the Creative Commons Attribution 4.0 License.
the Creative Commons Attribution 4.0 License.
 | 03 May 2021
Fifty-six years of surface solar radiation and sunshine duration over São Paulo, Brazil: 1961–2016
Marcia Akemi Yamasoe
Nilton Manuel Évora Rosário
Samantha Novaes Santos Martins Almeida
Martin Wild
A total of 56 years (1961–2016) of daily surface downward solar irradiation, sunshine duration, diurnal temperature range and the fraction of the sky covered by clouds in the city of São Paulo, Brazil, were analysed. The main purpose was to contribute to the characterization and understanding of the dimming and brightening effects on solar global radiation in this part of South America. As observed in most of the previous studies worldwide, in this study, during the period between 1961 and the early 1980s, a negative trend in surface solar irradiation was detected in São Paulo, characterizing the occurrence of a dimming effect. Sunshine duration and the diurnal temperature range also presented negative trends, in opposition to the positive trend observed in the cloud cover fraction. However, a brightening effect, as observed in western industrialized countries in more recent years, was not observed. Instead, for surface downward irradiation, the negative trend persisted, with a trend of −0.13 MJ m−2 per decade, with a p value of 0.006, for the 56 years of data and in consonance with the cloud cover fraction increasing trend, but not statistically significant, of 0.3 % per decade (p value = 0.198). The trends for sunshine duration and the diurnal temperature range, by contrast, changed signal, as confirmed by a piecewise linear regression model. Some possible causes for the discrepancy are discussed, such as the frequency of fog occurrence, urban heat island effects, horizontal visibility (as a proxy for aerosol loading variability) and greenhouse gas concentration increase. Future studies on the aerosol effect are planned, particularly with higher temporal resolution, as well as modelling studies, to better analyse the contribution of each possible cause.
- Article
(3609 KB) - Full-text XML
-
Supplement
(155 KB) - BibTeX
- EndNote


Ultimately, the downward solar radiation at the surface is the main source of energy that drives Earth's biological, chemical and physical processes (Wild et al., 2013; Kren et al., 2017), from local to global scales. Therefore, the assessment of the variability of the downward solar radiation at the surface is a key step in the efforts to understand Earth's climate system variability. Before reaching the surface, solar radiation can be attenuated mainly by aerosols and clouds, through scattering and absorption processes, and to a lesser extent, through Rayleigh scattering by atmospheric gases and absorption by ozone and water vapour, for example. In this context, during the last half century, long-term changes in the amount of surface solar radiation have been investigated worldwide (Dutton et al., 1991; Stanhill and Cohen, 2001; Wild et al., 2005; Shi et al., 2008; Wild, 2009, 2012; Ohvril et al., 2009). At least two trends have been well established and documented over wide regions of the world, a decline in surface solar radiation between the 1950s and 1980s, named “global dimming” and an increase, from the 1980s to 2000s, termed “brightening” (Stanhill and Cohen, 2001; Wild, 2009, 2012).
The global dimming definition, according to Stanhill and Cohen (2001), refers to a widespread and significant reduction in global irradiance, that is the flux of solar radiation reaching the Earth's surface comprising the direct solar beam and the diffuse radiation scattered by the sky and clouds. However, among these studies, while the dimming phase has been a consensus for all locations analysed, the brightening phase was not (Zerefos et al., 2009; Wild, 2012). Over India, for example, the dimming phase seems to last throughout the 2000s (Kumari and Goswami, 2010). The continuous dimming in India and the renewed dimming in China from the 2000s, opposite of a persistent brightening over Europe and the United States, have been linked to trends in atmospheric anthropogenic aerosol loadings (Wild, 2012). By contrast, other studies suggested that changes in cloud cover rather than anthropogenic aerosol emissions played a major role in determining solar dimming and brightening during the last half century (Stanhill et al., 2014). Therefore, the drivers of dimming and brightening are a matter of ongoing research and debate (Manara et al., 2016; Kazadzis et al., 2018; Manara et al., 2019; Yang et al., 2019). The role of these trends in the masking of temperature increases due to increasing greenhouse gas (GHG) concentration has been discussed (Wild et al., 2007). Furthermore, a comprehensive assessment of the spatial scale of both dimming and brightening is critical for a conclusive analysis of the likely drivers and implications for the current global climate variability. Large portions of the globe are still lacking any evaluation on this matter, such as Africa (Wild, 2009), which is a challenge for the spatial characterization of both dimming and brightening trends.
Among the rare studies focusing on the South American subcontinent, Raichijk (2012) discussed the trends over South America, analysing sunshine duration (SD) data from 1961 to 2004. The author divided South America into five climatic regions. In three of them, also the one where the city of São Paulo is located, statistically significant negative trends were observed on an annual basis, from 1961 up to 1990. From 1991 to 2004 a positive trend was observed in four of the five regions with a significance level higher than 90 %.
The alternative use of SD is mainly due to the lack of a consistent long-term network for the monitoring of surface solar radiation across the continent; therefore alternative proxies have to be found in order to provide an estimate of surface solar radiation long-term trends. Another variable commonly used to investigate surface solar radiation trends is the diurnal temperature range (DTR), the difference between daily maximum (Tmax) and minimum (Tmin) air temperature measured near the surface (Bristow and Campbell, 1984; Wild et al., 2007; Makowski et al., 2008).
The present study takes advantage of 56 years of unique high-quality concurrent records of surface solar irradiation (SSR), sunshine duration (SD), diurnal temperature range (DTR) and cloud cover fraction (CCF), i.e. the fraction of the sky covered by clouds, from 1961 to 2016, in the city of São Paulo, Brazil, to provide a perspective on dimming and brightening trends with an extended database.
Two questions are addressed in this study. (1) What was the decadal variability of SSR over the 56 years of data? (2) Can SD and DTR be adopted as proxies to infer SSR variability in São Paulo? To answer to these questions, we organize the paper as follows: in Sect. 2 we present the data and methods of analysis; Sect. 3 is divided into three parts. In the first part of that section, we discuss the annual trends in SSR, SD and DTR. In the second, we focus the analysis on horizontal visibility and the number of foggy days. In the third part of Sect. 3, we discuss the trends in the maximum and minimum air temperatures near the surface. Section 4 summarizes the main conclusions and discusses possible future work on the subject.
The long-term measurements used in this study were collected at the meteorological station operated by the Instituto de Astronomia, Geofísica e Ciências Atmosféricas from the Universidade de São Paulo (IAG/USP), located at latitude 23.65∘ S and longitude 46.62∘ W, 799 m above sea level. Figure 1 shows the geographical location of the meteorological station. The site is surrounded by a vegetated area due to its location inside a park.
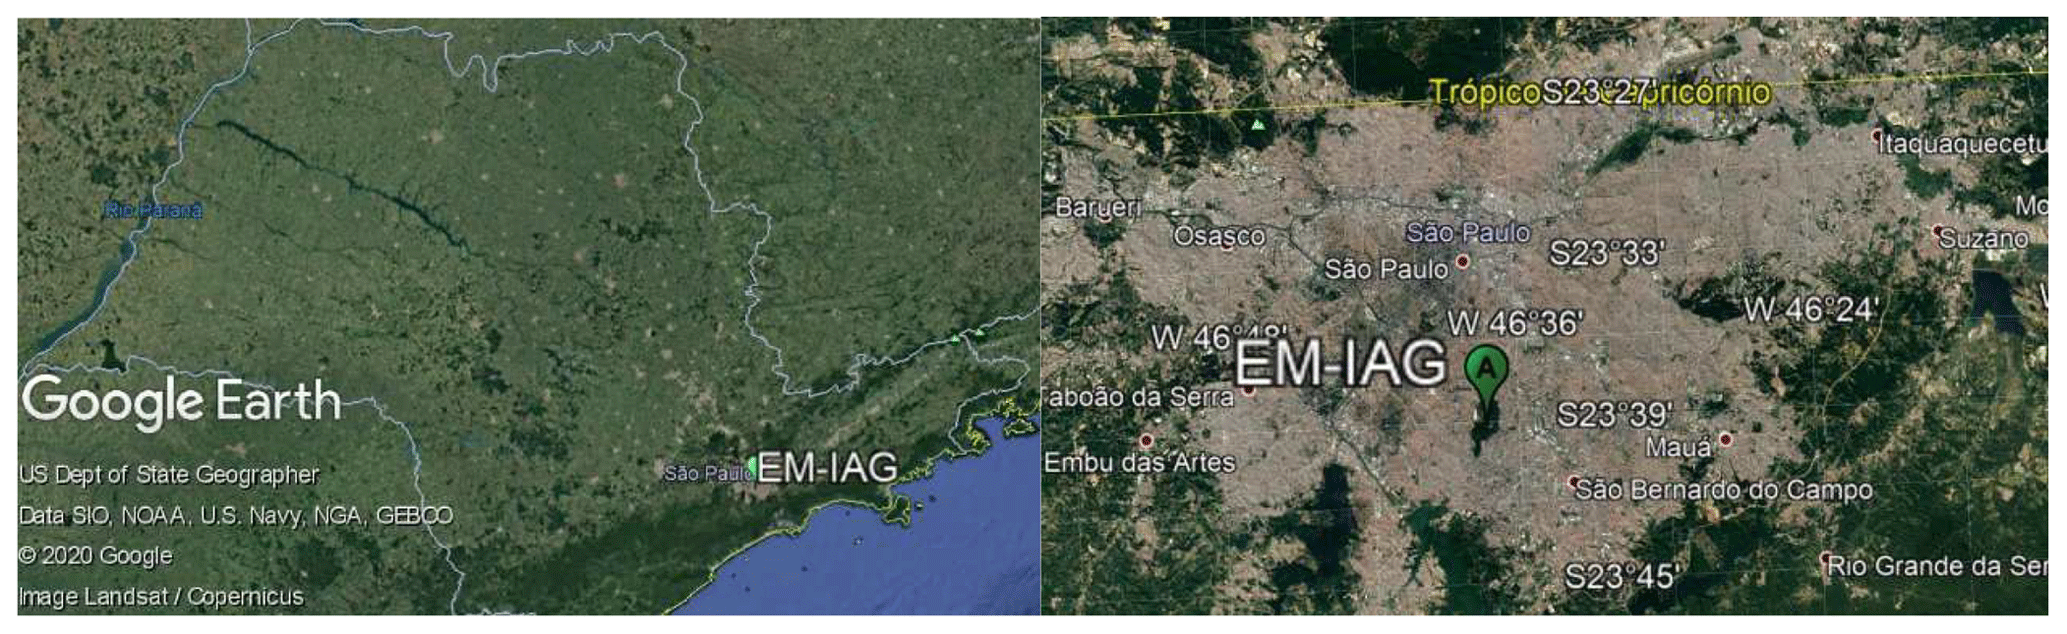
Figure 1São Paulo state and a zooming in view of São Paulo metropolitan area and the location of the meteorological station of Instituto de Astronomia, Geofísica e Ciências Atmosféricas from Universidade de São Paulo (EM-IAG). Adapted from © Google Earth (US Dept. of State Geographer – Data SIO, NOAA, U.S. Navy, NGA, GEBCO – Image Landsat/Copernicus).
The downward solar irradiation has been measured since 1961 using an Actinograph Robitzsch-Fuess model 58d, with 5 % instrumental uncertainty (Plana-Fattori and Ceballos, 1988). The long-term variation in the sensor calibration of −1.5 % per decade was taken into account. This trend was estimated by comparing 1 year of data collected in parallel and at the same site with a brand new Actinograph Robitzsch-Fuess model 58dc in 2014 and agrees with previous estimations performed by Plana-Fattori and Ceballos (1988) (see Supplement for details of the comparison). Sunshine duration data were collected with a Campbell-Stokes sunshine recorder (Horseman et al., 2008) from 1933 to the present, while daily maximum and minimum air temperatures have been monitored since 1935. Daily maximum and minimum temperatures were used to estimate the diurnal temperature range as it is simply the difference between the maximum and minimum daily temperatures. Diurnal cloud cover fraction was determined from visual inspection made every hour from 07:00 to 18:00 (local time) (Yamasoe et al., 2017).
Annual mean values of downward solar irradiation data at the surface were used to characterize dimming and brightening trends while sunshine duration and diurnal temperature range measurements at the same site were used to provide independent information.
In order to estimate trends, avoiding autocorrelation in the data, the modified Mann–Kendall trend test proposed by Hamed and Rao (1998) was applied to the variables, while the regression coefficient was estimated based on Sen (1968). A statistically significant trend at the 95 % confidence level was detected if the absolute value of Z was above 1.96. We also applied a piecewise linear regression model, proposed by Muggeo (2003) to detect any trend changes.
According to the meteorological station records, completely cloud-free days are extremely rare in São Paulo, being more common from June to the beginning of September, corresponding to the Southern Hemisphere wintertime, when dry conditions prevail in the region (Yamasoe et al., 2017). The number of days without clouds per year, from sunrise to sunset, varied from 1 to 23. This extremely low number of clear-sky days restricted the analysis in such conditions, mainly aiming to evaluate the exclusive role of aerosol variability in the long-term trends.
To complement the analysis and help interpret the findings, we included data about the occurrence of fog and horizontal visibility. The first information was analysed in terms of the number of foggy days (NFD). If fog was observed on a given day, the day received the number 1; otherwise, the number is 0. Horizontal visibility, or simply visibility, is recorded every hour, from 07:00 till midnight, at the meteorological station. Visibility can be affected by haze and fog conditions but is less sensitive to cloud variability. Thus, all-sky visibility data were used as a proxy for aerosol loading (Zhang et al., 2020). However, to avoid the effect of fog on the horizontal visibility, we limited the data from 10:00 to 15:00, as, at the location, fog is usually observed either early in the morning or late in the afternoon, when low-temperature and high-humidity scenarios are more likely to occur in São Paulo. Therefore, the reduction in visibility from 10:00 to 15:00 is expected to be related to the atmospheric turbidity. The impact of aerosol on SSR is higher from August to October, when advection of smoke plumes from long-range transports can reach São Paulo, summing up to the typical increase in the local pollution associated with the dominance of low-dispersion scenarios during this time of the year (Yamasoe et al., 2017). This is also when low temperatures and stable atmospheric conditions favour fog formation. Thus, the analysis of both variables is limited to the months of July to October.
To verify whether the effect of visibility on SSR and SD could be detected, data measured on clear-sky days were analysed normalizing SSR by the expected irradiation at the top of the atmosphere (TSR), determining the solar transmittance and minimizing the seasonal variability. Sunshine duration (SD or n) was normalized to the day length (N). Top-of-the-atmosphere irradiation and the day length were estimated using formulas proposed by Paltridge and Platt (1976), which also include the variation in Sun–Earth distance.
3.1 SSR, SD, DTR and CCF annual mean variability and trends
Figure 2 illustrates the time series of the annual mean values for SSR, SD, DTR and CCF, showing that all the analysed variables exhibited a large variability from year to year. SSR, SD and DTR presented a decreasing trend up to the beginning of the 1980s, opposite of, and therefore consistent with, the CCF trend. According to Rosas et al. (2019), who analysed the same cloud fraction database from the meteorological station, focusing on the climatology for different cloud types and base heights, all cloud types, except for the middle level clouds, presented a positive trend, which is confirmed by this study.

Figure 2Annual mean variability of surface solar irradiation (SSR), sunshine duration (SD), diurnal temperature range (DTR) and cloud cover fraction (CCF). Grey curves represent 5-year moving averages, and dotted lines are the result of a trend analysis from 1961 to 1983 and from 1984 to 2016. Lines of the trend analysis for SSR and CCF considering all the analysed years, from 1961 to 2016 are also shown.
Returning to Fig. 2, the grey curve represents the 5-year moving average, while the dotted lines indicate the result of the modified Mann–Kendall trend analysis, discussed in this section. The year 1983 was the one presenting the lowest annual mean value for SSR, SD and DTR, clearly as a response to the peak of CCF observed in that year, which is worth mentioning was characterized by a strong El Niño event. According to the Earth System Research Laboratory from the National Oceanic and Atmospheric Administration (ESRL/NOAA, 2021), it is listed at the top amongst the 24 strongest El Niño events, in the period from 1895 to 2015, and lasted from April 1982 up to September 1983 (https://www.esrl.noaa.gov/psd/enso/climaterisks/years/top24enso.html, last access: 10 March 2021). This 1983 El Niño effect was also detected in rainfall data over the São Paulo metropolitan area (Obregón et al., 2014), although the authors claim that such influence, at least on rainfall variability, is detectable but is multifaceted and depends on the life cycle of each El Niño–Southern Oscillation (ENSO) event. Xavier et al. (1995), trying to identify a possible influence of ENSO on precipitation extremes in the month of May, classified both May 1983 and May 1987 as exceptional extremes of precipitation. Their conclusion was that strong El Niño events can affect the spatial organization of rainfall around São Paulo city. A more recent study performed by Coelho et al. (2017), using daily precipitation data from 1934 to 2013 from the same meteorological station analysed in this research, concluded that El Niño conditions in July tend to increase precipitation in the following spring, also anticipating the onset of the rainy season. No study was found about the possible effect of ENSO on cloud cover over São Paulo. According to Rosas et al. (2019), middle and high-level clouds presented high positive anomalous cloud amount in 1983.
Applying the piecewise liner regression model (Muggeo, 2003) to detect trend changes, for the variables in Fig. 2, only SD and DTR presented statistically significant breakpoints. For SD, the regime shift was detected in 1982 (± 4 years) (p=0.008) and for DTR in 1979 (±4 years) (p=0.017). Considering the uncertainties in the estimates, both include the year 1983, consistent with the findings of Reid et al. (2016), who observed a regime shift in land surface temperature in South America in 1984. These findings motivated us to separate the time series analysis into two periods, the first from 1961 to 1983 and the second from 1984 up to 2016. The results of the modified Mann–Kendall trend test for each period and for all the analysed years, from 1961 to 2016, are presented in Table 1, considering both annual and seasonal variabilities. Bold values indicate trends that are statistically significant at the 95 % confidence level. From the table, in the first period, SSR, SD and DTR presented a decreasing trend, while CCF presented a positive one. Except for SSR, all trends were statistically significant, with daily SD decreasing at a rate of 0.37 h per decade and the diurnal temperature range declining at a rate of 0.49 ∘C per decade. As detected by the piecewise linear regression model, SD and DTR changed from negative to positive trends, from the first to the second period. Looking at the seasonal variability, Southern Hemisphere autumn (MAM), winter (JJA) and springtime (SON) presented statistically significant decreasing trends for SD and DTR. For CCF, statistically significant positive trends were observed for JJA and SON, and only MAM presented a statistically significant positive trend for SSR in the first period. Considering the whole analysed period, only SSR presented a statistically significant trend on the annual basis of −0.13 MJ m−2 per decade. In DJF and MAM, the trends were also negative and statistically significant, while no trends were detected in JJA or SON. For CCF, a statistically significant trend change was observed only in MAM of almost 1 % per decade. For the other seasons and on an annual basis, CCF presented no trend (DJF) or a positive trend, but not statistically significant.
Table 1Modified Mann–Kendall trend test results for period 1, from 1961 to 1983; period 2, from 1984 to 2016; and for all the analysed years, from 1961 to 2016, considering each season and on an annual basis for the surface solar radiation (SSR), sunshine duration (SD), diurnal temperature range (DTR) and sky cover fraction (CCF). The trend was estimated as the slope of the linear fit between the variable of interest and year. Bold numbers refer to statistically significant trend values at the 95 % confidence level.

Units of trends are as follows. a MJ m−2 per decade. b Hours per decade. c Degrees Celsius per decade. d Percent per decade.
In the first period, SSR and its proxies presented trends consistent with CCF features; i.e. as CCF increased over time, the others decreased. In the second period, from 1984 to 2016, this behaviour combination changed. SD and DTR trends changed from negative to positive, being statistically significant only for SD, with a trend of 0.11 h per decade. CCF continued to present a positive trend, but not statistically significant. It is worth noting that, even though the trends are not statistically significant, the pattern between SSR and CCF was observed throughout the entire period. According to Rosas et al. (2019), statistically significant trends, positive for low clouds (3.2 % per decade) and negative for mid-level clouds (−5.5 % per decade), were observed in the last 30 years, from 1987 to 2016. Such analysis indicated that changes in cloud types also influenced the variability of SSR and proxies. However, other factors, rather than only cloud cover changes, were also responsible for the variability of SD and DTR, as evaluated in the next sections.
3.2 Long-term variability of horizontal visibility and of the number of foggy days
To verify how effectively the horizontal visibility acts as a proxy for aerosol optical depth, Fig. 3 shows the solar transmittance (SSR TSR) and the normalized sunshine duration () for clear-sky days, from July to October, as a function of daily mean visibility. The correlation coefficients are 0.57 and 0.52 for (SSR TSR) and (), respectively, as indicated in the figure, and for this reason, the visibility data will be analysed next as a proxy for aerosol optical depth. As mentioned in the methodology section, we excluded visibility data from early morning and late afternoon to minimize the influence of fog.
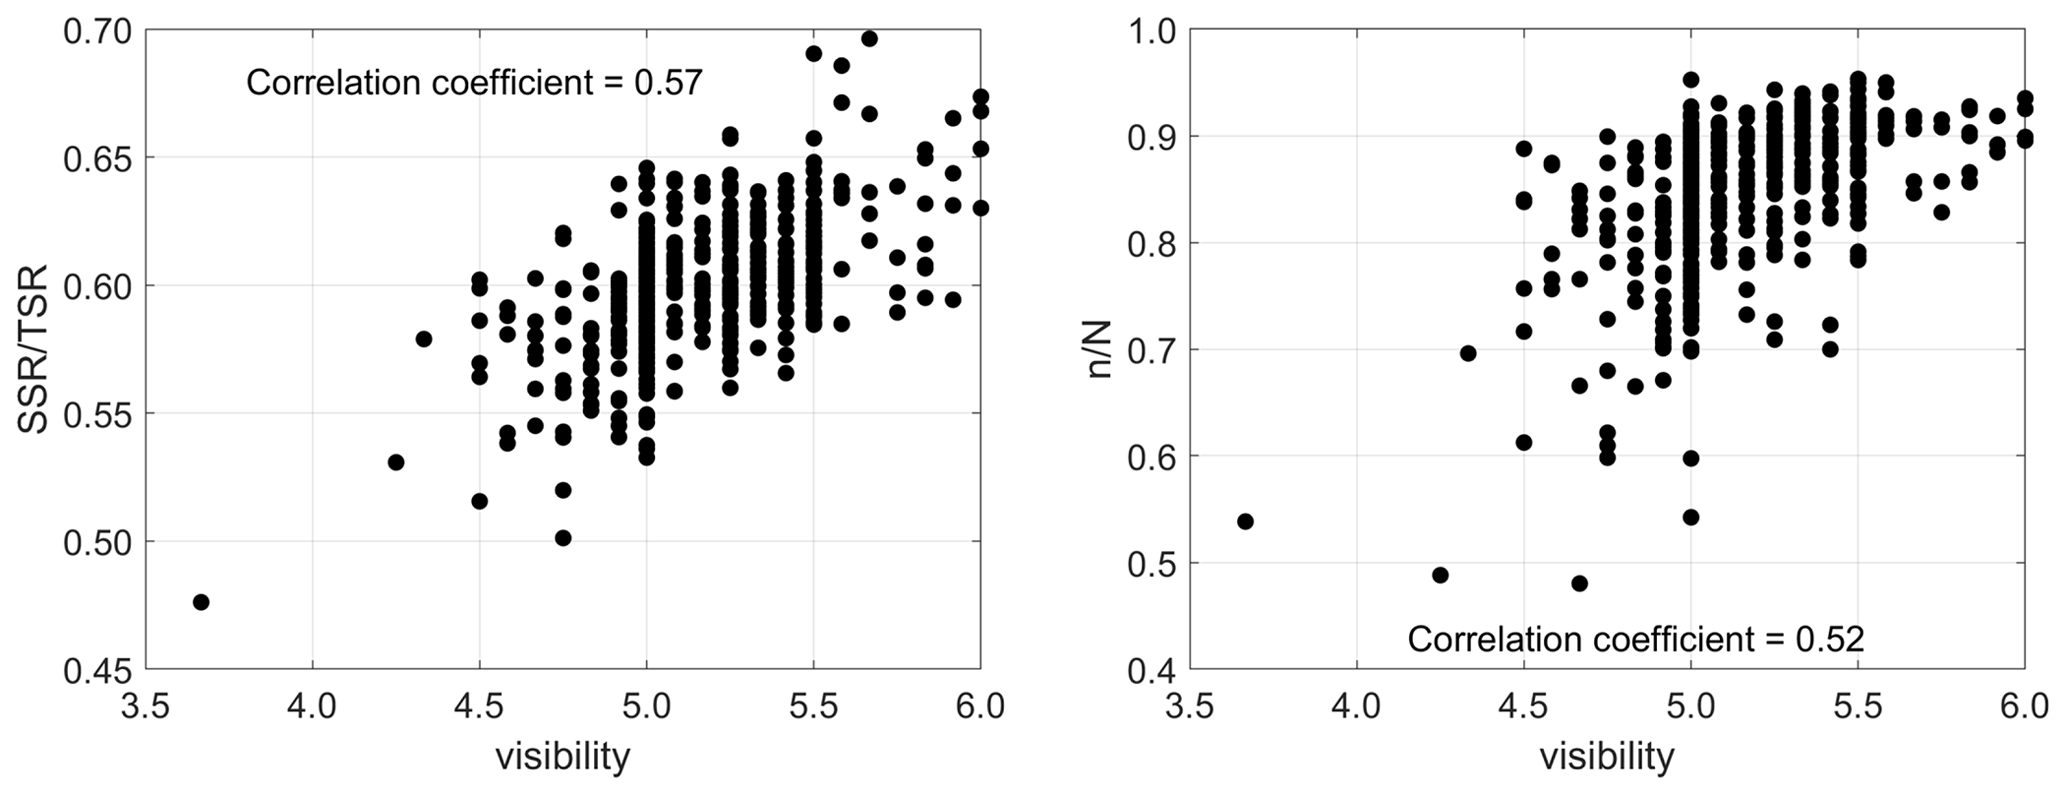
Figure 3Daily solar transmittance and the normalized sunshine duration as functions of the mean horizontal visibility recorded from 10:00 to 15:00 on clear-sky days in the months of July to October.
Figure 4 presents the mean visibility from July to October registered between 10:00 and 15:00 and the number of foggy days in the same months, from 1961 to 2016, both for all-sky conditions. July to October are the months with lower cloud cover fraction and with higher probability of long-range transport of biomass burning aerosol particles towards São Paulo, contributing to higher aerosol optical depth in the city (Castanho and Artaxo, 2001; Landulfo et al., 2003; Freitas et al., 2005; Castanho et al., 2008; Yamasoe et al., 2017). Since clear-sky days are rare in São Paulo, here we discuss the long-term variability of visibility, trying to infer aerosol loading variations.

Figure 4Time series of the mean visibility recorded from 10:00 to 15:00 and the number of foggy days (NFD) per year in all-sky conditions. Data are limited to the months of July to October.
From the figure, we see that the highest visibility was observed during the first half of the 1960s, with a gradual degradation till the early 1970s. Thereafter, visibility increased again but never recovered to the values of the 1960s. A significant reduction in visibility was observed in 1963. One hypothesis for the lower visibility in 1963 worth investigating was a sequence of vegetation fires reported in August and September in the state of Paraná affecting 128 municipalities (Paixão and Priori, 2015). Soares (1994) stated that about 10 % of the Paraná state was affected by the fires, which was responsible for the beginning of fire monitoring in Brazil due to its large proportion. Paraná is located to the south-southwest of São Paulo State. Cold front systems frequently advect air masses from this region towards São Paulo.
Considering local pollution sources, the reduction of the visibility data at the beginning of the series could be associated with the industrialization process in São Paulo and with the vehicular fleet and changes in the fuel composition at the end. According to Silva (2011), from 1956 to 1961, a national development plan was implemented in Brazil, to enhance economic growth, which particularly benefited the city of São Paulo, attracting industries, mainly from the automobile sector. This contributed to increasing the city's population and to the concentration of industries, boosting the economy of São Paulo City. In the 1970s, the high rate of urbanization, with many traffic jams, caused air quality and environmental degradation (Silva, 2011). As one of the consequences, the federal government promoted incentives to move industries to other Brazilian states, especially in the north and northeast regions of the country, but a part remained in the metropolitan area of São Paulo. Still, according to the author, this industrial decentralization process lasted till around 1991.
Andrade et al. (2017), discussing changes over time in air quality conditions in the metropolitan area of São Paulo, showed that SO2 frequently exceeded the air quality standards in the 1970s and 1980s. According to the authors, the Brazilian government started a programme to control its emissions due to the complaints of the population. At the beginning, the programme focused on stationary sources (industries) and, in the 1990s, the sulfur content in diesel fuel was also targeted. Nonetheless, during that decade, the metropolitan area of São Paulo still experienced severe air pollution problems with increasing concentration of aerosol particles, which might explain the reduction in visibility at the beginning of the decade (Fig. 4). Over time, SO2 emission control and other measures helped decrease the concentration of SO2 and of particulate matter with diameter less than 10 µm (PM10) near the surface. However, according to Oyama (2015), also due to a political decision to stimulate the economy, the annual number of registrations of new gasoline-fuelled vehicles increased exponentially, starting at about 3000 vehicles in 1988, peaking in 2000 with 150 000 registrations, and decreasing slowly after that, to about 60 000 in 2012. Despite the efforts to reduce vehicular emissions, the concentration of particulate matter with diameter less than or equal 2.5 µm is not yet controlled. In recent years, vehicular emissions have been the main local source of air pollution in the metropolitan area of São Paulo (Andrade et al., 2017).
Since both SSR and SD presented positive correlation with visibility, another factor might be responsible for the opposite trends observed in the second period for those variables. Changes in the number of foggy days are explored to verify whether its variability can help to explain part of the variability observed in the SD trends, particularly after 1983, when CCF only could not explain it. As shown in Fig. 4, the number of days with fog, in the months of July to October each year, is decreasing in São Paulo. The highest numbers were observed during the 1970s with a sharp decrease in the end of the decade and the beginning of the next, followed by a long period of stable conditions up to 2011 when another decrease was observed. This could be the reason for the positive trend of SD under all-sky scenarios in the second period (Fig. 2), when the CCF increase was not significant. A decrease in the annual number of foggy days was also observed in China (Li et al., 2012), which the authors attributed to the urban heat island effect. São Paulo, throughout the analysed period in this study, experienced a significant change in its spatial domain, which contributed to the intensification of the urban heat island effect. More on this effect will be discussed in the next section.
3.3 Long-term trends in daily maximum and minimum temperatures
Figure 5 presents the temporal variation in the annual mean of the daily maximum and minimum temperatures registered at the meteorological station, used to estimate DTR. As discussed in the last section, if the increasing trend in SD over the last years could be possibly attributed to the decreasing number of days per year with fog occurrence, we now hypothesize on the possible reasons for the increasing trend of DTR in the second period. According to Dai et al. (1999), DTR should also respond to cloud cover and precipitation and thus to SSR variations. As discussed by the authors, clouds can reduce Tmax and increase Tmin, since they can reflect solar radiation back to space during daytime and emit thermal radiation down to the surface during the night, respectively. Such behaviours can be clearly seen in Fig. 5, in the first period, and are confirmed by the trend analysis presented in Table 2. During the dimming period, Tmax presented a negative trend, while Tmin presented an increasing one, statistically significant at the 95 % confidence level for the latter variable. A similar behaviour was observed by Wild et al. (2007), who argued that the decreasing trend of Tmax is consistent with the negative trend of SSR, demonstrating that solar radiation deficit at the surface presented a clear effect on the surface temperature. Looking at the second period, from 1984 to 2016, both maximum and minimum temperatures presented an increasing trend, statistically significant at the 95 % confidence level, on an annual basis, of 0.25 and 0.16 ∘C per decade, respectively. In this period, the Tmin trend was still in line with the increasing CCF trend, but as pointed out by Wild et al. (2007) it could also be a response to the increasing levels of greenhouse gases as also pointed out by de Abreu et al. (2019) for the southeastern part of Brazil where São Paulo is located. Like SSR and CCF, these variables presented no statistically significant regime shift when applying the piecewise regression model. Thus, considering the whole period, it is possible to observe that regardless of the season or on an annual basis, both Tmax and Tmin presented statistically significant positive trends. Tmax increased with a trend of about 0.30 ∘C per decade and Tmin at a rate of 0.25 ∘C per decade, the highest trend detected in the summer months of DJF.
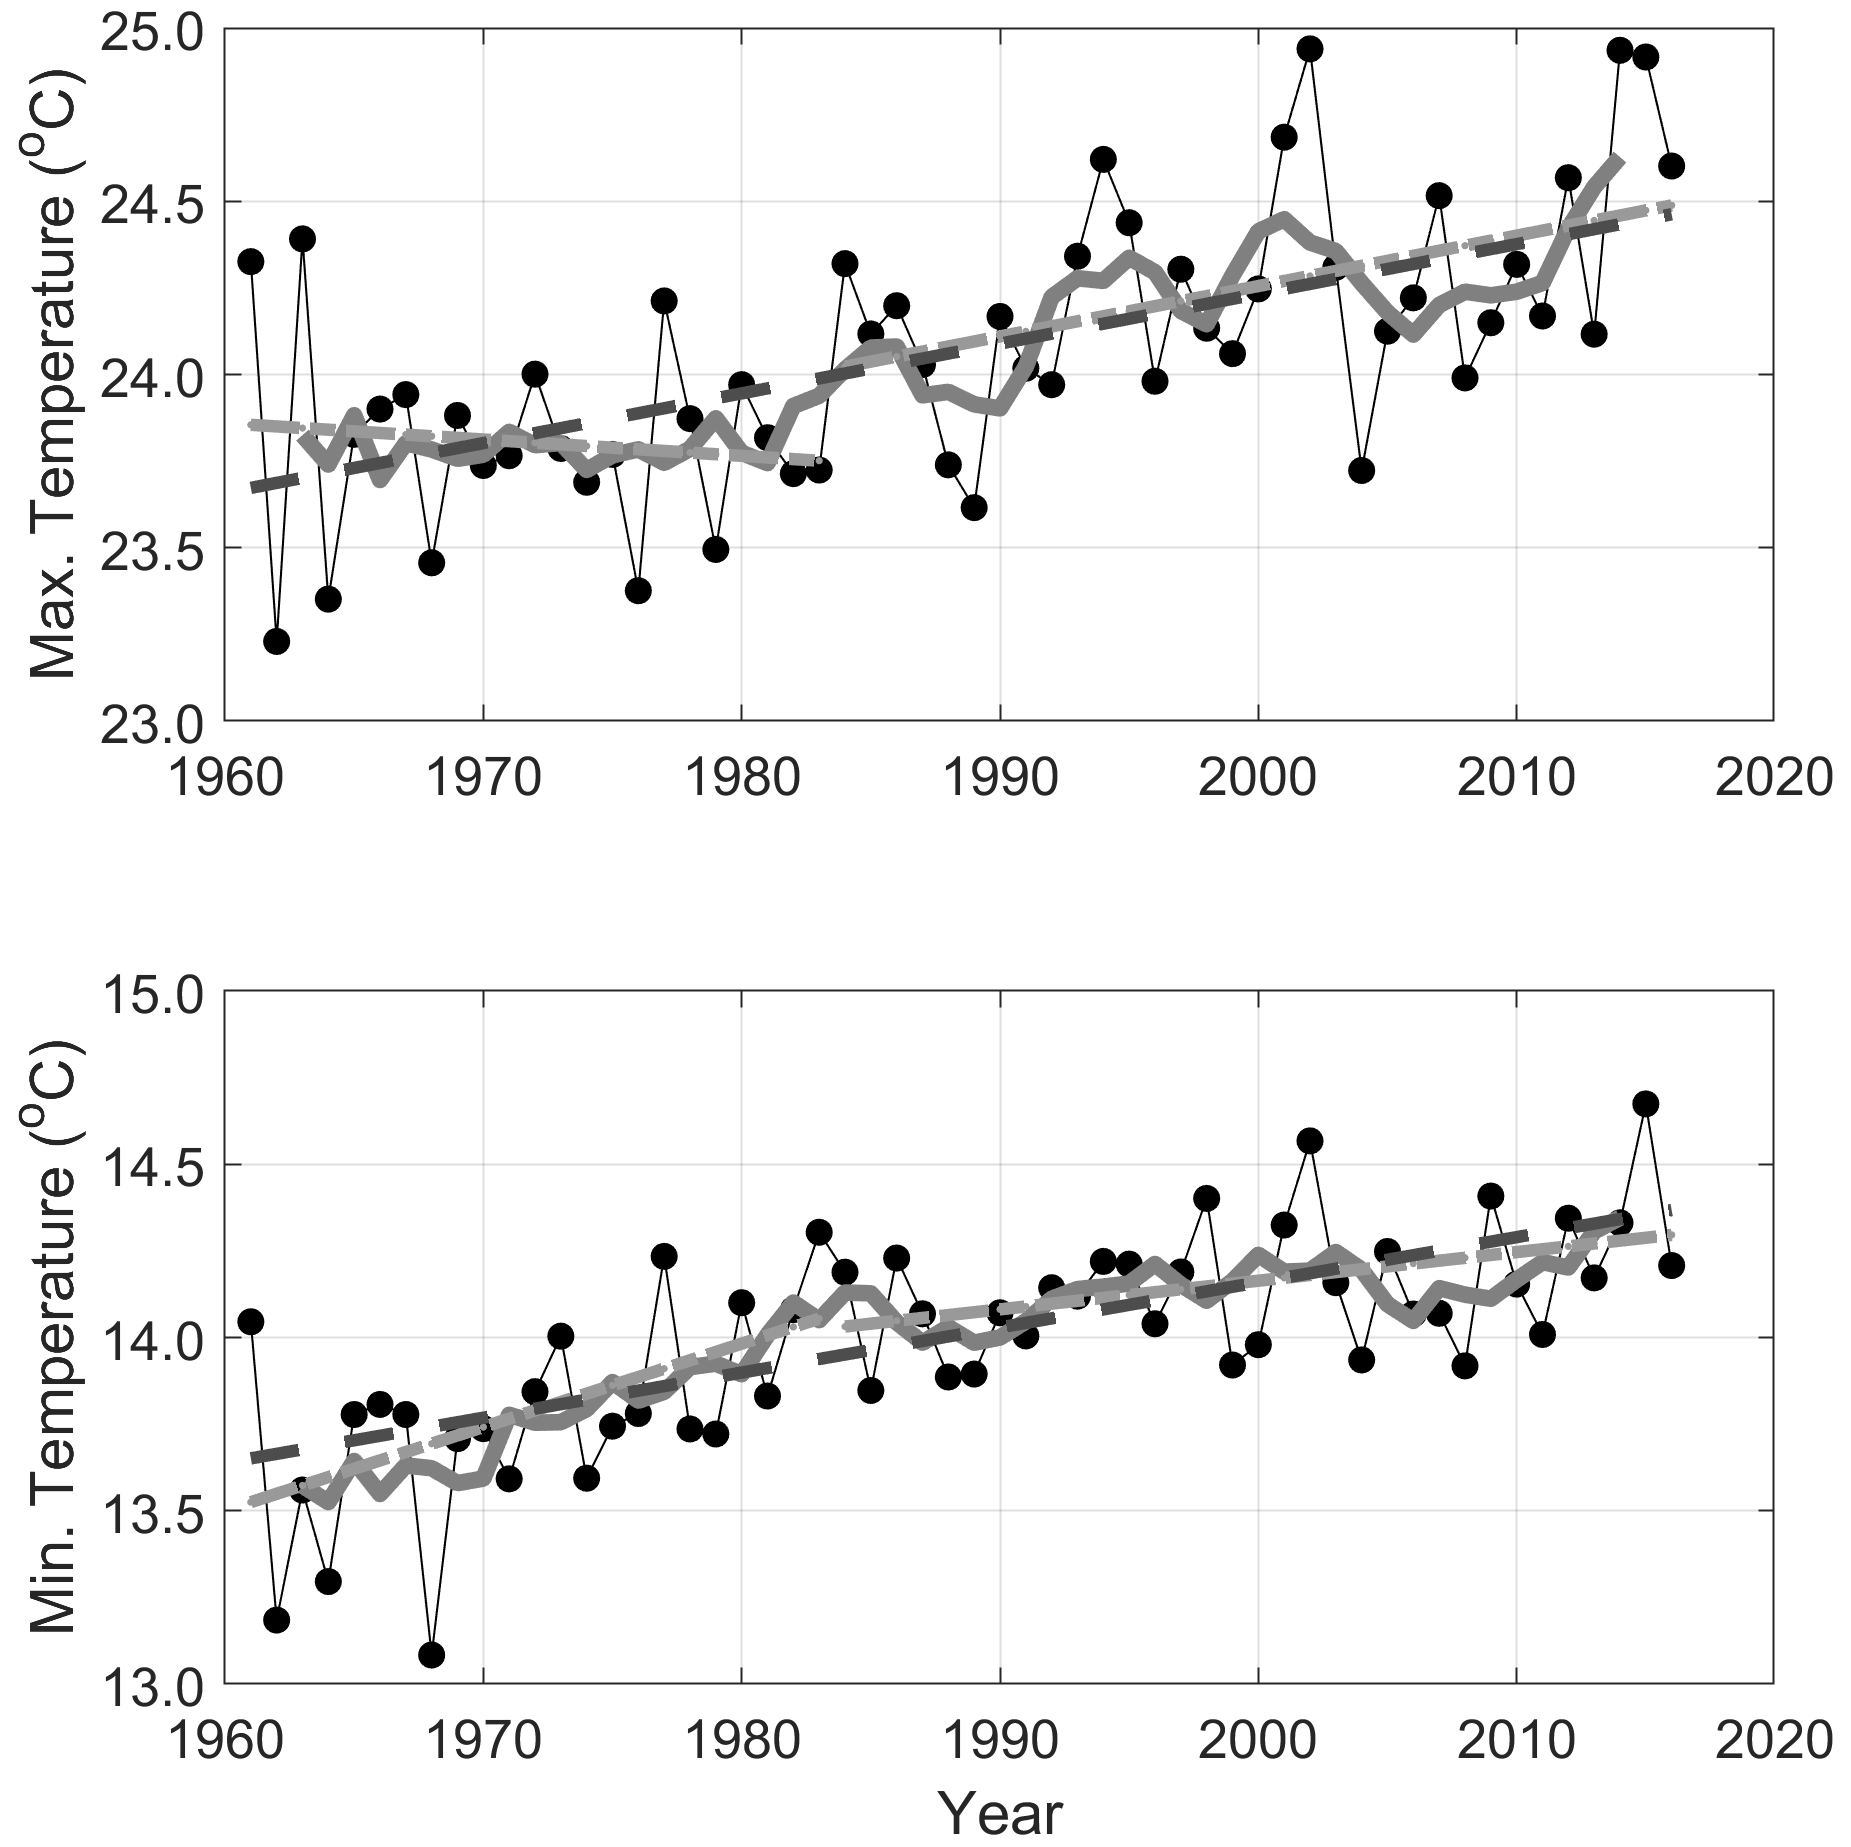
Figure 5Annual mean variability of daily maximum and minimum air temperatures at 1.5 m. Grey curves represent 5-year moving averages, light grey dotted lines are the result of trend analysis from 1961 to 1983 and from 1984 to 2016, and the dark grey dotted line represents the trend from 1961 to 2016.
Table 2Modified Mann–Kendall trend test results for period 1, from 1961 to 1983; period 2, from 1984 to 2016; and all the analysed years, from 1961 to 2016, considering each season and on an annual basis, for the daily maximum (Tmax) and minimum (Tmin) temperatures. The trend was estimated as the slope of the linear fit between the variable of interest and year. Bold numbers refer to statistically significant trend values at the 95 % confidence level.
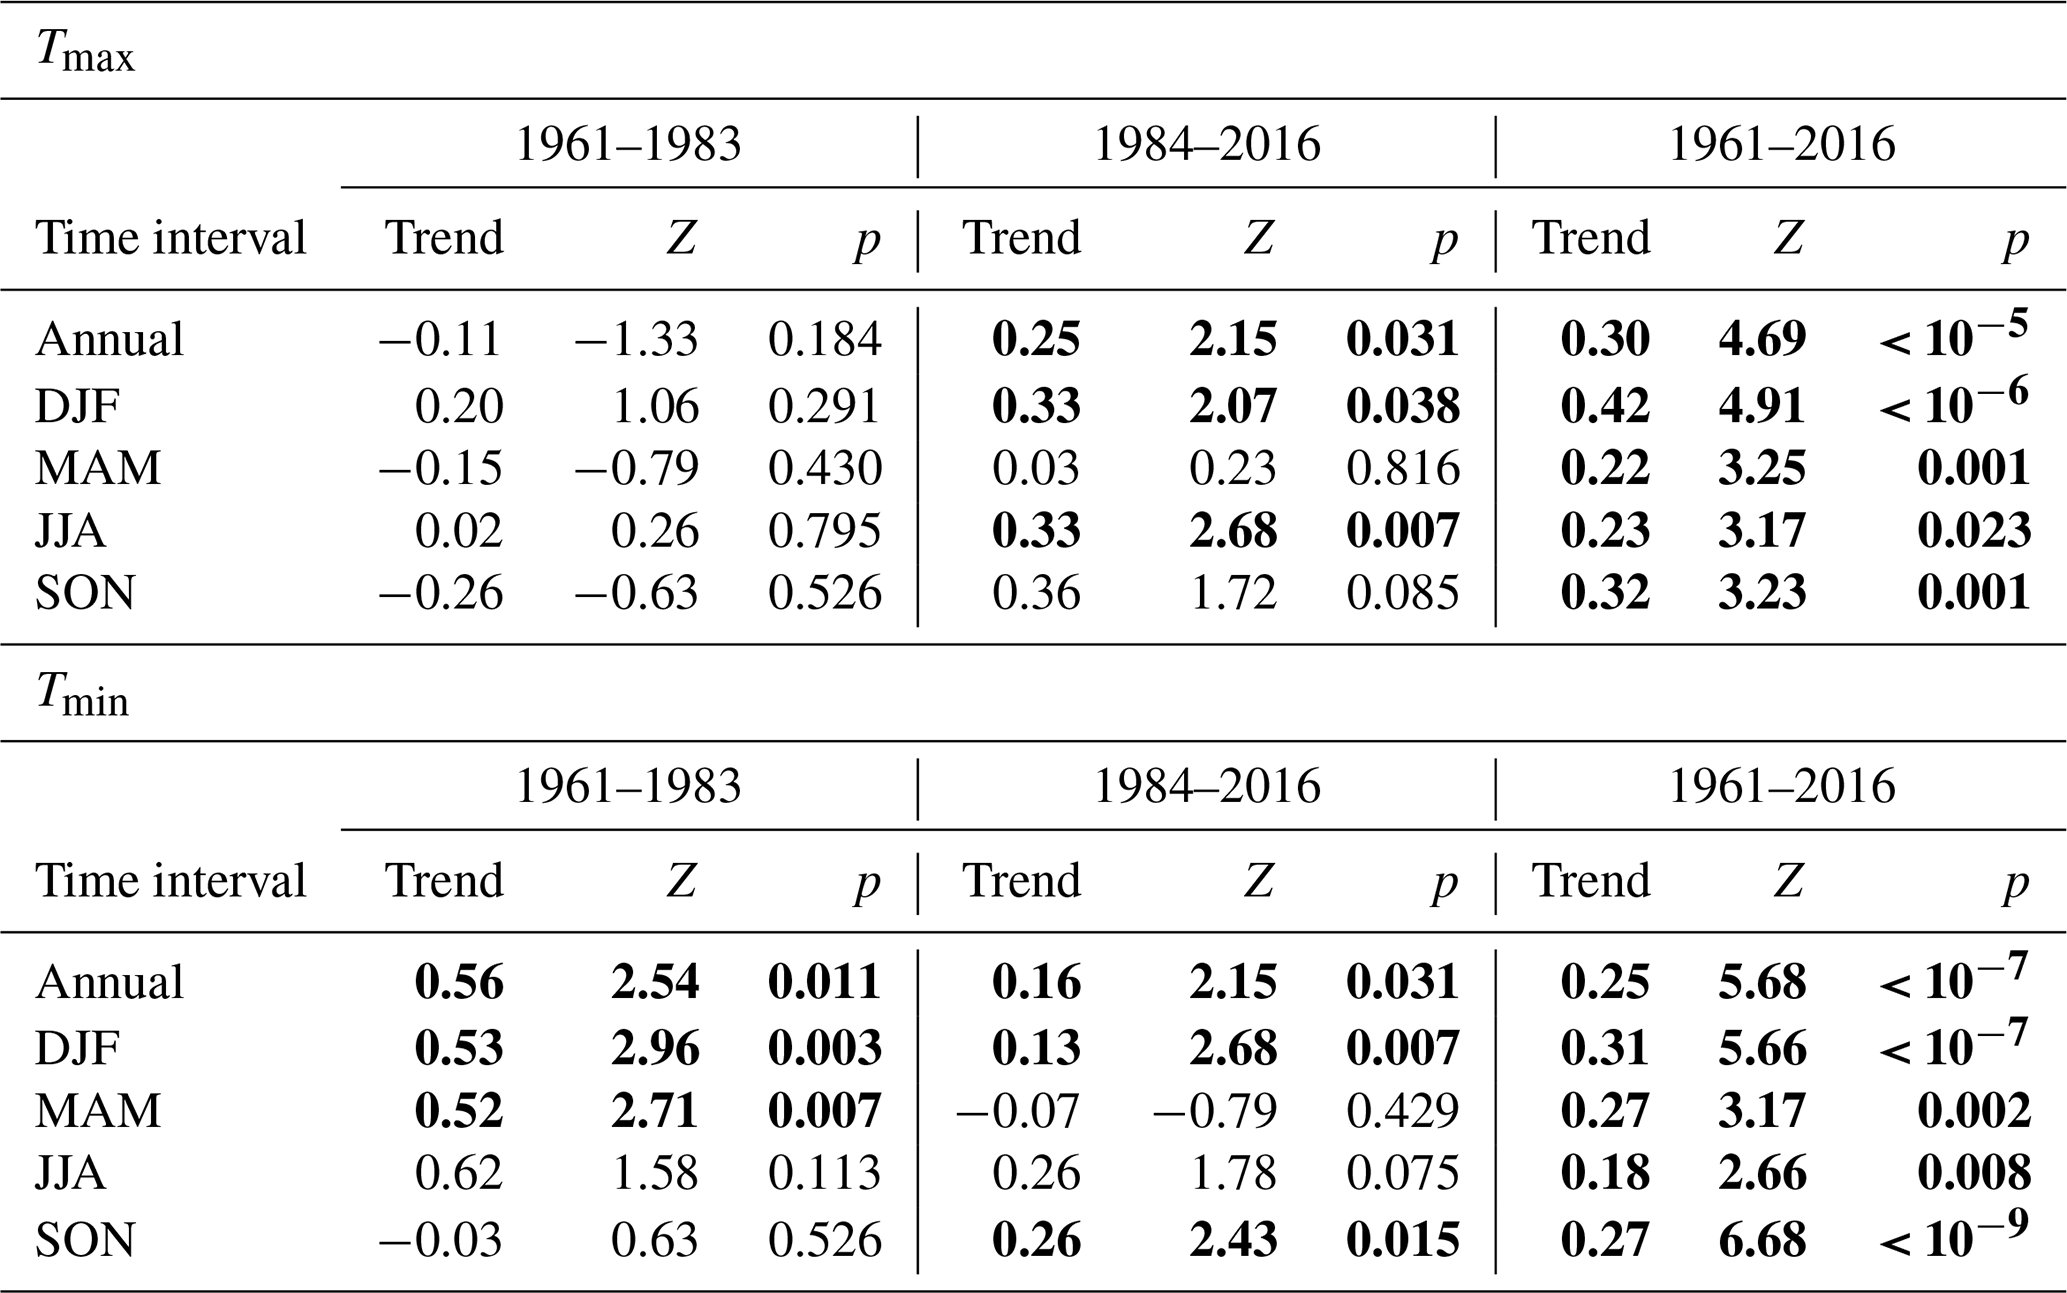
Units of trends: ∘C per decade.
The urban heat island (UHI) effect could also be responsible for the observed increasing trend of Tmax, particularly after 1980. The metropolitan area of São Paulo experienced a fast growth rate from 1980 to 2010. There were nearly 12 million inhabitants in 1980, and the population grew to about 21 million inhabitants in 2010 (Silva et al., 2017). According to the authors, the urban area increased from 874 to 2209 km2, from 1962 to 2002. According to Kim and Baik (2002), the maximum UHI intensity is more pronounced in clear-sky conditions, occurs more frequently at night than during the day and decreases with increasing wind speed. However, Ferreira et al. (2012) reported that, in São Paulo, the urban heat island maximum effect was observed during daytime, around 15:00, and was associated with downward solar radiation heating the urban region in a more effective way than the rural surrounding areas.
Finally, as pointed out by Wild et al. (2007), the increasing atmospheric concentration of greenhouse gases (GHG) can be another reason for the observed trend of Tmax, which was masked by the dimming effect in the first period. Modelling studies can help verify the real causes and disentangle the contribution of each effect, which is, however, out of the scope of this work.
This analysis of 56 years of surface solar irradiation (SSR) and proxy (SD and DTR) data helped to show that from about 1960 to the early 1980s, named the first period, a dimming effect of surface solar radiation was observed in the city of São Paulo, consistent with other parts of the world. The positive trend of CCF in the first period indicates that cloud cover changes could be one important driver of the dimming period. The dimming effect was also confirmed by SD and DTR trends in the mentioned period. However, the consistency between SSR, SD and DTR trends ended around 1983, when CCF presented the highest value throughout the entire series and which coincided with a strong El Niño year. Thus, answering our first question, SSR presented a decreasing trend, throughout the 56 years of data, statistically significant at the 95 % confidence level, with a rate of −0.13 MJ m−2 per decade. The negative trend was also statistically significant in DJF and MAM, presenting the most negative trend in the summer (DJF) of −0.26 MJ m−2 per decade.
Applying a piecewise linear regression model to the variables, only SD and DTR presented a statistically significant regime shift, around 1982 and 1979, respectively, with uncertainty of 4 years in both results. As the negative SSR trend was consistent with the slight positive trend of CCF, the changing behaviour of SD and DTR indicated that other factors besides the cloud cover variability might have affected their distinct patterns. In order to understand the possible causes of the SD trends, alternative parameters (fog frequency and horizontal visibility) focusing on the dry months of July to October were analysed. The results indicated that the decreasing trend of the number of foggy days per year may explain part of the increasing trend of SD.
Moreover, on clear-sky days, both SSR and SD presented correlation coefficients above 0.5 with visibility for the period when fog is unlikely to occur, indicating that this variable could be used as a proxy for aerosol loading variations. Changes in visibility during the 1960s and 1970s could be associated with the dynamics of the industrialization process of the São Paulo metropolitan area and the consequent urbanization, with population growth, traffic jams and degradation of the air quality. Long-range transport of biomass burning products towards São Paulo is also an important source of aerosol during the dry season. However, the long-term contribution of the different regions, as sources of pollutants to the atmosphere of the metropolitan area of São Paulo, is unclear. The role of biomass burning, in the state of São Paulo and the neighbour states of Minas Gerais, Paraná and Mato Grosso, is yet to be clarified. Further research is needed to improve our historical perspective on the role of other regional air pollution sources in the SSR.
In the case of DTR, since it was obtained from the difference between the daily maximum and minimum air temperatures close to the surface, the trends of the annual mean values of these temperatures were separately determined and analysed. The Tmin positive trends followed the CCF ones, also with a possible influence of the increasing levels of greenhouse gases, noticing that the reduction observed in CCF, in the beginning of the second period, is absent in the Tmin time series. The increasing trend of CCF, in the first period, resulted in a decreasing trend in Tmax, as more solar radiation reaching the surface was attenuated from year to year due to the presence of clouds. Some hypotheses for the increasing trend of Tmax during the second period were the urban heat island effect and the increasing concentrations of GHG. Of course, changes in the wind pattern and consequently in the advection of air masses with distinct properties can also affect the air temperature locally.
As the resultant trends of SD and DTR, compared with the SSR trend, diverged in the second period for São Paulo, in all-sky conditions, caution might be taken when those variables are used as proxies to downward surface solar radiation in the context of dimming and brightening analyses. This study revealed that different factors may act on each variable, leading to a distinct behaviour, as also mentioned by Manara et al. (2017).
For future studies, modelling efforts may be able to help evaluate each hypothesis raised in the present study, either those related to climate natural variability, such as El Niño, or those arising from anthropogenic activities as the increase in greenhouse gas concentrations and land use changes, particularly through the imperviousness of soils, affecting the partitioning of latent and sensible heat fluxes. Also, a higher temporal analysis and simultaneous monitoring of aerosol optical properties will help to better evaluate the aerosol effect on downward solar radiation in this region, including via the indirect effect.
Access to IAG meteorological station database (sky cover fraction, sunshine duration, daily maximum and minimum air temperatures, number of foggy days, visibility, and irradiation data) for education or scientific use can be made under request at http://www.estacao.iag.usp.br/sol_dados.php (last access: 10 March 2021). All processed data used in the paper such as annual and seasonal mean values, as well as data from cloud-free days, can be found at https://www.iag.usp.br/lraa/index.php/data/cientec/weather-station-climatology/ (Yamasoe, 2021).
The supplement related to this article is available online at: https://doi.org/10.5194/acp-21-6593-2021-supplement.
MAY and NMER designed the study and wrote the original manuscript. MAY and SNSMA organized the data. MAY performed the analysis. MAY, NMER and MW revised and edited the text. All authors contributed to the final paper.
The authors declare that they have no conflict of interest.
The authors acknowledge Fundação de Amparo à Pesquisa do Estado de São Paulo (FAPESP), grant number 2018/16048-6 and Coordenação de Aperfeiçoamento de Pessoal de Nível Superior (CAPES) for financial support. Marcia Akemi Yamasoe acknowledges CNPq (Conselho Nacional de Desenvolvimento Científico e Tecnologico), process number 313005/2018-4. Global dimming and brightening research at ETH Zurich is funded by the Swiss National Science Foundation (grant number 200020 188601). This study is part of the Núcleo de Apoio à Pesquisa em Mudanças Climáticas (INCLINE) and of Processos Radiativos na Atmosfera – Impactos dos Gases, Aerossóis e Nuvens. The authors are grateful to the observers and staff of the Instituto de Astronomia, Geofísica e Ciências Atmosféricas meteorological station for making available the meteorological observations. The authors acknowledge the two anonymous referees for their time, comments and suggestions that helped improve and clarify this paper.
This research has been supported by the Fundação de Amparo à Pesquisa do Estado de São Paulo (grant no. 2018/16048-6).
This paper was edited by Stelios Kazadzis and reviewed by two anonymous referees.
Andrade, M. F., Kumar, P., Freitas, E. D., Ynoue, R. Y., Martins, J., Martins, L. D., Nogueira, T., Perez-Martinez, P., Miranda, R. M., Albuquerque, T., Gonçalves, F. L. T., Oyama, B., and Zhang, Y.: Air quality in the megacity of São Paulo: Evolution over the last 30 years and future perspectives, Atmos. Environ., 159, 66–82, 2017.
Bristow, K. L. and Campbell, G. S.: On the relationship between incoming solar radiation and daily maximum and minimum temperature, Agr. Forest Meteorol., 31, 159–166, 1984.
Coelho, C. A. S., Firpo, M. A. F., Maia, A. H. N., and MacLachlan, C.: Exploring the feasibility of empirical, dynamical and combined probabilistic rainy season onset forecasts for São Paulo, Brazil, Int. J. Climatol., 37, 398–411, https://doi.org/10.1002/joc.5010, 2017.
Dai, A., Trenberth, K. E., and Karl, T. R.: Effects of clouds, soil moisture, precipitation, and water vapor on diurnal temperature range, J. Climate, 12, 2451–2473, 1999.
de Abreu, R. C., Tett, S. F. B., Schurer, A., and Rocha, H. R.: Attribution of detected temperature trends in Southeast Brazil, Geophys. Res. Lett., 46, 8407–8414, https://doi.org/10.1029/2019GL083003, 2019.
de Almeida Castanho, A. D. and Artaxo, P.: Wintertime and summertime São Paulo aerosol source apportionment study, Atmos. Environ., 35, 4889–4902, 2001.
de Almeida Castanho, A. D., Martins, J. V., and Artaxo, P.: MODIS aerosol optical depth retrievals with high spatial resolution over an urban area using the critical reflectance, J. Geophys. Res.-Atmos., 113, D02201, https://doi.org/10.1029/2007JD008751, 2008.
Dutton, E. G., Stone, R. S., Nelson, D. W., and Mendonca, B. G.: Recent interannual variations in solar radiation, cloudiness, and surface temperature at the South Pole, J. Climate, 4, 848–858, 1991.
ESRL/NOAA: Earth System Research Laboratory from the National Oceanic and Atmospheric Administration, available at: https://www.esrl.noaa.gov/psd/enso/climaterisks/years/top24enso.html, last access: 19 March 2021.
Ferreira, M. J., Oliveira, A. P., Soares, J., Codato, G., Bárbaro, E. W., and Escobedo, J. F.: Radiation balance at the surface in the city of São Paulo, Brazil: diurnal and seasonal variations, Theor. Appl. Climatol., 107, 229–246, https://doi.org/10.1007/s00704-011-0480-2, 2012.
Freitas, S. R., Longo, K. M., Dias, M. A. F. S., Dias, P. L. S., Chatfield, R., Prins, E., Artaxo, P., Grell, G. A., and Recuero, F. S.: Monitoring the transport of biomass burning emissions in South America, Environ. Fluid Mech., 5, 135–167, 2005.
Hamed, K. H. and Rao, A. R.: A modified Mann-Kendall trend test for autocorrelated data, J. Hydrol., 204, 182–196, 1998.
Horseman, A., MacKenzie, A. R., and Timmis, R.: Using bright sunshine at low-elevation angles to compile an historical record of the effect of aerosol on incoming solar radiation, Atmos. Environ., 42, 7600–7610, 2008.
Kazadzis, S., Founda, D., Psiloglou, B. E., Kambezidis, H., Mihalopoulos, N., Sanchez-Lorenzo, A., Meleti, C., Raptis, P. I., Pierros, F., and Nabat, P.: Long-term series and trends in surface solar radiation in Athens, Greece, Atmos. Chem. Phys., 18, 2395–2411, https://doi.org/10.5194/acp-18-2395-2018, 2018.
Kim, Y. H. and Baik, J. J.: Maximum urban heat island intensity in Seoul, J. Appl. Meteorol., 41, 651–659, 2002.
Kren, A. C., Pilewskie, P., and Coddington, O.: Where does Earth's atmosphere get its energy?, J. Space Weather Spac., 7, 1–16, https://doi.org/10.1051/swsc/2017007, 2017.
Kumari, B. P. and Goswami, B. N.: Seminal role of clouds on solar dimming over India monsoon region, Geophys. Res. Lett., 37, L06703, https://doi.org/10.1029/2009GL042133, 2010.
Landulfo, E., Papayannis, A., Artaxo, P., Castanho, A. D. A., de Freitas, A. Z., Souza, R. F., Vieira Junior, N. D., Jorge, M. P. M. P., Sánchez-Ccoyllo, O. R., and Moreira, D. S.: Synergetic measurements of aerosols over São Paulo, Brazil using LIDAR, sunphotometer and satellite data during the dry season, Atmos. Chem. Phys., 3, 1523–1539, https://doi.org/10.5194/acp-3-1523-2003, 2003.
Li, Z., Yang, J., Shi, C., and Pu, M.: Urbanization effects on fog in China: Field Research and Modeling, Pure Appl. Geophys., 169, 927–939, https://doi.org/10.1007/s00024-011-0356-5, 2012.
Makowski, K., Wild, M., and Ohmura, A.: Diurnal temperature range over Europe between 1950 and 2005, Atmos. Chem. Phys., 8, 6483–6498, https://doi.org/10.5194/acp-8-6483-2008, 2008.
Manara, V., Brunetti, M., Celozzi, A., Maugeri, M., Sanchez-Lorenzo, A., and Wild, M.: Detection of dimming/brightening in Italy from homogenized all-sky and clear-sky surface solar radiation records and underlying causes (1959–2013), Atmos. Chem. Phys., 16, 11145–11161, https://doi.org/10.5194/acp-16-11145-2016, 2016.
Manara, V., Brunetti, M., Maugeri, M., Sanchez-Lorenzo, A., and Wild, M.: Sunshine duration and global radiation trends in Italy (1959–2013): To what extent do they agree?, J. Geophys. Res.-Atmos., 122, 4312–4331, https://doi.org/10.1002/2016JD026374, 2017.
Manara, V., Bassi, M., Brunetti, M., Cagnazzi, B., and Maugeri, M.: 1990–2016 surface solar radiation variability and trend over the Piedmont region (northwest Italy), Theor. Appl. Climatol., 136, 849–862, https://doi.org/10.1007/s00704-018-2521-6, 2019.
Muggeo, V. M. R.: Estimating regression models with unknown break-points, Stat. Med., 22, 3055–3071, https://doi.org/10.1002/sim.1545, 2003.
Obregón, G. O., Marengo, J. A., and Nobre, C. A.: Rainfall and climate variability: long-term trends in the Metropolitan Area of São Paulo in the 20th century, Clim. Res., 61, 93–107, https://doi.org/10.3354/cr01241, 2014.
Ohvril, H., Teral, R., Neiman, L., Kannel, M., Uustare, M., Tee, M., Russak, V., Okulov, O., Jõeveer, A., Kallis, A., Ohvril, T., Terez, E. I., Terez, G. A., Gushchin, G. K., Abakumova, G. M., Gorbarenko, E. V., Tsvetkov, A. V., and Laulainen, N.: Global dimming and brightening versus atmospheric column transparency, Europe, 1906–2007, J. Geophys. Res.-Atmos., 114, D00D12, https://doi.org/10.1029/2008JD010644, 2009.
Oyama, B. S.: Contribution of the vehicular emission to the organic aerosol composition in the city of São Paulo, Doctoral Thesis, Universidade de São Paulo, São Paulo, Brazil, 91 pp., available at: https://www.iag.usp.br/pos/sites/default/files/t_beatriz_s_oyama_corrigida.pdf (last access: 25 October 2019), 2015.
Paixão, L. A. and Priori, A. A.: Social and environmental transformations of the rural landscape after an environmental disaster (Paraná, Brazil, 1963), Estudos Históricos, 28, 323–342, https://doi.org/10.1590/S0103-21862015000200006, 2015.
Paltridge, G. W. and Platt, C. M. R.: Radiative processes in meteorology and climatology, Elsevier Science, Amsterdam, The Netherlands, Oxford, UK, New York, USA, 1976.
Plana-Fattori, A. and Ceballos, J. C.: Algumas análises do comportamento de um actinógrafo bimetálico Fuess modelo 58d, Rev. Bras. Meteorol., 3, 247–256, 1988.
Raichijk, C.: Observed trends in sunshine duration over South America, Int. J. Climatol., 32, 669–680, https://doi.org/10.1002/joc.2296, 2012.
Reid, P. C., Hari, R. E., Beaugrand, G., Livingstone, D. M., Marty, C., Straile, D., Barichivich, J., Goberville, E., Adrian, R., Aono, Y., Brown, R., Foster, J., Groisman, P., Hélaouët, P., Hsu, H.-H., Kirby, R., Knight, J., Kraberg, A., Li, J., Lo, T.-T., Myneni, R. B., North, R. P., Pounds, J. A., Sparks, T., Stübi, R., Tian, Y., Wiltshire, K. H., Xiao, D., and Zhu, Z.: Global impacts of the 1980's regime shift, Global Change Biol., 22, 682–703, https://doi.org/10.1111/gcb.13106, 2016.
Rosas, J., Yamasoe, M. A., Sena, E. T., and Rosário, N. E.: Cloud climatology from visual observations at São Paulo, Brazil, Int. J. Climatol., 40, 207–219, https://doi.org/10.1002/joc.6203, 2020.
Sen, P. K.: Estimates of the regression coefficient based on Kendall's Tau, J. Am. Stat. Assoc., 63, 1379–1389, 1968.
Shi, G., Hayasaka, T., Ohmura, A., Chen, Z.-H., Wang, B., Zhao, J.-Q., Che, H.-Z., and Xu, L.: Data quality assessment and the long-term trend of ground solar radiation in China, J. Appl. Meteorol. Clim., 47, 1006–1016, 2008.
Silva, F. B., Longo, K. M., and Andrade, F. M.: Spatial and temporal variability patterns of the urban heat island in São Paulo, Environments, 4, 27, https://doi.org/10.3390/environments4020027, 2017.
Silva, P. F. J.: Notas sobre a industrialização no estado de São Paulo, Brasil, Finisterra, 46, 87–98, 2011.
Soares, R. V.: Ocorrência de incêndios em povoamentos florestais, Floresta, 22, 39–53, https://doi.org/10.5380/rf.v22i12.6424, 1994.
Stanhill, G. and Cohen, S.: Global dimming: a review of the evidence for a widespread and significant reduction in global radiation with discussion of its probable causes and possible agricultural consequences, Agr. Forest Meteorol., 107, 255–278, 2001.
Stanhill, G., Achiman, O., Rosa, R., and Cohen, S.: The cause of solar dimming and brightening at the Earth's surface during the last half century: Evidence from measurements of sunshine duration, J. Geophys. Res.-Atmos., 119, 10902–10911, https://doi.org/10.1002/2013JD021308, 2014.
Wild, M.: Global dimming and brightening: A review, J. Geophys. Res.-Atmos., 114, D00D16, https://doi.org/10.1029/2008JD011470, 2009.
Wild, M.: Enlightening global dimming and brightening, B. Am. Meteorol. Soc., 93, 27–37, https://doi.org/10.1175/BAMS-D-11-00074.1, 2012.
Wild, M., Gilgen, H., Roesch, A., Ohmura, A., Long, C. N., Dutton, E. G., Forgan, B., Kallis, A., Russak, V., and Tsvetkov, A.: From dimming to brightening: decadal changes in solar radiation at Earth's surface, Science, 308, 847–850, 2005.
Wild, M., Ohmura, A., and Makowski, K.: Impact of global dimming and brightening on global warming, Geophys. Res. Lett., 34, L04702, https://doi.org/10.1029/2006GL028031, 2007.
Wild, M., Folini, D., Schär, C., Loeb, N., Dutton, E. G., and König-Langlo, G.: The global energy balance from a surface perspective, Clim. Dynam., 40, 3107–3134, https://doi.org/10.1007/s00382-012-1569-8, 2013.
Xavier, T. M. B. S., Silva Dias, M. A. F., and Xavier, A. F. S.: Impact of ENSO episodes on the autumn rainfall patterns near São Paulo, Brazil, Int. J. Climatol., 15, 571–584, 1995.
Yamasoe, M. A.: Annual and seasonal mean values of surface solar irradiation, sunshine duration, diurnal temperature range, cloud cover fraction, maximum and minimum air temperature, based on observations performed at IAG meteorological station from 1961 to 2016, available at: https://www.iag.usp.br/lraa/index.php/data/cientec/weather-station-climatology/, last access: 26 March 2021.
Yamasoe, M. A., Rosário, N. M. E., and Barros, K. M.: Downward solar global irradiance at the surface in São Paulo city – The climatological effects of aerosol and clouds, J. Geophys. Res.-Atmos., 122, 391–404, https://doi.org/10.1002/2016JD025585, 2017.
Yang, S., Wang, X. L., and Wild, M.: Causes of Dimming and Brightening in China Inferred from Homogenized Daily Clear-Sky and All-Sky in situ Surface Solar Radiation Records (1958–2016), J. Climate, 32, 5901–5913, https://doi.org/10.1175/JCLI-D-18-0666.1, 2019.
Zerefos, C. S., Eleftheratos, K., Meleti, C., Kazadzis, S., Romanou, A., Ichoku, C., Tselioudis, G., and Bais, A.: Solar dimming and brightening over Thessaloniki, Greece, and Beijing, China, Tellus B, 61, 657–665, https://doi.org/10.1111/j.1600-0889.2009.00425.x, 2009.
Zhang, S., Wu, J., Fan, W., Yang, Q., and Zhao, D.: Review of aerosol optical depth retrieval using visibility data, Earth-Sci. Rev., 200, 102986, https://doi.org/10.1016/j.earscirev.2019.102986, 2020.