the Creative Commons Attribution 4.0 License.
the Creative Commons Attribution 4.0 License.
 | 30 Apr 2021
Aerosol radiative impact during the summer 2019 heatwave produced partly by an inter-continental Saharan dust outbreak – Part 1: Short-wave dust direct radiative effect
Carmen Córdoba-Jabonero
María-Ángeles López-Cayuela
Albert Ansmann
Adolfo Comerón
María-Paz Zorzano
Alejandro Rodríguez-Gómez
Constantino Muñoz-Porcar
The short-wave (SW) direct radiative effect (DRE) during the summer 2019 heatwave produced partly by a moderate, long-lasting Saharan dust outbreak over Europe is analysed in this study. Two European sites (periods) are considered: Barcelona, Spain (23–30 June), and Leipzig, Germany (29 and 30 June), 1350 km apart from each other. Major data are obtained from AERONET and polarised Micro-Pulse Lidar (P-MPL) observations. Modelling is used to describe the different dust pathways, as observed at both sites. The coarse dust (Dc) and fine dust (Df) components (with total dust, DD = Dc + Df) are identified in the profiles of the total particle backscatter coefficient using the POLIPHON (POlarisation LIdar PHOtometer Networking) method in synergy with P-MPL measurements. This information is used to calculate the relative mass loading and the centre-of-mass height, as well as the contribution of each dust mode to the total dust DRE. Several aspects of the ageing of dust are put forward. The mean dust optical depth and its ratios are, respectively, 0.153 and 24 % in Barcelona and 0.039 and 38 % in Leipzig; this Df increase in Leipzig is attributed to a longer dust transport path in comparison to Barcelona. The dust produced a cooling effect on the surface with a mean daily DRE of −9.1 and −2.5 W m−2, respectively, in Barcelona and Leipzig, but the DRE ratio is larger for Leipzig (52 %) than for Barcelona (37 %). Cooling is also observed at the top of the atmosphere (TOA), although less intense than on the surface. However, the DRE ratio at the TOA is even higher (45 % and 60 %, respectively, in Barcelona and Leipzig) than on the surface. Despite the predominance of Dc particles under dusty conditions, the SW radiative impact of Df particles can be comparable to, even higher than, that induced by the Dc ones. In particular, the DRE ratio in Barcelona increases by +2.4 % d−1 (surface) and +2.9 % d−1 (TOA) during the dusty period. This study is completed by a second paper about the long-wave and net radiative effects. These results are especially relevant for the next ESA EarthCARE mission (planned in 2022) as it is devoted to aerosol–cloud–radiation interaction research.
- Article
(5671 KB) - Full-text XML
- Companion paper
- BibTeX
- EndNote


Climate change is an important issue nowadays (IPCC, 2013), extreme events (as heatwaves, droughts, intense aerosol outbreaks, etc.) being linked to high perturbations in the radiative balance of the atmosphere. In particular, the knowledge of the aerosol-induced climatological implications is still preliminary, and the uncertainties associated with the determination of the aerosol direct and indirect radiative effects are difficult to be unambiguously estimated. This is mainly due to the change in the aerosol properties during their transport, the incomplete characterisation of aerosol complex mixtures, and the lack of information on aerosol–cloud interaction mechanisms (e.g. Haywood and Boucher, 2000).
Dust particles play an important role in the frame of climate forcing due to their direct effect on scattering and absorption of solar radiation, as well as their indirect effect by acting as both cloud condensation nuclei (CCN) and ice nucleating particles (INPs) (DeMott et al., 2003). Radiative forcing (RF) is a proxy for climate research and policy, which is also linked to the change in global mean surface temperature as derived from climate models at continental, regional, or local scales. In particular, significant uncertainties in the estimation of the dust-induced direct radiative effects are still present, hence the necessity to study the radiative properties of dust particles and to adequately quantify their direct effect on the earth–atmosphere radiative budget (IPCC, 2013). The direct radiative effect of the total dust has been widely investigated at both short-wave (SW) and long-wave (LW) spectral ranges (Sokolik and Toon, 1996; Pérez et al., 2006; Balkanski et al., 2007); however, despite dust intrusions being usually dominated by large particles, the fine-mode dust cannot be disregarded and hence its relative contribution to the total radiative effect. Therefore, the individual radiative estimate for both coarse- and fine-mode dust must be separately evaluated, and only a few works have addressed this issue. For instance, Sicard et al. (2014b) reported that coarse dust particles seem mainly to affect the LW radiation, their fine mode being mostly responsible of the SW radiative modulation.
Mineral dust is the most abundant aerosol in the atmosphere; however, dust emissions are very difficult to predict. Despite emissions of 1000–3000 Tg yr−1 being estimated by global models (i.e. Zender et al., 2004), a later study carried out by means of a global dust model intercomparison (Huneeus et al., 2011) suggested that the emissions may range from 500 to 4000 Tg yr−1. Globally the natural dust sources account for 75 %, with the remaining 25 % coming from anthropogenic (mainly from agricultural activities) origins (Ginoux et al., 2012). In particular, Saharan dust could represent half of the airborne abundance (Prospero et al., 2002). According to Huneeus et al. (2011), North African deserts could emit between 400 to 2200 Tg yr−1 of dust particles; hence, 8 % of that amount can be attributed to anthropogenic sources (Ginoux et al., 2012). In addition, Saharan dust is frequently transported far from its sources to Europe and the American continent, being able to reach rather high altitudes (up to 8 km height). Hence, changes in the dust properties are expected, influencing their vertical radiative field. Indeed, there is special interest in characterising the impact of the dust intrusions on the climate of Europe. The arrival of Saharan dust intrusions over Europe is frequently observed in springtime and summertime, mostly in southern Europe; only in very few cases are those intrusions able to reach central and northern Europe (Ansmann et al., 2003; Osborne et al., 2019; Akritidis et al., 2020). Several studies have focused on the dust vertical distribution using ground-based lidar systems (e.g. Ansmann et al., 2003; Papayannis et al., 2005, 2008; Mona et al., 2006; Córdoba-Jabonero et al., 2011) belonging to different aerosol lidar networks (EARLINET, MPLNET). Recent studies have demonstrated that there is an increasing frequency of Saharan outbreaks, in particular, over the Iberian Peninsula (IP) when compared with long-term records (Sousa et al., 2019), with a significant effect on the production of extreme heatwaves over the IP. For instance, the heatwave that occurred in June 2019 over Europe, as described by Sousa et al. (2019), was partly produced by an inter-continental Saharan dust intrusion reaching the IP and central Europe. This dust event is examined in this work.
The aim of this work is threefold: (1) to assess the continuous evolution of the SW direct radiative effect (DRE) of both coarse dust (Dc) and fine dust (Df) particles during the summer 2019 heatwave over Europe, examining a case study associated with the dust intrusion reaching two European stations in June 2019 by tracking the pathways of the different air masses; (2) to evaluate the impact of the Df particles on the total (Dc + Df) SW DRE; and (3) to show the improved use of polarised Micro-Pulse Lidar (P-MPL) systems, belonging to NASA's MPLNET (Micro-Pulse Lidar NETwork), for the continuous monitoring of the change in dust properties during transportation and hence the DRE evolution. The dust plume was first observed in Barcelona (BCN, Spain; 41.4∘ N, 2.1∘ E; 125 ) on 23 June and arrived later at Leipzig (LPZ, Germany; 51.4∘ N, 12.4∘ E; 125 ) on 29 June. Measurements with P-MPL systems were performed at both stations.
The paper is structured as follows. Section 2 describes the instrumentation and methods used: (Sect. 2.1) the two P-MPL systems as deployed at each of those two urban stations for continuous vertical aerosol observations; (Sect. 2.2) the retrieval methods to derive the dust properties for both the coarse and fine modes and their vertical mass concentration; (Sect. 2.3) the radiative transfer (RT) model for DRE calculations; and (Sect. 2.4) both trajectory and forecast models to simulate the origin and pathways of the dusty air masses. Section 3 describes the results, as obtained for (Sect. 3.1) the dust plume origin and transport, (Sect. 3.2) the separation of coarse- and fine-mode dust properties, and (Sect. 3.3) the dust direct radiative effect. Sections 4 and 5 present, respectively, the discussion of those results and the main conclusions. In a second work (Sicard et al., 2021) the dust long-wave and net DRE of the same event are analysed.
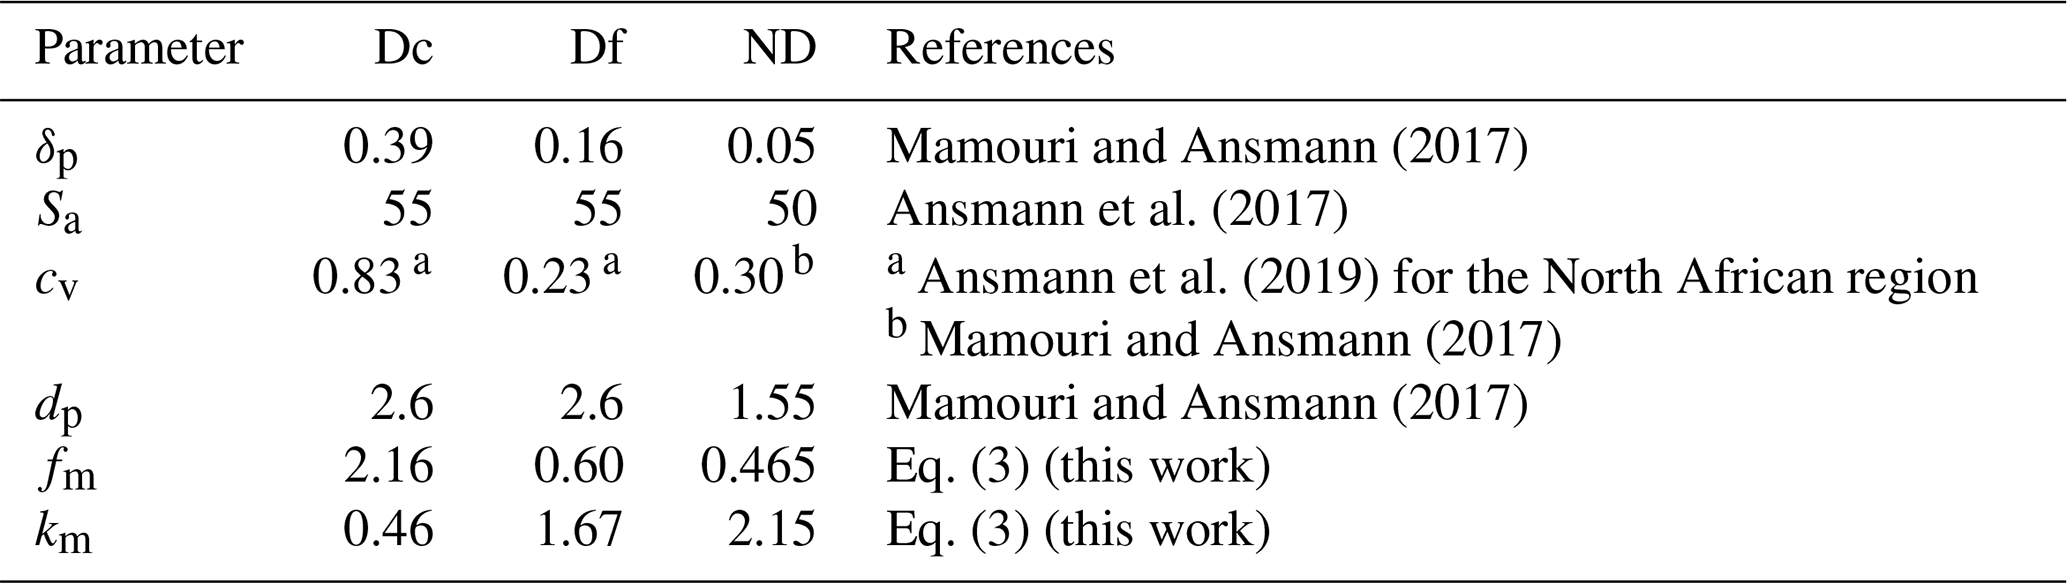
Table 1Assumed specific values of PLDR (δp) and LR (Sa, sr), together with the mass conversion factor (fm, g m−2), particle density (dp, g cm−3), volume conversion factor (cv, 10−12Mm), and MEE (km, m2 g−1), for the Dc, Df, and ND components.
2.1 P-MPL systems
Two polarised micro-pulse lidar (P-MPL) systems, belonging to NASA's MPLNET (Micro Pulse Lidar NETwork) and deployed at two European urban stations, namely Barcelona (BCN, Spain; 41.4∘ N, 2.1∘ E; 125 ; permanent location) and Leipzig (LPZ, Germany; 51.4∘ N, 12.4∘ E; 125 ; planned campaign), were used for vertical dust observations during the dust event examined in this study. BCN and LPZ are located at around 1500 and 2800 km, respectively, from the Saharan dust sources, and they are 1350 km apart from each other. Aerosol and cloud profiles are usually recorded in an automatic and continuous () mode. The P-MPL system is an elastic lidar with a relatively high pulse repetition frequency (2500 Hz) using a low-energy (∼ 7 µJ pulse−1) Nd:YVO4 laser at 532 nm, including polarisation capabilities. The lidar backscatter signal is registered in the polarised detection co-channel (Pco) and cross-channel (Pcross) using a unique avalanche photo-detector (APD), sampled for 75 m (BCN) and 15 m (LPZ) vertical resolutions and recorded and integrated for 1 min periods. The total range-corrected signal (RCS) P (Campbell et al., 2002) is the sum of their parallel () and perpendicular (Ps=Pcross) signal components, as adapted from Flynn et al. (2007), i.e. . Those RCS profiles are averaged for 1 h to increase the signal-to-noise ratio. The volume linear depolarisation ratio (VLDR), δV, can be also estimated from the perpendicular-to-parallel RCS ratio, i.e. . More details of the P-MPL signal processing are described in Córdoba-Jabonero et al. (2018).
2.2 POLIPHON retrieval: separation of the optical and mass features
The POLIPHON (POlarisation LIdar PHOtometer Networking) approach (Mamouri and Ansmann, 2014, 2017) is used in combination with the P-MPL observations (P profiles) for the separation of both fine and coarse extinction components of the desert dust (DD) particles, as described in Córdoba-Jabonero et al. (2018). The algorithm is based on a two-step method for separating the three components of dusty mixtures. First, by using both the lidar-derived total particle backscatter coefficient (PBC), βp, and the particle linear depolarisation ratio (PLDR), δp, profiles, the coarse mode (predominantly coarse dust particles, Dc), βDc, and the fine mode of the PBC are separated. Second, the fine mode of the PBC, which is composed of the fine dust particles (Df) and non-dust aerosols (ND), is separated in two more components, respectively, βDf and βND. The ND component is assumed to belong to the fine mode, associated with background (continental, pollution) aerosols in both the urban stations, BCN and LPZ, studied in this work. In summary, the height-resolved total PBC is , with z denoting the dependence on height. Particle extinction coefficient (PEC) profiles for each component are obtained from the corresponding PBC and the particular lidar ratio (LR, extinction-to-backscatter coefficient ratio) values, Sa, as assumed to be specific for those Dc, Df, and ND components; that is,
where σi(z), βi(z), and are, respectively, the extinction coefficient and the backscatter coefficient as a function of height, and the particular LR for each i component (i.e. i = Dc, Df, and ND). In this procedure, specific δp and Sa values for each pure Dc, Df, and ND component are input parameters. Table 1 shows the assumed values (corresponding references are also cited).
Total PBC profiles are derived by using the Klett–Fernald (KF) retrieval (Fernald, 1984; Klett, 1985) on the P-MPL RCS measurements and constrained with the aerosol optical depth (AOD) values available from NASA's AERONET (AErosol RObotic NETwork; http://aeronet.gsfc.nasa.gov; last access: 15 July 2020). Columnar AOD data are provided by the two AERONET Cimel sun photometers, co-located with the P-MPL systems at BCN and LPZ stations. AERONET V3 L2.0 and V3 L1.5 data are available, respectively, from BCN and LPZ sites (see Sect. 3.3.1). PLDR profiles are calculated from the PBC and VLDR profiles. More details of the P-MPL signal processing and optical retrieval are described in Córdoba-Jabonero et al. (2018). Relative uncertainty values associated with those optical properties are shown in Table 2.
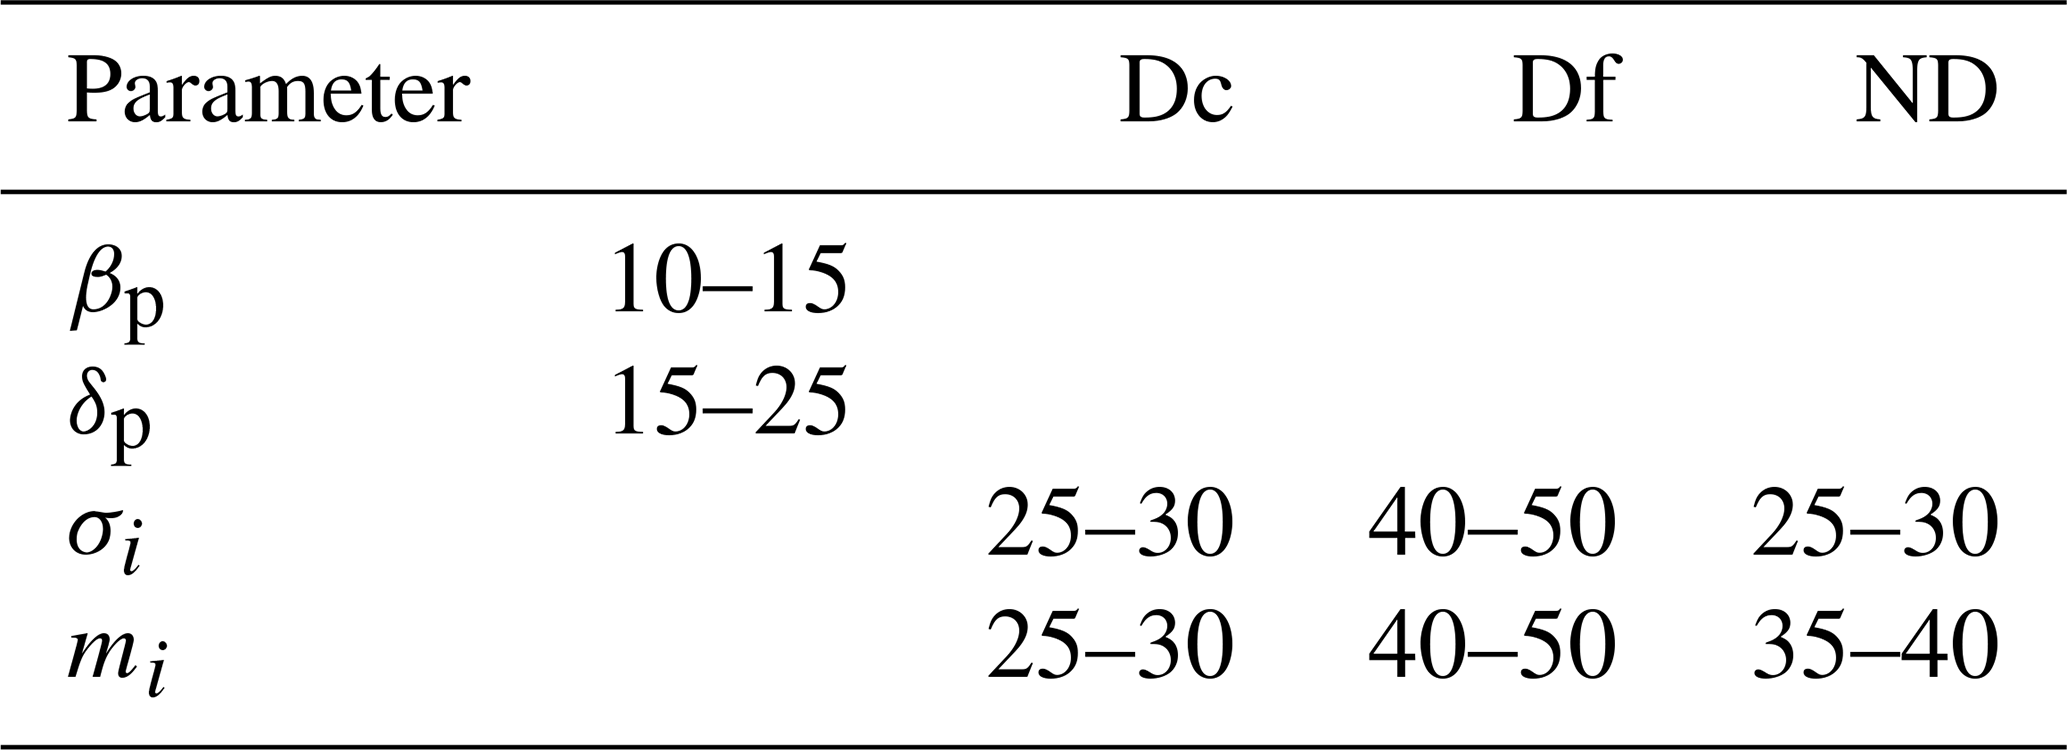
Table 2Relative uncertainties (%) associated with the lidar-derived particle optical properties and mass features (i is for the Dc, Df, and ND components).
Additionally, once σDc, σDf, and σND are determined, the mass concentration (MC) profiles of each i component, mi(z) (g m−3; i = Dc, Df, and ND), can be calculated (the expected values with relative uncertainties are included in Table 2) with the relation (Ansmann et al., 2017; Córdoba-Jabonero et al., 2016, 2019)
where (g m−2) are the specific AERONET-based extinction-to-mass conversion factors (Ansmann et al., 2019) for each component (i = Dc, Df, and ND). Note that
where dp, cv, and km are, respectively, the particle density (g cm−3), the volume conversion factor (10−12 Mm), and the mass extinction efficiency (MEE; m2 g−1). The assumed values of all those parameters are shown in Table 1. The vertical profile of the total mass concentration (MC, g m−3) is calculated as the summatory of each mass component, i.e.
and their vertically integrated mass values (i.e. mass loadings; g m−2), denoted as MLi and ML, are
where Δz is the vertical resolution of the lidar measurements (75 and 15 m, respectively, for BCN and LPZ).
The relative height-integrated mass contribution of each component with respect to the total mass loading (Mi, %) (i = Dc, Df, and ND), which is expressed as
is also examined during the dust event as observed in BCN and LPZ.
Regarding the vertical impact of each component, their relative contribution in terms of a mass-weighted altitude, the so-called centre-of-mass (CoM) height, is calculated, and its evolution is examined along each particular dust event period in BCN and LPZ. The CoM height, Zm, is defined similarly as in Córdoba-Jabonero et al. (2019); that is,
mi(zk) being the mass concentration profile for each i component (see Eq. 2 with i = Dc, Df, and ND) and zk the height, where k denotes the height-step defined by the vertical resolution (Δz; 75 and 15 m, respectively, for BCN and LPZ measurements).
2.3 GAME radiative transfer model
Solar flux was calculated for 18 layers of the atmosphere distributed between the ground level and 20 km height with the radiative transfer (RT) model GAME (Dubuisson et al., 1996, 2004, 2006). The solar spectral range was set from 0.2 to 4.0 µm (wave number resolution of 400 cm−1 from 0.2 to 0.7 µm and 100 cm−1 from 0.7 to 4.0 µm). GAME calculates solar flux values at the boundary of plane and homogenous atmospheric layers by using the discrete ordinates method (Stamnes et al., 1988). Gas (H2O, CO2, O3, N2O, CO, CH4, and N2 are considered) absorption is calculated from the correlated k distribution (Lacis and Oinas, 1991). More details about the computation of the gas transmission functions can be found in Dubuisson et al. (2004) and Sicard et al. (2014a). The gas absorption is parameterised from profiles of pressure, temperature, and relative humidity. In BCN, radiosoundings launched twice a day at 00:00 and 12:00 UTC by the University of Barcelona in collaboration with the Servei Meteorològic de Catalunya, the Catalonia meteorological agency, were used. No radiosoundings are available in LPZ; thus, the 6 h profiles from the Global Data Assimilation System (GDAS) provided by the National Oceanic and Atmospheric Administration (NOAA) were used instead. Aerosols are fully parameterised in the GAME model by the user in terms of spectrally and vertically resolved aerosol optical depth (AOD), single scattering albedo (SSA), and asymmetry factor (asyF). The spectrally resolved surface albedo (SA) is another input of the model. All those latter parameters are described in Sect. 3.3.1.
GAME has been used to calculate solar flux values for scientific purposes in several works (e.g. Roger et al., 2006; Mallet et al., 2008; Sicard et al., 2012). It was validated by means of an intercomparison exercise of radiative transfer models (Halthore et al., 2005) which concluded that GAME is accurate to a few watts (1–3) for an incoming solar flux of 1000 W m−2. Since this work is focused on the dust radiative impact, the expression of the aerosol direct radiative effect (ARE) is particularly defined for dust as the dust direct radiative effect (DRE) at a given height level, L; that is,
where Fd and F0 are the radiative flux values with and without dust, while the ↓ and ↑ arrows indicate whether the fluxes are downward or upward, respectively. By that definition, negative (positive) DRE values represent a cooling (warming) effect. The DRE was calculated at two climate-relevant altitude levels: at the top of atmosphere (TOA) and on the surface (SRF). The dust contribution in the atmospheric column is quantified by the atmospheric radiative effect, DRE(ATM), which is defined as follows:
2.4 Air masses transport modelling
In order to determine the origin and pathway of the dusty air masses affecting both stations involved in this study, a trajectory analysis using two different models is performed. The Hybrid Single-Particle Lagrangian Integrated Trajectory (HYSPLIT) model version 4, developed by NOAA's Air Resources Laboratory (ARL) (https://www.ready.noaa.gov/HYSPLIT.php; last access: 28 April 2020; Draxler and Hess, 1998; Stein et al., 2015; Rolph et al., 2017) is used in conjunction with the Global Data Assimilation System (GDAS) meteorological files (https://www.emc.ncep.noaa.gov/gmb/gdas/; last access: 28 April 2020; spatial resolution of 1∘ × 1∘ every 3 h) in order to identify the source regions of the dust particles. HYSPLIT 5 d back trajectories of air masses arriving at each station (BCN and LPZ) are obtained. The NMMB/BSC-Dust model (https://ess.bsc.es/bsc-dust-daily-forecast; last access: 30 January 2020; Pérez et al., 2011) is an online multi-scale atmospheric dust model providing short- to medium-range dust forecasts for both regional and global domains. It has been designed and developed by the Barcelona Supercomputing Center (BSC) and is fully embedded in the Non-hydrostatic Multi-scale Model (NMMB) developed at NOAA's National Centers for Environmental Prediction (NCEP) (Janjic et al., 2011). This toll has been used to obtain dust forecasts over both BCN and LPZ stations during the period from 23 to 30 June 2019.
This section is divided in three subsections on the dust plume origin and transport, the application of the POLIPHON algorithm to the P-MPL observations in terms of coarse- and fine-mode dust contributions to the optical and mass products, and the estimation of the dust direct radiative forcing.

Figure 1NMMB/BSC-Dust forecast images showing both the dust optical depth at 550 nm and 700 hPa wind field, illustrating the inter-continental Saharan dust outbreak observed from 23 to 30 June 2019. Both stations, BCN (41.4∘ N, 2.1∘ E) and LPZ (51.4∘ N, 12.4∘ E), are marked, respectively, by a red and a blue point. Dates and times (UT stands for UTC) are indicated in each image.
3.1 Dust plume origin and transport
The summer 2019 heatwave as observed across Europe (Sousa et al., 2019) was produced partly by an inter-continental Saharan dust outbreak. An overview of this dust intrusion coming from the African continent to Europe, mostly observed from 23 to 30 June 2019, is illustrated with the NMMB/BSC-Dust forecast images. Figure 1 shows the dust optical depth (DOD) at 550 nm and the 700 hPa wind field (the positions of BCN and LPZ stations are marked, respectively, by a red and a blue point). On 24 June 06:00 UTC, DOD values greater than 0.15 were observed at BCN with stable dust conditions throughout the study period. The Saharan dust outbreak moved towards northern Europe and looped down on 29 June, reaching LPZ at 12:00 UTC. In this station, unlike in BCN, two consecutive, close in time dust events occurred. DOD values greater than 0.15 were first observed until the early hours of 30 June (first dust period in LPZ). This was followed by non-dust conditions until 14:00 UTC when dust evidence was detected again until the end of the day (second dust period).
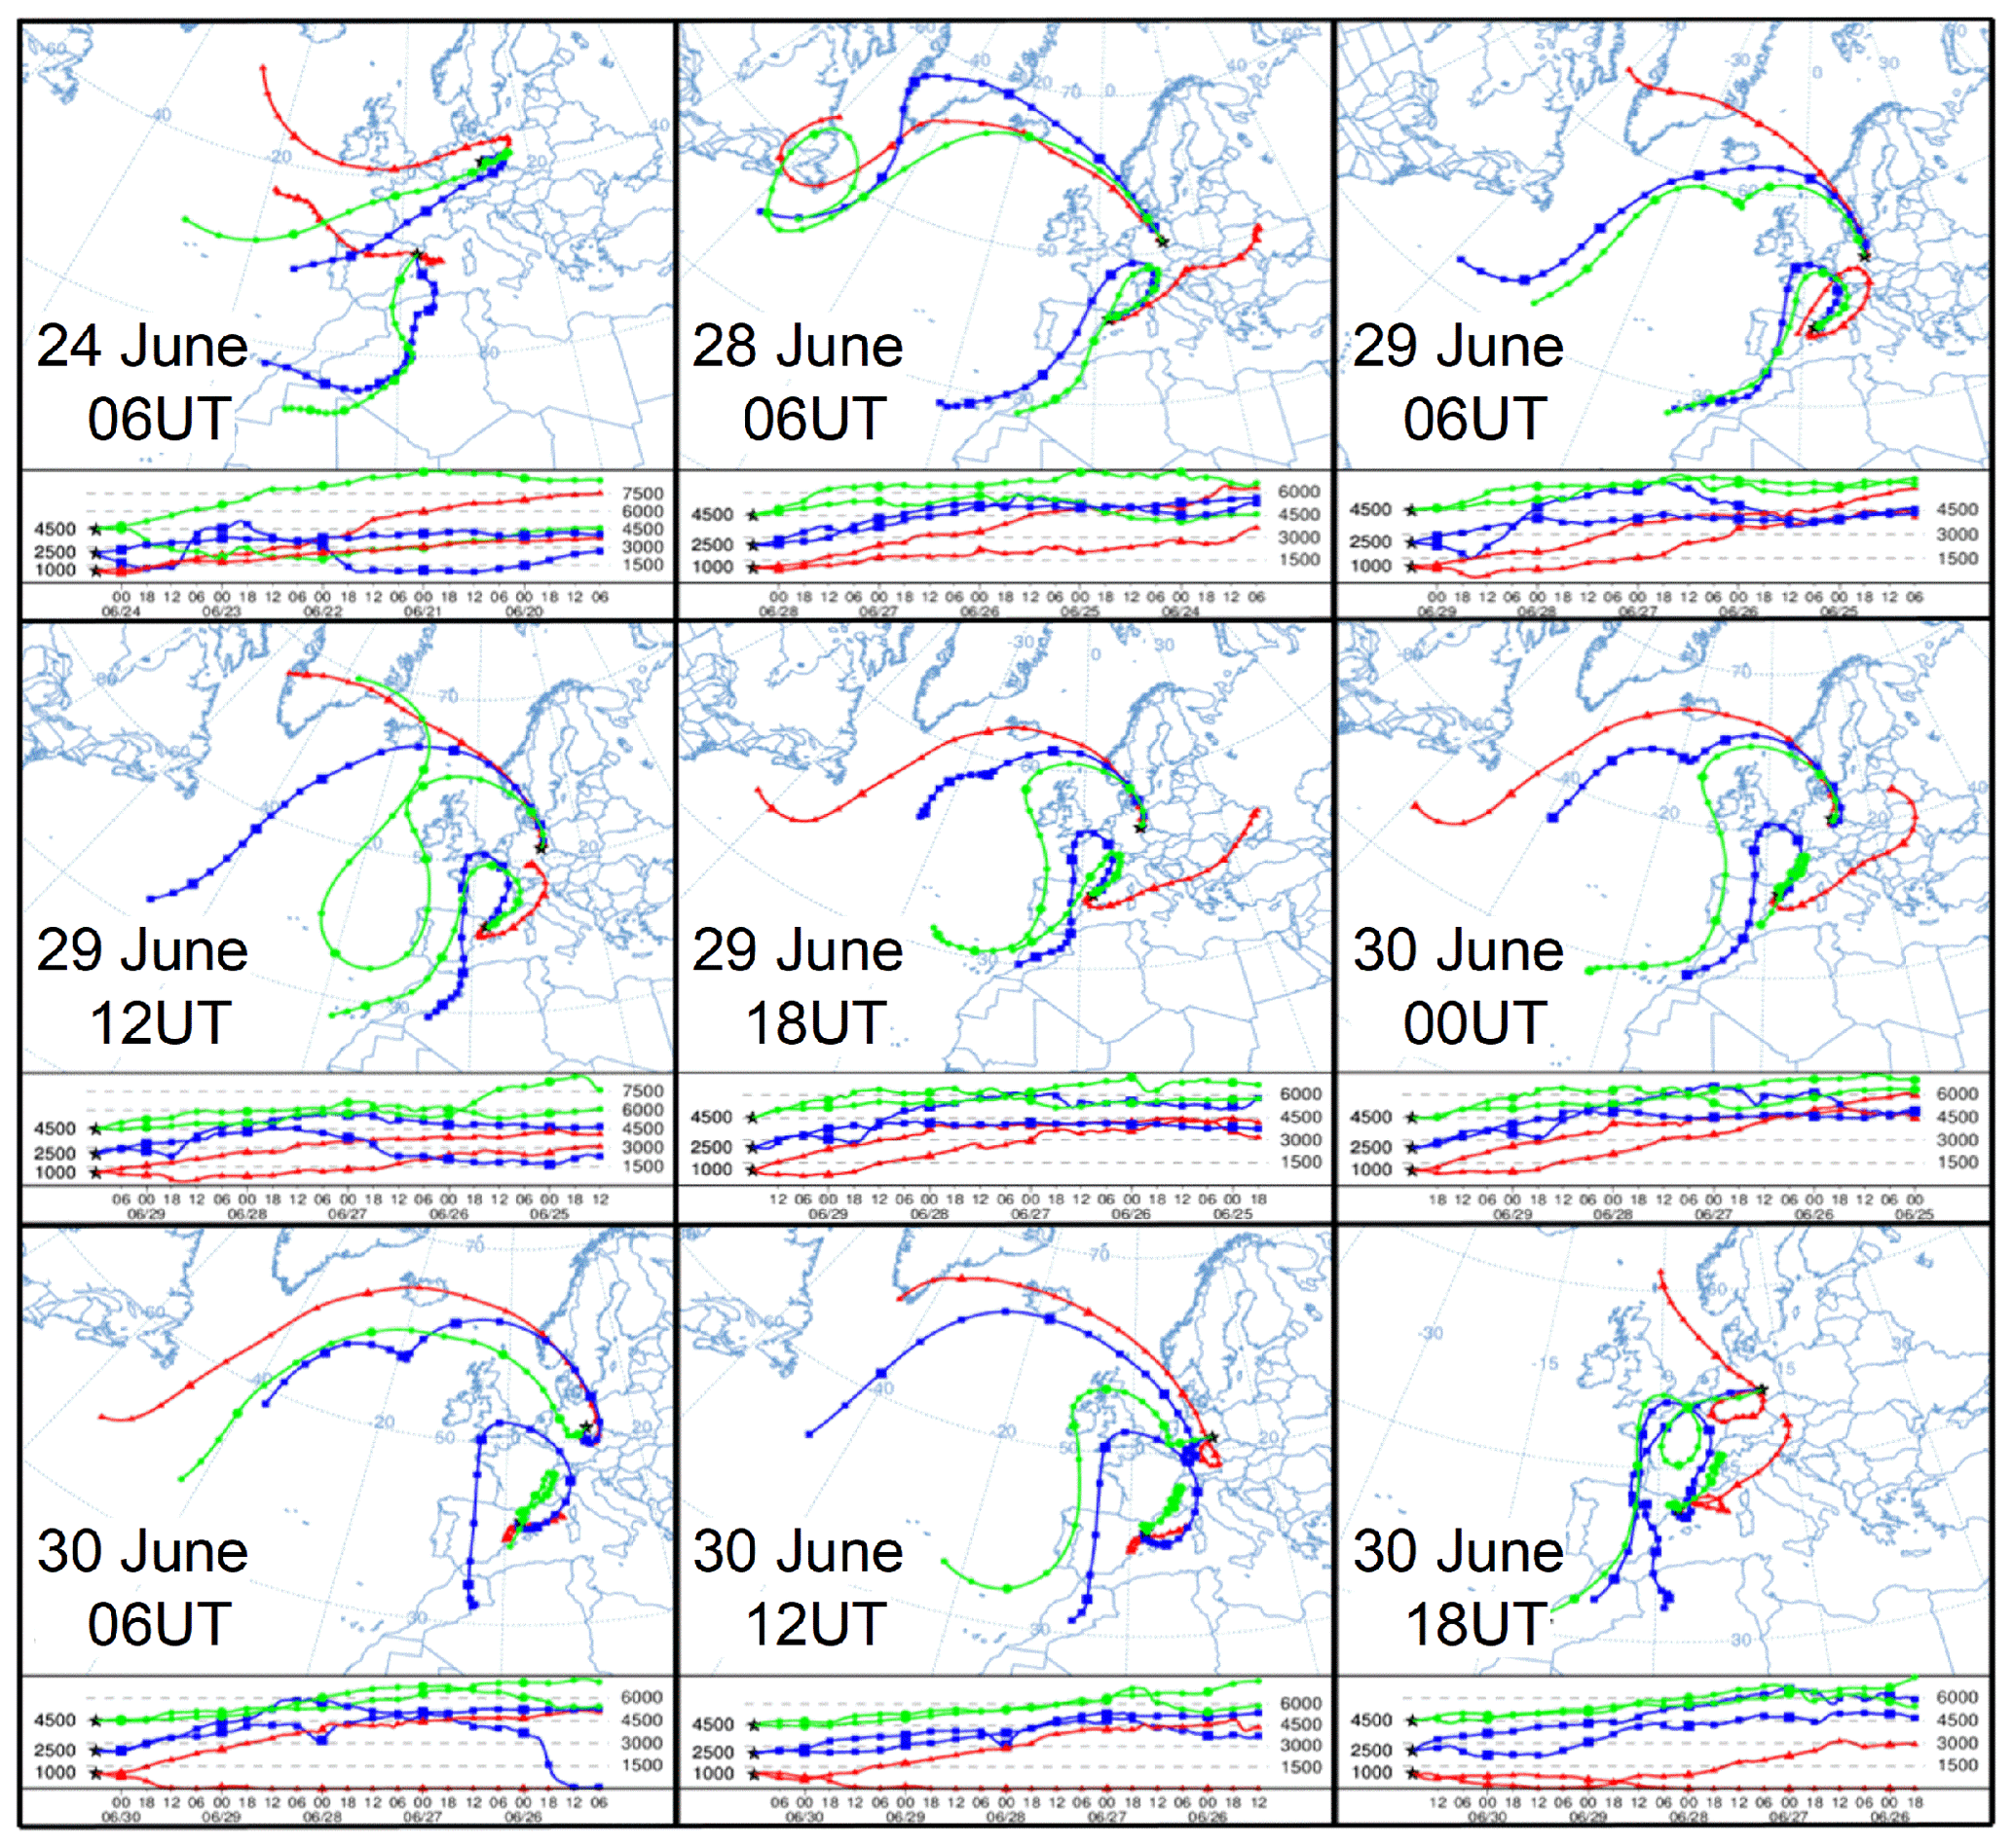
Figure 2HYSPLIT 5 d back trajectories arriving at altitudes of 1000 (red), 2500 (blue), and 4500 (green) over BCN (Spain, 41.4∘ N 2.1∘ E) and LPZ (Germany, 51.4∘ N 12.4∘ E) (marked by black stars), illustrating the inter-continental Saharan dust outbreak observed from 23 to 30 June 2019. Note that dates and times (UT stands for UTC) are the same as those shown in Fig. 1 (also indicated in each plot).
A similar pattern is found by analysing the HYSPLIT 5 d height-dependent back trajectories shown in Fig. 2. Regarding the particular height-dependent back trajectories over BCN , Saharan air masses at 2500 and 4000 m coming from North Africa can be observed for the whole dust event (23–30 June) (see Fig. 2; note that dates and times are the same as those shown in Fig. 1). On the other hand, those observed at 4500 m over LPZ from 29 to 30 June mainly come from the Iberian Peninsula, which was still under dust outbreak conditions in the same period. This indicates that the dusty conditions observed at LPZ are due to dust transport from the Iberian Peninsula (i.e. BCN area), observing two slightly separated dust events. The first one, occurred from 29 June 12:00 UTC to 30 June 05:00 UTC, reached altitudes higher than 3000 m height, while the second one (from 30 June 15:00 UTC to the end of the day) was detected at lower heights (see Fig. 2).
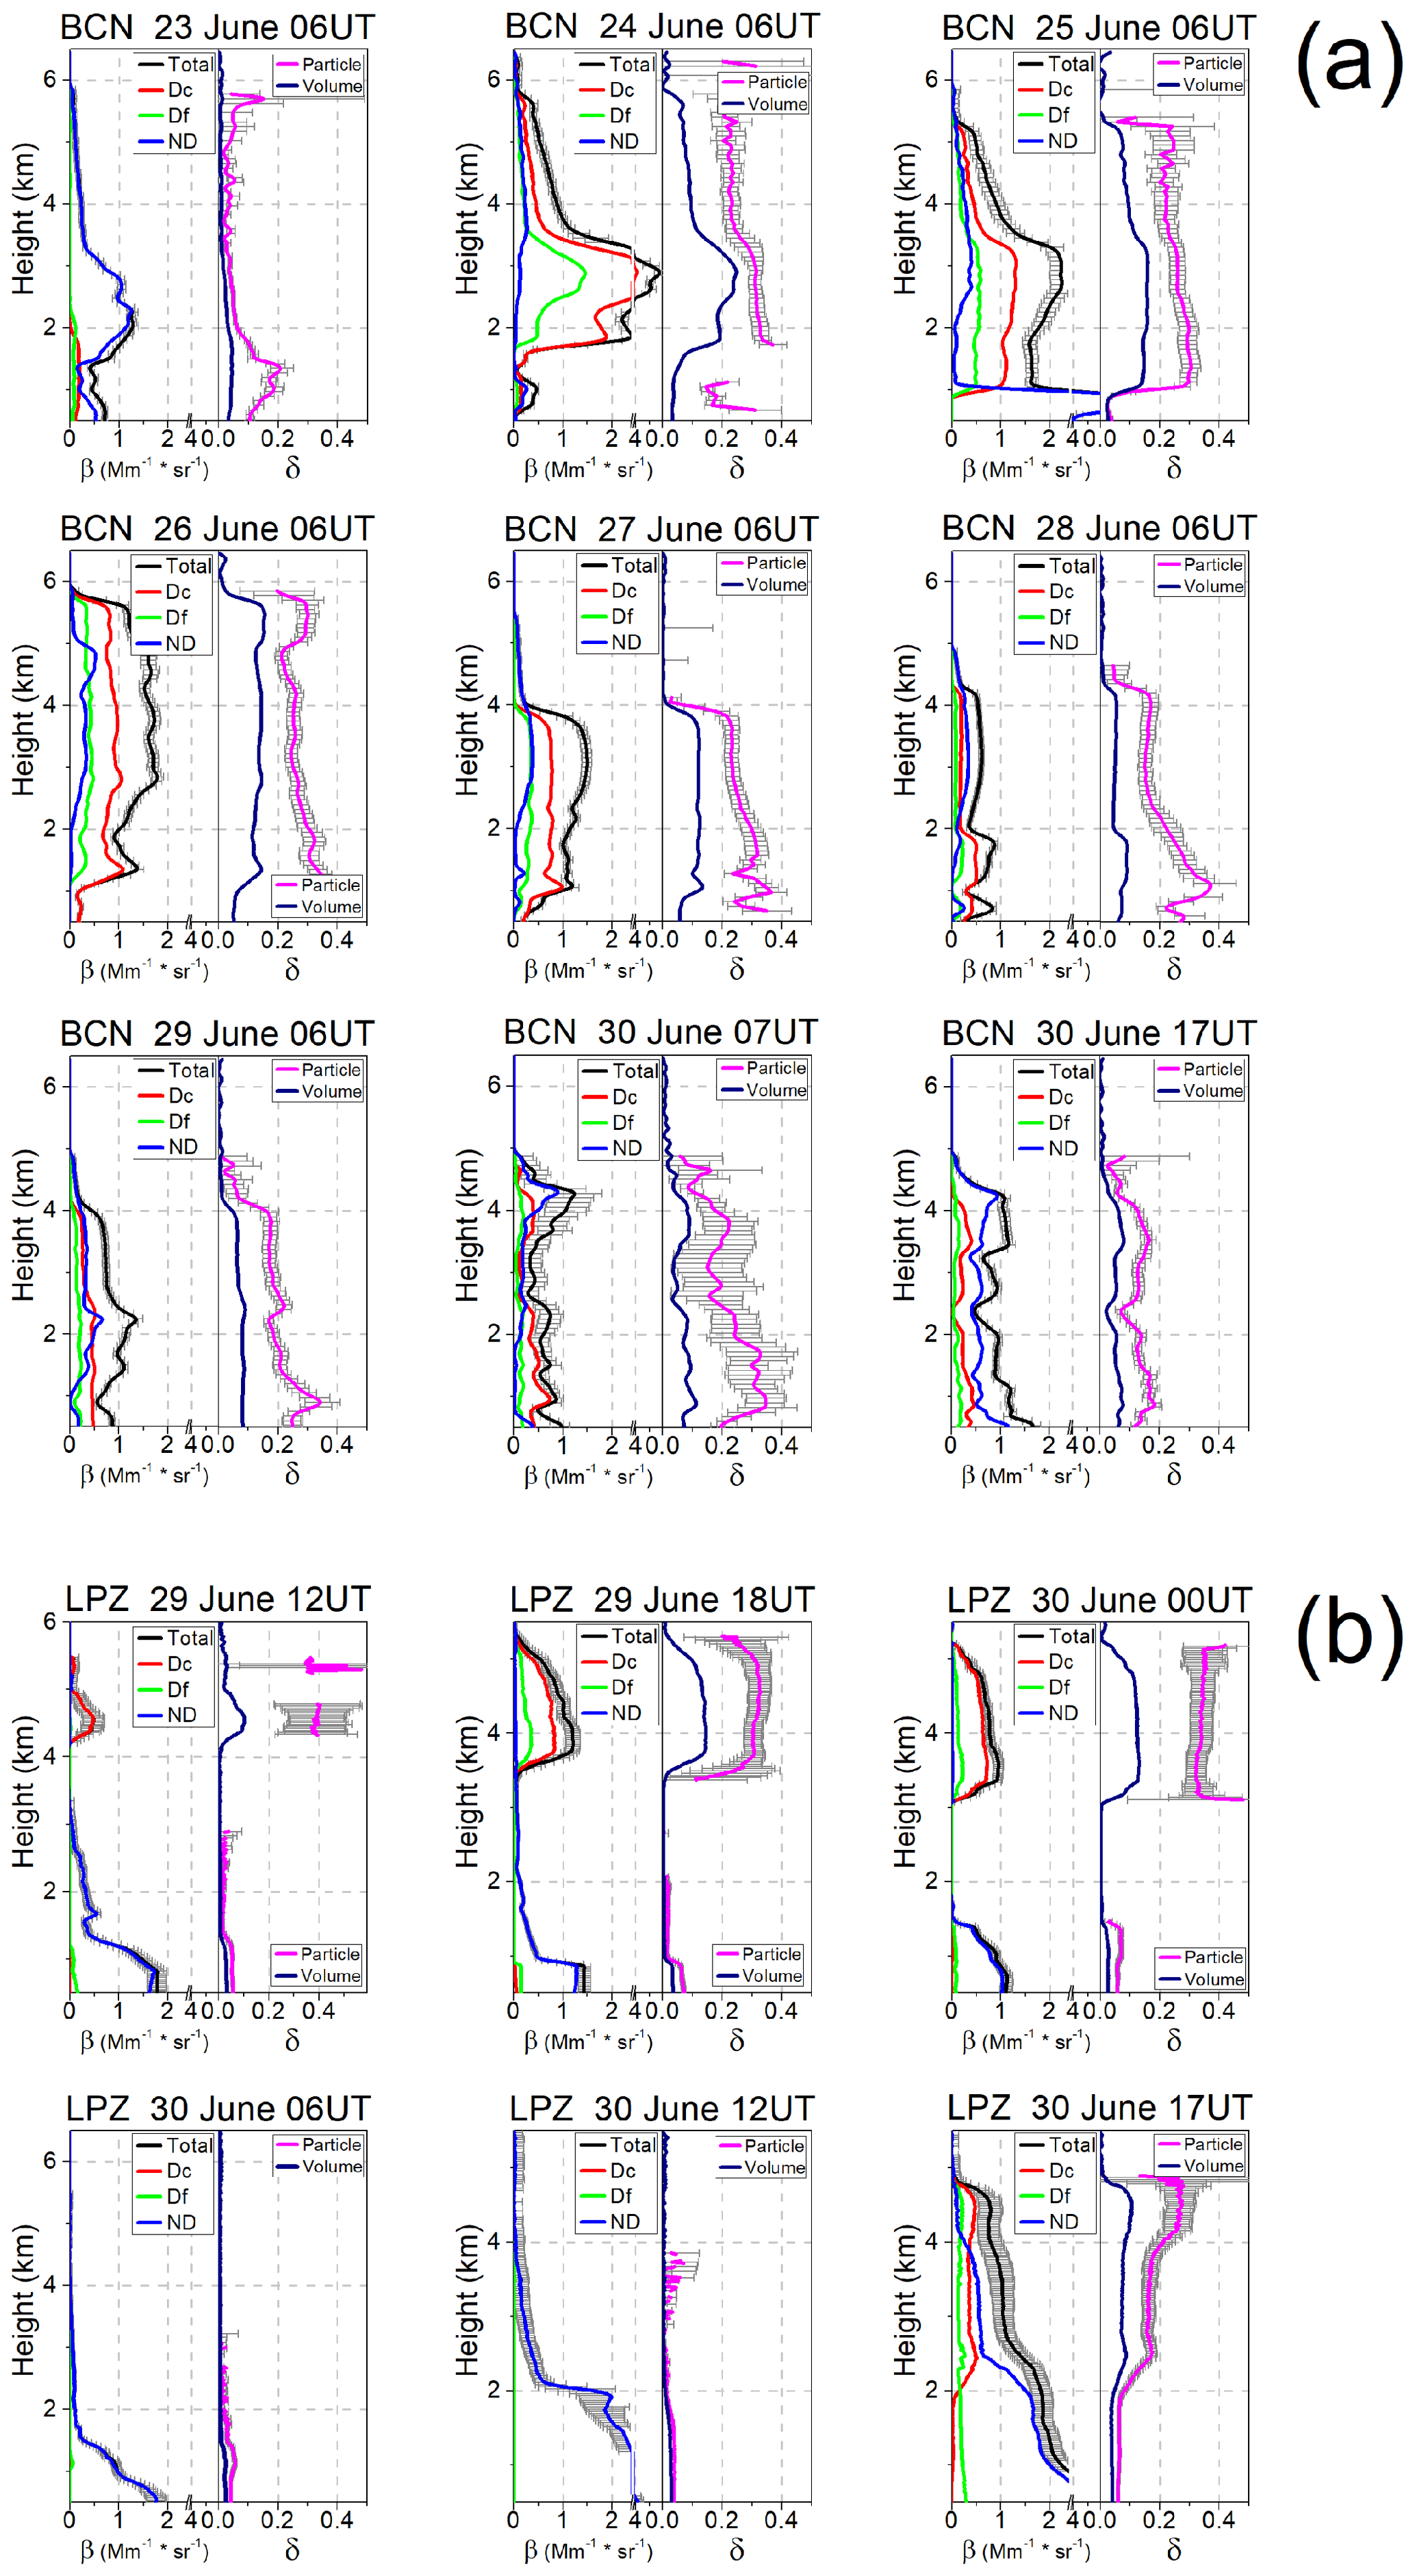
Figure 3Vertical profiles of the optical properties for representative cases (date and time, UT stands for UTC, are shown in each panel) of the dusty events as observed at (a) BCN and (b) LPZ: the total βp (black) and those separated into dusty (βDc, red, and βDf, green) and non-dusty (βND, blue) components (left panels), together with δV (dark blue) and δp (magenta) (right panels). These particular cases are marked by black circles in Fig. 4. For clarity, errors (grey bars) are shown only for βp and δp (particular uncertainties are in Table 2).
3.2 Coarse- and fine-mode dust separation
3.2.1 Optical properties: backscatter coefficient and depolarisation ratios
The evolution of the aerosol optical properties during the dusty events as observed at BCN (23–30 June) and LPZ (29 and 30 June) is analysed regarding their vertical structure. Figure 3 shows the total PBC, βp, and those separated into dusty, βDc and βDf, and non-dusty, βND, components, together with the PLDR, δp, and VLDR, δV, for representative cases of that evolution (date and times are shown in each panel, corresponding to the HYSPLIT images shown in Fig. 2).
In general, by looking at the successive selected panels in Fig. 3a, a gradual dust occurrence can be observed at BCN during the whole dusty event. The greatest incidence of dust intrusion is observed on 24 June, showing a pronounced dust (DD = Dc + Df with Dc predominance) layer extending from 1.5 to 5.5 km height and with a total PBC peak of 5.6 ± 0.4 at around 3 km height. In this dust layer, the mean δp is 0.31 ± 0.02 from 1.5 to 3.5 km, decreasing to 0.23 ± 0.01 at higher altitudes up to 5.5 km. Also, a narrow dust layer with a mean δp of 0.28 ± 0.06 is found above at around 6.2 km height. During the following days, a DD layer with a small ND contribution, also extensively ranging from 1 km to, respectively, 5 km (25 June) and 6 km (26 June) height, can be observed. In this case, the dust incidence is smaller: βp peak values of 2.2 ± 0.2 and 1.8 ± 0.1 are found on 25 and 26 June (approx. 30 %–40 % of that on 24 June), respectively, with mean δp values of 0.25 ± 0.04 and 0.27 ± 0.03. On 27 June, the DD layer descends down (0–4 km) with βp of 1.5 ± 0.1 and similar δp values (0.26 ± 0.05, on average). On 28 and 29 June, the DD signature is also observed from around 4 km down to the surface; however, the main DD occurrence is found from 2.0–2.5 km with a weaker dust incidence: the βp peak is less than 1 and around 1.4 on 28 and 29 June, respectively (i.e. around 17 % and 25 % of that found on 24 June). Regarding δp values found on 28 and 29 June, they are smaller than 0.20 (with mean values of 0.15 ± 0.05 and 0.14 ± 0.06, respectively) above 2 km and 0.28 ± 0.04 and 0.25 ± 0.04, on average, below 2 km. As stated before, this points out that the DD signature is more intense at heights lower than around 2 km. Similarly, the DD incidence still decreases on 30 June, being rather low in the afternoon with δp values smaller than 0.2 (0.12 ± 0.04, on average), indicating the final stage of the dust event over BCN.
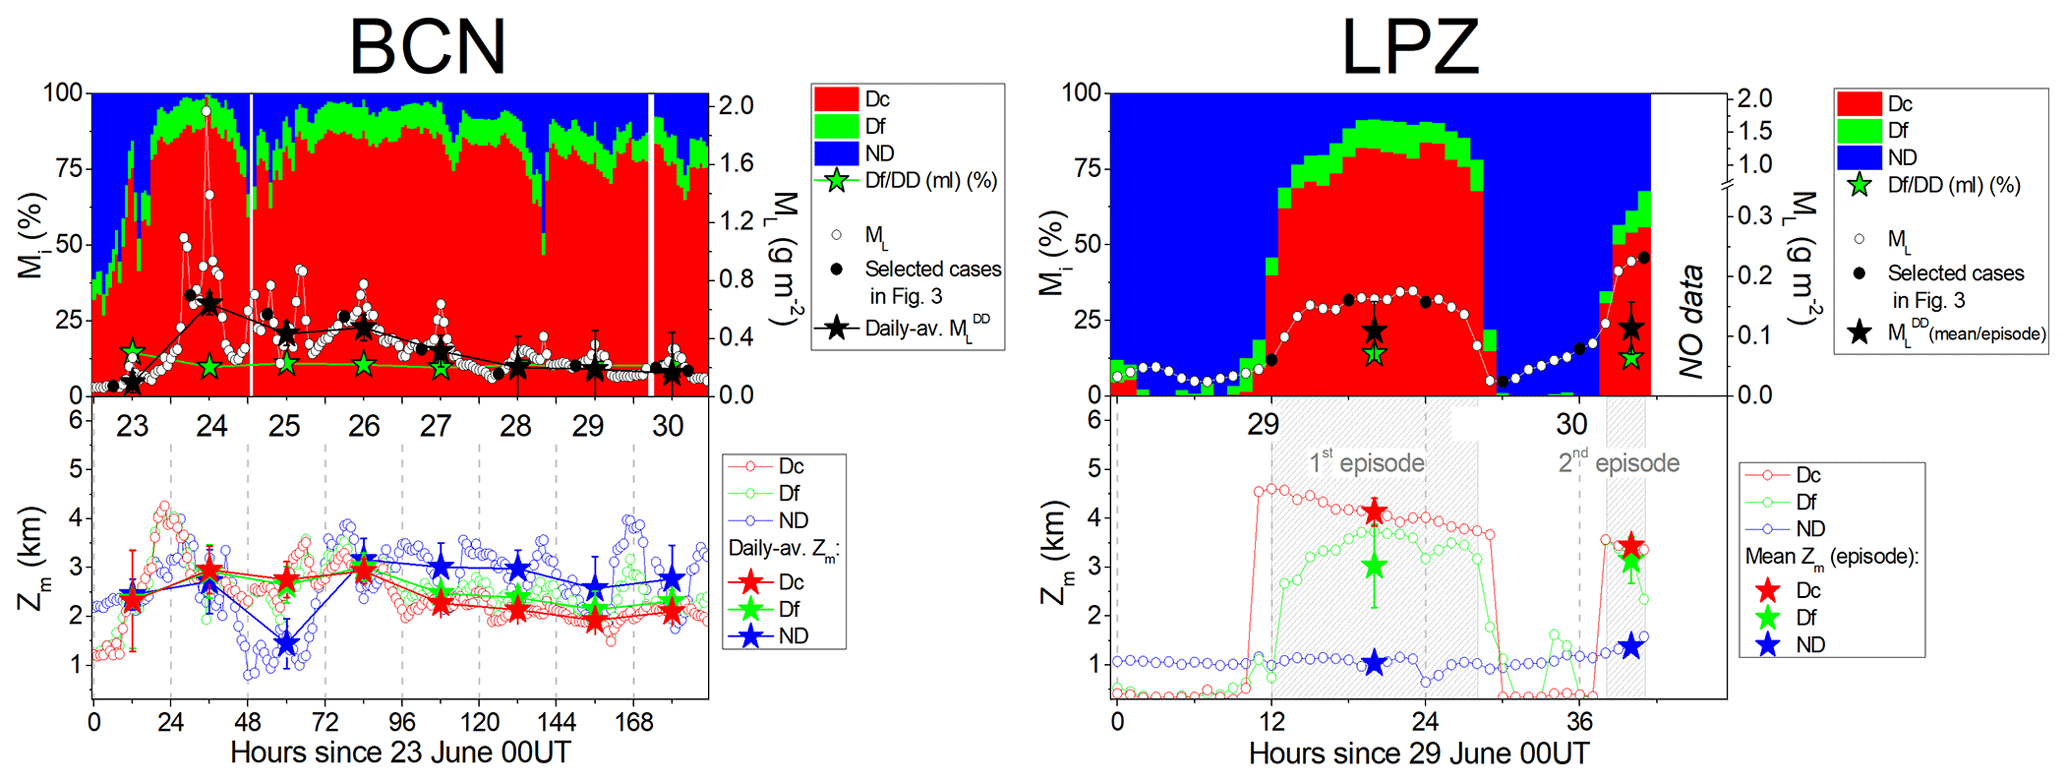
Figure 4Evolution of the dusty events occurring at (left) BCN and (right) LPZ stations in June 2019 in terms of (top) the relative mass loading ratio (Mi, in %) for each component i: Dc (red), Df (green), and ND (blue), together with the total mass loading (ML, g m−2; white circles) and the daily averaged and mean values for the total dust (; black stars); and (bottom) the centre-of-mass (CoM) height (Zm, km) for each component: Dc (red), Df (green), and ND (blue), together with their daily averaged and mean values (full coloured stars; see legend). Black circles in the top panels indicate the representative profiles as shown in Fig. 3. White blanks represent either no retrieval achieved or no data available.
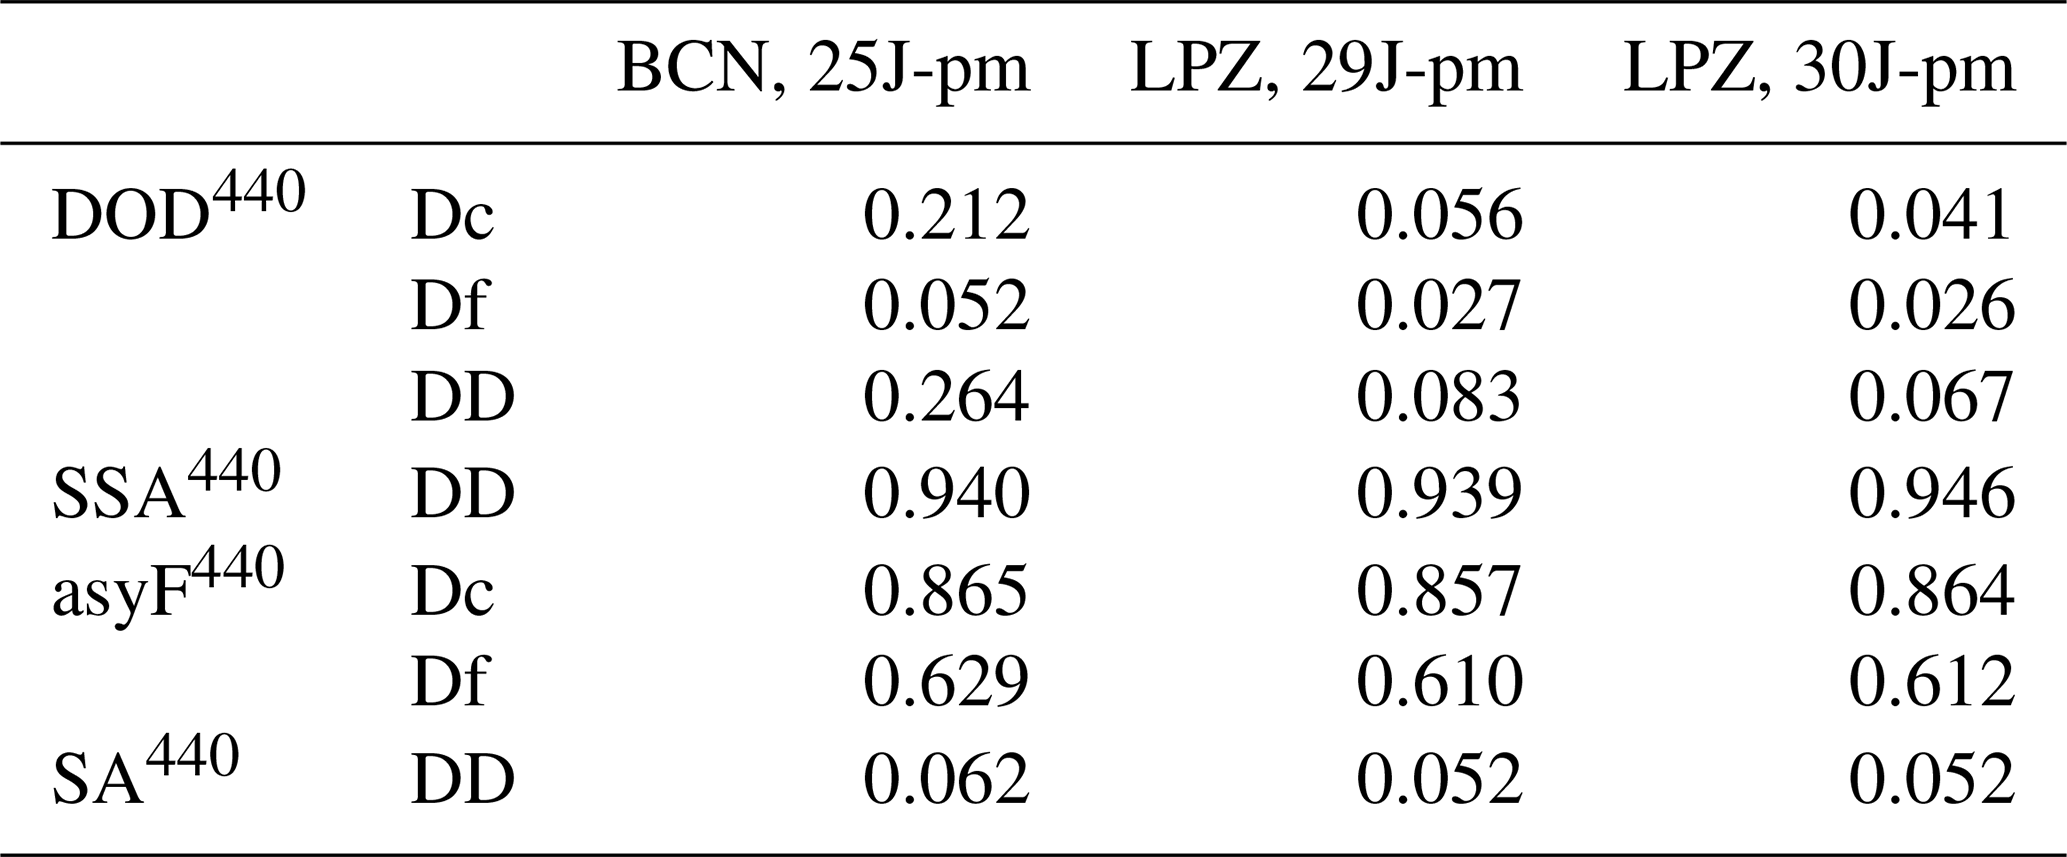
Table 3AERONET values at 440 nm of SSA, asyF, and SA for BCN on 25 June afternoon (25J-pm) and for LPZ on 29 and 30 June afternoon (29J-pm and 30J-pm, respectively). The mean DOD at 440 nm (DOD440) in the same time interval is also included. Dc, Df, and DD (Dc + Df) denote coarse dust, fine dust, and total dust aerosols, respectively.
In the case of the dust intrusion at LPZ, the dust pattern is different from that observed at the BCN site, as also confirmed by BSC/NMMB-Dust and HYSPLIT modelling (see Figs. 1 and 2). During the 29 and 30 June dust event, two dusty periods can be differentiated. The first one starts on 29 June at 12:00 UTC when a two-peak emerging dust layer (4.5 and 5.3 km) with δp values close to 0.4, indicating a major presence of Dc particles (Mamouri and Ansmann, 2017) (see Fig. 3b, 29 June 12:00 UTC), is observed and finishes on 30 June at 05:00 UTC. The second one extends from 30 June at 13:00 UTC to the end of that day (unfortunately, no P-MPL data were available after 18:00 UTC). Figure 3b illustrates the evolution of the dust intrusion once it arrived at LPZ on 29 June at 12:00 UTC. For the first dusty period, from 18:00 UTC on, a well-developed two-layered structure is observed: an evident DD layer with a high predominance of Dc particles is clearly confined from 3.5 to 5.5 km height, and no DD signature at lower altitudes can be detected. In this dust layer, βp peak values are between 0.9 and 1.2 (± 0.03, on average), showing a lower dust incidence (16 %–21 %) with respect to BCN and being only comparable with that present during the last days. However, δp values are higher, ranging between 0.39 ± 0.07 at the beginning of the episode and 0.31–0.34 (± 0.02) later on, indicating a high predominance of Dc particles (Mamouri and Ansmann, 2017). On the second dust period, a mixing of Dc, Df, and ND particles is observed (see Fig. 3b, 30 June 17:00 UTC): the DD layer is extended from the ground to 5 km height, approximately, but with a weak incidence (βp = 0.3–0.8 ). The DD signature below 2 km only corresponds to Df particles, scarcely present in this layer where the ND aerosols dominate, as indicated by the meanδp = 0.063 ± 0.003 in this layer. The Dc and Df components are mainly present in layers at higher altitudes, as also indicated by the PLDR: mean δp values of 0.25 ± 0.03 and 0.16 ± 0.03 are found, respectively, in layers ranging from around 4 to 5 km and from 2 to 4 km height, representing a dominant presence of Dc particles in the first of those layers.
3.2.2 Mass features: relative mass loadings and centre-of-mass height
The aerosol mass features during the dusty events as observed at BCN (23–30 June; continuous dust incidence) and LPZ (29 and 30 June; two separated dust episodes) are analysed in terms of the relative mass contribution of the Dc, Df, and ND components and their centre-of-mass (CoM) height as a measure of the vertical mass impact of each component. Figure 4 shows the time evolution of the relative mass loading for each component (Mi, %) (i: Dc, Df, and ND; see Eq. 7), together with the total mass loading (ML, g m−2; top panels) and the CoM height (Zm, km; bottom panels), for each component along the particular dust event. Daily averaged (BCN) and episode-averaged (LPZ) ML and Zm values are denoted using a bar over the variable, i.e. and . A maximal of 0.66 ± 0.42 g m−2 is found on 24 June at BCN, representing maxima 3–5 times higher than those observed in LPZ (0.14 ± 0.03 and 0.20 ± 0.04 g m−2, respectively, for the first and second episodes). That high dispersion found for (∼ 64 %) is due to the high variability in the dust mass loading during this day, showing a pronounced ML peak of 1.97 ± 0.6 g m−2 at 11:00 UTC (88 % and 9 % of that corresponding to the contribution of the Dc and Df particles, respectively).
Table 4DRE (W m−2) and DREff () on the surface (SRF) as induced by Dc, Df, and DD particles along the particular dust periods in BCN and LPZ. and X(max) indicate daily averaged and maximal instantaneous values, respectively. The daily DOD at 532 nm (DOD532) and the mass loading (ML, in g m−2) are also included. denotes the Df-to-total dust ratio.
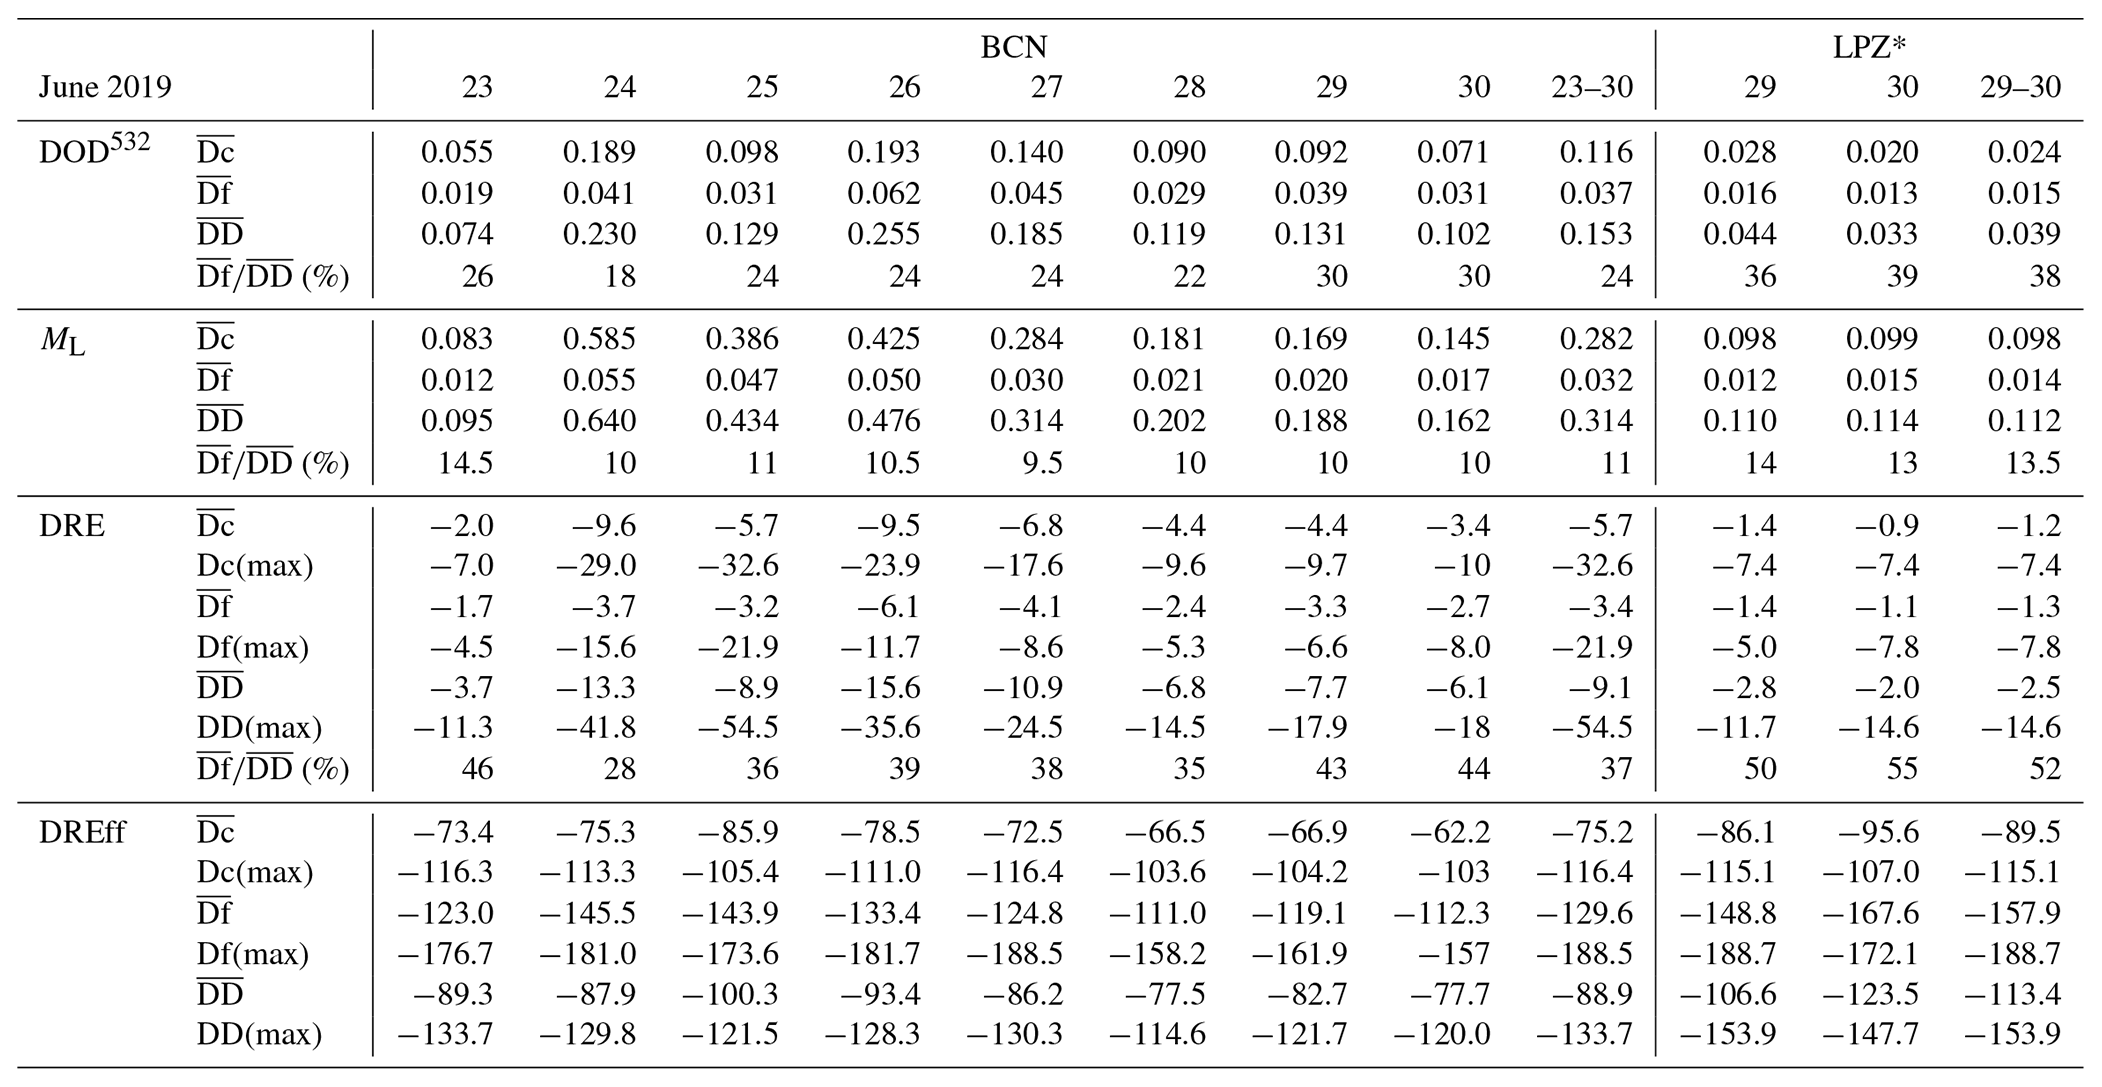
* 29 and 30 June represent the first and second DD episode, respectively, as observed in LPZ.
In general, as shown in Fig. 4 (top panels), Dc particles mostly dominate over BCN (MDc > 80 %) during 59 % of the overall dust period (23–30 June), although prevailing for 90 % of that time in a rather high percentage (MDc around 60 %); the Df presence is significantly lower (MDf < 10 % for 72 % of the dust length). Comparable results are found in BCN under dusty conditions when similar extinction-to-mass conversion factors are provided (Hess et al., 1998; Ansmann et al., 2019), depending only on the strength (intense and extreme) of dust intrusions (Córdoba-Jabonero et al., 2018, 2019). The relative Df mass contribution with respect to the total dust mass loading is 11 %. The mean daily averaged mass loading is 0.28 ± 0.17, 0.03 ± 0.02, and 0.31 ± 0.19 g m−2, respectively, for Dc, Df, and DD components for the whole 23–30 June period (see Table 4). As a comparison, during an extreme dust situation over BCN (Córdoba-Jabonero et al., 2019) mass loadings reached up to 2.8 g m−2 .
However, the situation at LPZ is slightly different. The relative Dc (Df) contribution during the first dust episode is lower than (similar to) that at BCN (MDc = 68 % and MDf = 9 %, on average). During the second episode, despite the mean being 1.50 times higher than in the first one, MDc and MDf decrease, on average, 48 % and 7 %, respectively. The relative mass contribution is higher than that found in BCN (13.5 %) (see Table 4). The mean mass loading per episode is lower in comparison, representing 35 %, 44 %, and 36 %, respectively, of that found in BCN for Dc, Df, and DD particles. As stated before, this is consequence of the particular transport of dust intrusions to BCN and LPZ. These results reflect the fact, as stated before for the optical properties of dust particles (Sect. 3.2.1), that dust particles (Dc and Df components) are highly mixed with ND aerosols (Dc proportion is highly reduced) during the second dust episode at LPZ in comparison with the first one, which presented a well-differentiated dust layer between 3.5 and 5.5 km height with a predominance of Dc particles (MDc of 78 %–84 % is found for the most intense dust incidence period occurring from 29 June 18:00 UTC to 30 June 02:00 UTC). In addition, these results are in accordance with Sect. 3.1 since the second dust event at LPZ corresponded to Saharan air masses coming directly from the Iberian Peninsula when dusty conditions were still present, crossing Europe and thus allowing for a higher dust mixing than that observed in BCN. However, for the first dust event at LPZ (when a defined high dust layer was observed), only air masses at higher altitudes experienced a pathway slightly crossing the Iberian Peninsula but arriving at LPZ mainly without crossing Europe (see Fig. 2), thus avoiding a high degree of dust mixing.
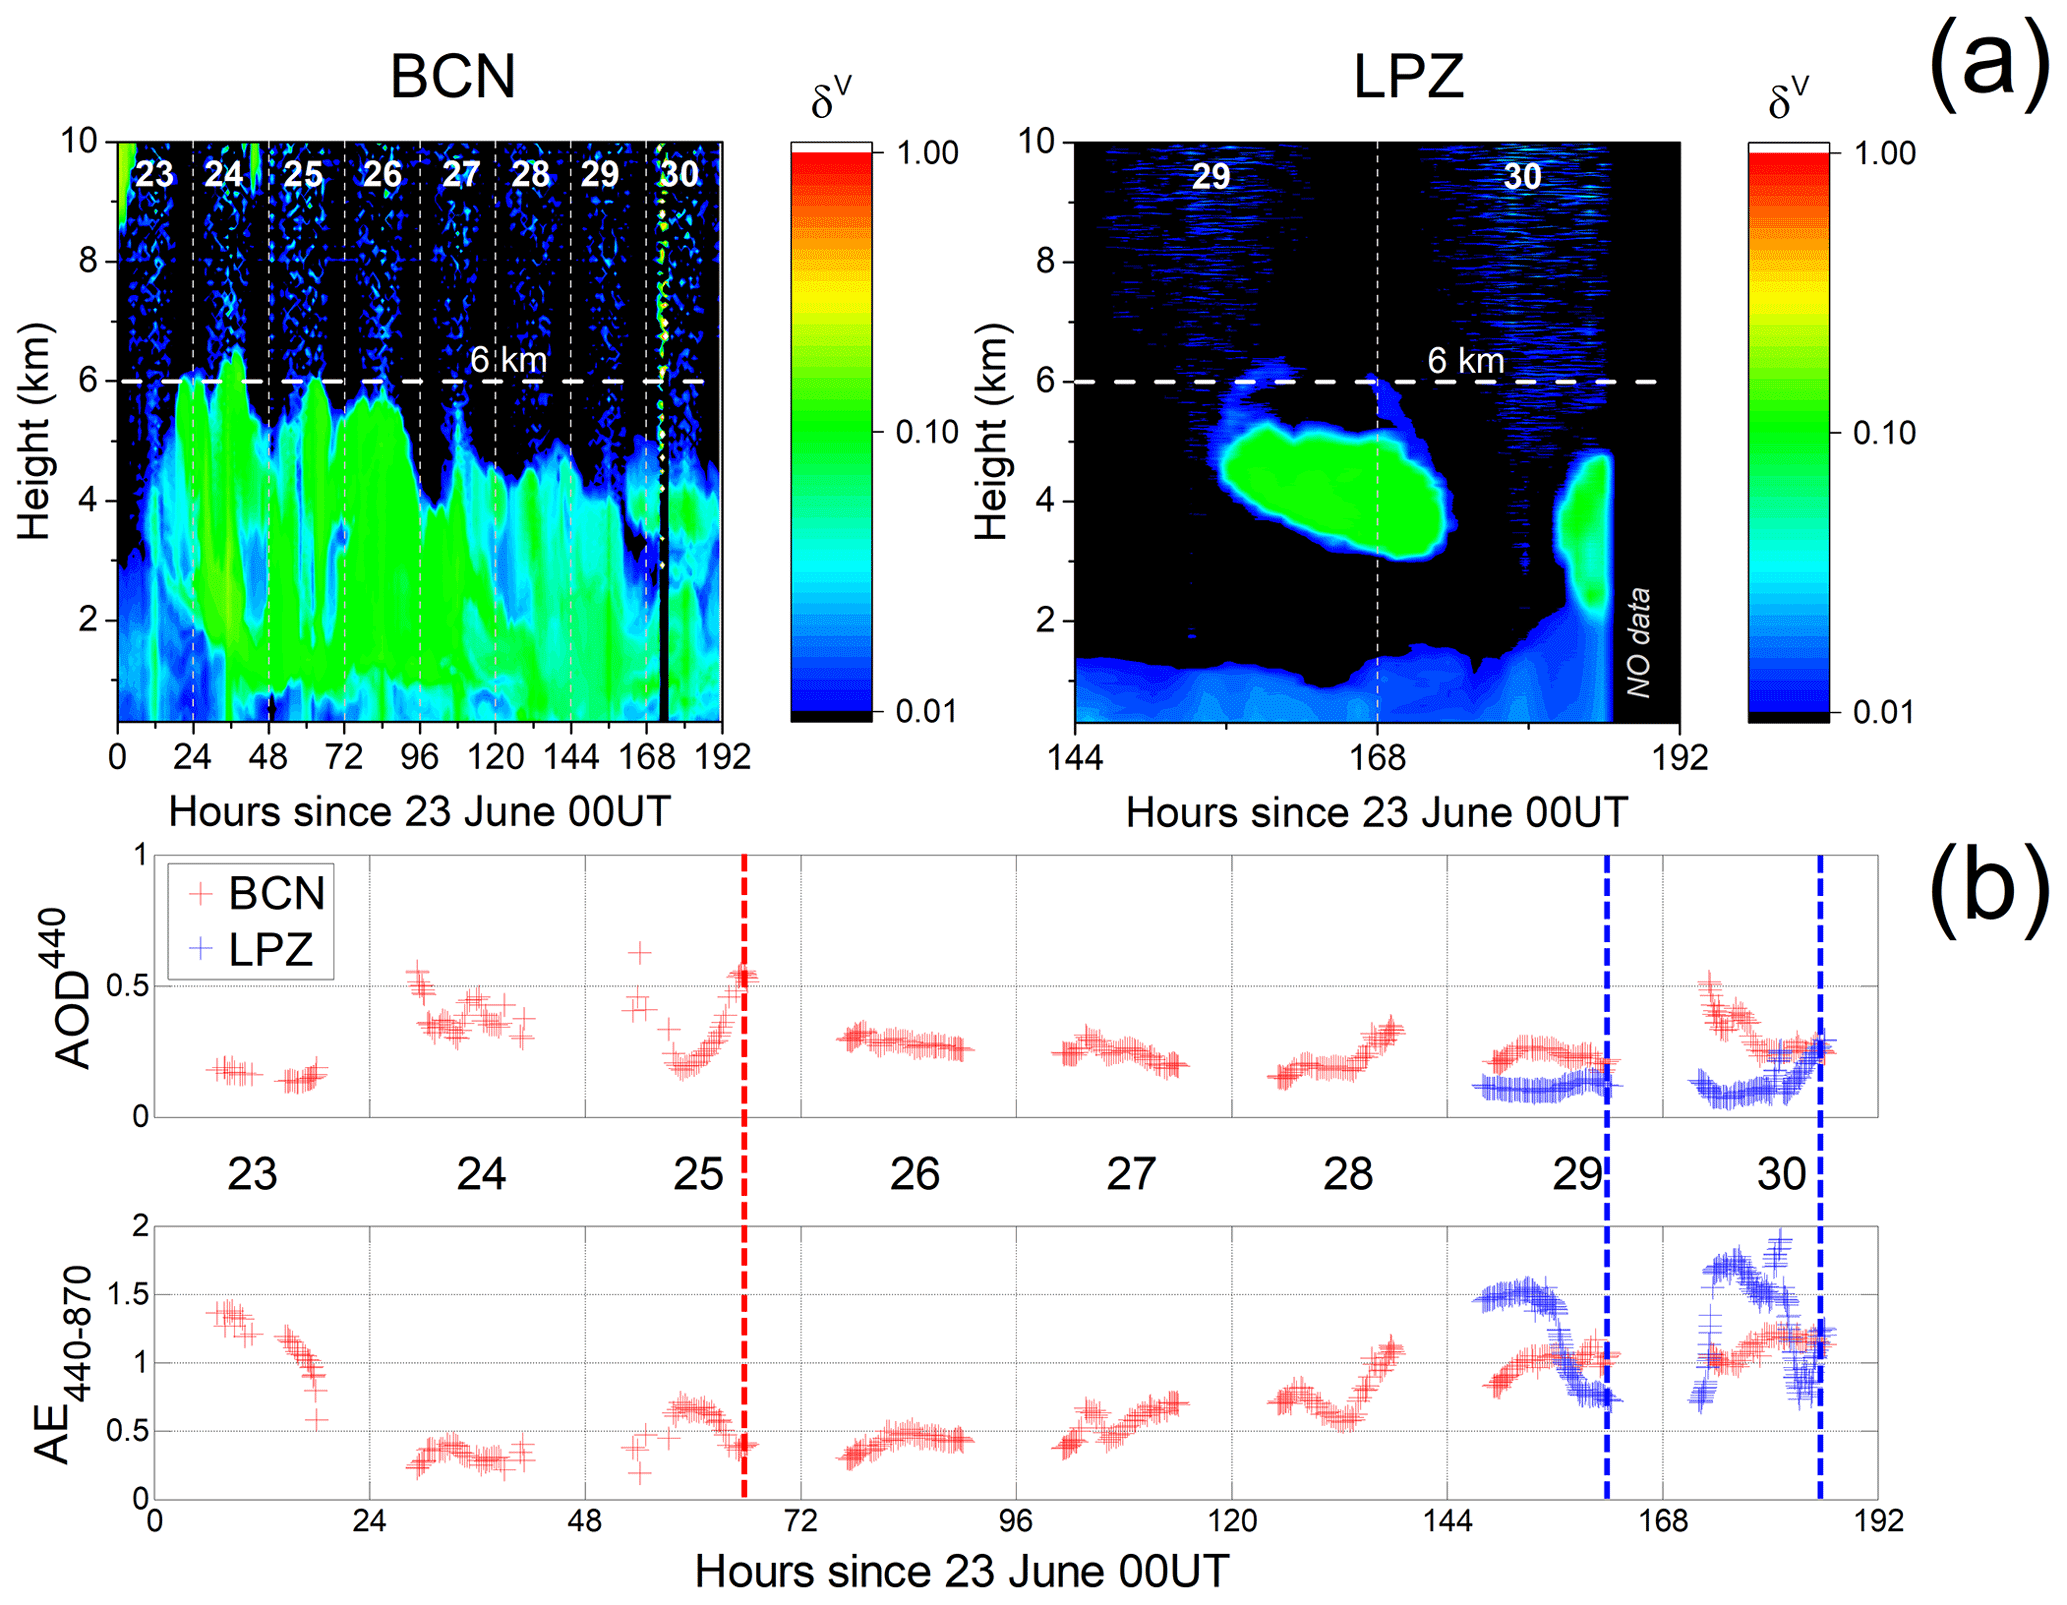
Figure 5(a) The time-height plot (UT stands for UTC) of the P-MPL VLDR, δV, in (left) BCN and (right) LPZ. (b) AERONET AOD440 and AE440−870 at BCN (red symbols) and LPZ (blue symbols) during the dust event period. The vertical dashed red (BCN) and blue (LPZ) lines indicate the time corresponding to the AERONET representative values of the single scattering albedo (SSA), asymmetry factor (asyF), and surface albedo (SA) used in the RT simulations.
As stated before, the dust intrusion arrived at BCN on 23 June. Figure 4 (bottom panels) shows that, in the night of 23 to 24 June, the CoM height of the dust intrusion reaches its highest value, i.e. Zm is around 4 km. Regarding daily averaged values for Dc and Df particles, the time evolution of their CoM heights follows a similar descending pattern from around 3 km height on 24 June down to 2 km on 30 June. Besides, for Df particles is slightly higher than that for the Dc component (200–250 m difference) on 27 June until the end of the dust event. These two results can indicate the removal of larger particles along with the progression of the dust intrusion over BCN.
In the case of LPZ, two consecutive, but different, dust episodes are observed. The first dust episode (a high well-defined dust layer) arrived at LPZ on 29 June at 11:00 UTC, mostly composed of Dc particles and with a CoM height of 4.6 km (slightly higher with respect to BCN); then, it showed a constant descending evolution down to 3.7 km on 30 June at 05:00 UTC. Concerning the Df particles, their Zm progression along this first episode is from 1.1 to 1.8 km height, peaking at 3.7 km on 29 June at 20:00 UTC. A mean value of 4.1 ± 0.3 and 3.0 ± 0.9 km is obtained, respectively, for the Dc and Df components during this dust episode. After that, a complete removal of the DD particles is observed. Later on 30 June, the dust signature is detected at 14:00 UTC again (second DD episode, with a high aerosol mixing, as discussed before), lasting until the end of that day (unfortunately, no P-MPL data were recorded later than 18:00 UTC). The CoM height also shows a descending behaviour, and the mean values during this episode for the Dc and Df particles are, respectively, 3.4 ± 0.1 and 3.1 ± 0.5 km height (slightly lower than those found in the first episode).
Therefore, as also mentioned before, differences in the vertical mass impact of the dust particles (their relative mass loading and CoM height) found in both distant BCN and LPZ locations are associated with the particular pathway of transported dust particles from the Saharan sources and between stations (see Sect. 3.1).
3.3 Dust direct radiative effect
This section is divided into four parts. The dust radiative properties as input data in the radiative transfer computations are introduced in Sect. 3.3.1. The direct radiative effect and radiative efficiency of dust particles, considered separately in both coarse and fine modes and on the surface (SRF), at the top of the atmosphere (TOA), and in the overall atmospheric column (ATM), are presented in Sects. 3.3.2 and 3.3.3, respectively. In Sect. 3.3.4, the diurnal cycle of the dust direct radiative effect is examined.
3.3.1 Dust radiative properties
At the time of writing this article AERONET V3L2.0 data were available from BCN, while only V3L1.5 data were available from LPZ. Figure 5 shows the time-height plot of the VLDR, δV, during the overall dust event period in BCN (23–30 June) and LPZ (29 and 30 June) in the top panels, together with the AERONET AOD at 440 nm (AOD440) and Ångström exponent (AE440−870) at both sites in the bottom panels. The AERONET AOD and Ångström exponent are given with an uncertainty of ± 0.02 (Eck et al., 1999) and ± 0.25, respectively, for AOD440 > 0.1 and in the order of 50 % for AOD440 < 0.1 (Toledano et al., 2007).
According to the δV values plotted, the presence and the intensity of the dust outbreak in BCN is clearly visible, reaching a maximum 6 km height during the night of 23 to 24 June (marked as a dashed white line in Fig. 5a). The dust plume top height remains pretty constant at around 6 km during the whole dusty period, while the vertical structure exhibits some variability. Although the dust event is still visible on 30 June, the intensity already starts decreasing from 27 June onwards. During 23–27 June the VLDR values below and above 1 km height are significantly different (less than 5 % and greater than 10 %, respectively) which could indicate that during that period the dust plume stayed aloft, decoupled from the local boundary layer. This fact can be confirmed by the vertical analysis of the optical properties, PBC and PLDR, as presented in Sect. 3.2.1, which highlights the location of the dust signature at altitudes between 1 and 6 km height (see Fig. 3a). In addition, as shown in Fig. 5b (red points) the AOD440 reaches maximum values on 24 and 25 June and starts decreasing afterwards. Inversely, AE440−870 reaches minimum values on both 24 and 25 June and increases afterwards. AOD440 peaks at 0.63 on 25 June (AE440−870 = 0.19); daily averaged AOD440 values of 0.39 ± 0.07 and 0.35 ± 0.14 are found on 24 and 25 June, respectively.
In the case of LPZ (see Fig. 5b, blue points), the event is less intense than in BCN, and, as stated before, the dust intrusion occurs in two close but separated periods (see Sect. 3.1). AOD440 increases in the afternoon of 29 June (peaks at 0.15), while at the same time AE440−870 drops from 1.5 down to 0.75. On 30 June AOD440 decreases in the morning and increases again in the afternoon up to a peak of 0.30 associated with values of AE440−870 oscillating around 1.0.

Figure 6AERONET spectral behaviour of (a) SSA, (b) asyF, and (c) SA for BCN (red lines) on 25 June afternoon (25J-pm) and for LPZ (blue lines) on 29 and 30 June afternoon (29J-pm, solid lines, and 30J-pm, dashed lines, respectively).
The dust radiative properties accepted by the GAME RT model are the AOD, the single scattering albedo (SSA), and the asymmetry factor (asyF). These three parameters should be spectrally defined for each height layer. The vertical profiles of coarse- and fine-mode dust extinction coefficients at 532 nm are obtained from the application of the POLIPHON method to the continuous hourly averaged P-MPL measurements (see Sect. 2.2). These profiles are integrated along 18 layers, obtaining mean DOD values for both the coarse and fine mode. The spectral mean DOD value for each layer is calculated from the layer-mean DOD at 532 nm (DOD532) using the AERONET AE440−870. The SSA and asyF, as well as the surface albedo (SA), are available from the AERONET database. These three properties are interpolated at the model wavelengths up to the highest AERONET wavelength (1020 nm) and assumed constant with the AERONET 1020 nm value beyond that limit. The asyF is given separately for the coarse and the fine mode. Since both available SSA and asyF are columnar variables, they are assumed constant with height. Because AERONET forces AOD > 0.4 for the retrieval of level 2.0 SSA, AERONET V3L2.0 SSAs are only available in BCN on 24 June (one value in the morning) and 25 June (three values in the afternoon). Hence, averaged DOD values on 25 June afternoon (25J-pm, denoted by a dashed red line in Fig. 5b) are used to be representative of the whole event for BCN. Only AERONET V3L1.5 inversions are available at LPZ from both 29 and 30 June, at the moment of writing. Averaged afternoon values (29J-pm and 30J-pm, denoted by dashed blue lines in Fig. 5b) are assumed to be representative for each day. The same time intervals are considered for the SSA, asyF, and SA. Their spectral dependence is represented in Fig. 6, and their corresponding values at 440 nm are reported in Table 3. AERONET SSA and asyF are given with an uncertainty of, respectively, ± 0.03 for AOD440 > 0.5 for dust and biomass burning and ± 0.04 for desert dust particles (Dubovik et al., 2000, 2006).
The SSA values found (approx. 0.94 at 440 nm; see Fig. 6a) are representative of moderately absorbing dust particles. The typical spectral behaviour of SSA for dust is expected to grow with increasing wavelength (Dubovik et al., 2002; Sicard et al., 2016). In the case of BCN, the SSA increases from 440 to 675 nm, with variations smaller than 0.01 beyond 675 nm. Given the high SSA values (0.98) for wavelengths greater than 675 nm and the estimated accuracy of this product (± 0.03; see Sicard et al., 2016), the spectral shape of SSA in BCN is that expected for dust. In the case of LPZ, SSA increases between 440 and 675 nm and decreases beyond 675 nm. This behaviour has been observed before by Sicard et al. (2016) for mixtures of dust and pollution when two opposite tendencies (dust SSA increases, while pollution SSA decreases with increasing wavelength) combine. These results suggest that AERONET columnar observations in LPZ reveal a mixing of dust and, most probably, pollution particles. However, although the columnar SSA pattern is similar for both DD episodes, suggesting a certain dust–pollution mixing, lidar observations highlight the differences between those two episodes at LPZ: a well-separated dust layer above 3.5 km height is observed for the first one, and a more mixed dust environment is found for the second one (as also stated in Sect. 3.2), both depending on the dusty air mass pathways reaching the LPZ station (see Sect. 3.1).
The spectral behaviour of the asymmetry factor is shown in Fig. 6b for both the coarse and the fine modes. The forward scattering is much more pronounced for large particles (asyF440 = 0.86) than for small particles (asyF440 = 0.61–0.63) for all wavelengths. This result implies that, at constant AOD and low solar zenith angle (SZA), and independent of the wavelength, the solar radiation scattered to the surface is greater for the coarse mode than for the fine mode. The spectral asyF decreases with increasing wavelength for both modes, being similar for the coarse mode in BCN and LPZ. This indicates that the scattering properties of this mode will have a similar effect on the radiative effect retrievals at both sites. If the coarse mode in the column is formed exclusively of dust particles, it can be stated that the ageing of dust has no effect on the absorption capabilities of the coarse mode. The forward scattering of the fine mode at wavelengths greater than 675 nm is slightly higher at BCN (asyF675 = 0.59) than at LPZ (asyF675 = 0.52). This result implies that, at near-infrared wavelengths (> 675 nm), for constant AOD, and low SZA, the solar radiation scattered to the surface by fine particles should be greater at BCN than LPZ.
The surface albedo shows (see Fig. 6c) a general growing trend with increasing wavelength. Similar SA values are found at both sites at 440 (0.05 < SA440 < 0.06) and 675 nm (0.09 < SA675 < 0.11). At wavelengths larger than 870 nm higher SA values are found in LPZ (SA870 = 0.34) than in BCN (SA870 = 0.25), indicating that at near-infrared wavelengths the surface will appear “brighter” at LPZ compared to BCN, and accordingly, at constant incoming radiation reaching the surface, more radiation will be reflected upward in LPZ than in BCN. The spectral values of the surface albedo found are similar to those reported in Granados-Muñoz et al. (2019), which were measured in Granada, Spain, at the same period of the year.

Figure 7Instantaneous dust direct radiative effects (DRE) on the surface (SRF) (blue), TOA (green), and in the atmosphere (red) in (a) BCN and (b) LPZ. (c) Fine-to-total () ratio of the instantaneous dust DRE on the surface (SRF) and at the TOA in BCN; the best linear fit has been calculated between 24 and 30 June (i.e. discarding 23 June) (both mean values and linear fittings are included in the legend). The absolute increase in DRE ratio on SRF (TOA) of +0.10 % h−1 (+0.12) is equivalent to an increase of +2.4 % d−1 (+2.9). UT stands for UTC.
3.3.2 Dust direct radiative effect on the surface
GAME simulations were performed for the 8 d considered in BCN (23–30 June) and the 2 d in LPZ (29 and 30 June), each day from 05:00 to 19:00 UTC when the sun was above the horizon (SZA < 90∘). The short-wave dust direct radiative effect (DRE) was calculated by using Eqs. (9) and (10) and is plotted separately for the coarse-mode dust (Dc) and fine-mode dust (Df) plus the combined effect (DD = Dc + Df) in Fig. 7. The fine-to-total ratio () was also calculated for both the DOD and DRE. The instantaneous dust radiative efficiency (DREff) was calculated as the ratio of instantaneous DRE to DOD and the daily DREff as the best linear fit forced to 0 of the scatterplot of instantaneous values of 1 full day of DRE as a function of DOD (see explanations in next paragraphs). Daily and maximal instantaneous values of DRE and DREff on the surface are shown in Table 4.
For both size modes the dust direct radiative effect on the surface (SRF), DRE(SRF), is negative for the overall dusty period (see Fig. 7, blue bars), indicating an aerosol cooling of the surface. In BCN, most of the instantaneous coarse-mode (fine-mode) DRE, DREDc (DREDf), are above −20 W m−2 (−10 W m−2). These values suggest that in terms of instantaneous radiative effect, the dust event should be classified as moderate. The singular aspect of the event lies in its duration and geographical extension. Instantaneous values of the total DRE, DREDD, below −20 W m−2 are reached during 4 d from 24 to 27 June, which can be identified as the most intensive period of the event in BCN (the daily DOD at 532 nm, DOD532, varies between 0.13 and 0.26), as stated before in Sect. 3.2. Peak values of the instantaneous DRE are reached at the same time for both modes on 25 June at 17:00 UTC and produce a peak of total DRE of −54.5 W m−2 (DOD532 = 0.45). This maximum is in the range of values as calculated by Sicard et al. (2014a) (−55.4–−53.1 W m−2) for two mineral dust outbreaks occurring in Barcelona in summer 2009 and AODs of 0.38. In terms of daily averaged values (see Table 4), DREDc and DREDf were −5.7 ± 2.8 and −3.4 ± 1.3 W m−2 on average over the whole event (23–30 June), leading to a daily DREDD of −9.1 ± 3.9 W m−2. For comparison, Meloni et al. (2005) found daily values of DRE in the central Mediterranean of −6.7 W m−2 (AOD550 = 0.227; SSA440 = 0.96 and asyF440 = 0.80) and −10.2 W m−2 (AOD550 = 0.227; SSA440 = 0.88 and asyF440 = 0.81). Compared to climatological values, our findings are also in agreement with recent works reporting about the same region. For instance, Tsikerdekis et al. (2019) simulated with RegCM4 the dust short-wave direct radiative effect for a 10 year period (1 December 1999 to 30 November 2009) and found for the summer season values of −14.9 and −5.5 W m−2 over the Saharan region and for the Mediterranean Basin, respectively. The fine-to-total ratio () of the daily DRE varies between 28 % and 46 %, being 37 % on average over the whole dust event; that is, the ratio of DRE produce a little more than one-third of the total DRE. This result can be interestingly related to the ratio of the daily DOD (24 %), meaning, in relative terms, that the fine dust particles contribute more to the total DRE than they do to the DOD.

Figure 8Dust direct radiative effect (DRE) (a) on the surface (SRF) and (b) at TOA as a function of DOD at 532 nm (DOD532), as shown separately for the coarse dust (Dc; circles, solid lines) and fine dust (Df; crosses, dashed lines) components at both BCN (23–30 June) (in red) and LPZ (29 and 30 June) (in blue). Corresponding DREff values (slope of the linear fitting: DRE vs. DOD) are included in the legend, as well as their standard deviation (i.e. the standard deviation of the points from the best linear fit).
Figure 8 nicely illustrates the dust direct radiative effect on the surface, DRE(SRF), and at the TOA, DRE(TOA). Figure 8a shows the instantaneous DRE(SRF) for both coarse (red) and fine (blue) modes as a function of their respective DOD532. By using linear regression analysis (regarding DRE = 0 with DOD = 0), the DREff corresponds to the slope of the linear fittings. In BCN, the total dust DREff on the surface, DREff(SRF), over the whole event is −75.2 and −129.6 , for the coarse and fine modes respectively, producing a total dust DREff of −88.9 ± 4.3 . Note the small deviation of the cloud of points from the linear fitting (± 2.9 and ± 1.4 W m−2 for the coarse and fine modes, respectively). It can be clearly seen that at constant DOD the fine dust mode produces a higher enhancement of DRE than the coarse-mode dust. Both DRE and DREff values are included in Table 4.
The main difference between the parameterisations for the radiative properties of both modes is the asymmetry factor: asyF values of 0.865 and 0.629 are reported for the coarse and fine modes, respectively. The lower asyF value found for the fine mode with respect to the coarse one implies that, in relation to a pure forward-scattering particle, more solar irradiance is scattered in the atmosphere by Df particles, and thus less irradiance is reaching the surface. Another difference is the vertical distribution of each of those coarse- and fine-mode dust layers. However, the height of the dust layer is not expected to have a relevant impact on the DRE(SRF) (Liao and Seinfeld, 1998).
During the most intensive days of the event in BCN, 24–27 June, the total dust DREff(SRF) varies between −100.3 and −87.9 . For comparison, measurements of the daily total dust DREff on the surface in the central Mediterranean of −86.4 ± 5.3 are reported by Di Sarra et al. (2008) for an AOD of 0.35 averaged over two summer solstices (2003/04), and −85.3 ± 4.7 are obtained by Di Biagio et al. (2009) for an AOD of 0.33 averaged over three summer solstices (2005–2007). Lyamani et al. (2006) found in south-eastern Spain values of total dust daily DREff of −73.4 for dust mixed with biomass burning during the 2003 heat wave, with an AOD varying in the range of 0.4–0.6. Closer to the dust source, in northern Benin, Mallet et al. (2008) calculated for a few days of clear-sky dust intrusion in January 2006 mean daily DRE(SRF) values of −61.5 W m−2 and mean daily DREff of −57.9 (mean AOD of 1.06). This short literature review does not intend to be exhaustive. However, it might lead us to consider that, as mineral dust direct radiative effect decreases with horizontal transport, the dust radiative efficiency might, inversely, increase as the mineral dust moves away from its source. More elements of discussion on this topic are brought in two paragraphs.
Table 5Same as Table 4 but at the TOA. DOD532 values are shown in Table 4.
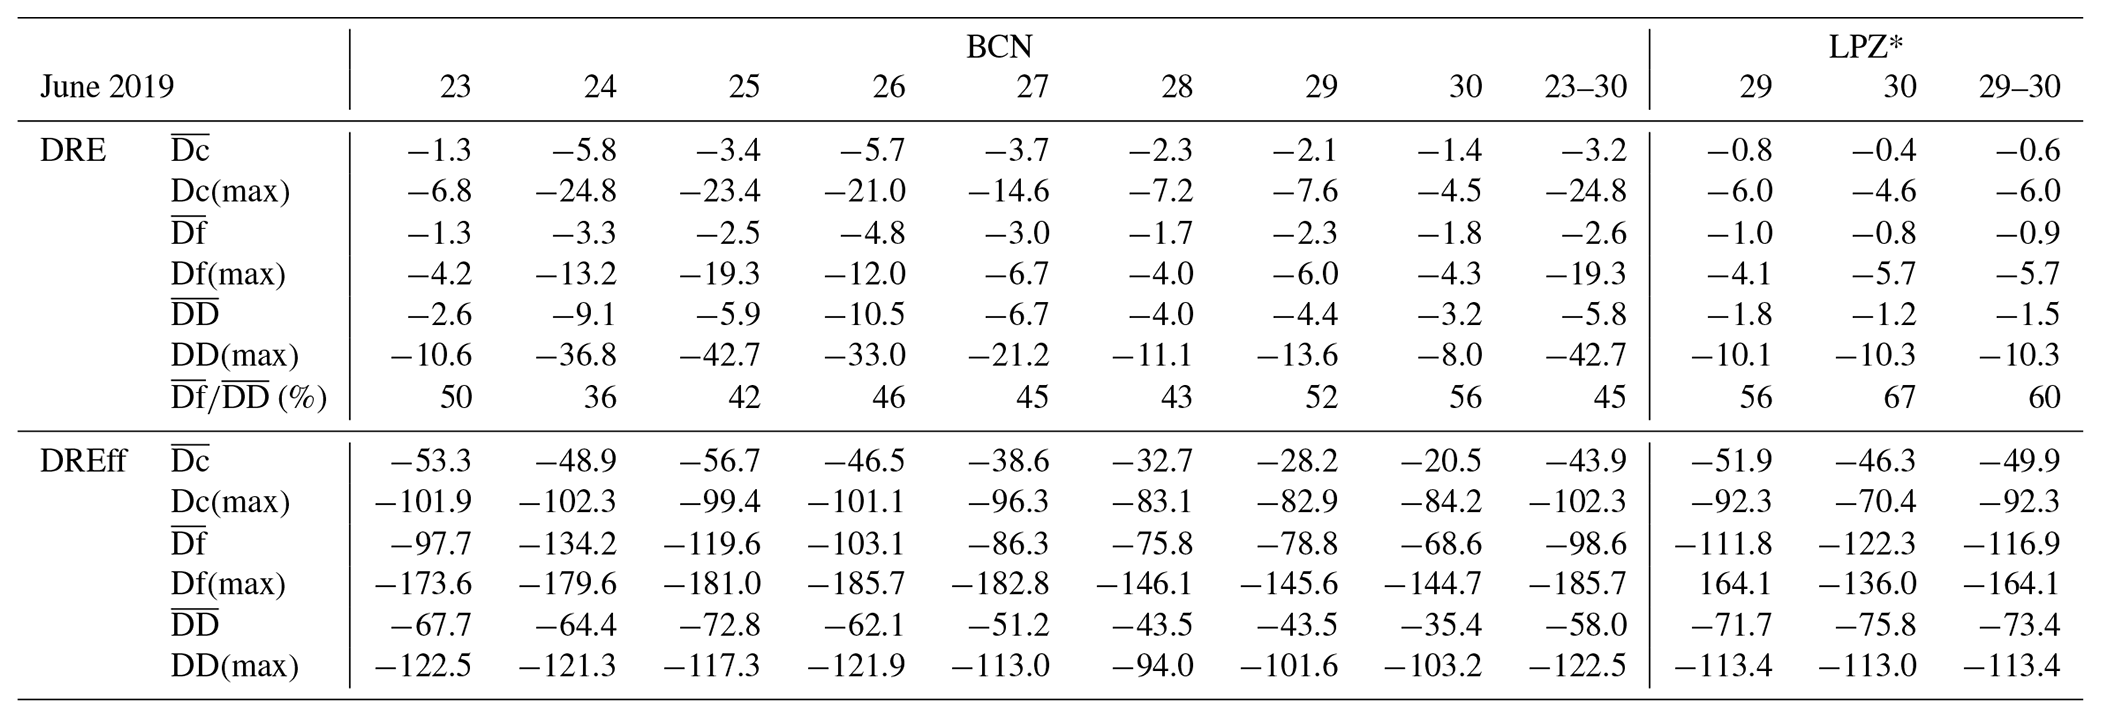
* 29 and 30 June represent the first and second DD episode, respectively, as observed in LPZ.
In LPZ, the event is much weaker than in BCN. Under dusty conditions, the DOD is, respectively, 0.083 and 0.067 (see Table 3) for the first (from 29J-pm to 30J-am) and second (30J-pm) dust episodes. On both days, the fine-to-total () ratio of the DOD is approximately one-third (one-fourth in BCN). The dust instantaneous DRE is on the order of magnitude of the DRE in BCN on the first weak day of the outbreak (23 June), with peaks of −7.4 and −7.8 W m−2 for the coarse and fine modes, respectively (see Fig. 7). The daily DRE, averaged over the 2 d, is −1.2 ± 0.4 and −1.3 ± 0.2 W m−2 for the coarse and fine modes, respectively, yielding to a total dust DRE of −2.5 ± 0.6 W m−2; in particular, the radiative contribution of the Df particles was 52 % with respect to DREDD (37 % in BCN). Despite the radiative impact of the mineral dust in LPZ being small (because of the low dust loading), this result is remarkable. It shows that, under some given circumstances, the fine-mode dust contribution to the DRE is comparable to that of the coarse mode, whereas mineral dust is usually regarded as a coarse-dominating aerosol. The increase in the ratio of daily DRE in LPZ (52 %) with respect to BCN (37 %) is due to the gravitational settling of the largest dust particles during a longer transport to LPZ. Indeed, according to Sect. 3.1, dust particles arriving at LPZ on 29 and 30 June at 4500 m height were travelling over the Iberian Peninsula for 3–4 d before (see Fig. 2). In terms of radiative efficiency, the DREffDc and DREffDf in LPZ, averaged over the 2 d of 29 and 30 June, is, respectively, −89.5 and −157.9 (slightly higher, in absolute value, than in BCN, that is, −75.2 ± 2.9 and −129.6 ± 1.4 , respectively; see Fig. 8a and Table 4). Note again the small deviation of the cloud of points from the linear fitting (± 0.8 and ± 0.5 W m−2 for the coarse and fine modes, respectively).
There are two main differences between BCN and LPZ parameterisations: the spectral asyF is slightly larger in BCN than in LPZ (see Fig. 6b), and the spectrally integrated SA is lower in BCN than in LPZ (see Fig. 6c). At constant DOD, both differences have an opposite impact on the dust DRE on the surface: the first one (higher asyF in BCN) will yield a weaker cooling effect (i.e. a larger radiative efficiency, as indeed observed), while the second one (smaller SA in BCN) will yield a stronger cooling (unlike what is observed). The effect of the higher spectral asyF in BCN is thus dominating over the effect caused by a lower albedo. The SA variation has indeed a small impact on the DRE(SRF). Osipov et al. (2015) showed that a SA decrease from 0.35 to 0.25 (which is approximately the difference in SA between LPZ and BCN at the near-infrared wavelengths; see Fig. 6c) yields a difference in the SW DRE on the surface of less than 3 W m−2.
In addition, the time evolution of the instantaneous DRE ratio is shown in Fig. 7c for BCN. On the surface, this ratio (in blue) shows a diurnal cycle whose shape changes from day to day. The mean DRE value over the whole dust event of these instantaneous ratios on the surface is 39 %. By discarding the first day (23 June) when the dust arrived at BCN, an increase in the DRE ratio with time can be observed. The best linear fit as calculated between 24 and 30 June presents a positive slope, i.e. an absolute increase, of +0.10 % h−1, that is, +2.4 % d−1. In other terms, the contribution of the fine-mode dust to the total dust DRE on the surface increases steadily during the dust event, the increase of +16 % being between the beginning of the event (on average, 28 % on 24 June) and its end (44 % on 30 June).
3.3.3 Dust direct radiative effect at TOA and in the atmosphere
Both the DRE and DREff at the TOA, DRE(TOA) and DREff(TOA), are calculated, similarly as on the surface. The radiative effect of dust in the atmosphere, DRE(ATM), as defined in Eq. (10), is also obtained. The time evolution of the instantaneous dust DRE at TOA is shown in Fig. 7a (BCN) and 7b (LPZ) and in dependence of DOD in Fig. 8b. Daily and maximal values are reported in Table 5.
In BCN, the DRE at TOA is negative during all of the dusty period. The overall mean daily DRE at TOA is −3.2 ± 1.8 and −2.6 ± 1.1 W m−2 for the coarse and fine modes, respectively, their instantaneous maxima being −24.8 (24 June) and −19.3 W m−2 (25 June). For the total dust, the overall mean daily DREDD(TOA) was −5.8 ± 2.8 W m−2, and an instantaneous maximum of −42.7 W m−2 was reached on 25 June. For the coarse mode, the instantaneous dust DRE at TOA (DREDc(TOA); green bars in Fig. 7a) was smaller than that on the surface (in terms of daily values, DREDc(TOA) represented 56 % of that found on the surface). For the fine mode, this difference is less pronounced: DREDf(TOA) represents 76 % of the surface value. The lower ratio of DRE(TOA) to DRE(SRF) for Dc particles (compared to Df ones) is mostly due to the strong forward-scattering property of large particles (asyF(Dc) > asyF(Df)), associated with the fact that the surfaces considered are not especially bright (see Fig. 6c). Comparing with values found in the literature, the daily DRE(TOA) values obtained in this work are higher, in absolute value, than those found in Europe ([−3.6, −2.2 W m−2] in Meloni et al., 2005; −4.0 W m−2 in Lyamani et al., 2006) but similar to values found in northern Benin (∼ −5.0 W m−2 for AOD ∼ 0.30–0.35 in Mallet et al., 2005). In terms of instantaneous values, absolute peak values are higher than most of those found in the literature (−8.7 W m−2 in Meloni et al., 2005; −24.6 W m−2 in Sicard et al., 2014a; −10.3 W m−2 in Granados-Muñoz et al., 2019). This difference is probably due to different aerosol loadings: the AOD associated with the maximum of DRE(TOA) found in this study (AOD = 0.56 on 25 June at 17:30 UTC; see Fig. 5) is much higher than those reported in the mentioned references. The instantaneous maximum as calculated for DRE(TOA), −42.7 W m−2, is, for instance, close to the values within the range [−55.0, −50.0 W m−2] as found by Cachorro et al. (2008) for a dust event and AODs varying in the range [0.82, 1.04]. The fine-to-total () ratio of the daily DRE(TOA) in BCN varies between 36 % and 56 %, being 45 % on average over the whole dust event. This ratio is higher than that found on the surface (37 %).
In LPZ, the DRE at the TOA, DRE(TOA), is, in absolute value, much lower than in BCN. The mean total dust daily DRE(TOA) value is −1.5 ± 0.4 W m−2, reaching an instantaneous maximum of −10.3 W m−2. In terms of daily values, DREDc(TOA) and DREDf(TOA) in LPZ represent 50 % and 70 %, respectively, of that found on the surface. This difference in daily DRE of 20 % between the coarse-mode dust and fine-mode dust is the same as that observed in BCN, and the reasons for it are those already mentioned. The DRE ratio at TOA ranges between 56 % and 67 %, being 60 % on average for the two dust episodes. In addition, similarly to BCN, that value is higher than that obtained on the surface (52 %).
These results indicate that, like on the surface, Df particles contribute more to the total DRE(TOA) in LPZ than in BCN because of the gravitational settling of the largest dust particles during a longer transport, as stated before (see Sect. 3.1), and that, in relative terms, their contribution is stronger at the TOA than on the surface. This result is especially relevant for satellite remote sensing instrumentation, which is mostly sensitive to SW wavelengths since its measurements can be likely affected by dust contamination (Marquis et al., 2021).
Since the DRE is lower at the TOA than on the surface, the DREff at the TOA consequently decreases compared to that on the surface. This is shown in Fig. 8, where the slope of the best linear fitting is less steep at the TOA than on the surface, i.e. DREff(TOA) is negatively higher than DREff(SRF). In BCN the daily DREffDc(TOA) and DREffDf(TOA), averaged over the whole dust event, are −43.9 ± 4.2 and −98.6 ± 2.0 , respectively, showing a deviation of the cloud of points from the linear fitting still low for both the coarse and fine modes but higher than at the surface (± 2.9 and ± 1.4 W m−2, respectively). The total dust DREffDD(TOA) is −58.0 ± 6.2 . Since DREff is an intensive parameter, those values can be compared to instantaneous dust DREff found in the literature, obtaining relatively similar values within a certain interval. For instance, Sicard et al. (2016) measured a summer-mean aerosol DREff(TOA) of −70.8 ± 16.8 in Palma de Mallorca (Balearic Islands) and of −90.0 ± 9.1 in Ersa (Corsica island) over a period of 5 years between 2011 and 2015. During a strong dust intrusion at Lampedusa, reaching AOD values of 0.6, Meloni et al. (2015) found a DREff(TOA) of approximately −77 . In LPZ, the DREff(TOA) values, in absolute values, are higher than in BCN; that is, −49.9 ± 0.9, −116.9 ± 0.5, and −73.4 ± 1.4 are found, respectively, for Dc and Df particles and the total dust (DD). Daily and maximal instantaneous values of DRE and DREff at the TOA are shown in Table 5.
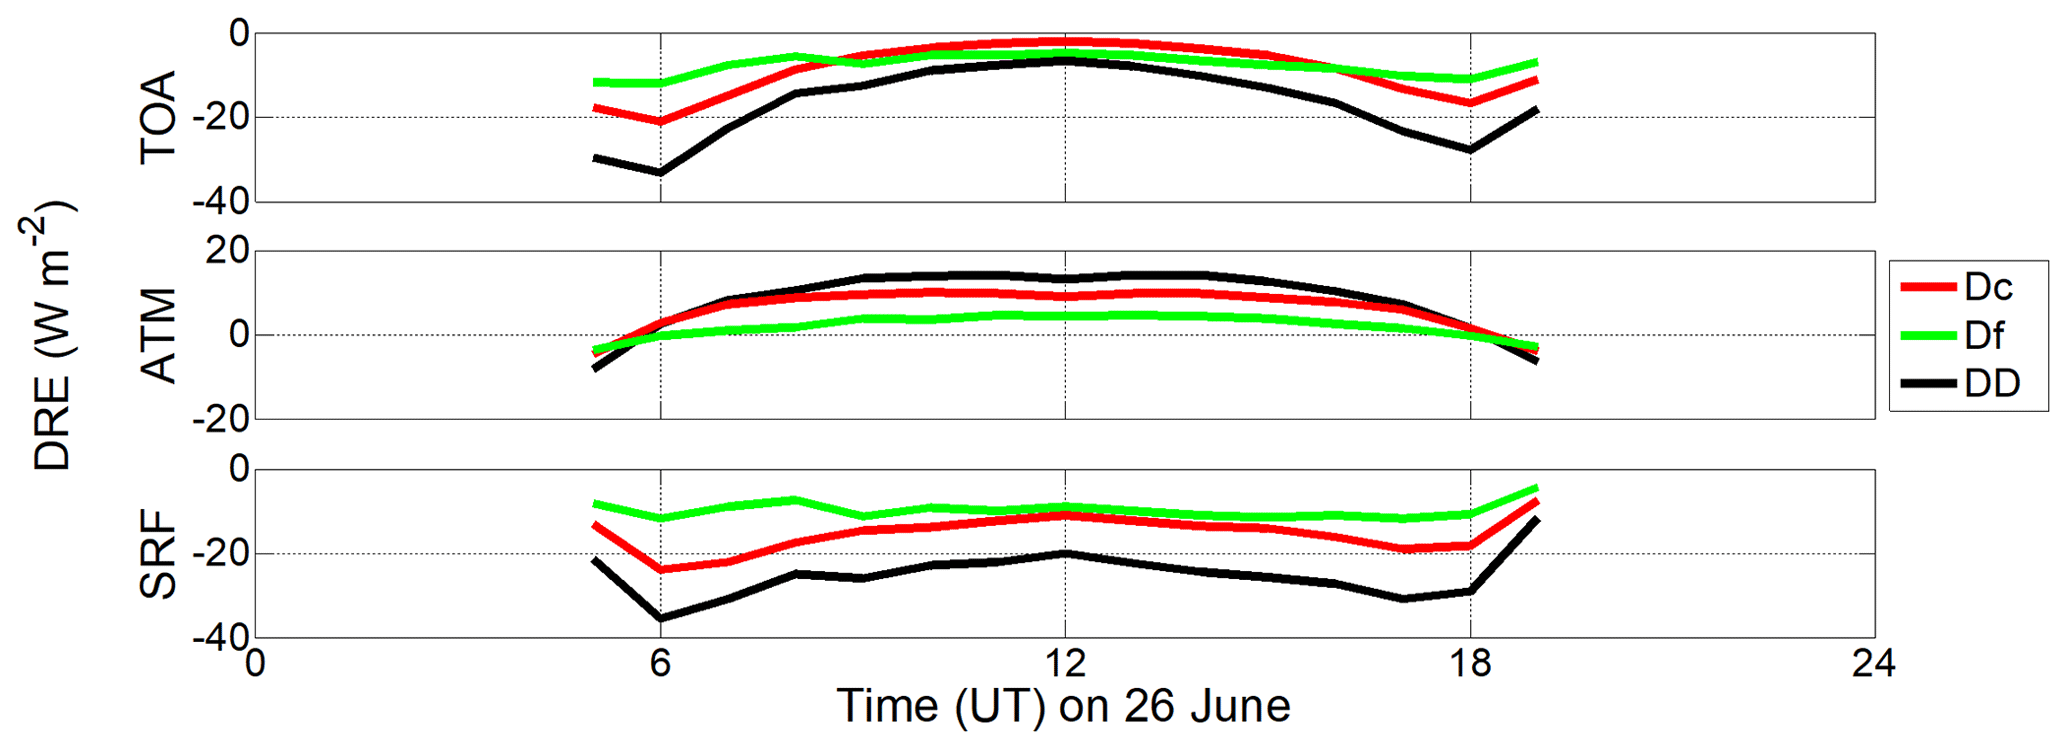
Figure 9Diurnal cycle on 26 June (UT stands for UTC) in BCN of the dust direct radiative effect DRE (bottom) on the surface (SRF), (centre) in the atmosphere (ATM), and (top) at TOA. The daily mean AOD440 for Dc and Df particles is, respectively, 0.19 ± 0.02 and 0.06 ± 0.02; SSA440 is taken as constant at 0.94; asyF440 is also taken as constant but is different for both modes: 0.865 and 0.629 for coarse and fine modes, respectively.
Results concerning the dust radiative effect in the atmospheric column, DRE(ATM), are reported in Figs. 7 and 9. The statistics of the event is not reported to avoid an excessively lengthy paper. Daily DRE(ATM) and DREff(ATM) can be easily calculated by subtracting the DRE and DREff values as obtained at the TOA (Table 5) and those found on the surface (Table 4) (see Eq. 10). Figure 7 shows that the dust produces generally a heating of the atmosphere (most of the red bars are positive in Fig. 7). The daily Dc, Df, and DD DRE(ATM) in BCN are, respectively, +2.5 ± 4.5, +0.8 ± 2.4, and +3.3 ± 6.8 W m−2, being slightly lower in LPZ (+0.6 ± 0.6, +0.4 ± 0.4, and +1.0 ± 1.0 W m−2, respectively). The ratio of DRE(ATM) is 24 % in BCN and is higher in LPZ (40 %). These values are surprisingly very similar to the ratio of DOD (24 % in BCN and 38 % in LPZ). This finding, together with the results of Sect. 3.3.2, indicates that the Df particles (fine-mode dust) have a lower impact on the overall atmospheric column than on the surface and at the TOA. In terms of radiative efficiency, the Dc, Df, and DD mean daily values of DREff(ATM) over the whole dust event in BCN are +31.3 ± 7.1, +31.0 ± 3.4, and +30.9 ± 10.5 , respectively; those values are higher in LPZ: +39.6 ± 1.7, +41.0 ± 1.0, and +40.0 ± 2.7 .
The difference between BCN and LPZ may be the result of a lower SSA and a higher SA at near-infrared wavelengths in LPZ than in BCN: both effects produce a smaller DRE(TOA) in absolute value and thus a higher DREff(ATM). Interestingly the dust radiative efficiency in the atmospheric column is virtually independent of the dust mode at both BCN and LPZ. However, due to the complexity of the mechanisms involved and the characteristics of the particles observed, those results are likely a coincidence and do not apply further than in our singular case. Similar total dust DREff(ATM) are reported in the literature, e.g. by Derimian et al. (2008) who found values of +40.6 W m−2 for an AOD of ∼ 0.54 measured in Senegal. However, larger values are also often reported; for instance, Lyamani et al. (2006) found values of +58.9 W m−2 (AOD ∼ [0.4–0.6]) in Granada (Spain), and Sicard et al. (2012) obtained values of +101.0 W m−2 (AOD ∼ 0.59) for strongly absorbing dust particles in Barcelona. Compared to the later, dust DREff(ATM) values found in this work are smaller. The reason relies on the dust DRE(TOA) being unusually large, in absolute value, because of the relatively strong contribution of the Df particles at both sites.
Finally, the time evolution of the instantaneous DRE(TOA) ratio in BCN must be commented on. That ratio at the TOA (see Fig. 7c, in green) shows a strong inverted U-shaped diurnal cycle with values almost double during the middle hours of the day compared to dawn/dusk. The mean value over the whole dust event of DRE(TOA) ratio is 50 %. By discarding the first day (23 June), an increase in the DRE ratio at TOA with time is observed, being stronger than that on the surface (see Fig. 7c, in blue). The best linear fit, calculated with data from 24 to 30 June, presents a positive slope, i.e. an absolute increase of +0.12 % h−1, i.e. +2.9 % d−1. On average, the contribution of the Df particles to the total dust DRE at the TOA is +20 % higher between 24 June (36 %) and 30 June (56 %). Likewise, a slightly smaller positive slope of +0.10 % h−1 (i.e. +2.4 % d−1; see Sect. 3.3.2) is found for the DRE ratio on the surface, which is +16 % higher between 24 June (28 %) and 30 June (44 %).
3.3.4 Diurnal cycle of the dust direct radiative effect
In order to analyse the diurnal cycle of DRE, 26 June at BCN is selected since the dust plume vertical distribution is relatively stable and the AOD is almost constant during that day (see Fig. 5). The diurnal cycle of the Dc, Df, and DD DRE on the surface, at TOA, and in the atmospheric column is represented in Fig. 9, and it can be described as singular, especially for the ground level (SRF). Cooling occurs at both the surface and TOA for all modes (Df, Dc, and DD) and at all hours of the day. The dust (all modes) produces a heating of the atmosphere during most of the hours of the day and a slight cooling (i.e. |DRE(TOA)|>|DRE(SRF)|) close to dawn/dusk. At both the surface and TOA, the shape of the diurnal cycle of DREDc and DREDD is similar to a “W”, showing two minima, one in the morning (around 06:00 UTC) and one in the afternoon (17:00–18:00 UTC), and a maximum during the middle hours of the day. These results are explained by the sensitivity analysis of SSA, asyF, and SA upon the shape of the diurnal DRE cycle as performed by Osipov et al. (2015) and also by a former study of Osborne et al. (2011).
The “W” shape, called an MMM (min-max-min) structure by Osipov et al. (2015), is basically due to a combination of solar geometry and dust anisotropic scattering: even though the direct radiative effect produced by forward-scattering particles increases with increasing solar zenith angle, the decreasing solar irradiance for long slant paths (at dawn/dusk) causes those actual valleys achieved at intermediate solar zenith angles (Osborne et al., 2011). This is valid at both the surface and TOA. For high values of asyF, increasingly pronounced MMM structures are expected (Osipov et al., 2015). Independently of the particle size, Osborne et al. (2011) also showed that spheroids produce greater asyF values than spheres or irregular-shaped particles, thus accentuating the MMM structure. The diurnal DREDf cycle does not show this MMM structure, remaining nearly constant during the day. Additionally it must be pointed out that DREDf(SRF) and DREDf(TOA) are of the same order of magnitude, and the daily DREDf(ATM) (+1.3 W m−2) is low enough, indicating that Df particles produce a quasi-neutral radiative effect on the overall atmospheric column. The decrease in DREDc on the surface (at TOA) between the middle hours of the day and dawn/dusk is −10.5 W m−2 (−16.9), which, once summed to the DREDf, induces a decrease in the DREDD of −13.3 W m−2 (−23.7). The diurnal DRE variations at TOA are larger than on the surface, a result also observed by Osborne et al. (2011). As a consequence, DRE(ATM), the difference between DRE(TOA) and DRE(SRF) for both Dc and DD, showed the shape of an inverted U. In the middle hours of the day DREDc(TOA) is approaching zero (−1.9 W m−2 at 12:00 UTC). It would have become positive if, for example, asyF had been higher, if the dust had been more absorbing (i.e. SSA < 0.94), or if the surface had been more reflective. It is worth noting that this MMM structure is not an intrinsic characteristic of the diurnal DRE cycle as induced by mineral dust. Banks et al. (2014) found a mean daytime cycle of dust DRE on the surface in Algeria (central Sahara; AOD ∼ 1, SSA ∼ 0.977) peaking toward local noon and decreasing (in absolute value) at both the beginning and the end of the day; they also found a mean daytime DRE cycle at TOA with a MMM structure and positive peak values in the middle hours of the day. These two behaviours were reproduced by the sensitivity study of Osipov et al. (2015) for pure forward-scattering particles (asyF = 1) in the first one and for bright surfaces (from desert to white body) in the second one.
Dust forecast modelling and back-trajectory analysis show that the main part of the air masses arriving at BCN during the dusty period studied (23–30 June 2019) originated in the Saharan region. In the case of LPZ, air masses were coming mostly from the Iberian Peninsula, which was still under dusty conditions for the same period, and just a few were coming straight from the Sahara. However, the dust air mass pathways are different for the two consecutive dust episodes observed in LPZ: for the first one, dust air masses arrived from the Iberian Peninsula describing a left-side arch coming from the north, slightly crossing central Europe, while, for the second one, they arrived from the Iberian Peninsula, directly crossing Europe to LPZ. Indeed, differences found in the vertical optical and mass impact, and consequently in the DRE, of the dust particles are based on the singular dust transport to both distant BCN and LPZ stations.
Both AERONET data and polarised Micro-Pulse Lidar (P-MPL) observations were used for continuous monitoring of the dust outbreak and the retrieval of the dust properties in order to calculate the DRE. By using the synergy between the POLIPHON method and polarised P-MPL measurements, the vertical profiles of the coarse dust (Dc) and fine dust (Df) extinction coefficients (and the mass concentration as well) were identified, and hence the Dc and Df contribution to the total dust (DD = Dc + Df) DRE was estimated.
At BCN mean dust optical depth values at 532 nm (DOD532) for Dc, Df, and DD particles, respectively, of 0.116, 0.037, and 0.153, with DD DOD532 peaks of 0.63 (AE ∼ 0.19), were found. Also, moderately absorbing particles (SSA440 = 0.94) and different asymmetry factors for Dc (asyF440 = 0.86) and Df (asyF440 = 0.63) particles were also reported in BCN. At LPZ the dust incidence was weaker compared to BCN: the mean DOD532 values for each of the two dust episodes for Dc, Df, and DD particles in percentage with respect to DOD532 in BCN were, respectively, 24 %, 43 %, and 29 % for the first dust episode and 17 %, 35 %, and 22 % for the second one. Similar moderately absorbing particles (SSA440 = 0.94–0.95) and asyF440 values for Dc and Df of 0.86 and 0.61, respectively, were reported for the two dust episodes in LPZ as well. Mean DOD532 ratios of 24 % and 36 % (39 %) were found, respectively, in BCN for the whole dust event and LPZ for the first (second) dust episode; hence, the Df contribution is higher in LPZ with respect to BCN. Indeed, this result reflects the ageing of dust and in particular the gravitational settling of Dc particles during their longer transport to LPZ.
Regarding the vertical extent and structure of dust particles, the dust intrusion was gradually moving on during the whole dust event (23–30 June) in BCN, reaching altitudes mainly from 1 to 5–6 km height with the presence of both Dc and Df particles; PLDR values of 0.2–0.3 also pointed out the predominance of Dc particles. In the case of LPZ, a two-layered structure with a well-defined decoupled dust layer between 3 and 5.5 km height with PLDR values of 0.35–0.39 (practically only Dc present) is observed for the first episode, while a mixture of Dc, Df, and ND particles is clearly observed during the second event. These differences are related to the singular intrusion pathway of each dust episode; during the second episode, unlike what happened during the first one, air masses were coming from the Iberian Peninsula, directly crossing central Europe, and thus allowing for a high degree of dust mixing. Concerning the relative mass incidence of each component, Dc particles were dominating (around 80 %, in general) during the overall dusty period at both stations. However, a higher Df mass contribution with respect to the total dust mass loading was found in LPZ (13.5 %) than in BCN (11 %), reflecting again, through an increase in the fine-mode mass contribution, the ageing of the dust. The mean daily averaged total mass loading was higher in BCN (0.31 ± 0.19 g m−2) than in LPZ (36 % of that found in BCN). As also stated before, this is a consequence of the particular transport of the dust intrusions to BCN and LPZ, which is also reflected, according to the daily averaged CoM height, in the vertical impact of the dust intrusions over each station. In BCN, the evolution of the CoM height follows a similar descending pattern from around 3 km on 24 June down to 2 km height on 30 June, but the mean CoM height for Df particles is slightly higher than that for the Dc component (200–250 m difference) from 27 June until the end of the dust event. These results might indicate the loss of the large particles during the progression of the dust intrusion over BCN. The mean CoM height of the dust particles is greater in LPZ (between 3 and 4 km) than in BCN (at 2–3 km height). Since the dust intrusion in LPZ, including both differentiated episodes, lasted only 2 d, the descending behaviour observed in BCN is not present.
In the context of the particular dust scenarios of BCN (continuous and progressive dust particles coming from the Saharan region) and LPZ (two close but separated dust episodes: the first introducing a well-defined highly decoupled dust layer with mostly Dc present, and the second presenting a high degree of dust mixing), the DRE (and DREff) at the surface (SRF) and at the TOA and also the atmospheric DRE (and its efficiency) were calculated for both stations. The modification of the dust optical properties due to ageing and its impact on the DRE is evidenced by the temporal dust evolution in BCN and with the comparison between BCN and LPZ dust scenarios.
On one hand, in BCN, the mean daily DRE on the surface, DRE(SRF), for the total dust (DD = Dc + Df) was −9 ± 4 W m−2, with an instantaneous maximum of −54.5 W m−2, while the total dust mean daily DREff(SRF) was −89 ± 4 , with an instantaneous peak of −133.7 . The daily DRE ratio at the surface was 37 %, being > 24 % for the DOD ratio; that is, in relative terms, Df particles contribute more to the total dust DRE than they did to the DOD. This was also observed in the DREff on the surface: DREff(SRF) is higher in absolute value for Df particles (−130 ± 1 ) than for Dc ones (−75 ± 3 ). The driving factor of that is the asymmetry factor: a lower asyF value is found for the fine mode (0.63) than for the coarse one (0.86). As a consequence and compared with a pure forward-scattering particle, there is more solar irradiance scattered in the atmosphere, and thus less irradiance is arriving at the surface. In these conditions, it must be highlighted that, at constant AOD, the DRE at the surface for Df particles would be higher, in absolute values, than for Dc ones. Along the 8 d dust event in BCN, the effect of dust ageing is clearly visible on the DRE ratio at the surface, which increased at a rate of +2.4 % d−1, i.e. +16 % between the first and the last day of the event; that is, at the end of the dust period, the Df contribution to the total dust DRE at the surface was 44 %, i.e. almost the same as for the Dc particles.
On the other hand, the total mean daily dust DRE at TOA (and the atmospheric DRE) was −6 ± 3 W m−2 (+3 ± 7 W m−2) (instantaneous DRE peak at TOA of −42.7 W m−2). Regarding the DREff, a total dust mean daily value at TOA and the atmospheric one of −58 ± 6 and +31 ± 10 , respectively, were estimated, with an instantaneous DREff peak at TOA of −122.5 . The daily DRE ratio at TOA was 45 %, which is higher than the one found at the surface (37 %). Hence, the contribution of the Df particles is stronger at the TOA than at the surface. Along the 8 d dust event, the DRE ratio at TOA increased at a rate of +2.9 % d−1, i.e. +20 % between the first and the last day of the event. Then, at the end of the event the DRE ratio at TOA was 56 %; that is, the Df contribution to the total dust DRE is higher than the one found for the Dc particles. The atmospheric DRE ratio was very similar to that estimated for DOD; additionally, the atmospheric DRE was found to be independent of the considered dust mode.
The results at LPZ are a kind of extension of what is observed in BCN because the main origin of the dust intrusion is from the Iberian Peninsula, which was already under the Saharan dusty conditions that arrived at LPZ on 29 June. Hence, dust particles were travelling for a longer period to LPZ, likely experiencing a more pronounced gravitational settling of the largest particles. Although the total dust radiative cooling impact was much lower in LPZ (i.e. the mean total dust DRE was 27.5 % and 26 %, respectively, on the surface and at the TOA of that in BCN), the relevance of the DRE in LPZ relies on a two-fold aspect. Firstly, both consecutive dust episodes were caused by different dust air mass pathways coming from the Iberian Peninsula, as described before. Despite their similar columnar SSA pattern, a completely decoupled high dust layer was observed for the first one and a more mixed dusty environment for the second one, which suggested a certain dust–pollution mixing in both episodes. Indeed, this is an example of the advantage of using lidar measurements in characterising aerosol complex scenarios: both DD and ND components were present in both episodes, but they were only `mixed' in the second one. Second, and as a direct consequence of the dust ageing, the mean DRE ratio at the surface in LPZ was 52 %, which is higher than in BCN (37 %), likewise that observed at the TOA, where the DRE ratio was 60 % in LPZ and 45 % in BCN. This might confirm, as mentioned before, the gravitational settling of the largest dust particles during a longer transport, leading to a higher contribution of Df particles to the total dust DRE in comparison with BCN. Moreover, the total dust DREff on the surface was −113 ± 1 in LPZ, which is a higher absolute value with respect to that found in BCN (−89 ± 4 ). That apparent increase, in absolute value, is because of the spectral behaviour of the asyF, which was slightly smaller in LPZ than in BCN, and then, at constant AOD, a larger cooling effect (i.e. a larger radiative efficiency) was produced.
Aerosol radiative effects during the summer 2019 heatwave over Europe produced partly by an inter-continental Saharan dust outbreak have been assessed in this work. The continuous evolution of the dust direct radiative effect (DRE) in the SW range has been examined, in particular, for a case study of the dust intrusion observed in June 2019 at two European stations. The dust plume was firstly observed in Barcelona (BCN, Spain; 41.4∘ N, 2.1∘ E; 125 ) on 23 June, lasting for 8 d until 30 June (23–30 June). Later, it arrived at Leipzig (LPZ, Germany; 51.4∘ N, 12.4∘ E; 125 ) on 29 June, two different, slightly separated, dust episodes being detected for 2 consecutive days (29 and 30 June).
The main conclusions are summarised next.
-
The particular pathway of the dust air masses defines the aerosol scenario, determining clearly the vertical extent and the properties of the dust particles and hence their direct radiative effects (DRE).
-
Columnar data alone do not fully describe that scenario, and they can even lead to wrong dust characterisation, but in synergy with lidar observations the dust environment can be completely analysed and assessed.
-
The synergetic use of the POLIPHON method with continuous P-MPL measurements allows for the separation of the optical properties of both the Dc and Df components from the ND aerosols in a temporal basis in order to evaluate separately the radiative effect of dust in mixed scenarios.
-
A dust-induced cooling effect is observed in the SW range, the DRE efficiency being higher, in absolute value, at the surface than at the top of atmosphere (TOA).
-
Despite Dc particles usually dominating under dusty conditions, the contribution of Df particles to the total dust DRE, both at the surface and at the TOA, is relevant; it is higher at the TOA than at the surface, and in both cases it increases throughout the event; at the TOA, the Df contribution at the end of the event is even higher than the Dc particles one (56 % vs. 44 %).
-
Consequently, although the dust cooling effect is lower in LPZ than in BCN, the Df contribution to the total dust DRE is higher in LPZ than in BCN because of the progressive loss of large particles by gravitational settling during their longer transport to the LPZ station.
The study calls for a more generalised use of state-of-the-art algorithms, like POLIPHON, to independently retrieve aerosol properties for the fine and coarse modes. These retrievals are very valuable when used as input for radiative transfer models. Our findings clearly demonstrate that both fine and coarse modes are equally relevant for the estimation of SW direct radiative effects of long-range transported mineral dust. In general, results obtained in this work are especially relevant for the next ESA EarthCARE mission (launch planned in 2022), which is focused on radiation–aerosol–cloud interactions, but also for satellite remote sensing instrumentation, which is mostly sensitive to SW wavelengths since its measurements can be likely affected by dust contamination. In addition, the determination of the dust ice nucleating particle (INP) concentration, once dust and non-dust components are separated, is ongoing; this is in relation to the indirect dust radiative forcing, representing an added value in aerosol–cloud–radiation research. The dust long-wave (LW) and net direct radiative effect of both Dc and Df modes on the surface and at TOA are presented in the companion paper by Sicard et al. (2021).
Part of the data used in this publication were obtained as part of the AERONET and MPLNET networks and are publicly available. For additional data or information, please contact the authors.
CCJ and MS designed the study and wrote the original draft paper. CCJ, MS, and AA provided data. CCJ, MS, and MALC performed data analysis with contributions from AA, AC, MPZ, ARG, and CMP. All authors reviewed and edited the final version of the manuscript. All the authors agreed to the final version of the paper.
The authors declare that they have no conflict of interest.
The authors thank the images provided from the NMMB/BSC-Dust model, operated by the Barcelona Supercomputing Centre (BSC) (https://ess.bsc.es/bsc-dust-daily-forecast; last access: 30 January 2020). The authors also gratefully acknowledge the NOAA Air Resources Laboratory (ARL) for the provision of the pictures from the HYSPLIT transport and dispersion model and/or READY website (http://www.ready.noaa.gov; last access: 28 April 2020) used in this work. The MPLNET project is funded by the NASA Radiation Sciences Program and Earth Observing System. The MPLNET staff at NASA GSFC is warmly acknowledged for the continuous help in keeping the MPL systems and the data analysis up to date. We particularly thank Judd Welton for providing the MPL unit in place at the Barcelona site.
This research was funded by the Spanish Ministry of Science, Innovation and Universities (CGL2017-90884-REDT and PRX18/00137 “Salvador de Madariaga” programme), the Spanish Ministry of Science and Innovation (PID2019-104205GB-C21 and PID2019-103886RB-I00), the H2020 programme from the European Union (ACTRIS, GA no. 654109, 778349, and 871115), and the Unity of Excellence “María de Maeztu“ (MDM-2016-0600) financed by the Spanish State Research Agency (AEI). MPZ has been partially funded by the AEI (Unity of Excellence “María de Maeztu” - Centro de Astrobiología (CSIC-INTA), MDM-2017-0737). MALC is supported by the INTA predoctoral contract programme.
This paper was edited by Stelios Kazadzis and reviewed by three anonymous referees.
Akritidis, D., Katragkou, E., Georgoulias, A. K., Zanis, P., Kartsios, S., Flemming, J., Inness, A., Douros, J., and Eskes, H.: A complex aerosol transport event over Europe during the 2017 Storm Ophelia in CAMS forecast systems: analysis and evaluation, Atmos. Chem. Phys., 20, 13557–13578, https://doi.org/10.5194/acp-20-13557-2020, 2020.
Ansmann, A., Bösenberg, J., Chaikovsky, A., Comerón, A., Eckhardt, S., Eixmann, R., Freudenthaler, V., Ginoux, P., Komguem, L., Linné, H., Márquez, M. Á. L., Matthias, V., Mattis, I., Mitev, V., Müller, D., Music, S., Nickovic, S., Pelon, J., Sauvage, L., Sobolewsky, P., Srivastava, M. K., Stohl, A., Torres, O., Vaughan, G., Wandinger, U., and Wiegner, M.: Long-range transport of Saharan dust to northern Europe: The 11–16 October 2001 outbreak observed with EARLINET, J. Geophys. Res.-Atmos., 108, 4783, https://doi.org/10.1029/2003JD003757, 2003.
Ansmann, A., Rittmeister, F., Engelmann, R., Basart, S., Jorba, O., Spyrou, C., Remy, S., Skupin, A., Baars, H., Seifert, P., Senf, F., and Kanitz, T.: Profiling of Saharan dust from the Caribbean to western Africa – Part 2: Shipborne lidar measurements versus forecasts, Atmos. Chem. Phys., 17, 14987–15006, https://doi.org/10.5194/acp-17-14987-2017, 2017.
Ansmann, A., Mamouri, R.-E., Hofer, J., Baars, H., Althausen, D., and Abdullaev, S. F.: Dust mass, cloud condensation nuclei, and ice-nucleating particle profiling with polarization lidar: updated POLIPHON conversion factors from global AERONET analysis, Atmos. Meas. Tech., 12, 4849–4865, https://doi.org/10.5194/amt-12-4849-2019, 2019.
Balkanski, Y., Schulz, M., Claquin, T., and Guibert, S.: Reevaluation of Mineral aerosol radiative forcings suggests a better agreement with satellite and AERONET data, Atmos. Chem. Phys., 7, 81–95, https://doi.org/10.5194/acp-7-81-2007, 2007.
Banks, J. R., Brindley, H. E., Hobby, M., and Marsham, J. H.: The Daytime Cycle in Dust Aerosol Direct Radiative Effects Observed in the Central Sahara during the Fennec Campaign in June 2011, J. Geophys. Res.-Atmos., 119, 13861–13876, https://doi.org/10.1002/2014JD022077, 2014.
Cachorro, V. E., Toledano, C., Prats, N., Sorribas, M., Mogo, S., Berjón, A., Torres, B., Rodrigo, R., De la Rosa, J., and De Frutos, A. M.: The Strongest Desert Dust Intrusion Mixed with Smoke Over the Iberian Peninsula Registered with Sun Photometry, J. Geophys. Res.-Atmos., 113, D14S04, https://doi.org/10.1029/2007JD009582, 2008.
Campbell, J. R., Hlavka, D. L., Welton, E. J., Flynn, C. J., Turner, D. D., Spinhirne, J. D., Scott III, V. S., and Hwang, I. H.: Full-Time, Eye-Safe Cloud and Aerosol Lidar Observation at Atmospheric Radiation Measurement Program Sites: Instruments and Data Processing, J. Atmos. Ocean. Tech., 19, 431–442, https://doi.org/10.1175/1520-0426(2002)019<0431:FTESCA>2.0.CO;2, 2002.
Córdoba-Jabonero, C., Sorribas, M., Guerrero-Rascado, J. L., Adame, J. A., Hernández, Y., Lyamani, H., Cachorro, V., Gil, M., Alados-Arboledas, L., Cuevas, E., and de la Morena, B.: Synergetic monitoring of Saharan dust plumes and potential impact on surface: a case study of dust transport from Canary Islands to Iberian Peninsula, Atmos. Chem. Phys., 11, 3067–3091, https://doi.org/10.5194/acp-11-3067-2011, 2011.
Córdoba-Jabonero, C., Andrey-Andres, J., Gomez, L., Adame, J. A., Sorribas, M., Navarro-Comas, M., Puentedura, O., Cuevas, E., and Gil-Ojeda, M.: Vertical Mass Impact and Features of Saharan Dust Intrusions Derived from Ground-Based Remote Sensing in Synergy with Airborne in-Situ Measurements, Atmos. Environ., 142, 420–429, https://doi.org/10.1016/j.atmosenv.2016.08.003, 2016.
Córdoba-Jabonero, C., Sicard, M., Ansmann, A., del Águila, A., and Baars, H.: Separation of the optical and mass features of particle components in different aerosol mixtures by using POLIPHON retrievals in synergy with continuous polarized Micro-Pulse Lidar (P-MPL) measurements, Atmos. Meas. Tech., 11, 4775–4795, https://doi.org/10.5194/amt-11-4775-2018, 2018.
Córdoba-Jabonero, C., Sicard, M., Del Águila, A., Jiménez, M., and Zorzano, M.: Performance of a Dust Model to Predict the Vertical Mass Concentration of an Extreme Saharan Dust Event in the Iberian Peninsula: Comparison with Continuous, Elastic, Polarization-Sensitive Lidars, Atmos. Environ., 214, 116828, https://doi.org/10.1016/j.atmosenv.2019.116828, 2019.
DeMott, P. J., Sassen, K., Poellot, M. R., Baumgardner, D., Rogers, D. C., Brooks, S. D., Prenni, A. J., and Kreidenweis, S. M.: African Dust Aerosols as Atmospheric Ice Nuclei, Geophys. Res. Lett., 30, 1732, https://doi.org/10.1029/2003GL017410, 2003.
Derimian, Y., León, J., Dubovik, O., Chiapello, I., Tanré, D., Sinyuk, A., Auriol, F., Podvin, T., Brogniez, G., and Holben, B. N.: Radiative Properties of Aerosol Mixture Observed during the Dry Season 2006 Over M'Bour, Senegal (African Monsoon Multidisciplinary Analysis Campaign), J. Geophys. Res.-Atmos., 113, D00C09, https://doi.org/10.1029/2008JD009904, 2008.
Di Biagio, C., di Sarra, A., Meloni, D., Monteleone, F., Piacentino, S., and Sferlazzo, D.: Measurements of Mediterranean Aerosol Radiative Forcing and Influence of the Single Scattering Albedo, J. Geophys. Res.-Atmos., 114, D06211, https://doi.org/10.1029/2008JD011037, 2009.
Di Sarra, A., Pace, G., Meloni, D., De Silvestri, L., Piacentino, S., and Monteleone, F.: Surface Shortwave Radiative Forcing of Different Aerosol Types in the Central Mediterranean, Geophys. Res. Lett., 35, L02714, https://doi.org/10.1029/2007GL032395, 2008.
Draxler, R. R. and Hess, G. D.: An Overview of the HYSPLIT_4 Modelling System for Trajectories, Aust. Meteorol. Mag., 47, 295–308, 1998.
Dubovik, O., Smirnov, A., Holben, B. N., King, M. D., Kaufman, Y. J., Eck, T. F., and Slutsker, I.: Accuracy assessment of aerosol optical properties retrieval from AERONET sun and sky radiance measurements, J. Geophys. Res., 105, 9791–9806, https://doi.org/10.1029/2000JD900040, 2000.
Dubovik, O., Holben, B., Eck, T. F., Smirnov, A., Kaufman, Y. J., King, M. D., Tanré, D., and Slutsker, I.: Variability of Absorption and Optical Properties of Key Aerosol Types Observed in Worldwide Locations, J. Atmos. Sci., 59, 590–608, https://doi.org/10.1175/1520-0469(2002)059<0590:VOAAOP>2.0.CO;2, 2002.
Dubovik, O., Sinyuk, A., Lapyonok, T., Holben, B. N., Mishchenko, M., Yang, P., Eck, T. F., Volten, H., Muñoz, O., Veihelmann, B., van der Zande, W. J., Leon, J.-F., Sorokin, M., and Slutsker, I.: Application of spheroid models to account for aerosol particle nonsphericity in remote sensing of desert dust, J. Geophys. Res., 111, D11208, https://doi.org/10.1029/2005JD006619, 2006.
Dubuisson, P., Buriez, J. C., and Fouquart, Y.: High Spectral Resolution Solar Radiative Transfer in Absorbing and Scattering Media: Application to the Satellite Simulation, J. Quant. Spectrosc. Ra., 55, 103–126, https://doi.org/10.1016/0022-4073(95)00134-4, 1996.
Dubuisson, P., Dessailly, D., Vesperini, M., and Frouin, R.: Water Vapor Retrieval Over Ocean using Near-infrared Radiometry, J. Geophys. Res.-Atmos., 109, D19106, https://doi.org/10.1029/2004JD004516, 2004.
Dubuisson, P., Roger, J., Mallet, M., and Dubovik, O.: A Code to Compute the Direct Solar Radiative Forcing: Application to Anthropogenic Aerosols during the Escompte Experiment, in: Proc. International Radiation Symposium (IRS 2004) on Current Problems in Atmospheric Radiation, 23–28 August 2004, Busan, Korea, edited by: Fischer, H. and Sohn, B.-J., A. Deepak Publishing, Hampton, 127–130, 2006.
Eck, T. F., Holben, B. N., Reid, J. S., Dubovik, O., Kinne, S., Smirnov, A., O'Neill, N. T., and Slutsker, I.: Wavelength dependence of the optical depth of biomass burning, urban and desert dust aerosols, J. Geophys. Res., 104, 31333–31349, https://doi.org/10.1029/1999JD900923, 1999.
Fernald, F. G.: Analysis of Atmospheric Lidar Observations: Some Comments, Appl. Optics, 23, 652–653, 1984.
Flynn, C. J., Mendoza, A., Zheng, Y., and Mathur, S.: Novel Polarization-Sensitive Micropulse Lidar Measurement Technique, Opt. Express, 15, 2785–2790, https://doi.org/10.1364/OE.15.002785, 2007.
Ginoux, P., Prospero, J. M., Gill, T. E., Hsu, N. C., and Zhao, M.: Global-scale attribution of anthropogenic and natural dust sources and their emission rates based on MODIS Deep Blue aerosol products, Rev. Geophys., 50, RG3005, https://doi.org/10.1029/2012RG000388, 2012.
Granados-Muñoz, M. J., Sicard, M., Román, R., Benavent-Oltra, J. A., Barragán, R., Brogniez, G., Denjean, C., Mallet, M., Formenti, P., Torres, B., and Alados-Arboledas, L.: Impact of mineral dust on shortwave and longwave radiation: evaluation of different vertically resolved parameterizations in 1-D radiative transfer computations , Atmos. Chem. Phys., 19, 523–542, https://doi.org/10.5194/acp-19-523-2019, 2019.
Halthore, R. N., Crisp, D., Schwartz, S. E., Anderson, G. P., Berk, A., Bonnel, B., Boucher, O., Chang, F., Chou, M., Clothiaux, E. E., Dubuisson, P., Fomin, B., Fouquart, Y., Freidenreich, S., Gautier, C., Kato, S., Laszlo, I., Li, Z., Mather, J. H., Plana-Fattori, A., Ramaswamy, V., Ricchiazzi, P., Shiren, Y., Trishchenko, A., and Wiscombe, W.: Intercomparison of Shortwave Radiative Transfer Codes and Measurements, J. Geophys. Res.-Atmos., 110, D11206, https://doi.org/10.1029/2004JD005293, 2005.
Haywood, J. and Boucher, O.: Estimates of the Direct and Indirect Radiative Forcing due to Tropospheric Aerosols: A Review, Rev. Geophys., 38, 513–543, 2000.
Hess, M., Koepke, P., and Schult, I.: Optical properties of aerosols and clouds: the software package OPAC, B. Am. Meteorol. Soc., 79, 831–844, https://doi.org/10.1175/1520-0477(1998)079%3c0831:OPOAAC%3e2.0.CO;2, 1998.
Huneeus, N., Schulz, M., Balkanski, Y., Griesfeller, J., Prospero, J., Kinne, S., Bauer, S., Boucher, O., Chin, M., Dentener, F., Diehl, T., Easter, R., Fillmore, D., Ghan, S., Ginoux, P., Grini, A., Horowitz, L., Koch, D., Krol, M. C., Landing, W., Liu, X., Mahowald, N., Miller, R., Morcrette, J.-J., Myhre, G., Penner, J., Perlwitz, J., Stier, P., Takemura, T., and Zender, C. S.: Global dust model intercomparison in AeroCom phase I, Atmos. Chem. Phys., 11, 7781–7816, https://doi.org/10.5194/acp-11-7781-2011, 2011.
IPCC: Myhre, G., Shindell, D., Bréon, F.-M-, Collins, W., Fuglestvedt, J., Huang, J., Koch, D., Lamarque, J.-F., Lee, D., Mendoza, B., Nakajima, T., Robock, A., Stephens, G., Takemura, T., and Zhang, H.: Anthropogenic and natural radiative forcing, in: Climate Change 2013: The Physical Science Basis. Contribution of Working Group I to the Fifth Assessment Report of the Intergovernmental Panel on Climate Change, edited by: Stocker, T. F., Qin, D., Plattner, G.-K., Tignor, M., Allen, S. K., Boschung, J., Nauels, A., Xia, Y., Bex, V., and Midgley, P. M., Cambridge University Press, Cambridge, NY, USA, 2013.
Janjic, Z., Janjic, T., and Vasic, R.: A Class of Conservative Fourth-Order Advection Schemes and Impact of Enhanced Formal Accuracy on Extended-Range Forecasts, Mon. Weather Rev., 139, 1556–1568, https://doi.org/10.1175/2010MWR3448.1, 2011.
Klett, J. D.: Lidar Inversion with Variable Backscatter/Extinction Ratios, Appl. Optics, 24, 1638–1643, 1985.
Lacis, A. A. and Oinas, V.: A Description of the Correlated K Distribution Method for Modeling Nongray Gaseous Absorption, Thermal Emission, and Multiple Scattering in Vertically Inhomogeneous Atmospheres, J. Geophys. Res.-Atmos., 96, 9027–9063, https://doi.org/10.1029/90JD01945, 1991.
Liao, H. and Seinfeld, J. H.: Radiative Forcing by Mineral Dust Aerosols: Sensitivity to Key Variables, J. Geophys. Res.-Atmos., 103, 31637–31645, https://doi.org/10.1029/1998JD200036, 1998.
Lyamani, H., Olmo, F. J., Alcántara, A., and Alados-Arboledas, L.: Atmospheric Aerosols during the 2003 Heat Wave in Southeastern Spain II: Microphysical Columnar Properties and Radiative Forcing, Atmos. Environ., 40, 6465–6476, https://doi.org/10.1016/j.atmosenv.2006.04.047, 2006.
Mallet, M., Pont, V., and Liousse, C.: Modelling of Strong Heterogeneities in Aerosol Single Scattering Albedos Over a Polluted Region, Geophys. Res. Lett., 32, L09807, https://doi.org/10.1029/2005GL022680, 2005.
Mallet, M., Pont, V., Liousse, C., Gomes, L., Pelon, J., Osborne, S., Haywood, J., Roger, J., Dubuisson, P., and Mariscal, A.: Aerosol Direct Radiative Forcing Over Djougou (Northern Benin) during the African Monsoon Multidisciplinary Analysis Dry Season Experiment (Special Observation Period-0), J. Geophys. Res.-Atmos., 113, D00C01, https://doi.org/10.1029/2007JD009419, 2008.
Mamouri, R. E. and Ansmann, A.: Fine and coarse dust separation with polarization lidar, Atmos. Meas. Tech., 7, 3717–3735, https://doi.org/10.5194/amt-7-3717-2014, 2014.
Mamouri, R.-E. and Ansmann, A.: Potential of polarization/Raman lidar to separate fine dust, coarse dust, maritime, and anthropogenic aerosol profiles, Atmos. Meas. Tech., 10, 3403–3427, https://doi.org/10.5194/amt-10-3403-2017, 2017.
Marquis, J. W., Oyola, M. I., Campbell, J. R., Ruston, B. C., Córdoba-Jabonero, C., Cuevas, E., Lewis, J., Toth, T., and Zhang, J.: Conceptualizing the Impact of Dust Contaminated Infrared Radiances on Data Assimilation for Numerical Weather Prediction, J. Atmos. Ocean. Tech., 38, 209–221, https://doi.org/10.1175/JTECH-D-19-0125.1, 2021.
Meloni, D., Di Sarra, A., Di Iorio, T., and Fiocco, G.: Influence of the Vertical Profile of Saharan Dust on the Visible Direct Radiative Forcing, J. Quant. Spectrosc. Ra., 93, 397–413, https://doi.org/10.1016/j.jqsrt.2004.08.035, 2005.
Meloni, D., Junkermann, W., Di Sarra, A., Cacciani, M., De Silvestri, L., Di Iorio, T., Estellés, V., Gómez-Amo, J. L., Pace, G., and Sferlazzo, D. M.: Altitude-resolved Shortwave and Longwave Radiative Effects of Desert Dust in the Mediterranean during the GAMARF Campaign: Indications of a Net Daily Cooling in the Dust Layer, J. Geophys. Res.-Atmos., 120, 3386–3407, https://doi.org/10.1002/2014JD022312, 2015.
Mona, L., Amodeo, A., Pandolfi, M., and Pappalardo, G.: Saharan dust intrusions in the Mediterranean area: Three years of Raman lidar measurements, J. Geophys. Res.-Atmos., 111, D16203, https://doi.org/10.1029/2005JD006569, 2006.
Osborne, S. R., Baran, A. J., Johnson, B. T., Haywood, J. M., Hesse, E., and Newman, S.: Short-wave and Long-wave Radiative Properties of Saharan Dust Aerosol, Q. J. Roy. Meteor. Soc., 137, 1149–1167, https://doi.org/10.1002/qj.771, 2011.
Osborne, M., Malavelle, F. F., Adam, M., Buxmann, J., Sugier, J., Marenco, F., and Haywood, J.: Saharan dust and biomass burning aerosols during ex-hurricane Ophelia: observations from the new UK lidar and sun-photometer network, Atmos. Chem. Phys., 19, 3557–3578, https://doi.org/10.5194/acp-19-3557-2019, 2019.
Osipov, S., Stenchikov, G., Brindley, H., and Banks, J.: Diurnal cycle of the dust instantaneous direct radiative forcing over the Arabian Peninsula, Atmos. Chem. Phys., 15, 9537–9553, https://doi.org/10.5194/acp-15-9537-2015, 2015.
Papayannis, A., Balis, D., Amiridis, V., Chourdakis, G., Tsaknakis, G., Zerefos, C., Castanho, A. D. A., Nickovic, S., Kazadzis, S., and Grabowski, J.: Measurements of Saharan dust aerosols over the Eastern Mediterranean using elastic backscatter-Raman lidar, spectrophotometric and satellite observations in the frame of the EARLINET project, Atmos. Chem. Phys., 5, 2065–2079, https://doi.org/10.5194/acp-5-2065-2005, 2005.
Papayannis, A., Amiridis, V., Mona, L., Tsaknakis, G., Balis, D., Bösenberg, J., Chaikovski, A., De Tomasi, F., Grigorov, I., Mattis, I., Mitev, V., Müller, D., Nickovic, S., Pérez, C., Pietruczuk, A., Pisani, G., Ravetta, F., Rizi, V., Sicard, M., Trickl, T., Wiegner, M., Gerding, M., Mamouri, R. E., D'Amico, G., and Pappalardo, G.: Systematic lidar observations of Saharan dust over Europe in the frame of EARLINET (2000–2002), J. Geophys. Res.-Atmos., 113, D10204, https://doi.org/10.1029/2007JD009028, 2008.
Pérez, C., Nickovic, S., Pejanovic, G., Baldasano, J. M., and Özsoy, E.: Interactive dust-radiation modeling: A step to improve weather forecasts, J. Geophys. Res., 111, D16206, https://doi.org/10.1029/2005JD006717, 2006.
Pérez, C., Haustein, K., Janjic, Z., Jorba, O., Huneeus, N., Baldasano, J. M., Black, T., Basart, S., Nickovic, S., Miller, R. L., Perlwitz, J. P., Schulz, M., and Thomson, M.: Atmospheric dust modeling from meso to global scales with the online NMMB/BSC-Dust model – Part 1: Model description, annual simulations and evaluation, Atmos. Chem. Phys., 11, 13001–13027, https://doi.org/10.5194/acp-11-13001-2011, 2011.
Prospero, J. M., Ginoux, P., Torres, O., Nicholson, S. E., and Grill, T. E.: Environmental characterization of global sources of atmospheric soil dust identified with the Nimbus 7 Total Ozone Mapping Spectrometer (TOMS) absorbing aerosol product, Rev. Geophys., 40, 1002, https://doi.org/10.1029/2000RG000095, 2002.
Roger, J., Mallet, M., Dubuisson, P., Cachier, H., Vermote, E., Dubovik, O., and Despiau, S.: A Synergetic Approach for Estimating the Local Direct Aerosol Forcing: Application to an Urban Zone during the Expérience Sur Site Pour Contraindre Les Modèles De Pollution Et De Transport D'Emission (ESCOMPTE) Experiment, J. Geophys. Res.-Atmos., 111, D13208, https://doi.org/10.1029/2005JD006361, 2006.
Rolph, G., Stein, A., and Stunder, B.: Real-Time Environmental Applications and Display System: READY, Environ. Modell. Softw., 95, 210–228, https://doi.org/10.1016/j.envsoft.2017.06.025, 2017.
Sicard, M., Mallet, M., García-Vizcaíno, D., Comerón, A., Rocadenbosch, F., Dubuisson, P., and Muñoz-Porcar, C.: Intense Dust and Extremely Fresh Biomass Burning Outbreak in Barcelona, Spain: Characterization of their Optical Properties and Estimation of their Direct Radiative Forcing, Environ. Res. Lett., 7, 034016, https://doi.org/10.1088/1748-9326/7/3/034016, 2012.
Sicard, M., Bertolín, S., Mallet, M., Dubuisson, P., and Comerón, A.: Estimation of mineral dust long-wave radiative forcing: sensitivity study to particle properties and application to real cases in the region of Barcelona, Atmos. Chem. Phys., 14, 9213–9231, https://doi.org/10.5194/acp-14-9213-2014, 2014a.
Sicard, M., Bertolín, S., Muñoz, C., Rodríguez, A., Rocadenbosch, F., and Comerõn, A.: Separation of aerosol fine- and coarse mode radiative properties: Effect on the mineral dust longwave, direct radiative forcing, Geophys. Res. Lett., 41, 6978–6985, https://doi.org/10.1002/2014GL060946, 2014b.
Sicard, M., Barragan, R., Dulac, F., Alados-Arboledas, L., and Mallet, M.: Aerosol optical, microphysical and radiative properties at regional background insular sites in the western Mediterranean, Atmos. Chem. Phys., 16, 12177–12203, https://doi.org/10.5194/acp-16-12177-2016, 2016.
Sicard, M., Córdoba-Jabonero, C., López-Cayuela, M.-A., Ansmann, A., Comerón, A., Zorzano, M.-P., Rodríguez-Gómez, A., and Muñoz-Porcar, C.: Aerosol radiative impact during the summer 2019 heatwave produced partly by an inter-continental Saharan dust outbreak – Part 2: Long-wave and net dust direct radiative effect, Atmos. Chem. Phys., submitted, 2021.
Sokolik, I. N. and Toon, O. B.: Direct radiative forcing by anthropogenic airborne mineral aerosols, Nature, 381, 681–683, https://doi.org/10.1038/381681a0, 1996.
Sousa, P. M., Barriopedro, D., Ramos, A. M., García-Herrera, R., Espírito-Santo, F., and Trigo, R. M.: Saharan air intrusions as a relevant mechanism for Iberian heatwaves: The record breaking events of August 2018 and June 2019, Weather and Climate Extremes, 26, 100224, https://doi.org/10.1016/j.wace.2019.100224, 2019.
Stamnes, K., Tsay, S., Wiscombe, W., and Jayaweera, K.: Numerically Stable Algorithm for Discrete-Ordinate-Method Radiative Transfer in Multiple Scattering and Emitting Layered Media, Appl. Optics, 27, 2502–2509, https://doi.org/10.1364/AO.27.002502, 1988.
Stein, A. F., Draxler, R. R., Rolph, G. D., Stunder, B. J., Cohen, M. D., and Ngan, F.: NOAA's HYSPLIT Atmospheric Transport and Dispersion Modeling System, B. Am. Meteorol. Soc., 96, 2059–2077, https://doi.org/10.1175/BAMS-D-14-00110.1, 2015.
Toledano, C., Cachorro, V. E., Berjon, A., de Frutos, A. M., Sorribas, M., de la Morena, B. A., and Goloub, P.: Aerosol optical depth and Ångström exponent climatology at El Arenosillo AERONET site (Huelva, Spain), Q. J. Roy. Meteor. Soc., 133, 795–807, https://doi.org/10.1002/qj.54, 2007.
Tsikerdekis, A., Zanis, P., Georgoulias, A. K., Alexandri, G., Katragkou, E., Karacostas, T., and Solmon, F.: Direct and semi-direct radiative effect of North African dust in present and future regional climate simulations, Clim. Dynam., 53, 4311–4336, https://doi.org/10.1007/s00382-019-04788-z, 2019.
Zender, C. S., Miller, R. L., and Tegen, I.: Quantifying mineral dust mass budgets: Terminology, constraints, and current estimates, Eos Trans. Am. Geophys. Un., 85, 509–512, https://doi.org/10.1029/2004EO480002, 2004.