the Creative Commons Attribution 4.0 License.
the Creative Commons Attribution 4.0 License.
 | 27 Apr 2021
Analysis of atmospheric ammonia over South and East Asia based on the MOZART-4 model and its comparison with satellite and surface observations
Pooja V. Pawar
Sachin D. Ghude
Chinmay Jena
Andrea Móring
Mark A. Sutton
Santosh Kulkarni
Deen Mani Lal
Divya Surendran
Martin Van Damme
Lieven Clarisse
Pierre-François Coheur
Xuejun Liu
Gaurav Govardhan
Jize Jiang
Tapan Kumar Adhya
Limited availability of atmospheric ammonia (NH3) observations limits our understanding of controls on its spatial and temporal variability and its interactions with the ecosystem. Here we used the Model for Ozone and Related chemical Tracers version 4 (MOZART-4) global chemistry transport model and the Hemispheric Transport of Air Pollution version 2 (HTAP-v2) emission inventory to simulate global NH3 distribution for the year 2010. We presented a first comparison of the model with monthly averaged satellite distributions and limited ground-based observations available across South Asia. The MOZART-4 simulations over South Asia and East Asia were evaluated with the NH3 retrievals obtained from the Infrared Atmospheric Sounding Interferometer (IASI) satellite and 69 ground-based monitoring stations for air quality across South Asia and 32 ground-based monitoring stations from the Nationwide Nitrogen Deposition Monitoring Network (NNDMN) of China. We identified the northern region of India (Indo-Gangetic Plain, IGP) as a hotspot for NH3 in Asia, both using the model and satellite observations. In general, a close agreement was found between yearly averaged NH3 total columns simulated by the model and IASI satellite measurements over the IGP, South Asia (r=0.81), and the North China Plain (NCP), East Asia (r=0.90). However, the MOZART-4-simulated NH3 column was substantially higher over South Asia than East Asia, as compared with the IASI retrievals, which show smaller differences. Model-simulated surface NH3 concentrations indicated smaller concentrations in all seasons than surface NH3 measured by the ground-based observations over South and East Asia, although uncertainties remain in the available surface NH3 measurements. Overall, the comparison of East Asia and South Asia using both MOZART-4 model and satellite observations showed smaller NH3 columns in East Asia compared with South Asia for comparable emissions, indicating rapid dissipation of NH3 due to secondary aerosol formation, which can be explained by larger emissions of acidic precursor gases in East Asia.
- Article
(3999 KB) - Full-text XML
-
Supplement
(964 KB) - BibTeX
- EndNote


Gaseous pollution due to various forms of nitrogen emissions plays an important role in environmental processes. Specifically, ammonia (NH3) emitted from various agricultural activities, such as the use of synthetic fertilisers and animal farming, together with nitrogen oxides (NOx), is one of the largest sources of reactive nitrogen (Nr) emission to the atmosphere. Ammonia has great environmental implications due to its substantial influence on the global nitrogen cycle and its associated air pollution, on the ecosystem and on public health (Behera et al., 2013; Liu et al., 2017b; Zhou et al., 2016). Emission estimates provided by the latest Emission Database for Global Atmospheric Research (EDGAR v4.3.2) emission inventory suggest that globally about 59 Tg of NH3 was emitted in the atmosphere in 2012, of which direct soil emissions contributed about 56 %, manure management (on farm) contributed about 19 % and agricultural burning contributed about 1.5 %, while the biomass burning contribution is not included in the emission estimate. Furthermore, due to a lack of observed emission factors and the high uncertainty of agricultural statistics, the uncertainty of NH3 is the largest among all other pollutants in EDGAR v4.3.2 (Crippa et al., 2018). Ammonia is a key precursor of aerosol formation, as the reactions in the atmosphere lead to an increase in different forms of sulfates and nitrates that contribute to secondary aerosol formation (Pinder et al., 2007, 2008). India and China together accounted for an estimated 64 % of the total amount of NH3 emissions in South Asia during 2000–2014 (Xu et al., 2018). Emissions of NOx and NH3 are increasing substantially over South Asia (Sutton et al., 2017a, b), which contributes to an increase in particulate mass loading, visibility degradation, acidification and eutrophication (Behera et al., 2013; Ghude et al., 2008, 2013, 2016). Asia is responsible for the largest share of global NH3 emissions (Janssens-Maenhout et al., 2012). A further increase in NH3 emission will increase its negative impacts and societal cost (Sutton et al., 2017b).
In India, around 50 % of total NH3 emissions is estimated to be from the fertiliser application and the remainder from livestock and other NH3 sources (Aneja et al., 2011; Behera et al., 2013). However, there are large uncertainties in emissions of ammonia, its deposition to the surface, its chemistry and its transport (Sutton et al., 2013; Zhu et al., 2015). Urea is mostly used as a fertiliser (Fertiliser Association of India Annual Report 2018–2019, 2018) and alone contributes more than 90 % of total fertiliser used for agricultural activities (Sharma et al., 2008). India is currently the second largest consumer of fertilisers after China, and fertiliser usage is bound to increase with further intensification of agriculture. The fertiliser input of India is expected to have doubled by 2050 (Alexandratos and Bruinsma, 2012).
Recent studies based on Infrared Atmospheric Sounding Interferometer (IASI) satellite measurements show very high concentrations of NH3 over the Indo-Gangetic Plain (IGP) and the North China Plain (NCP), which were mainly related to agricultural (Van Damme et al., 2014a, b, 2015b) and industrial activity (Clarisse et al., 2019; Van Damme et al., 2018). The seasonality was shown to be more pronounced in the Northern Hemisphere, with peak columns in spring and summer seasons (Van Damme et al., 2014a). Van Damme et al. (2015a) attempted first to validate IASI NH3 measurements using existing independent ground-based and airborne datasets. This study does not include comparison of ground-based NH3 datasets with IASI measurements particularly over South Asia (India) due to the limited availability of NH3 measurements. Liu et al. (2017a) estimated the ground-based NH3 concentrations over East Asia, combining IASI NH3 columns and NH3 profiles from the Model for Ozone and Related chemical Tracers (MOZART-4) and validated the data with 44 sites of the Chinese Nationwide Nitrogen Deposition Monitoring Network (NNDMN). In one of the recent studies over South Asia, interannual variability of atmospheric NH3 using IASI observations revealed large seasonal variability in atmospheric NH3 concentrations, which were equivalent to the highest number of urea fertiliser plants. This study highlights the importance of the role of agriculture statistics and fertiliser consumption/application in determining ammonia concentration in South Asia (Kuttippurath et al., 2020). The available global ammonia emission inventory does not include comprehensive bottom-up NH3 emissions for South Asia compared to East Asia that are suitable for input to atmospheric models by taking into consideration actual statistical data of various NH3 sources, such as livestock excreta, fertiliser application, agricultural soil, nitrogen-fixing plants, crop residue compost, biomass burning, urine from rural populations, chemical industry, waste disposal and traffic, which are currently missing (Behera et al., 2013; Huang et al., 2012; Janssens-Maenhout et al., 2015; Li et al., 2017; Zhang et al., 2010). Han et al. (2020) suggested that an updated emission inventory as per the source activity is essential for South Asia to reduce the uncertainties in simulated NH3 over this region. A recent study by Wang et al. (2020) examined the NH3 column observed over the IGP during summer using a regional model driven with the MIX emission inventory. The study suggested that high agriculture activity and high summer temperature contribute to high NH3 emission fluxes over the IGP, which lead to large total columns. A summertime increase in NH3 concentration at the surface over certain sites in the IGP regions is also observed from the ground-based monitoring network (Datta et al., 2012; Mandal et al., 2013; Saraswati et al., 2019; Sharma et al., 2012, 2014b).
In this study, we examined the spatio-temporal variability of atmospheric NH3 over Asia (South and East Asia) and focus on two hotspot regions of ammonia, the Indo-Gangetic Plain (IGP) and the North China Plain (NCP). The approach for this study is a combination of simulations using chemical transport modelling, satellite observations and in situ ammonia measurements over South Asia (69 stations) and East Asia (32 stations). The analysis applies the Model for Ozone and Related chemical tracers (MOZART-4) driven by a priori ammonia emissions based on the Hemispheric Transport of Air Pollution version 2 (HTAP-v2) emission inventory. It applies HTAP-v2 data for emissions to produce estimated total columns of NH3 and aerosol species for the year 2010 over Asia. Model simulations were evaluated and compared with NH3 data from IASI (over South and East Asia) and selected ground-based observations (noted above). In addition to the regional comparison, we examine why certain emission hotspot regions in East Asia show lower NH3 total columns compared with similar hotspot regions in South Asia, when analysed with both model and satellite observations.
2.1 MOZART-4 model
The global chemical transport model MOZART-4 has been employed in this study to conduct a year-long (2010) simulation of atmospheric trace gases and aerosols over Asia using the updated HTAP-v2 emission inventory (Janssens-Maenhout et al., 2015). These simulations were performed earlier to meet the objectives of the Task Force on Hemispheric Transport of Air Pollution phase 2 multi-model experiments (Surendran et al., 2015, 2016). The model domain covers the entire globe at a horizontal grid resolution of and 56 vertical levels from the surface up to 1 hPa. The model has approximately 10 levels in the boundary layer (below 850 hPa). MOZART-4 takes into account surface emissions, convection, advection, boundary layer transport, photochemistry, and wet and dry deposition. The model simulations were driven by the input meteorological dataset of resolution from Modern Era Retrospective Analysis for Research and Applications (MERRA) of the Goddard Earth Observing System Data Assimilation System (GEOS-DAS). Model simulations were performed for the complete year of 2010 (1 January to 31 December 2010), and its outputs were saved every 6 h (4 time steps each day) with a spin-up time of 6 months (1 July 2009 to 31 December 2009). MOZART-4 includes 157 gas-phase reactions, 85 gas-phase species, 39 photolysis compounds and 12 bulk aerosol compounds (Emmons et al., 2010). Dry deposition of gases and aerosols was calculated online according to the parameterisation of Wesely (1989), and wet deposition of soluble gases was calculated as described by the method of Emmons et al. (2010). Land use cover (LUC) maps used in MOZART-4 are based on the Advanced Very High Resolution Radiometer (AVHRR) and Moderate Resolution Imaging Spectroradiometer (MODIS) data based on the NCAR Community Land Model (CLM) (Oleson et al., 2010). MOZART-4 represents the land surface as a hierarchy of sub-grid types: glacier, lake, wetland, urban land and vegetated land. The vegetated land is further divided into a mosaic of plant function types (PFTs). These same maps are used for the dry deposition calculations (Emmons et al., 2010; Oleson et al., 2010; Lawrence and Chase, 2007). In MOZART-4 the tropospheric aerosol component is built on the extended work of Tie et al. (2001, 2005). The online Fast Tropospheric Ultraviolet Visible (FTUV) scheme, based on the TUV model (Tie et al., 2003), is used for the calculation of photolysis rates in MOZART-4. For long-lived species like CH4 and H2, surface boundary conditions are constrained by observations from NOAA/ESRL/GMD (Dlugokencky et al., 2005, 2008; Novelli, 1999), and N2O concentrations are set to the values as described in the Intergovernmental Panel on Climate Change 2000 report (IPCC, 2000). Biogenic emissions of isoprene and monoterpenes are calculated online using the Model of Emissions of Gases and Aerosols from Nature (MEGAN) (Guenther et al., 2006), using the implementation described by Pfister et al. (2008). Surface moisture flux and all relevant physical parameters are used to calculate water vapour (H2O) online. Biomass burning emissions of a wide range of gaseous components, including NH3, SO2 and individual volatile organic compounds, were provided by the Global Fire Emission Database (GFED-v3), determined by scaling the GFED CO2 emissions by the emission factors provided at grid resolution (Emmons et al., 2010).
In MOZART-4, the ammonium nitrate distribution is determined from NH3 emissions and the parameterisation of gas–aerosol partitioning using the equilibrium simplified aerosol model (EQSAM) by Metzger et al. (2002), which is a set of approximations to the equilibrium constant calculation (Seinfeld et al., 1998), based on the level of sulfate present. In Metzger et al. (2002), cations other than NH, e.g. sodium (Na+), potassium (K+), calcium (Ca2+), and magnesium (Mg2+), as well as organic acids, have been neglected for the gas–aerosol partitioning calculations. Metzger et al. (2006) found that the NH3 NH ratio (calculated by accounting for ammonium–sulfate–nitrate–sodium–chloride–water system (updated EQSAM2 parameterisation considering mineral elements and organic acids)) was 15 % higher than that calculated from the parameterisation similar to EQSAM. Ammonia has a stronger affinity towards the neutralisation of sulfuric acid (H2SO4) than nitric acid (HNO3), whereas the formation of ammonium chloride (NH4Cl(s) or (aq)) in atmosphere is unstable and can dissociate reversibly to NH3 and HCl. These aerosols in both dry and aqueous phase evaporate faster than the corresponding ammonium nitrate (NH4NO3) aerosols (Seinfeld and Pandis, 2012). In the current modelling setup, NH3 NH partitioning is mainly controlled by sulfate and subsequently by nitrate. A recent study (Acharja et al., 2020) based on the analysis of water-soluble inorganic chemical ions of PM1, PM2.5 and atmospheric trace gases over the IGP revealed that NH was one of the dominant ions and collectively with Cl−, NO and SO constituted more than 95 % of the measured ionic mass in both PM1 and PM2.5. Remaining ionic species (i.e. Na+, K+, Ca2+ and Mg2+) formed constituted only about 3 % of the total measured ions. Although major mineral cations (i.e. Na+, K+, Ca2+ and Mg2+) contribute actively to the neutralisation reaction, but their concentration in the IGP was found to be very low. Also over the NCP, mineral cations contributed less than 5 % in both PM1 and PM2.5 (Dao et al., 2014). Furthermore, a recent study by Xu et al. (2017) over East Asia revealed that NH was the predominant neutralising cation with the highest neutralisation factor (NF) (above 1), whereas Na+, K+, Ca2+ and Mg2+ had relatively low contributions (below 0.2). Therefore, consideration of mineral cations and organic acids in the NH3 NH partitioning might be limited and will not have a significant impact on the results of this study.
2.2 Emission inventory (HTAP-v2)
The HTAP-v2 bottom-up database is used in this study as an input for anthropogenic emissions of NH3 for the year 2010 (Janssens-Maenhout et al., 2015). The HTAP-v2 dataset is embedded with the activity data as per harmonised emission factors, international standards and gridded emissions with global proxy data. It includes important point sources providing high spatial resolution and emission grid maps with global coverage. This dataset consists of monthly mean NH3 emission maps with grid resolution for the year 2010. The HTAP-v2 dataset is compiled using various regional gridded emission inventories by the Environmental Protection Agency (EPA) for the United States, Environment Canada for Canada, the European Monitoring Evaluation Programme (EMEP) and the Netherlands Organisation for Applied Scientific Research for Europe and Model Intercomparison Study for Asia (MICS Asia) for China, India and other Asian countries. The Emission Database for Global Atmospheric Research (EDGARv4.3) is used for the rest of the world (mainly South America, Africa, Russia and Oceania). The MICS Asia dataset incorporated into the HTAP-v2 dataset includes an anthropogenic emission inventory developed in 2010 (Li et al., 2015), which incorporates several local emission inventories, including the Multi-resolution Emission Inventory for China (MEIC), the NH3 emission inventory from Peking University (Huang et al., 2012) and the Regional Emission inventory in ASia version 2.1 (REAS2.1) (Kurokawa et al., 2013) for areas where local emission data are not available. A detailed description of HTAP-v2 datasets can be found in Janssens-Maenhout et al. (2015).
For this study, we used emissions from five important sectors, such as agricultural, residential (heating/cooling of buildings and equipment/lighting of buildings and waste treatment), energy (power industry), transport (ground transport) and industries (manufacturing, mining, metal, cement, chemical, solvent industry) for the year 2010. Aircraft and international shipping are not considered for NH3 emissions in the HTAP-v2 bottom-up database. These emissions also include natural emissions such as soil from the Community Earth System Model (CESM) and biomass burning from the Global Fire Emission Database (GFED-v3) (Randerson et al., 2013). All these emissions are re-gridded to to match the model resolution.
The spatial distribution of the total NH3 emissions over Asian region is shown in Fig. 1. It shows the highest emissions over both South and East Asia, especially over the IGP and NCP region (shown with the black box in Fig. 1). The agricultural sector is the main contributor to NH3 emissions, including management of manure and agricultural soils (application of nitrogen fertilisers, including animal waste). It also includes emissions from livestock and crop cultivation, excluding emissions from agricultural waste burning and savannah burning (Janssens-Maenhout et al., 2015). Minor contributions from the residential sector are also observed for the Asian countries due to biomass combustion and coal burning, which are also included in the emissions. Spatial proxies such as population density, road networks and land use information have been used to allocate the area of emission sources. For the REAS2 emission inventory over India, the agricultural sector follows the spatial proxy of the total population (Li et al., 2017). The use of this approach is expected to be the main source of spatial uncertainty in the estimated NH3 emissions to the extent that total human population is only approximately correlated with the spatial distribution of fertiliser use and livestock numbers. Seasonal variation of average NH3 emission over the IGP and NCP region for anthropogenic (HTAP-v2), biomass burning (GFED-v3) and soil emission (CESM) is shown in Fig. 2. Anthropogenic NH3 emissions do not show any strong seasonal variability over the IGP region; however, over the NCP region, NH3 emissions show strong seasonality with peak emissions during May–September. It can be seen that the magnitude of peak emissions is 2 times more over the NCP region than the IGP region. On the other hand, seasonality in biomass burning NH3 emissions is strong over the IGP region, which shows the highest emissions in the spring season (MAM). Also, contribution of NH3 emissions from the IGP region is significantly higher compared to the NCP region during peak burning season, but the magnitude of biomass burning emission is 6 times lower compared to the magnitude of anthropogenic emissions.
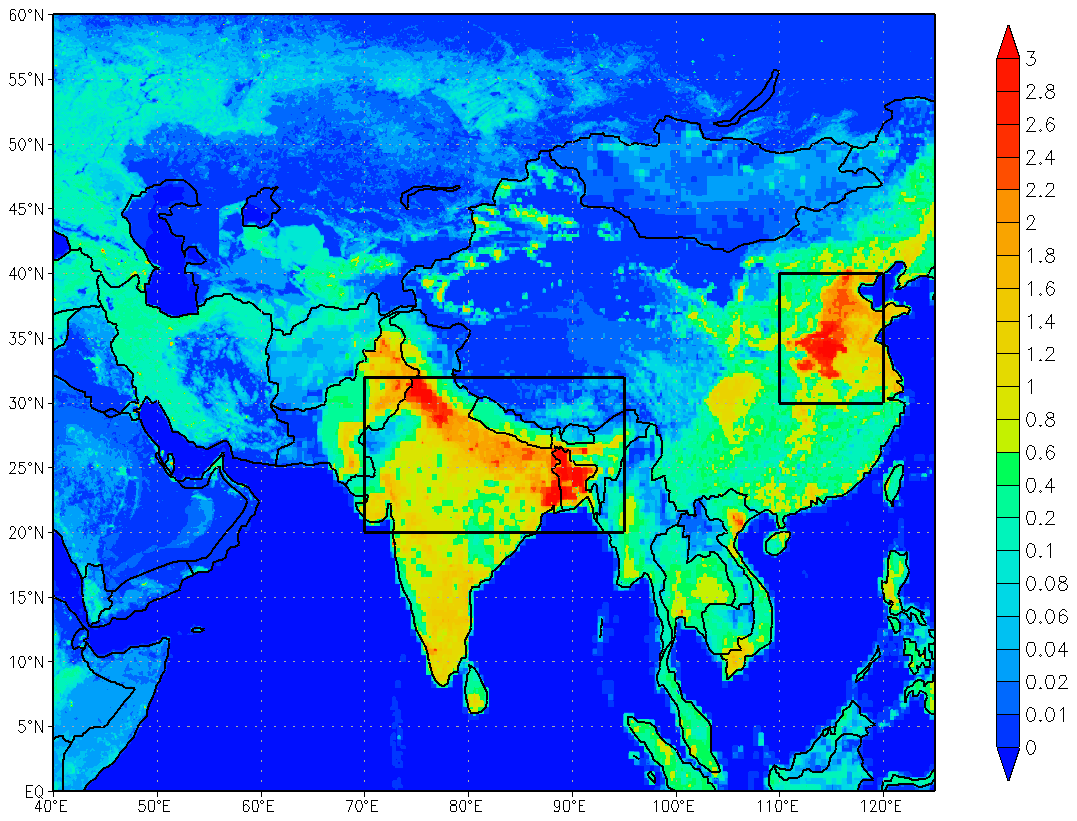
Figure 1Spatial distribution of total NH3 emissions ( kg m−2 s−1) over Asia. Data are shown at grid resolution from the Hemispheric Transport of Air Pollution version 2 (HTAP-v2) emission inventory. The solid rectangles indicate the Indo-Gangetic Plain (IGP; 20–32∘ N, 70–95∘ E) and the North China Plain (NCP; 30–40∘ N, 110–120∘ E).
2.3 Satellite NH3 observations
The NH3 total column data used in this study are derived from the IASI space-borne remote sensing instrument on board MetOp-A, which was launched in 2006 in a polar sun-synchronous orbit. The IASI operates in the thermal infrared spectral range (645–2760 cm−1) with a mean local solar overpass time of 09:30 and 21:30 (Clerbaux et al., 2009). It covers the globe twice a day, and each observation is composed of 4 pixels with a circular footprint of 12 km diameter at nadir and an elliptical footprint at the end of the swath (20×39 km). IASI is a suitable tool for evaluation of regional and global models due to its relatively high spatial and temporal sampling, and retrieval algorithms have been continuously improved (Whitburn et al., 2016). The NH3 total column retrievals show satisfactory agreement with monthly averaged integrated ground-based measurements with Fourier-transform infrared (FTIR) column data (Van Damme et al., 2015a). IASI measurements are also found to be consistent with other NH3 satellite products (Clarisse et al., 2010; Someya et al., 2020; Viatte et al., 2020). In the present study, we have used the ANNI-NH3-v2.2R-I dataset for the year 2010, which relies on ECMWF ERA-Interim meteorological input data, along with surface temperature retrieved from a dedicated network (Van Damme et al., 2017). An improved retrieval scheme for IASI spectra relies on the calculation of a dimensionless hyperspectral range index, which is successively converted to the total column and allows for a better identification of weak point sources of atmospheric NH3 (Van Damme et al., 2017; Whitburn et al., 2016). More details about the IASI satellite and the NH3 data product are given in Clerbaux et al. (2009), Van Damme et al. (2017) and Whitburn et al. (2016). We have considered the daily NH3 cloud-free satellite total column data and compared them with the modelled daily NH3 total column averaging paired observations across the months, seasons and year. We have used only morning overpasses at 09:30 measurements, as the relative errors due to the lower thermal contrast are larger for the night-time measurements (21:30 overpass). For consistency with satellite retrievals, first the model output (11:30 LT) at each day close to satellite overpass time (09:30 LT) is interpolated in space to the location of valid satellite retrievals. Since the IASI retrieval algorithm only provides total columns, in the second step, we made an unweighted average distribution of the daily paired data to obtain a monthly, seasonal and annual mean value of satellite and model total NH3 columns at each horizontal resolution of the model ().
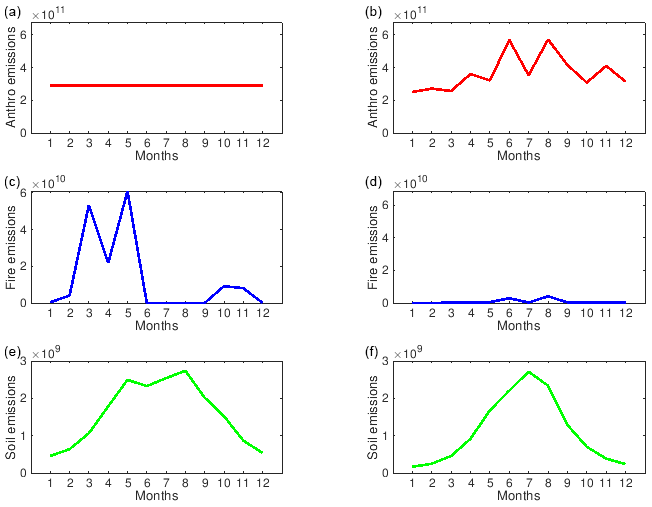
Figure 2Monthly variation of anthropogenic (HTAP-v2) (molecules cm−2 s−1) (a, b), biomass burning (GFED-v3) (molecules cm−2 s−1) (c, d) and soil (CESM) (molecules cm−2 s−1) (e, f) NH3 emissions averaged from the Indo-Gangetic Plain (20–32∘ N, 70–95∘ E) and the North China Plain (30–40∘ N, 110–120∘ E).
2.4 Ground-based observations
To evaluate the model's performance in South Asia, we used hourly NH3 measurements from the air quality monitoring station (AQMS) network operated by the Central Pollution Control Board (CPCB) across India. The CPCB follows a national programme for sampling of ambient air quality as well as weather parameter measurements. An automatic analyser (continuous) method is adopted at each monitoring location. NH3 is measured by the chemiluminescence method as NOx following the oxidation of NH3 to NOx. In this approach, NH3 is determined from the difference between NOx concentration with and without inclusion of NH3 oxidation (CPCB, 2011). The quality assurance and control process followed for these air quality monitoring instruments is given by the CPCB (2014, 2020). Surface observations of NH3 are taken from 69 different stations in South Asia. Most of the NH3 monitoring stations from India used in the current study are situated in the cities representing the urban environment. Sampling of ambient NH3 is done through a sampling inlet of 1 m above the roof top of the AQMS container with a height of 2.5 m (Technical specifications for CAAQM station, 2019). The details of these monitoring locations are given in Table S1 (in the Supplement), and the geographical locations are shown in Fig. 3. Out of these stations, 35 locations in Delhi, six in Bangalore, four in Hyderabad and two in Jaipur are averaged to get a single value for the same geographical location, and the remaining 22 locations are considered independently, representing 26 respective cities. Hourly NH3 concentrations (in µg m−3) used in the study are for the duration of 2016 to 2019. The quality control and assurance method, followed by the Central Pollution Control Board (CPCB) for these air quality monitoring stations, is given in the CPCB (2011, 2020). The calibration procedures for the NH3 analyser conform to United States Environmental Protection Agency (USEPA) methodologies and include daily calibration checks, biweekly precision checks and linearity checks every 6 weeks. All analysers undergo full calibration every 6 weeks. For details on the calibration procedure, refer to Technical specifications for CAAQM station (2019) and CPCB (2020). Furthermore, we take the following steps to assure the quality of NH3 observations from the CPCB network stations. For data quality, we rejected all the observations values below the lowest detection limit of the instrument (1 µg m−3) (Technical specifications for CAAQM station, 2019) because most of the sites are situated in the urban environment. For cities where more than one monitoring station is available, we rejected all the observations above 250 µg m−3 at a given site if other sites in the network do not show values outside this range. This step aims to eliminate any short-term local influence that cannot be captured in the models and to retain the regional-scale variability. Second, we removed single peaks characterised by a change of more than 100 µg m−3 in just 1 h for all the data in CPCB monitoring stations. This step filters random fluctuations in the observations. Third, we removed some very high NH3 values that appeared in the time series right after the missing values. For any given day, we removed the sites from the consideration that either experience instrument malfunction or appear to be very heavily influenced by strong local sources. In order to verify the data quality of the CPCB monitoring site, we have inter-compared the NH3 measurement at the CPCB monitoring station (R.K. Puram) in Delhi with the NH3 measurements at Indira Gandhi International (IGI) Airport taken during Winter Fog Experiment (WiFEX) (Ghude et al., 2017) using the Measurement of Aerosols and Gases (MARGA) instrument during the winter season of 2017–2018. More details on the NH3 measurements using MARGA are available in Acharja et al. (2020). Both sites were situated in the same area of Delhi (less than 1 km apart). Our inter-comparison shows that NH3 measured at the CPCB monitoring station using the chemiluminescence method are slightly (on an average 9.8 µg m−3) on the higher side compared to NH3 measured by ion chromatography (IC) using MARGA (Fig. S1 in the Supplement). The differences that were observed could partly be related to the different NH3 measurement techniques and partly to the locations of the two monitoring sites, which were not at exactly the same location. Evidently, the difference of 9.8 µg m−3 indicates that the NH3 measurements from the CPCB do not suffer from the calibration issue. However, rigorous validation is required in the future with more datasets. Given the presence of relatively high NOx concentrations, especially at urban locations, it is recognised that the measurement of NH3 by difference (i.e. between NOx and NOx plus oxidised NH3) is a potentially significant source of uncertainty. Future measurement inter-comparisons are planned (rescheduled from 2020 to 2021 because of COVID-19) to allow the chemiluminescence method as used in the Indian network to be compared with a range of other NH3 measurement methods (Móring et al., 2021; the Global Challenges Research Fund (GCRF).
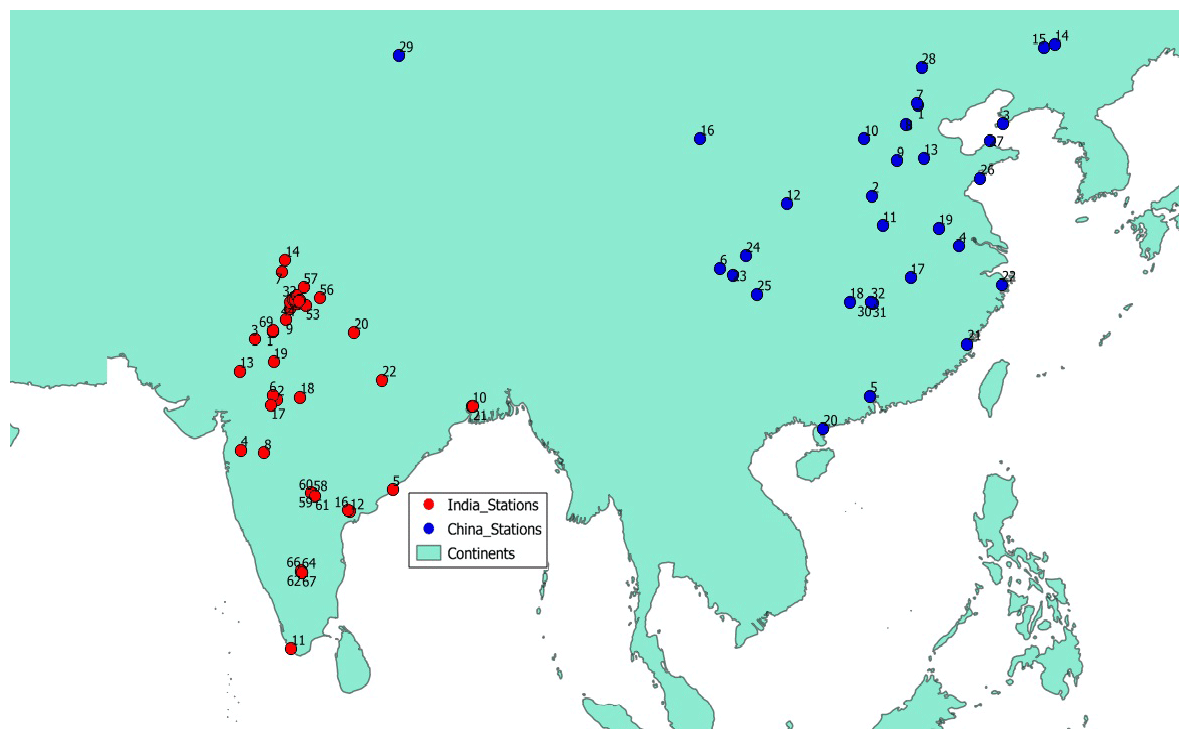
Figure 3Geographical locations of surface NH3 observational sites (69 locations) from the air quality automatic monitoring network operated by the Central Pollution Control Board (CPCB, 2020), India, and observational sites (32 locations) from the Nationwide Nitrogen Deposition Monitoring Network (NNDMN) operated by China Agricultural University, China.
To further evaluate the model's performance over East Asia, we used monthly mean NH3 measurements from the 32 stations of the Nationwide Nitrogen Deposition Monitoring Network (NNDMN) of China, operated by China Agricultural University. The details of these monitoring locations are given in Table S2 (in the Supplement), and the geographical locations are shown in Fig. 3. Monthly mean NH3 concentrations (in µg m−3) used in the study are for the duration of 2010 to 2015. Ambient concentrations of gaseous NH3 were measured using an active Denuder for Long-Term Atmospheric sampling (DELTA) system. More detail about the data product is given by Xu et al. (2019). To compare the model with the observation, simulated NH3 from the model is compared with the surface-based observations by using bilinear interpolation of model output to the geographical location and elevation of the observational sites.
3.1 Annual mean NH3 total columns over South Asia
Yearly averaged 2010 distribution of NH3 total columns over Asia simulated by MOZART-4 model and also retrieved with IASI instrument is shown in Fig. 4a and b. The total NH3 columns simulated by the model show higher tropospheric vertical column densities (TVCDs) of about 0.5–7×10¹⁶ molecules cm−2 over the IGP region of India compared to any other regions of Asia. This to an extent justifies the larger range of NH3 column values for the South Asian model domain, with both more polluted and cleaner conditions. These high TVCDs values coincide with the high nitrogen fertiliser and livestock numbers, as scaled according to human population density in Fig. 1.
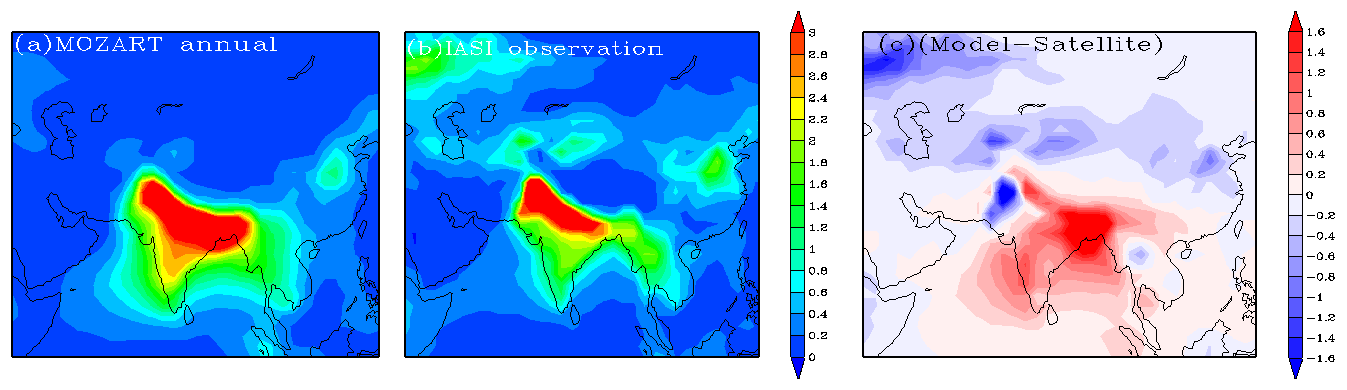
Figure 4Spatial distributions of annual mean NH3 (×1016 molecules cm−2) total columns over Asia for the year 2010. (a) Simulated by MOZART-4, (b) from the IASI satellite observations and (c) spatial difference between MOZART-4 and IASI.
Spatial differences between model-simulated data and satellite data for NH3 total column distribution are shown in Fig. 4c. On a quantitative level, the MOZART-4 model is found to overestimate the NH3 total column compared with IASI by 1–4×10¹⁶ molecules cm−2 over South Asia, especially over north-east India and Bangladesh. Conversely, the MOZART-4 model underestimates NH3 in comparison with IASI over the arid region of north-western India (state of Rajasthan adjacent to Pakistan) and centring on Pakistan. There are several possible reasons for the spatial differences shown in Fig. 4c, including (a) uncertainties in the mapped NH3 emissions data (e.g. between Afghanistan, Bangladesh, India and Pakistan, due to different relationships between human population and livestock/fertiliser activities); (b) uncertainties related to turbulent mixing and dispersion (this may affect both the simulations in MOZART-4 and the assumed vertical profiles for the IASI retrievals); and (c) uncertainties related to precipitation scavenging of ammonia and ammonium, noting that the eastern part of the IGP is substantially wetter than the western part.
According to Fig. 1, the magnitude of NH3 emissions over the NCP is similar to the IGP. By contrast, much smaller TVCDs of the NH3 columns are estimated by MOZART-4 and IASI over the NCP compared with the IGP. The MOZART-4 and IASI estimates are found to be in close agreement, with slightly smaller values estimated by MOZART-4. The possible reasons for the difference in NH3 concentrations in the IGP and the NCP are discussed in Sect. 3.4. The relationship between modelled and IASI-retrieved NH3 total columns is further analysed in terms of scatter plots in Fig. 5a and b, over the IGP region of South Asia (20–32∘ N, 70–95∘ E) and the NCP region of East Asia (30–40∘ N, 110–120∘ E) (rectangular areas shown in Fig. 1). Correlation coefficients (r) between model- and satellite-observed annual mean total columns over the IGP and the NCP are found to be 0.81 and 0.90 respectively for 2010. This indicates that spatial variability in simulated NH3 by the model and satellite observation is in closer agreement, both over the IGP and the NCP region. The model-simulated annual mean total NH3 columns give larger values over the IGP region (normalised mean bias (NMB) = 38 %) as well as over the entire South Asia region (NMB = 44 %), whereas over the NCP region (NMB = −35 %) and the entire East Asia region (NMB = −32 %), the model gives values which are smaller than IASI. Other statistical indicators are summarised in Table 1. Larger estimates of NH3 columns from an atmospheric chemistry transport model (CTM) compared with IASI were also found in an earlier study for South Asia (Clarisse et al., 2009).
Table 1Model performance statistics for NH3 total columns over Asia from IASI and MOZART-4 simulations for the year 2010.
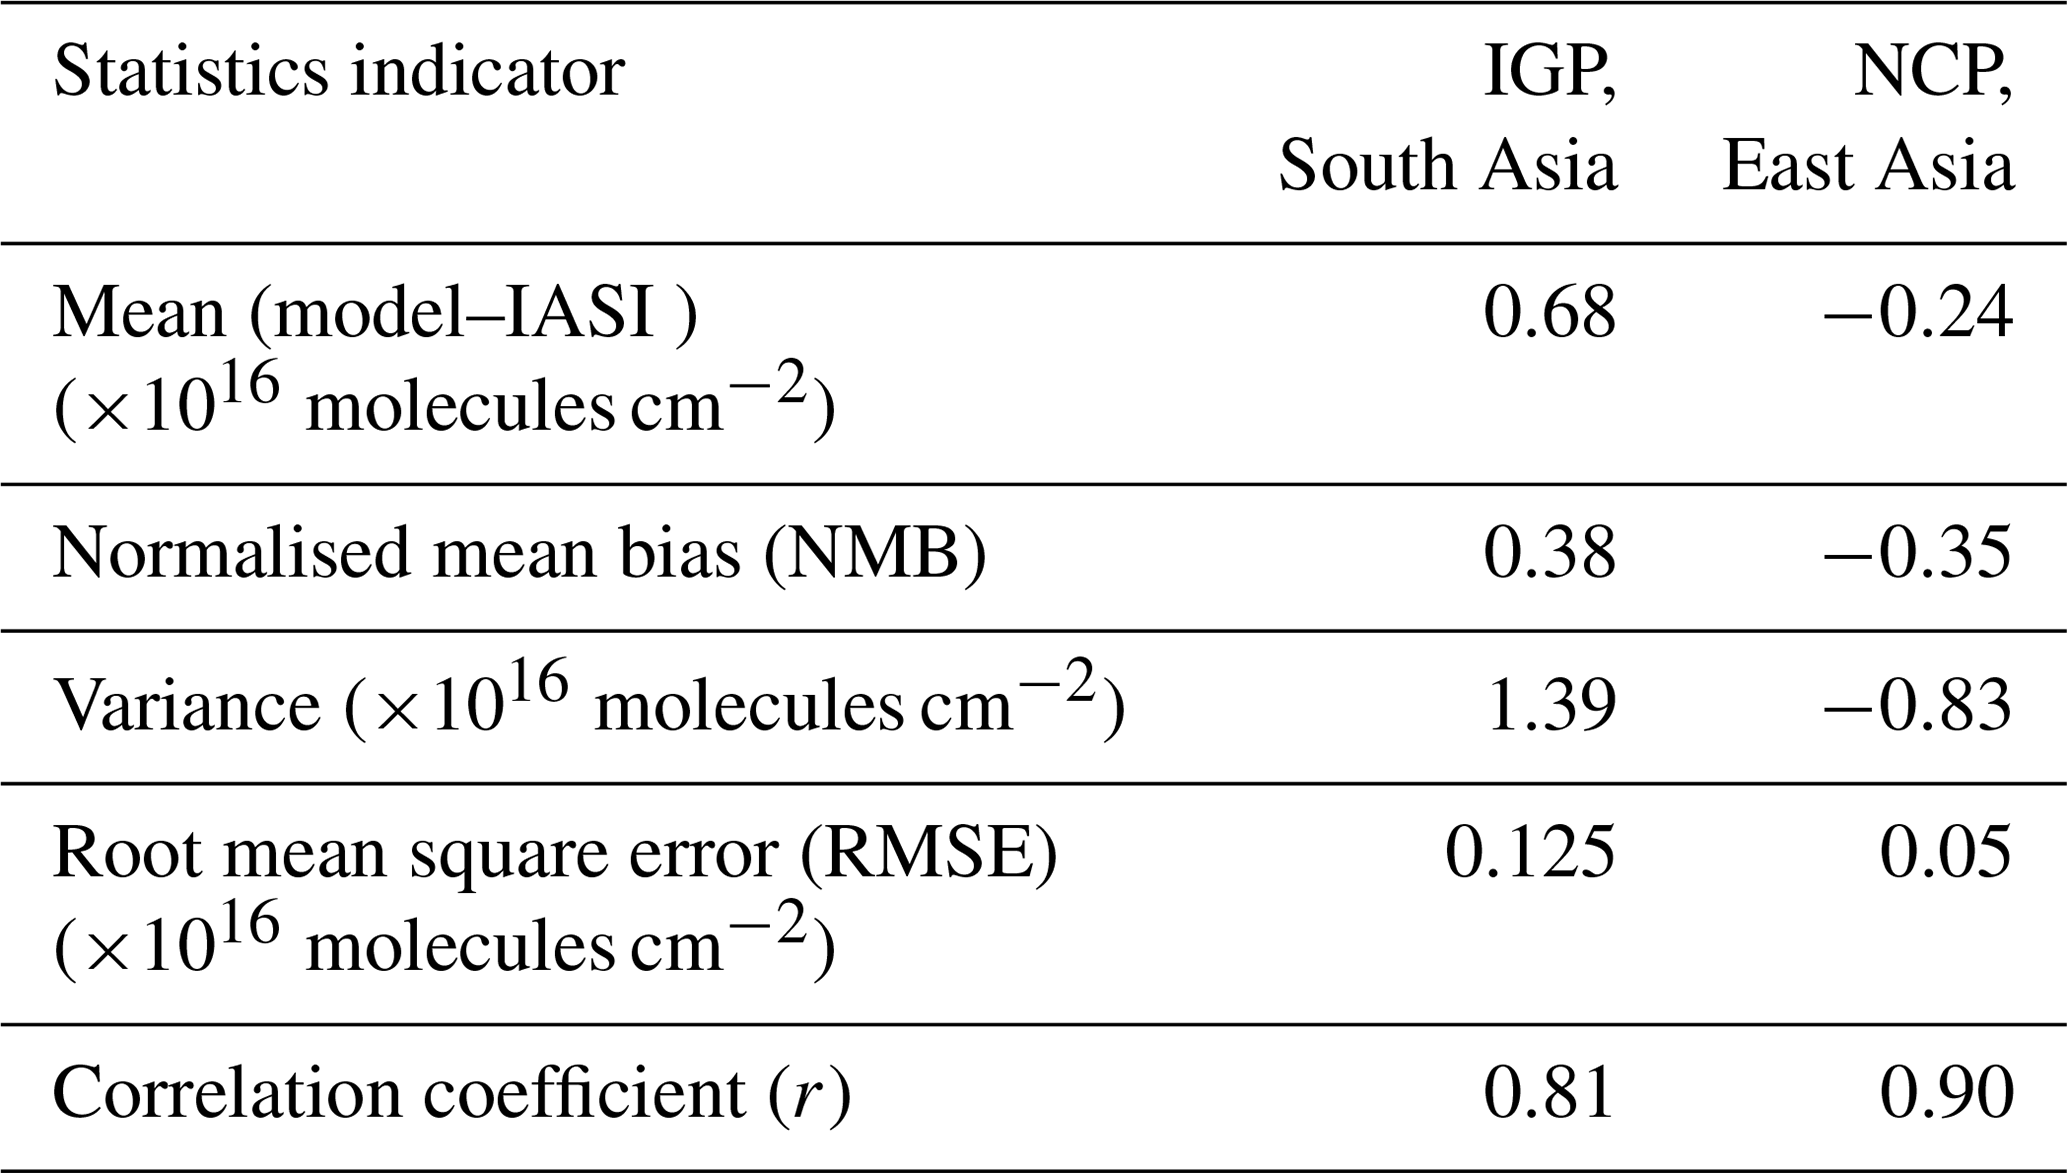
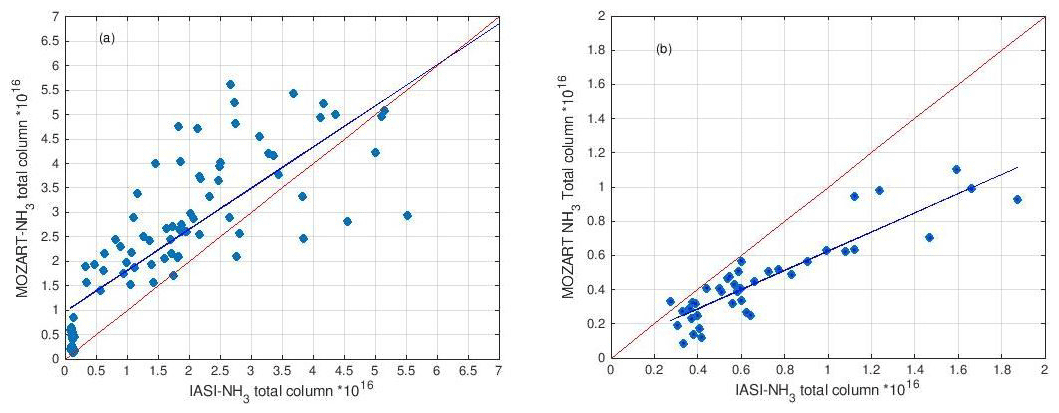
Figure 5(a) Scatter plot between annual averaged IASI- and MOZART-4-simulated NH3 (×1016 molecules cm−2) total columns over the IGP, South Asia (rectangle: 20—32∘ N, 70–95∘ E) and (b) scatter plot between annual averaged IASI- and MOZART-4-simulated NH3 (×1016 molecules cm−2) total columns over the NCP, East Asia (rectangle: 30–40∘ N, 110–120∘ E).
The overall higher value of the model-simulated NH3 over South Asia compared with IASI could be due to the combination of the uncertainties in both approaches. This includes uncertainties in emissions from the HTAP-v2 datasets used for the model simulations, inaccurate modelling of the chemistry in MOZART-4, errors in dry and wet deposition schemes used in the model and biases inherent to infrared satellite remote sensing. For IASI, firstly, only cloud-free satellite scenes are processed, which could result in missing some of the NH3 values during cloudy periods and biomass burning events. Secondly, NH3 vertical columns retrieved from the IASI observations are actually sampled around 09:30 local time, while the MOZART-4-simulated model output close to overpass time (11:30 LTC) was used. Finally, the retrieval of NH3 from infrared satellites is sensitive to inaccuracies in the temperature profile, and biases in the IASI L2 temperature profiles can result in biases in the retrieved NH3 (Whitburn et al., 2016). The HTAP-v2 dataset uses proxy values for agricultural activities (i.e. distributed by human population) instead of actual values for field fertiliser application and livestock excretion over South Asia. This could also result in additional uncertainty of NH3 emissions from agricultural activities. Further work is ongoing to integrate NH3 emissions inventories for different countries in South Asia based on national datasets, which should allow the emission-related uncertainties to be reduced in future. Similarly, slight underestimation over East Asia might originate from the country-specific emission inventory used for China (Huang et al., 2012) in the MOSAIC HTAP-v2 emission inventory and the limitations discussed above. The application of any equilibrium model (EQM) in global atmospheric studies is associated with considerable uncertainties. In MOZART-4 chemistry, the ammonium nitrate distribution is determined from NH3 emissions and the parameterisation of gas–aerosol partitioning by Metzger et al. (2002), based on the level of sulfate present. The emission fluxes of SO2 and NOx in the HTAP-v2 dataset also have large uncertainties over the IGP (Jena et al., 2015b; Wang et al., 2020), which can introduce additional uncertainty in NH3 NH gas–aerosol partitioning. In MOZART-4 chemistry, uncertainty can also be associated with the dry and wet deposition scheme, which can result in overestimation (Emmons et al., 2010).
3.2 Seasonal variability of NH3 total columns
Figure 6 shows the model (left) and IASI satellite (middle) seasonal distributions of NH3 total columns over Asia. These seasons are represented as 3-month periods: winter, December–January–February (DJF, first row); spring, March–April–May (MAM, second row); summer, June–July–August (JJA, third row); and autumn, September–October–November (SON, fourth row). It can be seen in Fig. 6 that there is larger seasonal variation in IASI NH3 total columns, while MOZART-4 presents limited seasonality in South Asia compared to better seasonal variation estimated in East Asia, as shown by both IASI and the MOZART-4 model. In general, during autumn, spring, summer and winter seasons, MOZART-4 shows higher NH3 total columns compared with IASI estimates over most of South Asia. However, this difference is more pronounced during autumn (SON) and winter (DJF) seasons (Fig. 6 right). We have seen that (Fig. 2) anthropogenic emission of NH3 is nearly the same in all months, and biomass burning has a peak during MAM over South Asia in the MOZART-4 model, whereas seasonality is better represented in NH3 emission for East Asia.
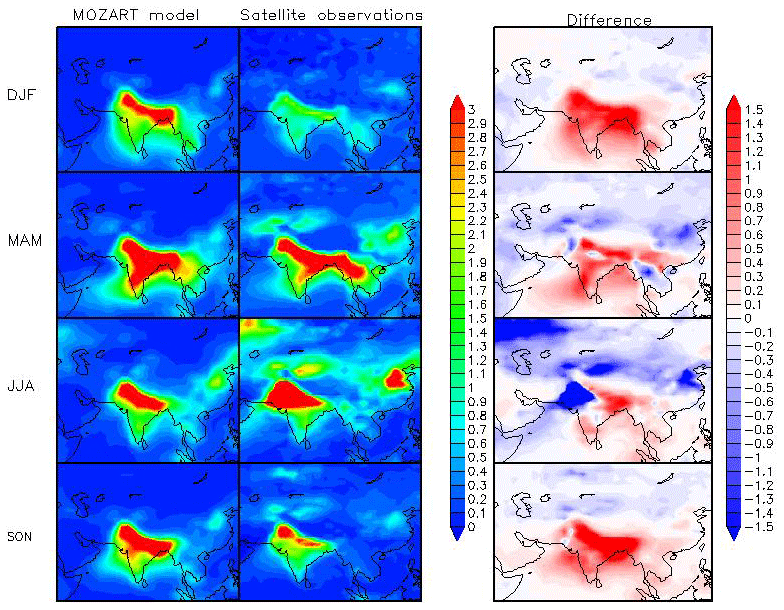
Figure 6Seasonal NH3 total column distribution (×1016 molecules cm−2) in 2010 simulated by MOZART-4 (left) and measured by the IASI satellite (middle). On the right, spatial differences between MOZART-4 and IASI during (top to bottom) winter (DJF), spring (MAM), summer (JJA) and autumn (SON) seasons are shown.
Major drivers in anthropogenic NH3 seasonal variation include differences in management and timing of fertiliser, which are not well represented in the emission over South Asia (Janssens-Maenhout et al., 2012). This can be expected to have a direct effect on NH3 total columns over South Asia. It is recognised that NH3 emission can be strongly affected by both short-term meteorological variation and longer term climatic differences (Sutton et al., 2013). This means that NH3 emissions may be expected to increase in warm summer conditions than in winter (Battye and Barrows, 2004). However, the magnitude of these emissions is expected to be smaller in comparison with anthropogenic emissions and may not contribute significantly to larger summertime NH3 columns observed from IASI retrievals over South Asia and East Asia than MOZART-4. Additional drivers in NH3 seasonal variation include meteorological variation. For example, strong subsidence, lower temperature and lighter winds over South Asia in the autumn and winter months prevent venting of low-altitude pollution to the higher altitudes. This means that emitted air pollutants tend to accumulate close to the source region in wintertime conditions (Ghude et al., 2010, 2011). Considering the comparison of IGP with NCP, accumulation of pollutants in the boundary layer is more pronounced over the IGP region due to flat land topography, and it is higher during winter than the autumn months (Surendran et al., 2016). We saw that simulated mean planetary boundary layer height (PBLH) is lower (approximately 400 m; Fig. S2 in the Supplement), and winds are lighter in winter months, compared to summer months, over South Asia, and particularly over the IGP region (Surendran et al., 2016). Figure 7a and b show the time–height distribution of NH3 and mean PBLH averaged over the IGP region, respectively. It can be seen that during winter months higher atmospheric stability prevents mixing of boundary layer NH3 to the free troposphere over the IGP (Fig. 7a), which is reflected in the higher wintertime values of MOZART-4 NH3 columns. Similarly, a higher NH3 NH ratio (Fig. S3 in the Supplement) and lower dry and wet deposition (Figs. S4 and S5 in the Supplement) of NH3 over the IGP in winter months enhances the accumulation of NH3 in the boundary layer compared to summer months. On the other hand, much less NH3 gets detected by the satellite at the higher altitudes, where detection sensitivity of the satellite is higher than that at the surface (Clarisse et al., 2010). The limited sensitivity of IASI measurements to detect boundary layer NH3 (Van Damme et al., 2014a) could be one of the reasons for large differences (1–4×10¹⁶ molecules cm−2) between MOZART-4 and IASI in winter seasons. Also, the sowing of wheat crops over the IGP involves a higher rate of fertiliser application during peak winter months (Sharma et al., 2014a) that releases a significant quantity of NH3 into the atmosphere. However, this seasonality is largely missing in the emissions (Fig. 2a), indicating that higher MOZART-4 NH3 is largely driven by the wintertime meteorology over this region.
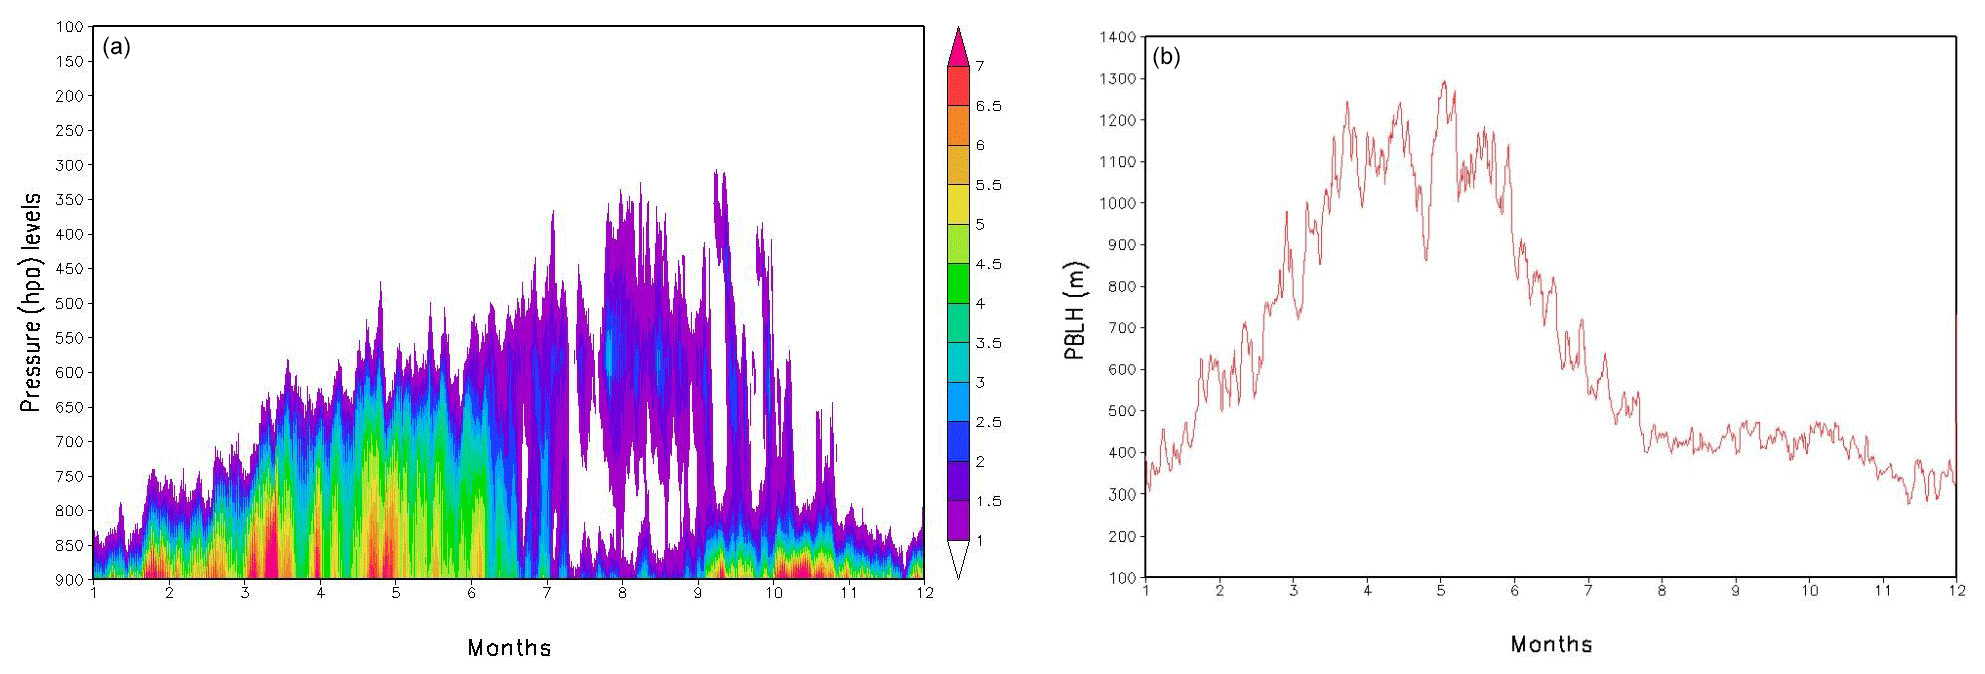
Figure 7(a) Daily vertical distribution of NH3 (ppb) averaged over the IGP, South Asia (20–32∘ N, 70–95∘ E) and (b) daily mean planetary boundary layer height (PBLH in metres) averaged over the IGP, South Asia (20–32∘ N, 70–95∘ E).
It is interesting to note from Fig. 6 (right) that during spring the difference between modelled and observed column NH3 is smaller over the IGP region compared with the winter season. Heating of the land mass due to large solar incidence suppresses the wintertime subsidence over the IGP and leads to a deeper boundary layer during spring and early summer. It can be seen that (Fig. 7b and Fig. S2 in the Supplement) the average PBLH is about 1100 m and 600 m deeper during spring and summer compared to winter over the IGP. During this season, significant transport of the boundary layer pollution in the mid-troposphere and upper troposphere due to enhanced convective activities and large-scale vertical motion can be noticed in Fig. 7a and is consistent with the earlier studies over this region (Lal et al., 2014; Surendran et al., 2016). Vertical motion associated with the convective activities is expected to redistribute the NH3 concentration in the column, which leads to more NH3 at higher altitudes, where detection sensitivity of the satellite is higher than that at the surface (Clarisse et al., 2010). As a result, more NH3 gets detected by the satellite and we see less difference between observations and the model over the IGP. This may also partly explain the higher IASI estimates of the NH3 column for summertime prior to the monsoon season. However, this hypothesis needs to be tested with higher sensitivity experiments as part of future work. During the spring season, MOZART-4 reflects a widespread NH3 total column from the entire Indian land mass, and IASI observations do capture the increase in the NH3 total column, at least for the seasonal mean cycle (Fig. 8a). This seasonal maximum in the NH3 total column identified both in IASI and MOZART-4 over South Asia can be explained by two factors: the meteorology factor and biomass burning emissions. Volatilisation of NH3 is enhanced with an increase in temperature (Sutton et al., 2013); hence higher temperatures during these drier periods over the IGP partly enhance NH3 emission to the environment, which is also evident from the soil NH3 emissions in Fig. 2e and f. However, the magnitude of these emissions is expected to be smaller in comparison with anthropogenic emissions. In the Indian region, emissions from biomass burning (crop residue burning) peak in March to May (Jena et al., 2015a), and emission of NH3 from biomass burning is at a maximum during this period (Fig. 2c and d). However, MOZART-4 estimates smaller NH3 total columns compared with IASI over Myanmar, Laos and Thailand during the period March–May (Fig. 6 right). This period is estimated to be associated with large-scale forest fires (and open crop burning) (Chan, 2017; Wu et al., 2018; Zheng et al., 2017), the effect of which appears to be underestimated in the MOZART-4 simulations. This suggests that the Global Fire Emissions Database (GFED-v3) underestimates the fire emissions over this region, agreeing with Zhang et al. (2020) and Huang et al. (2013). During the monsoon (JJA) (Fig. 6 right) and spring (MAM) season, IASI NH3 total columns are larger than the MOZART-4 estimates over the north-western arid region of South Asia, where monsoon rainfall is lowest (less than 30 cm). On the other hand, NH3 columns estimated by IASI are lower in the north-western IGP than the MOZART-4 simulations.
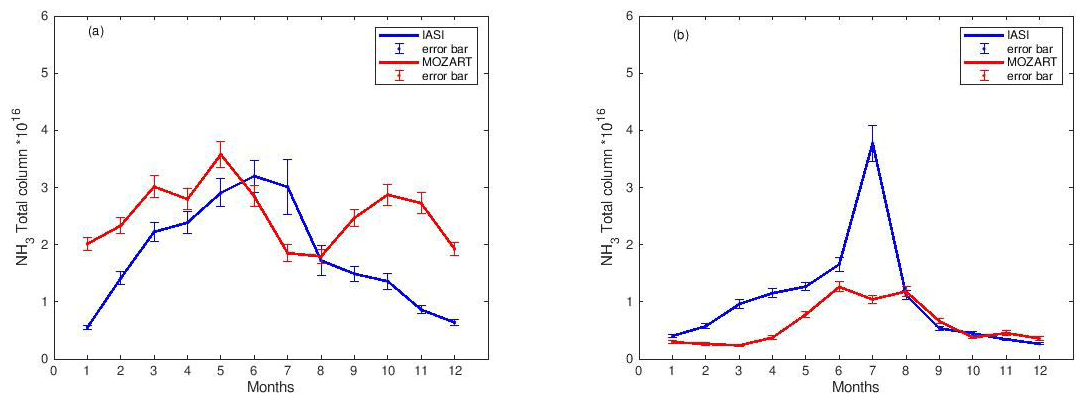
Figure 8(a) Comparison between monthly averaged IASI- and MOZART-4-simulated NH3 (×1016 molecules cm−2) total columns over the IGP, South Asia (20–32∘ N, 70–95∘ E). (b) Comparison of monthly averaged IASI- and MOZART-4-simulated NH3 (×1016 molecules cm−2) total columns over the NCP, East Asia (30–40∘ N, 110–120∘ E) (bar indicates standard error of 88 and 35 pixels in the IGP and the NCP respectively).
Figure 8 shows the comparison between IASI and modelled monthly time series of NH3 total columns over the IGP (20–32∘ N, 70–95∘ E) and the NCP (30–40∘ N, 110–120∘ E), respectively (rectangular areas shown in Fig. 1). We found a better consistency between modelled and measured seasonal NH3 total column over the NCP than the IGP. Monthly NH3 columns over the IGP show bimodal distribution in the model. However, IASI does not show such bimodal variation. Seasonal statistics show large normalised mean bias (38 %) and poor correlation (r=0.41) between the model and IASI. The bimodal distribution in NH3 total columns is partly driven by the biomass burning emissions, which show a major peak in spring and another small peak in autumn (Fig. 2c and d), and partly by the meteorology, as discussed in the previous section. During monsoon months (JJA), when the whole of South Asia receives significant rainfall, model simulations present lower NH3 total columns, which is not seen in the IASI observations or in the surface observations (Figs. 8a and 9b) over the IGP. The reason for this discrepancy may be related to the flat NH3 emission over South Asia (Fig. 2). Usually a large amount of fertilisation application is expected during the warm months of June and July in the IGP, which is not represented in the HTAP-v2 emissions, and therefore lower values in the model during monsoon months are mostly driven by the model meteorology. Lower values observed during the monsoon season in general are attributed to increased wet scavenging of NH3 due to monsoon rain (Fig. S5 left in the Supplement) and influx of cleaner marine air from the Bay of Bengal and Arabian Sea through south-easterly and south-westerly wind (Ghude et al., 2008). On the other hand, monthly variation in IASI NH3 total columns over East Asia is found to be captured well by the model (Fig. 8b) and seems to follow the variation observed in the anthropogenic NH3 emission (Fig. 2), except for the month of July where IASI estimates substantially higher NH3 total columns than the model. The reason for this peak in the IASI data for July may be related to urea fertiliser application in warm July conditions (see temporal course of the enhanced vegetation index; Li et al., 2014), which seems not to be represented well in the HTAP-v2 emissions. The overall statistics show slight good correlation (r=0.61) between observed and simulated NH3 columns and negative normalised mean bias (NMB %).

Figure 9(a) Scatter plot between annual averaged surface observations from 69 monitoring sites (Fig. 2) over South Asia and MOZART-4-simulated surface NH3 (µg m−3) (992 hPa) interpolated at the locations of 69 sites. (b) Comparison between monthly mean surface observations from 69 monitoring sites and MOZART-4-simulated monthly mean NH3 (µg m−3) concentration interpolated at the locations of 69 sites over South Asia.
3.3 Comparison between surface NH3 measurements and simulated NH3 concentrations in South and East Asia
To evaluate modelled surface NH3 concentrations in South Asia, we have used NH3 surface measurements from 69 monitoring locations over India for the years from 2016 to 2019. As 2010 data were not available, we make the hypothesis that measurement from 2016–2019 can be considered as representative of what was measured in 2010. Out of these stations, 35 locations in Delhi, six in Bangalore, four in Hyderabad and two in Jaipur are averaged to get a single value for the same geographical location, and the remaining 22 locations are considered independently, representing 26 respective cities. Due to the lack of ground-based measurements performed in 2010, the following comparison will mainly be qualitative, although it is estimated that the main spatial features of Indian agriculture and NH3 emissions will be consistent between 2010 and 2016–2019. As per the RCP8.5 scenario (Kumar et al., 2018), NH3 emission from South Asia is expected to have increased by less than 20 % from 2010 to 2020. Assuming a linear relationship between emission and surface concentration, it is expected that NH3 concentrations could be higher by about 10 %–15 % in 2016 to 2019.
It is interesting to note that the correlation between annual and monthly mean MOZART-4-simulated and surface-measured NH3 concentration (r=0.82 and r=0.62) is better than the comparison between MOZART-4 and IASI for South Asia (Fig. 9). However, MOZART-4 has systematically smaller estimated NH3 concentrations compared with the ground-based measurement network (NMB = −47 %). It should be noted that most of the monitoring stations are situated in urban regions (cities) of India and therefore represent the urban environment, which may have higher NH3 concentrations locally due to traffic and human activities (Sharma et al., 2014b). Since the MOZART-4 model is run at relatively coarse () grid resolution, the emissions may not capture the true variability in emissions at city scale. These surface NH3 sites are influenced by local emissions that are therefore not resolved by the MOZART-4 model. Therefore, when comparing coarse-scale models to observations, the model may have difficulties in resolving local-scale effects (Surendran et al., 2015). Until the planned further evaluation of the chemiluminescence monitoring method for ammonia (measured by difference with NOx) is evaluated (as noted in Sect. 2.4), it is not possible to be certain of the extent to which possible uncertainties in the measurement method contribute to the differences shown in Fig. 9b. While noting these uncertainties, it is worth noting that the ground-based NH3 observation network confirms the occurrence of higher ground-level NH3 concentrations in autumn and winter, as simulated using MOZART-4 using the HTAP-v2 emissions inventory (Fig. 9b).
Comparison of Figs. 8a and 9b shows that the time course of ground-level NH3 concentrations (as estimated by MOZART-4) is significantly different than the time course of the total NH3 column (as also estimated by MOZART-4), whereas the total column is largest in the summer (reflective of deeper atmospheric mixing and recirculation), and the ground-level concentrations are largest during winter. Although it is not easy to use the IASI data to infer ground-level NH3 concentrations, the stronger summer maximum of IASI (Fig. 8a) compared with MOZART-4 suggests that IASI would be in less close agreement with the ground-based measurement network than MOZART-4 (Fig. 9b). While recognising uncertainties in this interpretation, the key point is that large NH3 columns estimated by IASI for May–July are not reflected in the ground-based NH3 measurements from the Indian monitoring network.
Figure 10 shows the comparison between monthly mean (from 2010 to 2015 observations) NH3 surface measurements from 32 monitoring locations over China and modelled surface NH3 concentrations from the same location over East Asia. Similar to South Asia, MOZART-4 has systematically smaller estimated NH3 concentrations compared with the ground-based measurement network (NMB = −44 %) over East Asia. Figure 10b shows that maximum NH3 concentration occurred in summer (JJA), demonstrating agreement with IASI measurements. Other statistical indicators are summarised in Table 2. Furthermore, high NH3 concentration from ground-based measurements during JJA is consistent with the higher HTAP-v2 emissions (Fig. 2) (Huang et al., 2012) and higher NH4NO3 concentration (Fig. S6 in the Supplement). Higher concentration of NH4NO3 can also lead to higher NH3 concentrations, especially during summer due to its semi-volatile and unstable character at higher temperatures, as observed in East Asia. This implies that the NH3 emissions may play a vital role in determining the seasonal pattern of the ground NH3 concentrations. The summer peak may originate from fertiliser application, livestock emissions and volatilisation of NH3, which is enhanced at higher temperatures (Liu et al., 2017a).
Table 2Model performance statistics for NH3 concentration over East and South Asia from MOZART-4 simulations and the observational network for the year 2010.

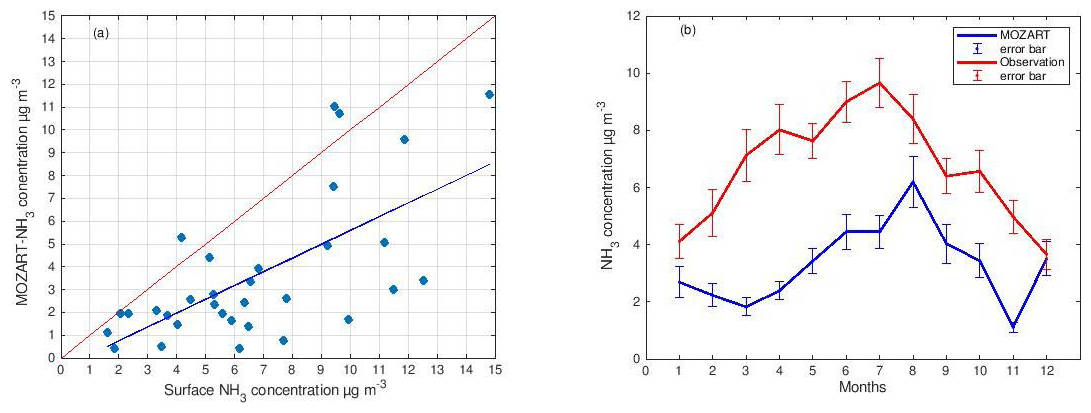
Figure 10(a) Scatter plot between annual averaged surface observations from 32 monitoring sites (Fig. 2) over East Asia and MOZART-4-simulated surface NH3 (µg m−3) (992 hPa) interpolated at the locations of 32 sites. (b) Comparison between monthly mean surface observations from 32 monitoring sites and MOZART-4-simulated monthly mean NH3 (µg m−3) concentration interpolated at the locations of 32 sites over East Asia.
3.4 Why were NH3 total columns low over high NH3 emission over East Asia compared to the high NH3 emission over South Asia?
Fine-scale details of the NH3 emissions over Asia in Figs. 1 and 2 clearly revealed larger emission values in areas where there is intensive agricultural management. This is the case especially in the NCP and the IGP (Fig. 1, shown with box). Earlier emission estimates suggest that fertiliser application and livestock contribute 2.6 Tg per year (yr−1) and 1.7 Tg yr−1 NH3 emissions respectively from South Asia (Aneja et al., 2011). Over South Asia, urea accounts for emissions of 2.5 Tg yr−1, which contributes to 95 % of the fertiliser emission and 58 % of total estimated agricultural emissions (Fertiliser Association of India Annual Report 2018–2019). For East Asia, livestock manure management accounts for approximately 54 % (5.3 Tg yr−1) of the total emissions, and fertiliser application accounts for 33 % (3.2 Tg yr−1) emissions, with 13 % of emissions from other sources. Combined, the model areas for the NCP and the IGP (as shown in Fig. 1) account for ∼45 % of the NH3 emitted from fertilisation in East Asia and South Asia (Huang et al., 2012).
We find that satellite observations show larger NH3 columns over the IGP than over similar higher emission regions of the NCP. However, in addition, we also find that the MOZART-4 model is able to capture these contrasting columnar NH3 levels between the IGP and the NCP. This indicates that the difference between the IGP and the NCP is unrelated to differences between the mosaic of emissions over South Asia and East Asia in HTAP-v2 and similarly not related to uncertainties in satellite retrievals. Instead, the analysis from MOZART-4 demonstrates that the difference can be explained by differences in atmospheric chemistry between the two regions, linked to higher SO2 and NOx emissions in the NCP than in the IGP. A recent study by Wang et al. (2020) shows that emission fluxes of SO2 and NOx over the IGP are only one-quarter of those over the NCP.
As ammonia is a highly alkaline gas with an atmospheric lifetime usually of few hours (and rarely a few days) (Dammers et al., 2019), it readily reacts with acid present in the atmosphere to form aerosols, which are eventually deposited to the earth's surface by either dry or wet deposition processes (Figs. S4 and S5 in the Supplement). In the atmosphere, ammonia therefore reacts rapidly with atmospheric sulfuric acid (H2SO4), nitric acids (HNO3) and hydrochloric acid (HCl) to contribute to ambient levels of fine particles, forming ammonium sulfate, ammonium nitrate and ammonium chloride, shown in Reactions (R1) and (R2):
In the atmosphere, the ammonium ion (NH) as an aerosol is estimated to have a lifetime of about 1–15 d (Aneja et al., 1998), though this is obviously dependent on the amount of atmospheric acids (Seinfeld and Pandis, 2012). In addition to the large fertiliser application and livestock management activities which are characteristic of both the IGP and the NCP, industrial and transportation activities are higher over the NCP (China), which also result in higher emission of NOx and SO2 over the NCP compared with the IGP (Zhao et al., 2013). Ammonia has greater affinity towards oxides of sulfur; hence it first reacts to form ammonium sulfate, and then the remaining ammonia further reacts to form ammonium nitrate (Seinfeld et al., 1998). The differences in the secondary aerosol formation over the NCP and the IGP are compared by considering the MOZART-4 model estimates of volume mixing ratio (VMR) in parts per billion (×109 ppb) of total sulfate, ammonium, ammonium nitrate at the surface and the total column of NOx (Fig. 11). Although vertical profiles of the aerosol components are small, there are strong vertical gradients in NOx concentrations, and for this reason we consider the comparison with the total NOx column more reflective of overall NOx chemistry than the ground-level NOx VMR.
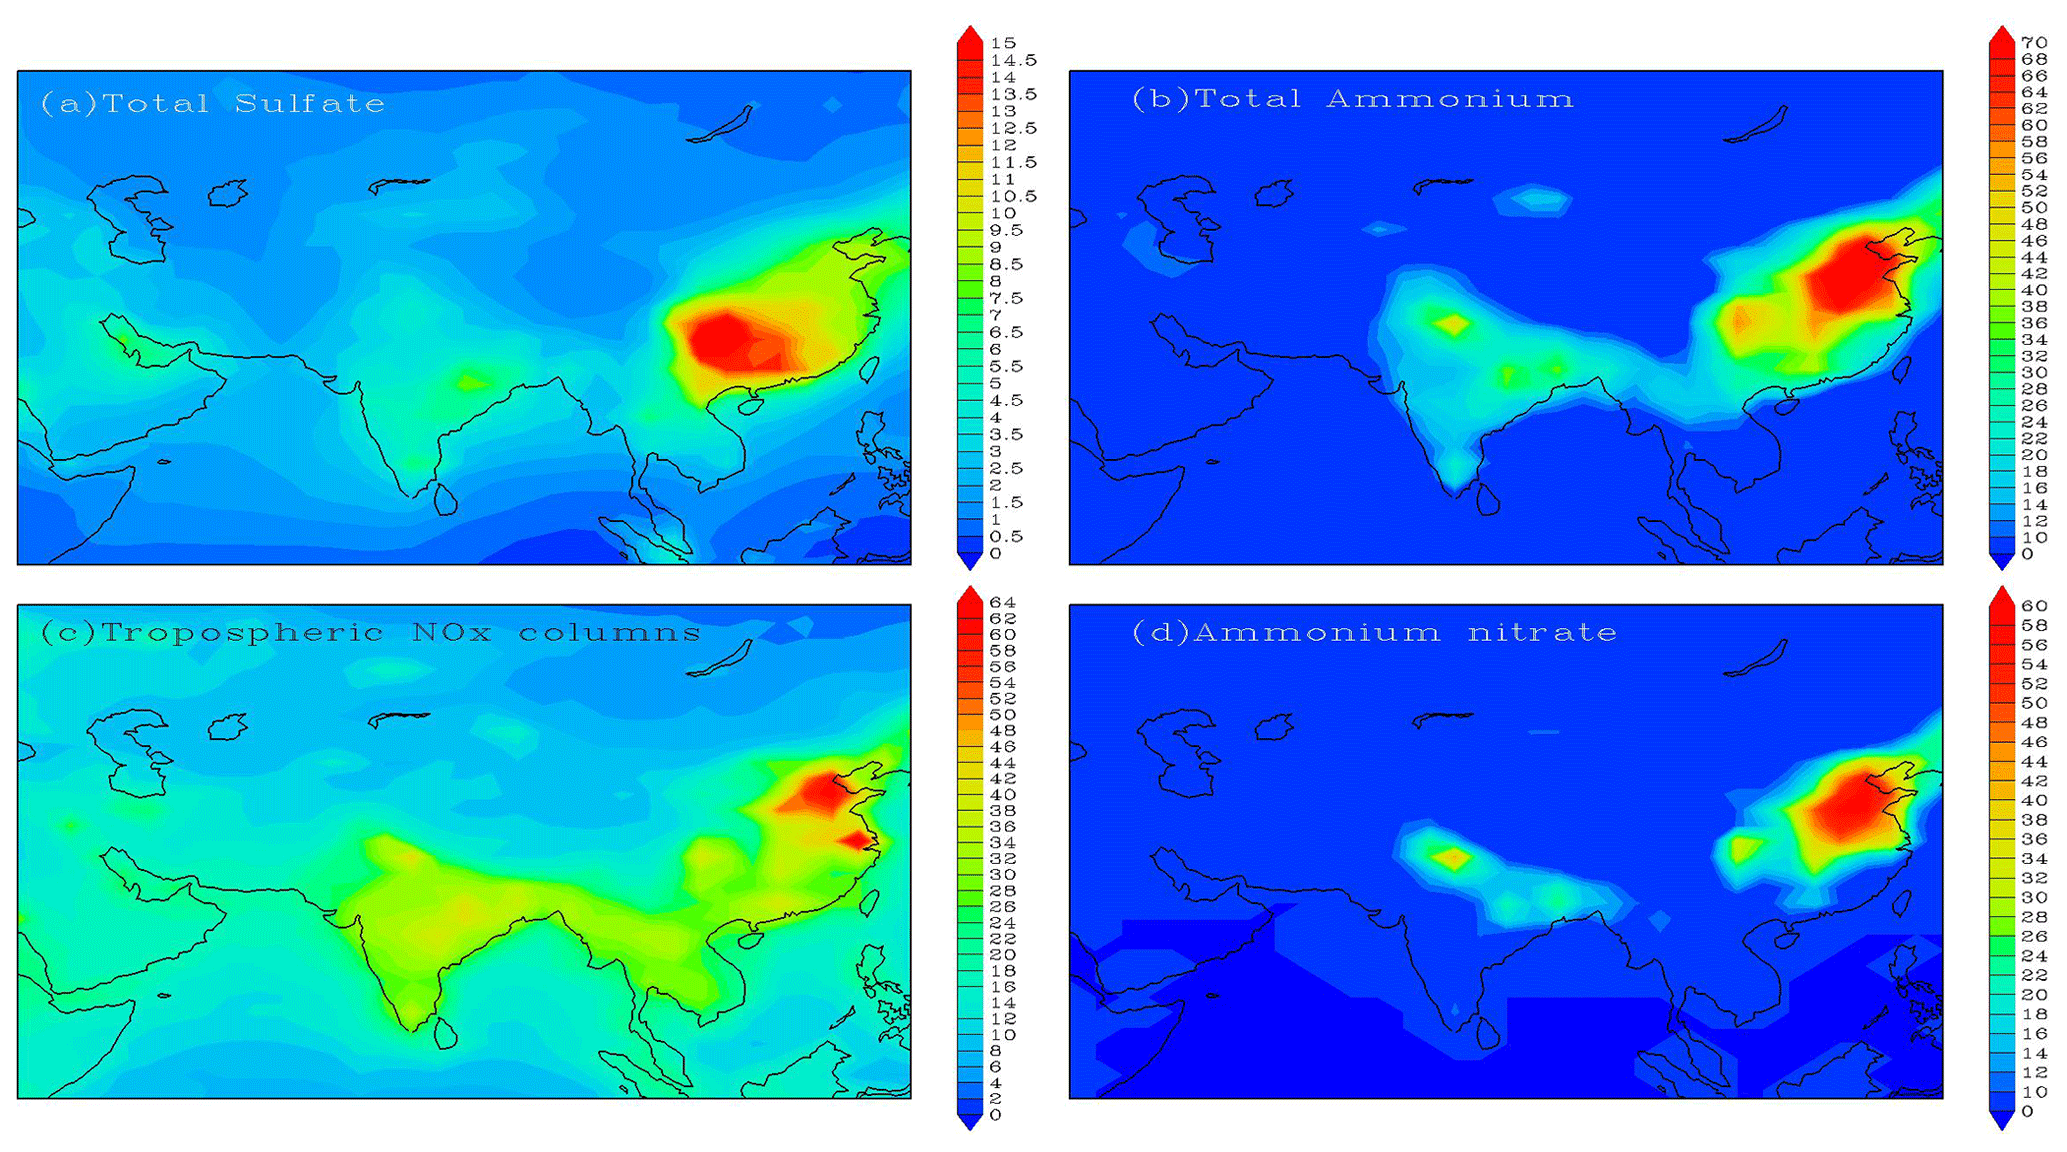
Figure 11MOZART-4-simulated spatial distribution of annual averaged (a) total sulfate aerosol (×109 ppb), (b) total ammonium aerosol (×109 ppb), (c) NOx total columns (×1016 molecules cm−2) and (d) total ammonium nitrate aerosol (×109 ppb) over Asia.
Figure 11 shows that the total sulfate VMR (Fig. 11a) and the NOx total column (Fig. 11c) are significantly higher over the NCP region than the IGP. Similarly, the total ammonium VMR (Fig. 11b) is significantly larger over the NCP than the IGP, indicating how a higher fraction of the gaseous ammonia is transformed to form ammonium over the NCP region. In addition, Fig. 11d shows higher estimated levels of ammonium nitrate in MOZART-4 over the NCP, reflective of the higher NOx emissions in this region. As a consequence of the different SO2 and NOx sources, gaseous NH3 is more quickly removed from the atmosphere over East Asia, with a residence time of approximately 6 h (Fig. S7 in the Supplement) (higher values indicates lower mean residence time), which is reflected in the higher VMR of ammonium, sulfate and ammonium nitrate (Fig. 11a, b and d). It can be seen that the NH3 NH ratio denotes lower values of 0–1 (Fig. S3 in the Supplement) over East Asia than South Asia, suggesting that NH partitioning is more over East Asia. As a result, the NH3 total columns over the NCP are much smaller than over the IGP, even though the magnitude of NH3 emission fluxes is greater over the NCP than the IGP. This difference indicates that the high NH3 loading over the IGP is partly coming from the low gas–particle partitioning of NH3 caused by low SO2 and NOx emission over South Asia. In contrast, high SO2 and NOx emissions promote the conversion of gaseous NH3 into particulate ammonium in the NCP. However, a rapid decline of acidic (SO2) emissions over China after 2000, which may not be reflected correctly in HTAP_v2 (Mortier et al., 2020; Tong et al., 2020; Zheng et al., 2018), will lead to higher NH3 loading due to less partitioning of NH3.
In this work, we have compared NH3 total columns simulated by the MOZART-4 model with IASI NH3 satellite observations over South and East Asia. The annual mean distribution reveals a consistent spatial pattern between MOZART-4 and IASI, but MOZART-4 tends to show larger NH3 columns over South Asia than IASI, particularly over the Indo-Gangetic Plain (IGP), whereas it is in close agreement over East Asia (including the North China Plain, NCP), with the exception of a July peak seen in the IASI dataset, which may be related to the specific timing of fertiliser-related NH3 emissions. Comparison of the seasonally and monthly resolved IASI total column with the MOZART-4 simulations shows inconsistencies in the spatial and temporal pattern over South Asia. This inconsistency is due to the uncertainties in the emission estimate, which does not include the seasonality pattern in HTAP-v2 over South Asia, as well as uncertainties in the processing of the IASI data. Both the MOZART-4 results and IASI estimates involve assumptions that could considerably affect the comparison between total columns of NH3.
In a comparison with estimates from a ground-based NH3 monitoring network for both South and East Asia, our results showed that MOZART-4 systematically gives smaller NH3 concentration estimates than the monitoring network. The NH3 measurement sites used in present study mostly represent urban locations, and the model may not be able to capture the actual concentration at point locations due to the coarser grid resolution over India. In addition, further assessment is needed to demonstrate the reliability of the NH3 measurement technique used in the monitoring network, where NH3 is measured by difference with NOx concentrations, which may be uncertain in urban areas with high NOx concentrations.
Despite the high NH3 emission over both South and East Asia, a larger NH3 total column is observed over South Asia in both the IASI and MOZART-4 estimates. This difference is explained by the MOZART-4 simulation, which treats the full atmospheric chemistry interaction with SO2 and NOx emissions, leading to aerosol formation. The MOZART-4 model showed a higher sulfate volume mixing ratio and NOx total column over East Asia, especially in the NCP, which is reflected in the ammonium aerosol volume mixing ratio (VMR) over East Asia. This suggests that the formation of ammonium aerosols (dominated by ammonium, sulfate and ammonium nitrate) is quicker over East Asia than in South Asia, leading to lower NH3 total columns in East Asia.
To examine the present findings, future studies should investigate the effect of changing emissions of NOx and SO2 on NH3 columns, for example by using perturbation of these emissions through counterfactual modelling scenarios. The comparison between model simulations using MOZART-4, satellite-derived estimates from IASI and ground-based monitoring of NH3 concentrations has highlighted the known uncertainties in emissions, satellite retrievals and measurements at point locations. In order to reduce the uncertainties in ammonia emission, it would be key to create an NH3 emission inventory specifically over South Asia, which is now currently under development as part of the GCRF South Asian Nitrogen Hub. This includes work to improve the bottom-up NH3 emission inventory, taking into account primary agricultural statistics on fertiliser use and animal number distributions. There is also potential for top-down (inverse) constraints on NH3 and NOx emissions by taking inference from the model, satellite and ground-based evidence. Here it is essential to recognise the need for more ground-based observational sites to measure NH3 air concentrations in rural areas, where agriculture activity is predominant. Such measurements at present are currently very few in South Asia. Coarser global models fail to resolve the local-scale emissions; hence higher resolution regional models with advance chemistry are also needed to resolve the sources and chemical processes on urban and rural scales.
The emission grid maps can be downloaded from the EDGAR website at https://edgar.jrc.ec.europa.eu/htap_v2/index.php?SECURE=_123 (HTAP-v2, 2019) per year per sector. The model data can be downloaded upon request from the AeroCom database (http://www.htap.org/; TF HTAP, 2018). The model data are available from the Prithvi (IITM) super-computer and can be provided upon request to corresponding author. The morning overpass NH3 total columns measured through IASI can be accessed from the data centre at http://cds-espri.ipsl.upmc.fr/etherTypo/index.php?id=1700&L=1 (CDS-ESPRI, 2019). For India, ground-based hourly NH3 measurements can be obtained from the CPCB website at https://app.cpcbccr.com/ccr (CPCB, 2019). For China, ground-based monthly mean NH3 datasets can be downloaded from https://figshare.com/articles/dataset/Data_Descriptor_Xu_et_al_20181211_Scientific_data_docx/7451357/5 (NNDNM, 2020).
The supplement related to this article is available online at: https://doi.org/10.5194/acp-21-6389-2021-supplement.
All authors contributed to the research. SDG designed the research; PVP conducted the research; PVP and SDG wrote the paper; CJ and DS performed the MOZART model simulations; AM and MAS formulated the research; MVD, LC, and PFC performed the IASI experiments; and SK, DML, GG, XL, WX, JJ, and TKA contributed to writing.
The authors declare that they have no conflict of interest.
We wish to thank the National Centre for Atmospheric Research (NCAR), funded by the U.S. National Science Foundation and operated by the University Corporation for Atmospheric Research, for access to MOZART-4. All model runs were carried out on the Prithvi IBM High-Performance Computing system at the Indian Institute of Tropical Meteorology (IITM), Pune, India. We thank the director of IITM for providing all the essential facilities required to complete the work. We wish to acknowledge the availability of CPCB data from the CPCB web portal (https://app.cpcbccr.com/ccr, last access: 15 April 2019). Research at ULB has been supported by the Belgian State Federal Office for Scientific, Technical and Cultural Affairs (Prodex arrangement IASI.FLOW). Lieven Clarisse and Martin Van Damme are respectively research associate and postdoctoral researcher with the Belgian F.R.S–FNRS. Cooperation between IITM and CEH has been facilitated through the NEWS India-UK Virtual Joint Centre, supported at CEH by the Biotechnological and Biological Sciences Research Council, the Natural Environment Research Council of UK Research and Innovation (UKRI) and the UKRI Global Challenges Research Fund (GCRF) South Asian Nitrogen Hub. The lead author's (Pooja V. Pawar) fellowship was supported by the National Supercomputing Mission (NSM) program grant at C-DAC, and we are grateful to the Executive Director and the Director General of C-DAC. The Nationwide Nitrogen Deposition Monitoring Network (NNDMN) of China was supported by the Chinese National Natural Science Foundation (41425007) and the Chinese National Research Program for Key Issues in Air Pollution Control (DQGG0208). We thank the anonymous reviewers and the editor for their constructive comments that helped in improving the quality of this paper.
This paper was edited by Frank Dentener and reviewed by three anonymous referees.
Acharja, P., Ali, K., Trivedi, D. K., Safai, P. D., Ghude, S., Prabhakaran, T., and Rajeevan, M.: Characterization of atmospheric trace gases and water soluble inorganic chemical ions of PM1 and PM2.5 at Indira Gandhi International Airport, New Delhi during 2017–18 winter, Sci. Total Environ., 729, 138800, https://doi.org/10.1016/j.scitotenv.2020.138800, 2020.
Alexandratos, N. and Bruinsma, J.: World Agriculture Towards 2030/2050, The 2012 Revision, Global Perspective Studies Team, FAO Agricultural Development Economics Division, ESA Working Paper No. 12-03, 12, available at: http://www.fao.org/docrep/016/ap106e/ap106e.pdf (last access: 14 March 2018), 2012.
Aneja, V. P., Murray, G. C., and Southerland, J.: Atmospheric nitrogen compounds: Emissions, transport, transformation, deposition, and assessment, EM Air Waste Manag. Assoc. Mag. Environ. Manag., 22–25, 1998.
Aneja, V. P., Battye, W., Behera, S. N., Erisman, J. W., Schlesinger, W. H., and Sharma, M.: Reactive nitrogen emissions from crop and livestock farming in India, Atmos. Environ., 47, 92–103, https://doi.org/10.1016/j.atmosenv.2011.11.026, 2011.
Battye, W. and B. R.: Review of Ammonia Emission Modeling Techniques for Natural Landscapes and Fertilized Soils, Work Assign. No. 2-09, 27517(68), USEPA, available at: https://www.epa.gov/sites/production/files/2015-08/documents/nh3_report_0504.pdf (last access: 15 January 2020), 2004.
Behera, S. N., Sharma, M., Aneja, V. P., and Balasubramanian, R.: Ammonia in the atmosphere: a review on emission sources, atmospheric chemistry and deposition on terrestrial bodies, Environ. Sci. Pollut. Res., 20, 8092–8131, https://doi.org/10.1007/s11356-013-2051-9, 2013.
Chan, K. L.: Biomass burning sources and their contributions to the local air quality in Hong Kong, Sci. Total Environ., 596–597, 212–221, https://doi.org/10.1016/j.scitotenv.2017.04.091, 2017.
Clarisse, L., Clerbaux, C., Dentener, F., Hurtmans, D., and Coheur, P. F.: Global ammonia distribution derived from infrared satellite observations, Nat. Geosci., 2, 479–483, https://doi.org/10.1038/ngeo551, 2009.
Clarisse, L., Shephard, M. W., Dentener, F., Hurtmans, D., Cady-Pereira, K., Karagulian, F., Van Damme, M., Clerbaux, C., and Coheur, P. F.: Satellite monitoring of ammonia: A case study of the San Joaquin Valley, J. Geophys. Res.-Atmos., 115, 1–15, https://doi.org/10.1029/2009JD013291, 2010.
Clarisse, L., Van Damme, M., Clerbaux, C., and Coheur, P. F.: Tracking down global NH3 point sources with wind-adjusted superresolution, Atmos. Meas. Tech., 12, 5457–5473, https://doi.org/10.5194/amt-12-5457-2019, 2019.
Clerbaux, C., Boynard, A., Clarisse, L., George, M., Hadji-Lazaro, J., Herbin, H., Hurtmans, D., Pommier, M., Razavi, A., Turquety, S., Wespes, C., and Coheur, P.-F.: Monitoring of atmospheric composition using the thermal infrared IASI/MetOp sounder, Atmos. Chem. Phys., 9, 6041–6054, https://doi.org/10.5194/acp-9-6041-2009, 2009.
CDS-ESPRI: NH3, IASI satellite datasets, available at: http://cds-espri.ipsl.upmc.fr/etherTypo/index.php?id=1700&L=1/ (last access: 15 April 2018), 2019.
CPCB: Guidelines for Real Time Sampling & Analyses, available at: http://www.indiaenvironmentportal.org.in/files/NAAQSManualVolumeII.pdf (last access: 24 November 2020), 2011.
CPCB: Annual Report 2014–15, Central Pollution Control Board (CPCB), Delhi, India, available at: http://cpcbenvis.nic.in/annual_report/AnnualReport_55_Annual_Report_2014-15.pdf (last access: 16 April 2019), 2014.
CPCB: measurement database in India, available at: https://app.cpcbccr.com/ccr/#/login/, last access: 15 April 2019.
CPCB: Central Pollution Control Board, available at: https://cpcb.nic.in/quality-assurance-quality-control/, last access: 26 May 2020.
Crippa, M., Guizzardi, D., Muntean, M., Schaaf, E., Dentener, F., van Aardenne, J. A., Monni, S., Doering, U., Olivier, J. G. J., Pagliari, V., and Janssens-Maenhout, G.: Gridded emissions of air pollutants for the period 1970–2012 within EDGAR v4.3.2, Earth Syst. Sci. Data, 10, 1987–2013, https://doi.org/10.5194/essd-10-1987-2018, 2018.
Dammers, E., McLinden, C. A., Griffin, D., Shephard, M. W., Van Der Graaf, S., Lutsch, E., Schaap, M., Gainairu-Matz, Y., Fioletov, V., Van Damme, M., Whitburn, S., Clarisse, L., Cady-Pereira, K., Clerbaux, C., Coheur, P. F., and Erisman, J. W.: NH3 emissions from large point sources derived from CrIS and IASI satellite observations, Atmos. Chem. Phys., 19, 12261–12293, https://doi.org/10.5194/acp-19-12261-2019, 2019.
Dao, X., Wang, Z., Lv, Y., Teng, E., Zhang, L., and Wang, C.: Chemical characteristics of water-soluble ions in particulate matter in three metropolitan areas in the North China Plain, PLoS One, 9, 1–16, https://doi.org/10.1371/journal.pone.0113831, 2014.
Datta, A., Sharma, S. K., Harit, R. C., Kumar, V., Mandal, T. K., and Pathak, H.: Ammonia emission from subtropical crop land area in india, Asia-Pacific J. Atmos. Sci., 48, 275–281, https://doi.org/10.1007/s13143-012-0027-1, 2012.
Dlugokencky, E. J., Myers, R. C., Lang, P. M., Masarie, K. A., Crotwell, A. M., Thoning, K. W., Hall, B. D., Elkins, J. W., and Steele, L. P.: Conversion of NOAA atmospheric dry air CH4 mole fractions to a gravimetrically prepared standard scale, J. Geophys. Res.-Atmos., 110, 1–8, https://doi.org/10.1029/2005JD006035, 2005.
Dlugokencky, E., Lang, P., and Masarie, K.: Atmospheric Methane Dry Air Mole Fractions from the NOAA ESRL Carbon Cycle Cooperative Global Air Sampling Network, 1983–2007, Version: 2008-07-02, available at: ftp://ftp.cmdl.noaa.gov/ ccg/ch4/flask/ (last access: 17 June 2015), 2008.
Emmons, L. K., Walters, S., Hess, P. G., Lamarque, J.-F., Pfister, G. G., Fillmore, D., Granier, C., Guenther, A., Kinnison, D., Laepple, T., Orlando, J., Tie, X., Tyndall, G., Wiedinmyer, C., Baughcum, S. L., and Kloster, S.: Description and evaluation of the Model for Ozone and Related chemical Tracers, version 4 (MOZART-4), Geosci. Model Dev., 3, 43–67, https://doi.org/10.5194/gmd-3-43-2010, 2010.
The Fertiliser Association of India (FAI): Fertiliser Association of India Annual Report 2018–2019, Delhi, India, 2018.
Ghude, S. D., Fadnavis, S., Beig, G., Polade, S. D., and van der A, R. J.: Detection of surface emission hot spots, trends, and seasonal cycle from satellite-retrieved NO2 over India, J. Geophys. Res., 113, D20305, https://doi.org/10.1029/2007JD009615, 2008.
Ghude, S. D., Lal, D. M., Beig, G., van der A, R., and Sable, D.: Rain-Induced Soil NOx Emission From India During the Onset of the Summer Monsoon: A Satellite Perspective, J. Geophys. Res., 115, D16304, https://doi.org/10.1029/2009JD013367, 2010.
Ghude, S. D., Beig, G., Kulkarni, P. S., Kanawade, V. P., Fadnavis, S., Remedios, J. J., and Kulkarni, S. H.: Regional co pollution over the Indian-subcontinent and various transport pathways as observed by mopitt, Int. J. Remote Sens., 32, 6133–6148, https://doi.org/10.1080/01431161.2010.507796, 2011.
Ghude, S. D., Kulkarni, S. H., Jena, C., Pfister, G. G., Beig, G., Fadnavis, S., and Van Der, R. J.: Application of satellite observations for identifying regions of dominant sources of nitrogen oxides over the indian subcontinent, J. Geophys. Res.-Atmos., 118, 1075–1089, https://doi.org/10.1029/2012JD017811, 2013.
Ghude, S. D., Chate, D. M., Jena, C., Beig, G., Kumar, R., Barth, M. C., Pfister, G. G., Fadnavis, S., and Pithani, P.: Premature mortality in India due to PM2.5 and ozone exposure, Geophys. Res. Lett., 43, 4650–4658, https://doi.org/10.1002/2016GL068949, 2016.
Ghude, S. D., Bhat, G. S., Prabhakaran, T., Jenamani, R. K., Chate, D. M., Safai, P. D., Karipot, A. K., Konwar, M., Pithani, P., Sinha, V., Rao, P. S. P., Dixit, S. A., Tiwari, S., Todekar, K., Varpe, S., Srivastava, A. K., Bisht, D. S., Murugavel, P., Ali, K., Mina, U., Dharua, M., Rao, Y. J., Padmakumari, B., Hazra, A., Nigam, N., Shende, U., Lal, D. M., Chandra, B. P., Mishra, A. K., Kumar, A., Hakkim, H., Pawar, H., Acharja, P., Kulkarni, R., Subharthi, C., Balaji, B., Varghese, M., Bera, S., and Rajeevan, M.: Winter fog experiment over the Indo-Gangetic plains of India, Curr. Sci., 112, 767–784, https://doi.org/10.18520/cs/v112/i04/767-784, 2017.
Guenther, A., Karl, T., Harley, P., Wiedinmyer, C., Palmer, P. I., and Geron, C.: Estimates of global terrestrial isoprene emissions using MEGAN (Model of Emissions of Gases and Aerosols from Nature), Atmos. Chem. Phys., 6, 3181–3210, https://doi.org/10.5194/acp-6-3181-2006, 2006.
Han, X., Zhu, L., Liu, M., Song, Y., and Zhang, M.: Numerical analysis of agricultural emissions impacts on PM2.5 in China using a high-resolution ammonia emission inventory, Atmos. Chem. Phys., 20, 9979–9996, https://doi.org/10.5194/acp-20-9979-2020, 2020.
Huang, K., Fu, J. S., Hsu, N. C., Gao, Y., Dong, X., Tsay, S. C., and Lam, Y. F.: Impact assessment of biomass burning on air quality in Southeast and East Asia during BASE-ASIA, Atmos. Environ., 78, 291–302, https://doi.org/10.1016/j.atmosenv.2012.03.048, 2013.
Huang, X., Song, Y., Li, M., Li, J., Huo, Q., Cai, X., Zhu, T., Hu, M., and Zhang, H.: A high-resolution ammonia emission inventory in China, Global Biogeochem. Cy., 26, 1–14, https://doi.org/10.1029/2011GB004161, 2012.
HTAP-v2: EDGAR datasets, available at: https://edgar.jrc.ec.europa.eu/htap_v2/index.php/, last access: 26 May 2019.
IPCC: Emissions scenarios, A special report of IPCC Working Group III, Cambridge University Press, Cambrige, UK, available at: https://www.ipcc.ch/site/assets/uploads/2018/03/sres-en.pdf (last access: 16 April 2020), 2000.
Janssens-Maenhout, G., Dentener, F. J., Aardenne, J. Van, Monni, S., Pagliari, V., Orlandini, L., Klimont, Z., Kurokawa, J., Akimoto, H., Ohara, T., Wankmüller, R., Battye, B., Grano, D., Zuber, A., and Keating, T.: EDGAR-HTAP: a harmonized gridded air pollution emission dataset based on national inventories, European Commission Publication Office, https://doi.org/10.2788/14102, 2012.
Janssens-Maenhout, G., Crippa, M., Guizzardi, D., Dentener, F., Muntean, M., Pouliot, G., Keating, T., Zhang, Q., Kurokawa, J., Wankmüller, R., Denier van der Gon, H., Kuenen, J. J. P., Klimont, Z., Frost, G., Darras, S., Koffi, B., and Li, M.: HTAP_v2.2: a mosaic of regional and global emission grid maps for 2008 and 2010 to study hemispheric transport of air pollution, Atmos. Chem. Phys., 15, 11411–11432, https://doi.org/10.5194/acp-15-11411-2015, 2015.
Jena, C., Ghude, S. D., Pfister, G. G., Chate, D. M., Kumar, R., Beig, G., Surendran, D. E., Fadnavis, S., and Lal, D. M.: Influence of springtime biomass burning in South Asia on regional ozone (O3): A model based case study, Atmos. Environ., 100, 37–47, https://doi.org/10.1016/j.atmosenv.2014.10.027, 2015a.
Jena, C., Ghude, S. D., Beig, G., Chate, D. M., Kumar, R., Pfister, G. G., Lal, D. M., Surendran, D. E., Fadnavis, S., and van der A, R. J.: Inter-comparison of different NOx emission inventories and associated variation in simulated surface ozone in Indian region, Atmos. Environ., 117, 61–73, https://doi.org/10.1016/j.atmosenv.2015.06.057, 2015b.
Kumar, R., Barth, M. C., Pfister, G. G., Delle Monache, L., Lamarque, J. F., Archer-Nicholls, S., Tilmes, S., Ghude, S. D., Wiedinmyer, C., Naja, M., and Walters, S.: How Will Air Quality Change in South Asia by 2050?, J. Geophys. Res.-Atmos., 123, 1840–1864, https://doi.org/10.1002/2017JD027357, 2018.
Kurokawa, J., Ohara, T., Morikawa, T., Hanayama, S., Janssens-Maenhout, G., Fukui, T., Kawashima, K., and Akimoto, H.: Emissions of air pollutants and greenhouse gases over Asian regions during 2000–2008: Regional Emission inventory in ASia (REAS) version 2, Atmos. Chem. Phys., 13, 11019–11058, https://doi.org/10.5194/acp-13-11019-2013, 2013.
Kuttippurath, J., Singh, A., Dash, S. P., Mallick, N., Clerbaux, C., Van Damme, M., Clarisse, L., Coheur, P. F., Raj, S., Abbhishek, K., and Varikoden, H.: Record high levels of atmospheric ammonia over India: Spatial and temporal analyses, Sci. Total Environ., 740, 139986, https://doi.org/10.1016/j.scitotenv.2020.139986, 2020.
Lal, D. M., Ghude, S. D., Singh, J. and Tiwari, S.: Relationship between Size of Cloud Ice and Lightning in the Tropics, Advances in Meterology, 471864, https://doi.org/10.1155/2014/471864, 2014.
Lawrence, P. J. and Chase, T. N.: Representing a new MODIS consistent land surface in the Community Land Model (CLM 3.0), J. Geophys. Res.-Biogeo., 112, G01023, https://doi.org/10.1029/2006JG000168, 2007.
Li, L., Friedl, M. A., Xin, Q., Gray, J., Pan, Y., and Frolking, S.: Mapping Crop Cycles in China Using MODIS-EVI Time Series, 6, 2473–2493, https://doi.org/10.3390/rs6032473, 2014.
Li, M., Zhang, Q., Kurokawa, J., Woo, J., He, K. B., Lu, Z., and Ohara, T.: MIX: a mosaic Asian anthropogenic emission inventory for the MICS-Asia and the HTAP projects, 34813–34869, Atmospheric Chemistry and Physics Discussions, https://doi.org/10.5194/acpd-15-34813-2015, 2015.
Li, M., Zhang, Q., Kurokawa, J.-I., Woo, J.-H., He, K., Lu, Z., Ohara, T., Song, Y., Streets, D. G., Carmichael, G. R., Cheng, Y., Hong, C., Huo, H., Jiang, X., Kang, S., Liu, F., Su, H., and Zheng, B.: MIX: a mosaic Asian anthropogenic emission inventory under the international collaboration framework of the MICS-Asia and HTAP, Atmos. Chem. Phys., 17, 935–963, https://doi.org/10.5194/acp-17-935-2017, 2017.
Liu, L., Zhang, X., Xu, W., Liu, X., Li, Y., Lu, X., Zhang, Y., and Zhang, W.: Temporal characteristics of atmospheric ammonia and nitrogen dioxide over China based on emission data, satellite observations and atmospheric transport modeling since 1980, Atmos. Chem. Phys., 17, 9365–9378, https://doi.org/10.5194/acp-17-9365-2017, 2017a.
Liu, X., Xu, W., Duan, L., Du, E., Pan, Y., Lu, X., Zhang, L., Wu, Z., Wang, X., Zhang, Y., Shen, J., Song, L., Feng, Z., Liu, X., Song, W., Tang, A., Zhang, Y., Zhang, X., and Collett, J. L.: Atmospheric Nitrogen Emission, Deposition, and Air Quality Impacts in China: an Overview, Curr. Pollut. Reports, 3, 65–77, https://doi.org/10.1007/s40726-017-0053-9, 2017b.
Mandal, T. K., Saxena, M., Rohtash, Sharma, S. K., Gupta, N. C., Kumar, M., and Saraswati: Characteristics of ambient ammonia over Delhi, India, Meteorol. Atmos. Phys., 124, 67–82, https://doi.org/10.1007/s00703-013-0299-8, 2013.
Metzger, S., Dentener, F., Pandis, S., and Lelieveld, J.: Gas/aerosol partitioning: 1. A computationally efficient model, J. Geophys. Res.-Atmos., 107, 4312, https://doi.org/10.1029/2001JD001102, 2002.
Metzger, S., Mihalopoulos, N., and Lelieveld, J.: Importance of mineral cations and organics in gas-aerosol partitioning of reactive nitrogen compounds: case study based on MINOS results, Atmos. Chem. Phys., 6, 2549–2567, https://doi.org/10.5194/acp-6-2549-2006, 2006.
Móring, A., Hooda, S., Raghuram, N., Adhya, T. K., Ahmad, A., Bandyopadhyay, S. K., Barsby, T., Beig, G., Bentley, A. R., Bhatia, A., Dragosits, U., Drewer, J., Foulkes, J., Ghude, S. D., Gupta, R., Jain, N., Kumar, D., Kumar, R. M., Ladha, J. K., Mandal, P. K., Neeraja, C. N., Pandey, R., Pathak, H., Pawar, P., Pellny, T. K., Poole, P., Price, A., Rao, D. L. N., Reay, D. S., Singh, N. K., Sinha, S. K., Srivastava, R. K., Shewry, P., Smith, J., Steadman, C. E., Subrahmanyam, D., Surekha, K., Venkatesh, K., Varinderpal-Singh, Uwizeye, A., Vieno, M., and Sutton, M. A.: Nitrogen Challenges and Opportunities for Agricultural and Environmental Science in India, Front. Sustain. Food Syst., 5, 505347, https://doi.org/10.3389/fsufs.2021.505347, 2021.
Mortier, A., Gliß, J., Schulz, M., Aas, W., Andrews, E., Bian, H., Chin, M., Ginoux, P., Hand, J., Holben, B., Zhang, H., Kipling, Z., Kirkevåg, A., Laj, P., Lurton, T., Myhre, G., Neubauer, D., Olivié, D., von Salzen, K., Skeie, R. B., Takemura, T., and Tilmes, S.: Evaluation of climate model aerosol trends with ground-based observations over the last 2 decades – an AeroCom and CMIP6 analysis, Atmos. Chem. Phys., 20, 13355–13378, https://doi.org/10.5194/acp-20-13355-2020, 2020.
NNDNM: A database of atmospheric nitrogen concentration and deposition from a nationwide monitoring network in China, available at: https://figshare.com/articles/dataset/Data_Descriptor_Xu_et_al_20181211_Scientific_data_docx/7451357/5, last access: 15 January 2020.
Novelli, P. C.: Molecular hydrogen in the troposphere: Global distribution and budget, J. Geophys. Res.-Atmos., 104, 30427–30444, https://doi.org/10.1029/1999JD900788, 1999
Oleson, K. W., Lawrence, D. M., Bonan, G. B., Flanner, M. G., Kluzek, E., Lawrence, P. J., Levis, S., Swenson, S. C., Thornton, P. E., Dai, A., Decker, M., Dickinson, R., Feddema, Johannes., Heald, C. L., Hoffman, F., Lamarque, J. F., Mahowald, N., Niu, G. Y., Qian, T., Randerson, J., Running, S., Sakaguchi, K., Slater, A., Stockli, R., Wang, A., Yang, Z. L., Zeng, X., and Zeng, X: Technical Description of version 4.0 of the Community Land Model (CLM), University Corporation for Atmospheric Research, https://doi.org/10.5065/D6FB50WZ, 2010.
Pfister, G. G., Emmons, L. K., Hess, P. G., Lamarque, J. F., Orlando, J. J., Walters, S., Guenther, A., Palmer, P. I., and Lawrence, P. J.: Contribution of isoprene to chemical budgets: A model tracer study with the NCAR CTM MOZART-4, J. Geophys. Res.-Atmos., 113, D05308, https://doi.org/10.1029/2007JD008948, 2008.
Pinder, R. W., Adams, P. J., and Pandis, S. N.: Ammonia Emission Controls as a Cost-Effective Strategy for Reducing Atmospheric Particulate Matter in the Eastern United States, Environ. Sci. Technol., 41, 380–386, https://doi.org/10.1021/es060379a, 2007.
Pinder, R. W., Gilliland, A. B., and Dennis, R. L.: Environmental impact of atmospheric NH3 emissions under present and future conditions in the eastern United States, Geophys. Res. Lett., 35, L12808, https://doi.org/10.1029/2008GL033732, 2008.
Randerson, J. T., van der Werf, G. R., Giglio, L., Collatz, G. J., and Kasibhatla, P. S.: Global Fire Emissions Database, Version 3.1. ORNL DAAC, Oak Ridge, Tennessee, USA, available at: https://doi.org/10.3334/ORNLDAAC/1191 (last access: 26 May 2020), 2013.
Saraswati, M. P. G., Sharma, S. K., Mandal, T. K., and Kotnala, R. K.: Simultaneous Measurements of Ambient NH3 and Its Relationship with Other Trace Gases, PM2.5 and Meteorological Parameters over Delhi, India, Mapan – J. Metrol. Soc. India, 34, 55–69, https://doi.org/10.1007/s12647-018-0286-0, 2019.
Seinfeld, J. H. and Pandis, S. N.: Atmospheric Chemistry and Physics: From Air Pollution to Climate Change, Wiley, available at: https://books.google.co.in/books?id=J3s30hwn_K0C (last access: 26 May 2020), 2012.
Seinfeld, J. H., Pandis, S. N., and Noone, K.: Atmospheric Chemistry and Physics: From Air Pollution to Climate Change, Phys. Today, 51, 88–90, https://doi.org/10.1063/1.882420, 1998.
Sharma, C., Tiwari, M. K., and Pathak, H.: Estimates of emission and deposition of reactive nitrogenous species for India, Curr. Sci., 94, 1439–1446, availabe at: http://www.indiaenvironmentportal.org.in/files/12_1.pdf (last access: 16 April 2020), 2008.
Sharma, S. K., Saxena, M., Saud, T., Korpole, S., and Mandal, T. K.: Measurement of NH3, NO, NO2 and related particulates at urban sites of indo gangetic plain (IGP) of India, J. Sci. Ind. Res. (India), 71, 360–362, 2012.
Sharma, S. K., Harit, R. C., Kumar, V., Mandal, T. K., and Pathak, H.: Ammonia Emission from Rice-Wheat Cropping System in Subtropical Soil of India, Agric. Res., 3, 175–180, https://doi.org/10.1007/s40003-014-0107-9, 2014a.
Sharma, S. K., Kumar, M., Rohtash, G. N. C., Saraswati, S. M., and Mandal, T. K.: Characteristics of ambient ammonia over Delhi, India, Meteorol. Atmos. Phys., 124, 67–82, https://doi.org/10.1007/s00703-013-0299-8, 2014b.
Someya, Y., Imasu, R., Shiomi, K., and Saitoh, N.: Atmospheric ammonia retrieval from the TANSO-FTS/GOSAT thermal infrared sounder, Atmos. Meas. Tech., 13, 309–321, https://doi.org/10.5194/amt-13-309-2020, 2020.
Surendran, D., Jena, C., Beig, G., Chate, D. M., and Ghude, S. D.: Quantifying the sectoral contribution of pollution transport from South Asia during summer and winter monsoon seasons in support of HTAP-2 experiment, Atmos. Environ., 145, 60–71, https://doi.org/10.1016/j.atmosenv.2016.09.011, 2016.
Surendran, D. E., Ghude, S. D., Beig, G., Emmons, L. K., Jena, C., Kumar, R., Pfister, G. G., and Chate, D. M.: Air quality simulation over South Asia using Hemispheric Transport of Air Pollution version-2 (HTAP-v2) emission inventory and Model for Ozone and Related chemical Tracers (MOZART-4), Atmos. Environ., 122, 357–372, https://doi.org/10.1016/j.atmosenv.2015.08.023, 2015.
Sutton, M. A., Reis, S., Riddick, S. N., Dragosits, U., Nemitz, E., Theobald, M. R., Tang, Y. S., Braban, C. F., Vieno, M., Dore, A. J., Mitchell, R. F., Wanless, S., Daunt, F., Fowler, D., Blackall, T. D., Milford, C., Flechard, C. R., Loubet, B., Massad, R., Cellier, P., Personne, E., Coheur, P. F., Clarisse, L., Van Damme, M., Ngadi, Y., Clerbaux, C., Skjøth, C. A., Geels, C., Hertel, O., Kruit, R. J. W., Pinder, R. W., Bash, J. O., Walker, J. T., Simpson, D., Horváth, L., Misselbrook, T. H., Bleeker, A., Dentener, F., and de Vries, W.: Towards a climate-dependent paradigm of ammonia emission and deposition, Philos. T. Roy. Soc. B., 368, 1–13, https://doi.org/10.1098/rstb.2013.0166, 2013.
Sutton, M. A., Drewer, J., Moring, A., Adhya, T. K., Ahmed, A., Bhatia, A., Brownlie, W., Dragosits, U., Ghude, S. D., Hillier, J., Hooda, S., Howard, C. M., Jain, N., Kumar, D., Kumar, R. M., Nayak, D. R., Neeraja, C. N., Prasanna, R., Price, A., Ramakrishnan, B., Reay, D. S., Singh, R., Skiba, U., Smith, J. U., Sohi, S., Subrahmanyan, D., Surekha, K., van Grinsven, H. J. M., Vieno, M., Voleti, S. R., Pathak, H., and Raghuram, N.: 2 – The Indian Nitrogen Challenge in a Global Perspective, in: The Indian Nitrogen Assessment, edited by: Abrol, Y. P., Adhya, T. K., Aneja, V. P., Raghuram, N., Pathak, H., Kulshrestha, U., Sharma, C., and Singh, B., pp. 9–28, Elsevier, https://doi.org/10.1016/B978-0-12-811836-8.00002-1, 2017a.
Sutton, M. A., Drewer, J., Moring, A., Adhya, T. K, Ahmed, A., and Bhatia, A.: The Indian nitrogen assessment: sources of reactive nitrogen, environmental and climate effects, management options, and policies, in: The Indian Nitrogen Assessment, edited by: Abrol, Y. P., Adhya, T. K., Aneja, V. P., Raghuram, N., Pathak, H., Kulshrestha, U., Sharma, C., and Singh, B., pp. 9–25, Elsevier, https://doi.org/10.1016/B978-0-12-811836-8.01002-8, 2017b.
Technical specifications for CAAQM station: Technical Specifications for CAAQM station: Real time, Central Pollution Control Board, East Arjun Nagar, Shahdara, India, available at: https://erc.mp.gov.in/Documents/doc/Guidelines/CAAQMS_Specs_new.pdf, last access: 16 April 2019.
TF HTAP: AeroCom database, model data, available at: (http://www.htap.org/ (last accessed 22 June 2020), 2018.
The Global Challenges Research Fund (GCRF): South Asia Nitrogen Hub, NERC project, available at: https://gtr.ukri.org/projects?ref=NE/S009019/1/ (last access: 22 June 2020), 2019.
Tie, X., Brasseur, G., Emmons, L., Horowitz, L., and Kinnison, D.: Effects of aerosols on tropospheric oxidants: A global model study, J. Geophys. Res.-Atmos., 106, 22931–22964, https://doi.org/10.1029/2001JD900206, 2001.
Tie, X., Madronich, S., Walters, S., Zhang, R., Rasch, P., and Collins, W.: Effect of clouds on photolysis and oxidants in the troposphere, 108, 4642, https://doi.org/10.1029/2003JD003659, 2003.
Tie, X., Madronich, S., Walters, S., Edwards, D. P., Ginoux, P., Mahowald, N., Zhang, R. Y., Lou, C., and Brasseur, G.: Assessment of the global impact of aerosols on tropospheric oxidants, J. Geophys. Res.-Atmos., 110, 1–32, https://doi.org/10.1029/2004JD005359, 2005.
Tong, D., Cheng, J., Liu, Y., Yu, S., Yan, L., Hong, C., Qin, Y., Zhao, H., Zheng, Y., Geng, G., Li, M., Liu, F., Zhang, Y., Zheng, B., Clarke, L., and Zhang, Q.: Dynamic projection of anthropogenic emissions in China: methodology and 2015–2050 emission pathways under a range of socio-economic, climate policy, and pollution control scenarios, Atmos. Chem. Phys., 20, 5729–5757, https://doi.org/10.5194/acp-20-5729-2020, 2020.
Van Damme, M, Wichink Kruit, R. J., Schaap, M., Clarisse, L., Clerbaux, C., Coheur, P. F., Dammers, E., Dolman, A. J., and Erisman, J. W.: Evaluating 4 years of atmospheric ammonia (NH3) over Europe using IASI satellite observations and LOTOS-EUROS model results, J. Geophys. Res., 119, 9549–9566, https://doi.org/10.1002/2014JD021911, 2014a.
Van Damme, M., Clarisse, L., Heald, C. L., Hurtmans, D., Ngadi, Y., Clerbaux, C., Dolman, A. J., Erisman, J. W., and Coheur, P. F.: Global distributions, time series and error characterization of atmospheric ammonia (NH3) from IASI satellite observations, Atmos. Chem. Phys., 14, 2905–2922, https://doi.org/10.5194/acp-14-2905-2014, 2014b.
Van Damme, M., Clarisse, L., Dammers, E., Liu, X., Nowak, J. B., Clerbaux, C., Flechard, C. R., Galy-Lacaux, C., Xu, W., Neuman, J. A., Tang, Y. S., Sutton, M. A., Erisman, J. W., and Coheur, P. F.: Towards validation of ammonia (NH3) measurements from the IASI satellite, Atmos. Meas. Tech., 8, 1575–1591, https://doi.org/10.5194/amt-8-1575-2015, 2015a.
Van Damme, Erisman, J. W., Clarisse, L., Dammers, E., Whitburn, S., Clerbaux, C., Dolman, A. J., and Coheur, P.: Worldwide spatiotemporal atmospheric ammonia (NH3), Geophys. Res. Lett., 1–9, 8660–8668, https://doi.org/10.1002/2015GL065496, 2015b.
Van Damme, M., Whitburn, S., Clarisse, L., Clerbaux, C., Hurtmans, D., and Coheur, P.-F.: Version 2 of the IASI NH3 neural network retrieval algorithm: near-real-time and reanalysed datasets, Atmos. Meas. Tech., 10, 4905-4914, https://doi.org/10.5194/amt-10-4905-2017, 2017.
Van Damme, M., Clarisse, L., Whitburn, S., Hadji-Lazaro, J., Hurtmans, D., Clerbaux, C., and Coheur, P. F.: Industrial and agricultural ammonia point sources exposed, Nature, 564, 99–103, https://doi.org/10.1038/s41586-018-0747-1, 2018.
Viatte, C., Wang, T., Van Damme, M., Dammers, E., Meleux, F., Clarisse, L., Shephard, M. W., Whitburn, S., Coheur, P. F., Cady-Pereira, K. E., and Clerbaux, C.: Atmospheric ammonia variability and link with particulate matter formation: a case study over the Paris area, Atmos. Chem. Phys., 20, 577–596, https://doi.org/10.5194/acp-20-577-2020, 2020.
Wang, T., Song, Y., Xu, Z., Liu, M., Xu, T., Liao, W., Yin, L., Cai, X., Kang, L., Zhang, H., and Zhu, T.: Why is the Indo-Gangetic Plain the region with the largest NH3 column in the globe during pre-monsoon and monsoon seasons?, Atmos. Chem. Phys., 20, 8727–8736, https://doi.org/10.5194/acp-20-8727-2020, 2020.
Wesely, M. L.: Parameterization of surface resistances to gaseous dry deposition in regional-scale numerical models, Atmos. Environ., 23, 1293–1304, https://doi.org/10.1016/0004-6981(89)90153-4, 1989.
Whitburn, S., Damme, M. Van, Clarisse, L., Bauduin, S., Heald, C. L., Hurtmans, D., Zondlo, M. A., Clerbaux, C., and Coheur, P.: A flexible and robust neural network IASI-NH3, 121, 6581–6599, https://doi.org/10.1002/2016JD024828, 2016.
Wu, J., Kong, S., Wu, F., Cheng, Y., Zheng, S., Yan, Q., Zheng, H., Yang, G., Zheng, M., Liu, D., Zhao, D., and Qi, S.: Estimating the open biomass burning emissions in central and eastern China from 2003 to 2015 based on satellite observation, Atmos. Chem. Phys., 18, 11623–11646, https://doi.org/10.5194/acp-18-11623-2018, 2018.
Xu, J. S., He, J., Behera, S. N., Xu, H. H., Ji, D. S., Wang, C. J., Yu, H., Xiao, H., Jiang, Y. J., Qi, B., and Du, R. G.: Temporal and spatial variation in major ion chemistry and source identification of secondary inorganic aerosols in Northern Zhejiang Province, China, Chemosphere, 179, 316–330, https://doi.org/10.1016/j.chemosphere.2017.03.119, 2017.
Xu, R. T., Pan, S. F., Chen, J., Chen, G. S., Yang, J., Dangal, S. R. S., Shepard, J. P., and Tian, H. Q.: Half-Century Ammonia Emissions From Agricultural Systems in Southern Asia: Magnitude, Spatiotemporal Patterns, and Implications for Human Health, GeoHealth, 2, 40–53, https://doi.org/10.1002/2017gh000098, 2018.
Xu, W., Zhang, L., and Liu, X.: A database of atmospheric nitrogen concentration and deposition from the nationwide monitoring network in China, Sci. Data, 6, 51, https://doi.org/10.1038/s41597-019-0061-2, 2019.
Zhang, X., Liu, J., Han, H., Zhang, Y., Jiang, Z., Wang, H., Meng, L., Li, Y. C., and Liu, Y.: Satellite-Observed Variations and Trends in Carbon Monoxide over Asia and Their Sensitivities to Biomass Burning, Remote Sens., 12, 830, https://doi.org/10.3390/rs12050830, 2020.
Zhang, Y., Dore, A. J., Ma, L., Liu, X. J., Ma, W. Q., Cape, J. N., and Zhang, F. S.: Agricultural ammonia emissions inventory and spatial distribution in the North China Plain, Environ. Pollut., 158, 490–501, https://doi.org/10.1016/j.envpol.2009.08.033, 2010.
Zhao, B., Wang, S. X., Liu, H., Xu, J. Y., Fu, K., Klimont, Z., Hao, J. M., He, K. B., Cofala, J., and Amann, M.: NOx emissions in China: historical trends and future perspectives, Atmos. Chem. Phys., 13, 9869–9897, https://doi.org/10.5194/acp-13-9869-2013, 2013.
Zheng, B., Tong, D., Li, M., Liu, F., Hong, C., Geng, G., Li, H., Li, X., Peng, L., Qi, J., Yan, L., Zhang, Y., Zhao, H., Zheng, Y., He, K., and Zhang, Q.: Trends in China's anthropogenic emissions since 2010 as the consequence of clean air actions, Atmos. Chem. Phys., 18, 14095–14111, https://doi.org/10.5194/acp-18-14095-2018, 2018.
Zheng, J., Hu, M., Du, Z., Shang, D., Gong, Z., Qin, Y., Fang, J., Gu, F., Li, M., Peng, J., Li, J., Zhang, Y., Huang, X., He, L., Wu, Y., and Guo, S.: Influence of biomass burning from South Asia at a high-altitude mountain receptor site in China, Atmos. Chem. Phys., 17, 6853–6864, https://doi.org/10.5194/acp-17-6853-2017, 2017.
Zhou, Y., Zhang, Y., Tian, D., and Mu, Y.: Impact of dicyandiamide on emissions of nitrous oxide, nitric oxide and ammonia from agricultural field in the North China Plain, J. Environ. Sci., 40, 20–27, https://doi.org/10.1016/j.jes.2015.08.016, 2016.
Zhu, L., Henze, D. K., Bash, J. O., Cady-Pereira, K. E., Shephard, M. W., Luo, M., and Capps, S. L.: Sources and Impacts of Atmospheric NH3: Current Understanding and Frontiers for Modeling, Measurements, and Remote Sensing in North America, Curr. Pollut. Reports, 1, 95–116, https://doi.org/10.1007/s40726-015-0010-4, 2015.