the Creative Commons Attribution 4.0 License.
the Creative Commons Attribution 4.0 License.
 | 26 Apr 2021
Potential impact of aerosols on convective clouds revealed by Himawari-8 observations over different terrain types in eastern China
Tianmeng Chen
Ralph A. Kahn
Daniel Rosenfeld
Jianping Guo
Wenchao Han
Dandan Chen
Convective clouds are common and play a major role in Earth's water cycle and energy balance; they may even develop into storms and cause severe rainfall events. To understand the convective cloud development process, this study investigates the impact of aerosols on convective clouds by considering the influence of both topography and diurnal variation in radiation. By combining texture analysis, clustering, and thresholding methods, we identify all convective clouds in two warm seasons (May–September, 2016/17) in eastern China based on Himawari-8 Level 1 data. Having large diurnally resolved cloud data together with surface meteorological and environmental measurements, we investigate convective cloud properties and their variation, stratified by elevation and diurnal change. We then analyze the potential impact of aerosol on convective clouds under different meteorological conditions and topographies. In general, convective clouds tend to occur preferentially under polluted conditions in the morning, which reverses in the afternoon. Convective cloud fraction first increases then decreases with aerosol loading, which may contribute to this phenomenon. Topography and diurnal meteorological variations may affect the strength of aerosol microphysical and radiative effects. Updraft is always stronger along the windward slopes of mountains and plateaus, especially in northern China. The prevailing southerly wind near the foothills of mountains and plateaus is likely to contribute to this windward strengthening of updraft and to bring more pollutant into the mountains, thereby strengthening the microphysical effect, invigorating convective clouds. By comparison, over plain, aerosols decrease surface heating and suppress convection by blocking solar radiation reaching the surface.
- Article
(18700 KB) - Full-text XML
-
Supplement
(1806 KB) - BibTeX
- EndNote


Convective clouds are important for Earth's energy balance and the water cycle. Changes in the distribution or triggering time of convective cloud can have a large impact on the climate system (IPCC, 2013). Previous studies have shown that aerosol particles in the atmosphere can affect the formation and development of convective clouds, through both radiative and microphysical effects (Ramanathan et al., 2001; Tao et al., 2012; Altaratz et al., 2014; Rosenfeld et al., 2014a, b; Li et al., 2016; Zhao et al., 2018a; Yang et al., 2019), which can dramatically affect the weather and climate (Zhao et al., 2020).
Aerosol particles generally cool the surface by scattering the downward solar radiation (McCormick and Ludwig, 1967; Charlson et al., 1992), whereas light-absorbing aerosols can additionally warm the atmosphere above the surface (Ackerman et al., 2000). These aerosol radiative effects change the surface radiation budget and the atmospheric temperature profile directly, thereby altering the onset time of convective cloud formation and precipitation (Feingold et al., 2005; Wang et al., 2013; Zhou et al., 2020).
Aerosols, by acting as cloud condensation nuclei (CCN) and/or ice nuclei (IN), can also affect the formation and growth of cloud droplets (Rosenfeld, 2000; Kaufman et al., 2002; Garrett et al., 2004; Lohmann and Feichter, 2005; Zhao et al., 2012), which is regarded as the aerosol microphysical effect. For constant cloud liquid water content, increases in aerosol particle number concentration can produce more but smaller cloud droplets, thus increasing cloud albedo (Twomey and Warner, 1967; Twomey, 1974). This effect, called the “Twomey effect”, is a well-established influence on cloud properties in polluted environments (Kaufman and Nakajima, 1993; Feingold et al., 2003). Smaller cloud droplets can increase cloud lifetime and reduce precipitation (Albrecht, 1989), whereas for some deep convective cloud, the latent heat released by the formation of more and smaller ice particles can invigorate deep convection and increase rain rate (Andreae et al., 2004; Kaufman et al., 2005; Rosenfeld et al., 2008; Li et al., 2011, 2019; Fan et al., 2013). Koren et al. (2005) also found an increase in cloud fraction with a decrease in cloud top pressure for clouds under a high-aerosol-loading environment. For cases of thin clouds, smaller cloud droplets enhance cloud thermal emissivity, trap more longwave radiation within the atmosphere, and alter cloud development (Garrett and Zhao, 2006; Zhao and Garrett, 2015).
Many previous studies show that the interactions between aerosols and weather variables are complex (Williams et al., 2002; Stevens and Feingold, 2009; Altaratz et al., 2014), making it challenging to untangle aerosol effects from meteorological factors that influence convective clouds. As different types of clouds form under different meteorological conditions, some previous observational studies attempted to classify clouds into different types to distinguish aerosol effects in various meteorological regimes (Andreae et al., 2004; Khain et al., 2005; Li et al., 2011; Gryspeerdt and Stier, 2012; Gryspeerdt et al., 2014; Qiu et al., 2017). Other studies consider different cloud types to be different stages of convective development, to identify aerosol effects on convective cloud evolution, stratified by meteorological conditions (Chen et al., 2016; Guo et al., 2018).
Meteorological conditions can change during the day and can vary from one place to another. For example, convective cloud and precipitation maxima tend to occur in the early morning over open ocean but in the late afternoon or early evening over land, driven primarily by temporal differences in the radiative forcing (Chang et al., 1995; Garreaud and Wallace, 1997; Sui et al., 1997; Zhou et al., 2008; Li et al., 2010). Other studies show that the impact of terrain on the convective cloud can also be complex (Roe, 2005; Houze, 2012) and that the meteorological factors that control convection can be affected by terrain (Romatschke and Houze, 2010, 2011a, b). Diurnal variation in solar radiation can alter wind circulation in a valley and therefore may control the spatial distribution of convective cloud in mountainous regions (Kirshbaum and Durran, 2004, 2005; Kirshbaum et al., 2007; Romatschke et al., 2010).
Studies also attempted to explore the effects of topography on aerosol–precipitation interactions. Lynn et al. (2007) simulated the aerosol effect on orographic precipitation using the Weather Research and Forecasting Model (WRF) and found that the intensity of orographic precipitation is suppressed in more polluted environments. However, when the cold rain process is involved, precipitation is delayed but intensified (Givati and Rosenfeld, 2004; Rosenfeld and Givati, 2006; Xiao et al., 2015; Yang et al., 2016). When light-absorbing aerosol is present, radiative heating in the atmosphere can produce enhanced instability, which may trigger disastrous precipitation, especially late in the day (Fan et al., 2015). These studies revealed some potential influences of aerosol on orographic precipitation from either model simulations or several specific observed cases. Only a few studies include long-term observational data to analyze the relationships between aerosol and orographic precipitation statistically (Rosenfeld, 2007; Guo et al., 2014). This might be due to a lack of observational data in the past with sufficiently high spatial and temporal resolution.
Tracking the development of convective cloud can provide more details of changes in cloud life cycle. Attempts have been made to investigate differences in cloud properties between morning and afternoon using Terra and Aqua MODIS data (e.g., Meskhidze et al., 2009), but they cannot track the development of convective clouds beyond two snapshots per day. On the contrary, geostationary satellite data can provide images every 2.5–15 min, making it possible to track the evolution of convective clouds individually over the entire day (Chakraborty et al., 2015, 2016). The launch of the Japanese next-generation geostationary satellite Himawari-8 in October 2014 provided an opportunity to study aerosol effects on convective clouds throughout the day. The diurnal variation in different terrain types may be particularly strong due to amplified variations in radiation and sunshine duration by terrain (Li and Weng, 1987, 1988, 1989). The current study aims to characterize the differences between convective clouds in polluted and clean environments, untangling the potential influence of topography on the way aerosols affect convective clouds, and to explore how the effects of aerosols change diurnally. To achieve this goal, we first develop an automatic method of identifying convective clouds using geostationary satellite data, and then we assess how aerosol effects change during the day and in different topographic regions of eastern China.
The paper is organized as follows: Sect. 2 introduces the study region and data selection. The method is described in Sect. 3. Section 4 presents the temporal and spatial distributions of convective cloud and discusses the possible impact by aerosol on convective cloud over different terrains. In Sect. 5, we give a brief summary.
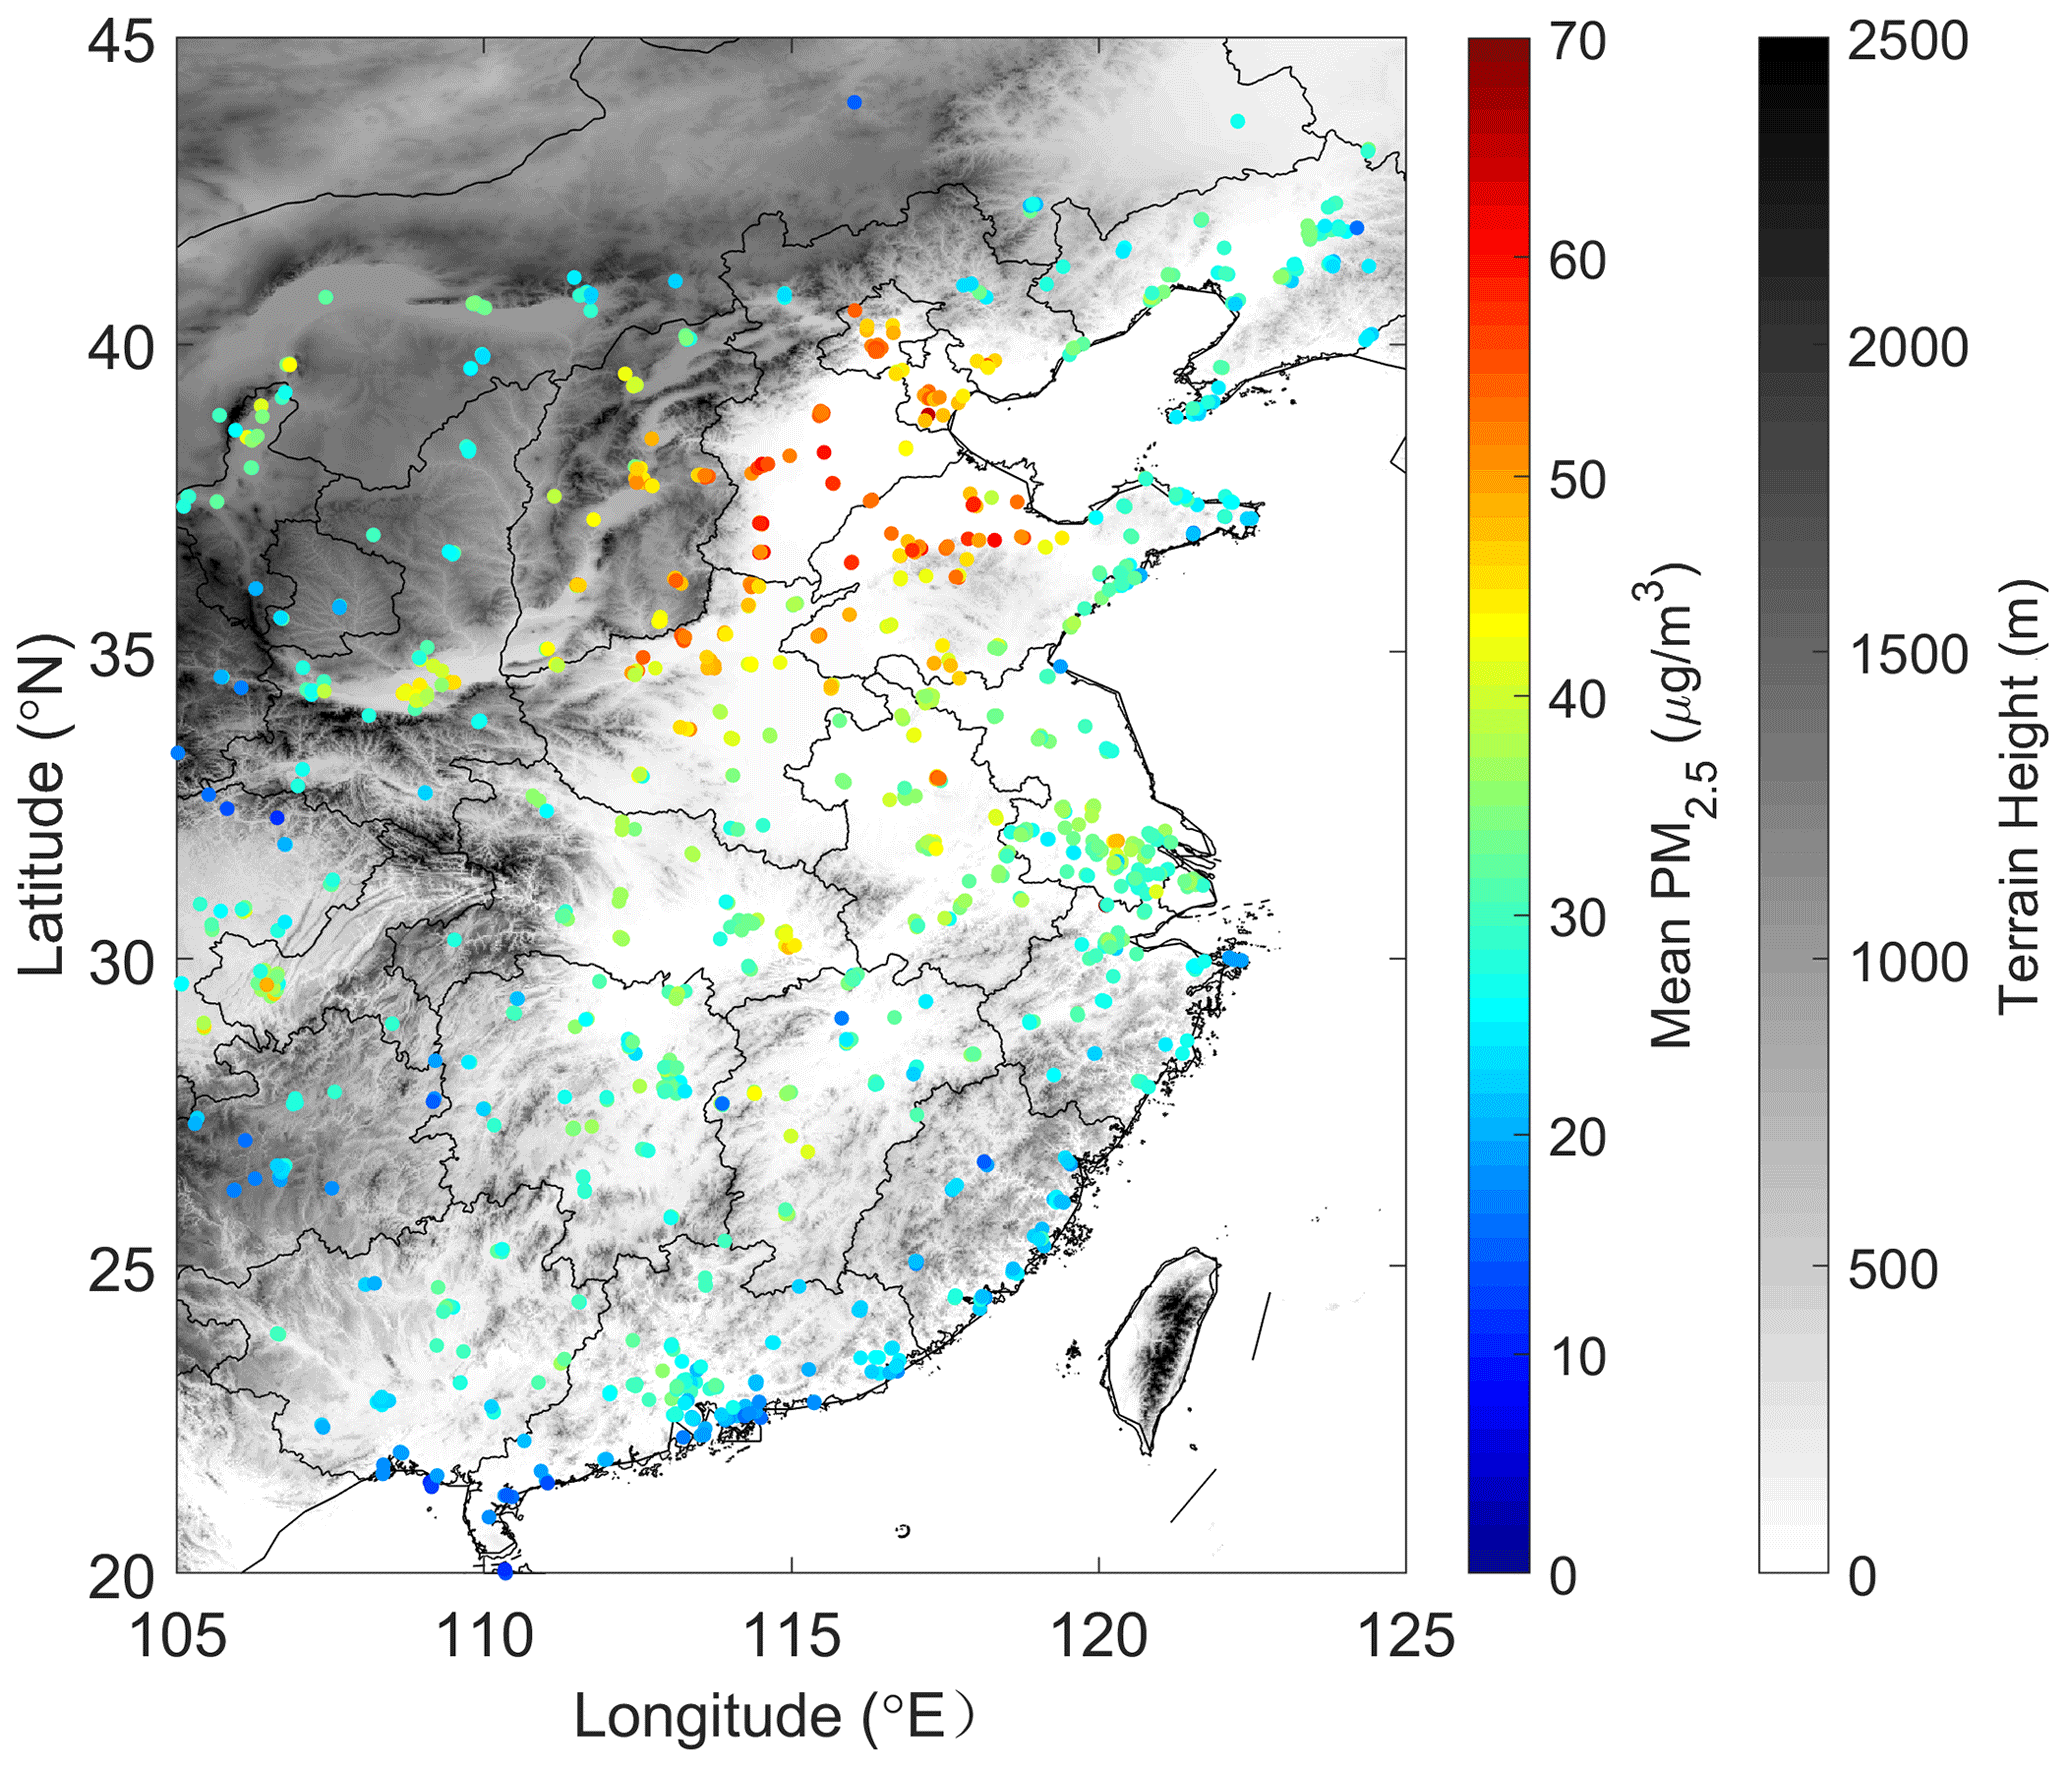
Figure 1Surface elevation and the mean value of ground-based PM2.5 measurements over eastern China. The terrain height (TH) of this region is represented with gray shading. Colored dots show the mean PM2.5 concentration from 1205 surface stations during May–September in 2016/17 over this area.
2.1 Region of interest
Rapid economic and industrial growth has brought heavy pollution to China, especially to eastern China, in recent decades. Thus, high aerosol loading over this area provides a natural laboratory for us to study the aerosol impact on convective clouds (Guo et al., 2011). In addition, eastern China has relatively complex topography, where convective clouds can be triggered and develop differently, leading to convective cloud regimes having distinctive diurnal change patterns. In order to investigate the joint impact of aerosol pollution and topography on convective cloud fraction and diurnal variation, we chose the area of longitudes 105 to 125∘ E and latitudes 20 to 45∘ N as the region of interest (ROI) for this study. We show the terrain distribution and the mean concentration of particles with aerodynamic diameters smaller than 2.5 µm (PM2.5) during May–September in 2016/17 over the ROI in eastern China in Fig. 1. Generally, terrain height (TH) tends to increase from east to west in this region, and PM2.5 mass concentration is generally higher over the plains and lower over mountain ranges and plateaus. As PM2.5 observations are available only over land in this area, the aerosol–convective cloud relationship is only discussed over land in this study.
2.2 Data
2.2.1 Himawari-8 data
The first satellite in a new generation of Japanese geostationary meteorology satellites, named Himawari-8, was launched in 2014. It carries a state-of-the-art optical sensor, the Advanced Himawari Imager (AHI), which can provide significantly high-resolution observations of the Earth system from space (0.5 or 1 km for visible and near-infrared bands at the sub-spacecraft point and 2 km for infrared bands) and time (around 10 min for full disk and 2.5 min for sectored regions) from space (Bessho et al., 2016). These advantages make it possible to detect rapid weather changes, especially the triggering and development of convective cloud. The geostationary sub-spacecraft point is located at 140.7∘ E over the Equator, so most of our ROI is covered.
In this study, we use the Himawari-8 L1 gridded data from the Japan Aerospace Exploration Agency (JAXA) P-Tree system to develop a convective cloud identification method and investigate how aerosols impact convective clouds over eastern China. This dataset is generated by the Earth Observation Research Center (JAXA/EORC) from Himawari Standard Data, with re-sampling to equal latitude–longitude grids. The channels we use here are centered at 0.64, 11.2, and 12.4 µm, with a spatial resolution of 0.02∘ × 0.02∘ and a temporal resolution of 10 min.
2.2.2 MODIS cloud mask
We use the MODIS Aqua MYD35 cloud mask data (Wilson et al., 2014) to validate the convective cloud identification method developed here. Cloud mask data at 1 km resolution (from the MYD35 Cloud_Mask product) are used to compare with the near-simultaneous cloud identification result from our method.
2.2.3 Particulate matter (PM) data
In previous studies, aerosol optical depth (AOD) (Andreae, 2009; Niu and Li, 2012; Wang et al., 2018), visibility (Chen et al., 2016), aerosol concentration with diameters between 100 nm and 3 µm (Zhao et al., 2018b, 2019; Yang et al., 2019), and particulate matter up to 10 µm in diameter (PM10) (Guo et al., 2016) were used as proxies for cloud concentration nuclei (CCN). However, satellite AOD retrievals can only be made in cloud-free conditions, near-cloud retrievals are frequently influenced by cloud contamination (Li et al., 2009), and the value is always influenced by the moisture of the atmosphere (Boucher and Quaas, 2012). In addition, remote-sensing methods cannot distinguish the part of the CCN size spectrum smaller than about 0.05 µm from atmospheric gas molecules. On the other hand, particulate matter can be measured from the surface or aircraft under all-sky conditions and can provide dried particle masses which can minimize the influence of moisture on it. In addition, as eastern China is under continuous emissions of newly formed particles and precursor gases, particles tend to grow into nucleation mode easily, forming CCN and leading to activations. In addition, CCN concentrations are to some extent proportional to aerosol loading (Andreae, 2009; Liu and Li, 2014). Zhang et al. (2019) found that the CCN number concentration increases with the total aerosol number concentration and PM during haze events. Particle size up to 10 µm may be much larger than the typical scale of CCN, so particulate matter up to 1 µm (PM1) or 2.5 µm (PM2.5) in diameter is more suitable to serve as CCN proxies. Due to the limited availability of PM1 measurements in eastern China, we chose PM2.5 as an indicator of different CCN levels in the environment for this study.
Figure 1 also shows the mean value of PM2.5 measured at 1205 ground-based stations across eastern China during the warm months (May–September) in 2016/17. The average PM2.5 mass concentration generally lies between 20 and 60 µg m3, with higher values over the Beijing–Tianjin–Hebei region. Although not uniformly distributed, the ground stations cover almost all regions in eastern China. Note that these stations provide hourly observations of PM10 and PM2.5 concentrations.
2.2.4 Reanalysis
In order to assess the impact of meteorological factors on convective clouds, and to analyze the dependence of the aerosol–convective cloud relationship on meteorological conditions, we adopt meteorological variables from the fifth-generation ECMWF (European Centre for Medium-Range Weather Forecasts) reanalysis for the global climate and weather (ERA5) and the second Modern-Era Retrospective analysis for Research and Applications (MERRA-2) reanalysis dataset (Gelaro et al., 2017). To evaluate how convective cloud fraction changes with respect to terrain height under different meteorological conditions, and to gain insight into whether the aerosol effects are independent of other factors that might influence convective cloud triggering and development during daytime, we chose the following factors to characterize the dynamics and thermodynamics of the environment; all these parameters are obtained at a spatial resolution of 0.5∘ × 0.5∘ and a temporal resolution of 3 h.
Convective available potential energy (CAPE). CAPE is adopted from the ERA5 reanalysis dataset, which is calculated from the ECMWF Integrated Forecasting System (IFS), by considering parcels of air departing at different model levels below the 350 hPa level (Hersbach et al., 2018). Numerous studies have shown that CAPE is a good indicator of atmospheric instability (Williams et al., 2002) and can reflect the potential ability of convective cloud formation and development.
Potential temperature. Temperature, especially lower-level atmospheric temperature, plays a critical role in triggering the development of convective clouds. As air temperature decreases systematically with altitude in most places, it is not correct to directly compare temperatures over different terrain. As the potential temperature is conserved regardless of height, it reflects the near-surface heating to some extent. Additionally, Wang et al. (2018) point out that selecting potential temperature avoids some duplication of temperature and humidity information. Thus, potential temperature is adopted, and we use the temperature at 2 m to calculate the near-surface potential temperature (θ) in this study.
Vertical velocity. Vertical velocities at 800 hPa (ω800) and 900 hPa (ω900) are chosen to investigate the role of vertical airflow in convection. As vertical motion over different terrain may vary, this factor can produce large differences in convective cloud occurrence frequency. We use ω800 and ω900 to represent the low-level dynamical conditions for terrain above and below 1000 m, respectively, so that we can roughly assess the ω at about 1000 (above the surface) in these regions despite varying terrain height. ω > 0 represents downward air motion, whereas ω < 0 means the air motion is upward. Uncertainty lies in the different distances between the 800 and 900 hPa level and cloud base. There are likely large differences in the updraft strength between these two levels and the cloud bases in some cases. However, in the formation of convective clouds, the vertical velocity between the surface and cloud base is more essential in transporting vapor and energy to higher levels. As these two levels cover most of the surfaces above and below 1000 m and can reflect the vertical velocities beneath cloud to some extent, we chose to use them as reference values to represent the dynamical conditions when convective clouds occur.
Humidity. Water vapor supply is essential to the formation and development of convective clouds (Redelsperger et al., 2002; Chakraborty et al., 2018) and is a crucial component of cloud water condensation and evaporation in aerosol–cloud interactions (Altaratz et al., 2014). As convective cloud formation is more sensitive to the under-cloud and near-surface water vapor content, similar to vertical velocity, relative humidity (RH) data at 800 hPa (RH800, for regions with TH ≥ 1000 m), and 900 hPa (RH900, for regions with TH < 1000 m) are employed, and the specific humidity at 2 m (q) is adopted to represent the near-surface water vapor content.
3.1 A convective cloud identification method
Numerous previous studies have attempted to develop methods for detecting and classifying cloud features, including convective clouds, based on satellite observations. One of the most common methods for identifying cloud is thresholding (Williams and Houze, 1987). However, Wielicki and Welch (1986) found that the identified cloud fraction depends strongly on threshold values, as cumulus cloud reflectance varies greatly within individual clouds and at cloud edges. As a result, many studies now adopt digital image processing to help identify shallow convective clouds more accurately.
One widely used image processing method is textural analysis, which adopts second-order statistics representing the texture of the digital image, as first proposed by Haralick (Haralick et al., 1973). This method, known as the gray level co-occurrence matrix (GLCM) method, was applied by Welch et al. (1988a, b) in their Landsat data analysis of marine stratocumulus cloud texture. The GLCM is a matrix of counts/frequencies of gray values for pairs of pixels, whose relative positions are defined by the polar coordinates (d, θ). The formula can be written as
where Pr{E} denotes the probability of event E, I represents the image matrix of size m × n (in this study, m = 1251 and n = 1001, as both the zonal and meridional spatial resolutions are 0.02∘ in the ROI), and (x1,y1) and (x2, y2) are the two elements in I with gray tone values i and j, which are separated by distance d in direction θ. The unit of d is a pixel, and θ always takes 0, 45, 90, and 135∘. The maximum difference between i and j defines the size of GLCM. When the frequency of the (i,j)th element is more concentrated near the off-diagonal of the GLCM, the image contains more complex texture (Fig. S1 in the Supplement). To define texture properties from the GLCM, several statistical image variables are derived from this matrix, including “contrast”, “homogeneity”, “energy”, and “entropy” , etc. (Haralick, 1979; Welch et al., 1988c; Baum et al., 1997; Bottino and Ceballos, 2014). The contrast measures the intensity contrast between a pixel and its neighbors, assessed over the entire image. Homogeneity measures the closeness to the diagonal of the GLCM element distribution. Energy, also termed the angular second moment, measures the complexity of the image, and entropy measures the degree of randomness.
The objective of this section is to identify new and mature convective clouds. As the edges of convective clouds tend to be very sharp (Purdom, 1976) in visible channel images, large differences between i and j occur. Thus, large contrast values can be found (Eq. 2) at the edge of convective clouds. The formula is
We use the mean contrast data at d=1 in the four directions (θ = 0, 45, 90, and 135∘ ) calculated from the visible channel (0.64 µm) to identify convective clouds.
Besides this parameter, we also employ the visible reflectance (VIS, 0.64 µm) and brightness temperatures (Tb) at 11.2 and 12.4 µm to help identify the distinctive patterns of convective clouds. The spatial gradient of Tb (11.2 µm) helps exclude very-low-elevation fogs, whose temperatures are close to that of the surface in the morning. We use these three parameters in a k-means clustering analysis. Five clusters are classified, and the mean contrast values are calculated. Those clusters with relatively higher contrast (with mean contrast > 3.5, which is the second smallest among all the cluster mean contrast values) are considered either small convective clouds or the edges of mature convective clouds.
Unlike stratus clouds produced by large-scale systems, mature local convective cloud tops tend to have very high VIS reflectance and small area (Lima and Wilson, 2008). As the cloud tops of mature convective clouds are also relatively flat, they produce small contrast values. We consider those clusters having an area smaller than 40 000 km2 (10 000 pixels), mean VIS reflectance larger than 0.75, and maximum VIS reflectance larger than 0.9 to be the tops of mature convective clouds.
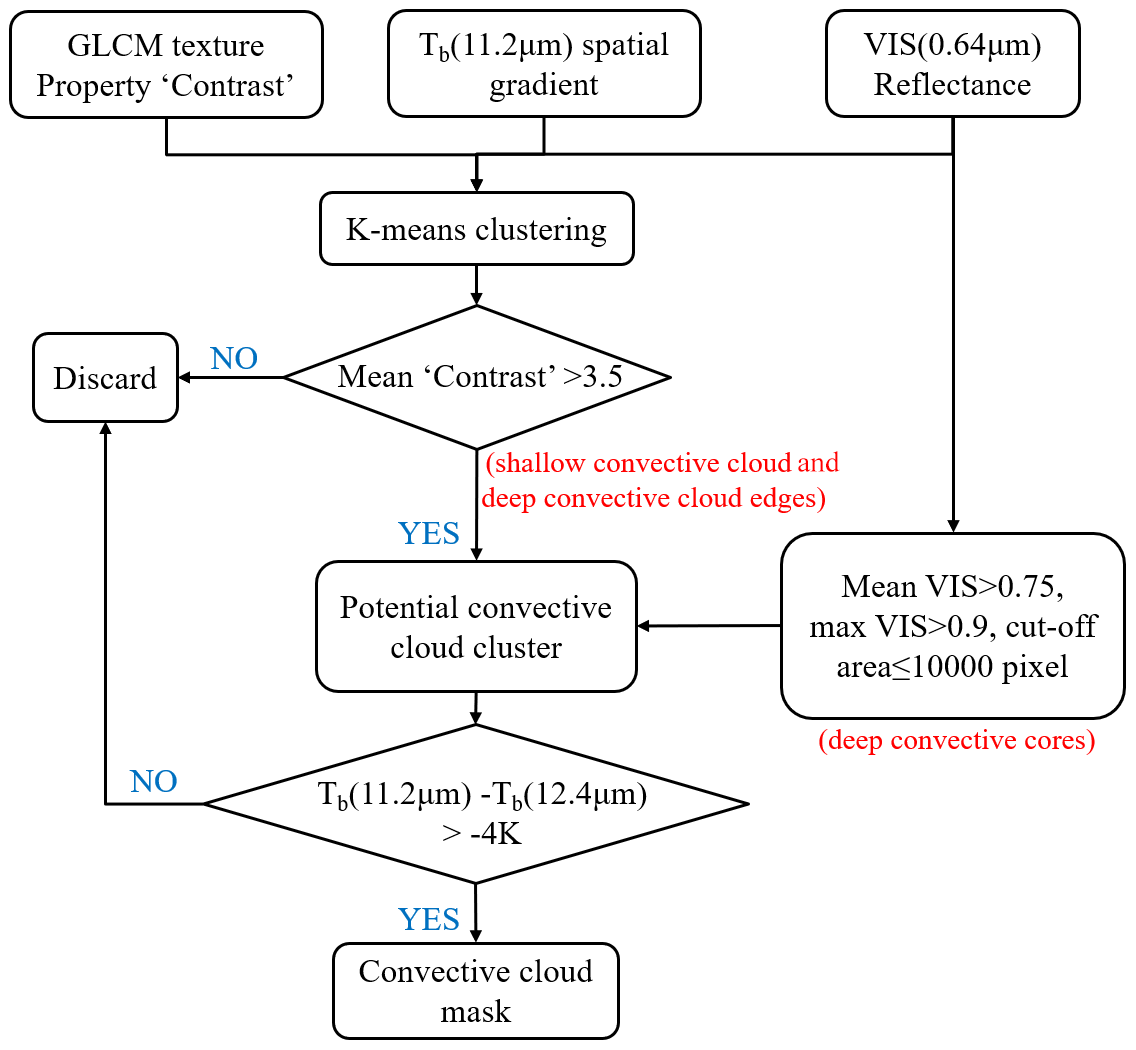
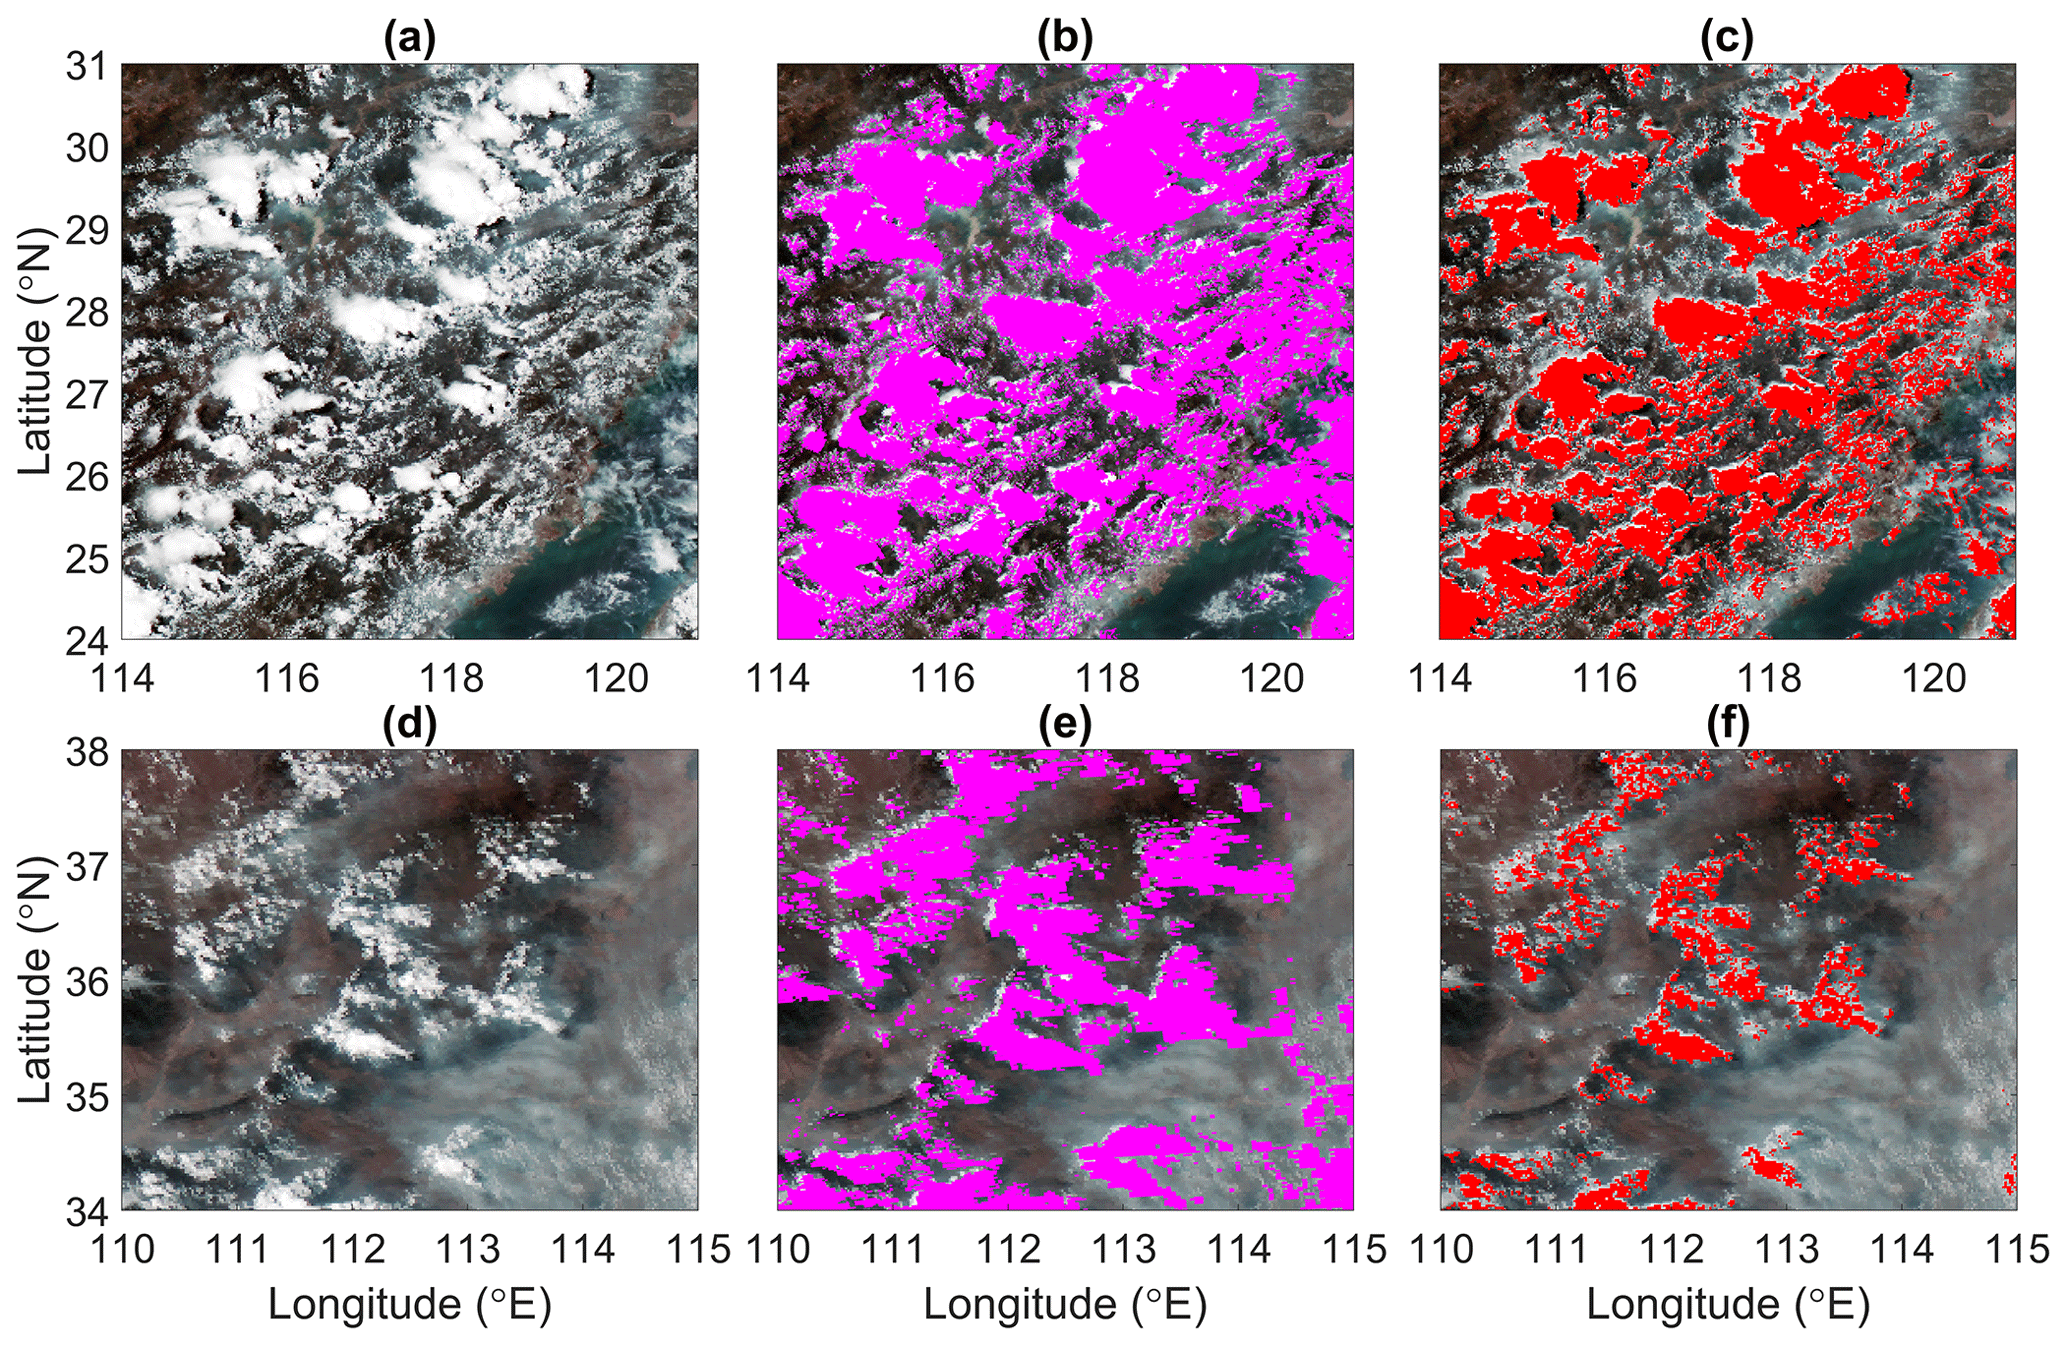
Figure 3Comparisons between MODIS cloud mask and the cloud identified by our convective cloud (CC) mask, at 13:40 LT on 30 July 2016 and 14:20 LT on 22 June 2016. (a, d) The true-color image, (b, e) MODIS cloud mask data from the MYD35 product (magenta points), and (c, f) convective clouds (CC) identified using the TCT-CID method.
In addition, we adopt the split-window technique to exclude cirrus (Mecikalski and Bedka, 2006). The brightness temperature differences between 11.2 and 12.4 µm are near zero for convective clouds, and we exclude those pixels with brightness temperature differences less than −4 K. This allows us to produce a cloud mask with a high probability of isolating convective clouds. Figure 2 shows the entire flowchart of our convective cloud identification method.
As we identify convective clouds using the combined results from texture analysis, clustering, and thresholding, we name this cloud identification method the texture–clustering–thresholding convection identification (TCT-CID) method.
3.2 Validation of the convective cloud mask
Figure 3 presents two examples of convective clouds identified in the hilly regions in southern China at 13:40 LT on 30 July 2016 and in the mountain regions in northern China at 14:20 LT on 22 June 2016. To get a general idea of the performance of the TCT-CID method, we compare the identified convective cloud mask against the MODIS Aqua MYD35 cloud mask. As the MODIS product does not classify clouds into different types, a scene which contains a vast convective cloud field and a scene with sparse convective clouds are chosen. Figure 3a and d show the true-color image of the scene we chose. Figure 3b and e and c and f are the MODIS cloud mask data and the convective cloud mask from our method, respectively. We can see that there is a relatively good agreement between the MODIS cloud mask and that identified by our method, especially for the deep convective clouds.
The method is designed to find sharp edges and bright clusters in VIS images firstly, but as some of the high clouds may also fit these conditions, which are not the subject of this study, we added a split-window filter to exclude this kind of clouds. However, the addition of this filter will also exclude the anvils of some mature convective clouds and some of the shallow clouds, so the cloud area identified by our method is smaller than the cloudy area found by the MODIS cloud mask, and the capability of shallow convection identification is limited. Nevertheless, the majority of convective clouds are well captured by our method. In order to validate the result of convective clouds identified by the TCT-CID method statistically, we compared the identified convective cloud mask with the Himawari-8 Level 2 cloud type data from the L2CLP010 product. This product provides the cloud type information using the ISCCP cloud classification criteria, which defines cloud type using specific combinations of cloud top pressure (CTP) and cloud optical thickness (COT) (Rossow and Schiffer, 1991). A COT–CTP diagram is created to differentiate cloud types with different radiative feedbacks. This method provides to some degree an accurate identification and classification of various cloud types. In this study, we compared the identified convective cloud masks with the L2CLP cloud type product. The frequencies of different cloud types corresponding to the identified convective cloud masks are calculated as the percentage of the convective cloud mask pixel count that matches each ISCCP cloud type to all the cloud mask pixels (Fig. S2 in the Supplement). We can find that the frequencies of deep convective cloud (DCC) and stratocumulus (Sc) are relatively significant, especially around noontime, which indicates that the TCT-CID method is effective at identifying deep convective clouds and stratocumulus clouds. Other cloud types, such as altostratus, nimbostratus, and cumulus cloud also show relatively large amounts. These cloud types can be seen as representing different stages in the development of convective clouds. Although their frequencies only exceed the median but not the 2σ values of the distributions, they still show significant differences from the frequency of cirrus, stratocirrus, altocumulus, and stratus. After 16:00, as the solar zenith angle grows, the cloud top reflectance increases significantly. The criteria of the TCT-CID method become less strict, so that cloud identification errors increase. Nevertheless, the frequency of DCC still passes the 2σ line, which implies that deep convection is the most robust cloud type that can be identified by the TCT-CID method.
These results suggest that the identification by the TCT-CID method is relatively reliable in studying the convective cloud properties and their relationship with aerosols.
3.3 Convective cloud fraction at different terrain heights in polluted or clean environments
In order to isolate the potential effect of topography on the aerosol–convective cloud relationship, in this study we investigate the convective cloud fraction (CCF) changes along with TH at different levels of aerosol loading. The CCF under clean (or polluted) conditions (CCFC(P)) within each elevation bin h is calculated using the formula shown below:
where represents the number of convective clouds occurring under clean (C) or polluted (P) conditions in the (i,j)th pixel box in the ROI during hour t, and Ntotal|h (i,j) represents the total number of convective clouds observed in each pixel box during the 08:00–17:00 daytime period. For each CCF bin, i and j denote the pixels within the region with elevation h. Sample sizes are shown in Fig. S3 in the Supplement.
By normalizing the occurrence frequencies by the total number of polluted and clean cases within each hour, we explore how topography changes the polluted and clean convective clouds spatially. The normalized CCFC(P) (NCCFC(P)) is computed as
The NCCFC(P) is also calculated with i and j at each elevation bin h. Unlike CCFC(P) (Eq. 3), the denominator for NCCFC(P) (Eq. 4) is not summed over all studied times of day but over the entire ROI (the size of which is m × n pixels) within each hour. NCCF focuses more specifically on how CCF at a given location and terrain elevation compares with all locations at the same elevation and the same time, reducing the influence of diurnal variation and emphasizing elevation-related differences. As such, the difference in NCCFC(P) between clean and polluted cases reflects the difference caused by topography when the overall environment is under clean or polluted conditions.

Figure 4Diurnal cycle of convective cloud (CC) occurrence frequency (OF) during daytime. The gray contour lines in each figure represent the terrain height (TH) at 1000 m. Most locations west of the contour line have TH > 1000 m, whereas terrain east of the contour lines has TH < 1000 m.
4.1 The diurnal cycle of convective clouds
We use the L1 data from Himawari-8 acquired from May to September in 2016 and 2017 to identify local convective clouds over eastern China and build the spatial distribution of convective clouds. Figure 4 shows the frequency of convective clouds occurring between 08:00 and 17:00 LT, calculated by dividing the number of convective clouds observed in six observations per hour (one every 10 min, e.g., from 08:00–08:50) by the accumulation between 08:00 and 17:00. The study period includes 20 455 Himawari images, containing more than 2000 samples within each pixel each hour. Convective cloud occurs predominantly over the sea in the morning and gradually shifts inland after local noon. This convective cloud occurrence pattern is driven by distinct differences in the specific heat capacities and boundary-layer thermodynamics over land and ocean. In the morning, radiative cooling and land breeze contribute to the formation of convective clouds over the ocean, whereas temperatures near the land surface tend to be relatively low, which makes it difficult for convective clouds to form there at this time of the day. But in the afternoon (local time), as land surface temperatures increase, the near-surface air layer becomes more unstable, making it easier for convective clouds to form. The accumulation of land-surface heating during the day also favors the development of deep convection in the afternoon. Such patterns are highly consistent with previous studies (Garreaud and Wallace, 1997; Sui et al., 1997; Yang and Slingo, 2001; Li et al., 2010).
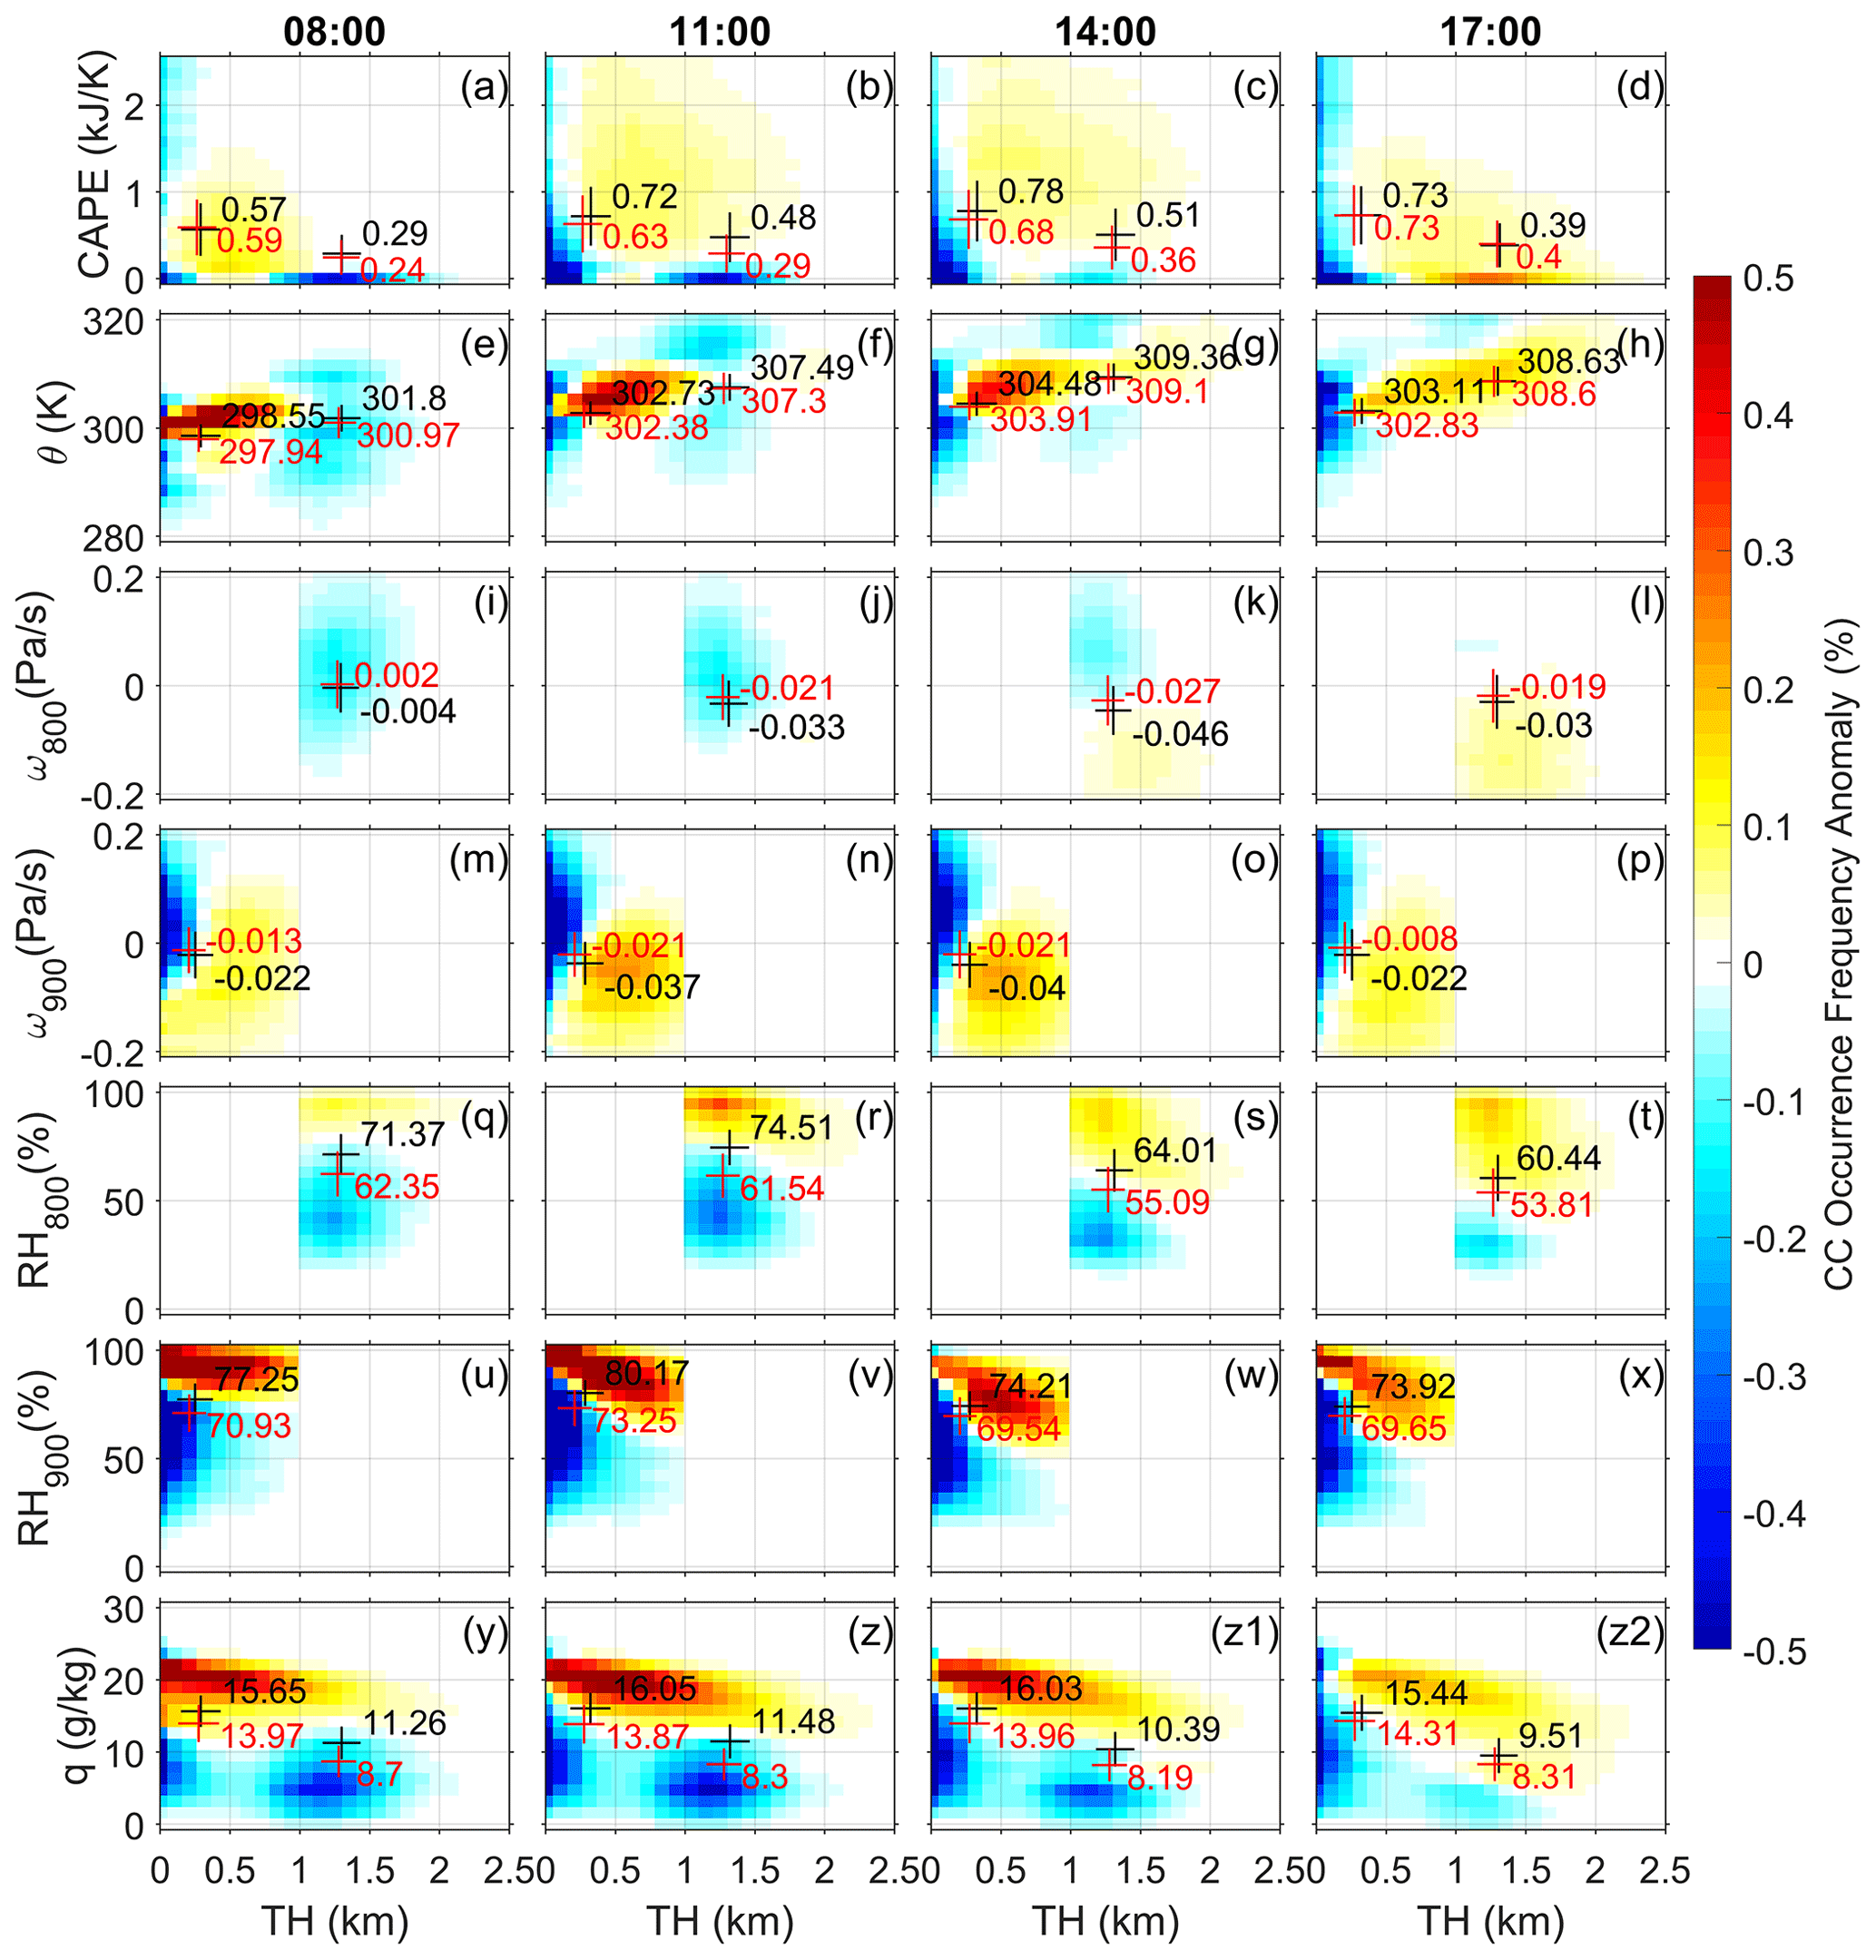
Figure 5Over-land convective cloud occurrence frequency (CC OF) anomaly with respect to terrain height (TH) and (a–d) convective available potential energy (CAPE), (e–h) potential temperature (θ), (i–l) vertical pressure velocity at 800 hPa (ω800) over terrain above 1000 m, (m–p) vertical pressure velocity at 900 hPa (ω900) over terrain below 1000 m, (q–t) relative humidity at 800 hPa (RH800) over terrain above 1000 m, (u–x) relative humidity at 900 hPa (RH900) over terrain below 1000 m, and (y–z2) specific humidity at 2 m (q). The columns represent local times over the ROI of 08:00, 11:00, 14:00, and 17:00, respectively. Black (red) crosses and the numbers beside them mark the mean values of the variables with convective cloud (under all-sky conditions) over regions with terrain height below 1000 m and above 1000 m; crosses mark the SDs of the variables. Grid points are plotted only if they exceed the 95 % significance level (p < 0.05) according to the Pearson χ2 test.
To further validate the identification results, the statistical patterns of convective cloud masks are investigated in Figs. 4 and 5. The impact of diurnal solar radiation variation and topography on convective clouds is already well understood (Houze, 2012, 2014), and thus, these results serve as further support for our cloud identification method. The black lines in Fig. 4 mark the 1000 m surface elevation contour, which is approximately the boundary between the plains and elevated terrains. Around 13:00–14:00 LT, convective clouds begin to form over the elevated regions, and the amount begins to increase afterwards (Fig. 4).
Figure 5 shows the joint distribution of convective cloud occurrence frequency (CC OF) anomaly with respect to terrain height (TH) over land and associated meteorological factors. Vertical velocities and relative humidity at 800 and 900 hPa are used as proxies for the basic state of dynamics and water vapor for regions with elevation above and below 1000 m, respectively.
Due to the different sample sizes over terrains of different elevations (Fig. S3), CC OFs tend to have two peaks, at heights below 500 m and above 1000 m (Fig. 5a–d). Thus, the mean values and SDs are calculated below and above 1000 m, respectively. Convective clouds tend to require more unstable conditions and higher surface potential temperature. The CAPE can be 0.02–0.19 kJ K−1 higher when convective clouds occur compared to all-sky conditions, and the differences can be about 0.05–0.1 kJ K−1 larger over higher terrains (TH > 1000 m). The mean values of θ are always slightly larger than under clear-sky conditions when convective clouds occur. Further, θ values increased by nearly 10 K for convective clouds to be favored at higher elevations. For dynamical conditions, shown in Fig. 5i–p, compared with the all-sky conditions, the CC OFs for both ω800 and ω900 tend to move slightly in the negative direction (i.e., upward motion) and become stronger from 08:00 to 14:00, with about 0.042 and 0.018 Pa s−1 decreases in the mean values for the higher and lower terrains, respectively. The differences are always larger over higher-altitude regions, especially around 14:00 LT.
The under-cloud relative humidity (RH) values (RH800 and RH900 for regions of TH > 1000 m and TH ≤ 1000 m, respectively) show a general increase when convective clouds occur and are closer to 100 % compared to all-sky conditions. In addition, the under-cloud RH over lower terrain is always higher than it is over higher-altitude regions during daytime (Fig. 5q–x). The stronger surface heating over higher terrain, which decreases the RH, may also contribute to this pattern. Also note that where convective clouds occur, specific humidity near the surface (q) is always higher. The mean q values are always about 4–6 g kg−1 larger for regions having TH ≤ 1000 m than for regions where TH > 1000 m (Fig. 5y–z2). This might indicate that, compared with higher-terrain regions, it is always moister over lower terrain, so it is more difficult for cloud droplets to evaporate in such places.
All these thermal, dynamical, and moisture conditions show relatively significant differences between the convective cloud conditions and the all-sky conditions, which indicates that the formation and development of convective clouds favor strong instability, surface heating, vertical velocity and water vapor supply. Such patterns show that our data conform to the expected patterns and can be used for the analysis presented below.
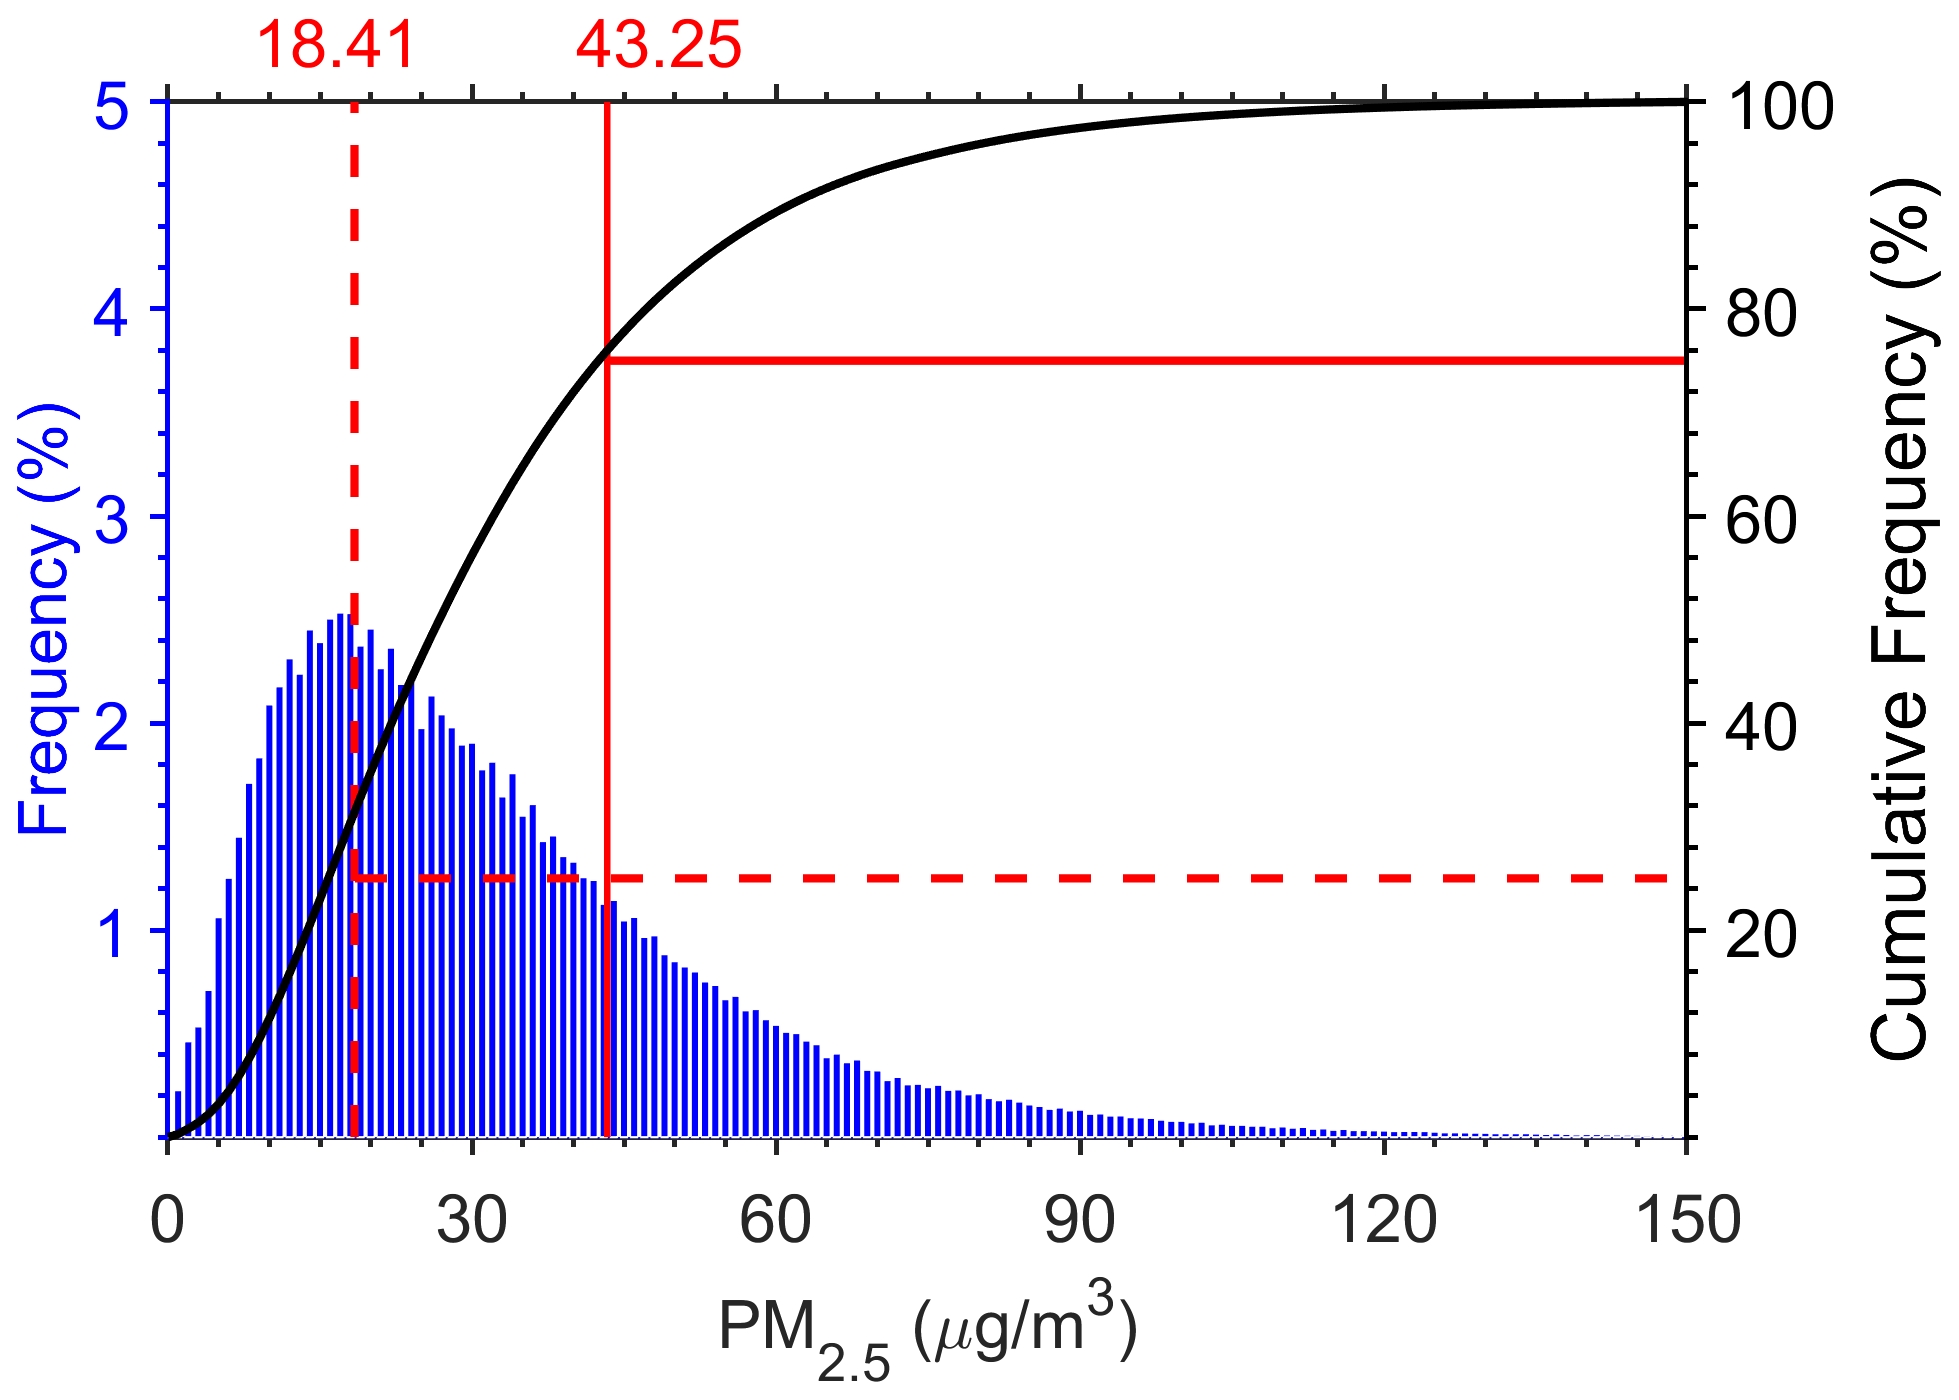
Figure 6Mean PM2.5 concentration distribution for 1205 sites over eastern China during daytime (08:00–17:00 LT). Blue bars and the black line show the frequency and cumulative frequency of mean PM2.5, respectively. The mean value of the top quarter is marked by the solid red line, and the mean value of the bottom quarter is marked with the dashed red line.
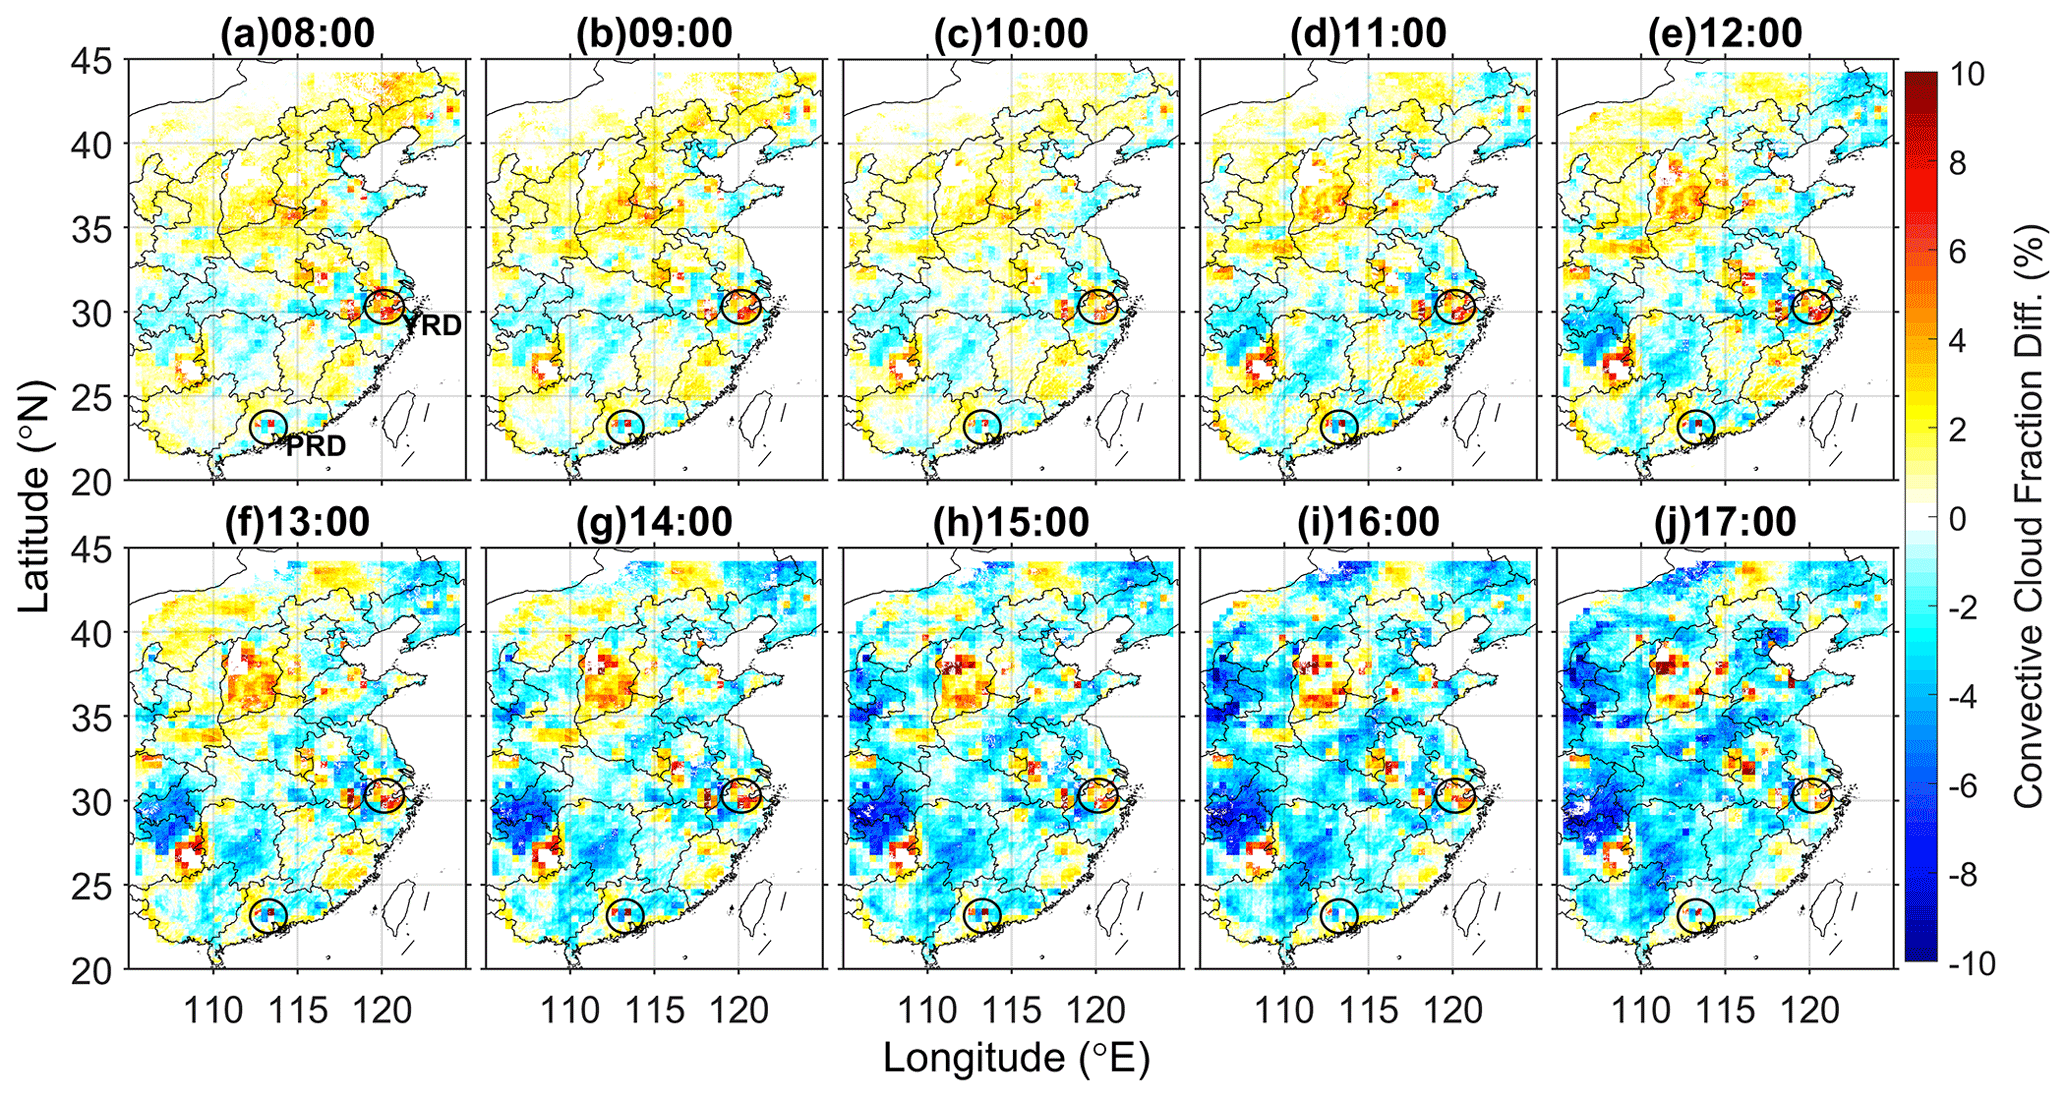
Figure 7Diurnal changes of convective cloud fraction (CCF) difference between polluted and clean conditions (polluted − clean) during May–September in 2016/17. Time marked above each figure is the local time. Black circles mark the Yangtze River Delta (YRD) and Pearl River Delta (PRD). (Note that grid points are plotted only if they exceed the 95 % significance level (p < 0.05) according to the Pearson χ2 test.)
4.2 Changes in convective cloud diurnal cycle associated with aerosol
In this study, PM2.5 observations from 1205 stations over eastern China are used as proxies for CCN, to roughly separate clouds into polluted and clean classes. We match the hourly measured PM2.5 with the 10 min convective cloud identification results by supposing the convective cloud observed in the same hour occurs under the same PM2.5 conditions. For each site, we use the top quarter of the PM2.5 concentration distribution as the criterion for identifying polluted cases and the bottom quarter as the clean cases (Fig. 6). We then aggregate them into a 0.4∘ × 0.4∘ grid using nearest-neighbor interpolation to create clean and polluted fields. The average clean and polluted thresholds over the ROI are shown as dashed and solid red lines in Fig. 6. All the convective clouds with their centroids located in the grid box are classified using the clean and polluted threshold value for that grid box. The centroids of convective clouds located within a grid box having PM2.5 concentration greater (less) than the polluted (clean) threshold are deemed polluted (clean) convective clouds. We calculated the CCF using the number of convective clouds under polluted (or clean) conditions divided by the total convective cloud amount within each grid cell. On average, 4.6 × 10⁷ (4.1 × 10⁷) pixels are deemed clean (polluted) convective cloud within each hour. Figure 7 shows the difference of CCF in polluted and clean environments. Warm (cold) colors in the figure mean that there are more (less) convective clouds under the polluted condition. Additionally, only those data points that exceed the 95 % significance level according to the Pearson χ2 test are plotted. From Fig. 7a to e, we find that before 12:00 LT convective clouds under polluted conditions generally occur in larger amounts, especially over the plateau region and some of the mountain regions. This pattern reverses gradually from 13:00 to 17:00 LT (Fig. 7f–j): the amount of convective clouds under polluted conditions tends to diminish, relative to those in clean conditions, in the afternoon. However, in several places, the CCF difference generally persists from morning to afternoon. Some red dots in southern and eastern China seem to occur over megacities, presumably related to the co-action of high aerosol loading and the urban heat island effect (e.g., for the megacities around Yangtze River Delta (YRD) and the Pearl River Delta (PRD), marked by black circles in the figure). There are also red dots located near several mountain areas, as complex topography may also be related to such a phenomenon. Furthermore, different topography may also lead to different convective cloud response to aerosol loading. Over northern China, more convective clouds form over mountains under polluted conditions, whereas over the central China plain, with mountains around, convective clouds may be suppressed all the time by high aerosol loading. The number distribution of convective cloud clusters in each area bin, aggregated over the entire ROI, is shown in Fig. S4 in the Supplement. Polluted convective cloud covers a larger area than clean convective cloud early in the day; this pattern gradually reverses after 13:00 LT, starting from the decrease in number of smaller convective cloud clusters. And after 14:00 LT, convective cloud area under clean conditions dominates. This pattern may suggest that high aerosol loading is perhaps one of the factors that inhibits the formation of small convective clouds in the afternoon.
In an attempt to assess the effects of pollution on diurnal convective cloud behavior, the influence of other meteorological factors is addressed later in Sect. 4.4 by stratifying the data based on such factors. We note here only that a relatively clear diurnal pattern in CCF exists and that pollution effects appear to be correlated with this pattern.
Koren et al. (2008) demonstrated two opposite effects of absorbing aerosol on cloud cover, i.e., the microphysical effect and the radiation effect, by theoretical derivation, and verified this theory with observations in the Amazon region. Their study concluded that aerosol particles can increase cloud droplet number by serving as CCN. However, when aerosol concentration is higher, the attenuation of solar radiation by aerosol particles decreases the surface temperature, and atmospheric heating decreases the lapse rate, thus inhibiting sensible heat flux (Feingold et al., 2005). The decrease in the surface temperature also reduces evaporation (Koren et al., 2004), so that the atmosphere becomes drier and more stable, which suppress convection. As aerosol loading increases, surface temperature tends to decrease regardless of aerosol type (Gu et al., 2006; Jiang et al., 2013; Yang et al., 2016a, b, 2018). Thus, we can infer that under conditions of high aerosol loading, the vertical moisture flux may be suppressed, which would inhibit convective cloud formation. Therefore, investigating the diurnal variation in aerosol microphysical and radiative effects might help explain the patterns shown in Fig. 7.
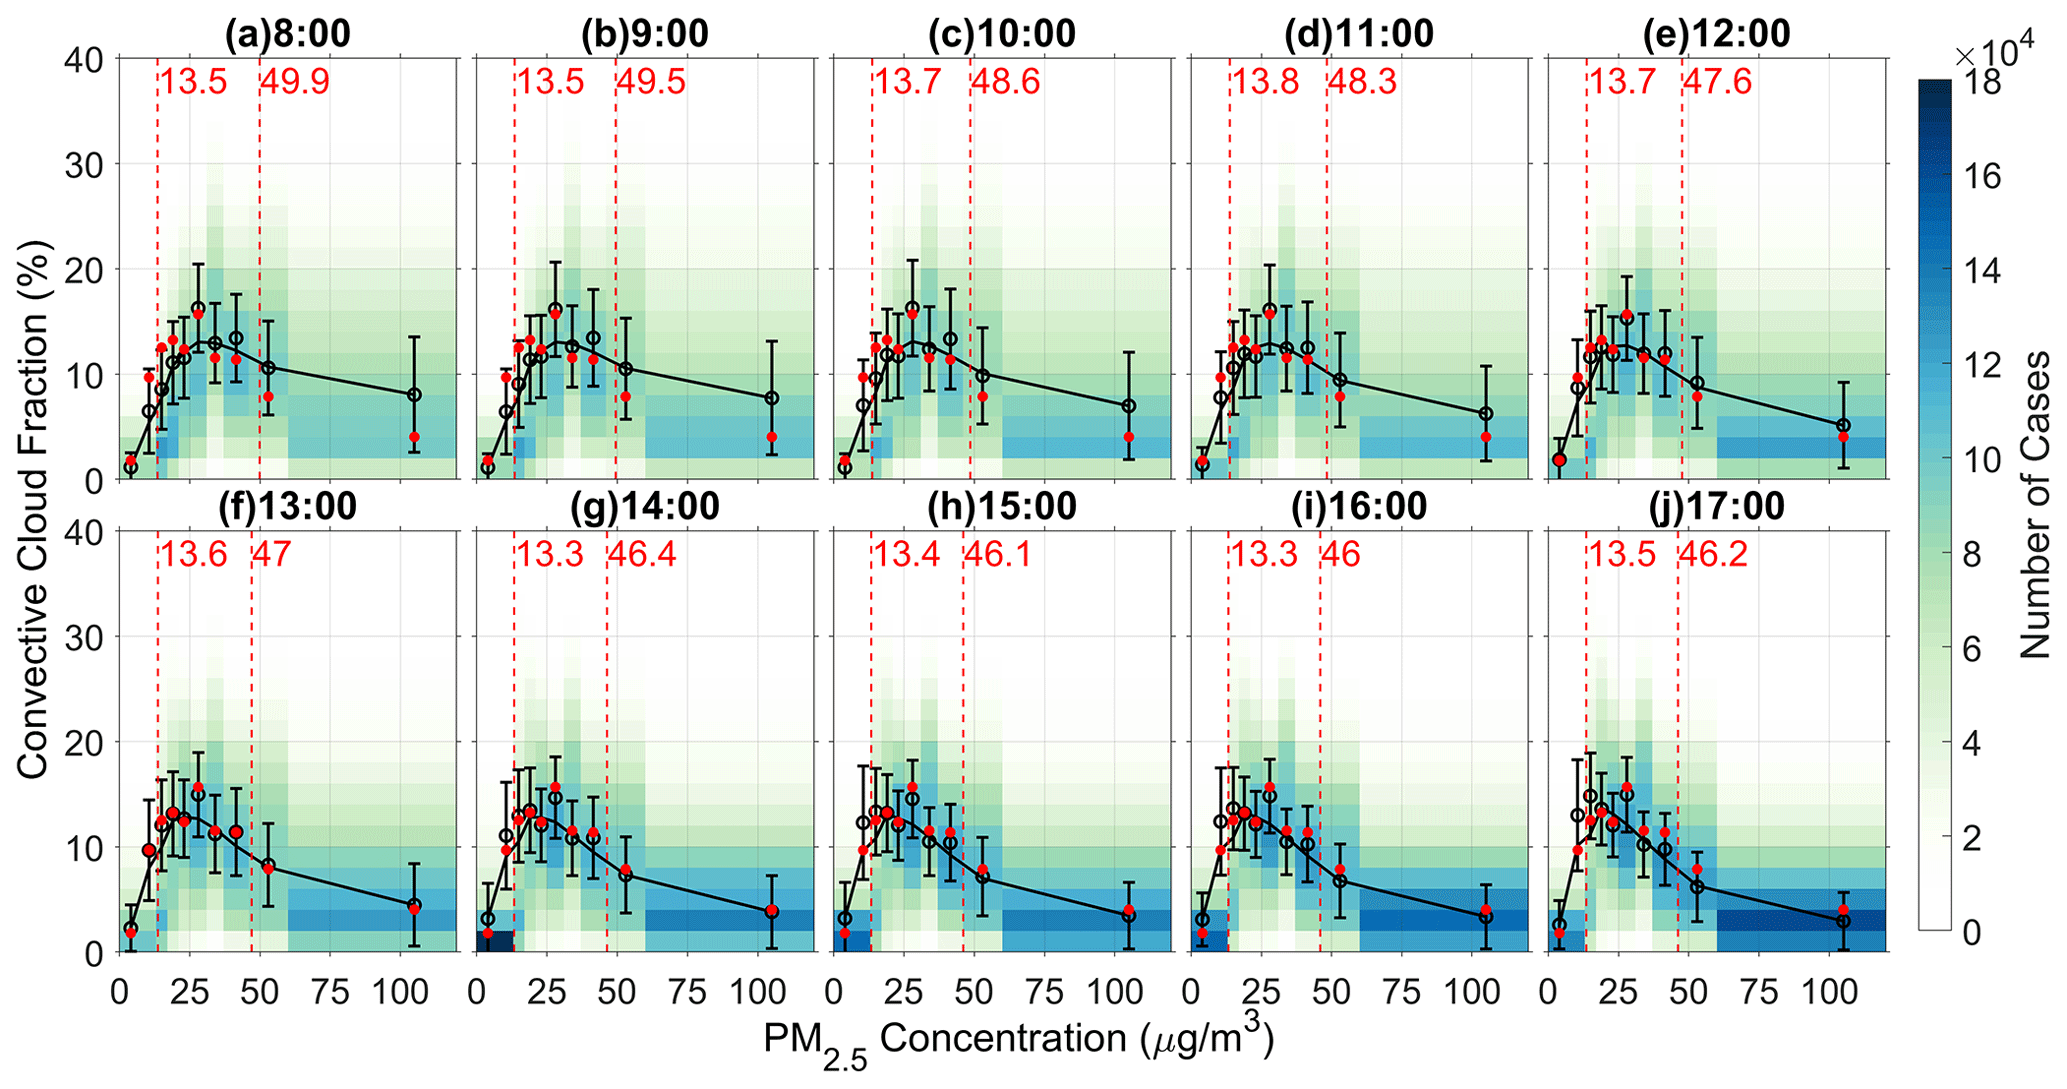
Figure 8Convective cloud fraction with respect to PM2.5 concentration at different times of day during May–September 2016/17. Color shading indicates the number of cases corresponding to each specific convective cloud fraction (CCF) and PM2.5 bin. Note that PM2.5 is separated into 10 equal-sample bins. Black circles and error bars are the mean values and SDs of CCF in each PM2.5 bin within each hour, red dots indicate the mean CCF over all times. Solid black lines represent the three-point moving average of the black circles. Dashed red lines (with red numbers) mark the mean polluted and clean thresholds during each hour.
Figure 8 shows the relationship between convective cloud and PM2.5 concentration. Ten equally sampled bins of PM2.5 concentration were defined, and we calculated the mean CCF within each bin using the convective cloud amount in each PM2.5 bin divided by the total convective cloud amount within the same area for all PM2.5 values. Sample sizes are shown in the color shaded background in each subfigure, and the mean sample number within each PM2.5 bin is ∼ 8 × 10⁵. The three-point moving average of the values is also plotted. We find that CCF first increases with respect to PM2.5 mass concentration and then starts to decrease; this pattern persists throughout the day. The PM2.5 mass concentrations at all turning points of the curves are between 20 and 30 µg m3. Similar results were also found by previous studies (Guo et al., 2017; Jiang et al., 2018; Wang et al., 2018). Adding to these previous results, we find that the relationship of PM2.5 and CCF persists throughout the day, as we have used high-resolution geostationary satellite data that provide us ample samples at different times. Furthermore, the aerosol effect on convective cloud is likely to be robust not only for deep convective clouds, but also for convective clouds at any stage of development. This pattern might be attributed to the competition between the microphysical effect dominating at low PM2.5 concentration and the radiative effect becoming increasingly important at higher PM2.5 concentration. This may also explain the phenomenon in Fig. S4. As solar radiation begins to wane in the afternoon and surface heating weakens, the high aerosol loading would suppress convection via the dominance of the radiative effect, thus inhibiting the formation of small convective clouds.
The CCF values corresponding to the average thresholds identifying clean and polluted conditions (marked as vertical dashed red line pairs with numbers in each Fig. 8 panel) generally tend to be higher under polluted than under clean conditions from 08:00–11:00 LT, whereas from 12:00–17:00 LT the pattern gradually reverses. The shapes of the moving average curves change slightly from morning to afternoon compared with the mean CCF over all times (red dots), where CCF is lower in the morning before the tipping point but higher in the afternoon, and after the tipping point, CCF is higher in the morning but lower in the afternoon. As we found from Figs. 5 and 7, meteorological condition changes associated with topography and diurnal solar radiation variations may play roles in altering the shapes of the CCF curves. For conditions with PM2.5 concentrations lower than the 20–30 µg m3 turning zone, more convective cloud is formed, presumably due to more unstable environments and stronger surface heating, especially in the afternoon. But as both the surface and the air above are generally moister before noontime (Fig. 5q–z2), the higher moisture may suppress cloud droplet evaporation and thus keep CCF from sharply decreasing.
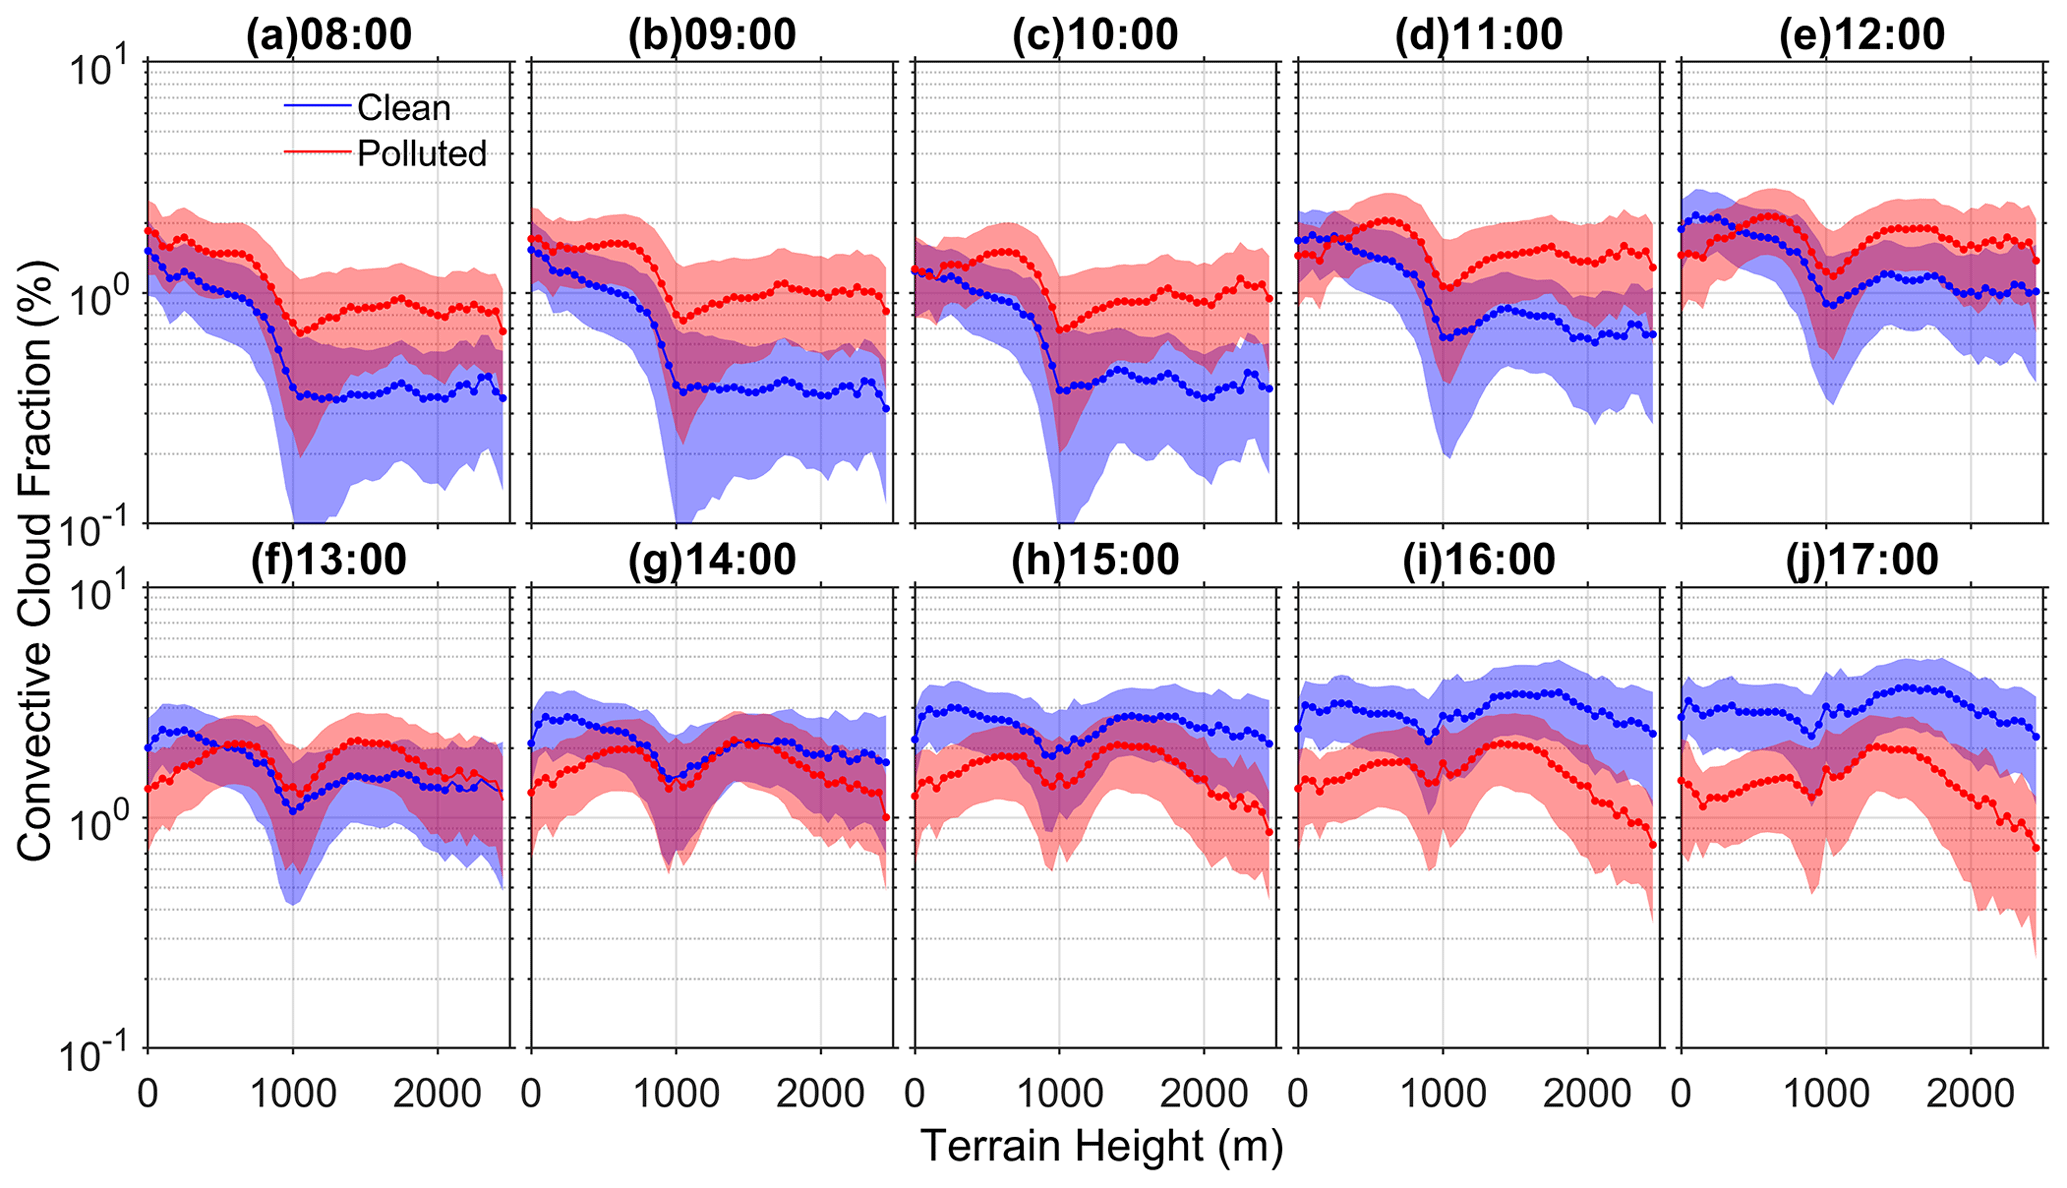
Figure 9Convective cloud fraction (CCF) normalized by the total number of cases with respect to terrain height changes during May–September 2016/17. Data for polluted conditions (CCFP) are plotted in red, whereas those for clean conditions (CCFC) are shown in blue. Solid lines and shaded parts are the mean values and SDs of the fractions in each TH bin. Dots are plotted only if the difference between clean and polluted cases exceeds the 95 % significance level (p < 0.05) according to Student's t test.
4.3 Effects of topography on the aerosol–convective cloud relationship
The CCFs at different TH in both polluted (CCFP) and clean (CCFC) conditions are shown in Fig. 9 (calculated by Eq. 3). We find that the CCF difference between polluted and clean conditions generally agrees with Fig. 7 in that CCFP is higher in the morning and lower in the afternoon, and the differences are statistically greatest in early morning and late afternoon. In addition, the differences between CCFP and CCFC vary considerably along with increasing TH, which may indicate that the effects of topography and air quality on CCF co-vary, and the impact of topography might be much stronger compared with increased aerosol loading.

Figure 10Same as Fig. 9, but for CCFC(P) which is normalized by the number of cases under polluted and clean conditions during each hour, i.e., NCCFC(P), respectively (Eq. 4).
There is also another aspect of these phenomena. Because the elevation-related response reverses over the day (e.g., Fig. 9), we applied NCCFC(P) to reduce the impact of diurnal variations. We can see from Fig. 10 that below the elevation of 500 m, most of the convective clouds are suppressed under polluted conditions, whereas over regions with terrain height greater than 1000 m, the amount of convective cloud under polluted conditions is significantly larger before 14:00 LT. This phenomenon may partly explain the results shown in Fig. 7, where complex topography plays an important role in the aerosol effect on convective clouds. Under polluted conditions, convective clouds over lower terrain are much easier to suppress, whereas over elevated terrain, convective clouds are more likely to be invigorated.
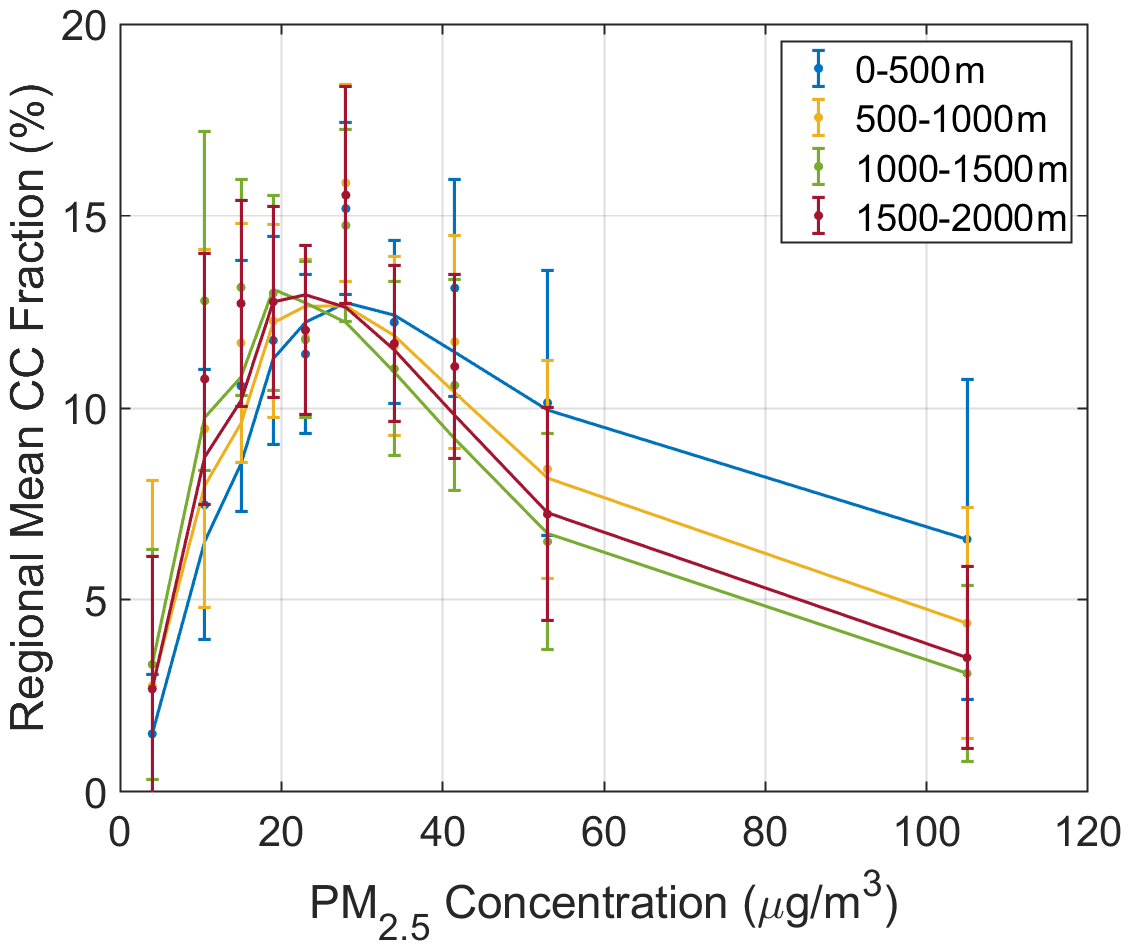
Figure 11Convective cloud fraction (CCF) over regions with terrain heights in the ranges 0–500 (blue), 500–1000 (yellow), 1000–1500 (green), and 1500–2000 m (red) with respect to PM2.5 concentration during May–September 2016/17. Ten equally sampled PM2.5 bins are defined for each terrain height range. The SDs are shown as error bars. Each solid line represents the three-point moving average for dots in the corresponding color.
As the topography over eastern China has a general step-like distribution, we roughly separate the terrain heights into four bins representing the plains (0–500 m), mountain ranges (500–1000 m), plateau (1000–1500 m) and high mountains (1500–2000 m), and we assess how the aerosol effect changes over different topography. The pixel number within each bin is over 4.0 × 10⁵, 1.6 × 10⁵, 2.3 × 10⁵, and 0.5 × 10⁵. We calculate the CCF using the number of convective clouds within each of 10 equally sampled PM2.5 bins divided by the total convective cloud amount over each sub-region. Each pair of CCFs in the four sub-regions is significantly different at the 95 % significance level according to Student's t test. Figure 11 shows how cloud fraction changes with respect to PM2.5 concentration over the four different terrain elevation ranges. In all four sub-regions, CCF first increases with PM2.5 concentration and then decreases. But before the turning zone (between 20–30 µg m3) the CCF is slightly higher over mountains and plateaus than over the plains, but after the turning zone, this pattern generally reverses. This presumably occurs because instability and surface heating are stronger over the higher terrain, which invigorates the convective cloud development by enhancing the aerosol microphysical effect (Rosenfeld and Lohmann, 2008). The air over the plain regions is moister than that over the mountain and plateau regions, which suppresses droplet evaporation and thus tends to overtake the aerosol radiative effect. Over higher terrains (TH > 1000 m), aerosol concentrations are relatively low, and the effect of topography might play a more important role. Surface heating is relatively stronger at the high mountains (TH > 1500 m), which may dominate the trend of decreasing CCF after the turning zone, so that the inhibition of convective cloud by aerosol radiative effect is weaker, and the CCF is higher than the plateau regions (1000 < TH ≤ 1500 m) after the turning zone.
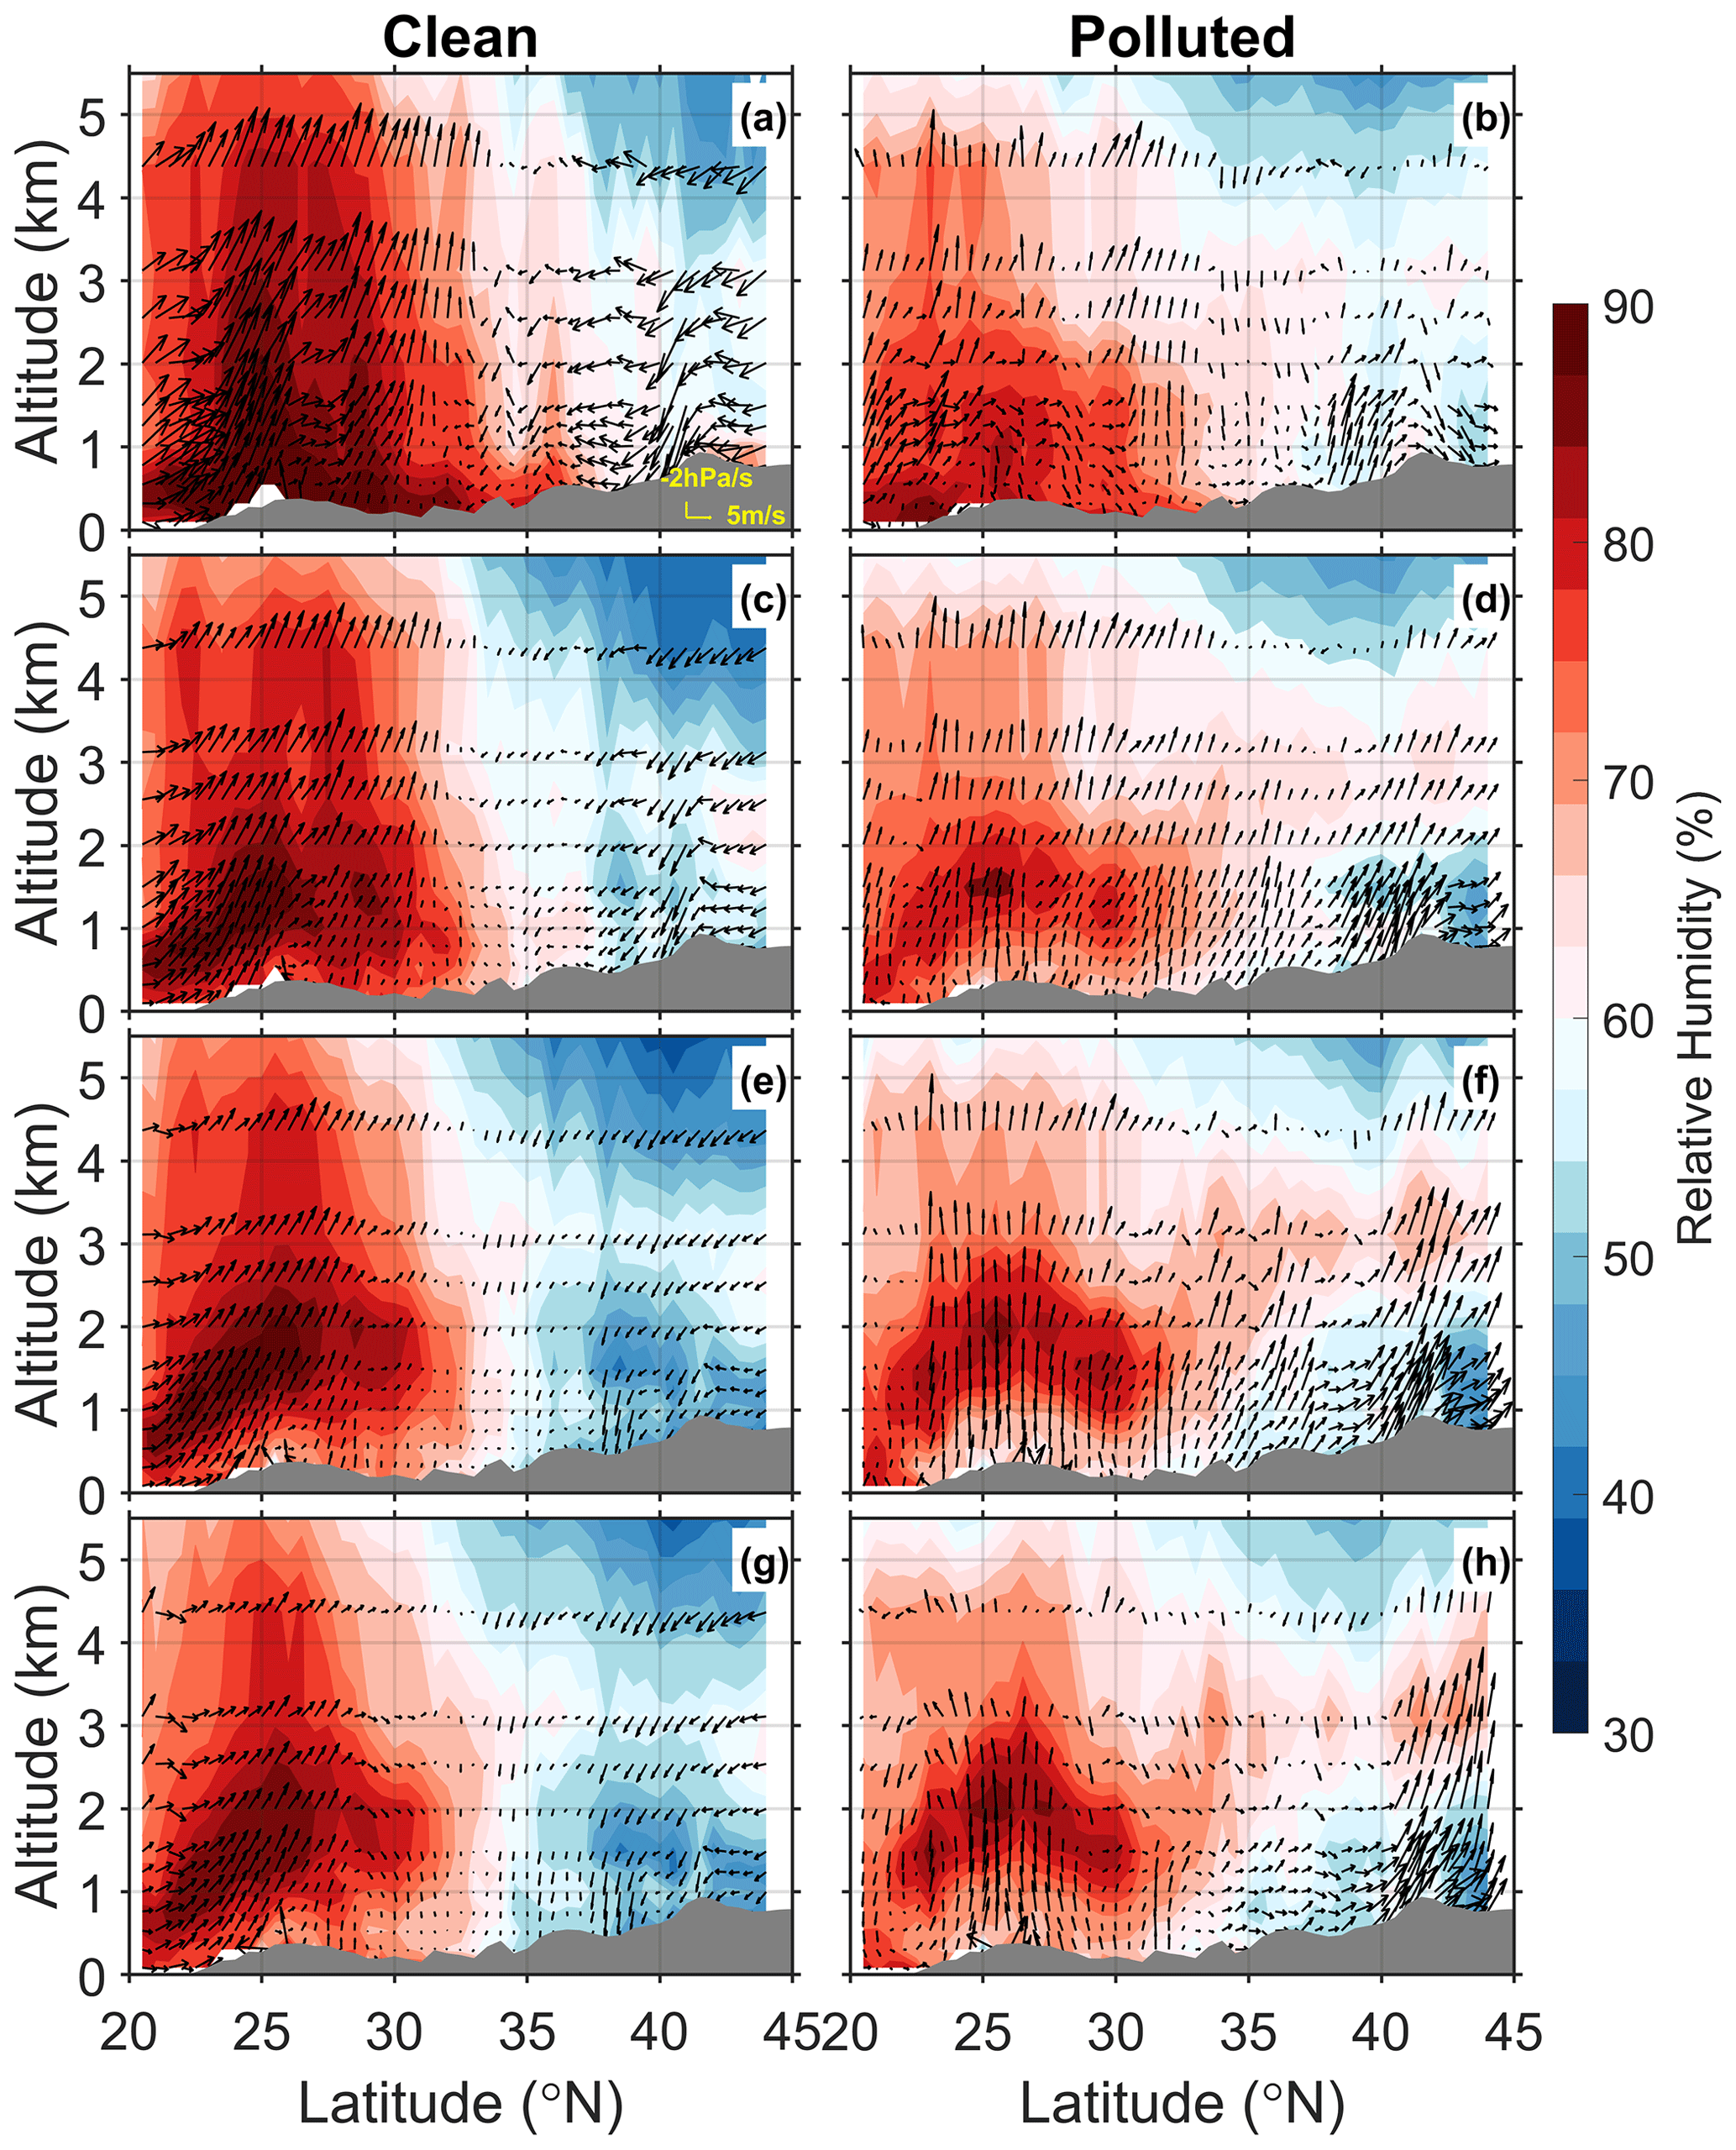
Figure 12Latitude–altitude cross sections of mean relative humidity (color shaded) and mean meridional–vertical wind (vectors) over the continent, averaged along 105 to 125∘ E for clean (left panels) and polluted (right panels) conditions at (a, b) 08:00 LT, (c, d) 11:00 LT, (e, f) 14:00 LT, and (g, h) 17:00 LT during May–September from 2016 to 2017. Vectors are constructed from the easterly wind (u) and vertical velocity (ω), scaled with −100. Gray shaded parts are the meridional mean terrain heights within ROI.
In order to further investigate the potential effect of topography in the aerosol–convective cloud relationship, the vertical circulation and moisture distributions are studied. We have classified the reanalysis data into clean and polluted cases using the clean and polluted threshold fields described in Sect. 4.2. The meridional–vertical mean distributions of relative humidity and wind are then calculated (Fig. 12). Generally, the circulation pattern is consistent throughout the day; the updraft south of 35∘ N is always stronger than that over the northern region, and the relative humidity in this region is significantly higher. Under clean conditions, the strong updraft and southerly wind south of 30∘ N may bring large amounts of moisture inland, contributing to convection development in this region. But under polluted conditions, the southerly wind is weaker, and the relative humidity above this region is lower, which may restrain convective cloud development. Both the drier conditions and the increased aerosol loading likely contribute to the inhibition of convective cloud. In regions north of 35∘ N, there is an obvious north wind component under clean conditions, bringing dry and clean air to this region, which may suppress the development of convective clouds. But under polluted conditions, under the control of a relatively strong southerly wind, moisture and pollutants may be blown toward the mountain regions and be forced upward by the elevated terrain, strengthening the formation and development of convective clouds, especially over the windward slopes north to 40∘ N. The zonal-vertical wind and relative humidity changes are shown in Figs. S5 and S6 in the Supplement. The updraft along windward slopes is always stronger, especially under polluted conditions in the northern part of the ROI. This is likely to contribute to strengthening the aerosol microphysical effect over such regions, which facilitates the invigoration of convective clouds. All the patterns described above agree well with the phenomena identified in the previous figures, indicating that different circulation patterns and the changes associated with different topography may have a considerable impact on the variability of the aerosol–convective cloud relationship.

Figure 13The joint distribution of convective cloud fraction (CCF) with respect to PM2.5 concentration and (a–d) lower-tropospheric stability (LTS), (e–h) potential temperature (θ), (i–l) vertical pressure velocity at 800 hPa (ω800) over terrain above 1000 m, (m–p) vertical pressure velocity at 900 hPa (ω900) over terrain below 1000 m, (q–t) relative humidity at 800 hPa (RH800) over terrain above 1000 m, (u–x) relative humidity at 900 hPa (RH900) over terrain below 1000 m, and (z–y2) specific humidity at 2 m (q). Each column represents a different local time during the day within the ROI, specifically at 08:00, 11:00, 14:00, and 17:00. Dashed red lines and the numbers beside them mark the mean tipping points of CCF at different thermodynamic, dynamical, and humidity levels. Note that the x axis is in log scale.
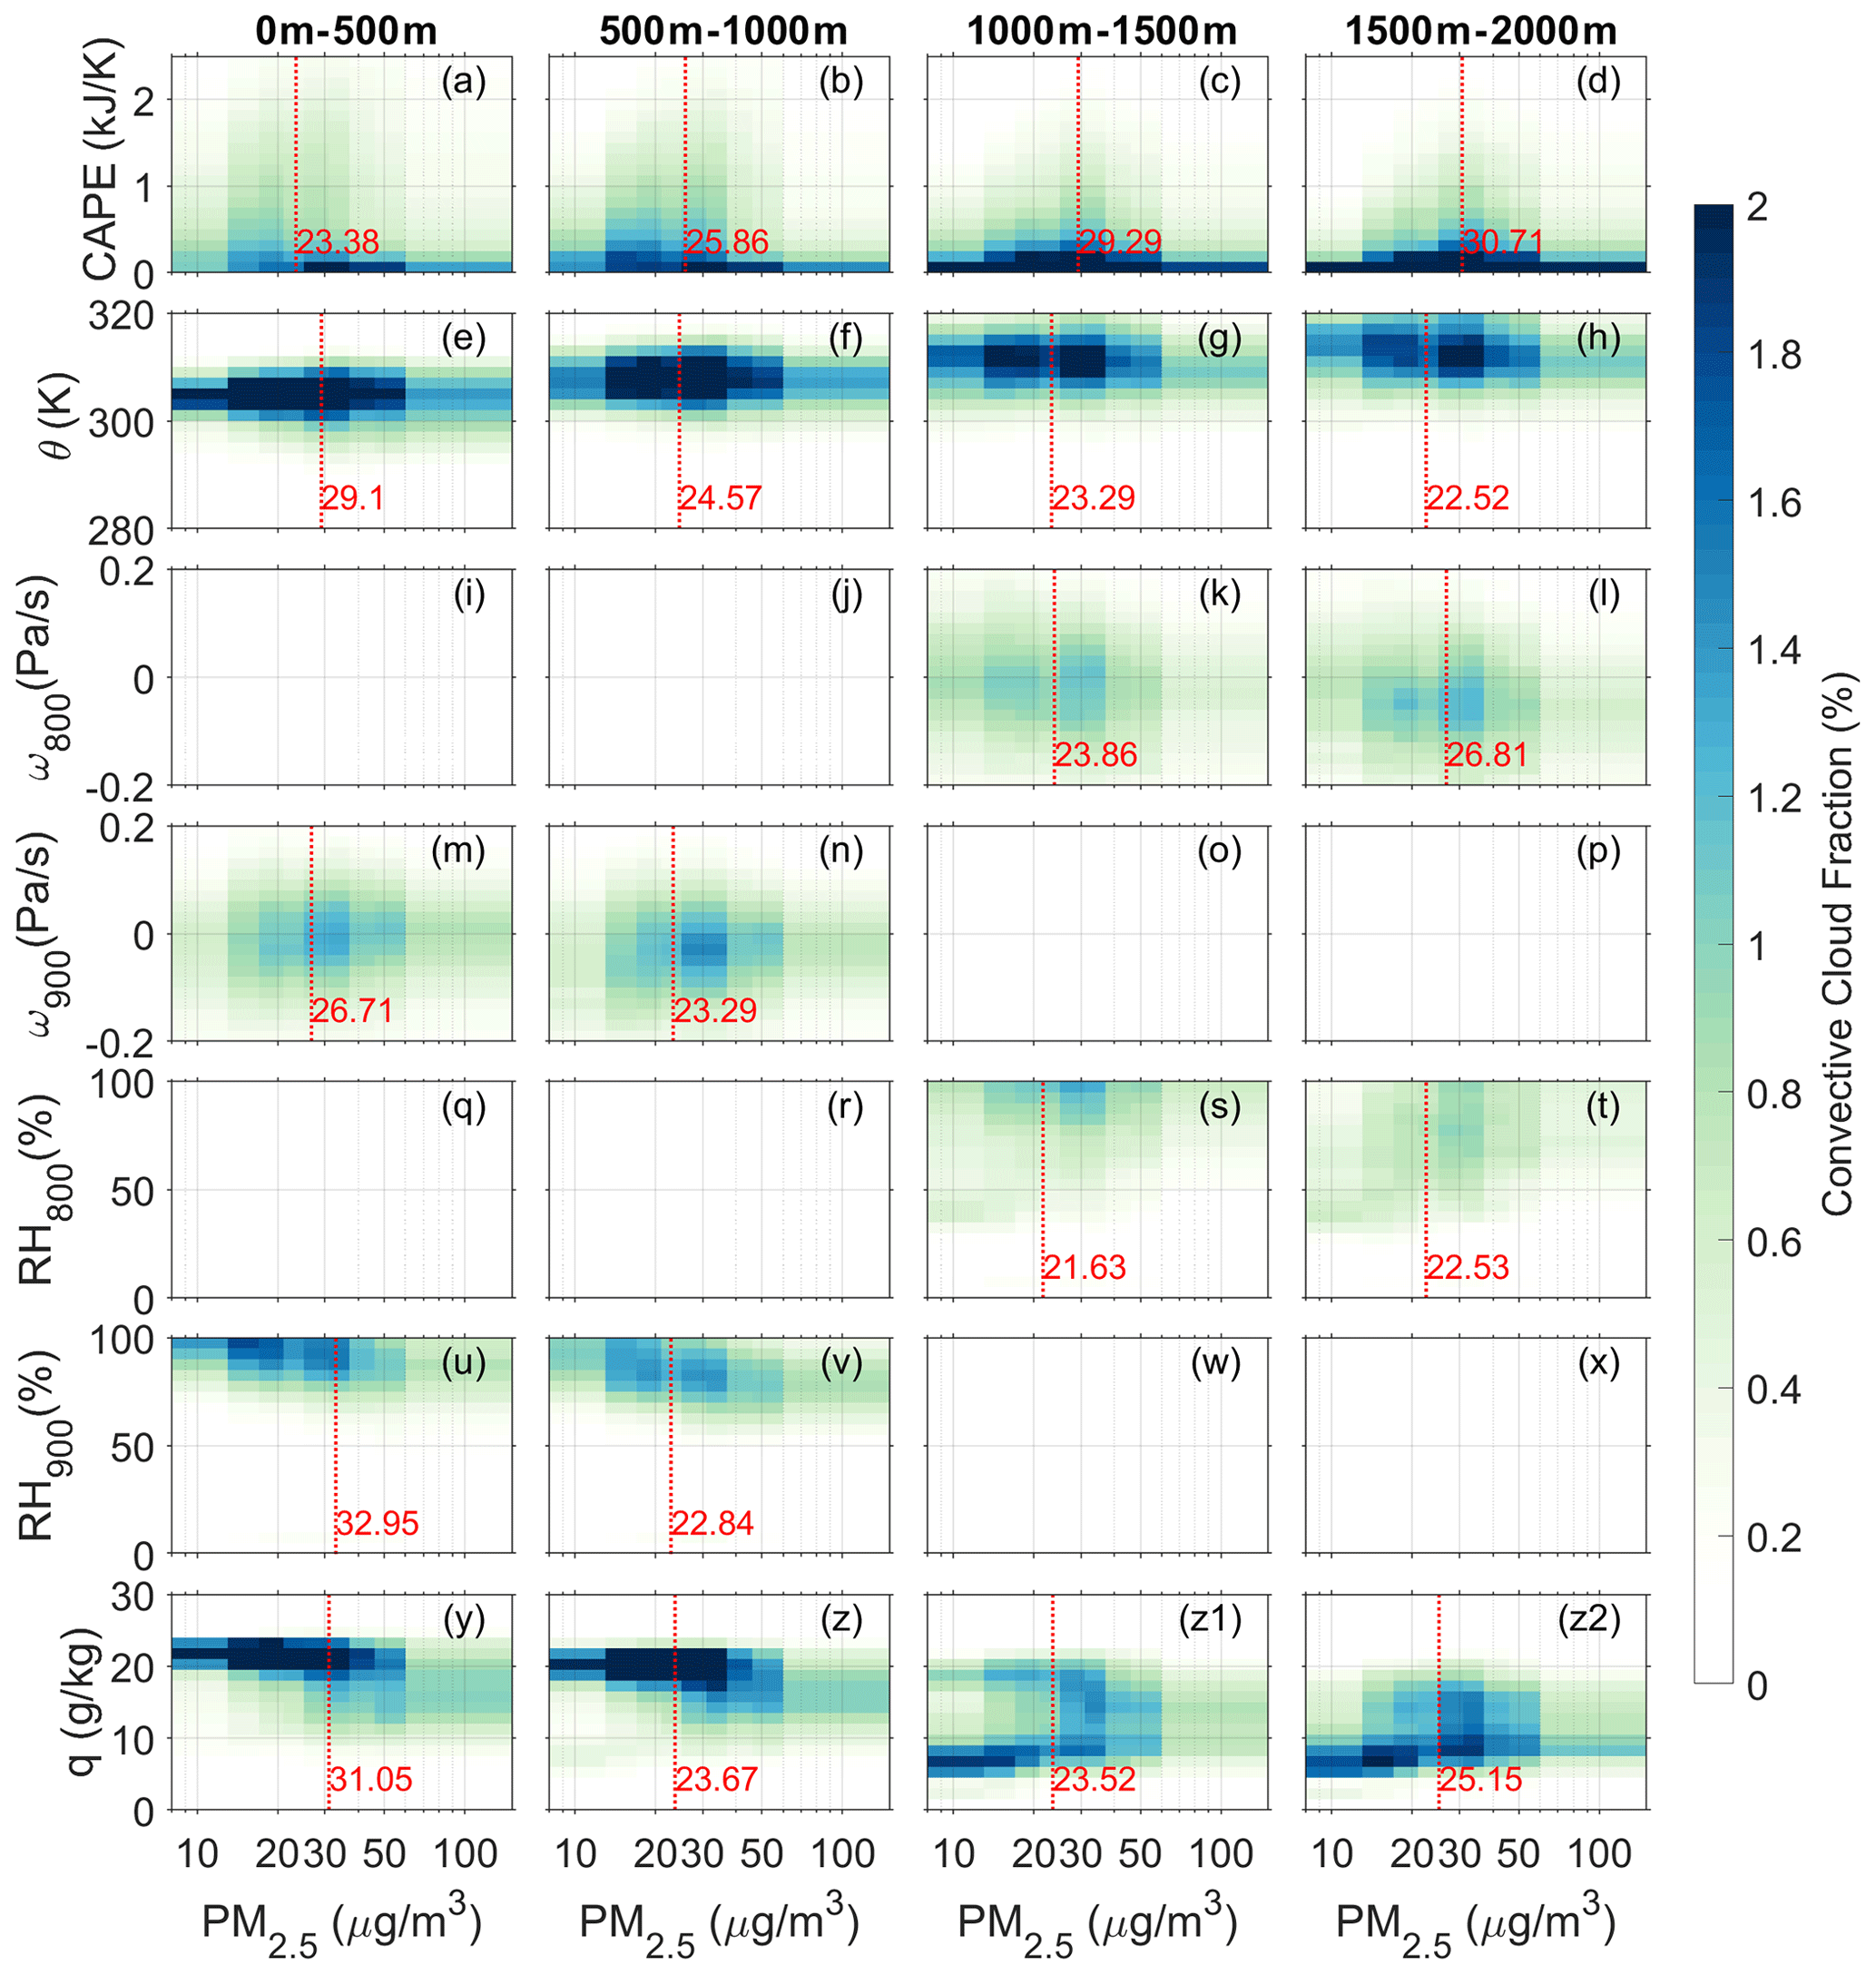
Figure 14Same as Fig. 13, but for different terrain heights; each column represents a different terrain height range.
4.4 The environmental dependence of the aerosol effect
To further isolate the signal of aerosol effects from that of meteorological conditions, and to characterize the co-variation in topography and aerosol effects on convective clouds, the changes of CCF with aerosol loading under various thermodynamic, dynamical, and humidity conditions at different times of day and over different terrain heights are shown in Figs. 13 and 14. Note that vertical velocities (relative humidity) at 800 and 900 hPa are used to represent the basic dynamic (water vapor) state for regions with elevation above and below 1000 m, respectively. We defined 10 equally sampled bins of PM2.5 concentration and calculated the joint distribution of CCF along with each PM2.5 and meteorological factor bin. The sample sizes in each subfigure are shown in Tables S1 and S2 in the Supplement. Generally, the CCF along with PM2.5 concentration shows unimodal distributions. CCFs increase at first and then decrease with PM2.5 concentration, as we saw in Fig. 8, but now within each of the vertical velocity and relative humidity strata, i.e., where we have minimized the differences in meteorological conditions. The patterns are consistent at different times of day and over different topography, which may indicate that under different thermodynamic, dynamical, and water vapor conditions the competition between the aerosol microphysical and radiation effects always exists, no matter how meteorological conditions vary, at least within the study domain. The main difference in the PM2.5–CCF relationship under different meteorological conditions lies in the tipping point.
The mean tipping point of CCF curves at different values of meteorological variables is marked as the turning line between the increasing and decreasing CCF trends (dashed red lines in Figs. 13 and 14). From Fig. 13a–h, the turning line moves to smaller PM2.5 values as surface heating increases and the atmosphere becomes more unstable from morning to late afternoon. And as CAPE (surface heating) gets stronger in the afternoon and over lower terrains, the tipping point also decreases (Figs. 13a–h and 14a–h). This phenomenon indicates that changes in thermodynamic conditions attributed to diurnal solar radiation variation and topography are perhaps among the potential impact factors that influence the changing CCF curve shapes in Figs. 8 and 11. Stronger surface heating and more unstable conditions may increase CCF when the microphysical effect of aerosol dominates the CCF changes and would potentially strengthen the aerosol microphysical effect as smaller aerosol concentrations may induce the same extent of invigoration.
Updraft changes, which can represent under-cloud dynamical conditions, at 800 and 900 hPa for terrain higher and lower than 1000 m, respectively, are relatively small during the day and over different topography. However, the turning values of CCF generally decrease with increasing updraft conditions as well (Fig. 13i–p). This pattern is likely to indicate that more aerosol particles can be activated or entrained into the clouds from the boundary layer when uplift is stronger, which in turn might strengthen the aerosol microphysical effect. Further, as shown in Fig. 14k and l, stronger updrafts over higher mountains (with TH > 1500 m) invigorate convective clouds after the turning line, especially for PM2.5 concentrations higher than 50 µg m3, which suggests that the suppression of convective clouds by aerosol radiative effect is counteracted.
For water vapor conditions, both higher relative humidity below cloud base (Figs. 13q–x and 14q–x) and higher specific humidity at the surface (Figs. 13y–z2 and 14y–z2) generally produce larger CCF. Higher RH and higher specific humidity (q) are also associated with higher CCF peaks. These patterns are consistent with the previous studies (Koren et al., 2010) and may indicate that moister conditions can lead to greater activation of aerosol particles. As PM2.5 measurements are dried particle masses, which can minimize the influence of ambient moisture, these patterns are more likely related to the strengthening of the aerosol microphysical effect, which might overtake the suppression from the aerosol radiative effect in higher-aerosol-loading conditions in these regions.
The meteorological factors that influence the aerosol effect on convective clouds are very likely to interact with one another, which may produce combined impacts on convective clouds and lead to nonlinear changes to the CCF distribution, creating large variations in the results. By analyzing the potential co-variation in aerosol effects, meteorological factors, and the impact of topography on convective clouds, we find that the CCF changes are robust under a range of meteorological conditions, as the strength of both the aerosol microphysical and radiative effects can potentially be influenced by specific thermodynamic, dynamical, and humidity conditions.
However, identifying the apparent correlations between convective cloud and aerosol loading is only a first step, supporting the hypothesized mechanisms by which aerosol affects convective cloud occurrence. The mechanism by which the aerosol and meteorology interact is another important question but is beyond the scope of the current study. If synoptic factors and differences in meteorological conditions associated with topography and aerosols work together, determining which factors dominate the formation and development of convective clouds needs to be explored with deeper mining of the data, as well as modeling studies, in the future.
Following rapid economic development and industrialization, eastern China has faced increasingly severe air pollution over recent decades. Aerosols, which play an important role in the formation and development of clouds and precipitation, can be among the main factors influencing urban inundation, hail, and severe storms.
The interaction between aerosol, weather, and topography is complex, so untangling their effects, which jointly influence convective cloud formation, is difficult. This study applies very large, diurnally resolved geostationary satellite data and extensive ground-based observations to investigate the characteristics of convective clouds, the impacts of aerosol on convective cloud properties, and the potential mechanisms that define the aerosol impacts on convective clouds under different meteorological conditions and over different topography. Having such large datasets allows us to stratify by various factors and isolate patterns among the multiple dimensions. The key results of this study are as follows.
-
We develop a convective cloud identification process named the TCT-CID algorithm by combining the merits of texture analysis, a clustering technique, and a threshold method, using the Level 1 data from the Japanese geostationary satellite Himawari-8 during the period from May to September in 2016 and 2017. The method offers stable and relatively accurate performance in identifying convective clouds.
-
The cloud mask is used to study the occurrence frequency and the regional distribution of convective clouds over eastern China, first to determine whether the new data reproduce expected cloud occurrence patterns. Statistical results show that convective cloud occurrence frequency (CC OF) is higher under more unstable conditions with stronger surface heating and updraft. And in the afternoon, this phenomenon is more significant than in the morning. The increases in both under-cloud relative humidity and surface specific humidity produce higher CC OF during the day. There is also a significant difference between higher and lower terrain regions. The consistency of these patterns with previous studies and the classic theories of convective cloud formation help validate the results of the TCT-CID algorithm.
-
We then compared convective clouds under clean and polluted conditions, and we further examined the possible impact of the diurnal cycle and topography on the aerosol–convective cloud relationship. We find that the convective cloud fraction generally tends to be larger before noon and smaller in the afternoon under more polluted conditions, but megacities and complex topography can influence the pattern. This result provides a new perspective on the aerosol effect compared to previous studies.
-
A relationship between aerosol loading and convective cloud fraction is found. The cloud fraction increases initially but then decreases with successive increases in aerosol loading. This pattern is consistent with the combined action of the aerosol microphysical and radiative effects. Previous studies found similar results for deep convective cloud and convective precipitation studies, but by using high-resolution geostationary satellite observations, we further find that this pattern is probably robust for convective clouds at all stages of development.
-
A possible alternative explanation is that aerosols and CCF are associated because they are both affected simultaneously by the same meteorological factors. However, CCF had generally similar relationships with aerosol mass concentrations for all meteorological stratifications that were examined. This observation renders the alternative meteorological explanation less likely.
-
Although the aerosol–convective cloud relationship is relatively stable, some variability also exists. The pattern varies throughout the day depending on terrain height and is modulated by varying thermodynamic, dynamical, and humidity conditions during the day. A more unstable environment and stronger surface heating would invigorate the convective cloud development, whereas moister conditions might suppress droplet evaporation and thus tend to overtake the inhibition of convective clouds.
-
We find that the meteorological variations driven by diurnal solar radiation changes and topography are among the potential reasons for changes in the relationship between convective cloud and aerosol loading, which could be related to the changes in the relative strength of aerosol microphysical and radiative effects. Over higher terrains such as mountains and plateaus, a southerly wind component is likely to contribute to the strengthening of the microphysical effect through forced uplifting of pollutant and moisture, which invigorates convective cloud over the windward slopes, whereas over plains, aerosol pollution blocking solar radiation is likely to dominate, thus decreasing the surface heating and suppressing convection by enhancing the radiative effect. However, as aerosol concentration, synoptic meteorological factors, and topography might work together in influencing the formation and development of convective clouds, the phenomena mentioned above can also be affected by nonlinear interactions among these factors.
Moreover, the analysis of this study is based mainly on satellite observations, which in themselves provide limited insight into the mechanism underlying the observed patterns. In the current study, we aimed only at isolating the possible effects of aerosol on convective cloud properties under different meteorological conditions. However, further exploration, including model simulations and/or targeted in situ or aircraft observations, is still needed to reveal the specific mechanisms behind these phenomena.
Processed data in the study are available from the first author upon request (chentm@cma.gov.cn). Himawari-8 L1 and L2 gridded data can be downloaded from https://www.eorc.jaxa.jp/ptree/userguide.html (P-Tree System, 2016, last access: 8 October 2018); MODIS cloud mask data can be downloaded from https://modis.gsfc.nasa.gov/data/dataprod/mod35.php (Ackerman and Frey, 2015, last access: 15 December 2020); ERA5 reanalysis data can be downloaded from https://cds.climate.copernicus.eu/cdsapp#!/dataset/reanalysis-era5-single-levels?tab=overview (Hersbach et al., 2020, last access: 29 December 2020); MERRA-2 reanalysis data are from https://gmao.gsfc.nasa.gov/reanalysis/MERRA-2/ (GMAO, 2015, last accessed: 8 October 2019).
The supplement related to this article is available online at: https://doi.org/10.5194/acp-21-6199-2021-supplement.
ZL, TC, and RAK determined the main goal of this study; TC carried it out, analyzed the data, and prepared the paper with contributions from all co-authors. DR provided ideas to improve the illustration of aerosol effect. Other co-authors participated in science discussions and suggested analyses.
The authors declare that they have no conflict of interest.
We acknowledge the JAXA P-tree system for providing the Himawari-8 Level 1 and Level 2 data and the Global Modeling and Assimilation Office (GMAO) for providing MERRA-2 reanalysis data. We also acknowledge the Goddard Space Flight Center (GSFC) for providing MODIS product, and Copernicus Climate Change Service (C3S) Climate Data Store (CDS) for providing ERA5 data. We would also like to extend our sincerest thanks and appreciation to the China National Environmental Monitoring Center for providing the hourly PM2.5 data. We would also like to thank the anonymous reviewers for their thoughtful suggestions and comments.
This study is supported by the Natural Science Foundation of China (42030606, 41925022, 91837204) and the Ministry of Science and Technology of China National Key R&D Program on Monitoring, Early Warning and Prevention of Major Natural Disasters (017YFC1501702, 2017YFC1501403).
This paper was edited by Matthias Tesche and reviewed by two anonymous referees.
Ackerman S. A. and Frey, R.: MODIS Atmosphere L2 Cloud Mask Product (35_L2). NASA MODIS Adaptive Processing System, Goddard Space Flight Center [data set], (Aqua) https://doi.org/10.5067/MODIS/MYD35_L2.006 (last access: 15 December 2020), 2015.
Ackerman, A. S., Toon, O. B., Stevens, D. E., Heymsfield, A. J., Ramanathan, V., and Welton, E. J.: Reduction of Tropical Cloudiness by Soot, Science, 288, 1042–1047, https://doi.org/10.1126/science.288.5468.1042, 2000.
Albrecht, B. A.: Aerosols, cloud microphysics, and fractional cloudiness, Science, 245, 1227, https://doi.org/10.1126/science.245.4923.1227, 1989.
Altaratz, O., Koren, I., Remer, L., and Hirsch, E.: Review: Cloud invigoration by aerosols – Coupling between microphysics and dynamics, Atmos. Res., 140, 38–60, https://doi.org/10.1016/j.atmosres.2014.01.009, 2014.
Andreae, M. O.: Correlation between cloud condensation nuclei concentration and aerosol optical thickness in remote and polluted regions, Atmos. Chem. Phys., 9, 543–556, https://doi.org/10.5194/acp-9-543-2009, 2009.
Andreae, M. O., Rosenfeld, D., Artaxo, P., Costa, A. A., Frank, G. P., Longo, K. M., and Silva-Dias, M. A. F.: Smoking rain clouds over the Amazon, Science, 303, 1337–1342, https://doi.org/10.1126/science.1092779, 2004.
Baum, B. A., Tovinkere, V., Titlow, J., and Welch, R. M.: Automated Cloud Classification of Global AVHRR Data Using a Fuzzy Logic Approach, J. Appl. Meteorol., 36, 1519–1540, https://doi.org/10.1175/1520-0450(1997)036<1519:accoga>2.0.co;2, 1997.
Bessho, K., Date, K., Hayashi, M., Ikeda, A., Imai, T., Inoue, H., Kumagai, Y., Miyakawa, T., Murata, H., Ohno, T., Okuyama, A., Oyama, R., Sasaki, Y., Shimazu, Y., Shimoji, K., Sumida, Y., Suzuki, M., Taniguchi, H., Tsuchiyama, H., Uesawa, D., Yokota, H., and Yoshida, R.: An Introduction to Himawari-8/9— Japan's New-Generation Geostationary Meteorological Satellites, J. Meteorol. Soc. Jpn. Ser. II, 94, 151–183, https://doi.org/10.2151/jmsj.2016-009, 2016.
Bottino, M. J. and Ceballos, J. C.: Daytime cloud classification over South American region using multispectral GOES-8 imagery, Int. J. Remote Sens., 36, 1–19, https://doi.org/10.1080/01431161.2014.978953, 2014.
Boucher, O. and Quaas, J.: Water vapour affects both rain and aerosol optical depth, Nat. Geosci., 6, 4–5, https://doi.org/10.1038/ngeo1692, 2012.
Chakraborty, S., Fu, R., Wright, J. S., and Massie, S. T.: Relationships between convective structure and transport of aerosols to the upper troposphere deduced from satellite observations, J. Geophys. Res.-Atmos., 120, 6515–6536, https://doi.org/10.1002/2015jd023528, 2015.
Chakraborty, S., Fu, R., Massie, S. T., and Stephens, G.: Relative influence of meteorological conditions and aerosols on the lifetime of mesoscale convective systems, P. Natl. Acad. Sci. USA, 113, 7426–7431, https://doi.org/10.1073/pnas.1601935113, 2016.
Chakraborty, S., Schiro, K. A., Fu, R., and Neelin, J. D.: On the role of aerosols, humidity, and vertical wind shear in the transition of shallow-to-deep convection at the Green Ocean Amazon 2014/5 site, Atmos. Chem. Phys., 18, 11135–11148, https://doi.org/10.5194/acp-18-11135-2018, 2018.
Chang, A. T. C., Chiu, L. S., and Yang, G.: Diurnal Cycle of Oceanic Precipitation from SSM/I Data, Mon. Weather Rev., 123, 3371–3380, https://doi.org/10.1175/1520-0493(1995)123<3371:dcoopf>2.0.co;2, 1995.
Charlson, R. J., Schwartz, S. E., Hales, J. M., Cess, KLEY, J. A., Hansen, J. E., and Hofmann, D. J.: Climate Forcing by Anthropogenic Aerosols, Science, 255, 423–430, https://doi.org/10.1126/science.255.5043.423, 1992.
Chen, T. M., Guo, J. P., Li, Z. Q., Zhao, C. F., Liu, H., Cribb, M., Wang, F., and He, J.: A CloudSat Perspective on the Cloud Climatology and Its Association with Aerosol Perturbations in the Vertical over Eastern China, J. Atmos. Sci., 73, 3599–3616, https://doi.org/10.1175/jas-d-15-0309.1, 2016.
Fan, J., Leung, L. R., Rosenfeld, D., Chen, Q., Li, Z., Zhang, J., and Yan, H.: Microphysical effects determine macrophysical response for aerosol impacts on deep convective clouds, P. Natl. Acad. Sci. USA, 110, E4581–E4590, https://doi.org/10.1073/pnas.1316830110, 2013.
Fan, J., Rosenfeld, D., Yang, Y., Zhao, C., Leung, L. R., and Li, Z.: Substantial contribution of anthropogenic air pollution to catastrophic floods in Southwest China, Geophys. Res. Lett., 42, 6066–6075, https://doi.org/10.1002/2015gl064479, 2015.
Feingold, G., Eberhard, W. L., Veron, D. E., and Previdi, M.: First measurements of the Twomey indirect effect using ground-based remote sensors, Geophys. Res. Lett., 30, 1287, https://doi.org/10.1029/2002GL016633, 2003.
Feingold, G., Jiang, H. L., and Harrington, J. Y.: On smoke suppression of clouds in Amazonia, Geophys. Res. Lett., 32, L02804, https://doi.org/10.1029/2004gl021369, 2005.
Garreaud, R. and Wallace, J. M.: The Diurnal March of Convective Cloudiness over the Americas, Mon. Weather Rev., 125, 3157–3171, https://doi.org/10.1175/1520-0493(1997)125<3157:tdmocc>2.0.co;2, 1997.
Garrett, T. J. and Zhao, C.: Increased Arctic cloud longwave emissivity associated with pollution from mid-latitudes, Nature, 440, 787–789, https://doi.org/10.1038/nature04636, 2006.
Garrett, T. J., Zhao, C., Dong, X., Mace, G. G., and Hobbs, P. V.: Effects of varying aerosol regimes on low-level Arctic stratus, Geophys. Res. Lett., 31, L17105, https://doi.org/10.1029/2004gl019928, 2004.
Gelaro, R., McCarty, W., Suárez, M. J., Todling, R., Molod, A., Takacs, L., Randles, C. A., Darmenov, A., Bosilovich, M. G., Reichle, R., Wargan, K., Coy, L., Cullather, R., Draper, C., Akella, S., Buchard, V., Conaty, A., Silva, A. M. d., Gu, W., Kim, G.-K., Koster, R., Lucchesi, R., Merkova, D., Nielsen, J. E., Partyka, G., Pawson, S., Putman, W., Rienecker, M., Schubert, S. D., Sienkiewicz, M., and Zhao, B.: The Modern-Era Retrospective Analysis for Research and Applications, Version 2 (MERRA-2), J. Climate, 30, 5419–5454, https://doi.org/10.1175/jcli-d-16-0758.1, 2017.
Givati, A. and Rosenfeld, D.: Quantifying Precipitation Suppression Due to Air Pollution, J. Appl. Meteorol., 43, 1038–1056, https://doi.org/10.1175/1520-0450(2004)043<1038:qpsdta>2.0.co;2, 2004.
Global Modeling and Assimilation Office (GMAO): MERRA-2 inst3_3d_asm_Np: 3d, 3-Hourly, Instantaneous, Pressure-Level,Assimilation, Assimilated Meteorological Fields V5.12.4, Goddard Earth Sciences Data and Information Services Center (GES DISC)[data set], https://doi.org/10.5067/QBZ6MG944HW0 (last access: 8 December 2019), 2015.
Gryspeerdt, E. and Stier, P.: Regime-based analysis of aerosol-cloud interactions, Geophys. Res. Lett., 39, L21802, https://doi.org/10.1029/2012gl053221, 2012.
Gryspeerdt, E., Stier, P., and Partridge, D. G.: Satellite observations of cloud regime development: the role of aerosol processes, Atmos. Chem. Phys., 14, 1141–1158, https://doi.org/10.5194/acp-14-1141-2014, 2014.
Gu, Y., Liou, K. N., Xue, Y., Mechoso, C. R., Li, W., and Luo, Y.: Climatic effects of different aerosol types in China simulated by the UCLA general circulation model, J. Geophys. Res.-Atmos., 111, D15201, https://doi.org/10.1029/2005jd006312, 2006.
Guo, J., Zhang, X., Wu, Y.-r., Zhaxi, Y., Che, H., La, B., Wang, W., and Li, X.: Spatio-temporal variation trends of satellite-based aerosol optical depth in China during 1980–2008, Atmos. Environ., 45, 6802–6811, https://doi.org/10.1016/j.atmosenv.2011.03.068, 2011.
Guo, J., Deng, M., Fan, J., Li, Z., Chen, Q., Zhai, P., Dai, Z., and Li, X.: Precipitation and air pollution at mountain and plain stations in northern China: Insights gained from observations and modeling, J. Geophys. Res.-Atmos., 119, 4793–4807, https://doi.org/10.1002/2013JD021161, 2014.
Guo, J., Deng, M., Lee, S. S., Wang, F., Li, Z., Zhai, P., Liu, H., Lv, W., Yao, W., and Li, X.: Delaying precipitation and lightning by air pollution over the Pearl River Delta. Part I: Observational analyses, J. Geophys. Res.-Atmos., 121, 6472–6488, https://doi.org/10.1002/2015jd023257, 2016.
Guo, J., Su, T., Li, Z., Miao, Y., Li, J., Liu, H., Xu, H., Cribb, M., and Zhai, P.: Declining frequency of summertime local-scale precipitation over eastern China from 1970 to 2010 and its potential link to aerosols, Geophys. Res. Lett., 44, 5700–5708, https://doi.org/10.1002/2017gl073533, 2017.
Guo, J., Liu, H., Li, Z., Rosenfeld, D., Jiang, M., Xu, W., Jiang, J. H., He, J., Chen, D., Min, M., and Zhai, P.: Aerosol-induced changes in the vertical structure of precipitation: a perspective of TRMM precipitation radar, Atmos. Chem. Phys., 18, 13329–13343, https://doi.org/10.5194/acp-18-13329-2018, 2018.
Haralick, R. M.: Statistical and structural approaches to texture, P. IEEE, 67, 786–804, https://doi.org/10.1109/PROC.1979.11328, 1979.
Haralick, R. M., Shanmugam, K., and Dinstein, I.: Textural Features for Image Classification, IEEE T. Syst. Man Cyb., SMC-3, 610–621, https://doi.org/10.1109/TSMC.1973.4309314, 1973.
Hersbach, H., Bell, B., Berrisford, P., Biavati, G., Horányi, A., Muñoz Sabater, J., Nicolas, J., Peubey, C., Radu, R., Rozum, I., Schepers, D., Simmons, A., Soci, C., Dee, D., and Thépaut, J.-N.: ERA5 hourly data on single levels from 1979 to present. Copernicus Climate Change Service (C3S) Climate Data Store (CDS), https://doi.org/10.24381/cds.adbb2d47, 2018.
Hersbach, H., Bell, B., Berrisford, P., Biavati, G., Horányi, A., Muñoz Sabater, J., Nicolas, J., Peubey, C., Radu, R., Rozum, I., Schepers, D., Simmons, A., Soci, C., Dee, D., and Thépaut, J.-N.: ERA5 hourly data on single levels from 1979 to present, Copernicus Climate Change Service (C3S) Climate Data Store (CDS) [data set], https://doi.org/10.24381/cds.adbb2d47 (last access: 29 December 2020), 2018.
Houze, R. A.: Orographic effects on precipitating clouds, Rev. Geophys., 50, RG1001, doi:10.1029/2011RG000365, 2012.
Houze Jr., R. A.: Cloud dynamics, Academic Press, Elsevier, Oxford, UK, 2014.
IPCC, 2013: Climate Change 2013: The Physical Science Basis, Contribution of Working Group I to the Fifth Assessment Report of the Intergovernmental Panel on Climate Change, edited by: Stocker, T. F., Qin, D., Plattner, G.-K., Tignor, M., Allen, S. K., Boschung, J., Nauels, A., Xia, Y., Bex, V., and Midgley, P. M., Cambridge University Press, Cambridge, United Kingdom and New York, NY, USA, 1535 pp., 2013.
Jiang, J. H., Su, H., Huang, L., Wang, Y., Massie, S. T., Zhao, B., Omar, A., and Wang, Z.: Contrasting effects on deep convective clouds by different types of aerosols, Nat. Commun., 9, 7, https://doi.org/10.1038/s41467-018-06280-4, 2018.
Jiang, Y., Liu, X., Yang, X.-Q., and Wang, M.: A numerical study of the effect of different aerosol types on East Asian summer clouds and precipitation, Atmos. Environ., 70, 51–63, https://doi.org/10.1016/j.atmosenv.2012.12.039, 2013.
Kaufman, Y. J. and Nakajima, T.: Effect of amazon smoke on cloud microphysics and albedo – analysis from satellite imagery, J. Appl. Meteorol., 32, 729–744, https://doi.org/10.1175/1520-0450(1993)032<0729:eoasoc>2.0.co;2, 1993.
Kaufman, Y. J., Tanre, D., and Boucher, O.: A satellite view of aerosols in the climate system, Nature, 419, 215–223, https://doi.org/10.1038/nature01091, 2002.
Kaufman, Y. J., Koren, I., Remer, L. A., Rosenfeld, D., and Rudich, Y.: The effect of smoke, dust, and pollution aerosol on shallow cloud development over the Atlantic Ocean, P. Natl. Acad. Sci. USA, 102, 11207–11212, https://doi.org/10.1073/pnas.0505191102, 2005.
Khain, A., Rosenfeld, D., and Pokrovsky, A.: Aerosol impact on the dynamics and microphysics of deep convective clouds, Q. J. Roy. Meteor. Soc., 131, 2639–2663, https://doi.org/10.1256/qj.04.62, 2005.
Kirshbaum, D. J. and Durran, D. R.: Factors Governing Cellular Convection in Orographic Precipitation, J. Atmos. Sci., 61, 682–698, https://doi.org/10.1175/1520-0469(2004)061<0682:fgccio>2.0.co;2, 2004.
Kirshbaum, D. J. and Durran, D. R.: Atmospheric Factors Governing Banded Orographic Convection, J. Atmos. Sci., 62, 3758–3774, https://doi.org/10.1175/jas3568.1, 2005.
Kirshbaum, D. J., Bryan, G. H., Rotunno, R., and Durran, D. R.: The Triggering of Orographic Rainbands by Small-Scale Topography, J. Atmos. Sci., 64, 1530–1549, https://doi.org/10.1175/jas3924.1, 2007.
Koren, I., Kaufman, Y. J., Remer, L. A., and Martins, J. V.: Measurement of the effect of Amazon smoke on inhibition of cloud formation, Science, 303, 1342–1345, https://doi.org/10.1126/science.1089424, 2004.
Koren, I., Kaufman, Y. J., Rosenfeld, D., Remer, L. A., and Rudich, Y.: Aerosol invigoration and restructuring of Atlantic convective clouds, Geophys. Res. Lett., 32, L14828, https://doi.org/10.1029/2005gl023187, 2005.
Koren, I., Martins, J. V., Remer, L. A., and Afargan, H.: Smoke invigoration versus inhibition of clouds over the Amazon, Science, 321, 946–949, https://doi.org/10.1126/science.1159185, 2008.
Koren, I., Feingold, G., and Remer, L. A.: The invigoration of deep convective clouds over the Atlantic: aerosol effect, meteorology or retrieval artifact?, Atmos. Chem. Phys., 10, 8855–8872, https://doi.org/10.5194/acp-10-8855-2010, 2010.
Li, W., Luo, C., Wang, D., and Lei, T.: Diurnal variations of precipitation over the South China Sea, Meteorol. Atmos. Phys., 109, 33–46, https://doi.org/10.1007/s00703-010-0094-8, 2010.
Li, Z. and Weng, D.: A computer model to determine topographic parameters, Acta Geographica Sinica, 42, 269–278, https://doi.org/10.11821/xb198703009, 1987.
Li, Z. and Weng, D.: A computer model for calculating the duration of sunshine in mountainous areas, Chinese Sci. Bull., 33, 1624–1627, CNKI:SUN:JXTW.0.1988-19-011, 1988.
Li, Z. and Weng, D.: A numerical model for hilly-land global radiation, Acta Meteorol. Sin., 3, 661–668, CNKI:SUN:QXXW.0.1989-05-010, 1989.
Li, Z., Zhao, X., Kahn, R., Mishchenko, M., Remer, L., Lee, K.-H., Wang, M., Laszlo, I., Nakajima, T., and Maring, H.: Uncertainties in satellite remote sensing of aerosols and impact on monitoring its long-term trend: a review and perspective, Ann. Geophys., 27, 2755–2770, https://doi.org/10.5194/angeo-27-2755-2009, 2009.
Li, Z., Niu, F., Fan, J., Liu, Y., Rosenfeld, D., and Ding, Y.: Long-term impacts of aerosols on the vertical development of clouds and precipitation, Nat. Geosci., 4, 888–894, https://doi.org/10.1038/ngeo1313, 2011.
Li, Z., Lau, W. K. M., Ramanathan, V., Wu, G., Ding, Y., Manoj, M. G., Liu, J., Qian, Y., Li, J., Zhou, T., Fan, J., Rosenfeld, D., Ming, Y., Wang, Y., Huang, J., Wang, B., Xu, X., Lee, S. S., Cribb, M., Zhang, F., Yang, X., Zhao, C., Takemura, T., Wang, K., Xia, X., Yin, Y., Zhang, H., Guo, J., Zhai, P. M., Sugimoto, N., Babu, S. S., and Brasseur, G. P.: Aerosol and monsoon climate interactions over Asia, Rev. Geophys., 54, 866–929, https://doi.org/10.1002/2015rg000500, 2016.
Li, Z., Wang, Y., Guo, J., Zhao, C., Cribb, M. C., Dong, X., Fan, J., Gong, D., Huang, J., Jiang, M., Jiang, Y., Lee, S.-S., Li, H., Li, J., Liu, J., Qian, Y., Rosenfeld, D., Shan, S., Sun, Y., Wang, H., Xin, J., Yan, X., Yang, X., Yang, X.-Q., Zhang, F., and Zheng, Y.: East Asian Study of Tropospheric Aerosols and their Impact on Regional Clouds, Precipitation, and Climate (EAST-AIRCPC), J. Geophys. Res.-Atmos., 124, 13026–13054, https://doi.org/10.1029/2019jd030758, 2019.
Lima, M. A. and Wilson, J. W.: Convective Storm Initiation in a Moist Tropical Environment, Mon. Weather Rev., 136, 1847–1864, https://doi.org/10.1175/2007mwr2279.1, 2008.
Liu, J. and Li, Z.: Estimation of cloud condensation nuclei concentration from aerosol optical quantities: influential factors and uncertainties, Atmos. Chem. Phys., 14, 471–483, https://doi.org/10.5194/acp-14-471-2014, 2014.
Lohmann, U. and Feichter, J.: Global indirect aerosol effects: a review, Atmos. Chem. Phys., 5, 715–737, https://doi.org/10.5194/acp-5-715-2005, 2005.
Lynn, B., Khain, A., Rosenfeld, D., and Woodley, W. L.: Effects of aerosols on precipitation from orographic clouds, J. Geophys. Res.-Atmos., 112, D10225, https://doi.org/10.1029/2006jd007537, 2007.
McCormick, R. A. and Ludwig, J. H.: Climate Modification by Atmospheric Aerosols, Science, 156, 1358–1359, https://doi.org/10.1126/science.156.3780.1358, 1967.
Mecikalski, J. R. and Bedka, K. M.: Forecasting convective initiation by monitoring the evolution of moving cumulus in daytime GOES imagery, Mon. Weather Rev., 134, 49–78, https://doi.org/10.1175/mwr3062.1, 2006.
Meskhidze, N., Remer, L. A., Platnick, S., Negrón Juárez, R., Lichtenberger, A. M., and Aiyyer, A. R.: Exploring the differences in cloud properties observed by the Terra and Aqua MODIS Sensors, Atmos. Chem. Phys., 9, 3461–3475, https://doi.org/10.5194/acp-9-3461-2009, 2009.
Niu, F. and Li, Z.: Systematic variations of cloud top temperature and precipitation rate with aerosols over the global tropics, Atmos. Chem. Phys., 12, 8491–8498, https://doi.org/10.5194/acp-12-8491-2012, 2012.
P-Tree System: Japan Aerospace Exploration Agency (JAXA) [data set], https://www.eorc.jaxa.jp/ptree/userguide.html (last access: L1: 8 October 2018, L2: 17 September 2020), 2016.
Purdom, J. F. W.: Some Uses of High-Resolution GOES Imagery in the Mesoscale Forecasting of Convection and Its Behavior, Mon. Weather Rev., 104, 1474–1483, https://doi.org/10.1175/1520-0493(1976)104<1474:suohrg>2.0.co;2, 1976.
Qiu, Y., Zhao, C., Guo, J., and Li, J.: 8-Year ground-based observational analysis about the seasonal variation of the aerosol-cloud droplet effective radius relationship at SGP site, Atmos. Environ., 164, 139–146, https://doi.org/10.1016/j.atmosenv.2017.06.002, 2017.
Ramanathan, V., Crutzen, P. J., Kiehl, J. T., and Rosenfeld, D.: Aerosols, Climate, and the Hydrological Cycle, Science, 294, 2119–2124, https://doi.org/10.1126/science.1064034, 2001.
Redelsperger, J.-L., Parsons, D. B., and Guichard, F.: Recovery Processes and Factors Limiting Cloud-Top Height following the Arrival of a Dry Intrusion Observed during TOGA COARE, J. Atmos. Sci., 59, 2438–2457, https://doi.org/10.1175/1520-0469(2002)059<2438:rpaflc>2.0.co;2, 2002.
Roe, G. H.: Orographic Precipitation, Annu. Rev. Earth Pl. Sc., 33, 645–671, https://doi.org/10.1146/annurev.earth.33.092203.122541, 2005.
Romatschke, U. and Houze Jr., R. A.: Extreme Summer Convection in South America, J. Climate, 23, 3761–3791, https://doi.org/10.1175/2010jcli3465.1, 2010.
Romatschke, U. and Houze Jr., R. A.: Characteristics of Precipitating Convective Systems in the South Asian Monsoon, J. Hydrometeorol., 12, 3–26, https://doi.org/10.1175/2010jhm1289.1, 2011a.
Romatschke, U. and Houze Jr., R. A.: Characteristics of Precipitating Convective Systems in the Premonsoon Season of South Asia, J. Hydrometeorol., 12, 157–180, https://doi.org/10.1175/2010jhm1311.1, 2011b.
Romatschke, U., Medina, S., and Houze Jr., R. A.: Regional, Seasonal, and Diurnal Variations of Extreme Convection in the South Asian Region, J. Climate, 23, 419–439, https://doi.org/10.1175/2009jcli3140.1, 2010.
Rosenfeld, D.: Suppression of Rain and Snow by Urban and Industrial Air Pollution, Science, 287, 1793–1796, https://doi.org/10.1126/science.287.5459.1793, 2000.
Rosenfeld, D. and Givati, A.: Evidence of Orographic Precipitation Suppression by Air Pollution–Induced Aerosols in the Western United States, J. Appl. Meteorol. Clim., 45, 893–911, https://doi.org/10.1175/jam2380.1, 2006.
Rosenfeld, D., Dai, J., Yu, X., Yao, Z., Xu, X., Yang, X., and Du, C.: Inverse Relations Between Amounts of Air Pollution and Orographic Precipitation, Science, 315, 1396–1398, https://doi.org/10.1126/science.1137949, 2007.
Rosenfeld, D., Lohmann, U., Raga, G. B., O'Dowd, C. D., Kulmala, M., Fuzzi, S., Reissell, A., and Andreae, M. O.: Flood or Drought: How Do Aerosols Affect Precipitation?, Science, 321, 1309–1313, https://doi.org/10.1126/science.1160606, 2008.
Rosenfeld, D., Andreae, M. O., Asmi, A., Chin, M., de Leeuw, G., Donovan, D. P., Kahn, R., Kinne, S., Kivekäs, N., Kulmala, M., Lau, W., Schmidt, K. S., Suni, T., Wagner, T., Wild, M., and Quaas, J.: Global observations of aerosol-cloud-precipitation-climate interactions, Rev. Geophys., 52, 1–59, https://doi.org/10.1002/2013rg000441, 2014a.
Rosenfeld, D., Sherwood, S., Wood, R., and Donner, L. J.: Climate Effects of Aerosol-Cloud Interactions, Science, 343, 379–380, https://doi.org/10.1126/science.1247490, 2014b.
Rossow, W. B., and Schiffer, R. A.: ISCCP Cloud Data Products, Bulletin of the American Meteorological Society, 72, 2–20, https://doi.org/10.1175/1520-0477(1991)072<0002:Icdp>2.0.Co;2, 1991.
Stevens, B. and Feingold, G.: Untangling aerosol effects on clouds and precipitation in a buffered system, Nature, 461, 607, https://doi.org/10.1038/nature08281, 2009.
Sui, C.-H., Lau, K.-M., Takayabu, Y. N., and Short, D. A.: Diurnal Variations in Tropical Oceanic Cumulus Convection during TOGA COARE, J. Atmos. Sci., 54, 639–655, https://doi.org/10.1175/1520-0469(1997)054<0639:dvitoc>2.0.co;2, 1997.
Tao, W. K., Chen, J. P., Li, Z. Q., Wang, C., and Zhang, C. D.: Impact of aerosols on convective clouds and precipitation, Rev. Geophys., 50, RG2001, https://doi.org/10.1029/2011rg000369, 2012.
Twomey, S.: Pollution and the planetary albedo, Atmos. Environ. (1967), 8, 1251–1256, https://doi.org/10.1016/0004-6981(74)90004-3, 1974.
Twomey, S. and Warner, J.: Comparison of Measurements of Cloud Droplets and Cloud Nuclei, J. Atmos. Sci., 24, 702–703, https://doi.org/10.1175/1520-0469(1967)024<0702:comocd>2.0.co;2, 1967.
Wang, Q., Li, Z., Guo, J., Zhao, C., and Cribb, M.: The climate impact of aerosols on the lightning flash rate: is it detectable from long-term measurements?, Atmos. Chem. Phys., 18, 12797–12816, https://doi.org/10.5194/acp-18-12797-2018, 2018.
Wang, Y., Khalizov, A., Levy, M., and Zhang, R.: New Directions: Light absorbing aerosols and their atmospheric impacts, Atmos. Environ., 81, 713–715, https://doi.org/10.1016/j.atmosenv.2013.09.034, 2013.
Welch, R. M., Kuo, K. S., Wielicki, B. A., Sengupta, S. K., and Parker, L.: Marine Stratocumulus Cloud Fields off the Coast of Southern California Observed Using LANDSAT Imagery. Part I: Structural Characteristics, J. Appl. Meteorol., 27, 341–362, https://doi.org/10.1175/1520-0450(1988)027<0341:mscfot>2.0.co;2, 1988a.
Welch, R. M., Sengupta, S. K., and Chen, D. W.: Cloud field classification based upon high spatial resolution textural features: 1. Gray level co-occurrence matrix approach, J. Geophys. Res.-Atmos., 93, 12663–12681, https://doi.org/10.1029/JD093iD10p12663, 1988b.
Welch, R. M., Sengupta, S. K., and Kuo, K. S.: Marine Stratocumulus Cloud Fields off the Coast of Southern California Observed Using LANDSAT Imagery. Part II: Textural Analysis, J. Appl. Meteorol., 27, 363–378, https://doi.org/10.1175/1520-0450(1988)027<0363:mscfot>2.0.co;2, 1988c.
Wielicki, B. A. and Welch, R. M.: Cumulus Cloud Properties Derived Using LANDSAT Satellite Data, J. Clim. Appl. Meteorol., 25, 261–276, https://doi.org/10.1175/1520-0450(1986)025<0261:ccpdul>2.0.co;2, 1986.
Williams, E., Rosenfeld, D., Madden, N., Gerlach, J., Gears, N., Atkinson, L., Dunnemann, N., Frostrom, G., Antonio, M., Biazon, B., Camargo, R., Franca, H., Gomes, A., Lima, M., Machado, R., Manhaes, S., Nachtigall, L., Piva, H., Quintiliano, W., Machado, L., Artaxo, P., Roberts, G., Renno, N., Blakeslee, R., Bailey, J., Boccippio, D., Betts, A., Wolff, D., Roy, B., Halverson, J., Rickenbach, T., Fuentes, J., and Avelino, E.: Contrasting convective regimes over the Amazon: Implications for cloud electrification, J. Geophys. Res.-Atmos., 107, LBA 50-51–LBA 50-19, https://doi.org/10.1029/2001JD000380, 2002.
Williams, M. and Houze Jr., R. A.: Satellite-Observed Characteristics of Winter Monsoon Cloud Clusters, Mon. Weather Rev., 115, 505–519, https://doi.org/10.1175/1520-0493(1987)115<0505:socowm>2.0.co;2, 1987.
Wilson, A. M., Parmentier, B., and Jetz, W.: Systematic land cover bias in Collection 5 MODIS cloud mask and derived products – A global overview, Remote Sens. Environ., 141, 149–154, https://doi.org/10.1016/j.rse.2013.10.025, 2014.
Xiao, H., Yin, Y., Jin, L., Chen, Q., and Chen, J.: Simulation of the effects of aerosol on mixed-phase orographic clouds using the WRF model with a detailed bin microphysics scheme, J. Geophys. Res.-Atmos., 120, 8345–8358, https://doi.org/10.1002/2014jd022988, 2015.
Yang, G.-Y. and Slingo, J.: The Diurnal Cycle in the Tropics, Mon. Weather Rev., 129, 784–801, https://doi.org/10.1175/1520-0493(2001)129<0784:tdcitt>2.0.co;2, 2001.
Yang, X., Zhao, C., Guo, J., and Wang, Y.: Intensification of aerosol pollution associated with its feedback with surface solar radiation and winds in Beijing, J. Geophys. Res.-Atmos., 121, 4093–4099, https://doi.org/10.1002/2015jd024645, 2016a.
Yang, X., Zhao, C., Zhou, L., Wang, Y., and Liu, X.: Distinct impact of different types of aerosols on surface solar radiation in China, J. Geophys. Res.-Atmos., 121, 6459–6471, https://doi.org/10.1002/2016jd024938, 2016b.
Yang, X., Zhao, C., Zhou, L., Li, Z., Cribb, M., and Yang, S.: Wintertime cooling and a potential connection with transported aerosols in Hong Kong during recent decades, Atmos. Res., 211, 52–61, https://doi.org/10.1016/j.atmosres.2018.04.029, 2018.
Yang, Y., Fan, J., Leung, L. R., Zhao, C., Li, Z., and Rosenfeld, D.: Mechanisms Contributing to Suppressed Precipitation in Mt. Hua of Central China. Part I: Mountain Valley Circulation, J. Atmos. Sci., 73, 1351–1366, https://doi.org/10.1175/jas-d-15-0233.1, 2016.
Yang, Y., Zhao, C., Dong, X., Fan, G., Zhou, Y., Wang, Y., Zhao, L., Lv, F., and Yan, F.: Toward understanding the process-level impacts of aerosols on microphysical properties of shallow cumulus cloud using aircraft observations, Atmos. Res., 221, 27–33, https://doi.org/10.1016/j.atmosres.2019.01.027, 2019.
Zhang, F., Ren, J., Fan, T., Chen, L., Xu, W., Sun, Y., Zhang, R., Liu, J., Jiang, S., Jin, X., Wu, H., Li, S., Cribb, M. C., and Li, Z.: Significantly Enhanced Aerosol CCN Activity and Number Concentrations by Nucleation-Initiated Haze Events: A Case Study in Urban Beijing, J. Geophys. Res.-Atmos., 124, 14102–14113, https://doi.org/10.1029/2019JD031457, 2019.
Zhao, C. and Garrett, T. J.: Effects of Arctic haze on surface cloud radiative forcing, Geophys. Res. Lett., 42, 557–564, https://doi.org/10.1002/2014gl062015, 2015.
Zhao, C., Klein, S. A., Xie, S., Liu, X., Boyle, J. S., and Zhang, Y.: Aerosol first indirect effects on non-precipitating low-level liquid cloud properties as simulated by CAM5 at ARM sites, Geophys. Res. Lett., 39, L08806, https://doi.org/10.1029/2012gl051213, 2012.
Zhao, C., Lin, Y., Wu, F., Wang, Y., Li, Z., Rosenfeld, D., and Wang, Y.: Enlarging Rainfall Area of Tropical Cyclones by Atmospheric Aerosols, Geophys. Res. Lett., 45, 8604–8611, https://doi.org/10.1029/2018gl079427, 2018a.
Zhao, C., Qiu, Y., Dong, X., Wang, Z., Peng, Y., Li, B., Wu, Z., and Wang, Y.: Negative Aerosol-Cloud re Relationship From Aircraft Observations Over Hebei, China, Earth and Space Science, 5, 19–29, https://doi.org/10.1002/2017ea000346, 2018b.
Zhao, C., Zhao, L., and Dong, X.: A Case Study of Stratus Cloud Properties Using In Situ Aircraft Observations over Huanghua, China, Atmosphere, 10, 19, https://doi.org/10.3390/atmos10010019, 2019.
Zhao, C., Yang, Y., Fan, H., Huang, J., Fu, Y., Zhang, X., Kang, S., Cong, Z., Letu, H., and Menenti, M.: Aerosol characteristics and impacts on weather and climate over the Tibetan Plateau, Natl. Sci. Rev., 7, 492–495, https://doi.org/10.1093/nsr/nwz184, 2020.
Zhou, S., Yang, J., Wang, W.-C., Zhao, C., Gong, D., and Shi, P.: An observational study of the effects of aerosols on diurnal variation of heavy rainfall and associated clouds over Beijing–Tianjin–Hebei, Atmos. Chem. Phys., 20, 5211–5229, https://doi.org/10.5194/acp-20-5211-2020, 2020.
Zhou, T., Yu, R., Chen, H., Dai, A., and Pan, Y.: Summer Precipitation Frequency, Intensity, and Diurnal Cycle over China: A Comparison of Satellite Data with Rain Gauge Observations, J. Climate, 21, 3997–4010, https://doi.org/10.1175/2008jcli2028.1, 2008.