the Creative Commons Attribution 4.0 License.
the Creative Commons Attribution 4.0 License.
 | 23 Apr 2021
Non-equilibrium interplay between gas–particle partitioning and multiphase chemical reactions of semi-volatile compounds: mechanistic insights and practical implications for atmospheric modeling of polycyclic aromatic hydrocarbons
Jake Wilson
Ulrich Pöschl
Polycyclic aromatic hydrocarbons (PAHs) are carcinogenic air pollutants. The dispersion of PAHs in the atmosphere is influenced by gas–particle partitioning and chemical loss. These processes are closely interlinked and may occur at vastly differing timescales, which complicates their mathematical description in chemical transport models. Here, we use a kinetic model that explicitly resolves mass transport and chemical reactions in the gas and particle phases to describe and explore the dynamic and non-equilibrium interplay of gas–particle partitioning and chemical losses of PAHs on soot particles. We define the equilibration timescale τeq of gas–particle partitioning as the e-folding time for relaxation of the system to the partitioning equilibrium. We find this metric to span from seconds to hours depending on temperature, particle surface area, and the type of PAH. The equilibration time can be approximated using a time-independent equation, , which depends on the desorption rate coefficient kdes and adsorption rate coefficient kads, both of which can be calculated from experimentally accessible parameters. The model reveals two regimes in which different physical processes control the equilibration timescale: a desorption-controlled and an adsorption-controlled regime. In a case study with the PAH pyrene, we illustrate how chemical loss can perturb the equilibrium particulate fraction at typical atmospheric concentrations of O3 and OH. For the surface reaction with O3, the perturbation is significant and increases with the gas-phase concentration of O3. Conversely, perturbations are smaller for reaction with the OH radical, which reacts with pyrene on both the surface of particles and in the gas phase. Global and regional chemical transport models typically approximate gas–particle partitioning with instantaneous-equilibration approaches. We highlight scenarios in which these approximations deviate from the explicitly coupled treatment of gas–particle partitioning and chemistry presented in this study. We find that the discrepancy between solutions depends on the operator-splitting time step and the choice of time step can help to minimize the discrepancy. The findings and techniques presented in this work not only are relevant for PAHs but can also be applied to other semi-volatile substances that undergo chemical reactions and mass transport between the gas and particle phase.
- Article
(5563 KB) - Full-text XML
- BibTeX
- EndNote


Polycyclic aromatic hydrocarbons (PAHs) are air pollutants that are structurally characterized by their fused aromatic ring systems (Keyte et al., 2013). Given their carcinogenic properties (Boström et al., 2002), developmental toxicity (Billiard et al., 2008), and abundance in the environment (Ravindra et al., 2008), PAHs pose a risk to human health (Kim et al., 2013).
PAHs are semi-volatile compounds that may exist in the gas phase, adsorbed on the surface of aerosol particles, or absorbed into the bulk of aerosol particles. We describe the suspension of nano- to micrometer-sized particles in outside air as atmospheric aerosols. Typical atmospheric aerosol particles include sea salt, mineral dust, sulfate, and organic particles (Pöschl, 2005). Two key types of organic particles include soot, formed during fossil-fuel combustion, and secondary organic aerosols (SOA), formed from condensation of organic vapors in the atmosphere. The mass transfer and distribution of PAHs between the gas phase and particle phase are referred to as gas–particle partitioning. For PAHs, an accurate model description of gas–particle partitioning is needed to interpret monitoring data, determine atmospheric burden and lifetime, and ultimately assess the hazards their emissions pose to human health. Moreover, after inhalation, the distribution of a semi-volatile compound between the gas phase and the particle phase can determine its bioaccessibility (Liu et al., 2017; Wei et al., 2020). While gas-phase PAHs can directly partition into the epithelial lining fluid of the lung, particle-phase PAHs first have to dissolve from a matrix and may hence be less bioaccessible (Lammel et al., 2020).
In equilibrium, the flux of a semi-volatile species from the gas phase to the particle surface is equal to the flux that desorbs back into the gas phase. The state of the system at equilibrium can be described mathematically with thermodynamic entities (Junge, 1977; Yamasaki et al., 1982; Pankow, 1994). The equilibrium gas–particle partitioning of semi-volatile compounds is determined by both adsorption onto the particle surfaces and absorption into the particle bulk. The relative contributions of these processes depend on the concentrations, composition, and phase state of particles. Physicochemical properties of a compound – such as the octanol–air partition coefficient KOA (Finizio et al., 1997; Harner and Bidleman, 1998), the soot–air partition coefficient KSA (Dachs and Eisenreich, 2000; Lohmann and Lammel, 2004), and Abraham descriptors (Arp et al., 2008; Shahpoury et al., 2016) – are typically used to predict the position of equilibrium. In terms of surface adsorption, soot or black carbon particles may be especially relevant for the gas–particle partitioning of PAHs as they exhibit large energies of desorption (Kubicki, 2006; Guilloteau et al., 2010) and are often co-emitted (Miguel et al., 1998).
Field observations of PAH gas–particle partitioning in the form of particulate fractions often differ from the predictions of equilibrium models (Lohmann et al., 2000; Mandalakis et al., 2002; Terzi and Samara, 2004; Callén et al., 2008; Akyüz and Çabuk, 2010; Lammel et al., 2010; Wei et al., 2015). These discrepancies can be induced by perturbations to the equilibrium – such as emissions, changes in temperature, dry and wet deposition, or chemical reaction (Pankow and Bidleman, 1992) – but only persist if the rate of the adsorption–desorption kinetics is slow compared to rate of the perturbing process. In other words, partitioning equilibrium will still be maintained if the equilibration timescale is shorter than the perturbation timescale. This means that accurate knowledge of equilibration timescales is vital to assess whether non-equilibrium effects may occur.
Gas–particle partitioning is an important process in chemical transport models (CTMs), which describe the long-distance transport and chemical degradation of atmospheric constituents such as PAHs (Shrivastava et al., 2017; Mu et al., 2018). In CTMs, PAHs are partitioned, transformed, and transported in discrete time steps, often using the method of operator splitting. With operator splitting, the partitioning equilibrium is restored at each model time step through instantaneous equilibration (IE) (Galarneau et al., 2014) rather than treating gas–particle partitioning continuously. PAH concentrations predicted by CTMs have been shown to depend on the employed treatment of gas–particle partitioning. For instance, Lammel et al. (2009) found that using different equilibrium partitioning models influenced atmospheric cycling, the total environmental fate, and long-range transport potential of PAHs. Friedman et al. (2014) found that implementing a partitioning scheme in which PAHs slowly evaporate from aerosol particles yielded the better agreement between observed and simulated concentration and partitioning data compared to the instantaneous-equilibration approach. Overall, CTMs that assume equilibrium partitioning tend to be more common than those accounting for mass-transfer limitations explicitly, as can be seen from a recent review of partitioning methods in regional-scale transport models of SOA (McFiggans et al., 2015).
Equilibration timescales of gas–partitioning may be estimated theoretically, using analytical equations or numerical models. By solving analytical transport equations, the equilibration timescales of partitioning for volatile inorganic compounds were found to depend on the size of aerosol particles (Meng and Seinfeld, 1996). More recently, there have been numerical simulations for SOA as a function of temperature and relative humidity (Shiraiwa and Seinfeld, 2012; Li and Shiraiwa, 2019). Alternatively, equilibration timescales may also be obtained experimentally. For example, Saleh et al. (2013) found the equilibration timescale of SOA formed by α-pinene ozonolysis to be less than 30 min following a perturbation in temperature. Furthermore, the interplay between partitioning and multiphase reaction of OH with alkanes was shown to influence the distribution of product isomers (Zhang et al., 2015).
For PAHs, several studies have investigated the timescales of gas–particle partitioning from the perspective of absorptive partitioning. Rounds and Pankow used a radial diffusion model to investigate the kinetic limitations of partitioning resulting from diffusion of a semi-volatile compound absorbed within a particle (Rounds and Pankow, 1990). Odum et al. (1994) additionally included a parameter to account for mass-transfer limitations at the surface. In chamber experiments, Kamens et al. (1995) examined the equilibration timescales of PAHs. However, an in-depth analysis of the important case of PAH adsorption onto the surface of soot remains elusive. In recent years, the desorption rate coefficients of PAHs from soot have been experimentally parameterized over a range of atmospherically relevant temperatures (Guilloteau et al., 2010). However, a systematic comparison between the equilibration timescales of partitioning and the timescales of loss processes has not been carried out.
In this study, we use a kinetic model to (1) examine the timescales of gas–particle partitioning for six PAHs and (2) investigate the chemical loss of PAHs by explicitly coupling the partitioning and oxidation chemistry of the PAH pyrene. The model uses the conventions of the Pöschl–Rudich–Ammann framework (Pöschl et al., 2007) and is based on the kinetic double-layer model for aerosol surface chemistry (K2-SURF; Shiraiwa et al., 2009). We quantify the equilibration timescales of six PAHs on the model surface of solid soot particles for different temperatures and particle number concentrations (Sect. 3.2). We illustrate how the combination of slow partitioning and chemical loss of PAHs can perturb the particulate fraction from equilibrium (Sect. 3.3.2) and alter chemical lifetime (Sect. 3.3.1) in the example of the PAH pyrene. We detail how a dominant loss of pyrene from the particle phase may decrease the particulate fraction. Likewise, in the case of dominant loss of pyrene from the gas phase, the particulate fraction would increase. Compared to instantaneous partitioning, which would conserve equilibrium particulate fractions, chemical lifetime may be affected through depletion of pyrene in the more reactive phase. We apply the knowledge gained from the kinetic model calculations to the description of gas–particle partitioning in CTMs by comparing the explicitly coupled (EC) solution to a method mimicking operator splitting with instantaneous equilibration and evaluate the performance of both methods in different scenarios.
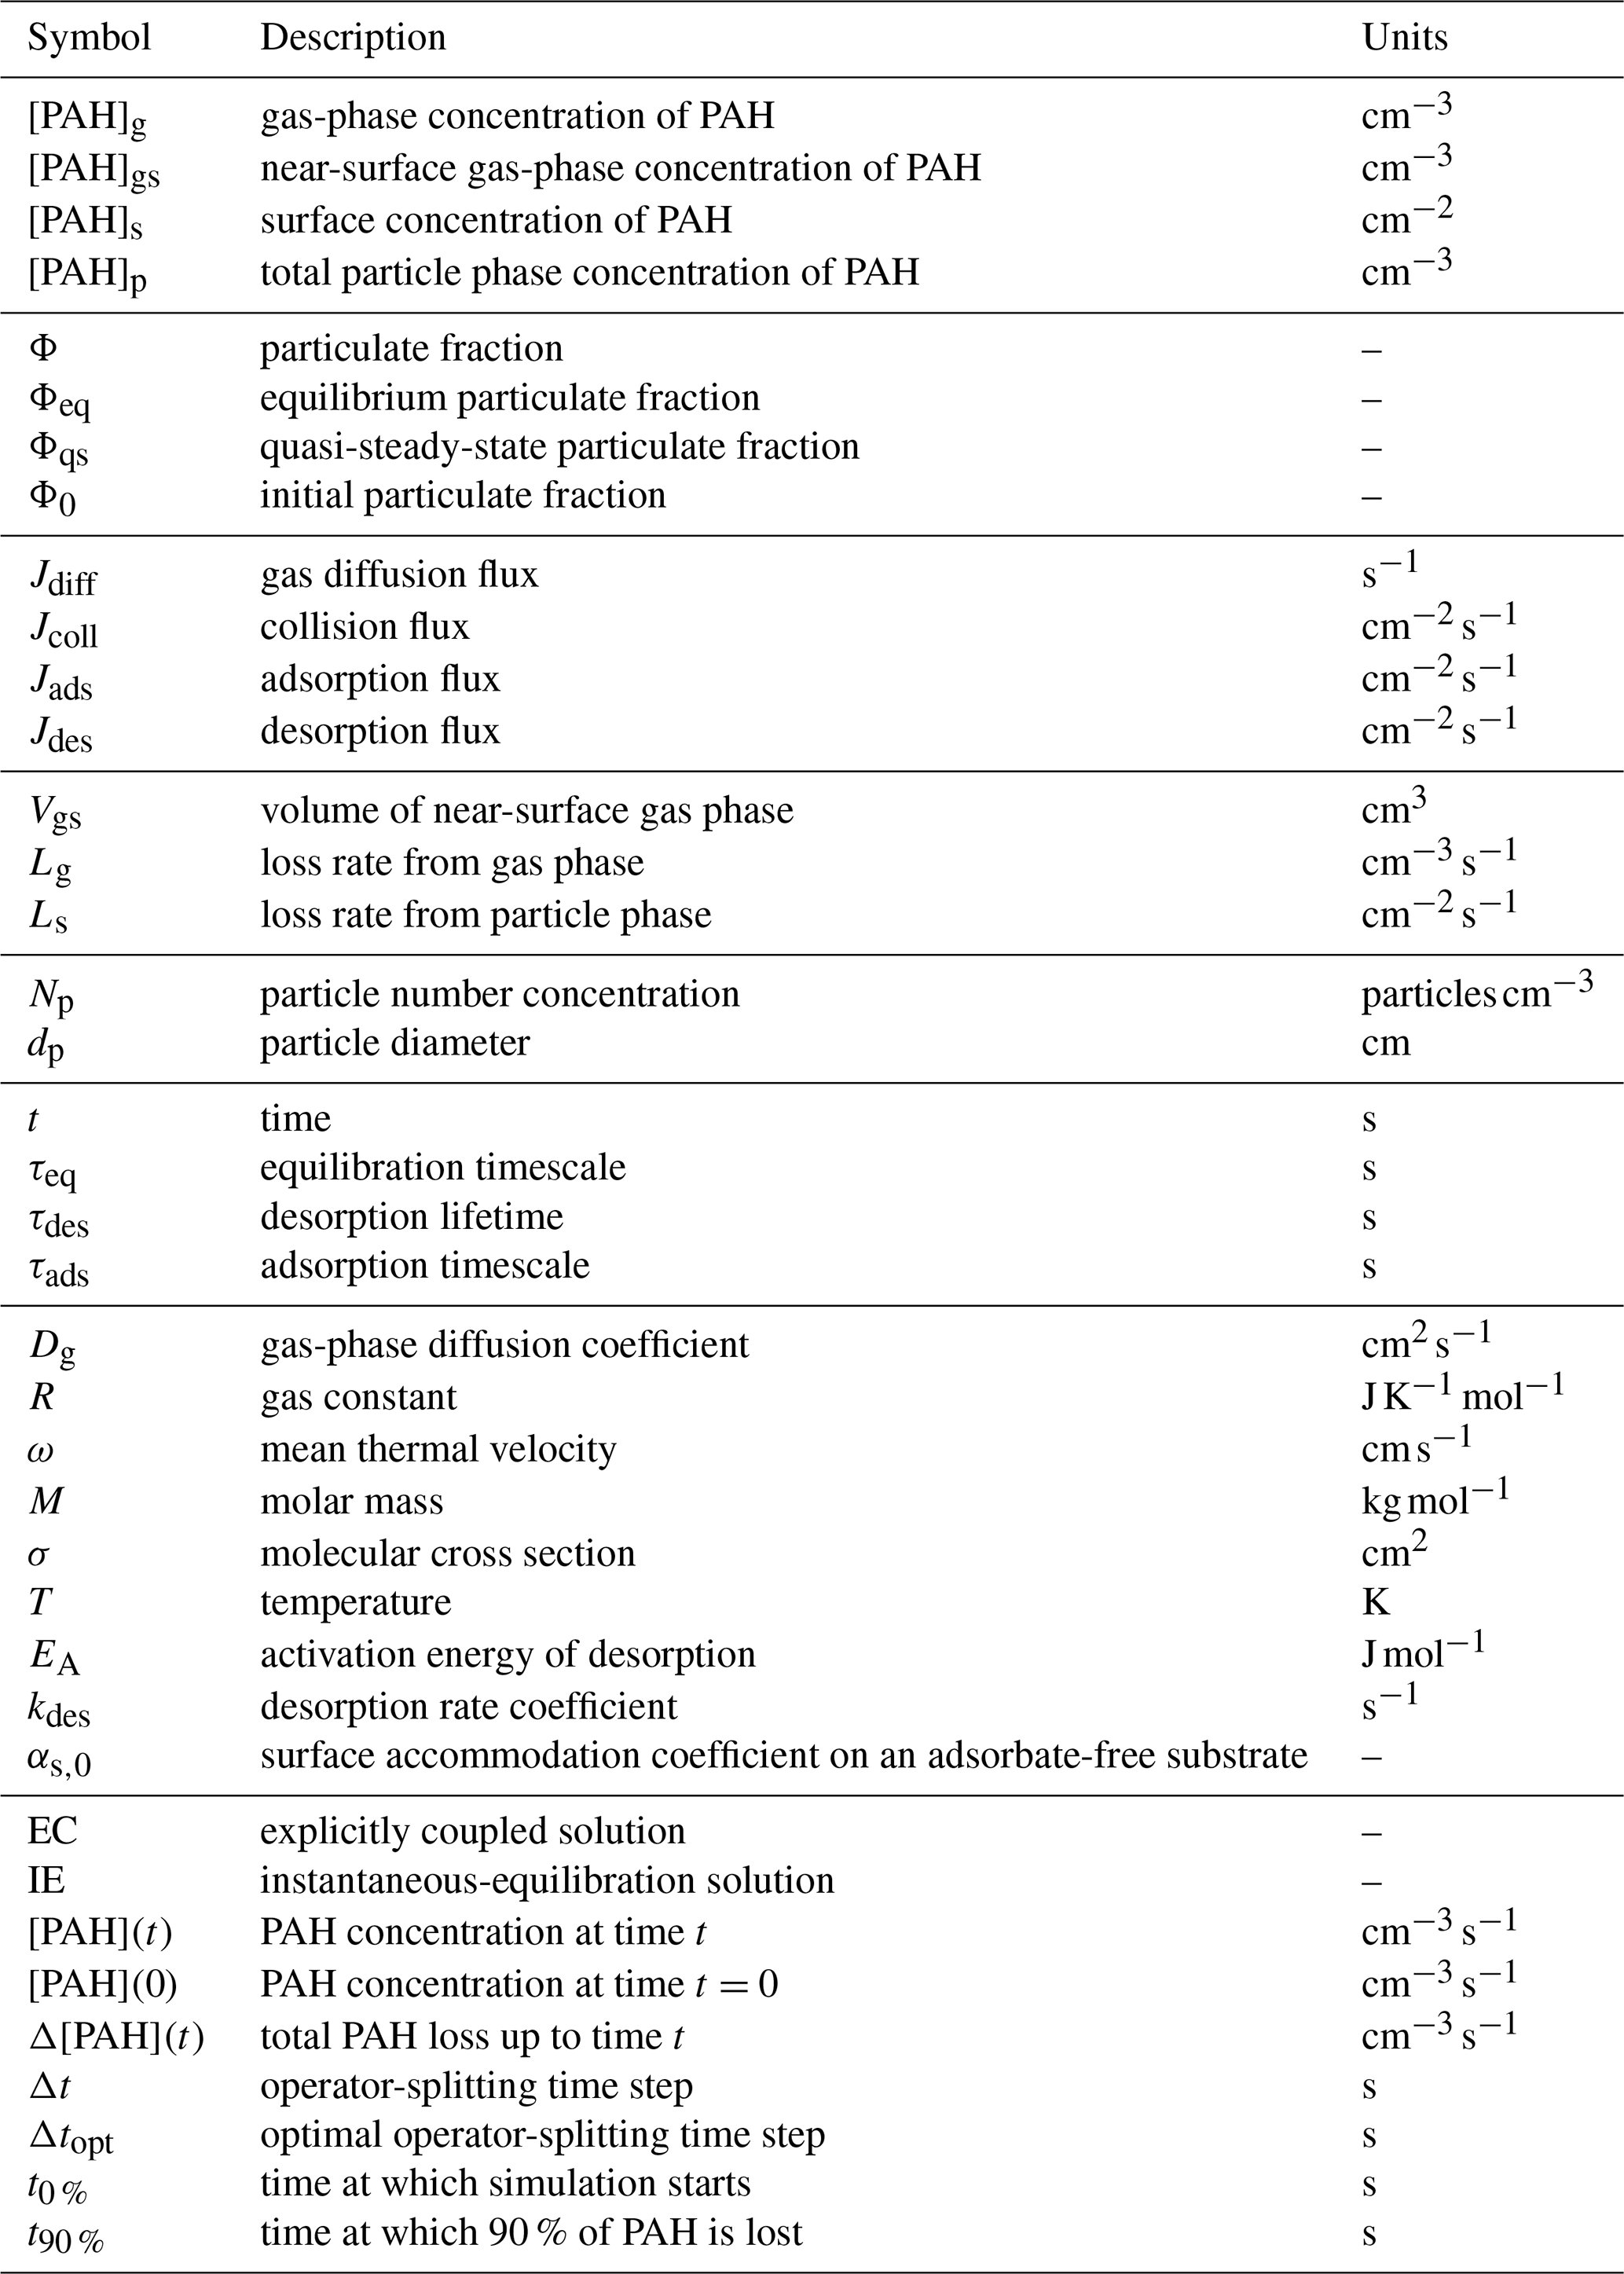
2.1 Kinetic model
A modified version of the kinetic double-layer model K2-SURF is used for all simulations (Shiraiwa et al., 2009). The original K2-SURF model consists of a near-surface gas phase and surface layer, with gas diffusion from the far-surface gas phase represented by a correction factor (Fig. A1). In this study, we added explicit treatment of gas diffusion to K2-SURF to track gas-phase PAH concentrations. PAHs reversibly desorb and adsorb between the aerosol particle surface and the near-surface gas phase. The rate coefficient for PAH desorption from the particle surface (s−1) depends on temperature T and two parameters determined from experiment: the Arrhenius factor A and the activation energy of desorption EA (Guilloteau et al., 2010). R is the gas constant. Aerosol particles are assumed to be monodisperse and to consist of a spherical, impenetrable solid carbon core. The system is closed with respect to aerosol particles and PAH in all simulations. In simulations involving chemical reactions, the system is open with respect to oxidants; i.e., gas-phase OH and O3 concentrations are fixed.
The differential equations in Eqs. (1)–(3) describe the time evolution of [PAH]g (cm−3), [PAH]gs (cm−3), and [PAH]s (cm−2), which are the number concentrations (i.e., a unitless count of molecules per unit volume or unit area) of PAH in the gas phase, in the near-surface gas phase, and on the surface of aerosol particles, respectively. Jdes (), Jads (), and Jdiff (s−1) are the desorption flux, adsorption flux, and gas diffusion flux. Each flux term is described in detail in Appendix A.
The surface area of a single aerosol particle with diameter dp (cm) is , Vgs (cm3) is the volume of gas in the near-surface gas phase for a single aerosol particle, and Np (cm−3) is the particle number concentration. Lg () is the rate of chemical loss in the gas phase, and Ls () is the rate of chemical loss in the particle phase. Reactions of PAHs within the near-surface gas phase are considered to be negligible due to the small fraction of PAHs in this volume. Sources of PAHs are not considered in this study.
2.2 Chemical reactions
The surface reaction between pyrene and O3 is modeled using a Langmuir–Hinshelwood mechanism, including reversible adsorption of O3 onto the surface of aerosol particles and reaction of surface-adsorbed O3 with surface-adsorbed pyrene.
The rate coefficient for reaction of pyrene with O3, cm2 s−1, and the corresponding mass-transport parameters are taken from Shiraiwa et al. (2009) (Table A1). Reaction products are treated as inert and non-volatile. Note that the reaction between O3 and benzo(a)pyrene on the surface of soot has been suggested to involve the formation of long-lived reactive oxygen intermediates (Shiraiwa et al., 2011). Such a detailed chemical mechanism is beyond the scope of this study, which instead focuses on the interaction of partitioning and chemistry, and has thus been omitted for simplicity. The desorption rate coefficients of both pyrene and O3, which are temperature dependent and explicitly included in the model, are expected to be the main driver of sensitivity in the model with regards to temperature. It should be noted that the accommodation coefficient and surface layer reaction rate coefficient may also exhibit temperature dependence but without further quantitative parameters cannot be included in the model. The gas-phase reaction between O3 and pyrene is considered negligible and is therefore not included (Keyte et al., 2013). The reaction between pyrene and OH is accounted for both in the gas phase and on the surface of particles.
The gas-phase reaction between pyrene and OH is modeled with the rate coefficient cm3 s−1 (theoretical calculation at 298 K; Zhang et al., 2014). The reaction between pyrene and OH on the surface of particles is treated with an Eley–Rideal-like mechanism using a surface reaction probability of 0.32 (obtained for pyrene; Bertram et al., 2001) and assuming an OH gas diffusion coefficient Dg of 0.21 cm2 s−1 (Tang et al., 2014). The temperature dependence of the gas-phase OH reaction of PAHs has been found experimentally to be “slight to nonexistent” (Brubaker and Hites, 1998). Likewise, the reaction probability of OH on a pyrene surface has been found to exhibit only a slight temperature dependence (Liu et al., 2012). We therefore do not include temperature dependence of chemical rate coefficients in this model. The uptake of OH onto the surface of particles is considered to be irreversible.
2.3 Particulate fraction
The measured distribution of PAHs (and other semi-volatiles) between the particle phase and the gas phase is commonly described with the particulate fraction Φ, i.e., the fraction of total PAHs associated with aerosol particles (Eq. 4).
The total concentration of PAH adsorbed on the surface of aerosol particles [PAH]p (cm−3) is the product of the surface area of a single particle with diameter dp, the particle number concentration Np, and surface concentration of PAH [PAH]s (cm−2; Eq. 5).
2.4 Equilibration timescale τeq
To quantify the time for PAHs to reach their equilibrium distribution between the gas phase and the particle phase, we use the equilibration timescale (τeq), defined as e-folding time for the relaxation of the system to gas–particle partitioning equilibrium. Figure 1 shows results from a kinetic box model simulation with a concentration of pyrene in air of 5×105 cm−3, temperature T=298 K, particle number concentration , and particle diameter dp=200 nm. No chemical loss of pyrene is included here. τeq is obtained numerically from model outputs by interpolating the time required by the system to achieve (i.e., ≈63.2 %) of the difference ΔΦ between an initial particulate fraction Φ0 and the equilibrium particulate fraction Φeq.
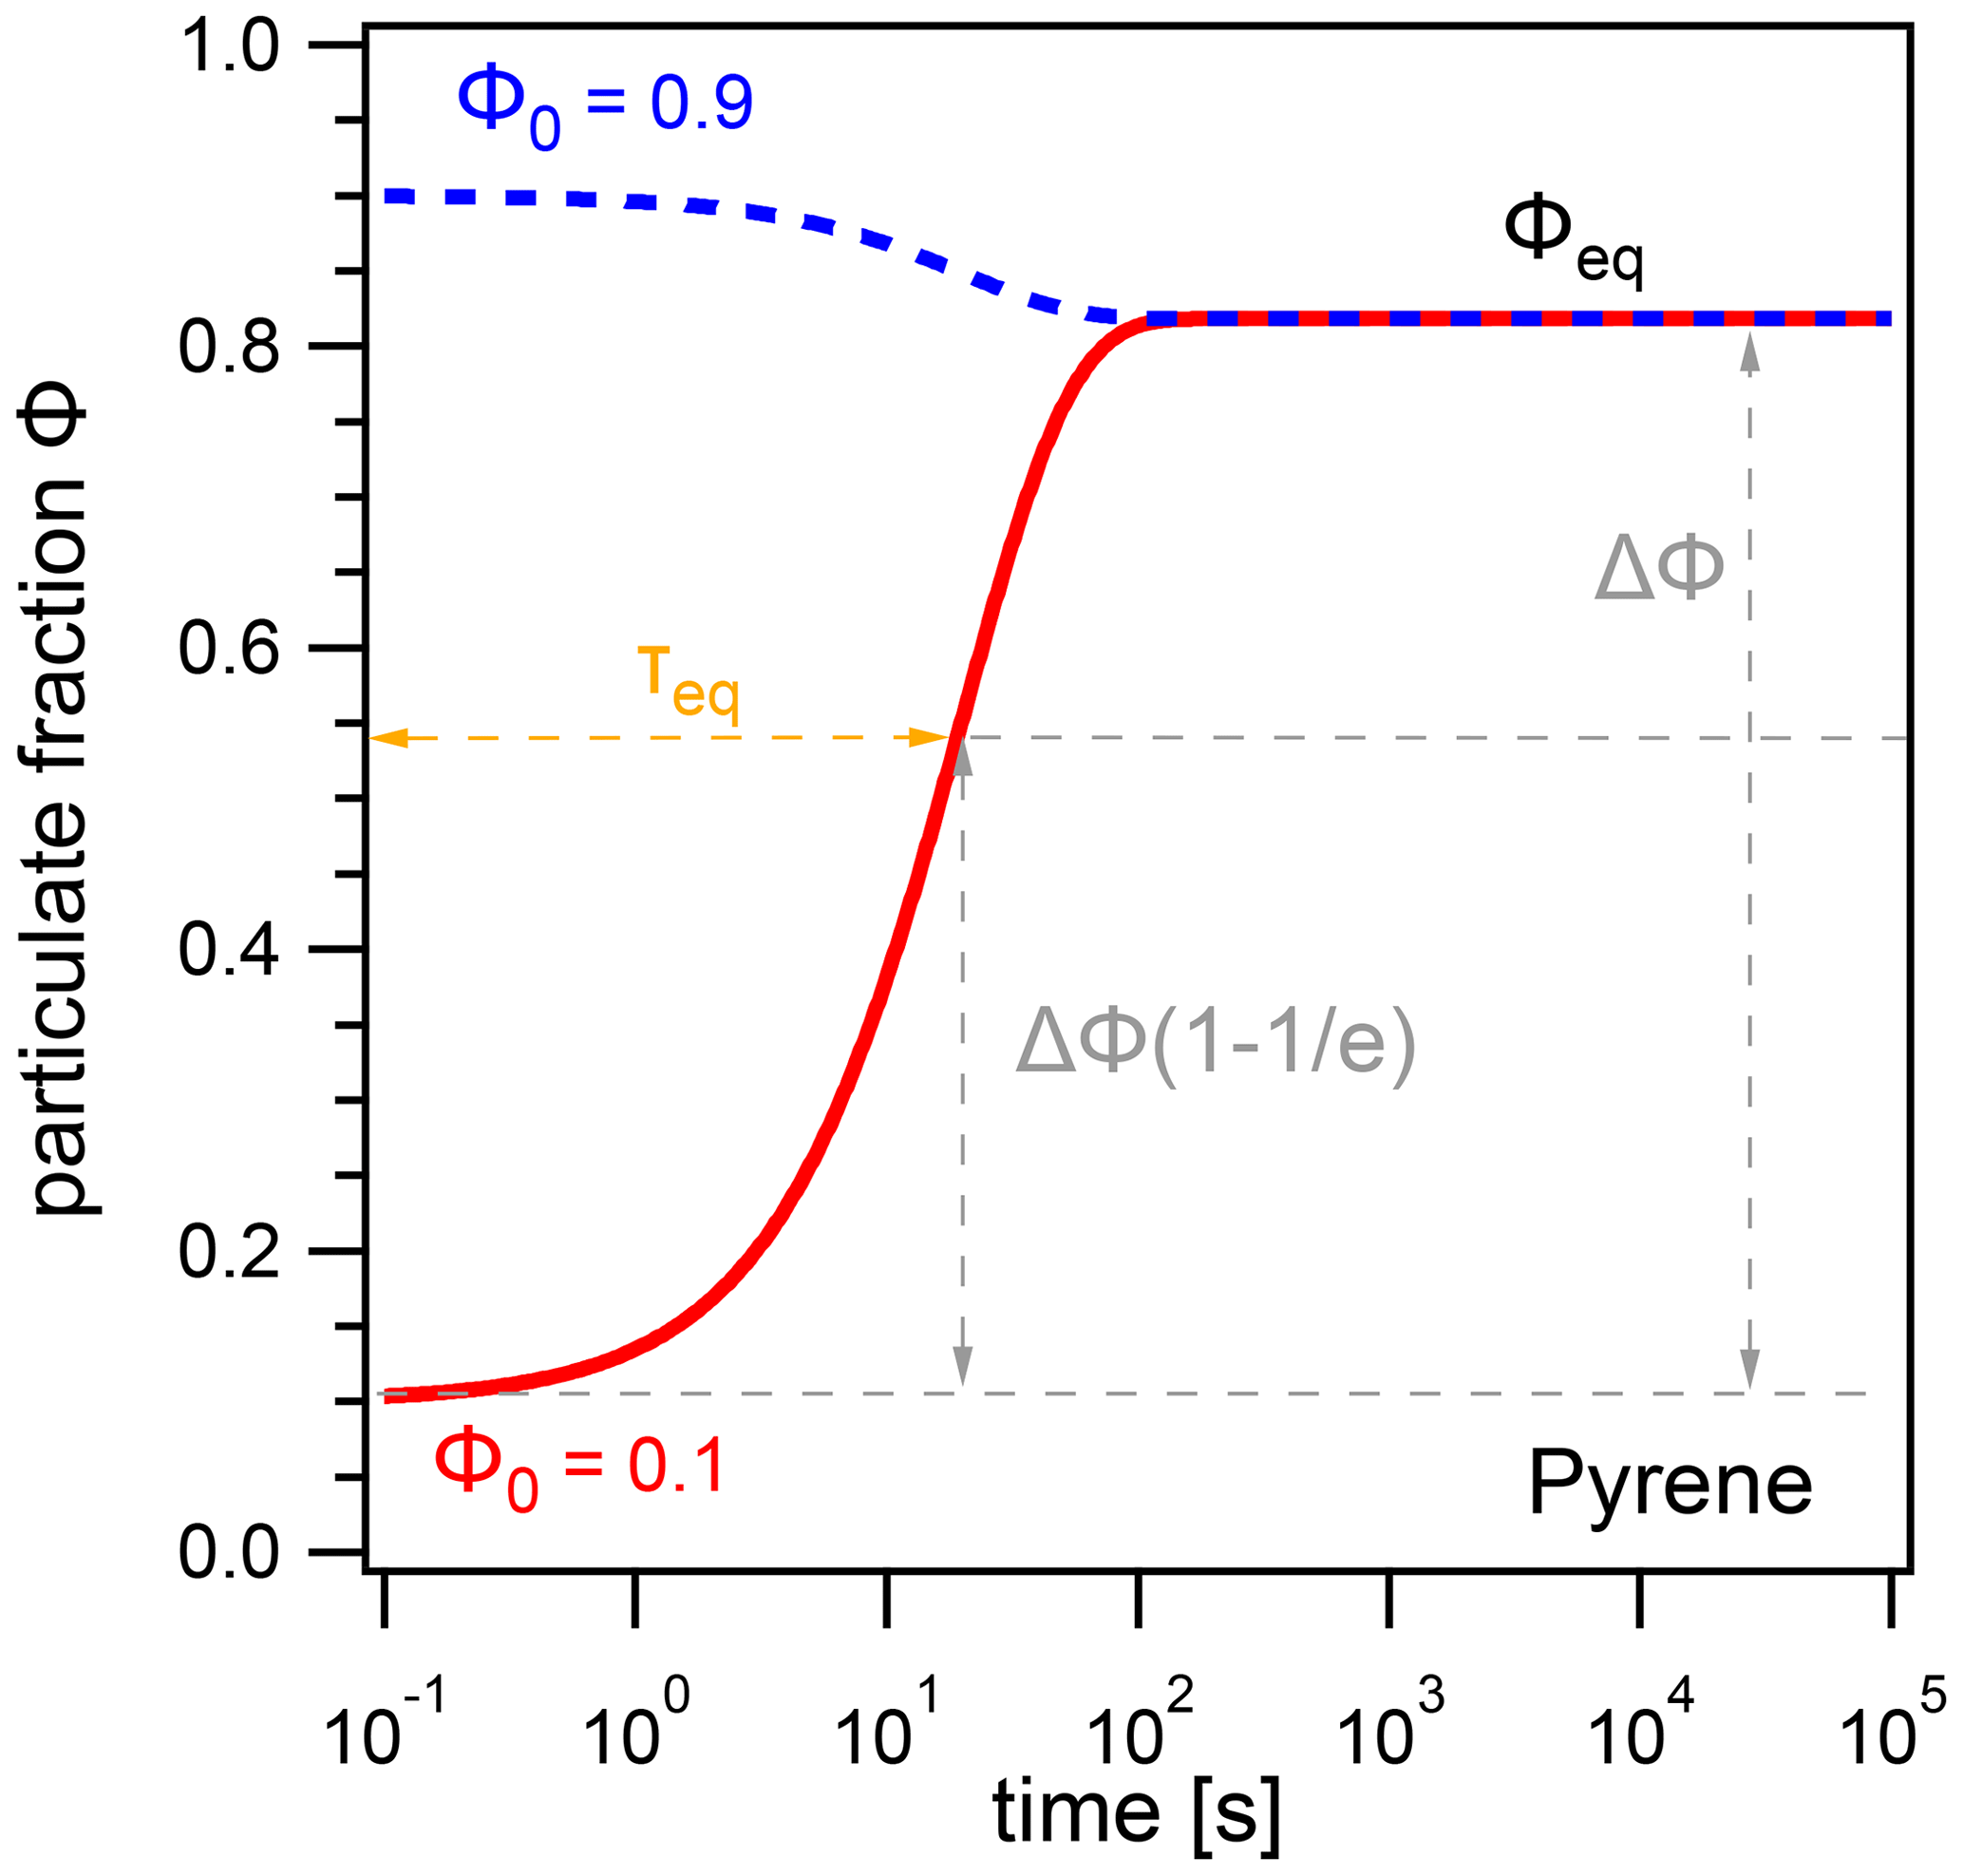
Figure 1The evolution of the particulate fraction Φ of pyrene with respect to time, starting from initial particulate fractions Φ0=0.1 (red) and Φ0=0.9 (blue). The equilibration timescale τeq is defined as the time required for the system to achieve 63.2 % of ΔΦ, the difference between Φ0 and Φeq.
In this example, pyrene reaches Φeq after ≈2 min, and the equilibration timescale is independent of the initial particulate fraction; i.e., τeq is the same regardless of whether Φ0=0.1 or Φ0=0.9. In fact, τeq is found to be independent of the choice of Φ0 for most conditions due to the first-order and hence mono-exponential nature of the adsorption and desorption processes. This allows for consistent intercomparison across different temperatures and particle number concentrations without changing starting distributions. Exceptions may occur in cases where surface adsorption is not strictly a first-order process, due to either surface saturation effects or gas-phase diffusion limitations. These conditions occur at very low particle number concentrations (typically ), and further details are given in Appendix B.
3.1 Extreme cases of multiphase chemistry and partitioning interaction
Three extreme cases can be formulated when partitioning, and chemical-loss processes of a semi-volatile compound take place at different relative timescales (Fig. 2).
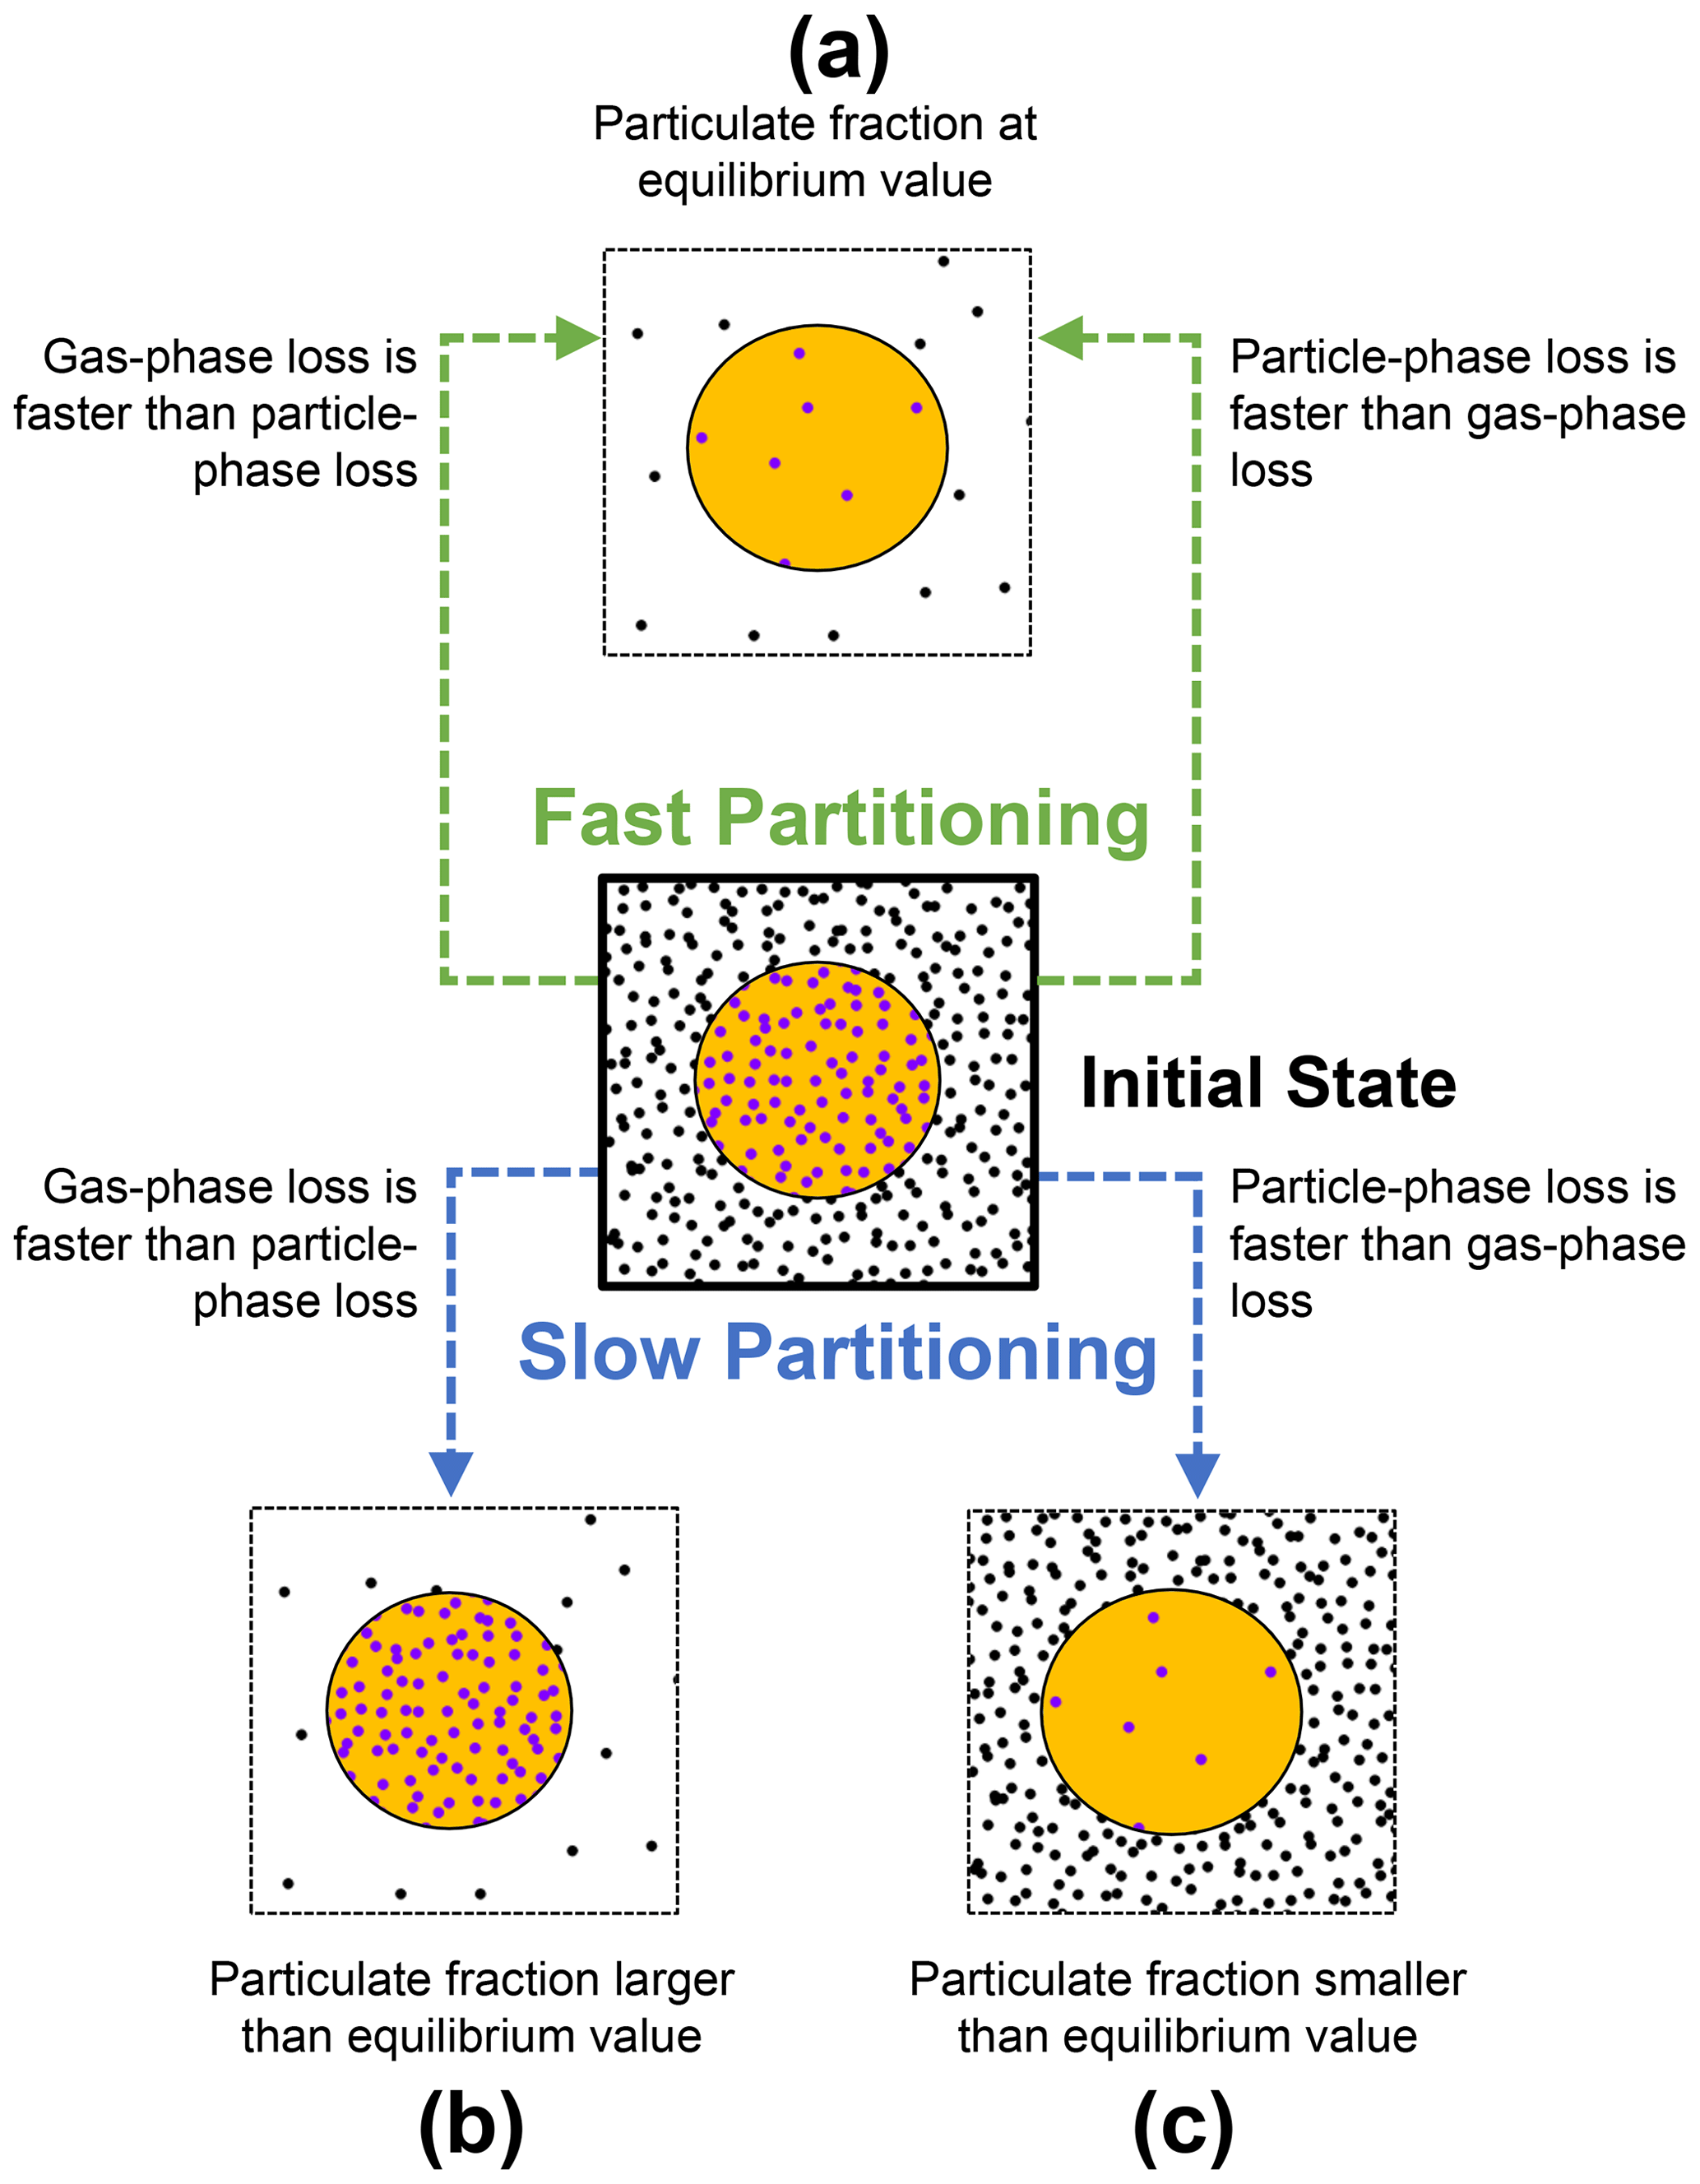
Figure 2Schematic on how the gas–particle partitioning equilibrium of a semi-volatile compound may be perturbed from an initial state (center) due to chemical loss, depending on equilibration timescales. If the timescales of partitioning are shorter than the timescales of chemical loss, the system is able to maintain equilibrium (a). However, the combination of rapid gas-phase loss and slow replenishment from the particle phase increases the particulate fraction above the equilibrium value (b). In turn, the combination of rapid particle-phase loss and slow replenishment by condensation decreases particulate fraction below the equilibrium value (c).
When the timescale of partitioning is short compared to the timescales of chemical loss, molecules are redistributed quickly between both phases (case a, Fig. 2). In this case, the relative amounts of gas- and particle-phase species will remain very close to their equilibrium values (Φ≈Φeq). This is independent of whether molecules are lost primarily from the gas phase or from the particle phase.
In contrast, if the timescale of the partitioning process is slow and the chemical loss rates from the gas and particle phase differ substantially, the particulate fraction will be perturbed from its equilibrium value (cases b and c, Fig. 2). When the loss rate in the gas phase exceeds the loss rate in the particle phase, the particulate fraction increases beyond its equilibrium value (Φ>Φeq; case b, Fig. 2). However, when the loss rate in the particle phase is greater than that in the gas phase, the particulate fraction decreases (Φ<Φeq; case c, Fig. 2).
Unlike these scenarios, chemical-loss and partitioning timescales may not differ substantially. Likewise, chemical losses are likely to take place in both phases simultaneously. Every real system must therefore be seen as superposition of these cases. The extent to which perturbation occurs depends upon the difference between partitioning and chemical reaction timescales. An in-depth discussion on the magnitude of perturbation is provided in Sect. 3.3.
Hence, two preconditions are required for the particulate fraction Φ of the system to be perturbed from the equilibrium particulate fraction predicted by equilibrium partitioning theory Φeq: (1) slow partitioning relative to the timescale of chemical loss and (2) an imbalance of chemical loss between the gas and particle phases.
If timescales of chemical loss and partitioning were known for all natural systems, they could be classified and mathematically treated in the respective limiting case. In this manuscript, we (1) estimate the partitioning timescales of PAH on soot as a function of atmospheric conditions, (2) compare these timescales to typical chemical loss rates in order to investigate whether perturbations from equilibrium exist, and (3) explore the implications of treating partitioning and chemistry separately in chemical transport models.
3.2 Partitioning equilibration timescales for PAHs on soot
τeq depends on the molecular structure of the PAH, particle number concentration, and temperature. This is explored in the following section with a series of simulations using a fixed total concentration of PAHs in air of 5×105 cm−3 and particles with a diameter of 50 nm.
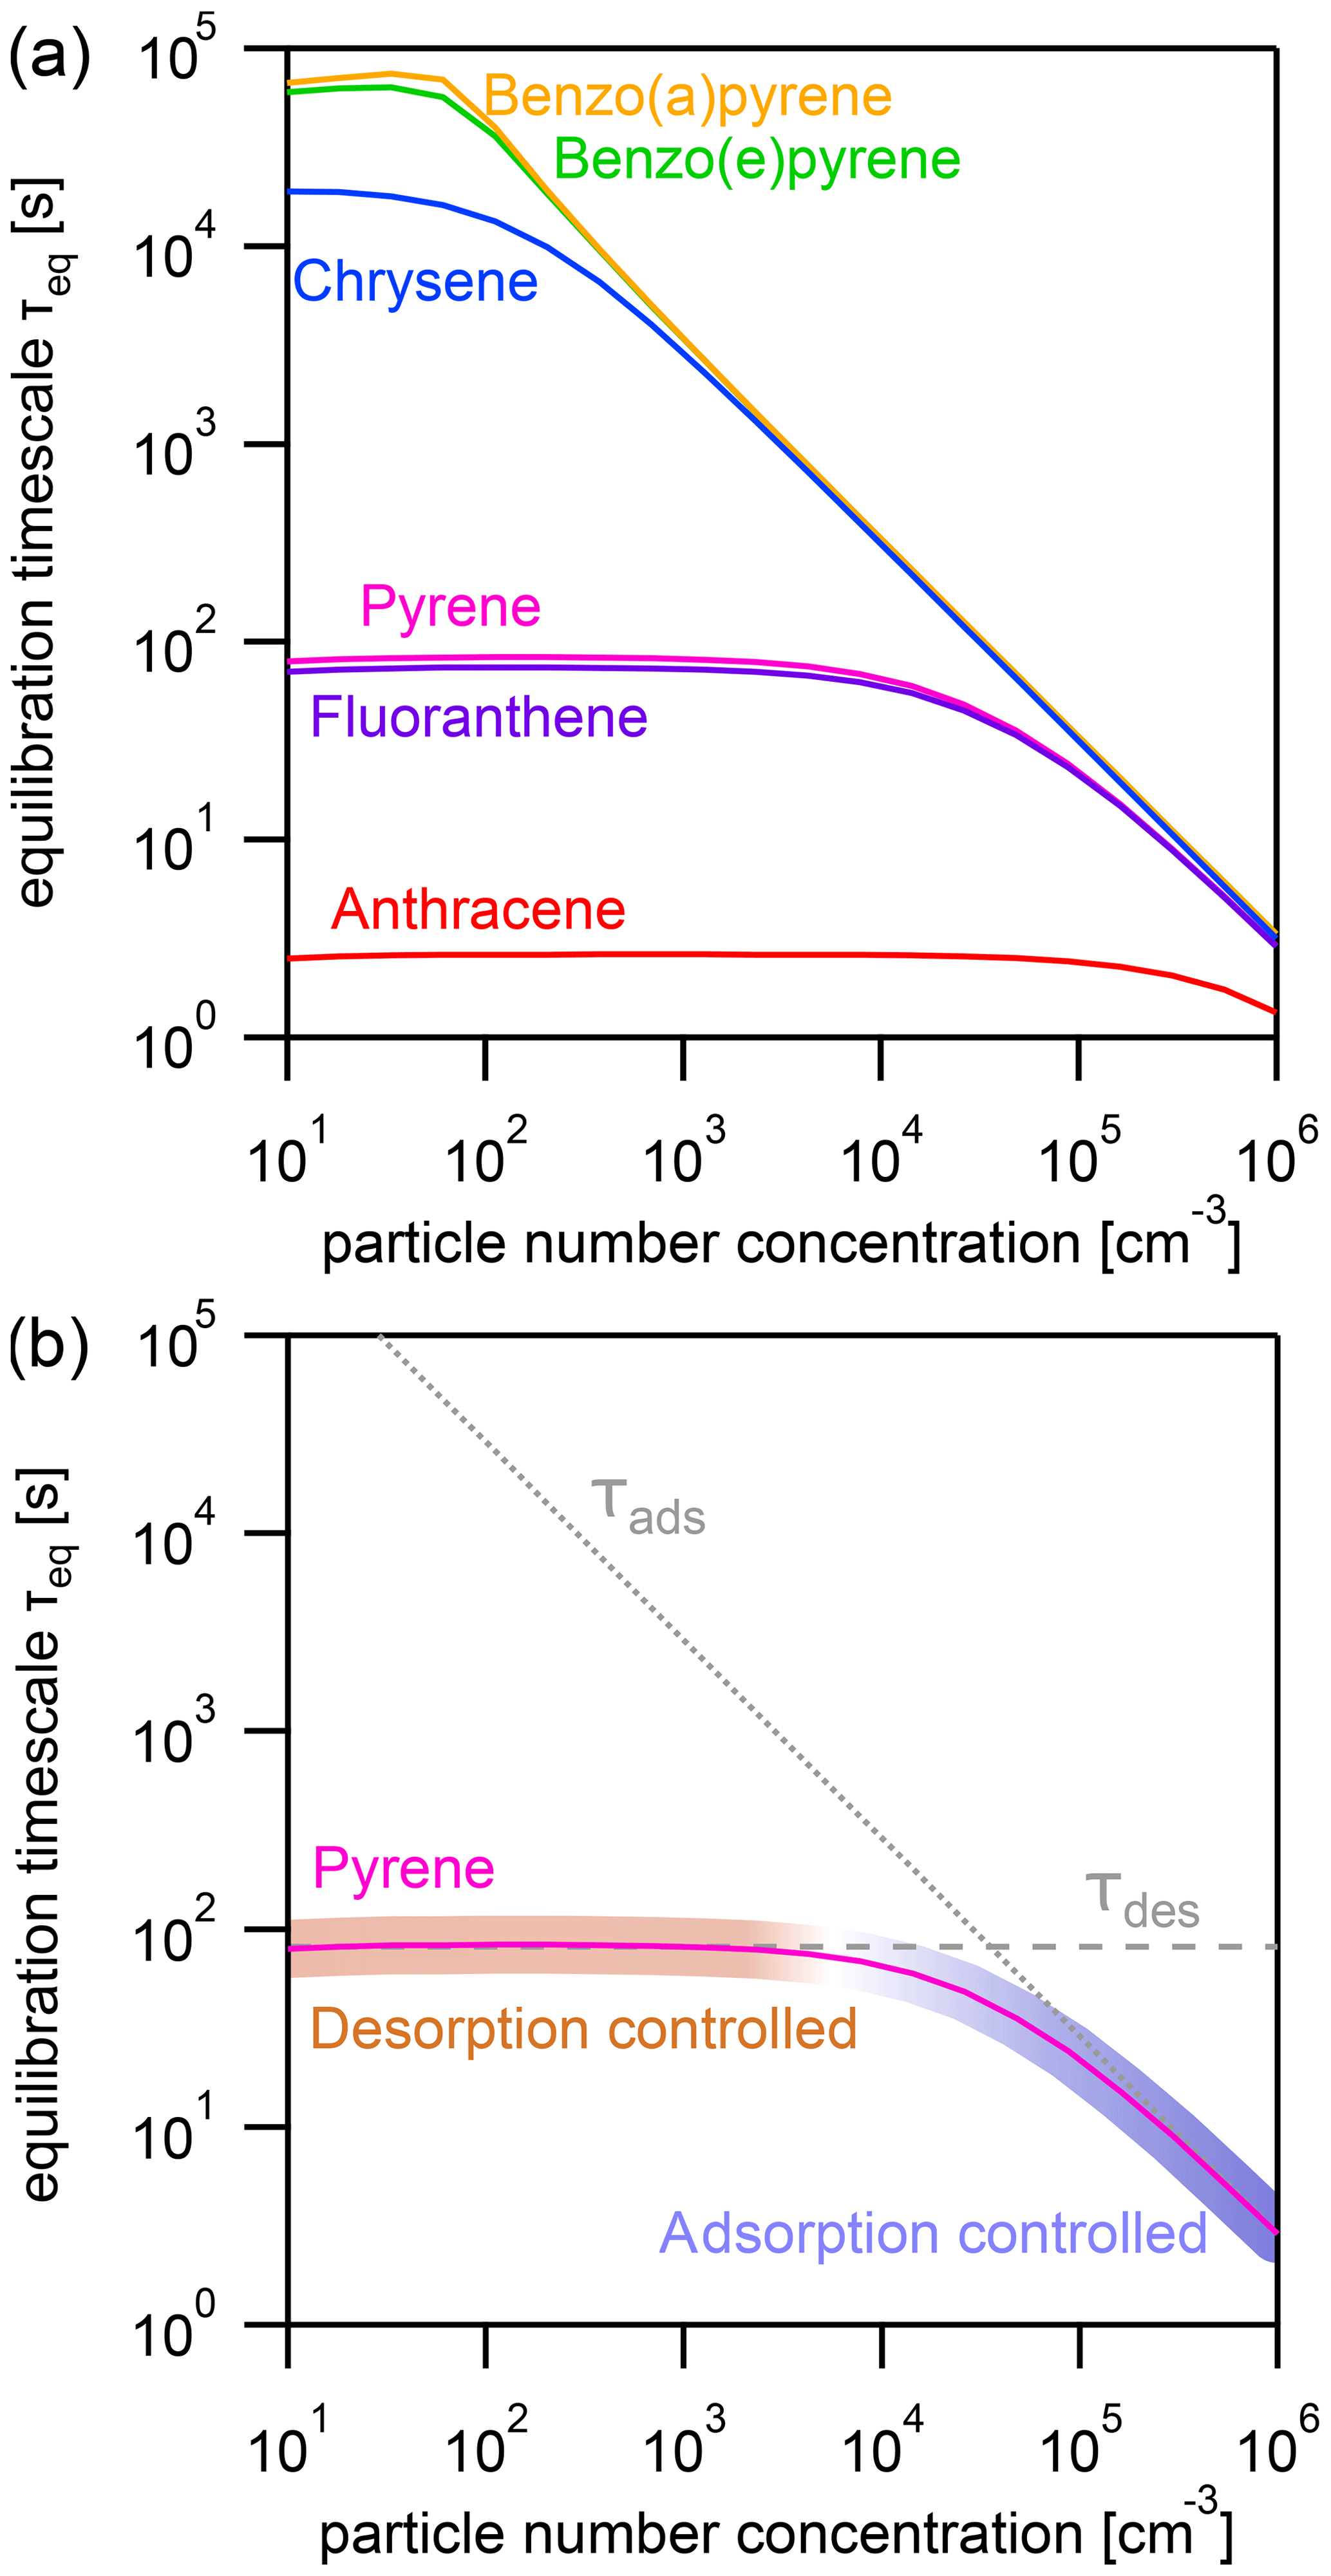
Figure 3(a) Equilibration timescale τeq for different PAHs as a function of particle number concentration at a constant temperature (T=298 K). (b) Comparison of the equilibration timescale of pyrene to the timescales of adsorption τads and desorption τdes, highlighting the transition between adsorption-controlled and desorption-controlled behavior.
3.2.1 Particle number concentration
The effect of varying the particle number concentration Np on the equilibration timescale shows a distinct behavior (Fig. 3a): τeq is particle number independent at lower Np, while τeq is particle number dependent at higher Np. The equilibration timescales of the less strongly adsorbed PAHs – including anthracene, fluoranthene, and pyrene – are not significantly affected by particle number concentration until a fairly high threshold particle number concentration is achieved (≈105, 104, and 104 particles cm−3, respectively).
Once the threshold particle number concentration is reached, a linear relationship in the double logarithmic dependence of equilibration timescale and particle number concentration emerges. The more strongly adsorbed PAHs – chrysene, benzo(e)pyrene, and benzo(a)pyrene – reach this limit at a much lower Np (≈102 particles cm−3). This can be understood when looking at Fig. 3b, in which the equilibration timescale of pyrene is shown together with the individual timescales of desorption τdes (dashed gray line, calculated with Eq. 6) and adsorption τads (dotted gray line, calculated with Eq. 7).
In the limit of an adsorbate-free surface, adsorption and desorption are first-order processes with respect to the near-surface gas and surface concentrations of PAH, respectively, and can therefore be described with rate coefficients kads (s−1) and kdes (s−1). The desorption timescale τdes depends on the Arrhenius factor A and the activation energy for desorption from the aerosol particle surface (EA), the gas constant R, and temperature T. The adsorption timescale τads depends on the surface accommodation coefficients on an adsorbate-free substrate αs,0; the particle number concentration Np; the surface area of a single aerosol particle with diameter dp; and the mean thermal velocity ω. The surface coverage θs is very small for typical particle number concentrations and will therefore be neglected in the following. In general, τeq can be approximated as a function of both timescales according to Eq. (8) (see Appendix B for details of the terms and derivation). This approximation holds as long as gas diffusion is sufficiently fast and does not limit equilibration.
If one process (desorption or adsorption) dominates the behavior of τeq, the system can be said to fall into an adsorption-controlled regime (highlighted for pyrene with blue shading) or a desorption-controlled regime (highlighted with red shading). A multi-step process in which mass is lost and transferred in one direction can be described analogously to a series of resistors in an electrical circuit, and the term limiting can be used to describe the slowest step. In contrast, the gas–particle partitioning system is a reversible system in which mass is transferred in both directions, and the relative rates of these mass-transfer processes determine the position of equilibrium. We therefore observe in Fig. 3b (and also Fig. 4b) that the equilibration time is determined primarily by the fastest process (i.e., that with the shortest timescale). We therefore adopt the term controlled to characterize this behavior.
In the low particle number concentration limit, the system is in a desorption-controlled regime and the equilibration timescale is thus strongly influenced by strength of the PAH–soot interaction, which explains the large differences in equilibration timescale between PAHs in Fig. 3a. In the high particle number concentration limit, the equilibration timescale is determined primarily by the adsorption of PAH onto particles from the near-surface gas phase and is therefore independent of PAH type as can be seen from the convergence of curves in Fig. 3a. The equilibration timescale here coincides with the adsorption timescale τads, and the system is in an adsorption-controlled regime. The transition between both regimes occurs where τads intersects τdes and coincides with the point Φeq=0.5. At this specific point, equal amounts of PAH are in the gas and particle phases, and the timescales of desorption and adsorption contribute equally to the equilibration time.
As surface coverages θs are very small and PAHs generally have surface accommodation coefficients on an adsorbate-free substrate of (Julin et al., 2014), we find in this study a special case of the adsorption-controlled regime where molecular collision of gas molecules is the sole controller of partitioning. For adsorbates with lower αs,0, the adsorption timescale would be longer and the system may be in the desorption-controlled regime.
3.2.2 Temperature
The effect of varying temperature T on the equilibration timescale shows a behavior similar to the one seen for the particle number concentration (Fig. 4a): τeq is temperature independent at low T, while τeq is temperature dependent and begins to decrease at higher T. For the most weakly adsorbed PAH anthracene, τeq begins decreasing at 240 K towards higher T and at 298 K is already less than 5 s. The equilibration timescales for fluoranthene and pyrene begin decreasing at ≈260 K and at 298 K are both less than 100 s. Strongly adsorbed PAHs – including chrysene, benzo(e)pyrene, and benzo(a)pyrene – do not undergo a significant change in equilibration timescale in the investigated temperature range.
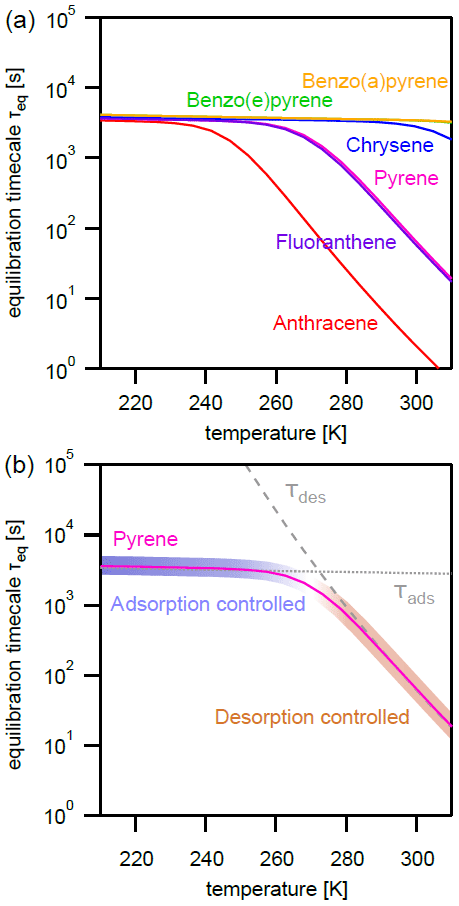
Figure 4(a) Equilibration timescale τeq for different PAHs as a function of temperature at a constant particle number concentration (). (b) Comparison of the equilibration timescale of pyrene to the timescales of adsorption τads and desorption τdes, highlighting the transition between adsorption-controlled and desorption-controlled behavior.
Again, the adsorption-controlled and desorption-controlled regimes explain this behavior (Fig. 4b). Between 210 and 240 K, PAH molecules possess little kinetic energy and are prevented from escaping into the gas phase, thus exhibiting long desorption lifetimes (Fig. A3) and high equilibrium particulate fractions (Fig. A2b). As most PAH is adsorbed on the surface of aerosol particles, molecular collision determines equilibration time. The system is in the adsorption-controlled regime, highlighted for pyrene with blue shading and signified by the coincidence with the adsorption timescale τads (dotted gray line). The number of collisions between gas-phase PAHs and particles slightly increases as the thermal velocity increases, but this effect is much smaller compared to the effect of temperature increase on desorption rates. Note that the surface accommodation coefficient is assumed to be temperature independent in this study. Overall, upon increase in temperature, the desorption process becomes increasingly important. At high temperature, the system is in the desorption-controlled regime, highlighted for pyrene with red shading in Fig. 4b and signified by the coincidence with the timescale of desorption τdes (dashed gray line).
3.3 Interplay of multiphase chemistry and partitioning
Chemical reactions with O3 and OH are important loss processes for PAHs. If the rate of chemical loss is fast relative to gas–particle partitioning, the gas–particle distribution may be perturbed from its equilibrium state (cf. Fig. 2, cases b and c). This effect is exemplified for pyrene by including surface chemistry with O3 (0, 1, 10, and 100 ppb) or gas-phase and surface chemistry with OH (0, 0.01, 0.1, and 1 ppt) in the model. A concentration of 10 ppb is representative of surface background O3 concentrations (Vingarzan, 2004), while 100 ppb O3 is characteristic of concentrations at more polluted sites (Wang et al., 2017). An OH concentration of 0.01 ppt is representative of concentrations measured at night (Geyer et al., 2003), while 0.1 ppt is representative of daytime concentrations (Stone et al., 2012), and 1 ppt is an upper limit only encountered in highly polluted conditions (Hofzumahaus et al., 2009) and smoke plumes (Hobbs et al., 2003). We employ the following conditions in the pyrene–soot system: T=280 K, particles cm−3, and dp=50 nm. At the start of the simulation, the initial total concentration of pyrene (5×105 cm−3) is distributed between the gas and particle phases according to the particulate fraction expected at equilibrium (i.e., ). The kinetic rate coefficients for all reactions are given in Sect. 2.2. Oxidant concentrations are fixed during simulations.
3.3.1 Non-equilibrium effects on chemical lifetime and particulate fraction
Figure 5a shows the decrease in the total (gas + particle) concentration of pyrene at different O3 concentrations. The chemical lifetime of pyrene is determined by calculating the time needed for the concentration to reach (i.e., ≈36.8 %) of its initial value. As the concentration of O3 increases from 1 to 10 and 100 ppb, the chemical lifetime of pyrene subsequently decreases to 23.9, 3.1, and 1.2 h, respectively. It is informative to compare these chemical lifetimes to those calculated by assuming partitioning is infinitely fast (i.e., the particulate fraction is fixed to Φeq during simulations). In this fictional scenario, the lifetimes of pyrene are significantly shorter at 23.1, 2.4, and 0.3 h and correspond to decreases of 3, 23, and 75 %, respectively. This comparison demonstrates that partitioning and chemical loss are closely interlinked. In this specific case, slow partitioning prolongs the lifetime of pyrene.
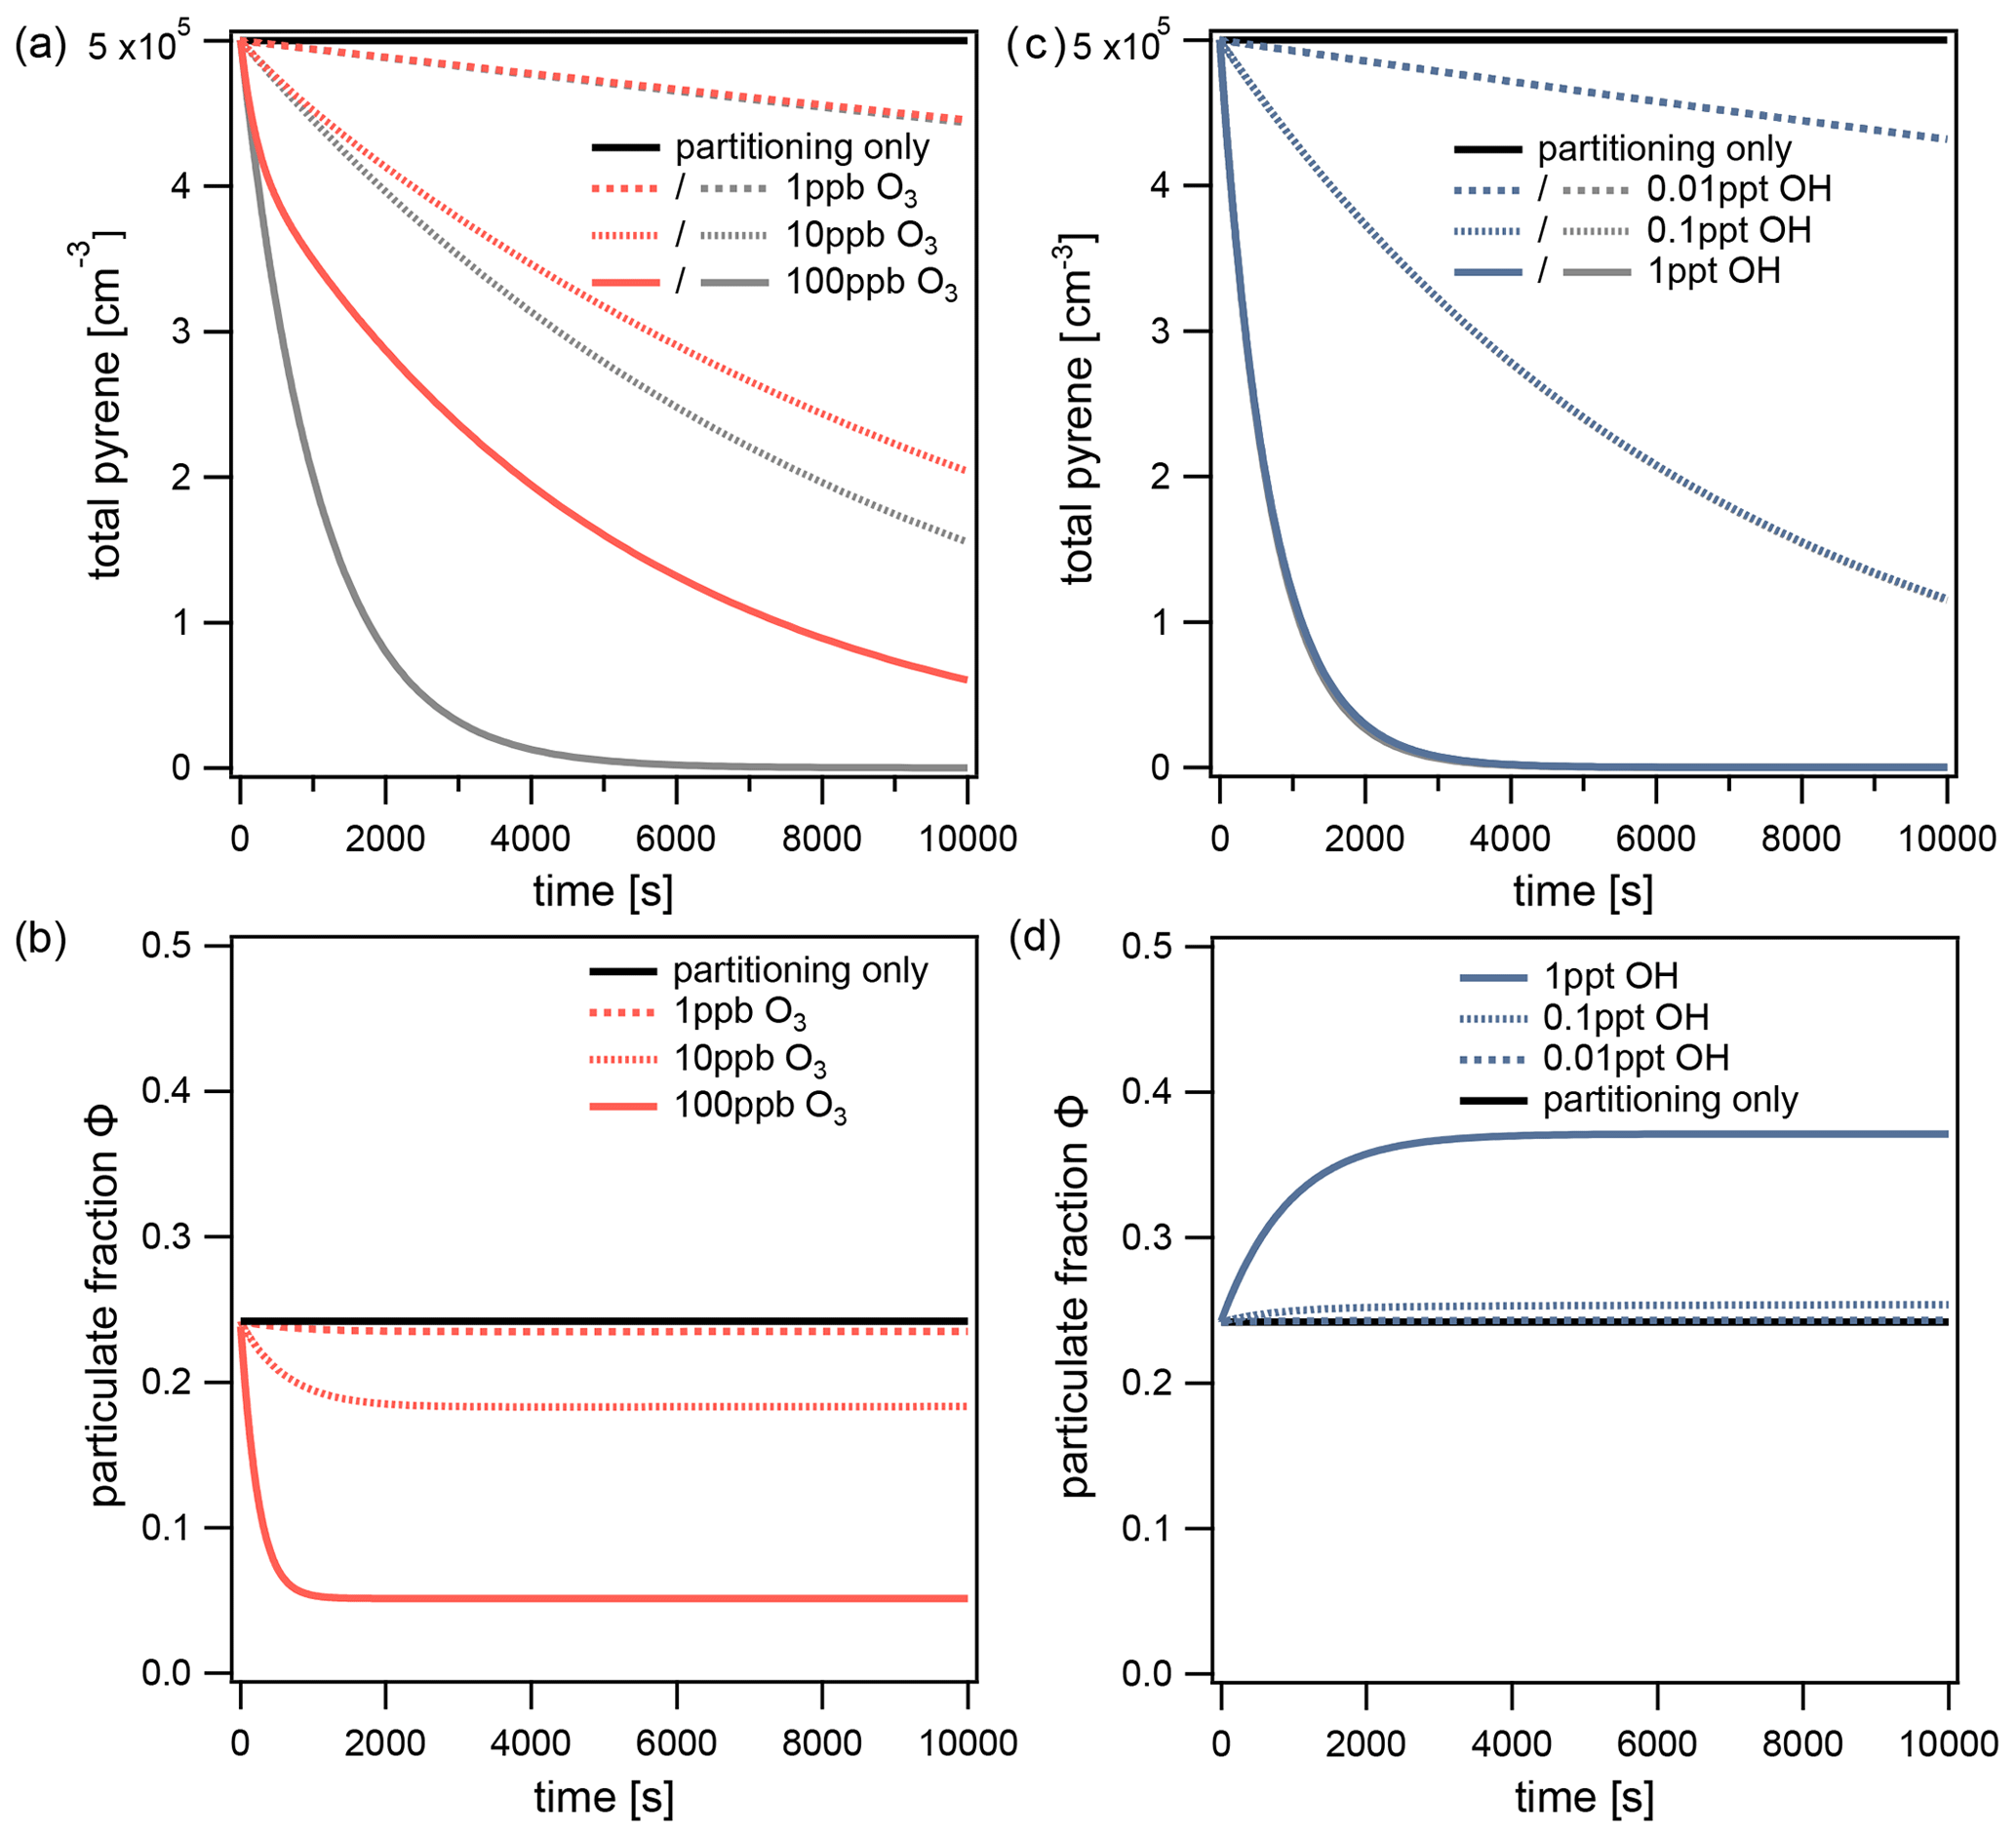
Figure 5The total pyrene concentration (gas phase+particle phase) with respect to time at different concentrations of (a) O3 and (b) OH. O3 reacts only with pyrene on the surface of particles, whereas OH reacts with pyrene in simultaneous gas and surface reactions. The total concentration of pyrene determined in a fictional scenario with infinitely fast partitioning is shown with gray lines. For the same simulations, the particulate fraction of pyrene with respect to time is shown: (c) O3 and (d) OH. The equilibrium particulate fraction Φeq is shown with a black line.
This effect can be understood by observing the change in particulate fraction over time during each of the simulations (Fig. 5b). As each simulation proceeds, the particulate fraction Φ drops below the equilibrium particulate fraction Φeq and eventually reaches a quasi-steady state Φqs. At O3 concentrations of 10 and 100 ppb, the particulate fractions reach values of Φqs=0.18 and 0.05, respectively. This effect can be explained by slow partitioning: chemical loss reduces the surface concentration of pyrene faster than its replenishment from the gas phase (non-equilibrium case c in Fig. 2). In the quasi-steady state, chemical loss and repartitioning are balanced. Importantly, both values differ significantly from Φeq. In contrast, when the O3 concentration is low enough (1 ppb) the particulate fraction remains approximately equal to its value at equilibrium (). At this O3 concentration, the rate of partitioning is sufficiently high so that pyrene lost from the particle surface can be fully replenished from the gas phase (equilibrium case a in Fig. 2). Hence, non-equilibrium behavior increases with oxidant concentration.
Figure 5c shows the decrease in total concentration of pyrene due to the simultaneous gas and surface reactions with OH. The lifetimes of pyrene with OH concentrations of 0.01, 0.1, and 1 ppt are 18.9, 1.9, and 0.2 h, respectively. Nearly identical lifetimes are obtained if partitioning is assumed to be infinitely fast, thus indicating that non-equilibrium effects on chemical lifetime are insignificant for this system. Figure 5d shows that, in contrast to the behavior of the O3 system, the highest concentration of OH perturbs the particulate fraction to a quasi-steady state above its equilibrium value. The particulate fraction reaches a quasi-steady state with a value of Φqs=0.37 at 1 ppt OH. Although chemical loss takes in both phases simultaneously, the turnover of pyrene is higher in the gas phase. The particulate fraction thus increases, characteristic of the non-equilibrium case b in Fig. 2. At lower concentrations of OH, the extent of the perturbation becomes only slight (Φqs=0.25 at 0.1 ppt) and eventually disappears (0.01 ppt in Fig. 5d). Hence, non-equilibrium effects on particulate fraction can be significant, even if they were insignificant for chemical lifetime. This is due to the short reaction timescale of the OH–pyrene system compared to its partitioning timescale: pyrene reaches of its initial concentration before the quasi-steady state is established.
3.3.2 Visualization of non-equilibrium effects with phase portraits
The dynamic behavior of the system may be visualized as a trajectory in the phase space of gas-phase and particle-phase pyrene concentrations, [PAH]g and [PAH]p (Fig. 6). At every point in the phase portrait, a vector illustrates how the system would change with time. Here, the direction of each vector arrow indicates the extent to which pyrene is being lost or transferred between phases, and its length indicates the rate of change. The exact characteristics of the phase portrait depend on temperature, available particle surface area, the strength of the PAH–soot interaction, and the rate of the chemical reactions involved. For a system where pyrene partitions without chemical loss, all trajectories converge onto a central line at which the system stops changing, known in mathematics as the nullcline (Fig. 6a). This line represents the point of gas–particle partitioning equilibrium. The slope of the line represents the dimensionless gas–particle partitioning coefficient Kp, from which the equilibrium particulate fraction Φeq can be obtained (Eq. 9).
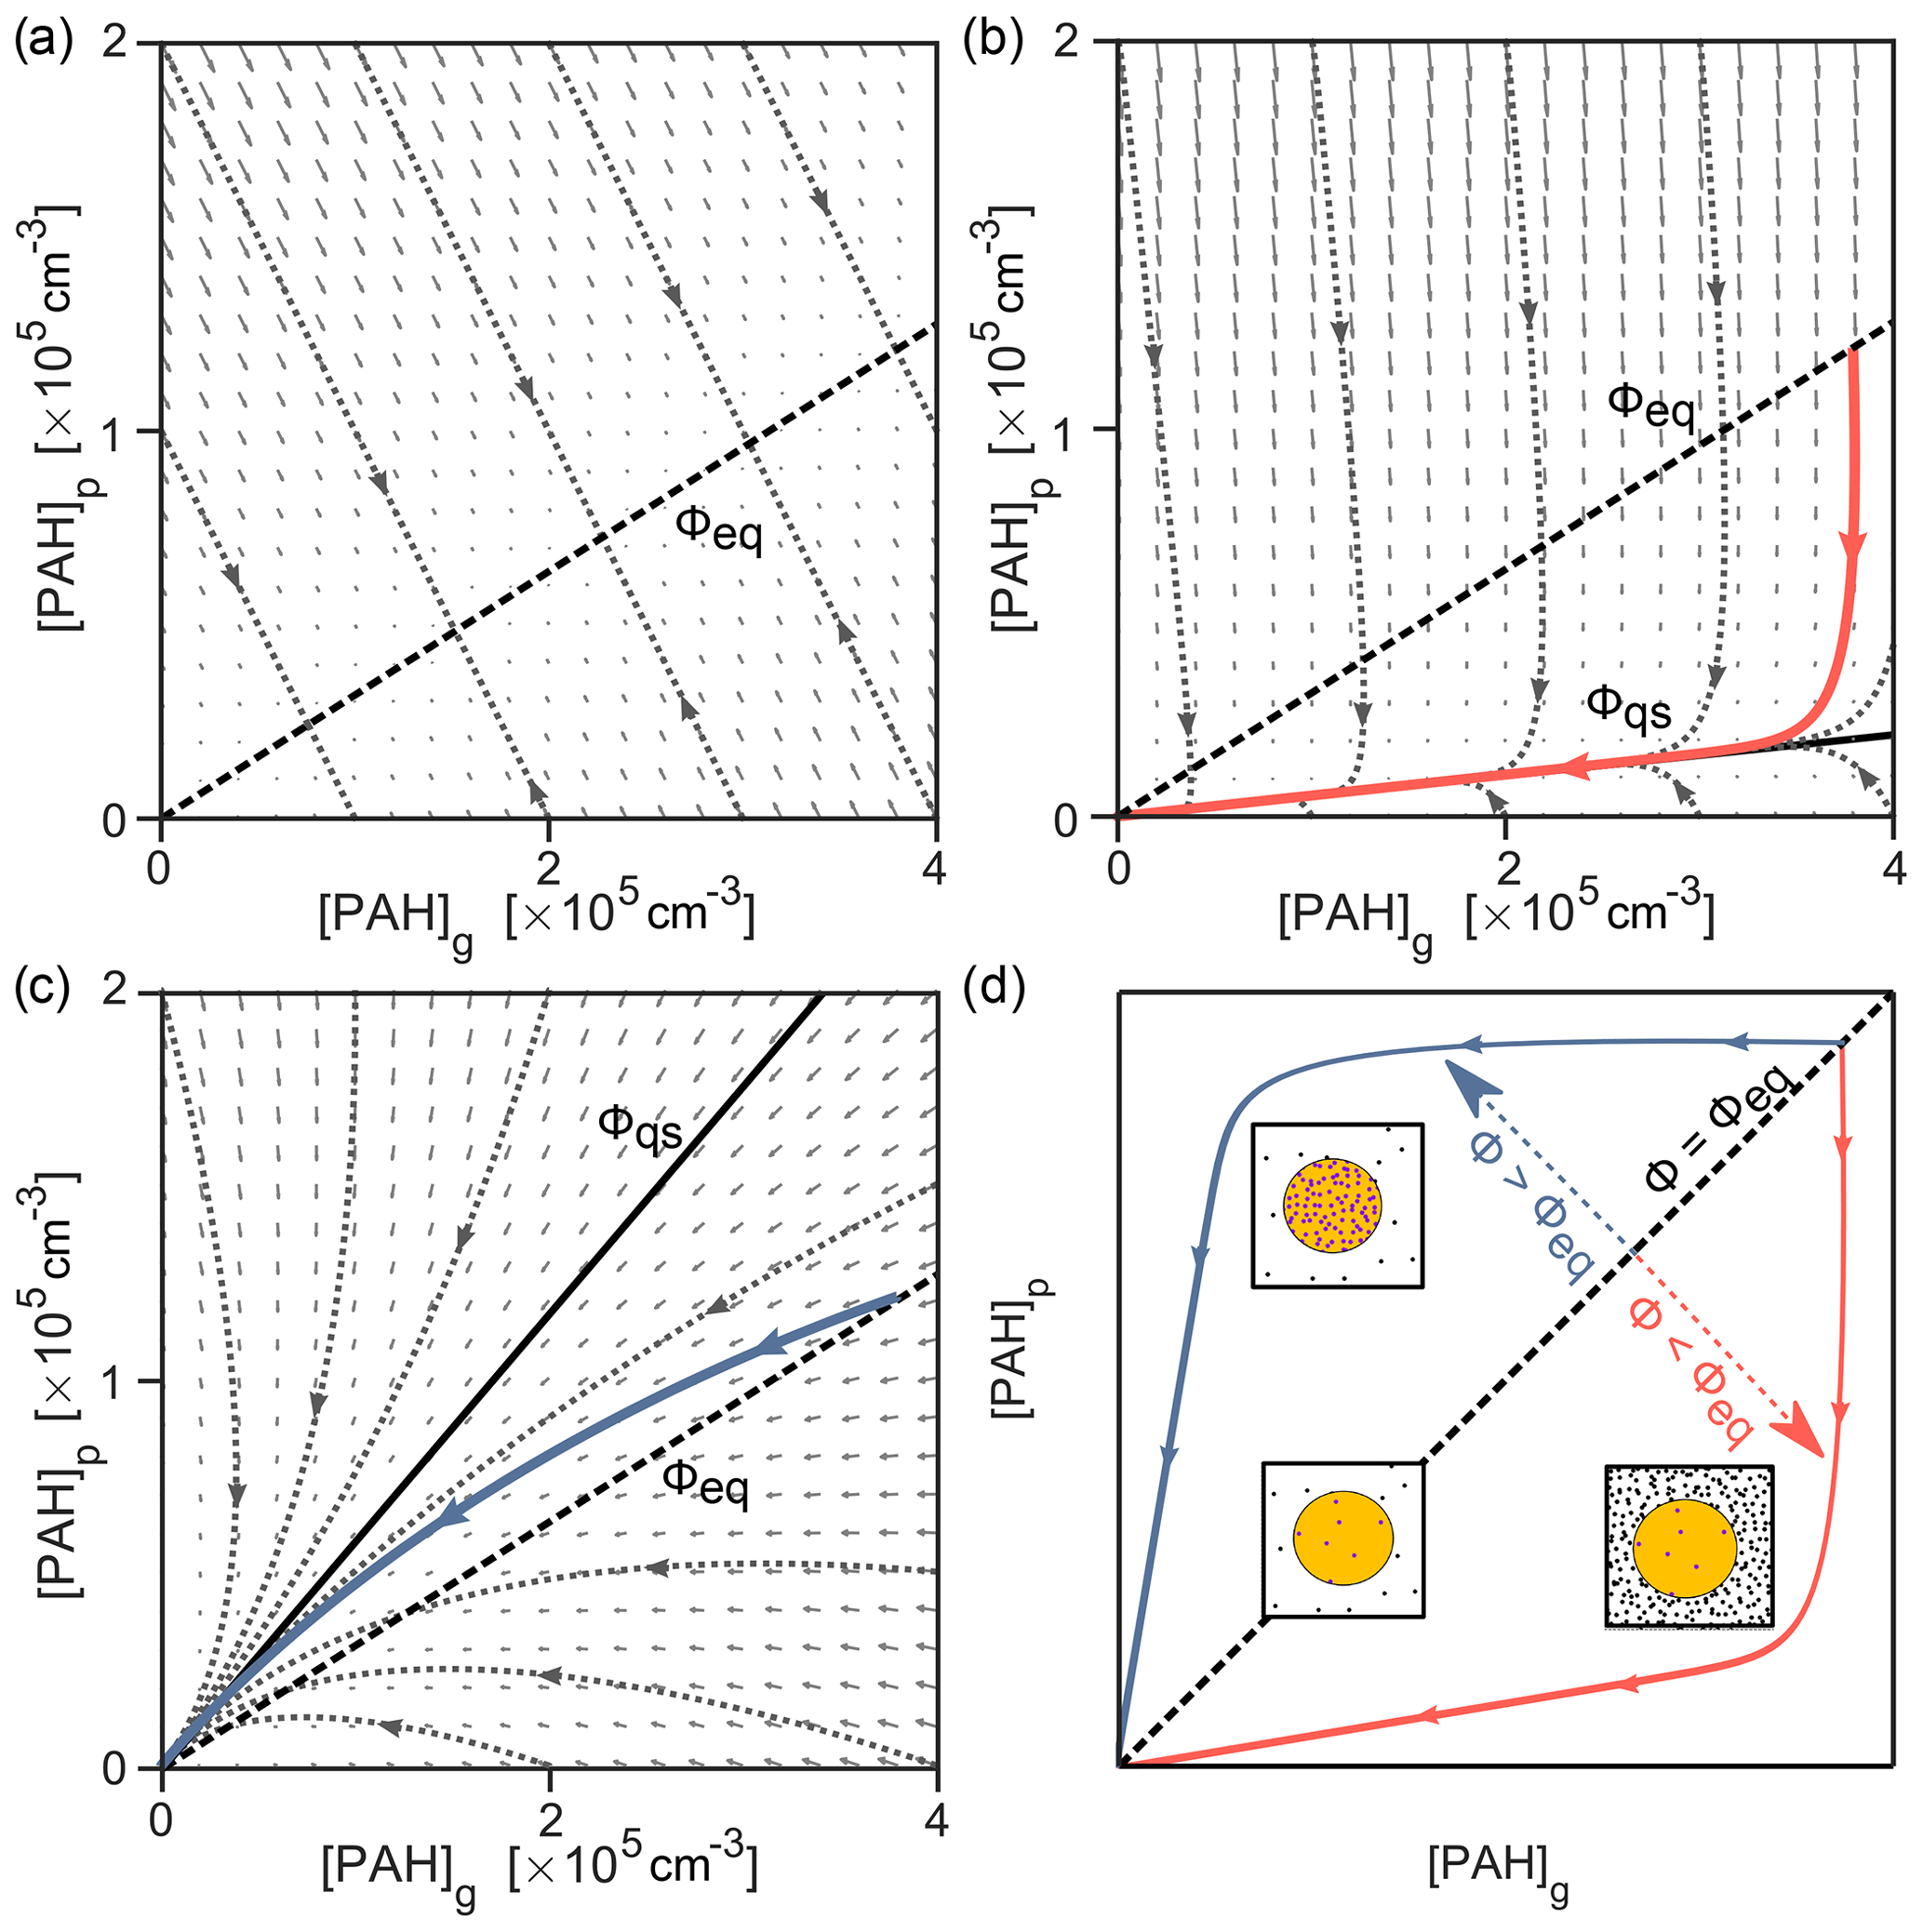
Figure 6The interplay of partitioning and chemistry illustrated as simulated trajectories in the phase space of gas- and particle-phase concentrations, [PAH]g and [PAH]p, of pyrene. (a) Partitioning only, (b) partitioning and chemical loss from the particle phase due to surface reaction with O3 (100 ppb, red solid line), (c) partitioning and chemical loss from the gas and particle phase due to reaction with OH (1 ppt, blue solid line), and (d) comparison to schematics in Fig. 2. The direction of each small gray vector arrow indicates the extent to which pyrene is being lost or transferred between phases, and its length is proportional to the rate of change. The nullcline representing equilibrium particulate fraction in panel (a) (Φeq=0.24, dashed black line) is shown in panels (b, c), alongside the respective slow manifold representing the quasi-steady-state particulate fraction (Φqs, solid black line).
As seen previously, chemical reactions may cause perturbation of the partitioning equilibrium. Such a perturbation would be indicated by deviation of trajectories from the nullcline in the phase portrait. The difference between a perturbed and equilibrium system is depicted for [O3]=100 ppb in Fig. 6b. The vector field fundamentally changes, and the trajectory of an exemplary simulated system (red solid line) does not converge to the nullcline obtained in Fig. 6a, despite starting at equilibrium conditions Φeq (shown as a dashed black line for reference). Instead, the trajectory converges onto a central trajectory termed the slow manifold (Fraser, 1988). All trajectories in this system (represented with dotted gray lines) converge towards this manifold, irrespective of initial conditions. After approaching the slow manifold, the trajectory proceeds towards the origin (i.e., full depletion of pyrene) with a constant slope. This constant slope indicates that a constant quasi-steady-state particulate fraction Φqs=0.05 has been reached. The deviation of the nullcline (Fig. 6a) and the slow manifold (Fig. 6b) can be used to indicate the extent of non-equilibrium effects in a multiphase chemical reaction system. For example, Fig. 6c shows that for the reaction with 1 ppt OH the discrepancy between the simulation trajectory and the partitioning nullcline is much smaller due to simultaneous loss in the gas and particle phases. The slow manifold here runs above the partitioning nullcline and is reached only just before all pyrene is consumed (compare solid blue lines in Fig. 5). Figure 6d shows how the nullcline and the slow manifolds above or below it can be interpreted using the diagrams in Fig. 2.
3.4 Implications for chemical transport models (CTMs)
In the previous sections, an explicitly coupled model of partitioning and chemistry is used. This means that mass-transport and chemical-loss processes are simultaneously evaluated in a set of differential equations. Hereinafter, this is referred to as the explicitly coupled approach (EC). As the explicitly coupled approach is computationally expensive, CTMs often treat the partitioning and chemical loss of PAHs separately using operator splitting (Brasseur and Jacob, 2017). Instantaneous equilibration (IE) is one type of operator-splitting approach: at each model time step (Δt), the gas–particle distribution of PAH is reset to the partitioning equilibrium (estimated by temperature, particle number concentration, PAH, and particle type), and chemical loss is then further integrated separately, starting from the newly established equilibrium. Time steps of global and regional transport models used to study PAH are typically around 15 min (Galarneau et al., 2014) or 30 min (Sehili and Lammel, 2007).
3.4.1 Influence of model time step length
The solution obtained using the IE approach can differ from the EC solution. Using the surface reaction of O3 (100 ppb) with pyrene in the particle phase, we demonstrate that the magnitude and sign of this difference vary between Δt=4 min, 8 min, 30 min, and 1 h (Fig. 7a). The following conditions are used in the simulations: T=280 K, dp=50 nm, and .
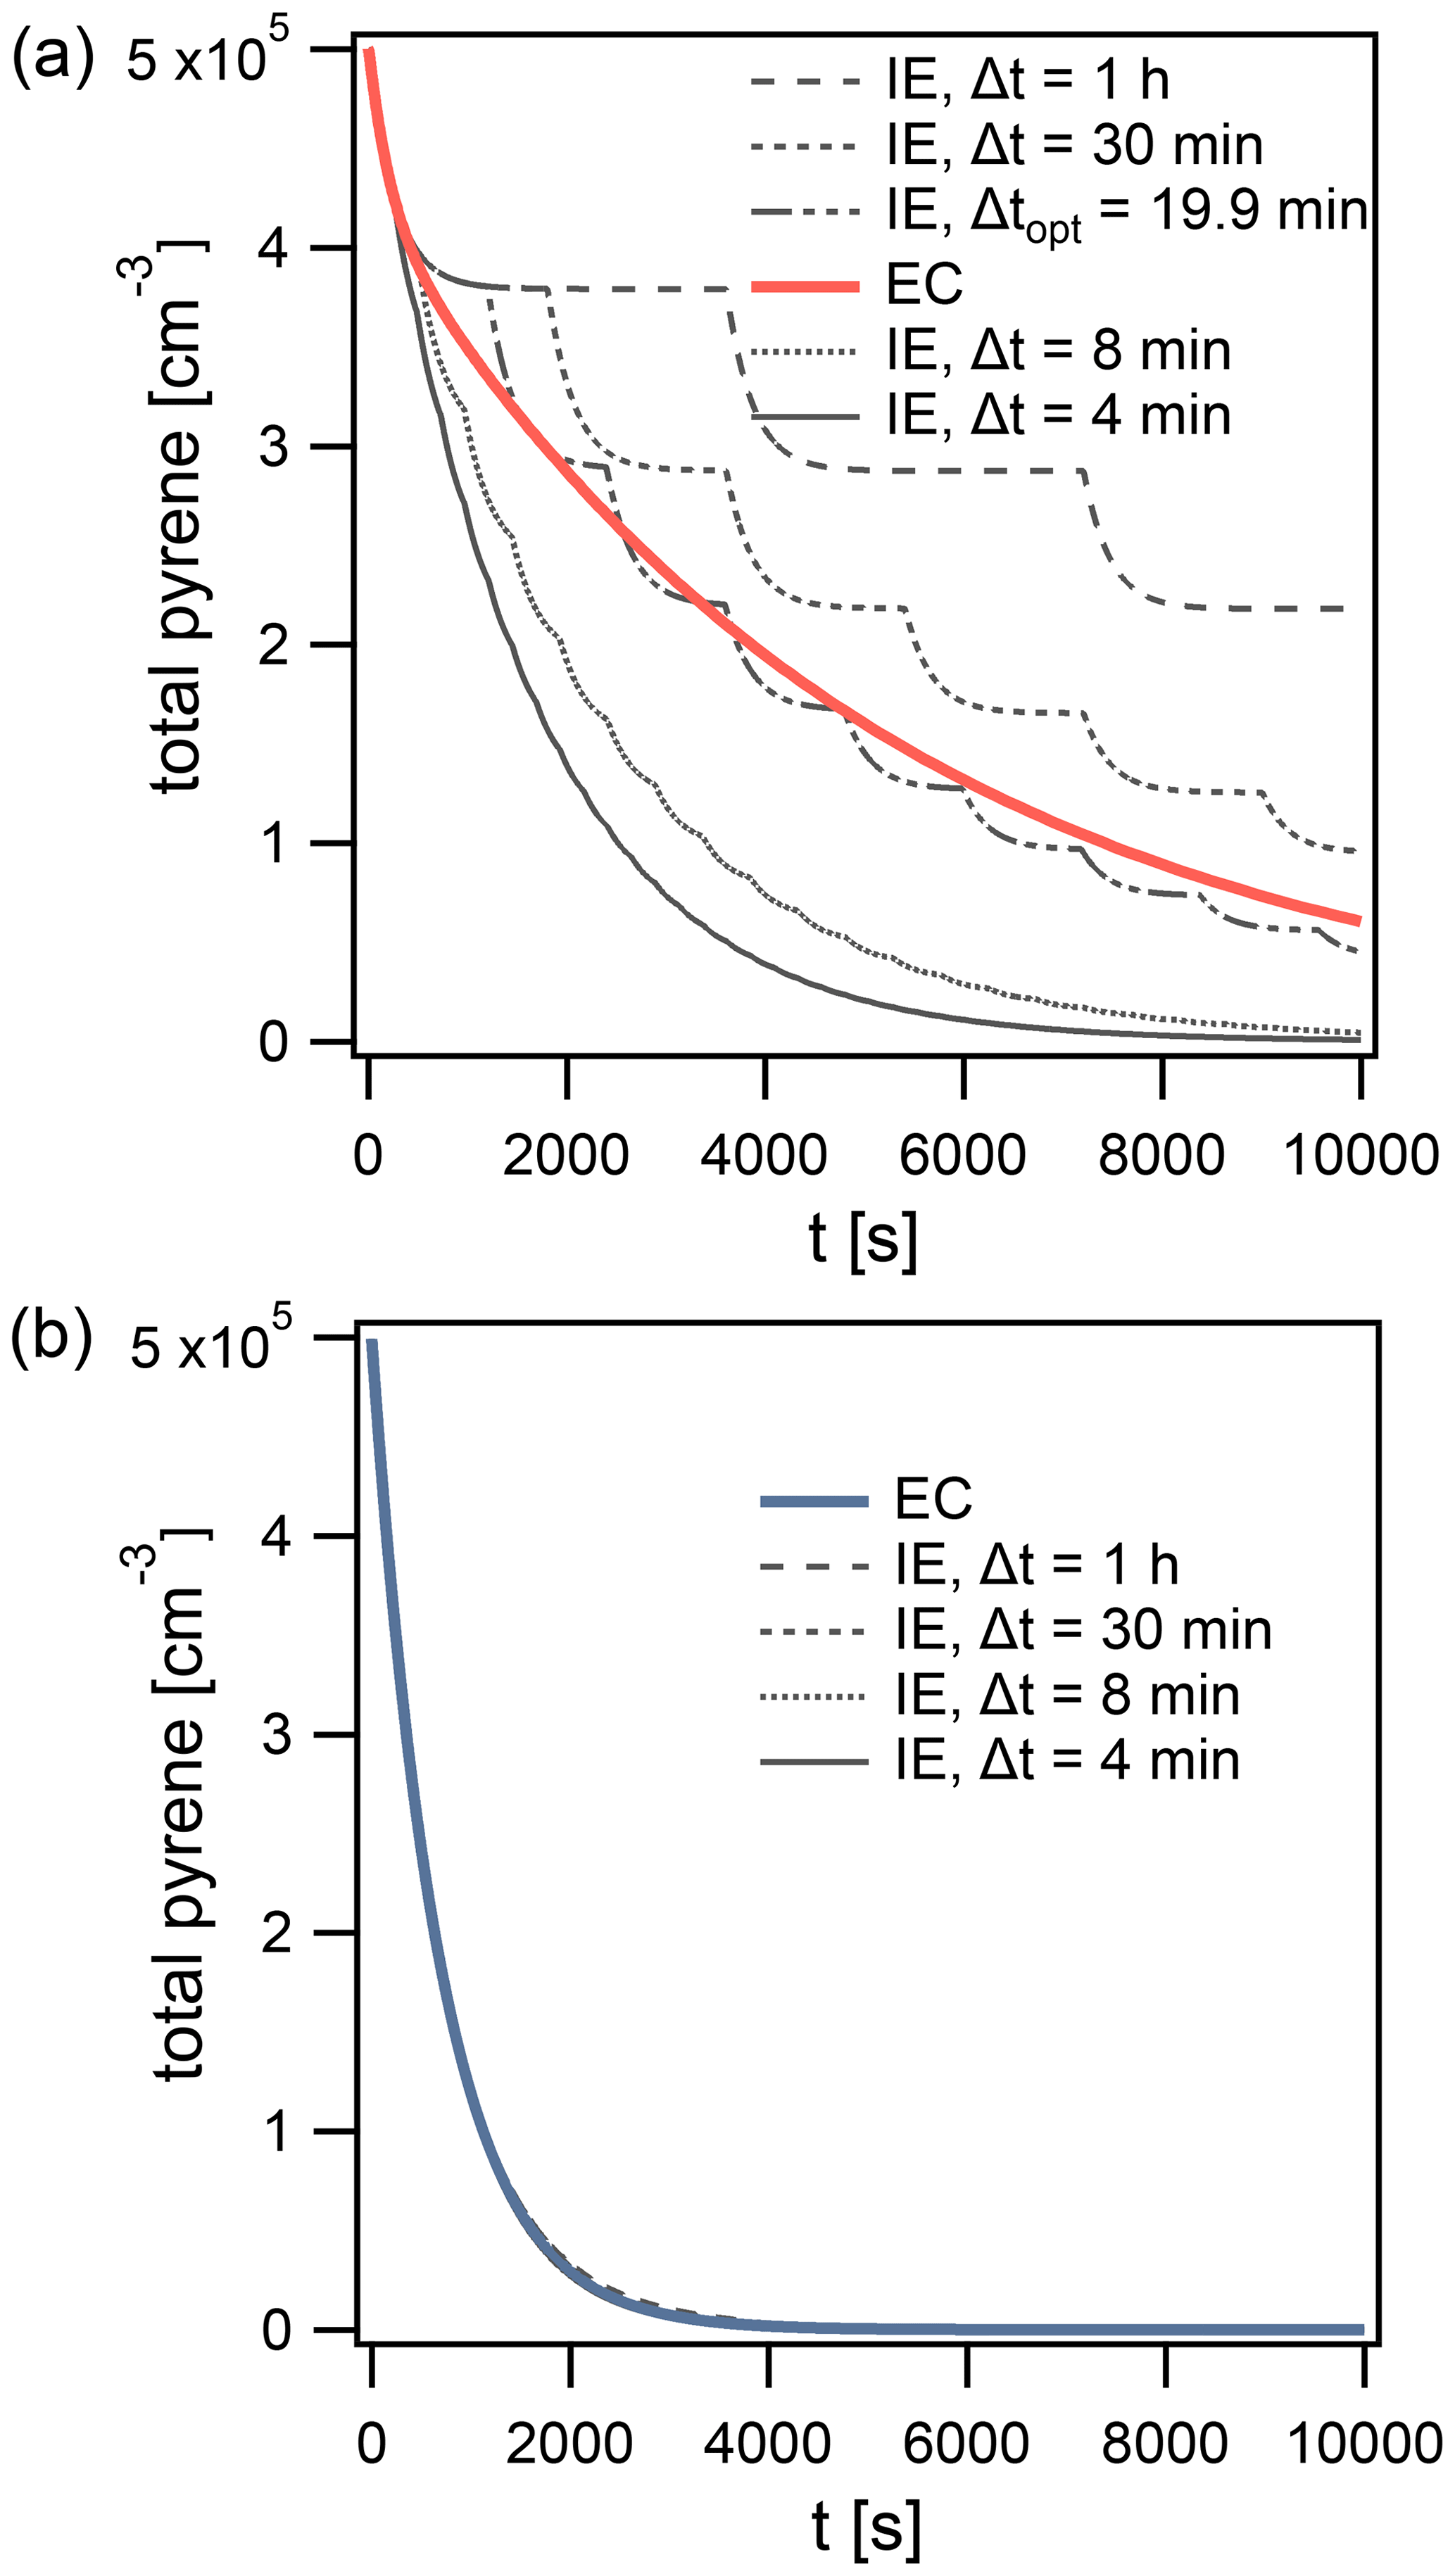
Figure 7Time evolution of total pyrene concentration in model calculations, comparing the explicitly coupled (EC) solution to the operator splitting with instantaneous-equilibration (IE) solution (Δt=4, 8, 30 min and 1 h) for systems with (a) surface reaction of particle-phase pyrene with 100 ppb O3 and (b) reaction of gas- and surface-bound pyrene with 1 ppt OH. The operator-splitting time step leading to the smallest deviation is depicted as Δtopt.
The lifetime of pyrene is underestimated when using time steps Δt of 4 and 8 min (Fig. 7a) but overestimated with Δt of 30 min and 1 h. In this example, an optimal time step exists for which the deviation from EC is minimized, Δtopt=19.9 min (Fig. 7a). It is close to the equilibration timescale of gas–particle partitioning τeq of pyrene, which is around 15 min under these conditions. τeq could thus serve as an initial guess for Δtopt. Δtopt is determined using a golden-section search optimization algorithm (Kiefer, 1953) to minimize the absolute difference between EC and IE model outputs. Of note, a deviation between IE and EC and hence a dependence of the model result on the operator-splitting time step only arises if a significant departure from partitioning equilibrium occurs. Under equilibrium partitioning conditions, a range of sufficiently short Δt can describe the system accurately. In an example with OH (1 ppt) reacting with gas-phase and surface-bound pyrene, all IE calculations produce negligible errors, irrespective of the time step used (Fig. 7b). This is due to the particulate fraction being very close to Φeq until the majority of pyrene has reacted (cf. Fig. 5d).
3.4.2 Deviation from explicitly coupled (EC) approach
The discrepancy between the EC and IE solutions depends not only on the length of Δt but also on the relative rates of partitioning and chemical loss. In this section, this discrepancy is explored as a function of desorption rate and is therefore characteristic of a range of PAHs. The reaction rate coefficients of pyrene are used as a best guess for generic PAHs. The discrepancy can be quantified with an error metric, Eloss, which can be interpreted as the relative difference in loss rates (Eq. 10). Δ[PAH]EC(t) and Δ[PAH]IE(t) are the accumulated losses of PAH at each time point t using EC and IE, respectively (Eqs. 11 and 12). This metric is chosen as it detects discrepancies in model solutions independent of the absolute turnover, which is important when comparing scenarios at high and low oxidant concentrations. Eloss ranges between −1 and 1 and is evaluated until either t90 % or t=24 h is reached. Eloss is positive when the IE solution overpredicts the loss of PAHs compared to the reference EC solution and negative when loss is underestimated.
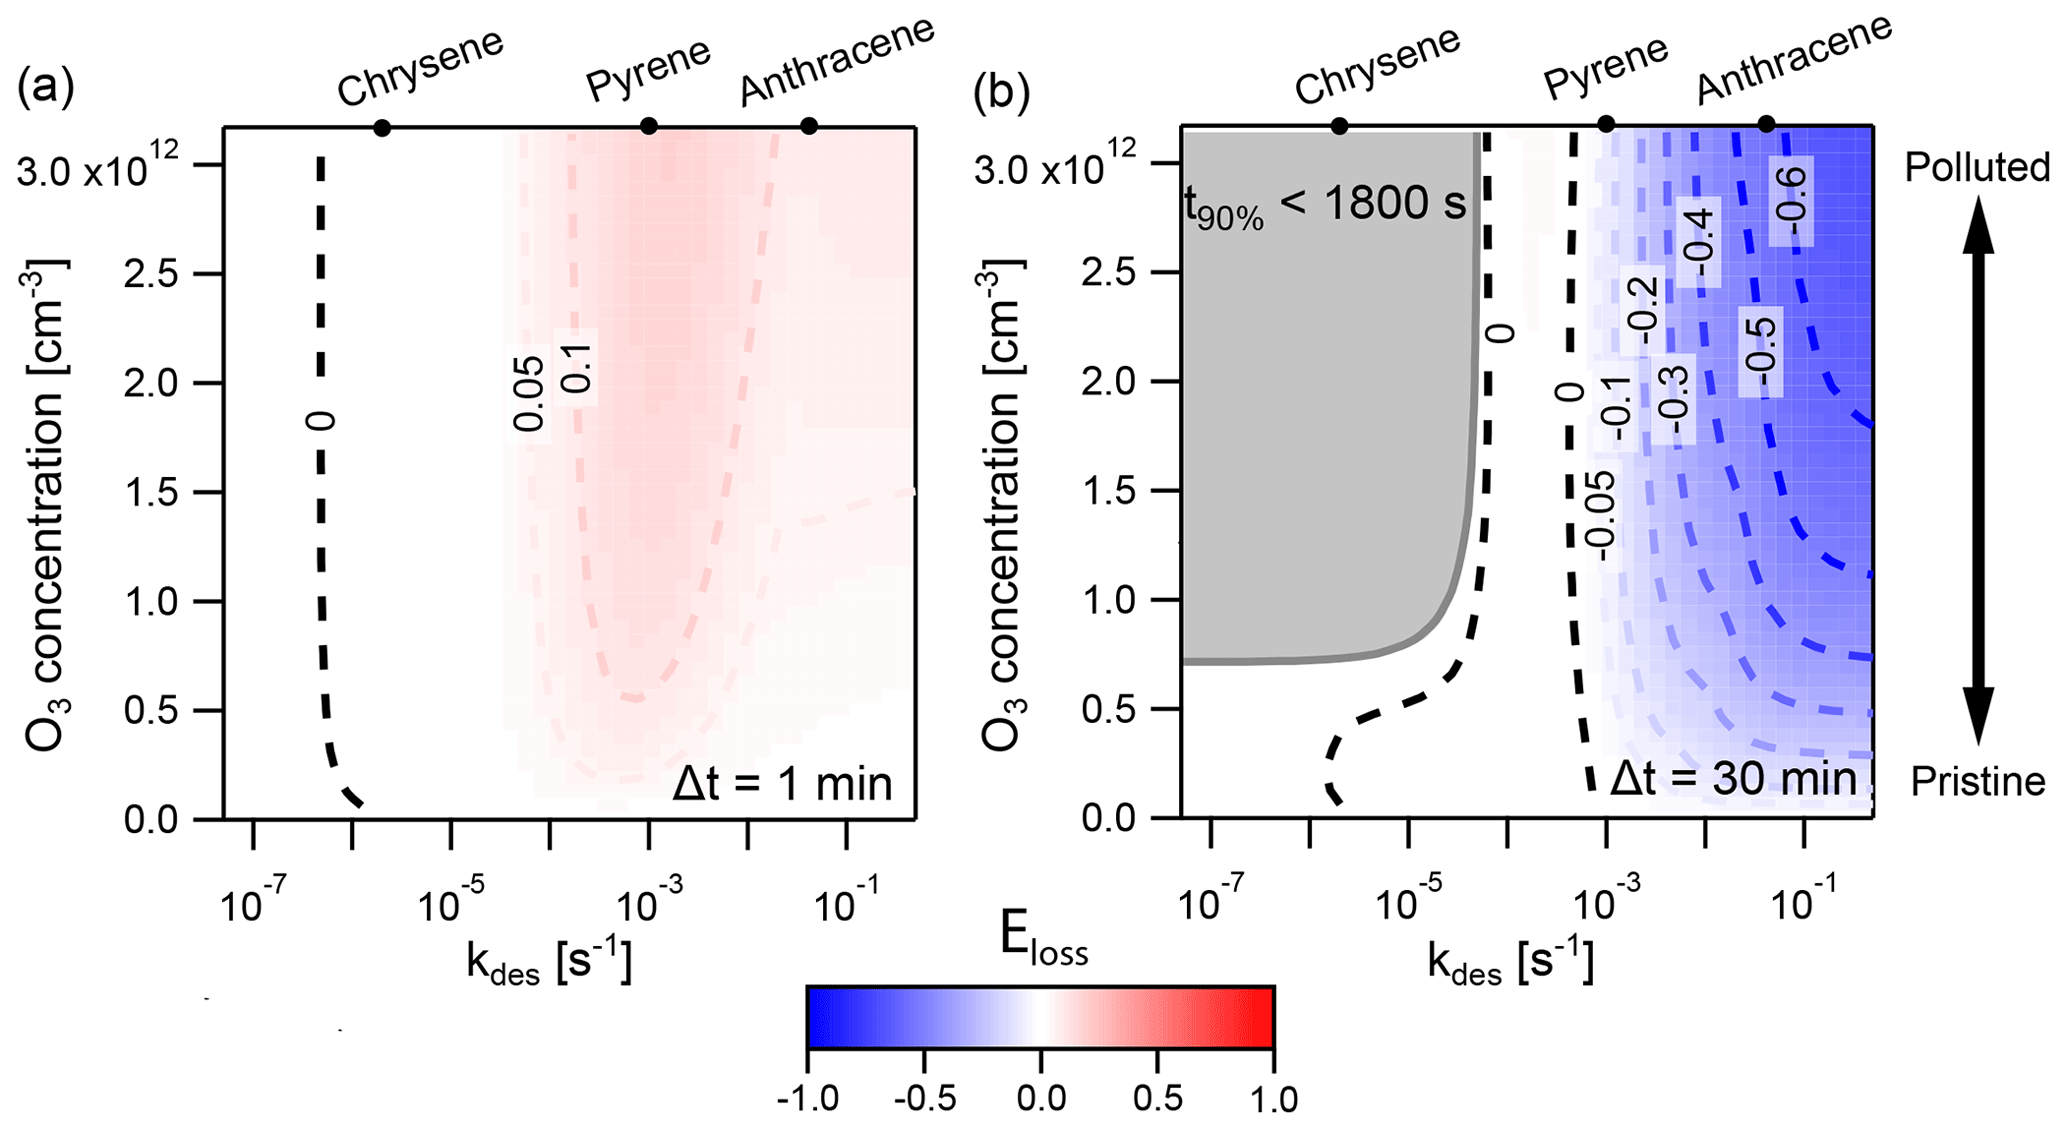
Figure 8Discrepancy between the explicitly coupled (EC) solution and the operator-splitting (IE) solution for surface reaction of particle-phase PAHs with O3, determined with the error metric Eloss. Regions where IE overestimates the loss of PAH are indicated in red (), and regions where it underestimates PAH loss in blue (). The result is shown using two different operator-splitting time step lengths: (a) Δt=1 min and (b) Δt=30 min. The dark gray area indicates the conditions under which the time taken for total PAH to deplete by 90 % (t90 %) is less than a single operator-splitting time step. The desorption rates for the PAHs chrysene, pyrene, and anthracene at 280 K are indicated on the top axis.
Figure 8 shows the extent and direction of deviation of IE from EC in a case study of PAH surface chemistry in which the desorption rate coefficient kdes is varied between and s−1 and the concentration of O3 between 0 and 120 ppb for IE time steps of Δt=1 min and Δt=30 min. When Δt=1 min (Fig. 8a), IE overestimates PAH loss compared to EC, indicated by red coloring. Deviation is largest when kdes is between and s−1. Here, the IE time step of 1 min causes PAH to transfer onto particles at an artificially high rate. This increases the particle-phase concentration of PAH and results in faster chemical loss. The IE solution hence shows fewer non-equilibrium effects of slow partitioning on multiphase chemistry compared to the reference EC model. At the highest kdes ( s−1), non-equilibrium effects of slow partitioning still occur, but in the desorption-controlled regime (cf. Fig. 4 at 280 K) an increase in kdes leads to a reduction in equilibration timescale. This leads not only to weaker non-equilibrium effects of slow partitioning in the EC solution but also to a better match between EC equilibration timescale and IE time step. Hence, the discrepancy between the IE and EC approach is reduced, as evident by the more faint red coloring. At low kdes ( s−1), most PAH is located on the surface of particles at all times, and re-partitioning of gas-phase PAH after depletion of particle-phase PAH is negligible. Thus, no deviation of the IE from the EC approach occurs.
In contrast, with a time step of Δt=30 min (Fig. 8b), the IE approach generally underestimates the loss of PAH compared to the EC approach, indicated by blue coloring. The largest underestimations are found at high kdes and high [O3]g. Underestimation of PAH loss occurs because the re-partitioning induced by the longer IE time step of 30 min is slower than the true equilibration rate in the EC model. In this scenario, the IE approach thus leads to stronger non-equilibrium effects of slow partitioning compared to the EC model. When the equilibration timescale becomes shorter, at high kdes ( s−1), the discrepancy between the IE and the EC solution further increases, especially at high [O3]g. Notably, at s−1, the IE approach slightly overestimates loss of PAH at high [O3]g. This is due to the EC equilibration timescale dropping below the equivalent of Δt=30 min just before non-equilibrium effects of slow partitioning vanish at the lowest kdes. In between, a zero contour (labeled “0”), and hence no deviation between both methods, occurs when s−1. Here, the IE approach matches the EC equilibration timescale by alternatingly underestimating and overestimating the concentration of PAH at different points of the simulation, and a cancellation of errors occurs (cf. Fig. 7a). This case is distinct from the left zero contour at s−1, in which departure from equilibrium does not occur and both methods return truly identical results (compare panels a and c of Fig. A5). Another region exists: for , the simulation proceeds for less than 30 min, and therefore fewer than one IE time step is evaluated (Fig. A5). In this region partitioning effectively does not take place, and we chose not to report the numerical value of Eloss.
Eloss is negligibly small when the concentration of [OH]g is varied between 0 and 0.5 ppt with reaction both in the gas phase and on the surface of particles (Fig. A4a). Unlike the example with O3, PAH loss rates due to reaction with OH in each phase are similar enough that Φ is not perturbed far from Φeq under these conditions. Often, in chemical transport models only the gas-phase reaction of PAH with OH is included. Varying the concentration of OH between 0 and 0.5 ppt with reaction in the gas phase only causes IE to overestimate the loss of PAH (red area, Fig. A4b).
To estimate errors for global models, it is also informative to present the discrepancy between the EC and IE approaches as a percentage difference. In Fig. 8 for instance, when , a model using the IE assumption underestimates the loss of PAH by 34 % compared to the EC solution (Fig. 8a). Likewise, if , a model using the IE assumption overestimates the loss of PAH by 23 %. In order to fully quantify the error introduced by the instantaneous-equilibration assumption, it would be necessary to implement a non-equilibrium partitioning scheme directly into a CTM.
It should be noted that, alongside the gas-phase and particle-phase concentrations of PAHs, CTMs are often evaluated by comparing the predicted particulate fraction and partitioning coefficient to observational data. Both of these metrics depend on the relative concentrations of gas-phase and particle-phase PAHs. Therefore, due to error propagation, the particulate fraction and partitioning coefficient may be more sensitive than absolute concentration to the effects of a non-equilibrium partitioning scheme.
This study shows that the chemical loss of polycyclic aromatic hydrocarbons (PAHs) and their partitioning between the gas and particle phases are closely interlinked. The equilibration timescales of adsorptive partitioning are quantified for six PAHs on the surface of soot. Our model predicts that equilibration timescales range from seconds to hours depending on temperature, available particle surface area, and molecular structure of the PAH. We highlight the molecular processes governing this timescale with two regimes: adsorption-controlled and desorption-controlled partitioning.
Soot constitutes only a fraction of total ambient aerosol particles (Pöschl, 2005). Thus, a logical next step will be to investigate how equilibration timescales vary for other types of particle surfaces. For example, given the weaker desorption energies of PAHs such as anthracene on the surface of NaCl (75.3 kJ mol−1) compared to soot (87.9 kJ mol−1; Chu et al., 2010), one would expect equilibration timescales on NaCl to be shorter.
On other particle types, PAH molecules can undergo absorptive partitioning by diffusing through surface layers into the bulk of the particle. For secondary organic aerosol (SOA), the particle phase state influences the rates of condensation and evaporation (Shiraiwa and Seinfeld, 2012). Equilibration timescales for PAHs are therefore also expected to be dependent on particle composition and humidity. For absorptive partitioning, the equilibration timescales of PAHs are expected to be even longer than the equilibration timescales for adsorptive partitioning. Alongside the contributions to the equilibration timescale from the adsorption- and the desorption-controlled regimes, absorptive partitioning is also controlled by the diffusion of PAHs through the bulk of aerosol particles. The complex interplay of partitioning and reaction in the gas and particle phases plays a critical role in the growth of SOA particles (Shiraiwa et al., 2013; Berkemeier et al., 2020), and departure from partitioning equilibrium adds to this complexity (Cappa and Wilson, 2011). However, the role of bulk diffusion in determining equilibration timescales is beyond the scope of this study and will be investigated in a follow-up study that builds on the framework provided here.
Chemical reaction of pyrene with O3 on the surface of particles perturbs the particulate fraction from partitioning equilibrium at atmospherically relevant oxidant concentrations. As the extent of this perturbation increases with concentration of O3, the largest deviations from equilibrium particulate fraction are likely to take place in the most polluted air. The reaction of pyrene with OH in both phases results in much smaller perturbations. In general, the biggest deviations from equilibrium particulate fraction are expected for low-volatility PAHs when atmospheric conditions induce slow partitioning (i.e., cold temperatures and low particle number concentrations). Other chemical-loss processes may also be important for PAHs, such as the reaction with NO3 in both the gas phase (Zhang et al., 2014) and the particle phase (Gross and Bertram, 2008), as well as aqueous-phase photodegradation processes (Fasnacht and Blough, 2002). These reactions must eventually be studied simultaneously in order to establish whether loss in both phases balances out or whether perturbation from equilibrium takes place.
Using existing observational datasets, it may be possible to establish how the size of the deviation in particulate fraction (between observed values and the predictions of equilibrium partitioning models) depends on the concentrations of OH, O3, NO3, and other perturbing variables. This could help identify and compare key perturbing variables in a real-world setting.
It should also be noted that, while in this study simulations involving chemical loss are initialized at the point of equilibrium (Φ0=Φeq), in reality PAHs may be emitted in a state far from partitioning equilibrium. Depending on the prevailing loss processes, such an effect could either enhance or inhibit perturbations from equilibrium.
Non-chemical-loss processes, such as dry and wet deposition, remove PAHs from the gas and the particle phases at different rates and may also cause perturbations from partitioning equilibrium. The fastest loss processes – i.e., those operating at the shortest timescales – will cause the greatest perturbations. In the case of polybrominated diphenyl ethers (PBDEs), Li et al. (2015) attempted to include the effect of loss by deposition on partitioning and derived an equation for the partitioning coefficient assuming a steady state rather than equilibrium. However, given that for PAHs the estimated lifetimes due to dry deposition (1 to 14 d) and wet deposition (5 to 15 months; Škrdlíková et al., 2011) are much longer than lifetimes due to chemical loss (in this study less than 24 h), chemical loss is expected to be the loss process that is most likely to perturb the partitioning equilibrium.
The methodology described in this study is universally applicable to semi-volatile compounds on solid surfaces if mass-transfer parameters and chemical reaction rate coefficients are available. In some cases it may be necessary to estimate these parameters. In quantum mechanical calculations, graphene surfaces could be used as a model for soot and desorption energies. Such values are already available for PBDEs (Ding et al., 2014) and other small organic molecules (Lazar et al., 2013).
It has to be noted that an explicitly coupled solution of partitioning and chemical loss is computationally too expensive for inclusion in typical regional and global CTMs. Hence, alternative algorithms would be highly anticipated. Knowledge about the position of the partitioning steady state in the presence of chemical loss (as indicated by the slow manifold that can be visualized in a phase portrait of gas- and particle-phase concentrations) could be used to develop such a method for global and regional models.
The flux of PAH molecules from the gas phase to the near-surface gas phase Jdiff with concentrations [PAH]g and [PAH]gs, respectively, is calculated with Eq. (A1).
The gas-phase diffusion coefficient Dg is fixed at 0.06 cm2 s−1 for all PAH compounds, based on measurements for anthracene and pyrene in nitrogen (Siddiqi et al., 2009). dp is the diameter of aerosol particles. The mean free path λ is defined in Eq. (A2).
The mean thermal velocity of a molecule ω depends on temperature T and its molar mass M (Eq. A3).
The adsorption flux Jads of molecules from the near-surface gas phase to the particle phase is described using Eq. (A4).
The surface accommodation coefficient on an adsorbate-free substrate αs,0 describes the probability that a molecule adsorbs upon collision with an adsorbate-free aerosol particle and for PAH molecules is assumed to be (Julin et al., 2014). The total sorption layer coverage θs is calculated as the sum of the fractional coverages of PAH and O3, θPAH and , respectively (Eq. A5). θPAH and are calculated using the surface concentrations [PAH]s and [O3]s and molecular cross sections σPAH and of PAH and O3, respectively (Eq. A6). In order to estimate σ, each benzene-like ring of a PAH molecule is assumed to occupy cm2. The collision flux Jcoll – i.e., the flux of molecules colliding with the surface – is defined in Eq. (A7).
The temperature-dependent desorption flux (Jdes) due to PAH molecules evaporating from the surface of an aerosol particle depends on the rate coefficient for desorption (kdes) and the surface concentration of PAH [PAH]s (Eq. A8).
kdes depends on the Arrhenius factor (A) and the activation energy for desorption from the aerosol particle surface (EA; Eq. A9).
The temperature dependence of the desorption rate coefficient was previously determined for seven PAHs on fresh kerosene soot (Guilloteau et al., 2008, 2010), and the obtained parameters are implemented in this model (see Table A1). These activation energies of desorption for PAHs on soot are consistent with those obtained theoretically on pure graphene (Lechner and Sax, 2014) and coronene (Kubicki, 2006). It should also be noted that different types of soot can have different effects on gas–particle partitioning (Mader and Pankow, 2002) and more aged soot may have a reduced affinity for PAH. Despite the simplifications of this model, we aim to provide a basis to which further complexity can be added.
Table A1Mass-transport parameters to determine the desorption rate coefficients of PAHs and O3 (): Arrhenius parameter A and activation energy of desorption EA (Guilloteau et al., 2008, 2010).

Irreversible reactions between pyrene and either O3 on the surface of aerosol particles or OH in the gas phase and on the surface of aerosol particles are investigated with the model. The equations of mass transport for O3 are identical to those for PAH, and the corresponding parameters are reported in Tables A1 and A2. As the uptake of OH is considered to proceed via an Eley–Rideal mechanism, the diffusion of OH from the gas phase to the near-surface gas phase is treated using a gas-phase diffusion correction factor Cg,OH (Eq. A10). The full equation for Cg,OH can be found in Eq. (14) of Pöschl et al. (2007).
Table A2Mass-transport parameters for adsorption of PAHs and O3: molar mass M; surface accommodation coefficient on an adsorbate-free substrate αs,0 (Julin et al., 2014); and molecular cross section σ. The gas-phase diffusion coefficient Dg used for PAHs is 0.06 cm2 s−1 (Siddiqi et al., 2009), and that for O3 is 0.14 cm2 s−1 (Massman, 1998).

The rate of PAH loss from the particle surface due to chemical reaction with OH Ls,OH depends on probability γOH,PAH that reaction occurs following collision of OH with PAH on the particle surface (Eq. A11). The rate of gas-phase PAH loss by OH Lg,OH and the rate of PAH loss from the surface due to reaction with O3 are defined by Eqs. (A12) and (A13), respectively. Further details of these reactions and their parameters can be found in Sect. R1.
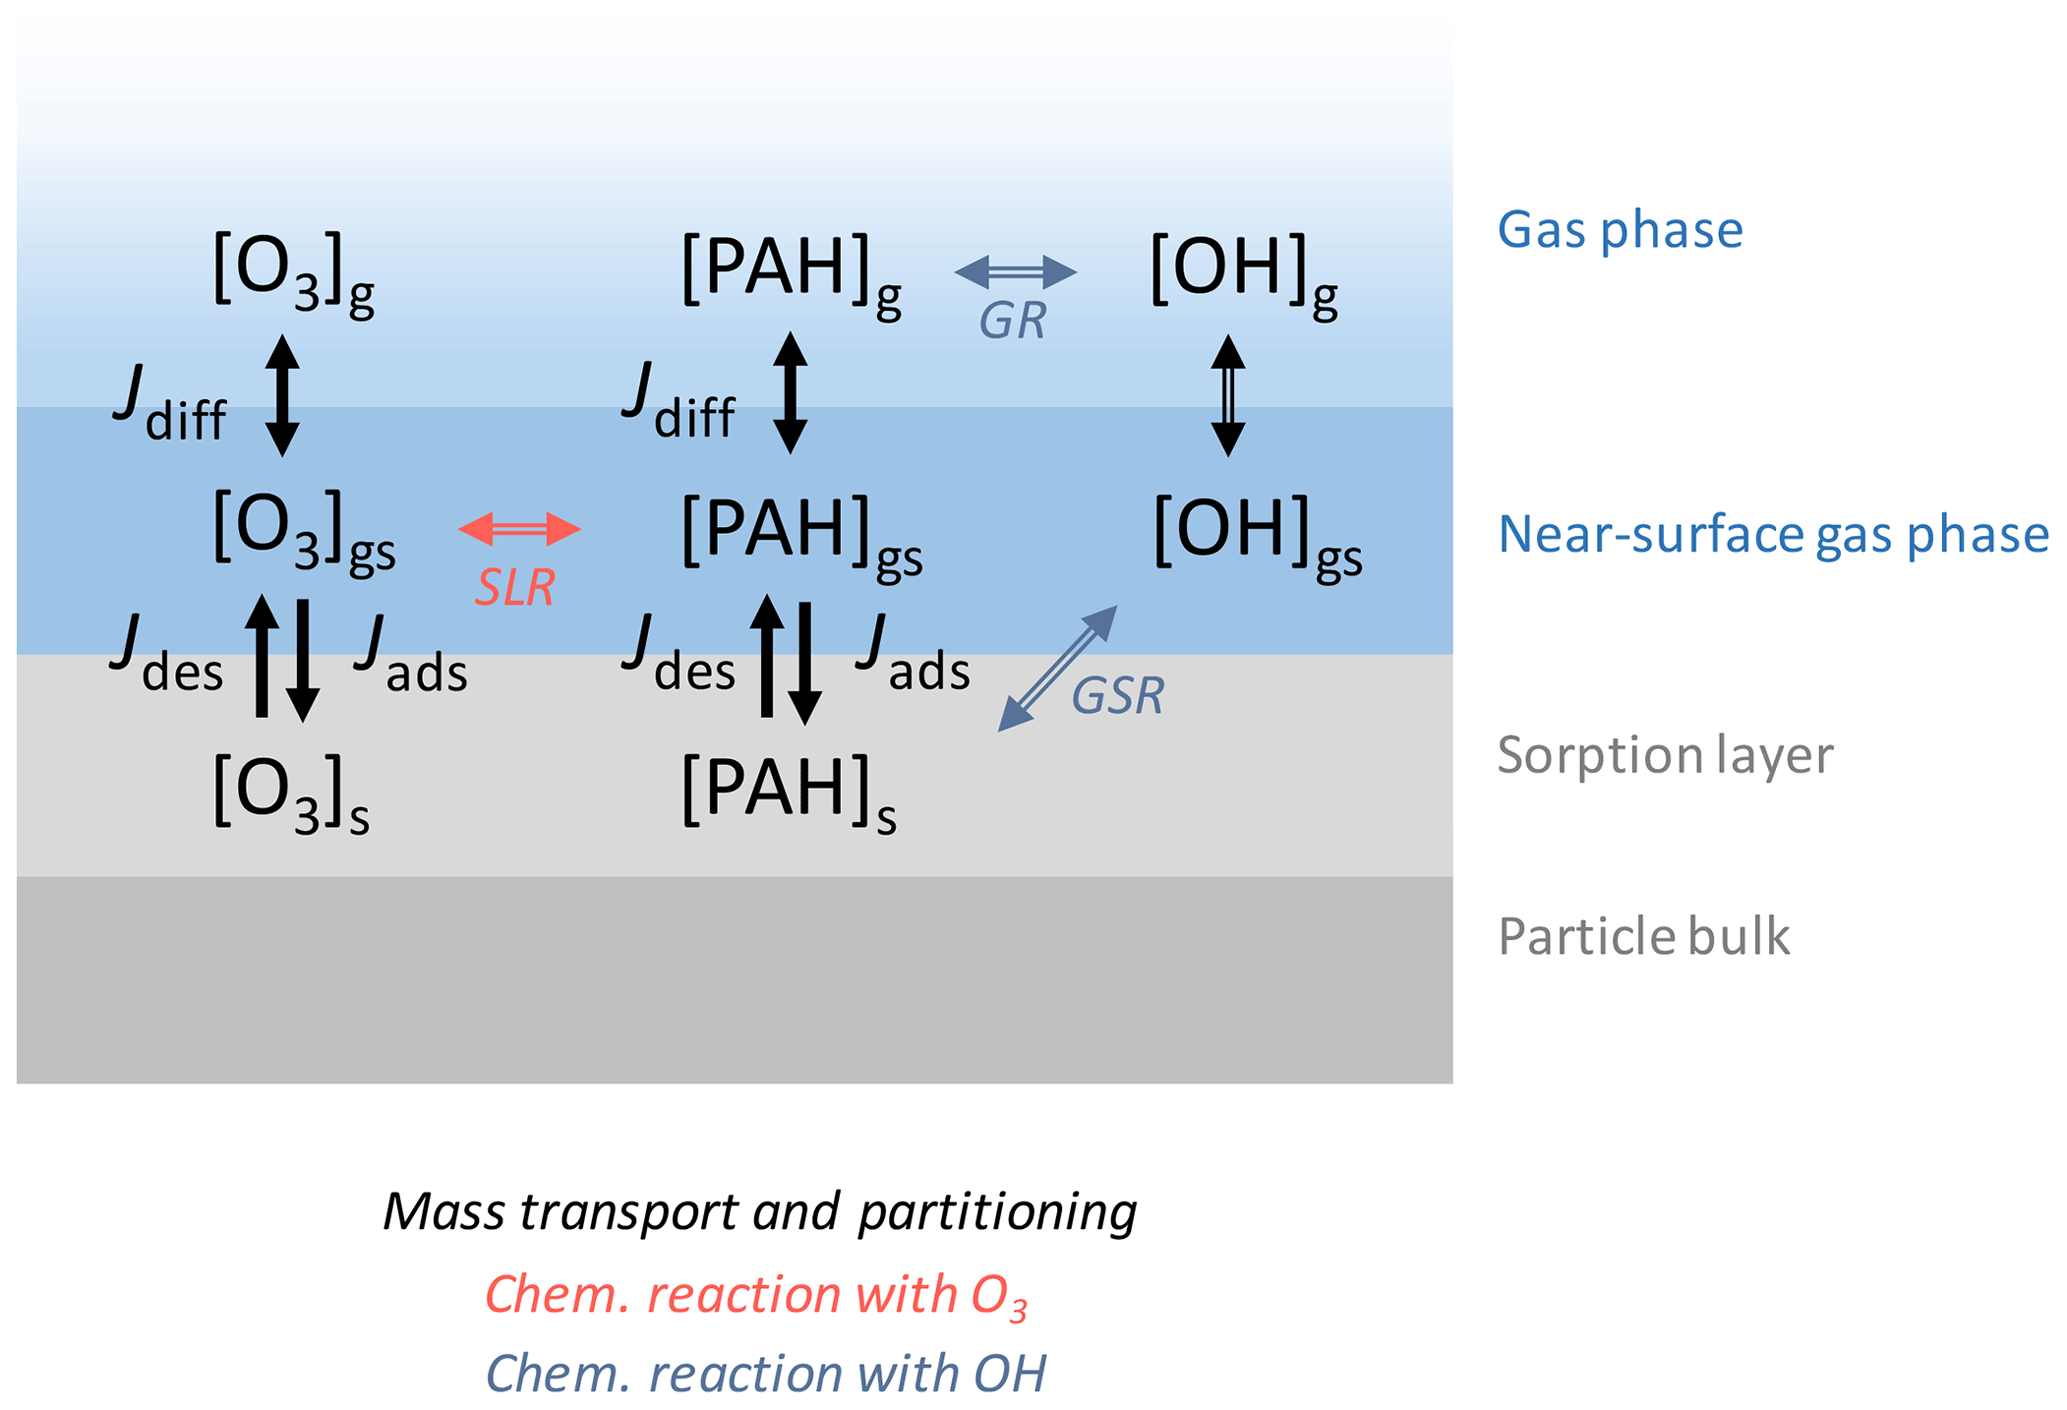
Figure A1The model used in this study consists of three layers: gas phase, near-surface gas phase, and sorption layer. The surface-layer reaction (SLR) with O3 and the gas-surface reactions (GSR) and gas-phase reactions (GR) with OH are modeled alongside mass transport and partitioning. Jdiff, Jdes, and Jads represent the gas diffusion flux between the gas phase and the near-surface gas phase, the desorption flux from the particle surface to the near-surface gas phase, and the adsorption flux from the near-surface gas phase to the particle surface, respectively. Note that, for the gas diffusion flux of OH, gas diffusion was implemented through a correction factor Cg,OH.
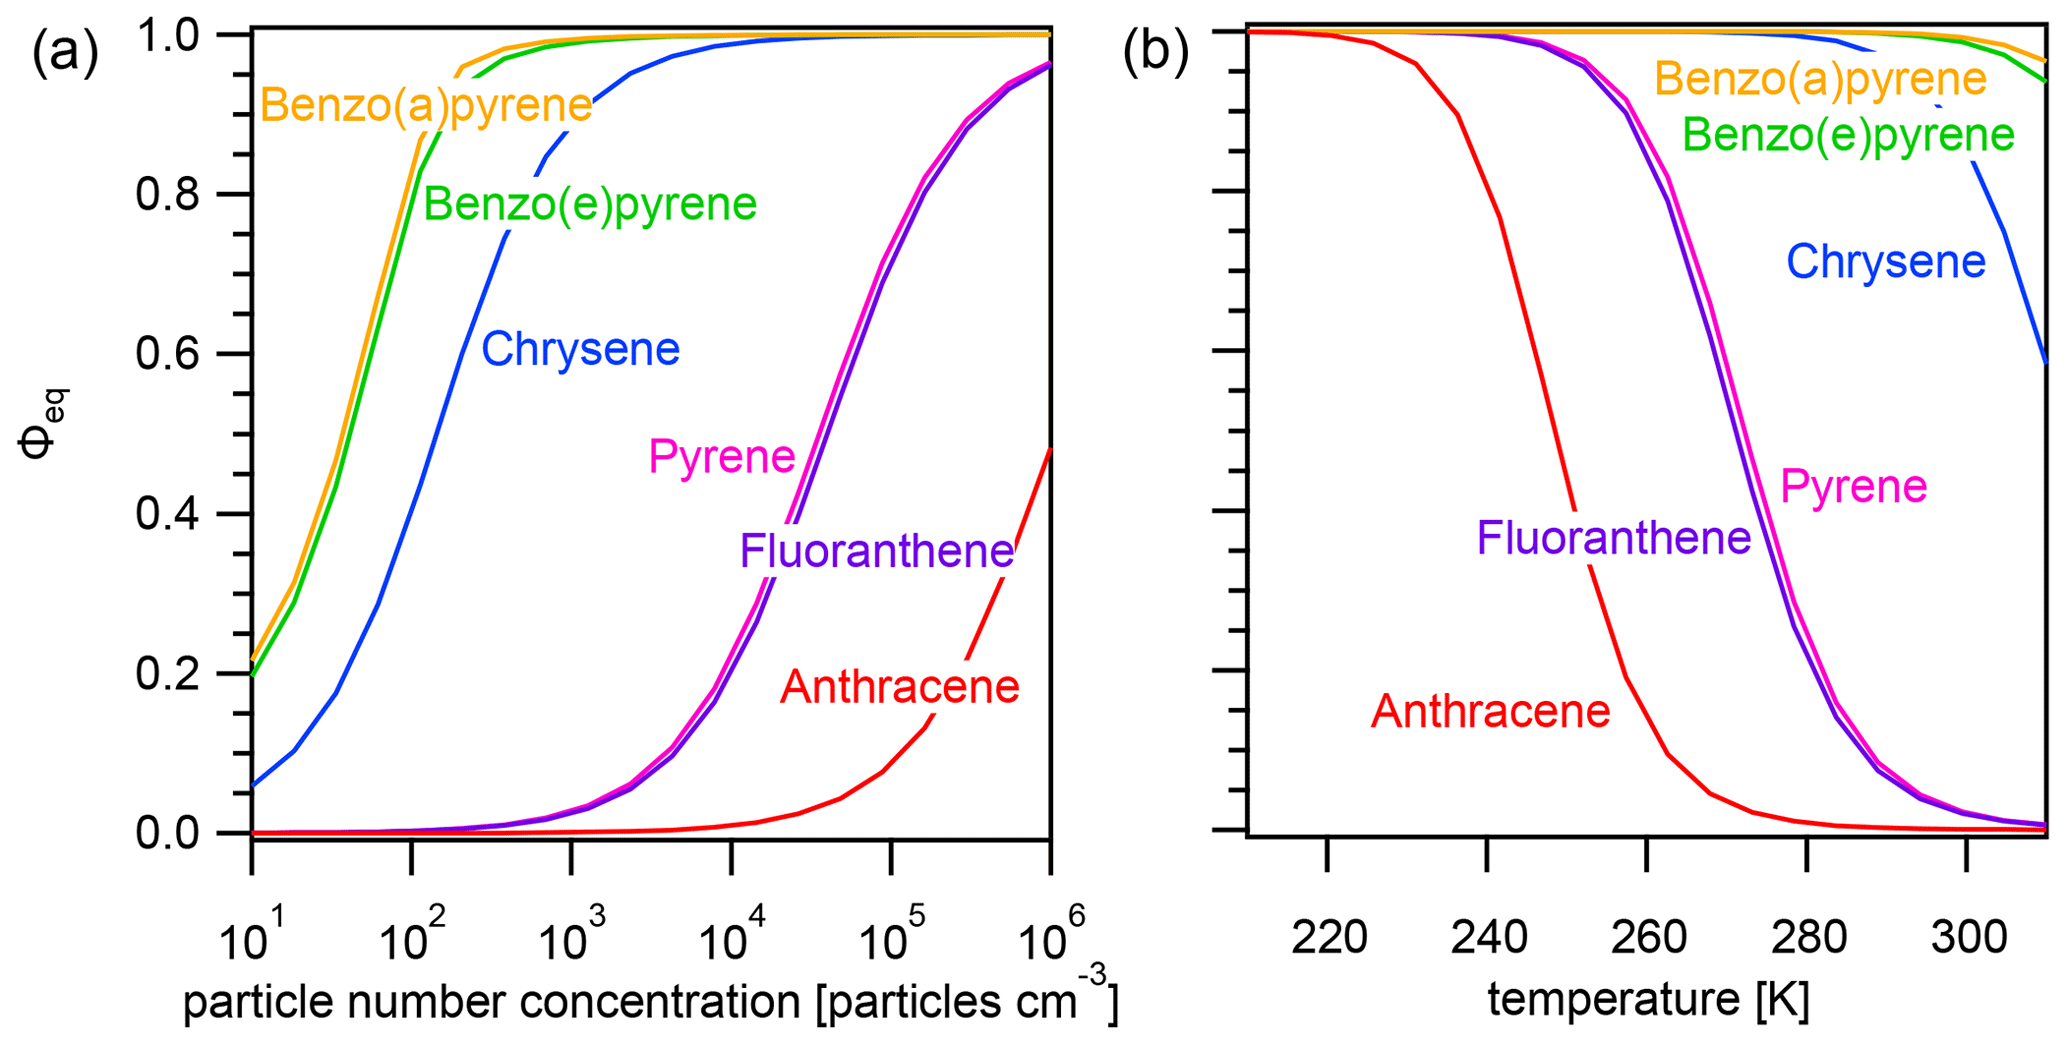
Figure A2Equilibrium particulate fraction Φeq of selected PAHs as a function of (a) particle number concentration (T=298 K) and (b) temperature () for particles of size dp=50 nm.
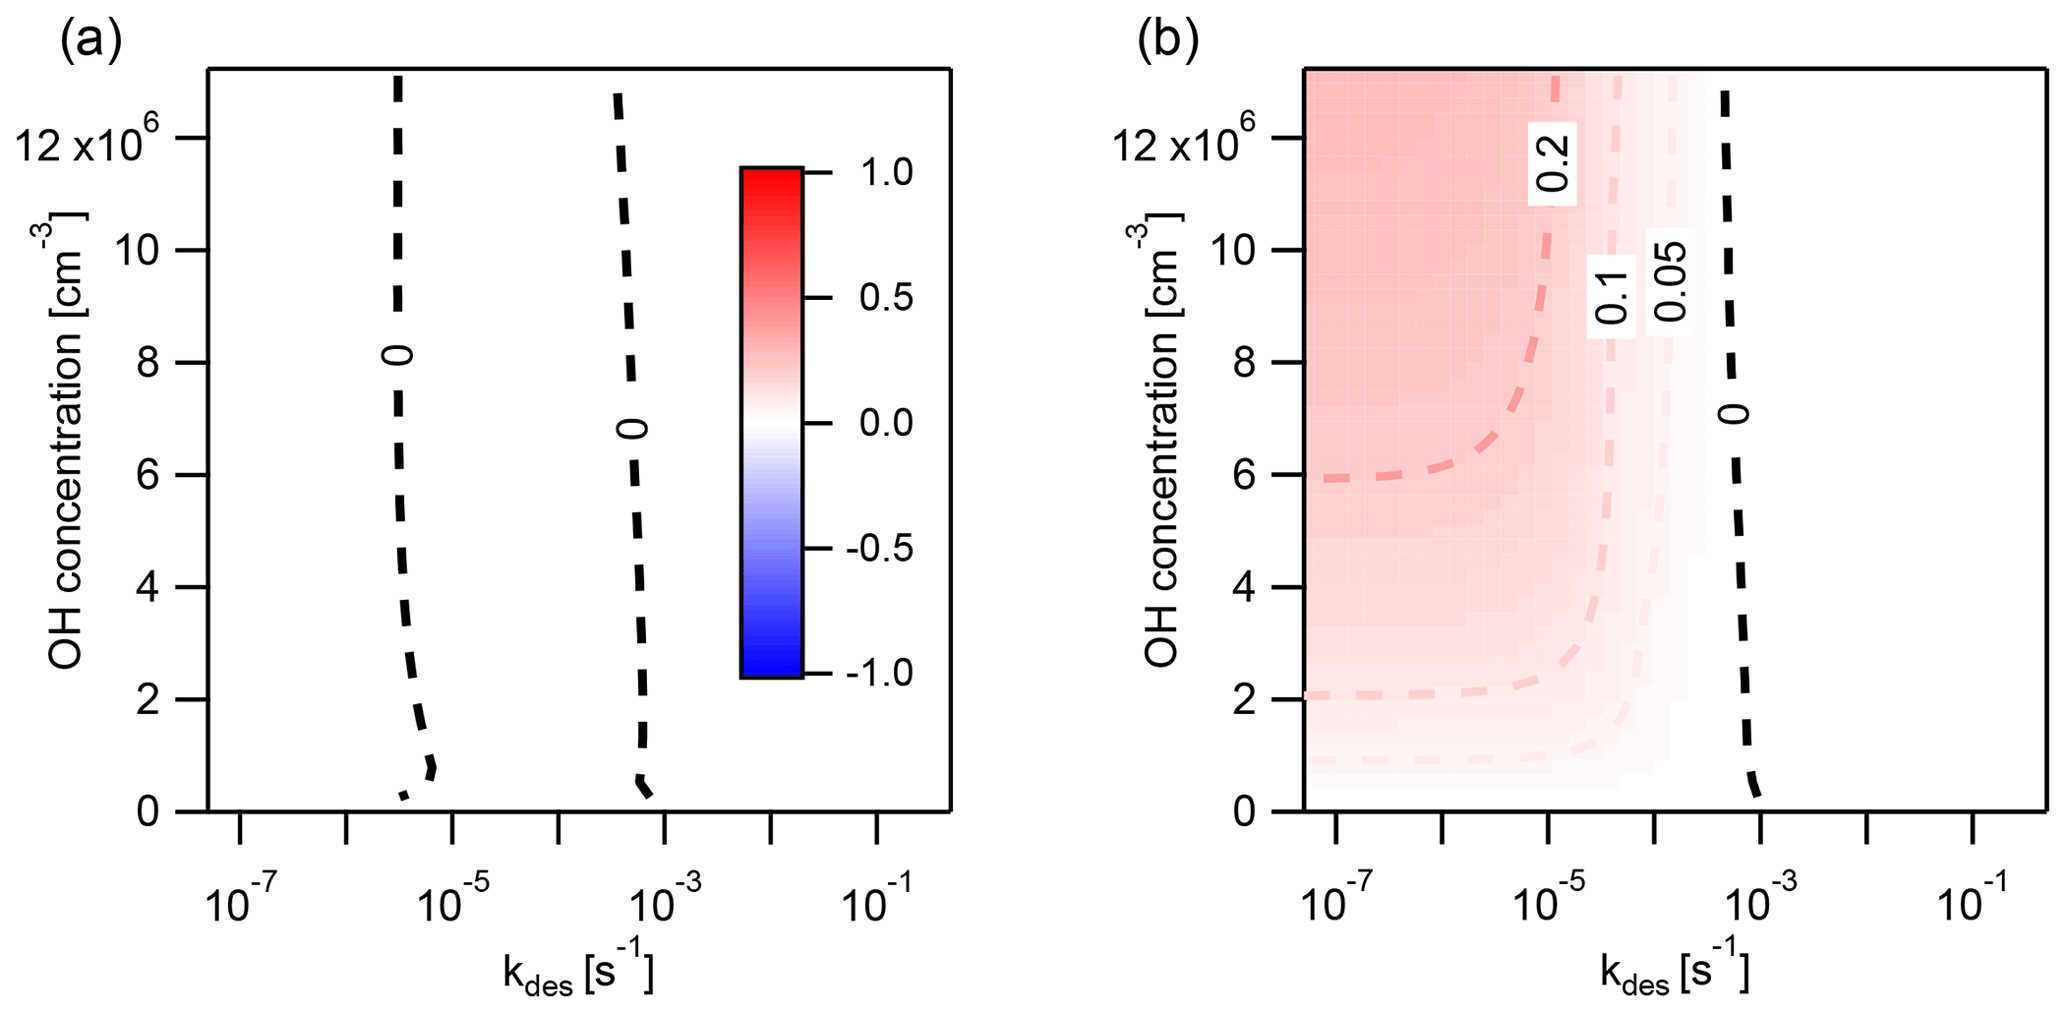
Figure A4Discrepancy, determined with the error metric Eloss, between the explicitly coupled (EC) solution and the operator-splitting (IE) solution with a time step of Δt=30 min for the reaction of OH (1 ppt) with (a) both gas- and particle-phase pyrene and (b) only gas-phase pyrene. Regions where EC overestimates the loss of pyrene are indicated in red () and underestimated in blue (). The conditions are 280 K and 1×10³ particles cm−3.
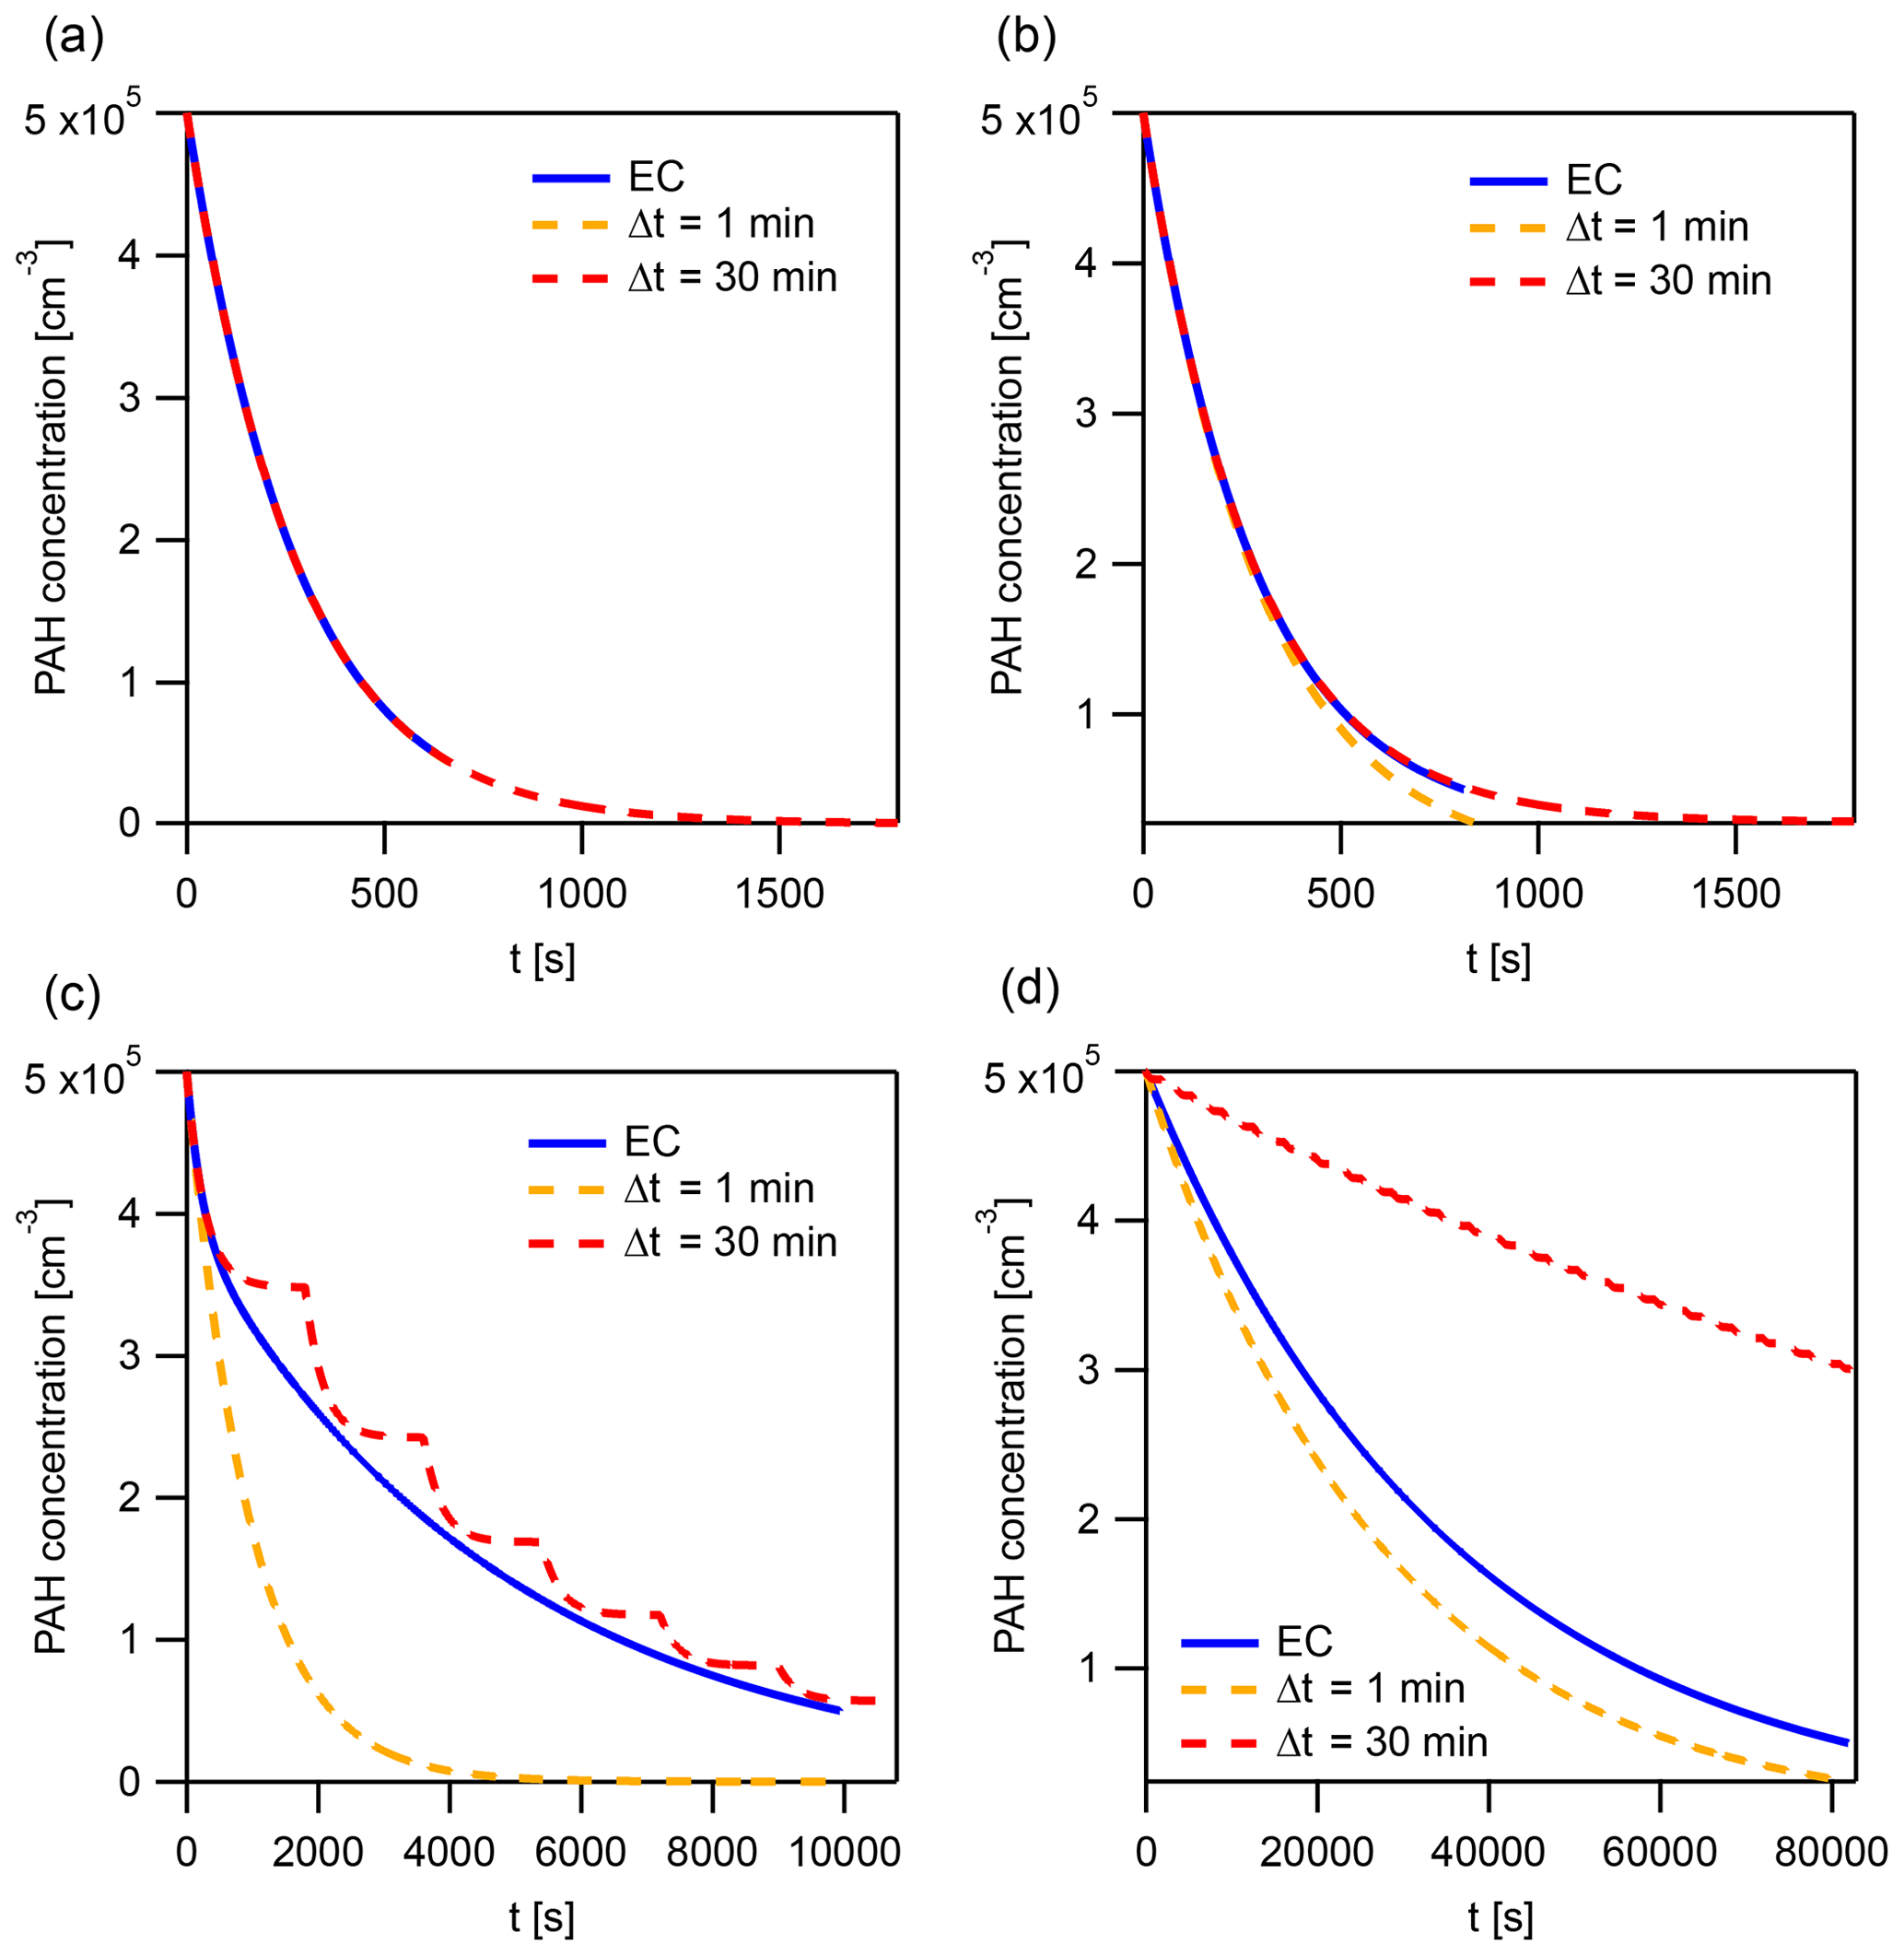
Figure A5The explicitly coupled (EC) solution and instantaneous-equilibration (IE) solutions with time steps Δt=1 and 30 min at specific points for the evaluation of the error metric Eloss (Fig. 8a and b). These points represent a horizontal cross section of Fig. 8 at and the following kdes: (a) 10−6.3, (b) 10−4.7, (c) 10−3.1, and (d) 10−1.5 s−1.
Figure A6The explicitly coupled (EC) solution and instantaneous-equilibration (IE) solutions with time steps Δt=1 and 30 min at specific points for the evaluation of the error metric Eloss (Fig. A4b). These points represent a horizontal cross section of Fig. A4b at and the following kdes: (a) 10−6.3, (b) 10−4.7, (c) 10−3.1, and (d) 10−1.5 s−1.
An approximate equation for equilibration time τeq (s) is obtained analytically using the relaxation time of a simple reversible reaction (Bernasconi, 1976). The equation approximates the numerically obtained results from the kinetic model and is derived by assuming that gas–particle partitioning can be described as two first-order processes, adsorption and desorption, with rate coefficients kdes (s−1) and kads (s−1). We find there is good agreement between the numerically obtained results and the approximate equation as long as the gas diffusion flux Jdiff does not significantly affect gas–particle partitioning (i.e., [PAH]g≈[PAH]gs) and surface crowding effects do not significantly inhibit adsorption of PAH onto the surface (i.e., θs is small). The equilibration timescale of PAHs predicted by the equation are within 10 % of the numerically obtained timescale among our test conditions (, ). For a gas-phase [PAH]g (cm−3) and particle-phase concentration [PAH]p (cm−3), the rate equation can be expressed in the following way:
At equilibrium, the concentration of PAH in the gas and particle phases is [PAH]g,eq and [PAH]p,eq. As there is no net transfer in mass,
The concentrations of PAH in the gas and particle phases can therefore be expressed as a displacement from their values at equilibrium, Δ[PAH]g and Δ[PAH]p (Eqs. B3 and B4).
Substitution of into Eqs. (B3) and (B4) allows the displacements from equilibrium to be expressed in terms of a single variable x (Eqs. B5 and B6).
Insertion of Eqs. (B5) and (B6) into Eq. (B2) gives
Expansion of brackets, followed by insertion of Eq. (B2), gives
Insertion of Eq. (B5) into Eq. (B8) gives Eq. (B9); then noting that gives Eq. (B10).
Both sides are integrated (Eq. B11), and the equation rearranged (Eq. B12).
The equilibration time τeq can therefore be considered the e-folding time required for the displacement x to decrease to of its initial value (Eq. B13).
Code is available upon request.
Data are available upon request.
JW, UP, MS, and TB designed research. JW, MS, and TB wrote the model code and designed model calculations. JW and TB analyzed model results. JW and TB wrote the manuscript with contributions from all co-authors.
The authors declare that they have no conflict of interest.
The authors thank Gerhard Lammel for helpful discussions.
This research has been supported by the National Science Foundation (grant no. AGS-1654104).
The article processing charges for this open-access publication were covered by the Max Planck Society.
This paper was edited by Rob MacKenzie and reviewed by three anonymous referees.
Akyüz, M. and Çabuk, H.: Gas–particle partitioning and seasonal variation of polycyclic aromatic hydrocarbons in the atmosphere of Zonguldak, Turkey, Sci. Total Environ., 408, 5550–5558, https://doi.org/10.1016/j.scitotenv.2010.07.063, 2010. a
Arp, H. P. H., Schwarzenbach, R. P., and Goss, K.-U.: Ambient gas/particle partitioning. 2: The influence of particle source and temperature on sorption to dry terrestrial aerosols, Environ. Sci. Technol., 42, 5951–5957, https://doi.org/10.1021/es703096p, 2008. a
Berkemeier, T., Takeuchi, M., Eris, G., and Ng, N. L.: Kinetic modeling of formation and evaporation of secondary organic aerosol from NO3 oxidation of pure and mixed monoterpenes, Atmos. Chem. Phys., 20, 15513–15535, https://doi.org/10.5194/acp-20-15513-2020, 2020. a
Bernasconi, C. F.: Relaxation Kinetics, Chapter 1 – Basic Principles, Academic Press, New York, https://doi.org/10.1016/B978-0-12-092950-4.50005-8, 1976. a
Bertram, A. K., Ivanov, A. V., Hunter, M., Molina, L. T., and Molina, M. J.: The reaction probability of OH on organic surfaces of tropospheric interest, J. Phys. Chem. A, 105, 9415–9421, https://doi.org/10.1021/jp0114034, 2001. a
Billiard, S. M., Meyer, J. N., Wassenberg, D. M., Hodson, P. V., and Di Giulio, R. T.: Nonadditive effects of PAHs on Early Vertebrate Development: mechanisms and implications for risk assessment, Toxicol. Sci., 105, 5–23, https://doi.org/10.1093/toxsci/kfm303, 2008. a
Boström, C.-E., Gerde, P., Hanberg, A., Jernström, B., Johansson, C., Kyrklund, T., Rannug, A., Törnqvist, M., Victorin, K., and Westerholm, R.: Cancer risk assessment, indicators, and guidelines for polycyclic aromatic hydrocarbons in the ambient air., Environ. Health Persp., 110, 451–488, https://doi.org/10.1289/ehp.110-1241197, 2002. a
Brasseur, G. P. and Jacob, D. J.: Modeling of Atmospheric Chemistry, Cambridge University Press, Cambridge, United Kingdom, https://doi.org/10.1017/9781316544754, 2017. a
Brubaker, W. W. and Hites, R. A.: OH Reaction kinetics of polycyclic aromatic hydrocarbons and polychlorinated dibenzo-p-dioxins and dibenzofurans, J. Phys. Chem. A, 102, 915–921, 1998. a
Callén, M. S., de la Cruz, M. T., López, J. M., Murillo, R., Navarro, M. V., and Mastral, A. M.: Some inferences on the mechanism of atmospheric gas/particle partitioning of polycyclic aromatic hydrocarbons (PAH) at Zaragoza (Spain), Chemosphere, 73, 1357–1365, https://doi.org/10.1016/j.chemosphere.2008.06.063, 2008. a
Cappa, C. D. and Wilson, K. R.: Evolution of organic aerosol mass spectra upon heating: implications for OA phase and partitioning behavior, Atmos. Chem. Phys., 11, 1895–1911, https://doi.org/10.5194/acp-11-1895-2011, 2011. a
Chu, S. N., Sands, S., Tomasik, M. R., Lee, P. S., and McNeill, V. F.: Ozone oxidation of surface-adsorbed polycyclic aromatic hydrocarbons: Role of PAH–surface interaction, J. Am. Chem. Soc, 132, 15968–15975, https://doi.org/10.1021/ja1014772, 2010. a
Dachs, J. and Eisenreich, S. J.: Adsorption onto aerosol soot carbon dominates gas-particle partitioning of polycyclic aromatic hydrocarbons, Environ. Sci. Technol., 34, 3690–3697, https://doi.org/10.1021/es991201+, 2000. a
Ding, N., Chen, X., and Wu, C.-M. L.: Interactions between polybrominated diphenyl ethers and graphene surface: a DFT and MD investigation, Environ. Sci. Nano, 1, 55–63, https://doi.org/10.1039/C3EN00037K, 2014. a
Fasnacht, M. P. and Blough, N. V.: Aqueous photodegradation of polycyclic aromatic hydrocarbons, Environ. Sci. Technol., 36, 4364–4369, https://doi.org/10.1021/es025603k, 2002. a
Finizio, A., Mackay, D., Bidleman, T., and Harner, T.: Octanol-air partition coefficient as a predictor of partitioning of semi-volatile organic chemicals to aerosols, Atmos. Environ., 31, 2289–2296, https://doi.org/10.1016/S1352-2310(97)00013-7, 1997. a
Fraser, S. J.: The steady state and equilibrium approximations: A geometrical picture, J. Chem. Phys., 88, 4732–4738, https://doi.org/10.1063/1.454686, 1988. a
Friedman, C. L., Pierce, J. R., and Selin, N. E.: Assessing the influence of secondary organic versus primary carbonaceous aerosols on long-range atmospheric polycyclic aromatic hydrocarbon transport, Environ. Sci. Technol., 48, 3293–3302, https://doi.org/10.1021/es405219r, 2014. a
Galarneau, E., Makar, P. A., Zheng, Q., Narayan, J., Zhang, J., Moran, M. D., Bari, M. A., Pathela, S., Chen, A., and Chlumsky, R.: PAH concentrations simulated with the AURAMS-PAH chemical transport model over Canada and the USA, Atmos. Chem. Phys., 14, 4065–4077, https://doi.org/10.5194/acp-14-4065-2014, 2014. a, b
Geyer, A., Bächmann, K., Hofzumahaus, A., Holland, F., Konrad, S., Klüpfel, T., Pätz, H.-W., Perner, D., Mihelcic, D., Schäfer, H.-J., Volz-Thomas, A., and Platt, U.: Nighttime formation of peroxy and hydroxyl radicals during the BERLIOZ campaign: Observations and modeling studies, J. Geophys. Res.-Atmos., 108, 8249, https://doi.org/10.1029/2001JD000656, 2003. a
Gross, S. and Bertram, A. K.: Reactive uptake of NO3, N2O5, NO2, HNO3, and O3 on three types of polycyclic aromatic hydrocarbon surfaces, J. Phys. Chem. A, 112, 3104–3113, https://doi.org/10.1021/jp7107544, 2008. a
Guilloteau, A., Nguyen, M. L., Bedjanian, Y., and Le Bras, G.: Desorption of polycyclic aromatic hydrocarbons from soot surface: Pyrene and fluoranthene, J. Phys. Chem. A, 112, 10552–10559, https://doi.org/10.1021/jp803043s, 2008. a, b
Guilloteau, A., Bedjanian, Y., Nguyen, M. L., and Tomas, A.: Desorption of polycyclic aromatic hydrocarbons from a soot surface: Three- to five-ring PAHs, J. Phys. Chem. A, 114, 942–948, https://doi.org/10.1021/jp908862c, 2010. a, b, c, d, e
Harner, T. and Bidleman, T. F.: Octanol–air partition coefficient for describing particle/gas partitioning of aromatic compounds in urban air, Environ. Sci. Technol., 32, 1494–1502, https://doi.org/10.1021/es970890r, 1998. a
Hobbs, P. V., Sinha, P., Yokelson, R. J., Christian, T. J., Blake, D. R., Gao, S., Kirchstetter, T. W., Novakov, T., and Pilewskie, P.: Evolution of gases and particles from a savanna fire in South Africa, J. Geophys. Res.-Atmos., 108, 8485, https://doi.org/10.1029/2002JD002352, 2003. a
Hofzumahaus, A., Rohrer, F., Lu, K., Bohn, B., Brauers, T., Chang, C.-C., Fuchs, H., Holland, F., Kita, K., Kondo, Y., Li, X., Lou, S., Shao, M., Zeng, L., Wahner, A., and Zhang, Y.: Amplified trace gas removal in the troposphere, Science, 324, 1702–1704, https://doi.org/10.1126/science.1164566, 2009. a
Julin, J., Winkler, P. M., Donahue, N. M., Wagner, P. E., and Riipinen, I.: Near-unity mass accommodation coefficient of organic molecules of varying structure, Environ. Sci. Technol., 48, 12083–12089, https://doi.org/10.1021/es501816h, 2014. a, b, c
Junge, C.: Basic considerations about trace constituents in the atmosphere as related to the fate of global pollutants, in: Fate of pollutants in the air and water environments. Part I., edited by: Suffet, I. H., Wiley-Interscience, New York, 1977. a
Kamens, R., Odum, J., and Fan, Z.-H.: Some observations on times to equilibrium for semivolatile polycyclic aromatic hydrocarbons, Environ. Sci. Technol., 29, 43–50, https://doi.org/10.1021/es00001a005, 1995. a
Keyte, I. J., Harrison, R. M., and Lammel, G.: Chemical reactivity and long-range transport potential of polycyclic aromatic hydrocarbons – a review, Chem. Soc. Rev., 42, 9333–9391, https://doi.org/10.1039/C3CS60147A, 2013. a, b
Kiefer, J.: Sequential minimax search for a maximum, Proc. Am. Math. Soc., 4, 502–506, https://doi.org/10.1090/S0002-9939-1953-0055639-3, 1953. a
Kim, K.-H., Jahan, S. A., Kabir, E., and Brown, R. J. C.: A review of airborne polycyclic aromatic hydrocarbons (PAHs) and their human health effects, Environ. Int., 60, 71–80, https://doi.org/10.1016/j.envint.2013.07.019, 2013. a
Kubicki, J. D.: Molecular simulations of benzene and PAH interactions with soot, Environ. Sci. Technol., 40, 2298–2303, https://doi.org/10.1021/es051083s, 2006. a, b
Lammel, G., Sehili, A. M., Bond, T. C., Feichter, J., and Grassl, H.: Gas/particle partitioning and global distribution of polycyclic aromatic hydrocarbons – A modelling approach, Chemosphere, 76, 98–106, https://doi.org/10.1016/j.chemosphere.2009.02.017, 2009. a
Lammel, G., Klánová, J., Ilić, P., Kohoutek, J., Gasić, B., Kovacić, I., and Škrdlíková, L.: Polycyclic aromatic hydrocarbons in air on small spatial and temporal scales – II. Mass size distributions and gas-particle partitioning, Atmos. Environ., 44, 5022–5027, https://doi.org/10.1016/j.atmosenv.2010.08.001, 2010. a
Lammel, G., Kitanovski, Z., Kukučka, P., Novák, J., Arangio, A. M., Codling, G. P., Filippi, A., Hovorka, J., Kuta, J., Leoni, C., Příbylová, P., Prokeš, R., Sáňka, O., Shahpoury, P., Tong, H., and Wietzoreck, M.: Oxygenated and nitrated polycyclic aromatic hydrocarbons in ambient air–levels, phase partitioning, mass size distributions, and inhalation bioaccessibility, Environ. Sci. Technol., 54, 2615–2625, 2020. a
Lazar, P., Karlický, F., Jurečka, P., Kocman, M., Otyepková, E., Šafářová, K., and Otyepka, M.: Adsorption of small organic molecules on graphene, J. Am. Chem. Soc., 135, 6372–6377, https://doi.org/10.1021/ja403162r, 2013. a
Lechner, C. and Sax, A. F.: Adhesive forces between aromatic molecules and graphene, J. Phys. Chem. C, 118, 20970–20981, https://doi.org/10.1021/jp505894p, 2014. a
Li, Y. and Shiraiwa, M.: Timescales of secondary organic aerosols to reach equilibrium at various temperatures and relative humidities, Atmos. Chem. Phys., 19, 5959–5971, https://doi.org/10.5194/acp-19-5959-2019, 2019. a
Li, Y.-F., Ma, W.-L., and Yang, M.: Prediction of gas/particle partitioning of polybrominated diphenyl ethers (PBDEs) in global air: A theoretical study, Atmos. Chem. Phys., 15, 1669–1681, https://doi.org/10.5194/acp-15-1669-2015, 2015. a
Liu, C., Zhang, Y., and Weschler, C. J.: Exposure to SVOCs from inhaled particles: Impact of desorption, Environ. Sci. Technol., 51, 2615–2625, 2017. a
Liu, Y., Ivanov, A., Zelenov, V., and Molina, M.: Temperature dependence of OH uptake by carbonaceous surfaces of atmospheric importance, Russ. J. Phys. Ch. B, 6, 327–332, 2012. a
Lohmann, R. and Lammel, G.: Adsorptive and absorptive contributions to the gas-particle partitioning of polycyclic aromatic hydrocarbons: State of knowledge and recommended parametrization for modeling, Environ. Sci. Technol., 38, 3793–3803, https://doi.org/10.1021/es035337q, 2004. a
Lohmann, R., Harner, T., Thomas, G. O., and Jones, K. C.: A comparative study of the gas-particle partitioning of PCDD/Fs, PCBs, and PAHs, Environ. Sci. Technol., 34, 4943–4951, https://doi.org/10.1021/es9913232, 2000. a
Mader, B. T. and Pankow, J. F.: Study of the effects of particle-phase carbon on the gas/particle partitioning of semivolatile organic compounds in the atmosphere using controlled field experiments, Environ. Sci. Technol., 36, 5218–5228, https://doi.org/10.1021/es011048v, 2002. a
Mandalakis, M., Tsapakis, M., Tsoga, A., and Stephanou, E. G.: Gas–particle concentrations and distribution of aliphatic hydrocarbons, PAHs, PCBs and PCDD/Fs in the atmosphere of Athens (Greece), Atmos. Environ., 36, 4023–4035, https://doi.org/10.1016/S1352-2310(02)00362-X, 2002. a
Massman, W. J.: A review of the molecular diffusivities of H2O, CO2, CH4, CO, O3, SO2, NH3, N2O, NO, and NO2 in air, O2 and N2 near STP, Atmos. Environ., 32, 1111–1127, https://doi.org/10.1016/S1352-2310(97)00391-9, 1998. a
McFiggans, G. B., Alfarra, M. R., Allan, J., Coe, H., Hamilton, J., Harrison, R., Jenkin, M. E., Lewis, A., Moller, S. J., and Williams, P. I.: A review of the state-of-the-science relating to secondary particulate matter of relevance to the composition of the UK atmosphere: Full technical report to Defra, project AQ0732, 131–165, http://eprints.whiterose.ac.uk/92381/ (last access: 12 April 2021), 2015. a
Meng, Z. and Seinfeld, J. H.: Time scales to achieve atmospheric gas-aerosol equilibrium for volatile species, Atmos. Environ., 30, 2889–2900, https://doi.org/10.1016/1352-2310(95)00493-9, 1996. a
Miguel, A. H., Kirchstetter, T. W., Harley, R. A., and Hering, S. V.: On-road emissions of particulate polycyclic aromatic hydrocarbons and black carbon from gasoline and diesel vehicles, Environ. Sci. Technol., 32, 450–455, https://doi.org/10.1021/es970566w, 1998. a
Mu, Q., Shiraiwa, M., Octaviani, M., Ma, N., Ding, A., Su, H., Lammel, G., Pöschl, U., and Cheng, Y.: Temperature effect on phase state and reactivity controls atmospheric multiphase chemistry and transport of PAHs, Sci. Adv., 4, eaap7314, https://doi.org/10.1126/sciadv.aap7314, 2018. a
Odum, J. R., Yu, J., and Kamens, R. M.: Modeling the mass transfer of semivolatile organics in combustion aerosols, Environ. Sci. Technol., 28, 2278–2285, https://doi.org/10.1021/es00062a011, 1994. a
Pankow, J. F.: An absorption model of gas/particle partitioning of organic compounds in the atmosphere, Atmos. Environ., 28, 185–188, https://doi.org/10.1016/1352-2310(94)90093-0, 1994. a
Pankow, J. F. and Bidleman, T. F.: Interdependence of the slopes and intercepts from log-log correlations of measured gas-particle paritioning and vapor pressure–I. theory and analysis of available data, Atmos. Environ., 26, 1071–1080, https://doi.org/10.1016/0960-1686(92)90039-N, 1992. a
Pöschl, U.: Atmospheric aerosols: Composition, transformation, climate and health effects, Angew. Chem. Int. Ed., 44, 7520–7540, https://doi.org/10.1002/anie.200501122, 2005. a, b
Pöschl, U., Rudich, Y., and Ammann, M.: Kinetic model framework for aerosol and cloud surface chemistry and gas–particle interactions – Part 1: General equations, parameters, and terminology, Atmos. Chem. Phys., 7, 5989–6023, https://doi.org/10.5194/acp-7-5989-2007, 2007. a, b
Ravindra, K., Sokhi, R., and Van Grieken, R.: Atmospheric polycyclic aromatic hydrocarbons: Source attribution, emission factors and regulation, Atmos. Environ., 42, 2895–2921, https://doi.org/10.1016/j.atmosenv.2007.12.010, 2008. a
Rounds, S. A. and Pankow, J. F.: Application of a radial diffusion model to describe gas/particle sorption kinetics, Environ. Sci. Technol., 24, 1378–1386, https://doi.org/10.1021/es00079a012, 1990. a
Saleh, R., Donahue, N. M., and Robinson, A. L.: Time scales for gas-particle partitioning equilibration of secondary organic aerosol formed from alpha-pinene ozonolysis, Environ. Sci. Technol., 47, 5588–5594, https://doi.org/10.1021/es400078d, 2013. a
Sehili, A. M. and Lammel, G.: Global fate and distribution of polycyclic aromatic hydrocarbons emitted from Europe and Russia, Atmos. Environ., 41, 8301–8315, https://doi.org/10.1016/j.atmosenv.2007.06.050, 2007. a
Shahpoury, P., Lammel, G., Albinet, A., Sofuoǧlu, A., Dumanoğlu, Y., Sofuoǧlu, S. C., Wagner, Z., and Zdimal, V.: Evaluation of a conceptual model for gas-particle partitioning of polycyclic aromatic hydrocarbons using polyparameter linear free energy relationships, Environ. Sci. Technol., 50, 12312–12319, https://doi.org/10.1021/acs.est.6b02158, 2016. a
Shiraiwa, M. and Seinfeld, J. H.: Equilibration timescale of atmospheric secondary organic aerosol partitioning, Geophys. Res. Lett., 39, L24801, https://doi.org/10.1029/2012GL054008, 2012. a, b
Shiraiwa, M., Garland, R. M., and Pöschl, U.: Kinetic double-layer model of aerosol surface chemistry and gas-particle interactions (K2-SURF): Degradation of polycyclic aromatic hydrocarbons exposed to O3, NO2, H2O, OH and NO3, Atmos. Chem. Phys., 9, 9571–9586, https://doi.org/10.5194/acp-9-9571-2009, 2009. a, b, c
Shiraiwa, M., Sosedova, Y., Rouvière, A., Yang, H., Zhang, Y., Abbatt, J. P. D., Ammann, M., and Pöschl, U.: The role of long-lived reactive oxygen intermediates in the reaction of ozone with aerosol particles, Nat. Chem, 3, 291–295, https://doi.org/10.1038/nchem.988, 2011. a
Shiraiwa, M., Yee, L. D., Schilling, K. A., Loza, C. L., Craven, J. S., Zuend, A., Ziemann, P. J., and Seinfeld, J. H.: Size distribution dynamics reveal particle-phase chemistry in organic aerosol formation, P. Natl. Acad. Sci. USA, 110, 11746–11750, https://doi.org/10.1073/pnas.1307501110, 2013. a
Shrivastava, M., Lou, S., Zelenyuk, A., Easter, R. C., Corley, R. A., Thrall, B. D., Rasch, P. J., Fast, J. D., Simonich, S. L. M., Shen, H., and Tao, S.: Global long-range transport and lung cancer risk from polycyclic aromatic hydrocarbons shielded by coatings of organic aerosol, P. Natl. Acad. Sci. USA, 114, 1246–1251, https://doi.org/10.1073/pnas.1618475114, 2017. a
Siddiqi, M. A., Siddiqui, R. A., and Atakan, B.: Thermal stability, sublimation pressures, and diffusion coefficients of anthracene, pyrene, and some metal β-diketonates, J. Chem. Eng. Data, 54, 2795–2802, https://doi.org/10.1021/je9001653, 2009. a, b
Škrdlíková, L., Landlová, L., Klánová, J., and Lammel, G.: Wet deposition and scavenging efficiency of gaseous and particulate phase polycyclic aromatic compounds at a central European suburban site, Atmos. Environ., 45, 4305–4312, https://doi.org/10.1016/j.atmosenv.2011.04.072, 2011. a
Stone, D., Whalley, L. K., and Heard, D. E.: Tropospheric OH and HO2 radicals: field measurements and model comparisons, Chem. Soc. Rev., 41, 6348–6404, https://doi.org/10.1039/C2CS35140D, 2012. a
Tang, M. J., Cox, R. A., and Kalberer, M.: Compilation and evaluation of gas phase diffusion coefficients of reactive trace gases in the atmosphere: volume 1. Inorganic compounds, Atmos. Chem. Phys., 14, 9233–9247, https://doi.org/10.5194/acp-14-9233-2014, 2014. a
Terzi, E. and Samara, C.: Gas-particle partitioning of polycyclic aromatic hydrocarbons in urban, adjacent coastal, and continental background sites of Western Greece, Environ. Sci. Technol., 38, 4973–4978, https://doi.org/10.1021/es040042d, 2004. a
Vingarzan, R.: A review of surface ozone background levels and trends, Atmos. Environ., 38, 3431–3442, https://doi.org/10.1016/j.atmosenv.2004.03.030, 2004. a
Wang, T., Xue, L., Brimblecombe, P., Lam, Y. F., Li, L., and Zhang, L.: Ozone pollution in China: A review of concentrations, meteorological influences, chemical precursors, and effects, Sci. Total Environ., 575, 1582–1596, https://doi.org/10.1016/j.scitotenv.2016.10.081, 2017. a
Wei, C., Han, Y., Bandowe, B. A. M., Cao, J., Huang, R.-J., Ni, H., Tian, J., and Wilcke, W.: Occurrence, gas/particle partitioning and carcinogenic risk of polycyclic aromatic hydrocarbons and their oxygen and nitrogen containing derivatives in Xi'an, central China, Sci. Total Environ., 505, 814–822, https://doi.org/10.1016/j.scitotenv.2014.10.054, 2015. a
Wei, W., Ramalho, O., and Mandin, C.: Modeling the bioaccessibility of inhaled semivolatile organic compounds in the human respiratory tract, Int. J. Hyg. Environ. Health, 224, 113436, https://doi.org/10.1016/j.ijheh.2019.113436, 2020. a
Yamasaki, H., Kuwata, K., and Miyamoto, H.: Effects of ambient temperature on aspects of airborne polycyclic aromatic hydrocarbons, Environ. Sci. Technol., 16, 189–194, https://doi.org/10.1021/es00098a003, 1982. a
Zhang, H., Worton, D. R., Shen, S., Nah, T., Isaacman-VanWertz, G., Wilson, K. R., and Goldstein, A. H.: Fundamental time scales governing organic aerosol multiphase partitioning and oxidative aging, Environ. Sci. Technol., 49, 9768–9777, https://doi.org/10.1021/acs.est.5b02115, 2015. a
Zhang, Q., Gao, R., Xu, F., Zhou, Q., Jiang, G., Wang, T., Chen, J., Hu, J., Jiang, W., and Wang, W.: Role of water molecule in the gas-phase formation process of nitrated polycyclic aromatic hydrocarbons in the atmosphere: A computational study, Environ. Sci. Technol., 48, 5051–5057, https://doi.org/10.1021/es500453g, 2014. a, b
- Abstract
- Introduction
- Methods
- Results and discussion
- Atmospheric implications
- Appendix A: Kinetic model
- Appendix B: Derivation of equation for equilibration time
- Code availability
- Data availability
- Author contributions
- Competing interests
- Acknowledgements
- Financial support
- Review statement
- References