the Creative Commons Attribution 4.0 License.
the Creative Commons Attribution 4.0 License.
 | 18 Jan 2021
Record low ozone values over the Arctic in boreal spring 2020
Martin Dameris
Diego G. Loyola
Matthias Nützel
Melanie Coldewey-Egbers
Christophe Lerot
Fabian Romahn
Michel van Roozendael
Ozone data derived from the Tropospheric Monitoring Instrument (TROPOMI) sensor on board the Sentinel-5 Precursor satellite show exceptionally low total ozone columns in the polar region of the Northern Hemisphere (Arctic) in spring 2020. Minimum total ozone column values around or below 220 Dobson units (DU) were seen over the Arctic for 5 weeks in March and early April 2020. Usually the persistence of such low total ozone column values in spring is only observed in the polar Southern Hemisphere (Antarctic) and not over the Arctic. These record low total ozone columns were caused by a particularly strong polar vortex in the stratosphere with a persistent cold stratosphere at higher latitudes, a prerequisite for ozone depletion through heterogeneous chemistry. Based on the ERA5, which is the fifth generation of the European Centre for Medium-Range Weather Forecasts (ECMWF) atmospheric reanalysis, the Northern Hemisphere winter 2019/2020 (from December to March) showed minimum polar cap temperatures consistently below 195 K around 20 km altitude, which enabled enhanced formation of polar stratospheric clouds. The special situation in spring 2020 is compared and discussed in context with two other Northern Hemisphere spring seasons, namely those in 1997 and 2011, which also displayed relatively low total ozone column values. However, during these years, total ozone columns below 220 DU over several consecutive days were not observed in spring. The similarities and differences of the atmospheric conditions of these three events and possible explanations for the observed features are presented and discussed. It becomes apparent that the monthly mean of the minimum total ozone column value for March 2020 (221 DU) was clearly below the respective values found in March 1997 (267 DU) and 2011 (252 DU), which highlights the special evolution of the polar stratospheric ozone layer in the Northern Hemisphere in spring 2020. A comparison with a typical ozone hole over the Antarctic (e.g., in 2016) indicates that although the Arctic spring 2020 situation is remarkable, with total ozone column values around or below 220 DU observed over a considerable area (up to 0.9 million km2), the Antarctic ozone hole shows total ozone columns typically below 150 DU over a much larger area (of the order of 20 million km2). Furthermore, total ozone columns below 220 DU are typically observed over the Antarctic for about 4 months.
- Article
(9766 KB) - Full-text XML
- BibTeX
- EndNote


Today's operating satellite instruments produce a reliable picture of the Earth's atmosphere and its chemical composition. These instruments monitor, for example, the evolution of the stratospheric ozone layer (e.g., Loyola et al., 2009), which is important for life on Earth. Unusually low ozone values can occur in the polar regions if chemical and dynamical processes interact in a specific way. A long-lived polar vortex with low stratospheric temperatures can support significant ozone depletion, and a strong polar vortex itself can hamper meridional transport of ozone-rich air from lower latitudes (e.g., Solomon, 1999; Solomon et al., 2014). The largest concentrations of atmospheric ozone are found in the stratospheric ozone layer, with about 90 % of the atmosphere's ozone located at altitudes between 15 and 30 km (e.g., Langematz, 2019). The Dobson unit (DU) – named after Gordon Dobson (1889–1976), who devised the first instrument for measuring atmospheric ozone content – is used to describe the total amount of ozone found in the atmosphere above a specific location. Typically, an ozone hole in the Antarctic is defined as the area where the total ozone column (TOC) is less than 220 DU (e.g., WMO, 2018). In the Southern Hemisphere (SH) polar region (Antarctic) a TOC below 220 DU is about 30 % under the climatological mean ozone value in austral spring, which was determined for the years before 1980 (e.g., Chap. 4 in WMO, 1999; Chap. 3 in WMO, 2003). Climatological mean TOCs averaged over the Northern Hemisphere (NH) polar region (Arctic) in boreal spring are higher (∼ 400–450 DU; e.g., Dameris, 2010). Therefore, the decrease of TOC below 220 DU during this period indicates a reduction of total ozone in the order of 50 %. We note that NH winters with reduced wave activity could be related to reduced transport of ozone into the stratospheric polar vortex and to stronger ozone depletion in the lower stratosphere because of lower temperatures (e.g., Tegtmeier et al., 2008). Additionally, a shift of the tropopause to higher altitudes and a colder tropopause could lead in the same direction (e.g., Manney et al., 2011).
The south polar lower stratosphere cools significantly more in winter (June–August) than the north polar lower stratosphere (December–February). In the cold polar lower stratosphere in winter, polar stratospheric clouds (PSCs) form during polar night. PSCs develop at temperatures below 195 K or 188 K at 50 hPa, which are approximate values that depend on HNO3 and H2O concentrations (see, for instance, Fig. 4-1 of Chap. 4 in WMO, 2018). Under these conditions, nitric acid trihydrate crystals (NAT: HNO3 × 3H2O; so-called NAT-PSCs) or ice PSCs are formed in the following days or weeks, respectively. PSC particles allow heterogeneous reactions to take place on their surfaces, which enable halogen compounds (chlorine and bromine) to be released from reservoir compounds (e.g., ClONO2, HCl) and then be converted to an active form. When the sun returns in polar spring, active molecules, such as Cl2 or HOCl, are converted into reactive Cl and ClO. Ozone depletion follows via catalytic photochemical reaction cycles. More details can be found in the review article by Solomon (1999).
Due to the prohibition of the production and usage of ozone-depleting substances (among others CFCs, chlorofluorocarbons) in response to the international activities to protect the ozone layer (Montreal Protocol, 1987, and its amendments), atmospheric concentrations of these chemical substances (particularly CFCs) and their products have been reduced over the last 20 years by about 15 % (Chap. 1 in WMO, 2018). Nevertheless, the current atmospheric burden of CFCs is still enhanced with respect to 1980s values as CFCs have lifetimes of several decades (SPARC, 2013). Consequently, the chlorine concentration in the stratosphere is still high. Based on the current scientific understanding, the chlorine content is expected to reach pre-CFC-era conditions (i.e., levels similar to the ones before 1980) around the middle of this century, and we can therefore expect a return to pre-CFC values of the ozone layer in the next 30 to 40 years (see Chaps. 3 and 4 in WMO, 2018).
Notwithstanding the Montreal Protocol and the projected recovery of the ozone layer, very low TOC values over the polar cap can occur not only in the SH, but also in the NH. For instance, as shown in Fig. 1, in March and early April 2020, very low TOC values were measured in the Arctic, although the stratospheric chlorine content in 2020 was known to be lower than in previous years (Chap. 1 in WMO, 2018).
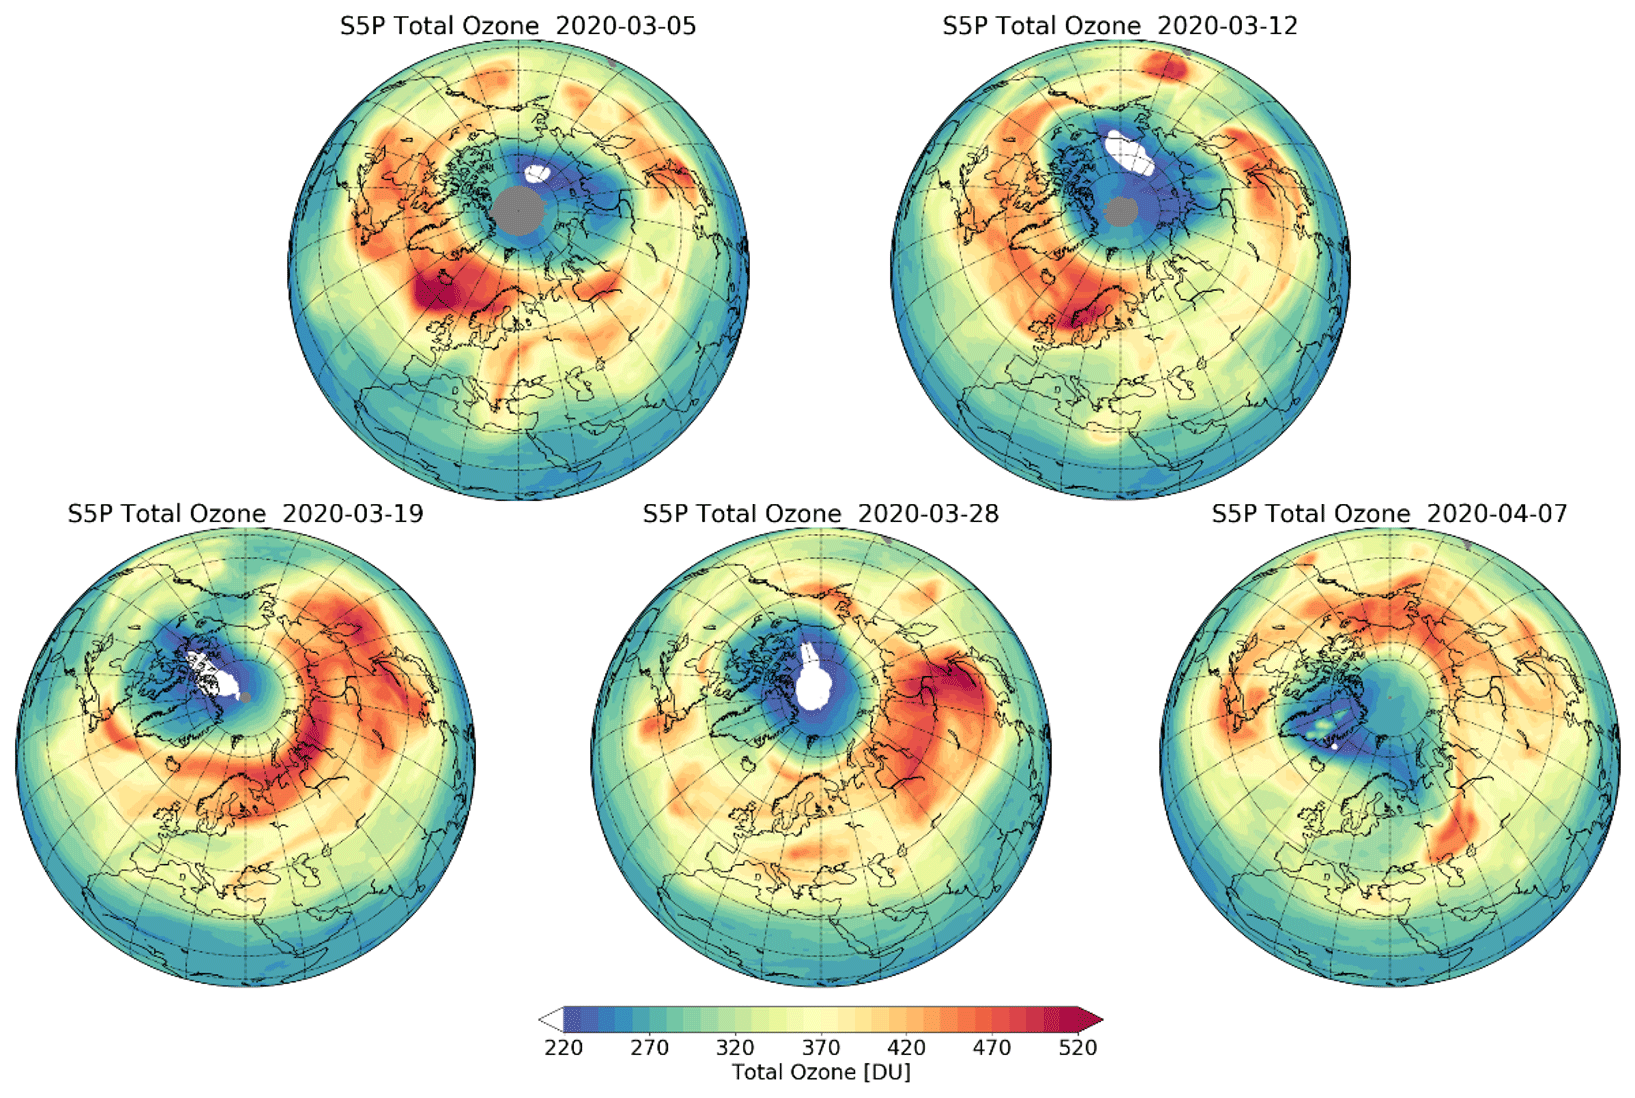
Figure 1Total ozone column over the Northern Hemisphere on 5, 12, 19, and 28 March and 7 April 2020 measured by the TROPOMI instrument on board the Sentinel-5 Precursor (S5P) satellite. The color scale shows Dobson units (DU). The area with total ozone column values below 220 DU is denoted by the white color. Grey areas near the North Pole indicate missing data during polar night.
The dynamical conditions of the stratosphere as observed in the NH spring 2020 were unusual, showing an undisturbed polar stratospheric vortex with low temperatures, as will be seen in the upcoming analysis. Comparable dynamical conditions in the NH stratosphere in spring were noted in the literature for 1997 (e.g., Coy et al., 1997; Manney et al., 1997; Lefèvre et al., 1998; Hansen and Chipperfield, 1999) and 2011 (e.g., Manney et al., 2011; Sinnhuber et al., 2011; Kuttippurath et al., 2012; Hommel et al., 2014). TOC values were low for an extended time period in spring in these 2 years, but TOC values below 220 DU were not observed. Although the dynamical conditions in winter and spring 2019/2020 were unusual, they lie in the natural range of stratospheric dynamical fluctuations in NH winter and early spring (e.g., Langematz et al., 2014). The importance of stratospheric dynamics causing low TOC has been discussed in detail in the last decades (e.g., Chaps. 4 and 12 in WMO, 1999; Chap. 3 in WMO, 2003; Chap. 3 in WMO, 2014; Solomon, 1999; Petzoldt, 1999; Rex et al., 2004; Tilmes et al., 2006; Kivi et al., 2007; Tegtmeier et al., 2008; Harris et al., 2010).
Considering the dynamical conditions, it was not unexpected to measure low TOC values within the polar vortex in NH spring 2020. However, as indicated in Fig. 1, it is still noteworthy that the TOC values were below the typical ozone hole threshold of 220 DU for about 5 weeks, despite the reduced chlorine content in the stratosphere. The occurrence of TOC values below 220 DU in March 2020 derived from satellite instrument measurements is confirmed by ground-based measurements at different NH stations, in particular at stations in Canada (e.g., Alert, Eureka, and Resolute). The ozone data are available, for instance, at http://www.temis.nl/uvradiation/UVarchive/stations_uv.html (last access: 13 January 2021; van Geffen et al., 2017). Additional ozonesonde profiles are discussed in detail by Wohltmann et al. (2020) and Bernhard et al. (2020).
This study provides a description of the dynamical situation in NH winter and spring 2019/2020, which for the first time led to TOC values below 220 DU in larger areas of the polar vortex for an extended time period over the Arctic. We compare winter 2019/2020 to winters with similar dynamical conditions in Arctic spring but which did not show TOC values below 220 DU over the polar NH in spring over an extended time period. Further, we also demonstrate that the low TOC values over the Arctic observed in spring 2020 are far from the conditions usually observed in the Antarctic ozone hole.
In the next section (Sect. 2) the data sets used are introduced, including a short description of the performed data processing. In Sect. 3 the special situation in NH winter and spring 2019/2020 is presented in detail, and in Sect. 4 it is compared with two NH winter and spring seasons, namely 1996/1997 and 2010/2011, where similar polar stratospheric conditions – including low TOC values – have been observed. In addition, the observations in Arctic winter and spring 2019/2020 are compared to a typical Antarctic ozone hole as detected in 2016 and to the small Antarctic ozone hole observed in 2019. The discussion of results and the conclusions are presented in Sects. 5 and 6, respectively.
2.1 Meteorological data
In this study the presented dynamical analyses are based on meteorological data derived from the European Centre for Medium-Range Weather Forecasts' (ECMWF's) most recent atmospheric reanalysis, ERA5, i.e., the fifth generation (Hersbach et al., 2019b, 2020). The ERA5 data used in this study cover the period from 1979 to 2020. For our investigations ERA5 temperature and wind data were used at the provided 0.25∘ × 0.25∘ resolution. Daily mean data are calculated for the presentations of the respective meteorological situations from the ERA5 hourly data on pressure levels (Hersbach et al., 2018). Monthly mean values are obtained from the monthly mean data at pressure levels (Hersbach et al., 2019a). In addition, daily potential vorticity (PV) fields on isentropes have been derived from hourly PV data on isentropes, which were obtained from the full ERA5 data set (Copernicus Climate Change Service (C3S), 2017) and regridded to a regular latitude longitude grid (of roughly 0.28∘ × 0.28∘). ERA5 (raw) data are publicly available. For details, see the Data Availability section.
2.2 Ozone data
Ozone data from July 2019 to April 2020 from the Tropospheric Monitoring Instrument (TROPOMI) sensor on board the EU/ESA Copernicus Sentinel-5 Precursor satellite are scientifically used for the first time in combination with the long-term ozone data set from the European satellite data record GOME-type Total Ozone Essential Climate Variable (GTO-ECV) from July 1995 to June 2019 (Coldewey-Egbers et al., 2015). The publicly available (Level 2) TOC data for July 2019 to April 2020 are derived from the TROPOMI sensor using the GODFIT algorithm (Lerot et al., 2014). The estimated mean magnitude of the bias of the TROPOMI TOC compared with ground-based measurements is less than 1 %, with a mean standard deviation of up to 2.5 % (Garane et al., 2019). An initial comparison of TOCs from TROPOMI and the Ozone Monitoring Instrument (OMI) on board the NASA Aura spacecraft indicated that TROPOMI TOCs are slightly smaller ( %) than OMI TOCs. A similar difference is thus expected with respect to GTO-ECV since OMI provides the reference basis for the combined record (see next paragraph). The TROPOMI TOC images presented for the first time in this study are based on daily mean data regridded to 1∘ × 1∘ resolution to facilitate the comparison with the GTO-ECV data. For details, see the Data Availability section.
GTO-ECV has been developed in the framework of the European Space Agency's Climate Change Initiative ozone project and is based on observations from different satellite sensors: the Global Ozone Monitoring Experiment on board the second European Remote Sensing satellite (GOME/ERS-2), the Scanning Imaging Absorption Spectrometer for Atmospheric Chartography on board the Environmental Satellite (SCIAMACHY/ENVISAT), the Ozone Monitoring Instrument on board the Aura satellite (OMI/Aura), and the Global Ozone Monitoring Experiment second generation on board the MetOp satellite (GOME-2/MetOp), covering the time period from July 1995 to June 2019 (Coldewey-Egbers et al., 2015). As for TROPOMI, the retrieval algorithm GODFIT (Lerot et al., 2014) is used to derive TOCs from the measurements of the individual satellite sensors. Before the separate data records are merged into one single product, adjustments are applied in order to minimize possible inter-sensor biases and/or drifts. If not accounted for, such discrepancies can introduce unwanted discontinuities or artificial trends in the combined record. Due to its notable temporal stability, OMI was selected to serve as a reference for the other instruments. The data are then adjusted by using a correction that depends on latitude and time. The agreement between GTO-ECV and ground-based observations is 0.5 %–1.5 % peak-to-peak amplitude with a negligible long-term drift in the NH (Garane et al., 2018), and the difference between GTO-ECV and an “adjusted” TOC data set based on reanalysis data is between 1.7 % and 1.1 % (for details, see Coldewey-Egbers et al., 2020). In particular, the excellent temporal stability makes the GTO-ECV data record suitable and useful for applications related to long-term investigations of the ozone layer. In this study we use the daily mean data product at 1∘ × 1∘ resolution to analyze minimum ozone columns in the NH polar region during the past 24 years. During polar night, the satellite sensors used cannot provide measurements. For instance, in December, north of about 70∘ N, no observations are available. With returning sunlight, the coverage in the NH high-latitude regions improves, and global coverage resumes around 20 March.
Arctic winter and early spring 2019/2020 showed a persistent stratospheric polar vortex with strong zonal winds from mid-December until early April. Figure 2 presents the potential vorticity (PV) field of ERA5 in the NH at the isentropic surface of 475 K (around 20 km altitude) and shows the position and strength of the polar vortex. The region of strong PV gradients, which is represented here by the contour line of 36 PV units (e.g., Wohltmann et al., 2020), indicates the edge of the polar vortex. The figure illustrates that the polar vortex is strong in March and early April and that the position of the polar vortex coincides with the region of low TOC values (Fig. 1). Figure 3 shows strong zonal mean zonal wind speeds at 60∘ N, 10 hPa (about 30 km altitude) in the ERA5 data (magenta line and dots in the figure), which are higher than the monthly mean values for the time period from 1979/1980 to 2019/2020 (see grey dots in the figure). This finding is in line with a similar analysis by Lawrence et al. (2020), who used Modern-Era Retrospective analysis for Research and Applications version 2 (MERRA-2) data. In addition, Lawrence et al. (2020) showed that the polar vortex was generally stronger than usual (with respect to the climatological mean) in the polar stratosphere from November to April. Further, their analysis showed the height dependence of the zonal mean zonal wind anomalies, and it was found that the anomalies in NH spring are most pronounced around 10 hPa (and above). Smaller dynamical fluctuations were detected in winter 2019/2020, which were caused by planetary wave activity (Lawrence et al., 2020; for additional information, see https://acd-ext.gsfc.nasa.gov/Data_services/met/ann_data.html, last access: 13 January 2021; or https://ozonewatch.gsfc.nasa.gov/, last access: 13 January 2021; a key reference for such analyses is Newman et al., 2001). No minor or major warmings of the polar stratosphere were observed (see below), and the polar vortex was mostly undisturbed and showed a circular shape, except for the period from mid-January to beginning of February 2020, as can be seen from Fig. 3. These results are in agreement with Lawrence et al. (2020). In Fig. 4 the ERA5 monthly mean zonal winds derived for the NH in January, February, and March 2020 indicate a persistent strong polar vortex, with maximum zonal wind speeds up to 118 m s−1 at 10 hPa in January.
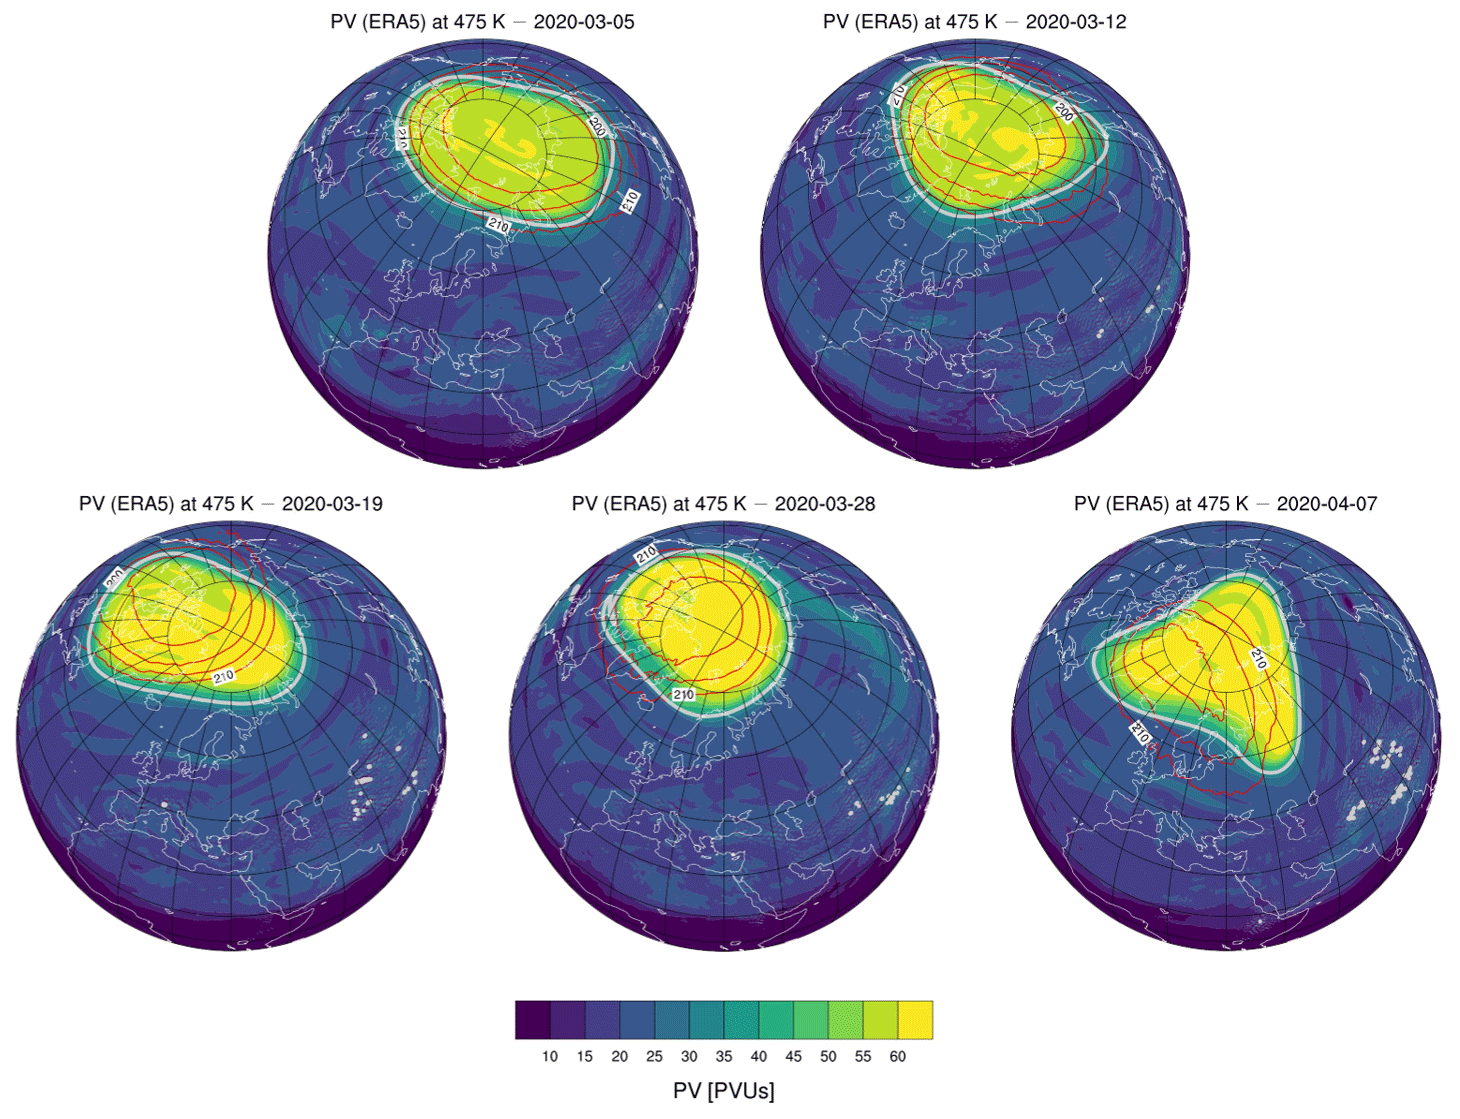
Figure 2Potential vorticity (PV) on the 475 K isentropic surface over the Northern Hemisphere on 5, 12, 19, 28 March and 7 April 2020 based on ERA5. The color scale shows potential vorticity units (PVUs); 1 PVU is 10−6 m−2 s−1 K kg−1. The grey contour highlights the 36 PVU. Red contour lines indicate the polar temperature field, with values ranging from 210 to 195 K; the distance of isolines is 5 K.

Figure 3Daily (lines) and monthly (dots; in the center of each month) mean zonal mean zonal wind (in m s−1) at 10 hPa (about 30 km altitude): the Northern Hemisphere winters 1996/1997, 2010/2011, 2018/2019, and 2019/2020 at 60∘ N from 1 December to 30 April based on ERA5 data are displayed in blue, green, brown, and magenta (lines and dots); the Southern Hemisphere winters 2016 and 2019 at 60∘ S from 1 June to 1 November (attention: the respective data are shifted by 6 months) based on ERA5 data are displayed in red and purple (lines and dots with crosses). Additional monthly means for the Northern Hemisphere winters from 1979/1980 to 2019/2020 are shown as grey dots in the center of each month. For simplicity, the leap day in 2020 (29 February) was neglected in the daily time series.
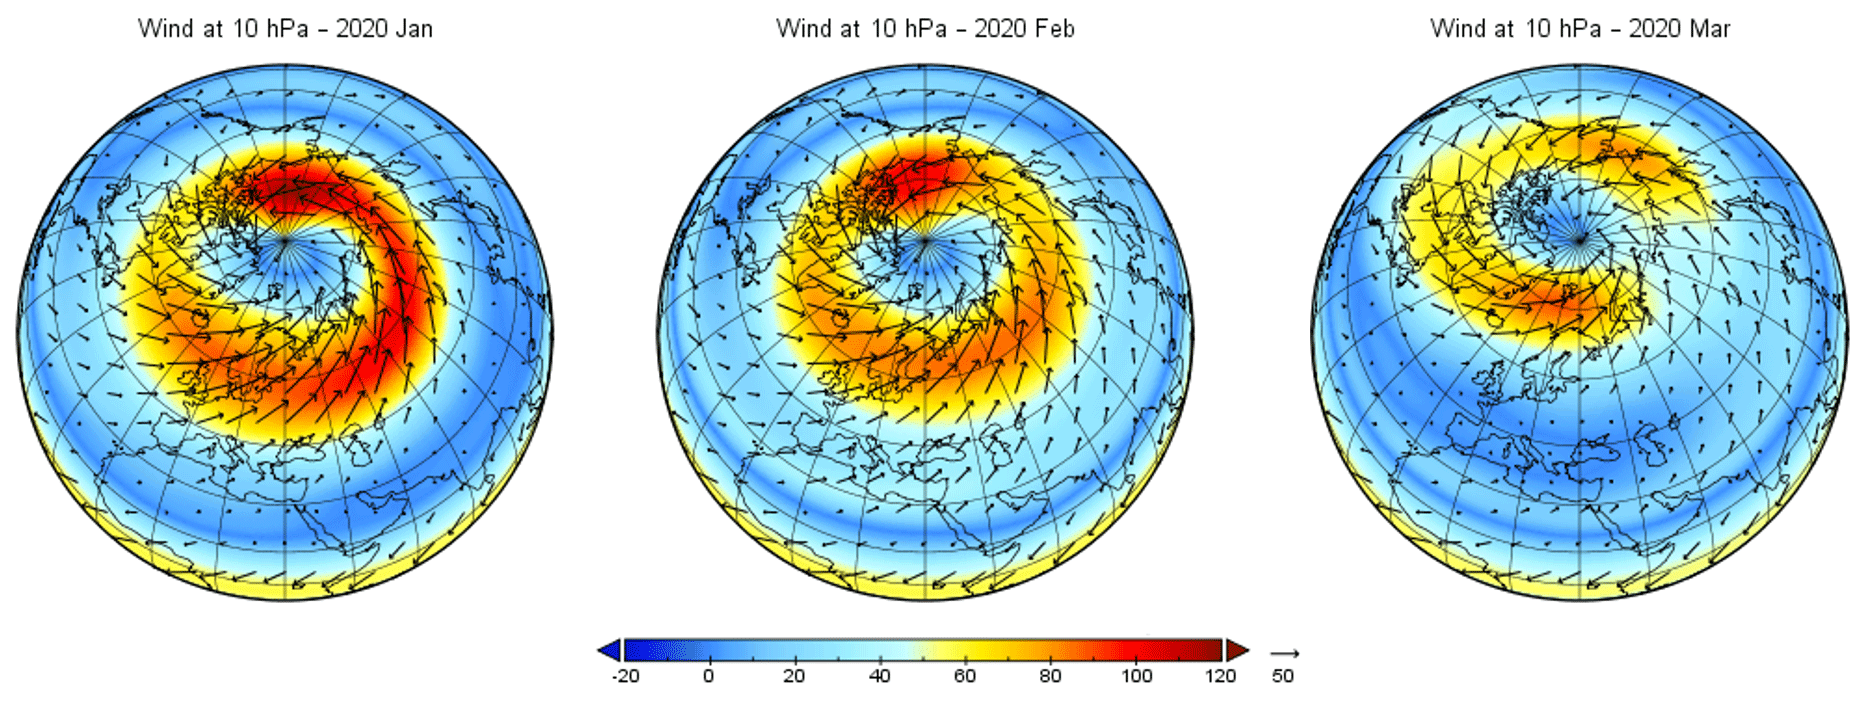
Figure 4ERA5 monthly mean wind at 10 hPa (about 30 km altitude), showing a strong vortex in the north polar region, with speeds of up to 118, 103, and 89 m s−1 for January to March 2020 respectively.
The dynamical conditions in winter 2019/2020 with low planetary wave activity result in very low temperatures in the polar lower stratosphere during polar night, especially in January, February, and March, which cause a strong polar vortex as a response. In the following, our analyses of lower stratospheric temperatures focus on the 50 hPa pressure level (about 20 km altitude), which is within the height range important for ozone depletion. Figure 5 shows that the monthly mean temperatures in January, February, and March 2020 were very low in comparison with the respective mean values calculated for the last 4 decades (1979/1980–2019/2020). In March 2020 the calculated maximum temperature difference with respect to the long-term mean was −23.8 K. In Fig. 6 (magenta line) minimum polar temperatures below 195 K at 50 hPa are detected in the polar cap region (50–90∘ N) from the beginning of December until the end of March. Further analyses of the temperature field at 50 hPa indicate large areas below 195 K. This result agrees with the analyses by Lawrence et al. (2020) based on MERRA-2 and by Wohltmann et al. (2020) based on ERA5. As indicated in Fig. 7 (dotted magenta line), the maximum daily mean area of temperatures below 195 K is 13 × 1012 m2, found at the end of January. At the end of March, the daily cumulative area below 195 K, i.e., the sum of the daily areas below 195 K up to the respective date, results in about 920 × 1012 m2. This led to conditions allowing for the formation of NAT-PSCs at 50 hPa for about 3.5 months (see Figs. 6 and 7). Our results are supported by Lawrence et al. (2020) and Wohltmann et al. (2020), who among others analyzed the volume of PSCs (see also Manney et al., 2020). When the sun rises in spring, sunlight delivers the energy required for starting a chemical depletion process of ozone (e.g., Solomon, 1999). In spring 2020 record low Arctic TOC values below 220 DU developed within the boundaries of the strong polar vortex for 8 continuous days from 12 to 19 March (see Fig. 1 and also the magenta line in Fig. 8). A region of significantly reduced TOC values inside the polar vortex was observed over the polar cap from the beginning of March until early April 2020 (Fig. 1).
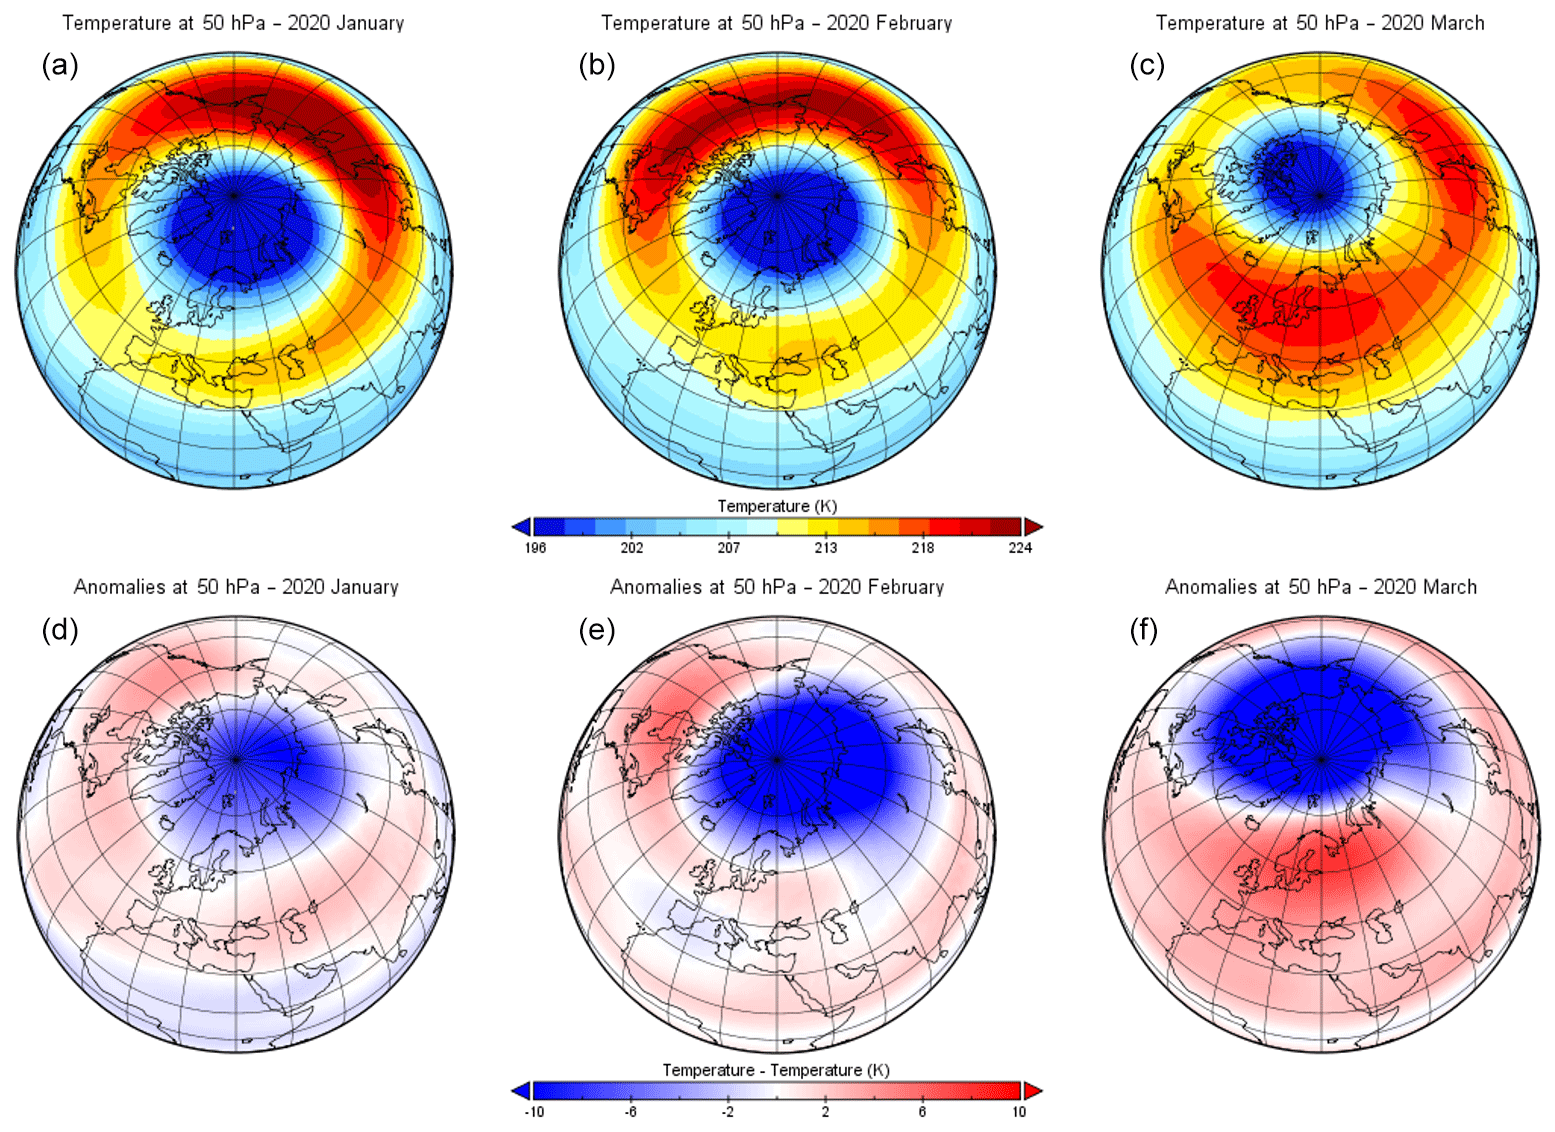
Figure 5ERA5 monthly mean temperature at 50 hPa (about 20 km altitude) for January to March (columns 1 to 3) for year 2020 (a–c) and the corresponding temperature anomalies (d–f) with respect to the average from 1979–2019, showing negative differences of up to −9.93 K in January, −18.44 K in February, and −23.83 K in March 2020.
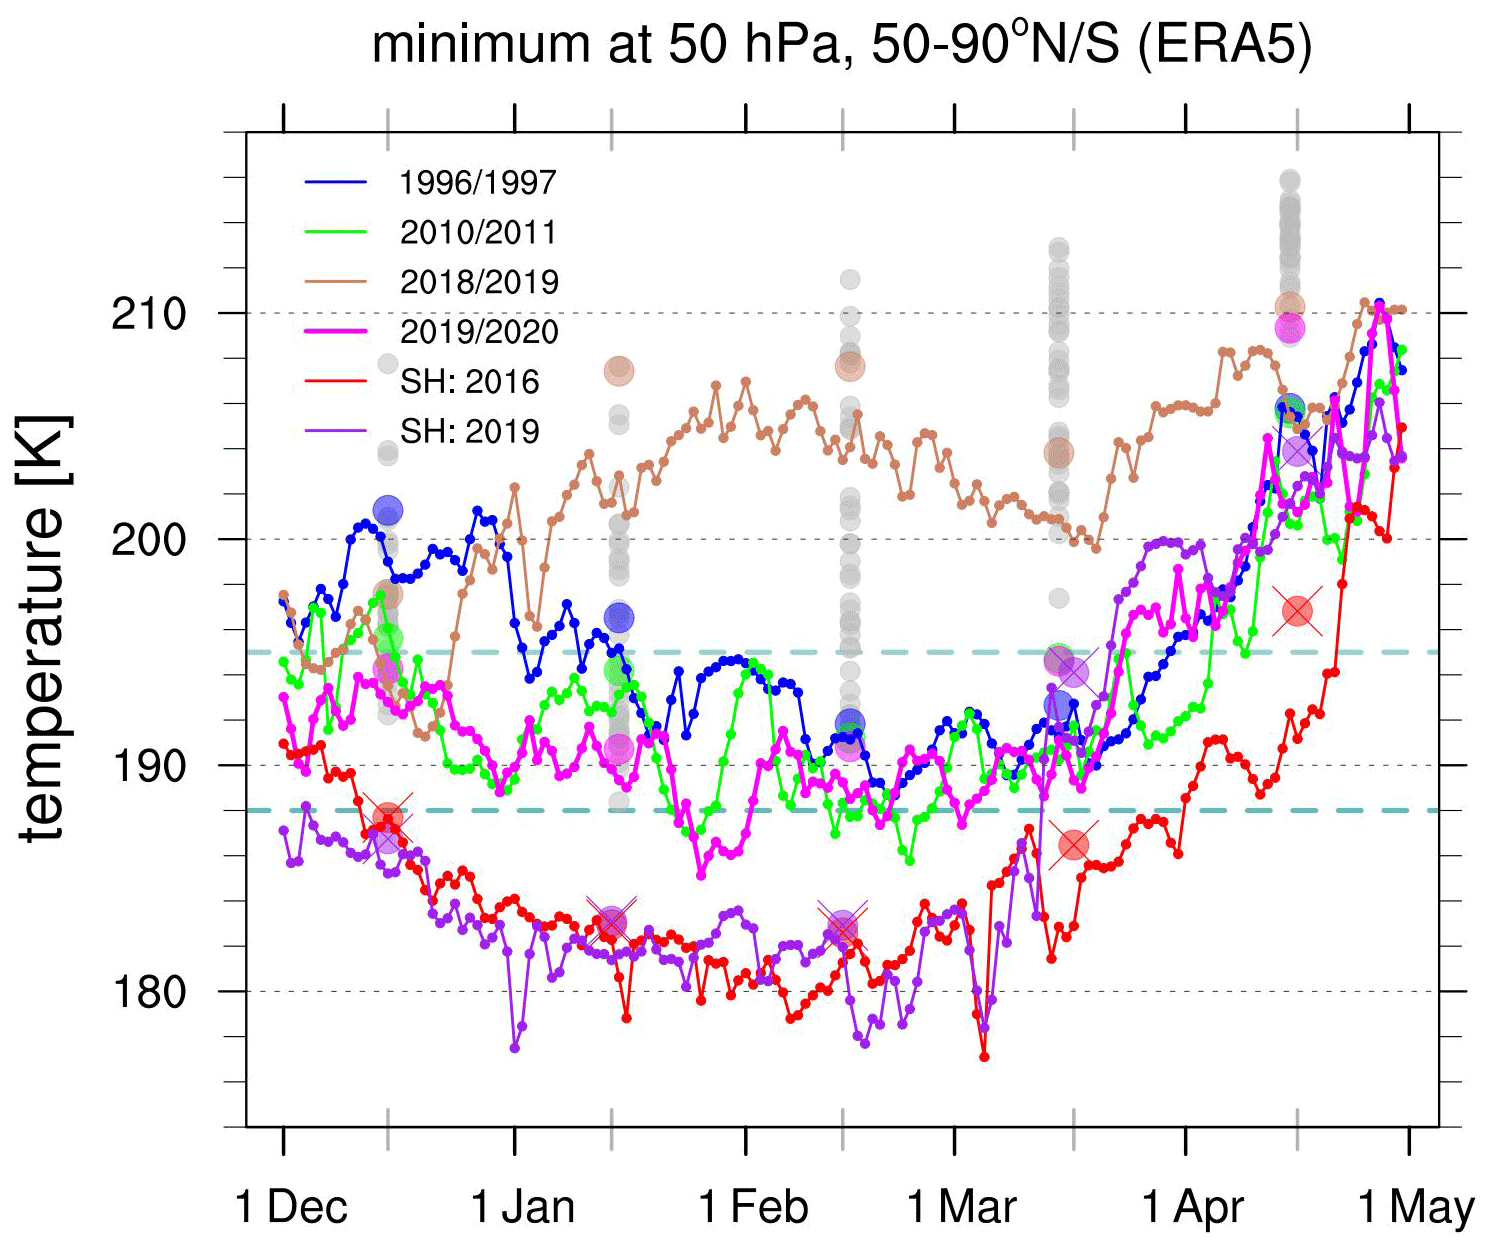
Figure 6Minimum values of daily (lines) and of monthly (dots; in the center of each month) mean temperatures (in K) at 50 hPa (about 20 km altitude): the Northern Hemisphere winters 1996/1997, 2010/2011, 2018/2019, and 2019/2020 for 50–90∘ N from 1 December to 30 April based on ERA5 data are displayed by blue, green, brown, and magenta (lines and dots); the Southern Hemisphere winters 2016 and 2019 for 50–90∘ N from 1 June to 1 November based on ERA5 data are displayed in red and purple (lines and dots with crosses). The Southern Hemisphere data are shifted by 6 months. Additionally, the minima of the monthly mean temperature data for the Northern Hemisphere winters from 1979/1980 to 2019/2020 are shown as grey dots in the center of each month. For simplicity, the leap day in 2020 (29 February) was neglected in the daily time series. The dashed dark green horizontal lines at 195 and 188 K mark the thresholds for the formation of NAT-PSCs and ice PSCs, respectively (see text).
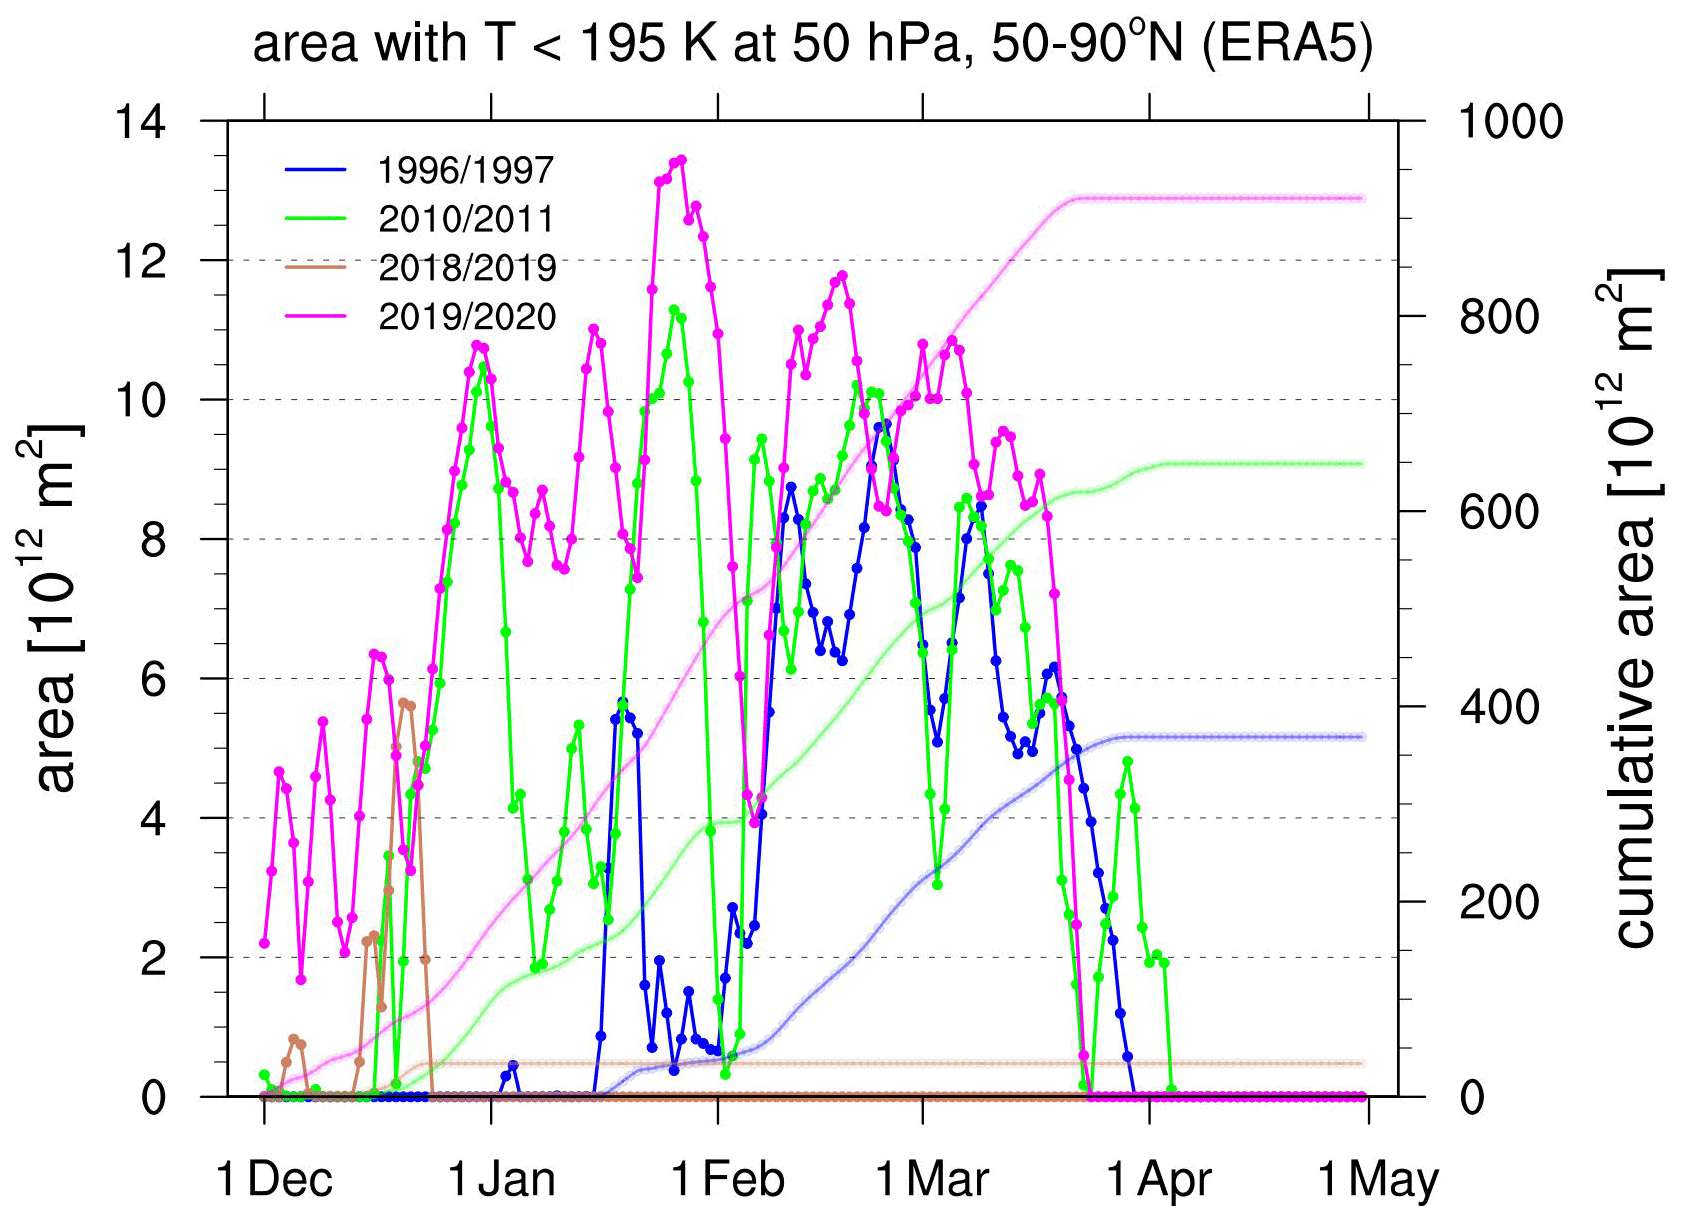
Figure 7Daily area (in 1012 m2) with temperature less than 195 K at 50 hPa (about 20 km altitude) in the region 50–90∘ N from 1 December to 30 April based on ERA5 data (solid lines). Daily cumulative values are indicated as faint lines. The Northern Hemisphere winters 1996/1997, 2010/2011, 2018/2019, and 2019/2020 are displayed by blue, green, brown, and magenta lines, respectively. For simplicity, the leap day in 2020 (29 February) was neglected in the daily time series.
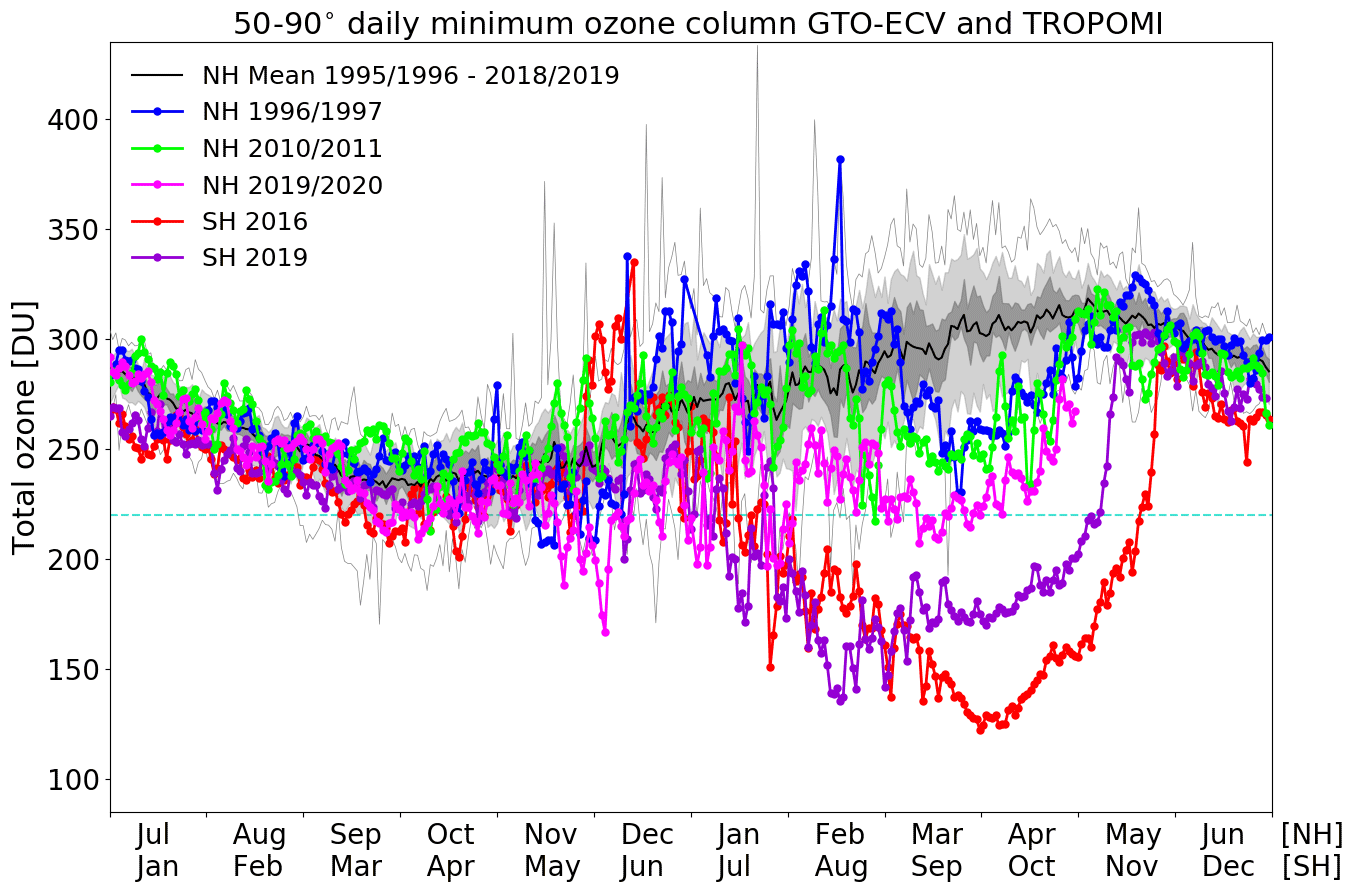
Figure 8Annual cycle of the minimum total column ozone values (in Dobson Units, DU) in the north polar region between 50 and 90∘ N and in the south polar region between 50 and 90∘ S derived from the European satellite data record GOME-type Total Ozone Essential Climate Variable (GTO-ECV) from July 1995 to June 2019 and TROPOMI data from July 2019 to April 2020. The thick black line shows the GTO-ECV mean annual cycle in the north polar region, with the lowest ozone values in the fall season (October, November) and the highest ozone values in late spring (April, May). The thin black lines indicate the maximum and minimum values for the complete time period of satellite measurements starting in 1995. The light grey shading denotes the 10th percentile and the 90th percentile, and the dark grey shading denotes the 30th percentile and the 70th percentile, respectively. The magenta line shows the minimum values for the TROPOMI total ozone in the 2019/2020 season. The blue and green lines show the minimum values for the total ozone in the years 1996/1997 and 2010/2011, respectively. For comparison, the annual cycle of the minimum total column ozone values in the south polar region is shown in the years 2016 (red line) and 2019 (purple line). The Southern Hemisphere data are shifted by 6 months.
In Figs. 3 and 6, corresponding values of mean zonal winds and minimum polar cap temperatures over the Antarctic are shown. In particular, a typical, undisturbed SH situation in 2016 (red lines) and the situation in 2019 (purple lines) with a dynamically disturbed spring season are presented. It becomes evident that in winter the zonal mean zonal winds (at 60∘ S, 10 hPa) are stronger (by about 30 m s−1), and the minimum temperatures (polar cap, 50 hPa) are much lower (about 10 K) than in the Arctic (see also Wargan et al., 2020).
The temporal evolution of minimum TROPOMI TOC values north of 50∘ N from July 2019 until April 2020 is presented in Fig. 8 (magenta line) and compared with historical values from the GTO-ECV data record (see Sect. 2 for details). In winter 2019/2020 ozone values were slightly below mean conditions most of the time until the end of February with respect to mean minimum TOC values (Fig. 8; magenta line vs. thick black line). There were however several short-term deviations towards even lower TOC, during so-called ozone mini-hole events (e.g., Millán and Manney, 2017, and references therein). The most noteworthy examples occurred in early December 2019 (3 and 4 December), the beginning of January 2020 (4–8 January), and the end of January (25–27 January). Ozone mini-holes are synoptic-scale features (with a high-pressure system in the troposphere below the stratospheric polar vortex, i.e., a low-pressure area) with significantly reduced TOC values. It is well understood that ozone mini-holes primarily result from dynamical processes (e.g., Millán and Manney, 2017). The positions of the mini-holes correlate well with minima of potential vorticity near the tropopause (Peters et al., 1995; James and Peters, 2002). Hoinka et al. (1996) found that about 50 % of short-term TOC fluctuations in the NH can be explained by variations of the tropopause pressure (see also Manney et al., 2011). Furthermore, Steinbrecht et al. (1998) showed that an increase of tropopause height by 1 km is connected with a reduction of TOC by 16 DU. Figure 8 illustrates that such mini-hole events occur regularly (the lower light grey line) during NH winter. The ozone mini-holes very commonly develop in the North Atlantic region and then often drift eastward towards northern Europe within a few days (James, 1998). This was also the case for the three examples seen in winter 2019/2020, with minimum TOC found over northern Europe (not shown). Since the polar vortex already existed in late November and early December 2019 (Lawrence et al., 2020) with lower than usual TOC, the ozone mini-hole, for instance on 3 and 4 December, showed very low TOC values (170 DU; Fig. 8) at 65∘ N, northeast of United Kingdom and west of Scandinavia.
Because the polar vortex was persistent and strong since the beginning of the Arctic winter 2019/2020, reduced TOC values inside the polar vortex and higher TOC values outside were observed from January 2020 onwards but with TOC values clearly above 220 DU inside the vortex. As indicated in Fig. 4, the polar vortex with persistent strong zonal winds and strong PV gradients (see Fig. 2) prevented the meridional transport of ozone-rich air from lower latitudes towards the NH polar region. Lawrence et al. (2020) showed that the undisturbed polar vortex acted as a strong transport barrier. This is, among others, indicated by ozonesonde and ground-based measurements at different NH stations, with lower TOC values in the inner part of the polar vortex and higher TOC values outside. Respective ozone data are available at http://www.temis.nl/uvradiation/UVarchive/stations_uv.html (last access: 13 January 2021; van Geffen et al., 2017) and also available at https://woudc.org/data/explore.php (last access: 13 January 2021) and at https://www.ndacc.org (last access: 13 January 2021; see also Wohltmann et al., 2020 and Bernhard et al., 2020). After mid-February, low TOC values inside the polar vortex can be identified also in the TROPOMI data (not shown), which is indicated by a strong horizontal ozone gradient in the vicinity of the polar jet with the strongest zonal winds.
Remarkable deviations from normal Arctic conditions were found starting in early March 2020 until early April, when low TOC values in the north polar region were detected (magenta line in Fig. 8): the long period of unusually low TOC started in early March 2020, falling below 220 DU for the first time on 2 March, and continued with similarly low TOC – including a period of 8 consecutive days with minimum TOCs below 220 DU – until 7 April. For the first time TOC values near or below 220 DU unrelated to ozone mini-hole events were observed for a period of about 5 weeks, corresponding to new record low values for this time of the year. The maximum area with TOC below 220 DU was 0.9 million km2 ( m2) on 12 March (Fig. 1). For 12 March, the size of the polar vortex is 21.75 million km2 (Fig. 2). This is in the order of 4 % of the polar vortex area at the 475 K isentropic surface inside the 36 PV unit contour (Wohltmann et al., 2020). In comparison with corresponding values of a typical ozone hole in the Antarctic (here 2016; Fig. 8, red line; Fig. 9d) the area of low TOC (below 220 DU) is much smaller, and the minimum TOC is clearly higher. The Antarctic ozone hole in spring 2016 showed minimum TOC clearly below 150 DU, and TOC values below 220 DU were found for a period of about 4 months. The maximum area of the ozone hole was in the order of 20 million km2 (Fig. 9d). Even the maximum area of record low TOC values (below 220 DU), detected in the Arctic in spring 2020 (Fig. 9a), is just about 10 % of the exceptionally small Antarctic ozone hole observed in SH spring 2019; see Wargan et al. (2020), who reported an ozone hole area of roughly 5–10 million km2 during September and October 2019 (see also Fig. 9e).
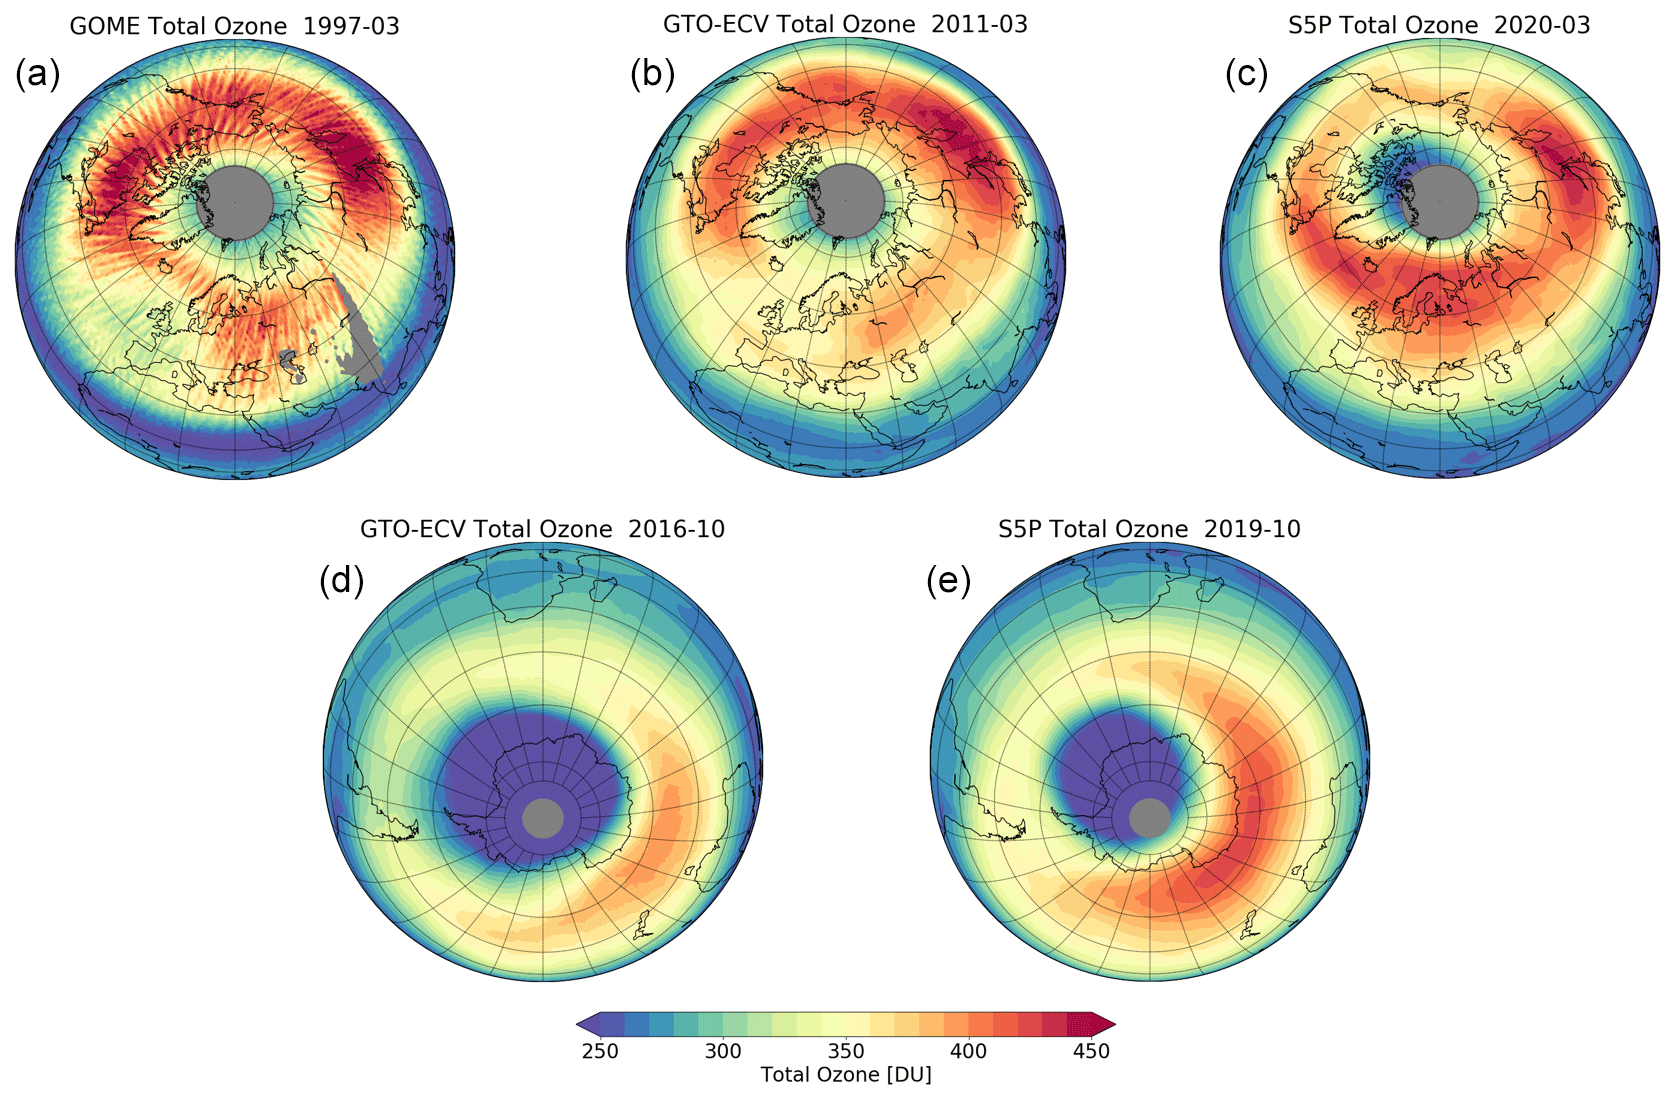
Figure 9Monthly mean total ozone columns over the Northern Hemisphere in March 1997 (a), 2011 (b), and 2020 (c) and the Southern Hemisphere in October 2016 (d) and 2019 (e). The plot for March 1997 is based on GOME/ERS-2 data with a limited spatial sampling, which induces the orbit structures on the monthly mean values; the plots from 2011 and 2016 are based on GTO-ECV; and the plots from 2019 and 2020 are based on TROPOMI/S5P. Grey areas near the poles indicate missing data during polar night.
There are two other prominent spring seasons in the NH, which showed similarly strong and cold stratospheric polar vortices. In particular, comparable dynamical conditions in the NH stratosphere were observed in February and March 1997 (e.g., Coy et al., 1997; Manney et al., 1997; Lefèvre et al., 1998; Hansen and Chipperfield, 1999) and 2011 (e.g., Manney et al., 2011; Sinnhuber et al., 2011; Kuttippurath et al., 2012; Hommel et al., 2014). We note that the characteristics of the polar vortex – which in turn have direct or indirect consequences for the TOC, either by chemical ozone depletion or (meridional) transport of air masses – vary in different NH winters (e.g., Petzoldt, 1999; Tegtmeier et al., 2008; see also Manney et al., 2011).
In Fig. 3 the temporal evolution of the two stratospheric polar vortices in the NH in 1996/1997 (blue line) and 2010/2011 (green line) is indicated by the zonal mean zonal wind speed at 60∘ N, 10 hPa. In comparison with the dynamical situation in January, February, and March 2020 (magenta line in Fig. 3), the respective time periods in 1997 and 2011 also showed a persistent polar vortex with high zonal wind speeds, which reached values of up to more than 50 m s−1. These values are higher than the long-term mean values, which show an increase up to 40 m s−1 until the beginning of January and a decrease thereafter (see also Fig. 1 in Lee and Butler, 2020). While the temporal evolution of the dynamical situation in Arctic spring 2011 was very similar to that of 2020 with a persistent polar vortex and high zonal wind speeds until mid-March, the period of strong zonal winds in 1997 continued until April. The polar vortex in December 1996 was weak, and therefore polar temperatures were relatively high (higher than 195 K; see next paragraph). The evolution of the winter vortices in December 2010 and 2019 is similar, reaching zonal wind speeds of about 40 m s−1 in mid-December. Similar values were shown by Lawrence et al. (2020), who looked at MERRA-2 data. In this context, Manney et al. (2011) showed that in 2011 the meridional transport was weak at the edge of the polar vortex (i.e., a strong barrier) throughout the winter. Less ozone was transported from lower latitudes to higher latitudes. The meridional transport was enhanced in 1997 because the polar vortex was weaker in December and January (Manney et al., 2011).
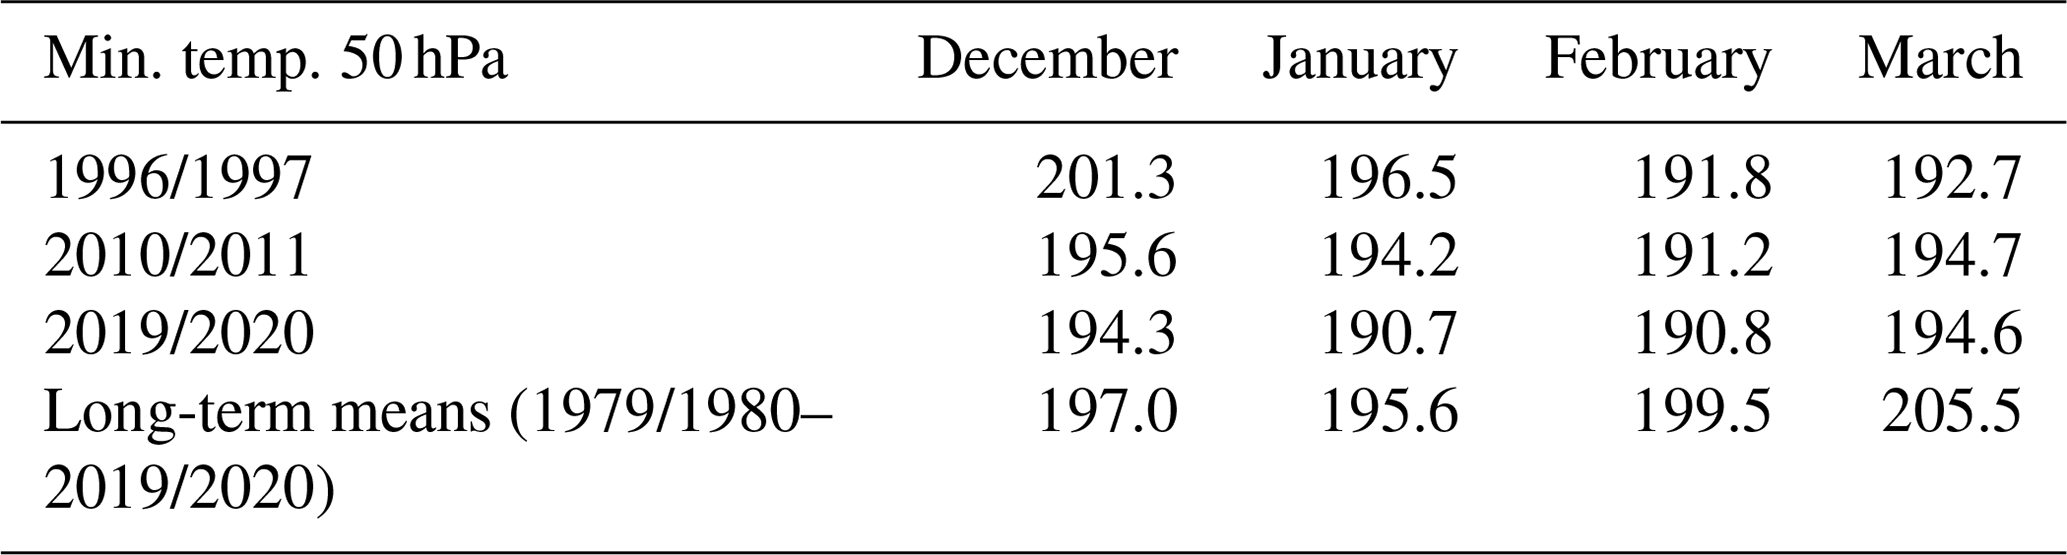
In all 3 years, February and March dynamical conditions led to low stratospheric temperatures in the polar cap region (50–90∘ N). The temporal evolution of the observed daily minimum temperatures at 50 hPa is shown in Fig. 6. The minimum temperatures were below the threshold temperature for the formation of NAT-PSCs (195 K) in February and March of all 3 years. Minimum temperatures at 50 hPa in December 2019 and January 2020 most of the time were slightly lower than the minimum temperatures in December/January 2010/2011. In turn, the minimum temperatures in December/January are clearly higher in 1996/1997 than in 2010/2011 and 2019/2020. The minimum values of the monthly mean temperatures are given in Table 1, indicating low temperatures in December 2019 and January and February 2020 (see also the colored dots in Fig. 6).
Table 1Minimum temperatures (in kelvin) of the polar cap region (50–90∘ N) at 50 hPa (about 20 km altitude) based on the monthly mean temperatures from ERA5 in December, January, February, and March of 1996/1997, 2010/2011, and 2019/2020 and the long-term mean values (1979/1980–2019/2020), respectively.
A series of studies published in the past highlight the differences of the two winters 1996/1997 and 2010/2011, in particular regarding polar chemical processes (e.g., Manney et al., 2011; Kuttippurath et al., 2012; Chap. 3 in WMO, 2014). Severe chemical ozone loss was observed in spring 2011 (Manney et al., 2011). In spring 1997 the chemical ozone loss was only moderate (Manney et al., 1997; Tegtmeier et al., 2008). The most important reason according to these studies was the late development of the polar vortex and late drop of temperatures below PSC thresholds in winter 1996/1997 (see also Table 1 and Figs. 6 and 7). Recent studies found that the maximum ozone loss in spring 2020 was similar to that of spring 2011 (e.g., Manney et al., 2020; Wohltmann et al., 2020; Grooß and Müller, 2020). These papers also found that TOC values were lower in 2020 because chemical loss started earlier and because of less horizontal mixing due to a permanent strong vortex.
As demonstrated in Fig. 7, the daily areas with temperatures below 195 K at the 50 hPa pressure level are obviously larger in 2019/2020 (magenta line) than in 1996/1997 (blue line) and 2010/2011 (green line). In particular, the cumulative areas with temperatures below 195 K at 50 hPa are markedly different: whereas in 2019/2020 the cumulative area was about 920 × 1012 m2, in 1996/1997 it was about 370 × 1012 m2, and in 2010/2011 it was about 650 × 1012 m2. Furthermore, in the last week of January 2020 the temperatures at 50 hPa went below 188 K (magenta line in Fig. 6), the typical ice PSC threshold (PSC type 2, ice PSCs; see, for instance, Fig. 4-1 of Chap. 4 in WMO, 2018). The maximum daily area with temperatures below 188 K at 50 hPa was 2.8 × 10¹² m2 on 30 January, and the cumulative area with temperatures below 188 K at 50 hPa reached its maximum of 18 × 1012 m2 on 2 March 2020. While the threshold for ice PSCs was not reached in 1996/1997, in 2010/2011 the cumulative area with temperatures below 188 K at 50 hPa was estimated to be 4.3 × 10¹² m2.
To summarize, in all 3 years the temperatures in the lower stratosphere in February and March were in a similar range, showing colder conditions than usual. December 2019 and January 2020 were also clearly colder than the long-term mean conditions (Table 1). Winter 2019/2020 showed a larger area below the formation temperature of PSCs than the other two NH winters for an extended period of time (see Fig. 7). Permanent presence of PSCs over about 4 months enabled efficient chlorine activation. Additionally, PSCs supported strong denitrification of the lower stratosphere by irreversible removal of total reactive nitrogen (NOy), in particular HNO3, by uptake of NOy on the surface of PSCs, followed by sedimentation of PSC particles (Fahey et al., 1990). This ultimately enabled a period of chemical ozone depletion that was longer than usual (e.g., Fahey et al., 1990; Rex et al., 1999; Pommereau et al., 2018). Manney et al. (2020) analyzed the data of the spaceborne Microwave Limb Sounder (MLS) instrument, indicating that denitrification was stronger in 2020 than in 2011. Further, in Manney et al. (2011) it was shown that denitrification was clearly stronger in 2011 than in 1997.
The seasonal evolution of minimum TOC values north of 50∘ N between July 1996 and June 1997 (blue line in Fig. 8) and between July 2010 and June 2011 (green line in Fig. 8) indicates normal or slightly enhanced ozone values until February with respect to the long-term mean value (thick black line in Fig. 8). The long-term mean value is based on satellite observations from 1995 to 2019. Typical features of a strong polar vortex can be observed in February 1997 and February 2011, with low TOC values in the polar vortex and relatively high TOC values in the collar region of the polar vortex (not shown). Around the beginning of March 1997 and March 2011 the TOC values declined, and low TOC values were detected in both years until early April. In spring 1997 the dynamical conditions led to frequent ozone mini-holes (Coy et al., 1997) and to a higher tropopause that obviously contributed to lower TOC values via dynamical processes (Manney et al., 2011).
Figure 9a–c show the TOC monthly means for March 1997, 2011, and 2020. Low TOC values over the polar cap can be seen in all three cases. The lowest Arctic TOC values are detected in boreal spring 2020. In spring 1997 and 2011 TOC values below 220 DU were not detected over larger areas and over several consecutive days. The monthly mean minimum TOC value for March 2020, which is 221 DU, is much lower compared to the monthly mean minimum TOCs for March 1997 (267 DU) and for March 2011 (252 DU). The temporal evolution of minimum Antarctic TOC values south of 50∘ S (the red and purple line in Fig. 8 for 2016 and 2019, respectively) and the TOC monthly means for October 2016 and 2019 (Fig. 9d and e) show that the size and strength of the Antarctic ozone hole are much larger than the corresponding values detected for the Arctic in spring 2020.
In recent decades, Arctic and Antarctic winter and early spring TOC variability reflects in large parts the natural fluctuations of the stratospheric dynamics of the respective hemispheres (e.g., Chap. 4 in WMO, 2018). In particular, dynamical conditions of the NH stratosphere at higher latitudes in winter can range from a very disturbed polar vortex (i.e., by strong planetary wave activity), which could lead to high stratospheric temperatures, to conditions with a persistent strong polar vortex (i.e., by low planetary wave activity), which could create low stratospheric temperatures (e.g., Chap. 4 in WMO, 2018).
The NH winter season of 2019/2020 presented a situation with significantly suppressed meridional air mass exchange and transport into the polar vortex area in combination with enhanced ozone depletion by heterogeneous chemical processes inside the polar vortex (Manney et al., 2020), which causes a clear reduction of TOC. Winter 2019/2020 shows an extraordinary dynamical situation, with an unusual persistent strong and cold polar vortex over the season compared to the last 4 decades (the period of the ERA5 data set used in this study). There is some evidence that a similar dynamical event did not occur in the period from 1955 to 1980, i.e., before the starting point of our analyses based on ERA5. An analysis of historical data was provided by the Stratospheric Research Group at FU Berlin. In Labitzke and Naujokat (2000) it was stated that “the spring of 1997 was the coldest within our series of 45 winters”; the Berlin time series ranges from 1955 to 2000. Among others, they compared the monthly mean North Pole temperatures at 30 hPa in all years and found that February 1997 (190 K) and March 1997 (194 K) were clearly colder than all other years. The second coldest spring was detected in 1967 (February: 195 K; March: 201 K). Temperatures in January 1997 were near the climatological mean value. This suggests that the dynamical situation of winter and spring 2019/2020 has stood out since the beginning of the monitoring of the stratosphere in the 1950s. Although the historical Berlin data set does not have the same quality as ERA5, it is suitable for a qualitative evaluation of the respective dynamical situations of NH winter and spring seasons. Lawrence et al. (2020) looked at the Japanese Meteorological Agency's 55-year reanalysis (JRA-55), which goes back to winter 1958/1959. Based on the zonal mean zonal wind at 60∘ N, 10 hPa, they found that winter 2019/2020 ranked third. The two winters of 1966/1967 and 1975/1976 (which are indicated as moderate cold winters in the Berlin analysis) were the strongest on record with respect to the zonal mean wind (mean from December to March). The slightly different order regarding record years indicates that the results depend on the considered meteorological variable as well as the altitude and latitude region. It is clear that the data before 1980 (pre-satellite era) are more uncertain. Nevertheless, it is obvious that winter 2019/2020 was one of the coldest winters in the last 65 years and that it showed an exceptionally persistent strong polar vortex.
The stratospheric dynamical conditions were completely different in the NH winter 2018/2019 (brown line in Fig. 3) compared to 2019/2020 (magenta line in Fig. 3). In NH winter 2018/2019 a sudden major stratospheric warming event began in late December 2018. This strong disturbance of the polar vortex by planetary waves led to a pronounced warming of the lower stratosphere (e.g., Lee and Butler, 2020), indicating minimum temperatures in the polar cap region at 50 hPa, which were clearly above the threshold for the formation of NAT-PSCs (195 K) for the complete winter season (brown line in Fig. 6). Consequently, TOC values similar to the long-term mean in the Arctic region were found from late winter to early spring (not shown).
The SH spring seasons of 2002 and 2019 provide two additional examples of the importance of stratospheric dynamics in the development of low TOC values. In September 2002 a sudden major stratospheric warming in connection with a breakdown of the polar vortex was detected, which led to a split of the ozone hole (Sinnhuber et al., 2003; Allen et al., 2003; Hoppel et al., 2003; Stolarski et al., 2005). In September 2019 the polar vortex was also significantly disturbed (Wargan et al., 2020; Lim et al., 2020; see purple lines in Figs. 3 and 6). The minimum TOC values in the Antarctic were noticeably higher in 2019 than in previous years (Wargan et al., 2020; see the purple line in Fig. 8). Nevertheless, it is obvious that the small ozone hole in Antarctic spring 2019 is still much larger than the area with record low TOC values detected in Arctic spring 2020 (see also Fig. 9).
The Arctic observations in winter and spring 2019/2020 are consistent with our expectation that Arctic ozone reductions in spring are largest after stratospheric winters with a strong, circular polar vortex in connection with low polar lower stratospheric temperatures (Chap. 4 in WMO, 2018). However, as can be seen in Fig. 6, the temperatures in the Antarctic are considerably lower than in the Arctic (even for 2019/2020), and the period of low temperatures is much longer in the Antarctic. As a result, the record low Arctic TOC values are much higher than the TOC values observed in the Antarctic. This is also the case for the small ozone hole in Antarctic spring 2019, as indicated in Fig. 8.
The dynamical conditions in the Arctic stratosphere in February and March 2020 were similar to the conditions in early spring 1997 and 2011. All 3 years showed low TOCs in March (Fig. 8). Minimum TOC values were below 220 DU for several days in March 2020, which was not the case for March 1997 nor 2011, although the stratospheric chlorine content was higher in 1997 (about 15 %) and slightly higher in 2011 (Chap. 1 in WMO, 2018). Especially in December 2019 and January 2020 the area of temperatures below 195 K in the lower stratosphere was larger than in the two other years discussed here (see Fig. 7). In 2019/2020 the minimum polar cap temperatures at 50 hPa were below 195 K (the threshold for formation of NAT-PSCs) in December, January, February, and the beginning of March (Fig. 6). In this context, Manney et al. (2020) identified an activation of chlorine already in the beginning of December. The daily areas allowing for the formation of PSCs at 50 hPa were clearly larger in 2019/2020 in comparison with the winters 1996/1997 and 2010/2011. This finding is in line with the results presented by Lawrence et al. (2020). The ERA5 data set also indicates minimum temperature values in winter 2019/2020, which were slightly above or below 188 K for a week (in particular at the end of January 2020), providing conditions for the formation of ice PSCs (see also Manney et al., 2020).
The observed minimum TOC values in March 2020, with new low TOC records for the NH polar cap, are related to substantial ozone depletion in spring (Manney et al., 2020; Wohltmann et al., 2020). Since the polar vortex in winter and spring 2019/2020 provided continuous conditions for the formation of PSCs, significant denitrification of the stratosphere occurred (Manney et al., 2020). This contributed to the 5-week period of significant TOC reduction by an extended phase of active stratospheric chlorine (Manney et al., 2011). Here, we note again that 2020 also started with lower base values of TOC (inside the polar vortex; see Fig. 8), which might have been caused by a reduced meridional transport of ozone from lower to higher latitudes due to the strong polar vortex during this winter. This might have also contributed to the fact that the spring TOC values in the Arctic region in 2020 were clearly lower than those found in 1997 and 2011.
Record low stratospheric ozone values over the Arctic in 2020 are not an unequivocal result of climate change. The dynamical situations in February and March of 1997, 2011, and 2020 were similar. The cold stratosphere in December 2019 and January 2020 as a single event does not point towards climate change due to increasing greenhouse gas concentrations. The NH winter 2019/2020 is a perfect showcase for a NH winter with low planetary wave activity and for a persistent strong vortex with low temperatures. This could be a sign of climate change if similar conditions were to occur more regularly in the next years. Although the stratosphere is cooling due to increasing greenhouse gas concentrations (Maycock et al., 2018; Steiner et al., 2020), consequences for stratospheric dynamics, particularly in winter and ozone depletion in spring, are still under debate (e.g., Bednarz et al., 2016; Ivy et al., 2016; Pommereau et al., 2018). For instance, the empirical quantification of the relation between winter–spring loss of Arctic ozone and changes in stratospheric climate by Rex et al. (2004) showed that cold (NH) winters may possibly get colder in the future. The investigations by Wohltmann et al. (2020) seem to support this hypothesis. It is possible that the cooling of the (lower) stratosphere could delay the recovery of the ozone layer (Pommereau et al., 2018). However, this statement is in contradiction with results derived from chemistry–climate model predictions (e.g., Dhomse et al., 2018), indicating that climate change in the NH will accelerate stratospheric ozone recovery instead of delaying it (see also Chaps. 3 and 4 in WMO, 2018). Since the changes of stratospheric temperature are affected not only by radiative cooling due to enhanced greenhouse gas concentrations, but also by atmospheric circulation changes (e.g., Langematz et al., 2014), the quantitative determination of the net effect on ozone still remains a challenge. Furthermore, model calculations by Waibel et al. (1999) more than 20 years ago showed that higher degrees of Arctic denitrification in future, related to stratospheric cooling by enhanced greenhouse gas concentrations, could lead to larger seasonal ozone depletion despite the projected decline in inorganic chlorine.
Finally, based on our current knowledge, we deem it unlikely that the observed enhanced CFC-11 emissions in recent years (Montzka et al., 2018) have significantly influenced the strength of ozone depletion in the NH in 2020 (Dameris et al., 2019; Fleming et al., 2020; Keeble et al., 2020).
This study presents a description of the NH winter and spring season 2019/2020 and considers the dynamical situation of the stratosphere and the evolution of the ozone layer in the Arctic region. Record low TOC values around 220 DU were detected over a large area (up to 0.9 million km2) as well as for an extended time period (of about 5 weeks). The situation in 2019/2020 is compared with other years which showed similar stratospheric dynamics in spring. We have used recent meteorological data from ERA5 and TOC data from GTO-ECV (based on the satellite sensors GOME/ERS-2, SCIAMACHY/ENVISAT, OMI/Aura, and GOME-2/MetOp) in combination with recent TOC data from TROPOMI (on board Sentinel-5P). The detected Arctic area of record low TOC values is much smaller in comparison with a typical Antarctic ozone hole, which is of the order of about 20 to 25 million km2 from early September until mid-October and shows TOC values below 220 DU for up to about 4 months (WMO, 2018). The Arctic TOC observations in spring 2020 were extraordinary because TOC values below 220 DU were not observed in previous years over a period of 5 weeks in the Arctic. The persistent strong polar vortex in 2019/2020 (from mid-December to early April) led to particularly cold stratospheric conditions throughout the complete winter and early spring season, which likely supported enhanced ozone depletion compared to other years (Manney et al., 2020; Wohltmann et al., 2020). The special dynamical situation in winter 2019/2020 is the cause for the significant reduction of the TOC in spring 2020.
We note that numerous studies of the 2019/2020 winter season can be found in a special issue of Geophysical Research Letters and Journal of Geophysical Research: Atmospheres (e.g., Manney et al., 2020; Wohltmann et al., 2020; Lawrence et al., 2020; Grooß and Müller, 2020; Inness et al., 2020; Bernhard et al., 2020), which are based on observational, reanalysis, and modeling data. Our results agree with these published studies about the Arctic winter season 2019/2020.
If the regulations of the Montreal Protocol regarding the prohibition of CFCs are strictly implemented, one can expect a full recovery of the ozone layer including the polar regions by the middle of this century (Chaps. 3 and 4 in WMO, 2018). In recent years, the beginning of ozone recovery has already been detected (e.g., Solomon et al., 2016; Weber et al., 2018). However, in winters with a cold and strong polar stratospheric vortex, a persistent region of low TOC might also develop again in the NH in the future. The recovery of the ozone layer and its interactions with climate change must be watched carefully, as discussed for instance by Dameris and Loyola (2011). Continued monitoring of stratospheric ozone with a suite of instruments will be key to understand the future development of Arctic ozone. This capability is crucial to allow for an evaluation of specific events in the light of the Montreal Protocol.
Meteorological data are based on ERA5 from ECMWF (https://cds.climate.copernicus.eu//#!/search?text=ERA5&type=dataset, last access: 1 October 2020; Copernicus Climate Change Service, 2017), which is available at the Climate Data Store (CDS). This work contains modified Copernicus Climate Change Service information (Copernicus Climate Change Service (C3S), 2017; Hersbach et al., 2018, 2019a). Neither the European Commission nor ECMWF is responsible for any use that may be made of the Copernicus information or data it contains. In particular, subsets, i.e., wind and temperature data, from the pressure level data sets of monthly averaged data (Hersbach et al., 2019a) and hourly reanalysis data (Hersbach et al., 2018) have been used. Daily mean data are produced using hourly data on pressure levels and using CDO (Climate Data Operators; https://doi.org/10.5281/zenodo.2558193; Schulzweida, 2019) command “daymean” to produce daily means from the hourly data. Analogously, hourly PV data on isentropes from the full ERA5 data set (Copernicus Climate Change Service (C3S), 2017) have been exploited and regridded to a regular grid using CDO. We thank the ECMWF for producing ERA5 data and making them available through the CDS. The data used contain modified Copernicus Climate Change Service information, in particular with respect to Figs. 2–7 and Table 1. Please note that the data used here may also contain “preliminary” ERA-5 data (see Hersbach et al., 2020).
The GTO-ECV Climate Research Data Package is available at http://cci.esa.int/ozone/ (last access: 13 January 2021; ESA, 2021); detailed information about this data record can be found at https://doi.org/10.5194/amt-8-3923-2015 (Coldewey-Egbers et al., 2015). This data source is used here, in particular with respect to the preparation of Figs. 8 and 9.
The (Level 2) TROPOMI total ozone column data (TROPOMI OFFL TOC; Copernicus Sentinel-5P, 2018) are freely available at https://doi.org/10.5270/S5P-fqouvyz (see also https://s5phub.copernicus.eu/, last access: 18 May 2020; https://s5pexp.copernicus.eu/, last access: 18 May 2020). This paper contains modified Copernicus Sentinel-5 Precursor data processed by DLR/BIRA/ESA. These data are used here, in particular with respect to Figs. 1, 8, and 9.
MD structured and composed the paper. MD, DGL, MCE, and MN jointly analyzed the different data sets and compiled the results, including the preparation of the figures. MD, DGL, MCE, and MN contributed to the writing of the paper. MCE, DGL, CL, and MvR generated the GTO-ECV data in the ESA project Ozone_cci+ and the EU/ECMWF project C3S_312b. CL, FR, DGL, and MvR are responsible for the TROPOMI TOC Level 2 data in the ESA project S5P-MPC.
The authors declare that they have no conflict of interest.
First, we would like to thank Birgit Hassler for an internal review of the first draft of the paper. We would like to thank the three referees for their helpful comments and suggestions. In particular we appreciate the personal commitment of Gloria Manney and Ingo Wohltmann, which helped to improve the paper. The NCAR Command Language (NCL, 2018) was used for data analysis and to create some of the figures in this study. NCL is developed by UCAR/NCAR/CISL/TDD and is available online at https://doi.org/10.5065/D6WD3XH5 (NCL, 2018). CDO (Climate Data Operators; Schulzweida, 2019) was employed for processing the data.
The work for this study was supported under the umbrella of the DLR-project MABAK (Innovative Methoden zur Analyse und Bewertung von Veränderungen der Atmosphäre und des Klimasystems). The work described in this paper has also received funding from the ESA-projects “Ozone_cci” and “Ozone_cci+” (as part of the ESA Climate Change Initiative (CCI) program) and the Initiative and Networking Fund of the Helmholtz Association through the “Advanced Earth System Modelling Capacity (ESM)” project.
The article processing charges for this open-access
publication were covered by a Research
Centre of the Helmholtz Association.
This paper was edited by Farahnaz Khosrawi and reviewed by Ingo Wohltmann, Gloria Manney, and one anonymous referee.
Allen, D. R., Bevilacqua, R. M., Nedoluha, G., Randall, C. E., and Manney, G. L.: Unusual stratospheric transport and mixing during the 2002 Antarctic winter, Geophys. Res. Lett., 30, 1599, https://doi.org/10.1029/2003GL017117, 2003.
Bednarz, E. M., Maycock, A. C., Abraham, N. L., Braesicke, P., Dessens, O., and Pyle, J. A.: Future Arctic ozone recovery: the importance of chemistry and dynamics, Atmos. Chem. Phys., 16, 12159–12176, https://doi.org/10.5194/acp-16-12159-2016, 2016.
Bernhard, G. H., Fioletov, V. E., Grooß, J.-U., Ialongo, I., Johnsen, B., Lakkala, K., Manney, G. L., Müller, R., and Svendby, T.: Record-breaking increases in Arctic solar ultraviolet radiation caused by exceptionally large ozone depletion in 2020, Geophys. Res. Lett., 47, e2020GL090844, https://doi.org/10.1029/2020GL090844, 2020.
Coldewey-Egbers, M., Loyola, D. G., Koukouli, M., Balis, D., Lambert, J.-C., Verhoelst, T., Granville, J., van Roozendael, M., Lerot, C., Spurr, R., Frith, S. M., and Zehner, C.: The GOME-type Total Ozone Essential Climate Variable (GTO-ECV) data record from the ESA Climate Change Initiative, Atmos. Meas. Tech., 8, 3923–3940, https://doi.org/10.5194/amt-8-3923-2015, 2015.
Coldewey-Egbers, M., Loyola, D. G., Labow, G., and Frith, S. M.: Comparison of GTO-ECV and adjusted MERRA-2 total ozone columns from the last 2 decades and assessment of interannual variability, Atmos. Meas. Tech., 13, 1633–1654, https://doi.org/10.5194/amt-13-1633-2020, 2020.
Copernicus Climate Change Service (C3S): Fifth generation of ECMWF atmospheric reanalyses of the global climate, ERA5, Copernicus Climate Change Service Climate Data Store (CDS), available at: https://cds.climate.copernicus.eu//#!/search?text=ERA5&type=dataset, (last access: 1 October 2020), 2017.
Copernicus Sentinel-5P: (processed by ESA), TROPOMI Level 2 Ozone Total Column products, Version 01, European Space Agency, https://doi.org/10.5270/S5P-fqouvyz (last access: 13 January 2021), 2018.
Coy, L., Nash, E. R., and Newman, P. A.: Meteorology of the polar vortex: Spring 1997, Geophys. Res. Lett., 24, 2693–2696, https://doi.org/10.1029/97GL52832, 1997.
Dameris, M.: Climate change and atmospheric chemistry: How will the stratospheric ozone layer develop?, Angew. Chem. Int. Edit., 49, 8092–8102, https://doi.org/10.1002/anie.201001643, 2010.
Dameris M. and Loyola, D. G.: “Chemistry-Climate Connections – Interaction of Physical, Dynamical, and Chemical Processes in Earth Atmosphere”, in: Climate Change – Geophysical Foundations and Ecological Effects, edited by: Blanco, J. and Kheradmand, H., InTech, London, UK, 1–26 pp., https://doi.org/10.5772/24210, 2011.
Dameris, M., Jöckel, P., and Nützel, M.: Possible implications of enhanced chlorofluorocarbon-11 concentrations on ozone, Atmos. Chem. Phys., 19, 13759–13771, https://doi.org/10.5194/acp-19-13759-2019, 2019.
Dhomse, S. S., Kinnison, D., Chipperfield, M. P., Salawitch, R. J., Cionni, I., Hegglin, M. I., Abraham, N. L., Akiyoshi, H., Archibald, A. T., Bednarz, E. M., Bekki, S., Braesicke, P., Butchart, N., Dameris, M., Deushi, M., Frith, S., Hardiman, S. C., Hassler, B., Horowitz, L. W., Hu, R.-M., Jöckel, P., Josse, B., Kirner, O., Kremser, S., Langematz, U., Lewis, J., Marchand, M., Lin, M., Mancini, E., Marécal, V., Michou, M., Morgenstern, O., O'Connor, F. M., Oman, L., Pitari, G., Plummer, D. A., Pyle, J. A., Revell, L. E., Rozanov, E., Schofield, R., Stenke, A., Stone, K., Sudo, K., Tilmes, S., Visioni, D., Yamashita, Y., and Zeng, G.: Estimates of ozone return dates from Chemistry-Climate Model Initiative simulations, Atmos. Chem. Phys., 18, 8409–8438, https://doi.org/10.5194/acp-18-8409-2018, 2018.
ESA: The GTO-ECV Climate Research Data Package, European Space Agency, available at: http://cci.esa.int/ozone/, last access: 13 January 2021.
Fahey, D. W., Solomon, S., Kawa, S. R., Loewenstein, M., Podolske, J. R., Strahan S. E., and Chan, K. R.: A diagnostic for denitrification in the winter polar stratospheres, Nature, 345, 698–702, 1990.
Fleming, E. L., Newman, P. A., Liang, Q., and Daniel, J. S.: The impact of continuing CFC-11 emissions on stratospheric ozone, J. Geophys. Res., 125, e2019JD031849, https://doi.org/10.1029/2019JD031849, 2020.
Garane, K., Lerot, C., Coldewey-Egbers, M., Verhoelst, T., Koukouli, M. E., Zyrichidou, I., Balis, D. S., Danckaert, T., Goutail, F., Granville, J., Hubert, D., Keppens, A., Lambert, J.-C., Loyola, D., Pommereau, J.-P., Van Roozendael, M., and Zehner, C.: Quality assessment of the Ozone_cci Climate Research Data Package (release 2017) – Part 1: Ground-based validation of total ozone column data products, Atmos. Meas. Tech., 11, 1385–1402, https://doi.org/10.5194/amt-11-1385-2018, 2018.
Garane, K., Koukouli, M.-E., Verhoelst, T., Lerot, C., Heue, K.-P., Fioletov, V., Balis, D., Bais, A., Bazureau, A., Dehn, A., Goutail, F., Granville, J., Griffin, D., Hubert, D., Keppens, A., Lambert, J.-C., Loyola, D., McLinden, C., Pazmino, A., Pommereau, J.-P., Redondas, A., Romahn, F., Valks, P., Van Roozendael, M., Xu, J., Zehner, C., Zerefos, C., and Zimmer, W.: TROPOMI/S5P total ozone column data: global ground-based validation and consistency with other satellite missions, Atmos. Meas. Tech., 12, 5263–5287, https://doi.org/10.5194/amt-12-5263-2019, 2019.
Grooß, J.-U. and Müller, R.: Simulation of the record Arctic stratospheric ozone depletion in 2020, J. Geophys. Res., https://doi.org/10.1002/essoar.10503569.1, submitted, 2020.
Hansen, G. and Chipperfield, M. P.: Ozone depletion at the edge of the Arctic polar vortex 1996/1997, J. Geophys. Res., 104, 1837–1845, 1999.
Harris, N. R. P., Lehmann, R., Rex, M., and von der Gathen, P.: A closer look at Arctic ozone loss and polar stratospheric clouds, Atmos. Chem. Phys., 10, 8499–8510, https://doi.org/10.5194/acp-10-8499-2010, 2010.
Hersbach, H., Bell, B., Berrisford, P., Horányi, A., Muñoz Sabater, J., Nicolas, J., Radu, R., Schepers, D., Simmons, A., Soci, C., and Dee, D.: ERA5 hourly data on pressure levels from 1979 to present, Copernicus Climate Change Service (C3S) Climate Data Store (CDS), https://doi.org/10.24381/cds.bd0915c6, 2018.
Hersbach, H., Bell, B., Berrisford, P., Horányi, A., Muñoz Sabater, J., Nicolas, J., Radu, R., Schepers, D., Simmons, A., Soci, C., and Dee, D.: ERA5 monthly averaged data on pressure levels from 1979 to present, Copernicus Climate Change Service (C3S) Climate Data Store (CDS), https://doi.org/10.24381/cds.6860a573, 2019a.
Hersbach, H., Bell, B., Berrisford, P., Horányi, A., Sabater, J. M., Nicolas, J., Radu, R., Schepers, D., Simmons, A., Soci, C., and Dee, D.: Global reanalysis: goodbye ERA-Interim, hello ERA5, ECMWF Newsletter, 159, 17–24, https://doi.org/10.21957/vf291hehd7, 2019b.
Hersbach, H., Bell, B., Berrisford, P., Hirahara, S., Horányi, A., Muñoz-Sabater, J., Nicolas, J., Peubey, C., Radu, R., Schepers, D., Simmons, A., Soci, C., Abdalla, S., Abellan, X., Balsamo, G., Bechtold, P., Biavati, G., Bidlot, J., Bonavita, M., De Chiara, G., Dahlgren, P., Dee, D., Diamantakis, M., Dragani, R., Flemming, J., Forbes, R., Fuentes, M., Geer, A., Haimberger, L., Healy, S., Hogan, R.J., Hólm, E., Janisková, M., Keeley, S., Laloyaux, P., Lopez, P., Lupu, C., Radnoti, G., de Rosnay, P., Rozum, I., Vamborg, F., Villaume, S., and Thépaut, J.-N.: The ERA5 Global Reanalysis, Q. J. Roy. Meteor. Soc., 146, 1999–2049, https://doi.org/10.1002/qj.3803, 2020.
Hoinka, K. P., Claude, H., and Köhler, U.: On the correlation between tropopause pressure and ozone above central Europe, Geophys. Res. Lett., 23, 1753–1756, 1996.
Hommel, R., Eichmann, K.-U., Aschmann, J., Bramstedt, K., Weber, M., von Savigny, C., Richter, A., Rozanov, A., Wittrock, F., Khosrawi, F., Bauer, R., and Burrows, J. P.: Chemical ozone loss and ozone mini-hole event during the Arctic winter 2010/2011 as observed by SCIAMACHY and GOME-2, Atmos. Chem. Phys., 14, 3247–3276, https://doi.org/10.5194/acp-14-3247-2014, 2014.
Hoppel, K., Bevilacqua, R., Allen, D., and Nedoluha, G.: POAM III observations of the anomalous 2002 Antarctic ozone hole, Geophys. Res. Lett., 30, 1394, https://doi.org/10.1029/2003GL016899 2003GL016899, 2003.
Inness, A., Chabrillat, S., Flemming, J., Huijnen, V., Langenrock, B., Nicolas, J., Polichtchouk, I., and Razinger, M.: Exceptionally Low Arctic Stratospheric Ozone in Spring 2020 as Seen in the CAMS Reanalysis, J. Geophys. Res.-Atmos., 125, e2020JD033563, https://doi.org/10.1029/2020JD033563, 2020.
Ivy, D. J., Solomon, S., and Rieder, H. E.: Radiative and dynamical influences on polar stratospheric temperature trends, J. Climate, 29, 4927–4938, https://doi.org/10.1175/JCLI-D-15-0503.1, 2016.
James, P. M.: A climatology of ozone mini-holes over the northern hemisphere, Int. J. Climatol., 18, 1287–1303, https://doi.org/10.1002/(SICI)1097-0088(1998100)18:12<1287::AID-JOC315>3.0.CO;2-4, 1998.
James, P. M. and Peters, D.: The Lagrangian structure of ozone mini-holes and potential vorticity anomalies in the Northern Hemisphere, Ann. Geophys., 20, 835–846, https://doi.org/10.5194/angeo-20-835-2002, 2002.
Keeble, J., Abraham, N. L., Archibald, A. T., Chipperfield, M. P., Dhomse, S., Griffiths, P. T., and Pyle, J. A.: Modelling the potential impacts of the recent, unexpected increase in CFC-11 emissions on total column ozone recovery, Atmos. Chem. Phys., 20, 7153–7166, https://doi.org/10.5194/acp-20-7153-2020, 2020.
Kivi, R., Kyrö, E., Turunen, T., Harris, N. R. P., von der Gathen, P., Rex, M., Andersen, S. B., and Wohltmann, I.: Ozonesonde observations in the Arctic during 1989–2003: Ozone variability and trends in the lower stratosphere and free troposphere, J. Geophys. Res., 112, D08306, https://doi.org/10.1029/2006JD007271, 2007.
Kuttippurath, J., Godin-Beekmann, S., Lefèvre, F., Nikulin, G., Santee, M. L., and Froidevaux, L.: Record-breaking ozone loss in the Arctic winter 2010/2011: comparison with 1996/1997, Atmos. Chem. Phys., 12, 7073–7085, https://doi.org/10.5194/acp-12-7073-2012, 2012.
Labitzke, K. and Naujokat, B.: The lower arctic stratosphere in winter since 1952, SPARC Newsletter No. 15, 11–14, 2000.
Langematz, U.: Stratospheric ozone: down and up through the Anthropocene, ChemTexts, 5, 12, https://doi.org/10.1007/s40828-019-0082-7, 2019.
Langematz, U., Meul, S., Grunow, K., Romanowsky, E., Oberländer, S., Abalichin, J., and Kubin, A.: Future Arctic temperature and ozone: The role of stratospheric composition changes, J. Geophys. Res., 119, 2092–2112, https://doi.org/10.1002/2013JD021100, 2014.
Lawrence, Z. D., Perlwitz, J., Butler, A. H., Manney, G. L., Newman, P. A., Lee, S. H., and Nash, E. R.: The remarkable strong Arctic stratospheric polar vortex of winter 2020: links to record-breaking Arctic oscillation and ozone loss, J. Geophys. Res.-Atmos., 125, e2020JD033271, https://doi.org/10.1029/2020JD033271, 2020.
Lee, S. H. and Butler, A. H.: The 2018–2019 Arctic stratospheric polar vortex, Weather, 75, 52–57, https://doi.org/10.1002/wea.3643, 2020.
Lefèvre, F., Figarol, F., Carslaw, K. S., and Peter, T.: The 1997 Arctic ozone depletion quantified from three-dimensional model simulations, Geophys. Res. Lett., 25, 2425–2428, 1998.
Lerot C., van Roozendael, M., Spurr, R., Loyola, D. G., Coldewey-Egbers, M., Kochenova, S., van Gent, J., Koukouli, M.-E., Balis, D., Lambert, J.-C., Granville, J., and Zehner, C.: Homogenized total ozone data records from the European sensors GOME/ERS-2, SCIAMACHY/Envisat, and GOME-2/MetOp-A, J. Geophys. Res. Atmos., 119, 1639–1662, https://doi.org/10.1002/2013JD020831, 2014.
Lim, E.-P., Hendon, H. H., Butler, A. H., Garreaud, R. D., Polichtchouk, I., Shepherd, T. G., Scaife, A., Comer, R., Coy, L., Newman, P. A., Thompson, D. W. J., and Nakamura, H.: The 2019 Antarctic sudden stratospheric warming, SPARC-Newsletter, 54, 10–13, 2020.
Loyola, D. G., Coldewey-Egbers, M., Dameris, M., Garny, H., Stenke, A., van Roozendael, M., Lerot, C., Balis, D., and Koukouli, M.: Global long-term monitoring of the ozone layer – a prerequisite for predictions, Int. J. Remote Sens., 30, 4295–4318, https://doi.org/10.1080/01431160902825016, 2009.
Manney, G. L., Froidevaux, L., Santee, M. L., Zurek, R. W., and Waters, J. W.: MLS observations of Arctic ozone loss in 1996–97, Geophys. Res. Lett., 24, 2967–2700, https://doi.org/10.1029/97GL52827, 1997.
Manney, G. L., Santee, M. L., Rex, M., Livesey, N. J., Pitts, M. C., Veefkind, P., Nash, E. R., Wohltmann, I., Lehmann, R., Froidevaux, L., Poole, L. R., Schoeberl, M. R., Haffner, D. P., Davies, J., Dorokhov, V., Gernandt, H., Johnson, B., Kivi, R., Kyrö, E., Larsen, N., Levelt, P. F., Makshtas, A., McElroy, C. T., Nakajima, H., Parrondo, M. C., Tarasick, D. W., von der Gathen, P., Walker, K. A., and Zinoviev, N. S.: Unprecedented Arctic ozone loss in 2011, Nature, 478, 469–475, https://doi.org/10.1038/nature10556, 2011.
Manney, G. L., Livesey, N. J., Santee, M. L., Froidevaux, L., Lambert, A., Lawrence, Z. D., Millán, L. F., Neu, J. L., Read, W. G., Schwartz, M. J., and Fuller, R. A.: Record-low Arctic stratospheric ozone in 2020: MLS observations of chemical processes and comparisons with previous extreme winters, Geophys. Res. Lett., 47, e2020GL089063, https://doi.org/10.1029/2020GL089063, 2020.
Maycock, A. C., Randel, W. J., Steiner, A. K., Karpechko, A. Y., Christy, J., Saunders, R., Thompson, D. W. J., Zou, C.-Z., Chrysanthou, A., Abraham, N. L., Akiyoshi, H., Archibald, A. T., Butchart, N., Chipperfield, M., Dameris, M., Deushi, M., Dhomse, S., Di Genova, G., Jöckel, P., Kinnison, D. E., Kirner, O., Ladstaedter, F., Michou, M., Morgenstern, O., O'Connor, F., Oman, L., Pitari, G., Plummer, D. A., Revell, L. E., Rozanov, E., Stenke, A., Visioni, D., Yamashita, Y., and Zeng, G.: Revisiting the mystery of recent stratospheric temperature trends, Geophys. Res. Lett., 45, 9919–9933, https://doi.org/10.1029/2018GL078035, 2018.
Millán, L. F. and Manney, G. L.: An assessment of ozone mini-hole representation in reanalyses over the Northern Hemisphere, Atmos. Chem. Phys., 17, 9277–9289, https://doi.org/10.5194/acp-17-9277-2017, 2017.
Montzka, S. A., Dutton, R., Yu, P., Ray, E., Portmann, R. W., Daniel, J. S., Kuijpers, L., Hall, B. D., Mondeel, D., Siso, C., Nance, D. J., Rigby, M., Manning, A. J., Hu, L., Moore, F., Miller, B. R., and Elkins, J. W.: A persistent and unexpected increase in global emissions of ozone-depleting CFC-11, Nature, 557, 413–417, https://doi.org/10.1038/s41586-018-0106-2, 2018.
NCL, The NCAR Command Language (Version 6.5.0) [Software], Boulder, Colorado, UCAR/NCAR/CISL/TDD, https://doi.org/10.5065/D6WD3XH5, 2018.
Newman, P. A., Nash, E. R., and Rosenfield, J. E.: What controls the temperature of the Arctic stratosphere during the spring?, J. Geophys. Res., 106, 19999–20010, 2001.
Peters, D., Egger, J., and Entzian, G.: Dynamical aspects of ozone mini-hole formation, Meteorol. Atmos. Phys., 55, 205–214, https://doi.org/10.1007/BF01029827, 1995.
Petzoldt, K.: The role of dynamics in total ozone deviations from their long-term mean over the Northern Hemisphere, Ann. Geophys., 17, 231–241, https://doi.org/10.1007/s00585-999-0231-1, 1999.
Pommereau J.-P., Goutail, F., Pazmino, A., Lefèvre, F., Chipperfield, M. P., Feng, W., van Roozendael, M., Jepsen, N., Hansen, G., Kivi, R., Bognar, K., Strong, K., Walker, K., Kuzmichev, A., Khattatov, S., and Sitnikova, V.: Recent Arctic ozone depletion: Is there an impact of climate change? Comptes Rendus Géoscience, Elsevier Masson, 350, 347–353, https://doi.org/10.1016/j.crte.2018.07.009, 2018.
Rex, M., Salawitch, R. J., Toon, G. C., Sen, B., Margitan, J. J., Osterman, G. B., Blavier, J.-F., Gao, R. S., Donnelly, S., Keim, E., Neuman, J., Fahey, D. W., Webster, C. R., Scott, D.C., Herman, R. L., May, R. D., Moyer, E. J., Gunson, M. R., Irion, F. W., Chang, A. Y., Rinsland, C. P., and Bui, T. P.: Subsidence, mixing, and denitrification of Arctic polar vortex air measured During POLARIS, J. Geophys. Res., 104, 26611–26623, 1999.
Rex, M., Salawitch, R. J., von der Gathen, P., Harris, N. R. P., Chipperfield, M. P., and Naujokat, B.: Arctic ozone loss and climate change, Geophys. Res. Lett., 31, L04116, https://doi.org/10.1029/2003GL018844, 2004.
Schulzweida, U.: CDO User Guide (Version 1.9.6), https://doi.org/10.5281/zenodo.2558193, 2019.
Sinnhuber, B.-M., Weber, M., Amankwah, A., and Burrows, J. P.: Total ozone during the unusual Antarctic winter of 2002, Geophys. Res. Lett., 30, 1580–1584, 2003.
Sinnhuber, B.-M., Stiller, G., Ruhnke, R., von Clarmann, T., Kellmann, S., and Aschmann, J.: Arctic winter 2010/2011 at the brink of an ozone hole, Geophys. Res. Lett., 38, L24814, https://doi.org/10.1029/2011GL049784, 2011.
Solomon, S.: Stratospheric ozone depletion: a review of concepts and history, Rev. Geophys., 37, 275–316, 1999.
Solomon, S., Haskins, J., Ivy, D. J., and Min, F.: Fundamental differences between Arctic and Antarctic ozone depletion, P. Natl. Acad. Sci. USA, 111, 6220–6225, https://doi.org/10.1073/pnas.1319307111, 2014.
Solomon, S., Ivy, D. J., Kinnison, D., Mills, M. J., Neely III, R. R., and Schmidt, A.: Emergence of healing in the Antarctic ozone layer, Science, 353, 269–274, https://doi.org/10.1126/science.aae0061, 2016.
SPARC: SPARC Report on the Lifetimes of Stratospheric Ozone-Depleting Substances, Their Replacements, and Related Species, edited by: Ko, M., Newman, P., Reimann, S., and Strahan, S., SPARC Report No. 6, WCRP-15/2013, available at: https://www.sparc-climate.org/publications/sparc-reports/sparc-report-no-6/ (last access: 15 January 2021), 2013.
Steinbrecht, W., Claude, H., Köhler, U., and Hoinka, K. P.: Correlations between tropopause height and total ozone: Implications for long-term changes, J. Geophys. Res., 103, 19183–19192, 1998.
Steiner, A. K., Ladstädter, F., Randel, W. J., Maycock, A. C., Fu, Q., Claud, C., Gleisner, H., Haimberger, L., Ho, S.-P., Keckhut, P., Leblanc, T., Mears, C., Polvani, L. M., Santer, B. D., Schmidt, T., Sofieva, V., Wing, R., and Zou, C.-Z.: Observed temperature changes in the troposphere and stratosphere from 1979 to 2018, J. Climate, 33, 8165–8194, https://doi.org/10.1175/JCLI-D-19-0998.1, 2020.
Stolarski, R.S., McPeters, R. D., and Newman, P. A.: The Ozone hole of 2002 as measured by TOMS, J. Atmos. Sci., 62, 716–720, 2005.
Tegtmeier, S., Rex, M., Wohltmann, I., and Krüger, K.: Relative importance of dynamical and chemical contributions to Arctic wintertime ozone, Geophys. Res. Lett., 35, L17801 https://doi.org/10.1029/2008GL034250, 2008.
Tilmes, S., Müller, R., Engel, A., Rex, M., and Russell III, J. M.: Chemical ozone loss in the Arctic and Antarctic stratosphere between 1992 and 2005, Geophys. Res. Lett.. 33, L20812, https://doi.org/10.1029/2006GL026925, 2006.
Van Geffen, J., Van Weele, M., Allaart, M. and Van der A, R.: TEMIS UV index and UV dose operational data products, version 2, dataset, Royal Netherlands Meteorological Institute (KNMI), https://doi.org/10.21944/temis-uv-oper-v2, 2017.
Waibel, A. E., Peter, T., Carslaw, K. S., Oelhaf, H., Wetzel, G., Crutzen, P. J., Poeschl, U., Tsias, A., Reimer, E., and Fischer, H.: Arctic ozone loss due to denitrification, Science, 283, 2064–2069, 1999.
Wargan, K., Weir, B., Manney, G. L., Cohn, S., and Livesey, N. J.: The anomalous 2019 Antarctic ozone hole in the GEOS Constituent Data Assimilation System with MLS observations, J. Geophys. Res.-Atmos., 125, e2020JD033335, https://doi.org/10.1029/2020JD033335, 2020.
Weber, M., Coldewey-Egbers, M., Fioletov, V. E., Frith, S. M., Wild, J. D., Burrows, J. P., Long, C. S., and Loyola, D.: Total ozone trends from 1979 to 2016 derived from five merged observational datasets – the emergence into ozone recovery, Atmos. Chem. Phys., 18, 2097–2117, https://doi.org/10.5194/acp-18-2097-2018, 2018.
WMO (World Meteorological Organization): Scientific Assessment of Ozone Depletion: 1998, Global Ozone Research and Monitoring Project-Report No. 44, Geneva, Switzerland, 558 pp., 1999.
WMO (World Meteorological Organization): Scientific Assessment of Ozone Depletion: 2002, Global Ozone Research and Monitoring Project-Report No. 47, 498 pp., Geneva, Switzerland, 2003.
WMO (World Meteorological Organization): Scientific Assessment of Ozone Depletion: 2014, Global Ozone Research and Monitoring Project-Report No. 55, 416 pp., Geneva, Switzerland, 2014.
WMO (World Meteorological Organization): Scientific Assessment of Ozone Depletion: 2018, Global Ozone Research and Monitoring Project-Report No. 58, 588 pp., Geneva, Switzerland, 2018.
Wohltmann, I., von der Gathen, P., Lehmann, R., Maturilli, M., Deckelmann, H., Manney, G. L., Davis, J., Tarasick, D., Jepsen, N., Kivi, R., Lyall, N., and Rex, M.: Near complete local reduction of Arctic stratospheric ozone by severe chemical loss in spring 2020, Geophys. Res. Lett., 47, e2020GL089547, https://doi.org/10.1029/2020GL089547, 2020.
- Abstract
- Introduction
- Data and data processing
- Situation in Northern Hemisphere winter and spring 2019/2020
- Situations in Northern Hemisphere winter and spring 1996/1997 and 2010/2011
- Discussion
- Conclusions
- Data availability
- Author contributions
- Competing interests
- Acknowledgements
- Financial support
- Review statement
- References