the Creative Commons Attribution 4.0 License.
the Creative Commons Attribution 4.0 License.
 | 23 Apr 2021
The thermodynamic structures of the planetary boundary layer dominated by synoptic circulations and the regular effect on air pollution in Beijing
Yunyan Jiang
Jinyuan Xin
Ying Wang
Guiqian Tang
Yuxin Zhao
Danjie Jia
Dandan Zhao
Meng Wang
Lindong Dai
Lili Wang
Tianxue Wen
Fangkun Wu
To investigate the impacts of multiscale circulations on the planetary boundary layer (PBL), we have carried out the PBL thermodynamic structure field experiment with a Doppler wind profile lidar, a microwave radiometer, and a ceilometer from January 2018 to December 2019 in Beijing. We found that the direct regulatory effect of synoptic circulation worked through transporting and accumulating pollutants in front of mountains in the daytime, while the indirect effect of multiscale circulations worked through coupling mechanisms in the nighttime. The horizontal coupling of different-direction winds produced a severe pollution convergent zone. The vertical coupling of upper environmental winds and lower regional breezes regulated the mixing and diffusion of pollutants by generating dynamic wind shear and advective temperature inversion. We also found that the dominating synoptic circulations led to great differences in PBL thermodynamic structure and pollution. The cyclonic circulation resulted in a typical multilayer PBL characterized by high vertical shear (600 m), temperature inversion (900 m), and an inhomogeneous stratification. Meanwhile, strong regional breezes pushed the pollution convergent zone to the south of Beijing. The southwesterly circulation resulted in a mono-layer PBL characterized by low vertical shear (400 m) and inversion (200 m). The westerly circulation led to a hybrid-structure PBL, and the advective inversion was generated by the vertical shear of zonal winds. Strong environmental winds of southwesterly and westerly circulations pushed the severe-pollution zone to the front of mountains. There was no distinct PBL structure under the anticyclone circulation. The study systematically revealed the appreciable effects of synoptic and regional circulations on PBL structure and air quality, which enriched the prediction theory of atmospheric pollution in the complex terrain.
- Article
(11980 KB) - Full-text XML
- BibTeX
- EndNote


The megacity of Beijing is the political, economic, and cultural center of China. With the recent economic development and acceleration of urbanization, an increasing number of air pollution episodes have emerged and pose a direct threat to human health (Quan et al., 2014; Fu et al., 2014; Cheng et al., 2016; Song et al., 2017). Large-scale atmospheric circulations play a leading role in the transportation, accumulation, and dispersion of pollution and thus result in the day-to-day variation in air quality (Tai et al., 2010; Zhang, 2017; Wang et al., 2018). Zheng et al. (2015) explored the relationships between aerosol optical depth (AOD) and synoptic circulations and found that a uniform surface pressure field in eastern China or a steady, straight westerly in the middle troposphere is typically responsible for heavy-pollution events. Miao et al. (2017) specially targeted summertime synoptic types, indicating that the horizontal transport of pollutants induced by the synoptic forcing is the most important factor affecting the air quality of Beijing in summer. They also found that synoptic patterns with high-pressure systems located to the east or southeast of Beijing are the most favorable types for heavy-aerosol-pollution events. Leung et al. (2018) indicated that daily PM2.5 had a strong positive correlation with temperature and relative humidity but negative correlation with sea level pressure in northern China. The PM2.5-to-climate-sensitivities results were applied to predict future PM2.5 due to climate change, and a decrease of 0.5 µg/m3 in annual mean PM2.5 in the Beijing–Tianjin–Hebei region was found due to more frequent cold frontal ventilation. Liu et al. (2019) found that the episodes of PM2.5 pollution over the Beijing–Tianjin–Hebei region in winter were related to weather patterns such as the rear of a high-pressure system approaching the sea, a high-pressure field, a saddle pressure field, and the leading edge of a cold front. Li et al. (2020) quantitatively analyzed the contributions of different large-scale circulations to PM2.5. Many approaches have been used to classify the synoptic circulations, which can be mainly divided into subjective and objective methods. Objective weather typing methods have the advantages of convenient operation, high objectivity, and efficiency; hence they have been employed widely in recent years (Zhang et al., 2016; Ye et al., 2016; Miao et al., 2017). In this study, we adopt an objective Lamb–Jenkinson classification scheme to categorize the large-scale atmospheric circulations centered on Beijing. The Lamb–Jenkinson approach, which confirms that the categorization results have a clear physical understanding, has been applied widely in previous studies (Huang et al., 2016; Liao et al., 2017; Yu et al., 2017).
In addition, Beijing is located in the North China Plain (NCP) region and surrounded by the Yan and Taihang mountains to the north and west, respectively (Fig. 1b). The Bohai Sea lies to the southeast and is approximately 150 km from Beijing. This semibasin topography blocks and decelerates the relatively weak southerly airflows (Li et al., 2007). Aerosol pollutants from southern provinces through regional transportation stagnate and converge in front of the mountains, leading to the accumulation zone of pollution. This unique geographic location and topography result in diurnal variations in the mountain–plain breeze (MPB) and sea–land breeze (SLB) under relatively weak synoptic circulations. The SLB can penetrate deep into the mainland when it is blooming, and aerosol pollution transported previously over the sea could be recirculated to the Beijing–Tianjin–Hebei region (Liu et al., 2009; Miao et al., 2017; Bei et al., 2018). As Beijing is surrounded by mountains and is relatively far from the Bohai Sea, the intensity of the MPB circulation is much stronger compared to the sea–land breeze circulation in Beijing (Chen et al., 2009; Miao et al., 2015a, b), especially when synoptic circulations dominate in Bohai areas. Miao et al. (2015b) found that the regional-scale MPB circulations can modulate aerosol pollution by lifting or suppressing the planetary boundary layer (PBL). Chen et al. (2009) found that the MPB played an important role in the vertical transportation and dispersion of pollutants via the mountain chimney effect.

Figure 1The locations of 16 grid data of the 5∘ × 10∘ MSLP used for Lamb–Jenkinson weather type classification (black dots) (a). The terrain height of the North China Plain (shaded; units: m) (b). The location of Beijing city and the Beijing–Tianjin–Hebei region is marked by the solid red lines and dashed red lines, respectively. The orange dot indicates the location of remote-sensing devices. The arrows indicate the horizontal-coupling mechanism of how multiscale circulations affect pollution by generating convergent zones.
The PBL structure is also a key factor affecting the distribution and intensity of pollutants in addition to the circulations. The thermal structure of the PBL determines the vertical dispersion of aerosols. In the daytime convective layer, air pollution tends to be mixed vertically and homogeneously because of intensified turbulence and eddies of different sizes by radiation (Stull, 1988). After sunset, the turbulence decays, and a stable boundary layer forms with weak turbulence. A radiation inversion on the ground caps the pollutants and leads to the accumulation near the surface. Hu et al. (2014) found that westerly warm advection above the Loess Plateau was transported over the NCP and imposed a thermal inversion, which acted as a lid and capped the pollution in the boundary layer (Xu et al., 2019). The dynamic structure of the PBL, including wind shears and turbulence, can modify air quality by influencing the dispersion and transport processes of air pollutants (Li et al., 2019). Zhang et al. (2020) found that a much weaker vertical wind shear was observed in the lower part of the PBL under polluted conditions compared with that under clean conditions, which could be caused by the strong ground-level PM2.5 accumulation induced by weak vertical mixing in the PBL. In turn, the particulate matter can also affect the PBL structure by scattering and absorbing of solar radiation and lead to severe pollution by positive feedback (Petaja et al., 2016; Li et al., 2017). Ding et al. (2016) suggested that black carbon enhanced haze pollution in megacities in China by heating the upper PBL and cooling the surface. Lou et al. (2019) investigated the relationships between PBL height and PM2.5 and indicated that the strongest anticorrelation occurred in the NCP region at 14:00 Beijing time.
To sum up, because of the unique topography and geographic location of Beijing, large-scale circulation and regional-scale thermodynamic circulation both have appreciable impacts on the PBL and air pollution. What the characteristics of PBL structure and the temporal and spatial distribution of pollution under different circulation types are and how the multiscale circulations jointly force the PBL structure to change when they coexist are still unrevealed. Therefore, one objective of this study is to investigate the PBL thermodynamic structure and the distribution of severe-pollution areas under the most frequent circulation types in Beijing. The other primary objective is to further explore the synergetic effects of multiscale circulations on the PBL and pollution in detail. Since the weather typing approach is able to classify the synoptic circulations into different types, and the high-vertical-resolution remote-sensing observations can measure the fine thermodynamic structures of the PBL, the objectives can be achieved by employing the weather typing approach and remote-sensing measurements as a necessary first step. The remainder of this paper is organized as follows. Section 2 describes the instruments, data, and method. Section 3 classifies the synoptic-circulation types and selects typical types as research objects. Moreover, it further investigates how the coupling mechanism of synoptic circulations and regional-scale circulations changes the dynamic and thermal PBL structure and air pollution. Section 4 discusses the improvements on previous studies and summarizes the main findings.
A PBL field observation experiment was performed from January 2018 to December 2019 based on multiple remote-sensing devices, including a Doppler wind profile lidar, microwave radiometer (MWR), and ceilometer in the courtyard of the Institute of Atmospheric Physics (39.6∘ N and 116.2∘ E), Chinese Academy of Sciences, Beijing (Fig. 1b). We systematically probed the PBL dynamic structure, thermodynamic structure, and the vertical distribution of aerosols using the lidar three-dimensional winds, the MWR temperature and humidity profiles, and the ceilometer backscattering coefficient, respectively. The original remote-sensing data, with high temporal and spatial resolution, are fully capable of showing the fine PBL thermodynamic structure. The reanalysis data of mean sea level pressure (MSLP) and winds are used to depict the synoptic circulations and winds from hundreds of automatic weather stations to characterize the fine regional circulations. Thus, the synergistic impacts of coexisting synoptic-scale and regional-scale circulations on the PBL thermodynamic structure and air pollution in the megacity of Beijing can be well understood using the remote-sensing and meteorological data in combination with the Lamb–Jenkinson weather typing approach. The typical cases lasting 2 d in the same weather type (cyclonic, C; southwesterly, SW; westerly, W; and anticyclonic, A) are on 22 to 24 October, 26 to 28 July, and 15 to 17 May in 2019 and 28 to 30 December in 2018, respectively. Due to the algorithm limitations on the observation conditions, the data of backscattering coefficient and temperature profiles are missing for about 5 h on 27 July 2019.
2.1 Remote-sensing data
The ceilometer (CL31, Vaisala) BL-VIEW software derives the PBL height according to the minimum value of the local backscatter gradient (Tang et al., 2015) based on the assumption that the aerosol concentration in the mixing layer (ML) is close to constant and significantly larger than that in the air above (Steyn et al., 1999). The BL-VIEW algorithm excluded profiles with fog, precipitation, or low clouds, therefore resulting in the missing value of attenuated backscatter coefficient on 27 July 2019 used in southwesterly circulation. The vertical resolution of the backscatter is 10 m, and the maximal detection range can reach 7.7 km. A full overlap is achieved by using the same telescope for transmitting and receiving so that the backscatter can be used from the first range gate (Münkel et al., 2007). This gives a clear advantage over other commonly used automatic lidars and ceilometers that usually show great uncertainty in the range below 200–500 m (Kotthaus and Grimmond, 2018). Three possible PBL heights, with a temporal resolution of 10 min, can be output simultaneously to characterize the multiple aerosol layers' structure according to the first three largest negative gradients of backscatter. The typical uncertainty in the CL31 in attenuated backscatter coefficient is ±20 % and is ± 200 m in PBL height determination compared with radiosonde and other active remote sensors (Tsaknakis et al., 2011).
A Windcube 100S scanning Doppler lidar is used to measure the wind profiles based on the Doppler shift in aerosol particulate backscatter signals. Dai et al. (2020) suggested that the Doppler wind profile lidar is fully capable of measuring three-dimensional winds by comparing with cup anemometer and sonic wind anemometer. The vertical measuring range is from 50 m to 3.3 km. Several scanning modes are available, and the DBS (Doppler beam-swinging technique) mode, which includes four LOSs (lines of sight) spaced 90∘ apart with a fixed elevation angle and one vertical LOS, is selected to detect the profiles of winds. The vertical resolution of the profiles is 25 m, and the temporal resolution is 20 s. The velocity uncertainty along each LOS is associated with carrier-to-noise ratio (CNR) for each measurement volume following the methodology from O'Connor et al. (2010). Typically, a threshold of −22 or −23 dB is used as a limit for the accepted uncertainty in the lidar measurements (Gryning et al., 2016), which corresponds to an uncertainty of about 0.15 m s−1 (Aitken et al., 2012; Suomi et al., 2017).
The temperature and relative humidity profiles in the RPG-HATPRO (Humidity And Temperature PROfilers, Radiometer Physics GmbH) MWR are determined by a neural network (NN) algorithm, and the vertical resolution of the profiles is 10–30 m in the lowest 0.5 km, 40–90 m from 0.5 to 2.5 km, and 100–200 m from 2 to 10 km, and the temporal resolution is 1 s. The MWR used in this study has been tested by comparing with radiosonde observations (Zhao et al., 2019). The systematic errors increase with altitude, and the MWR-retrieved temperature and relative humidity are of quite high reliability inside the PBL. The temperature biases and RMSEs are −2–0 ∘C and 1–2 ∘C under 2 km, and the minimum biases and RMSEs are between 1 and 2 km, less than 0.5 and 1.3 ∘C, respectively. Since the relative humidity was derived from the temperature and water vapor density, both the errors can cause the uncertainties. The bias and RMSE of relative humidity are about −5 % and 15 % under 2 km. Furthermore, the residual liquid droplets on the water film led to high brightness temperature measured by the MWR, resulting in the abnormal high values of the temperature and humidity data. Therefore, data on 27 July 2019 were eliminated and substituted with missing values.
2.2 Meteorological data
The daily MSLP and wind at 850 hPa from the National Center for Atmospheric Research (NCAR) reanalysis data (gridded at 2.5∘ × 2.5∘) were used to classify the synoptic-circulation patterns and depict the background circulations of the typical circulation types. The divergence and vertical-velocity reanalysis data (gridded at 1∘ × 1∘) with a temporal resolution of 1 h from ERA-Interim reanalysis of the European Centre for Medium-Range Weather Forecasts (ECMWF) were used to study the vertical motion in the mid–low troposphere in the NCP region and its impact on PBL structure. The hourly mean wind at the surface in the Beijing–Tianjin–Hebei area was collected by hundreds of automatic weather stations operated by the China Meteorological Administration (CMA).
2.3 Pollutant data
The hourly PM2.5 concentrations at the Beijing–Tianjin–Hebei monitoring sites are acquired from the National Urban Air Quality real-time publishing platform (http://106.37.208.233:20035/, last access: 20 February 2021) issued by the Ministry of Ecology and Environment. There are 35 air quality monitoring stations in Beijing (Fig. 4a) and 68 monitoring sites in Tianjin and Hebei provinces (Figs. 5, 7, 9). The PM2.5 concentration in Beijing is shown as a shaded area by interpolating data of 35 sites, while the PM2.5 concentration in other areas is shown as scatter with color as the spatial resolution is relatively low. The PM2.5 data of Olympic Center station, which is the closest monitoring site to the location of the remote-sensing measurements (less than 1 km), are used in the circulation classification.
2.4 Method
The Lamb–Jenkinson weather typing (LWT) approach is widely adopted in large-scale circulation classification (Lamb, 1972; Jenkinson and Collison, 1977) because of its automation and explicit meteorological meaning. To classify the synoptic-circulation types, the daily MSLPs in 2018 and 2019 were used. The LWT scheme is a half-objective categorization method. The weather patterns are predefined, and each day can be identified objectively as one certain type according to a small number of empirical rules (Trigo and DaCamara, 2000). As shown in Fig. 1a, 16 gridded pressure data surrounding the study area (Beijing city) were selected to calculate the direction and vorticity of geostrophic wind. The synoptic circulation can be classified into 26 types in total, including two vorticity types (cyclonic, C; anticyclonic, A), eight directional types (northeasterly, NE; easterly, E; southeasterly, SE; southerly, S; southwesterly, SW; westerly, W; northwesterly, NW; and northerly, N), and 16 hybrid types (CN, CNE, CE, CSE, CS, CSW, CW, CNW, AN, ANE, AE, ASE, AS, ASW, AW, and ANW).
The gradient Richardson number (Ri) is the ratio of the buoyancy term to the shear term in the turbulent kinetic equation. A negative Ri is an indication of buoyancy-generated turbulence, while positive Ri less than 0.25 indicates shear turbulence and dynamic instability. When Ri is larger than 0.25 and less than 1.0, the flows become neutral or exhibit hysteresis and still maintain turbulent. Otherwise, Ri larger than 1.0 means turbulent flow will turn to be dynamically stable and laminar (Stull, 1988). The distributional characteristics of Ri can reveal whether the PBL has a stratified structure or not (Banakh et al., 2020). Thus, we adopt the critical values of 0.25 and 1.0 as a criterion to determine the PBL structure. Ri can be calculated by Eq. (1), where g is the acceleration of gravity; Δz is the height interval between adjacent layers; is the mean virtual potential temperature; and and are the mean zonal- and meridional-wind speeds within the height interval, respectively.
3.1 The typical weather types and PM2.5 distribution
Based on the Lamb–Jenkinson weather typing approach, synoptic circulations from 2018 to 2019 were classified into 26 predefined circulation patterns, and each day has a specific type. The distributional characteristics of daily averaged PM2.5 concentration as well as the occurrence frequency of different circulation patterns were statistically conducted. The occurrence frequencies of the two vorticity and eight directional types were much higher than those of the other 16 hybrid types, accounting for 75 % of total days (Fig. 2). According to the pollution intensity, three pollution types (cyclonic, C; southwesterly, SW; and westerly, W) and one clean type (anticyclonic A) occurring most frequently in the NCP were selected as the studied circulation patterns. It was consistent with the results of Li et al. (2020) on the relationship between pollutant concentration and circulation types in northern China. Weather types with high PM2.5 concentration but occurring no more than 10 times, such as type CE and type CW, are not discussed in this article. The average and extreme PM2.5 concentrations of type C reached 77 and 270 µg/m3, respectively, and were much stronger than the other pollution types. Clearly, the cyclonic circulation pattern was more conducive to severe-pollution events. The circulation of type A was the most common type, and the PM2.5 concentration was 28 µg/m3, which was the lowest.
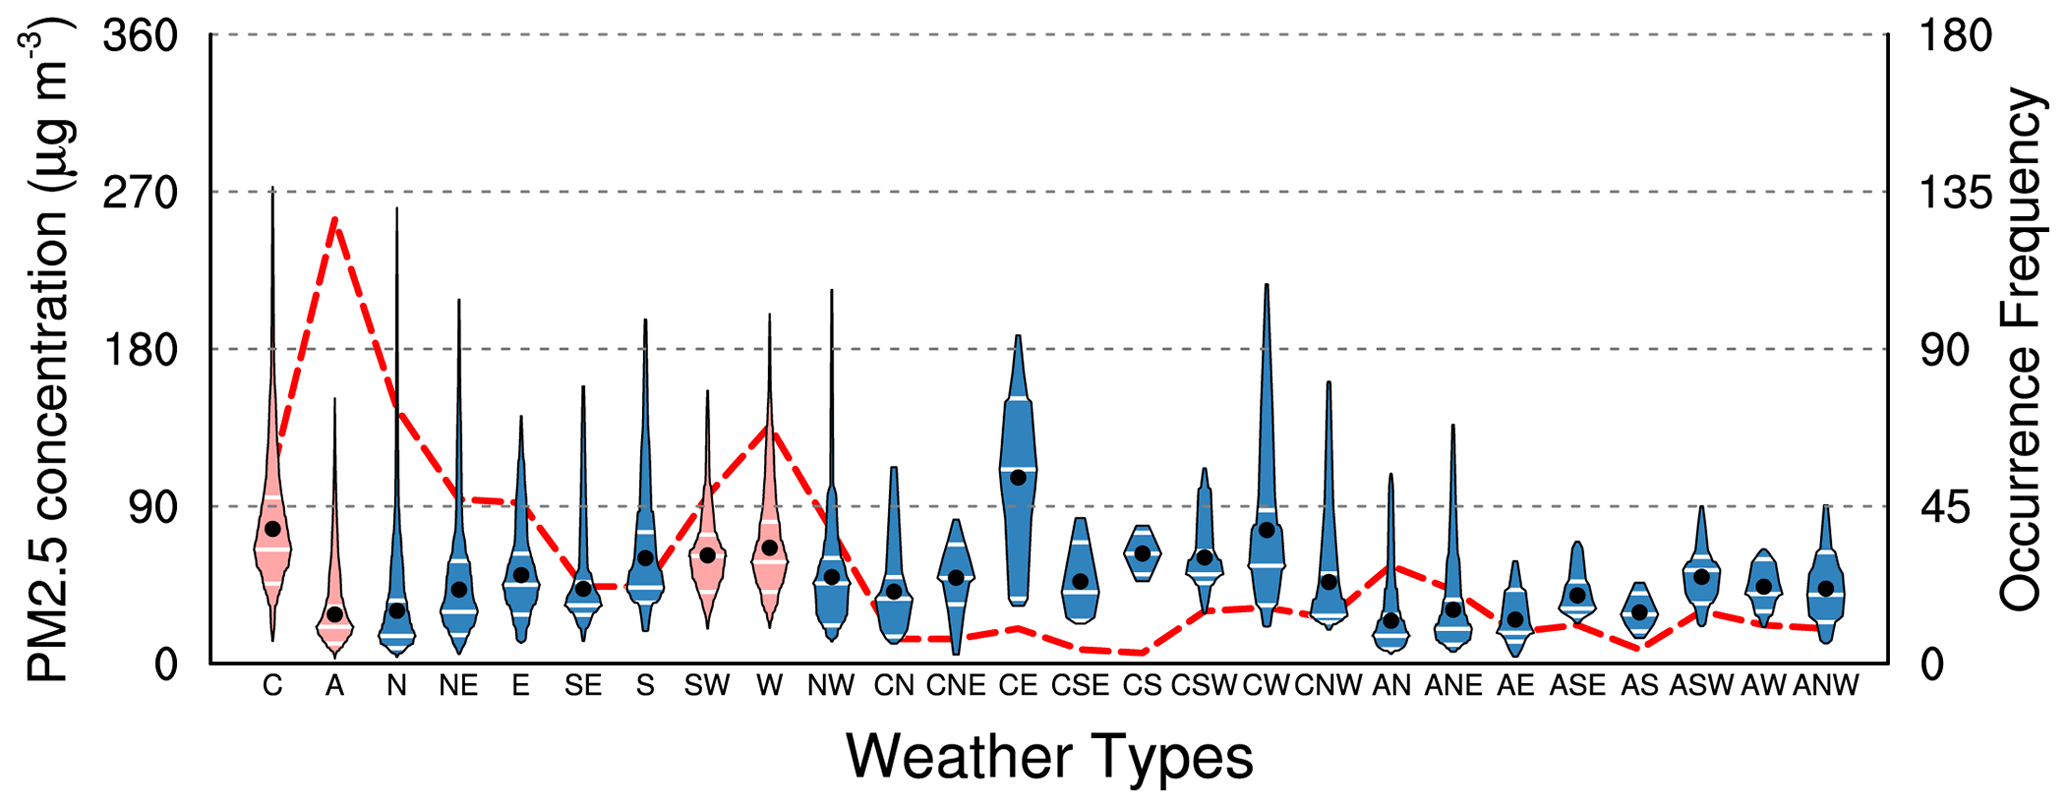
Figure 2Daily averaged PM2.5 concentration at Olympic Center station (box plots; units: 10−1 µg m−3) and the occurrence frequencies of 26 weather types (dashed red lines) from 2018 to 2019. The red boxes represent classical types selected for research. The black dots represent the mean values.
As shown in Fig. 3, the locations of the high and low pressures and the intensity of the wind fields at 925 hPa under different circulation patterns were clearly distinct. In type C, Beijing was located in the center of low pressure, and the sea to the east of China was controlled by an anticyclone (Fig. 3a). Southwesterly winds prevailed, flowing northward to Beijing along the periphery of the anticyclone with an average wind speed of 3 m/s. In type SW, Beijing lay southeast of the low pressure in Mongolia, and the high pressure over the sea was significantly enhanced compared with type C (Fig. 3b). Therefore, southeasterly winds prevailed to the south of Beijing and shifted southwest after flowing by. In type W, westerly winds were dominant and converged with southwesterly flows to the north of Beijing (Fig. 3c). The mean velocity of environmental flows in type SW and type W was observably larger than that in type C. In general, the mainland was mainly controlled by low pressure with an anticyclone lying over the sea to the east of China in pollution types C, SW, and W, and southerly flows dominated at 925 hPa. By contrast, northern China in the clean type A was occupied by high pressure. Beijing was located in the center of high pressure, with strong northerly winds in the lower level (Fig. 3d).
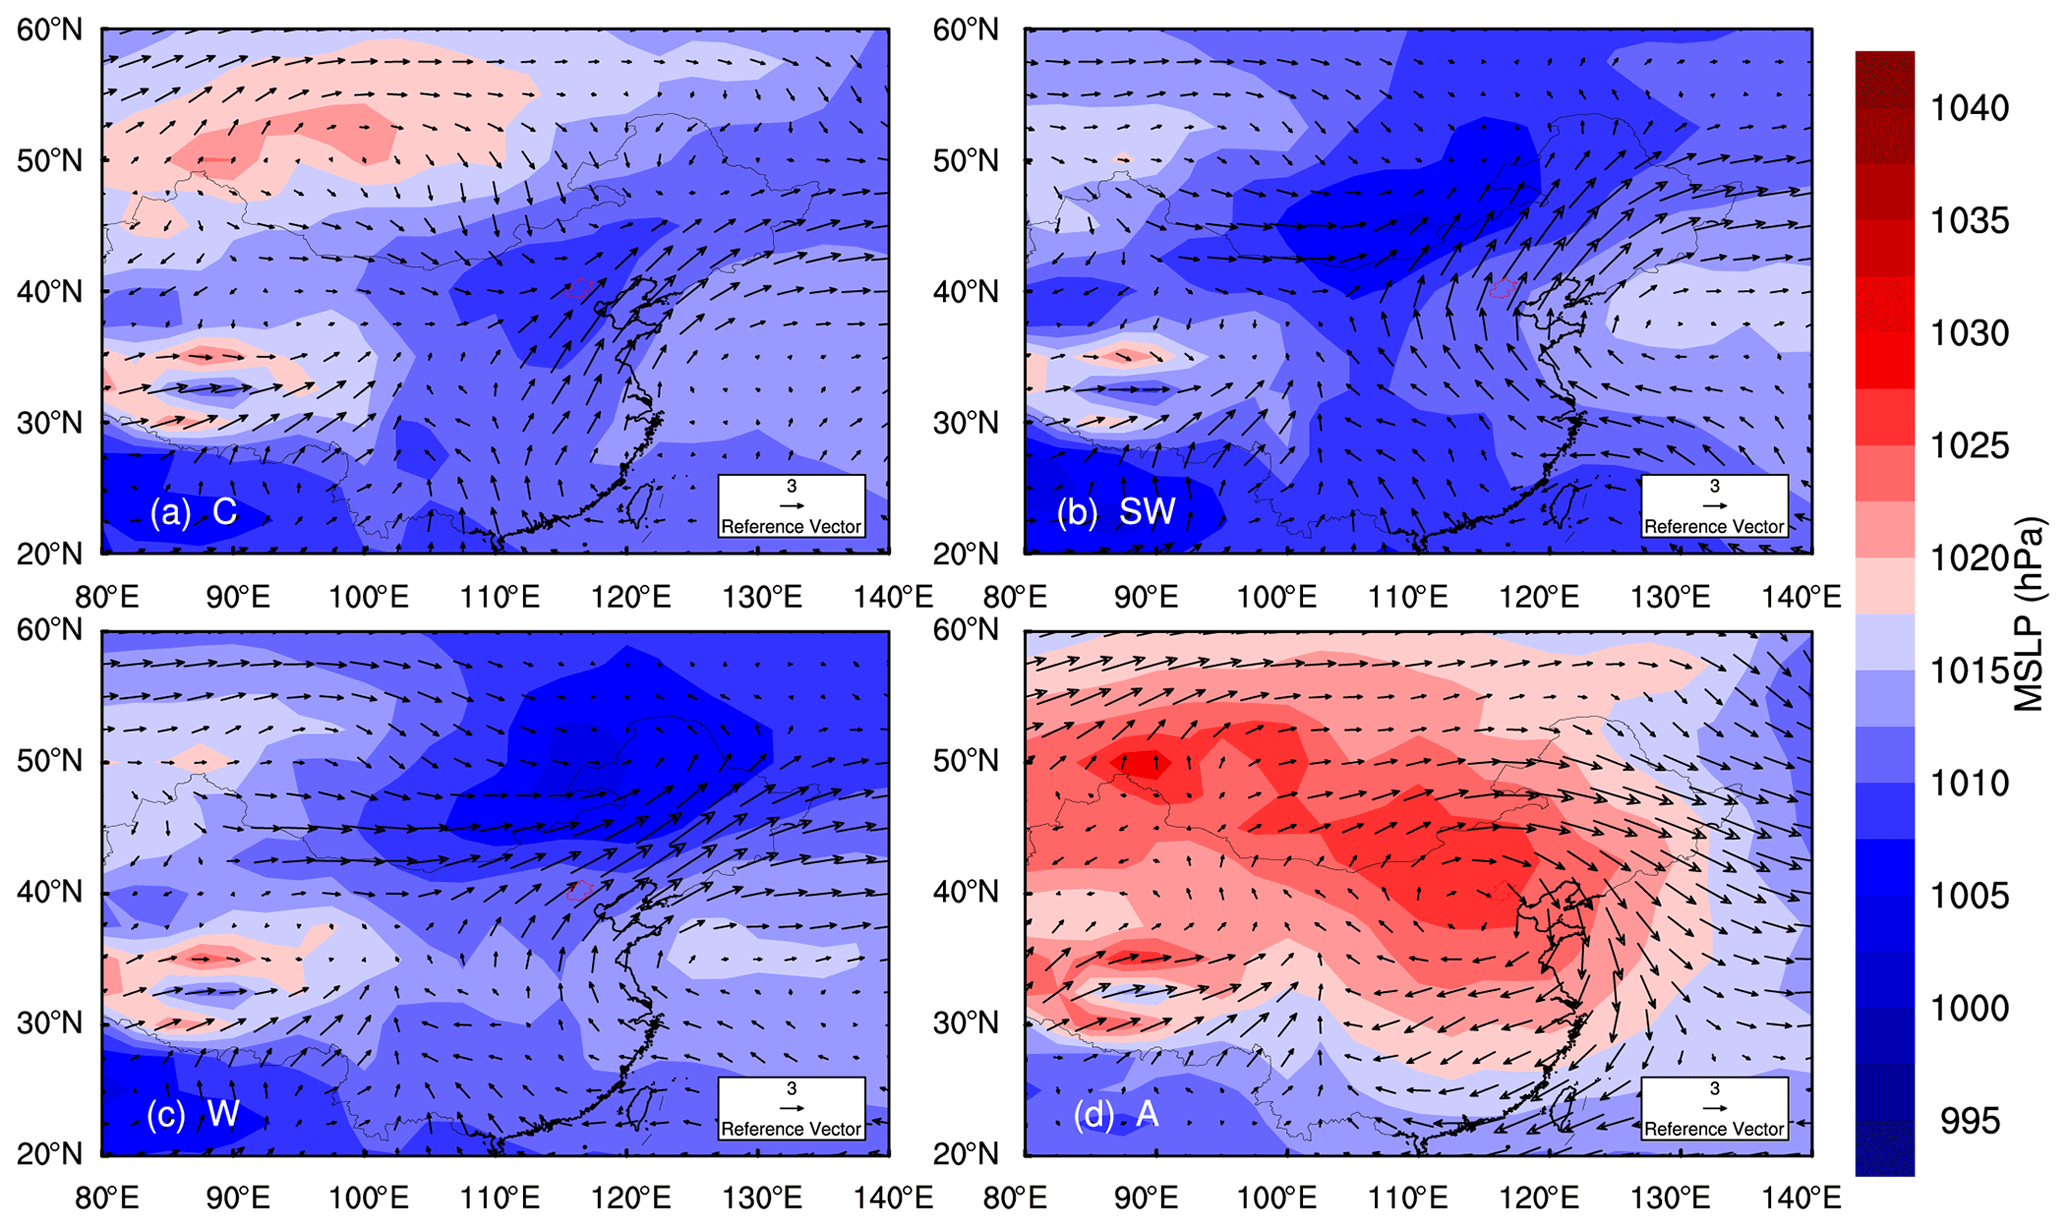
Figure 3The daily MSLP (shaded; units: hPa) and wind fields at 925 hPa (vectors; units: m s−1) for types C (a), SW (b), W (c), and A (d) from 2018 to 2019.
The pollution intensity is closely related to the large-scale weather circulations. Although the dominant synoptic patterns in different seasons vary greatly, the modulating effects on air pollution of specific circulation types in different seasons are similar (Liao et al., 2017; Li et al., 2020). The spatial distribution of PM2.5 in Beijing under pollution types C, SW, and W and clean type A is shown in Fig. 4. Type C had the highest pollution level, with the PM2.5 concentration increasing from 60 µg/m3 in the northwestern mountainous area to 90 µg/m3 in the south-central plain area, which was significantly higher than the values for types SW and W. Type A was highly ventilated, with a PM2.5 concentration below 30 µg/m3 in most areas. Under the influence of semibasin topography surrounded by mountains on three sides (Fig. 1b), the pollution concentrations in all weather types were characterized by a gradual decrease from southeast to northwest in Beijing.
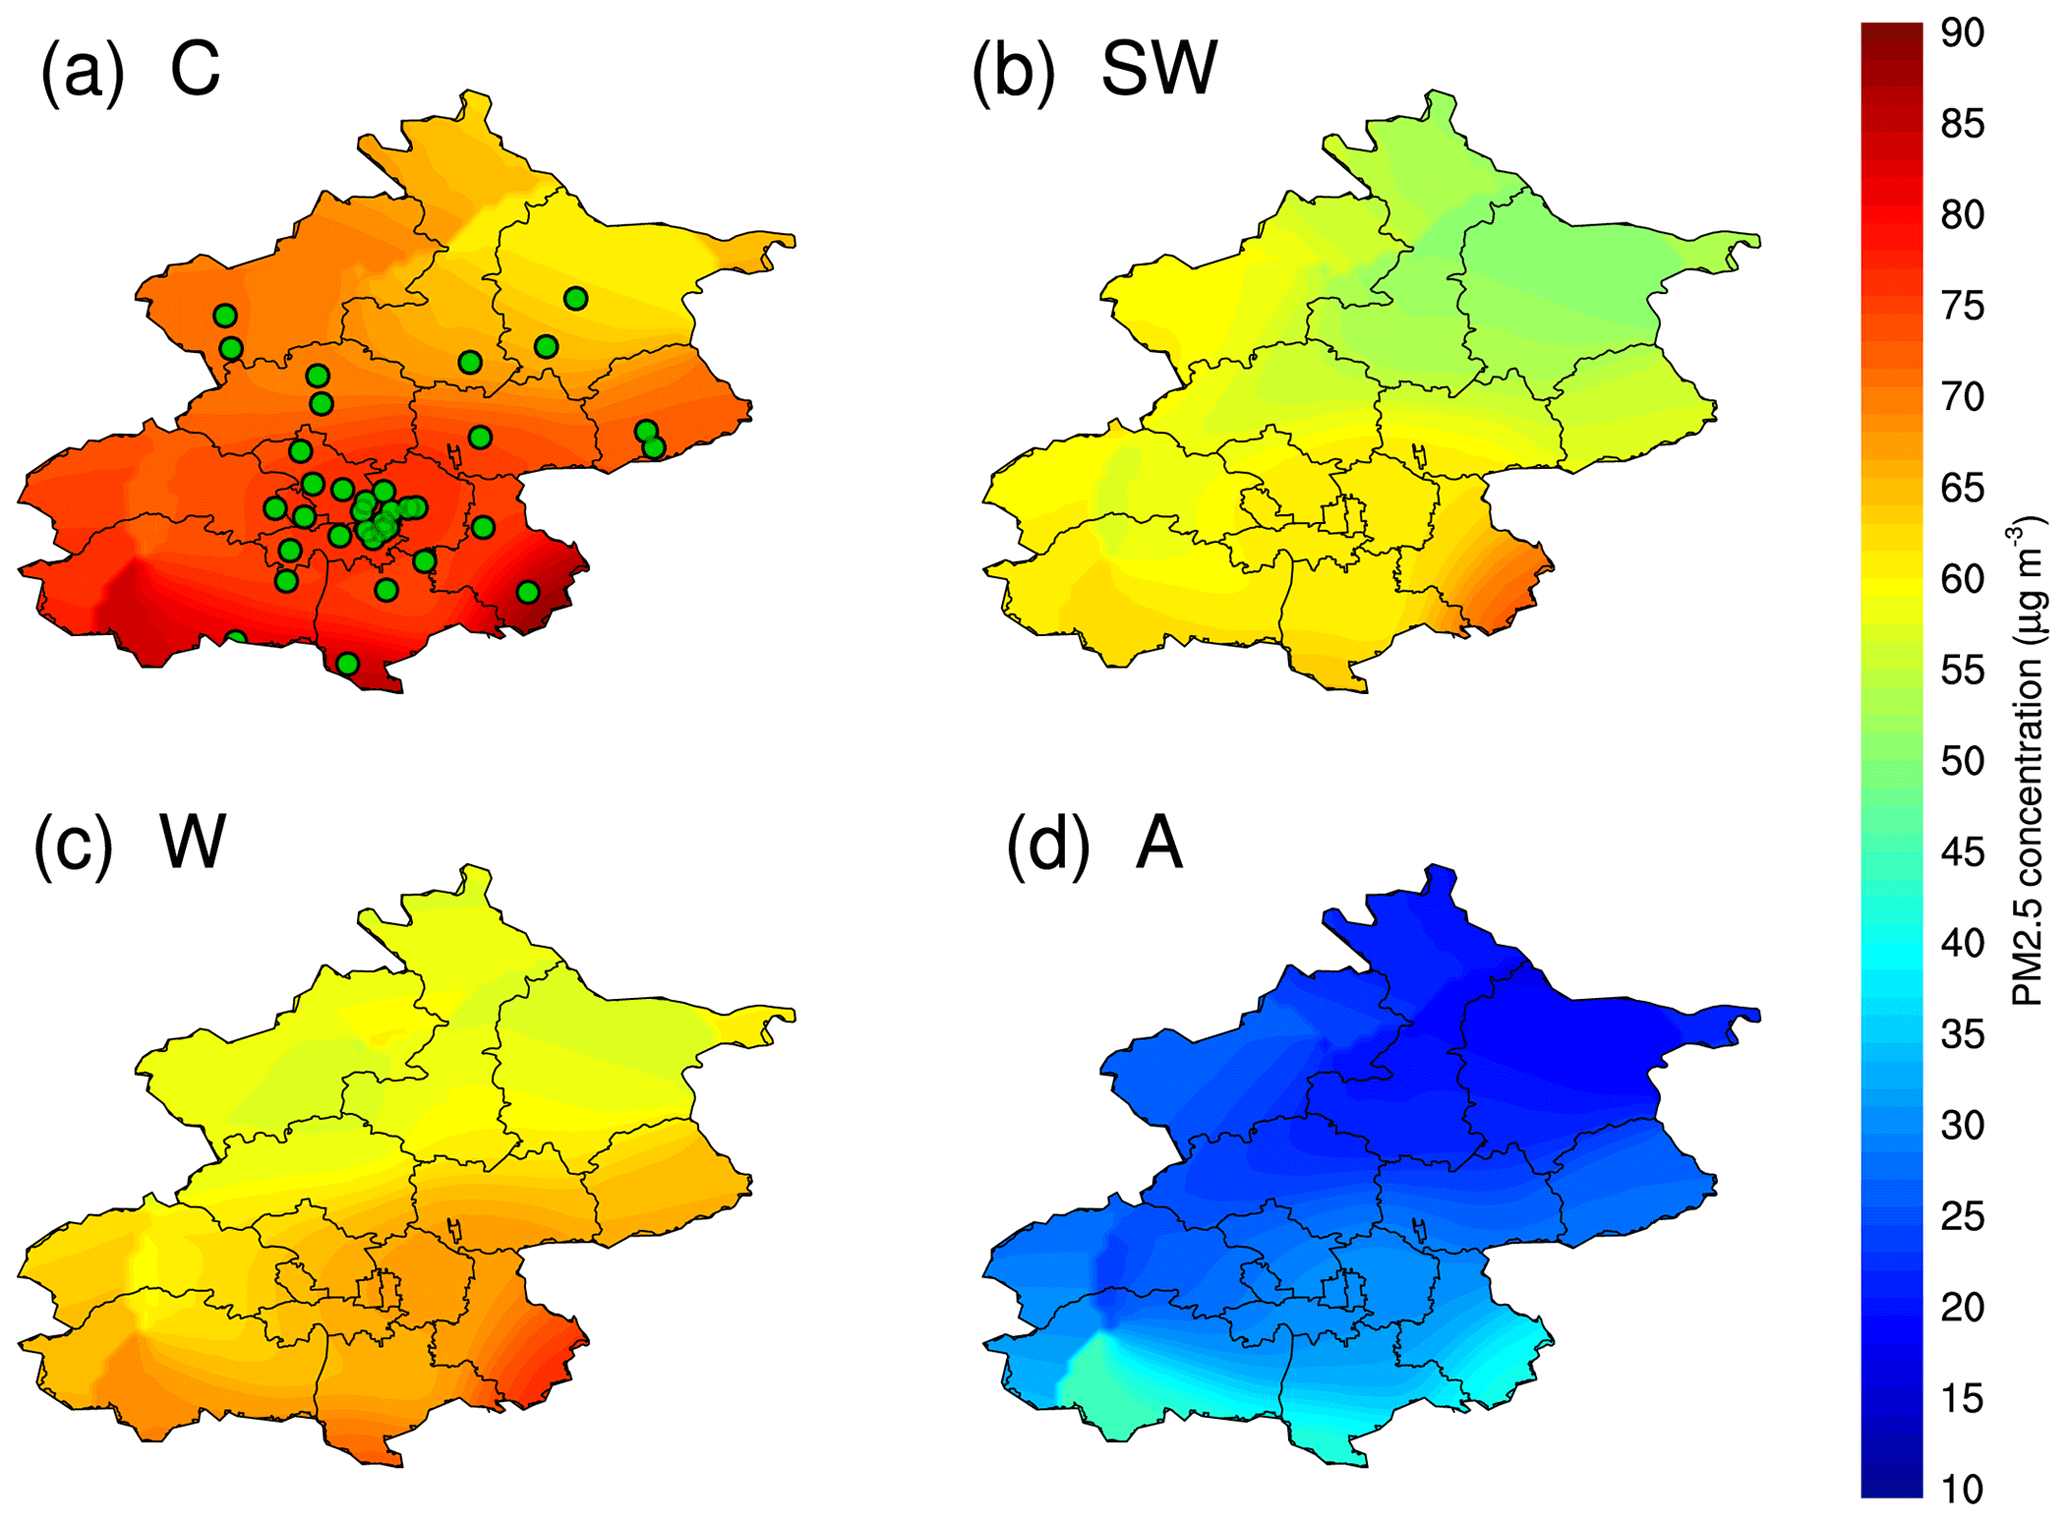
Figure 4The averaged PM2.5 concentration (shaded; units: 10−1 µg m−3) in Beijing for types C (a), SW (b), W (c), and A (d) from 2018 to 2019. The green dots in Fig. 4a indicate the locations of air quality monitoring sites in Beijing.
3.2 The flow field and thermodynamic structure of the PBL under typical weather types
As mentioned above, due to the special topography and geographical location in Beijing, both large-scale weather circulations and regional-scale thermal circulations have conspicuous effects on modulating pollution. In addition, the thermal and dynamic structure of the PBL also has an appreciable impact on the mixing and diffusion of pollutants. Therefore, the multiscale circulations can influence the pollution not only directly but also by changing the PBL structure indirectly. To reveal the mechanisms of how the coupling effects of multiscale circulations affect the PBL structure and air pollution under different synoptic patterns, we conduct an analysis of the horizontal flow field and vertical PBL structure in depth by choosing typical cases lasting 2 d in the same weather type (C, SW, W, and A). The typical cases are on 22 to 24 October, 26 to 28 July, and 15 to 17 May in 2019 and 28 to 30 December in 2018, respectively.
3.2.1 Multilayer PBL structure under type C circulation
The mainland was governed by low pressure under type C synoptic circulations, and the ambient winds were mainly southwesterly (Fig. 3a). On the afternoon of the 22nd, the plain breezes in central Hebei, which were induced by thermal contrast between the mountain and plain, blocked weak environmental winds and the direct transportation of pollutants to Beijing (Fig. 5a). The westerly and the northerly mountain breezes began to prevail at night, while the conversion from sea breeze to land breeze was not obvious (Fig. 5b). The onshore winds in the coastal area were notably larger than the northerly mountain breezes in southern Chengde (SCD), which were diverted to the west and east. The diverted easterly winds converged with the onshore winds, enhancing the easterly winds and the eastern pollution transport channel. Sun et al. (2019) have found that the pressure gradients between the plain and mountain areas are critical causes of the easterly winds in Beijing. Consequently, easterly winds gathered with mountain breezes and formed a pollution convergent zone. Weak environmental winds not only made the pollution channels hard to establish but also caused the pollutants to recirculate southward by strong downslope breezes further in the early morning (Fig. 5c). A mesoscale convergence belt was generated in southeastern Hebei, providing conditions for the transportation of pollutants later. At noon on the 23rd, the intensified plain winds transported high concentrations of aerosols from the right side of the convergence belt to Beijing (Fig. 5d). Large-scale environmental winds were strengthened and dominated in the afternoon (Fig. 5e), leading to the establishment of the southern and eastern pollution transport channels and further exacerbating the air quality. On the night of the 23rd, easterly winds were observably strengthened again, joining with the downslope breezes and the ambient southerly flows (Fig. 5f). The four directional airflows formed a convergent zone that caused pollutants to accumulate dramatically in the plain areas. This convergent region that is generated by the coupling effect of large-scale circulation and regional-scale mountain breezes at night also appeared in other pollution types, as is discussed later.

Figure 5The surface winds (vectors; units: m s−1) in the NCP and PM2.5 concentration at the Beijing (shaded; units: 10−1 µg m−3), Hebei, and Tianjin monitoring sites (scatter; units: 10−1 µg m−3) of different times (local time) for type C. The dashed line represents the convergence belt. The arrow lines represent the pollutant transport channels. The rectangle represents the convergent zone.
The PBL under type C circulation presented a multilayer structure without diurnal variation (Fig. 6a). The highly stable structure and weak ambient winds resulted in a higher aerosol concentration near the surface than that in the other pollution types (Fig. 4). The pollution decreased from bottom to top within the PBL and was characterized by a gradient distribution. It is consistent with previous research (Jiang et al., 2021) showing that the top PBL height is equal to the maximum detection range of wind lidar. In the daytime, environmental southwesterly winds dominated within the PBL. In the horizontal flow field, zonal winds from Tianjin to the southeast of Beijing turned to be easterly winds, and the northerly downslope winds in Beijing were strengthened later on the night of the 22nd (Fig. 5b, c). Inside the PBL, easterly and northerly winds extended to 600 m above the ground from 20:00 Beijing time on the 22nd to 10:00 Beijing time on the 23rd (Fig. 6b, c); thus the directional shear of meridional and zonal winds increased considerably. The shallower nocturnal PBL coincided with the zero-speed zone between the upper environmental winds and lower regional-scale breezes with the largest directional shear (Fig. 6b, c). Variations in the vertical dynamic structure in the PBL drove the thermal structure to adjust. Warm air advected by large-scale southwesterly winds overlay the cold air advected by regional-scale northeasterly breezes. Consequently, a conspicuous advective temperature inversion occurred near the shallower nocturnal PBL at 08:00–09:00 Beijing time on the 22nd and 00:00–11:00 Beijing time on the 23rd, ranging from 600 to 900 m above the ground (Fig. 6d). The Richardson number Ri away from the temperature inversion structure was less than 0.25 (turbulent region) during the night, while it increased considerably from the periphery of inversion and was larger than 1.0 (stable region) promptly. The sharp jump of Ri from the turbulent region to the stable region of inversion indicated a vertical stratified structure inside the PBL. The result suggested that the nocturnal PBL has an inhomogeneous stratification structure characterized by strong variations in Ri accompanied by inversion structure (Fig. 6e). However, the relatively stronger northerly breezes compared to the environmental winds made the pollutants recirculate southward horizontally; the wind shear developed so high that the dynamically stable region was above 300 m and the inversion was above 600 m. The pollutants dispersed vertically to some extent consequently (Figs. 5c, 6c). Compared to the previous night, the ambient winds on the night of the 23rd were stronger; thus, both southern and eastern transport channels were established, along with the pollution convergent zone (Fig. 5f). The weak easterly and northerly winds were lower than 300 m (Fig. 6b, c), resulting in temperature inversion and stable stratification connected to the ground. A high concentration of pollution was accumulated in the convergent zone horizontally and trapped below the lowest PBL vertically. Thus, the PM2.5 concentration on the night of the 23rd was significantly higher than that on the 22nd.
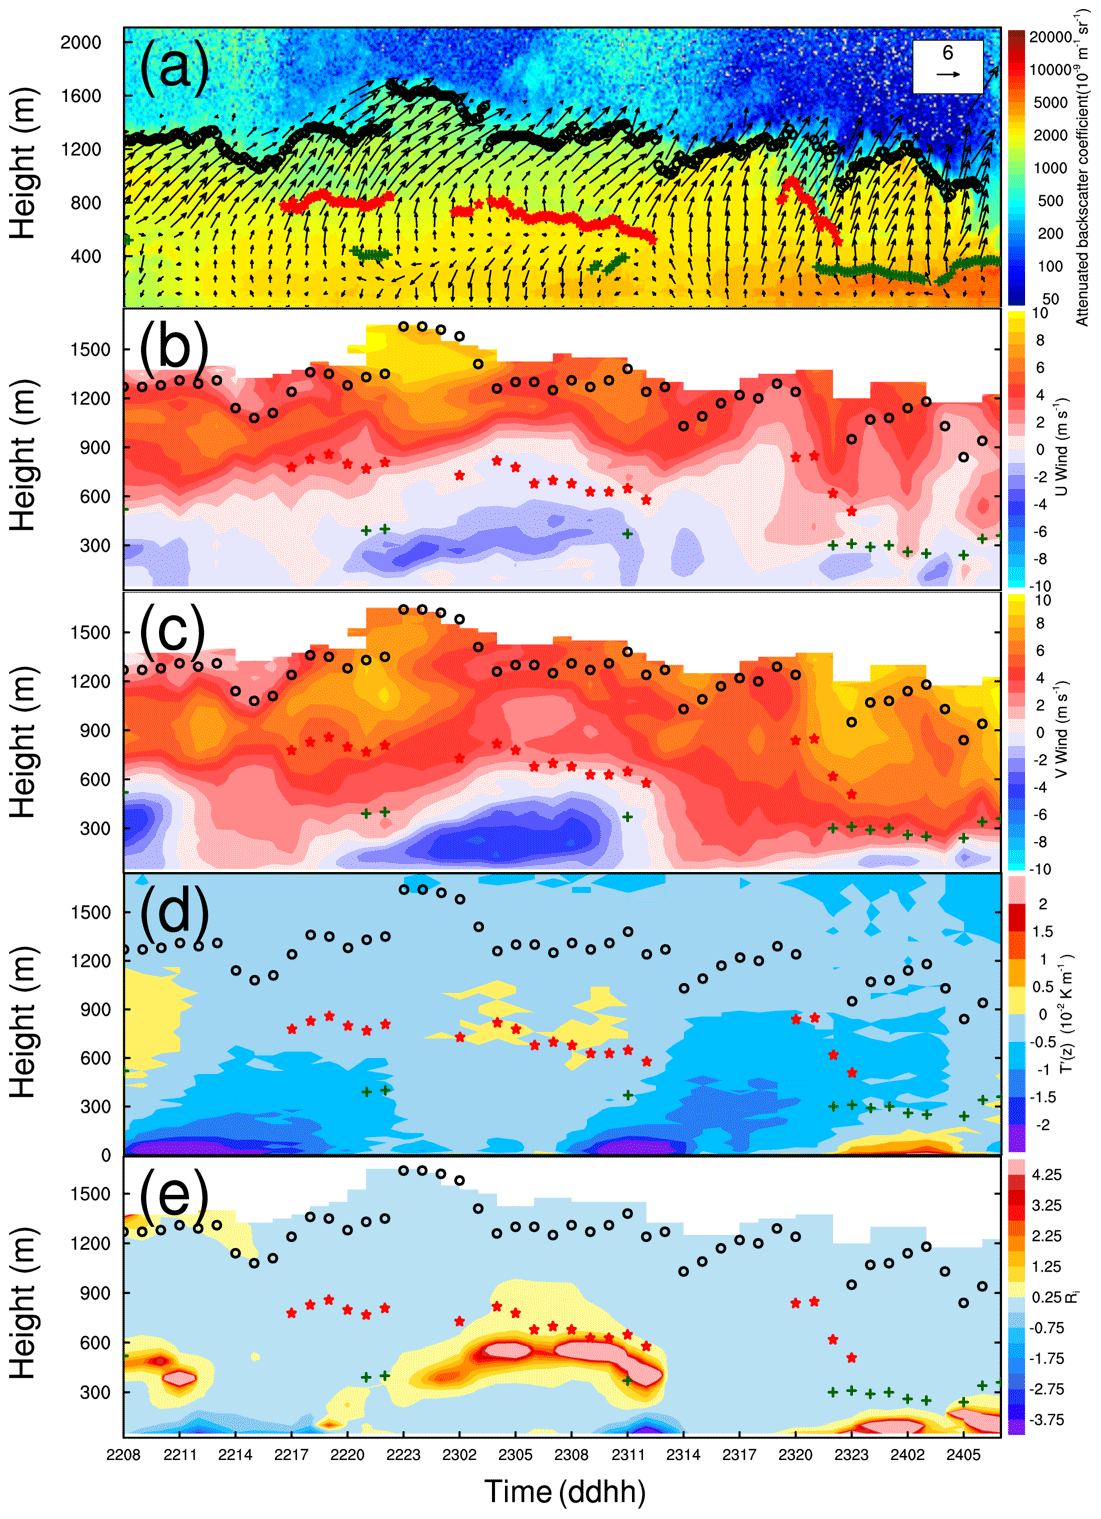
Figure 6Attenuated backscatter coefficient (shaded; units: 10−9 m−1 sr−1) measured by a ceilometer and horizontal winds (vectors; units: m s−1) measured by lidar (a), zonal-wind-component speeds (shaded; units: m s−1) (b), meridional-wind-component speeds (shaded; units: m s−1) (c), gradient of temperature T′(z) (shaded; units: K km−1) measured by an MWR (d), and Richardson number (shaded) (e) for type C. The green crosses, red stars, and black hollow dots represent the lowest, middle, and top PBLH (planetary boundary layer height), respectively.
3.2.2 Mono-layer PBL structure under type SW circulation
Under type SW circulation, the easterly wind component increased in southeastern Hebei and the Bohai Sea, and the velocity of environmental winds was appreciably higher than that in type C (Fig. 3b). On the early morning of the 26th, mountain breezes carrying clean air masses prevailed in Beijing, and the air quality was good (Fig. 7a). The basic southerly winds dominated in the Beijing–Tianjin–Hebei region in the afternoon, transporting pollutants northward and causing airflow to converge in plain areas (Fig. 7b). However, pollutants were ventilated horizontally by strong ambient winds and diffused vertically by the intensified turbulent mixing within the growing ML, so the aerosol concentration grew slowly during the day (Fig. 8a). At night, the mountain breezes were strengthened, while the ambient southerly winds were weakened; hence, the pollutants were transported to Beijing via the eastern pollution channel (Fig. 7c). Multiscale circulations of different directions joined and generated a convergent zone in the plain area. Afterwards, easterly flows were further strengthened and transported pollutants to Beijing continuously, and the severely polluted area moved westward (Figs. 7d, 8a). In the daytime of the 27th, the ambient winds prevailed again, and strong ambient winds removed pollutants by enhancing the ventilation and turbulent mixing (Figs. 7e, 8a). Therefore, the PM2.5 concentration decreased instantly, and the air quality in the Beijing–Tianjin–Hebei region improved markedly (Fig. 7f).
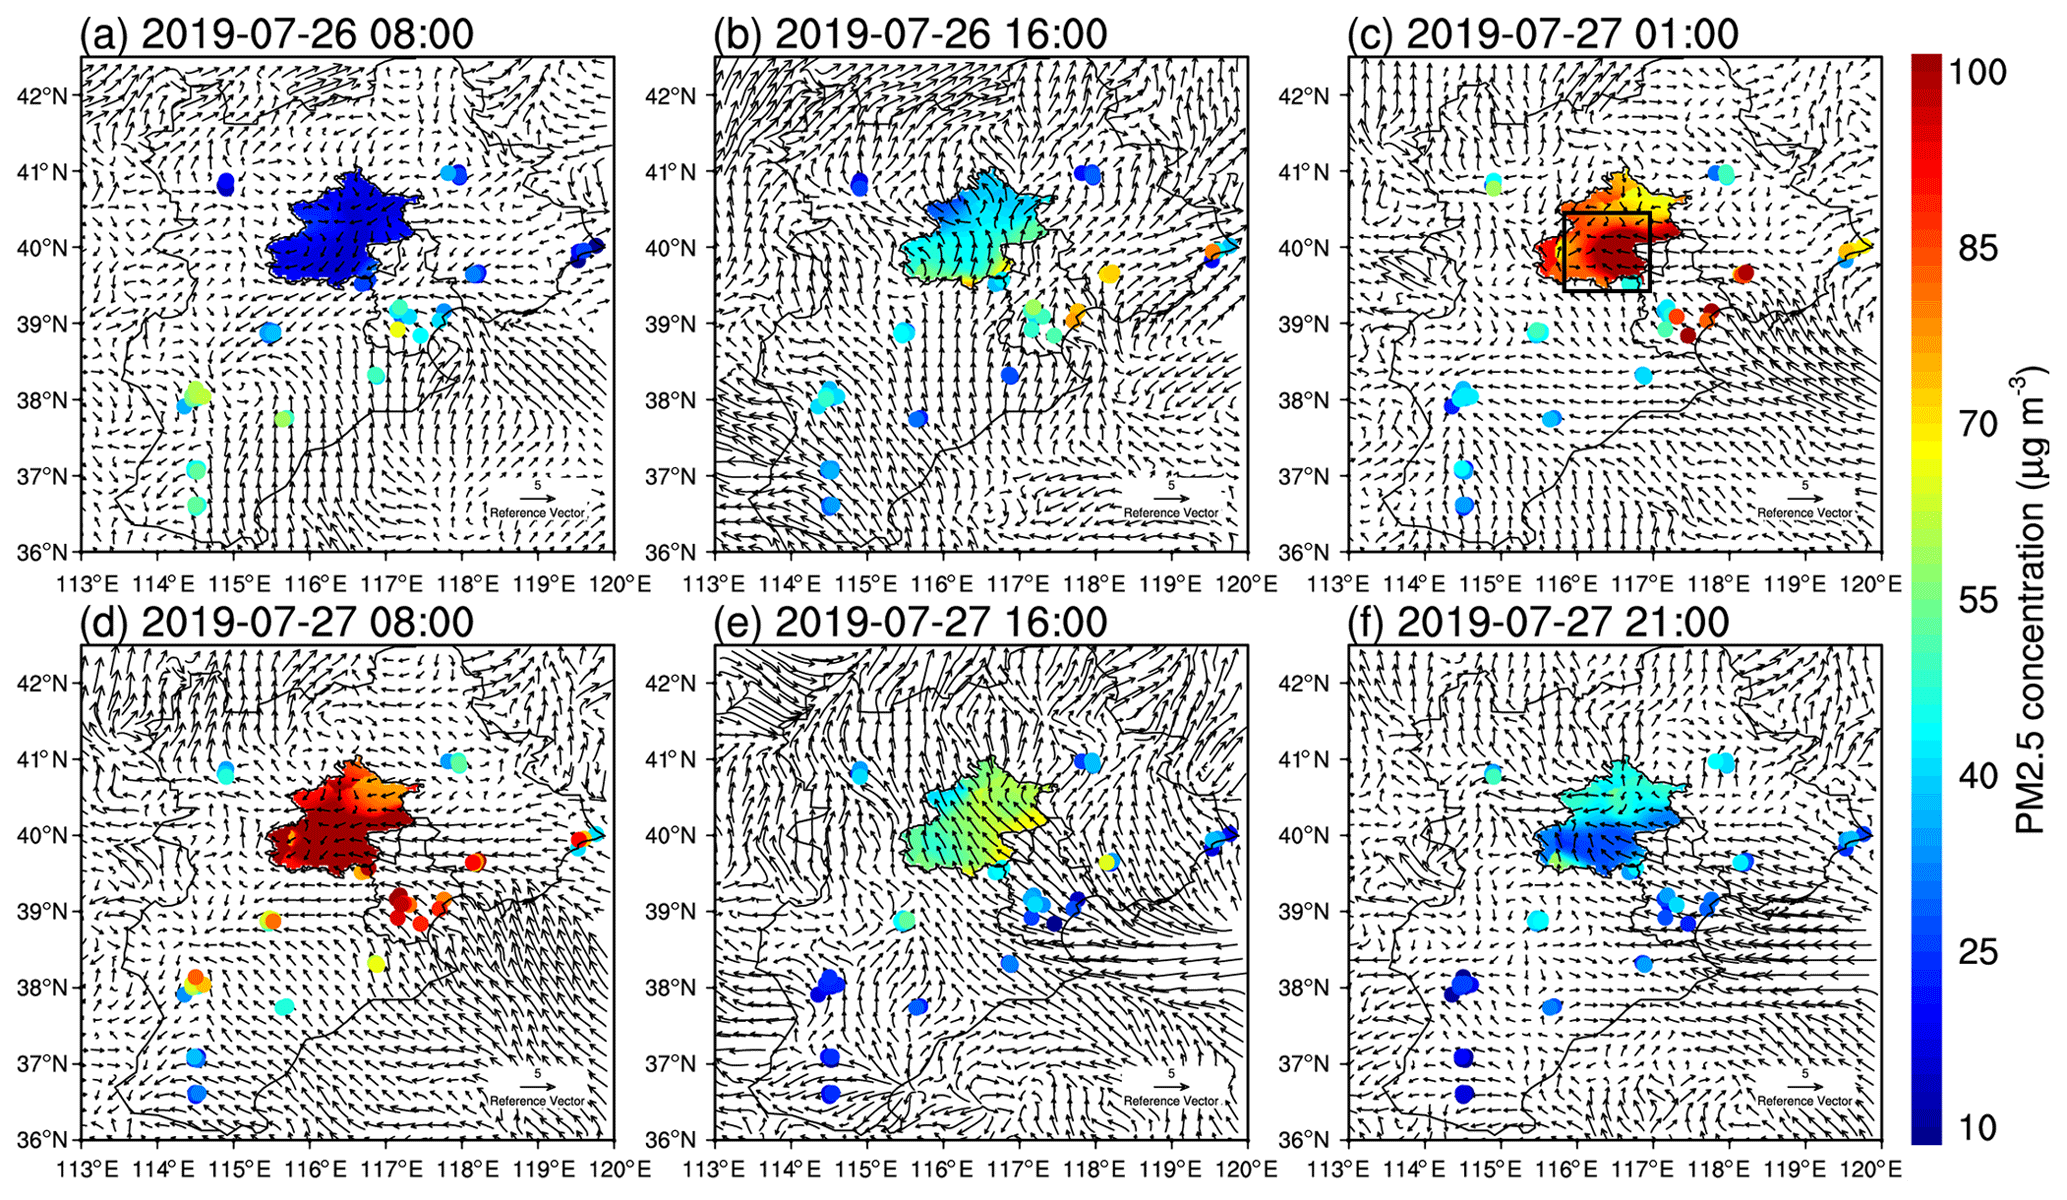
Figure 7The surface winds (vectors; units: m s−1) in the NCP and PM2.5 concentration at the Beijing (shaded; units: 10−1 µg m−3), Hebei, and Tianjin monitoring sites (scatter; units: 10−1 µg m−3) of different times (local time) for type SW. The rectangle represents the convergent zone.
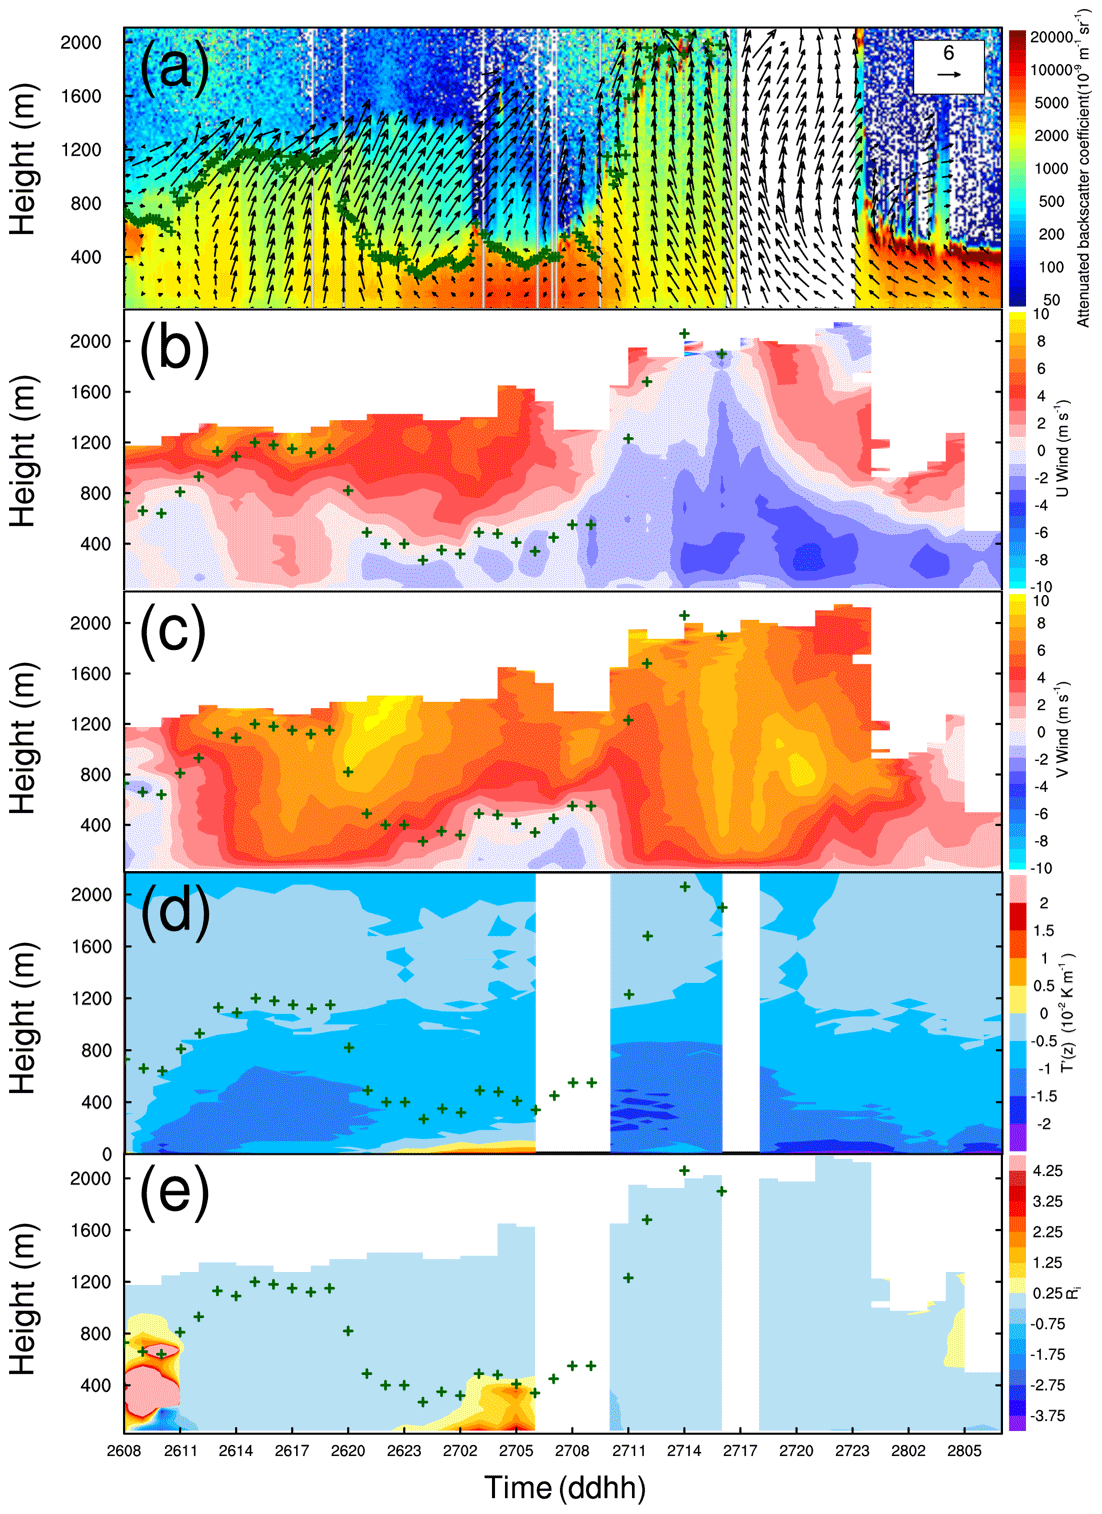
Figure 8Attenuated backscatter coefficient (shaded; units: 10−9 m−1 sr−1) measured by a ceilometer and horizontal winds (vectors; units: m s−1) measured by lidar (a), zonal-wind-component speeds (shaded; units: m s−1) (b), meridional-wind-component speeds (shaded; units: m s−1) (c), gradient of temperature T′(z) (shaded; units: K km−1) measured by an MWR (d), and Richardson number (shaded) (e) for type SW. The green crosses represent the PBLH.
Unlike type C, the PBL presented a monolayer structure in type SW, and the aerosol within the PBL was uniformly distributed (Fig. 8a). Furthermore, the PBL had an obvious diurnal variation, and the maximum detection distance of wind lidar was only consistent with the top ML in type SW. The nocturnal PBL and the growing or collapsing ML were usually lower than the maximum detection distance, indicating that there were residual aerosols above the PBL. In the daytime of the 26th, southwesterly winds dominated within the PBL, and the temperature lapse rate was greater than 0.5 ∘C/100 m. Along with radiation reinforcing turbulent kinetic energy, the PBL rose to 1200 m. Pollutants were transported to Beijing but mixed vertically (Fig. 8a), so the PM2.5 concentration near the surface grew slowly (Fig. 7b). On the night of the 26th, the regional-scale circulation developed upward, and the vertical wind shears between the lower regional breezes and upper environmental winds were strengthened prominently (Fig. 8b, c). The warm advection overlay the cold advection resulted in advective inversion, forcing the PBL to adjust to become stable (Fig. 8d). Correspondingly, Ri experienced an appreciable increase from the turbulent region above the PBL to the stable region of below the PBL (Fig. 8e). The nocturnal PBL has a homogeneous, dynamically stable structure. Similarly to type C, a high concentration of pollutants was trapped below the zero-wind-speed zone, where the nocturnal PBL was located. In the daytime of the 27th, large-scale environmental winds within the PBL were strengthened greatly. The PBL height was 800 m higher than that of the previous day; thus, the pollutants were advected horizontally and diffused vertically (Fig. 8a). The basic southerly winds with high speed prevailed in central and southern Beijing on the night of the 27th, preventing the mountain winds from flowing southward (Fig. 7f). As a result, no vertical shear of meridional winds occurred in the dynamic field (Fig. 8c), and no temperature inversion occurred in the thermal field (Fig. 8d). The PM2.5 concentration was further reduced. It can be inferred that the temperature inversion in type SW was generated by the vertical thermal contrast of meridional winds. When the meridional winds were uniformly southerly winds within and above the PBL, the air masses in the upper layer had the same thermal properties as in the lower layer, which will reduce the vertical wind shear and destroy the stable inversion structure.
3.2.3 Hybrid-structure PBL under type W circulation
Under type W circulation, strong easterly winds transported a high concentration of aerosols to Beijing through the eastern pollution channel, and the PM2.5 concentration had already reached a high level in the early morning (Fig. 9a). Taking the mountain as the boundary, environmental westerly winds prevailed in northwestern Hebei, and southwesterly winds prevailed in southern Hebei in the afternoon. The two directional flows carried pollutants and formed a convergence belt along the western mountains (Figs. 3c, 9b). This distribution of synoptic circulations in type W was conducive to the occurrence of severe pollution around mountains. Similarly to other pollution types, the ambient winds converged with region-scale mountain breezes at night, forming a convergent zone (Fig. 9c). The convergent zone moved southward later because of intensified mountain breezes (Fig. 9d). The large velocity of environmental winds leads to strong ventilation (Fig. 9e). In addition, the increasing PBL made the pollutants diluted vertically, and the air pollution was alleviated temporarily. On the night of the 16th (Fig. 9f), the synergistic effects of multiscale circulations led to the convergent zone again, and pollution occurred in the easterly flows with a high PM2.5 concentration.
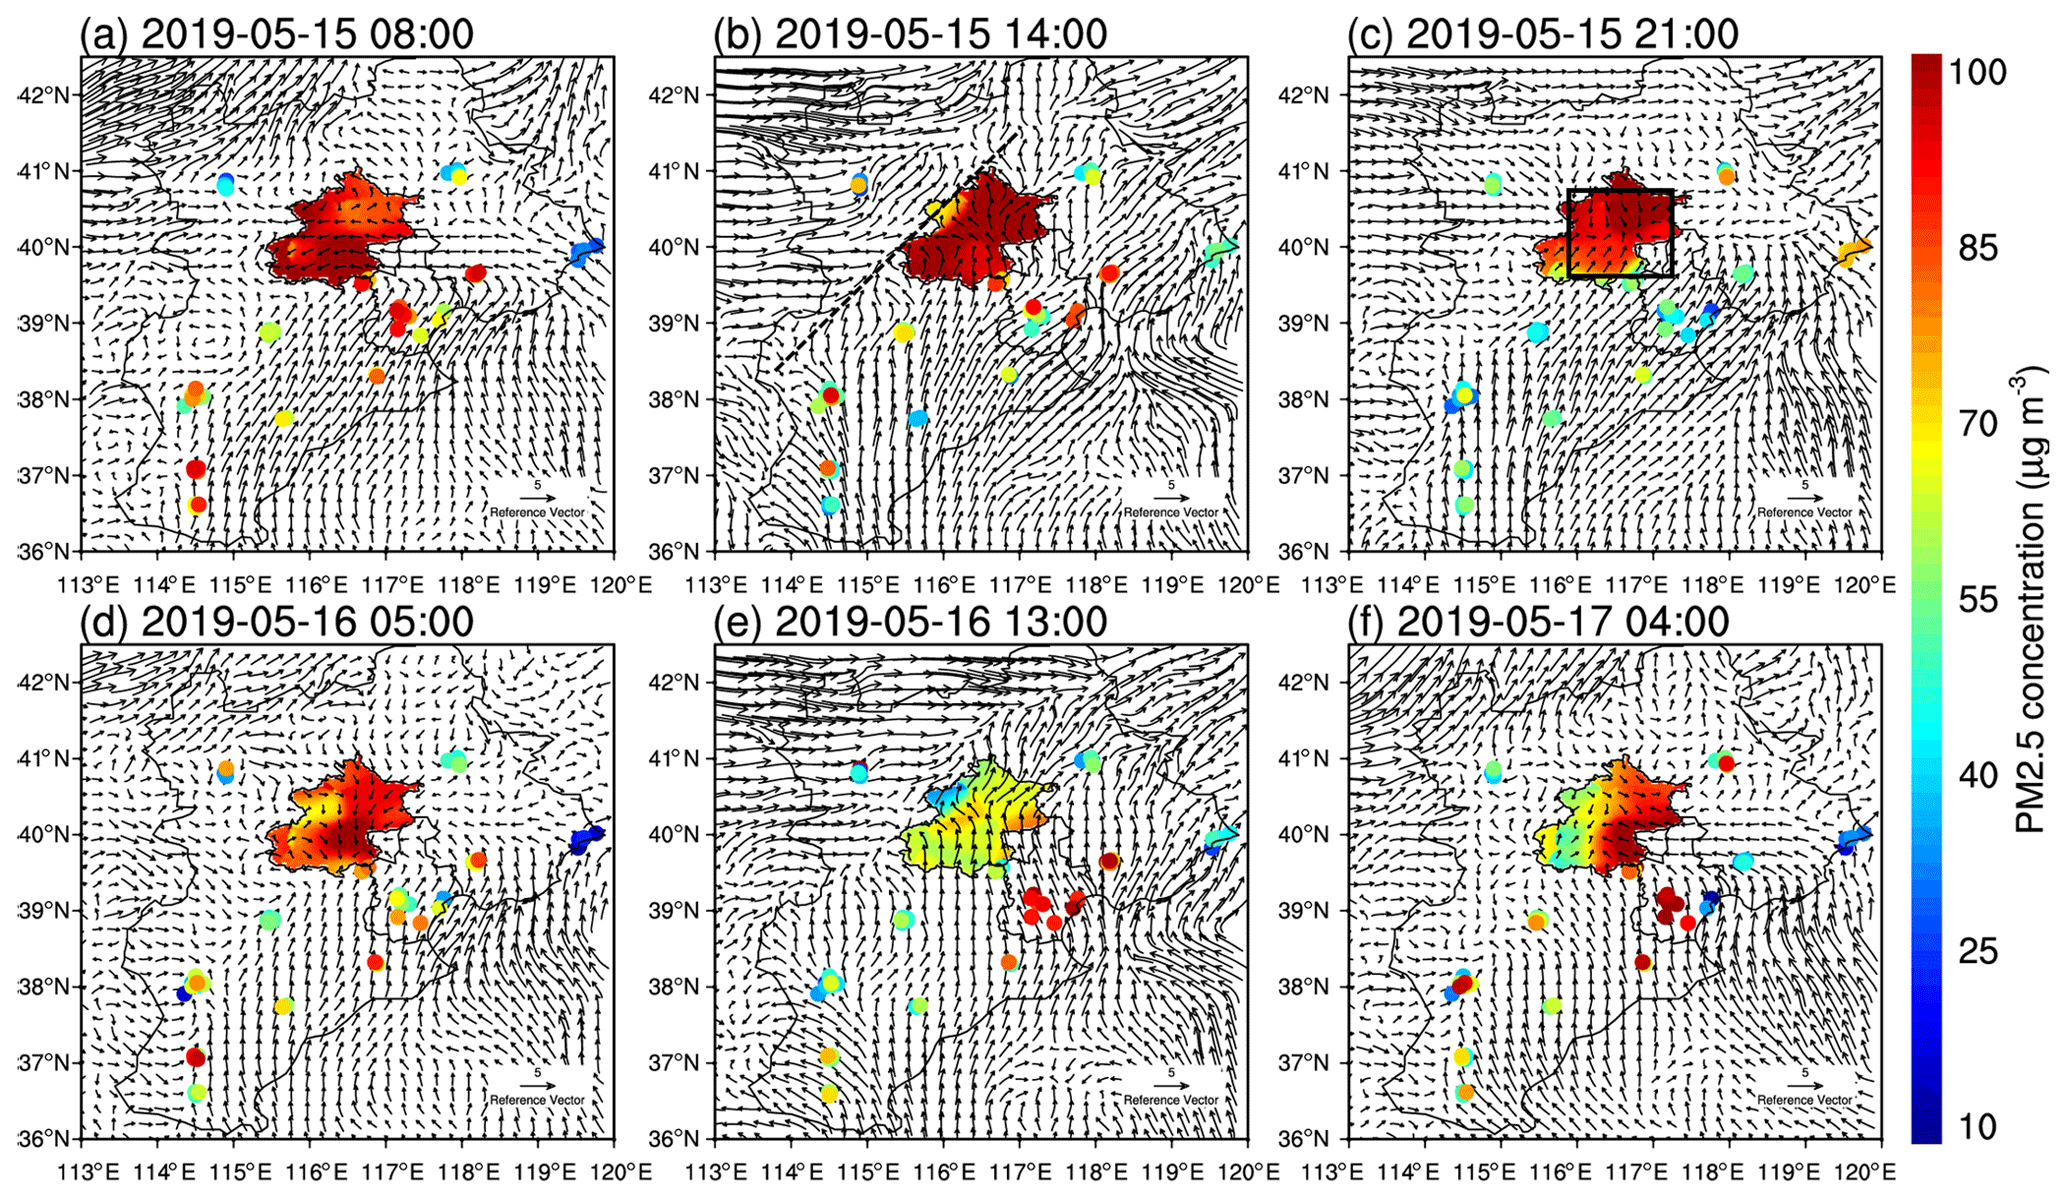
Figure 9The surface winds (vectors; units: m s−1) in the NCP and PM2.5 concentration at the Beijing (shaded; units: 10−1 µg m−3), Hebei, and Tianjin monitoring sites (scatter; units: 10−1 µg m−3) of different times (local time) for type W. The dashed line represents the convergence belt. The rectangle represents the convergent zone.
The PBL under type W circulation presented a hybrid structure, having similar characteristics of types C and SW simultaneously. Similarly to type C, the aerosol concentration was characterized by a gradient distribution within the multilayer PBL (Fig. 10a). However, the PBL had an obvious diurnal variation, and the maximum detection distance of wind lidar was only consistent with the top ML in the daytime, similarly to type SW. Although the PBL height reached 1600 m in the daytime (Fig. 10a), the PM2.5 concentration at the surface did not decrease observably because of the massive pollution accumulated previously and the continuous emissions and transportation of pollutants (Fig. 9b). The mixing layer collapsed along the zero wind speed of meridional winds after sunset, and the breezes within the nocturnal PBL shifted northwest at night (Fig. 10b, c). In type W, zonal circulation dominated. The vertical shear of zonal winds was intensified significantly at night, while the vertical shear of meridional winds diminished. Therefore, it can be assumed that the temperature inversion in type W was produced by the vertical shear of zonal winds. The thermal contrast between the upper westerly winds and the lower easterly winds produced a deep inversion layer that existed from the surface to 500 m (Fig. 10d) as well as a dynamically stable structure with a depth exceeding 600 m (Fig. 10e). This is consistent with the findings of Hu et al. (2014) that westerly warm advection from the Loess Plateau was transported over the NCP and imposed a thermal inversion above the PBL. The top of the PBL was consistent with the top of the inversion and zero-wind-speed zone, and a high concentration of aerosols was trapped below the zero-wind-speed zone.
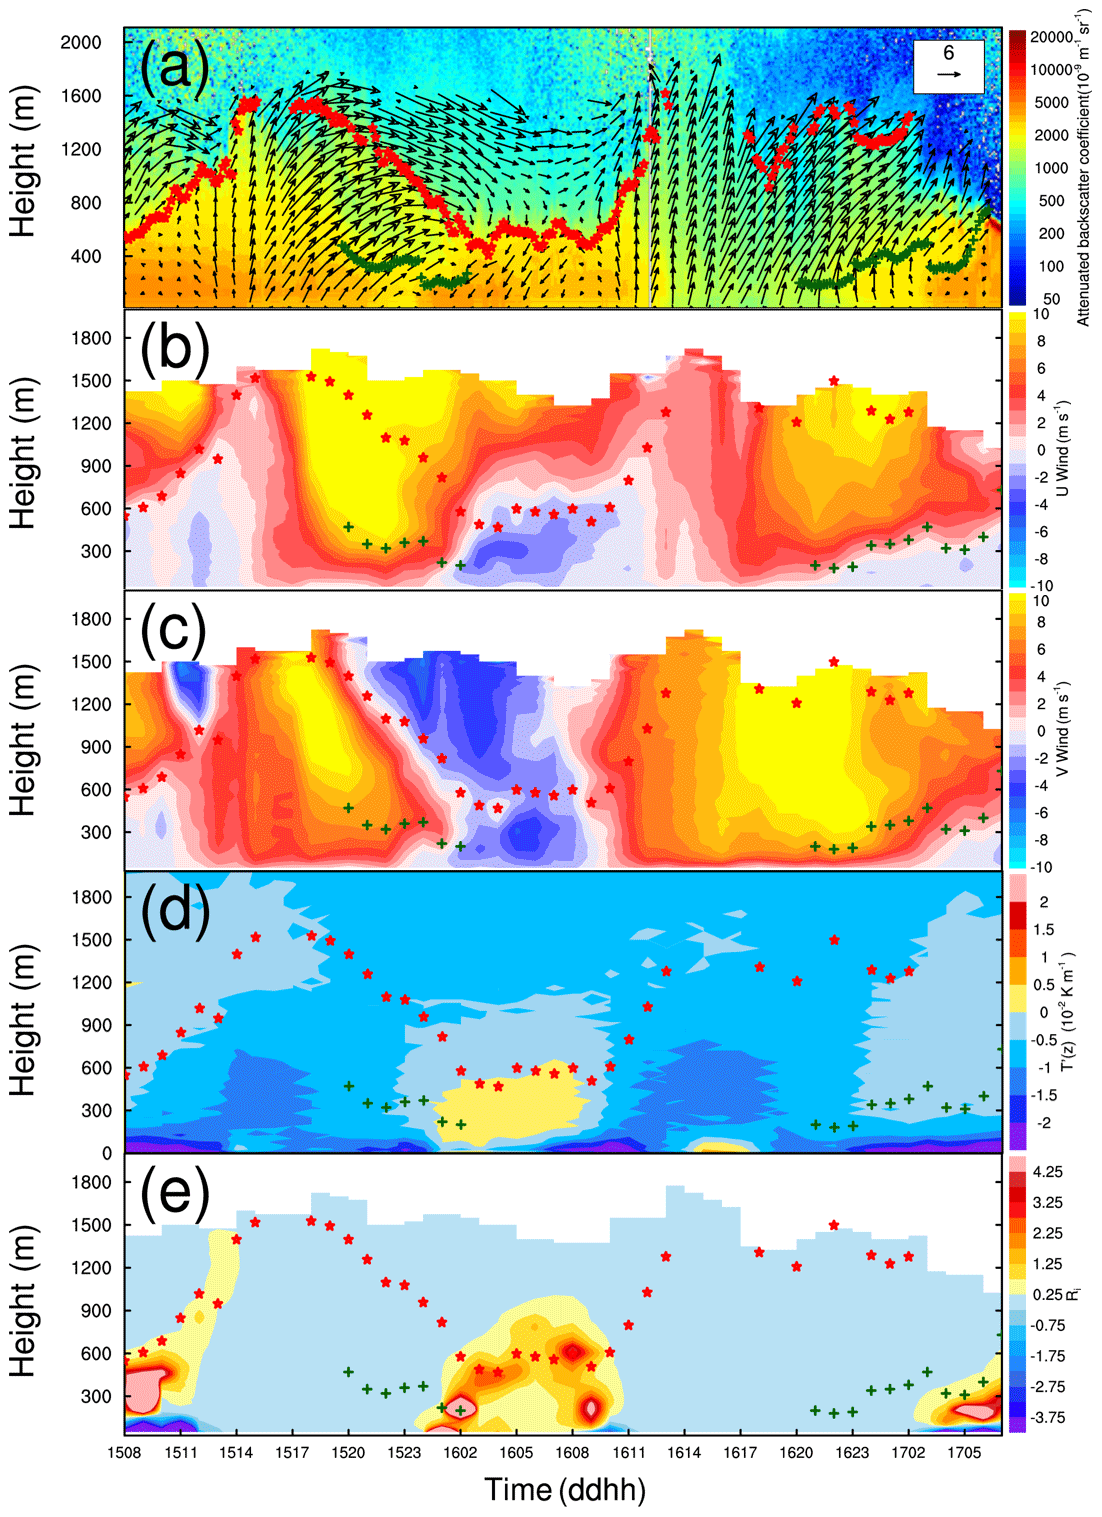
Figure 10Attenuated backscatter coefficient (shaded; units: 10−9 m−1 sr−1) measured by a ceilometer and horizontal winds (vectors; units: m s−1) measured by lidar (a), zonal-wind-component speeds (shaded; units: m s−1) (b), meridional-wind-component speeds (shaded; units: m s−1) (c), gradient of temperature T′(z) (shaded; units: K km−1) measured by an MWR (d), and Richardson number (shaded) (e) for type W. The green crosses and red stars represent the low and top PBLH, respectively.
3.2.4 Strong turbulent PBL structure under clean type A circulation
Strikingly different from the circulations of pollution types, the mainland was under high-pressure control in the clean type, and northwesterly winds with a high velocity carrying clean air masses moved southward (Fig. 11a). Strong winds were favorable for the turbulent mixing and the vertical dispersion of pollutants. In addition, the strong ventilation was beneficial to the horizontal spreading of pollutants. Due to the intense turbulent mixing, the vertical wind shear and the diurnal variation in the thermal field disappear, and there is no distinct PBL structure different from the free atmosphere (Fig. 11a, b). The lapse rate of temperature was greater than 1 ∘C/100 m, and Ri was less than 0.25 within the PBL (not shown). Although the aerosol concentration of the clean type was far less than that of pollution types, the PBL height was only 500 m at night (Fig. 11a). Sometimes, the PBL in the clean type was even lower than that of pollution types or extended to 2–3 km swiftly because of the instant upward diffusion of aerosol particulates. Unlike pollution types, the PBL height is inconsistent with the maximum detection range of wind lidar. Therefore, different circulation types should be distinguished when analyzing the long-term relationships between the PBL height and pollution concentration. As shown in Fig. 12c and d, under the governing of high pressure, descending and divergent airflows of the clean type dominated the whole lower and middle parts of the troposphere, and the sinking velocity was significantly higher than that of pollution types. The vertical velocity changed little vertically due to the northerly winds with a large speed penetrating downward. The intensity of sinking and divergence was higher at night than that in the day, with the strongest divergence occurring near the surface.
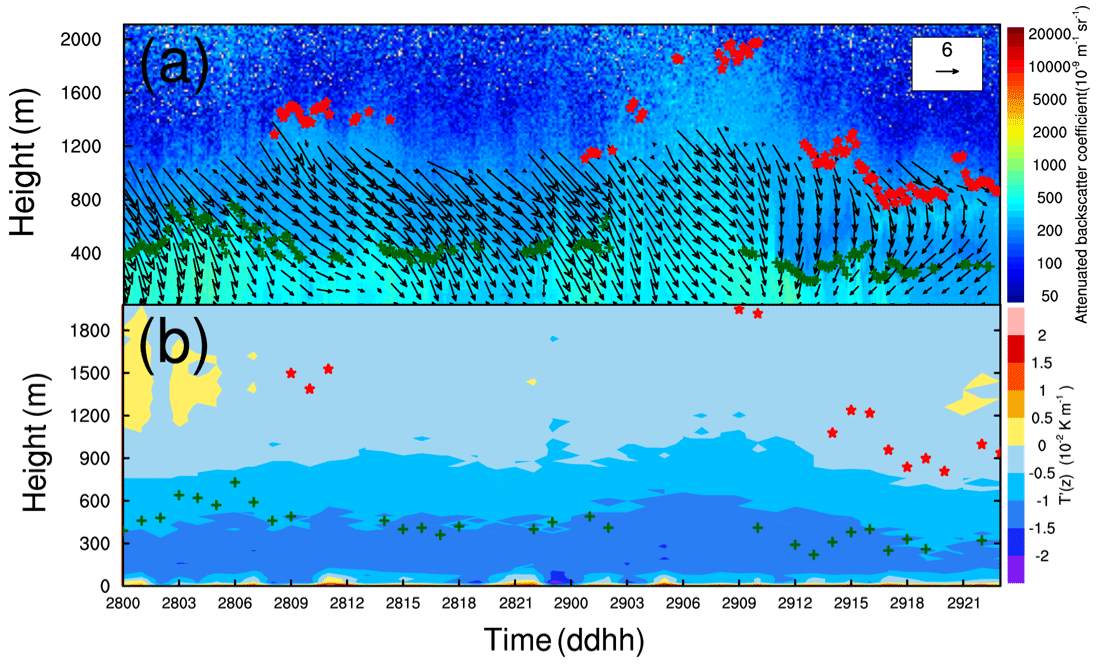
Figure 11Attenuated backscatter coefficient (shaded; units: 10−9 m−1 sr−1) measured by a ceilometer and horizontal winds (vectors; units: m s−1) measured by lidar (a); gradient of temperature T′(z) (shaded; units: K km−1) measured by an MWR (b) for type A. The green crosses and red stars represent the low and top PBLH, respectively.
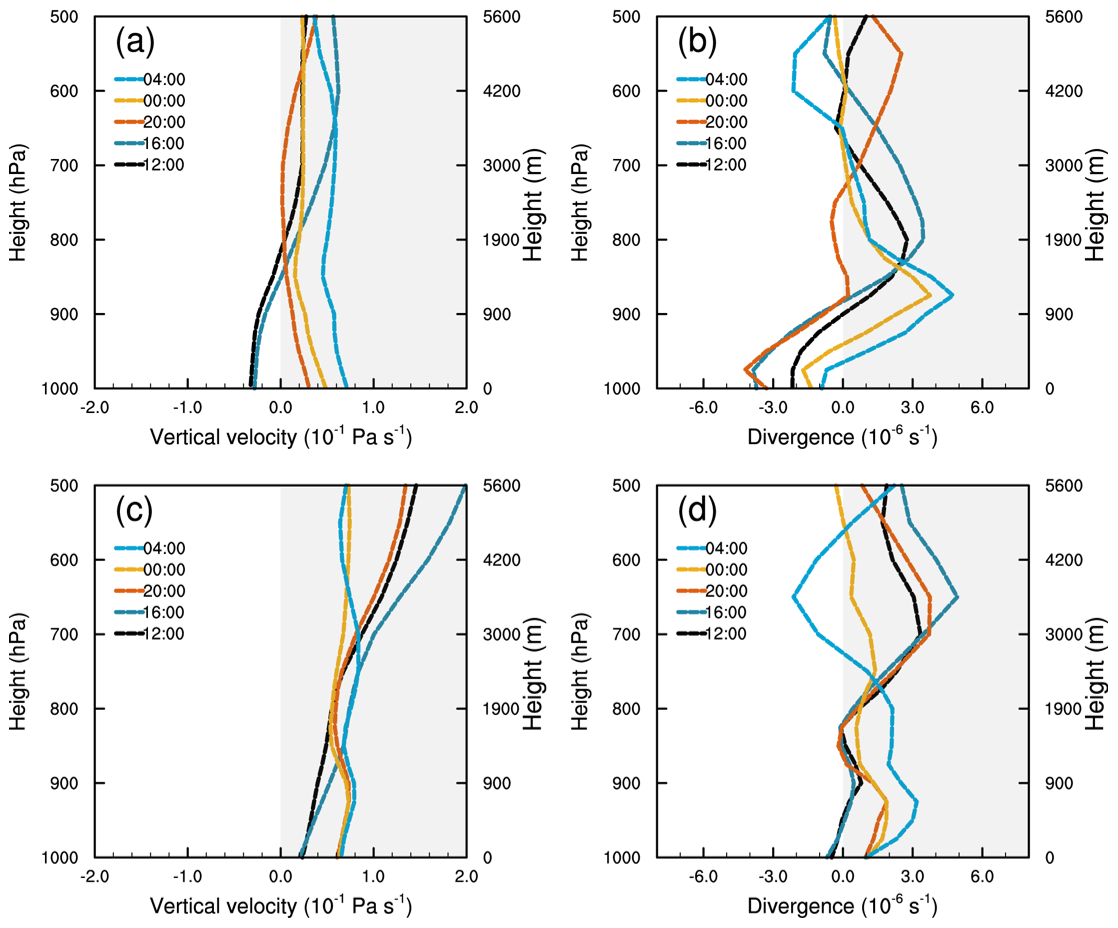
Figure 12The averaged vertical velocity (units: Pa s−1; negative (positive) value denotes updraft (downward) movement) (a, c) and divergence (units: 10−5 s−1) (b, d) of pollution types (a, b) and the clean type (c, d) in the North China Plain.
3.3 Multiscale-circulation coupling mechanism for air pollution
In addition to horizontal circulations, the vertical motion of basic airflows is also a crucial dynamic factor in forming a stable structure during pollution episodes. The pollution types shared similar vertical-motion characteristics as shown in Fig. 12. The basic flows at the bottom of the troposphere are convergence, and the flows above it are divergence at all times of the day (Fig. 12b). In the daytime, the environmental southerly winds were obstructed on three sides by mountains. Airflows slowed down or stagnated in the plain areas, forming the topographic convergence, while at night the convergence was caused by the joining of environmental winds and regional breezes, and the height of the convergent zone reduced simultaneously with the nocturnal PBL because the regional circulations developed below the shallower nocturnal PBL. Unlike the divergence field, the vertical velocity in the daytime differed from that in the nighttime because of the diurnal variations in PBL structure (Fig. 12a). In the daytime, the thermodynamic convection and the wind speed were enhanced expressively (Figs. 8a, 10a); thus the intensified turbulence will help the flows to move upward and cause the pollutants close to the ground to mix vertically within the PBL to some extent. However, the sinking and divergent flows were superposed above the PBL, preventing the pollutants from moving upward continuously and making it difficult for the aerosol particulates to diffuse beyond. As a consequence, the pollutants accumulate slowly in the daytime because of the common influences of horizontal topographic blocking and vertical upward mixing with the increasing PBL. However, at nighttime, as the thermodynamic convection weakened, and the inversion structure formed, it turned to be a sinking movement at the bottom of the troposphere when the cold northerly regional breezes prevailed. Wu et al. (2017) found that the descending motion of synoptic circulations contributed to a reduction in the PBLH by compressing the air mass. Therefore, massive pollutants were capped near the surface and accumulated rapidly at night under the convergent sinking motion accompanied by temperature inversion structure.
To sum up, different pollution patterns (C, SW, and W) have similar influential mechanisms that both horizontal- and vertical-coupling effects of the multiscale circulations have contributed to air pollution. The horizontal-coupling mechanism is shown in Fig. 1b. The environmental winds transport pollutants emitted from southern sources to Beijing, mainly through southern and eastern pollution channels. Large-scale environmental winds and regional-scale breezes are coupled, generating a convergent zone of four directional flows horizontally and aggravating the air pollution directly at night. The relative strength of winds makes the severely polluted area move around horizontally from 39 to 41∘ N. The schematic of Fig. 13 demonstrates that the vertical-coupling mechanism further influences the mixing and dispersion of pollution indirectly by changing the PBL structure. In the daytime, the sinking divergent flows overlaying the rising convergent flows within the PBL inhibit the continuous upward dispersion of pollutants. At night, the warm advection transported by the upper environmental winds overlies the cold advection transported by the lower regional breezes, generating strong directional wind shear and advective inversion, which are near the top of regional breezes. This dynamic structure forces the PBL to be a stable stratification. The nocturnal PBL is located at the zero-speed zone between the regional-scale breezes and the environmental winds, and the relative strength of winds determines the PBL height. The capping inversion cooperating with the convergent sinking motion within the PBL suppresses massive pollutants below the zero-speed zone.

Figure 13The schematic of the vertical-coupling mechanism of multiscale circulations for typical pollution types. The horizontal part is the background circulations of MSLP; the vertical part is the PBL thermodynamic structure over the NCP region.
This paper explores the direct regulatory effect and indirect coupling effect of synoptic circulations by choosing the most frequent pollution types and clean type classified by the LWT approach. The PBL thermodynamic structure and the severe-pollution area under typical circulation types are further investigated. Results suggest that different pollution patterns have similar influential mechanisms on PBL structure and air pollution. The direct regulatory effect of synoptic circulations plays a leading role in the daytime; large-scale southerly winds dominate and are favorable for the pollution transport to the NCP region and the accumulation in front of mountains in the early stage of pollution. However during the period of pollution, the relatively stronger southerly winds and the increasing PBL height are adverse to the accumulation of pollutants or even make pollutants ventilated horizontally and diluted vertically, while the indirect effect played a leading role in the nighttime by coupling mechanisms. The coexisting multiscale circulations at night, on the one hand, affect the pollution via the horizontal-coupling effect, which produces a pollution convergent zone of different-direction winds. The relative strength of winds makes the polluted area move around horizontally between 39 and 41∘ N. On the other hand, the multiscale circulations regulate the mixing and diffusion of pollutants by the vertical-coupling effect, which changes the PBL dynamic and thermal structure. Vertical shear between the ambient winds and regional-scale breezes leads to an advective-inversion structure with strong variations in Ri. The nocturnal shallower PBL is consistent with the zero velocity zone, where massive pollutants were suppressed below, and the relative strength of winds determines the PBL height.
The multilayer PBL under type C circulation has no diurnal variation. Weak ambient winds strengthen the mountain breezes observably at night, and as a result the vertical shear and temperature inversion can reach 600 and 900 m, respectively. An inhomogeneous stratification with sharp jump of Ri is formed from the periphery of inversion. The severely polluted area was located to the south of Beijing. The mono-layer PBL under southwesterly circulation with obvious diurnal variation can reach 2000 m in the daytime. Strong environmental winds restrain the development of regional breezes at night, the zero-speed zone is located at 400 m and the inversion generated by the vertical shear of meridional winds is lower than 200 m. Southerly winds within and above the PBL having the same thermal properties will diminish the vertical shear and damage the advective-inversion structure. The PBL under westerly circulation has a hybrid structure with both multiple aerosol layers and diurnal variation. The inversion is generated by the vertical shear of zonal winds. The polluted areas under southwesterly and westerly circulations are located more northerly. Clean and strong north winds are dominating under anticyclone circulation, the vertical shear and the diurnal variation in thermal field disappear and there is no distinct PBL structure.
This study suggests that synoptic-scale circulations or the regional-scale circulations do not influence the PBL structure and air pollution separately but by the synergistic ways instead. The new knowledge of the coupling mechanism of multiscale circulations has appreciable implications for deepening the understanding of the cooperation of influential factors in severe-pollution processes against the background of unique topography. The new findings on the PBL thermodynamic structure and the distribution of pollution provide a reference for forecasting the severe-pollution area under the most frequent synoptic-circulation types in Beijing. Although the essential impacts of synoptic-scale and regional-scale circulations on PBL thermodynamic structure are emphasized in the paper, the feedback impact of aerosols should not be neglected either when investigating the PBL structure and air pollution.
The hourly ground-level PM2.5 concentration data can be obtained from the National Urban Air Quality real-time publishing platform (http://106.37.208.233:20035/, last access: 20 February 2021) issued by the Chinese Ministry of Ecology and Environment. Other data used in this study can be acquired upon request to the corresponding author.
JX and YJ designed the study. YJ, YW, GT, YZ, DJ, DZ, MW, LD, LW, TW, and FW contributed to the observation data, provided experimental assistance, and analyzed the methodology. YJ and JX wrote the paper with input from all the other authors.
The authors declare that they have no known competing financial interests or personal relationships that could have appeared to influence the work reported in this paper.
This study was partially supported by the National Key Research and Development Program of China (grant no. 2016YFC0202001), the Chinese Academy of Sciences (CAS) Strategic Priority Research Program (grant no. XDA23020301), the National Natural Science Foundation of China (grant no. 42061130215), and the Royal Society (grant no. NAF/R1/201354).
This research has been supported by the Ministry of Science and Technology of China (grant no. 2016YFC0202001), the Chinese Academy of Sciences Strategic Priority Research Program (grant no. XDA23020301), the National Natural Science Foundation of China (grant no. 42061130215), and the Royal Society (grant no. NAF/R1/201354).
This paper was edited by Jianping Huang and reviewed by two anonymous referees.
Aitken, M. L., Rhodes, M. E., and Lundquist, J. K.: Performance of a Wind-Profiling Lidar in the Region of Wind Turbine Rotor Disks, J. Atmos. Ocean. Tech., 29, 347–355, 2012.
Banakh, V. A., Smalikho, I. N., and Falits, A. V.: Wind-Temperature Regime and Wind Turbulence in a Stable Boundary Layer of the Atmosphere: Case Study, Remote Sens.-Basel, 12, 955, https://doi.org/10.3390/rs12060955, 2020.
Bei, N., Zhao, L., Wu, J., Li, X., Feng, T., and Li, G.: Impacts of sea-land and mountain-valley circulations on the air pollution in Beijing-Tianjin-Hebei (BTH): A case study, Environ. Pollut., 234, 429–438, 2018.
Chen, Y., Zhao, C., Zhang, Q., Deng, Z., Huang, M., and Ma, X.: Aircraft study of Mountain Chimney Effect of Beijing, China, J. Geophys. Res.-Atmos., 114, https://doi.org/10.1029/2008jd010610, 2009.
Cheng, Z., Luo, L., Wang, S., Wang, Y., Sharma, S., Shimadera, H., Wang, X., Bressi, M., de Miranda, R. M., Jiang, J., Zhou, W., Fajardo, O., Yan, N., and Hao, J.: Status and characteristics of ambient PM2.5 pollution in global megacities, Environ. Int., 89–90, 212–221, 2016.
Dai, L., Xin, J., Zuo, H., Ma, Y., Zhang, L., Wu, X., Ma, Y., Jia, D., and Wu, F.: Multilevel Validation of Doppler Wind Lidar by the 325 m Meteorological Tower in the Planetary Boundary Layer of Beijing, Atmosphere, 11, 1051, https://doi.org/10.3390/atmos11101051, 2020.
Ding, A. J., Huang, X., Nie, W., Sun, J. N., Kerminen, V. M., Petaja, T., Su, H., Cheng, Y. F., Yang, X. Q., Wang, M. H., Chi, X. G., Wang, J. P., Virkkula, A., Guo, W. D., Yuan, J., Wang, S. Y., Zhang, R. J., Wu, Y. F., Song, Y., Zhu, T., Zilitinkevich, S., Kulmala, M., and Fu, C. B.: Enhanced haze pollution by black carbon in megacities in China, Geophys. Res. Lett., 43, 2873–2879, 2016.
Fu, G. Q., Xu, W. Y., Yang, R. F., Li, J. B., and Zhao, C. S.: The distribution and trends of fog and haze in the North China Plain over the past 30 years, Atmos. Chem. Phys., 14, 11949–11958, https://doi.org/10.5194/acp-14-11949-2014, 2014.
Gryning, S.-E., Floors, R., Pena, A., Batchvarova, E., and Bruemmer, B.: Weibull Wind-Speed Distribution Parameters Derived from a Combination of Wind-Lidar and Tall-Mast Measurements Over Land, Coastal and Marine Sites, Bound.-Lay. Meteorol., 159, 329–348, 2016.
Hu, X.-M., Ma, Z., Lin, W., Zhang, H., Hu, J., Wang, Y., Xu, X., Fuentes, J. D., and Xue, M.: Impact of the Loess Plateau on the atmospheric boundary layer structure and air quality in the North China Plain: A case study, Sci. Total Environ., 499, 228–237, 2014.
Huang, M., Gao, Z., Miao, S., and Xu, X.: Characteristics of sea breezes over the Jiangsu coastal area, China, Int. J. Climatol., 36, 3908–3916, 2016.
Jenkinson, A. F. and Collison, F. P.: An initial climatology of gales over the North Sea, Synoptic Climatology Branch Memorandum, Meteorological Office, Bracknell, UK, 1977.
Jiang, Y., Xin, J., Zhao, D., Jia, D., Tang, G., Quan, J., Wang, M., and Dai, L.: Analysis of differences between thermodynamic and material boundary layer structure: Comparison of detection by ceilometer and microwave radiometer, Atmos. Res., 248, 105179, https://doi.org/10.1016/j.atmosres.2020.105179, 2021.
Kotthaus, S. and Grimmond, C. S. B.: Atmospheric boundary-layer characteristics from ceilometer measurements, Part 1: A new method to track mixed layer height and classify clouds, Q. J. Roy. Meteor. Soc., 144, 1525–1538, 2018.
Lamb, H. H.: British Isles weather types and a register of the daily sequence of circulation patterns, 1861–1971, Geophysical Memoirs: HMSO, London, 116, p. 85, 1972.
Leung, D. M., Tai, A. P. K., Mickley, L. J., Moch, J. M., van Donkelaar, A., Shen, L., and Martin, R. V.: Synoptic meteorological modes of variability for fine particulate matter (PM2.5) air quality in major metropolitan regions of China, Atmos. Chem. Phys., 18, 6733–6748, https://doi.org/10.5194/acp-18-6733-2018, 2018.
Li, L.-J., Ying, W., Zhang, Q., Tong, Y. U., Yue, Z., and Jun, J. I. N.: Spatial distribution of aerosol pollution based on MODIS data over Beijing, China, J. Environ. Sci., 19, 955–960, 2007.
Li, M., Wang, L., Liu, J., Gao, W., Song, T., Sun, Y., Li, L., Li, X., Wang, Y., Liu, L., Daellenbach, K. R., Paasonen, P. J., Kerminen, V.-M., Kulmala, M., and Wang, Y.: Exploring the regional pollution characteristics and meteorological formation mechanism of PM2.5 in North China during 2013–2017, Environ. Int., 134, 105283, https://doi.org/10.1016/j.envint.2019.105283, 2020.
Li, X., Ma, Y., Wei, W., Zhang, Y., Liu, N., Hong, Y., and Wang, Y.: Vertical Distribution of Particulate Matter and its Relationship with Planetary Boundary Layer Structure in Shenyang, Northeast China, Aerosol Air Qual. Res., 19, 2464–2476, 2019.
Li, Z., Guo, J., Ding, A., Liao, H., Liu, J., Sun, Y., Wang, T., Xue, H., Zhang, H., and Zhu, B.: Aerosol and boundary-layer interactions and impact on air quality, Natl. Sci. Rev., 4, 810–833, 2017.
Liao, Z., Gao, M., Sun, J., and Fan, S.: The impact of synoptic circulation on air quality and pollution-related human health in the Yangtze River Delta region, Sci. Total Environ., 607, 838–846, 2017.
Liu, S., Liu, Z., Li, J., Wang, Y., Ma, Y., Sheng, L., Liu, H., Liang, F., Xin, G., and Wang, J.: Numerical simulation for the coupling effect of local atmospheric circulations over the area of Beijing, Tianjin and Hebei Province, Sci. China Ser. D, 52, 382–392, 2009.
Liu, Y., Wang, B., Zhu, Q., Luo, R., Wu, C., and Jia, R.: Dominant Synoptic Patterns and Their Relationships with PM2.5 Pollution in Winter over the Beijing-Tianjin-Hebei and Yangtze River Delta Regions in China, J. Meteorol. Res.-PRC, 33, 765–776, 2019.
Lou, M., Guo, J., Wang, L., Xu, H., Chen, D., Miao, Y., Lv, Y., Li, Y., Guo, X., Ma, S., and Li, J.: On the Relationship Between Aerosol and Boundary Layer Height in Summer in China Under Different Thermodynamic Conditions, Earth and Space Science, 6, 887–901, 2019.
Miao, Y., Hu, X.-M., Liu, S., Qian, T., Xue, M., Zheng, Y., and Wang, S.: Seasonal variation of local atmospheric circulations and boundary layer structure in the Beijing-Tianjin-Hebei region and implications for air quality, J. Adv. Model. Earth Sy., 7, 1602–1626, 2015a.
Miao, Y., Liu, S., Zheng, Y., Wang, S., Chen, B., Zheng, H., and Zhao, J.: Numerical study of the effects of local atmospheric circulations on a pollution event over Beijing-Tianjin-Hebei, China, J. Environ. Sci., 30, 9–20, 2015b.
Miao, Y., Guo, J., Liu, S., Liu, H., Li, Z., Zhang, W., and Zhai, P.: Classification of summertime synoptic patterns in Beijing and their associations with boundary layer structure affecting aerosol pollution, Atmos. Chem. Phys., 17, 3097–3110, https://doi.org/10.5194/acp-17-3097-2017, 2017.
Münkel, C., Eresmaa, N., Rasanen, J., and Karppinen, A.: Retrieval of mixing height and dust concentration with lidar ceilometer, Bound.-Lay. Meteorol., 124, 117–128, 2007.
O'Connor, E. J., Illingworth, A. J., Brooks, I. M., Westbrook, C. D., Hogan, R. J., Davies, F., and Brooks, B. J.: A Method for Estimating the Turbulent Kinetic Energy Dissipation Rate from a Vertically Pointing Doppler Lidar, and Independent Evaluation from Balloon-Borne In Situ Measurements, J. Atmos. Ocean. Tech., 27, 1652–1664, 2010.
Petaja, T., Jarvi, L., Kerminen, V. M., Ding, A. J., Sun, J. N., Nie, W., Kujansuu, J., Virkkula, A., Yang, X. Q., Fu, C. B., Zilitinkevich, S., and Kulmala, M.: Enhanced air pollution via aerosol-boundary layer feedback in China, Sci. Rep.-UK, 6, 18998, https://doi.org/10.1038/srep18998, 2016.
Quan, J., Tie, X., Zhang, Q., Liu, Q., Li, X., Gao, Y., and Zhao, D.: Characteristics of heavy aerosol pollution during the 2012–2013 winter in Beijing, China, Atmos. Environ., 88, 83–89, 2014.
Song, C., Wu, L., Xie, Y., He, J., Chen, X., Wang, T., Lin, Y., Jin, T., Wang, A., and Liu, Y.: Air pollution in China: Status and spatiotemporal variations, Environ. Pollut., 227, 334–347, 2017.
Steyn, D. G., Baldi, M., and Hoff, R. M.: The detection of mixed layer depth and entrainment zone thickness from lidar backscatter profiles, J. Atmos. Ocean. Tech., 16, 953–959, 1999.
Stull, R. B.: An Introduction to Boundary Layer Meteorology, Kluwer Academic Publishers, Dordrecht, the Netherlands, 1988.
Sun, Z.-B., Wang, H., Guo, C., Wu, J., Cheng, T., and Li, Z.-M.: Barrier effect of terrain on cold air and return flow of dust air masses, Atmos. Res., 220, 81–91, 2019.
Suomi, I., Gryning, S.-E., O'Connor, E. J., and Vihma, T.: Methodology for obtaining wind gusts using Doppler lidar, Q. J. Roy. Meteor. Soc., 143, 2061–2072, 2017.
Tai, A. P. K., Mickley, L. J., and Jacob, D. J.: Correlations between fine particulate matter (PM2.5) and meteorological variables in the United States: Implications for the sensitivity of PM2.5 to climate change, Atmos. Environ., 44, 3976–3984, 2010.
Tang, G., Zhu, X., Hu, B., Xin, J., Wang, L., Münkel, C., Mao, G., and Wang, Y.: Impact of emission controls on air quality in Beijing during APEC 2014: lidar ceilometer observations, Atmos. Chem. Phys., 15, 12667–12680, https://doi.org/10.5194/acp-15-12667-2015, 2015.
Trigo, R. M. and DaCamara, C. C.: Circulation weather types and their influence on the precipitation regime in Portugal, Int. J. Climatol., 20, 1559–1581, 2000.
Tsaknakis, G., Papayannis, A., Kokkalis, P., Amiridis, V., Kambezidis, H. D., Mamouri, R. E., Georgoussis, G., and Avdikos, G.: Inter-comparison of lidar and ceilometer retrievals for aerosol and Planetary Boundary Layer profiling over Athens, Greece, Atmos. Meas. Tech., 4, 1261–1273, https://doi.org/10.5194/amt-4-1261-2011, 2011.
Wang, X., Dickinson, R. E., Su, L., Zhou, C., and Wang, K.: PM2.5 Pollution in China and how it has been exacerbated by terrain and meteorological conditions, B. Am. Meteorol. Soc., 99, 105–120, 2018.
Wu, P., Ding, Y., and Liu, Y.: Atmospheric circulation and dynamic mechanism for persistent haze events in the Beijing-Tianjin-Hebei region, Adv. Atmos. Sci., 34, 429–440, 2017.
Xu, T., Song, Y., Liu, M., Cai, X., Zhang, H., Guo, J., and Zhu, T.: Temperature inversions in severe polluted days derived from radiosonde data in North China from 2011 to 2016, Sci. Total Environ., 647, 1011–1020, 2019.
Ye, X., Song, Y., Cai, X., and Zhang, H.: Study on the synoptic flow patterns and boundary layer process of the severe haze events over the North China Plain in January 2013, Atmos. Environ., 124, 129–145, 2016.
Yu, B., Zhu, B., Dou, J., Zhang, W., and Hu, D.: Classification of air pollution synoptic patterns and air pollutants transport/purification effect by cold front over Hangzhou, China Environ. Sci., 37, 452–459, 2017.
Zhang, R.: Warming boosts air pollution, Nat. Clim. Change, 7, 238–239, 2017.
Zhang, Y., Ding, A., Mao, H., Nie, W., Zhou, D., Liu, L., Huang, X., and Fu, C.: Impact of synoptic weather patterns and inter-decadal climate variability on air quality in the North China Plain during 1980–2013, Atmos. Environ., 124, 119–128, 2016.
Zhang, Y., Guo, J., Yang, Y., Wang, Y., and Yim, S. H. L.: Vertica Wind Shear Modulates Particulate Matter Pollutions: A Perspective from Radar Wind Profiler Observations in Beijing, China, Remote Sens.-Basel, 12, 546, https://doi.org/10.3390/rs12030546, 2020.
Zhao, D., Xin, J., Gong, C., Quan, J., Liu, G., Zhao, W., Wang, Y., Liu, Z., and Song, T.: The formation mechanism of air pollution episodes in Beijing city: Insights into the measured feedback between aerosol radiative forcing and the atmospheric boundary layer stability, Sci. Total Environ., 692, 371–381, 2019.
Zheng, X. Y., Fu, Y. F., Yang, Y. J., and Liu, G. S.: Impact of atmospheric circulations on aerosol distributions in autumn over eastern China: observational evidence, Atmos. Chem. Phys., 15, 12115–12138, https://doi.org/10.5194/acp-15-12115-2015, 2015.