the Creative Commons Attribution 4.0 License.
the Creative Commons Attribution 4.0 License.
 | 22 Apr 2021
Aerosol acidity and liquid water content regulate the dry deposition of inorganic reactive nitrogen
Athanasios Nenes
Spyros N. Pandis
Maria Kanakidou
Armistead G. Russell
Shaojie Song
Petros Vasilakos
Rodney J. Weber
Ecosystem productivity is strongly modulated by the atmospheric deposition of inorganic reactive nitrogen (the sum of ammonium and nitrate). The individual contributions of ammonium and nitrate vary considerably over space and time, giving rise to complex patterns of nitrogen deposition. In the absence of rain, much of this complexity is driven by the large difference between the dry deposition velocity of nitrogen-containing molecules in the gas or condensed phase. Here we quantify how aerosol liquid water and acidity, through their impact on gas–particle partitioning, modulate the deposition velocity of total NH3 and total HNO3 individually while simultaneously affecting the dry deposition of inorganic reactive nitrogen. Four regimes of deposition velocity emerge: (i) HNO3 – fast, NH3 – slow, (ii) HNO3 – slow, NH3 – fast, (iii) HNO3 – fast, NH3 – fast, and (iv) HNO3 – slow, NH3 – slow. Conditions that favor partitioning of species to the aerosol phase strongly reduce the local deposition of reactive nitrogen species and promote their accumulation in the boundary layer and potential for long-range transport. Application of this framework to select locations around the world reveals fundamentally important insights: the dry deposition of total ammonia displays little sensitivity to pH and liquid water variations, except under conditions of extreme acidity and/or low aerosol liquid water content. The dry deposition of total nitric acid, on the other hand, is quite variable, with maximum deposition velocities (close to gas deposition rates) found in the eastern United States and minimum velocities in northern Europe and China. In the latter case, the low deposition velocity leads to up to 10-fold increases in PM2.5 nitrate aerosol, thus contributing to the high PM2.5 levels observed during haze episodes. In this light, aerosol pH and associated liquid water content can be considered to be control parameters that drive dry deposition flux and can accelerate the accumulation of aerosol contributing to intense haze events throughout the globe.
- Article
(3254 KB) - Full-text XML
- BibTeX
- EndNote


Human civilization and a high standard of living fundamentally depend on a sustainable food and energy supply (NAS, 2016). Both can be linked to the availability of reactive nitrogen (Nr) species in agricultural soils, which are key nutrients required by the biosphere for growth and crop production. Although fertilizers rich in Nr have ensured food security for most of the global population, riverine outflow and atmospheric deposition of Nr to oceans and coastal zones have increased roughly 3-fold compared to preindustrial levels (Kanakidou et al., 2016), with profound and diverse impacts on the Earth system (Jickells et al., 2017; Suntharalingam et al., 2019). Nr includes reduced nitrogen species – the main components of which are gas-phase ammonia (NH3) and its particulate-phase counterpart ammonium (NH). Oxidized nitrogen also constitutes a significant fraction of Nr and its deposition, being primarily in the form of nitric acid (HNO3) and particulate-phase nitrate (NO) (Seinfeld and Pandis, 2016).
Reactive inorganic nitrogen species are major components of ambient particulate matter (Kanakidou et al., 2005; Sardar et al., 2005; Zhang et al., 2007), with important implications for human health (Pope et al., 2004; Lim et al., 2012; Lelieveld et al., 2015; Cohen et al., 2017), ecosystem productivity (Fowler et al., 2013), and the climate system (Haywood and Boucher, 2000; Bellouin et al., 2011; IPCC, 2013). Ammonia reacts with sulfuric and nitric acids to form ammonium sulfate/bisulfate and nitrate aerosol, while gas-phase nitric acid can also react with nonvolatile cations found in sea salt, mineral dust, and biomass burning to form a variety of inorganic (soluble) salts. The acidity (pH) and liquid water content of aerosol in turn are central parameters that govern the gas–particle partitioning of Nr species (Meskhidze et al., 2003; Guo et al., 2015, 2017a, 2018; Nenes et al., 2020). Given that species in the gas phase generally have a different atmospheric residence time than those in the aerosol phase (Seinfeld and Pandis, 2016), the degree of gas–particle partitioning can directly impact the atmospheric residence time of Nr species, with important implications for particulate matter levels and dry deposition (e.g., Pinder et al., 2007, 2008). It is therefore important to consider how aerosol acidity and liquid water content, through their effect on gas–particle partitioning, can affect the deposition fluxes of Nr species. Here we present a simple and thermodynamically consistent framework to address the links between deposition of Nr and aerosol acidity. We then demonstrate the power of this new framework with observational data to understand the relevant “chemical regimes” that apply to select places around the world and to understand the implications that changes in acidity have on deposition flux and PM levels.
Nenes et al. (2020), based on the work of Meskhidze et al. (2003) and Guo et al. (2016, 2017a), developed a framework, where the sensitivity of PM to concentrations of ammonia and nitrate is expressed in terms of aerosol pH and liquid water content. The basis of this approach lies in the realization that the magnitude of PM sensitivity to precursor emissions is driven by gas–particle partitioning, the latter of which is controlled by aerosol acidity and liquid water content. Given that the deposition velocity of ammonia and nitrate also is strongly modulated by the same partitioning, it should show similar sensitivity to the pH and liquid water content.
2.1 Linking deposition flux with partitioning fraction
For a given air mass with total nitrate, NO3T (i.e., the amount of aerosol and gas-phase nitrate), the equilibrium aerosol nitrate concentration, , is given by , where is the fraction of NO3T that partitions to the particle phase. The deposition flux of NO3T, , is then given by the contribution from the gas and particle phases (Seinfeld and Pandis, 2016):
where has units of moles N per unit area and time, vg, vp are the gas- and particulate-phase deposition velocities, respectively, and (of order 10 for NH3T and NO3T; Duyzer, 1994; Seinfeld and Pandis, 2016).
Similarly, equilibrium partitioning of NH3T to the aerosol is given by , where is the fraction of NH3T (i.e., the amount of aerosol ammonium and gas-phase ammonia) that partitions to the particle phase:
where has units of moles N per unit area and time.
2.2 The acidity and liquid water content link: deposition velocity “regimes”
From Eqs. (1) and (2), it becomes apparent that the and are modulators of the deposition fluxes. Depending on their value, both and vary by a factor of 10, with the highest values corresponding to partitioning fractions close to zero. Through their effects on gas–particle partitioning, aerosol acidity and liquid water content can impact the deposition flux, which we quantify as follows.
The partitioning fractions can be expressed as functions of the liquid water content, Wi:
where and follow the definitions of Nenes et al. (2020).
Equation (3) yields sigmoidal functions, with the partitioning fraction ranging from zero to unity over a characteristic pH range. The same equation can then be used to define a characteristic pH that determines when the deposition of ammonia or nitrate is fast (i.e., effective deposition velocity approaching that of the gas phase) or slow (i.e., approaching the particle-phase deposition velocity). Following Nenes et al. (2020), we define characteristic thresholds being α for and β for , which separate the corresponding deposition velocity regimes (Fig. 1). When is below α (or is below β), a sufficient amount of (or ) is in the gas phase so that the effective deposition velocity is approximately equal to the gas-phase limit (fast for NO3T or NH3T, respectively). The transition between fast and slow velocity can occur over a range of ε, but is selected to define the thresholds so that in the map areas with slow–fast pairs (slow NH3–fast HNO3 and vice versa) deposition conditions most closely approach the gas–particle deposition velocity limits. Equations (5) and (6) of Nenes et al. (2020) then give a characteristic acidity level for nitrate and for ammonium. Figure 2 displays pH′ and pH′′ for 273 and 298 K; pH′ tends to decrease with increasing Wi and vice versa for ammonium and pH′′.
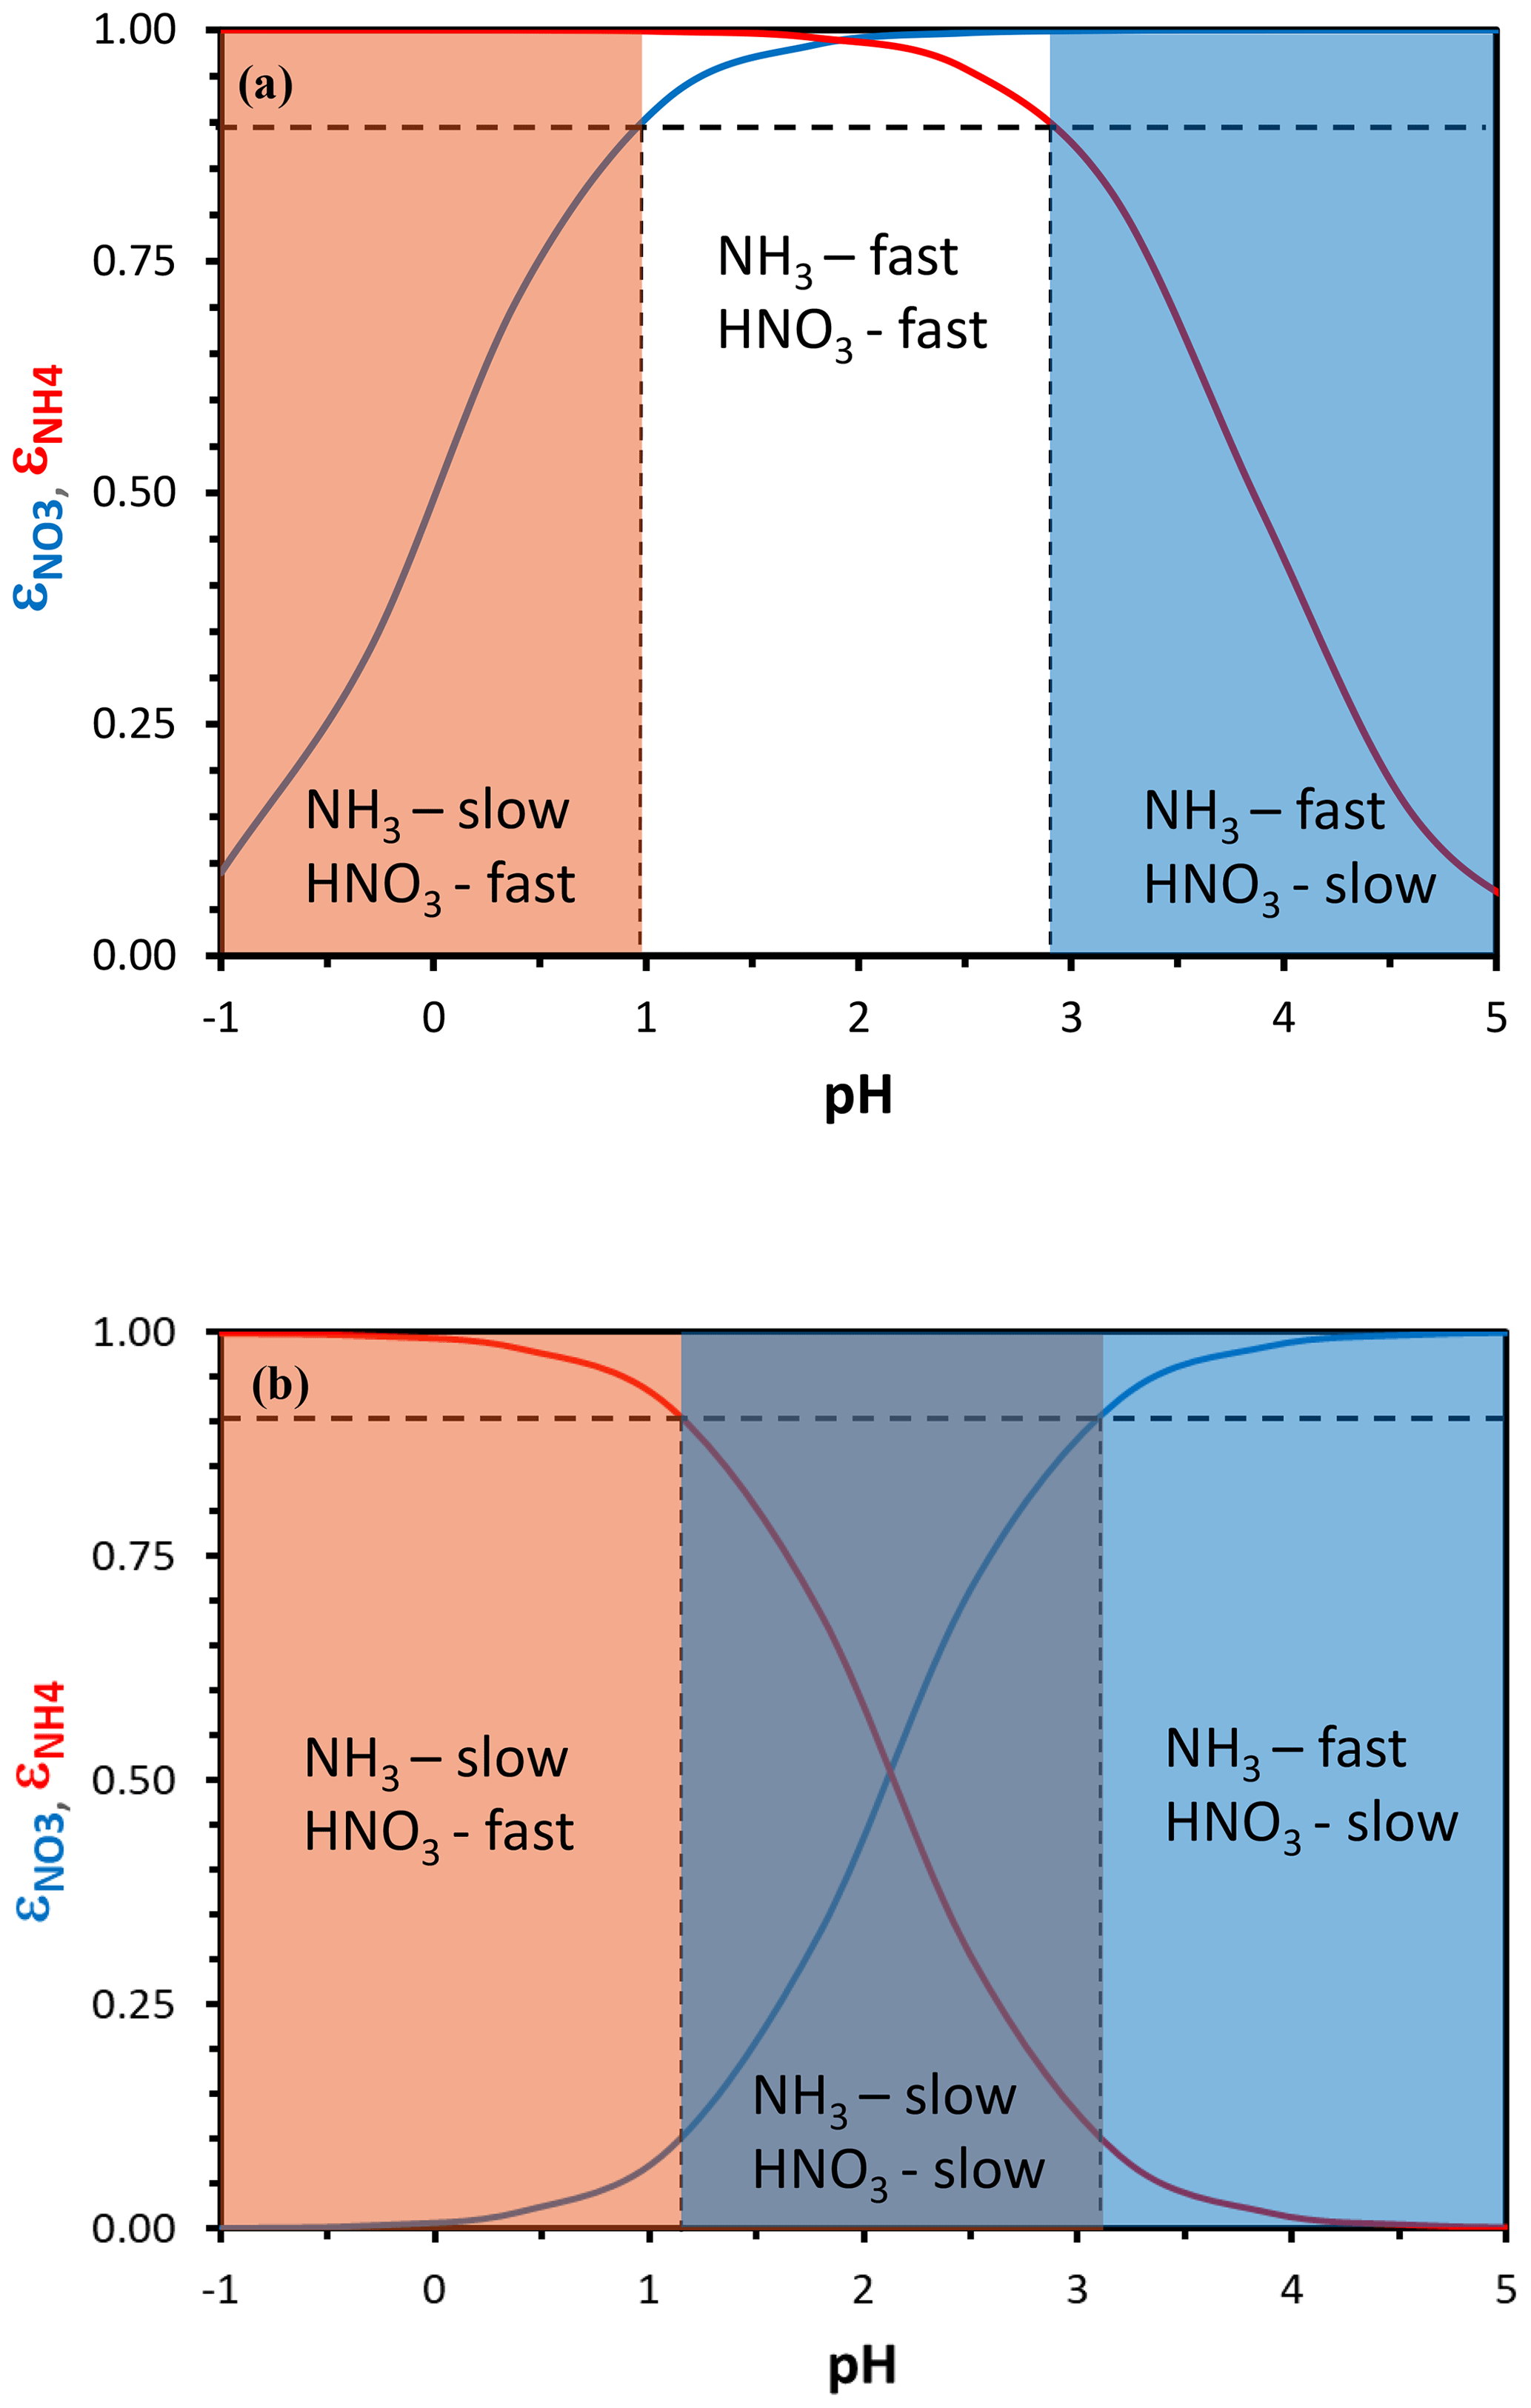
Figure 1Particle-phase fraction of total nitrate, ε(NO) (blue curve), and total ammonium, ε(NH) (red curve), versus pH for a temperature of 288 K and an aerosol liquid water content of (a) 10 µg m−3 and (b) 250 µg m−3. A combination of moderate acidity and low liquid water content creates conditions for rapid dry deposition of both total ammonium and nitrate (a) and vice versa for moderate acidity and high liquid water content (b). In defining the sensitivity domains, we have assumed that a partitioning fraction of 90 % (dotted black lines), and its corresponding characteristic pH, defines where the aerosol deposition velocity dominates the total dry deposition rate of each nitrogen-containing species.
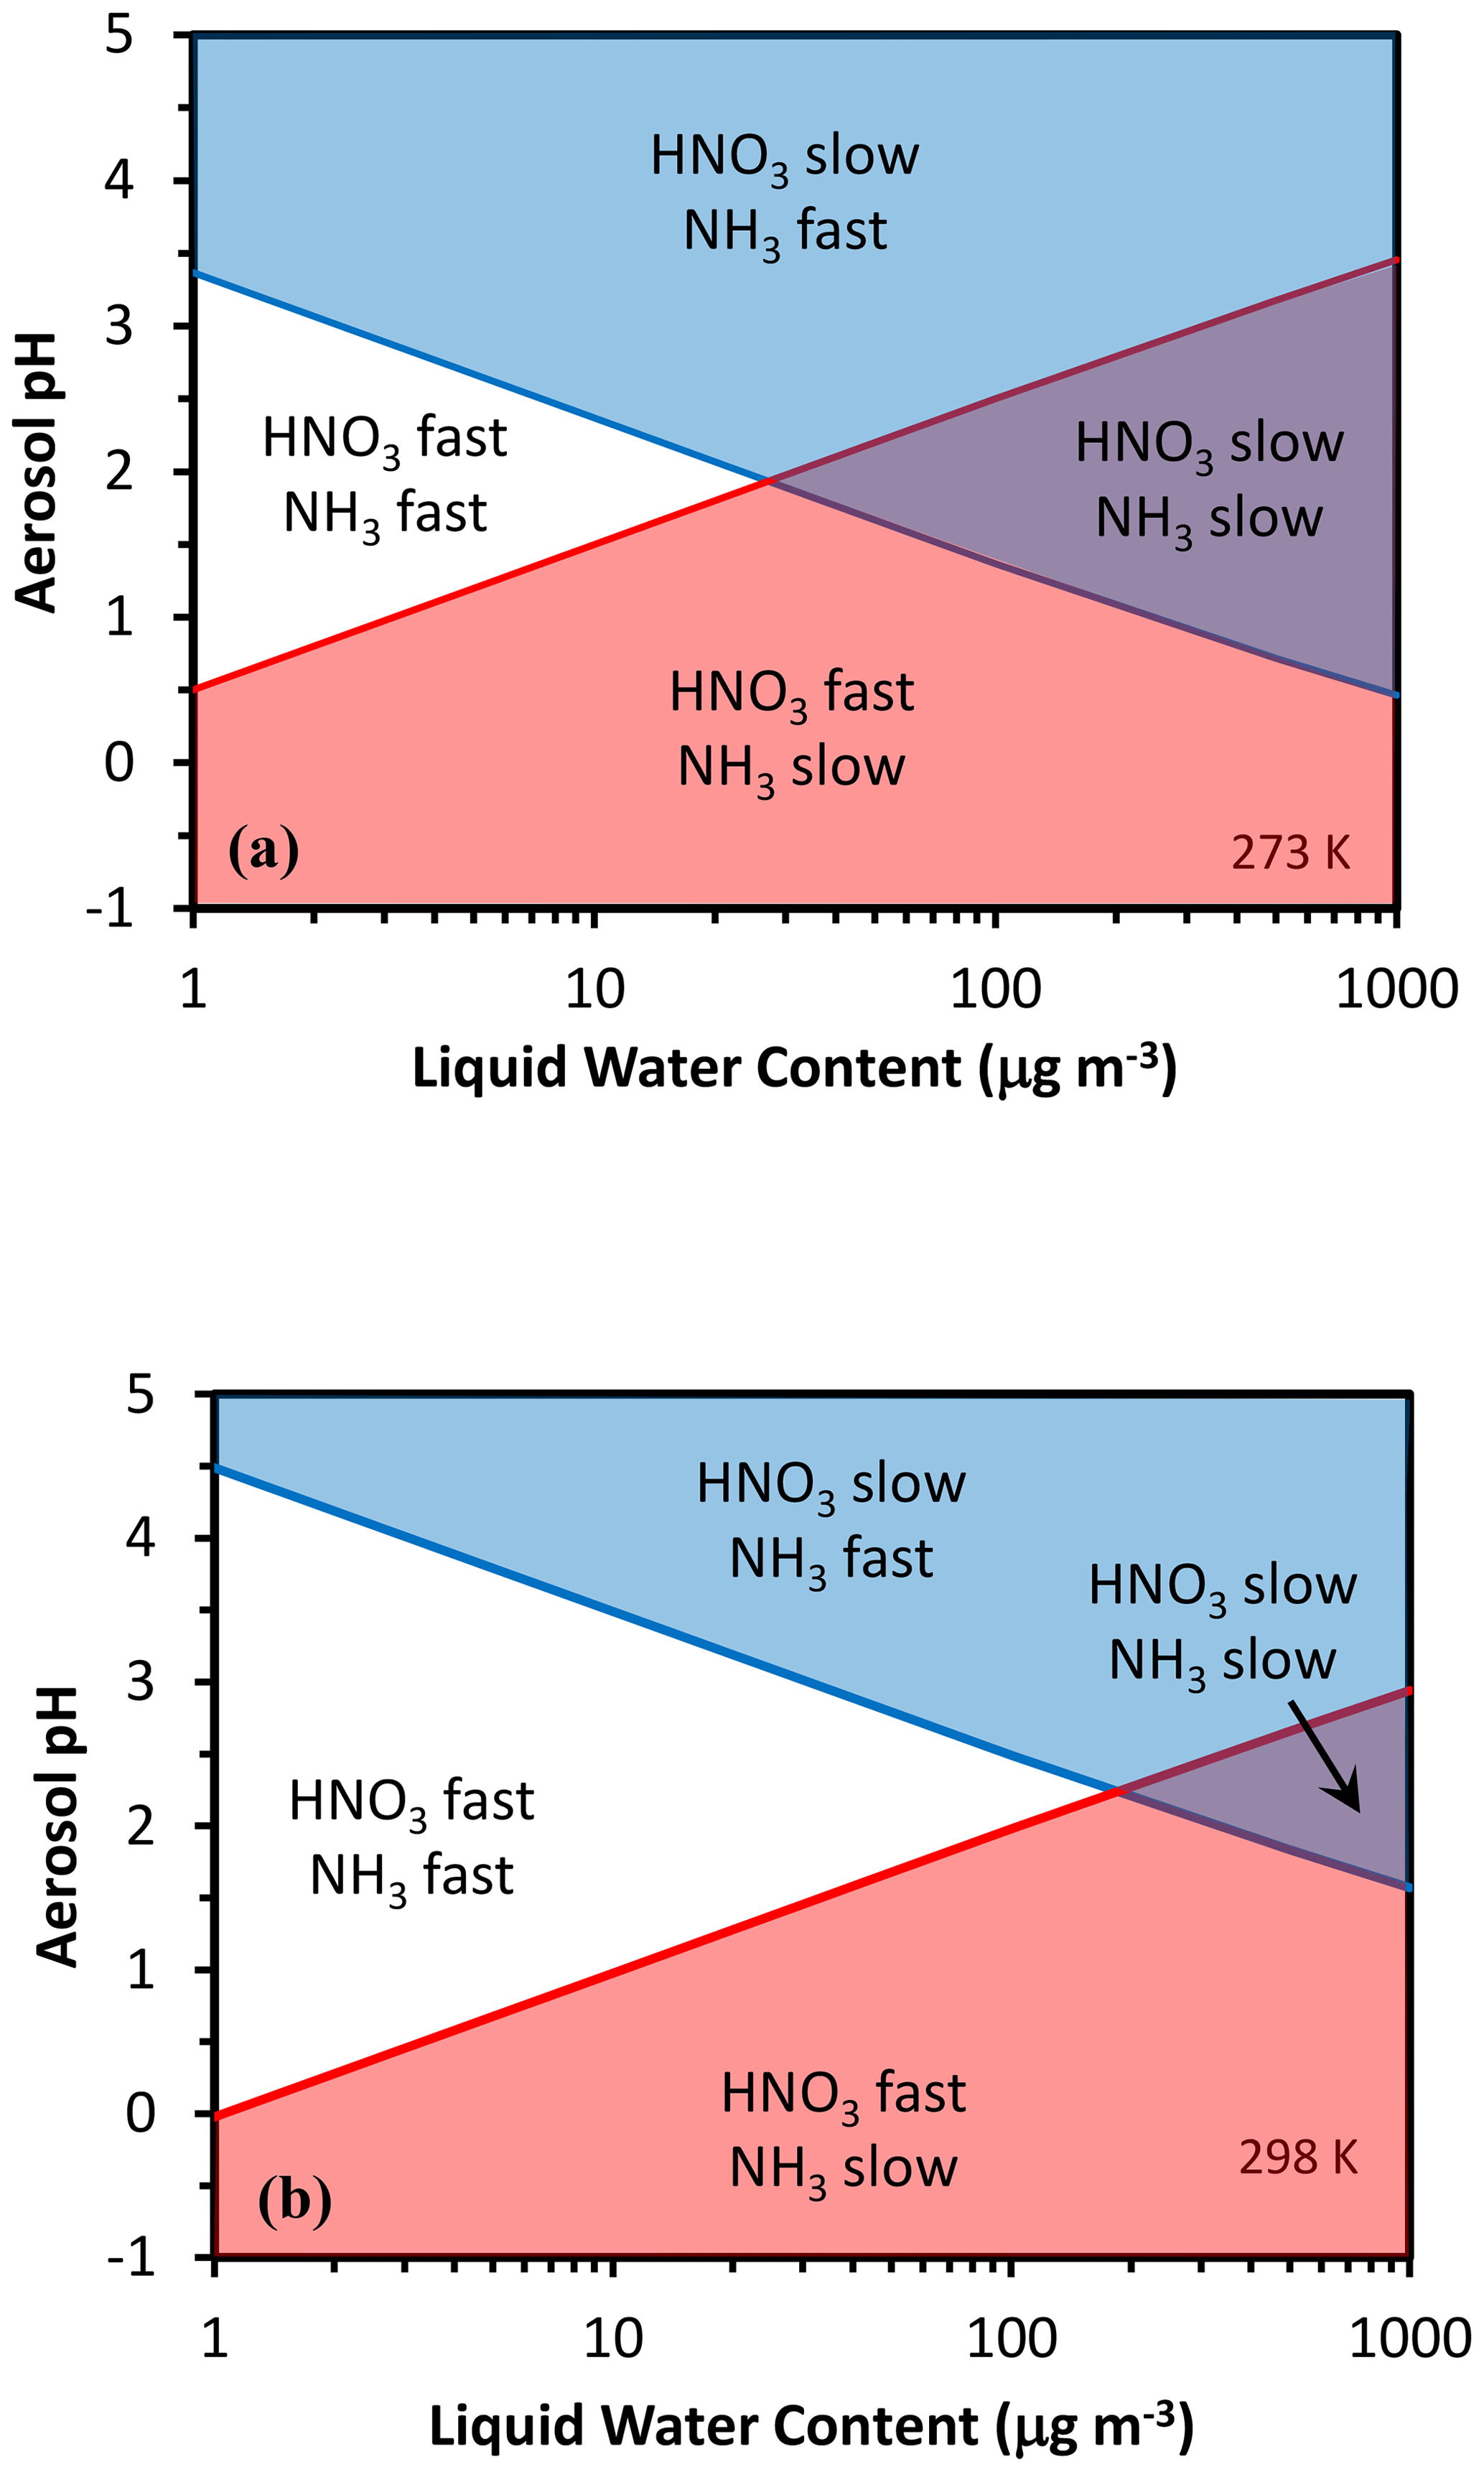
Figure 2Chemical domains of deposition velocity for ammonia and nitrate. Shown are results for 273 K (a) and 298 K (b).
Based on the values of pH′, pH′′, and its relation to the aerosol pH, we can then determine whether the deposition (or ) is slow or fast; Nr deposition can belong to one of four distinct chemical regimes:
-
Regime 1: pH > pH′′ and pH < pH′: “NH3 fast, HNO3 fast”.
-
Regime 2: pH > pH′′ and pH > pH′: “NH3 fast, HNO3 slow”.
-
Regime 3: pH < pH′′ and pH > pH′: “NH3 slow, HNO3 slow”.
-
Regime 4: pH < pH′′ and pH < pH′: “NH3 slow, HNO3 fast”.
Figure 2 indicates these four regions. Observation or modeling data, based on their value of acidity and liquid water, will belong to one of these four chemical regimes of deposition velocity for and/or .
Following Nenes et al. (2020), the characteristic point (defined by a characteristic acidity pH∗ and liquid water content ) on the chemical regime map where the two lines cross over, thus separating Regime 1 from Regime 3 and Regime 2 from Regime 4, corresponds to a , and µg m−3 for 298 K. Therefore, for moderately acidic aerosol (pH* ∼ 2) and sufficiently high amounts of water, the aerosol levels can considerably increase because the deposition velocity changes by about 10-fold for both and . For higher (or lower) pH levels, the aerosol transitions between regions 2 and 4. For liquid water above , there is a “transition pH” from a NH3 – slow, HNO3 – fast deposition scheme to a NH3 – fast, HNO3 – slow deposition rate (Fig. 2). Similarly, there is also another “transition pH” that defines when both and change from fast to slow deposition. Given the combined complexity of deposition velocity and aerosol thermodynamics, it is remarkable that deposition velocity patterns for and can be unraveled simply using pH and liquid water. This is illustrated in the following section.
The above framework requires knowledge of aerosol pH and liquid water content, which can be routinely simulated by state-of-the-art atmospheric chemical transport models (e.g., CMAQ, CAMx). Thermodynamic analysis of ambient aerosol and gas-phase measurements also provides aerosol pH and liquid water content. Therefore, the above framework can be used to characterize the chemical domain of both observed and simulated aerosol.
Application of the framework is demonstrated for ambient data representing select locations over the world. For this purpose, we use the same datasets as in Nenes et al. (2020), which were obtained from application of the ISORROPIA-II model (Fountoukis and Nenes, 1997) to observations over five locations worldwide: Cabauw, Netherlands (CBW), Tianjin, China (TJN), California, United States (CNX), Southeastern United States (SAS), and a wintertime NE United States (WIN) study. This dataset covers a wide range of atmospheric acidity, temperature, relative humidity, and liquid water levels. Figure 3 presents the deposition domain classifications for each location, with characteristic curves being calculated from the average temperature of the dataset. Cabauw is characterized by high deposition velocity for , while alternates between fast and slow deposition, with most of the time being in the slow deposition regime (Fig. 3a). The California dataset (Fig. 3b) is quite interesting, as both and deposit rapidly, which means that they are less subject to long-range transport and are rapidly lost from the boundary layer. Tianjin displays similar behavior to Cabauw (Fig. 3c). The Southeastern United States (SAS) is considerably more acidic; for this reason, exhibits variability in its deposition velocity (alternating between slow and fast), while always maintains a high deposition velocity. The wintertime NE US dataset (WIN) corresponds to a broad region (aircraft dataset); hence the data occupy multiple domains. There are no locations in this dataset characterized by low deposition velocities for both and .
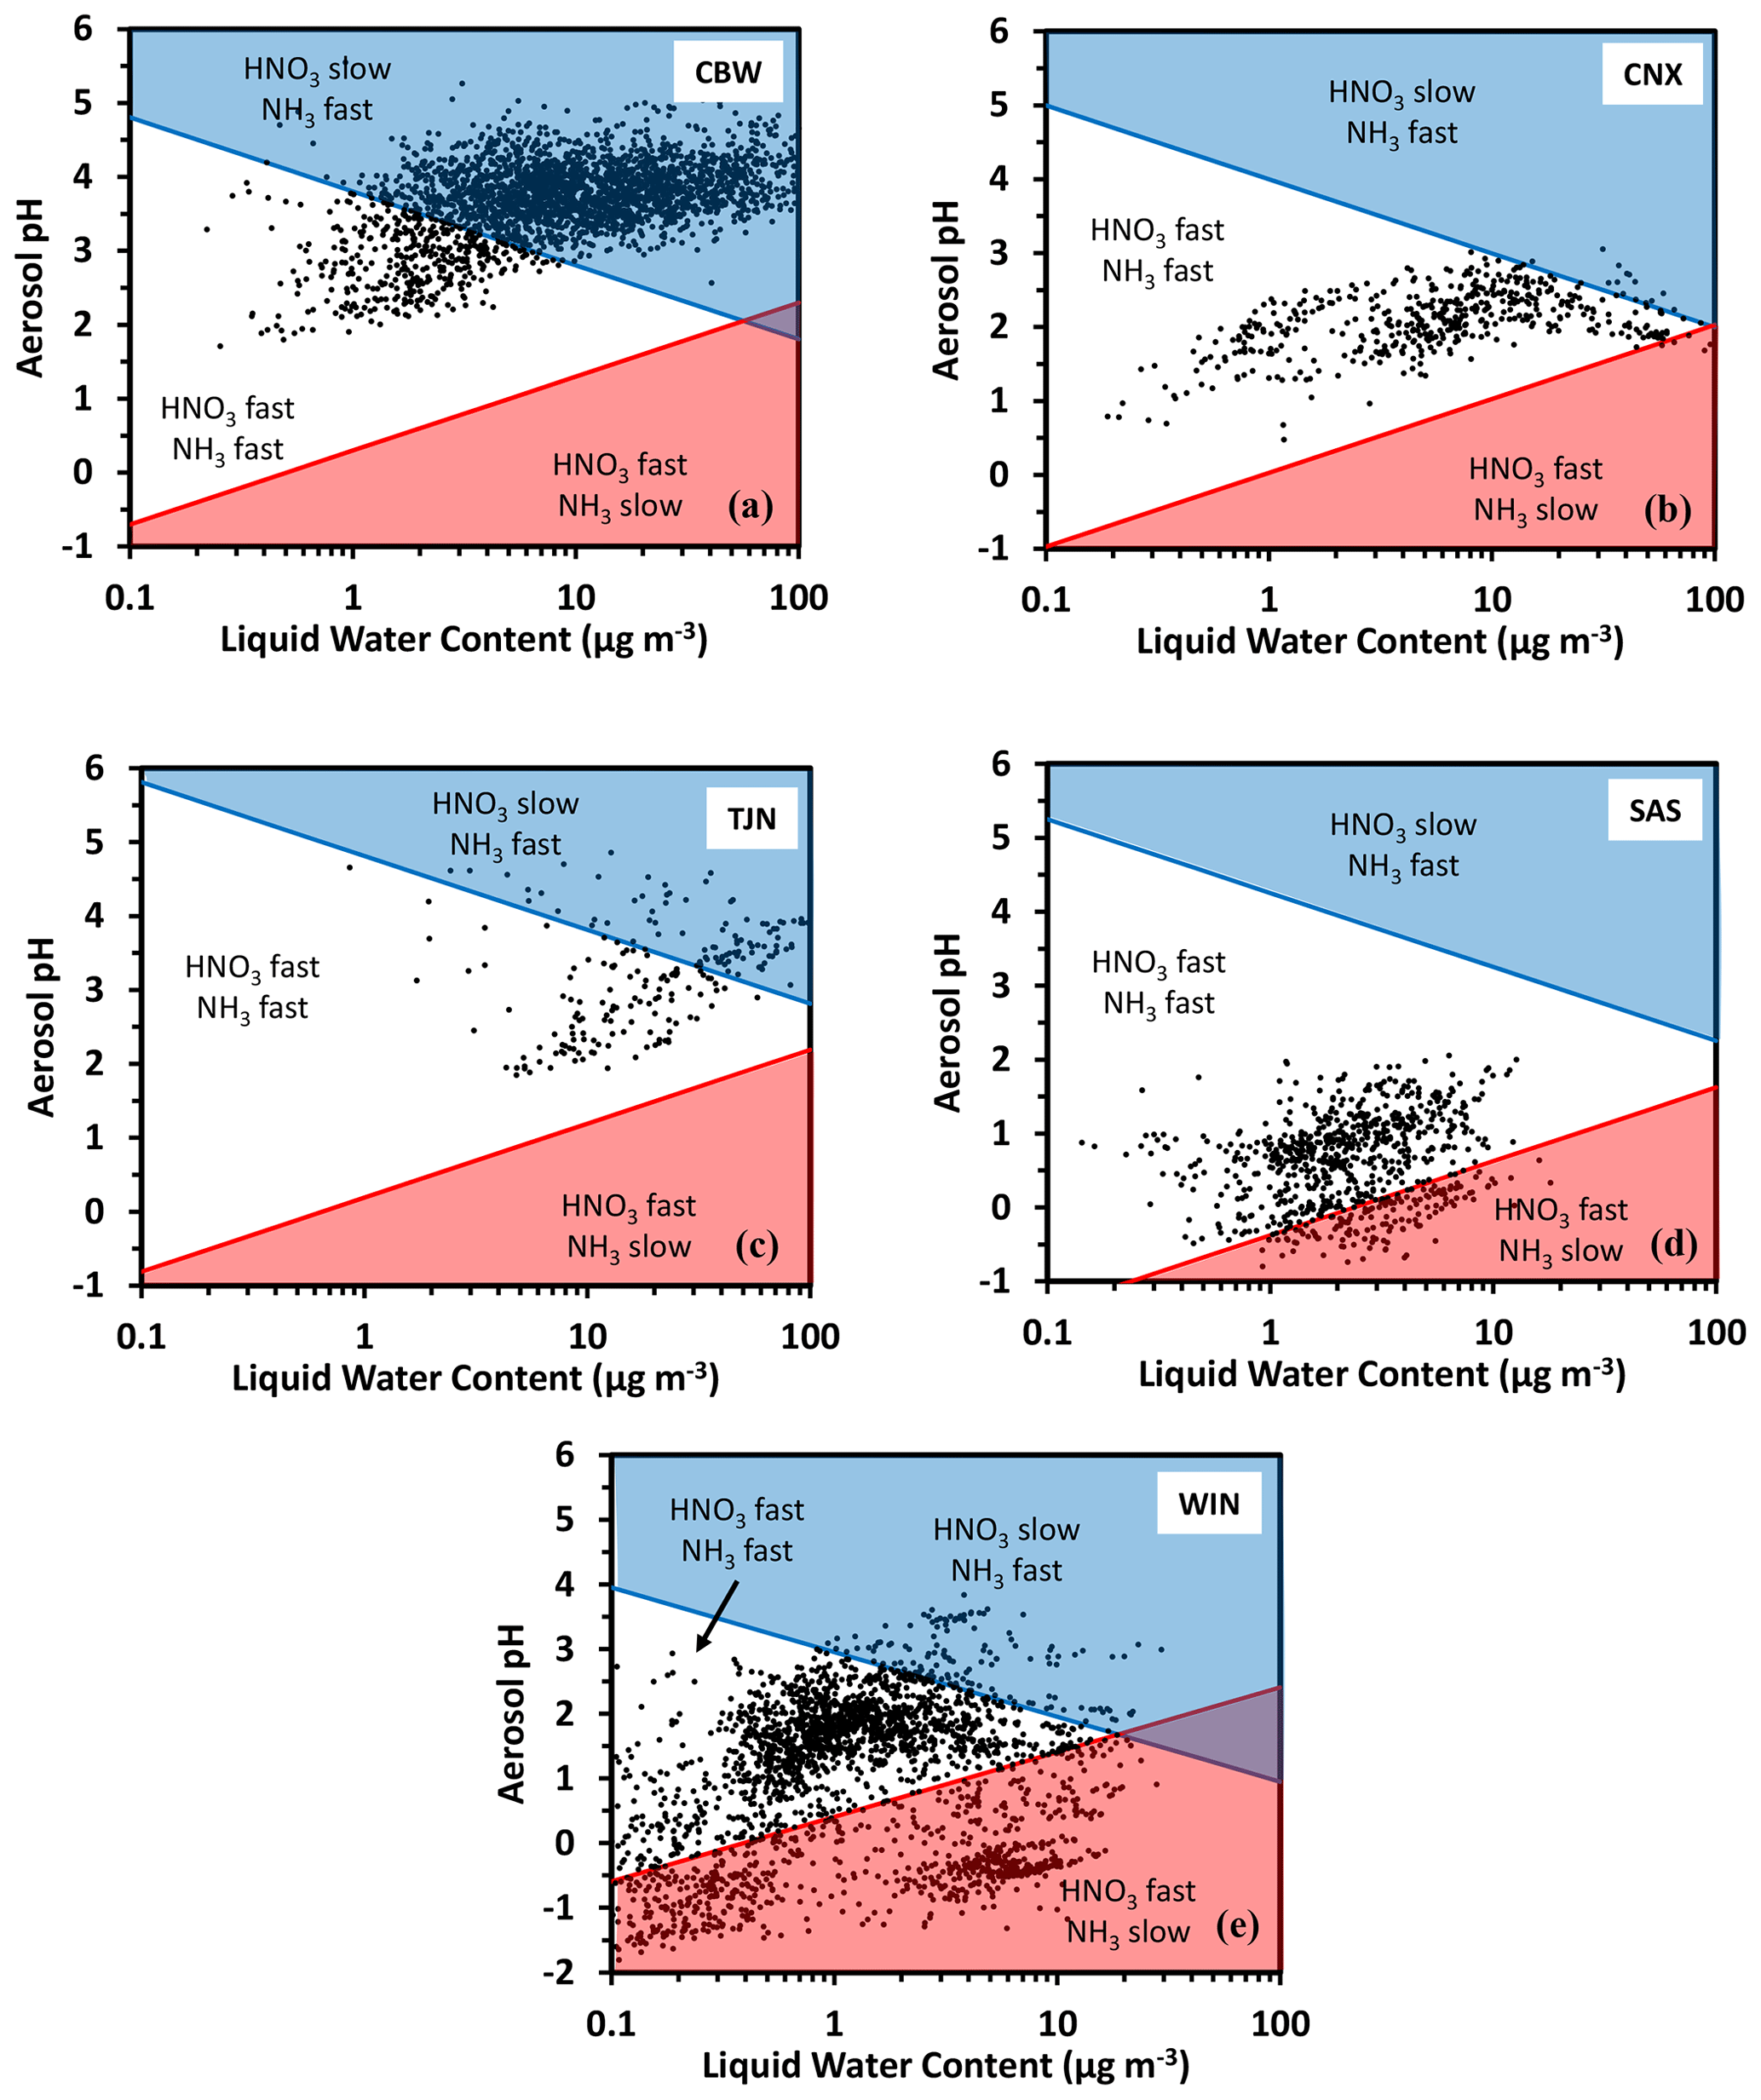
Figure 3Domains of reactive nitrogen deposition for five regions examined: (a) Cabauw – CBW, (b) CalNex – CNX, (c) Tianjin – TJN, (d) SE United States – SAS, and (e) NE United States (WIN).
To understand the implications of acidity and liquid variations for the reactive nitrogen flux (mol m−2 s−1), we first sum the contributions from NO3T and NH3T. Summing Eqs. (1) and (2) yields the reactive nitrogen flux, , expressed as moles N per area and unit of time:
Defining (fraction of Nr that is ) and substituting into Eq. (4) gives
Further dividing Eq. (5) with vpNr gives the nondimensional Nr flux, :
expresses how rapid is, compared to if the flux of Nr occurred with the particle deposition velocity. Equation (6) embodies the effect of acidity and liquid water content (through their effect on and on the Nr deposition velocity and flux. ranges between 1 and k; when it is equal to k, deposition is most efficient and occurs with the gas-phase deposition velocity for both and (Regime 1). Under such conditions, reactive nitrogen is rapidly lost from the atmosphere. When is unity, all the reactive nitrogen is in particulate form, and the dry deposition is at its slowest possible rate (Regime 4) – allowing its transport over larger distances and resulting in an increase of its lifetime in the boundary layer (considering only dry removal) by a factor of k.
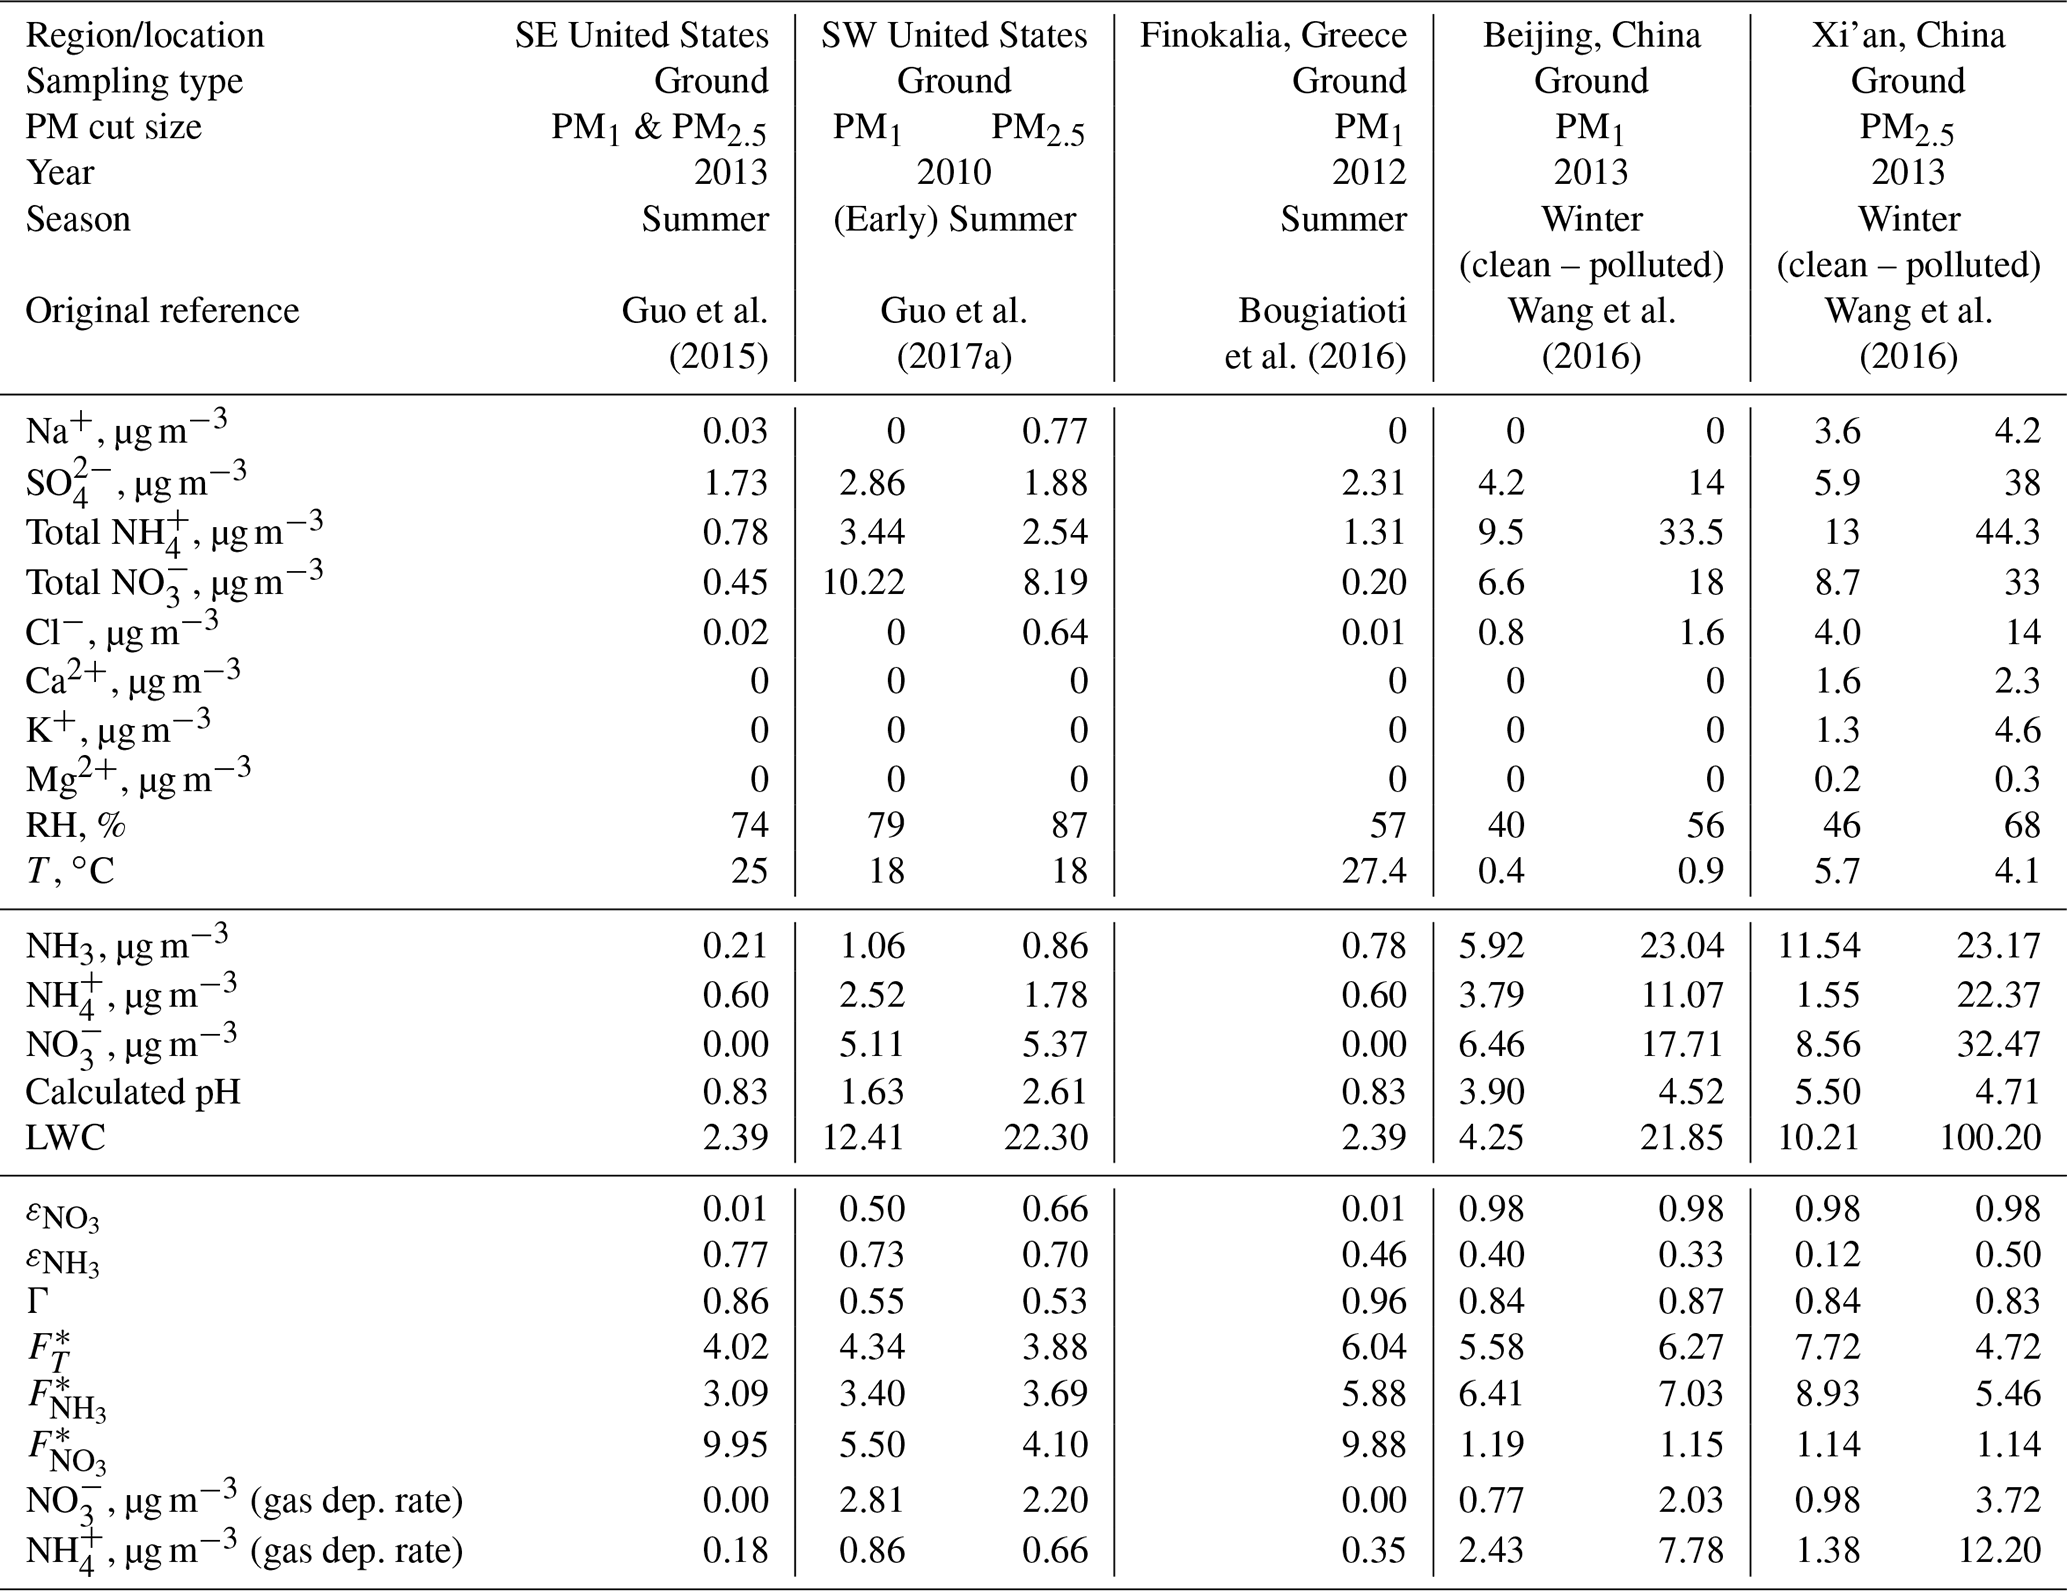
We apply Eq. (6) on observations that span a wide range of atmospheric acidity and liquid water content, to explore the degree to which atmospheric acidity can modulate . The observations analyzed (Table 1) are for characteristic conditions found in the United States, Europe, and China (refer to the table caption for more information on the data). US and European sites cited tend to be more acidic than the Asian sites (although Cabauw clearly is similar to the latter; Fig. 3a). To understand the deposition rate trends, we first examine the patterns for ammonia and nitrate separately and then the combined Nr flux.
Table 1Aerosol composition and meteorological conditions for flux deposition calculations and aerosol composition changes from modifications to the deposition velocity. The reported aerosol precursor concentrations, LWC, RH, and T are obtained from Table S1 of Guo et al. (2017b), but original references from which the data were obtained are also shown in row 6. Data for Finokalia, Greece, were obtained from Bougiatioti et al. (2016), assuming that the total NO is equal to the aerosol nitrate, and total NH is equal to the aerosol ammonium (0.81 µg m−3) plus 0.5 µg m−3 gas-phase NH3. The data in rows 7–17 are input to ISORROPIA-II (metastable, forward), and the output is then presented in rows 17–21. These data and the equations presented in the text are utilized to compute the quantities remaining in rows 22–29.
For ammonia, given that the pH is mostly above 1 (Table 1), the corresponding partitioning fractions are below 0.9 (Fig. 4a), and its deposition is generally fast. Indeed, its nondimensional deposition flux (Fig. 4b) is often above 5, and in polluted conditions in China it reaches values as high as 9 (Fig. 4b); lower values are only seen for the most acidic and warm conditions for the SE United States. The latter means that ammonia has a larger lifetime in the boundary layer of the SE United States, allowing for its buildup and transport over larger distances, relative to the situation in China, northern Europe, and other locations with mildly acidic aerosol.
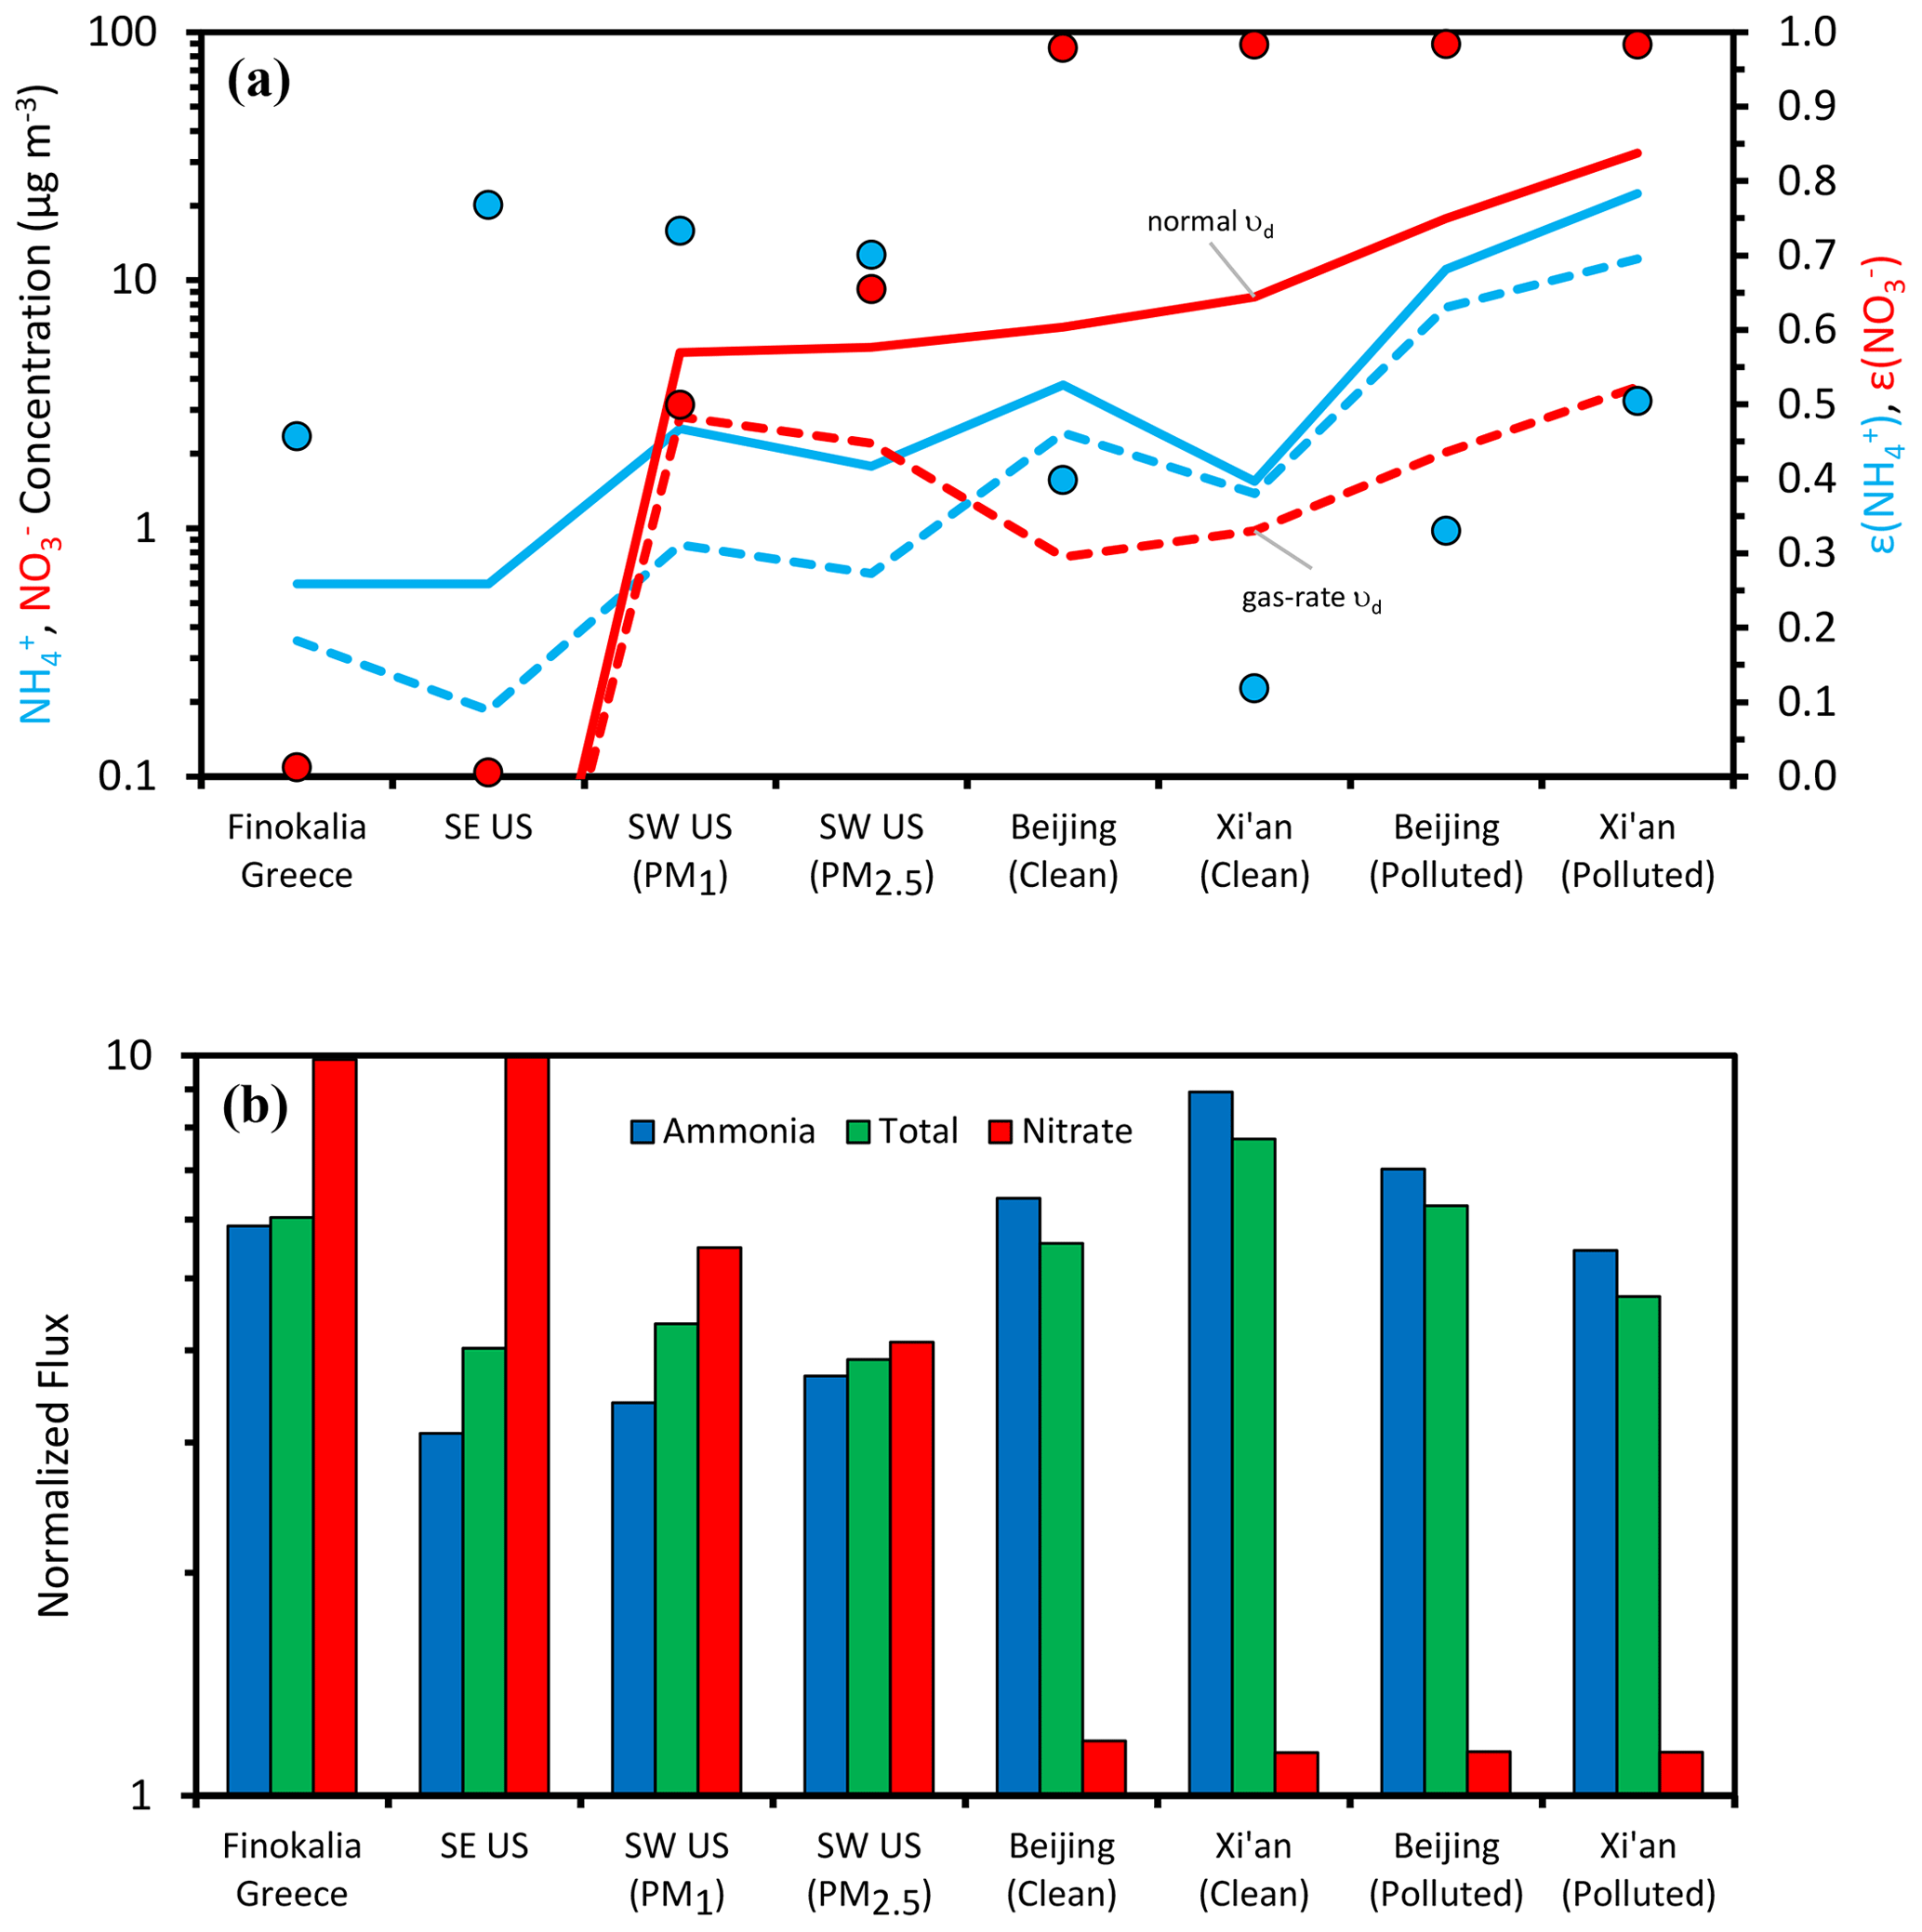
Figure 4Acidity and aerosol water impacts on aerosol concentration and deposition flux in select regions of the world that represent strongly acidic conditions (SE United States), intermediate acidity conditions (SW United States, Greece), and mildly acidic conditions (China). Shown is (a) the concentration of aerosol ammonium and nitrate and the impact of deposition velocity determined by the aerosol acidity state and (b) the impact of acidity state on normalized ammonia, nitrate, and total reduced nitrogen flux.
Nitric acid shows a different behavior, effectively exhibiting the full range of partitioning fractions and deposition velocities for the sites studied (Fig. 4a, b), giving a normalized deposition flux of ∼ 10 (i.e., mainly deposited as gaseous HNO3) in the SE United States and Finokalia, Greece, and ∼1 for the Asian sites. The immediate implication for its deposition patterns is that at the more acidic sites, remains close to the production region, while for less acidic conditions, it can be transported away with a 10-fold increase in its boundary-layer lifetime.
To understand the impact of both and pattern variability on the deposition flux of total reactive nitrogen, we first note that constitutes the majority of the Nr in all sites considered (i.e., Γ ∼ 0.5–0.96; Table 1). Given this, and considering that the acidity levels usually do not approach low enough levels to ensure that (Fig. 3a), does not substantially vary from location to location, and, it closely follows that of NH3 (Fig. 4b). Because of the opposite trends of normalized deposition flux between and (Fig. 4b), the shifts in ammonia deposition flux are partially mitigated when included in . The implication is that although nitrate exhibits large variability in dry deposition flux rate, ammonia should exhibit less variability – and therefore total reactive nitrogen should also have lower variability.
The immediate consequence of modulating deposition velocities is that the atmospheric residence time of aerosol precursors is changed. When the deposition velocity of Nr species is low, then the precursor is given an opportunity to accumulate – when it also corresponds to a compound that PM2.5 levels are sensitive to, aerosol levels can increase considerably. Based on the discussion in Sect. 4, aerosol nitrate accumulates (i.e., slow deposition), exactly when aerosol is most sensitive to changes in its concentration. To illustrate this effect, we estimate how the concentration of aerosol nitrate and ammonium would change in response to changes in deposition velocity. Following the approach of Weber et al. (2016), the steady-state boundary-layer concentration of nitrate can be written as
where h is the height of the boundary layer, E is the emission rate including transport from outside the boundary layer, and P is the photochemical production rate. Assuming that partitioning of total nitrate changes from a value to , the steady-state (with all other factors being equal) changes according to
Equation (8) suggests that if the pH (through its impact on varies sufficiently, the change in total nitrate in the boundary layer will approach a factor of k∼10 (Fig. 4a). Assuming that this occurs, we can then show PM would drop considerably in regions where nitrate constitutes a significant fraction of PM levels (Fig. 4a, difference between solid lines and dotted lines). Given that aerosol nitrate is often a significant constituent of PM in regions where the aerosol exhibits a mildly acidic pH (e.g., Cabauw, China), this constitutes an important and overlooked positive feedback (i.e., one that magnifies the response in particle mass or deposition rates) between acidity, nitric acid production, ammonium, and PM buildup that is a consequence of aerosol thermodynamic partitioning and deposition velocity. These processes are summarized in Fig. 5. A time-varying mixing layer, along with storage of both and aloft, complicates the dynamics, but the implications are the same: pH and liquid water content are integral to the deposition of reactive nitrogen.
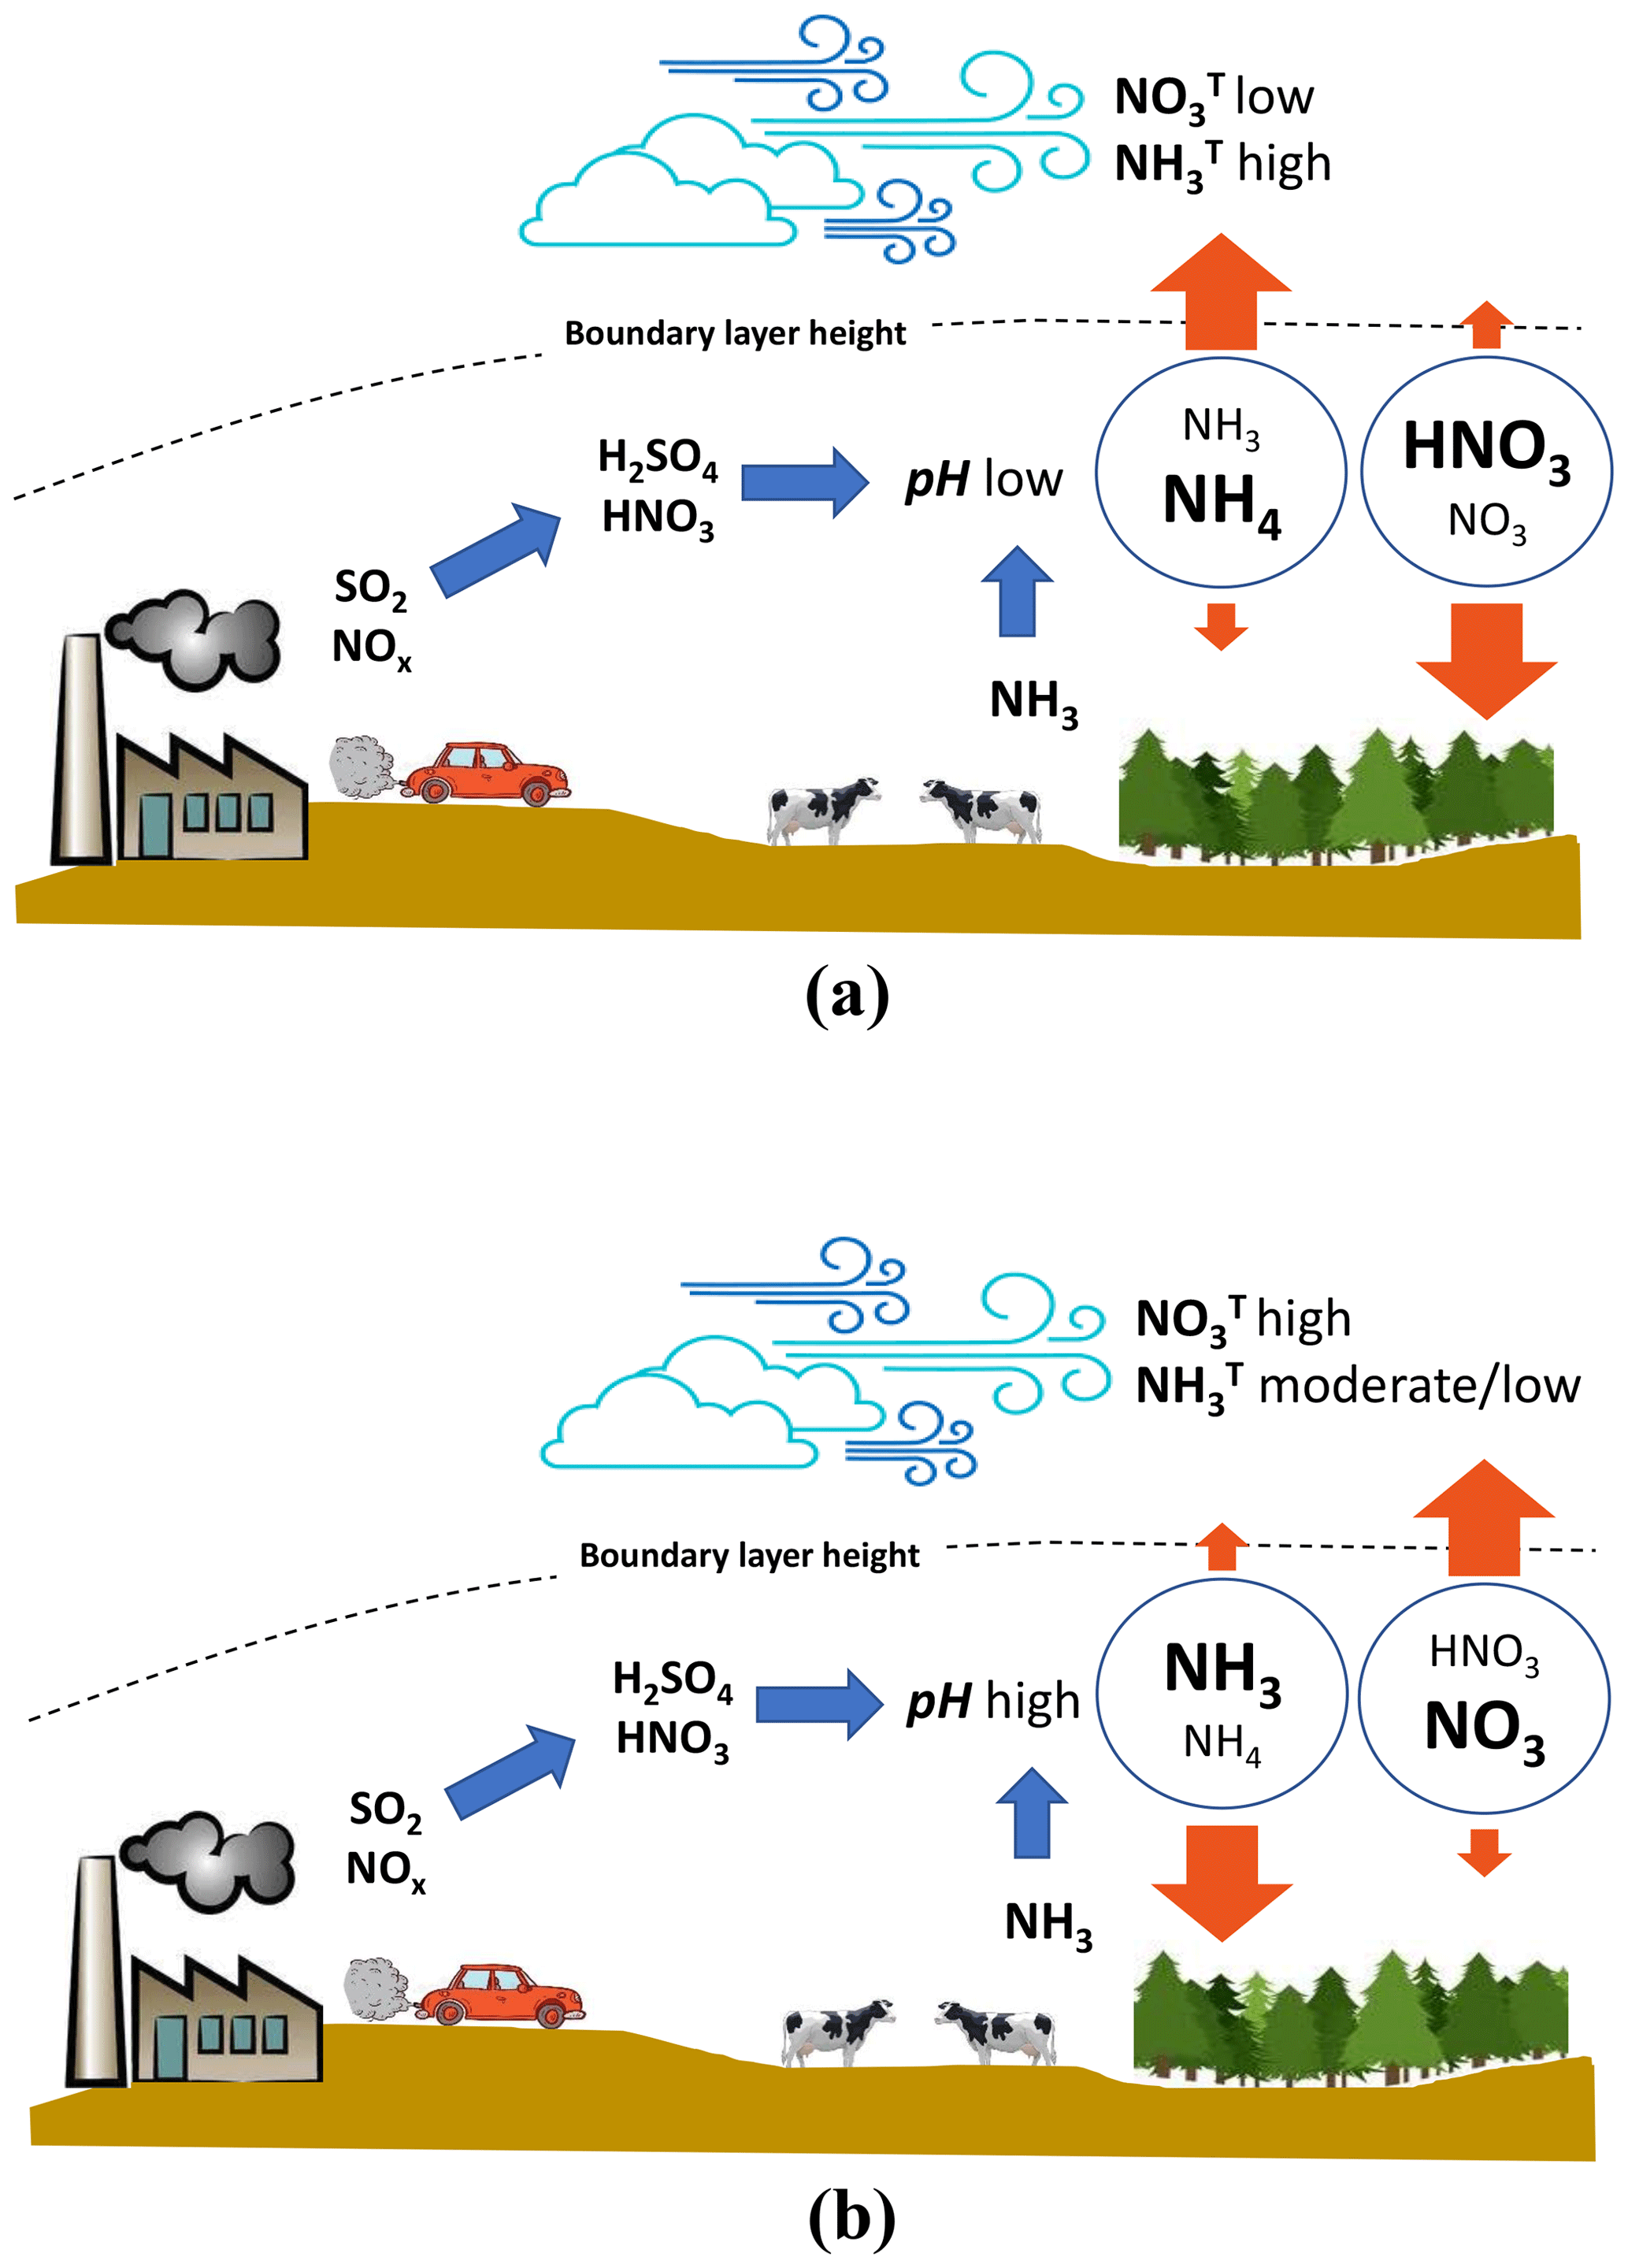
Figure 5Summary sketch of the interactions between aerosol pH and emissions of total ammonium and nitrate. (a) Aerosol pH is low and LWC is moderate, as is characteristic of the SE United States. Here the partitioning of ammonium is mostly in the aerosol phase, and the relevant dry deposition velocity is low. The concentration of total ammonium is dictated by the aerosol deposition velocity limit; ammonia export to the free troposphere is favored and vice versa for total nitrate. (b) Aerosol pH is high and LWC is moderate (as is characteristic of northern Europe in the winter and China). Here the partitioning of total ammonia is shifted to the gas phase, and the relevant dry deposition velocity is rapid. Total ammonia does not accumulate considerably in the boundary layer, and export to the free troposphere is minimal. Nitrate partitions to the aerosol phase, deposits slowly, and accumulates rapidly in the boundary layer. These conditions favor haze events and nitrate export to the free troposphere.
Here we present a simple framework to understand how aerosol acidity and liquid water content can modulate the dry deposition flux of inorganic reactive nitrogen species and an assessment of factors that cause variability in Nr deposition and their implications. Our analysis identifies four deposition velocity regimes: (i) HNO3 – fast, NH3 – slow, (ii) HNO3 – slow, NH3 – fast, (iii) HNO3 – fast, NH3 – fast, and (iv) HNO3 – slow, NH3 – slow. When this framework is applied to ambient measurements or predictions of PM and gaseous precursors, the regime of deposition velocity is directly determined. Generally, conditions that favor strong partitioning of species to the aerosol phase impact the deposition flux of Nr species and their potential for long-range transport. Applying this framework to select locations around the world reveals important implications: (i) ammonia deposition rates display little sensitivity to pH and liquid water variations, except under conditions of extreme acidity or aerosol liquid water content; and (ii) for the examples considered, dry deposition of total Nr is 50 %–85 % (by mol) total ammonia, which means that modest modulations of Nr flux are seen from acidity changes. There are regions, however (e.g., coastal areas, dust), where total nitrate may constitute a much larger fraction of the Nr – and for which acidity would drive fluctuations thereof. Total nitrate deposition flux is close to the maximum levels (approximately equal to the corresponding gas deposition rates) in the Southeastern United States and has minimum rates for northern Europe and China. When the latter occurs, the low deposition velocity can promote considerable accumulation of nitrate aerosol in the boundary layer – increasing the PM2.5 nitrate up to 10-fold, eventually causing the extremely high levels observed. If liquid water content is high enough (e.g., close to fog conditions), both total ammonia and nitrate deposit slowly and are allowed to accumulate, which create the potential for the most intense haze episodes. Nighttime conditions tend to be characterized by lower temperatures and higher humidity – both of which favor partitioning to the aerosol phase, which slows down deposition for both types of reduced nitrogen. This diurnal-deposition cycle exacerbates the daytime–nighttime contrast in boundary-layer aerosol concentration.
The above also point to the effect that model prediction biases in pH could have when it comes to prediction of reactive nitrogen deposition fluxes and PM levels in the boundary layer. For example, in the case of PM2.5 nitrate, not only will the aerosol levels be directly affected owing to partitioning ratio biases (Vasilakos et al., 2018), but also too much accumulation (if pH is predicted too high) or accelerated loss (if pH is predicted too low) may magnify nitrate prediction biases through the discussed feedback from deposition velocity. A similar situation can also arise for aerosol ammonium, only that the trends of bias with respect to pH are reversed. Identical biases also can arise for semi-volatile species that are sensitive to aerosol pH, such as chloride, amines, and organic acids.
Although ammonium almost exclusively resides in the fine mode – where the equilibrium analysis carried out here is most applicable – nitrate can also reside partially in the coarse mode in the presence of dust and/or sea salt particles (e.g., Karydis et al., 2016) because the latter tend to have a high enough pH to favor partitioning (Vasilakos et al., 2018; Kakavas et al., 2021). The same principle and trends also apply in such situations, as acidity and liquid water content drive gas–aerosol partitioning and modulate the deposition velocity (the analysis can also be extended to separately consider coarse- and fine-mode particles), though larger particles have a higher deposition velocity than submicron particles. The effect of organic aerosol and its associated liquid water content may also affect the partitioning, although such effects remain to be studied and may be most important at low relative humidity (below 40 %) and temperatures low enough for strong diffusivity limitations to limit the applicability of equilibrium considerations (Battaglia et al., 2019; Pye et al., 2020). The fast region at higher temperatures suggests that deposition would be slower and that long-range transport becomes more prevalent in winter. Furthermore, nitrate forms largely from oxidation of NOx emissions; nonlinearities in gas-phase oxidation complicate the relationship between the thermodynamic framework and precursor emissions. Despite these limitations, the new understanding presented here applies throughout most of the atmosphere close to the surface, demonstrating that aerosol pH and its associated liquid water content naturally emerge as parameters that drive the dry deposition flux and atmospheric lifetime of reactive nitrogen and can initiate feedbacks that promote heavy PM2.5 pollution episodes.
User access to data used in this paper is described in the citations referenced for each dataset and can also be accessed from the compiled dataset of Pye et al. (2020). The ISORROPIA-II thermodynamic equilibrium code is available at https://isorropia.epfl.ch (last access: 25 March 2021, Nenes, 2021). Relevant spreadsheets and mapping templates are provided upon request.
AN initiated the study, developed the framework, carried out analysis of the ambient data, and wrote the initial draft. All authors helped interpret the data, provided feedback on the analysis approach, and extensively commented on the manuscript.
The authors declare that they have no conflict of interest.
The contents of this paper are solely the responsibility of the grantee and do not necessarily represent the official views of the supporting agencies. Further, the U.S. government does not endorse the purchase of any commercial products or services mentioned in the publication.
This work was supported by the project PyroTRACH (ERC-2016-COG) funded by H2020-EU.1.1. – Excellent Science – European Research Council (ERC), project ID 726165. We also acknowledge support from the European Union Horizon 2020 project FORCeS under grant agreement no. 821205. Maria Kanakidou acknowledges support of this work by the project “PANhellenic infrastructure for Atmospheric Composition and climatE change” (MIS 5021516), which is implemented under the Action “Reinforcement of the Research and Innovation Infrastructure”, funded by the Operational Programme “Competitiveness, Entrepreneurship and Innovation” (NSRF 2014–2020) and co-financed by Greece and the European Union (European Regional Development Fund). Rodney J. Weber acknowledges support from the U.S. EPA under grant R83588201. Armistead G. Russell acknowledges support from the U.S. EPA under grants R83588001 and R83588201.
This research has been supported by the European Research Council, H2020 Research Infrastructures (PyroTRACH (grant no. 726165)), the European Union Horizon 2020 project FORCeS under grant agreement no. 821205, the General Secretariat for Research and Technology (grant no. MIS 5021516), and the U.S. Environmental Protection Agency (grant nos. R83588201 and R83588001).
This paper was edited by Veli-Matti Kerminen and reviewed by two anonymous referees.
Battaglia Jr., M. A., Weber, R. J., Nenes, A., and Hennigan, C. J.: Effects of water-soluble organic carbon on aerosol pH, Atmos. Chem. Phys., 19, 14607–14620, https://doi.org/10.5194/acp-19-14607-2019, 2019.
Bellouin, N., Rae, J., Jones, A., Johnson, C., Haywood, J., and Boucher, O.: Aerosol forcing in the Climate Model Intercomparison Project (CMIP5) simulations by HadGEM2-ES and the role of ammonium nitrate, J. Geophys. Res.-Atmos., 116, D20206, https://doi.org/10.1029/2011jd016074, 2011.
Bougiatioti, A., Nikolaou, P., Stavroulas, I., Kouvarakis, G., Weber, R., Nenes, A., Kanakidou, M., and Mihalopoulos, N.: Particle water and pH in the eastern Mediterranean: source variability and implications for nutrient availability, Atmos. Chem. Phys., 16, 4579–4591, https://doi.org/10.5194/acp-16-4579-2016, 2016.
Cohen, A. J., Brauer, M., Burnett, R., Anderson, H. R., Frostad, J., Estep, K., Balakrishnan, K., Brunekreef, B., Dandona, L., Dandona, R., Feigin, V., Freedman, G., Hubbell, B., Jobling, A., Kan, H., Knibbs, L., Liu, Y., Martin, R., Morawska, L., Pope, C. A., Shin, H., Straif, K., Shaddick, G., Thomas, M., van Dingenen, R., van Donkelaar, A., Vos, T., Murray, C. J. L., and Forouzanfar, M. H.: Estimates and 25-year trends of the global burden of disease attributable to ambient air pollution: an analysis of data from the Global Burden of Diseases Study 2015, Lancet, 389, 1907–1918, https://doi.org/10.1016/s0140-6736(17)30505-6, 2017.
Duyzer, J.: Dry deposition of ammonia and ammonium aerosols over heathland, J. Geophys. Res.-Atmos., 99, 18757–18763, https://doi.org/10.1029/94JD01210, 1994.
Fountoukis, C. and Nenes, A.: ISORROPIA II: a computationally efficient thermodynamic equilibrium model for K+-Ca2+-Mg2+--Na+---Cl−-H2O aerosols, Atmos. Chem. Phys., 7, 4639–4659, https://doi.org/10.5194/acp-7-4639-2007, 2007.
Fowler, D., Coyle, M., Skiba, U., Sutton, M. A., Cape, J. N., Reis, S., Sheppard, L. J., Jenkins, A., Grizzetti, B., Galloway, J. N., Vitousek, P., Leach, A., Bouwman, A. F., Butterbach-Bahl, K., Dentener, F., Stevenson, D., Amann, M., and Voss, M.: The global nitrogen cycle in the twenty-first century, Philos. T. Roy. Soc. B, 368, 20130164, https://doi.org/10.1098/rstb.2013.0164, 2013.
Guo, H., Xu, L., Bougiatioti, A., Cerully, K. M., Capps, S. L., Hite Jr., J. R., Carlton, A. G., Lee, S.-H., Bergin, M. H., Ng, N. L., Nenes, A., and Weber, R. J.: Fine-particle water and pH in the southeastern United States, Atmos. Chem. Phys., 15, 5211–5228, https://doi.org/10.5194/acp-15-5211-2015, 2015.
Guo, H., Sullivan, A. P., Campuzano-Jost, P., Schroder, J. C., Lopez-Hilfiker, F. D., Dibb, J. E., Jimenez, J. L., Thornton, J. A., Brown, S. S., Nenes, A., and Weber, R. J.: Fine particle pH and the partitioning of nitric acid during winter in the northeastern United States, J. Geophys. Res.-Atmos., 121, 10355–10376, https://doi.org/10.1002/2016jd025311, 2016.
Guo, H., Liu, J., Froyd, K. D., Roberts, J. M., Veres, P. R., Hayes, P. L., Jimenez, J. L., Nenes, A., and Weber, R. J.: Fine particle pH and gas–particle phase partitioning of inorganic species in Pasadena, California, during the 2010 CalNex campaign, Atmos. Chem. Phys., 17, 5703–5719, https://doi.org/10.5194/acp-17-5703-2017, 2017a.
Guo, H., Weber, R. J., and Nenes, A.: High levels of ammonia do not raise fine particle pH sufficiently to yield nitrogen oxide-dominated sulfate production, Sci. Rep.-UK, 7, 12109, https://doi.org/10.1038/s41598-017-11704-0, 2017b.
Guo, H., Otjes, R., Schlag, P., Kiendler-Scharr, A., Nenes, A., and Weber, R. J.: Effectiveness of ammonia reduction on control of fine particle nitrate, Atmos. Chem. Phys., 18, 12241–12256, https://doi.org/10.5194/acp-18-12241-2018, 2018.
Haywood, J. and Boucher, O.: Estimates of the direct and indirect radiative forcing due to tropospheric aerosols: A review, Rev. Geophys., 38, 513–543, https://doi.org/10.1029/1999rg000078, 2000.
IPCC: Climate Change 2013: The Physical Science Basis, in: Contribution of Working Group I to the Fifth Assessment Report of the Intergovernmental Panel on Climate Change, Cambridge, United Kingdom and New York, USA, 1535 pp., 2013.
Jickells, T. D., Buitenhuis, E., Altieri, K., Baker, A. R., Capone, D., Duce, R. A., Dentener, F., Fennel, K., Kanakidou, M., LaRoche, J., Lee, K., Liss, P., Middelburg, J. J., Moore, J. K., Okin, G., Oschlies, A., Sarin, M., Seitzinger, S., Sharples, J., Singh, A., Suntharalingam, P., Uematsu, M., and Zamora, L. M.: A reevaluation of the magnitude and impacts of anthropogenic atmospheric nitrogen inputs on the ocean, Global Biogeochem. Cy., 31, 289–305, https://doi.org/10.1002/2016GB005586, 2017.
Kakavas, S., Patoulias, D., Zakoura, M., Nenes, A., and Pandis, S. N.: Size-resolved aerosol pH over Europe during summer, Atmos. Chem. Phys., 21, 799–811, https://doi.org/10.5194/acp-21-799-2021, 2021.
Kanakidou, M., Seinfeld, J. H., Pandis, S. N., Barnes, I., Dentener, F. J., Facchini, M. C., Van Dingenen, R., Ervens, B., Nenes, A., Nielsen, C. J., Swietlicki, E., Putaud, J. P., Balkanski, Y., Fuzzi, S., Horth, J., Moortgat, G. K., Winterhalter, R., Myhre, C. E. L., Tsigaridis, K., Vignati, E., Stephanou, E. G., and Wilson, J.: Organic aerosol and global climate modelling: a review, Atmos. Chem. Phys., 5, 1053–1123, https://doi.org/10.5194/acp-5-1053-2005, 2005.
Kanakidou, M., Myriokefalitakis, S., Daskalakis, N., Fanourgakis, G., Nenes, A., Baker, A. R., Tsigaridis, K., and Mihalopoulos, N.: Past, present and future atmospheric nitrogen deposition, J. Atmos. Sci., 73, 2039–2047, 2016.
Karydis, V. A., Tsimpidi, A. P., Pozzer, A., Astitha, M., and Lelieveld, J.: Effects of mineral dust on global atmospheric nitrate concentrations, Atmos. Chem. Phys., 16, 1491–1509, https://doi.org/10.5194/acp-16-1491-2016, 2016.
Lelieveld, J., Evans, J. S., Fnais, M., Giannadaki, D., and Pozzer, A.: The contribution of outdoor air pollution sources to premature mortality on a global scale, Nature, 525, 367–371, https://doi.org/10.1038/nature15371, 2015.
Lim, S. S., Vos, T., Flaxman, A. D., Danaei, G., Shibuya, K., Adair-Rohani, H., AlMazroa, M. A., Amann, M., Anderson, H. R., Andrews, K. G., Aryee, M., Atkinson, C., Bacchus, L. J., Bahalim, A. N., Balakrishnan, K., Balmes, J., Barker-Collo, S., Baxter, A., Bell, M. L., Blore, J. D., Blyth, F., Bonner, C., Borges, G., Bourne, R., Boussinesq, M., Brauer, M., Brooks, P., Bruce, N. G., Brunekreef, B., Bryan-Hancock, C., Bucello, C., Buchbinder, R., Bull, F., Burnett, R. T., Byers, T. E., Calabria, B., Carapetis, J., Carnahan, E., Chafe, Z., Charlson, F., Chen, H., Chen, J. S., Cheng, A. T.-A., Child, J. C., Cohen, A., Colson, K. E., Cowie, B. C., Darby, S., Darling, S., Davis, A., Degenhardt, L., Dentener, F., Des Jarlais, D. C., Devries, K., Dherani, M., Ding, E. L., Dorsey, E. R., Driscoll, T., Edmond, K., Ali, S. E., Engell, R. E., Erwin, P. J., Fahimi, S., Falder, G., Farzadfar, F., Ferrari, A., Finucane, M. M., Flaxman, S., Fowkes, F. G. R., Freedman, G., Freeman, M. K., Gakidou, E., Ghosh, S., Giovannucci, E., Gmel, G., Graham, K., Grainger, R., Grant, B., Gunnell, D., Gutierrez, H. R., Hall, W., Hoek, H. W., Hogan, A., Hosgood Iii, H. D., Hoy, D., Hu, H., Hubbell, B. J., Hutchings, S. J., Ibeanusi, S. E., Jacklyn, G. L., Jasrasaria, R., Jonas, J. B., Kan, H., Kanis, J. A., Kassebaum, N., Kawakami, N., Khang, Y.-H., Khatibzadeh, S., Khoo, J.-P., Kok, C., Laden, F., Lalloo, R., Lan, Q., Lathlean, T., Leasher, J. L., Leigh, J., Li, Y., Lin, J. K., Lipshultz, S. E., London, S., Lozano, R., Lu, Y., Mak, J., Malekzadeh, R., Mallinger, L., Marcenes, W., March, L., Marks, R., Martin, R., McGale, P., McGrath, J., Mehta, S., Memish, Z. A., Mensah, G. A., Merriman, T. R., Micha, R., Michaud, C., Mishra, V., Hanafiah, K. M., Mokdad, A. A., Morawska, L., Mozaffarian, D., Murphy, T., Naghavi, M., Neal, B., Nelson, P. K., Nolla, J. M., Norman, R., Olives, C., Omer, S. B., Orchard, J., Osborne, R., Ostro, B., Page, A., Pandey, K. D., Parry, C. D. H., Passmore, E., Patra, J., Pearce, N., Pelizzari, P. M., Petzold, M., Phillips, M. R., Pope, D., Pope Iii, C. A., Powles, J., Rao, M., Razavi, H., Rehfuess, E. A., Rehm, J. T., Ritz, B., Rivara, F. P., Roberts, T., Robinson, C., Rodriguez-Portales, J. A., Romieu, I., Room, R., Rosenfeld, L. C., Roy, A., Rushton, L., Salomon, J. A., Sampson, U., Sanchez-Riera, L., Sanman, E., Sapkota, A., Seedat, S., Shi, P., Shield, K., Shivakoti, R., Singh, G. M., Sleet, D. A., Smith, E., Smith, K. R., Stapelberg, N. J. C., Steenland, K., Stöckl, H., Stovner, L. J., Straif, K., Straney, L., Thurston, G. D., Tran, J. H., Van Dingenen, R., van Donkelaar, A., Veerman, J. L., Vijayakumar, L., Weintraub, R., Weissman, M. M., White, R. A., Whiteford, H., Wiersma, S. T., Wilkinson, J. D., Williams, H. C., Williams, W., Wilson, N., Woolf, A. D., Yip, P., Zielinski, J. M., Lopez, A. D., Murray, C. J. L., and Ezzati, M.: A comparative risk assessment of burden of disease and injury attributable to 67 risk factors and risk factor clusters in 21 regions, 1990–2010: a systematic analysis for the Global Burden of Disease Study 2010, Lancet, 380, 2224–2260, https://doi.org/10.1016/S0140-6736(12)61766-8, 2012.
Meskhidze, N., Chameides, W. L., Nenes, A., and Chen, G.: Iron mobilization in mineral dust: Can anthropogenic SO2 emissions affect ocean productivity?, Geophys. Res. Lett., 30, 2085, https://doi.org/10.1029/2003gl018035, 2003.
National Academies of Sciences, Engineering, and Medicine: The Future of Atmospheric Chemistry Research: Remembering Yesterday, Understanding Today, Anticipating Tomorrow, The National Academies Press, Washington, D.C., USA, 226 pp., https://doi.org/10.17226/23573, 2016.
Nenes, A.: ISORROPIA Model, available at: https://isorropia.epfl.ch, last access: 25 March 2021.
Nenes, A., Pandis, S. N., Weber, R. J., and Russell, A.: Aerosol pH and liquid water content determine when particulate matter is sensitive to ammonia and nitrate availability, Atmos. Chem. Phys., 20, 3249–3258, https://doi.org/10.5194/acp-20-3249-2020, 2020.
Pinder, R. W., Adams, P. J., and Pandis, S. N.: Ammonia Emission Controls as a Cost-Effective Strategy for Reducing Atmospheric Particulate Matter in the Eastern United States, Environ. Sci. Technol., 41, 380–386, https://doi.org/10.1021/es060379a, 2007.
Pinder, R. W., Dennis, R. L., and Bhave, P. V.: Observable indicators of the sensitivity of PM2.5 nitrate to emission reductions – Part I: Derivation of the adjusted gas ratio and applicability at regulatory-relevant time scales, Atmos. Environ., 42, 1275–1286, 2008.
Pope III, C. A., Burnett, R. T., Thurston, G. D., Thun, M. J., Calle, E. E., Krewski, D., and Godleski, J. J.: Cardiovascular mortality and long-term exposure to particulate air pollution: epidemiological evidence of general pathophysiological pathways of disease, Circulation, 109, 71–77, https://doi.org/10.1161/01.CIR.0000108927.80044.7F, 2004.
Pye, H. O. T., Nenes, A., Alexander, B., Ault, A. P., Barth, M. C., Clegg, S. L., Collett Jr., J. L., Fahey, K. M., Hennigan, C. J., Herrmann, H., Kanakidou, M., Kelly, J. T., Ku, I.-T., McNeill, V. F., Riemer, N., Schaefer, T., Shi, G., Tilgner, A., Walker, J. T., Wang, T., Weber, R., Xing, J., Zaveri, R. A., and Zuend, A.: The acidity of atmospheric particles and clouds, Atmos. Chem. Phys., 20, 4809–4888, https://doi.org/10.5194/acp-20-4809-2020, 2020.
Sardar, S. B., Fine, P. M., and Sioutas, C.: Seasonal and spatial variability of the size-resolved chemical composition of particulate matter (PM10) in the Los Angeles Basin, J. Geophys. Res.-Atmos., 110, D07S08, https://doi.org/10.1029/2004jd004627, 2005.
Seinfeld, J. H. and Pandis, S. N.: Atmospheric Chemistry and Physics: From Air Pollution to Climate Change, John Wiley & Sons, Hoboken, New Jersey, USA, 2016.
Suntharalingam, P., Resplandy, L., Setzinger, S., Buitenhuis, E., Kanakidou, M., Landolfi, A., Bikkina, S., Zamora, L., Lamarque, J.-F., Bange, H., Sarin, M., and Singh, A.: Anthropogenic nitrogen inputs and impacts on oceanic N2O fluxes in the northern Indian Ocean: the need for an integrated observation and modelling approach, Deep-Sea Res. Pt. II, 166, 104–113, https://doi.org/10.1016/j.dsr2.2019.03.007, 2019.
Vasilakos, P., Russell, A., Weber, R., and Nenes, A.: Understanding nitrate formation in a world with less sulfate, Atmos. Chem. Phys., 18, 12765–12775, https://doi.org/10.5194/acp-18-12765-2018, 2018.
Wang, G., Zhang, R., Gomez, M. E., Yang, L., Levy Zamora, M., Hu, M., Lin, Y., Peng, J., Guo, S., Meng, J., Li, J., Cheng, C., Hu, T., Ren, Y., Wang, Y., Gao, J., Cao, J., An, Z., Zhou, W., Li, G., Wang, J., Tian, P., Marrero-Ortiz, W., Secrest, J., Du, Z., Zheng, J., Shang, D., Zeng, L., Shao, M., Wang, W., Huang, Y., Wang, Y., Zhu, Y., Li, Y., Hu, J., Pan, B., Cai, L., Cheng, Y., Ji, Y., Zhang, F., Rosenfeld, D., Liss, P. S., Duce, R. A., Kolb, C. E., and Molina, M. J.: Persistent sulfate formation from London Fog to Chinese haze, P. Natl. Acad. Sci. USA, 113, 13630–13635, https://doi.org/10.1073/pnas.1616540113, 2016.
Weber, R. J., Guo, H., Russell, A. G., and Nenes, A.: High aerosol acidity despite declining atmospheric sulfate concentrations over the past 15 years, Nat. Geosci., 9, 282–285, https://doi.org/10.1038/ngeo2665, 2016.
Zhang, Q., Jimenez, J. L., Canagaratna, M. R., Allan, J. D., Coe, H., Ulbrich, I., Alfarra, M. R., Takami, A., Middlebrook, A. M., Sun, Y. L., Dzepina, K., Dunlea, E., Docherty, K., DeCarlo, P. F., Salcedo, D., Onasch, T., Jayne, J. T., Miyoshi, T., Shimono, A., Hatakeyama, S., Takegawa, N., Kondo, Y., Schneider, J., Drewnick, F., Borrmann, S., Weimer, S., Demerjian, K., Williams, P., Bower, K., Bahreini, R., Cottrell, L., Griffin, R. J., Rautiainen, J., Sun, J. Y., Zhang, Y. M., and Worsnop, D. R.: Ubiquity and dominance of oxygenated species in organic aerosols in anthropogenically-influenced Northern Hemisphere midlatitudes, Geophys. Res. Lett., 34, L13801, https://doi.org/10.1029/2007gl029979, 2007.
- Abstract
- Introduction
- The new conceptual framework
- Application of the framework
- Implications for deposition flux of Nr at selection locations worldwide
- Implications of modified deposition flux for boundary-layer PM2.5 levels
- Conclusions
- Code and data availability
- Author contributions
- Competing interests
- Disclaimer
- Acknowledgements
- Financial support
- Review statement
- References