the Creative Commons Attribution 4.0 License.
the Creative Commons Attribution 4.0 License.
 | 20 Apr 2021
Explicit modeling of isoprene chemical processing in polluted air masses in suburban areas of the Yangtze River Delta region: radical cycling and formation of ozone and formaldehyde
Kun Zhang
Ling Huang
Qing Li
Juntao Huo
Yusen Duan
Yuhang Wang
Elly Yaluk
Yangjun Wang
Qingyan Fu
In recent years, ozone pollution has become one of the most severe environmental problems in China. Evidence from observations have showed increased frequency of high O3 levels in suburban areas of the Yangtze River Delta (YRD) region. To better understand the formation mechanism of local O3 pollution and investigate the potential role of isoprene chemistry in the budgets of ROx radicals, synchronous observations of volatile organic compounds (VOCs), formaldehyde (HCHO), and meteorological parameters were conducted at a suburban site of the YRD region in 2018. Five episodes with elevated O3 concentrations under stagnant meteorological conditions were identified; an observation-based model (OBM) with the Master Chemical Mechanism was applied to analyze the photochemical processes during these high O3 episodes. The high levels of O3, nitrogen oxides (NOx), and VOCs facilitated strong production and recycling of ROx radicals with the photolysis of oxygenated VOCs (OVOCs) being the primary source. Our results suggest that local biogenic isoprene is important in suburban photochemical processes. Removing isoprene could drastically slow down the efficiency of ROx recycling and reduce the concentrations of ROx. In addition, the absence of isoprene chemistry could further lead to a decrease in the daily average concentrations of O3 and HCHO by 34 % and 36 %, respectively. Therefore, this study emphasizes the importance of isoprene chemistry in the suburban atmosphere, particularly with the participation of anthropogenic NOx. Moreover, our results provide insights into the radical chemistry that essentially drives the formation of secondary pollutants (e.g., O3 and HCHO) in suburban areas of the YRD region.
- Article
(5732 KB) - Full-text XML
-
Supplement
(1150 KB) - BibTeX
- EndNote


The hydroxyl radical (OH), hydroperoxy radical (HO2) and organic peroxy radical (RO2), collectively known as ROx, dominate the oxidative capacity of the atmosphere and hence govern the removal of primary contaminants (e.g., volatile organic compounds (VOCs)) and the formation of secondary pollutants (e.g., ozone (O3), secondary organic aerosols (SOAs)) (Liu et al., 2012; Xue et al., 2016). ROx radicals can undergo efficient recycling (e.g., ) and produce O3 and oxygenated VOCs (OVOCs) (Liu et al., 2012; Tan et al., 2019; Xue et al., 2016). In addition, the photolysis of OVOCs can in turn produce primary RO2 and HO2 radicals, and further accelerate the recycling of ROx (Liu et al., 2012). The reaction rates of different VOCs with ROx vary significantly (Atkinson and Arey, 2003; Atkinson et al., 2006). For instance, the reaction rate constants for OH with ethane and ethene are 0.248 × 10⁻¹² and 8.52 × 10⁻¹² (cm molec.−1 s−1), respectively. Among the hundreds and thousands of VOC species, isoprene (C5H8, 2-methyl-1,3-butadiene) is among the most active and abundant biogenic VOCs (BVOCs) species globally (Wennberg et al., 2018). Over the past decades, isoprene emission sources have been extensively studied (Gong et al., 2018) and recent work has focused on the degradation pathways and the impact of isoprene chemistry on regional forest chemistry (Gong et al., 2018; Wolfe et al., 2016a). Previous studies showed that isoprene could be quickly oxidized by atmospheric oxidants (e.g., OH, O3, or NO3) (Wolfe et al., 2016a; Gong et al., 2018; Jenkin et al., 2015). Due to the rapid reaction between OH and isoprene (100 × 10−12 cm3 molec.−1 s−1 at 298 K), more than 90 % of the total daytime isoprene is removed via this reaction (Wennberg et al., 2018). The reaction between OH and isoprene is initiated by the addition of OH and can generate isoprene hydroxyperoxy radicals (ISOPO2) (Wennberg et al., 2018; D'Ambro et al., 2017; Liu et al., 2013; Jenkin et al., 2015). ISOPO2 isomers could then interconvert rapidly due to reversible O2 addition and are finally removed via reactions with HO2 or NO (Jenkin et al., 2015; Wolfe et al., 2016a). Hence, the degradation process of isoprene is tightly associated with ROx recycling. According to He et al. (2019), isoprene chemistry could strongly influence the photochemical formation of O3, with a relative incremental reactivity (RIR) of ∼ 0.06 % %−1. In addition, HCHO is also formed via several pathways during the depletion of isoprene (Jenkin et al., 2015; Wolfe et al., 2016a) and is found to be highly sensitive to isoprene emissions (Zeng et al., 2019).
The Yangtze River Delta (YRD) region is one of the most developed city clusters in eastern China and is under serious O3 pollution (Zhang et al., 2019, 2020a; Chan et al., 2017). In suburban areas of the YRD, high levels of O3 have been frequently observed (Zhang et al., 2019, 2020a). Several studies have investigated the relationship between O3 and its precursors (Chan et al., 2017; Lin et al., 2020; Zhang et al., 2020a, b), but few studies have addressed the atmospheric oxidizing capacity and radical chemistry involved in these complicated photochemical processes (Tan et al., 2019; Zhu et al., 2020b). Previous studies have pointed out that the high levels of O3 in suburban areas of Shanghai could be attributed to the transport of O3 or its precursors from urban areas (Lin et al., 2020; Zhang et al., 2019; Li et al., 2016, 2019). On the contrary, high O3 concentrations were frequently observed in suburban areas under stable meteorological conditions. Therefore, given the dense vegetation cover in the suburban YRD and weak transport of air masses, the importance of local isoprene chemistry regarding ozone formation remains unclear.
In this study, we conducted a comprehensive set of in situ observations of isoprene concentration, meteorological conditions, and concentrations of atmospheric pollutants (including O3, NOx, CO, VOCs, and HCHO) to understand the impact of isoprene chemistry on atmospheric photochemical processes in the suburban YRD region. We used an observation-based model (OBM) to explore the role of local isoprene chemistry in radical budgets and the formation of O3 and HCHO. Results from this study provide insights into the isoprene chemistry in the suburban region of a fast-developing city cluster.
2.1 Field measurement
The observations were conducted at a supersite (120.98∘ E, 31.09∘ N) in suburban areas of the YRD region (Fig. 1). It is located west of Shanghai and is close to the Dianshan Lake Scenic area with relatively higher vegetation cover than the urban areas. To investigate the local isoprene chemistry and its influence on O3 and HCHO formation, continuous measurements were conducted from 7 April to 25 September 2018, when photochemical activity and O3 formation is significant.
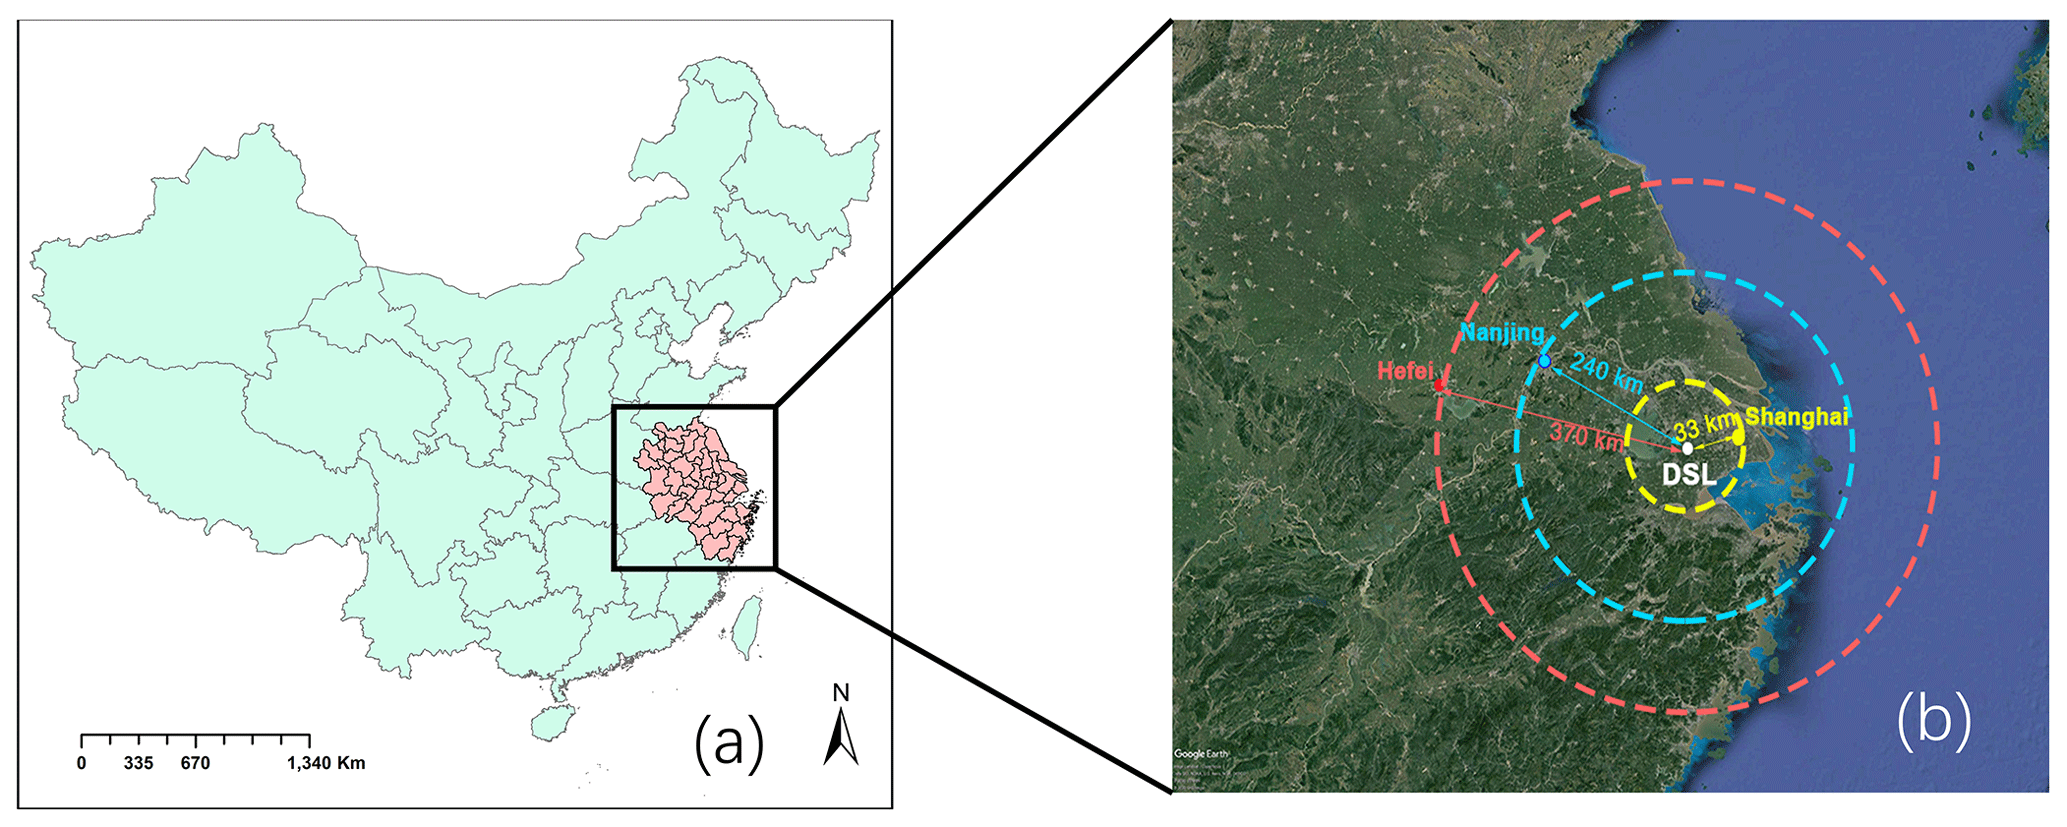
Figure 1(a) Map of China with the YRD region highlighted in pink. (b) Satellite map of the YRD region (created with © Google Earth on 23 July 2020).
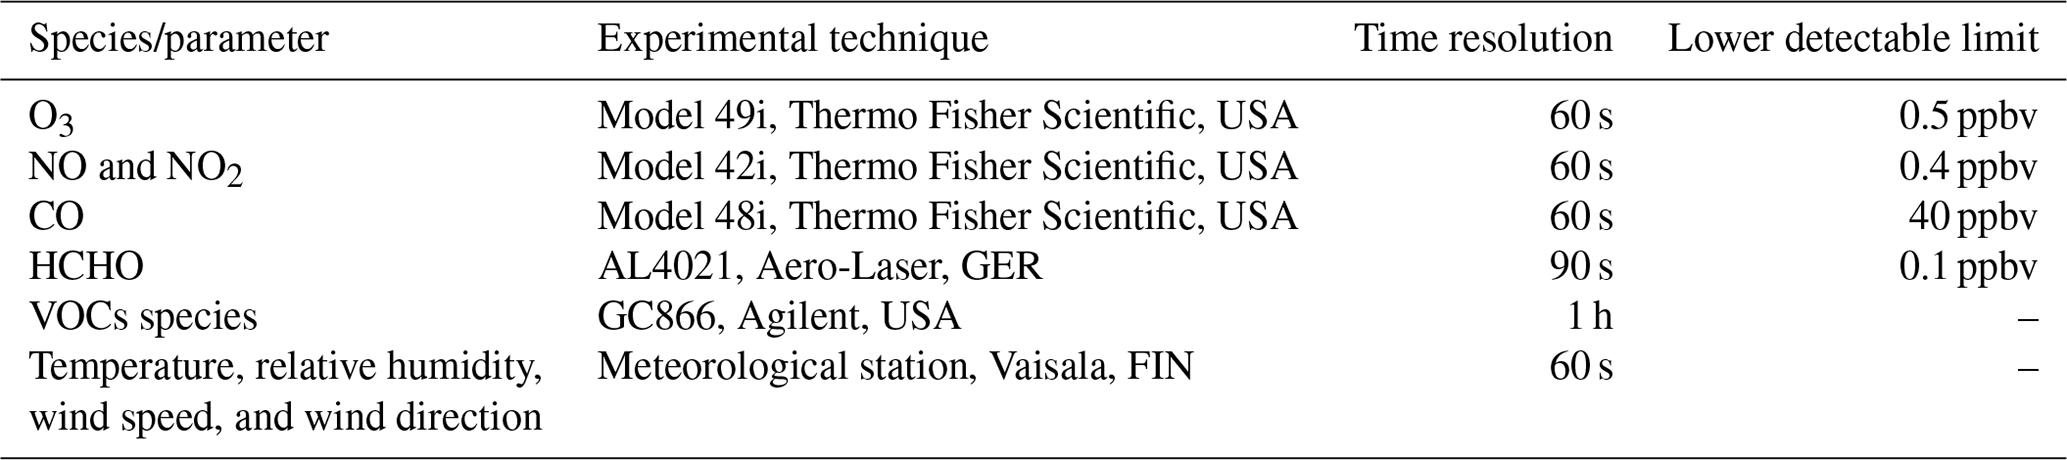
The measurement instruments are shown in Table 1. Wind speed (WS), wind direction (WD), ambient pressure (P), temperature (T), and relative humidity (RH) were simultaneously observed by a meteorological station (Vaisala., FIN). According to China's air quality standard, several criteria air pollutants were measured during this experiment. For instance, O3 was measured by an ultraviolet photometric analyzer (Model 49i, Thermo Fisher Scientific, USA) with a detection limit of 0.5 ppbv, whereas nitrogen oxides (NO and NO2) were simultaneously observed by a chemiluminescence instrument (Model 42i, Thermo Fisher Scientific, USA) with a detection limit of 0.4 ppbv. Likewise, carbon monoxide (CO) was monitored by a gas filter correlation infrared absorption analyzer (Model 48i, Thermo Fisher Scientific, USA) with a detection limit of 0.04 ppm. All the online instruments used for gas analyzer were auto-zeroed every day and were multi-point calibrated every month. All the instruments used for online observation were housed on top of a five-story building, which was about 15 m above the ground level.
A total of 55 VOC species, including 28 alkanes, 10 alkenes (including isoprene), 16 aromatics, and acetylene were continuously analyzed at our sampling site by two online gas chromatographs with flame ionization detector (GC-FID) systems (GC-866 airmoVOC C2–C6 #58850712 and airmoVOC C6–C12 #283607112, Agilent, USA) with a time resolution of 1 h during the study period. Ambient samples are directly inhaled into this system by a pump. Low carbon VOCs (C2–C6) are captured by a low temperature (−10 ∘C) preconcentration system, while high carbon VOCs are concentrated by a built-in room temperature preconcentration system. Then the preconcentration system is heated to desorb VOCs, which are eventually carried into the chromatographic columns by helium. Individual VOCs separated in the columns are eventually detected by FID systems. Formaldehyde (HCHO) was continuously measured by a Hantzsch fluorescence technique (AL4201, Aero-Laser GmbH, GER), which is based on fluorometric Hantzsch reaction in the liquid phase, requiring the quantitative transfer of HCHO from gas phase to liquid phase. A Hantzsch reagent (acetylacetone) was used in this instrument.
2.2 Observation-based model
In this study, a zero-dimensional (0-D) box model (F0AM) (Wolfe et al., 2016b) based on the University of Washington Chemical Model (UWCM) was used to simulate the atmospheric chemical processes. Dry deposition and atmospheric dilution were considered in this model. The Master Chemical Mechanism (MCM) v3.3.1, with more than 5800 chemical species and 17 000 reactions, was used in this study to enable a detailed description of the complex chemical reactions. In addition to gas-phase reactions, several heterogeneous processes including the uptake of HO2, N2O5, and HCHO on an aerosol surface as well as heterogeneous sources of nitrous acid (HONO) were considered in our simulation. The rate constants and uptake coefficient of these reactions were obtained from the studies of Riedel et al. (2014), Xue et al. (2014), and Li et al. (2014). Since key parameters such as aerosol surface area (SA) and particle diameter (r) were not measured, an average SA (640 nm2 cm−3) was adopted from the field campaign in Shanghai (Wang et al., 2014).
Table 2Heterogeneous reactions and associated rate constants used in the OBM model.
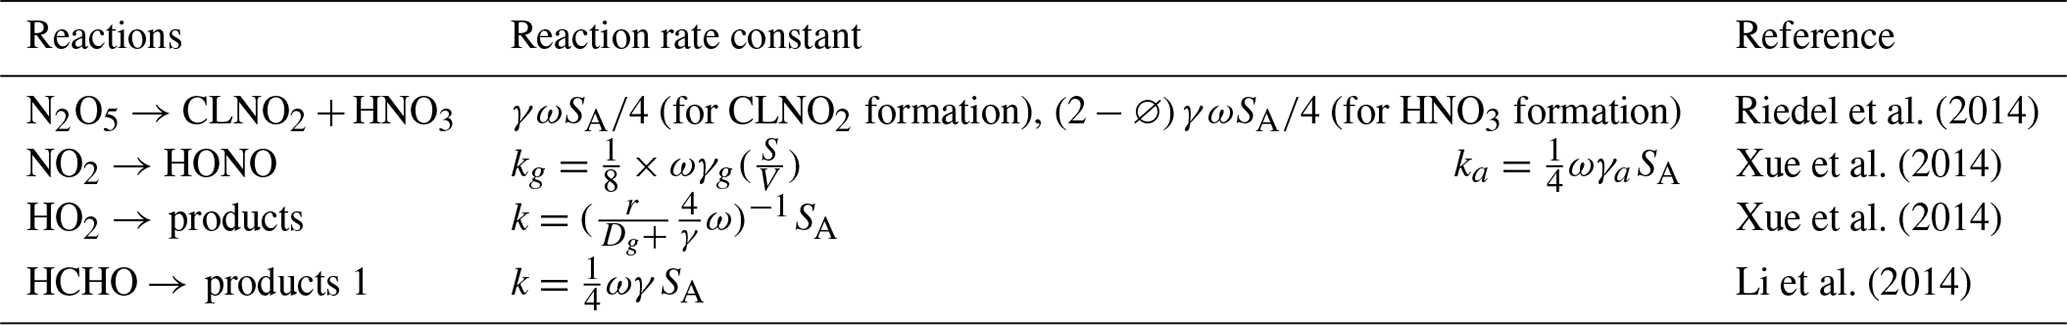
γ = uptake coefficient for the given reactant with aerosol surface area; ϕ = product yield; ω = mean molecular speed of the given reactant (m s−1); SA = RH corrected aerosol surface area concentration (nm2 cm−3); r = surface-weighted particle radius.
Photolysis frequencies (J values) were calculated by a trigonometric parameterization based on solar zenith angle (SZA):
where I, m, and n are constants unique to each photolysis reaction derived from least-squares fits to J values computed with fixed solar spectra and literature cross section and quantum yields (Wolfe et al., 2016b). Hourly average concentrations of speciated VOCs (except HCHO), NO, NO2, CO, and meteorological parameters (such as T, RH, and P) were used to constrain the F0AM model. Since nitrous acid (HONO) was not measured during our observation, it was fixed as 2 % of the observed NO2 concentration. This constant ratio is observed in different field studies and performed well in previous box model studies (Tan et al., 2019). Before each simulation, the model was run 3 d as spin-up to reach a steady state for unmeasured species (e.g., OH and NO3 radicals).
The comparison of simulated and observed O3 and HCHO concentrations are shown in Figs. S1 and S2 in the Supplement. The index of agreement (IOA), mean bias (MB), and normalized mean bias (NMB) are used to evaluate the model performance. These three parameters can be calculated by Eqs. (2) to (4), where Si, Oi, and are the simulated, observed, and average observed value of the target compound. In this study, the IOA, MB, and NMB of O3 were 0.90, 0.76, and 10 %, respectively. These results suggest that the model can reasonably reproduce the variations of O3 and could be used for further analysis. As for HCHO, the IOA, MB, and NMB were 0.74, 2.43, and 48 %, respectively. In general, the model overestimated HCHO concentration, especially on 29 and 30 July. According to previous
studies, the inconsistency between simulated and observed HCHO is attributed to uncertainties in the treatment of dry deposition, faster vertical transport, uptake of HCHO, and fresh emissions of VOCs precursors (Li et al., 2014). In addition, primary HCHO sources can contribute up to 76 % of total HCHO concentration in urban areas (Li et al., 2010). However, due to the lack of primary HCHO sources for areas around Dianshan Lake (DSL), primary HCHO emissions were not included in our model. Although some bias exists, the model results still provide valuable information of secondary formation of HCHO at suburban areas. To assess the reliability of model results without OH observation, we compared the OBM-simulated OH concentration with that calculated using the ratio of ethylbenzene (E) and m,p-xylene (X) that share common emission sources but with different reactivity with OH radicals (shown in Eq. 5–8):
where [X]0 and [X]t are the mixing ratio of X at the initial time and after transport time t. kX,OH is the temperature dependent reaction rate coefficient of m,p-xylene with OH, which was taken from the IUPAC database (http://iupac.pole-ether.fr/, last access: 15 April 2021), whereas fd,B is the dilution factor of m,p-xylene in the atmosphere. In this study, we assume that the rates of turbulent mixing and horizontal convection are similar for E and X. Therefore, during the transport time Δt, the dilution factor of E and X are the same. Therefore, rearranging Eq. (7) and extending this analysis to E and X will yield Eq. (8), where [OH] is the estimated concentration of OH by ethylbenzene and m,p-xylene ratio. The calculated average regional concentrations of OH (8.39 ± 5.11 × 10⁶ molec. cm−3) was in the same magnitude of the OBM-simulated result (4.59 ± 5.11 × 10⁶ molec. cm−3), suggesting that the OBM-simulated radical concentration is reliable.
To quantify the changes of atmospheric oxidative capacity (AOC) in response to isoprene chemistry, two parallel scenarios (S0 and S1) were conducted with isoprene chemistry disabled in S1. In both cases, identical chemical mechanism and meteorological conditions were used to drive the model simulations. A comparative analysis of the scenarios revealed the impact of isoprene chemistry on AOC and secondary formation of O3 and HCHO.
3.1 Overview of the observations
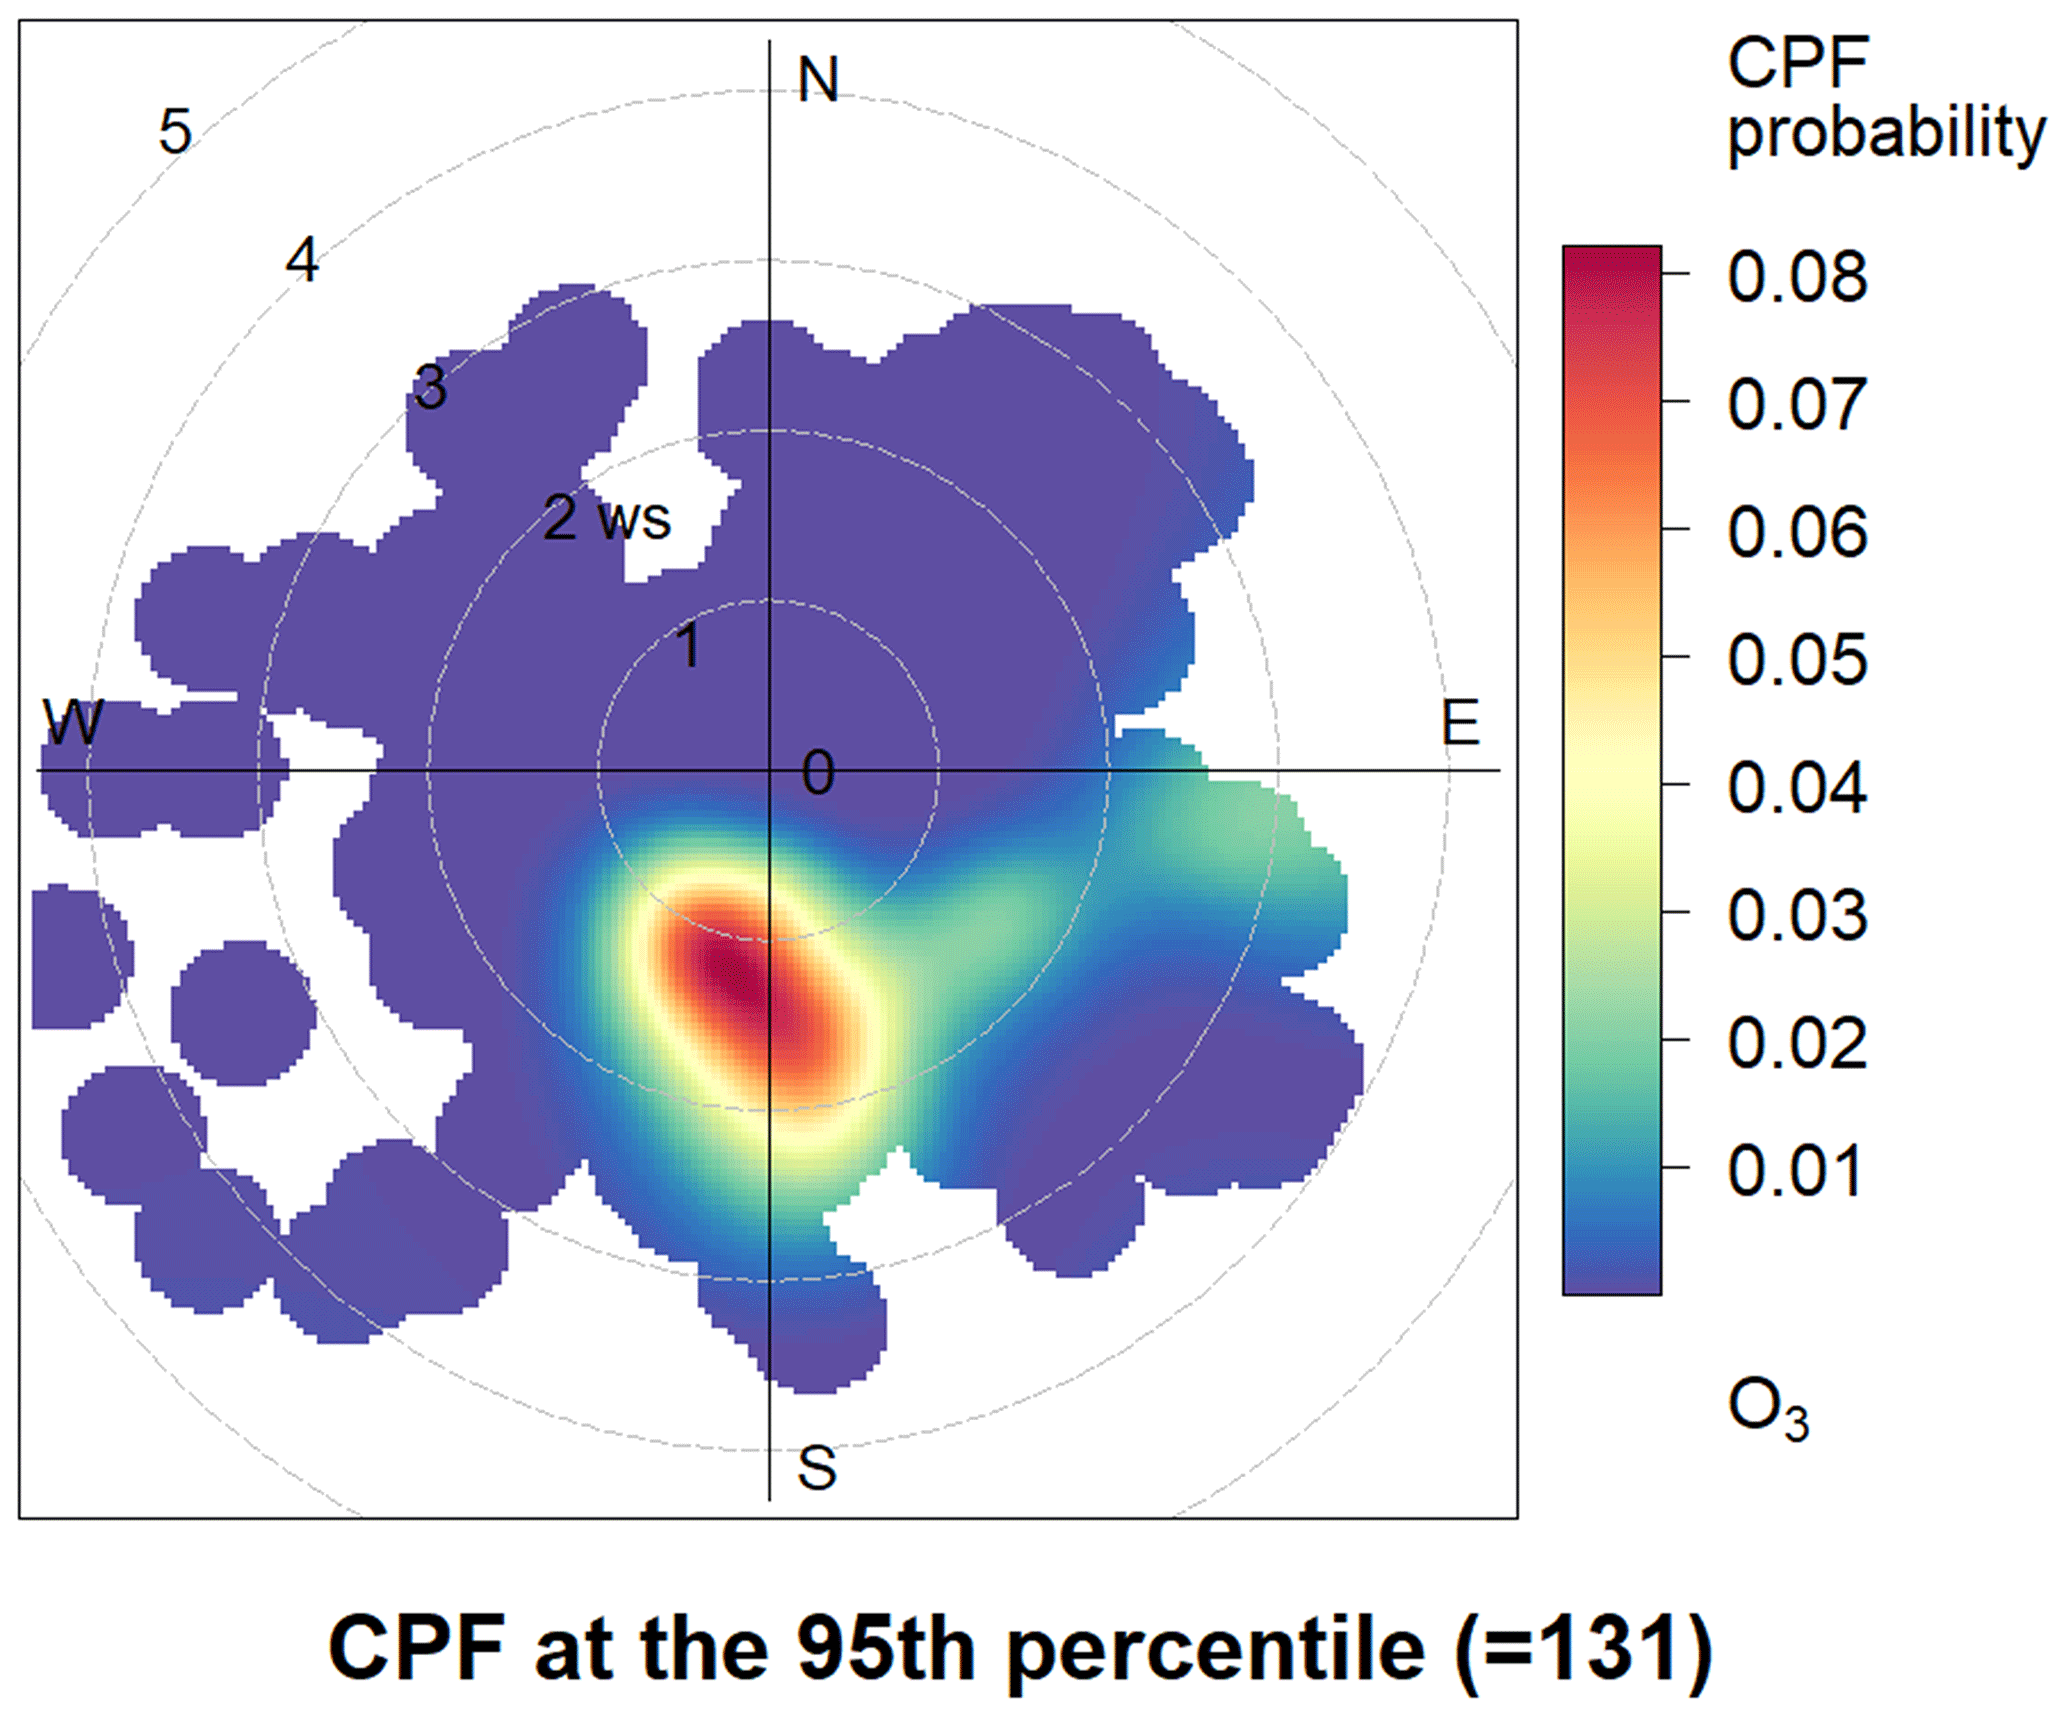
To investigate the impact of local chemistry on ozone formation and avoid the influence of emission transportation, five days under stagnant conditions (with daily average wind speed less than 2 m s−1 and maximum daily 8 h average (MDA8) O3 concentration >75 ppb) were identified as typical local chemistry cases. Figure 2 shows the time series of observed meteorological parameters (P, T, and RH), trace gases (NO, NO2, and O3), isoprene, and HCHO on selected days. During those episodes, the air masses reaching the site were mainly from the southeast and southwest (Fig. 2). The weak wind was not conductive to the regional transportation of air pollutants. The observed O3, NO2, NO, CO, and TVOC ranged from 1.40 to 155.40 ppbv (52.72 ± 44.43 ppbv, average value, the same below), 5.36 to 57.95 ppbv (21.58 ± 12.88 ppbv), 0.75 to 54.51 ppbv (5.40 ± 8.13 ppbv), 400 to 960 ppbv (597 ± 153 ppbv), and 2.34 to 20.33 ppbv (7.28 ± 4.32 ppbv), respectively. During the five episodes, the average concentrations of alkanes (13.97 ± 9.12 ppbv), alkenes (3.27 ± 2.31 ppbv), and aromatics (4.93 ± 2.69 ppbv) were about 53 %, 18 %, and 50 %, respectively, higher than that of the whole observation period. The conditional probability function (CPF) is applied to reveal the relationship between high O3 concentrations and wind (Fig. 3). A detailed description of the CPF can be found in the Supplement (Text S1). The results suggest that high O3 concentrations (>131 ppb) were usually observed when the site was influenced by weak south wind. This implies that the high O3 was mostly formed locally. Although this site is distant from urban areas, high levels of NO were found during early morning, emanating particularly from nearby heavy-duty vehicle emissions. As for NO2, only one peak was found at dusk. This was in contrast with previous results in urban areas (Zhang et al., 2019). It is worth noting that NO2 and O3 concentrations were high even during nighttime, suggesting that the AOC remained high at nighttime. It should also be noted that a flat CO pattern was found during the morning when NOx peaks were observed. This inconformity can be attributed to the coarse resolution of the CO analyzer (about 80 ppbv) and CO emission source (mainly gasoline vehicles in terms of vehicle exhaust) while NOx is mainly emitted by heavy-duty vehicle exhausts. Therefore, since the DSL site is far from an urban area, it is unlikely to have gasoline vehicles in the early morning. On the contrary, there are sometimes heavy-duty trucks passing by, causing peaks of NO in the early morning.
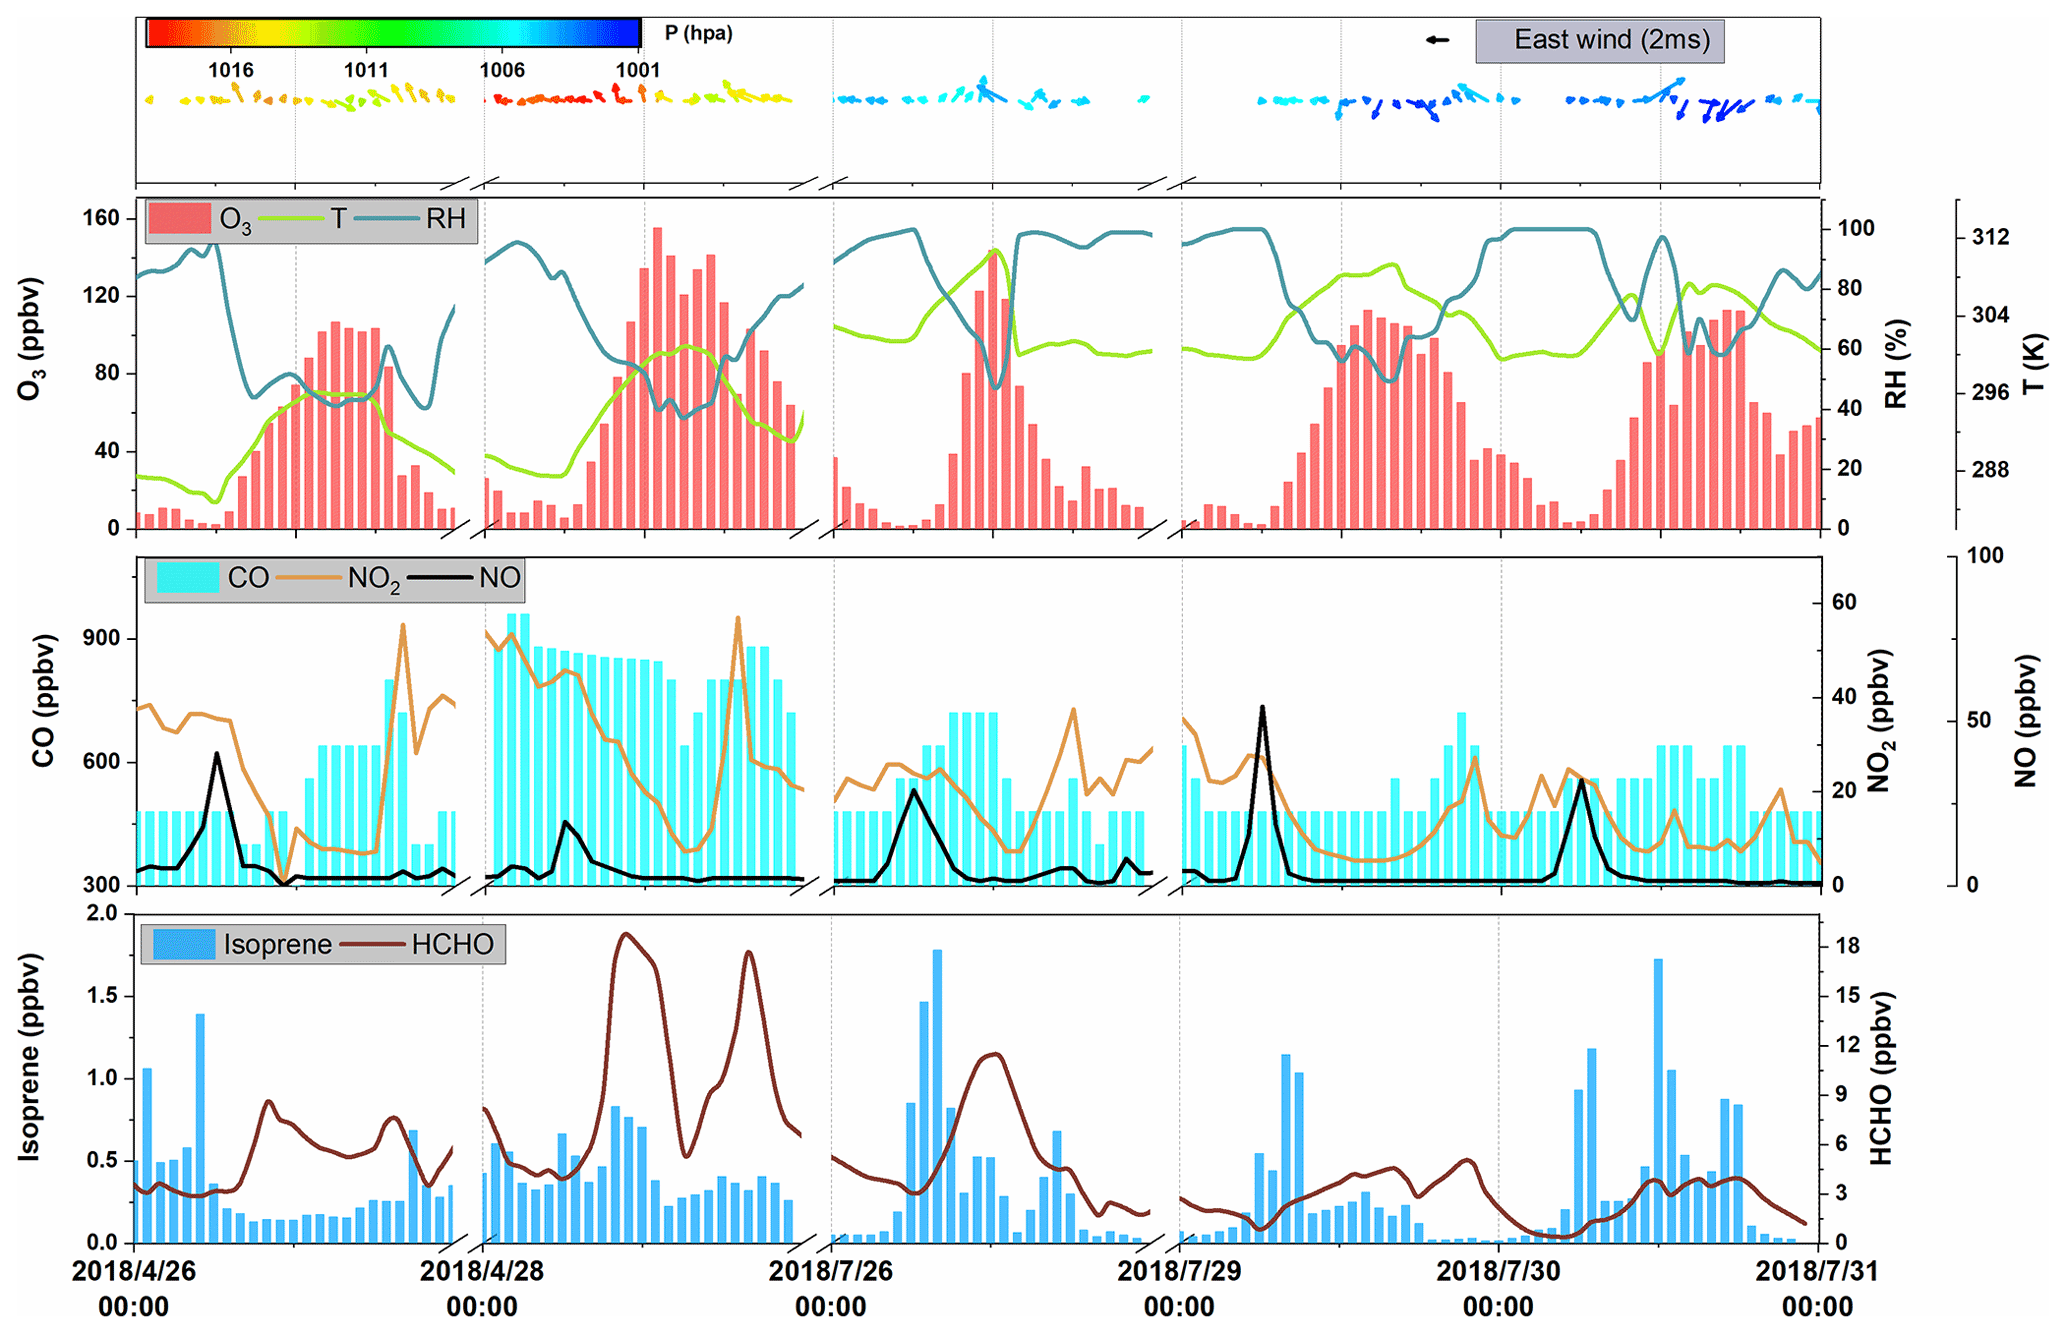
Figure 2Time series of hourly averages for O3, CO, NO, NO2, isoprene, HCHO, and meteorological parameters.
The daily average isoprene concentration was 0.37 ± 0.36 ppbv and is comparable to the observations by Gong et al. (2018) at a forested mountaintop site (0.287 ± 0.032 ppbv). To estimate the influence of isoprene on atmospheric oxidation capability, we adopted the approach by Zhu et al. (2020b) to calculate the OH reactivity (kOH). The results suggested that isoprene, accounting for ∼19 % of the total kOH, was the most significant VOC species with respect to kOH (0.89 ± 0.44 s−1). This indicates the significant role of isoprene in the photochemistry of a suburban area. The average HCHO was 5.01 ± 3.80 ppbv, which was ∼2 times that observed at a rural site of Hong Kong SAR, China (Yang et al., 2020). It is worth noting that HCHO could reach an average of 18.69 ppbv at midday.
Based on explicit calculation, the total concentration of OVOC was obtained. However, due to the complexity of OVOC formation, which could have hundreds of precursors for just one OVOC species and complex chain reactions converting VOCs to OVOCs, it is difficult to derive an accurate relationship between VOCs and OVOCs. But since VOCs were mainly oxidized by OH and O3 during the daytime, in this study we chose a multi-linear regression model (Eq. 9) to roughly explore the relationship between VOCs and simulated OVOCs.
where β0, β1, β2, β3, β4, and β5 are the coefficients from linear regression; [OVOC] and [OH] are the predicted concentrations of OVOC and OH, respectively; and [Alkane], [Alkene], [Aromatic], [O3] are the observed concentrations of alkanes, alkenes, aromatics, and O3, respectively. The significant value (Sig value) and statistical reliability criteria (R) were 0.000 and 0.853 (shown in Table S2 and Fig. S3 in the Supplement), respectively, indicating that the linear relationship represented by Eq. (9) is statistically reliable. Similarly, the β1, β2, β3 were 0.027, 0.623, and 0.820, respectively, suggesting that alkenes and aromatics are significant for the simulated OVOC concentration.
3.2 Simulated concentrations of radicals
Figure 4 shows the simulated average daytime variation of major radicals in the base scenario (S0). It should be noted that the discussion below is limited to local conditions (cases with average wind speed lower than 2 m s−1), since transportation of emissions are not considered in the 0-D model. The daily average simulated concentrations of OH, HO2, RO2, and NO3 were 4.88 × 10⁶, 3.49 × 10⁸, 0.31 × 10⁹, and 0.31 × 10⁸ molec. cm−3, respectively. The simulated daily average OH concentration is comparable to a summertime simulation in Beijing (9 × 10⁶ molec. cm−3) (Liu et al., 2019) and at a suburban site in Hong Kong SAR, China in 2013 (1.5 ± 0.2 × 10⁶ molec. cm−3) (Xue et al., 2016). In addition, the average simulated daytime OH concentration was ∼33 % lower than that simulated at a forested mountaintop site in southern China (Gong et al., 2018). To verify the performance of the OBM model, regional daytime mixing ratios of OH were also calculated by a parameterization method using measured ethylbenzene and m,p-xylene ratios. The calculated average regional concentrations of OH (8.39 ± 5.11 × 10⁶ molec. cm−3) were in the same magnitude of the OBM-simulated result (4.88 ± 5.11 × 10⁶ molec. cm−3), suggesting that the OBM-simulated radical concentration is reliable. Furthermore, at the DSL site, the simulated maximum HO2 concentration (6.19 × 10⁸ molec. cm−3) was close to that reported in Beijing (6.8 × 10⁸ molec. cm−3) (Liu et al., 2012) but was ∼ 32 % higher than that in Wuhan (4.7 × 10⁸ molec. cm−3) (Zhu et al., 2020a). Due to the high reactivity of RO2 and high concentration of HOx, RO2 was kept at a low level during the daytime. As for NO3, it can be quickly decomposed during the daytime, leading to the negligible concentration in the daytime.
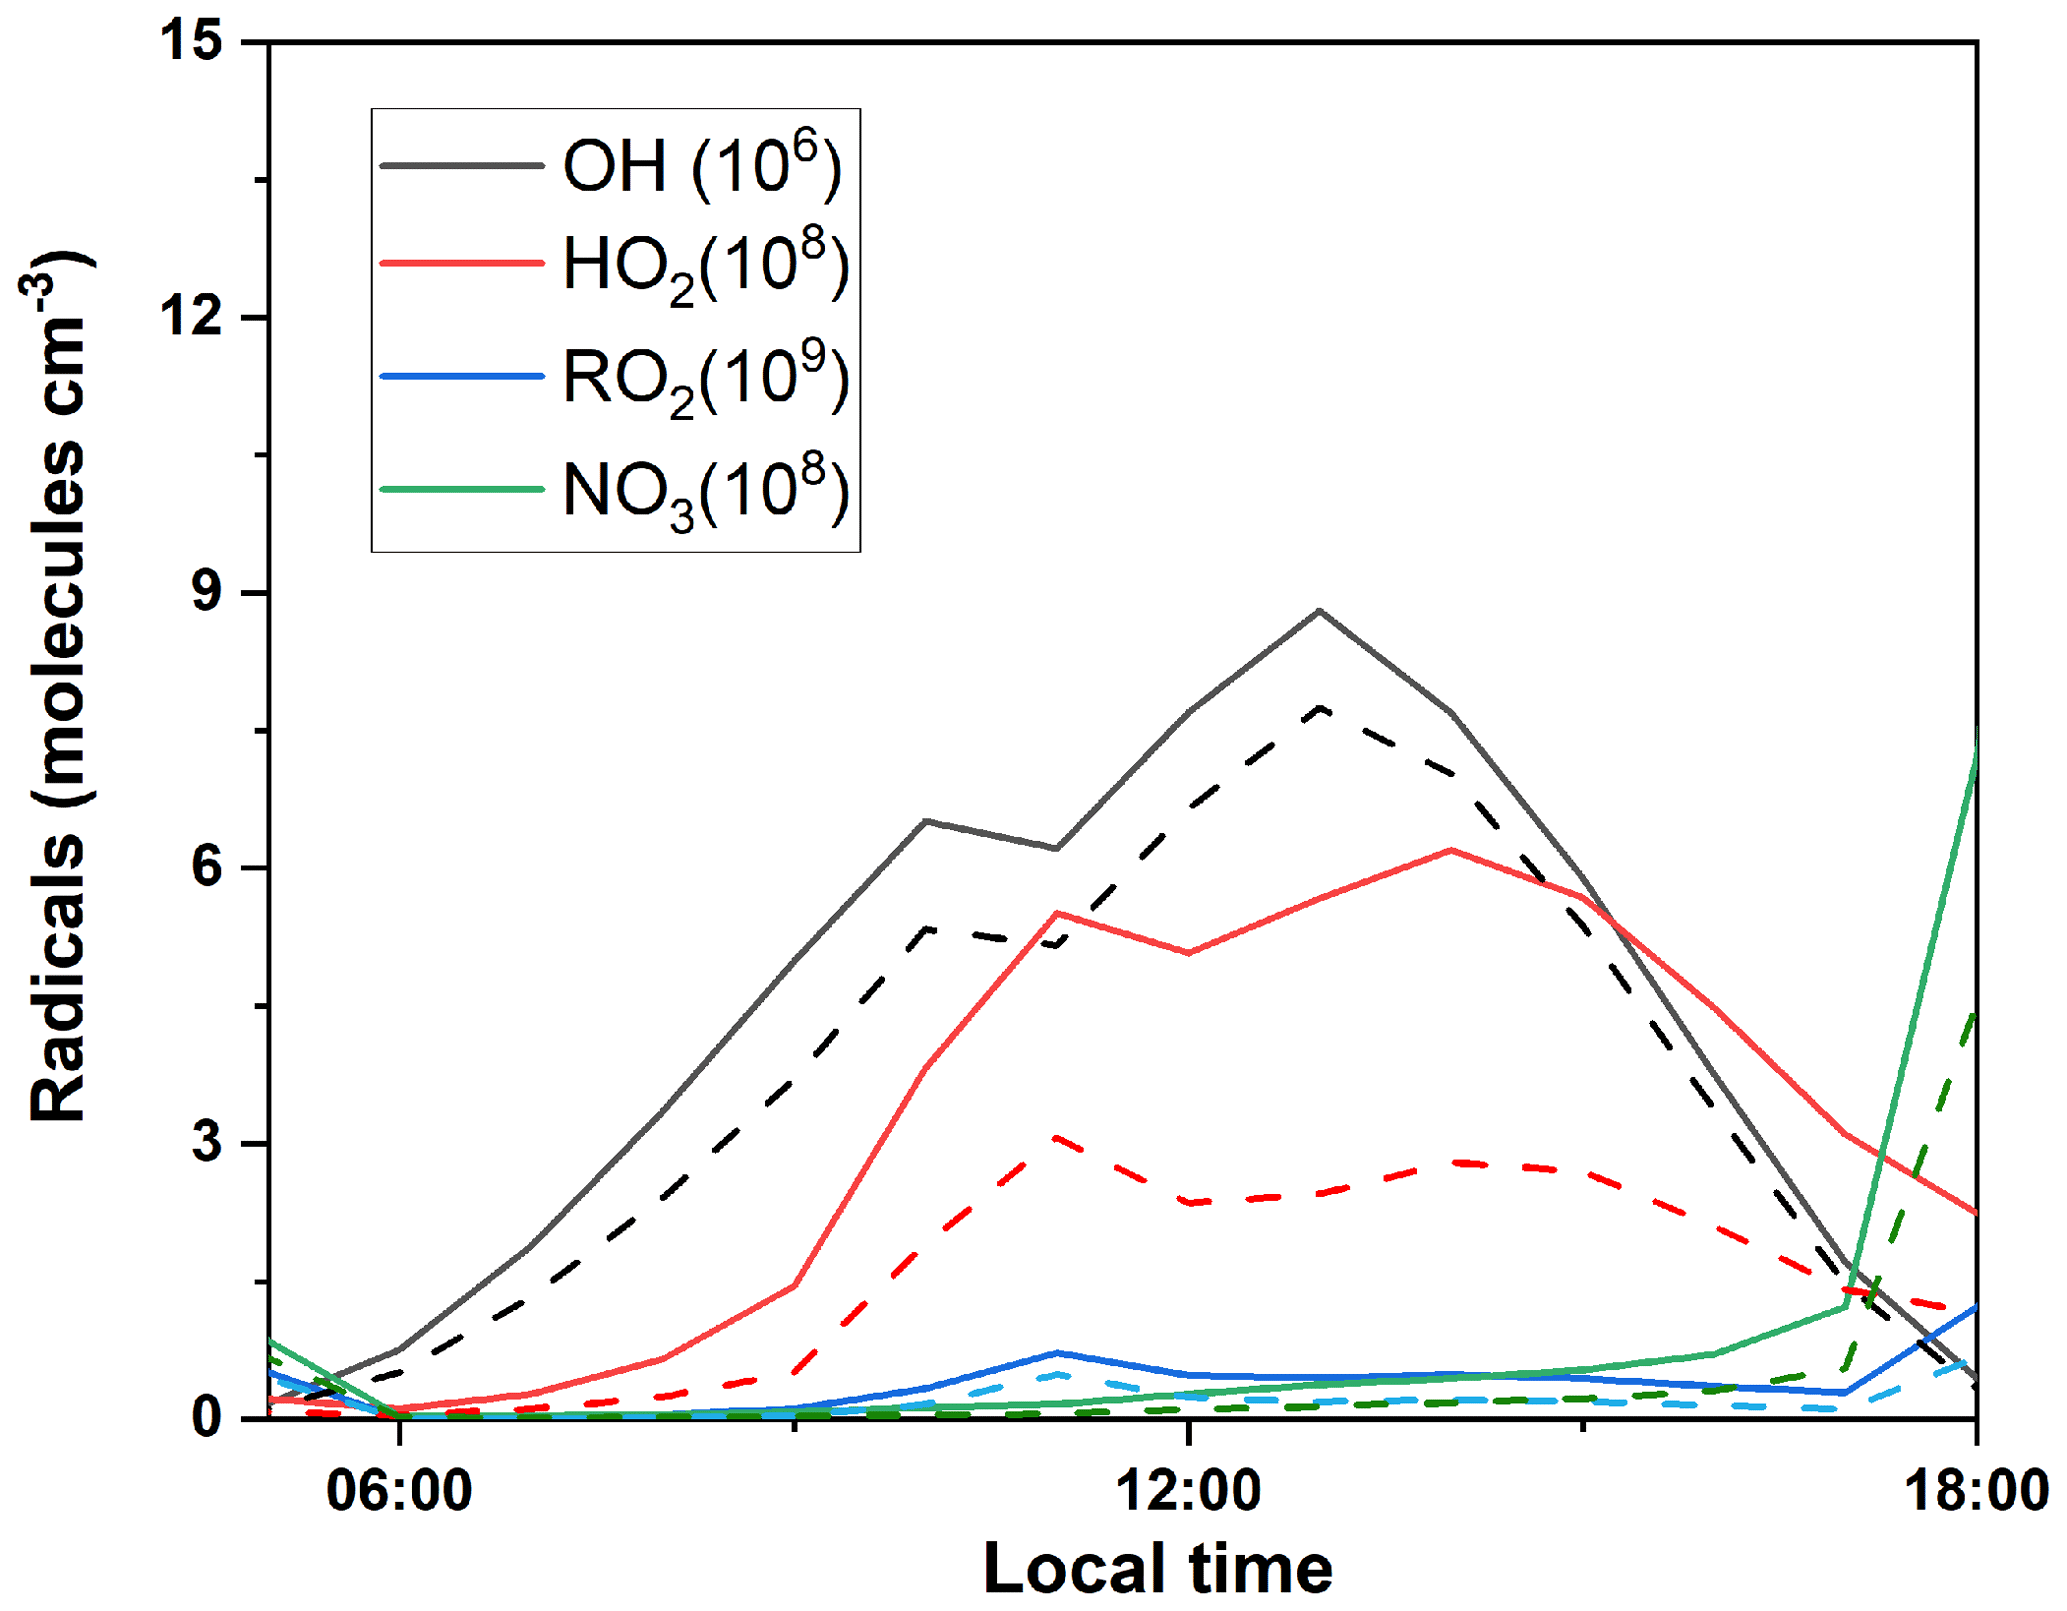
Figure 4Simulated average daytime variation of OH, HO2, RO2, and NO3 in S0 (solid lines) and S1 (dashed lines).
3.3 Recycling of ROx radicals
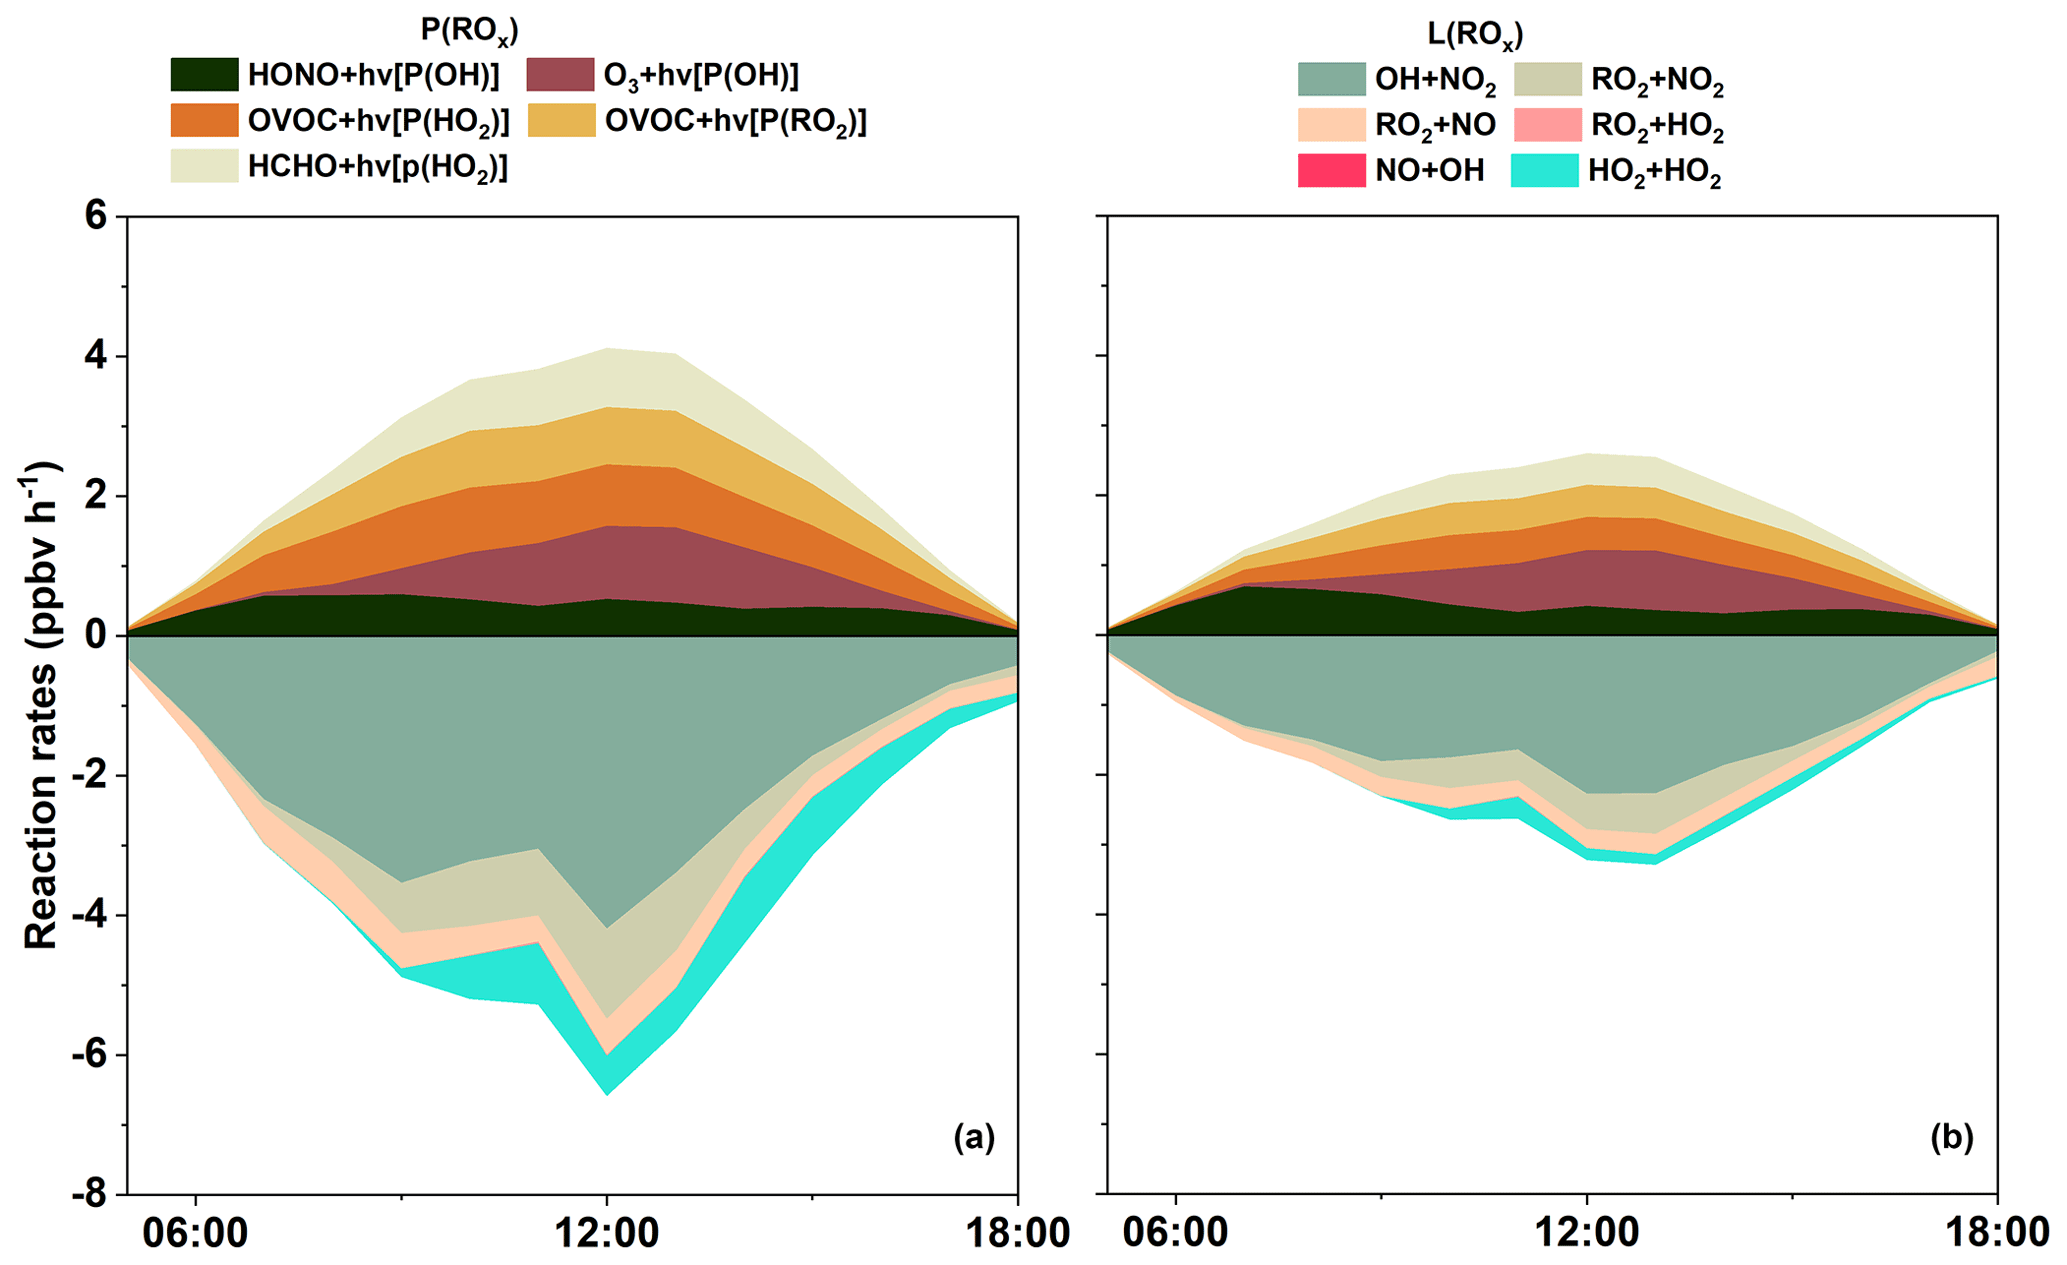
Figure 5a shows the primary sources of ROx in S0 and its detailed daytime budget. Minor ROx sources, e.g., ozonolysis of alkenes, are not shown in the figure. Photolysis of O3 was the predominant primary source of OH, with a daytime mean production rate of 0.50 ppbv h−1, which was comparable to that found by Liu et al. (2012) in Beijing, but was 0.40 ppbv h−1 lower than the result reported by Xue et al. (2016). Similarly, another important OH source is the photolysis of HONO, contributing 0.32 ppbv h−1 of daytime OH production in our simulation. This result is much lower than other related studies by Liu et al. (2019) and Xue et al. (2016), possibly due to the excessive constrain on HONO (since HONO was not directly monitored) during our experiment.
Sensitivity analysis was conducted to quantify the influence of different ratio on radical recycling (Text S2, Fig. S4, and Table S1 in the Supplement). As expected, a lower ratio leads to a lower HONO concentration and subsequently less OH generation from the photolysis of HONO. The sensitivity analysis shows that when the ratio is 0.005, the daytime OH level could decrease by 15.28 %. Conversely, a higher (e.g., 0.04) can promote OH concentration by 14.08 %. This result illustrates the importance of HONO photolysis in the generation of OH and therefore simultaneous ambient measurements of HONO is highly recommended for future analysis of local radical recycling. Regarding HO2, the photolysis of OVOC (excluding HCHO) is the predominant source with a daytime mean production rate of 0.65 ppbv h−1 and maxima of 0.92 ppbv h−1, which is comparable to Xue et al. (2016). The photolysis of HCHO can also contribute 0.48 ppbv h−1 to the daytime production of HO2, which is close to the results of Xue et al. (2016). As for RO2, the photolysis of OVOC was the largest source (0.57 ppbv h−1), which was relatively lower than the results found at an urban site (Liu et al., 2012). Therefore, regarding ROx in the DSL site, the daytime primary radical production was dominated by the photolysis of OVOC (except for HCHO), followed by the photolysis of HCHO and O3. However, the photolysis of HONO can become the overwhelming ROx source around sunrise, which suggests that HONO can be an important OH reservoir species at night. Summing up all the sources of ROx gives a total primary daytime ROx production rate of 2.55 ppbv h−1 (0.84 ppbv h−1 for OH, 1.14 ppbv h−1 for HO2, and 0.57 ppbv h−1 for RO2), which was 61 %–69 % lower than those in Beijing (6.6 ppbv h−1, Liu et al., 2012) and Hong Kong SAR, China (8.11 ppbv h−1, Xue et al., 2016), indicating that the recycling of ROx in Beijing and Hong Kong SAR, China could be much more reactive.
ROx radicals are ultimately removed from the atmosphere via deposition of radical reservoir species, e.g., H2O2, HNO3, and ROOH (Liu et al., 2012). The terminate processes of ROx was dominated by their reactions with NOx. Specifically in this study, the reaction of OH + NO2, RO2 + NO2, RO2 + NO, forming HNO3, RO2NO2, and RONO2, accounted for 2.42, 0.56, and 0.41 ppbv h−1 of the daytime ROx radical sink, respectively. This is consistent with the understanding that reactions with NOx usually dominate the radical sink under high NOx environments (Xue et al., 2016; Liu et al., 2012). In addition, RONO2 and RO2NO2 could in turn react with OH, leading to 0.41 ppbv h−1 of daytime OH sinks (Fig. 6). Summing up the primary sources and sinks gives a negative value of net ROx production, suggesting that the ROx was in a stage of gradual depletion.
Furthermore, the daytime (06:00–18:00 GMT+8) average budget of ROx is shown in Fig. 6. Evidently, the production of OH was dominated by the reaction of HO2 + NO (8.29 ppbv h−1) in ROx recycling, whereas RO2 was produced by the reaction of OH with OVOC (3.02 ppbv h−1), alkyl (RH) (1.21 ppbv h−1), and peroxides (0.14 ppbv h−1). In addition, the reaction of RO2+NO can result in strong production of RO (3.87 ppbv h−1). Moreover, the reaction of RO and O2 was the major contributor to HO2 production, followed by the reaction of OH with CO (1.89 ppbv h−1), OVOC (1.59 ppbv h−1), and RH (0.15 ppbv h−1). It is worth noting that the two fastest reactions within the recycling of ROx (HO2 + NO and RO2 + NO) were related to NOx. As mentioned in the study of Liu et al. (2012), this result could be mainly due to the abundance of NO (e.g., ∼ 50 ppbv in the morning). Obviously, these recycling processes dominate the total production of OH, HO2, and RO2 radicals. As suggested in the studies of Xue et al. (2016) and Liu et al. (2012), the radical propagation is efficient and enhances the effect of the newly produced radicals in the polluted atmospheres with the co-existence of abundant NOx and VOCs.
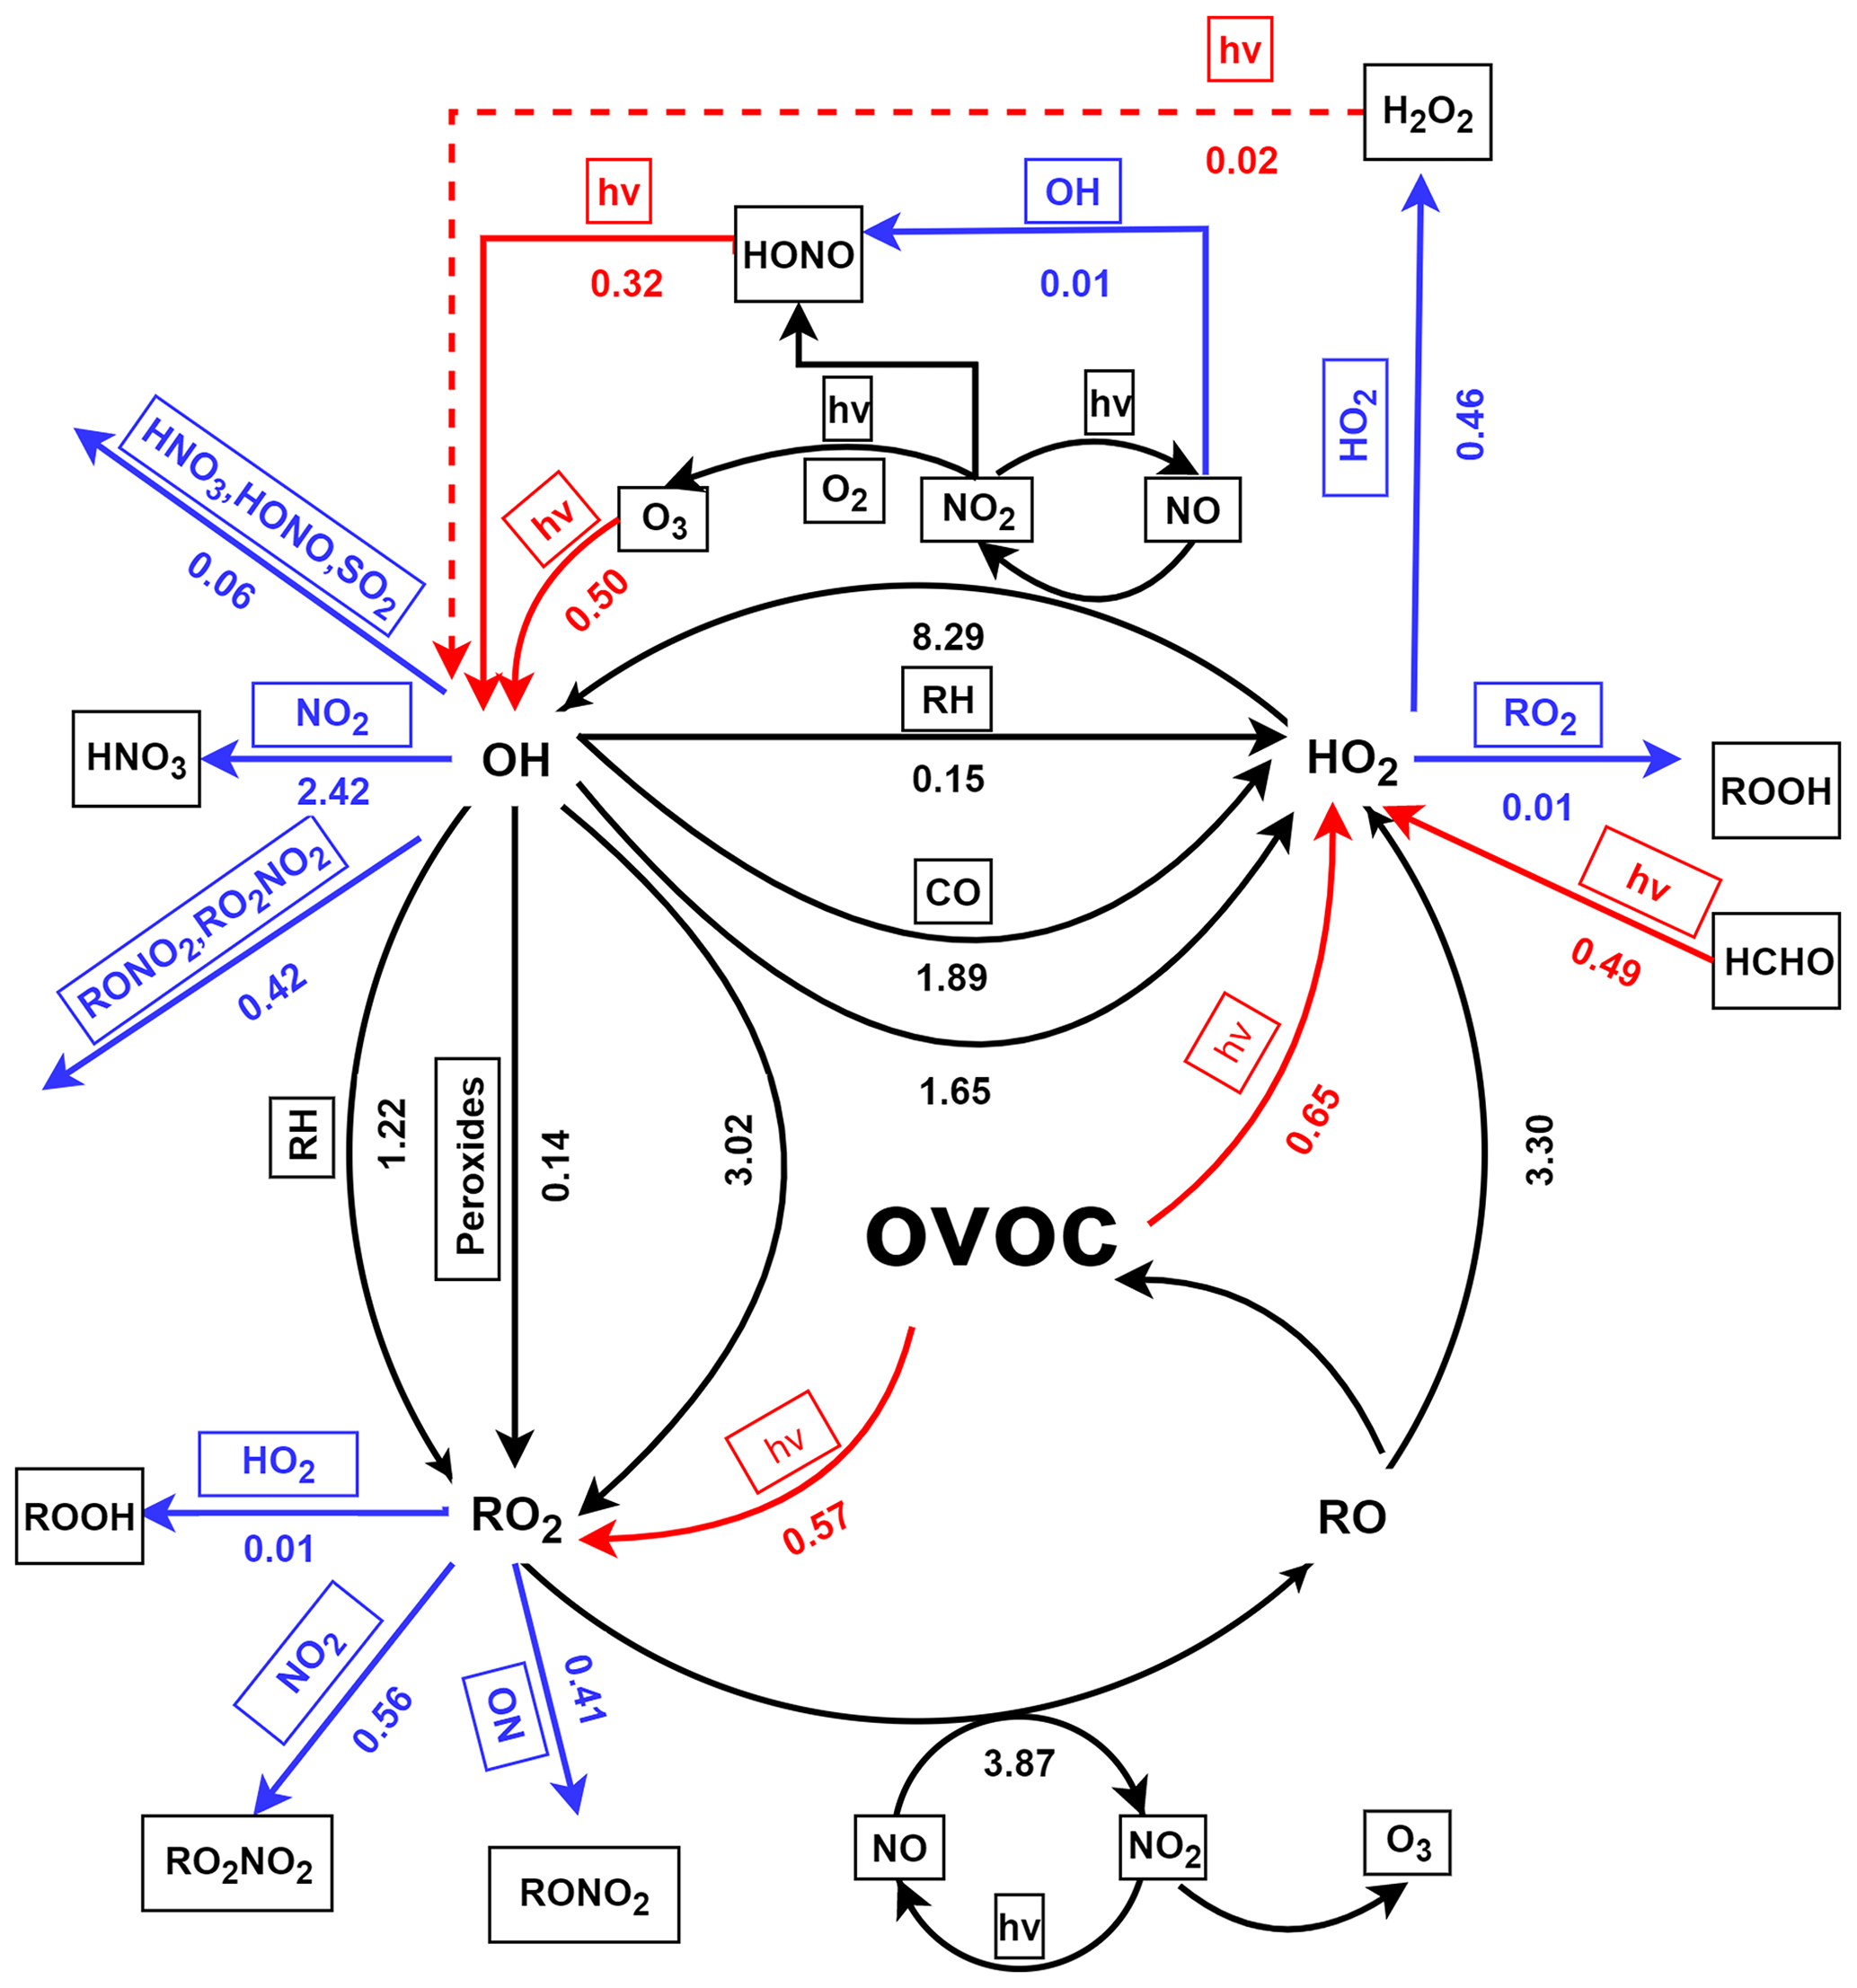
Figure 6Summary of daytime (06:00–18:00) average budgets of ROx radicals (in ppbv h−1). Primary ROx sources and sinks are in red and blue, respectively, and the black lines represent the processes in ROx and NOx recycling.
3.4 Formation and sink of O3
Figure 7 illustrates the diurnal variation of simulated O3 concentration and net production rate (including the formation and sink pathways) in S0. In the troposphere, O3 is formed via the reactions of NO with peroxy radicals (e.g., HO2 and RO2) (Liu et al., 2012; Xue et al., 2016; Zhu et al., 2020a). Consequently, the daytime reaction of HO2+NO and RO2+NO contributed an average of 9.34 and 8.52 ppbv h−1 of the O3 produced. Coincidentally, the maximum rate of HO2+NO (15.36 ppbv h−1) and RO2+NO (13.26 ppbv h−1) both occurred at 13:00 LST. Our results reveal a total daytime production rate of O3(P(O3): the sum of HO2+ NO and RO2 + NO) at 17.86 ppbv h−1, which is in line with related study in Beijing (32 ppbv h−1, Liu et al., 2012) and Hong Kong SAR, China (6.7 ppbv h−1, Liu et al., 2019).
Due to the fast cycling of both O3 and NO2, the sink of O3 resulted from several reactions leading to the destruction of O3 and NO2. In our case, the reaction of NO2+OH is the predominant scavenging pathway of O3, with an average daytime reaction rate of 1.89 ppbv h−1 (49 %, percentage of the total O3 sink rate). This is comparable to the studies of Liu et al. (2012, 2019). In addition, the reaction of RO2+NO2 was the second contributor to the O3 sink with a mean contribution of 0.62 ppbv h−1 (16 %). Other pathways, e.g., photolysis of O3, ozonolysis of alkenes, and O3+HO2, altogether contributed 1.11 ppbv h−1 of the total daytime O3 sink rate. Also, the daytime mean L(O3) was 3.87 ppbv h−1, which was ∼ 22 % of P(O3), suggesting that O3 could efficiently accumulate during the daytime. The net production of O3 (P(O3) − L(O3)) is also shown in Fig. 7. Our results reveal a maximum O3 concentration at around 16:00 LST, which was also observed in other suburban sites (Zong et al., 2018; Zhang et al., 2019).
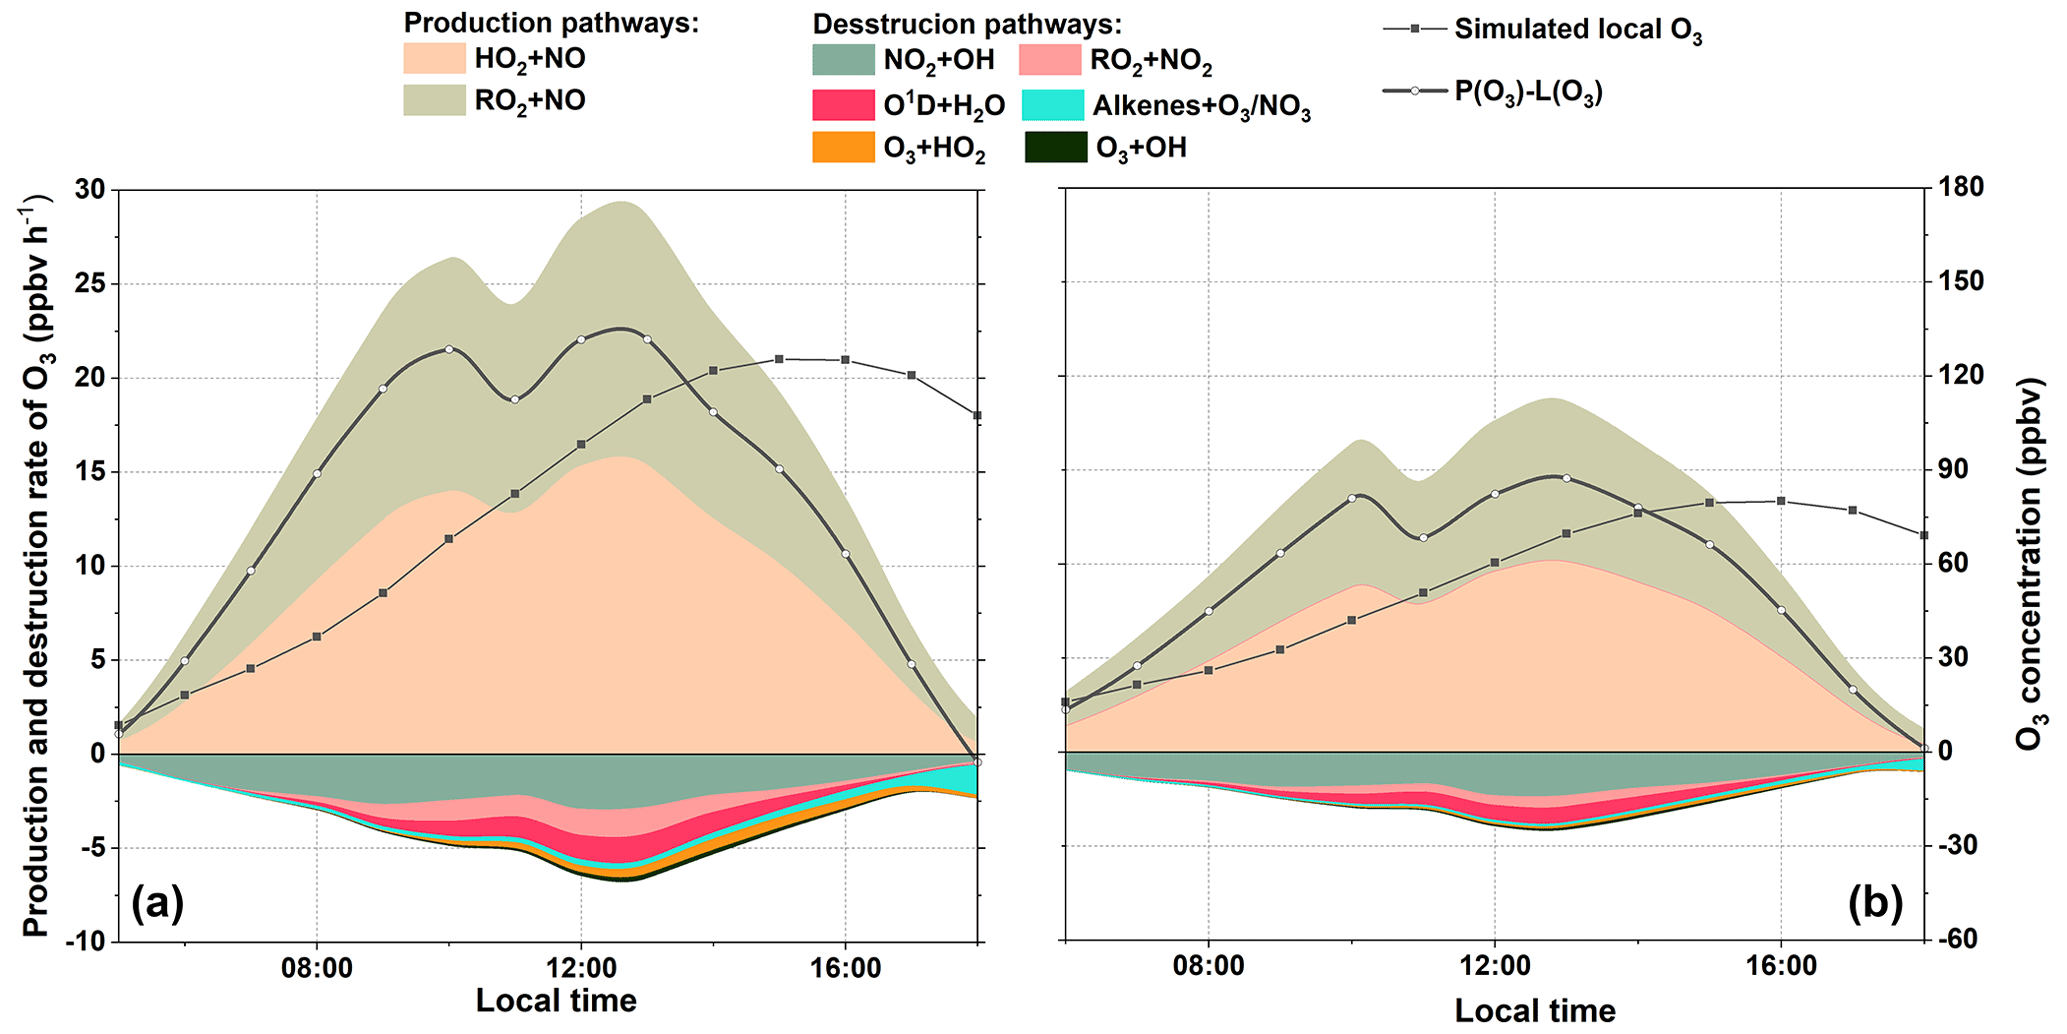
Figure 7Simulated average diurnal profiles of O3 formation and sink rates (ppbv h−1) in S0 (a) and S1 (b).
3.5 Formation and sink of HCHO
As aforementioned, high levels of HCHO were observed at DSL. Figure 8a shows the production and sink pathways of HCHO in S0. In this study, the local HCHO formation was dominated by the reaction of RO+O2, accounting for ∼ 90 % of the total production rate. Further classification of the RO+O2 pathway suggested that the oxidation of CH3O made a significant contribution of ∼ 47 %, followed by the RO (from isoprene) + O2 reaction (12 %) and RO (from aromatics) + O2 reaction (∼ 11 %). This result is comparable to the studies of Yang et al. (2020, 2018). During the day, isoprene is the most important VOC species in the production of HCHO with a mean rate of 0.48 ppbv h−1. As stated earlier, the study site is surrounded by dense vegetation, which provides abundant biogenic isoprene. As a result, over 90 % of the daytime isoprene was oxidized by OH radicals (Fig. S5 in the Supplement). Based on the MCMv3.3.1, several RO2 species (e.g., ISOP34O2, ISOPDO2, ISOPCO2, CISOPAO2, and ISOPAO2) can be generated during the OH-initiated degradation process of isoprene (Jenkin et al., 2015). For instance, with the presence of NO, isoprene-originated RO2 can transfer into RO (e.g., ISOPDO, ISOP34O, and ISOPAO). The subsequent degradation processes of isoprene-related RO, especially ISOP34O, ISOPDO, ISOPAO, and ISOPBO, are closely related to the formation of HCHO (Jenkin et al., 2015). In other sources of HCHO, such as the reaction between VOC and O3, photolysis of OVOC and the reaction of OVOC+OH only contributed a small amount of the total production rate during whole day.
In this study, it is noteworthy that the two dominant pathways for HCHO depletion were the photolysis of HCHO (∼ 52 %) and the reaction of HCHO+OH (∼ 48 %). On the other hand, the net HCHO production rate is equal to P(HCHO) + L(HCHO), as shown in Fig. 8. It is evident that after sunrise, the net production rate of HCHO rose gradually to a peak of ∼ 1.6 ppbv h−1 at 08:00 (similar to the results by Yang et al., 2018). Thereafter, at around 12:00 LST, net(HCHO) dropped to ∼ 0 ppbv h−1, which was roughly consistent with our observation, showing that the HCHO peak occurs at around 12:00. In addition, a negative net(HCHO) was exhibited between 13:00 and 14:00. Although the reaction of RO+O2 quickly produced HCHO in the afternoon, the depletion pathways, especially the photolysis of HCHO, became more competitive, leading to the net reduction of HCHO. This also indicates that strong photochemical reactions do not monotonously profit the accumulation of HCHO; it can also constrain high HCHO levels in certain situations. After 14:00, the photolysis of HCHO dropped rapidly and the net depletion of HCHO went back to ∼ 0 ppbv h−1 at around 15:00. The daytime net HCHO production rate was 0.70 ppbv h−1, which was comparable to result of Yang et al. (2018).
The above analysis indicates that the photolysis of OVOC, HCHO, O3, and HONO was the primary source of ROx, which offers a high oxidizing environment for the degradation of VOCs. As a typical byproduct in the degradation of several VOCs, HCHO can be quickly formatted during the day. The insight into the detailed photochemical processes shows the important role of isoprene in the formation of HCHO.
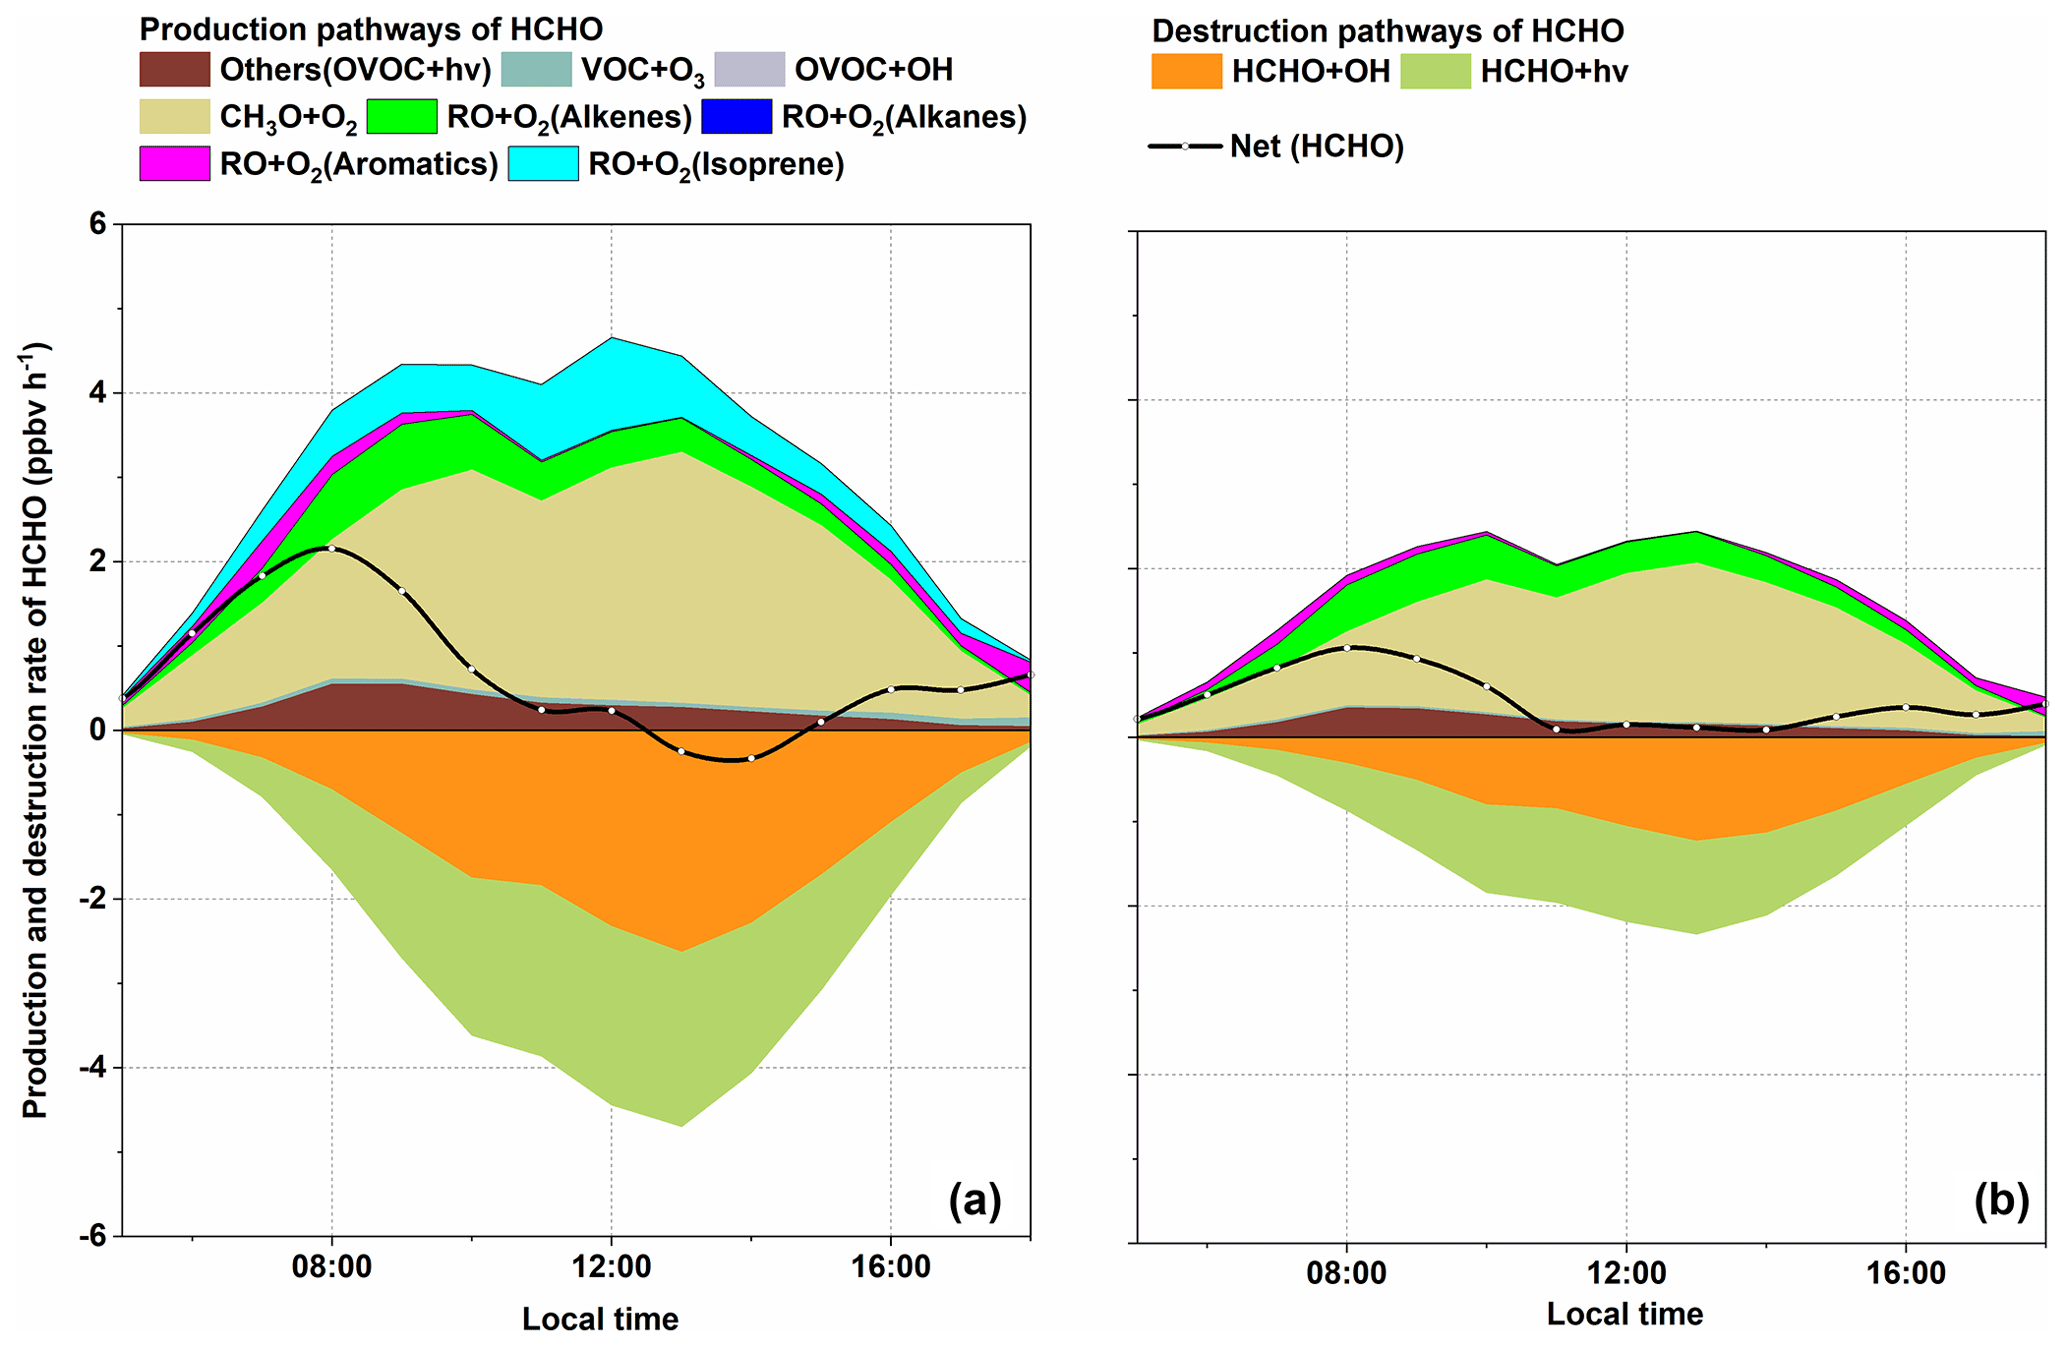
Figure 8Simulated average daytime profiles of net rate (net(HCHO)), breakdown HCHO production rate, and sink rate (ppbv h−1) in S0 (a) and S1 (b).
3.6 Impacts of isoprene chemistry on photochemistry
3.6.1 Impact on ROx budget
To compare the importance of isoprene and other abundant VOCs in local chemistry at the DSL site, sensitivity analysis was conducted for the modeled O3, HCHO, and OH concentrations without the input of active VOCs (toluene, ethylene, ethylbenzene, ethane, acetylene, xylene, propene, and isoprene). Results suggested that although the average isoprene concentration was only 0.37 ± 00.36 ppbv, cutting isoprene input can lead to an obvious drop in simulated O3, HCHO, and OH, which was comparable to that of cutting EXT and alkenes, indicating the significant role of isoprene in local photochemical processes (Fig. S6 in the Supplement). In addition, the degradation of isoprene is closely linked to the cycling of ROx. To roughly explain the impact of isoprene chemistry on the ROx budget, we carried out a parallel simulation (S1) where isoprene chemistry is disabled (Fig. 9). The diurnal variation of OH, HO2, RO2, and NO3 in S1 is also shown in Fig. 4, which clearly suggests the decline in ROx and NO3 without isoprene input. To investigate the underlying causes, we calculated the production rate of ROx (P(ROx)) and loss rate of ROx (L(ROx)) in S1, respectively (Fig. 5b). Comparative analysis revealed a decreasing trend for most of the reaction rates in P(ROx) and L(ROx) in S1. This strongly indicates that the absence of isoprene slows down the ROx recycling. Generally, considering that the photolysis of OVOC (0.67 ppbv h−1) was still the predominant primary source of ROx, but without isoprene, the photolysis rate of OVOC decreased by 0.49 ppbv h−1. Moreover, the total production and depletion rate of OH dropped to 6.96 and 7.51 ppbv h−1, respectively. Although the absence of isoprene could reduce the consumption of OH, the OH concentration would be reduced by ∼ 16 % compared to S0, suggesting that the amount of OH produced via isoprene chemistry is large enough to compensate for the shift from OH to peroxy radicals in the ROx family. As for RO2, the daytime production and sink rate falls to 3.25 and 3.34 ppbv h−1, respectively. This means the concentration of RO2 would be in a stage of gradual decrease. In addition, the absence of isoprene could also reduce RO2 concentration by ∼ 20 %, suggesting that isoprene was an important source of RO2 at the DSL site. As for HO2, a drastic decrease of ∼ 53% was found in S1. The abovementioned decrease in ROx obviously could not be explained solely by the removal of isoprene-related radicals. Sensitivity assessment of the model results shows that OVOC concentrations decreased drastically (∼ 41 %) after cutting isoprene (e.g., ∼ 37 % decrease in formaldehyde, ∼ 65 % decrease in methylglyoxal, ∼ 51 % decrease in glyoxal, ∼ 100 % decrease in methacrolein (MACR), and ∼ 100 % decrease in methyl vinyl ketone (MVK)). The decrease in OVOC can further pull-down a substantial amount of primary RO2 and HO2 (Figs. 6 and 9). It is interesting to note that taking away isoprene also causes a drop of NO3 (∼ 23 %). This result can be attributed to the decrease of secondary production of O3 (∼ 35 %), which can further reduce the formation of NO3, especially at night.
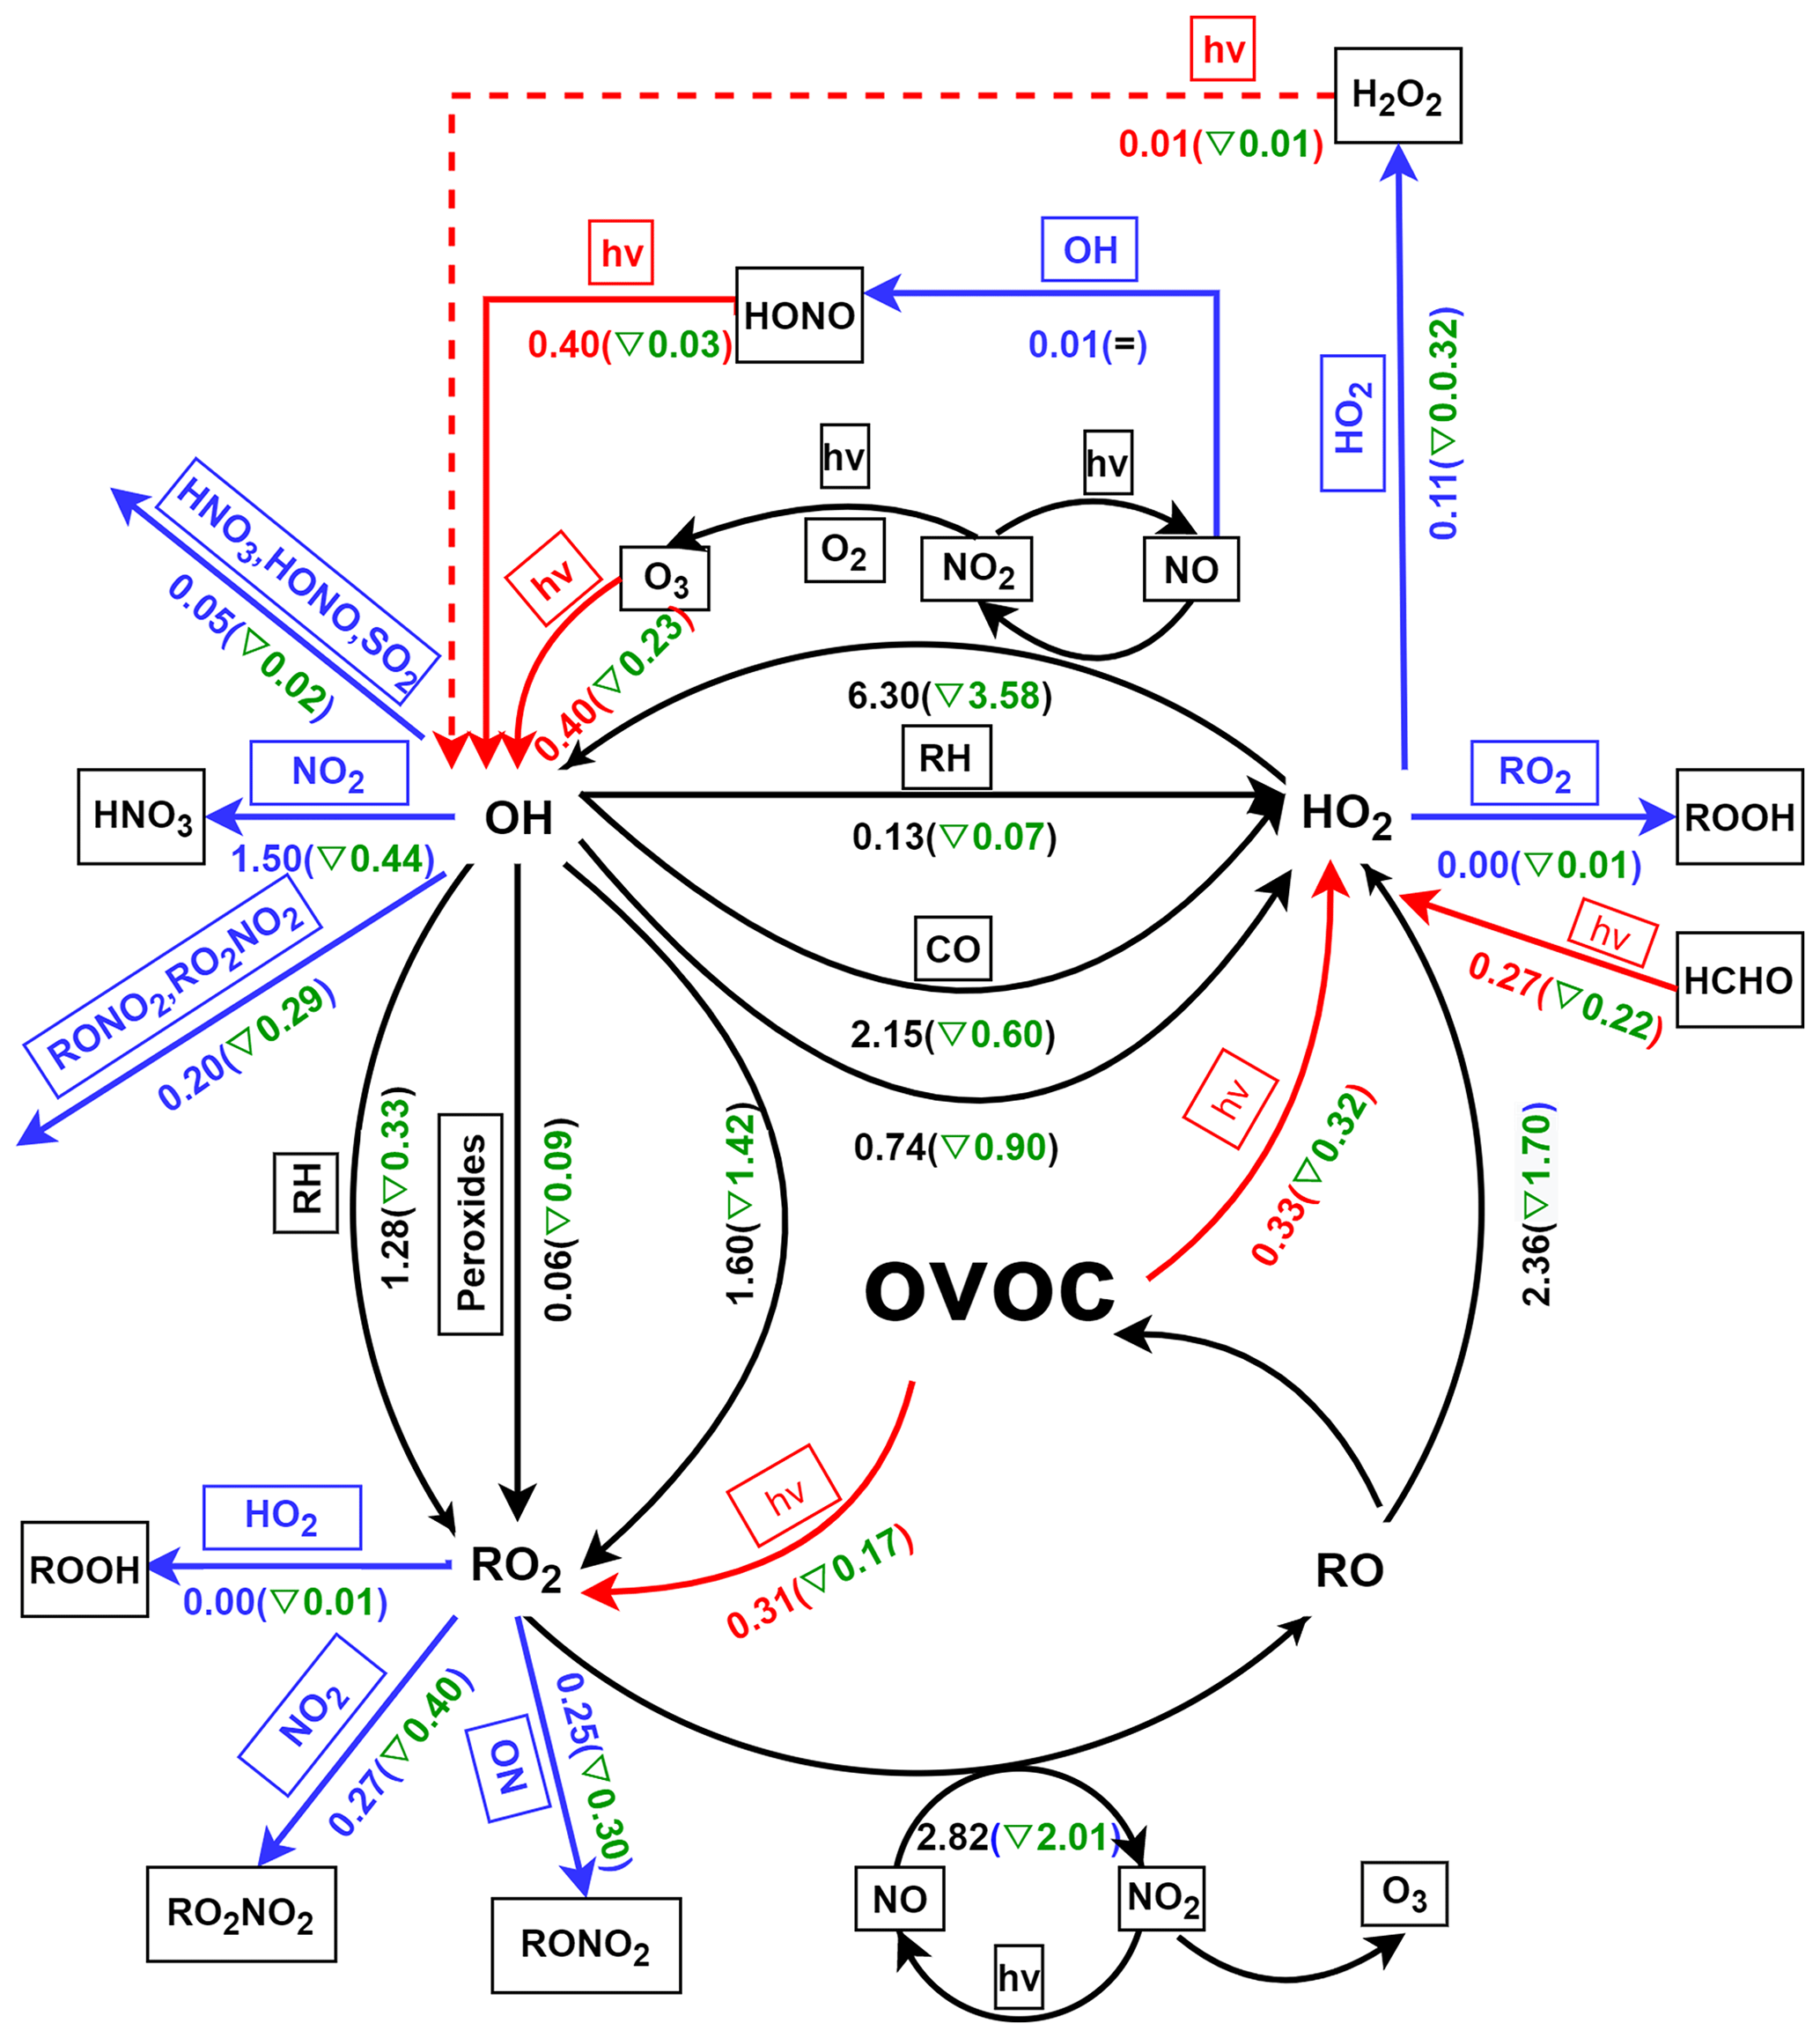
Figure 9Summary of daytime (06:00–18:00) average budgets of ROx radicals (in ppbv h−1) in S1. Primary ROx sources and sinks are in red and blue, respectively, and the black lines represent the processes in ROx and NOx recycling. Values in the brackets represent the difference between S1 and S0.
3.6.2 Impact on O3 formation
To investigate the detailed impact of isoprene on O3 formation, the production and sink pathways of O3 in S1 were also quantified (see Fig. 7b). Notably, the simulated maximum and daily average O3 dropped to 84.95 and 41.23 ppbv, respectively, which is ∼ 35 % and ∼ 34 % lower than that in S0. By comparing S1 and S0, the absence of isoprene can reduce all the production and sink pathways of O3. For example, the rate of the two major production pathways of O3 (HO2+NO and RO2+NO) decreased by ∼ 37 % and ∼ 45 %, respectively. This can be attributed to the drop in the concentrations of HO2 and RO2 radicals in S1. Similarly, the absence of isoprene in O3 depletion caused a decrease of 0.31 ppbv h−1 in the reaction rate of , followed by RO2+NO2 (0.22 ppbv h−1) and NO2+OH (0.265 ppbv h−1). Apparently, the absence of isoprene will reduce the total concentrations of alkenes and can further lead to the decrease of RO2 and OH levels, which ultimately slows down the depletion pathways of O3. Eventually, the absence of isoprene caused a decrease of 5.78 ppbv h−1 in the daytime mean net production rate of O3. Hence, isoprene chemistry plays an important role in the local O3 formation at the DSL site.
3.6.3 Impact on HCHO formation
The analysis of S0 revealed the important role of isoprene, aromatics, and alkenes in the production of HCHO. To investigate the chain effect of isoprene chemistry on HCHO production, the major reactions that dominate the formation and depletion of HCHO in S1 were also analyzed by the OBM model (Fig. 8b). Comparisons between S0 and S1 show that the daily average HCHO decreased by 2.90 ppbv (∼ 39 %) when isoprene chemistry is cut off. Obviously, the drop in HCHO concentration cannot be solely illustrated by the absence of RO (from isoprene). As aforementioned, the absence of isoprene slows down the recycling of ROx and can further lead to a decrease in ROx concentration. Based on the OBM analysis, the concentrations of CH3O, RO (from aromatics), RO (from alkanes), and RO (from alkenes) decreased by 2.70 × 10², 1.59 × 10⁵, 3.35 × 101, and 3.44 molec. cm−3, respectively. The drop in the HCHO precursor concentrations ultimately led to a decrease in the daytime reaction rate of CH3O+O2, RO (from alkenes) + O2, and RO (from aromatics) + O2 by 0.66 ppbv h−1 (∼ 36 %), 0.06 ppbv h−1 (∼ 16 %), and 0.06 ppbv h−1 (∼ 40 %), respectively. The total daytime formation rate of HCHO dropped to 1.71 ppbv h−1 from 1.66 ppbv h−1 (∼ 49 %), lower than that in S0. As a result of the lower HCHO and OH concentrations in S1, the daily mean depletion rate of HCHO decreased by 1.25 ppbv h−1 (∼ 49 %). Ultimately, the absence of isoprene pulled down the daily average HCHO level by 1.61 ppbv (∼ 36 %).
3.7 Uncertainty analysis
Due to limitations in the observations, several issues should be noted in the application of the OBM model to evaluate the local chemistry in the present study. Firstly, methane concentration, which was set to 1850 ppbv based on previous observations, could be an overestimation or underestimation. Thus, we conducted sensitivity analysis of modeled O3, OH, and HCHO with different methane values (from 1600 to 1900 ppbv) (Fig. S7 in the Supplement). The model predicted O3, HCHO, and OH concentrations with negligible change under different CH4 values. Secondly, the photolysis rates directly influence the key photochemical processes during the day. Since the photolysis rates were not measured during the sampling period, we also conducted sensitivity analysis by increasing or decreasing the photolysis rates by 20 % and 40 %. The results showed that the O3, HCHO, and OH concentrations could increase by 51.14 %, 34.52 %, and 50.38 %, respectively, when photolysis rates were increased by 40 % (Fig. S8 in the Supplement). On the contrary, when photolysis rates were decreased by 40 %, O3, HCHO, and OH concentrations decreased by 50.59 %, 30.84 %, and 47.24 %, respectively (Fig. S6 in the Supplement). According to the study by Xu et al. (2013), NO2 concentration measured by the molybdenum oxide converter technique can be significantly overestimated in areas far away from fresh NOx emission sources. Therefore, OBM simulations with reduced NO2 concentrations were conducted. The results suggest that decreasing NO2 could increase or decrease O3, HCHO, and OH concentrations under different scenarios (Fig. S9 in the Supplement). Overall, decreasing NO2 by 40 % could cause a 6.94 %, 12.07%, and 6.29 % increase in O3, HCHO, and OH concentrations, respectively. Finally, the total surface area of aerosols was obtained from the study of Wang et al. (2014) and the uncertainty of this value could directly influence the heterogeneous reactions in this model. Therefore, we conducted sensitive analysis by using increasing or decreasing SA value by 40 % (Fig. S10 in the Supplement). The results show that O3, HCHO, and OH concentrations did not exhibit obvious changes when SA changed. Hence, accurate measurement data of the photolysis rate and NO2 concentration is strongly recommended in further OBM analyses.
Our observations at a suburban site of the YRD region from April to June in 2018 captured five typical local O3 formation episodes. The detailed atmospheric photochemistry during these episodes were analyzed by a typical 0-D box model on a local scale. Under stagnant conditions, the photolysis of OVOC served as the predominant primary ROx sources. ROx achieves efficient recycling with the participation of NOx. Influenced by the fast ROx recycling, local O3 was efficiently produced and accumulated under stagnant conditions. The reactions of RO radicals with O2 dominate the photochemical formation of HCHO. The higher atmospheric oxidative capacity leads to fast degradation of VOCs, which can further lead to high levels of HCHO at the DSL site. Specifically, the degradation of RO radicals (e.g., ISOP34O, ISOPDO, ISOPAO, and ISOPBO) from isoprene oxidation play an important role in the photochemical production of HCHO. To investigate the role of isoprene in ROx recycling and the formation of secondary pollutants, a sensitivity scenario without isoprene (S1) input was simulated by the OBM model. By comparing S1 to the standard simulation (S0), we find that isoprene chemistry is important in local ROx recycling. The absence of isoprene can obviously decrease the concentrations of OVOC and the reaction rates in ROx propagations, and further reduce the concentrations of radicals (e.g., OH, HO2, RO2). Our results indicate that isoprene chemistry can strongly influence the formation of O3 and HCHO in the presence of NOx. Therefore, removing isoprene can slow down the reaction of HO2+NO and RO2+NO by ∼ 37 % and ∼ 45 %, respectively, and eventually cause a ∼ 34 % decrease of O3. As a result of the lower O3 concentration, the average concentration of NO3 dropped by 23 % in S1. The absence of isoprene can also lead to the decrease of RO (from isoprene) and ROx concentration and cause an obvious drop of HCHO formation (∼ 49 %). Furthermore, other biogenic VOCs (BVOCs, such as terpene and sesquiterpene) can also affect local chemistry via photochemical processes, but those BVOCs were not able to be synchronously observed. Therefore, future studies should take into account these BVOCs. Additionally, the uncertainty analysis conducted in this study indicates the significance of synchronous and accurate observation of photolysis rates and NO2 concentration when using the OBM. Generally, this study underlines the significant role of isoprene chemistry in radical chemistry, photochemical reactions, and secondary pollutant formation in the atmosphere of the YRD region and provides insights into secondary pollution and its formation mechanisms.
The data that support the results are available from the corresponding author upon request.
The supplement related to this article is available online at: https://doi.org/10.5194/acp-21-5905-2021-supplement.
KZ was in charge of formal analysis, methodology, and writing of the original draft. LH was responsible for writing-review. QL was in charge of formal analysis, JH and YD for formal analysis and data curation. YuW handled the writing-review. EY, YaW, and QF were also responsible for formal analysis. LL was in charge of the conceptualization, methodology, writing-review and editing.
The authors declare that they have no conflict of interest.
This study is supported by the National Natural Science Foundation of China (No. 42075144; No. 41875161), Shanghai International Science and Technology Cooperation Fund (No. 19230742500), Shanghai Science and Technology Fund (No. 19DZ1205007), Shanghai Sail Program (No. 19YF1415600), and the National Key Research and Development Program of China (No. 2018YFC0213600). Yuhang Wang was supported by the National Science Foundation. We thank the Shanghai Environmental Monitoring Center (SEMC) for conducting the measurements and sharing the data.
This study was financially supported by the National Natural Science Foundation of China (grant nos. 42075144 and 41875161), Shanghai International Science and Technology Cooperation Fund (grant no. 19230742500), Shanghai International Science and Technology Cooperation Fund (grant no. 19DZ1205007), Shanghai Sail Program (grant no. 19YF1415600), and the National Key Research and Development Program of China (grant no. 2018YFC0213600). Yuhang Wang was supported by the National Science Foundation.
This paper was edited by Dwayne Heard and reviewed by two anonymous referees.
Atkinson, R. and Arey, J.: Atmospheric degradation of volatile organic compounds, Chem. Rev., 103, 4605–4638, 2003.
Atkinson, R., Baulch, D. L., Cox, R. A., Crowley, J. N., Hampson, R. F., Hynes, R. G., Jenkin, M. E., Rossi, M. J., Troe, J., and IUPAC Subcommittee: Evaluated kinetic and photochemical data for atmospheric chemistry: Volume II – gas phase reactions of organic species, Atmos. Chem. Phys., 6, 3625–4055, https://doi.org/10.5194/acp-6-3625-2006, 2006.
Chan, K. L., Wang, S. S., Liu, C., Zhou, B., Wenig, M. O., and Saiz-Lopez, A.: On the summertime air quality and related photochemical processes in the megacity Shanghai, China, Sci. Total Environ., 580, 974–983, 2017.
D'Ambro, E. L., Møller, K. H., Lopez-Hilfiker, F. D., Schobesberger, S., Liu, J., Shilling, J. E., Lee, B. H., Kjaergaard, H. G., and Thornton, J. A.: Isomerization of second-generation isoprene peroxy radicals: Epoxide formation and implications for secondary organic aerosol yields, Environ. Sci. Technol., 51, 4978–4987, 2017.
Gong, D., Wang, H., Zhang, S., Wang, Y., Liu, S. C., Guo, H., Shao, M., He, C., Chen, D., He, L., Zhou, L., Morawska, L., Zhang, Y., and Wang, B.: Low-level summertime isoprene observed at a forested mountaintop site in southern China: implications for strong regional atmospheric oxidative capacity, Atmos. Chem. Phys., 18, 14417–14432, https://doi.org/10.5194/acp-18-14417-2018, 2018.
He, Z., Wang, X., Ling, Z., Zhao, J., Guo, H., Shao, M., and Wang, Z.: Contributions of different anthropogenic volatile organic compound sources to ozone formation at a receptor site in the Pearl River Delta region and its policy implications, Atmos. Chem. Phys., 19, 8801–8816, https://doi.org/10.5194/acp-19-8801-2019, 2019.
Jenkin, M. E., Young, J. C., and Rickard, A. R.: The MCM v3.3.1 degradation scheme for isoprene, Atmos. Chem. Phys., 15, 11433–11459, https://doi.org/10.5194/acp-15-11433-2015, 2015.
Li, L., An, J. Y., Shi, Y. Y., Zhou, M., Yan, R. S., Huang, C., Wang, H. L., Lou, S. R., Wang, Q., Lu, Q., and Wu, J.: Source apportionment of surface ozone in the Yangtze River Delta, China in the summer of 2013, Atmos. Environ., 144, 194–207, 2016.
Li, L., An, J. Y., Yan, R. S., Huang, C., Wang, H. L., Lou, S. R., Huang, L., and Yarwood, G.: Ozone source apportionment over the Yangtze River Delta region, China: Investigation of regional transport, sectoral contributions and seasonal differences, Atmos. Environ., 202, 269–280, 2019.
Li, X., Rohrer, F., Brauers, T., Hofzumahaus, A., Lu, K., Shao, M., Zhang, Y. H., and Wahner, A.: Modeling of HCHO and CHOCHO at a semi-rural site in southern China during the PRIDE-PRD2006 campaign, Atmos. Chem. Phys., 14, 12291–12305, https://doi.org/10.5194/acp-14-12291-2014, 2014.
Li, Y., Shao, M., Lu, S., Chang, C. C., and Dasgupta, P. K.: Variations and sources of ambient formaldehyde for the 2008 Beijing Olympic games, Atmos. Environ., 44, 2632–2639, https://doi.org/10.1016/j.atmosenv.2010.03.045, 2010.
Lin, H., Wang, M., Duan, Y., Fu, Q., Ji, W., Cui, H., Jin, D., Lin, Y., and Hu, K.: O3 sensitivity and contributions of different nmhc sources in O3 formation at urban and suburban sites in Shanghai, Atmosphere, 11, 1–18, https://doi.org/10.3390/atmos11030295, 2020.
Liu, X., Lyu, X., Wang, Y., Jiang, F., and Guo, H.: Intercomparison of O3 formation and radical chemistry in the past decade at a suburban site in Hong Kong, Atmos. Chem. Phys., 19, 5127–5145, https://doi.org/10.5194/acp-19-5127-2019, 2019.
Liu, Y. J., Herdlinger-Blatt, I., McKinney, K. A., and Martin, S. T.: Production of methyl vinyl ketone and methacrolein via the hydroperoxyl pathway of isoprene oxidation, Atmos. Chem. Phys., 13, 5715–5730, https://doi.org/10.5194/acp-13-5715-2013, 2013.
Liu, Z., Wang, Y., Gu, D., Zhao, C., Huey, L. G., Stickel, R., Liao, J., Shao, M., Zhu, T., Zeng, L., Amoroso, A., Costabile, F., Chang, C.-C., and Liu, S.-C.: Summertime photochemistry during CAREBeijing-2007: ROx budgets and O3 formation, Atmos. Chem. Phys., 12, 7737–7752, https://doi.org/10.5194/acp-12-7737-2012, 2012.
Riedel, T. P., Wolfe, G. M., Danas, K. T., Gilman, J. B., Kuster, W. C., Bon, D. M., Vlasenko, A., Li, S.-M., Williams, E. J., Lerner, B. M., Veres, P. R., Roberts, J. M., Holloway, J. S., Lefer, B., Brown, S. S., and Thornton, J. A.: An MCM modeling study of nitryl chloride (ClNO2) impacts on oxidation, ozone production and nitrogen oxide partitioning in polluted continental outflow, Atmos. Chem. Phys., 14, 3789–3800, https://doi.org/10.5194/acp-14-3789-2014, 2014.
Tan, Z., Lu, K., Jiang, M., Su, R., Wang, H., Lou, S., Fu, Q., Zhai, C., Tan, Q., Yue, D., Chen, D., Wang, Z., Xie, S., Zeng, L., and Zhang, Y.: Daytime atmospheric oxidation capacity in four Chinese megacities during the photochemically polluted season: a case study based on box model simulation, Atmos. Chem. Phys., 19, 3493–3513, https://doi.org/10.5194/acp-19-3493-2019, 2019.
Wang, X., Chen, J., Cheng, T., Zhang, R., and Wang, X.: Particle number concentration, size distribution and chemical composition during haze and photochemical smog episodes in Shanghai, J. Environ. Sci., 26, 1894–1902, https://doi.org/10.1016/j.jes.2014.07.003, 2014.
Wennberg, P. O., Bates, K. H., Crounse, J. D., Dodson, L. G., McVay, R. C., Mertens, L. A., Nguyen, T. B., Praske, E., Schwantes, R. H., Smarte, M. D., St Clair, J. M., Teng, A. P., Zhang, X., and Seinfeld, J. H.: Gas-phase reactions of isoprene and its major oxidation products, Chem. Rev., 118, 3337–3390, 2018.
Wolfe, G. M., Kaiser, J., Hanisco, T. F., Keutsch, F. N., de Gouw, J. A., Gilman, J. B., Graus, M., Hatch, C. D., Holloway, J., Horowitz, L. W., Lee, B. H., Lerner, B. M., Lopez-Hilifiker, F., Mao, J., Marvin, M. R., Peischl, J., Pollack, I. B., Roberts, J. M., Ryerson, T. B., Thornton, J. A., Veres, P. R., and Warneke, C.: Formaldehyde production from isoprene oxidation across NOx regimes, Atmos. Chem. Phys., 16, 2597–2610, https://doi.org/10.5194/acp-16-2597-2016, 2016a.
Wolfe, G. M., Marvin, M. R., Roberts, S. J., Travis, K. R., and Liao, J.: The Framework for 0-D Atmospheric Modeling (F0AM) v3.1, Geosci. Model Dev., 9, 3309–3319, https://doi.org/10.5194/gmd-9-3309-2016, 2016b.
Xu, Z., Wang, T., Xue, L. K., Louie, P. K. K., Luk, C. W. Y., Gao, J., Wang, S. L., Chai, F. H., and Wang, W. X.: Evaluating the uncertainties of thermal catalytic conversion in measuring atmospheric nitrogen dioxide at four differently polluted sites in China, Atmos. Environ., 76, 221–226, 2013.
Xue, L. K., Wang, T., Gao, J., Ding, A. J., Zhou, X. H., Blake, D. R., Wang, X. F., Saunders, S. M., Fan, S. J., Zuo, H. C., Zhang, Q. Z., and Wang, W. X.: Ground-level ozone in four Chinese cities: precursors, regional transport and heterogeneous processes, Atmos. Chem. Phys., 14, 13175–13188, https://doi.org/10.5194/acp-14-13175-2014, 2014.
Xue, L., Gu, R., Wang, T., Wang, X., Saunders, S., Blake, D., Louie, P. K. K., Luk, C. W. Y., Simpson, I., Xu, Z., Wang, Z., Gao, Y., Lee, S., Mellouki, A., and Wang, W.: Oxidative capacity and radical chemistry in the polluted atmosphere of Hong Kong and Pearl River Delta region: analysis of a severe photochemical smog episode, Atmos. Chem. Phys., 16, 9891–9903, https://doi.org/10.5194/acp-16-9891-2016, 2016.
Yang, X., Xue, L. K., Wang, T., Wang, X. F., Gao, J., Lee, S. C., Blake, D. R., Chai, F. H., and Wang, W. X.: Observations and explicit modeling of summertime carbonyl formation in Beijing: identification of key precursor species and their impact on atmospheric oxidation chemistry, J. Geophys. Res.-Atmos., 123, 1426–1440, 2018.
Yang, X., Zhang, G. Q., Sun, Y. M., Zhu, L., Wei, X. F., Li, Z., and Zhong, X. L.: Explicit modeling of background HCHO formation in southern China, Atmos. Res., 240, 104941, https://doi.org/10.1016/j.atmosres.2020.104941, 2020.
Zeng, P., Lyu, X. P., Guo, H., Cheng, H. R., Wang, Z. W., Liu, X. F., and Zhang, W. H.: Spatial variation of sources and photochemistry, of formaldehyde in Wuhan, Central China, Atmos. Environ., 214, 116826, https://doi.org/10.1016/j.atmosenv.2019.116826, 2019.
Zhang, K., Zhou, L., Fu, Q., Yan, L., Bian, Q., Wang, D., and Xiu, G.: Vertical distribution of ozone over Shanghai during late spring: A balloon-borne observation, Atmos. Environ., 208, 48–60, 2019.
Zhang, K., Li, L., Huang, L., Wang, Y., Huo, J., Duan, Y., Wang, Y., and Fu, Q.: The impact of volatile organic compounds on ozone formation in the suburban area of Shanghai, Atmos. Environ., 232, 117511, https://doi.org/10.1016/j.atmosenv.2020.117511, 2020a.
Zhang, K., Xu, J., Huang, Q., Zhou, L., Fu, Q., Duan, Y., and Xiu, G.: Precursors and potential sources of ground-level ozone in suburban Shanghai, Front. Env. Sci. Eng., 14, 92, https://doi.org/10.1007/s11783-020-1271-8, 2020b.
Zhu, J., Cheng, H., Peng, J., Zeng, P., Wang, Z., Lyu, X., and Guo, H.: O3 photochemistry on O3 episode days and non-O3 episode days in Wuhan, Central China, Atmos. Environ., 223, 117236, https://doi.org/10.1016/j.atmosenv.2019.117236, 2020a.
Zhu, J., Wang, S., Wang, H., Jing, S., Lou, S., Saiz-Lopez, A., and Zhou, B.: Observationally constrained modeling of atmospheric oxidation capacity and photochemical reactivity in Shanghai, China, Atmos. Chem. Phys., 20, 1217–1232, https://doi.org/10.5194/acp-20-1217-2020, 2020b.
Zong, R. H., Yang, X., Wen, L., Xu, C. H., Zhu, Y. H., Chen, T. S., Yao, L., Wang, L. W., Zhang, J. M., Yang, L. X., Wang, X. F., Shao, M., Zhu, T., Xue, L. K., and Wang, W. X.: Strong ozone production at a rural site in the North China Plain: Mixed effects of urban plumes and biogenic emissions, J. Environ. Sci., 71, 261–270, https://doi.org/10.1016/j.jes.2018.05.003, 2018.