the Creative Commons Attribution 4.0 License.
the Creative Commons Attribution 4.0 License.
 | 16 Apr 2021
Production of HONO from NO2 uptake on illuminated TiO2 aerosol particles and following the illumination of mixed TiO2∕ammonium nitrate particles
Joanna E. Dyson
Graham A. Boustead
Lauren T. Fleming
Mark Blitz
Daniel Stone
Stephen R. Arnold
Lisa K. Whalley
The rate of production of HONO from illuminated TiO2 aerosols in the presence of NO2 was measured using an aerosol flow tube system coupled to a photo-fragmentation laser-induced fluorescence detection apparatus. The reactive uptake coefficient of NO2 to form HONO, , was determined for NO2 mixing ratios in the range 34–400 ppb, with spanning the range (9.97 ± 3.52) × 10−6 to (1.26 ± 0.17) × 10−4 at a relative humidity of 15 ± 1 % and for a lamp photon flux of (1.63 ± 0.09) ×1016 photons cm−2 s−1 (integrated between 290 and 400 nm), which is similar to midday ambient actinic flux values. increased as a function of NO2 mixing ratio at low NO2 before peaking at (1.26 ± 0.17) at ∼ 51 ppb NO2 and then sharply decreasing at higher NO2 mixing ratios rather than levelling off, which would be indicative of surface saturation. The dependence of HONO production on relative humidity was also investigated, with a peak in production of HONO from TiO2 aerosol surfaces found at ∼ 25 % RH. Possible mechanisms consistent with the observed trends in both the HONO production and reactive uptake coefficient were investigated using a zero-dimensional kinetic box model. The modelling studies supported a mechanism for HONO production on the aerosol surface involving two molecules of NO2, as well as a surface HONO loss mechanism which is dependent upon NO2. In a separate experiment, significant production of HONO was observed from illumination of mixed aerosols in the absence of NO2. However, no production of HONO was seen from the illumination of nitrate aerosols alone. The rate of production of HONO observed from mixed aerosols was scaled to ambient conditions found at the Cape Verde Atmospheric Observatory (CVAO) in the remote tropical marine boundary layer. The rate of HONO production from aerosol particulate nitrate photolysis containing a photocatalyst was found to be similar to the missing HONO production rate necessary to reproduce observed concentrations of HONO at CVAO. These results provide evidence that particulate nitrate photolysis may have a significant impact on the production of HONO and hence NOx in the marine boundary layer where mixed aerosols containing nitrate and a photocatalytic species such as TiO2, as found in dust, are present.
- Article
(4411 KB) - Full-text XML
- BibTeX
- EndNote


A dominant source of OH radicals in polluted environments is the photolysis of nitrous acid (HONO) (Platt et al., 1980; Winer and Biermann, 1994; Harrison et al., 1996; Alicke et al., 2002; Whalley et al., 2018; Crilley et al., 2019; Lu et al., 2019; Slater et al., 2020; Whalley et al., 2021). During a recent study in winter in central Beijing, HONO photolysis accounted for over 90 % of the primary production of OH averaged over the day (Slater et al., 2020). Oxidation by OH radicals is the dominant removal mechanism for many tropospheric trace gases, such as tropospheric methane, as well as the formation of secondary species, including tropospheric ozone (Levy, 1971), nitric and sulfuric acids which condense to form aerosols, and secondary organic aerosols. Understanding the formation of HONO in highly polluted environments is crucial to fully understand both the concentration and distribution of key atmospheric radical species, as well as secondary products in the gas and aerosol phases associated with climate change and poor air quality.
Atmospheric concentrations of HONO range from a few parts per trillion by volume (pptv) in remote clean environments (Reed et al., 2017) to more than 10 ppb in highly polluted areas such as Beijing (Crilley et al., 2019). The main gas-phase source of HONO in the troposphere is the reaction of nitric oxide (NO) with the OH radical. HONO has also been shown to be directly emitted from vehicles (Kurtenbach et al., 2001; Li et al., 2008), for which the rate of emission is often estimated as a fraction of known NOx (NO2+NO) emissions. Many heterogeneous HONO sources have also been postulated, including the conversion of nitric acid (HNO3) on ground or canopy surfaces (Zhou et al., 2003; George et al., 2005), bacterial production of nitrite on soil surfaces (Su et al., 2011; Oswald et al., 2013), and, more recently, particulate nitrate photolysis, thought to be an important source in marine environments (Ye et al., 2016; Reed et al., 2017; Ye et al., 2017a, b). Rapid cycling of gas-phase nitric acid to gas-phase nitrous acid via particulate nitrate photolysis in the clean marine boundary layer has been observed during the 2013 NOMADSS aircraft measurement campaign over the North Atlantic Ocean (Ye et al., 2016). Ground-based measurements of HONO made at Cabo Verde in the tropical Atlantic Ocean (Reed et al., 2017) provided evidence that a mechanism for renoxification in low-NOx areas is required (Reed et al., 2017; Ye et al., 2017a).
Recent model calculations show a missing daytime source of HONO, which is not consistent with known gas-phase production mechanisms, direct emissions or dark heterogeneous formation (e.g. prevalent at night). It has been suggested that this source could be light driven and dependent on NO2 (Kleffmann, 2007; Michoud et al., 2014; Spataro and Ianniello, 2014; Lee et al., 2016).
It is estimated that between 1604 and 1960 Tg yr−1 of dust particles are emitted into the atmosphere (Ginoux et al., 2001). Titanium dioxide (TiO2) is a photocatalytic compound found in dust particles at mass mixing ratios of between 0.1 % and 10 % depending on the location where the particles were suspended (Hanisch and Crowley, 2003). When exposed to UV light (λ < 390 nm) TiO2 promotes an electron () from the conduction band to the valence band, leaving behind a positively charged hole () in the valence band (Chen et al., 2012):
which can then lead to both reduction and oxidation reactions of any surface-adsorbed gas-phase species such as NO2 leading to HONO.
In previous studies of the reaction of NO2 on TiO2 aerosol surfaces, HONO was observed as a major gas-phase product (Gustafsson et al., 2006; Dupart et al., 2014). Gustafsson et al. (2006) observed a yield of gas-phase HONO of ∼ 75 % (for each NO2 removed) and showed the rate of the photoreaction of NO2 on pure TiO2 aerosols dependent on relative humidity, emphasising the superhydrophilic nature of TiO2 surfaces under UV irradiation. Dupart et al. (2014) also reported a relative humidity dependence of the uptake of NO2 onto Arizona test dust containing TiO2, with the main gas-phase products measured being NO and HONO, with a HONO yield of 30 % in experiments with 110 ppb NO2. Dupart et al. (2014) postulated the following mechanism of HONO production, which is consistent with the formation of the NO anion seen in a previous study on TiO2 surfaces (Nakamura et al., 2000):
In areas with high mineral dust loading, such as desert regions, far from anthropogenic sources, NO2 concentrations are typically low. However, when dust is transported to urban areas, this source of HONO may become significant. One study reported that TiO2 composed 0.75–1.58 µg m−3 when aerosol loadings were 250–520 µg m−3 over the same time period in southeast Beijing, when air had been transported from the Gobi desert (Schleicher et al., 2010).
In this study, the production of HONO on the surface of TiO2 particles in the presence of NO2 is investigated as a function of NO2 mixing ratio, aerosol surface area density and relative humidity using an aerosol flow tube system coupled to a photo-fragmentation laser-induced fluorescence detector (Boustead, 2019). The uptake coefficient of NO2 to generate HONO is then determined, and a mechanistic interpretation of the experimental observations is presented. The production of HONO directly in the absence of NO2 from the illumination of a mixed sample of nitrate and TiO2 aerosol is also presented. Using a similar apparatus, previous work had showed that TiO2 particles produce OH and HO2 radicals directly under UV illumination (Moon et al., 2019). The atmospheric implications of these results and the role of photocatalysts for the formation of HONO are also discussed.
2.1 Overview of the experimental setup
The production of HONO from illuminated aerosol surfaces is studied using an aerosol flow tube system coupled to a photo-fragmentation laser-induced fluorescence (PF-LIF) cell which allows the highly sensitive detection of the OH radical formed through photo-fragmentation of HONO into OH and NO followed by laser-induced fluorescence (LIF) detection at low pressure. The experimental setup used in this investigation is described in detail in Boustead (2019), as well as similar systems having been used to measure HONO in the field (Liao et al., 2006; Wang et al., 2020), and therefore only a brief description of the setup is given here. A schematic of the experimental setup is shown in Fig. 1.
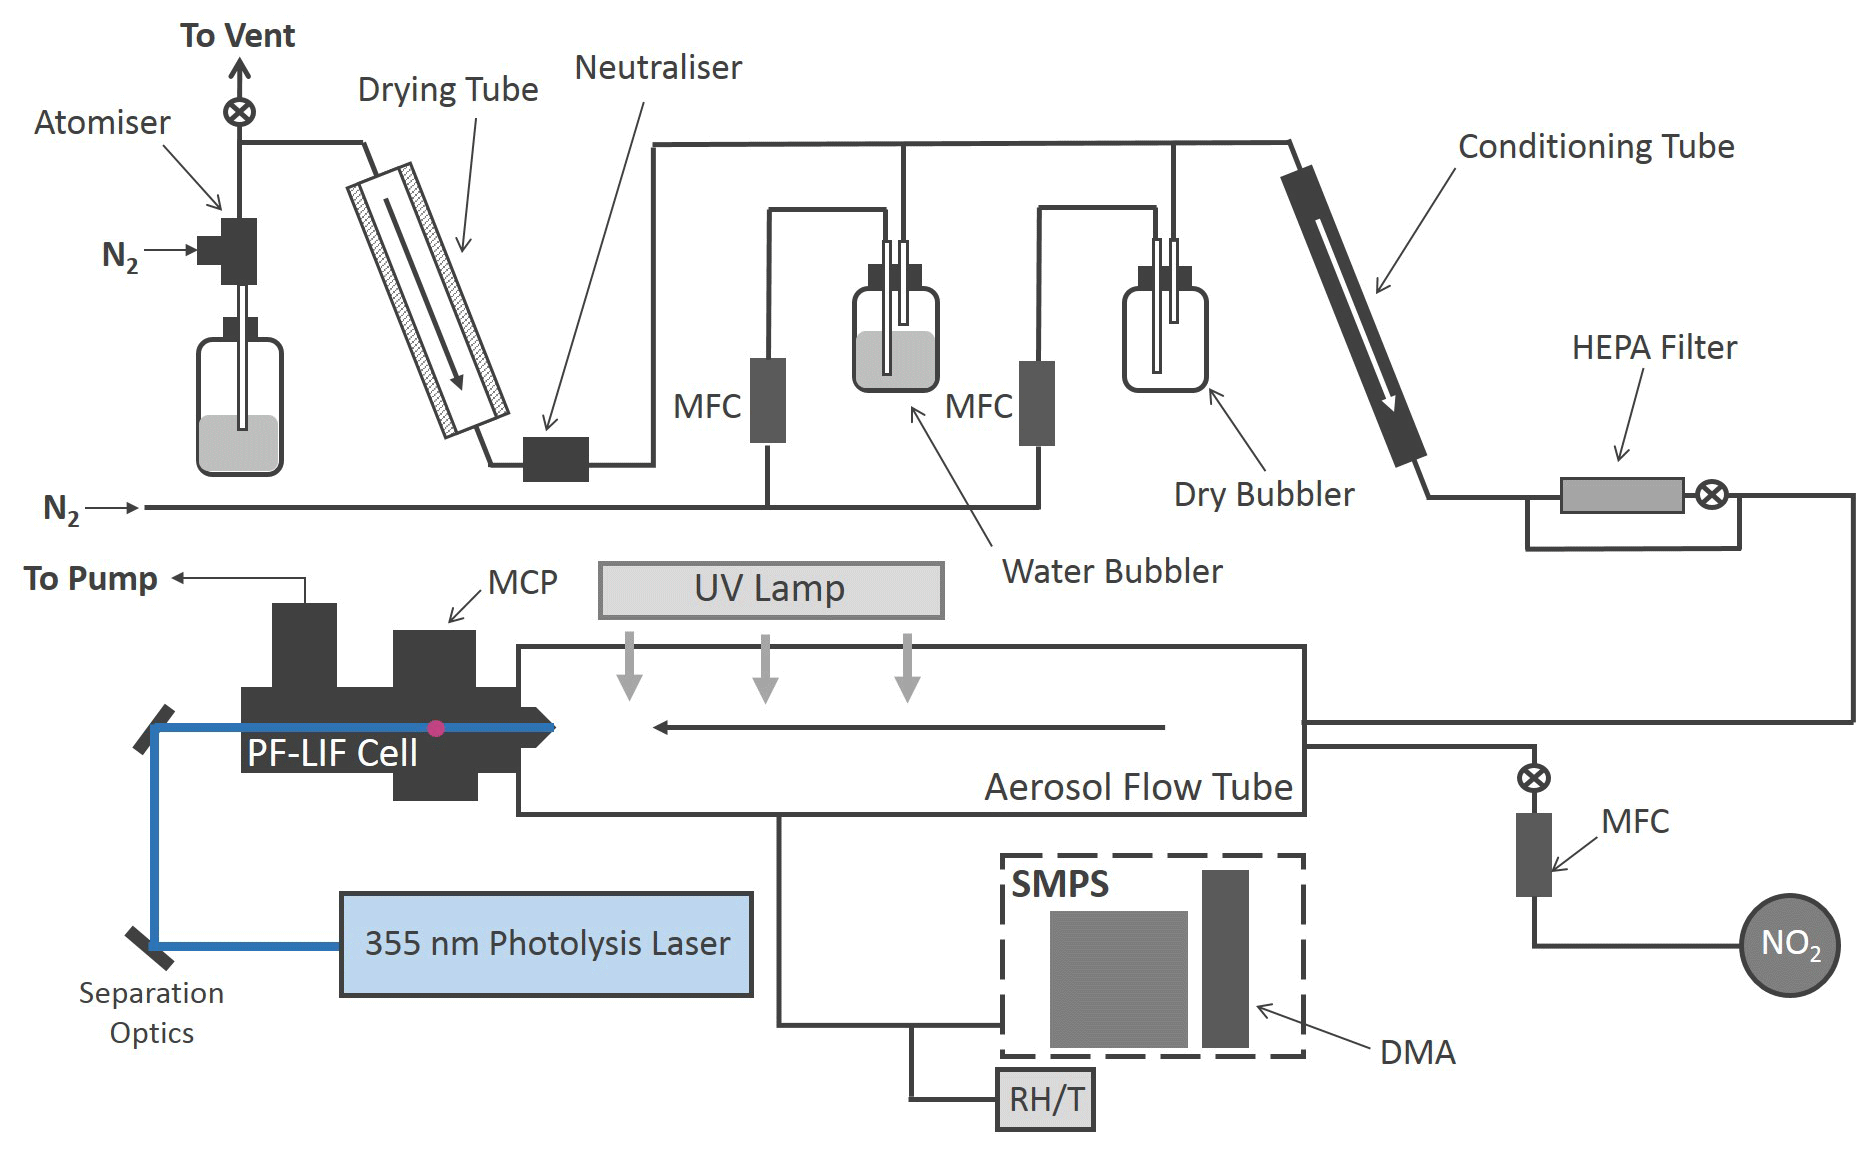
Figure 1Schematic of the Leeds aerosol flow tube system coupled to a laser-fragmentation laser-induced fluorescence detector for HONO. The paths of the 355 nm (blue) and 308 nm (purple, depicted as travelling out of the page perpendicular to the 355 nm light) light are also shown. CPC: condensation particle counter; DMA: differential mobility analyser; HEPA: high-efficiency particle air filter; FAGE: fluorescence assay by gas expansion; MCP: microchannel plate photomultiplier; MFC: mass flow controller; RH/T: relative humidity/temperature probe; SMPS: scanning mobility particle sizer.
All experiments were conducted at room temperature (295 ± 3 K) using nitrogen (BOC, 99.998 %) or air (BOC, 21 ± 0.5 % O2) as the carrier gas. A humidified flow of aerosols, ∼ 6 L min−1 (total residence time of 104 s in the flow tube), was introduced through an inlet at the rear of the aerosol flow tube (Quartz, 100 cm long, 11.5 cm i.d.), which was covered by a black box to eliminate the presence of room light during experiments. A 15 W UV lamp (XX-15LW bench lamp, λpeak=365 nm) was situated on the outside of the flow tube to illuminate aerosols and promote the production of HONO (half the length of the flow tube was illuminated, leading to an illumination time of 52 s). The concentration of HONO is measured by PF-LIF with sampling from the end of the flow tube via a protruding turret containing a 1 mm diameter pinhole, through which the gas exiting the flow tube was drawn into the detection cell at 5 L min−1. The detection cell was kept at low pressure, ∼ 1.5 Torr, using a rotary pump (Edwards, E1M80) in combination with a roots blower (Edwards, EH1200). All gas flows in the experiment were controlled using mass flow controllers (MKS and Brooks). The relative humidity (RH) and temperature of the aerosol flow was measured using a probe (Rotronics HC2-S, accuracy ±1 % RH) the former calibrated against the H2O vapour concentration measured by a chilled mirror hygrometer (General Eastern Optica) in the exhaust from the flow tube.
2.2 Aerosol generation and detection
Solutions for the generation of TiO2 aerosol solutions were prepared by dissolving 5 g of titanium dioxide (Aldrich Chemistry 718467, 99.5 % Degussa, 80 % anatase : 20 % rutile) into 500 mL of Milli-Q water. Polydisperse aerosols were then generated from this solution using an atomiser (TSI model 3076), creating a 1 L min−1 flow of TiO2 aerosol particles in nitrogen hereafter referred to as the aerosol flow. This aerosol flow was then passed through a silica drying tube (TSI 3062, capable of reducing 60 % RH incoming flow to 20 % RH) to remove water vapour and then passed through a neutraliser to apply a known charge distribution and reduce loss of aerosols to the walls. After the neutraliser the aerosol flow was mixed with both a dry and a humidified N2 flow (controlled by mass flow controllers) to regulate the relative humidity of the system by changing the ratio of dry to humid nitrogen flows. A conditioning tube was then used to allow for equilibration of water vapour adsorption and re-evaporation to and from the aerosol surfaces for the chosen RH, which was controlled within the range ∼ 10 %–70 % RH. A portion of the aerosol flow was then passed through a high-efficiency particle filter (HEPA) fitted with a bypass loop and bellows valve allowing control of the aerosol number concentration entering the aerosol flow tube. Previous studies (George et al., 2013; Boustead, 2019) have shown the loss of aerosol to the walls of the flow tube to be negligible. Aerosol size distributions were measured for aerosols exiting the flow tube using a scanning mobility particle sizer (SMPS, TSI 3081) and a condensation particle counter (CPC, TSI 3775) which was calibrated using latex beads. Any aerosol surface area not counted due to the upper diameter range of the combined SMPS/CPC (14.6–661.2 nm, sheath flow of 3 L min−1, instrumental particle counting error of 10 %–20 %) was corrected for during analysis by assuming a log-normal distribution, which was verified for TiO2 aerosols generated in this manner (Matthews et al., 2014). However, the majority of aerosols, > 90 %, had diameters in the range that could be directly detected. In addition to the experiments with single-component TiO2, mixed ammonium and single-component ammonium nitrate aerosols were also generated using the atomiser for investigations of HONO production from nitrate aerosols without NO2 present. An example of an aerosol size distribution from this work for single-component ammonium nitrate aerosols, mixed ammonium and single-component TiO2 aerosols is shown in Fig. 2.
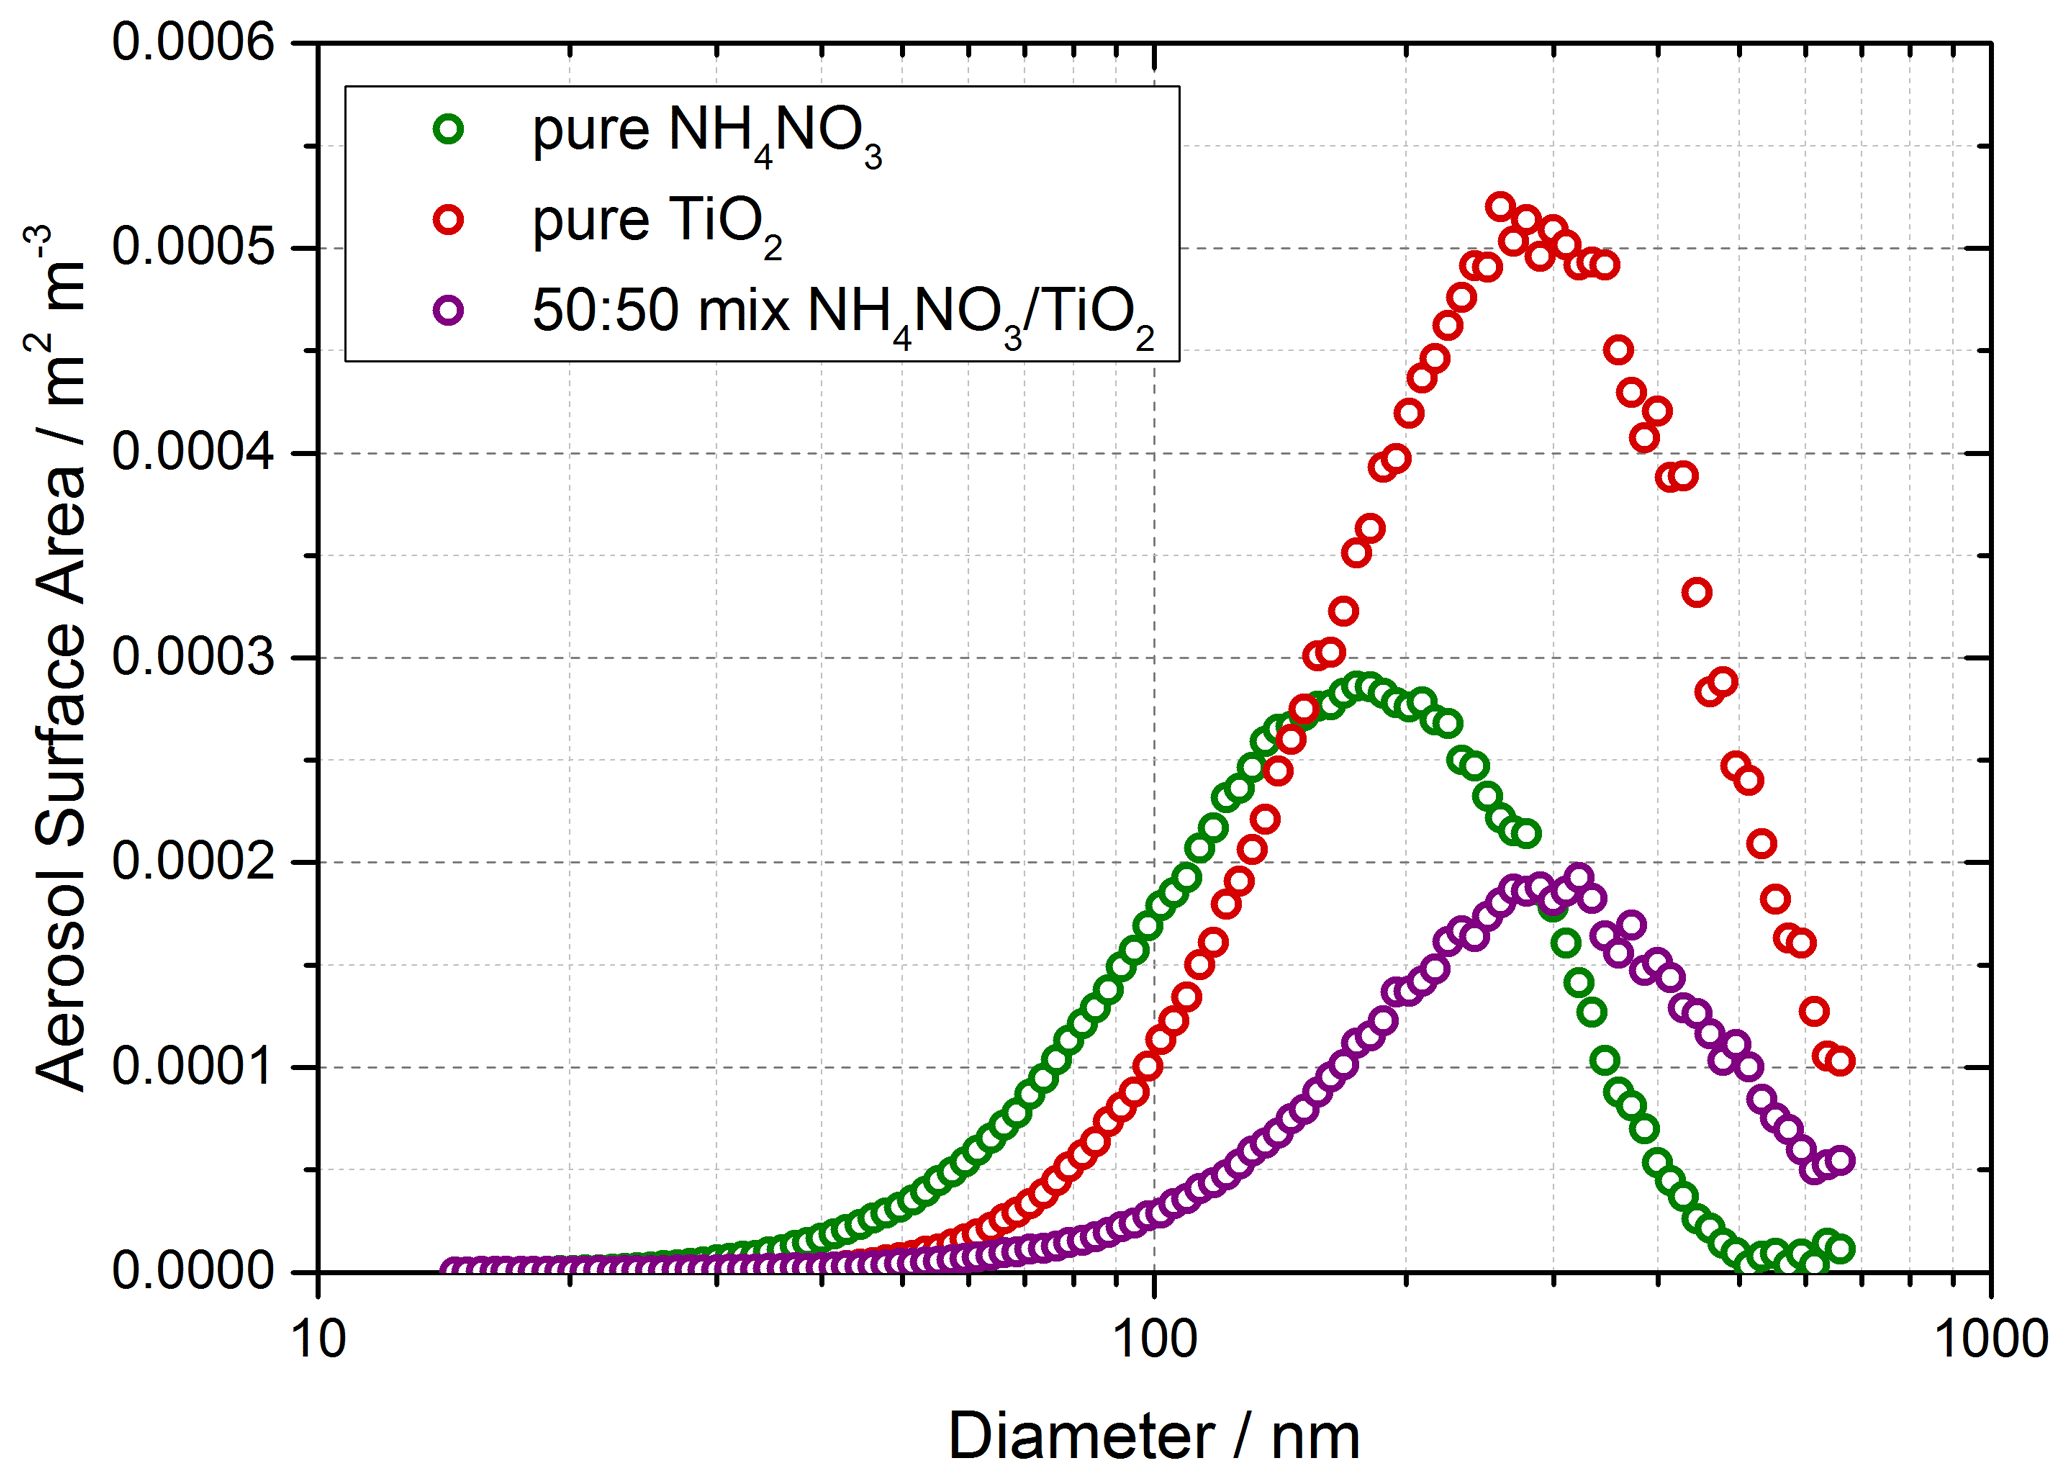
Figure 2Typical aerosol surface area distribution for pure ammonium nitrate aerosols (green) and pure TiO2 aerosols (red) and 50:50 mixed aerosols (purple) measured after the flow tube.
2.3 Detection of HONO
As HONO is not directly detectable via LIF, it was necessary to fragment the HONO produced into OH and NO (Liao et al., 2007), with detection of OH via LIF. A 355 nm photolysis laser (Spectron Laser Systems, SL803) with a pulse repetition frequency (PRF) of 10 Hz and pulse duration ∼ 10 ns was used to fragment HONO into OH. This fragmentation wavelength was chosen as HONO has a strong absorption peak at ∼ 355 nm, leading to the breakage of the HO–NO bond to form NO and OH in their electronic ground states (Shan et al., 1989). A Nd:YAG pumped dye probe laser (JDSU Q201-HD, Q series, Sirah Cobra Stretch) with a PRF of 5000 Hz was used for the detection of OH via the fluorescence assay by gas expansion (FAGE) technique, which employs the expansion of gas through a small pinhole into the detection cell. The OH radical was measured using on-resonance detection by LIF via the excitation of the A2Σ+ () ←X2Πi () Q1(2) transition at 308 nm (Heard, 2006). A multi-channel plate (MCP) photomultiplier (Photek, MCP 325) equipped with an interference filter at 308 nm (Barr Associates, 308 nm, FWHM – 8 nm, ∼ 50 % transmission) was used to measure the fluorescence signal. A reference OH cell in which a large LIF signal could be generated was utilised to ensure the wavelength of the probe laser remained tuned to the peak of the OH transition at 308 nm. OH measurements are taken both before and after each photolysis laser pulse, allowing measurement of any OH already present in the gas flow to be determined as a background signal for subtraction. The OH generated from HONO photolysis was measured promptly (∼ 800 ns) after the 355 nm pulse to maximise sensitivity to OH before it was spatially diluted away from the measurement region (Boustead, 2019). Offline measurements, with the probe laser wavelength moved away from the OH transition (by 0.02 nm), were taken to allow the signal generated from detector dark counts and scattered laser light to be measured and subtracted from the online signal. To determine an absolute value of the HONO concentration, [HONO], a calibration was performed, in order to convert from the HONO signal, SHONO, using SHONO=CHONO [HONO], as described fully in Boustead (2019). A glass calibration wand was used to produce OH and HO2 in equal concentrations from the photolysis of water vapour at 185 nm:
An excess flow of NO was then added to generate HONO, which was then detected as OH in the cell. The excess flow of NO (BOC, 99.5 %) ensures rapid and complete conversion of OH and HO2 to HONO. The concentration of OH and HO2 produced, and therefore the amount of HONO produced in the wand, is calculated using
where [H2O] is the concentration of water vapour in the humidified gas flow, is the absorption cross section of H2O at 185 nm 7.14 × 10⁻²⁰ cm2 molec.−1 (Cantrell et al., 1997), ϕOH is the quantum yield of OH for the photo-dissociation of H2O at 185 nm (=1), F is the lamp flux and t is the irradiation time (the product of which is determined using ozone actinometry (Boustead, 2019).
A typical value of the calibration factor was counts mW−1 for N2, leading to a calculated limit of detection of 12 ppt for a 50 s averaging period and a signal-to-noise ratio (SNR) of 1 (Boustead, 2019). The typical error in the HONO concentration was 15 % at 1σ, determined by the error in the calibration.
2.4 Experimental procedure and data analysis
The experiments were performed with a minimum flow of 6 L min−1 through the aerosol flow tube, giving a Reynolds number of ∼ 150, which ensured a laminar flow regime. The HONO signal, converted to an absolute concentration using a calibration factor, was measured over a range of aerosol surface area densities, both in the presence and absence of illumination, and background measurements without aerosols present were also performed.
The HONO signal originates from several sources: the illuminated aerosol surface, the illuminated quartz flow tube walls, dark reactions on aerosol surfaces, dark reactions on the flow tube surface, and finally from impurities in the NO2 (Sigma Aldrich, > 99.5 %, freeze pump thawed to further remove any remaining NO or O2) and N2 flows (either HONO itself or a species which photolyses at 355 nm to give OH). Of interest here is the HONO production from both dark and illuminated aerosol surfaces which is atmospherically relevant. Following transit through the flow tube, and in the presence of NO2, the total concentration of HONO measured by the PF-LIF detector is given by
Any HONO seen without the presence of aerosol was therefore due to HONO impurities in the N2 or NO2 gas, the dark production of HONO from the flow tube walls or from the production of HONO from the illuminated reactor walls, which may include production from TiO2 aerosols coating the flow tube in the presence of NO2. This background HONO concentration depended on the experimental conditions and on how recently the flow tube and PF-LIF cell had been cleaned to remove any build-up of TiO2 deposits. However, the build-up of TiO2 on the flow tube walls was relatively slow, and back-to-back measurements were made in the presence and absence of aerosols to obtain an accurate background. Additional experiments showed no significant production of HONO on TiO2 aerosol surfaces without the presence of NO2. Even though the aerosol surface area density (∼ 0.02 m2 m−3) was small compared to the surface area density of the reactor walls (35 m2 m−3), very little HONO signal was produced without the presence of aerosols and was always subtracted from the signal in the presence of aerosols. The HONO signal was measured both with the lamp on and off for each aerosol surface area density to investigate the production of HONO from illuminated aerosol surfaces. The HONO signal was averaged over 50 s (average of 500 of the 355 nm photolysis laser pulses with a PRF of 10 Hz). Once aerosols were introduced into the flow tube system, a period of ∼ 30 min was allowed for equilibration and the measured aerosol surface area density to stabilise. In general, the relative humidity of the system was kept constant at RH ∼ 15 % for all experiments investigating HONO production as a function of NO2 mixing ratio over the range 34–400 ppb. In a number of experiments, however, RH was varied in the range ∼ 12 %–37 %.
The mixing ratio of NO2 entering the flow tube was calculated using the concentration of the NO2 in the cylinder and the degree of dilution. The NO2 mixing ratio within the cylinder was determined using a commercial instrument based on UV–Vis absorption spectroscopy (Thermo Fisher 42TL, limit of detection 50 pptv, precision 25 pptv). For each individual experiment, the mixing ratio of NO2 was kept constant (within the range 34–400 ppb), and the aerosol surface area density was varied from zero up to a maximum of 0.04 m2 m−3, in order to obtain the HONO produced from illuminated aerosol surfaces in the flow tube for a given mixing ratio of NO2. As well as subtraction of any background HONO, a correction must be made for any loss of HONO owing to its photolysis occurring within the flow tube.
In order to determine the rate of photolysis of HONO, the rate of photolysis of NO2 was first determined using chemical actinometry, and the known spectral output of the lamp and the literature values of the absorption cross sections and photo-dissociation quantum yields for NO2 and HONO were used to determine the rate of photolysis of HONO. When just flowing NO2 in the flow tube, the loss of NO2 within the illuminated region is determined only by photolysis and is given by
where j(NO2) is the photolysis frequency of NO2 for the lamp used in these experiments. From the measured loss of NO2 in the illuminated region, and with knowledge of the residence time, the photolysis frequency, j(NO2), was determined to be (6.43 ± 0.30) × 10−3 s−1 for the set of experiments using one lamp to illuminate the flow tube. j(NO2) is given by
where λ1 and λ2 represent the range of wavelengths over which the lamp emits, and σλ and ϕλ are the wavelength-dependent absorption cross section and photo-dissociation quantum yield of NO2, respectively, and Fλ is the flux of the lamp at a given wavelength. The flux of the lamp, the spectral intensity of which was measured using a spectral radiometer (Ocean Optics QE65000) as a function of wavelength, is shown in Fig. 3.
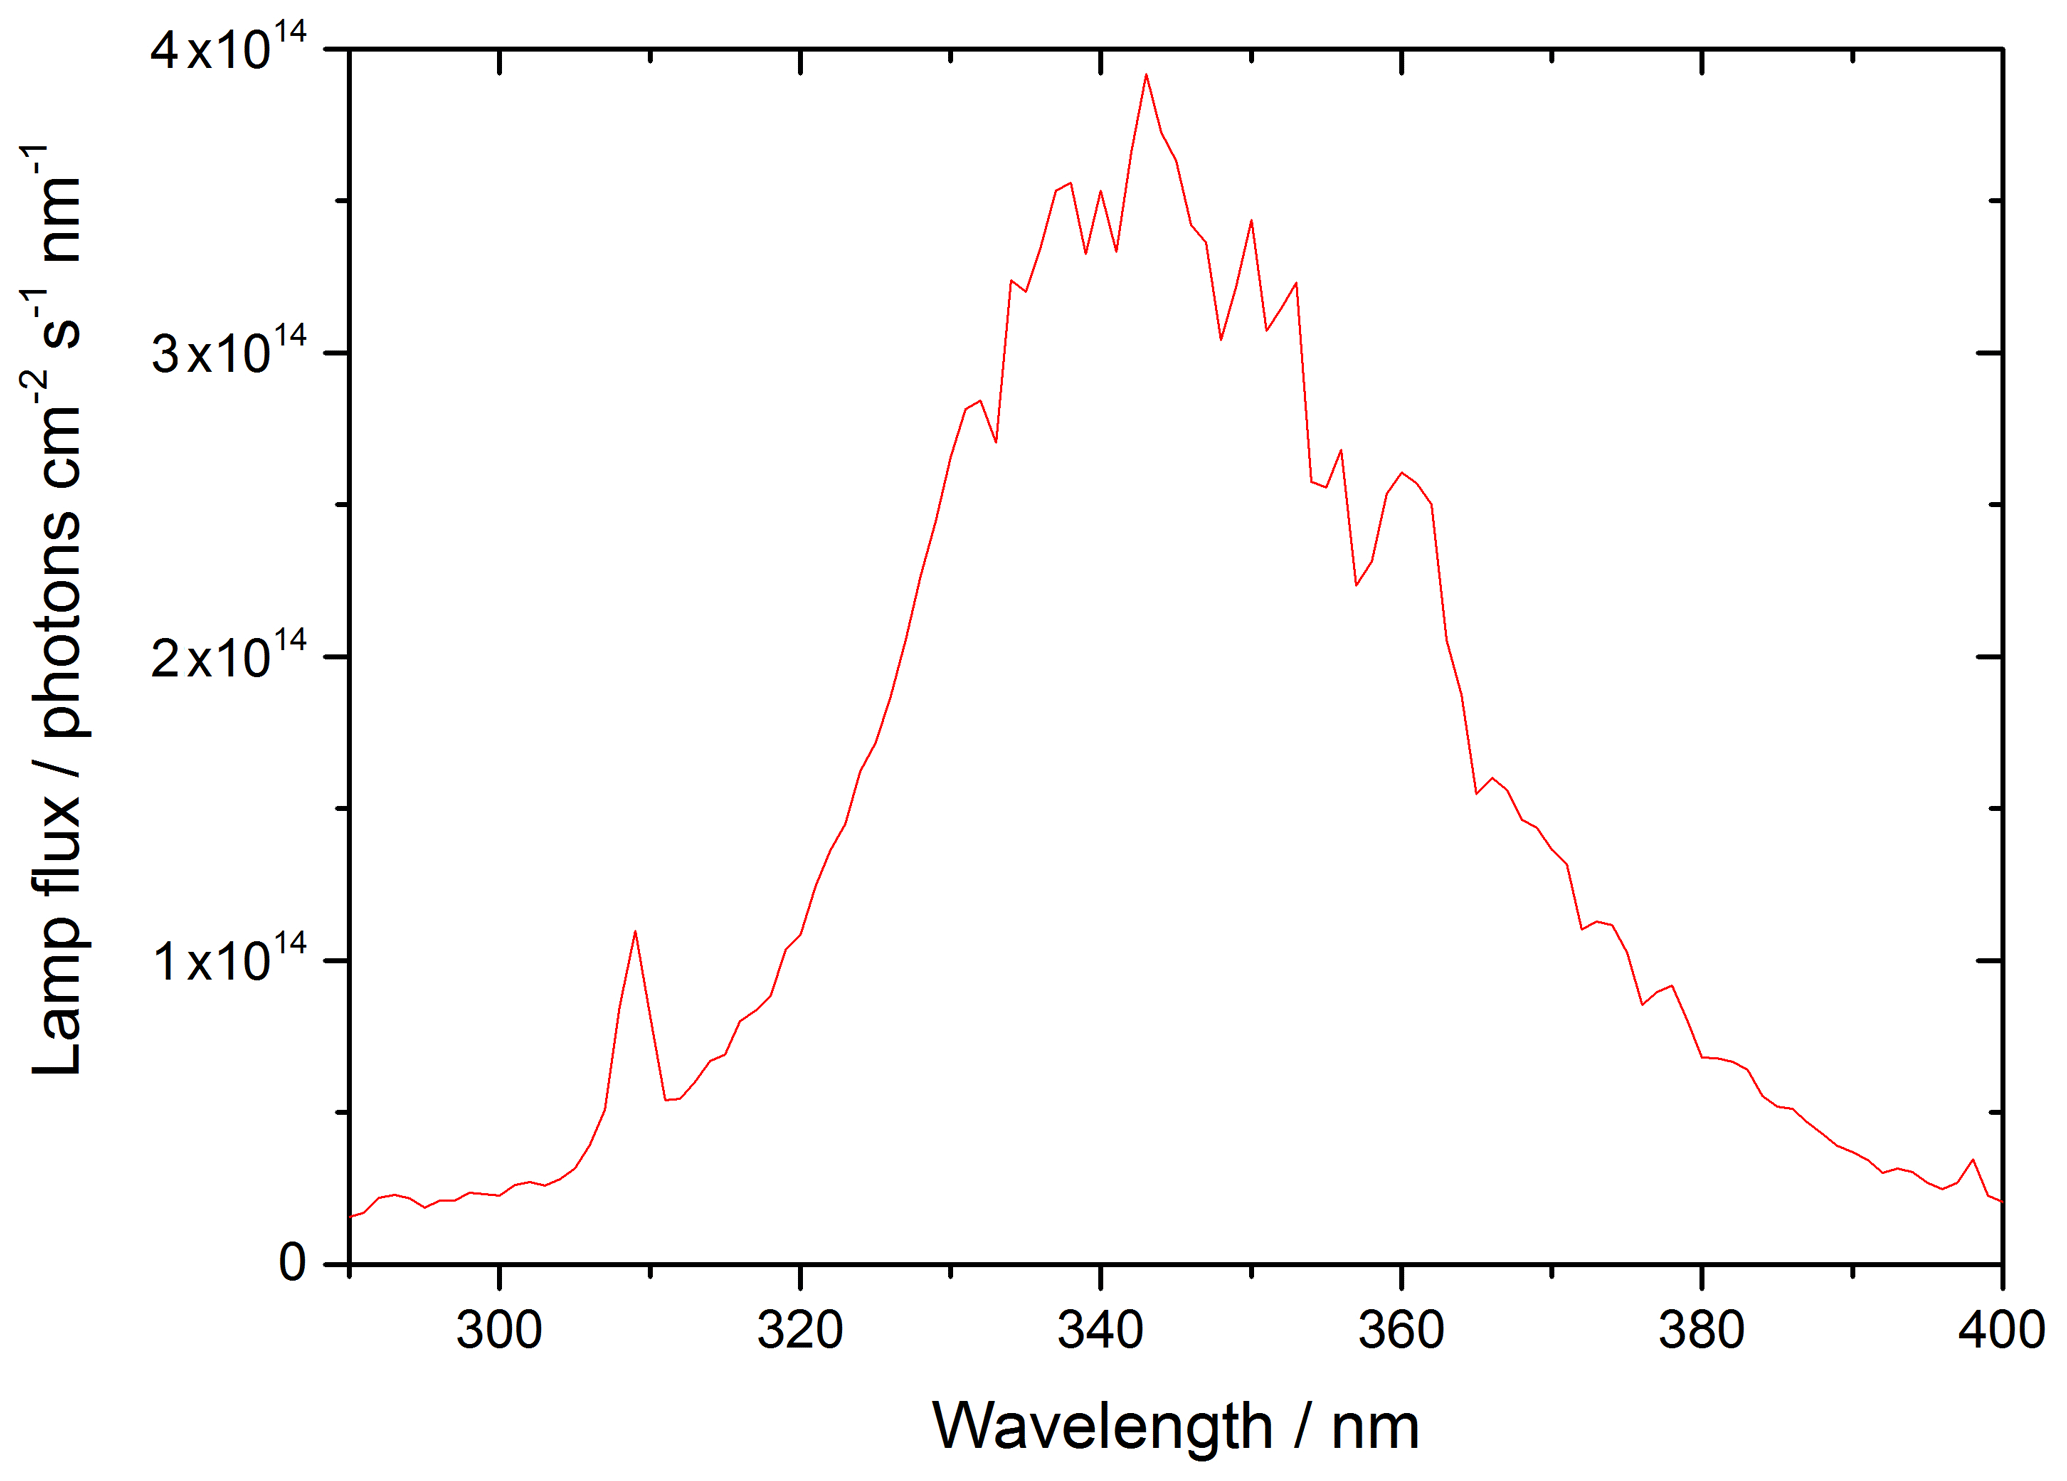
Figure 3UVA emission spectrum for the 15 W bench lamp used in these experiments between 290–400 nm. The integrated photon flux over this wavelength range is (1.63 ± 0.09) × 1016 photons cm−2 s−1 determined from the measured j(NO2) of (6.43 ± 0.30) × 10−3 s−1.
From the measured j(NO2), and with knowledge of σλ and φλ for NO2, the flux of the lamp was determined to be (1.63 ± 0.09) × 1016 photons cm−2 s−1 integrated over the 290–400 nm wavelength range of the lamp. Using this flux, and the known σλ and φλ for HONO over the same wavelength range, j(HONO) was determined to be (1.66 ± 0.10) × 10−3 s−1.
In the presence of aerosols under illuminated conditions, the rate of heterogeneous removal of NO2 at the aerosol surface to generate HONO is given by
where k is the pseudo-first-order rate coefficient for loss of NO2 at the aerosol surface, which leads to the generation of HONO. The postulated mechanism for HONO production from NO2 is discussed in Sect. 3.3.2 below, but for the definition of k it is assumed to be a first-order process for NO2. Integration of Eq. (5) gives
where is the concentration of NO2 at time t, assuming that each NO2 molecule is quantitatively converted to a HONO molecule following surface uptake (see Sect. 3.3.2 for the proposed mechanism), and is the initial concentration of NO2. Hence k can be determined from Eq. (6) using the measurement of the concentration of HONO, [HONO], that has been generated from TiO2 aerosol surfaces for an illumination time of t (and after subtraction of any background HONO produced from other sources and after correction for loss via photolysis; see above) and with knowledge of [NO2]0.
The reactive uptake coefficient of NO2 to generate HONO, , defined as the probability that upon collision of NO2 with the TiO2 aerosol surface a gas-phase HONO molecule is generated, is given by
where ν is the mean thermal velocity of NO2, given by with R, T and M as the gas constant, the absolute temperature and the molar mass of NO2, respectively; SA is the aerosol surface area density (m2 m−3); and k is defined as above. Rearrangement of Eq. (7) gives
Figure 4 shows the variation of k,determined from Eq. (6) above with t=52 s (illumination time in the flow tube), against aerosol surface area density, SA, for [NO2]0=200 ppb and RH = 15 %, from which the gradient using Eq. (8) yields .

Figure 4Pseudo-first-order rate coefficient for HONO production, k (open circles), as a function of aerosol surface area for [NO2] = 200 ppb and RH = 15 ± 1 %, T=293 ± 3 K, and a photolysis time of 52 ± 2 s. The red line is a linear-least-squares fit including 1σ confidence bands (dashed lines) weighted to both x and y errors (1σ), the gradient of which yields (2.17 ± 0.09) × 10−5, with the uncertainty representing (1σ). The non-zero y-axis intercept is due to a background HONO signal owing to the presence of a HONO impurity in the NO2 cylinder, which is not subtracted. The total photon flux of the lamp (see Fig. 2 for its spectral output) = (1.63 ± 0.09) × 1016 photons cm−2 s−1.
The uncertainty in k (∼ 20 %) shown in Fig. 4 and determined by Eq. (6) is mainly controlled by the uncertainty in the HONO concentration (the HONO signal typically varies between repeated runs for a given SA by ∼ 10 % coupled with the 15 % error in the calibration factor), the initial NO2 mixing ratio (10 %), and the photolysis time, t (∼ 3 %). The uncertainty in SA is determined by the uncertainty in the SMPS (15 %). The error in the value of (typically 20 %) is calculated from the 1σ statistical error of the weighted fit shown in Fig. 4. An experiment performed using air yielded an uptake coefficient value within 7 % of the equivalent experiment done in N2, which is well within the experimental error.
2.5 Box model description
A kinetic scheme within the framework of a box model was used together with the differential equation solver Facsimile 4.3.53 (MCPA Software Ltd., 2020) to investigate the mechanism of NO2 adsorption on TiO2 in the presence of light to produce HONO. The models were only semi-explicit, focusing on determining the stoichiometric amounts of NO2 needed to produce a single HONO molecule in the gas phase for comparison with the experimental dependence of HONO production upon NO2 mixing ratio and to provide a predictive framework for parameterising the HONO production rate with NO2 mixing ratio in the atmosphere. Three model scenarios were designed. The simplest model (Model 1) considered only the adsorption of a single molecule of NO2 to the TiO2 surface, the surface conversion to HONO in the presence of light and subsequent desorption of HONO – the latter was assumed to occur rapidly. The two further model scenarios investigated the effect of a 2:1 stoichiometric relationship between the NO2 adsorbed to the surface of TiO2 and the HONO produced, via the formation of an NO2 dimer. Model 2 incorporated an Eley–Rideal mechanism reliant on the adsorption of one NO2 molecule to the surface followed by the subsequent adsorption of a second NO2 molecule directly onto the first (Fig. 5). Model 3, however, features a Langmuir–Hinshelwood mechanism of adsorption in which two NO2 molecules adsorb to the surface and then diffuse to one another before colliding on the surface and forming the cis-ONO-NO2 dimer (Finlayson-Pitts et al., 2003; de Jesus Madeiros and Pimentel, 2011; Liu and Goddard, 2012; Varner et al., 2014). The formation of the asymmetric cis-ONO-NO2 dimer followed by isomerisation to form the asymmetric trans-ONO-NO2 dimer has been suggested to have an enthalpic barrier that is ∼ 170 kJ mol−1 lower than for direct isomerisation to trans-ONO-NO2 from the symmetric N2O4 dimer (Liu and Goddard, 2012). The dimerisation of NO2 and subsequent isomerisation to form trans-ONO-NO2 has been suggested under dark conditions to lead to the formation of both HONO and HNO3 in the presence of water vapour (Finlayson-Pitts et al., 2003; de Jesus Madeiros and Pimentel, 2011; Liu and Goddard, 2012; Varner et al., 2014). Although the interaction of light with TiO2 with the concomitant production of electron–hole pairs (Reaction R1) is central to HONO formation, we do not specify here the exact mechanism by which the electron–hole pairs interact with surface-bound species to generate HONO. We propose that the interaction with light speeds up the autoionisation of trans-ONO-NO2 to form (NO+)(NO), which is represented by Reactions (R13) and (R15) in Model 2 and Model 3 respectively. (NO+)(NO) can then react rapidly with surface-adsorbed water, leading to HONO formation (Varner et al., 2014).
A schematic of the proposed mechanism investigated with Model 2 and Model 3 is shown in Fig. 5 and consists of (i) the adsorption of NO2 onto a surface site, (ii) the conversion of NO2 to form HONO via the formation of an NO2 dimer intermediate on the surface via either a Eley–Rideal or Langmuir–Hinshelwood-type mechanism, (iii) subsequent desorption of HONO from the surface, and finally (iv) competitive removal processes for HONO both on the surface and in the gas phase that are either dependent or independent on the NO2 mixing ratio. The model includes the gas-phase photolysis of NO2 and HONO and the gas-phase reactions of both HONO and NO2 with OH and O(3P) atoms.
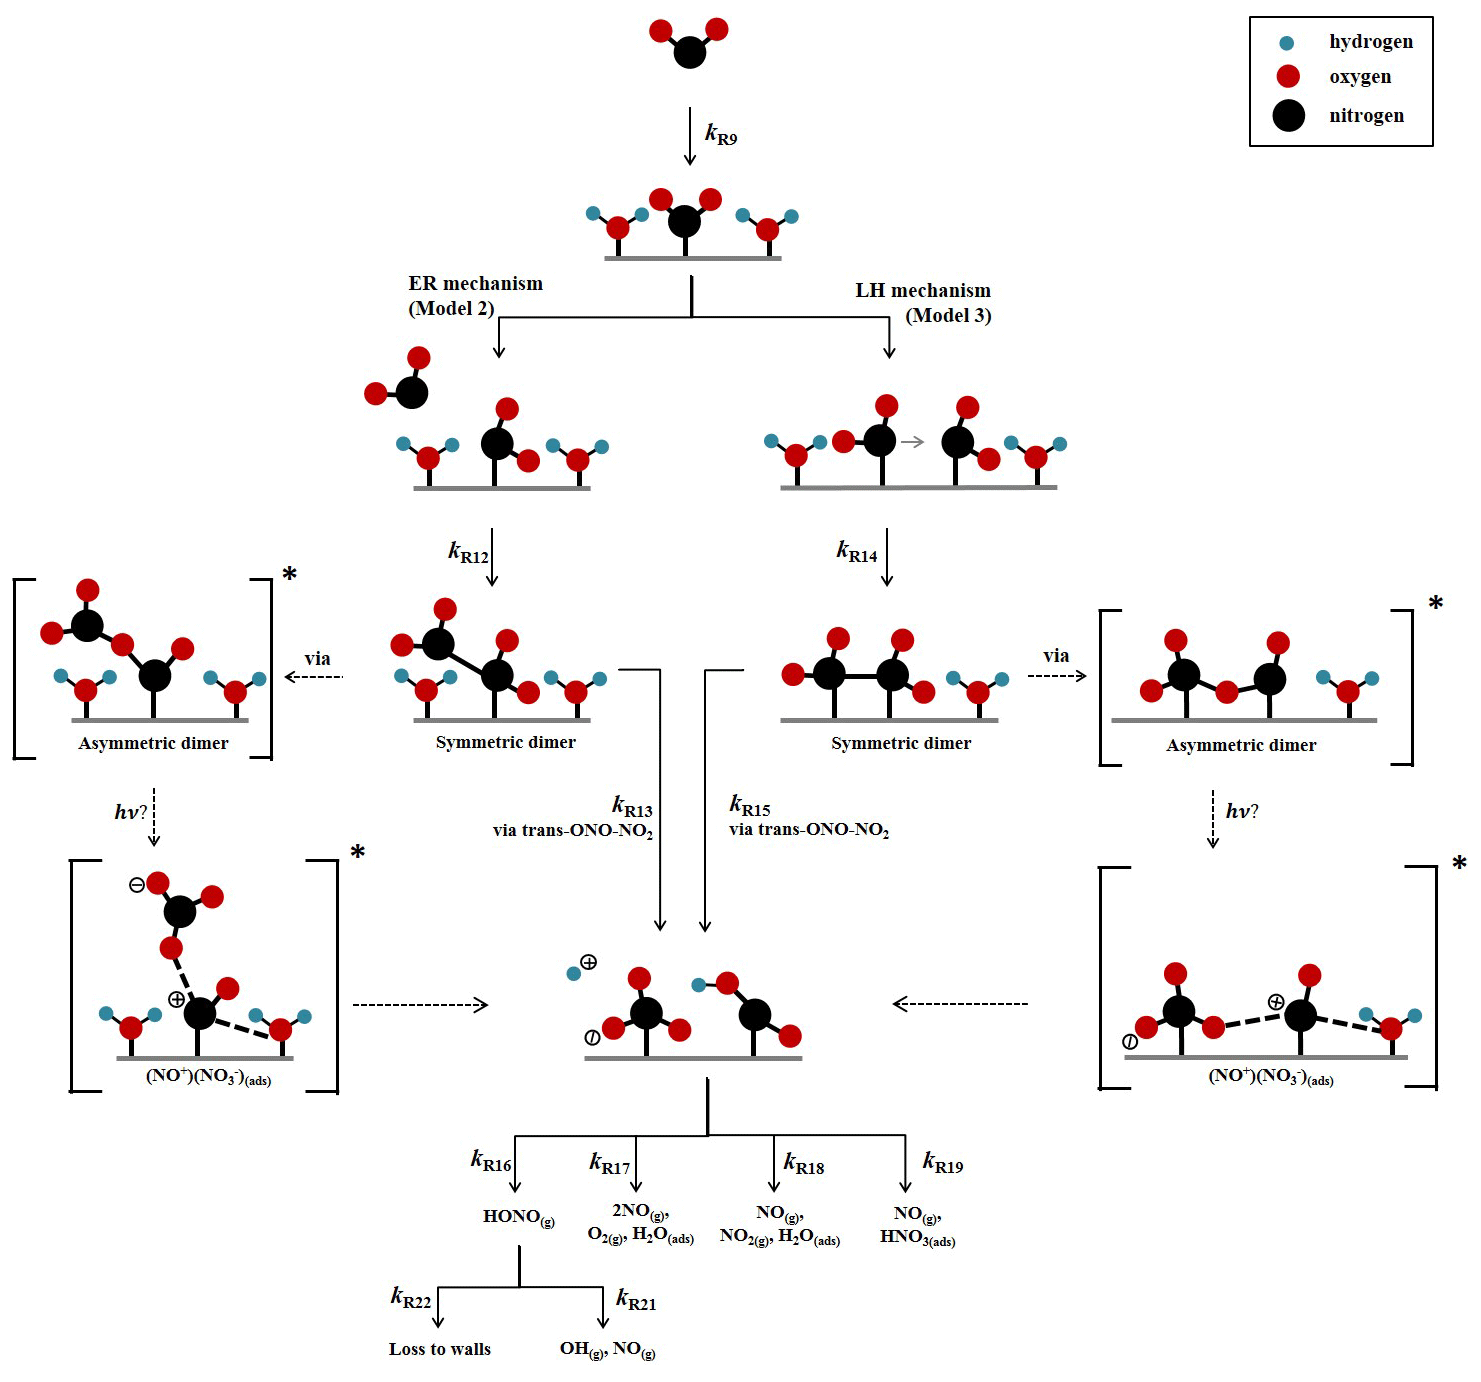
Figure 5Schematic diagram of proposed mechanism of uptake of NO2 on an aerosol surface in the presence of water to form HONO. Both Eley–Rideal, Model 2, and Langmuir–Hinshelwood, Model 3, mechanisms are shown with relevant estimated and calculated rate coefficients used in the models. NO2-dependent and independent loss reactions of HONO are also depicted. Nitrogen is shown in black, oxygen is shown in red and hydrogen is shown in blue. * denotes intermediate steps of the isomerisation of symmetric N2O4 to trans-ONO-NO2, which is then predicted to form HONO.
To the best of our knowledge neither the enthalpy of adsorption of NO2 onto a TiO2 surface nor the bimolecular rate coefficients for the chemical steps on the surface shown in Fig. 5 have been determined. Hence, for each of the steps a rate coefficient (s−1 or cm3 molec.−1 s−1) was assigned, as given in Table 1, and with the exception of the experimentally determined j(NO2) and the calculated j(HONO), and the gas-phase rate coefficients which are known, the rate coefficients were estimated, with the aim of reproducing the experimental NO2 dependence of the HONO production and NO2 reactive uptake coefficient; justification of chosen values is given below.
Table 1Reactions included in the chemical mechanism used to model NO2 uptake onto TiO2 aerosols. All rate coefficients are estimated, as described in Sect. 2.5, with the exception of the NO2 and HONO photolysis rate coefficient and the gas-phase rate coefficient which are known.
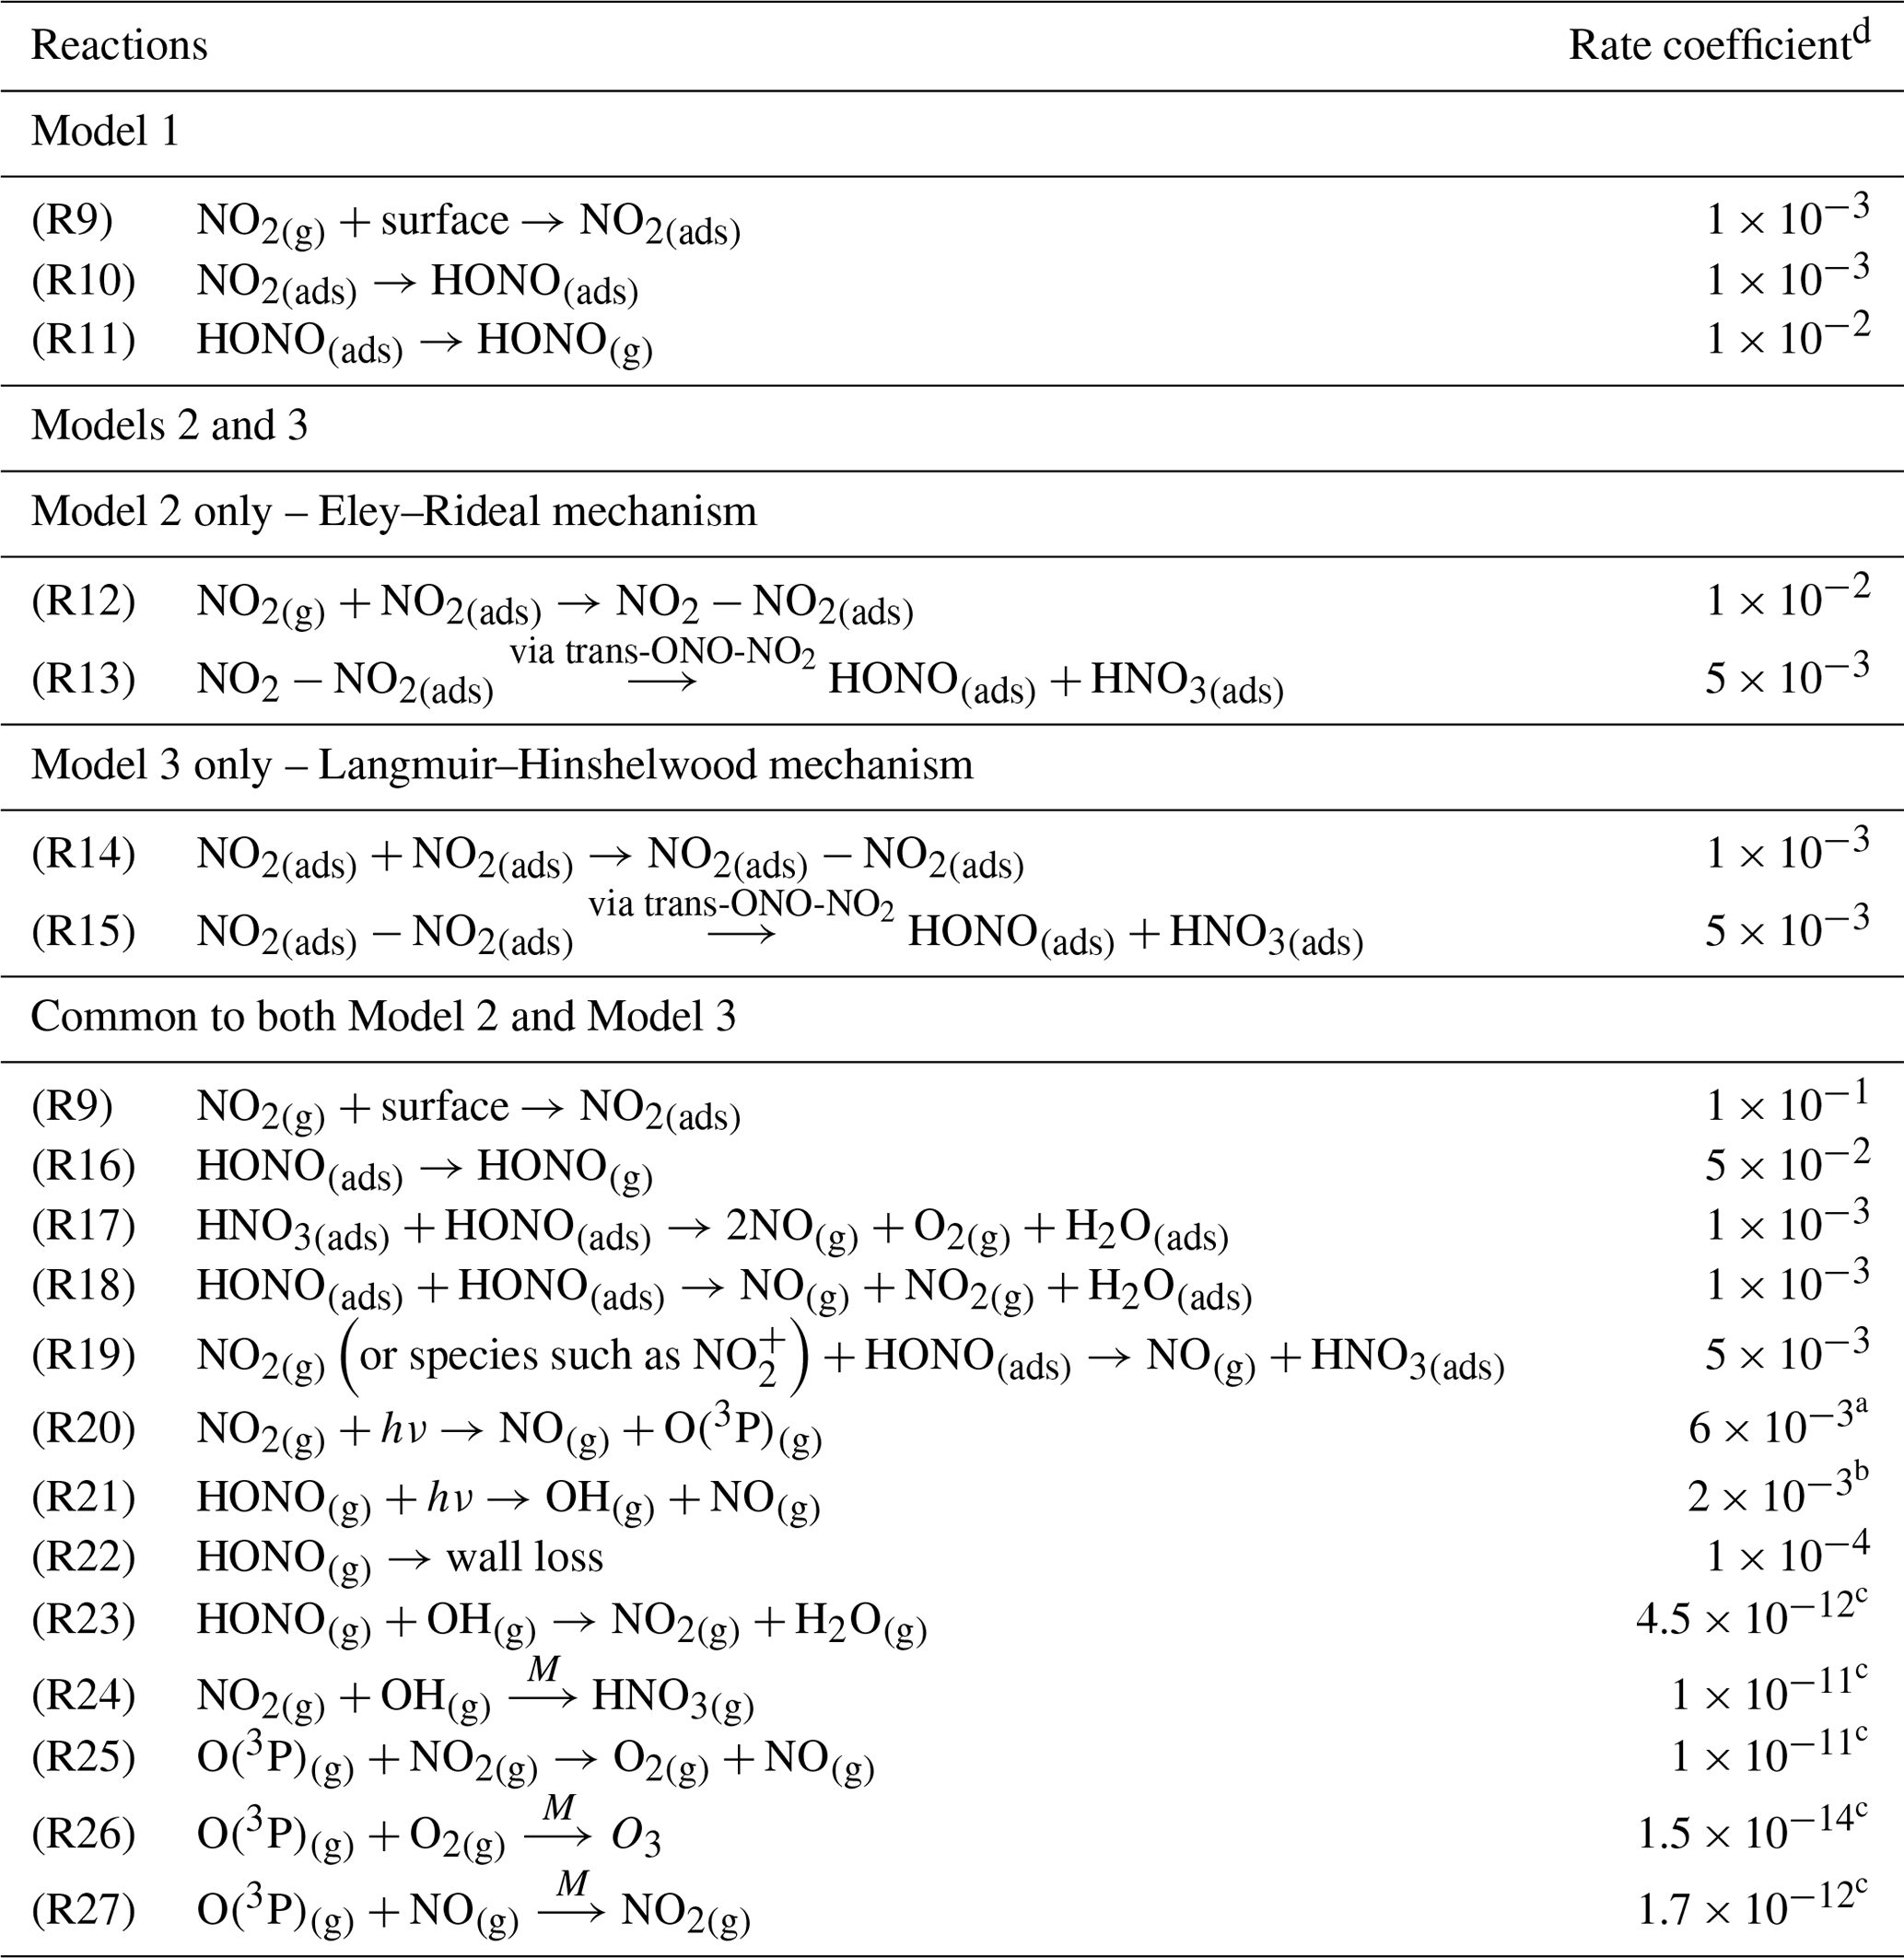
a Measured using chemical actinometry with the knowledge of the experimentally determined spectral output of the lamp and the cross sections and quantum yields of NO2 and HONO; see Sect. 2.4 for more detail. b Calculated using a photon flux of (1.63 ± 0.09) × 1016 photons cm−2 s−1. c Sander et al. (2003). d Rate coefficients are in the units of s−1 for first-order processes or cm3 molec.−1 s−1 for second-order processes. T for all k values is 298 K.
The modelled Gibbs free energy barrier for the isomerisation of N2O4 to form the asymmetric ONO-NO2 isomer (cis or trans conformation not specified) was estimated by Pimental et al. (2007) to be 87 kJ mol−1 with a rate coefficient as large as 2 × 10⁻³ s−1 in the aqueous phase at 298 K, stated in the study to confirm the Finlayson-Pitts model for the hydrolysis of NO2 on surfaces via the asymmetric trans-ONO-NO2 dimer (Finlayson-Pitts et al., 2003). Using this study as a guide, we estimated kR13 and kR15 as 5 × 10⁻³ s−1, slightly larger than that estimated by Pimental et al. (2007) due to the presence of light. A study into the decomposition of HONO on borosilicate glass surfaces suggested a rate coefficient for the loss HONO on the non-conditioned chamber walls to be (1.0 ± 0.2) × 10−4 s−1 increasing to (3.9 ± 1.1) × 10−4 s−1 when HNO3 was present on the walls (Syomin and Finlayson-Pitts, 2003). From this we estimated a light-accelerated loss rate coefficient of 1 × 10⁻³ s−1 for the loss of HONO(ads) by reaction with itself, kR18, and through reaction with HNO3(ads), kR17. Both of these reactions will occur on the surface of the aerosol. We make the assumption that the rate of loss of HONO to the walls of the chamber for this experiment is less than that of the heterogeneous loss reactions on the photocatalytic aerosol surface, leading to a kR22 of 1 × 10⁻⁴ s−1 as reported by Syomin and Finlayson-Pitts (2003). For kR12-kR15, initial values were adopted and were then adjusted to fit the shape of the trend in experimental results of [HONO] and versus [NO2], discussed fully in Sect. 3.3.2. For completeness, gas-phase loss reactions of HONO and NO2 with OH and the reactions of O(3P) with NO, NO2 and O2 were also included in the model, Reactions (R23)–(R27), though their inclusion had no effect on the HONO concentration. The rates of Reactions (R23)–(R27) within the model are much smaller than HONO loss reactions on the surface, Reactions (R17)–(R19), and the photolysis Reaction (R21). For both Model 2 and Model 3, the adsorption of an NO2 molecule to the surface, kR9, was assumed to be rapid and not the rate-determining step. Likewise, the desorption of HONO was also assumed to be rapid – faster than the loss rates of adsorbed HONO but slower than the adsorption of NO2; this was necessary for the model to reproduce the trend in the experimental results of [HONO] versus [NO2], discussed fully in Sect. 3.3.2.
3.1 HONO production from TiO2 aerosol surfaces in the presence of NO2
The production of HONO on TiO2 aerosol surfaces was measured as a function of the initial NO2 mixing ratio. Figure 6 shows the dependence of the HONO concentration, measured at the end of the flow tube, on the initial NO2 mixing ratio for an aerosol surface area of (1.6 ± 0.8) × 10−2 m2 m−3. A sharp increase in HONO production at a low mixing ratio of NO2 was seen, followed by a more gradual reduction in HONO production after a peak production at ∼ 54 ± 5 ppb NO2.
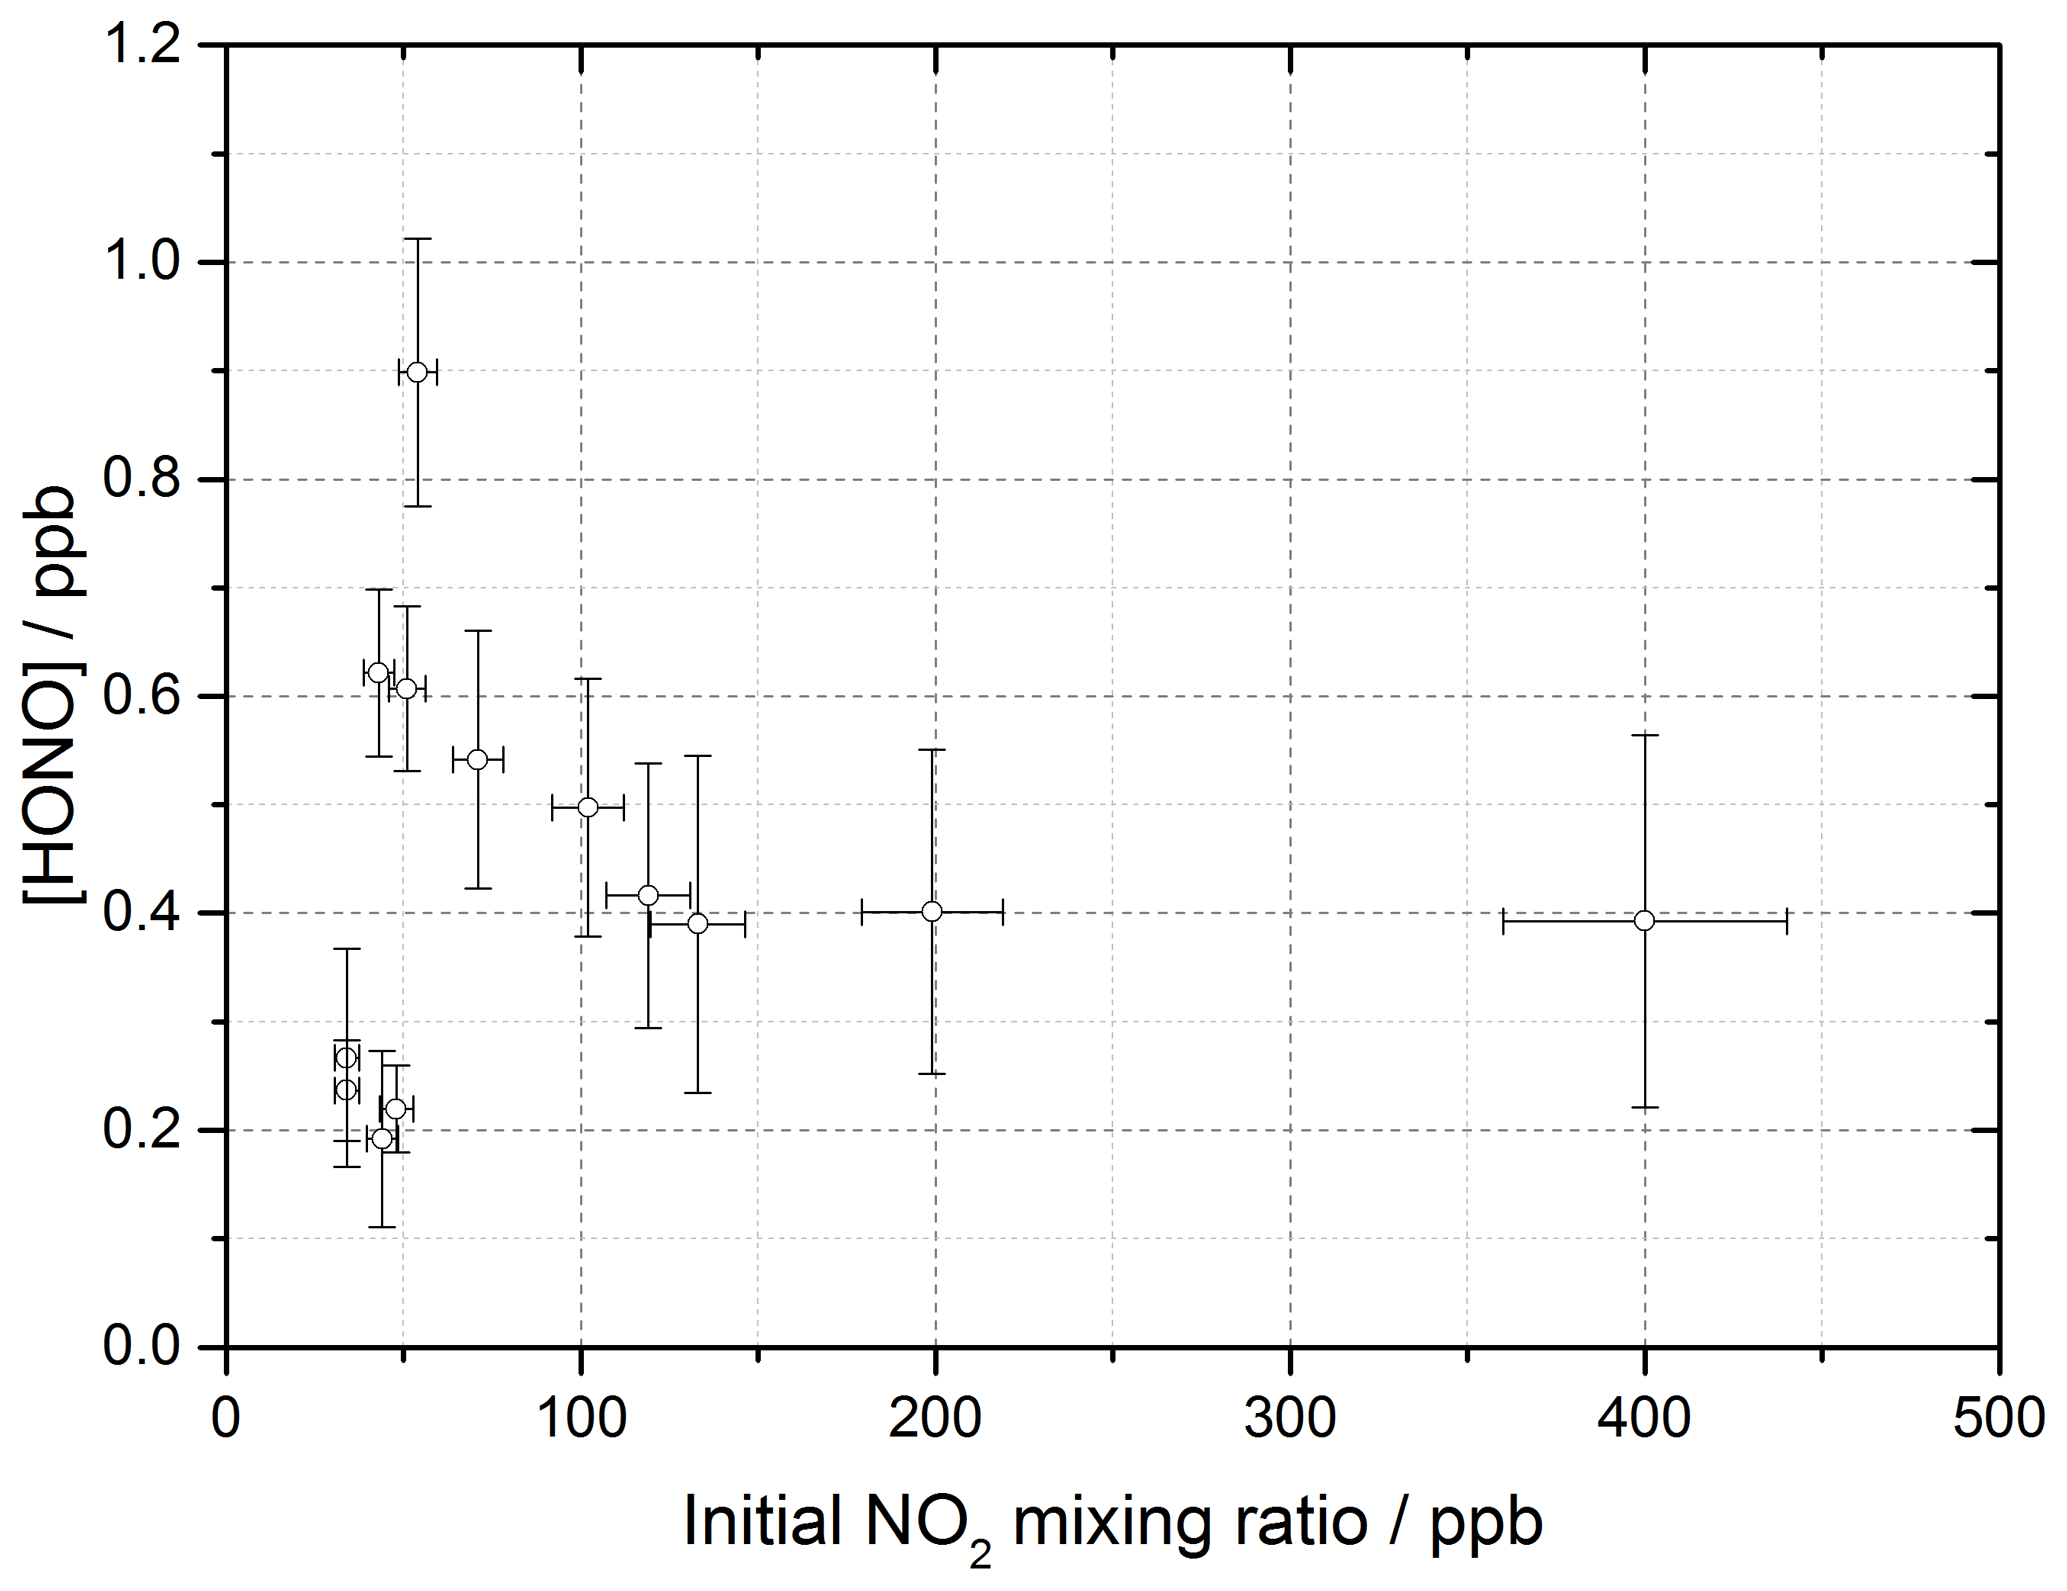
Figure 6HONO concentration measured at the end of the flow tube as a function of the initial NO2 mixing ratio, for the aerosol surface area density of (1.6 ± 0.8) × 10−2 m2 m−3, relative humidity of 15 ± 1 %, photon flux of (1.63 ± 0.09) × 1016 photons cm−2 s−1 (290–400 nm wavelength range), reaction time of 52 seconds and N2 carrier gas. Each point is an average of up to 20 measurements at the same aerosol surface area and mixing ratio of NO2. The highest concentration of HONO measured was 0.90 ± 0.12 ppb at [NO2] = 54 ± 5 ppb. The y error bars represent 1σ, while the x error bars represent the sum in quadrature of the errors in the N2 and NO2 gas flows and the NO2 dilution. The SA varied over the experiments at different NO2 mixing ratios leading to a larger error in the quoted SA.
Figure 7 shows the HONO concentration measured at the end of the flow tube over a range of RH values for a fixed aerosol surface area density of (1.59 ± 0.16 × 10⁻² m2 m−3) and at two NO2 mixing ratios, displaying a peak in HONO production between 25 %–30 % RH. Above ∼ 37 % RH, for experiments including single-component TiO2 aerosols, it was found that significant aerosols were lost from the system before entering the flow tube, speculated to be due to loss to the walls of the Teflon lines. As such the RH dependence was only studied up to 37 % RH; however, a clear drop-off in HONO production was seen for both NO2 mixing ratios studied after ∼ 30 % RH.
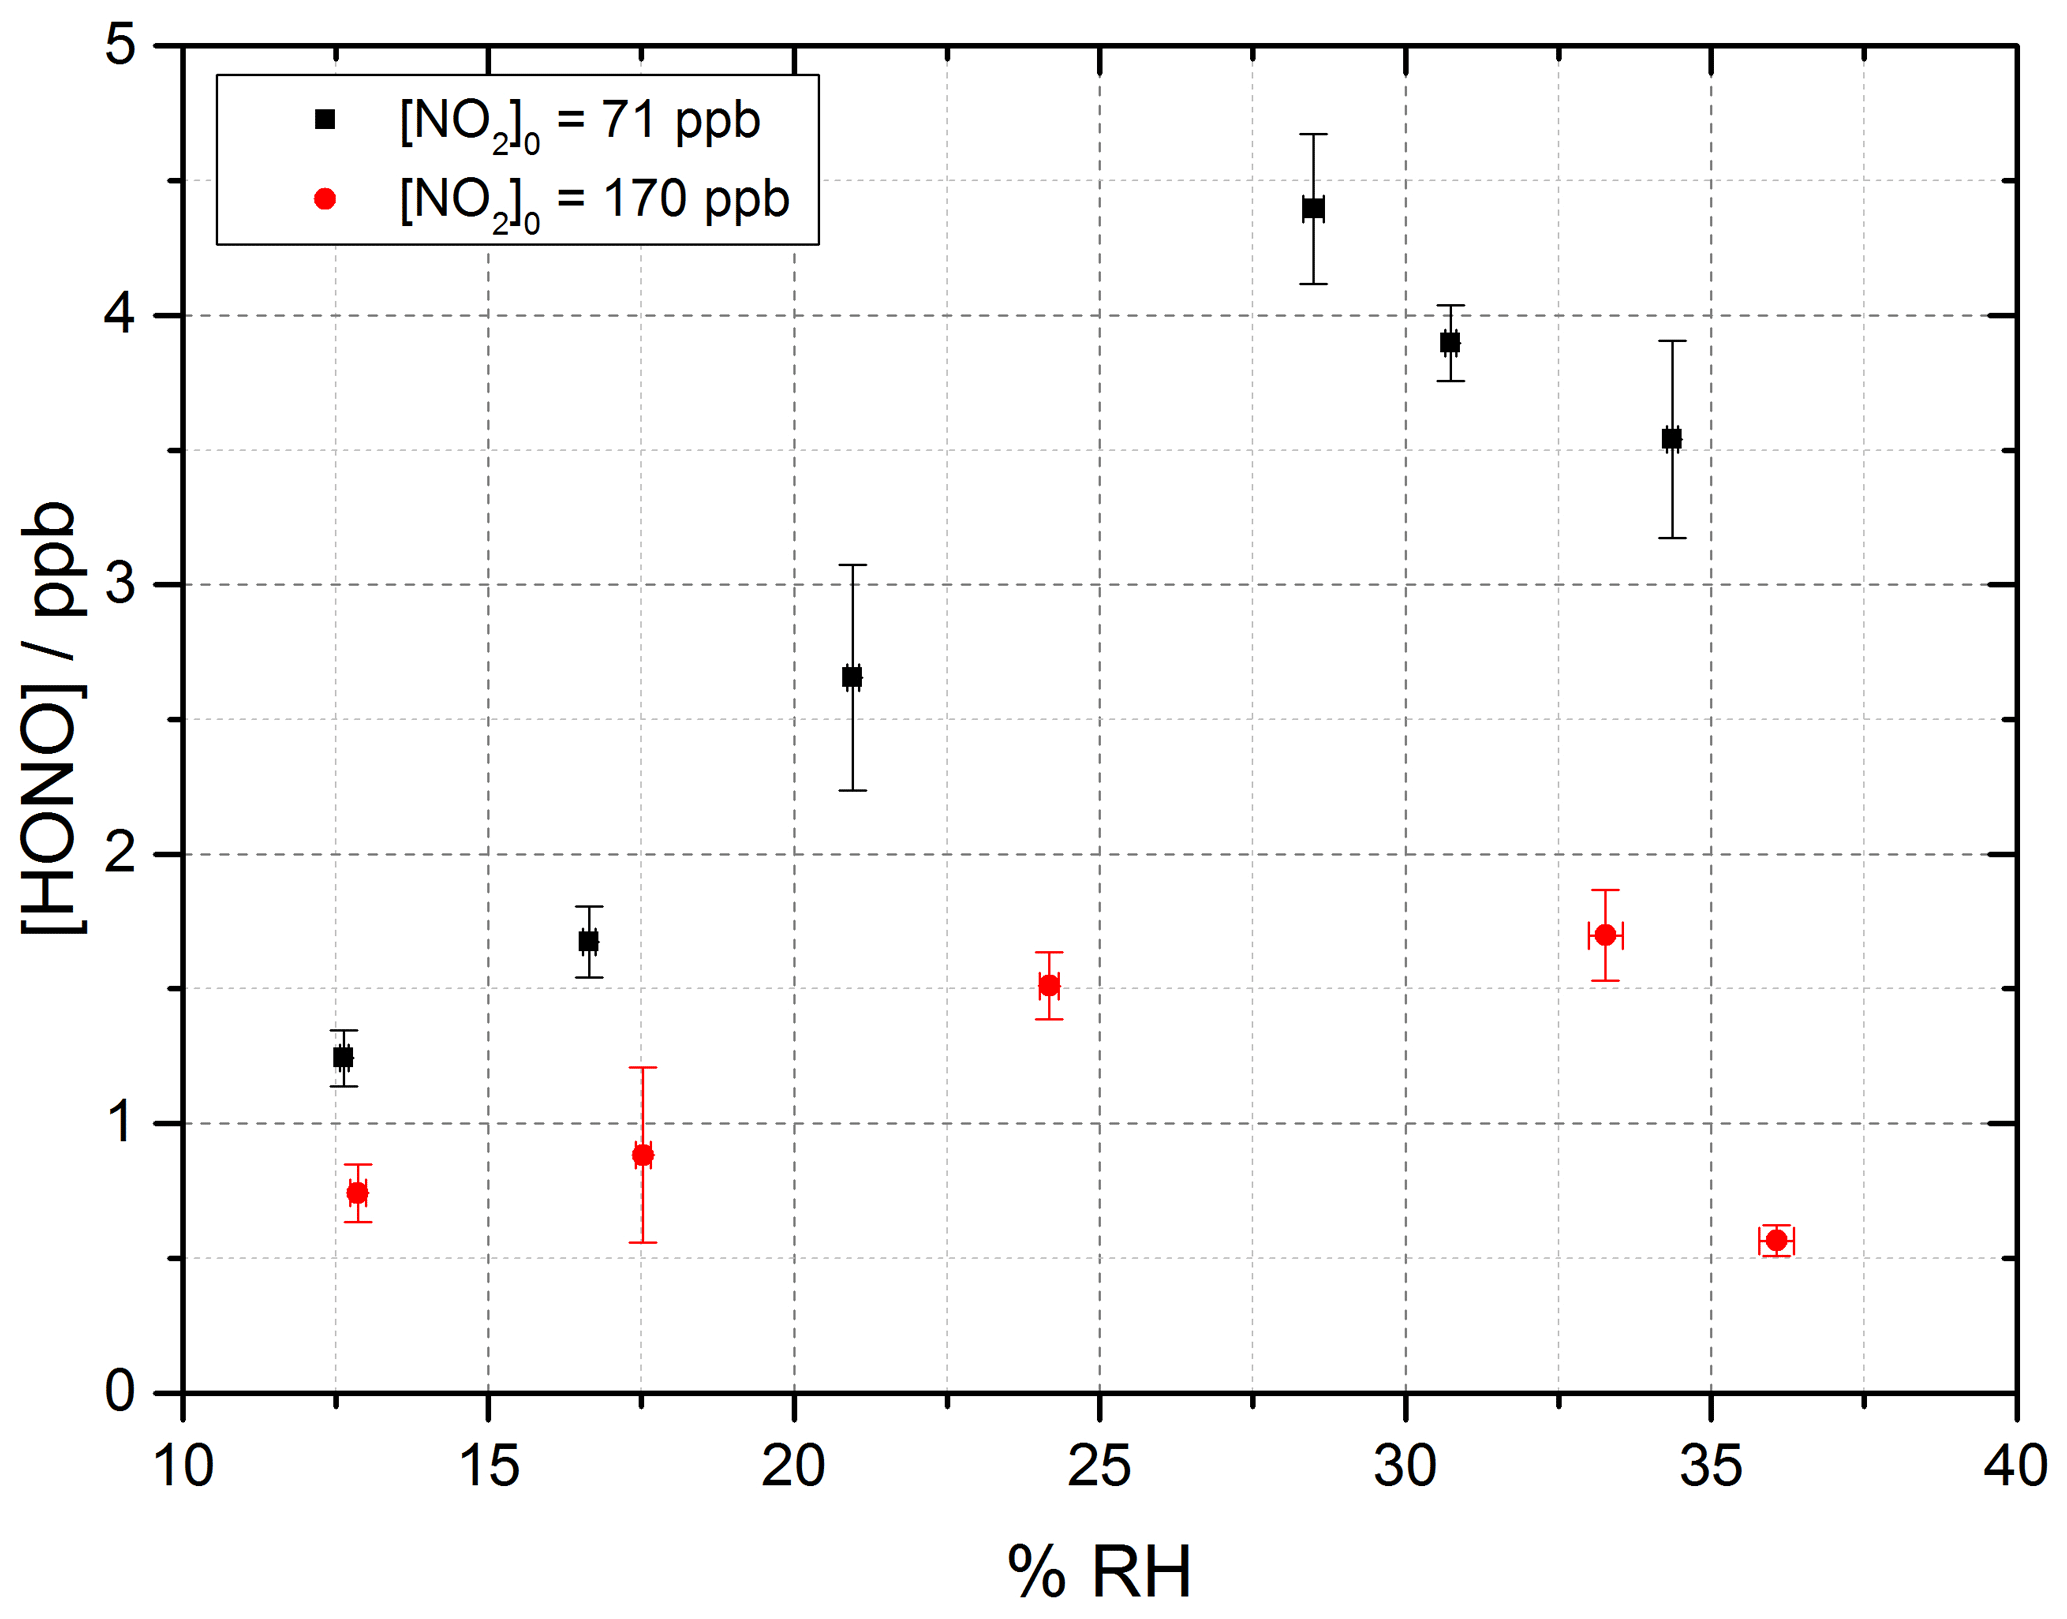
Figure 7RH dependence of HONO production from illuminated TiO2 aerosol surfaces at 295 K in N2 at 71 (black) and 170 (red) ppb initial NO2 mixing ratio. The aerosol surface area density was kept constant at (1.59 ± 0.16) × 10−2 m2 m−3 with a photon flux of (1.63 ± 0.09) × 1016 photons cm−2 s−1 and an illumination time of 52 ± 2 s. The error bars represent 1σ.
A dependence of HONO production upon RH was expected due to the potential role of water as a proton donor in the production mechanism of HONO on TiO2 surfaces (Reactions R2 and R5, as shown in Fig. 5) (Dupart et al., 2014). The fractional surface coverage of water on the TiO2 aerosol core, , at 15 % RH and above was calculated using the parameterisation below, which was determined using transmission IR spectroscopy (Goodman et al., 2001):
where V is the volume of water vapour adsorbed at equilibrium pressure P, Vm is the volume of gas necessary to cover the surface of TiO2 particles with a complete monolayer, P0 is the saturation vapour pressure, c is the temperature-dependent constant related to the enthalpies of adsorption of the first and higher layers (taken as 74.8 kJ mol−1 for TiO2, Goodman et al., 2001), and n is the asymptotic limit of monolayers (eight for TiO2, Goodman et al., 2001) at large values of .
At 15 % RH, a fractional water coverage of 1.09 was calculated to be present on the surface, increasing to 1.50 at 35 % RH. It has been shown in previous work that HONO can be displaced from a surface by water, leading to an increase in gas-phase HONO with RH (Syomin and Finlayson-Pitts, 2003). The increase in HONO with RH to ∼ 25 %–30 % RH could therefore be attributed to both an increase in the concentration of the water reactant leading to more HONO formation and the increase in displacement of HONO from the surface due to preferential adsorption of water. A decrease in HONO production seems to occur above ∼ 30 % RH, which could be due to the increased water adsorption inhibiting either NO2 adsorption or the electron–hole transfer process (Gustafsson et al., 2006). H2O vapour adsorption is likely enhanced by the superhydrophilic properties of TiO2 surfaces under UV radiation, meaning that water monolayers form more quickly on the surface of TiO2 owing to light-induced changes in surface tension (Takeuchi et al., 2005; Gustafsson et al., 2006).
At the higher initial concentration of NO2=170 ppb, the RH dependence showed a similar peak in HONO production between ∼ 25 %–30 % RH, but less HONO was produced overall, as expected from Fig. 6 given the higher NO2. Previous work on the production of HONO from suspended TiO2 aerosols reported a strong RH dependence of the uptake coefficient, γ, of NO2 to form HONO with a peak at ∼ 15 % RH and decreasing at larger RH (Gustafsson et al., 2006). The same trend for the NO2 uptake coefficient was observed by Dupart et al. (2014) on Arizona test dust (ATD) aerosols with a peak in γ at ∼ 25 % RH. This increase in the RH at which the uptake coefficient for NO2 in going from TiO2 to ATD aerosols was ascribed to the lower concentration of TiO2 present in ATD aerosols as opposed to single-component TiO2 aerosols used by Gustafsson et al. (2006) as well as by differences in particle size distribution. Gustafsson et al. (2006) reported a larger aerosol size distribution with a bimodal trend with mode diameters of ∼ 80 and ∼ 350 nm for single-component TiO2 aerosols, whereas Dupart et al. (2014) reported a smaller unimodal aerosol size distribution for ATD aerosols with a mode diameter of ∼ 110 nm. In this work we also see a larger aerosol size distribution, with a lower mode diameter of ∼ 180 nm similar to Dupart et al. (2014) but for pure TiO2 aerosols (aerosol size distribution shown in Fig. 2). Similar to the results of Dupart et al. (2014) we observe a trend inversion in [HONO] vs. RH at higher RH, between 25 %–30 %. An increase in HONO as a function of RH has also been observed on TiO2-containing surfaces (Langridge et al., 2009; Gandolfo et al., 2015; Gandolfo et al., 2017) with a similar profile for the observed RH dependence of HONO being observed by Gandolfo et al. (2015) from photocatalytic paint surfaces with a maximum in HONO mixing ratio found at 30 % RH. In comparison, a study focusing on the products of the uptake of NO2 on TiO2 surfaces showed a maximum in the gas-phase HONO yield at 5 % RH, with the yield of HONO plateauing off with further increase in humidity (Bedjanian and El Zein, 2012).
3.2 Dependence of reactive uptake coefficient on initial NO2 mixing ratio
The reactive uptake coefficient, for NO2→HONO, on TiO2 aerosol particles was determined experimentally for 18 different initial NO2 mixing ratios and is shown in Fig. 8. For each initial NO2 mixing ratio, the gradient of the first-order rate coefficient for HONO production, k, as a function of aerosol surface area density (e.g. Fig. 4) and in conjunction with Eq. (8) was used to obtain . The uptake coefficient initially increases with NO2, reaching a peak at for an initial NO2 mixing ratio of 51±5 ppb, before sharply decreasing as the NO2 mixing ratio continues to increase above this value.
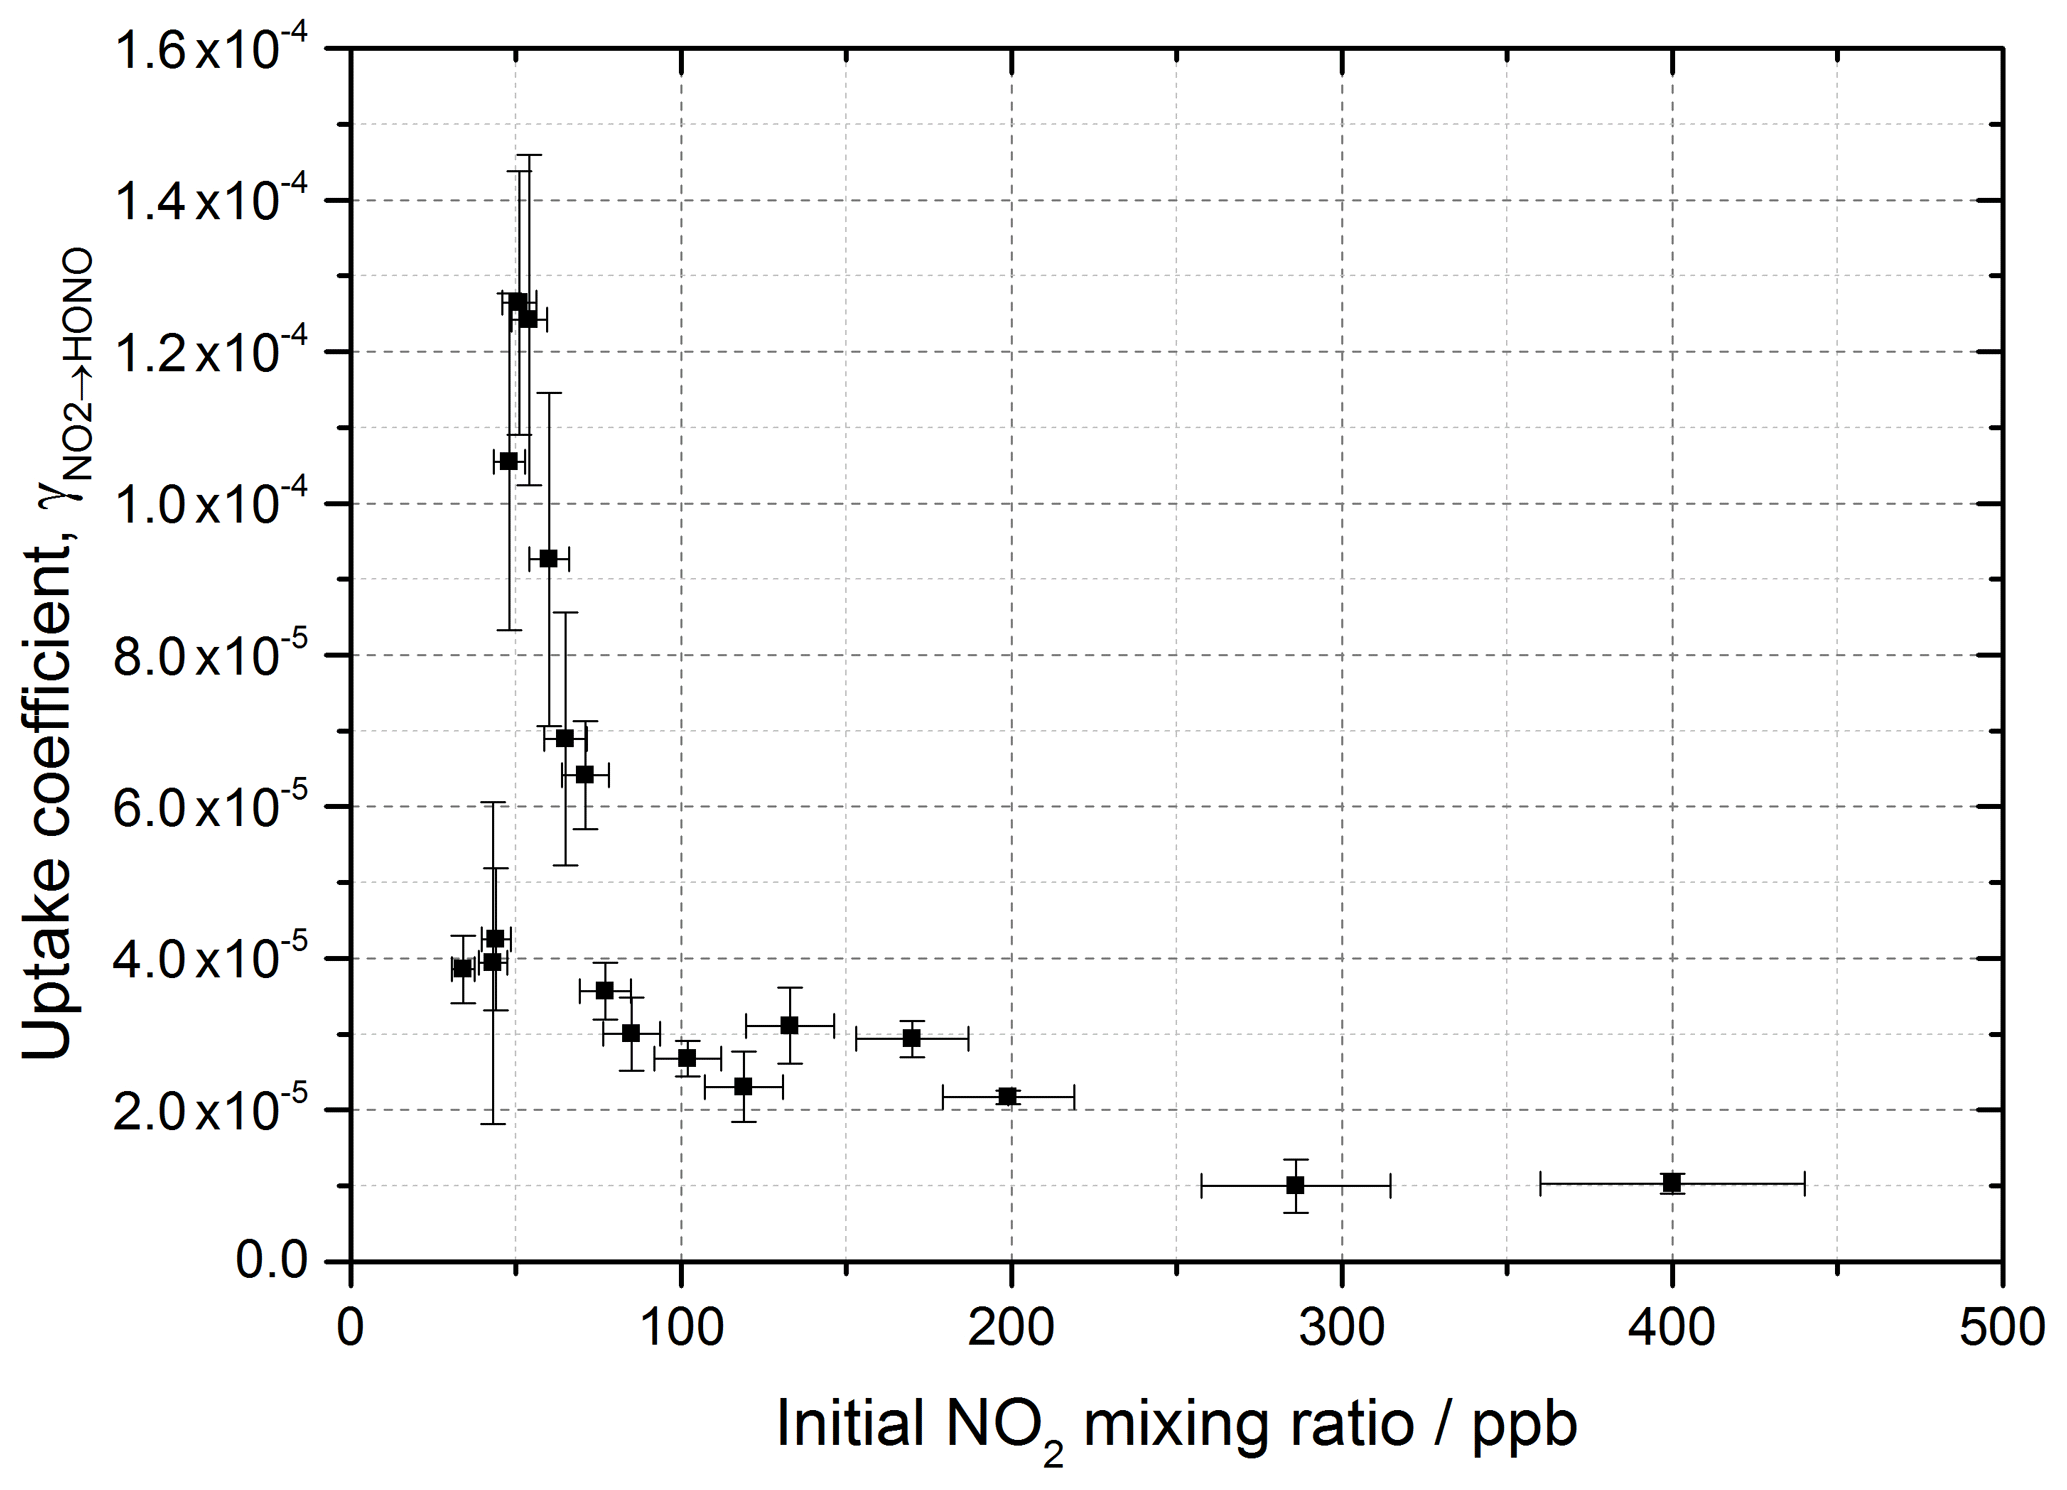
Figure 8Experimental results showing the reactive uptake coefficients of NO2 to form HONO, , onto TiO2 aerosol surfaces as a function of the initial NO2 mixing ratio. All experiments were conducted in N2 at 295 K at 15 ± 1 % RH, a photon flux of (1.63 ± 0.09) × 1016 photons cm−2 s−1 and an illumination time of 52 ± 2 s. was determined for each NO2 mixing ratio from the gradient of the pseudo-first-order rate coefficient for HONO production, k, versus aerosol surface area density varied from 0–0.04 m2 m−3 (e.g. as shown in Fig. 4) and Eq. (8).
The increase in uptake coefficient with NO2 at low NO2 (< 51 ppb) has not been seen previously in studies of HONO production from TiO2-containing aerosols with similar [NO2] ranges (Gustafsson et al., 2006; Ndour et al., 2008; Dupart et al., 2014) or with other aerosol surfaces (Bröske et al., 2003; Stemmler et al., 2007) or TiO2 surfaces (El Zein and Bedjanian, 2012b). It is worth noting that several of these studies reported the overall uptake of NO2 onto aerosol surfaces and not specifically the uptake to form HONO, although HONO was indirectly measured in all studies noted here (Gustafsson et al., 2006; Ndour et al., 2008; Dupart et al., 2014). For single-component TiO2 aerosols, Gustafsson et al. (2006) reported a uptake coefficient, , of 9.6 × 10⁻⁴ at 15 % RH and 100 ppb NO2. Taking into account the HONO yield of 0.75 given by Gustafsson et al. (2006), an estimated is determined and can be compared to the value observed in this work at 15 % RH and 100 ppb NO2, ( (2.68 ± 0.23) × 10−5). The we determine is 27 times smaller than reported by Gustafsson et al. (2006). This difference is mostly due to the lower experimental photon flux in our setup, ∼ 19 times less at nm owing to the use of one 15 W UV lamp to irradiate the flow tube (Boustead, 2019) compared to Gustafsson et al. (2006), who utilised four 18 W UV lamps.
The origins of the increase in , together with reaching a maximum, and the subsequent decrease at larger NO2 mixing ratios were investigated using the kinetic box model and postulated mechanism for HONO production described in Sect. 2.5. The aim was to compare the observed production of HONO and with the modelled values, as a function of NO2 mixing ratio. The skill of the model to reproduce the observed behaviour enables a validation of the postulated mechanism for HONO production, and variation of the kinetic parameters enables the controlling influence of different steps in the mechanism on HONO production to be evaluated.
3.3 Modelling the HONO production mechanism on illuminated TiO2 aerosol surfaces
The HONO production on illuminated TiO2 aerosol surfaces was investigated for each of the mechanisms outlined in Table 1.
3.3.1 Model 1
Model 1 (see Table 1 and Fig. 5), which contains the simplest mechanism, was designed to reproduce the decreasing value of the NO2 uptake coefficient to form HONO, , with increasing NO2 and also the plateauing at higher NO2 mixing ratios caused by NO2 reaching a maximum surface coverage, as seen by Stemmler et al. (2007). A decrease in the uptake coefficient of NO2, onto dust aerosol surfaces was also seen in studies where the formation of HONO from NO2 uptake was not directly studied (Ndour et al., 2008; Dupart et al., 2014). The mechanism for Model 1 which is given in Table 1 describes the adsorption of one NO2 molecule to a surface site which then undergoes the reaction which forms HONO, followed by desorption of HONO to the gas phase, Reactions (R9)–(R11). Any representation of the specific chemical processes which convert NO2 to HONO on the surface following the initial photo-production of electron–hole pairs in the TiO2 structure (Reaction R2) was not included here as the primary focus was to produce the relationship between and the NO2 mixing ratio. Gustafsson et al. (2006) reported that the measured rate of photo-induced HONO production is 75 % that of the rate of NO2 removal, whereas the dark disproportionation reaction (Reaction R28) would predict a 50 % yield, and hence that the HONO observed in their studies is not simply a photo-enhancement of
Gustafsson et al. (2006) suggests that an oxidant on the surface is produced following the creation of the electron–hole pair (OH is generated in Reaction R2) and suggests H2O2 as a possibility, which is consistent with the observation of OH and HO2 radicals produced from the surface of illuminated TiO2 aerosols (Moon et al., 2019). For Model 1, outputs for the predicted concentration of HONO and the reactive uptake coefficient, , as a function of initial NO2 mixing ratio are shown in Fig. 9.
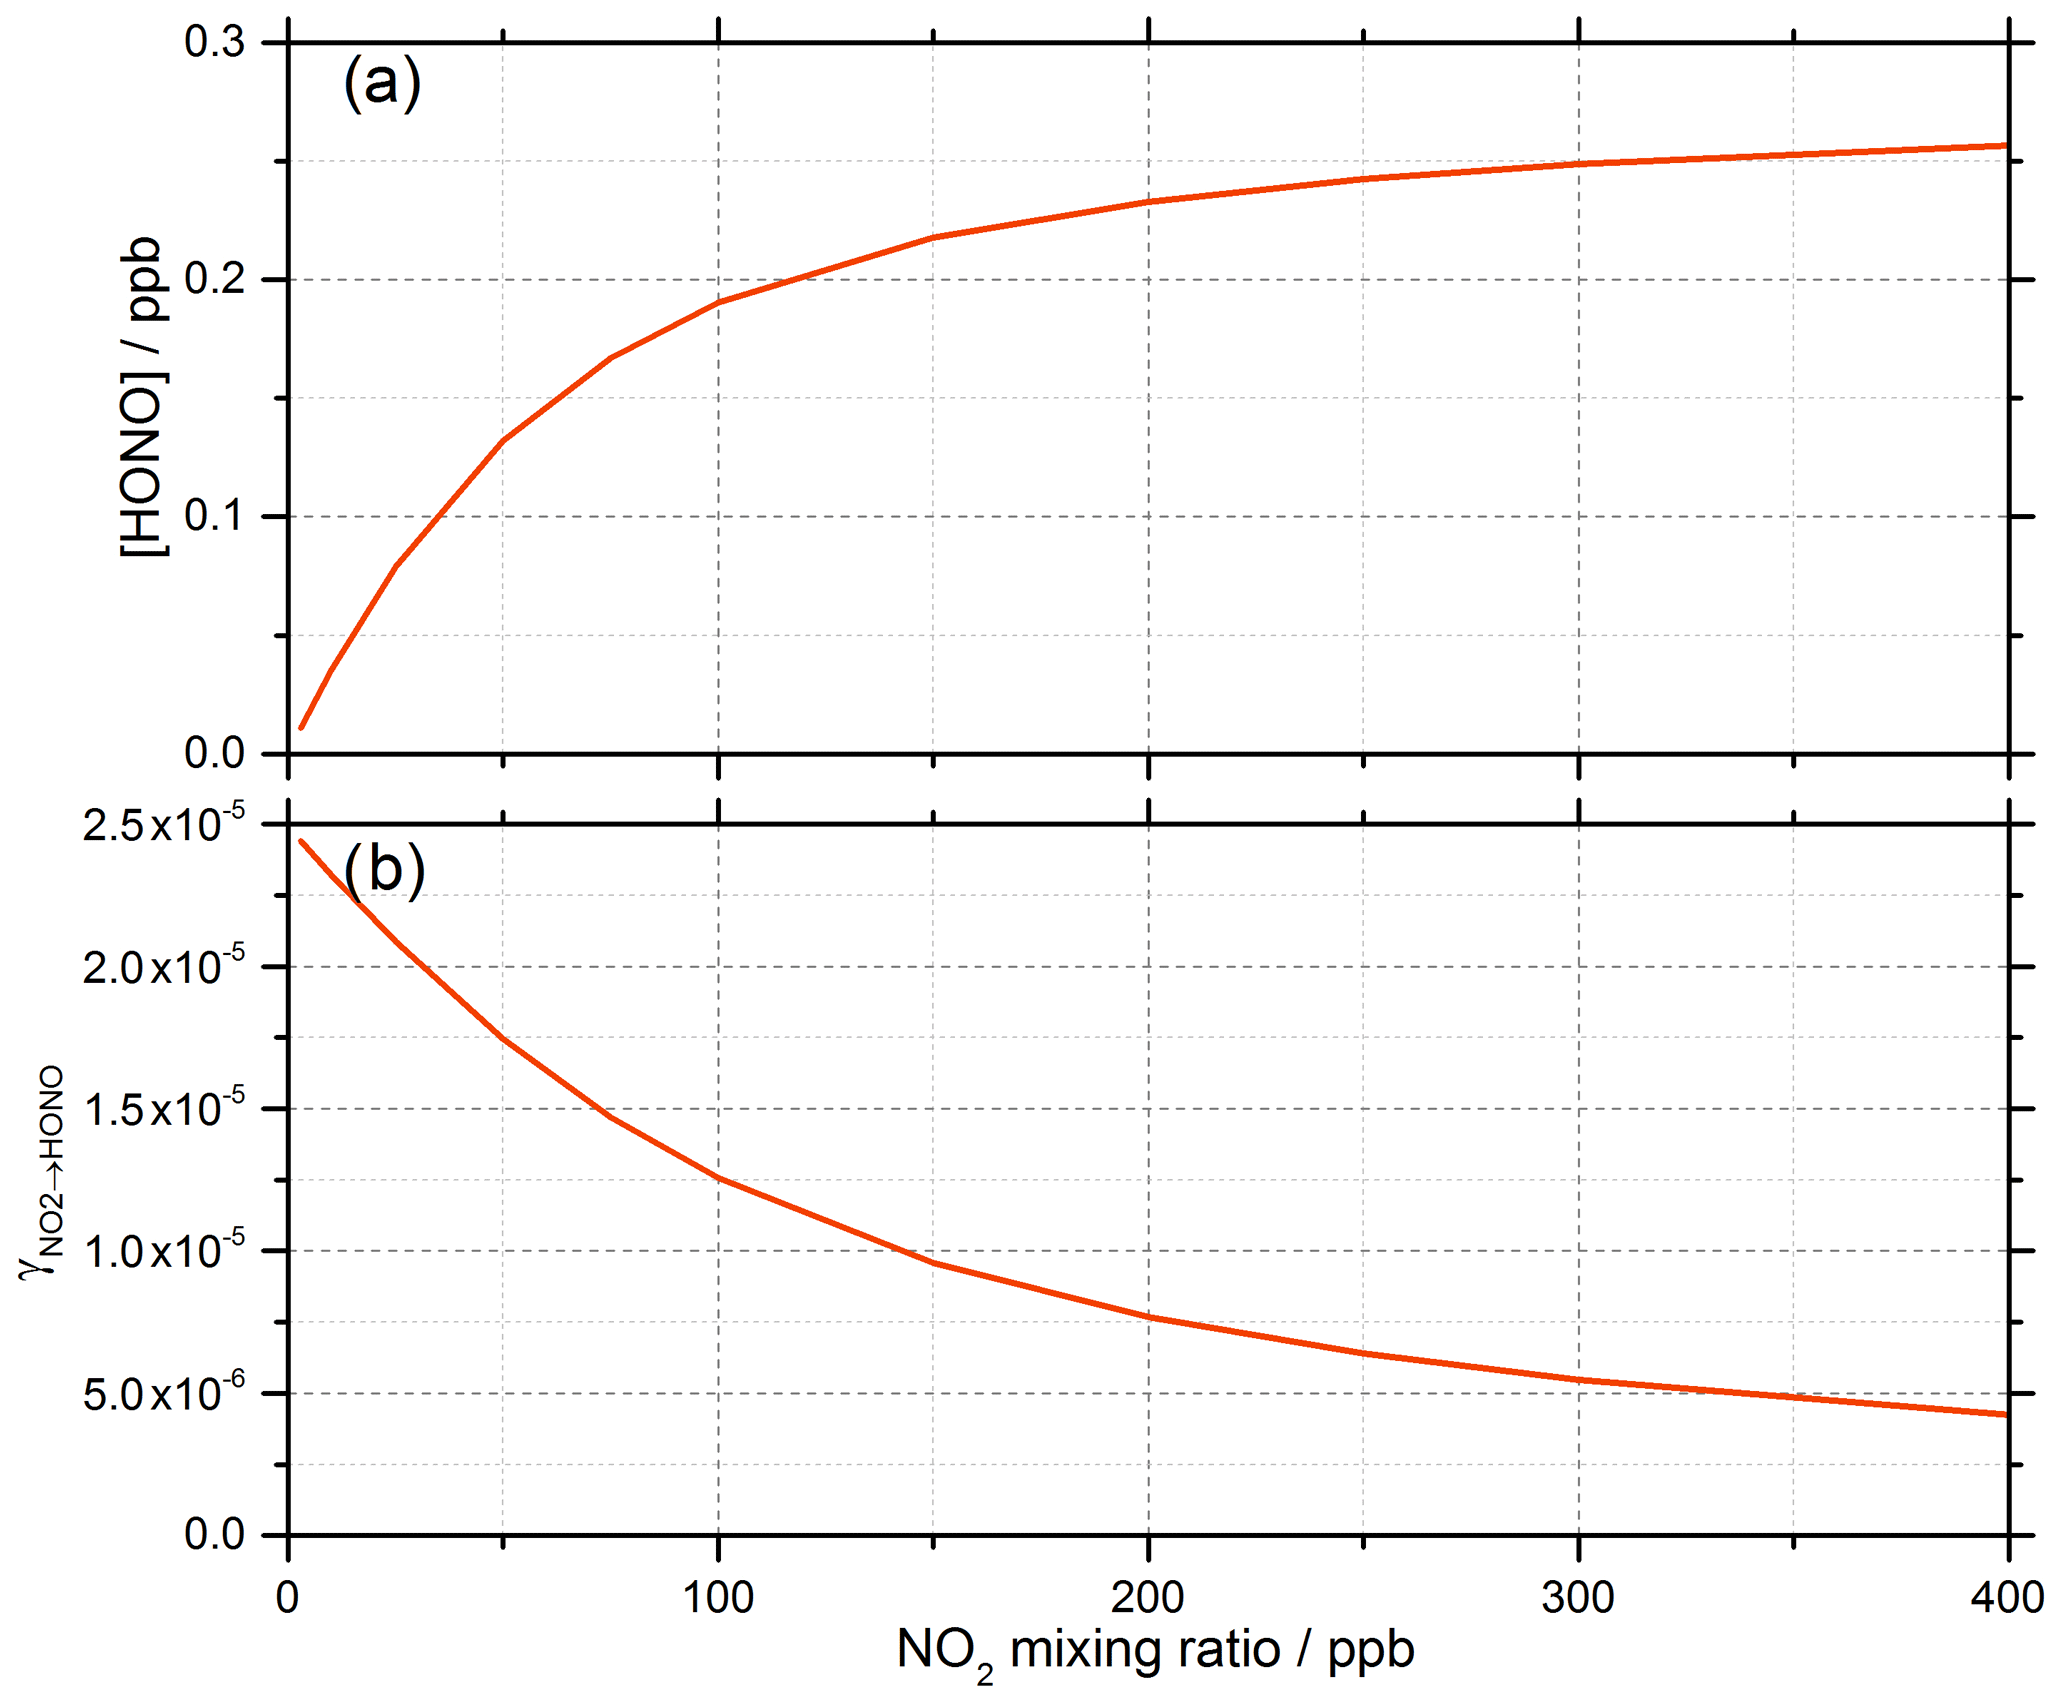
Figure 9Model 1 calculations for (a) the concentration of HONO and (b) the reactive uptake coefficient to form HONO, , as a function of NO2 mixing ratio for a model run time of 52 s. The estimated rate coefficients used in this model are shown in Table 1.
For a run time of 52 s, equal to that of the experimental illumination time, Model 1 predicts an increase in HONO production with increasing NO2 mixing ratio until the HONO concentration begins to plateau, reaching ∼ 0.25 ppb at [NO2] = 400 ppb, presumably owing to saturation on active aerosol surface sites by NO2. This leads to the modelled reactive uptake coefficient, , monotonically decreasing with increasing NO2 mixing ratio – a variation in NO2 uptake coefficient similar to that seen in previous photo-enhanced NO2 aerosol uptake studies (Bröske et al., 2003; Stemmler et al., 2007; Ndour et al., 2008; Dupart et al., 2014). However, the model predictions for Model 1 do not reproduce the experimental variations shown in Figs. 6 and 8, in which there is an observed initial rise and then a fall in both the HONO concentration and with increasing NO2 mixing ratio. Hence, additional processes were considered in the model in order to try to reproduce this behaviour.
3.3.2 Model 2 and Model 3 – investigating the role of NO2 dimerisation for the surface formation of HONO, and including additional surface losses of HONO
As the experimental increases with NO2 at low NO2 (Fig. 8), we postulate in Model 2 and Model 3 that the production of HONO under illuminated conditions is not fully first order in NO2 and requires more than one NO2 molecule to form HONO, consistent with the formation of the symmetric NO2 dimer (N2O4) followed by isomerisation on the surface to form the asymmetric trans-ONO-NO2 dimer, which has been suggested to be more reactive with water than the symmetric N2O4 dimer (Finlayson-Pitts et al., 2003; Ramazan et al., 2004; Ramazan et al., 2006; Liu and Goddard, 2012) due to the autoionisation to form (NO+)(NO), which we propose is accelerated by the presence of light, the full mechanism for which is shown in Fig. 5. A recent rotational spectroscopy study found that the trans-ONO-NO2 was better described as the ion pair (NO+)(NO) (Seifert et al., 2017). Reaction of the (NO+)(NO) ion pair with surface-adsorbed water can then lead to the formation of HONO and HNO3, the feasibility of which is supported by molecular dynamics simulation studies (Varner et al., 2014). While the symmetric N2O4 dimer is favoured as it is the most stable conformer, the asymmetric forms have been experimentally observed in several studies (Fateley et al., 1959; Givan and Loewenschuss, 1989b, a, 1991; Pinnick et al., 1992; Forney et al., 1993; Wang and Koel, 1998, 1999; Beckers et al., 2010). A more recent ab initio study of NO2 adsorption at the air–water interface suggested an orientational preference of NO2 on the surface, with both oxygen atoms facing away from the interface, which may imply that the asymmetric dimer ONO-NO2 can form directly, meaning the high barrier between the symmetric and asymmetric forms does not need to be overcome (Murdachaew et al., 2013).
The energy barrier to isomerisation of symmetric N2O4 in the gas phase may be reduced due to the interaction with water adsorbed on surfaces. We therefore rule out the dimer in the gas phase adsorbing onto the surface first and then reacting to form HONO (Varner et al., 2014). An interesting question is whether the first NO2 molecule adsorbed to the surface dimerises via the addition of a gaseous NO2 via an Eley–Rideal (ER) type process or whether a Langmuir–Hinshelwood (LH) type mechanism is operating in which both NO2 molecules are first adsorbed and then diffuse together on the surface forming N2O4. Both ER and LH mechanisms to form the NO2 dimer have been included in the model, denoted as Model 2 and Model 3, respectively. The outputs for Model 2 and Model 3 (see Table 1 for details of the processes included) for the HONO concentration and as a function of NO2 are shown in Fig. 10 together with the experimental data. The stoichiometric relationship of the requirement of two NO2 molecules forming HONO on the surface was key to reproducing the experimental trend of first an increase and then a decrease in both the HONO concentration and the reactive uptake coefficient with the initial NO2 mixing ratio.
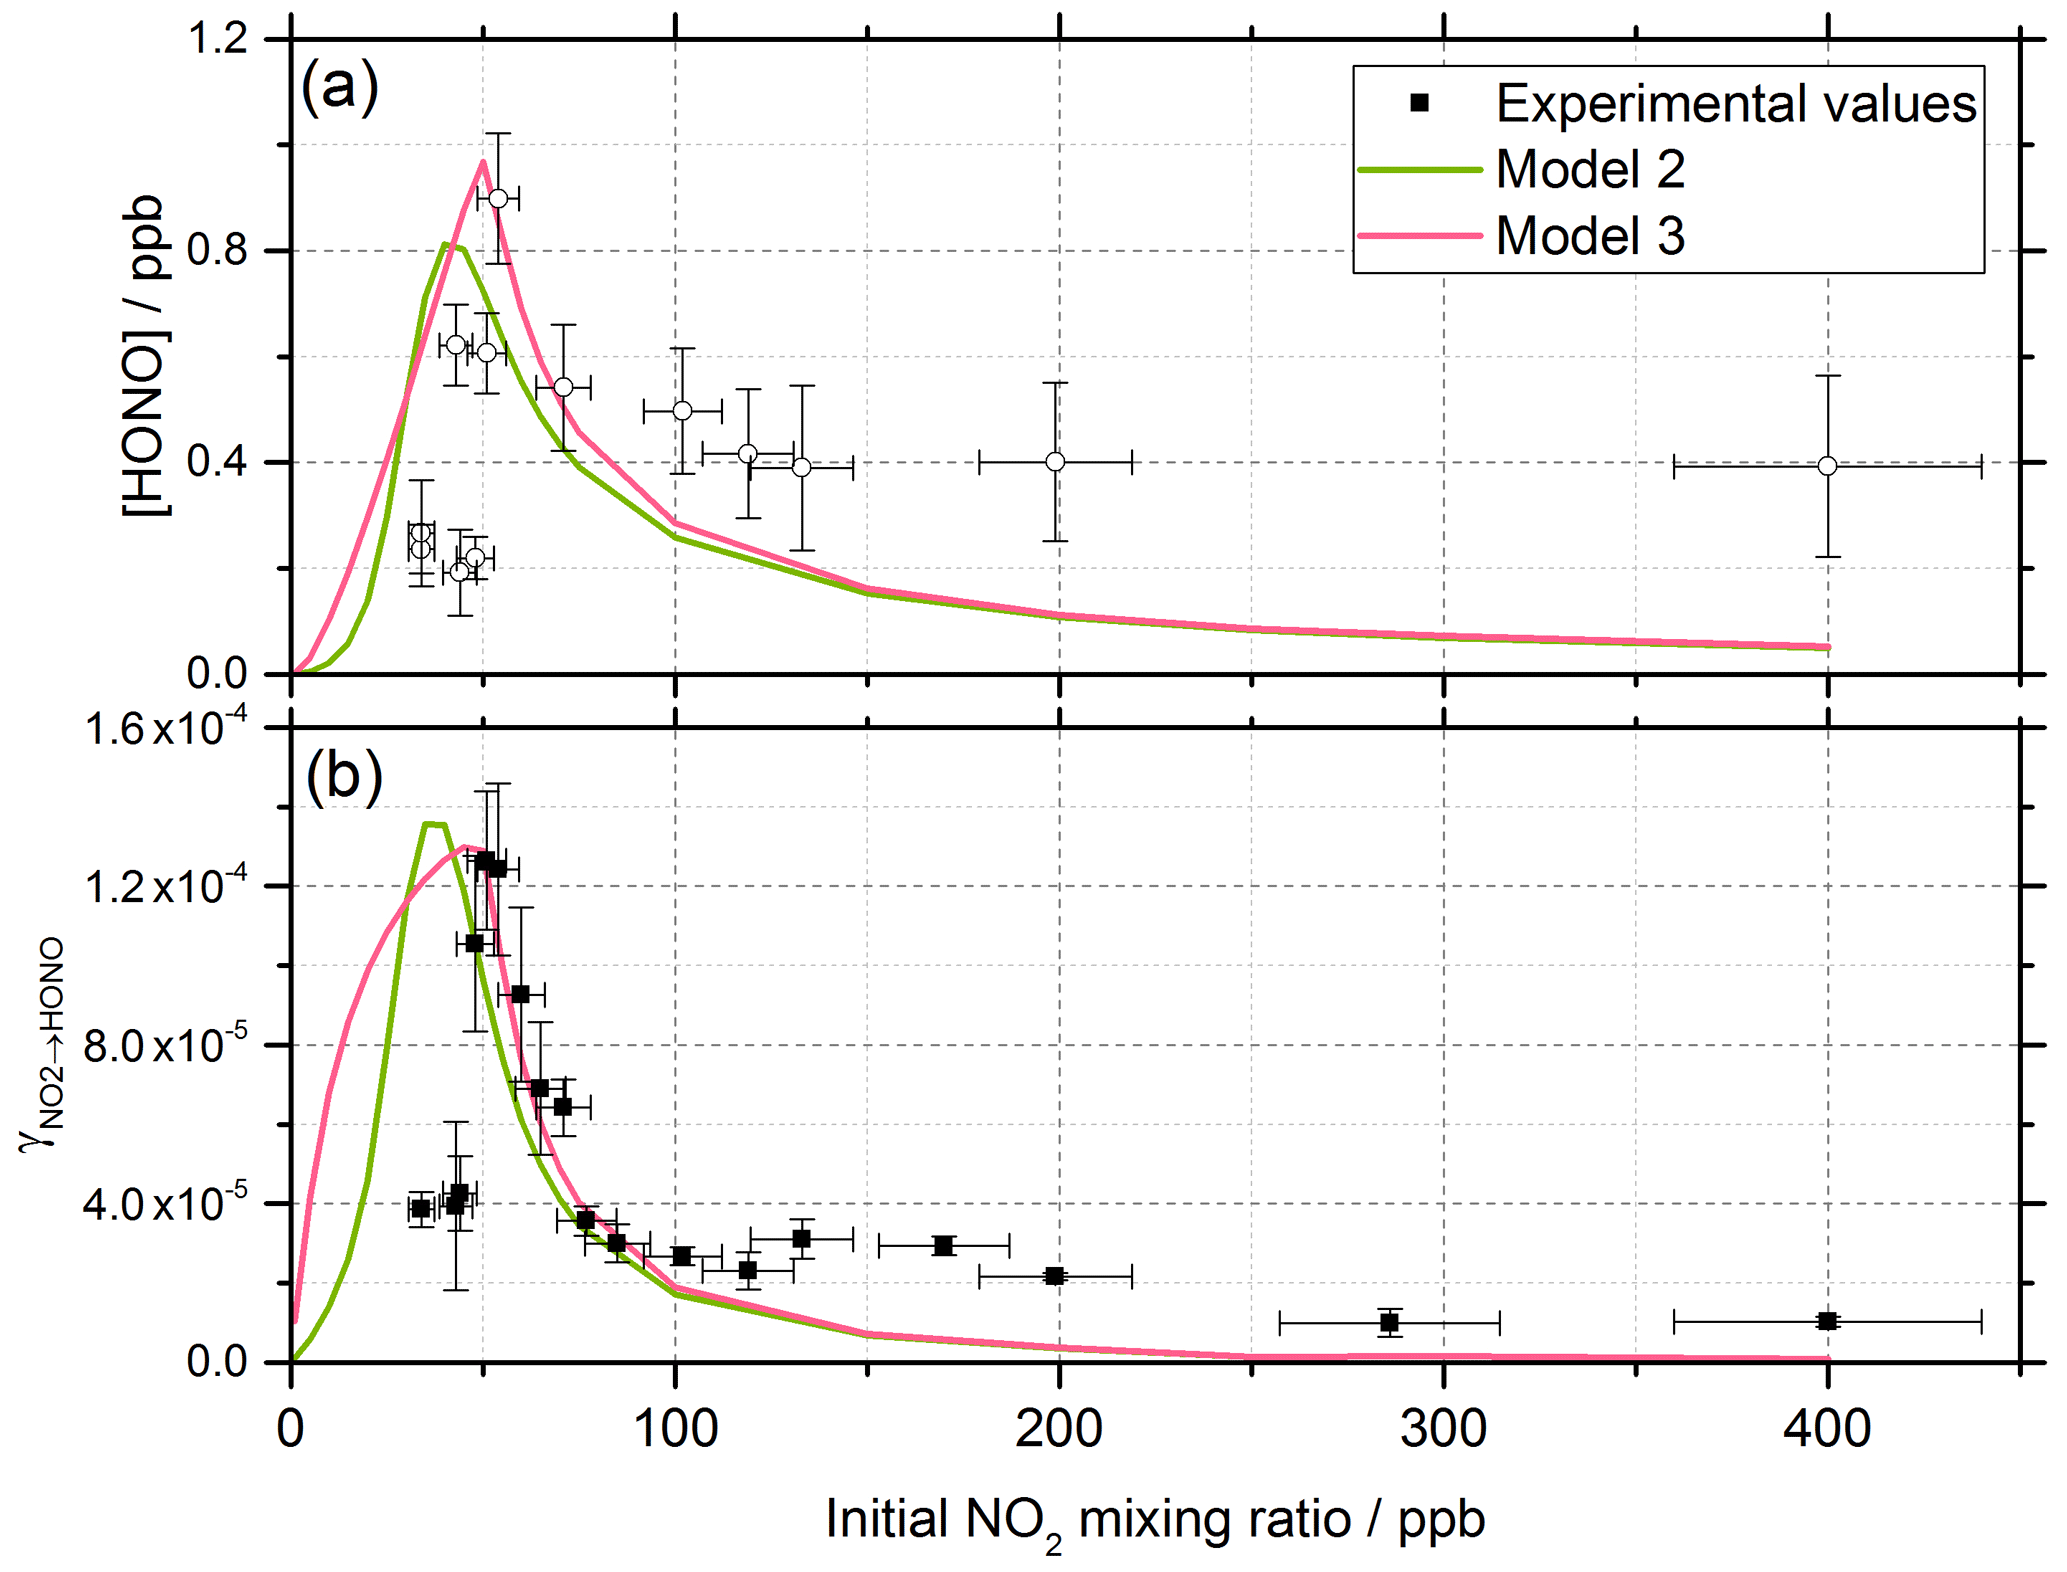
Figure 10Experimental values (open circles with 1σ error bars), Model 2 (green line) and Model 3 (pink line) calculations for (a) HONO concentration after 52 s illumination and (b) NO2 reactive uptake coefficient, , as a function of the initial NO2 mixing ratio. The mechanisms used for these model runs included a 2:1 stoichiometric relationship between the NO2 adsorbed on the TiO2 aerosol surface and the HONO produced, as well as additional HONO loss reactions which are dependent on NO2; see Table 1 for details. Model 2 and Model 3 use an Eley–Rideal and Langmuir–Hinshelwood mechanism, respectively, for the formation of the NO2 dimer on the aerosol surface. Modelled was calculated using Eqs. (6) and (7) with a constant surface area of 1.6 × 10⁻² m2 m−3 chosen to match the aerosol surface area density of (1.6 ± 0.8) × 10−2 m2 m−3 shown in the experimental [HONO] values in panel (a).
In previous work that investigated HONO production from humic acid aerosols, a saturation effect was seen with HONO production plateauing with increasing NO2 mixing ratio (Stemmler et al., 2007), with the decreasing uptake coefficient, , with increasing NO2 being attributed to NO2 fully saturating available surface sites. However, the observed decrease in [HONO] at the high NO2 mixing ratios shown in Figs. 8 and 10a suggests that additional reactions on the surface may remove HONO and result in the reduction of [HONO] that is measured. As [HONO] decreases with the increase in the NO2 mixing ratio, the removal process should either involve NO2 directly,
or involve species made rapidly from NO2 on the surface, such as NO,
which may be present at high enough concentrations of HNO3 on the surface (Syomin and Finlayson-Pitts, 2003) or following reaction with , or a product of the reaction of with NO2 (Reaction R4), i.e. NO. Similar results were observed in a study by El Zein and Bedjanian (2012a), where NO2 and NO were found to be formed from the heterogeneous reaction of HONO with TiO2 surfaces in both dark and illuminated conditions, suggesting the loss of HONO via an auto-ionisation reaction between the gas-phase and adsorbed HONO to generate NO+ and NO (El Zein and Bedjanian, 2012a). Additional HONO surface loss pathways were assumed to occur under illuminated conditions due to the presence of e− and h+, leading to the oxidation of HONO to NO2 and the reduction of HONO to NO (El Zein et al., 2013). Transition state theory (TST) studies of the gas-phase reaction of HONO with NO2 to form HNO3 calculated a large activation energy which varied depending on whether the reaction occurs via O abstraction by HONO (159 kJ mol−1) or via OH abstraction via NO2 (∼ 133–246 kJ mol−1) (Lu et al., 2000). In the gas phase these reactions are too slow to be important, but they could be enhanced on the surface, potentially more so on a photoactive surface such as TiO2. For Models 2 and 3 the shape of the trend in HONO concentration and uptake coefficient, γ, versus NO2 concentration depended strongly on the value of kR19 and the choice of a 2:1 stoichiometric ratio of the NO2 molecules adsorbed to the HONO molecules produced. Without these two key processes being included, a maximum in either the HONO concentration or γ as the NO2 concentration is increased could not be obtained in the model. A third key condition was the requirement that the desorption rate coefficient, kR16, be larger than the rate coefficient for the loss of HONO, kR17 and s−1, but slower than the adsorption rate coefficient, kR9. Changing the values of all other kinetic parameters in the model had an effect on the absolute concentration of HONO but crucially not on the shape of the trends in HONO or the uptake coefficient versus NO2 concentration. Changing the values of the rate coefficients for the gas-phase loss Reactions (R23)–(R27) only had a very small impact on the HONO concentration. The addition of an NO2-dependent loss reaction to both Model 2 and Model 3 had the most significant effect on the trend in modelled HONO concentration. Though it is also possible that a secondary product could remain adsorbed and therefore block active sites on the TiO2 surface, effectively poisoning the photocatalyst, NO2-independent loss reactions in the model, kR17 and kR18, had little effect on the trend in [HONO] vs. NO2, only having an effect on the overall [HONO]. HNO3 has however been shown to remain adsorbed to surfaces once formed (Sakamaki et al., 1983; Pitts et al., 1984; Finlayson-Pitts et al., 2003; Ramazan et al., 2004) and may also react with adsorbed HONO, further reducing the product yield (Finlayson-Pitts et al., 2003): these NO2-independent loss reactions may therefore become more important at higher NO2 concentrations and hence surface concentrations of HONO and HNO3:
The photolysis of particulate nitrate was not considered in Model 2 or Model 3, due to the lack of particulate nitrate in the system at t=0. The gas-to-particle conversion of any HNO3 formed was not considered to be important due to the assumption that most HNO3 formed would remain adsorbed to the aerosol surface (Sakamaki et al., 1983; Pitts et al., 1984; Finlayson-Pitts et al., 2003; Ramazan et al., 2004).
For Model 2, which includes the production of HONO via the Eley–Rideal mechanism, in order to reproduce the experimentally observed sharp increase followed by a decrease in both [HONO] and as a function of increasing NO2 mixing ratio, the modelled rate coefficient for the adsorption of a gas-phase NO2 molecule to another, the surface-adsorbed NO2 to initially form the symmetric N2O4 dimer, kR12, had to be larger than for the isomerisation step to form HONO and HNO3 via trans-ONO-NO2, kR13. Interestingly, for HONO production via the Langmuir–Hinshelwood mechanism, Model 3, the modelled rate coefficient for the diffusion of one NO2 molecule across the surface to form the dimer with another NO2 molecule, kR14, had to be smaller than for the isomerisation step, kR15, to more closely represent the experimental results for the uptake coefficient. Additionally, in order to reproduce the experimental trend in HONO formation as a function of NO2 mixing ratio, the rate coefficient for the NO2-dependent loss reaction, kR19, had to be larger than the NO2-independent reactions, kR17 and kR18, leading to s−1. The modelled HONO concentration is also sensitive to the active site surface concentration: Model 3 required an active site surface concentration 2.5 times that of Model 2 to reproduce the peak in [HONO] at ∼ 51 ppb NO2 observed in the experimental results. The reason for this is due to the difference in active site occupation in the two models: one active site is being occupied by two NO2 molecules per HONO formed in Model 2 as opposed to Model 3, where two active sites are occupied per HONO formed. Regardless of the choice of an Eley–Rideal or Langmuir–Hinshelwood mechanism, both models reproduce the general shape of [HONO] and with NO2, providing evidence that two NO2 molecules are required to form HONO.
3.4 HONO production from illumination of a mixed NH4NO3 TiO2 aerosol in the absence of NO2
The photolysis of particulate nitrate has been postulated as a source of HONO under ambient sunlit conditions during several field campaigns, from both aircraft- and ground-based measurements (Reed et al., 2017; Ye et al., 2017a, b). Here, experiments were carried out to investigate the formation of HONO from particulate nitrate photolysis, with and without the addition of a photocatalyst. This is of significant interest for marine environments downwind of arid desert regions due to the availability of TiO2 or other photocatalytic materials within aerosols in dust plumes that are transported from these regions (Hanisch and Crowley, 2003).
Using the aerosol flow tube setup described in Sect. 2.1–2.4, an aqueous solution of ammonium nitrate (5 g NH4NO3 in 500 mL Milli-Q water) was used to generate nitrate aerosols. At the RH used in this experiment, ∼ 50 %, the aerosols were still deliquesced. For these experiments the residence time of the aerosols in the illuminated region of the flow tube was 30 s (flow rate ∼ 6 L min−1), with the production of HONO following illumination measured as a function of aerosol surface area density. The number of lamps was increased from one to four, increasing the photon flux from (1.63 ± 0.09) × 1016 to (8.21 ± 2.39) × 1016 photons cm−2 s−1 and j(NO2) from (6.43 ± 0.30) × 10−3 to (3.23 ± 0.92) × 10−2 s−1. The j(NO2), j(HONO) and flux values for four lamps were more than 4 times that of one lamp only due to the lamp casings being mirrored, and so with four lamps, with two lamps on either side of the flow tube, the casings reflected the light back into the flow tube, increasing the effective light intensity. For these experiments, no gaseous NO2 was added to the gas entering the flow tube. As shown in Fig. 11, for the illumination of pure nitrate aerosols, although a small amount of HONO was observed at higher aerosol loadings, no statistically significant production of HONO was seen.
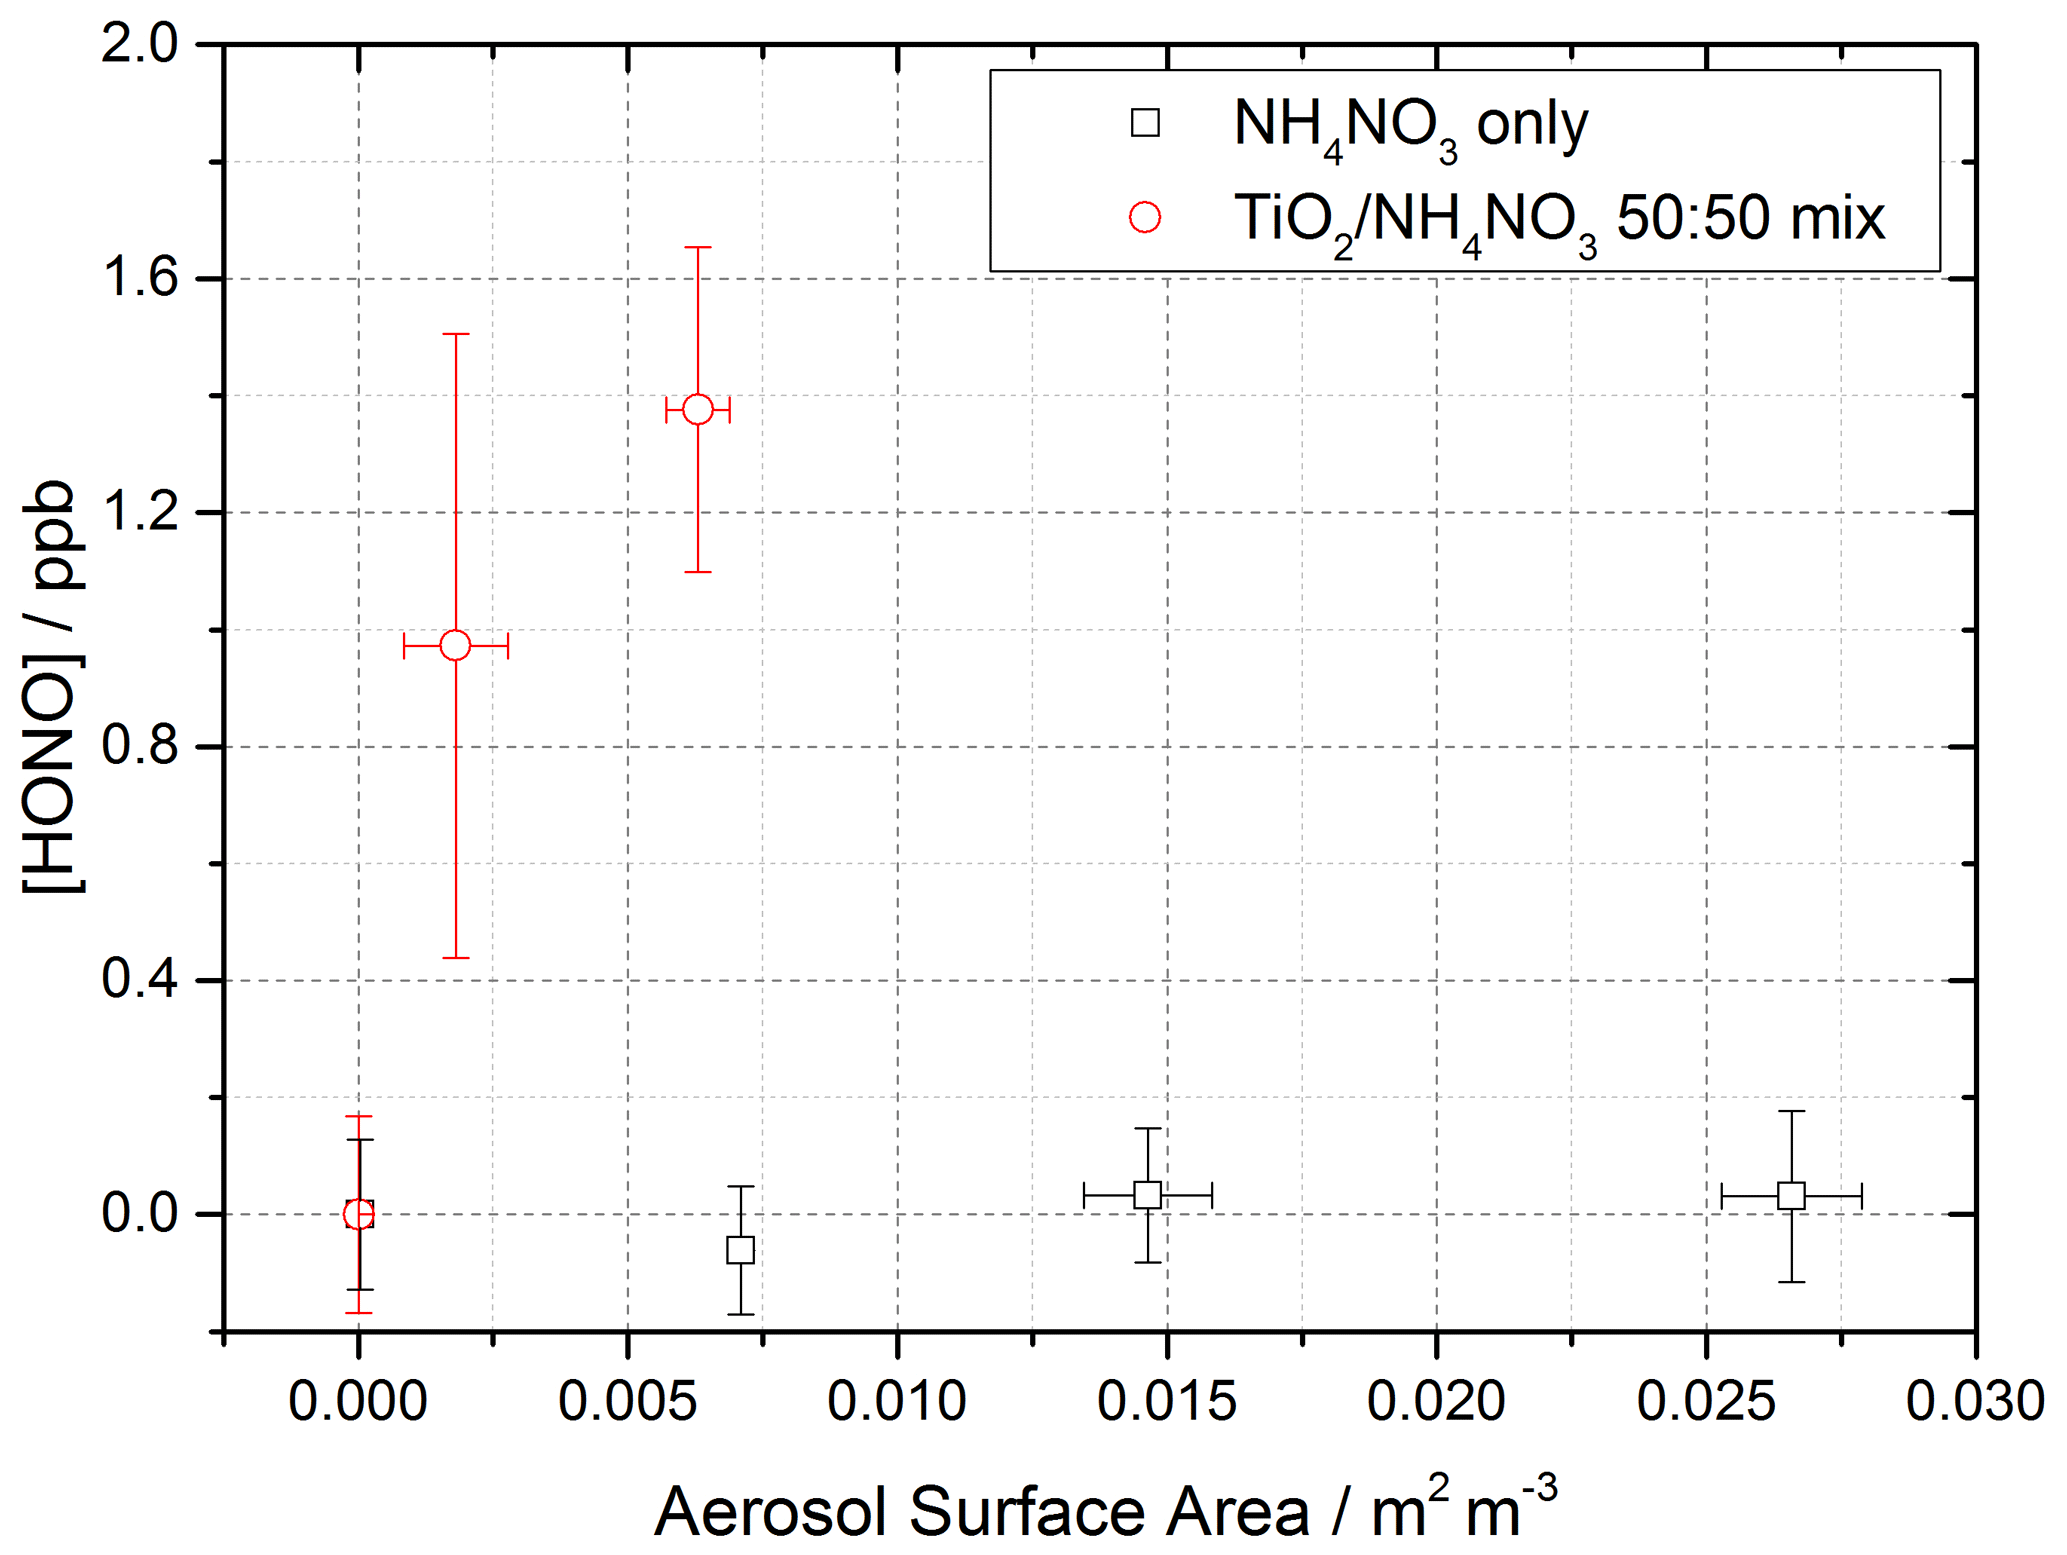
Figure 11Dependence of the HONO concentration generated as a function of aerosol surface area density for pure NH4NO3 aerosol (black open squares, error bars represent 1σ) and 1:1 TiO2 NH4NO3 mixed aerosol (red open circles, error bars represent 1σ). Both experiments were performed in N2 at 295 K, an illuminated residence time of 30 s and a lamp photon flux of (8.29 ± 2.39) × 1016 photons cm−2 s−1. The NH4NO3-only experiment was performed at ∼ 50 ± 5 % RH, while the TiO2 NH4NO3 mix experiment was performed at 20 ± 2 % RH. For all points, the background HONO observed without illumination has been subtracted. At zero aerosol surface area density there is no HONO generated from the walls of the flow tube.
A second set of experiments were performed with an aqueous solution of titanium dioxide and ammonium nitrate combined in a 1:1 mass ratio to give a TiO2 NH4NO3 aerosol mixture (5 g NH4NO3 and 5 g TiO2 in 500 mL Milli-Q water) to investigate if the photocatalytic properties of TiO2 facilitate the production of HONO in the presence of nitrate. The RH was decreased to ensure the maximum TiO2 photocatalytic activity (Jeong et al., 2013). A recent study using Raman micro-spectroscopy to observe phase changes in salt particles reported an efflorescence point of pure ammonium nitrate to be between 13.7 %–23.9 % RH (Wu et al., 2019). It is possible therefore that at the RH used in this experiment, ∼ 20 %, the aerosols were still deliquesced. As shown in Fig. 11, the presence of TiO2 in the aerosol mixture showed a significant production of HONO without the presence of NO2, a potentially significant result for the production of HONO in low-NOxenvironments in the presence of mixed dust/nitrate aerosols, for example in oceanic regions off the coast of West Africa or in continental regions impacted by outflow from the Gobi desert. Using the Aerosol Inorganic Model (AIM) (Clegg et al., 1998; Wexler and Clegg, 2002), the nitrate content of the aerosol at both 20 % and 50 % RH was calculated, in accordance with the experimental RH conditions. From this and the aerosol volume distribution given by the SMPS, the [NO] within the aerosols could be calculated. The formation of HONO by photolysis of particulate nitrate is given by
and hence
where j(pNO3) is the photolysis frequency of nitrate for the lamps used in these experiments and t is the illumination time of the experiment. With knowledge of [HONO], [NO] and t=30 s, j(pNO3) can be calculated from a measurement of [HONO] as a function of [NO], as shown in Fig. 12, for the mixed experiment.
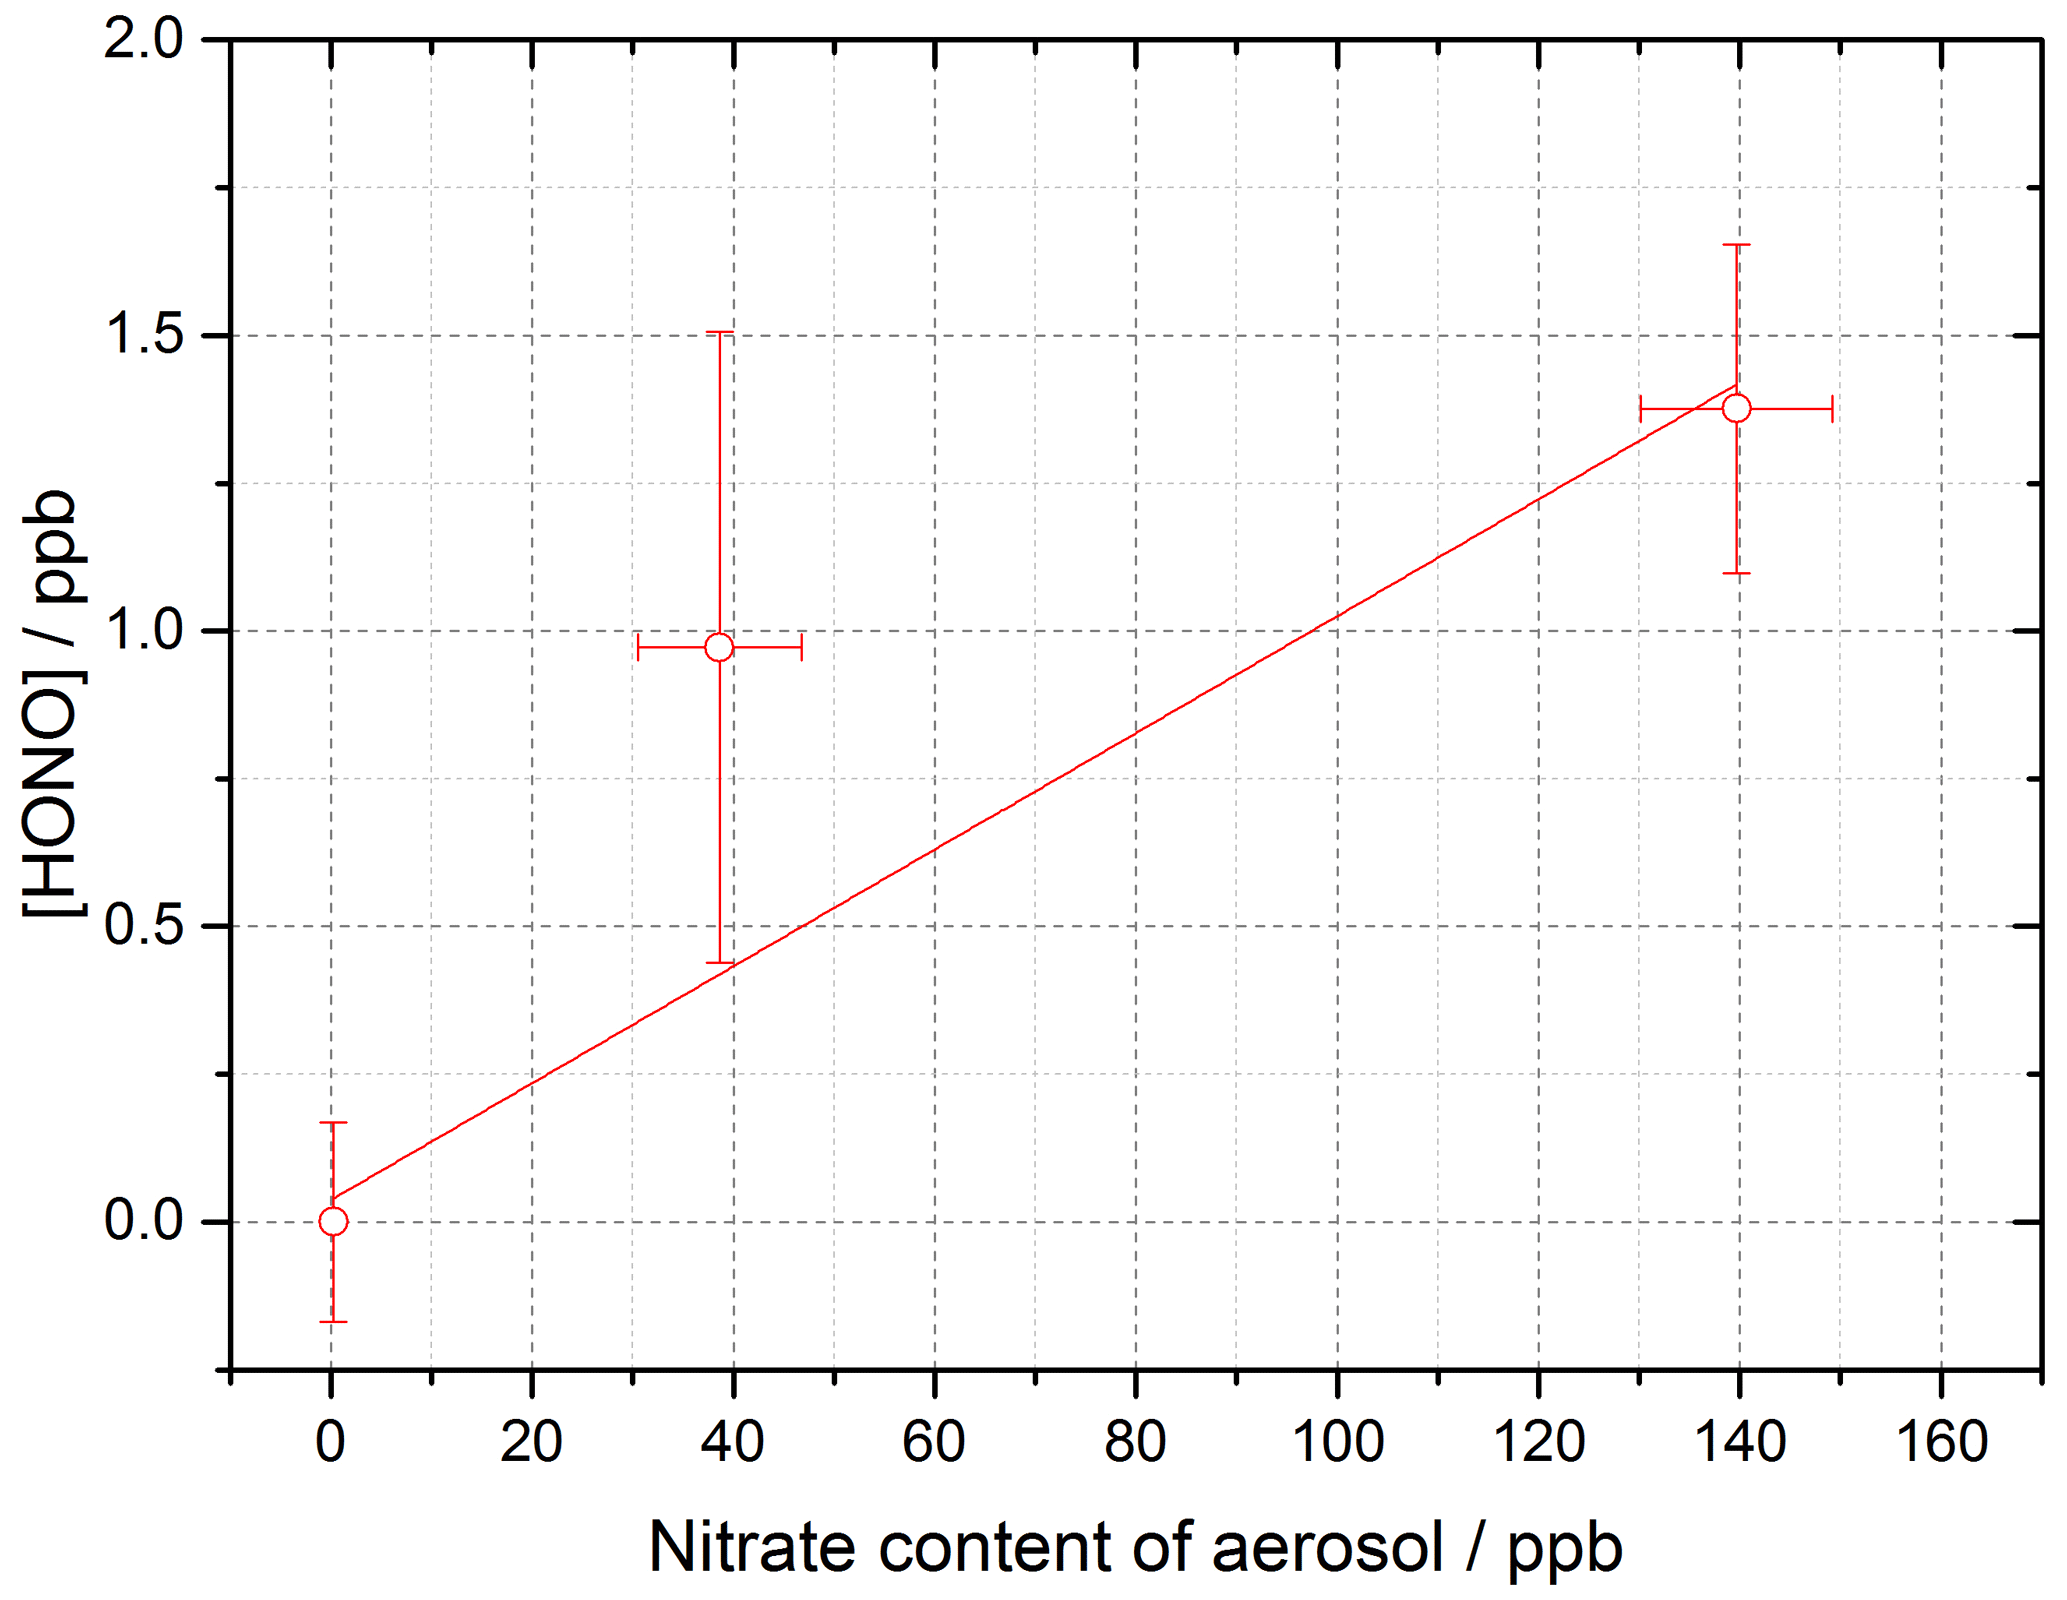
Figure 12Dependence of [HONO] on the calculated nitrate concentration in the aerosol (using the AIM model) for the mixed TiOammonium nitrate aerosol experiment. Using Eq. (10) and for t=30 s, the gradient gives j(pNO3)= (3.29 ± 0.89) × 10−4 s−1. Experiment performed at 15 ± 1 % RH, in N2 at 295 K with a lamp photon flux of (8.29 ± 2.39) × 1016 photons cm−2 s−1. For all points, the background HONO observed without illumination has been subtracted.
When using the four lamps together, the experimental particulate nitrate photolysis rate, j(pNO3), was determined to be (3.29 ± 0.89) × 10−4 s−1 for the mixed aerosol. From this, it is possible to estimate j(pNO3) for ambient conditions typical of the tropical marine boundary layer. Taking the ratio of the experimental j(HONO) for four lamps ((8.35 ± 0.18) × 10−3 s−1) and the measured j(HONO) from the RHaMBLe campaign held at the Cape Verde Atmospheric Observatory (May–June 2007) (1.2 × 10⁻³ s−1) (Carpenter et al., 2010; Whalley et al., 2010; Reed et al., 2017) and assuming that j(pNO3) and j(HONO) scale in the same way, ambient j(pNO3) can be determined from
where is the photolysis rate coefficient of particulate nitrate at Cabo Verde, j(pNO3) is the experimentally determined photolysis rate coefficient of particulate nitrate to form HONO and j(HONO) is the HONO photolysis rate coefficient calculated from the experimentally determined j(NO2).
Using j(pNO3)= (3.29 ± 0.89) × 10−4 s−1, the rate of HONO production from nitrate photolysis at Cabo Verde was calculated to be s−1 from the mixed aerosol experiment. Although for pure nitrate aerosol in the absence of TiO2 the data were scattered and the HONO production was small (Fig. 11), an upper limit estimate of (1.06 ± 1.15) × 10−6 s−1 under conditions at Cabo Verde could be made using Eq. (11), as done for rate of HONO production from mixed aerosols. The atmospheric implications of this will be considered below.
4.1 Production of HONO from sunlit aerosols containing TiO2 in the presence of NO2
For the reactive uptake of NO2 onto illuminated TiO2 particles as a function of the initial NO2 mixing ratio, as shown in Fig. 8, a maximum value of (1.26 ± 0.17) × 10−4 was determined at 51 ± 5 ppb NO2 for a photon flux from the lamp of (1.63 ± 0.09) × 1016 photons cm−2 s−1. These experiments were for single-component TiO2 particles, and so for dust aerosols a value of (1.26 ± 0.17) × 10−5 is appropriate, assuming a 10 % fraction of TiO2 and/or other photoactive materials (which behave similarly for HONO production) in mineral dust (Hanisch and Crowley, 2003). Dust aerosols are transported from the Gobi desert to urban areas of China where high NOx and nitrate aerosol concentrations have been observed, and in these areas HONO production facilitated by photocatalysts may be important (Saliba et al., 2014).
Using an average daytime maximum for [NO2], j(NO2) and aerosol surface area measurements for a non-haze period in May–June in 2018 in Beijing, of 50 ppb, 1 × 10⁻² s−1 and 2.5 × 10⁻³ m2 m−3 (of which a maximum of 0.3 % was assumed to be TiO2, though this could be higher in dust impacted events, Schleicher et al., 2010) respectively, a production rate of HONO of 1.70 × 10⁵ molec. cm−3 s−1 (∼ 24.8 ppt h−1) has been estimated using the maximum reactive uptake coefficient measured in this work, (1.26 ± 0.17) × 10−4. The average RH in Beijing during summertime is significantly higher than the range of RH used in the TiO2 aerosol experiments. In previous work (Gustafsson et al., 2006), the NO2 reactive uptake coefficient decreased for relative humidities above those studied here, and hence the HONO production calculated under the conditions in Beijing may represent an upper limit. The lamp used to illuminate the TiO2 aerosols in these experiments gives rise to j(NO2)= (6.43 ± 0.3) × 10−3 s−1, and so has been scaled by a factor of 1.55 to match the noon j(NO2) measured in May–June 2018 in Beijing (10−2 s−1), to take into account the relatively small difference in experimental and atmospheric photon flux for Beijing. The HONO production rate estimated here for noontime summer (May–June 2018) in Beijing (∼ 25 ppt h−1) is similar to the value for the maximum production of HONO from urban humic acid aerosol surfaces in Europe, 17 ppt h−1 at 20 ppb NO2 reported by Stemmler et al. (2007). For comparison, the net gaseous production rate of HONO at noon in May–June (2018) Beijing was determined from the measured rate of gas-phase production and losses:
where 3.3 × 10⁻¹¹ cm3 molec.−1 s−1 (Atkinson et al., 2004), kOH+HONO = 6 × 10⁻¹² cm3 molec.−1 s−1 (Atkinson et al., 2004) and j(HONO) = 1 × 10⁻² s−1 for an average maximum noontime OH concentration of 8 × 10⁶ molec. cm−3 (Whalley et al., 2021), NO concentration of 1.45 ppb (Whalley et al., 2021) and HONO concentration of 0.8 ppb (Whalley et al., 2021).
The net gas-phase production of HONO from Eq. (13) was calculated to be −3.8 ppb h−1 (a net loss) as expected due to HONO loss by photolysis peaking at solar noon, suggesting the production of HONO heterogeneously from TiO2 and NO2 (∼ 25 ppt h−1) would have little effect on the overall HONO budget for Beijing summertime at noon.
4.2 Production of HONO from photolysis of mixed dust/nitrate aerosols
Particulate nitrate photolysis could be an important source of HONO in oceanic environments, for example the Atlantic Ocean, where both dust aerosols from the Sahara and high concentrations of mixed nitrate aerosols from sea spray are present, despite low NO2 concentrations (Hanisch and Crowley, 2003; Ye et al., 2017b). From the particulate nitrate photolysis experiments in the absence of NO2 conducted here, a (4.73 ± 1.01) × 10−5 s−1 was determined in the presence of the TiO2 photocatalysts (Sect. 3.4). Using the experimental j(pNO3), scaled to typical ambient light levels, and a mean noon concentration of nitrate aerosols of 400 ppt measured at Cabo Verde (Reed et al., 2017), taken as an example marine boundary layer environment with a high concentration of mineral dust aerosols, a rate of HONO production from particulate nitrate at Cabo Verde was calculated as 4.65 × 10⁵ molec. cm−3 s−1 (68 ppt h−1). We note that this value would be ∼ 50 times smaller for pure nitrate aerosols. The missing rate of HONO production, i.e. not taken into account by the gas-phase production and loss, Pother, from the Cabo Verde RHaMBLe campaign, can be calculated using the observed HONO concentration, [HONO], and the known gas-phase routes for HONO production and loss:
where 3.3 × 10⁻¹¹ cm3 molec.−1 s−1 (Atkinson et al., 2004), cm3 molec.−1 s−1 (Atkinson et al., 2004) and j(HONO) = 2 × 10⁻³ s−1 for average maximum measured concentrations of 1 × 10⁷ molec. cm−3 for OH (Whalley et al., 2010), 5.41 × 10⁷ molec. cm−3 for NO (Whalley et al., 2010) and 1.23 × 10⁸ molec. cm−3 for HONO (Whalley et al., 2010).
Using Eq. (14) this missing HONO production rate for Cabo Verde was 34.6 ppt h−1, which is within a factor of 2 of the rate of HONO production (68 ppt h−1) calculated from nitrate photolysis using our experimental HONO production data for mixed aerosols. These results provide further evidence that particulate nitrate photolysis in the presence of photocatalytic compounds such as TiO2 found in dust could be significant in closing the HONO budget for this environment (Whalley et al., 2010; Reed et al., 2017; Ye et al., 2017a).
The experimental production of HONO from both illuminated TiO2 aerosols in the presence of NO2 and from mixed aerosols in the absence of NO2 was observed, with the HONO concentrations measured using photo-fragmentation laser-induced fluorescence spectroscopy. Using experimental data, the reactive uptake of NO2 onto the TiO2 aerosol surface to produce HONO, , was determined for NO2 mixing ratios ranging from 34 to 400 ppb, with a maximum value of (1.26 ± 0.17) × 10−4 for single-component TiO2 aerosols observed at 51 ppb NO2 and for a lamp photon flux of (1.63 ± 0.09) × 1016 photons cm−2 s−1 (integrated between 290 and 400 nm). The measured reactive uptake coefficient, , showed an increase and then a subsequent decrease as a function of NO2 mixing ratio, peaking at 51 ± 5 ppb. Box modelling studies supported a mechanism involving two NO2 molecules on the aerosol surface per HONO molecule generated, providing evidence for the formation of a surface-bound NO2 dimer intermediate. The exact mechanism for HONO formation, for example the step(s) which is accelerated in the presence of light, remains unclear, although previous studies would suggest the process occurs via the isomerisation of the symmetric N2O4 dimer to give trans-ONO-NO2, either via cis-ONO-NO2 or directly, suggested to be more reactive with water than the symmetric dimer (Finlayson-Pitts et al., 2003; Ramazan et al., 2004; Ramazan et al., 2006; de Jesus Madeiros and Pimentel, 2011; Liu and Goddard, 2012; Murdachaew et al., 2013; Varner et al., 2014). Investigations into the RH dependence of the HONO production mechanism on TiO2 aerosols showed a peak in production between ∼ 25 %–30 % RH, with lower HONO production at higher NO2 mixing ratios observed for all RHs tested. The increase in HONO production with increasing RH can be attributed to a higher concentration of H2O on the surface increasing its availability for the hydrolysis reaction to give HONO, whereas a decrease in HONO production after RH ∼ 30 % could be due to the increased water surface concentration inhibiting the adsorption of NO2. Using the laboratory reactive uptake coefficient for HONO production, , the rate of production of HONO from illuminated aerosols in Beijing in summer for typical NO2 mixing ratios and aerosol surface areas was found to be similar to that estimated previously for the production of HONO from urban humic acid aerosol surfaces in Europe.
In the absence of NO2, significant HONO production from 50:50 mixed aerosols was measured. Using the experimental HONO concentrations observed, a rate of HONO production from nitrate photolysis was calculated, which was then scaled to the ambient conditions encountered at the Cape Verde Atmospheric Observatory in the tropical marine boundary layer. A HONO production rate of 68 ppt h−1 for the mixed aerosol was found for CVAO conditions, similar in magnitude to the missing HONO production rate that had been calculated previously in order to bring modelled HONO concentrations into line with field-measured values at CVAO. These results provide further evidence that aerosol particulate nitrate photolysis may be significant as a source of HONO, and hence NOx, in the remote marine boundary layer, where mixed aerosols containing nitrate and a photocatalytic species such as TiO2, as found in dust, are present.
However, the production of HONO from pure, deliquesced ammonium nitrate aerosols alone could not be definitively confirmed over the range of conditions used in our experiments, suggesting that another component within the aerosol is necessary for HONO production. Future work should be directed towards studying pure nitrate aerosols over a wider range of conditions, for example varying the aerosol pH, and also adding other chemical species into the aerosol which may promote HONO production.
Data presented in this study can be obtained from the authors upon request (d.e.heard@leeds.ac.uk)
JED and GAB carried out the measurements with assistance from LTF, MB and LKW. JED and LKW developed the model, and JED carried out the calculations. JED, LKW and DEH prepared the manuscript, with contributions from all co-authors.
The authors declare that they have no conflict of interest.
We are grateful to the Natural Environmental Research Council for funding a SPHERES PhD studentship (Joanna E. Dyson) and for funding the EXHALE project (grant number NE/S006680/1).
This research has been supported by the Natural Environment Research Council (grant no. NE/S006680/1).
This paper was edited by Markus Ammann and reviewed by two anonymous referees.
Alicke, B., Platt, U., and Stutz, J.: Impact of nitrous acid photolysis on the total hydroxyl radical budget during the Limitation of Oxidant Production/Pianura Padana Produzione di Ozono study in Milan, J. Geophys. Res.-Atmos., 107, 8196, https://doi.org/10.1029/2000JD000075, 2002.
Atkinson, R., Baulch, D. L., Cox, R. A., Crowley, J. N., Hampson, R. F., Hynes, R. G., Jenkin, M. E., Rossi, M. J., and Troe, J.: Evaluated kinetic and photochemical data for atmospheric chemistry: Volume I – gas phase reactions of Ox, HOx, NOx and SOx species, Atmos. Chem. Phys., 4, 1461–1738, https://doi.org/10.5194/acp-4-1461-2004, 2004.
Beckers, H., Zeng, X., and Willner, H.: Intermediates involved in the oxidation of nitrogen monoxide: Photochemistry of the cis-N2O2⋅ O2 complex and of sym-N2O4 in Solid Ne Matrices, Chemistry, 16, 1506–1520, https://doi.org/10.1002/chem.200902406, 2010.
Bedjanian, Y. and El Zein, A.: Interaction of NO2 with TiO2 Surface Under UV Irradiation: Products Study, J. Phys. Chem. A, 116, 1758–1764, https://doi.org/10.1021/jp210078b, 2012.
Boustead, G. A.: Measurement of nitrous acid production from aerosol surfaces using Photo-Fragmentation Laser-Induced Fluorescence, School of Chemistry, University of Leeds, 2019.
Bröske, R., Kleffmann, J., and Wiesen, P.: Heterogeneous conversion of NO2 on secondary organic aerosol surfaces: A possible source of nitrous acid (HONO) in the atmosphere?, Atmos. Chem. Phys., 3, 469–474, https://doi.org/10.5194/acp-3-469-2003, 2003.
Cantrell, C., Zimmer, A., and Tyndall, G. S.: Adsorption cross sections for water vapor from 183 to 193 nm, Geophys. Res. Lett., 24, 2195–2198, https://doi.org/10.1029/97GL02100, 1997.
Carpenter, L. J., Fleming, Z. L., Read, K. A., Lee, J. D., Moller, S. J., Hopkins, J. R., Purvis, R. M., Lewis, A. C., Müller, K., Heinold, B., Herrmann, H., Fomba, K. W., van Pinxteren, D., Müller, C., Tegen, I., Wiedensohler, A., Müller, T., Niedermeier, N., Achterberg, E. P., Patey, M. D., Kozlova, E. A., Heimann, M., Heard, D. E., Plane, J. M. C., Mahajan, A., Oetjen, H., Ingham, T., Stone, D., Whalley, L. K., Evans, M. J., Pilling, M. J., Leigh, R. J., Monks, P. S., Karunaharan, A., Vaughan, S., Arnold, S. R., Tschritter, J., Pöhler, D., Frieß, U., Holla, R., Mendes, L. M., Lopez, H., Faria, B., Manning, A. J., and Wallace, D. W. R.: Seasonal characteristics of tropical marine boundary layer air measured at the Cape Verde Atmospheric Observatory, J. Atmos. Chem., 67, 87–140, https://doi.org/10.1007/s10874-011-9206-1, 2010.
Chen, H., Nanayakkara, C. E., and Grassian, V. H.: Titanium dioxide photocatalysis in atmospheric chemistry, Chem. Rev., 112, 5919–5948, https://doi.org/10.1021/cr3002092, 2012.
Clegg, S. L., Brimblecombe, P., and Wexler, A. S.: Thermodynamic model of the system H+- NH- Na+- SO- NO- Cl−- H2O at 298.15 K, J. Phys. Chem. A, 102, 2155–2171, https://doi.org/10.1021/jp973043j, 1998.
Crilley, L. R., Kramer, L. J., Ouyang, B., Duan, J., Zhang, W., Tong, S., Ge, M., Tang, K., Qin, M., Xie, P., Shaw, M. D., Lewis, A. C., Mehra, A., Bannan, T. J., Worrall, S. D., Priestley, M., Bacak, A., Coe, H., Allan, J., Percival, C. J., Popoola, O. A. M., Jones, R. L., and Bloss, W. J.: Intercomparison of nitrous acid (HONO) measurement techniques in a megacity (Beijing), Atmos. Meas. Tech., 12, 6449–6463, https://doi.org/10.5194/amt-12-6449-2019, 2019.
de Jesus Madeiros, D. and Pimentel, A. S.: New insights in the atmospheric HONO formation: new pathways for N2O4 isomerisaton and NO2 dimerisation in the presence of water, J. Phys. Chem. A, 115, 6357–6365, https://doi.org/10.1021/jp1123585, 2011.
Dupart, Y., Fine, L., D'Anna, B., and George, C.: Heterogeneous uptake of NO2 on Arizona Test Dust under UV-A irradiation: an aerosol flow tube study, Aeolian Res., 15, 45–51, https://doi.org/10.1016/j.aeolia.2013.10.001, 2014.
El Zein, A. and Bedjanian, Y.: Reactive Uptake of HONO to TiO2 Surface: “Dark” Reaction, J. Phys. Chem. A, 116, 3665–3672, https://doi.org/10.1021/jp300859w, 2012a.
El Zein, A. and Bedjanian, Y.: Interaction of NO2 with TiO2 surface under UV irradiation: measurements of the uptake coefficient, Atmos. Chem. Phys., 12, 1013–1020, https://doi.org/10.5194/acp-12-1013-2012, 2012b.
El Zein, A., Bedjanian, Y., and Romanias, M. N.: Kinetics and products of HONO interaction with TiO2 surface under UV irradiation, Atmos. Environ., 67, 203–210, https://doi.org/10.1016/j.atmosenv.2012.11.016, 2013.
Fateley, W. G., Bent, H. A., and Crawford Jr., B.: Infrared spectra of the frozen oxides of nitrogen, J. Chem. Phys., 31, 204–217, https://doi.org/10.1063/1.1730296, 1959.
Finlayson-Pitts, B. J., Wingen, L. M., Summer, A. L., Syomin, D., and Ramazan, K. A.: The heterogeneous hydrolysis of NO2 in laboratory systems in outdoor and indoor atmospheres: An intergrated mechanism, Phys. Chem. Phys. Chem, 5, 223–242, https://doi.org/10.1039/b208564j, 2003.
Forney, D., Thompson, W. E., and Jacox, M. E.: The vibrational spectra of molecular ions isolated in solid neon. XI. NO, NO, and NO, J. Chem. Phys., 99, 7393–7403, https://doi.org/10.1063/1.465720, 1993.
Gandolfo, A., Bartolomei, V., Gomez Alvarez, E., Tlili, S., Gligorovski, S., Kleffmann, J., and Wortham, H.: The effectiveness of indoor photocatalytic paints on NOx and HONO levels, Appl. Catal. B-Environ., 166–167, 84–90, https://doi.org/10.1016/j.apcatb.2014.11.011, 2015.
Gandolfo, A., Rouyer, L., Wortham, H., and Gligorovski, S.: The influence of wall temperature on NO2 removal and HONO levels released by indoor photocatalytic paints, Appl. Catal. B-Environ., 209, 429–436, https://doi.org/10.1016/j.apcatb.2017.03.021, 2017.
George, C., Strekowski, R. S., Kleffmann, J., Stemmler, K., and Ammann, M.: Photoenhanced uptake of gaseous NO2 on solid organic compounds: a photochemical source of HONO?, Faraday Discuss., 130, 195–210, https://doi.org/10.1039/b417888m, 2005.
George, I. J., Matthews, P. S. J., Whalley, L. K., Brooks, B., Goddard, A., Baeza-Romero, M., and Heard, D. E.: Measurements of uptake coefficients for heterogeneous loss of HO2 onto submicron inorganic salt aerosols, Phys. Chem. Chem. Phys., 15, 12829–12845, https://doi.org/10.1039/c3cp51831k, 2013.
Ginoux, P., Chin, M., Tegen, I., Prospero, J. M., Holben, B., Dubovik, O., and Lin, S. J.: Sources and distributions of dust aerosols simulated with the GOCART model, J. Geophys. Res.-Atmos., 106, 20255–20273, https://doi.org/10.1029/2000JD000053, 2001.
Givan, A. and Loewenschuss, A.: Fourier transform infrared and Raman studies on solid nitrogen dioxide: Temperature cycling of ordered, disordered, and multicomponent layers, J. Chem. Phys., 90, 6135–6142, https://doi.org/10.1063/1.456379, 1989a.
Givan, A. and Loewenschuss, A.: On the intermolecularity or intramolecularity of nitrosonium nitrate formation in thin films of nitrogen dioxide: A Fourier transform infrared study, J. Chem. Phys., 91, 5126–5127, https://doi.org/10.1063/1.457609, 1989b.
Givan, A. and Loewenschuss, A.: Fourier transform infrared study of amorphous N2O4 solid: Destabilization with inert impurities, J. Chem. Phys., 94, 7562–7563, https://doi.org/10.1063/1.460192, 1991.
Goodman, A. L., Bernard, E. T., and Grassian, V. H.: Spectroscopic study of nitric acid and water adsorption on oxide particles: enhanced nitric acid uptake kinetics in the presence of adsorbed water, J. Phys. Chem. A, 105, 6443–6457, https://doi.org/10.1021/jp0037221, 2001.
Gustafsson, R. J., Orlov, A., Griffiths, P. T., Cox, R. A., and Lambert, R. M.: Reduction of NO2 to nitrous acid on illuminated titanium dioxide aerosol surfaces: implications for photocatalysis and atmospheric chemistry, Chem. Commun., 37, 3936–3938, https://doi.org/10.1039/b609005b, 2006.
Hanisch, F. and Crowley, J. N.: Ozone decomposition on Saharan dust: an experimental investigation, Atmos. Chem. Phys., 3, 119–130, https://doi.org/10.5194/acp-3-119-2003, 2003.
Harrison, R. M., Peak, J. D., and Collins, G. M.: Tropospheric cycle of nitrous acid, J. Geophys. Res.-Atmos., 101, 14429–14439, https://doi.org/10.1029/96JD00341, 1996.
Heard, D. E.: Atmospheric field measurements of the hydroxyl radical using Laser-Induced Fluorescence spectroscopy, Annu. Rev. Phys. Chem., 57, 191–216, https://doi.org/10.1146/annurev.physchem.57.032905.104516, 2006.
Jeong, M.-G., Park, E. J., Seo, H. O., Kim, K.-D., Kim, Y. D., and Lim, D. C.: Humidity effect on photocatalytic activity of TiO2 and regeneration of deactivated photocatalysts, Appl. Surf. Sci., 271, 164–170, https://doi.org/10.1016/j.apsusc.2013.01.155, 2013.
Kleffmann, J.: Daytime sources of nitrous acid (HONO) in the atmospheric boundary layer, Chem. Phys. Chem., 8, 1137–1144, https://doi.org/10.1002/cphc.200700016, 2007.
Kurtenbach, R., Becker, K. H., Gomes, J. A. G., Kleffmann, J., Lörzer, J. C., Spittler, M., Wiesen, P., Ackermann, R., Geyer, A., and Platt, U.: Investigations of emissions and heterogeneous formation of HONO in road traffic tunnel, Atmos. Environ., 35, 3385–3394, https://doi.org/10.1016/S1352-2310(01)00138-8, 2001.
Langridge, J. M., Gustafsson, R. J., Griffiths, P. T., Cox, R. A., Lambert, R. M., and Jones, R. L.: Solar driven nitrous acid formation on building material surfaces containing titanium dioxide: A concern for air quality in urban areas?, Atmos. Environ., 43, 5128–5131, https://doi.org/10.1016/j.atmosenv.2009.06.046, 2009.
Lee, J. D., Whalley, L. K., Heard, D. E., Stone, D., Dunmore, R. E., Hamilton, J. F., Young, D. E., Allan, J. D., Laufs, S., and Kleffmann, J.: Detailed budget analysis of HONO in central London reveals a missing daytime source, Atmos. Chem. Phys., 16, 2747–2764, https://doi.org/10.5194/acp-16-2747-2016, 2016.
Levy, H.: Normal atmosphere: large radical and formaldehyde concentrations predicted, Science, 173, 141–143, https://doi.org/10.1126/science.173.3992.141, 1971.
Li, S., Matthews, J., and Sinha, A.: Atmospheric hydroxyl radical production from electronically excited NO2 and H2O, Science, 319, 1657–1660, https://doi.org/10.1126/science.1151443, 2008.
Liao, W., Hecobian, A., Mastromarino, J., and Tan, D.: Development of a photo-fragmentation/laser-induced fluorescence measurement of atmospheric nitrous acid, Atmos. Environ., 40, 17–26, https://doi.org/10.1016/j.atmosenv.2005.07.001, 2006.
Liao, W., Hecobian, A., Mastromarino, J., and Tan, D.: Development of a photo-fragmentation/laser-induced fluorescence measurement of atmospheric nitrous acid, Atmos. Envrion., 40, 17–26, https://doi.org/10.1016/j.atmosenv.2005.07.001, 2007.
Liu, W. G. and Goddard, W. A.: First-principle study of the role of interconversion between NO2, N2O4, cis-ONO-NO2, and trans-ONO-NO2 in chemical processes, J. Am. Chem. Soc., 134, 12970–12978, https://doi.org/10.1021/ja300545e, 2012.
Lu, K., Fuchs, H., Hofzumahaus, A., Tan, Z., Wang, H., Zhang, L., Schmitt, S. H., Rohrer, F., Bohn, B., Broch, S., Dong, H., Gkatzelis, G. I., Hohaus, T., Holland, F., Li, X., Liu, Y., Liu, Y., Ma, X., Novelli, A., Schlag, P., Shao, M., Wu, Y., Wu, Z., Zeng, L., Hu, M., Kiendler-Scharr, A., Wahner, A., and Zhang, Y.: Fast Photochemistry in Wintertime Haze: Consequences for Pollution Mitigation Strategies, Environ. Sci. Technol., 53, 10676–10684, https://doi.org/10.1021/acs.est.9b02422, 2019.
Lu, X., Park, J., and Lin, M. C.: Gas phase reactions of HONO with NO2, O3 and HCl: Ab initio and TST study, J. Phys. Chem. A, 104, 8730–8738, https://doi.org/10.1021/jp001610o, 2000.
Matthews, P. S. J., Baeza-Romero, M. T., Whalley, L. K., and Heard, D. E.: Uptake of HO2 radicals onto Arizona test dust particles using an aerosol flow tube, Atmos. Chem. Phys., 14, 7397–7408, https://doi.org/10.5194/acp-14-7397-2014, 2014.
MCPA Software Ltd.: Facsimile integrator software package, MCPA Software Ltd.: Facsimile, 2020
Michoud, V., Colomb, A., Borbon, A., Miet, K., Beekmann, M., Camredon, M., Aumont, B., Perrier, S., Zapf, P., Siour, G., Ait-Helal, W., Afif, C., Kukui, A., Furger, M., Dupont, J. C., Haeffelin, M., and Doussin, J. F.: Study of the unknown HONO daytime source at a European suburban site during the MEGAPOLI summer and winter field campaigns, Atmos. Chem. Phys., 14, 2805–2822, https://doi.org/10.5194/acp-14-2805-2014, 2014.
Moon, D. R., Ingham, T., Whalley, L. K., Seakins, P. W., Baeza-Romero, M. T., and Heard, D. E.: Production of OH and HO2 radicals from near-UV irradiated airborne TiO2 nanoparticles, Phys. Chem. Phys. Chem, 21, 2325–2336, https://doi.org/10.1039/C8CP06889E, 2019.
Murdachaew, G., Varner, M. E., Philips, L. F., Finlayson-Pitts, B. J., and Gerber, R. B.: Nitrogen dioxide at the air-water interface: trapping, adsorption, and solvation in the bulk and at the surface, Phys. Chem. Chem. Phys., 15, 204–212, https://doi.org/10.1039/c2cp42810e, 2013.
Nakamura, I., Sugihara, S., and Takeuchi, K.: Mechanism for NO photooxidation over the oxygen-deficient TiO2 powder under visible light irradiation, Chem. Lett., 29, 1276–1277, https://doi.org/10.1246/cl.2000.1276, 2000.
Ndour, M., D'Anna, B., George, C., Ka, O., Balkanski, Y., Kleffman, J., Stemmler, K., and Ammann, M.: Photoenhanced uptake of NO2 on mineral dust: Laboratory experiments and model simulations, Geophys. Res. Lett., 35, L05812, https://doi.org/10.1029/2007GL032006, 2008.
Oswald, R., Behrendt, T., Ermel, M., Wu, D., Su, H., Cheng, Y., Breuninger, C., Moravek, A., Mougin, E., Delon, C., Loubet, B., Pommerening-Röser, A., Sörgel, M., Pöschl, U., Hoffmann, T., Andeae, M. O., Meixner, F. X., and Trebs, I.: HONO emissions from soil bacteria as a major source of atmospheric reactive nitrogen, Science, 341, 1233–1235, https://doi.org/10.1126/science.1242266, 2013.
Pimental, A. S., Lima, F. C. A., and da Silva, A. B. F.: The isomerization of dinitrogen tetraoxide: , J. Phys. Chem. A, 2007, 2913–2920, https://doi.org/10.1021/jp067805z, 2007.
Pinnick, D., Agnew, S., and Swanson, B.: Fluid dinitrogen tetroxide at very high pressure and high temperature: observation of the nitrite isomer, J. Phys. Chem., 96, 7092–7096, https://doi.org/10.1021/j100196a046, 1992.
Pitts, J. N., Sanhueza, E., Atkinson, R., Carter, W. P. L., Winer, A. M., Harris, G. W., and Plum, C. N.: An investigation of the dark formation of nitrous acid in environmental chambers, Int. J. Chem. Kinet., 16, 919–939, https://doi.org/10.1002/kin.550160712, 1984.
Platt, U., Perner, D., Harris, G. W., Winer, A. M., and Pitts, J. N.: Observations of nitrous acid in an urban atmosphere by differential optical absorption, Nature, 285, 312–314, https://doi.org/10.1038/285312a0, 1980.
Ramazan, K. A., Syomin, D., and Finlayson-Pitts, B. J.: The photochemical production of HONO during the heterogeneous hydrolysis of NO2, Phys. Chem. Chem. Phys., 6, 3836–3843, https://doi.org/10.1039/B402195A, 2004.
Ramazan, K. A., Wingen, L. M., Miller, Y., Chaban, G. M., Gerber, R. B., Xantheas, S. S., and Finlayson-Pitts, B. J.: New experimental and theoretical approach to the heterogeneous hydrolysis of NO2: key role of molecular nitric acid and its complexes, J. Phys. Chem. A, 110, 6886–6897, https://doi.org/10.1021/jp056426n, 2006.
Reed, C., Evans, M. J., Crilley, L. R., Bloss, W. J., Sherwen, T., Read, K. A., Lee, J. D., and Carpenter, L. J.: Evidence for renoxification in the tropical marine boundary layer, Atmos. Chem. Phys., 17, 4081–4092, https://doi.org/10.5194/acp-17-4081-2017, 2017.
Sakamaki, F., Hatakeyama, S., and Akimoto, H.: Formation of nitrous acid and nitric oxide in the heterogeneous dark reaction of nitrogen dioxide and water vapor in a smog chamber, Int. J. Chem. Kinet., 15, 1013–1029, https://doi.org/10.1002/kin.550151006, 1983.
Saliba, N. A., Moussa, S. G., and El Tayyar, G.: Contribution of airborne dust particles to HONO sources, Atmos. Chem. Phys. Discuss., 14, 4827–4839, https://doi.org/10.5194/acpd-14-4827-2014, 2014.
Sander, S., Friedl, R., Barker, J., Golden, D., Kurylo, M., Wine, P., Abbatt, J., Burkholder, J., Kolb, C., and Moortgat, G.: Chemical kinetics and photochemical data for use in atmospheric studies, evaluation number 14, JPL Publ. 02-25, 2003.
Schleicher, N., Norra, S., Chai, F., Chen, Y., Wang, S., and Stüben, D.: Anthropogenic versus geogenic contribution to total suspended atmospheric particulate matter and its variations during a two-year sampling period in Beijing, China, J. Environ. Monit., 12, 434–441, https://doi.org/10.1039/B914739J, 2010.
Seifert, N. A., Zaleski, D. P., Fehnel, R., Goswami, M., Pate, B. H., Lehmann, K. K., Leung, H. O., Marshall, M. D., and Stanton, J. F.: The gas-phase structure of the asymmetric, trans-dinitrogen tetroxide (N2O4), formed by dimerization of nitrogen dioxide (NO2), from rotational spectroscopy and ab initio quantum chemistry, J. Chem. Phys., 146, 134305, https://doi.org/10.1063/1.4979182, 2017.
Shan, J. H., Wategaonkar, S. J., and Vasudev, R.: Vibrational state dependence of the A state lifetime of HONO, Chem. Phys. Lett., 158, 317–320, https://doi.org/10.1016/0009-2614(89)87343-9, 1989.
Slater, E. J., Whalley, L. K., Woodward-Massey, R., Ye, C., Lee, J. D., Squires, F., Hopkins, J. R., Dunmore, R. E., Shaw, M., Hamilton, J. F., Lewis, A. C., Crilley, L. R., Kramer, L., Bloss, W., Vu, T., Sun, Y., Xu, W., Yue, S., Ren, L., Acton, W. J. F., Hewitt, C. N., Wang, X., Fu, P., and Heard, D. E.: Elevated levels of OH observed in haze events during wintertime in central Beijing, Atmos. Chem. Phys., 20, 14847–14871, https://doi.org/10.5194/acp-20-14847-2020, 2020.
Spataro, F. and Ianniello, A.: Sources of atmospheric nitrous acid: State of the science, current research needs, and future prospects, J. Air Waste Ma., 64, 1232–1250, https://doi.org/10.1080/10962247.2014.952846, 2014.
Stemmler, K., Ndour, M., Elshorbany, Y., Kleffmann, J., D'Anna, B., George, C., Bohn, B., and Ammann, M.: Light induced conversion of nitrogen dioxide into nitrous acid on submicron humic acid aerosol, Atmos. Chem. Phys., 7, 4237–4248, https://doi.org/10.5194/acp-7-4237-2007, 2007.
Su, H., Cheng, Y., Oswald, R., Behrendt, T., Trebs, I., Meixner, F. C., Andreae, M. O., Cheng, P., Zhang, Y., and Pöschl, U.: Soil nitrate as a source of atmospheric HONO and OH radicals, Science, 333, 1616–1618, https://doi.org/10.1126/science.1207687, 2011.
Syomin, D. A. and Finlayson-Pitts, B. J.: HONO decomposition on borosilicate glass surfaces: implications for environmental chamber studies and field experiments, Phys. Chem. Chem. Phys., 5, 5236–5242, https://doi.org/10.1039/b309851f, 2003.
Takeuchi, M., Sakamoto, K., Martra, G., Coluccia, S., and Anpo, M.: Mechanism of photoinduced superhydrophilicity on the TiO2 photocatalyst surface, J. Phys. Chem. B, 109, 15422–15428, https://doi.org/10.1021/jp058075i, 2005.
Varner, M. E., Finlayson-Pitts, B. J., and Gerber, R. B.: Reaction of a charge-separated ONONO2 species with water in the formation of HONO: an MP2 molecular dynamics study, Phys. Chem. Chem. Phys., 16, 4483–4487, https://doi.org/10.1039/c3cp55024a, 2014.
Wang, C., Bottorff, B., Reidy, E., Rosales, C. M. F., Collins, D. B., Novoselac, A., Farmer, D. K., Vance, M. E., Stevens, P. S., and Abbatt, J. P. D.: Cooking, Bleach Cleaning, and Air Conditioning Strongly Impact Levels of HONO in a House, Environ. Sci. Technol., 54, 13488–13497, 10.1021/acs.est.0c05356, 2020.
Wang, J. and Koel, B. E.: IRAS studies of NO2, N2O3, and N2O4 adsorbed on Au (111) surfaces and reactions with coadsorbed H2O, J. Phys. Chem. A, 102, 8573–8579, https://doi.org/10.1021/jp982061d, 1998.
Wang, J. and Koel, B. E.: Reactions of N2O4 with ice at low temperatures on the Au (111) surface, Surf. Sci., 436, 15–28, https://doi.org/10.1016/S0039-6028(99)00457-4, 1999.
Wexler, A. S. and Clegg, S. L.: Atmospheric aerosol models for systems including the ions H+, NH, Na+, SO, NO, Cl−, Br−, and H2O, J. Geophys. Res.-Atmos., 107, ACH 14-11–ACH 14-14, https://doi.org/10.1029/2001JD000451, 2002.
Whalley, L. K., Furneaux, K. L., Goddard, A., Lee, J. D., Mahajan, A., Oetjen, H., Read, K. A., Kaaden, N., Carpenter, L. J., Lewis, A. C., Plane, J. M. C., Saltzman, E. S., Wiedensohler, A., and Heard, D. E.: The chemistry of OH and HO2 radicals in the boundary layer over the tropical Atlantic Ocean, Atmos. Chem. Phys., 10, 1555–1576, https://doi.org/10.5194/acp-10-1555-2010, 2010.
Whalley, L. K., Stone, D., Dunmore, R., Hamilton, J., Hopkins, J. R., Lee, J. D., Lewis, A. C., Williams, P., Kleffmann, J., Laufs, S., Woodward-Massey, R., and Heard, D. E.: Understanding in situ ozone production in the summertime through radical observations and modelling studies during the Clean air for London project (ClearfLo), Atmos. Chem. Phys., 18, 2547–2571, https://doi.org/10.5194/acp-18-2547-2018, 2018.
Whalley, L. K., Slater, E. J., Woodward-Massey, R., Ye, C., Lee, J. D., Squires, F., Hopkins, J. R., Dunmore, R. E., Shaw, M., Hamilton, J. F., Lewis, A. C., Mehra, A., Worrall, S. D., Bacak, A., Bannan, T. J., Coe, H., Percival, C. J., Ouyang, B., Jones, R. L., Crilley, L. R., Kramer, L. J., Bloss, W. J., Vu, T., Kotthaus, S., Grimmond, S., Sun, Y., Xu, W., Yue, S., Ren, L., Acton, W. J. F., Hewitt, C. N., Wang, X., Fu, P., and Heard, D. E.: Evaluating the sensitivity of radical chemistry and ozone formation to ambient VOCs and NOx in Beijing, Atmos. Chem. Phys., 21, 2125–2147, https://doi.org/10.5194/acp-21-2125-2021, 2021.
Winer, A. M. and Biermann, H. W.: Long pathlength differential optical absorption spectroscopy (DOAS) measurements of gaseous HONO, NO2 and HCNO in the California South Coast Air Basin, Res. Chem. Intermed., 20, 423–445, https://doi.org/10.1163/156856794X00405, 1994.
Wu, L., Li, X., and Ro, C.: Hygroscopic behavior of ammonium sulfate, ammonium nitrate, and their mixture particles, Asian J. Atmos. Environ., 13.3, 196–211, https://doi.org/10.5572/ajae.2019.13.3.196, 2019.
Ye, C., Zhou, X., Pu, D., Stutz, J., Festa, J., Spolaor, M., Tsai, C., Cantrell, C., Mauldin, R. L., Campos, T., Weinheimer, A., Hornbrook, R. S., Apel, E. C., Guenther, A., Kaser, L., Yuan, B., Karl, T., Haggerty, J., Hall, S., Ullmann, K., Smith, J. N., Ortega, J., and Knote, C.: Rapid cycling of reactive nitrogen in the marine boundary layer, Nature, 532, 489–491, https://doi.org/10.1038/nature17195, 2016.
Ye, C., Heard, D. E., and Whalley, L. K.: Evaluation of novel routes for NOx formation in remote regions, Environ. Sci. Technol., 51, 7442–7449, ht 2017a.
Ye, C., Zhang, N., Gao, H., and Zhou, X.: Photolysis of particulate nitrate as a source of HONO and NOx, Environ. Sci. Technol., 51, 6849–6856, https://doi.org/10.1021/acs.est.7b00387, 2017b.
Zhou, X., Gao, H., He, Y., Huang, G., Bertman, S. B., Civerolo, K., and Schwab, J.: Nitric acid photolysis on surfaces in low NOx environments: Significant atmospheric implications, Geophys. Res. Lett., 30, 2217, https://doi.org/10.1029/2003GL018620, 2003.