the Creative Commons Attribution 4.0 License.
the Creative Commons Attribution 4.0 License.
 | 15 Apr 2021
A study of the effect of aerosols on surface ozone through meteorology feedbacks over China
Apostolos Voulgarakis
Tijian Wang
Matthew Kasoar
Chris Wells
Cheng Yuan
Sunil Varma
Laura Mansfield
Interactions between aerosols and gases in the atmosphere have been the focus of an increasing number of studies in recent years. Here, we focus on aerosol effects on tropospheric ozone that involve meteorological feedbacks induced by aerosol–radiation interactions. Specifically, we study the effects that involve aerosol influences on the transport of gaseous pollutants and on atmospheric moisture, both of which can impact ozone chemistry. For this purpose, we use the UK Earth System Model (UKESM1), with which we performed sensitivity simulations including and excluding the aerosol direct radiative effect (ADE) on atmospheric chemistry, and focused our analysis on an area with a high aerosol presence, namely China. By comparing the simulations, we found that ADE reduced shortwave radiation by 11 % in China and consequently led to lower turbulent kinetic energy, weaker horizontal winds and a shallower boundary layer (with a maximum of 102.28 m reduction in north China). On the one hand, the suppressed boundary layer limited the export and diffusion of pollutants and increased the concentration of CO, SO2, NO, NO2, PM2.5 and PM10 in the aerosol-rich regions. The ratio generally increased and led to more ozone depletion. On the other hand, the boundary layer top acted as a barrier that trapped moisture at lower altitudes and reduced the moisture at higher altitudes (the specific humidity was reduced by 1.69 % at 1493 m on average in China). Due to reduced water vapour, fewer clouds were formed and more sunlight reached the surface, so the photolytical production of ozone increased. Under the combined effect of the two meteorology feedback methods, the annual average ozone concentration in China declined by 2.01 ppb (6.2 %), which was found to bring the model into closer agreement with surface ozone measurements from different parts of China.
- Article
(4819 KB) - Full-text XML
-
Supplement
(582 KB) - BibTeX
- EndNote


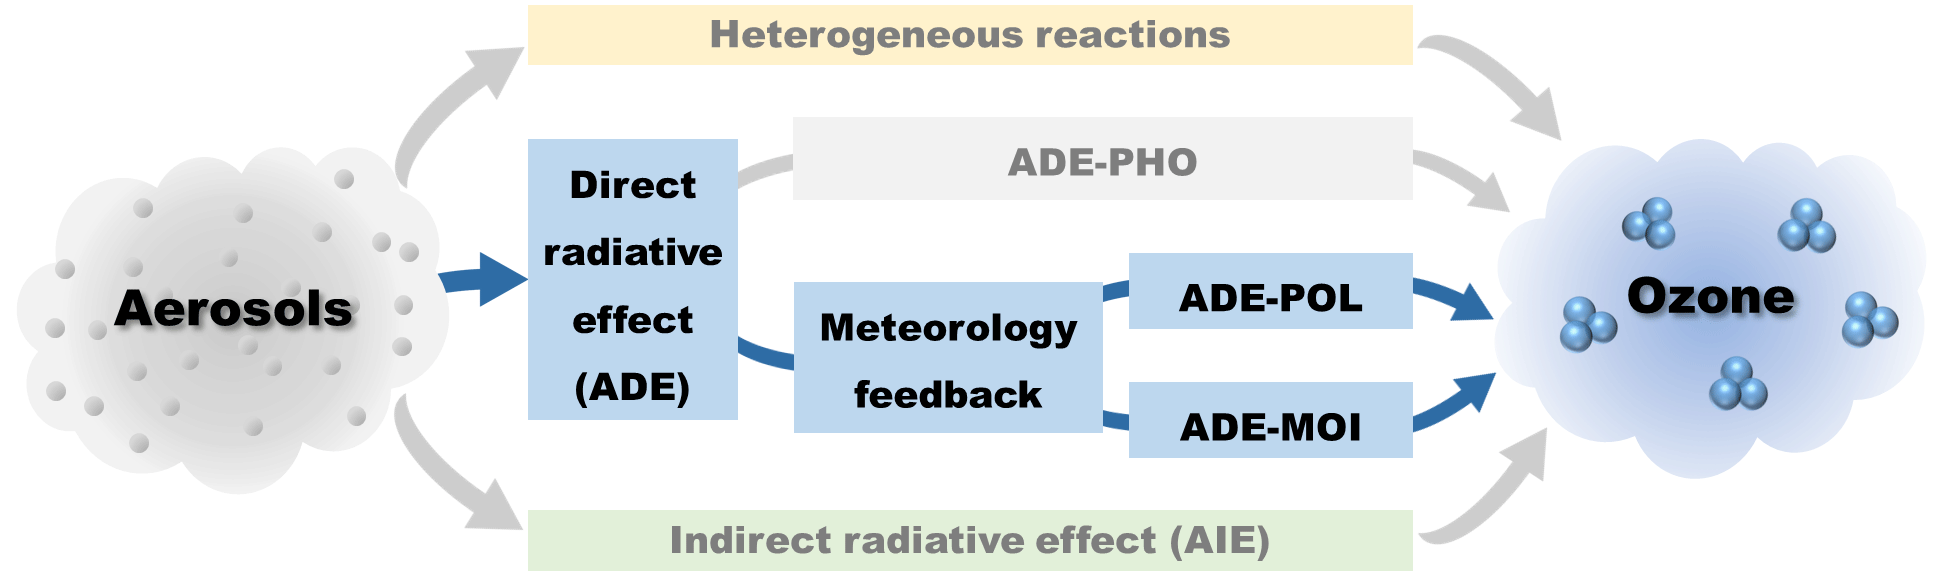
Figure 1The mechanism of aerosols affecting ozone. The main topic of this paper has been marked as blue lines and blocks.
Atmospheric aerosols could change the Earth's radiation budget by scattering and absorbing the incoming solar radiation, which is known as the aerosol direct radiative effect (ADE; Myhre et al., 2013). Scattering aerosols, such as sulfate, nitrate, organic carbon and sea salt, reflect shortwave radiation and lead to negative radiative forcing (Choi and Chung, 2014; Hollaway et al., 2019), while absorbing aerosols, such as black carbon (BC) and dust, absorb sunlight and lead to positive radiative forcing at the top of the atmosphere. Absorbing aerosols heat the atmosphere but cool the Earth's surface by reducing the downward solar radiation. Aerosols can also influence the radiation by aerosol–cloud interactions, i.e. the aerosol indirect effect (AIE). By acting as condensation and nucleation sites, aerosols are related to clouds' microphysical development. When there are more aerosols, there will be more clouds but smaller droplets, leading to brighter clouds and more shortwave radiation being reflected back to space (Twomey, 1974). In addition, the higher number but smaller size of cloud droplets mean delayed precipitation and a longer lifetime of clouds (Albrecht, 1989; Stevens and Feingold, 2009).
The direct radiative effect of aerosols plays an important role in ozone chemistry. Tropospheric ozone is produced mainly by the photolysis of NO2 (NO2 + hν → NO + O3P, followed by O3P + O2 → O3) and can also be destroyed by photolysis (O3 + hν → O2 + O1D). The photodissociation reaction rate (photolysis rate) is greatly related to shortwave radiation, which can be influenced by aerosols (He and Carmichael, 1999). Due to ADE, the photolysis rates of NO2 () and O1D () have been found to be reduced by 3 % to 30 % in Europe (Real and Sartelet, 2011), Texas (Flynn et al., 2010), Mexico (Castro et al., 2001; L. Li et al., 2011), Russia (Péré et al., 2015) and China (Hollaway et al., 2019; Wang et al., 2019; Xu et al., 2012), with consequent effects on ozone concentration.
In addition to its impact on photochemical reactions, ADE can affect meteorological conditions by influencing the regional energy balance and the vertical structure of the planetary boundary layer (PBL). The PBL is the bottom layer of the atmosphere that connects it to the Earth's surface (Stull, 1988). The air pollutants in the troposphere, including ozone and its precursors, are primarily distributed in the PBL and can be redistributed by turbulent mixing, advective (horizontal) transport and vertical diffusion (H. Li et al., 2018). The top of the PBL also acts as a barrier, which prevents aerosols, water vapour and other chemicals to be exchanged between the PBL and the free troposphere. The radiative effect of aerosols reduces downward solar radiation and therefore cools the Earth's surface, which leads to lower turbulent kinetic energy and lower PBL height (Z. Li et al., 2017; Wilcox et al., 2016). A high aerosol loading has also been found to be responsible for a delayed PBL formation in the morning and an earlier PBL collapse in the afternoon (Barbaro et al., 2014). Meanwhile, a more stable boundary layer could slow down the atmospheric movement and make it less likely for pollutants to be transported and dispersed. The relationship between PBL characteristics and pollution events has been highlighted for various regions around the world, e.g. Spain (Adame et al., 2015), Paris (Dupont et al., 2016), India (Nair et al., 2018; Patil et al., 2014) and China (Gao et al., 2015; Liu et al., 2020; Miao and Liu, 2019; Qu et al., 2017). Though boundary layer ozone is less restricted to the PBL due to its relatively long lifetime (Hayashida et al., 2018; Verstraeten et al., 2015), the consumers and precursors of ozone could be influenced by this meteorological feedback between aerosols and the PBL (Nguyen et al., 2019), therefore influencing ozone itself.
Another possible mechanism that is even less direct is the following: by weakening atmospheric movement and lowering the PBL, water vapour increases in the PBL and becomes difficult to be transported from the PBL to the free troposphere (Hansen et al., 1997). The reduced humidity will limit the development of clouds, thus allowing more sunlight to reach the surface (Wilcox et al., 2016). The photolysis rates that drive atmospheric photochemical reactions thereby vary and result in the changes in air pollutants and ozone levels (Johnson, 2003). Tang et al. (2003) found that clouds have a large impact on tropospheric photolysis rates and ozone concentration, which leads to a decrease in by 20 % and in ozone by 1.2 % below clouds along the Transport and Chemical Evolution over the Pacific (TRACE-P) experiment flight paths. On a global scale, Liu et al. (2006) found that clouds have a smaller impact on photolysis rates (less than −5 %). Using the Cambridge p-TOMCAT chemical transport model (CTM), Voulgarakis et al. (2009a, b) showed that clouds have a modest effect on global average ozone but have a larger impact in the areas with higher cloud cover.
Apart from the radiative effect, aerosols can also influence ozone through the chemical effect, which is a heterogeneous reaction. By reacting with ozone, nitrogen oxides, OH, HO2, H2O2, etc., mineral and carbonaceous aerosols can affect ozone concentration directly and indirectly (Bauer, 2004; Ramachandran, 2015; Tang et al., 2017).
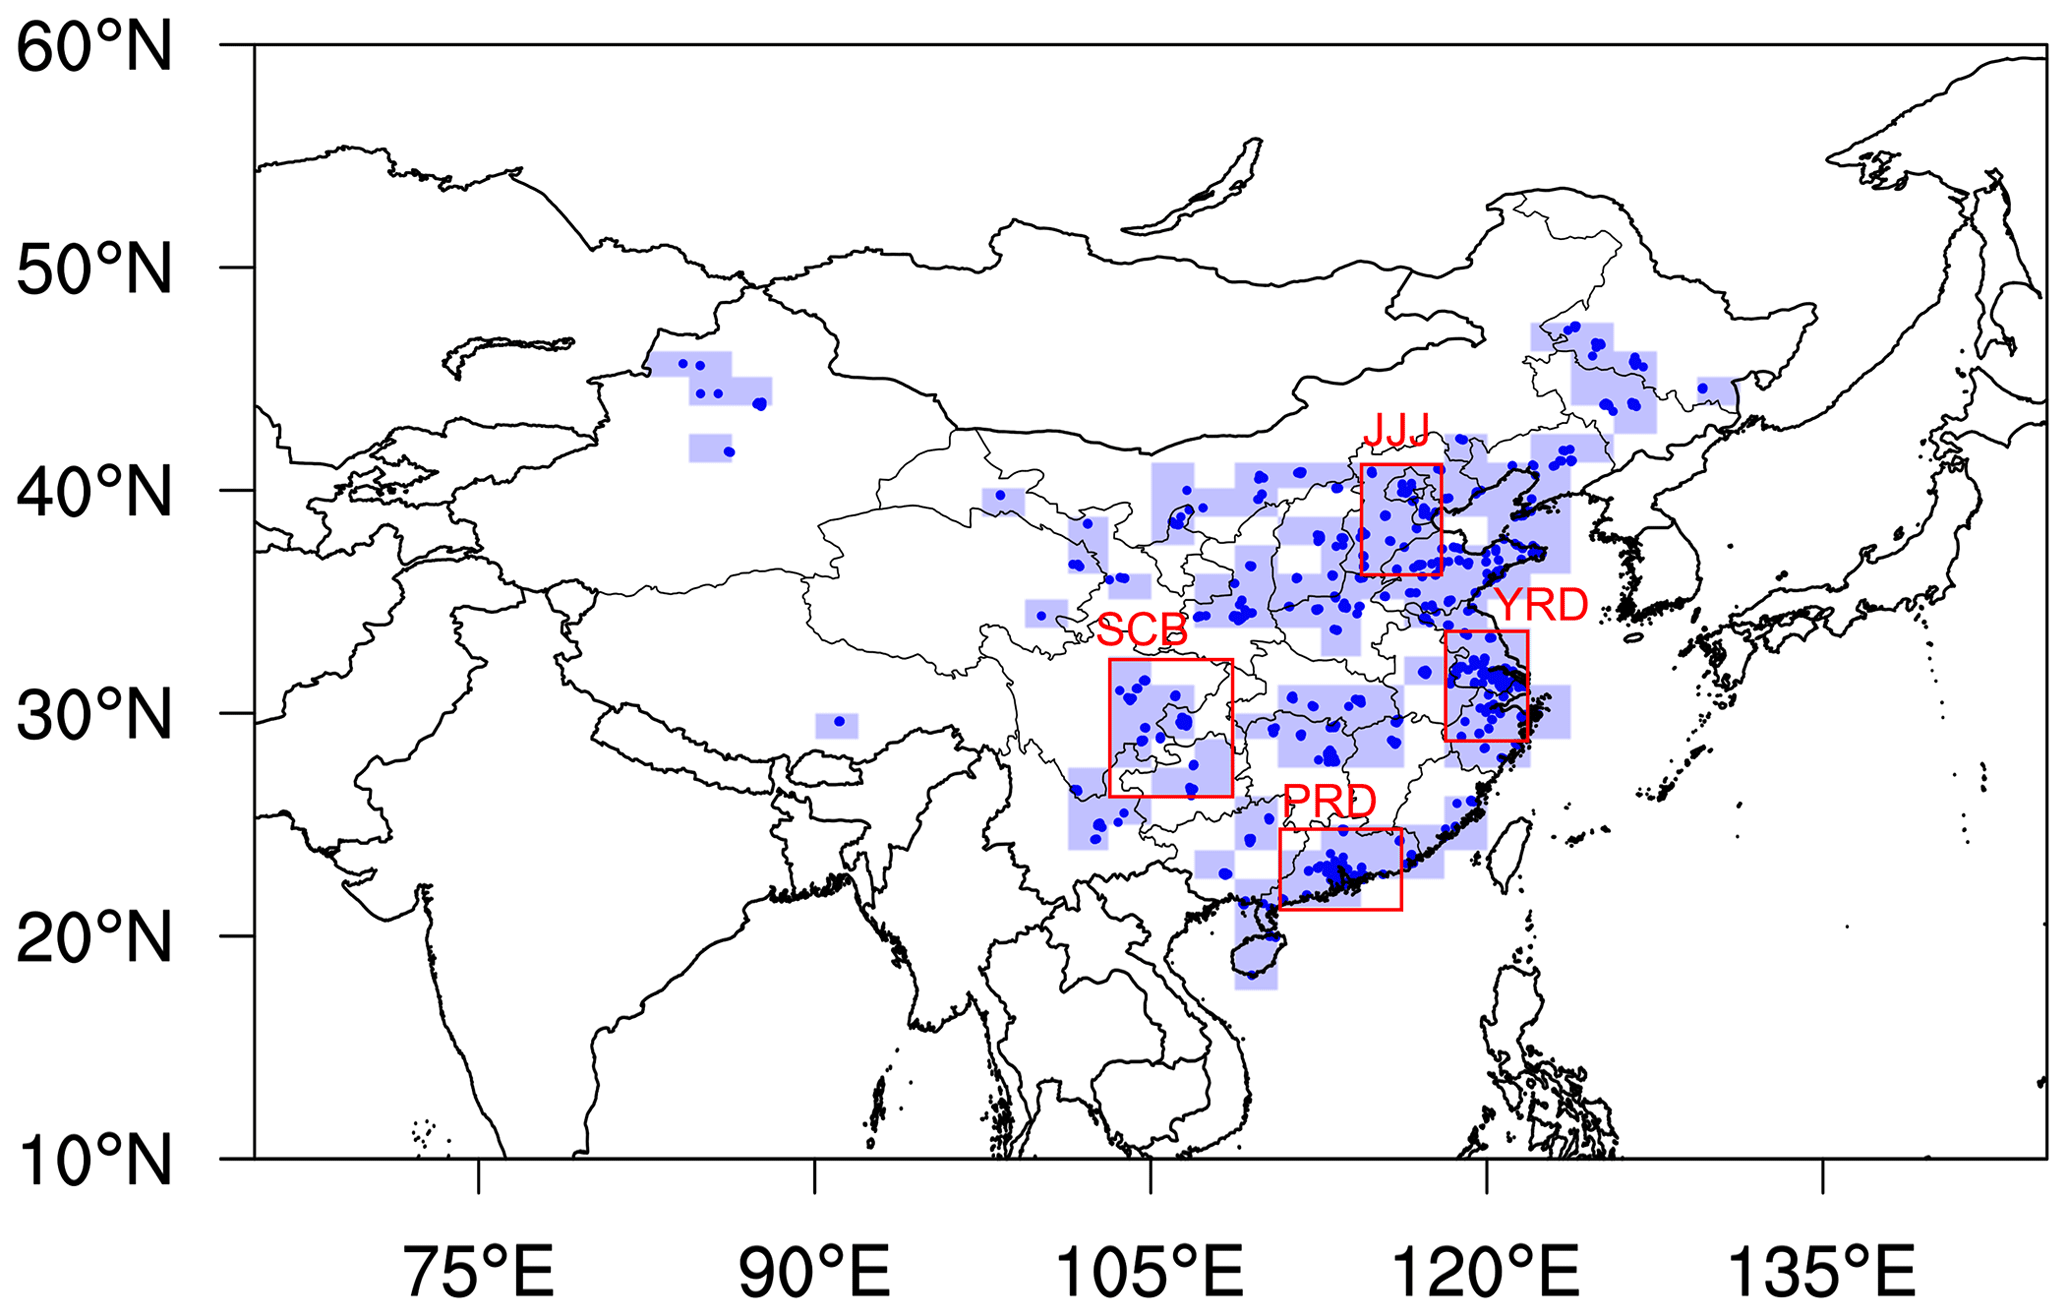
Figure 2Monitoring sites (blue dots), model grid cells including the monitoring sites (pale blue squares) and the location of the four selected regions for further analysis (red grids): Jing–Jin–Ji (JJJ), the Yangtze River Delta (YRD), the Pearl River Delta (PRD) and the Sichuan Basin (SCB).
Based on the above, Fig. 1 summarises five possible influences of aerosols on ozone: (1) heterogeneous reactions, (2) directly changing photolysis rate (ADE-PHO), (3) influencing the distribution of atmospheric pollutants, including ozone and its precursors through meteorological feedbacks (ADE-POL), (4) changing the photolysis rates through influencing moisture transport (ADE-MOI), and (5) modifying clouds and, consequently, chemistry via microphysics, i.e. the aerosol indirect effect (AIE). ADE-POL and ADE-MOI can be thought of as the meteorological mechanisms that are both dominated by atmospheric transport feedbacks. Regarding the chemical effect, the impact of heterogeneous reactions on ozone has been investigated through a lot of laboratory and model studies (Bauer, 2004; Griffiths and Anthony Cox, 2009; Stewart and Cox, 2004; Tang et al., 2017). Regarding radiative effects, though the aerosol radiative influence on climate has been widely studied, the less abundant studies of their influence on ozone mainly focus on ADE-PHO (J. Li et al., 2011; Qu et al., 2019) and AIE (Hall et al., 2018; Voulgarakis et al., 2009a; Wild et al., 2000), while ADE-POL and ADE-MOI are much less discussed in the literature. Therefore, in this paper, we exclude the impact of heterogeneous reactions and direct photochemical or microphysical effects and focus on the combined effect of ADE-POL and ADE-MOI, i.e. the meteorological feedback, on tropospheric ozone. This enables a better understanding of the interaction between aerosols and ozone in China and provides a more comprehensive scientific background for the control of atmospheric particulate matter, ozone and photochemical pollution.
A set of sensitivity simulations has been performed, by using the first version of the UK Earth System Model (UKESM1), to investigate the influence of meteorological feedbacks of aerosols on ozone in different parts of East Asia. Section 2 introduces the observational data and numerical model set-up that is used in this study. Section 3.1 evaluates the performance of the numerical model by comparing it to observational data. Section 3.2 discusses the aerosol–PBL feedback. Section 3.3 demonstrates the impact of ADE on atmospheric pollutants (ADE-POL). Section 3.4 demonstrates the impact of ADE on moisture, clouds and then photolysis rates (ADE-MOI). Section 3.5 discusses the combined effect of ADE-POL and ADE-MOI on ozone. The conclusions and perspective are presented in Sect. 4.
2.1 Observation
Air pollutant concentrations at more than 1000 national ambient air quality monitoring sites are released by the Ministry of Environmental Protection (MEP) of China and can be downloaded from the China National Environmental Monitoring Center (CNEMC, http://www.cnemc.cn/sssj/, last access: 13 April 2021). The technical requirements for the monitoring system including the composition, installation, operation, maintenance and data quality control are addressed in the China Environmental Protection Standards “HJ 193-2013” (http://www.mee.gov.cn/ywgz/fgbz/bz/bzwb/jcffbz/201308/W020130802493970989627.pdf, last access: 13 April 2021) and “HJ 655-2013” (http://www.mee.gov.cn/ywgz/fgbz/bz/bzwb/jcffbz/201308/W020130802492823718666.pdf, last access: 13 April 2021). In this paper, the hourly concentrations of SO2, NO2, O3, CO, PM2.5 and PM10 at 1412 monitoring sites in 2014 were utilised from CNEMC. The locations of the monitoring sites are shown in Fig. 2. The observational data were used to evaluate the simulated air pollution over China.
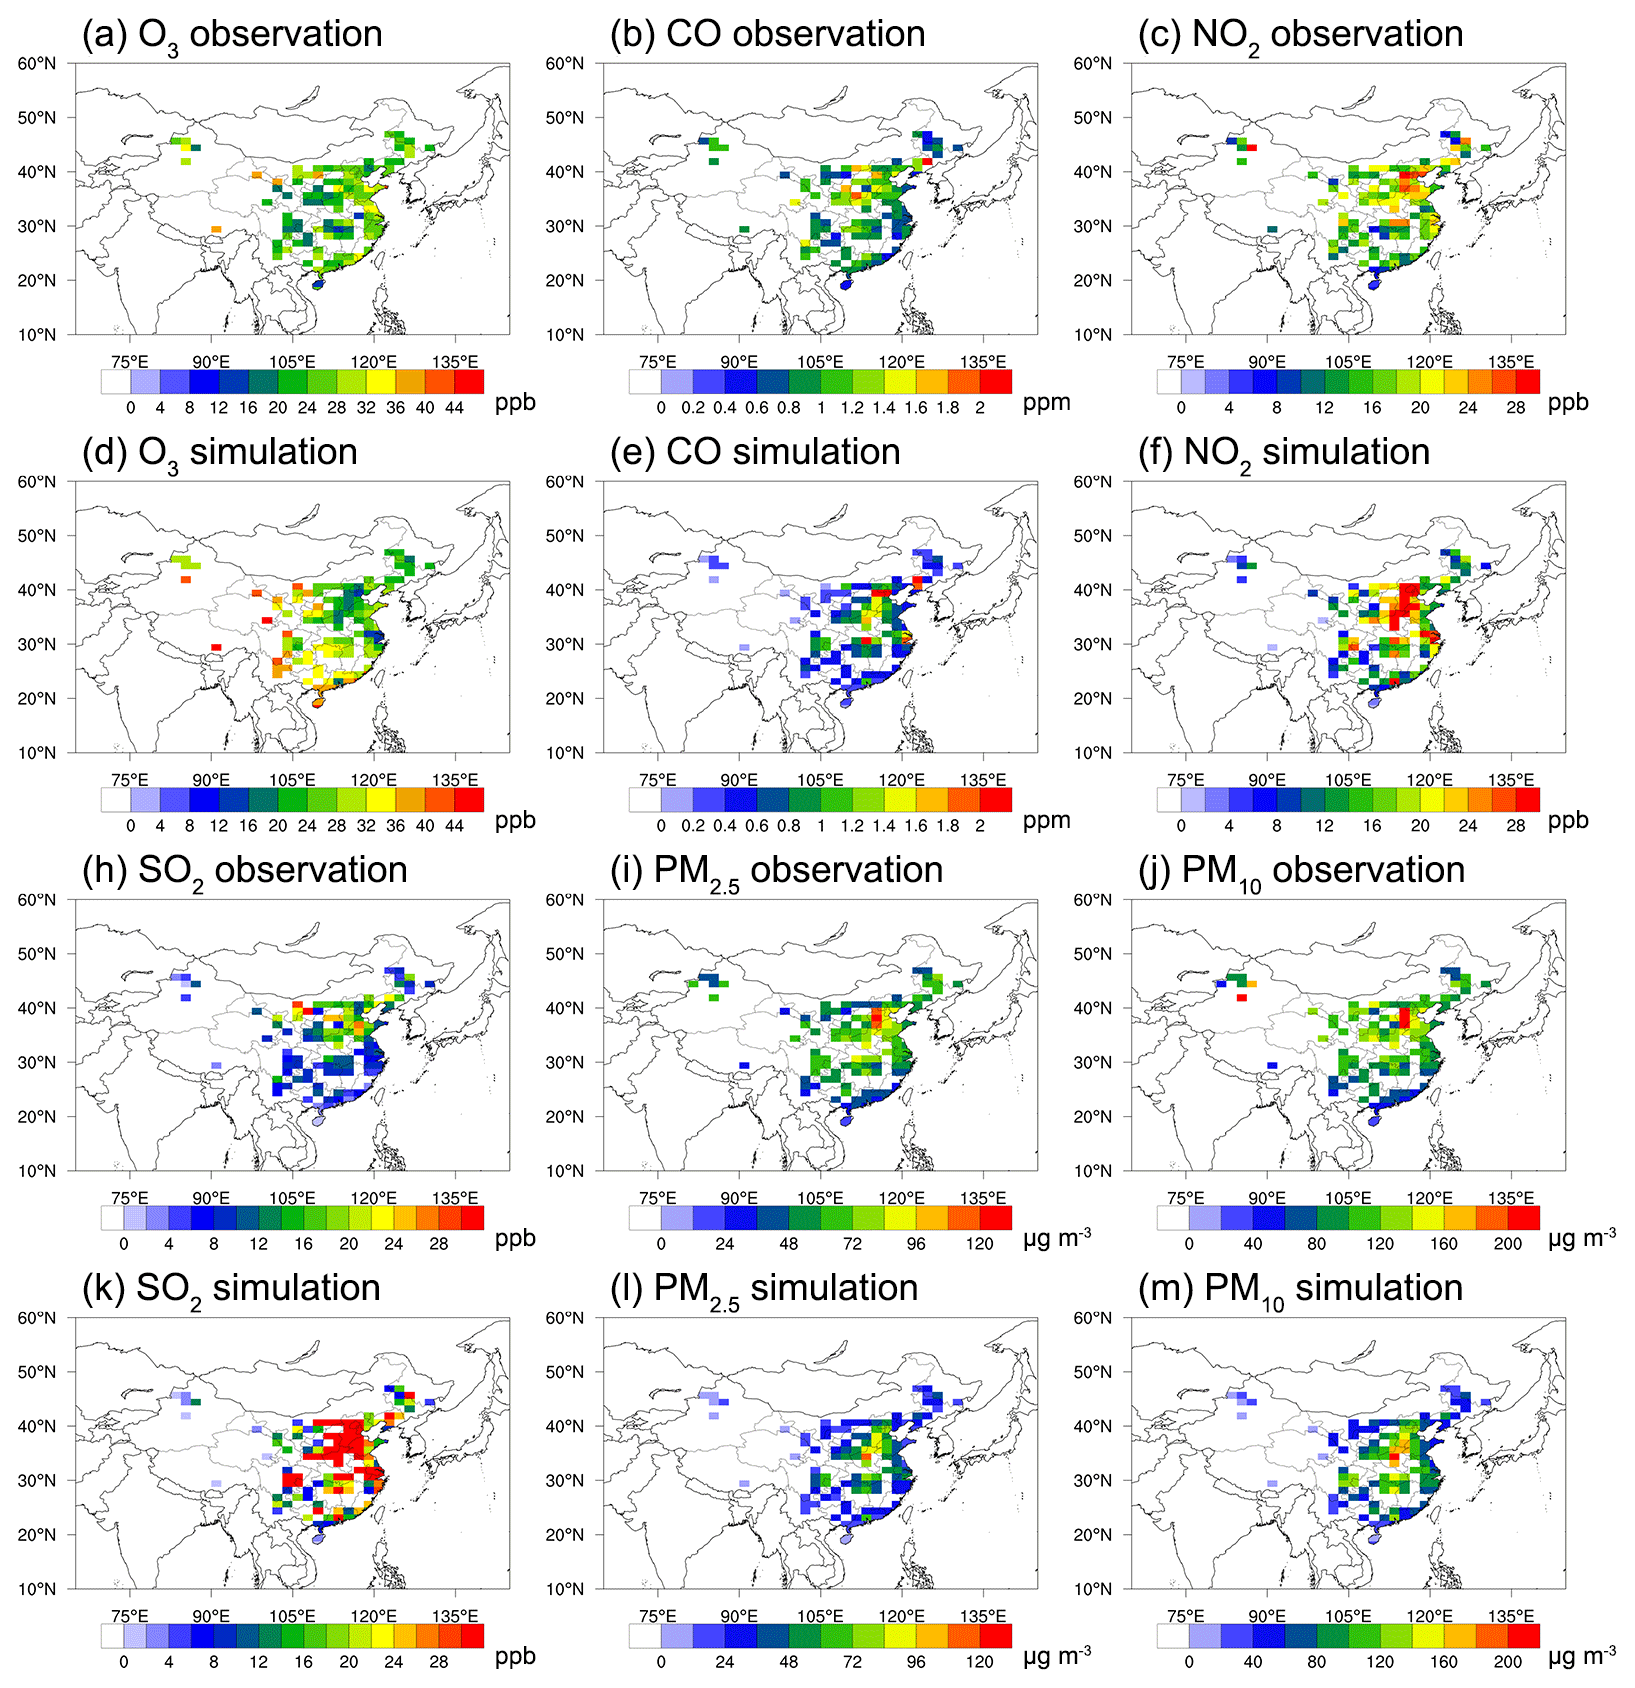
Figure 3The observed and simulated (EXPradon) annual average concentrations of (a, d) O3, (b, e) CO, (c, f) NO2, (h, k) SO2, (i, l) PM2.5 and (j, m) PM10 in the model grid points in 2014.
2.2 UKESM1-AMIP
The first version of the United Kingdom Earth System Model (UKSEM1) is jointly developed by Natural Environment Research Council (NERC) and the Met Office Hadley Centre and was released in February 2019 (Sellar et al., 2019). UKESM1 is based on the physical climate model HadGEM3 (Hewitt et al., 2011; Kuhlbrodt et al., 2018; Williams et al., 2018) and couples additional components, including a land biogeochemistry model (JULES; Clark et al., 2011), the UK Chemistry and Aerosols model (UKCA; Archibald et al., 2020; Mulcahy et al., 2018), a dynamic vegetation model (TRIFFID; Cox, 2001) and an interactive ocean biogeochemistry model (MEDUSA; Yool et al., 2013). In this study, we used its atmosphere-only (UKESM1-AMIP) version to study the radiative effect of aerosols on ozone. Unlike the fully coupled UKESM1, the atmosphere-only configuration does not include ocean and sea ice models (NEMO/CICE), MEDUSA, or TRIFFID. Instead, UKESM1-AMIP uses prescribed, observation-based sea surface temperatures and sea ice data (https://pcmdi.llnl.gov/mips/amip/, last access: 13 April 2021). The model input for vegetation and surface ocean biology fields is provided by the UKESM1 historical simulations for the Coupled Model Intercomparison Project Phase 6 (CMIP6).
The core atmospheric model of UKESM1-AMIP is the 11.1 version of the Met Office Unified Model (UM; Walters et al., 2019), in which the atmospheric chemistry and aerosols are modelled by UKCA. The new Global Model of Aerosol Processes (GLOMAP-mode; Mann et al., 2010) is a size-resolved aerosol microphysics model. It is used for aerosol simulation in UKCA, including the mass and number of sulfate, black carbon, organic carbon and sea salt. Dust aerosols are not available yet in GLOMAP-mode, and so a bin scheme for mineral dust (Woodward, 2001) is used. The photolysis scheme in UKCA is Fast-JX (Telford et al., 2013), which provides the full scattering calculation for 18 wavelength bins over 177–850 nm. Fast-JX allows the calculation of the interactive photolysis rates in the troposphere (Wild et al., 2000) and improves the calculation of photolysis rates in the stratosphere (Bian and Prather, 2002). In order to focus on ADE-POL and ADE-MOI effects (see Sect. 1), Fast-JX has not been coupled with the GLOMAP-mode aerosol scheme, which means that photolysis rates are independent of the aerosol loading (Sellar et al., 2019).
Two sensitivity simulations were performed to evaluate the radiative effects of aerosols on ozone: (1) EXPradon, which includes the aerosol direct radiative feedback on atmospheric chemistry, and (2) EXPradoff, which is without this radiative feedback. The simulation covers 1 year, i.e. from 1 January 2014 to 31 December 2014. The atmospheric horizontal resolution of UKESM1-AMIP is N96 (∼ 140 km) and the vertical resolution is 85 levels. Emissions are the year 2014 CMIP6 emissions for all runs.
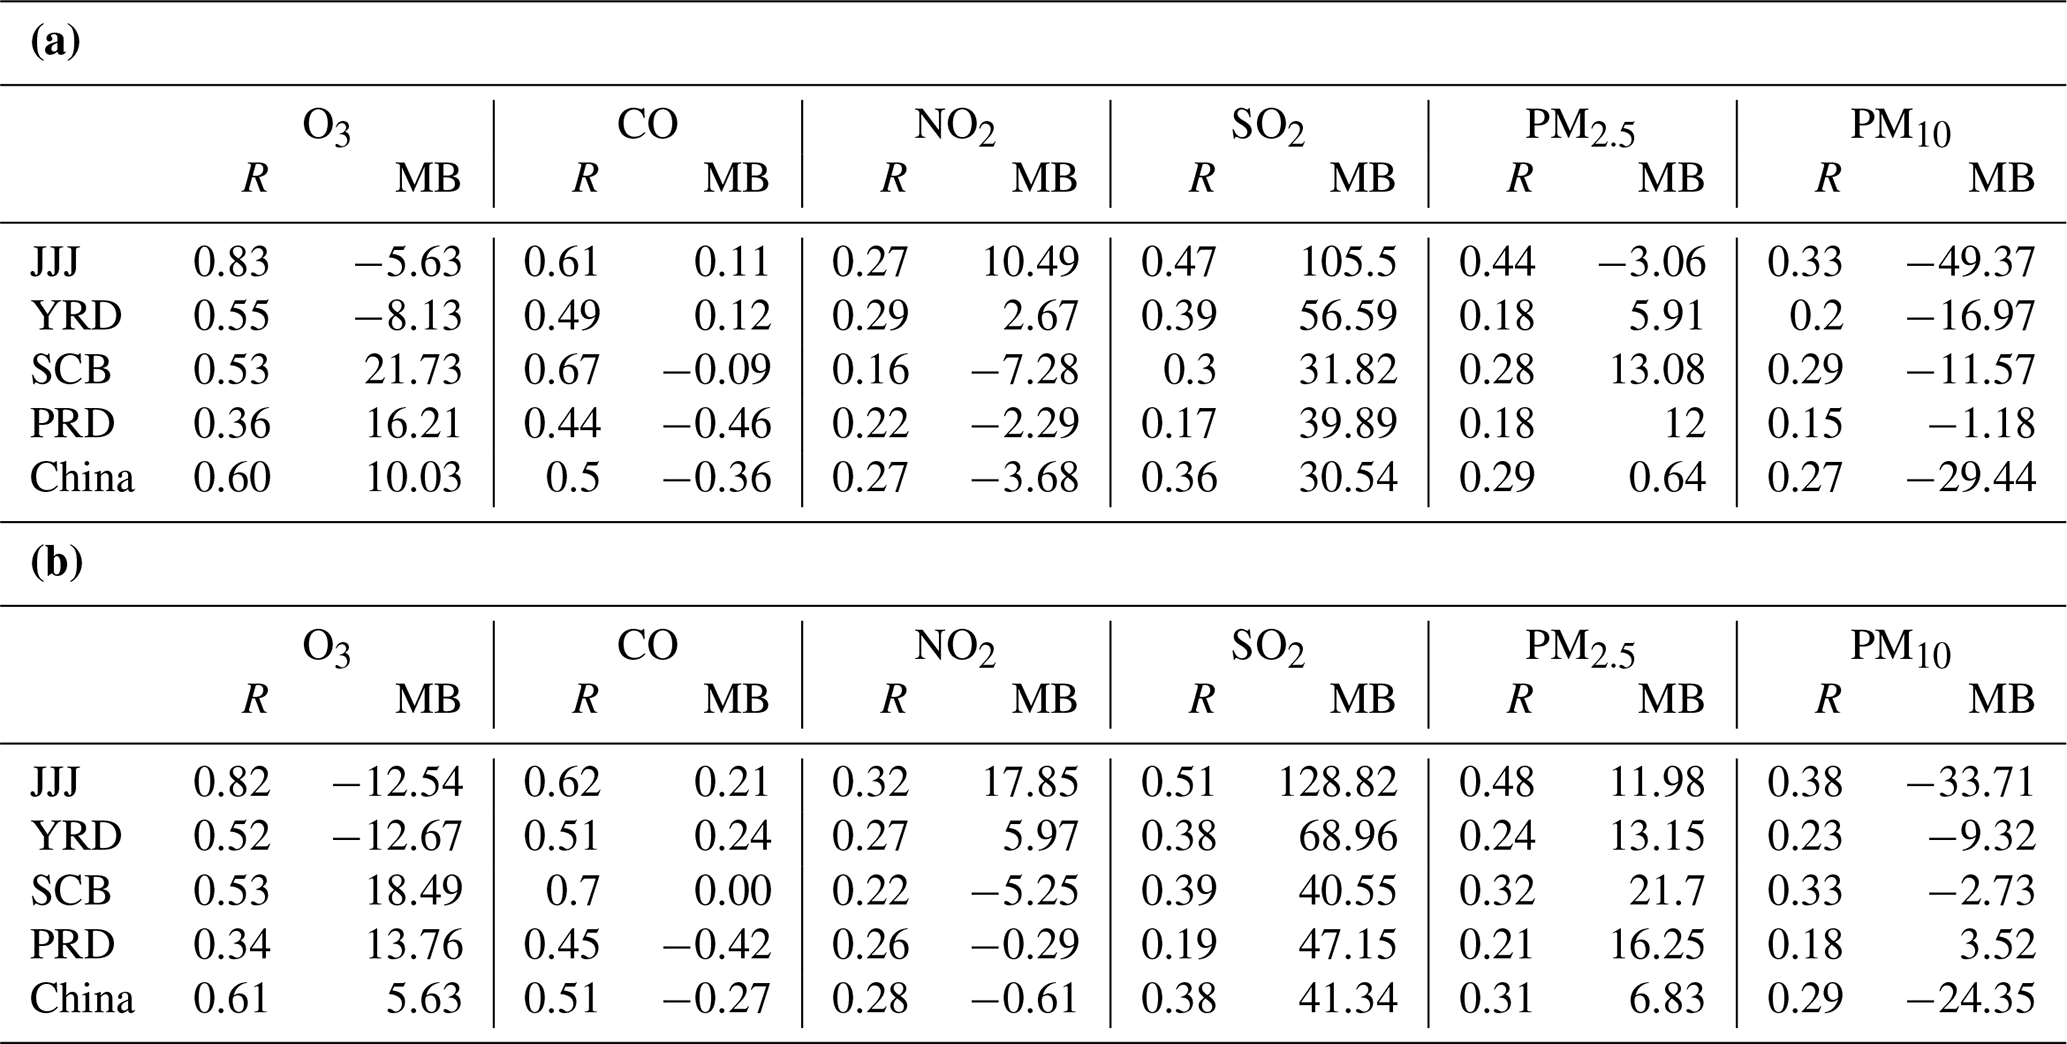
Table 1Statistical matrix for simulated and observed pollutant concentrations. (a) The correlation coefficient (R) and mean bias (MB) between observation and simulation in EXPradoff. (b) The temporal correlation coefficient (R) and mean bias (MB) between observation and simulation in EXPradon. The statistics are based on the daily average concentrations in 2014.
3.1 Model evaluation
The model performance was evaluated by comparing the simulation results at the surface layer with the ground-based observations. The simulation with radiation feedback (EXPradon) was carried out as the control test. Figure 3 shows annual average concentrations of O3, CO, NO2, SO2, PM2.5 and PM10 simulated in EXPradon along with the concentrations observed at monitoring sites. Pearson's correlation coefficient (R) and mean bias error (MB) are shown in Table 1, using daily average concentration data. In terms of the spatial distribution, the simulation results are found to be in fairly good agreement with the observations. With the economic and industrial development in north and east China, anthropogenic emissions lead to increased air pollution in these areas (M. Li et al., 2017). The model captures the high SO2, CO and NO2 concentrations and the high aerosol loading in north and east China. However, the model produces much higher SO2 concentrations than the observations, most likely due to an overestimation of the emissions. Under the clean air policies, the SO2 emission has declined by 62 % during 2010–2017 (Zheng et al., 2018), but the CMIP6 emissions do not capture this reduction, with 2014 SO2 emissions being higher by 48 % when compared to the region-specific Multi-resolution Emission Inventory for China (MEIC) (Paulot et al., 2018). For the spatial distribution of ozone, the model is in good agreement with observations. The simulated ozone concentration is well correlated with the observed values, with R reaching a maximum of 0.8 in the Jing–Jin–Ji (JJJ) area. The radiation effect improved the model performance in China. When including the meteorological feedback of radiation effect, the average MB of ozone dropped from 10.03 to 5.63, while the average R remained the same (Table 1). In most areas, the correlation between observed and simulated CO, NO, SO2 and particulate matter were higher in EXPradon than in EXPradoff, indicating that including these effects improves the simulation of tropospheric pollutants. Subsequently, we examine these effects in more detail.
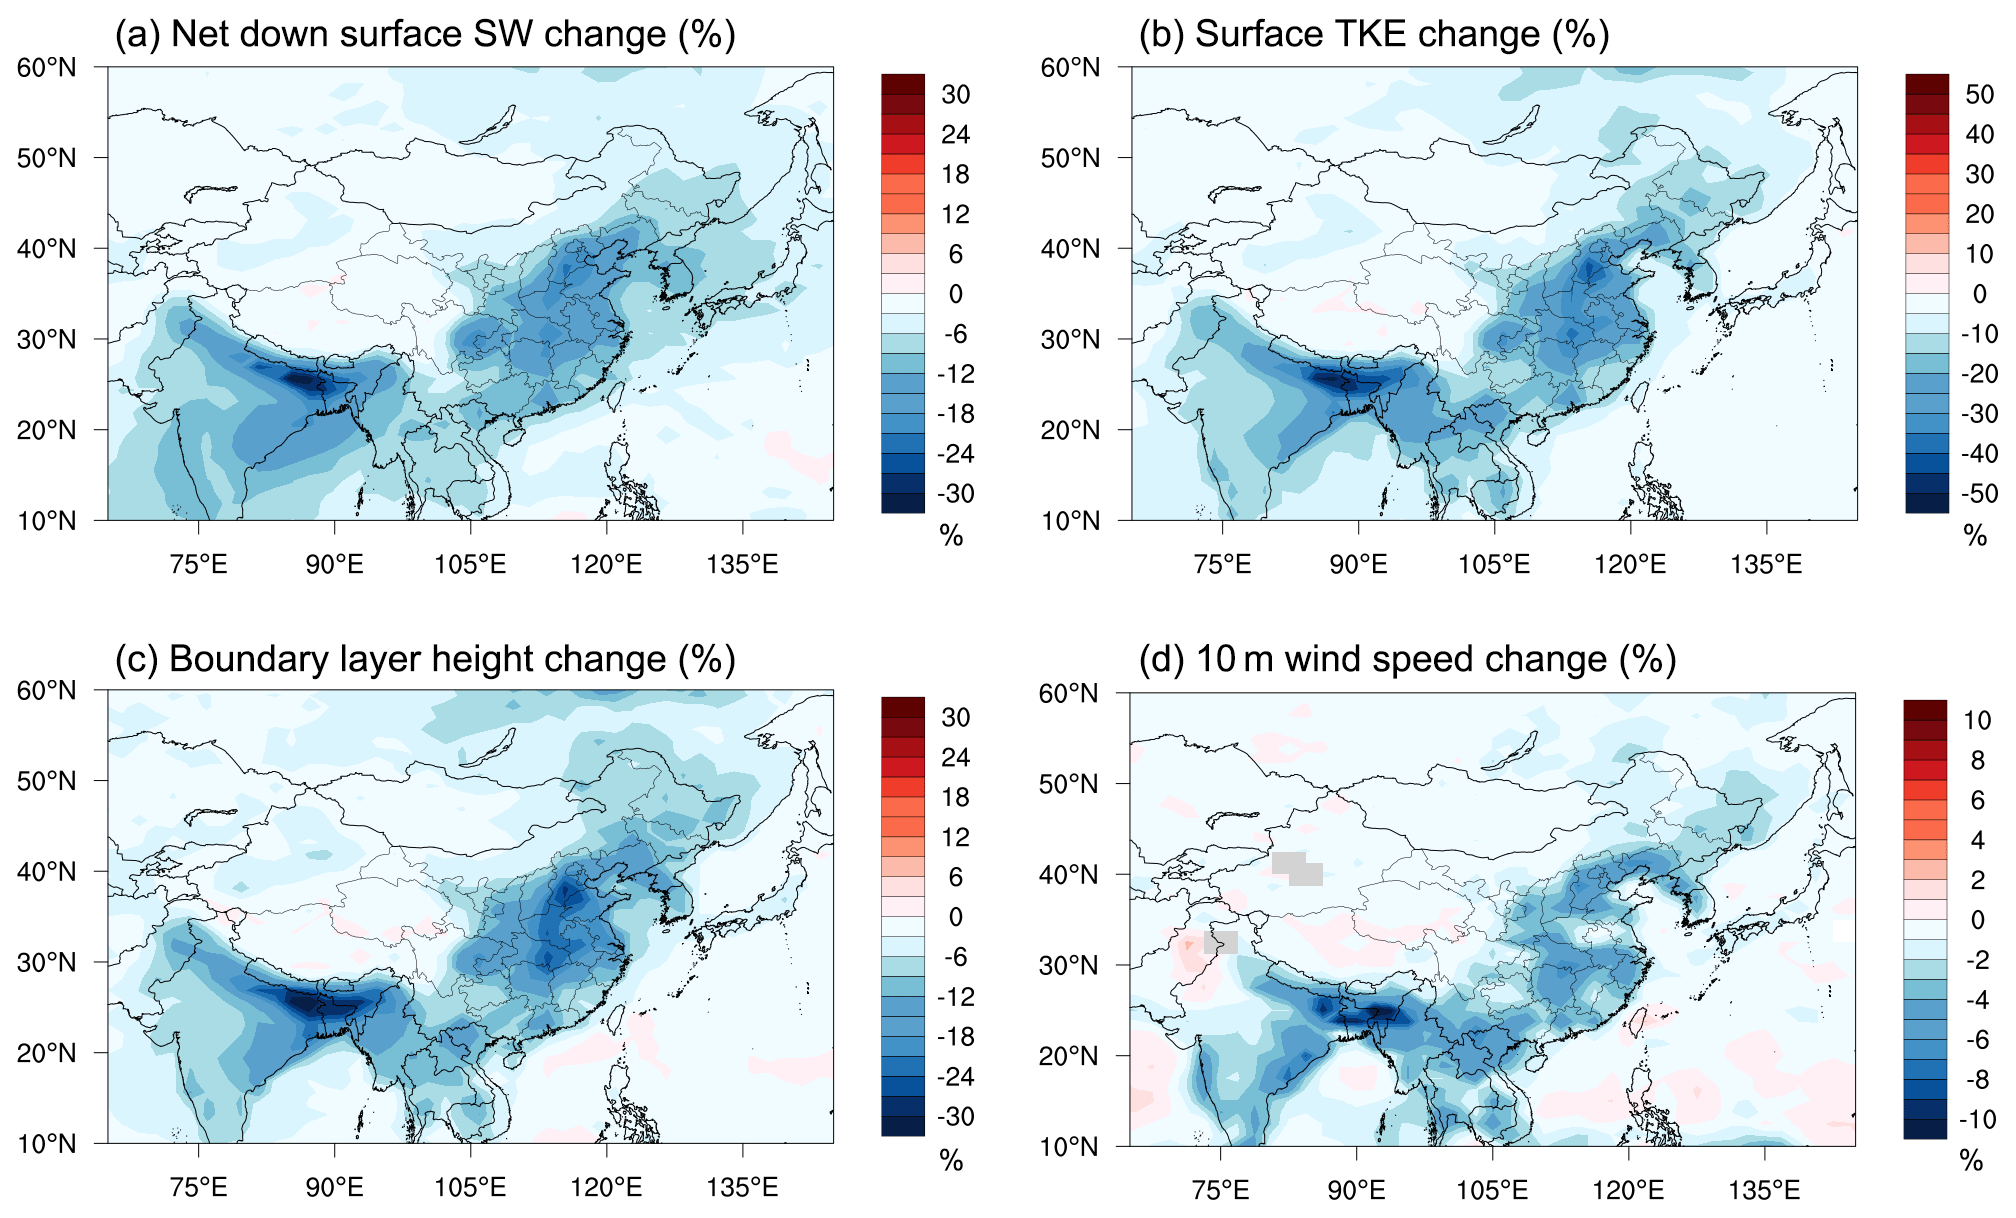
Figure 4Changes in (a) net down surface shortwave radiation, (b) turbulent kinetic energy (TKE), (c) boundary layer height and (d) wind due to the aerosol direct radiative effect. Differences are calculated as , averaged over 1 year.
3.2 Aerosol effect on meteorology
The aerosol effect on meteorology was assessed by taking averages over the 1-year simulation and taking the difference between EXPradon and EXPradoff. Figure 4 shows the changes in net downwelling surface shortwave radiation, turbulent kinetic energy, planetary boundary layer height (PBLH) and 10 m wind due to the direct effect of aerosols on radiation. Shortwave radiation is generally reduced due to aerosols over China, and the largest reduction is found in more aerosol-rich parts of the country (Fig. 3l and m), i.e. north and east China. Shortwave radiation was reduced by 30.24 W m−2 (18.85 %), 19.73 W m−2 (12.98 %), 20.45 W m−2 (11.22 %) and 16.27 W m−2 (13.53 %) in JJJ, the Yangtze River Delta (YRD), the Pearl River Delta (PRD) and the Sichuan Basin (SCB), respectively (Fig. 4a). The high-resolution regionally focused Weather Research and Forecasting model coupled with Chemistry (WRF-Chem) simulation performed by Wang et al. (2016) similarly showed that due to ADE, the solar radiation in China decreased by 20 W m−2 and the percentage changes ranged from 11.7 % to 14.3 % in different areas. A decreased downwelling solar radiation could cool the surface and cause weaker thermal turbulence in the boundary layer (Liu et al., 2018; Quan et al., 2013). The temperature at 1.5 m is found to be reduced in the North China Plain and south-west China (Fig. S1a in the Supplement) due to the radiation changes. Turbulent kinetic energy (TKE) (Fig. 4b) showed the largest change in north China (JJJ), with a decline of 0.12 m2 s−2 (33.43 %), which is consistent with China's largest SW radiation change area. This is in line with the findings of Wang et al. (2020), who found that during a haze episode in winter, the TKE in Beijing declined by 0.1–0.7 m2 s−2 due to the aerosol-induced effect. The reduction in TKE in the YRD reaches 23.09 % in our findings, which is the second-highest TKE reduction region in China.

Figure 5Changes in (a) CO, (b) SO2, (c) NO, (d) NO2, (e) PM2.5 and (f) PM10 concentration due to the aerosol direct radiative effect. Differences are calculated as , averaged over 1 year.
The growth of the boundary layer mainly depends on the atmospheric thermal structure and turbulent exchange intensity (Garratt, 1994; Serafin et al., 2018). Owing to the reduced solar radiation and TKE, the development of the PBL was suppressed and resulted in a shallower and more stable boundary layer (Fig. 4c and d). In north China (JJJ), the annual average planetary boundary layer height (PBLH) was reduced by 102.28 m (22.01 %) due to the ADE. Observations in this area also showed that the average PBLH was reduced by 334–710 m during severe pollution periods compared to clean days (Tang et al., 2016; Zhang et al., 2015). The annual delineation of PBLH in the YRD was 53.39 m (16.26 %), and this reduction was consistent with the WRF-Chem simulation by Wang et al. (2016), who found that the PBLH in east China decreased by 75.2 m in spring, while in other regions of China it decreased by 75–138 m. Using the Weather Research and Forecasting and Community Multiscale Air Quality (WRF-CMAQ) model, Nguyen et al. (2019) also found that the ADE could reduce the annual average PBLH in East Asia by 46.47 m (8.13 %). The lower boundary layer caused by aerosols is usually also accompanied by calm winds and higher relative humidity values (Yin et al., 2019). Here, the 10 m wind is found to be lowered by 1 % to 7.5 % (Fig. 4d) and relative humidity at 1.5 m increased with a maximum of 5.7 % (Fig. S1b). The variations in wind and boundary layer stability would influence horizontal transport and pollutants and moisture accumulation, as well as the vertical dispersion and the exchange of clean air with the free troposphere.
3.3 Impact of meteorology feedback via atmospheric pollutants (ADE-POL)
The aerosol direct radiative feedback was found to reduce solar radiation, which resulted in the suppression of PBL height and turbulent intensity, while the suppressed PBL in turn limits the export and diffusion of pollutants. Figure 5 shows the influence of ADE on surface CO, SO2, NO, NO2, PM2.5 and PM10 concentrations. Overall, pollutant concentrations increased when including aerosols, due to the decreasing wind speeds and PBLH. The CO increase caused by ADE averaged over China was 11.04 %, with the biggest changes appearing in north China (JJJ), east China (YRD) and central China (up to 12.25 %–16.17 %). The distribution of SO2, NO and NO2 changes is similar to that of CO, with increases of 5.66 %–38.99 %, 7.71 %–55 % and 2.78 %–40.63 %, respectively. For fine and coarse aerosols (PM2.5 and PM10), the increases are between 9.5 % and 18.6 % in the four selected areas and the spatial distributions of changes are similar to those of gaseous pollutants. Changes in gas and aerosol pollutants were the result of the changes in meteorological conditions. The shallower PBLH reduced the vertical dispersion and compressed the pollutants in the PBL, resulting in higher surface pollutant concentrations. The increased boundary layer stability and reduced wind speed also led to the accumulation of pollutants at their emission sources. The spatial distribution of the changes in pollutant concentration is similar to the spatial distribution of meteorological condition changes and emission sources. With a larger population and more developed industries, north and east China were considered to be the high-emission areas of the country (Wang, 2015; Zheng et al., 2018). These areas are more sensitive to the accumulation of pollutants and showed a stronger increase in the pollutant concentrations due to aerosol effects. Western China is less developed than the eastern parts, and its population and anthropogenic emissions are also lower (Saikawa et al., 2017; Shi et al., 2014). As a result of this, the ADE in west China caused a small increase and even a decrease in pollutant concentrations. In south-west China, the SCB is more developed than the surrounding cities, and its bowl-shaped topography helps trap air pollutants (Ning et al., 2018). More pronounced increases in pollutants' concentrations are also found in this area, but the magnitude is lower than that in JJJ and the YRD. Changes in air pollutants (including NO and NO2) in different regions affect the ratio of , which is related to the loss and the production process of ozone. The change in and ozone will be further discussed in Sect. 3.5.
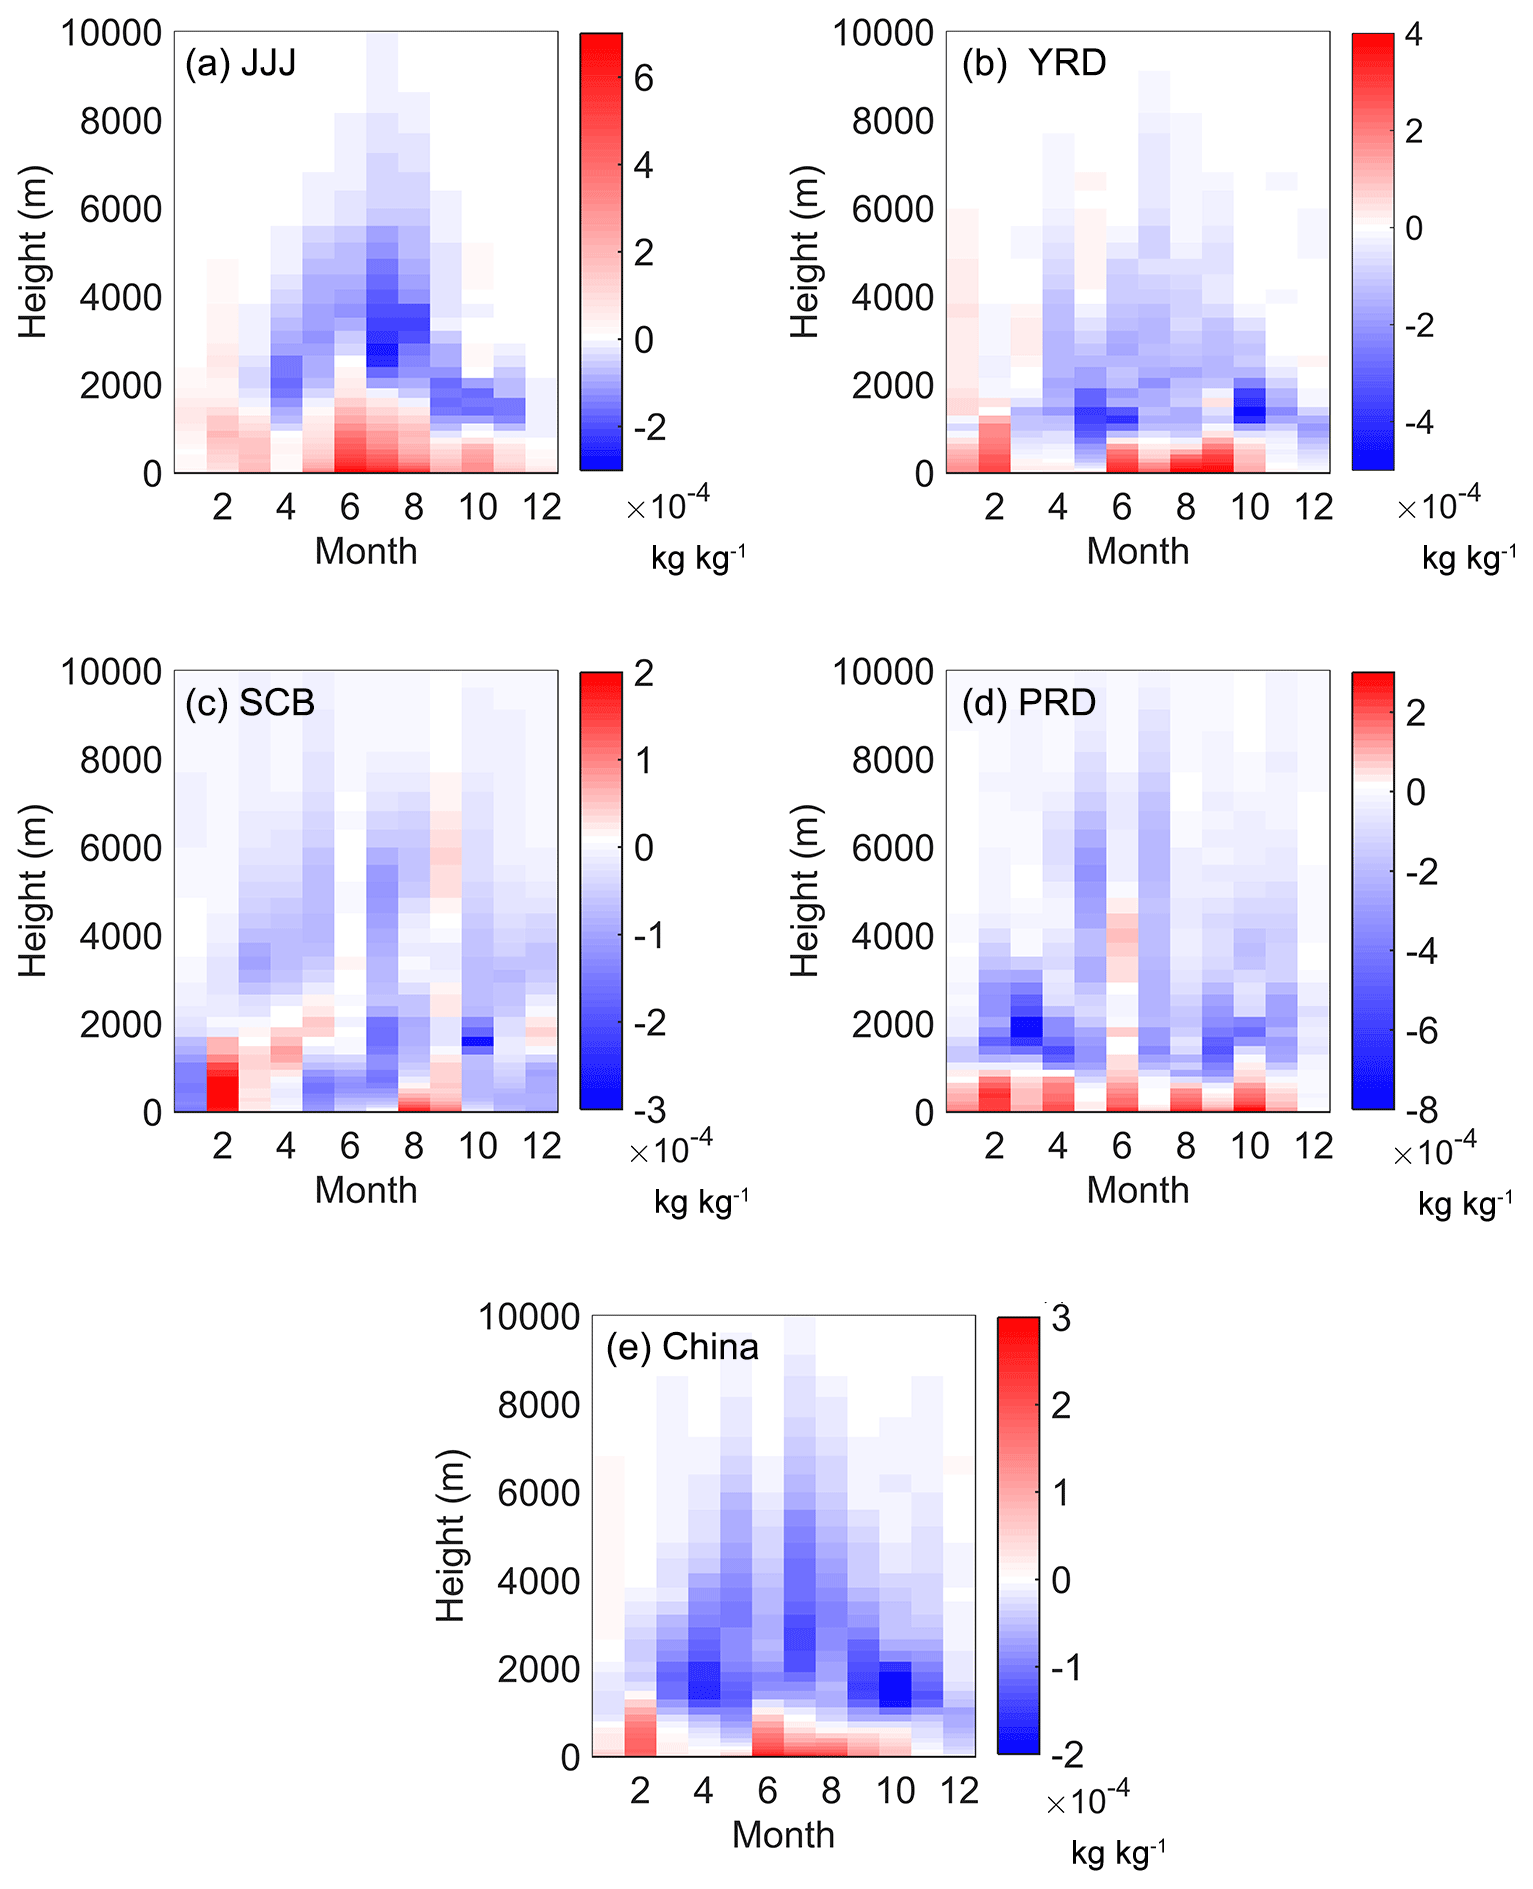
Figure 6Monthly changes in specific humidity in (a) Jing–Jin–Ji, (b) the Yangtze River Delta, (c) the Sichuan Basin, (d) the Pearl River Delta and (e) China due to the aerosol direct radiative effect. Differences are calculated as the monthly mean of EXPradon minus EXPradoff.
3.4 Impact of meteorology feedback via moisture (ADE-MOI)
The changes in boundary layer stability and PBLH would not only contribute to the pollutant accumulation but would also be linked to the moisture accumulation. The change in horizontal water vapour flux over the land area is small (Fig. S2 in the Supplement). However, a low PBLH could limit the vertical transport of water vapour from the boundary layer to the free troposphere. Figure 6 shows the vertical profile of changes in specific humidity in different parts of China. In most seasons, climatological specific humidity increases in the lower troposphere and drops in the higher layers. In JJJ, the area most affected by ADE, the surface moisture content increases more when comparing EXPradon with EXPradoff, with a maximum change of 4.28 % (6.55 × 10⁻⁴ kg kg−1) in June. The annual mean specific humidity decreased by a maximum of 1.69 % (1 × 10⁻⁴ kg kg−1) at 1493 m in China.
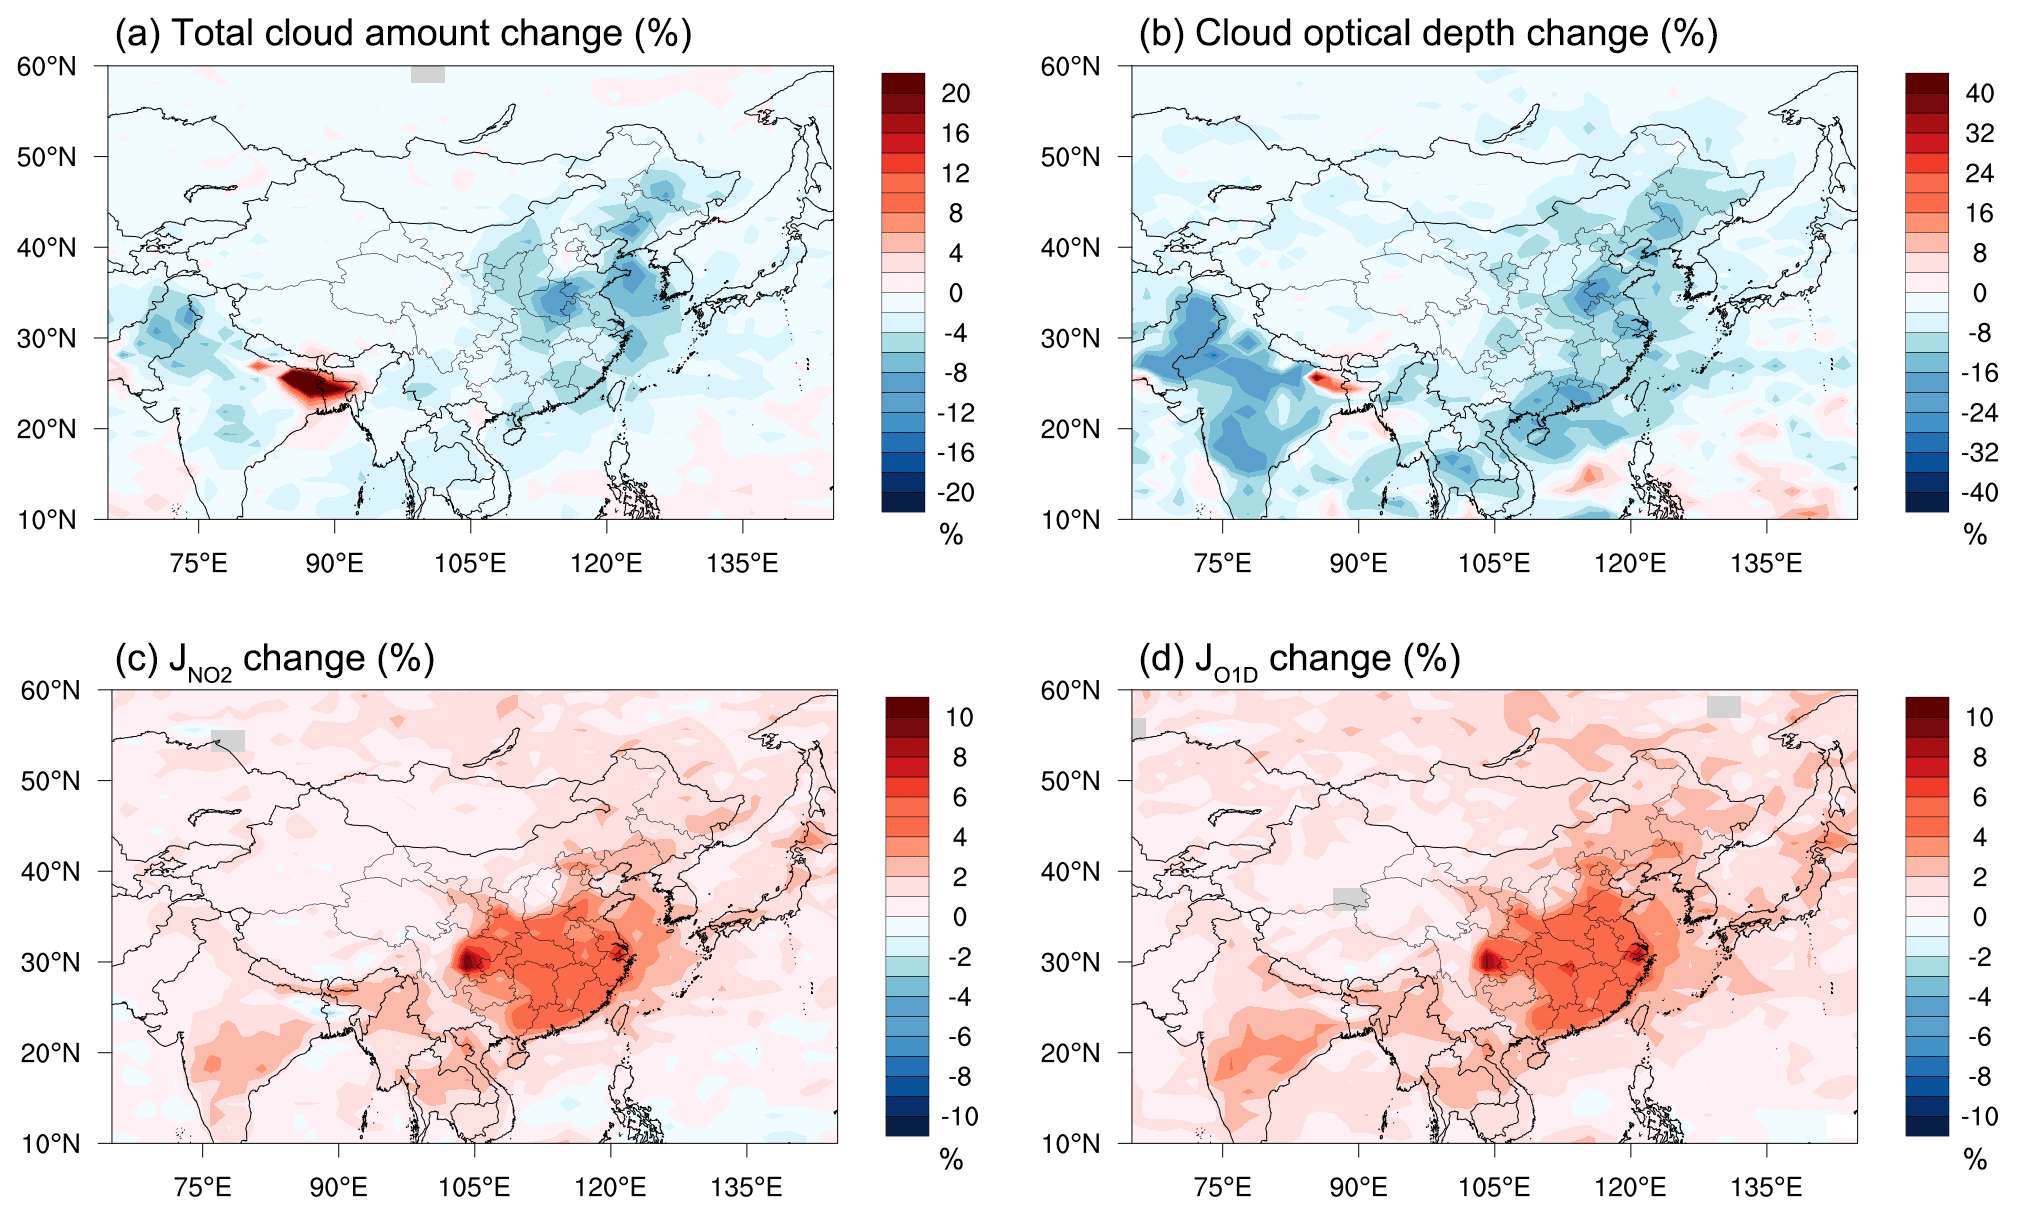
Figure 7Changes in (a) total cloud amount, (b) cloud optical depth, (c) and (d) due to the aerosol direct radiative effect. Differences are calculated as , averaged over 1 year.
When more water vapour was trapped in the lower troposphere, there would be less moisture to form cloud in the upper layers (Allen et al., 2019). The annual average cloud amount decreases by 4 % due to aerosol effects on radiation over the whole country (Fig. 7). The area with the largest decline is the YRD with a percentage of 5 %. The cloud optical depth also drops by 7 %–15.6 % in China, with the regional distribution of changes being similar to the cloud amount changes. Clouds attenuate solar radiation, leading to diminished photolysis rates beneath the cloud (Tang et al., 2003; Voulgarakis et al., 2009a, b, 2010). Therefore, the increased water vapour in the PBL results in higher photolysis rates by reducing clouds. However, the increased water vapour in the PBL will also enhance extinction by aerosol hygroscopic growth, which results in lower photolysis rates. Figure 7 shows that surface photolysis rates and both increase, which means, comparing them to the aerosol hygroscopic growth, that the aforementioned cloud reduction is the dominant effect. The national average and rose by 4.1 % and 3.3 %, respectively. The SCB is the region with the largest increase in and , with percentage increases of 8 % and 7.9 %, respectively. The increase in and could lead to an increase or decrease in ozone concentration.
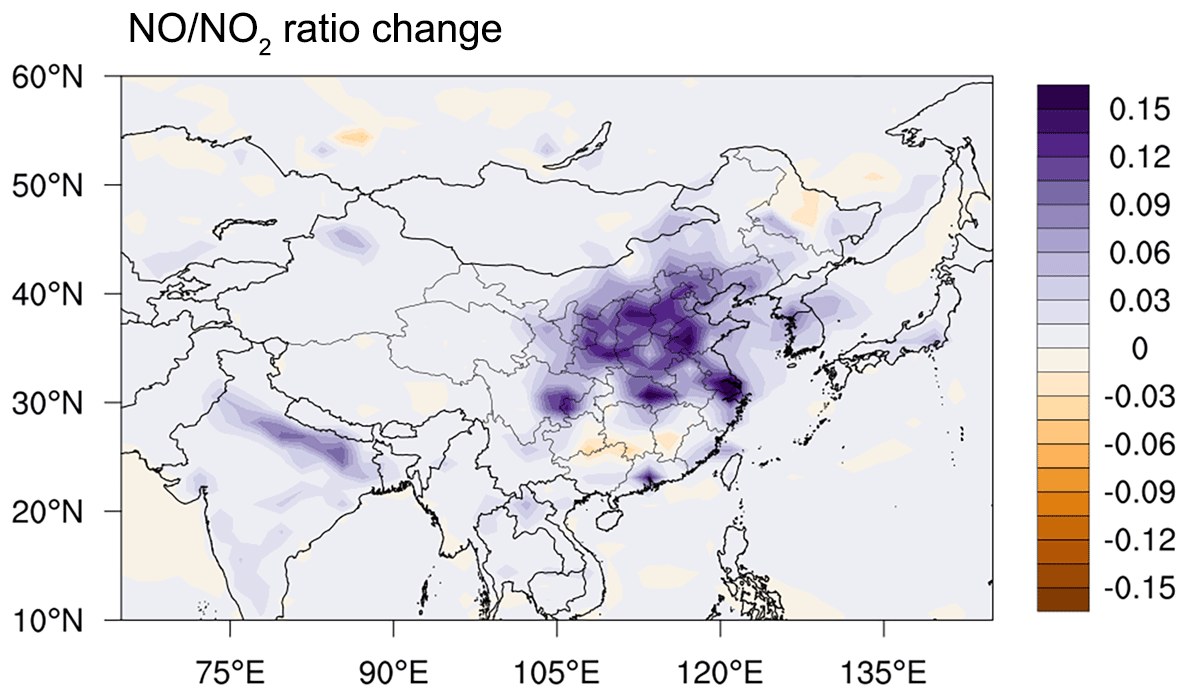
Figure 8Annual average change in due to the aerosol direct radiative effect. Differences are calculated as the annual mean of EXPradon minus EXPradoff.
3.5 O3 changes due to aerosol meteorology feedback
The meteorological feedbacks that we study, ADE-POL and ADE-MOI, may have contrasting effects on ozone. For ADE-POL, the relationship between NO and NO2 concentrations could be used to predict the changes in ozone concentration because NO and NO2 lead to the loss and production of ozone, respectively. Figure 8 shows the annual average ratio changes. In the aerosol-polluted areas, i.e. north China, the YRD, the PRD, the SCB and central China, the ratio increased, with a highest value of 0.17. West China, south China (excluding the PRD) and north-east China were less influenced by ADE-POL, and the ratio showed a small change. The observations in Germany (Melkonyan and Kuttler, 2012), Brazil (De Souza et al., 2017) and China (Han et al., 2011) have demonstrated that an increasing ratio could consume more ozone and reduce ozone concentration. In ADE-MOI, and were both increased due to the cloud amount and optical depth changes. Tang et al. (2003) found that the was more sensitive to cloud than and most other photolysis rates and the decrease in cloud cover could lead to higher net ozone production below the cloud layer. Therefore, changes in the atmospheric water content and subsequent cloud changes could lead to local increases in surface ozone concentration.
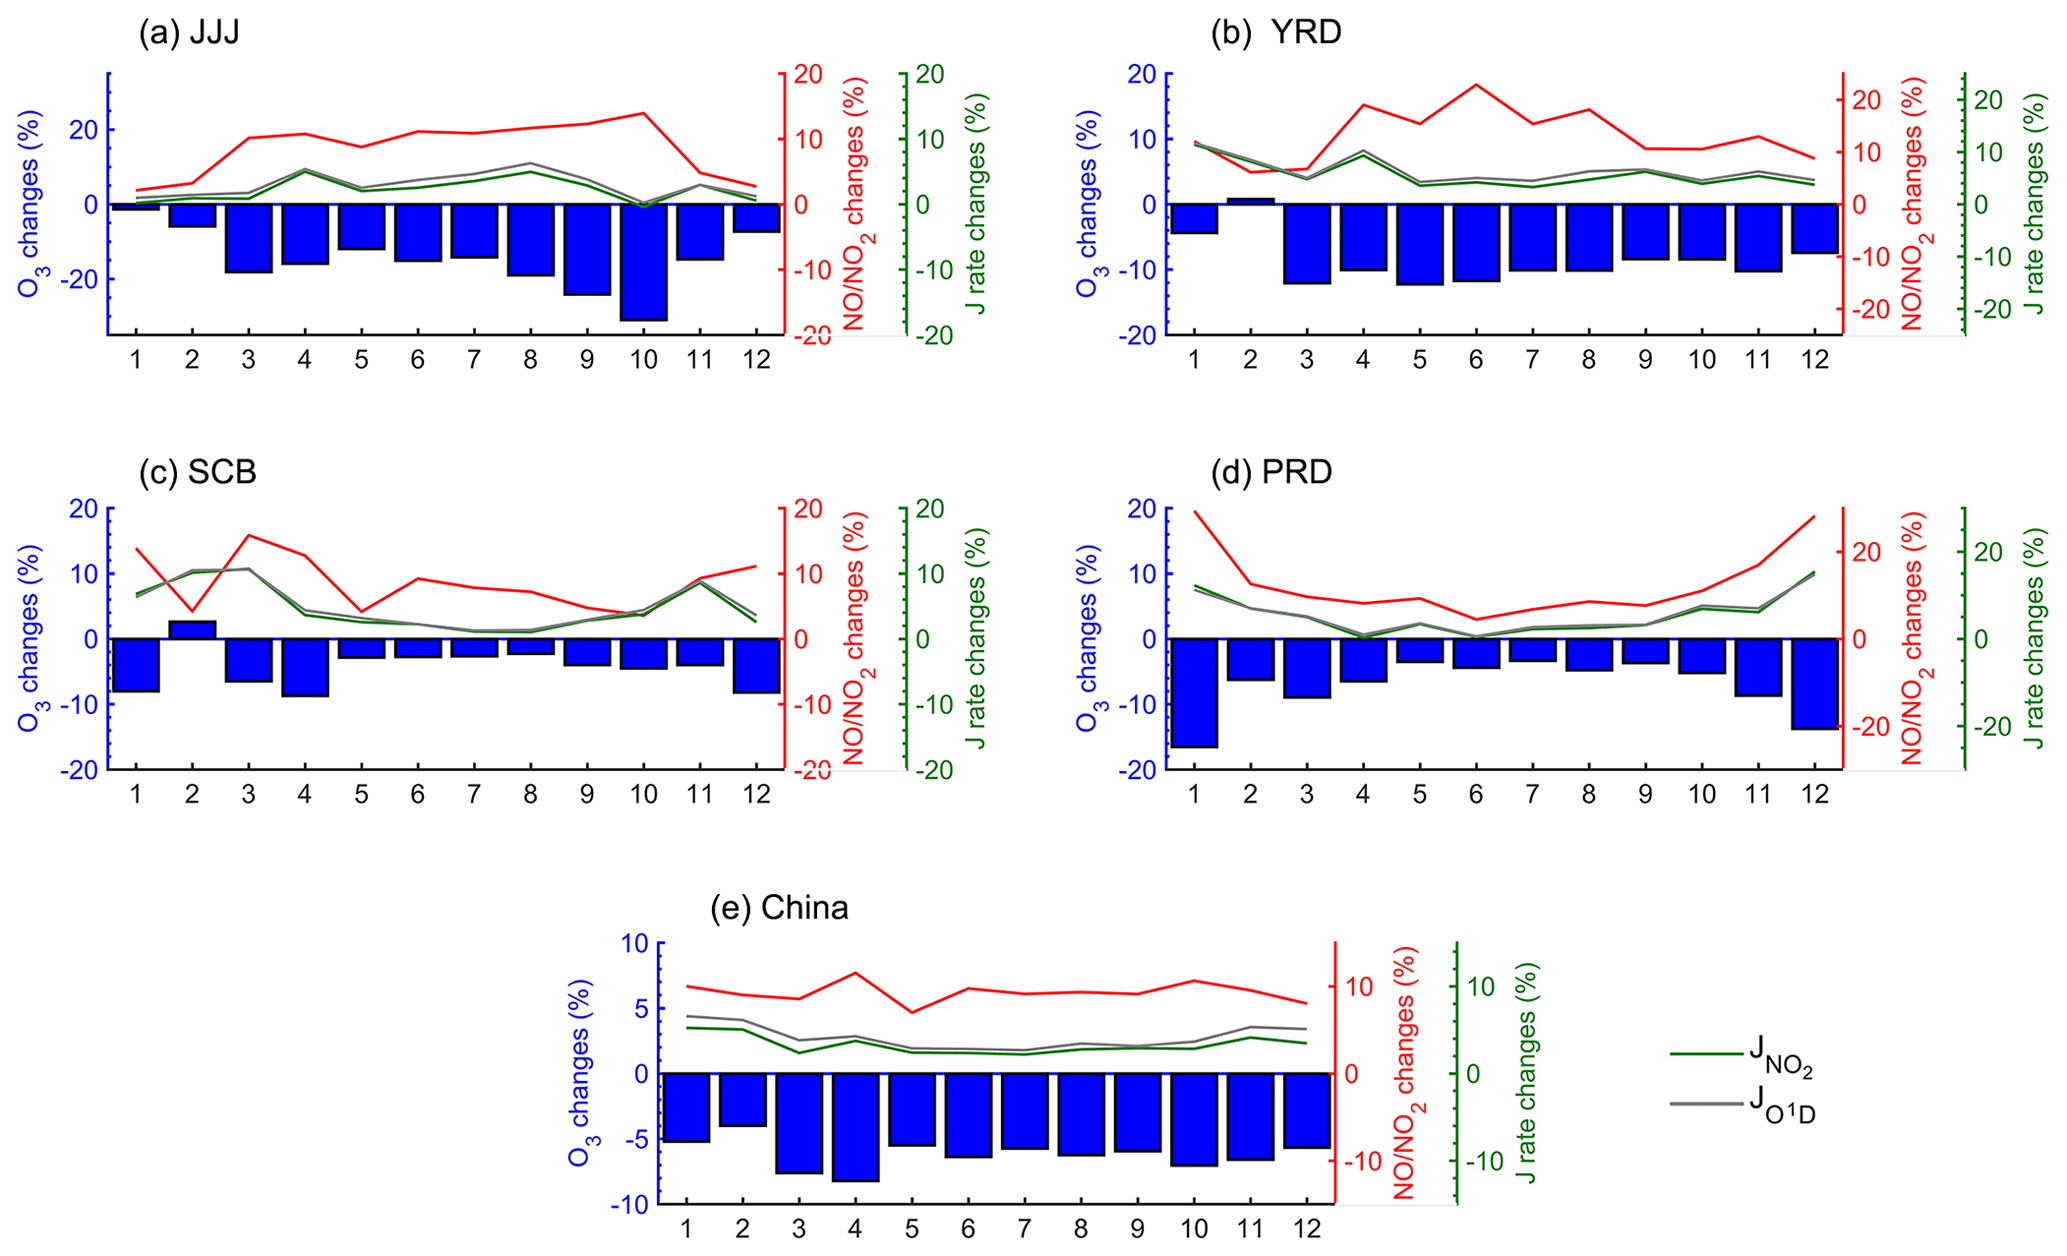
Figure 9Monthly variation in O3 concentration changes, ratio changes, and and changes in (a) Jing–Jin–Ji, (b) the Yangtze River Delta, (c) the Sichuan Basin, (d) the Pearl River Delta and (e) China due to the aerosol direct radiative effect. Differences are calculated as , averaged over 1 year.
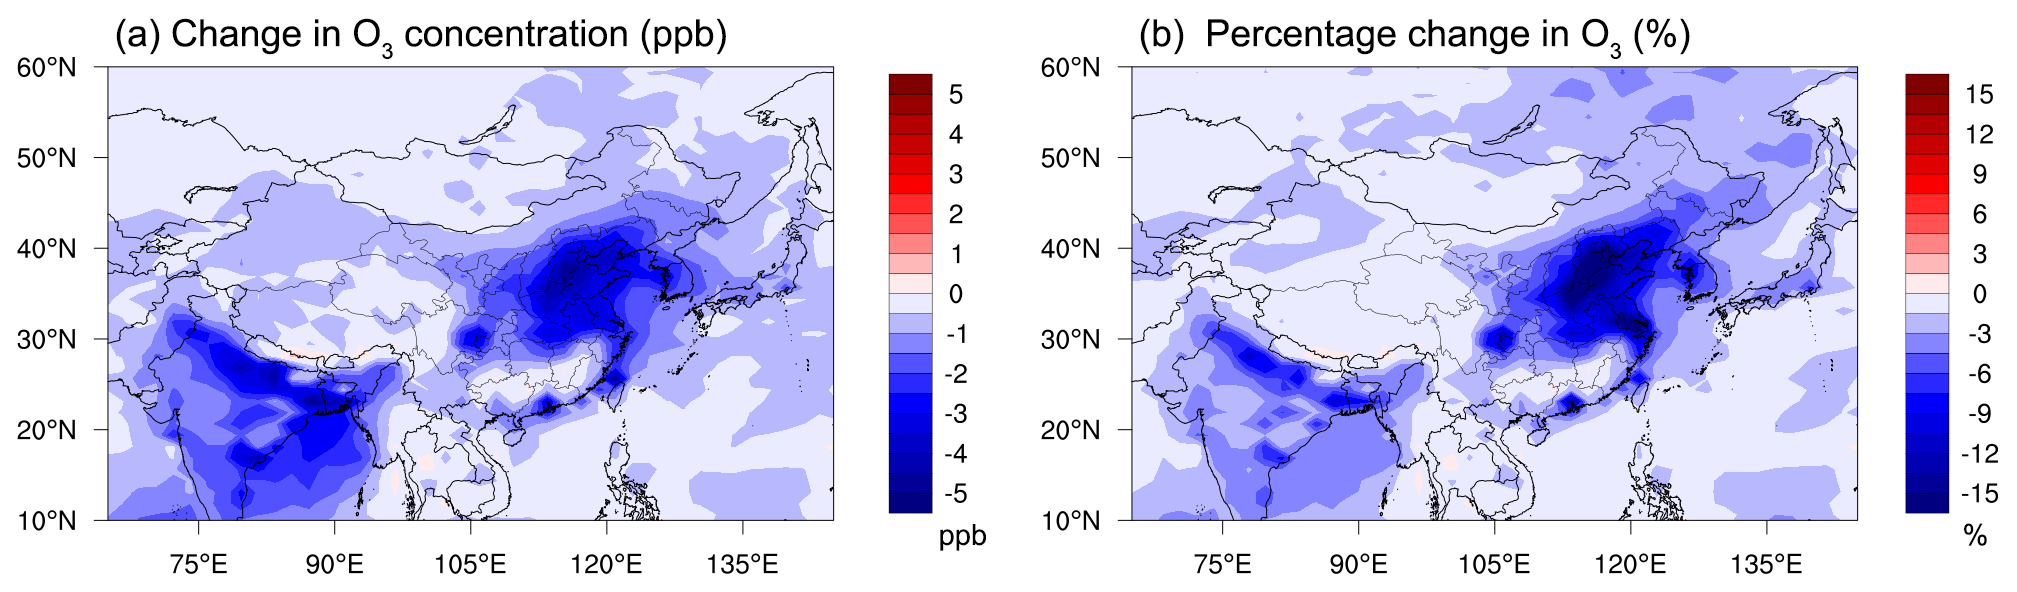
Figure 10Annual average change in ozone due to the aerosol direct radiative effect: (a) absolute changes (ppb) are calculated as EXPradon minus EXPradoff; (b) percentage changes (%) are calculated as .
These two opposite effects compete against each other, resulting in different ozone changes in different regions and seasons. Figure 9 presents the seasonal changes in the ratio (representing the ADE-POL effect), photolysis rates (representing the ADE-MOI effect) and ozone concentration in the four selected regions and in the whole country. The increase in the ratio dominates the ozone changes and diminished the surface ozone concentration in all seasons and regions, except for February in the YRD and SCB regions, when the ADE-MOI effect overwhelmed the ADE-POL effect. The magnitude of ozone percentage change appears to depend on the relative magnitude of the ratio changes and the photolysis rates change. In northern cities, such as JJJ, the monthly variation in ozone changes showed a double-peak pattern, with the largest decline in spring and autumn, while in south China, the change in ozone only reached its largest reduction in winter. The latitudes of the YRD and the SCB are in between the latitudes of JJJ or the PRD, and therefore the seasonal patterns are not as clear as for JJJ or the PRD. In the YRD, the combined effect leads to ozone changes ranging from −5 to 0.07 ppb. Xing et al. (2017) found that the meteorology changes reduced the surface concentration of ozone in east China in January by 5–24 µg m−3 (2.33–11.19 ppb). The reason for the difference might be that they did not include the positive feedback of ADE-MOI when analysing meteorological effects. The reaction flux changes in Fig. S3 in the Supplement show that, on annual average, the combined effect of ADE-POL and ADE-MOI led to more ozone consumption than ozone production, suggesting that ADE-POL dominates. Figure 10 shows the spatial distribution of annual average ozone changes. The region with the highest ozone reduction is consistent with the region of the largest ratio increase. Ozone concentration was found to decrease by 3.84 ppb (14.9 %), 2.45 ppb (8.7 %), 1.48 ppb (4.3 %) and 1.78 ppb (7.1 %) in JJJ, the YRD, the PRD and the SCB on annual average, and it decreased by around 2.01 ppb (6.2 %) averaged over the whole country.
In this paper, we used a coupled global Earth system model, UKESM1-AMIP, to evaluate the influence of aerosol meteorology feedback on tropospheric ozone over China. Aerosols reduced surface net downward shortwave radiation by 11 % through the scattering and absorbing effect and reduced the surface turbulent kinetic energy by 16.7 %. The boundary layer was therefore less heated and developed, the height of which was found to decrease by 102.28 m in north China. The meteorology changes in the lower troposphere can influence the dispersion and mixing of pollutants (ADE-POLL effect) and moisture (ADE-MOI effect). Gaseous pollutants such as CO, SO2, NO and NO2 all increased in the aerosol-rich regions, and particulate matter (PM2.5 and PM10) increased by 9.5 %–18.6 % in the four selected areas. Different changes in NO and NO2 affect the ratio, which is related to the loss and the production process of ozone. Moisture was found to be more trapped in the boundary layer, with specific humidity increasing in the PBL, and the strongest effects were found in June in JJJ (4.28 %). With more moisture accumulated near the ground, less moisture was transported to higher layers to form clouds. The cloud amount was reduced by 4 % and clouds became more transparent. The photolysis rates for NO2 and O1D were thereby found to be increased by 4.1 % and 3.3 %, respectively.
An increased ratio (ADE-POL) consumes more ozone, while an increased photolysis rate (ADE-MOI) produces more ozone. The net magnitude of ozone change due to aerosols is linked to the relative magnitude of the ratio change and the photolysis rate change. In general, the change dominated the ozone concentration change and led to reduced annual average ozone in China of around 2.01 ppb (6.2 %).
Overall, our study reveals that, except for the direct effect through photolysis rate changes, ADE can influence ozone concentration through two meteorological mechanisms: one is to affect the abundances of atmospheric pollutants, including ozone consumers and producers (ADE-POL), and the other is to affect the vertical transmission of water vapour, thus affecting the optical characteristics of clouds and therefore ozone photochemical production through photolysis (ADE-MOI). The combined effect and relative importance of meteorological feedbacks, direct photolysis influences and microphysical influences needs to be assessed in a future study.
The data used in this study are available upon request from Yawei Qu (yawei_qu531@163.com).
The supplement related to this article is available online at: https://doi.org/10.5194/acp-21-5705-2021-supplement.
YQ designed the research study, ran model simulations and performed the data analysis under the close supervision of AV, with some additional supervisory support from TW. TW provided access to CNEMC data. MK, CW, SV and LM offered continued guidance and technical support with the UKESM simulation. YQ wrote the original paper and AV, TW and CY commented on it.
The authors declare that they have no conflict of interest.
UKESM1-AMIP model simulations were performed using MONSooN (Met Office and NERC Supercomputing Nodes), a shared HPC platform within a collaborative computing environment, which is developed by the Met Office and NERC. Also, we wish to thank Luke Abraham from the University of Cambridge and Mohit Dalvi from the UK Met Office for their support with using the UKESM model.
This research has been supported by the National Key Basic Research Development Program of China (grant nos. 2016YFC0203303 and 2020YFA0607802), the National Natural Science Foundation of China (grant nos. 41621005 and 42077192), the China Scholarship Council (grant no. 201806190151), and the Leverhulme Centre for Wildfires, Environment and Society through the Leverhulme Trust (grant no. RC-2018-023).
This paper was edited by Fangqun Yu and reviewed by three anonymous referees.
Adame, J. A., Córdoba-Jabonero, C., Sorribas, M., Toledo, D., and Gil-Ojeda, M.: Atmospheric boundary layer and ozone-aerosol interactions under Saharan intrusions observed during AMISOC summer campaign, Atmos. Environ., 104, 205–216, https://doi.org/10.1016/j.atmosenv.2014.12.036, 2015.
Albrecht, B. A.: Aerosols, Cloud Microphysics, and Fractional Cloudiness, Science, 245, 1227–1230, https://doi.org/10.1126/science.245.4923.1227, 1989.
Allen, R. J., Amiri-Farahani, A., Lamarque, J.-F., Smith, C., Shindell, D., Hassan, T., and Chung, C. E.: Observationally constrained aerosol–cloud semi-direct effects, npj Clim. Atmos. Sci., 2, 16, https://doi.org/10.1038/s41612-019-0073-9, 2019.
Archibald, A. T., O'Connor, F. M., Abraham, N. L., Archer-Nicholls, S., Chipperfield, M. P., Dalvi, M., Folberth, G. A., Dennison, F., Dhomse, S. S., Griffiths, P. T., Hardacre, C., Hewitt, A. J., Hill, R. S., Johnson, C. E., Keeble, J., Köhler, M. O., Morgenstern, O., Mulcahy, J. P., Ordóñez, C., Pope, R. J., Rumbold, S. T., Russo, M. R., Savage, N. H., Sellar, A., Stringer, M., Turnock, S. T., Wild, O., and Zeng, G.: Description and evaluation of the UKCA stratosphere–troposphere chemistry scheme (StratTrop vn 1.0) implemented in UKESM1, Geosci. Model Dev., 13, 1223–1266, https://doi.org/10.5194/gmd-13-1223-2020, 2020.
Barbaro, E., de Arellano, J. V. G., Ouwersloot, H. G., Schröter, J. S., Donovan, D. P., and Krol, M. C.: Aerosols in the convective boundary layer: Shortwave radiation effects on the coupled land-atmosphere system, J. Geophys. Res., 119, 5845–5863, https://doi.org/10.1002/2013JD021237, 2014.
Bauer, S. E.: Global modeling of heterogeneous chemistry on mineral aerosol surfaces: Influence on tropospheric ozone chemistry and comparison to observations, J. Geophys. Res., 109, D02304, https://doi.org/10.1029/2003JD003868, 2004.
Bian, H. and Prather, M. J.: Fast-J2: Accurate simulation of stratospheric photolysis in global chemical models, J. Atmos. Chem., 41, 281–296, https://doi.org/10.1023/A:1014980619462, 2002.
Castro, T., Madronich, S., Rivale, S., Muhlia, A., and Mar, B.: The influence of aerosols on photochemical smog in Mexico City, Atmos. Environ., 35, 1765–1772, https://doi.org/10.1016/S1352-2310(00)00449-0, 2001.
Choi, J. O. and Chung, C. E.: Sensitivity of aerosol direct radiative forcing to aerosol vertical profile, Tellus B, 66, 24376, https://doi.org/10.3402/tellusb.v66.24376, 2014.
Clark, D. B., Mercado, L. M., Sitch, S., Jones, C. D., Gedney, N., Best, M. J., Pryor, M., Rooney, G. G., Essery, R. L. H., Blyth, E., Boucher, O., Harding, R. J., Huntingford, C., and Cox, P. M.: The Joint UK Land Environment Simulator (JULES), model description – Part 2: Carbon fluxes and vegetation dynamics, Geosci. Model Dev., 4, 701–722, https://doi.org/10.5194/gmd-4-701-2011, 2011.
Cox, P. M.: Description of the TRIFFID dynamic global vegetation model, in: Hadley Centre Technical Note, Met Office, Berks, UK, 2001.
De Souza, A., Aristone, F., Kumar, U., Kovac-Andric, E., Arsić, M., and Ikefuti, P.: Analysis of the correlations between NO, NO2 and O3 concentrations in Campo Grande – MS, Brazil, European Chemical Bulletin, 6, 284, https://doi.org/10.17628/ecb.2017.6.284-291, 2017.
Dupont, J. C., Haeffelin, M., Badosa, J., Elias, T., Favez, O., Petit, J. E., Meleux, F., Sciare, J., Crenn, V., and Bonne, J. L.: Role of the boundary layer dynamics effects on an extreme air pollution event in Paris, Atmos. Environ., 141, 571–579, https://doi.org/10.1016/j.atmosenv.2016.06.061, 2016.
Flynn, J., Lefer, B., Rappenglück, B., Leuchner, M., Perna, R., Dibb, J., Ziemba, L., Anderson, C., Stutz, J., Brune, W., Ren, X., Mao, J., Luke, W., Olson, J., Chen, G., and Crawford, J.: Impact of clouds and aerosols on ozone production in Southeast Texas, Atmos. Environ., 44, 4126–4133, https://doi.org/10.1016/j.atmosenv.2009.09.005, 2010.
Gao, Y., Zhang, M., Liu, Z., Wang, L., Wang, P., Xia, X., Tao, M., and Zhu, L.: Modeling the feedback between aerosol and meteorological variables in the atmospheric boundary layer during a severe fog–haze event over the North China Plain, Atmos. Chem. Phys., 15, 4279–4295, https://doi.org/10.5194/acp-15-4279-2015, 2015.
Garratt, J.: Review: the atmospheric boundary layer, Earth-Sci. Rev., 37, 89–134, https://doi.org/10.1016/0012-8252(94)90026-4, 1994.
Griffiths, P. T. and Anthony Cox, R.: Temperature dependence of heterogeneous uptake of N2O5 by ammonium sulfate aerosol, Atmos. Sci. Lett., 10, 159–163, https://doi.org/10.1002/asl.225, 2009.
Hall, S. R., Ullmann, K., Prather, M. J., Flynn, C. M., Murray, L. T., Fiore, A. M., Correa, G., Strode, S. A., Steenrod, S. D., Lamarque, J.-F., Guth, J., Josse, B., Flemming, J., Huijnen, V., Abraham, N. L., and Archibald, A. T.: Cloud impacts on photochemistry: building a climatology of photolysis rates from the Atmospheric Tomography mission, Atmos. Chem. Phys., 18, 16809–16828, https://doi.org/10.5194/acp-18-16809-2018, 2018.
Han, S., Bian, H., Feng, Y., Liu, A., Li, X., Zeng, F., and Zhang, X.: Analysis of the relationship between O3, NO and NO2 in Tianjin, China, Aerosol Air Qual. Res., 11, 128–139, https://doi.org/10.4209/aaqr.2010.07.0055, 2011.
Hansen, J., Sato, M., and Ruedy, R.: Radiative forcing and climate response, J. Geophys. Res.-Atmos., 102, 6831–6864, https://doi.org/10.1029/96JD03436, 1997.
Hayashida, S., Kajino, M., Deushi, M., Sekiyama, T. T., and Liu, X.: Seasonality of the lower tropospheric ozone over China observed by the Ozone Monitoring Instrument, Atmos. Environ., 184, 244–253, https://doi.org/10.1016/j.atmosenv.2018.04.014, 2018.
He, S. and Carmichael, G. R.: Sensitivity of photolysis rates and ozone production in the troposphere to aerosol properties, J. Geophys. Res.-Atmos., 104, 26307–26324, https://doi.org/10.1029/1999JD900789, 1999.
Hewitt, H. T., Copsey, D., Culverwell, I. D., Harris, C. M., Hill, R. S. R., Keen, A. B., McLaren, A. J., and Hunke, E. C.: Design and implementation of the infrastructure of HadGEM3: the next-generation Met Office climate modelling system, Geosci. Model Dev., 4, 223–253, https://doi.org/10.5194/gmd-4-223-2011, 2011.
Hollaway, M., Wild, O., Yang, T., Sun, Y., Xu, W., Xie, C., Whalley, L., Slater, E., Heard, D., and Liu, D.: Photochemical impacts of haze pollution in an urban environment, Atmos. Chem. Phys., 19, 9699–9714, https://doi.org/10.5194/acp-19-9699-2019, 2019.
Johnson, B. T.: The Semi-Direct Aerosol Effect, Ph.D. thesis, Department of Meteorology, The University of Reading, United Kingdom, 201 pp., 2003.
Kuhlbrodt, T., Jones, C. G., Sellar, A., Storkey, D., Blockley, E., Stringer, M., Hill, R., Graham, T., Ridley, J., Blaker, A., Calvert, D., Copsey, D., Ellis, R., Hewitt, H., Hyder, P., Ineson, S., Mulcahy, J., Siahaan, A., and Walton, J.: The Low-Resolution Version of HadGEM3 GC3.1: Development and Evaluation for Global Climate, J. Adv. Model. Earth Sy., 10, 2865–2888, https://doi.org/10.1029/2018MS001370, 2018.
Li, H., Wang, B., Fang, X., Zhu, W., Fan, Q., Liao, Z., Liu, J., Zhang, A., and Fan, S.: Combined effect of boundary layer recirculation factor and stable energy on local air quality in the Pearl River Delta over southern China, J. Air Waste Manage., 68, 685–699, https://doi.org/10.1080/10962247.2018.1439125, 2018.
Li, J., Wang, Z., Wang, X., Yamaji, K., Takigawa, M., Kanaya, Y., Pochanart, P., Liu, Y., Irie, H., Hu, B., Tanimoto, H., and Akimoto, H.: Impacts of aerosols on summertime tropospheric photolysis frequencies and photochemistry over Central Eastern China, Atmos. Environ., 45, 1817–1829, https://doi.org/10.1016/j.atmosenv.2011.01.016, 2011.
Li, L., Chen, C. H., Fu, J. S., Huang, C., Streets, D. G., Huang, H. Y., Zhang, G. F., Wang, Y. J., Jang, C. J., Wang, H. L., Chen, Y. R., and Fu, J. M.: Air quality and emissions in the Yangtze River Delta, China, Atmos. Chem. Phys., 11, 1621–1639, https://doi.org/10.5194/acp-11-1621-2011, 2011.
Li, M., Liu, H., Geng, G., Hong, C., Liu, F., Song, Y., Tong, D., Zheng, B., Cui, H., Man, H., Zhang, Q., and He, K.: Anthropogenic emission inventories in China: a review, Natl. Sci. Rev., 4, 834–866, https://doi.org/10.1093/nsr/nwx150, 2017.
Li, Z., Guo, J., Ding, A., Liao, H., Liu, J., Sun, Y., Wang, T., Xue, H., Zhang, H., and Zhu, B.: Aerosol and boundary-layer interactions and impact on air quality, Natl. Sci. Rev., 4, 810–833, https://doi.org/10.1093/nsr/nwx117, 2017.
Liu, C., Huang, J., Wang, Y., Tao, X., Hu, C., Deng, L., Xu, J., Xiao, H. W., Luo, L., Xiao, H. Y., and Xiao, W.: Vertical distribution of PM2.5 and interactions with the atmospheric boundary layer during the development stage of a heavy haze pollution event, Sci. Total Environ., 704, 135329, https://doi.org/10.1016/j.scitotenv.2019.135329, 2020.
Liu, H., Crawford, J. H., Pierce, R. B., Norris, P., Platnick, S. E., Chen, G., Logan, J. A., Yantosca, R. M., Evans, M. J., Kittaka, C., Feng, Y., and Tie, X.: Radiative effect of clouds on tropospheric chemistry in a global three-dimensional chemical transport model, J. Geophys. Res., 111, D20303, https://doi.org/10.1029/2005JD006403, 2006.
Liu, Q., Jia, X., Quan, J., Li, J., Li, X., Wu, Y., Chen, D., Wang, Z., and Liu, Y.: New positive feedback mechanism between boundary layer meteorology and secondary aerosol formation during severe haze events, Sci. Rep.-UK, 8, 6095, https://doi.org/10.1038/s41598-018-24366-3, 2018.
Mann, G. W., Carslaw, K. S., Spracklen, D. V., Ridley, D. A., Manktelow, P. T., Chipperfield, M. P., Pickering, S. J., and Johnson, C. E.: Description and evaluation of GLOMAP-mode: a modal global aerosol microphysics model for the UKCA composition-climate model, Geosci. Model Dev., 3, 519–551, https://doi.org/10.5194/gmd-3-519-2010, 2010.
Melkonyan, A. and Kuttler, W.: Long-term analysis of NO, NO2 and O3 concentrations in North Rhine-Westphalia, Germany, Atmos. Environ., 60, 316–326, https://doi.org/10.1016/j.atmosenv.2012.06.048, 2012.
Miao, Y. and Liu, S.: Linkages between aerosol pollution and planetary boundary layer structure in China, Sci. Total Environ., 650, 288–296, https://doi.org/10.1016/j.scitotenv.2018.09.032, 2019.
Mulcahy, J. P., Jones, C., Sellar, A., Johnson, B., Boutle, I. A., Jones, A., Andrews, T., Rumbold, S. T., Mollard, J., Bellouin, N., Johnson, C. E., Williams, K. D., Grosvenor, D. P., and McCoy, D. T.: Improved Aerosol Processes and Effective Radiative Forcing in HadGEM3 and UKESM1, J. Adv. Model. Earth Sy., 10, 2786–2805, https://doi.org/10.1029/2018MS001464, 2018.
Myhre, G., Shindell, D., Breon, F.-M., Collins, W., Fuglestvedt, J., Huang, J., Koch, D., Lamarque, J.-F., Lee, D., Mendoza, B., Nakajima, T., Robock, A., Stephens, G., Takemura, T., and Zhang, H.: Anthropogenic and Natural Radiative Forcing, in: Climate Change 2013 – The Physical Science Basis, vol. 9781107057, edited by: Intergovernmental Panel on Climate Change, Cambridge University Press, Cambridge, pp. 659–740, 2013.
Nair, S. K., Madhusoodanan, M. S., and Mehajan, R. K.: The role of Boundary Layer Height (BLH) variations on pollution dispersion over a coastal station in the Southwest Peninsular India, J. Atmos. Sol.-Terr. Phy., 179, 273–280, https://doi.org/10.1016/j.jastp.2018.07.011, 2018.
Nguyen, G. T. H., Shimadera, H., Sekiguchi, A., Matsuo, T., and Kondo, A.: Investigation of aerosol direct effects on meteorology and air quality in East Asia by using an online coupled modeling system, Atmos. Environ., 207, 182–196, https://doi.org/10.1016/j.atmosenv.2019.03.017, 2019.
Ning, G., Wang, S., Ma, M., Ni, C., Shang, Z., Wang, J., and Li, J.: Characteristics of air pollution in different zones of Sichuan Basin, China, Sci. Total Environ., 612, 975–984, https://doi.org/10.1016/j.scitotenv.2017.08.205, 2018.
Patil, M. N., Patil, S. D., Waghmare, R. T., and Dharmaraj, T.: Planetary Boundary Layer and aerosol interactions over the Indian sub-continent, J. Atmos. Sol.-Terr. Phy., 112, 38–42, https://doi.org/10.1016/j.jastp.2014.02.007, 2014.
Paulot, F., Paynter, D., Ginoux, P., Naik, V., and Horowitz, L. W.: Changes in the aerosol direct radiative forcing from 2001 to 2015: observational constraints and regional mechanisms, Atmos. Chem. Phys., 18, 13265–13281, https://doi.org/10.5194/acp-18-13265-2018, 2018.
Péré, J. C., Bessagnet, B., Pont, V., Mallet, M., and Minvielle, F.: Influence of the aerosol solar extinction on photochemistry during the 2010 Russian wildfires episode, Atmos. Chem. Phys., 15, 10983–10998, https://doi.org/10.5194/acp-15-10983-2015, 2015.
Qu, Y., Han, Y., Wu, Y., Gao, P., and Wang, T.: Study of PBLH and Its Correlation with Particulate Matter from One-Year Observation over Nanjing, Southeast China, Remote Sens.-Basel, 9, 668, https://doi.org/10.3390/rs9070668, 2017.
Qu, Y., Wang, T., Wu, H., Shu, L., Li, M., Chen, P., Zhao, M., Li, S., Xie, M., Zhuang, B., Liu, J., and Han, Y.: Vertical structure and interaction of ozone and fine particulate matter in spring at Nanjing, China: The role of aerosol's radiation feedback, Atmos. Environ., 222, 117162, https://doi.org/10.1016/j.atmosenv.2019.117162, 2019.
Quan, J., Gao, Y., Zhang, Q., Tie, X., Cao, J., Han, S., Meng, J., Chen, P., and Zhao, D.: Evolution of planetary boundary layer under different weather conditions, and its impact on aerosol concentrations, Particuology, 11, 34–40, https://doi.org/10.1016/j.partic.2012.04.005, 2013.
Ramachandran, S.: New directions: Mineral dust and ozone – Heterogeneous chemistry, Atmos. Environ., 106, 369–370, https://doi.org/10.1016/j.atmosenv.2015.01.078, 2015.
Real, E. and Sartelet, K.: Modeling of photolysis rates over Europe: impact on chemical gaseous species and aerosols, Atmos. Chem. Phys., 11, 1711–1727, https://doi.org/10.5194/acp-11-1711-2011, 2011.
Saikawa, E., Kim, H., Zhong, M., Avramov, A., Zhao, Y., Janssens-Maenhout, G., Kurokawa, J.-I., Klimont, Z., Wagner, F., Naik, V., Horowitz, L. W., and Zhang, Q.: Comparison of emissions inventories of anthropogenic air pollutants and greenhouse gases in China, Atmos. Chem. Phys., 17, 6393–6421, https://doi.org/10.5194/acp-17-6393-2017, 2017.
Sellar, A. A., Jones, C. G., Mulcahy, J. P., Tang, Y., Yool, A., Wiltshire, A., O'Connor, F. M., Stringer, M., Hill, R., Palmieri, J., Woodward, S., Mora, L., Kuhlbrodt, T., Rumbold, S. T., Kelley, D. I., Ellis, R., Johnson, C. E., Walton, J., Abraham, N. L., Andrews, M. B., Andrews, T., Archibald, A. T., Berthou, S., Burke, E., Blockley, E., Carslaw, K., Dalvi, M., Edwards, J., Folberth, G. A., Gedney, N., Griffiths, P. T., Harper, A. B., Hendry, M. A., Hewitt, A. J., Johnson, B., Jones, A., Jones, C. D., Keeble, J., Liddicoat, S., Morgenstern, O., Parker, R. J., Predoi, V., Robertson, E., Siahaan, A., Smith, R. S., Swaminathan, R., Woodhouse, M. T., Zeng, G., and Zerroukat, M.: UKESM1: Description and Evaluation of the U. K. Earth System Model, J. Adv. Model. Earth Sy., 11, 4513–4558, https://doi.org/10.1029/2019MS001739, 2019.
Serafin, S., Adler, B., Cuxart, J., De Wekker, S., Gohm, A., Grisogono, B., Kalthoff, N., Kirshbaum, D., Rotach, M., Schmidli, J., Stiperski, I., Večenaj, Ž., and Zardi, D.: Exchange Processes in the Atmospheric Boundary Layer Over Mountainous Terrain, Atmosphere-Basel, 9, 102, https://doi.org/10.3390/atmos9030102, 2018.
Shi, Y., Xia, Y. F., Lu, B. H., Liu, N., Zhang, L., Li, S. J., and Li, W.: Emission inventory and trends of NO x for China, 2000–2020, J. Zhejiang Univ.-Sc. A, 15, 454–464, https://doi.org/10.1631/jzus.A1300379, 2014.
Stevens, B. and Feingold, G.: Untangling aerosol effects on clouds and precipitation in a buffered system, Nature, 461, 607–613, https://doi.org/10.1038/nature08281, 2009.
Stewart, D. J., Griffiths, P. T., and Cox, R. A.: Reactive uptake coefficients for heterogeneous reaction of N2O5 with submicron aerosols of NaCl and natural sea salt, Atmos. Chem. Phys., 4, 1381–1388, https://doi.org/10.5194/acp-4-1381-2004, 2004.
Stull, R. B. (ed.): An Introduction to Boundary Layer Meteorology, Netherlands, Dordrecht, 1988.
Tang, G., Zhang, J., Zhu, X., Song, T., Münkel, C., Hu, B., Schäfer, K., Liu, Z., Zhang, J., Wang, L., Xin, J., Suppan, P., and Wang, Y.: Mixing layer height and its implications for air pollution over Beijing, China, Atmos. Chem. Phys., 16, 2459–2475, https://doi.org/10.5194/acp-16-2459-2016, 2016.
Tang, M., Huang, X., Lu, K., Ge, M., Li, Y., Cheng, P., Zhu, T., Ding, A., Zhang, Y., Gligorovski, S., Song, W., Ding, X., Bi, X., and Wang, X.: Heterogeneous reactions of mineral dust aerosol: implications for tropospheric oxidation capacity, Atmos. Chem. Phys., 17, 11727–11777, https://doi.org/10.5194/acp-17-11727-2017, 2017.
Tang, Y., Carmichael, G. R., Uno, I., Woo, J., Kurata, G., Lefer, B., Shetter, R. E., Huang, H., Anderson, B. E., Avery, M. A., Clarke, A. D., and Blake, D. R.: Impacts of aerosols and clouds on photolysis frequencies and photochemistry during TRACE-P: 2. Three-dimensional study using a regional chemical transport model, J. Geophys. Res., 108, 8822, https://doi.org/10.1029/2002JD003100, 2003.
Telford, P. J., Abraham, N. L., Archibald, A. T., Braesicke, P., Dalvi, M., Morgenstern, O., O'Connor, F. M., Richards, N. A. D., and Pyle, J. A.: Implementation of the Fast-JX Photolysis scheme (v6.4) into the UKCA component of the MetUM chemistry-climate model (v7.3), Geosci. Model Dev., 6, 161–177, https://doi.org/10.5194/gmd-6-161-2013, 2013.
Twomey, S.: Pollution and the planetary albedo, Atmos. Environ., 8, 1251–1256, https://doi.org/10.1016/0004-6981(74)90004-3, 1974.
Verstraeten, W. W., Neu, J. L., Williams, J. E., Bowman, K. W., Worden, J. R., and Boersma, K. F.: Rapid increases in tropospheric ozone production and export from China, Nat. Geosci., 8, 690–695, https://doi.org/10.1038/ngeo2493, 2015.
Voulgarakis, A., Wild, O., Savage, N. H., Carver, G. D., and Pyle, J. A.: Clouds, photolysis and regional tropospheric ozone budgets, Atmos. Chem. Phys., 9, 8235–8246, https://doi.org/10.5194/acp-9-8235-2009, 2009a.
Voulgarakis, A., Savage, N. H., Wild, O., Carver, G. D., Clemitshaw, K. C., and Pyle, J. A.: Upgrading photolysis in the p-TOMCAT CTM: model evaluation and assessment of the role of clouds, Geosci. Model Dev., 2, 59–72, https://doi.org/10.5194/gmd-2-59-2009, 2009b.
Voulgarakis, A., Savage, N. H., Wild, O., Braesicke, P., Young, P. J., Carver, G. D., and Pyle, J. A.: Interannual variability of tropospheric composition: the influence of changes in emissions, meteorology and clouds, Atmos. Chem. Phys., 10, 2491–2506, https://doi.org/10.5194/acp-10-2491-2010, 2010.
Walters, D., Baran, A. J., Boutle, I., Brooks, M., Earnshaw, P., Edwards, J., Furtado, K., Hill, P., Lock, A., Manners, J., Morcrette, C., Mulcahy, J., Sanchez, C., Smith, C., Stratton, R., Tennant, W., Tomassini, L., Van Weverberg, K., Vosper, S., Willett, M., Browse, J., Bushell, A., Carslaw, K., Dalvi, M., Essery, R., Gedney, N., Hardiman, S., Johnson, B., Johnson, C., Jones, A., Jones, C., Mann, G., Milton, S., Rumbold, H., Sellar, A., Ujiie, M., Whitall, M., Williams, K., and Zerroukat, M.: The Met Office Unified Model Global Atmosphere 7.0/7.1 and JULES Global Land 7.0 configurations, Geosci. Model Dev., 12, 1909–1963, https://doi.org/10.5194/gmd-12-1909-2019, 2019.
Wang, J., Allen, D. J., Pickering, K. E., Li, Z., and He, H.: Impact of aerosol direct effect on east asian air quality during the east-aire campaign, J. Geophys. Res., 121, 6534–6554, https://doi.org/10.1002/2016JD025108, 2016.
Wang, R.: Global Emission Inventory and Atmospheric Transport of Black Carbon, Springer, Berlin, Heidelberg, 2015.
Wang, W., Li, X., Shao, M., Hu, M., Zeng, L., Wu, Y., and Tan, T.: The impact of aerosols on photolysis frequencies and ozone production in Beijing during the 4 year period 2012–2015, Atmos. Chem. Phys., 19, 9413–9429, https://doi.org/10.5194/acp-19-9413-2019, 2019.
Wang, Y., Yu, M., Wang, Y., Tang, G., Song, T., Zhou, P., Liu, Z., Hu, B., Ji, D., Wang, L., Zhu, X., Yan, C., Ehn, M., Gao, W., Pan, Y., Xin, J., Sun, Y., Kerminen, V.-M., Kulmala, M., and Petäjä, T.: Rapid formation of intense haze episodes via aerosol–boundary layer feedback in Beijing, Atmos. Chem. Phys., 20, 45–53, https://doi.org/10.5194/acp-20-45-2020, 2020.
Wilcox, E. M., Thomas, R. M., Praveen, P. S., Pistone, K., Bender, F. A. M., and Ramanathan, V.: Black carbon solar absorption suppresses turbulence in the atmospheric boundary layer, P. Natl. Acad. Sci. USA, 113, 11794–11799, https://doi.org/10.1073/pnas.1525746113, 2016.
Wild, O., Zhu, X. I. N., and Prather, M. J.: Fast-J: Accurate Simulation of In- and Below-Cloud Photolysis in Tropospheric Chemical Models, J. Atmos. Chem., 37, 245–282, https://doi.org/10.1023/A:1006415919030, 2000.
Williams, K. D., Copsey, D., Blockley, E. W., Bodas-Salcedo, A., Calvert, D., Comer, R., Davis, P., Graham, T., Hewitt, H. T., Hill, R., Hyder, P., Ineson, S., Johns, T. C., Keen, A. B., Lee, R. W., Megann, A., Milton, S. F., Rae, J. G. L., Roberts, M. J., Scaife, A. A., Schiemann, R., Storkey, D., Thorpe, L., Watterson, I. G., Walters, D. N., West, A., Wood, R. A., Woollings, T., and Xavier, P. K.: The Met Office Global Coupled Model 3.0 and 3.1 (GC3.0 and GC3.1) Configurations, J. Adv. Model. Earth Sy., 10, 357–380, https://doi.org/10.1002/2017MS001115, 2018.
Woodward, S.: Modeling the atmospheric life cycle and radiative impact of mineral dust in the Hadley Centre climate model, J. Geophys. Res.-Atmos., 106, 18155–18166, https://doi.org/10.1029/2000JD900795, 2001.
Xing, J., Wang, J., Mathur, R., Wang, S., Sarwar, G., Pleim, J., Hogrefe, C., Zhang, Y., Jiang, J., Wong, D. C., and Hao, J.: Impacts of aerosol direct effects on tropospheric ozone through changes in atmospheric dynamics and photolysis rates, Atmos. Chem. Phys., 17, 9869–9883, https://doi.org/10.5194/acp-17-9869-2017, 2017.
Xu, J., Zhang, Y., Zheng, S., and He, Y.: Aerosol effects on ozone concentrations in Beijing: A model sensitivity study, J. Environ. Sci., 24, 645–656, https://doi.org/10.1016/S1001-0742(11)60811-5, 2012.
Yin, J., Gao, C. Y., Hong, J., Gao, Z., Li, Y., Li, X., Fan, S., and Zhu, B.: Surface Meteorological Conditions and Boundary Layer Height Variations During an Air Pollution Episode in Nanjing, China, J. Geophys. Res.-Atmos., 124, 3350–3364, https://doi.org/10.1029/2018JD029848, 2019.
Yool, A., Popova, E. E., and Anderson, T. R.: MEDUSA-2.0: an intermediate complexity biogeochemical model of the marine carbon cycle for climate change and ocean acidification studies, Geosci. Model Dev., 6, 1767–1811, https://doi.org/10.5194/gmd-6-1767-2013, 2013.
Zhang, Q., Quan, J., Tie, X., Li, X., Liu, Q., Gao, Y., and Zhao, D.: Effects of meteorology and secondary particle formation on visibility during heavy haze events in Beijing, China, Sci. Total Environ., 502, 578–584, https://doi.org/10.1016/j.scitotenv.2014.09.079, 2015.
Zheng, B., Tong, D., Li, M., Liu, F., Hong, C., Geng, G., Li, H., Li, X., Peng, L., Qi, J., Yan, L., Zhang, Y., Zhao, H., Zheng, Y., He, K., and Zhang, Q.: Trends in China's anthropogenic emissions since 2010 as the consequence of clean air actions, Atmos. Chem. Phys., 18, 14095–14111, https://doi.org/10.5194/acp-18-14095-2018, 2018.