the Creative Commons Attribution 4.0 License.
the Creative Commons Attribution 4.0 License.
 | 29 Mar 2021
Aerosol characteristics at the three poles of the Earth as characterized by Cloud–Aerosol Lidar and Infrared Pathfinder Satellite Observations
Yikun Yang
Quan Wang
Zhiyuan Cong
Xingchuan Yang
To better understand the aerosol properties over the Arctic, Antarctic and Tibetan Plateau (TP), the aerosol optical properties were investigated using 13 years of CALIPSO (Cloud–Aerosol Lidar and Infrared Pathfinder Satellite Observations) L3 data, and the back trajectories for air masses were also simulated using the Hybrid Single-Particle Lagrangian Integrated Trajectory (HYSPLIT) model. The results show that the aerosol optical depth (AOD) has obvious spatial- and seasonal-variation characteristics, and the aerosol loading over Eurasia, Ross Sea and South Asia is relatively large. The annual-average AODs over the Arctic, Antarctic and TP are 0.046, 0.024 and 0.098, respectively. Seasonally, the AOD values are larger from late autumn to early spring in the Arctic, in winter and spring in the Antarctic, and in spring and summer over the TP. There are no significant temporal trends of AOD anomalies in the three study regions. Clean marine and dust-related aerosols are the dominant types over ocean and land, respectively, in both the Arctic and Antarctic, while dust-related aerosol types have greater occurrence frequency (OF) over the TP. The OF of dust-related and elevated smoke is large for a broad range of heights, indicating that they are likely transported aerosols, while other types of aerosols mainly occurred at heights below 2 km in the Antarctic and Arctic. The maximum OF of dust-related aerosols mainly occurs at 6 km altitude over the TP. The analysis of back trajectories of the air masses shows large differences among different regions and seasons. The Arctic region is more vulnerable to mid-latitude pollutants than the Antarctic region, especially in winter and spring, while the air masses in the TP are mainly from the Iranian Plateau, Tarim Basin and South Asia.
- Article
(7971 KB) - Full-text XML
-
Supplement
(1263 KB) - BibTeX
- EndNote


As an important component, atmospheric aerosols play a crucial role in the Earth–atmosphere system (Garrett and Zhao, 2006; Ghan and Easter, 2006; Nabat et al., 2015; Wei et al., 2021; Xue et al., 2020). Aerosols have a variety of effects on Earth's climate, including the significant direct effect (Rap et al., 2013; Xing et al., 2017), indirect effect (Albrecht, 1989; Liu et al., 2019, 2020a; Righi et al., 2011; Twomey, 1977; Zhao and Garrett, 2015) and semi-direct effect (Amiri-Farahani et al., 2017; Johnson, 2005; Koren et al., 2004). Meanwhile, different aerosol types often have different physical, chemical and optical properties, and the balance between cooling and warming depends to some extent on aerosol characteristics (Boucher et al., 2013). The influence of aerosols on the Earth–atmosphere system depends on aerosol characteristics and underlying surface (Kipling et al., 2016; McFarlane et al., 2007). The vertical distribution of aerosol is especially valuable as a signature of combined impacts, including the processes of aerosol emission, conversion, transport and removal (Winker et al., 2013). Due to the lack of understanding of aerosol distribution, dynamics and optical characteristics, the impact of aerosols on the global radiative budget in climate models has great uncertainty (Boucher et al., 2013; Loeb and Su, 2010). Thus, knowledge of aerosol characteristics is essential for determining the radiative forcing effects of aerosols, improving the accuracy of aerosol optical depth (AOD) retrieval using passive satellites and quantifying the role of aerosols in global climate changes.
The acquisition of aerosol characteristics is mainly from two methods: ground-based monitoring and satellite remote sensing (Giles et al., 2012; Nishizawa et al., 2007; Omar et al., 2005; Russell et al., 2014). Ground-based remote sensing, such as the Aerosol Robotic Network (AERONET), can provide high-accuracy aerosol characteristics. The aerosol properties from AERONET are derived from direct sun extinction and sky radiance measurements, including columnar optical depth, single-scattering albedo (SSA), Ångström exponent (AE) and so on (Dubovik and King, 2000; Dubovik et al., 2002, 2006). Although the aerosol characteristics can be obtained from ground-based remote sensing with high accuracy, they have some limitations in the study of global aerosol characteristics research. On one hand, it is difficult to acquire the vertical distributions of aerosols. On the other hand, due to the strong spatiotemporal variations in aerosols, the spatiotemporal representation of aerosol characteristics measured by ground stations is limited.
Passive satellite remote sensing also can be used to obtain aerosol properties. In general, passive remote sensing can only obtain two-dimensional aerosol characteristics but cannot obtain aerosol vertical-structure information. Several AOD retrieval algorithms based on passive remote sensing have been developed over the past decade, such as Dark Target (DT), Dark Water, Deep Blue (DB), Multi-Angle Implementation of Atmospheric Correction (MAIAC), the structure–function algorithm and so on (Hsu et al., 2013, 2004; Kaufman et al., 1997; Levy et al., 2013; Lyapustin et al., 2018; Martonchik et al., 1998; Tanre et al., 1988). In terms of aerosol type, the Multi-angle Imaging SpectroRadiometer (MISR) instrument, which has nine view angles along the flight path (Diner et al., 1998), is sensitive to the size and shape of aerosols (Diner et al., 2008). The Ozone Monitoring Instrument (OMI) includes ultraviolet bands, which can be used to retrieve aerosol optical parameters, such as absorbing aerosol optical depth, single-scattering albedo and aerosol index (Marey et al., 2011; Torres et al., 2007). Compared with passive satellite remote sensing, active satellite remote sensing, such as the Cloud–Aerosol Lidar with Orthogonal Polarization (CALIOP), can acquire the vertical profile of the atmosphere and understand the vertical distribution of aerosol properties at a local or global scale (Shimizu et al., 2017). With three elastic backscattering channels, CALIOP is the first polarization lidar in space to provide three-dimensional atmospheric-structure measurements (Granados-Muñoz et al., 2019; Peyridieu et al., 2010). It can measure the vertical distribution and the microphysical and optical properties of aerosols and clouds with a high vertical resolution at 1064 nm and a parallel and cross-polarized return signal at 532 nm (Kittaka et al., 2011; Kumar et al., 2016). CALIOP has high sensitivity and can detect weak aerosol layers with optical depths of 0.01 or less (Winker et al., 2007). The polarization measurements also allow the discrimination of spherical and non-spherical cloud and aerosol particles. Thus, CALIOP is widely used to study aerosol and cloud characteristics (Das and Jayaraman, 2011; Sun et al., 2018; Varnai and Marshak, 2011).
As two main cold sources of the global atmosphere, the Arctic and Antarctic play an irreplaceable key role in global climate change research. Located in the middle of Asia, the Tibetan Plateau (TP) is the largest ice sheet accumulation area except for the Arctic and Antarctic. The Arctic, Antarctic and TP are representative of pristine regions, and they are very sensitive to global climate change (Lu et al., 2011). Associated with their different geographical environments, human activities have different effects on them. Previous studies have indicated that the clouds and radiation are particularly sensitive to aerosols over pristine regions (Garrett and Zhao, 2006; Seinfeld et al., 2016; Wang et al., 2018). The Arctic, Antarctic and TP have been undergoing unprecedented changes in global climate changes.
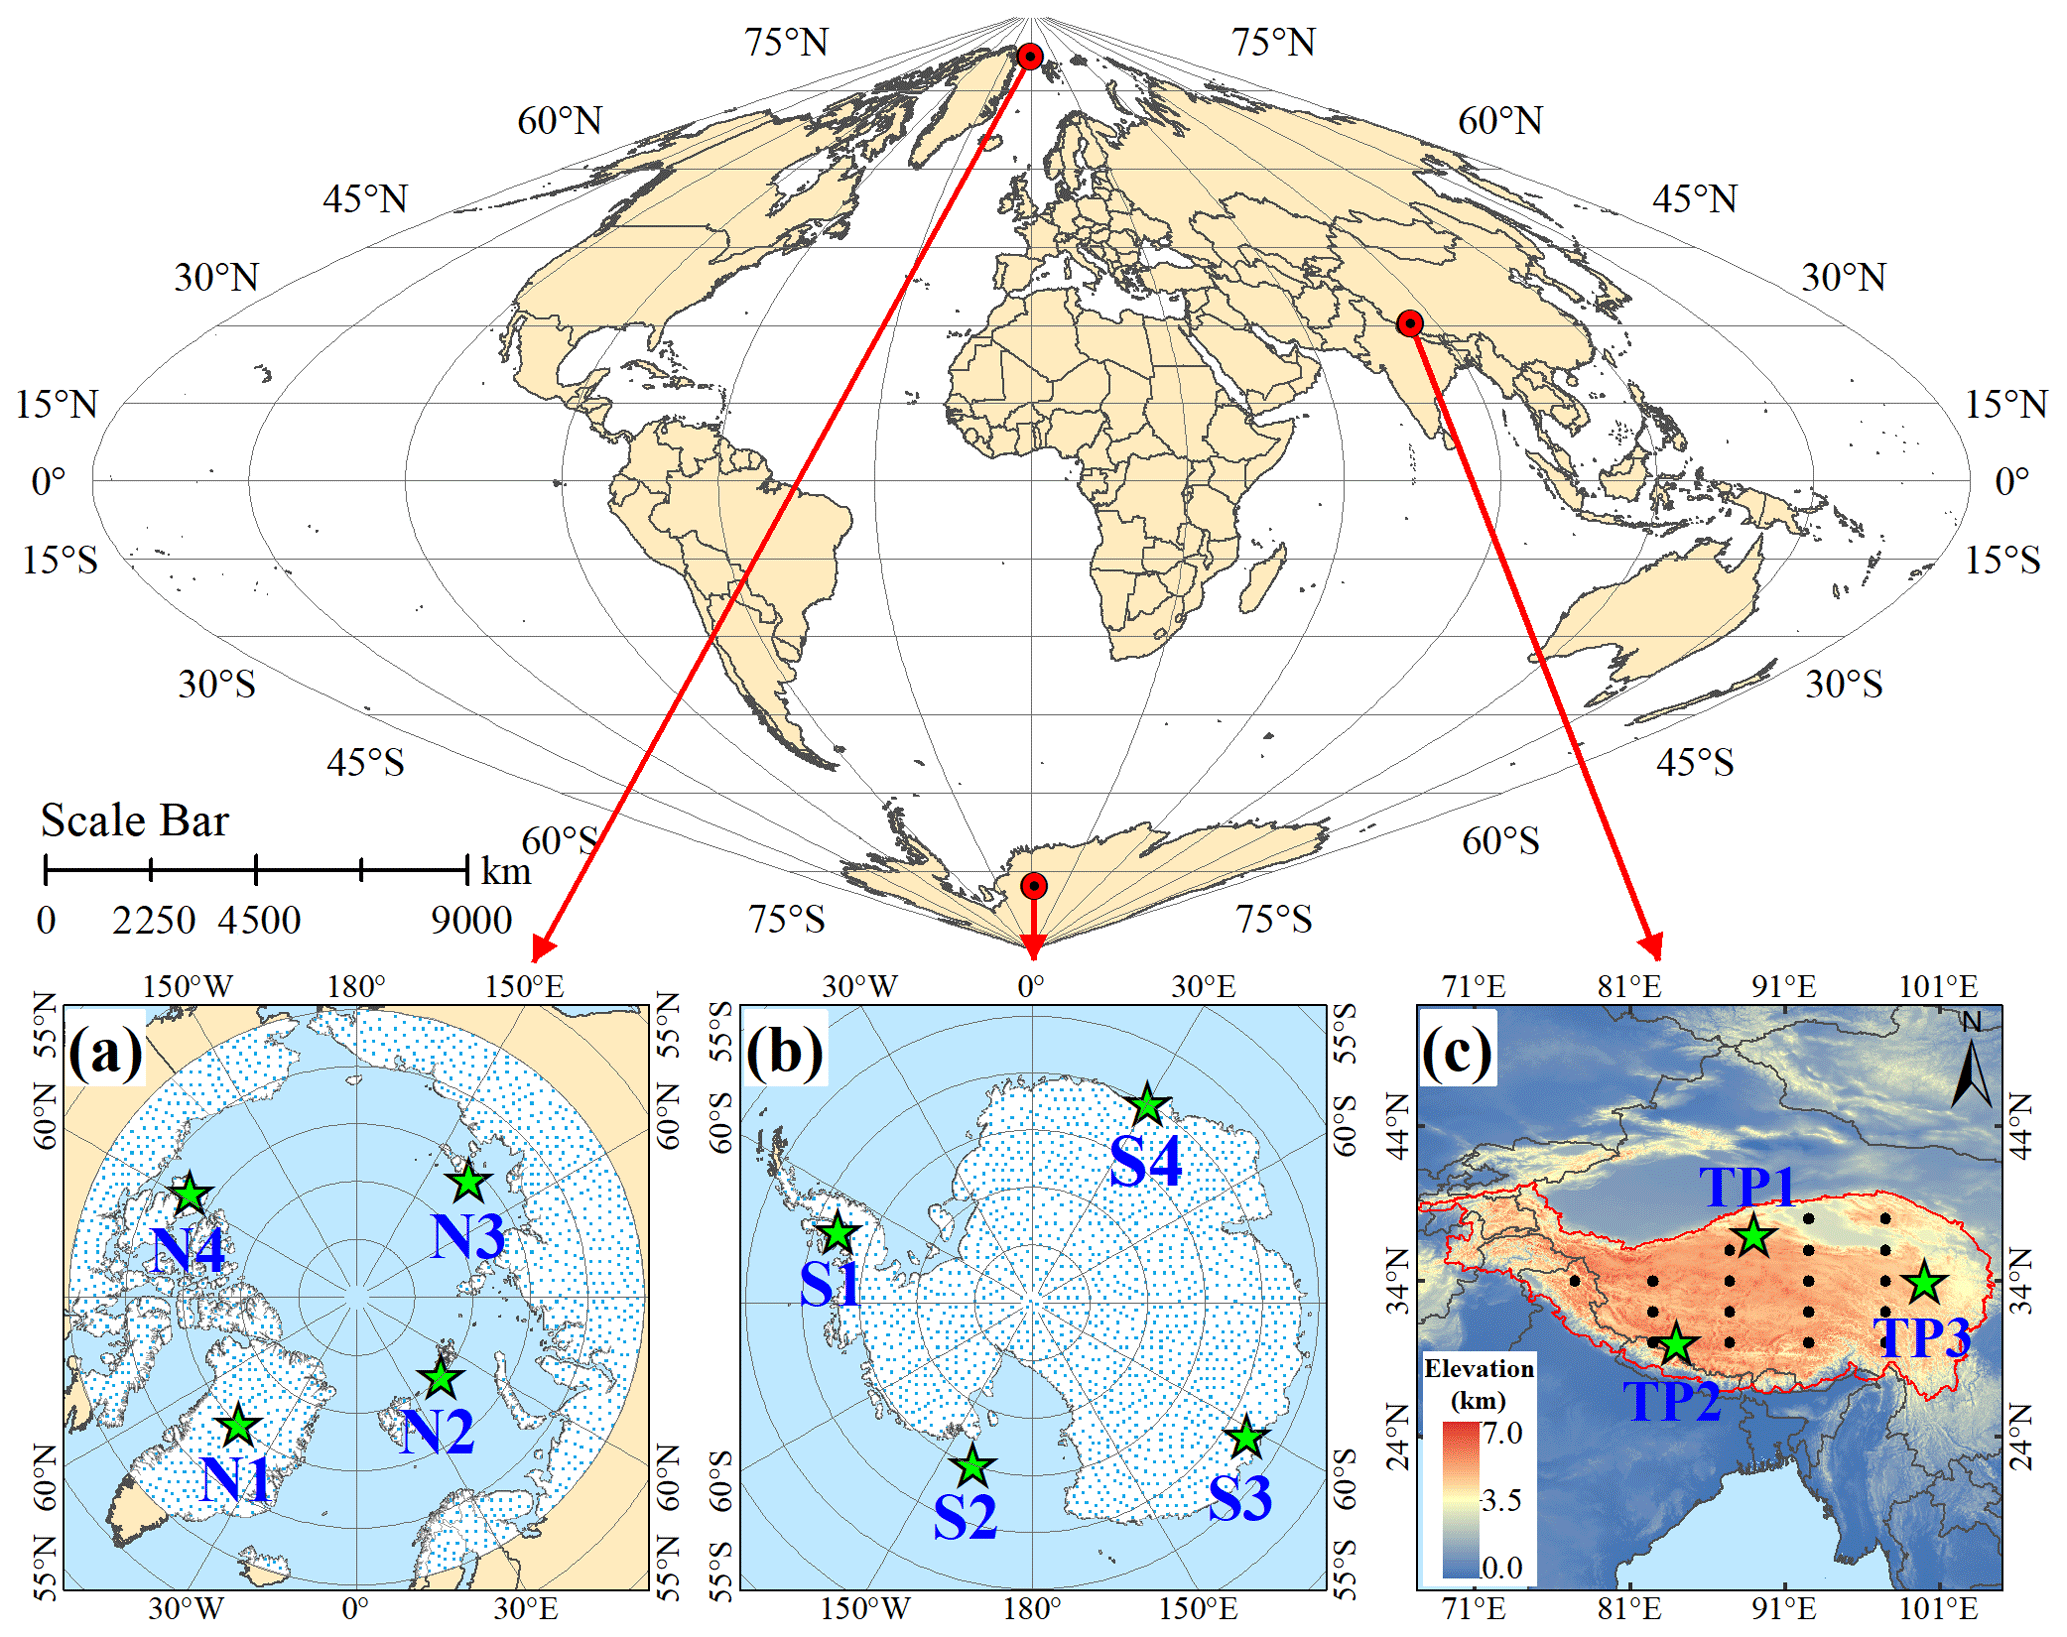
Figure 1Geographical map of the three study areas: the (a) Arctic, (b) Antarctic and (c) TP. Among them, the white background and blue points represent the land within the study area. In (c), the black dots represent the center of the TP inner pixel corresponding to CALIPSO (Cloud–Aerosol Lidar and Infrared Pathfinder Satellite Observations) L3 aerosol data, the green pentagrams represent the site of the aerosol back trajectory study, the red line represents the boundary of the TP, and the color represents the surface elevation data from the Shuttle Radar Topography Mission (SRTM) at http://srtm.csi.cgiar.org/ (last access: 24 March 2021).
Extensive research on aerosol properties over pristine regions has been conducted (Di Carmine et al., 2005; Leaitch et al., 2020; Wu et al., 2018). The Arctic is a region with ample spatiotemporal variability in aerosols (Schmeisser et al., 2018). Due to the influence of pollutants transported (e.g., forest fire smoke, dust, soot and sulfates) from lower latitudes, the AOD in the Arctic is abnormally high in winter and spring (Stone et al., 2014; Tomasi et al., 2007), while in the summertime, the oxidation of dimethyl sulfide (DMS), emitted by phytoplankton activity in the marine area, can act as cloud condensation nuclei and exert significant control on sulfate aerosol (Leaitch et al., 2013). Meanwhile, by employing carbon monoxide as the assumed passive tracer, the relative contributions of transport efficiency and scavenging to seasonal variability in Arctic aerosol have also been evaluated (Garrett et al., 2010). In the past few decades, the aerosol properties in the Antarctic region, including their concentrations, size distribution and chemical composition, have been investigated mainly based on ground-based observations (Barbaro et al., 2017; Kerminen et al., 2000; Koponen et al., 2003). The aerosol properties of the Antarctic are mainly controlled by the Southern Ocean primary and secondary emissions and some periodical long-range transport (Asmi et al., 2018). Coarse-particle sea salt and fine-particle sulfate aerosols are most abundant in the coastal Antarctic regions and over the Antarctic continental regions, respectively (Hall and Wolff, 1998; Wagenbach et al., 1998; Kerminen et al., 2000). Meanwhile, there are also obvious seasonal differences in Antarctic aerosol types. Sea salt and ammonium sulfate particles are dominant in the polar night months, while sulfuric acid droplets are the main particles in the sunlit months (Ito, 1985). The types of aerosols in the TP are complex, and the dominant aerosol type varies with site (Zhao et al., 2020). Dust aerosols in the northern parts of the TP and polluted aerosols over South Asia can reach internal regions of the TP through long-distance transport (Cong et al., 2015; Huang et al., 2007; Lu et al., 2012; Lüthi et al., 2015; Xia et al., 2011; Zhao at al., 2013; Zhu et al., 2019).
Although many studies have been carried out on aerosol optical properties over the Arctic, Antarctic and TP, they are mainly based on the short-term ground remote-sensing or in situ observations, which has limited spatial representation (Chaubey et al., 2011; Cong et al., 2009; Eleftheriadis et al., 2004; Engvall et al., 2008; Pokharel et al., 2019) and inadequate information about the vertical distribution of aerosols. Meanwhile, different aerosol types can result in large uncertainty in estimating the aerosol radiative effect (Loeb and Su, 2010). Thus, it is essential to investigate the long-term aerosol characteristics over relatively large domains of the three pole regions, including the vertical-profile information. In this study, the aerosol optical properties over the Arctic, Antarctic and TP were investigated systematically, including the spatial and temporal distribution, vertical structure, and temporal trends of AOD and aerosol types. In addition, the back trajectory of air masses was also performed to determine the influence of ambient aerosols on the study areas.
2.1 Study regions
As shown in Fig. 1, the Arctic, Antarctic and TP are selected as our study regions. The areas north of 65∘ N and south of 65∘ S are the study regions of the Arctic and Antarctic, respectively, as shown in Fig. 1a and b. The Arctic is an ocean covered by a thin layer of perennial sea ice and surrounded by land including Asia, Europe and North America, while the Antarctic is dominated by the continent covered by a very thick ice cap and surrounded by a rim of sea ice and the Southern Ocean. The TP is composed of land and ice sheets, and the surrounding environment is complex. As shown in Fig. 1c, there is the Taklimakan Desert in the north and the heavily polluted South Asia in the south. Due to the coarse resolution of CALIPSO L3 data over the TP, the spatial and temporal distributions as well as the temporal-variation trends were captured in a large region with latitudes from 25 to 41∘ N and longitudes from 65 to 105∘ E. However, the vertical characteristics of aerosol properties were only investigated in the inner region of the TP, which is marked by black dots, as shown in Fig. 1c. In addition, 11 special locations (marked with green pentagrams) were selected for the study of aerosol sources using back trajectories, and detailed information of 11 sites can be found in Sect. 2.3 and Table S1 in the Supplement.
2.2 CALIOP data
The CALIPSO satellite provides new insight into the role of how clouds and aerosols form, evolve and affect weather and climate (Winker et al., 2007, 2010). The level 3 tropospheric-aerosol-profile product based on level 2 aerosol extinction profiles has the highest quality and is the most sophisticated among all CALIOP level 2 data products (Kim et al., 2018). Compared with the previous products, several changes in data quality screening have been made in the latest product to further avoid extinction retrieval errors, and the detailed algorithm has been depicted (Tackett et al., 2018).
Compared with other sky conditions, the level 3 tropospheric-cloud-free-aerosol-profile (NL3TCFAP) product has the highest quality as extinction retrievals are minimally affected by errors in retrieving the attenuation of overlying cloud cover (Tackett et al., 2018). Meanwhile, the NL3TCFAP product can describe in detail the near-global three-dimensional distribution of aerosols. Thus, to investigate the aerosol properties over the three polar regions of the Arctic, Antarctic and TP, the NL3TCFAP product including daytime and nighttime was used in this study. Up to now, the NL3TCFAP product has contained seven types of aerosols, which are clean marine, dust, polluted continental/smoke, clean continental, polluted dust, elevated smoke and dusty marine. The properties of different types of aerosols are discussed in Sect. 3.2.
The NL3TCFAP product records aerosol property data on a uniform 2∘ latitude by 5∘ longitude grid and has a vertical resolution of 60 m for heights up to 12.1 km above mean sea level (a.m.s.l.). In this study, the mean AOD of each grid at different temporal scales was calculated, and the seasonal differences between the Northern and Southern hemispheres were also considered. The spring (autumn), summer (winter), autumn (spring) and winter (summer) are defined as March–May, June–August, September–November and December–February in the Northern (Southern) Hemisphere, respectively. Note that the averaged aerosol properties over the TP region in this study are only for the internal pixels of the TP, which is marked by black dots in Fig. 1c. The occurrence frequency (OF) of aerosol types was also calculated by counting the number of samples of seven aerosol types in each horizontal grid cell or altitude layer. For the vertical distribution of aerosol properties such as extinction coefficient of the dominant type of aerosol, the CALIOP data were used with further data quality control by removing the outliers. The outliers are defined as the observed data (x) falling outside 3 times the SDs (δ) above or below the mean (), as follows:
2.3 HYSPLIT model
The Hybrid Single-Particle Lagrangian Integrated Trajectory (HYSPLIT) model has been widely used in the simulation of atmospheric pollutant transport, dispersion and deposition (Ashrafi et al., 2014; Jeong et al., 2012; Vernon et al., 2018; Zhao et al., 2009). To fully understand the sources of aerosols, the back trajectories of air masses at 11 selected sites over the three study regions mentioned above were examined using the latest version (V5.0.0) of the HYSPLIT model (Stein et al., 2015). Simultaneously, the multiple trajectories that are near each other were merged into groups through cluster analysis. In this study, the four Arctic sites are located in Greenland (N1), northern Europe (N2), northern Asia (N3) and northern North American (N4). The four sites in the Antarctic are located on the Antarctic Peninsula (S1), Ross Sea (S2), Dronning Maud Land (S3) and Wilkes Land (S4). The three selected sites in the TP region are located on the northern (TP1), southern (TP2) and eastern (TP3) edges of the TP region. The locations of these sites are shown in Fig. 1, and detailed information of each site is shown in Table S1. Previous air mass back trajectory simulations in the polar regions found that it is difficult to simulate the seasonal difference in the air mass with short-term back trajectory simulation, while the long-term back trajectory simulation has great uncertainties in the spatial domain (Hirdman et al., 2010; Sharma et al., 2013); thus a 14 d back trajectory simulation was adopted in this study (Rousseau et al., 2006), and the simulation date was set as the 15th and last day of each month, which can help save a lot of computation sources while keeping the simulated back trajectories representative.
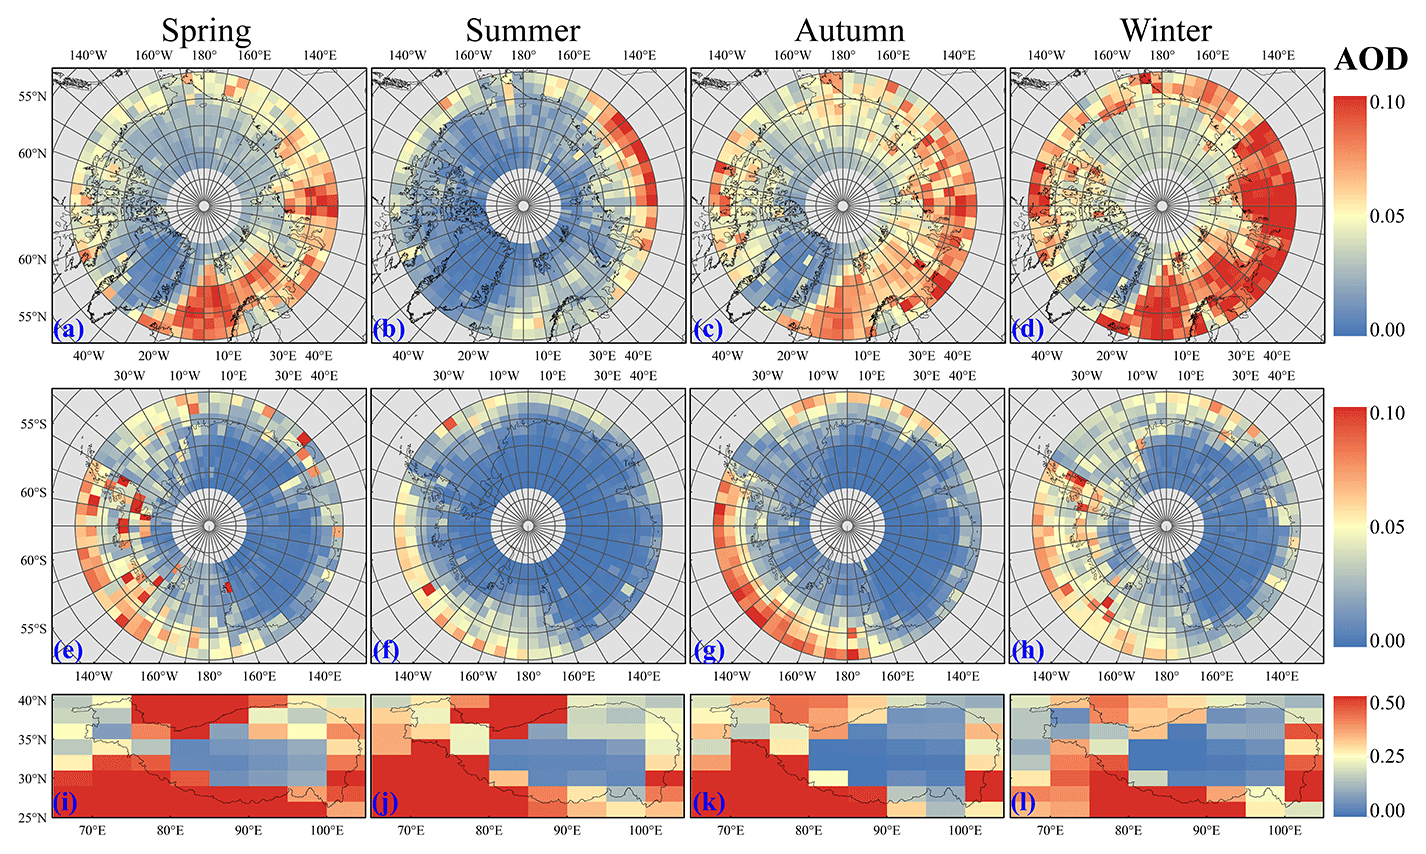
Figure 2Seasonally averaged AOD distribution for 13 years (June 2006 to December 2019) over the Arctic, Antarctic and TP. Four columns represent four seasons. Panels (a–d), (e–h) and (i–l) represent the spatial distribution of aerosols in the Arctic, Antarctic and TP, respectively.
3.1 The spatial and temporal distribution of aerosol properties
3.1.1 The spatial distribution of AOD
Figure 2 depicted the seasonally averaged spatial distribution of AOD over the Arctic, Antarctic and TP, from which we can find that the AOD averaged between June 2006 and December 2019 has obvious spatial variation. In the Arctic, except for the island of Greenland, aerosol loadings are larger over the continent than over the ocean. In contrast, aerosol loadings over the Antarctic continent are lower than over the surrounding ocean. In general, aerosol loadings are found to be larger in the southern part of the Atlantic Ocean in the Antarctic and to decrease with an increase in latitude, while high AODs could exist in some regions at high latitudes of the Antarctic such as the Antarctic Peninsula, especially in spring and winter. The aerosol concentration in the TP region is generally low, while the aerosol loading in the regions around the TP (e.g., Tarim Basin in the north, Qaidam Basin in the northeast, Sichuan Basin in the east and South Asia in the south) is large. In terms of regional differences, the aerosol concentration in the Arctic region is significantly higher than that in the Antarctic region. Meanwhile, the annual-average AODs over the Arctic, Antarctic and the inner region of the TP are 0.046, 0.024 and 0.098, with SDs of 0.003, 0.002 and 0.009, respectively.
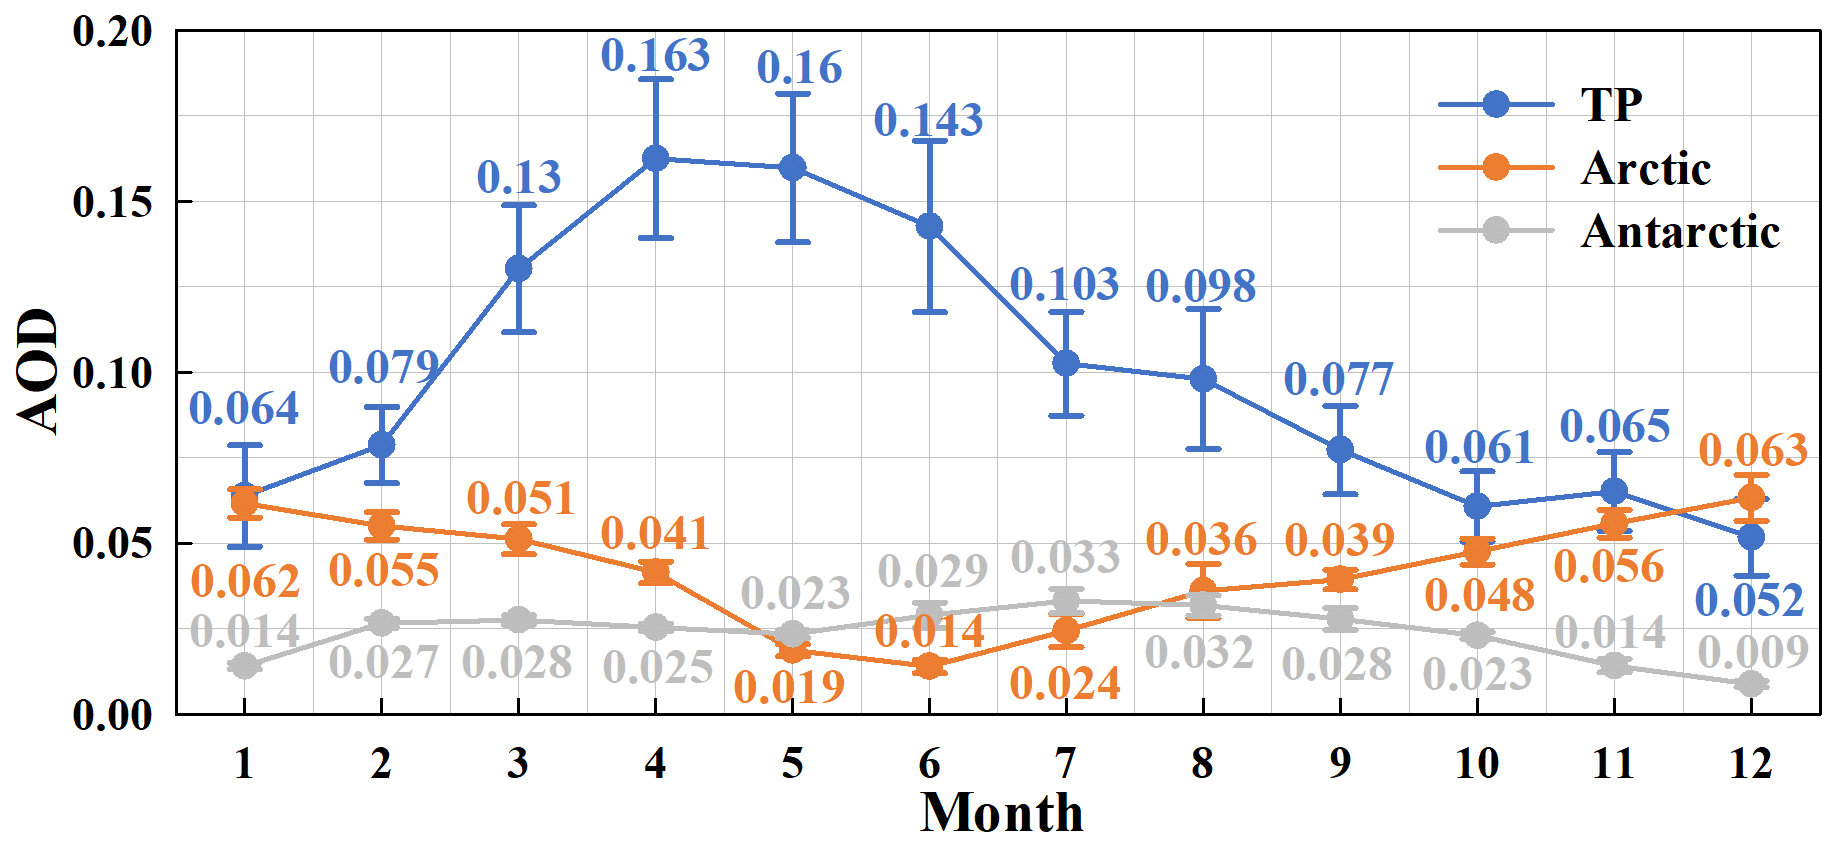
Figure 3The monthly averages (dots) and SDs (bars) of AODs for the study period from June 2006 to December 2019 over the Arctic, Antarctic and TP.
3.1.2 The multi-year-averaged seasonal variation in AOD
The aerosols and monsoon circulation patterns interact with each other (Ma and Guan, 2018), making it particularly valuable to know the seasonal variations in aerosol properties. In this study, we investigated the monthly variations in multi-year (June 2006–December 2019) averages and SDs of AODs for three study regions, which are shown in Fig. 3. As shown in Figs. 2 and 3, AOD has obvious seasonal variations, especially over the TP and Arctic, while the Antarctic AOD has relatively weak seasonal variations. The TP has a higher aerosol concentration in spring and summer. The high aerosol concentration mainly occurs from late autumn to early spring in the Arctic, while it occurs in winter and spring in the Antarctic. The aerosol loading over the TP is easily affected by the surrounding regions, where there are many anthropogenic and natural aerosol sources. Specifically, the dust aerosols in the Tarim Basin and Qaidam Basin have a greater contribution to the TP in spring and summer, especially in the northern part of the TP in summer (Huang et al., 2007; Xia et al., 2008; Xu et al., 2020). Meanwhile, a large number of fine aerosol particles exist in South Asia and the northern Indian Peninsula due to forest fires and anthropogenic burning during the dry season. The aerosols are lifted and transported to the Himalayas under the influence of large-scale atmospheric systems such as the South Asian monsoon and the Siberian high, which affects the southern part of the TP (Cong et al., 2015; Engling et al., 2011; Han et al., 2020; Xu et al., 2014, 2015).
The high aerosol concentration in the winter and spring Arctic is known as the Arctic haze phenomenon (Garrett and Zhao, 2006; Mitchell, 1957; Zhao and Garrett, 2015). On one hand, anthropogenic aerosol from low and middle latitudes can disturb the Arctic atmosphere, especially from Eurasia. On the other hand, stable atmospheric status with less precipitation occurs in the Arctic winter, which makes it difficult for aerosols to be removed by wet deposition (Garrett et al., 2010; Heintzenberg, 1989). As shown in Fig. S1 in the Supplement, the Arctic region has a smaller monthly average convective available potential energy (CAPE) in the winter half year, while the monthly average wind speed at 10 m above the surface is higher. Among the three study regions, the AOD of the Antarctic is slightly higher than that of the Arctic in the Southern Hemisphere wintertime, while the AOD of the Antarctic is the lowest in other months. The slightly higher AOD shown in the Antarctic in spring and winter compared to the other two seasons may be due to a similar reason as in the Arctic: stable atmospheric conditions and less precipitation make the aerosols difficult to be removed in spring and winter. Meanwhile, the SD of AOD is also calculated and shown as error bars in Fig. 3. It can be seen that the SD of AOD over the TP is larger than that over the Arctic and Antarctic, indicating that the variation in AOD over the TP is more significant.
Similar patterns of multi-year-averaged seasonal variation in AOD over the three study regions were also observed using the AERONET data, which have high accuracy and are widely used in aerosol characteristics and satellite-based AOD inversion verification studies (Holben et al., 1998; Martonchik et al., 2004; Russell et al., 2010; Yang et al., 2019). Over the TP, the multi-year-averaged AOD reaches a maximum in April and a minimum in December, while the aerosol composition varies greatly at different sites (Cong et al., 2009; Pokharel et al., 2019). High AOD mainly occurs in spring, associated with the Arctic haze, and low AOD occurs in summer over the Arctic (Breider et al., 2014; Grassl and Ritter, 2019; Rahul et al., 2014). Monthly mean values of AOD have also been investigated using the AERONET sites (Novolazarevskaya, Dome Concordia and South Pole) over the Antarctic, which are similar to those found using CALIPSO data, with values ranging from 0.02 to 0.04 from September to March (Tomasi et al., 2015). It should be noted that due to the daytime limitation, only the AODs during the short summer period were analyzed over the Arctic and Antarctic using AERONET measurements.
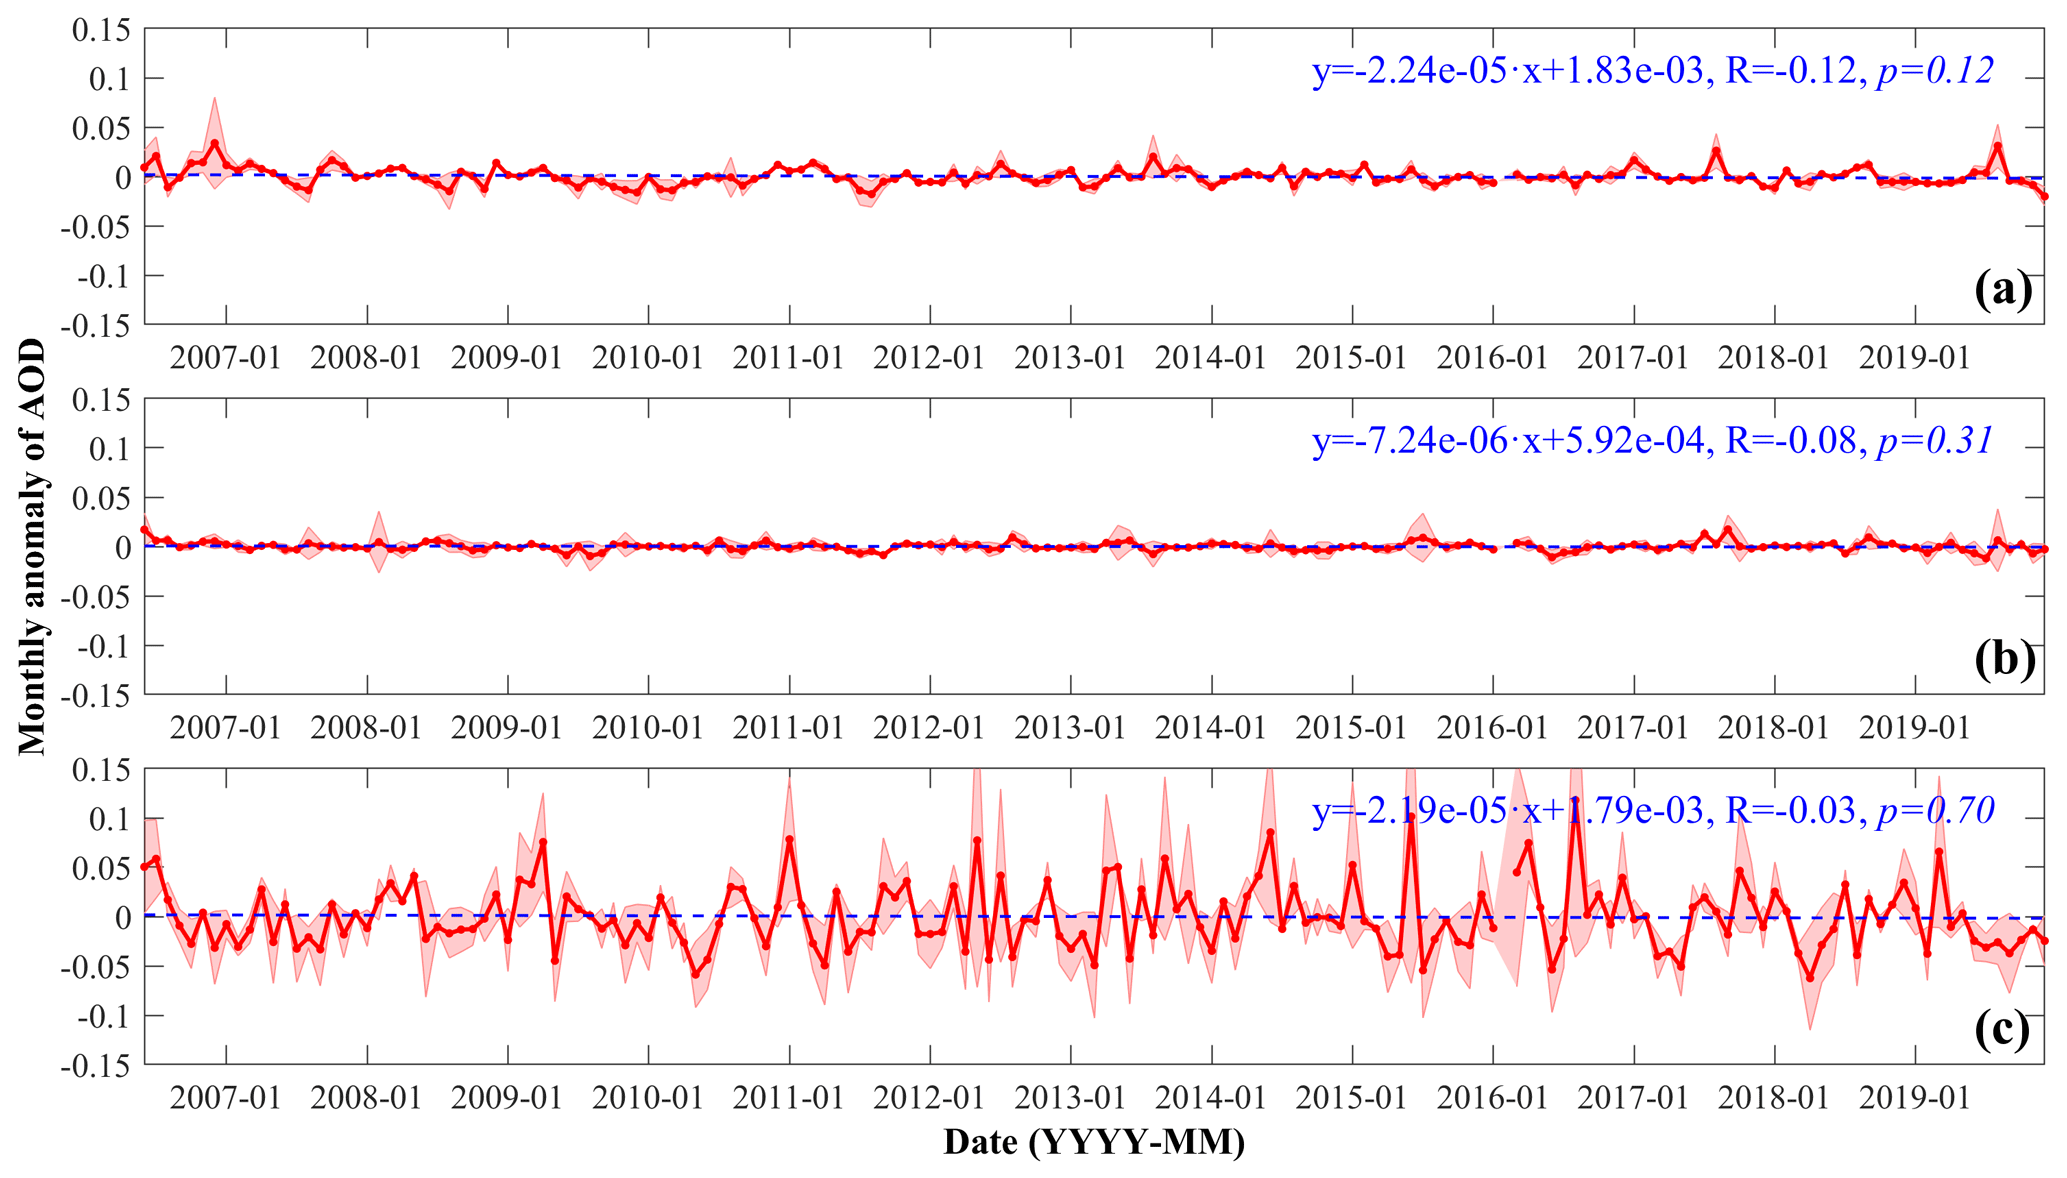
Figure 4Temporal variation in monthly AOD anomalies from June 2006 to December 2019 over the (a) Arctic, (b) Antarctic and (c) TP. The solid red lines and shadows represent the deseasonalized monthly AOD anomalies and SDs, respectively, while the dotted blue lines represent the linear trends.
3.1.3 The long-term trend of AOD
To study the long-term trend of AOD over the Arctic, Antarctic and TP, the monthly AODs along with their SDs from June 2006 to December 2019 were calculated using valid data in the study areas. In order to remove the clear seasonal variation in AOD as found earlier in the study regions, the deseasonalized trend was carried out by calculating the AOD anomalies. The AOD anomaly here is defined as the difference between the monthly average value of AOD in each month and the average value of AOD for that month in all years. The results of the monthly AOD anomaly over the Arctic, Antarctic and TP are outlined in Fig. 4. The solid line with red color represents the monthly AOD anomaly, the shadow region represents the single SDs, and the dotted blue line represents the linear trend based on deseasonalized monthly AOD anomalies from June 2006 to December 2019. Figure 4 shows that there are no significant increasing or decreasing trends of AOD anomalies in the Arctic, Antarctic and TP (slope = −0.00724 % to −0.00219 %), although the linear trends show a high confidence level (p > 0.05). It is worth noting that the deseasonalized monthly AOD anomalies over the TP region are relatively high. There are two likely reasons. First, there are anthropogenic emission sources over the TP region (Li et al., 2016; Zhu et al., 2019). Second, the TP is located in Central Asia, surrounded by highly polluted areas, and is easily affected by external aerosol transport (Hu et al., 2020; Liu et al., 2015; Xia et al., 2021; Zhao et al., 2020). Figure S2 in the Supplement also presents the temporal variation in seasonal-average AOD from the summer of 2006 to the winter of 2019 over the TP, Arctic and Antarctic. As expected, AOD over the three study regions has an obvious seasonal-variation trend. For the TP, the average AOD is about 0.15 in spring, which is the most serious pollution season in the whole year, while AOD is about 0.05 in winter, which is the cleanest season in the whole year. Boreal winter (summer) and summer (winter) are the most polluted and cleanest seasons over the Arctic (Antarctic), respectively. In addition, the SDs of seasonal AODs over the TP are between 0.0 and 0.12 due to the influence of transported aerosols from surrounding regions, which are greater than those of 0.0 to 0.05 over the Arctic and Antarctic.
3.2 The properties of different aerosol types
Compared with the aerosol type information from AERONET, MODIS, MISR and OMI, aerosol types obtained using the CALIPSO are widely used to investigate the aerosol characteristics at a local or global scale. However, the uncertainty assessment of CALIPSO aerosol types is still a challenging task (Kahn and Gaitley, 2015), especially for aerosol types which have similar optical properties, such as polluted dust and smoke (Zeng et al., 2021). Aerosol subtypes from the CALIPSO V3 dataset were evaluated with the AERONET product by previous studies, which showed consistency of all aerosol types except for smoke and polluted-dust aerosols (Burton et al., 2013; Mielonen et al., 2009). In the V4 CALIPSO aerosol classification algorithm, several refinements were conducted to improve the accuracy of aerosol type classification (Kim et al., 2018).
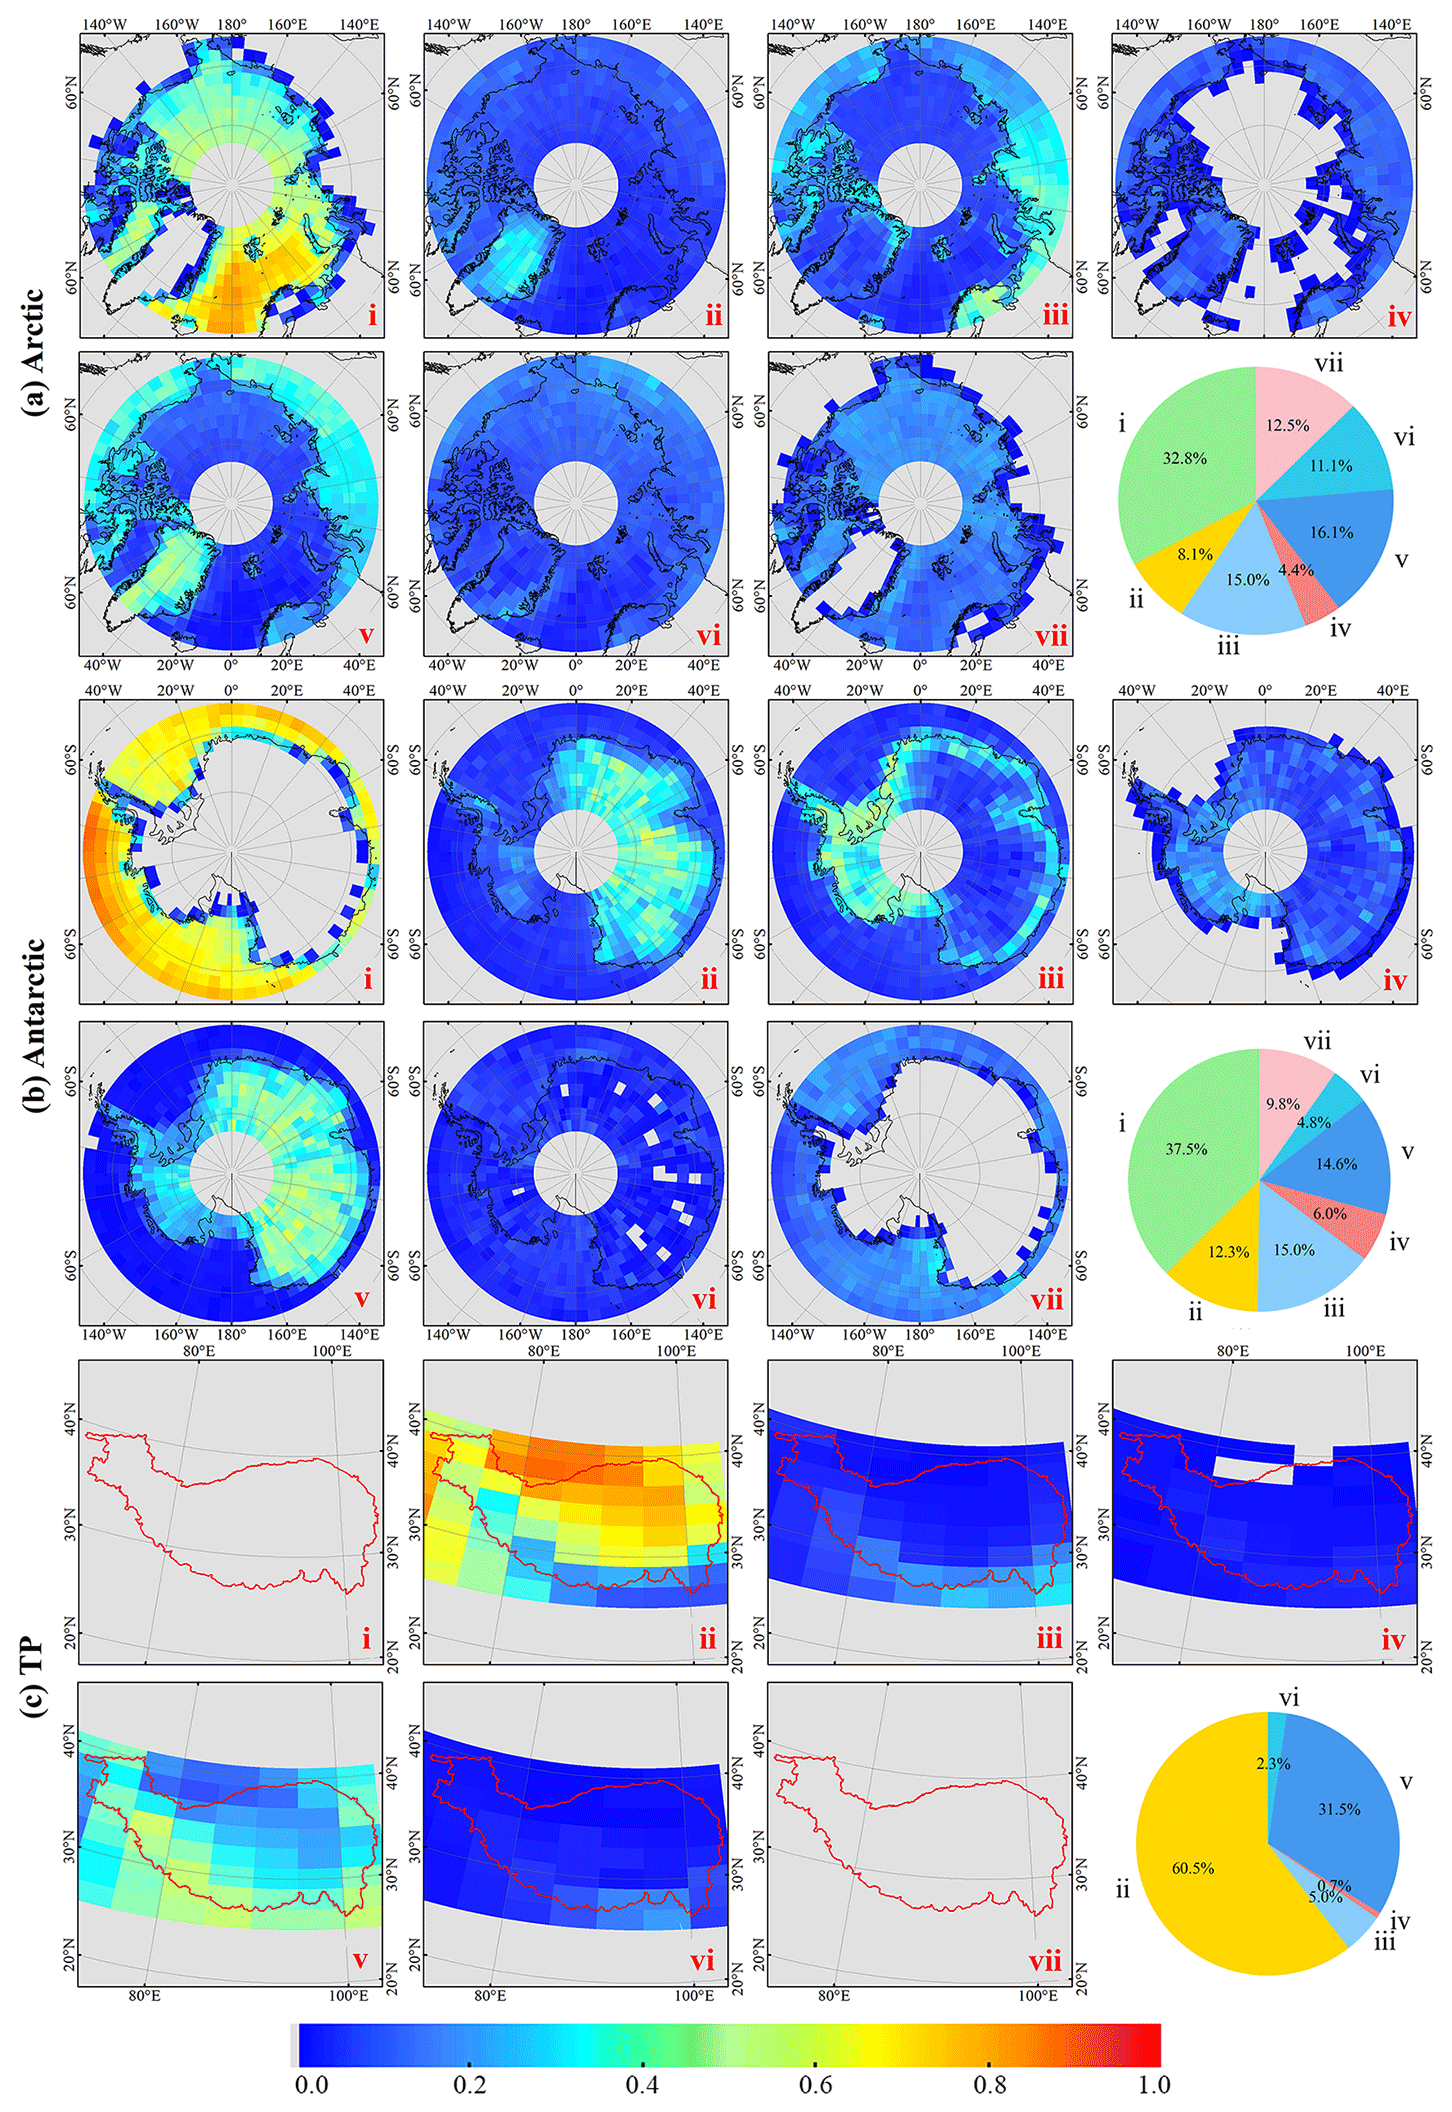
Figure 5The annually averaged OF maps during the study period from June 2006 to December 2019 for seven aerosol types defined by CALIOP products over the (a) Arctic, (b) Antarctic and (c) TP. The numbers i–vii represent clean marine, dust, polluted continental/smoke, clean continental, polluted dust, elevated smoke and dusty marine, respectively. The pie represents the annual-average OF of all pixels for seven aerosol types.
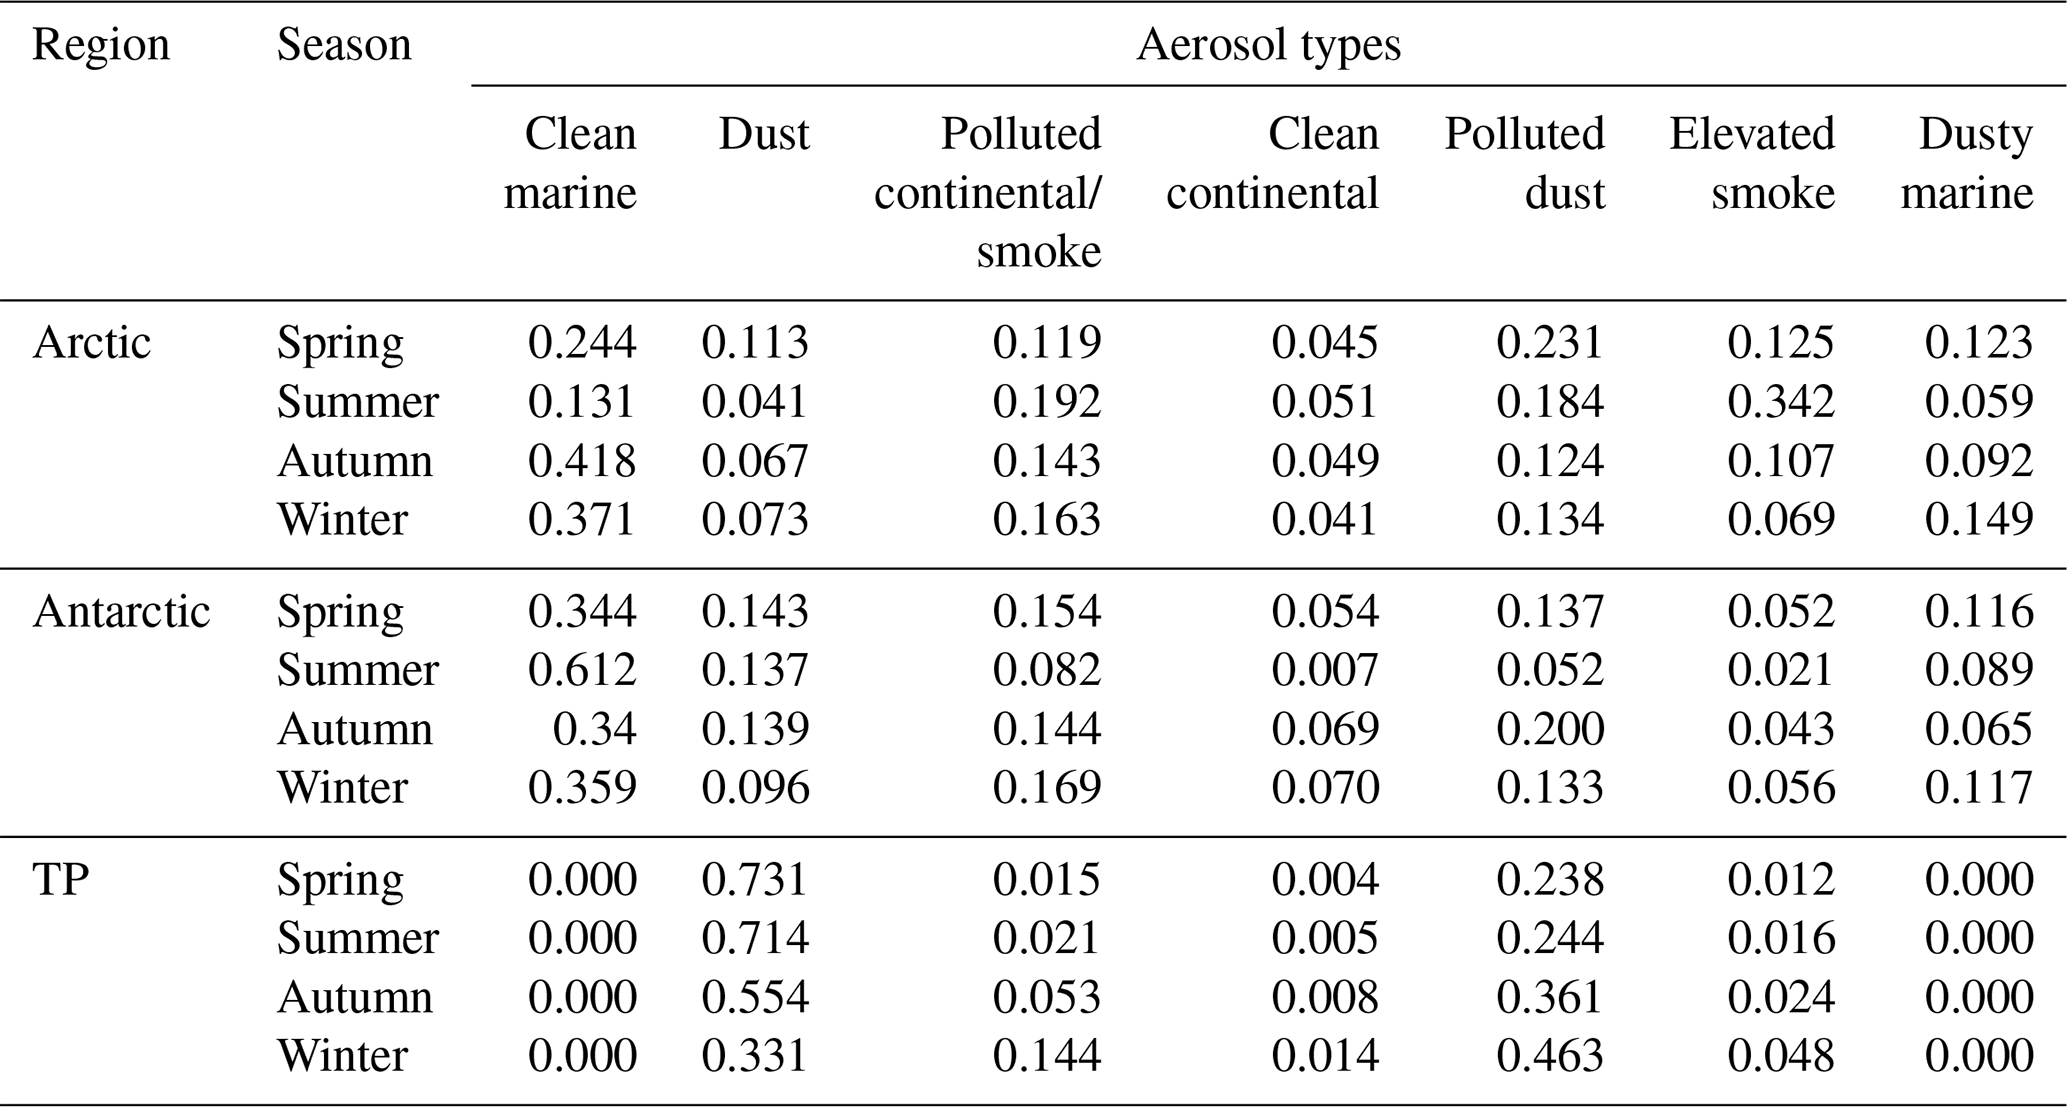
Table 1The normalized seasonal-average OF of seven aerosol types during the study period from June 2006 to December 2019 over the Arctic, Antarctic and TP.
3.2.1 Horizontal distribution
In order to examine the spatial and temporal variability in aerosol types, the normalized annual and seasonally averaged OFs of different aerosol types over the (a) Arctic, (b) Antarctic and (c) TP are presented in Fig. 5 and Table 1, respectively. The numbers i–vii represent OF of clean marine, dust, polluted continental/smoke, clean continental, polluted-dust, elevated-smoke and dusty marine aerosol, respectively.
In terms of the spatial distribution of aerosol OF among the three study regions, it can be seen from Fig. 5 that the annual-average OF of aerosol types is roughly similar in both the Arctic and Antarctic. The dominant aerosol type is the clean marine, followed by polluted continental/smoke and polluted dust. The annual-average proportion of time with clean marine aerosol dominant in the Arctic and Antarctic is about 32.8 % and 37.5 %, respectively. In contrast, the dominant aerosol types over the TP are the dust type and polluted-dust type, which show a dominant role for 92 % of the time throughout the whole year. Figure 5 also shows that there are large differences in the spatial distribution of different aerosol types over all study regions. However, the spatial distribution of aerosol types has a distinctive feature; that is, the OFs of dust (ii), polluted continental/smoke (iii) and polluted dust (v) over the land are significantly higher than over the ocean area in the Arctic and Antarctic. The clean marine (i) aerosol mainly occurs in the sea area of the Arctic and Antarctic regions, and the farther away from the land, the higher the OF of clean marine aerosol. Clean continental (iv) aerosol only occurs in the land area, while dusty marine aerosol (vii) only occurs in the marine area. The OF of elevated smoke (vi) does not differ significantly between land and sea areas, which can be explained to a certain extent by the fact that the elevated-smoke aerosols in the Antarctic and Arctic are mainly transported from the outside.
There is also a significant difference in the OF spatial distribution of different aerosol types in each study region. In the Arctic, dust (ii) and polluted-dust (v) aerosol has a higher frequency of occurrence over Greenland, northeastern Asia and northern North America. There are two main contributing sources. One is that the contribution of local emission (e.g., Iceland) to dust aerosols in the Arctic is significant, especially in winter (Dagsson-Waldhauserova et al., 2019; Fan, 2013). The other is the transport of Asian dust into the atmosphere, which was subsequently transported eastward and reached the high-latitude regions of northern North America (Tomasi et al., 2007; VanCuren et al., 2012). In contrast, polluted continental/smoke (iii) aerosol mainly occurs in Eurasia, which is mainly due to biomass burning (e.g., agricultural burning and wildfires) in the Eurasian region (Soja et al., 2004; Warneke et al., 2010). In the Antarctic, there are obvious spatial differences in aerosol types. Specifically, dust (ii) and polluted-dust (v) aerosols are the dominant aerosol types that occurred in East Antarctica. The main aerosol type in West Antarctic (Antarctic Peninsula) is polluted continental/smoke (iii) aerosols, but there is also a certain proportion of polluted-dust (v) aerosol in West Antarctica, similar to the findings reported by Li et al. (2008). The clean marine aerosol mainly occurs in the Southern Ocean and decreases drastically in occurrence frequency in the interior of Antarctica (Teinilä et al., 2014; Virkkula et al., 2006). For the TP region, dust aerosols occur more frequently in the north and west of the TP, which is mainly because they are close to desert source areas, including the Tarim Basin, Qaidam Basin and Iranian Plateau. Differently, the polluted dust in the south of the TP has a higher frequency of occurrence, which may be due to the impact of South Asia anthropogenic pollutants and biomass burning aerosols. Similarly, polluted continental/smoke and elevated smoke also have a higher frequency in the southern TP.

Figure 6The vertical distribution of seasonally (spring: a–c; summer: d–f; autumn: g–i; winter: j–l) averaged aerosol extinction coefficient at 532 nm during the study period from June 2006 to December 2019 over the Arctic (left panels), Antarctic (middle panels) and TP (right panels), including the mean extinction coefficient (solid red line), dust extinction coefficient (solid black line), elevated-smoke extinction coefficient (solid blue line) and polluted-dust extinction coefficient (solid cyan line) over the Arctic (a, d, g and j), Antarctic (b, e, h and k) and TP (c, f, i and l).
As mentioned above, aerosol types have a distinct seasonal variation. We then investigated the seasonal-average OF of different aerosol types. In this study, the number of samples of seven aerosol types in each study region was first counted, and then the normalized OF of different aerosol types was calculated seasonally. Similarly to the findings in Fig. 5, in general, the dominating aerosol type is clean marine over the Arctic and Antarctic. However, the normalized OF of aerosol types displays a substantial seasonal dependence (Table 1). Specifically, the proportion of clean marine aerosols is larger in the Arctic in autumn and winter than that in spring and summer. This may be due to the fact that the near-surface wind speed in the winter half year in the Arctic region is higher than that in the summer half year, which leads to more marine aerosols entering the atmosphere (Erickson et al., 1986; Hughes and Cassano, 2015). In the summer fire season, the wildfires and agricultural burning occur more frequently over Siberia and North America and can be transported to the Arctic along with the pollutants, resulting in a high proportion of polluted continental/smoke aerosol and elevated-smoke aerosol. This notion is also supported by previous studies (Stohl et al., 2006; Schmeisser et al., 2018; Tomasi et al., 2007). In spring, meanwhile, the proportion of dust and polluted dust increases significantly in the Arctic, which is due to the transported dust from Asian desert sources (Barrie, 1995). Similar results for the seasonal variation in aerosol type over the Arctic were also simulated by the GEOS-Chem model (AboEl-Fetouh et al., 2020). Differently from the Arctic, clean marine aerosol was the dominant aerosol type in the Antarctic, especially in summer, accounting for about 61.2 %. Similar results were reported by Quinn et al. (1998). Meanwhile, there is a high proportion of dust aerosols in the Antarctic except in winter. It is also found that polluted continental/smoke aerosol in the Southern Hemisphere in winter and spring has a relatively large proportion, consistent with previous findings that there is more equivalent back carbon concentrations in spring and winter than in summer and autumn (Bodhaine, 1995; Weller et al., 2013). Compared with the Antarctic and Arctic regions, the types of aerosols in the TP are relatively simple, which are mainly the dust aerosol and polluted-dust aerosol. In spring and summer, the proportion of dust aerosol is relatively high because the dust aerosols originating from the Taklimakan Desert are transported to the internal TP through the northwesterly wind under the topographic blocking (Liu et al., 2015; Jia et al., 2015). In autumn and winter, the emission of anthropogenic aerosol increases, resulting in higher OF of polluted continental/smoke, and elevated-smoke aerosols also increase due to the increase in biomass combustion (Carter et al., 2016; Cheng et al., 2020). Similar results were also found by measuring the concentration of polycyclic aromatic hydrocarbons (PHAs) in soil, which are the by-products of incomplete combustion of organic matter (Tao et al., 2011). Correspondingly, the proportion of polluted-dust aerosol, which is the mixture of anthropogenic aerosol and dust aerosol, increases in autumn and winter over the TP.
3.2.2 The vertical extinction coefficient of dominant aerosol type
Knowledge of aerosol extinction coefficient is necessary to enhance our understanding of how atmospheric aerosols impact the weather and climate to a certain extent (Jung et al., 2019). The extinction properties of the three typical aerosol types (including dust, elevated smoke and polluted dust) and the average value of the extinction of all aerosol types were retrieved in the CALIPSO L3 aerosol profile product. In this study, the seasonal-average aerosol extinction coefficient profiles (spring: a–c; summer: d–f; autumn: g–i; winter: j–l) over the Arctic, Antarctic and TP were calculated statistically and are shown in Fig. 6.
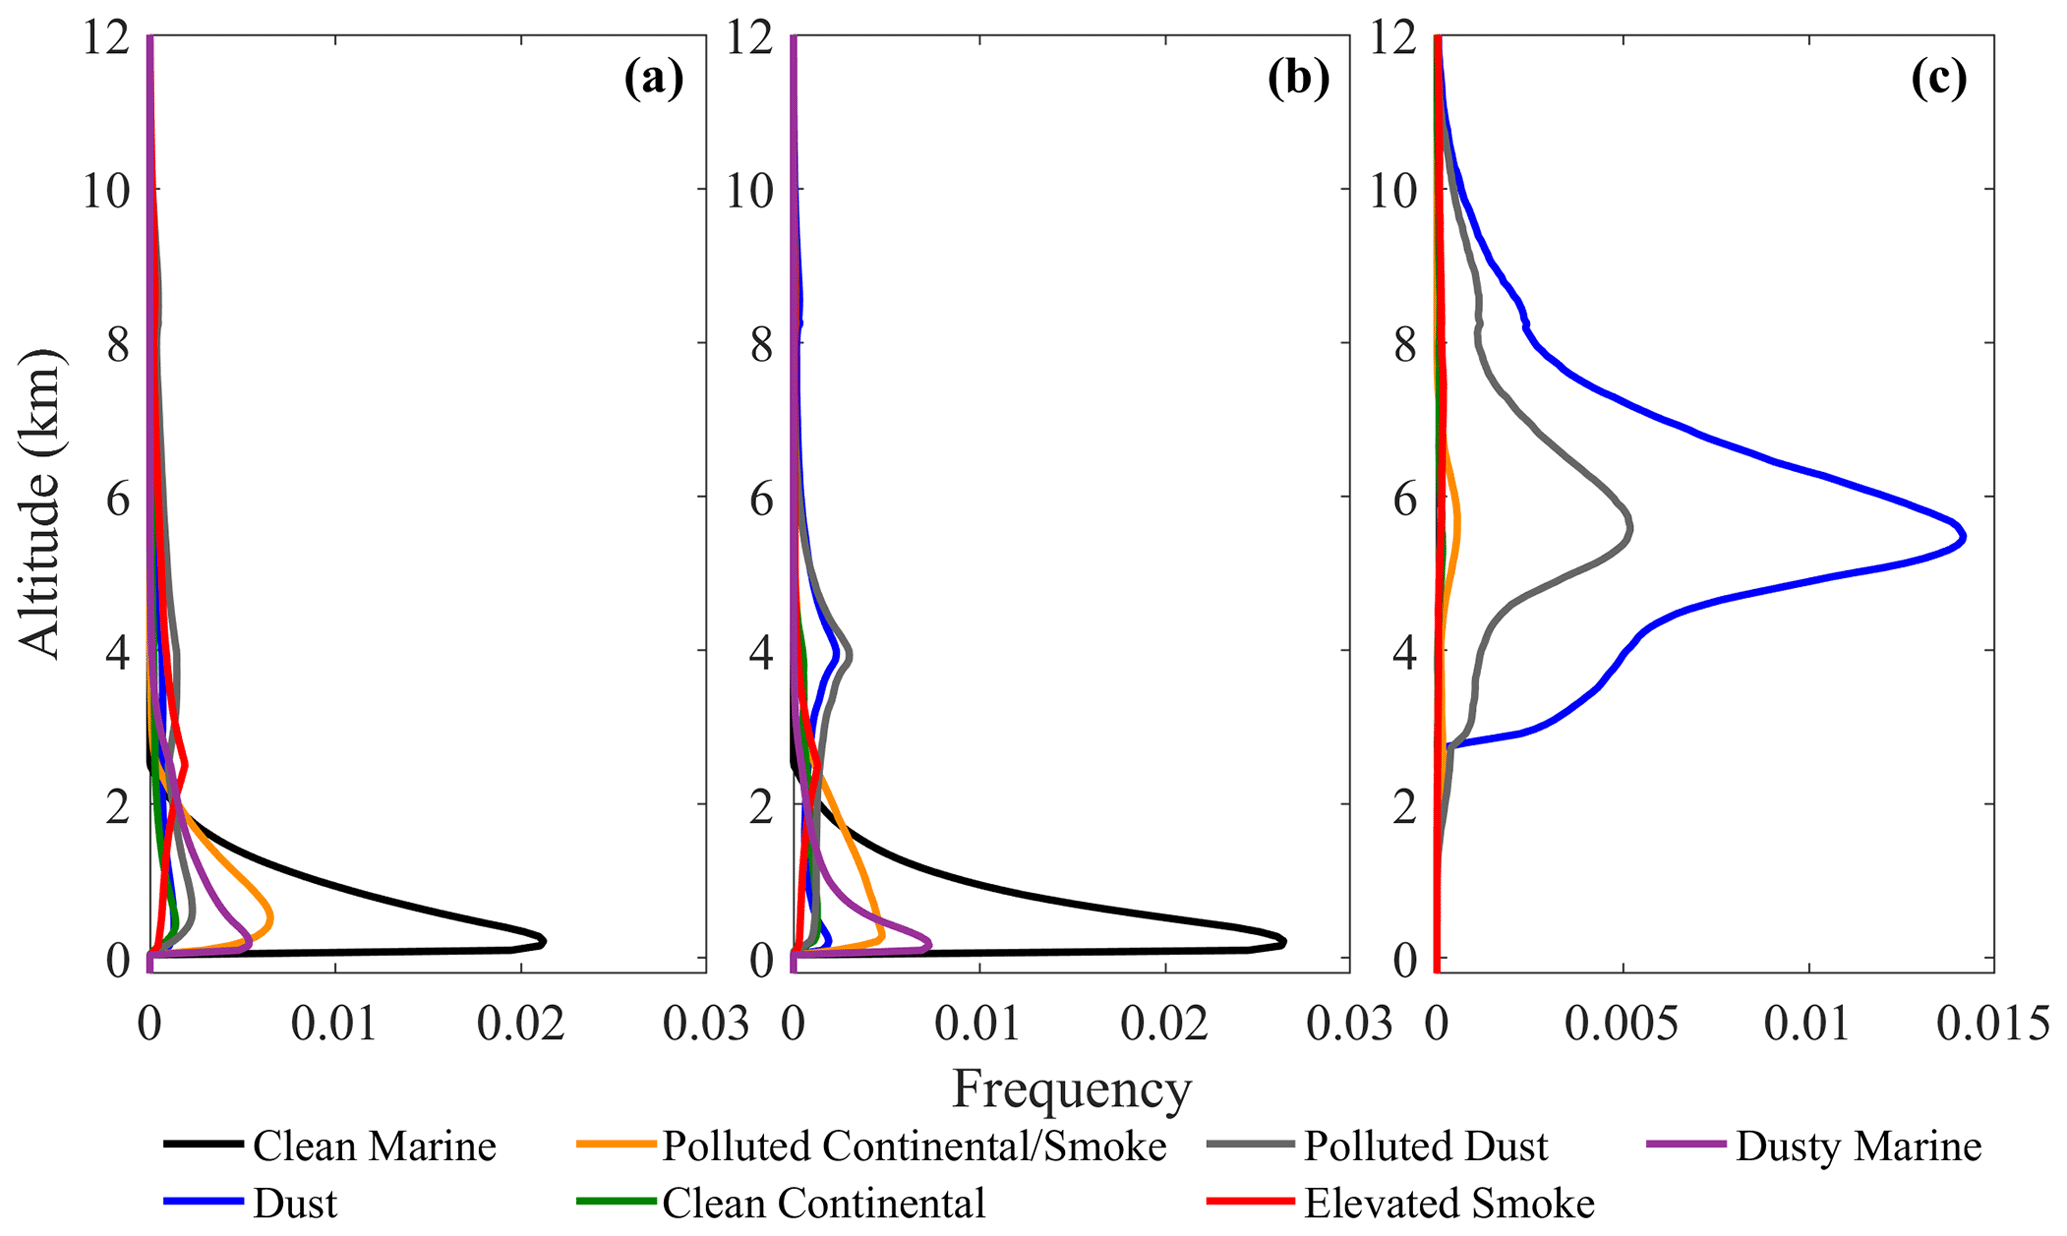
Figure 7The vertical distribution of multi-year-average (June 2006 to December 2019) OF of aerosol types over the (a) Arctic, (b) Antarctic and (c) TP.
As Fig. 6 shows, there is no doubt that the aerosol extinction coefficient profile has a significant regional difference. In general, the aerosol extinction coefficient in the Arctic has a broad vertical distribution at heights ranging from 0 to 12 km, but the vertical distribution of the Antarctic aerosol extinction coefficient is uneven. In the Antarctic, the extinction layer can reach a maximum height of 11 km in winter (Fig. 6k) and spring (Fig. 6b), while it is mainly distributed below 5 km in summer (Fig. 6e) and autumn (Fig. 6h). The vertical distribution of aerosols over the TP is more concentrated, with most aerosols distributed between 2 and 8 km. The vertical distribution of extinction coefficients of different aerosol types also demonstrates large regional differences. The elevated smoke in the Arctic has a larger extinction coefficient when the altitude is greater than 2 km, especially in summer (Fig. 6d) and autumn (Fig. 6g), while in the near-ground area (altitude < 2 km), dust and polluted dust have a larger extinction coefficient, which is in good agreement with previous studies (Di Biagio et al., 2018). The extinction coefficients of aerosols in the Antarctic have obvious seasonal characteristics. The vertical-distribution patterns of extinction coefficients for the three aerosol types in spring (Fig. 6b) and autumn (Fig. 6h) are basically the same, and the extinction layers are mainly concentrated at heights below 5 km. In summer (Fig. 6e), the vertical distributions of extinction coefficients are quite different among the different types of aerosols. The elevated smoke is mainly concentrated at heights of about 3 km, while the dust-related aerosol types are more distributed at heights below 2 km. In contrast, in winter (Fig. 6k) the extinction coefficient of dust and elevated smoke increases significantly above 5 km, and the polluted-dust aerosols have large extinction coefficients under 5 km. Unlike the Arctic and Antarctic regions, the extinction coefficients of smoke- and dust-related aerosols over the TP region are larger at heights of 4–9 and 2–9 km, respectively. From the perspective of seasonal variation, the extinction coefficient of dust aerosol is larger in spring (Fig. 6c) and summer (Fig. 6f) than in autumn (Fig. 6i) and winter (Fig. 6l). In contrast, the extinction coefficient profile of polluted-dust aerosol shows larger values in spring (Fig. 6c) and autumn (Fig. 6i). This vertical-distribution information of aerosol can help to better understand the sources and impacts of aerosols over the three study regions in the future. For example, aerosol information below clouds could be particularly important for studying aerosol–cloud interactions. Note that the vertical distribution of aerosol characteristics could also be influenced by the topography in each region, which is out of the scope of the current study.
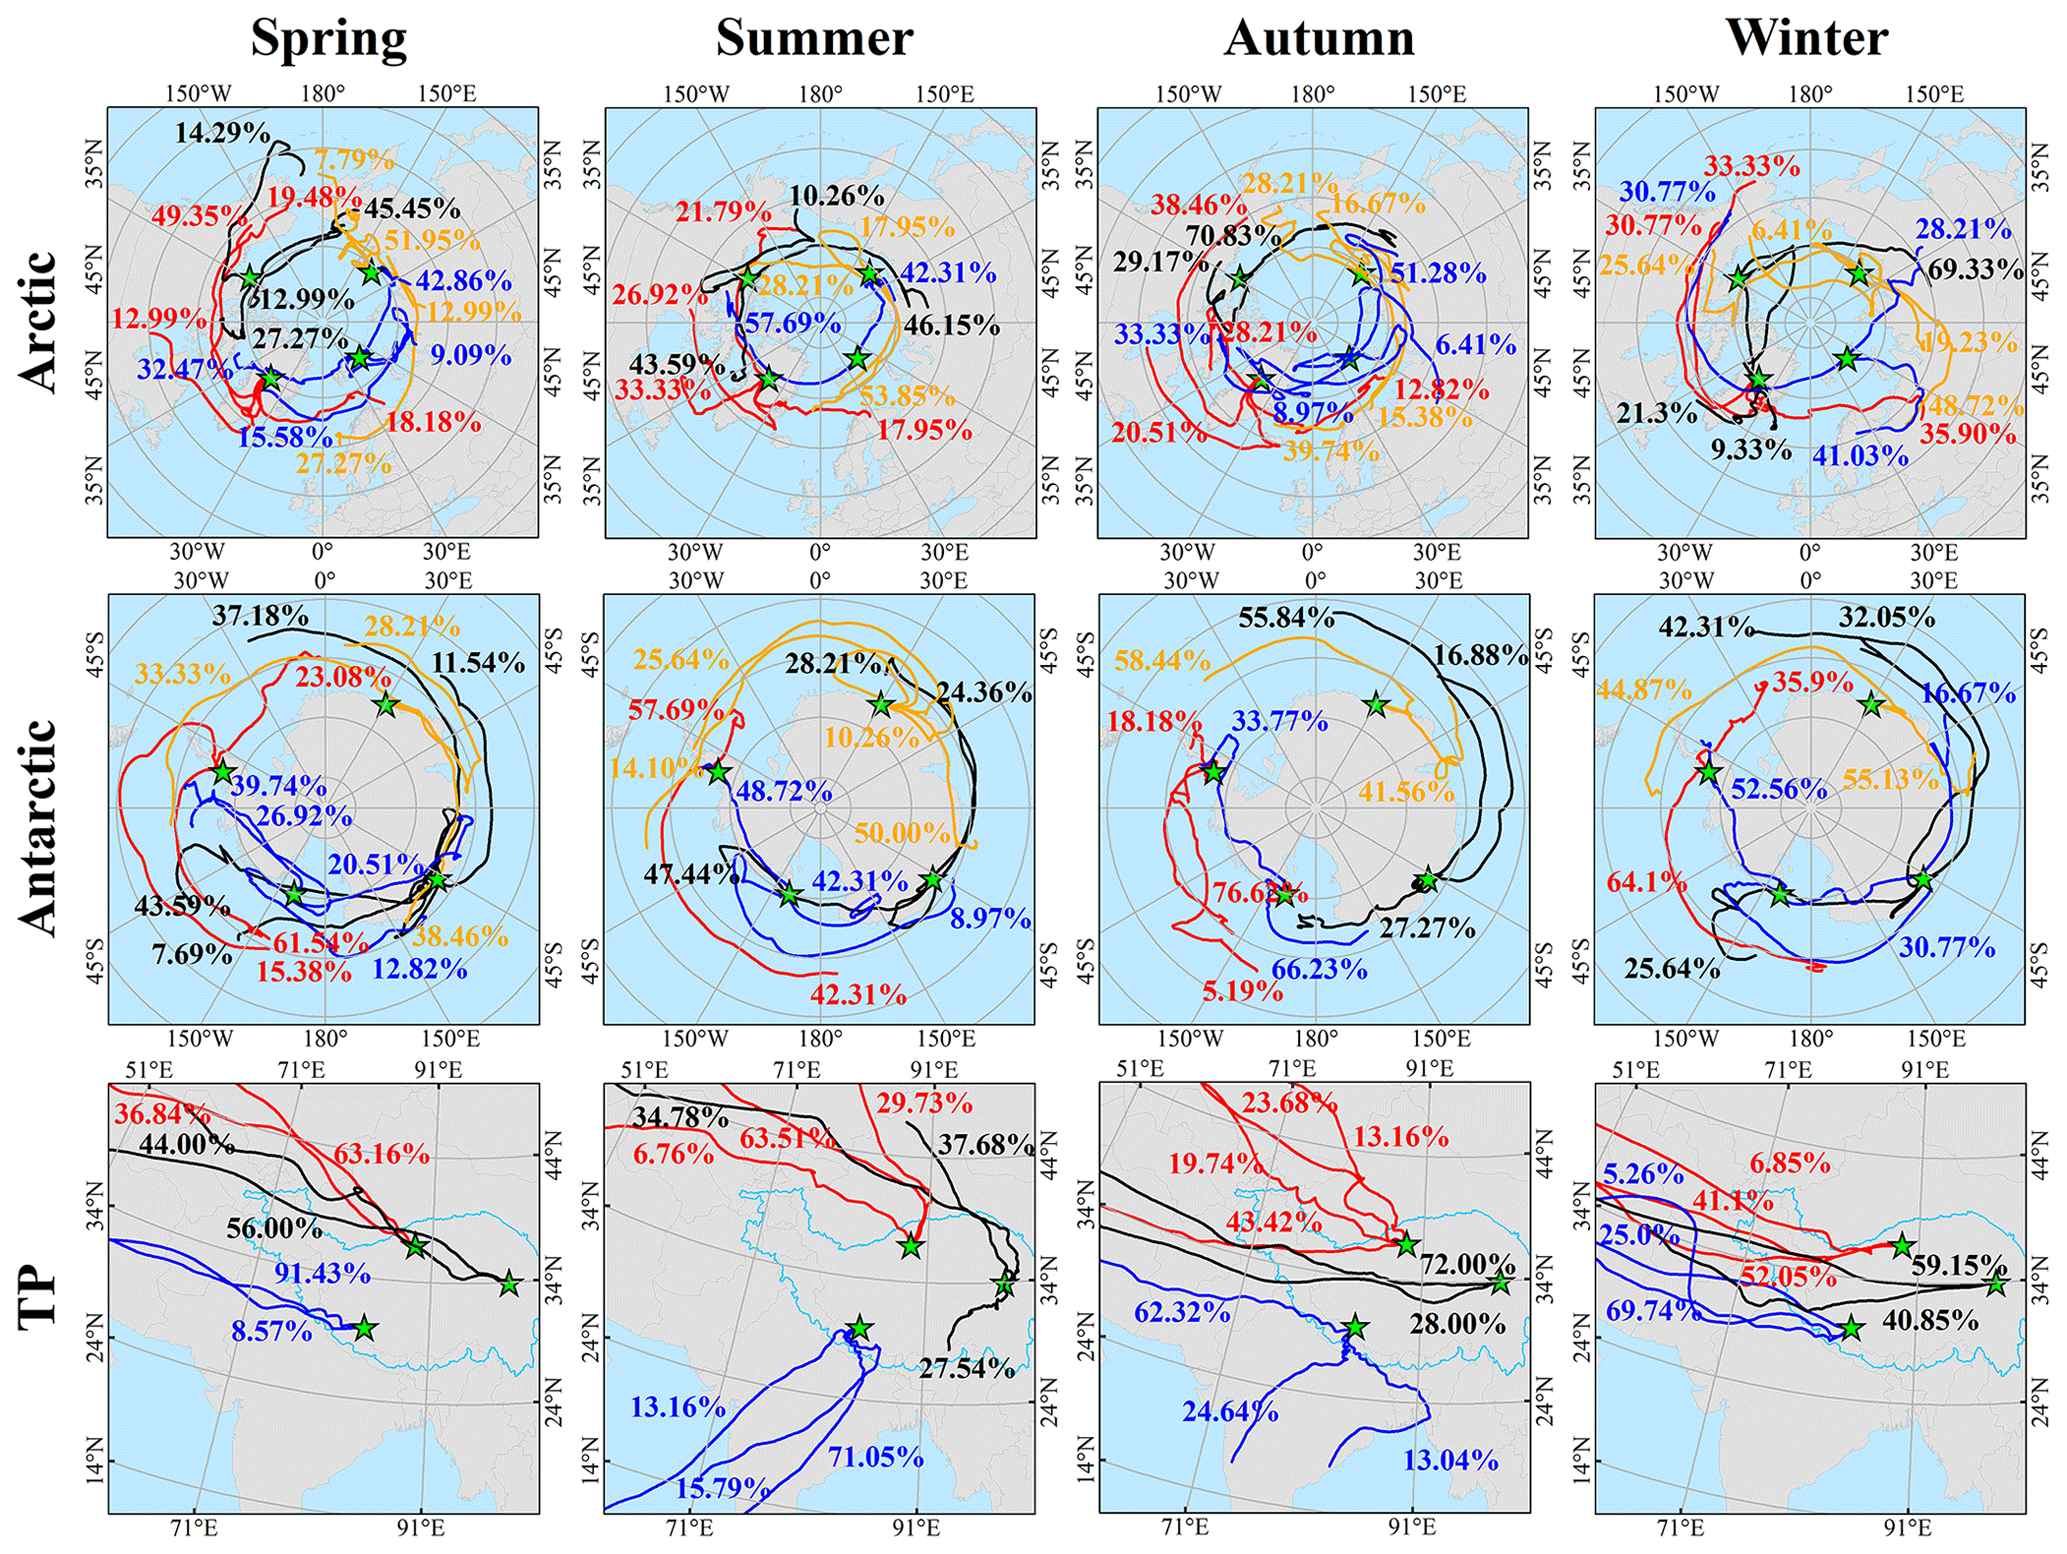
Figure 8The seasonal-average characteristics of the back trajectories for the study period from January 2007 to December 2019 at each selected site over the Arctic, Antarctic and TP.
3.2.3 Vertical distribution
Aerosol types not only have significant spatial and temporal variations but also vary with height. CALIPSO data provide the vertical distribution of aerosol types at 208 levels, ranging from the surface to 12 km. Here we investigate the vertical distribution of seven aerosol types, as shown in Fig. 7. The results show that most of the aerosol types in the Arctic and Antarctic regions have similar vertical-distribution patterns, except for dust and polluted dust. Clean marine, polluted continental/smoke, clean continental and dusty marine mainly occur near the surface, with altitudes below 3 km. Differently from the four types of aerosols above, the elevated smoke is found more at higher altitudes extending up to 8 and 4 km, with the highest OF at about 2.5 km, in the Arctic and Antarctic regions, respectively, which indicates that the main source of elevated smoke is external transport. In addition, polluted continental/smoke aerosols occur more frequently in the Arctic region than in the Antarctic region. This is mainly due to the fact that the Arctic region is surrounded by more continents, and more continental pollutants can enter the Arctic region. Compared with the Arctic, the dust and polluted dust in the Antarctic region have obvious vertical-distribution characteristics. The dust and polluted-dust aerosols are mainly located within 3–5 km in the Antarctic, which indicates that the dust-related aerosols in the Antarctic area are mainly transported from outside through the upper air (Li et al., 2008). Similarly to previous studies, dust-related aerosol layers over the TP appear most frequently at approximately 4–8 , where the plumes likely originate from the nearby Taklimakan Desert (Huang et al., 2007; Liu et al., 2015, 2020b; Xu et al., 2020).
3.3 Back trajectory
In order to better understand the origins of the air masses arriving in the study regions, the latest version (V5.0.0) of the HYSPLIT model was used in this study to simulate the back trajectories of air masses. A total of 11 sites listed in Table S1 were selected in this study, and the 14 d back trajectories for the Arctic, Antarctic and TP sites were simulated. A total of 3432 (11 × 2 × 12 × 13: 11 sites, 2 times per month, 12 months per year and a total of 13 years from 2007 to 2019) back trajectories were computed at a height of 500 m above the surface at all 11 sites. The seasonal climatologies (January 2007 to December 2019) of air mass trajectories were created, and the cluster analysis was implemented to examine the long-range transport pathways of air masses. The cluster analysis determines the final number of clusters based on the total spatial variance (Draxler and Hess, 1998). Figure 8 reveals the seasonal climatological characteristics of the back trajectories after cluster analysis. It can be seen that the back trajectories over different study regions have distinctive characteristics, especially in the TP region. It is worth noting that due to the fact that coarse-resolution reanalysis data are difficult to use to describe meteorological fields under complex terrain conditions, the back trajectories of air masses simulated by HYSPLIT may have a large error over the TP region. Compared with the Antarctic, the air mass trajectory in the Arctic region has a shorter transport distance. This is most likely due to the fact that the temperature in the Arctic is higher than that in the Antarctic, which decreases the pressure gradient and reduces the near-surface wind speed. In the Arctic, the difference in back trajectories between the summer and winter half year is obvious, with a greater proportion of air masses from Eurasia in winter and spring. At the same time, Asian dust storms prevail in spring, resulting in a greater proportion of dust and polluted dust in spring. In contrast, the influence of external transport of aerosols is relatively small in autumn, and the larger near-surface wind speed allows more marine aerosols to enter the atmosphere, which together make the contribution of clean marine aerosols in autumn relatively large in the Arctic.
In the Antarctic region, the seasonal difference in air mass trajectories is relatively small compared with the Arctic region, and the air mass trajectories were mainly controlled by circumpolar westerly winds (Ravi et al., 2011). While it is not clearly shown by the air mass back trajectory simulation results, dust and polluted dust over East Antarctica were likely caused by the transport from South America and Africa, and the polluted dust over West Antarctica was more likely affected by the aerosol transport from South America and Australia. Generally speaking, under the influence of steady and strong westerly winds, dust and carbonaceous aerosols in South America, Australia and Africa have a certain impact on Antarctic pollution (Li et al., 2008; McConnell et al., 2007; Zou et al., 2018).
Differently from the Arctic and Antarctic, the back trajectories of air masses over the TP have significant seasonal variation. In spring and summer, the air masses located on the northern slope of the TP mainly come from the northern desert area. In autumn, the air masses from the north begin to weaken, while the air masses from the Iranian Plateau begin to increase and reach a maximum in winter (93.15 %). For the site on the southern slope of the TP, the air masses mainly come from the Iranian Plateau in spring and winter, while in summer they mainly come from South Asia, which makes the TP more vulnerable to pollution from the Indian Peninsula and South Asia. Similarly to the site on the northern slope of the TP, the back trajectories of air masses at the eastern slope site are greatly affected by the Tarim Basin and Qaidam Basin in spring but are mainly affected by the Iranian Plateau and the western part of the TP in autumn and winter. Differently, in summer, the back trajectories of air masses are not only from the Tarim Basin and Qaidam Basin but also from the southern part of the TP, with about 27.54 % of air masses.
Aerosols play a crucial role in the radiative budget of the Earth–atmosphere system, but due to insufficient understanding of aerosol properties, at least partly, the uncertainty in the total radiative forcing by aerosols in the climate mode is still the largest. Understanding the properties of aerosols is highly demanded. The satellite active remote sensing can make up for the insufficiency of ground-based remote sensing to obtain long-term and large-scale aerosol properties. In this study, the spatial and temporal distribution of the aerosol optical depth (AOD) and aerosol type over the Arctic, Antarctic and Tibetan Plateau (TP) regions was investigated. In addition, 11 typical sites were selected, and the back trajectories of air masses were simulated using the Hybrid Single-Particle Lagrangian Integrated Trajectory (HYSPLIT) model. The main findings are as follows.
The distribution of AOD over the three study regions shows distinctive spatial and seasonal differences. In general, the AOD over the Arctic and Antarctic decreases with increasing latitude. In the Arctic, the AOD over land is greater than that over the ocean, while the opposite is true for the Antarctic. Eurasia and the Ross Sea are the high-AOD areas in the Arctic and Antarctic, respectively. The annual-average AOD over the TP region (0.098) is about twice that of the Arctic (0.046) and 4 times that of the Antarctic (0.024). The seasonal variation in AOD over the TP is the most distinctive due to the influence of transported aerosols from surrounding high-emission regions. The maximum AOD occurs in spring and summer over the TP, while it occurs from late autumn to early spring in the Arctic and in winter and spring in the Antarctic.
The deseasonalized trend of AOD (called AOD anomaly) over the three regions was also investigated. The result shows that there were no obvious temporal trends in the AOD anomalies over the Arctic, Antarctic and TP. Compared with the Antarctic and Arctic, the AOD anomalies over the TP have obvious fluctuations, which indicates that the TP is more susceptible to the influence of highly varied aerosols from different regions. In the Arctic, the aerosol extinction coefficient has a broad vertical distribution at heights from the surface to 12 km. Moreover, the extinction coefficient of elevated smoke and polluted dust in the upper layer is large in the Arctic, especially in summer and autumn. In the Antarctic, the vertical distribution of aerosol extinction has obvious seasonal differences. Dust aerosol has a large extinction coefficient at heights of 5–11 km in winter, while in other seasons, the aerosol extinction coefficient is large at heights below 5 km.
The multi-year-average (June 2006–December 2019) occurrence frequency (OF) of aerosol types was also examined. The OF of different aerosol types demonstrates significant spatial differences. In the Antarctic and Arctic regions, the dominant aerosol type is the clean marine type, followed by polluted continental/smoke and polluted-dust aerosol types. Clean marine aerosol types are mainly distributed over the seas of the polar regions, and polluted continental/smoke and polluted dust are mainly distributed over the land regions. In the Arctic, polluted continental/smoke aerosol types are mainly distributed in the northern part of Europe, while polluted-dust aerosols are widely distributed in the northern parts of Asia and America along with the Greenland island region. In the Antarctic, dust and polluted-dust aerosol types are mainly distributed in East Antarctica, and polluted continental/smoke aerosol types are mainly distributed in the Antarctic Peninsula. In the TP region, the main aerosol types in the north and south of the TP are dust and polluted dust, respectively. The normalized seasonal OF of seven aerosol types is further investigated. The result shows that the OF of each aerosol type in different regions has obvious seasonal variations. Regarding the vertical distribution of the OF of aerosol types, dust, polluted dust and elevated smoke have a relatively large OF at higher altitudes. And the maximum altitude with a noticeable OF of these types of aerosols is higher in the Antarctic than in the Arctic. Differently from the Arctic and Antarctic, the dust-related aerosol layers over the TP appear most frequently at heights of approximately 4–8
The back trajectories of air masses indicate that the Arctic region is vulnerable to mid-latitude pollutants, especially in winter and spring, while the Antarctic region is less affected by the mid-latitude pollutants. Differently from those in the Arctic and Antarctic, the air mass trajectories over the TP have obvious seasonal variations.
The CALIPSO dataset was obtained from https://earthdata.nasa.gov/ (NASA/LARC/SD/ASDC, 2019). Surface elevation data from the Shuttle Radar Topography Mission (SRTM) were downloaded from http://srtm.csi.cgiar.org/ (Jarvis, 2008). HYSPLIT data are provided by the NOAA READY website (http://www.ready.noaa.gov, NOAA 2016).
The supplement related to this article is available online at: https://doi.org/10.5194/acp-21-4849-2021-supplement.
CZ designed the research, and CZ and YY carried out the research and wrote the manuscript. QW and XY contributed to running the HYSPLIT model. ZC provided constructive comments and revised the manuscript many times. HF provided constructive comments on this research. All authors made substantial contributions to this work.
The authors declare that they have no conflict of interest.
The authors gratefully acknowledge the data support from NASA for making CALIPSO L3 datasets accessible to the public. We also thank the NOAA Air Resources Laboratory (ARL) for the provision of the HYSPLIT transport and dispersion model. We thank the reviewers of this paper for their valuable comments, which helped improve the manuscript.
This research has been supported by the Strategic Priority Research Program of the Chinese Academy of Sciences (grant no. XDA19070202) and the National Natural Science Foundation of China (grant nos. 91837204 and 41925022).
This paper was edited by Jianping Huang and reviewed by two anonymous referees.
AboEl-Fetouh, Y., O'Neill, N., Ranjbar, K., Hesaraki, S., Abboud, I., and Sobolewski, P.: Climatological-scale analysis of intensive and semi-intensive aerosol parameters derived from AERONET retrievals over the Arctic, J. Geophys. Res.-Atmos., 125, e2019JD031569, https://doi.org/10.1029/2019jd031569, 2020.
Albrecht, B.: Aerosols, cloud microphysics, and fractional cloudiness, Science, 245, 1227–1230, https://doi.org/10.1126/science.245.4923.1227, 1989.
Amiri-Farahani, A., Allen, R. J., Neubauer, D., and Lohmann, U.: Impact of Saharan dust on North Atlantic marine stratocumulus clouds: importance of the semidirect effect, Atmos. Chem. Phys., 17, 6305–6322, https://doi.org/10.5194/acp-17-6305-2017, 2017.
Ashrafi, K., Shafiepour-Motlagh, M., Aslemand, A., and Ghader, S.: Dust storm simulation over Iran using HYSPLIT, J. Environ. Health Sci., 12, 9, https://doi.org/10.1186/2052-336x-12-9, 2014.
Asmi, E., Neitola, K., Teinila, K., Rodriguez, E., Virkkula, A., Backman, J., Bloss, M., Jokela, J., Lihavainen, H., De Leeuw, G., Paatero, J., Aaltonen, V., Mei, M., Gambarte, G., Copes, G., Albertini, M., Perez Fogwill, G., Ferrara, J., Elena Barlasina, M., and Sanchez, R.: Primary sources control the variability of aerosol optical properties in the Antarctic Peninsula, Tellus B, 70, 1414571, https://doi.org/10.1080/16000889.2017.1414571, 2018.
Barbaro, E., Padoan, S., Kirchgeorg, T., Zangrando, R., Toscano, G., Barbante, C., and Gambaro, A.: Particle size distribution of inorganic and organic ions in coastal and inland Antarctic aerosol, Environ. Sci. Pollut. R., 24, 2724–2733, https://doi.org/10.1007/s11356-016-8042-x, 2017.
Barrie L.: Arctic Aerosols: Composition, Sources and Transport, in: Ice Core Studies of Global Biogeochemical Cycles. NATO ASI Series (Series I: Global Environmental Change), vol 30, edited by: Delmas, R. J., Springer, Berlin, Heidelberg, 1–22, https://doi.org/10.1007/978-3-642-51172-1_1, 1995.
Bodhaine, B.: Aerosol absorption measurements at Barrow, Mauna Loa and the South Pole, J. Geophys. Res.-Atmos., 100, 8967–8975, https://doi.org/10.1029/95JD00513, 1995.
Boucher, O., Randall, D., Artaxo, P., Bretherton, C., Feingold, G., Forster, P., Kerminen, V.-M., Kondo, Y., Liao, H., Lohmann, U., Rasch, P., Satheesh, S., Sherwood, S., Stevens, B., and Zhang, X.: Clouds and Aerosols, in: Climate Change 2013: The Physical Science Basis. Contribution of Working Group I to the Fifth Assessment Report of the Intergovernmental Panel on Climate Change, edited by: Stocker, T., Qin, D., Plattner, G.-K., Tignor, M., Allen, S., Boschung, J., Nauels, A., Xia, Y., Bex, V., and Midgley, P., Cambridge University Press, Cambridge, UK and New York, NY, USA, 2013.
Breider, T. J., Mickley, L. J., Jacob, D. J., Wang, Q., Fisher, J. A., Chang, R. Y. W., and Alexander, B.: Annual distributions and sources of Arctic aerosol components, aerosol optical depth, and aerosol absorption, J. Geophys. Res.-Atmos., 119, 4107–4124, https://doi.org/10.1002/2013jd020996, 2014.
Burton, S. P., Ferrare, R. A., Vaughan, M. A., Omar, A. H., Rogers, R. R., Hostetler, C. A., and Hair, J. W.: Aerosol classification from airborne HSRL and comparisons with the CALIPSO vertical feature mask, Atmos. Meas. Tech., 6, 1397–1412, https://doi.org/10.5194/amt-6-1397-2013, 2013.
Carter, E., Archer-Nicholls, S., Ni, K., Lai, A. M., Niu, H., Secrest, M. H., Sauer, S. M., Schauer, J. J., Ezzati, M., Wiedinmyer, C., Yang, X., and Baumgartner, J.: Seasonal and diurnal air pollution from residential cooking and space heating in the eastern Tibetan Plateau, Environ. Sci. Technol., 50, 8353–8361, https://doi.org/10.1021/acs.est.6b00082, 2016.
Chaubey, J. P., Krishna Moorthy, K., Suresh Babu, S., and Nair, V. S.: The optical and physical properties of atmospheric aerosols over the Indian Antarctic stations during southern hemispheric summer of the International Polar Year 2007–2008, Ann. Geophys., 29, 109–121, https://doi.org/10.5194/angeo-29-109-2011, 2011.
Cheng, Y., Dai, T., Li, J., and Shi, G.: Measurement Report: Determination of aerosol vertical features on different timescales over East Asia based on CATS aerosol products, Atmos. Chem. Phys., 20, 15307–15322, https://doi.org/10.5194/acp-20-15307-2020, 2020.
Cong, Z., Kang, S., Smirnov, A., and Holben, B.: Aerosol optical properties at Nam Co, a remote site in central Tibetan Plateau, Atmos. Res., 92, 42–48, https://doi.org/10.1016/j.atmosres.2008.08.005, 2009.
Cong, Z., Kang, S., Kawamura, K., Liu, B., Wan, X., Wang, Z., Gao, S., and Fu, P.: Carbonaceous aerosols on the south edge of the Tibetan Plateau: concentrations, seasonality and sources, Atmos. Chem. Phys., 15, 1573–1584, https://doi.org/10.5194/acp-15-1573-2015, 2015.
Dagsson-Waldhauserova, P., Renard, J.-B., Olafsson, H., Vignelles, D., Berthet, G., Verdier, N., and Duverger, V.: Vertical distribution of aerosols in dust storms during the Arctic winter, Sci. Rep.-UK, 9, 16122, https://doi.org/10.1038/s41598-019-51764-y, 2019.
Das, S. and Jayaraman, A.: Role of black carbon in aerosol properties and radiative forcing over western India during premonsoon period, Atmos. Res., 102, 320–334, https://doi.org/10.1016/j.atmosres.2011.08.003, 2011.
Di Biagio, C., Pelon, J., Ancellet, G., Bazureau, A., and Mariage, V.: Sources, Load, Vertical Distribution, and Fate of Wintertime Aerosols North of Svalbard From Combined V4 CALIOP Data, Ground-Based IAOOS Lidar Observations and Trajectory Analysis, J. Geophys. Res.-Atmos., 123, 1363–1383, https://doi.org/10.1002/2017jd027530, 2018.
Di Carmine, C., Campanelli, M., Nakajima, T., Tomasi, C., and Vitale, V.: Retrievals of Antarctic aerosol characteristics using a Sun-sky radiometer during the 2001–2002 austral summer campaign, J. Geophys. Res.-Atmos., 110, D13202, https://doi.org/10.1029/2004jd005280, 2005.
Diner, D., Beckert, J., Reilly, T., Bruegge, C., Conel, J., Kahn, R., Martonchik, R., Ackerman, T., Davies, R., Gerstl, S., Gordon, H., Muller, J., Myneni, R., Sellers, P., Pinty, B., and Verstraete, M.: Multi-angle Imaging Spectro Radiometer (MISR) instrument description and experiment overview, IEEE T. Geosci. Remote, 36, 1072–1087, 1998.
Diner, D., Abdou, W., Ackerman, T., Crean, K., Gordon, H., Kahn, R., Martonchik, J., McMuldroch, S., Paradise, S., Pinty, B., Verstraete, M., Wang, M., and West, R.: MISR level 2 aerosol retrieval algorithm theoretical basis, JPL D-11400, Rev. 60 G, Jet Propul. Lab., Calif. Inst. of Technol., Pasadena, CA, USA, available at: https://eospso.gsfc.nasa.gov/sites/default/files/atbd/atbd-misr-09.pdf (last access: 24 March 2021), 2008.
Draxler, R. and Hess, G.: An overview of the HYSPLIT_4 modelling system for trajectories, dispersion and deposition, Aust. Meteorol. Mag., 47, 295–308, 1998.
Dubovik, O. and King, M.: A flexible inversion algorithm for retrieval of aerosol optical properties from Sun and sky radiance measurements, J. Geophys. Res.-Atmos., 105, 20673–20696, https://doi.org/10.1029/2000jd900282, 2000.
Dubovik, O., Holben, B., Lapyonok, T., Sinyuk, A., Mishchenko, M., Yang, P., and Slutsker, I.: Non-spherical aerosol retrieval method employing light scattering by spheroids, Geophys. Res. Lett., 29, 1415, https://doi.org/10.1029/2001gl014506, 2002.
Dubovik, O., Sinyuk, A., Lapyonok, T., Holben, B., Mishchenko, M., Yang, P., Eck, T., Volten, H., Munoz, O., Veihelmann, B., van der Zande, W., Leon, J., Sorokin, M., and Slutsker, I.: Application of spheroid models to account for aerosol particle non-sphericity in remote sensing of desert dust, J. Geophys. Res.-Atmos., 111, D11208, https://doi.org/10.1029/2005jd006619, 2006.
Eleftheriadis, K., Nyeki, S., Psomiadou, C., and Colbeck, I.: Background aerosol properties in the European Arctic, Water, Air, Soil Pollut.: Focus, 4, 23–30, https://doi.org/10.1023/B:WAFO.0000044783.70114.19, 2004.
Engling, G., Zhang, Y., Chan, C., Sang, X., Lin, M., Ho, K., Li, Y., Lin, C., and Lee, J.: Characterization and sources of aerosol particles over the southeastern Tibetan Plateau during the Southeast Asia biomass-burning season, Tellus B, 63, 117–128, https://doi.org/10.1111/j.1600-0889.2010.00512.x, 2011.
Engvall, A.-C., Krejci, R., Ström, J., Treffeisen, R., Scheele, R., Hermansen, O., and Paatero, J.: Changes in aerosol properties during spring-summer period in the Arctic troposphere, Atmos. Chem. Phys., 8, 445–462, https://doi.org/10.5194/acp-8-445-2008, 2008.
Erickson, D., Merrill, J., and Duce, R.: Seasonal Estimates of Global Atmospheric Sea-Salt Distribution, J. Geophys. Res.-Atmos., 91, 1067–1072, https://doi.org/10.1029/JD091iD01p01067, 1986.
Fan, S.: Modeling of observed mineral dust aerosols in the arctic and the impact on winter season low-level clouds, J. Geophys. Res.-Atmos., 118, 11161–11174, https://doi.org/10.1002/jgrd.50842, 2013.
Garrett, T. and Zhao, C.: Increased Arctic cloud longwave emissivity associated with pollution from mid-latitudes, Nature, 440, 787–789, https://doi.org/10.1038/nature04636, 2006.
Garrett, T., Zhao, C., and Novelli, P.: Assessing the relative contributions of transport efficiency and scavenging to seasonal variability in Arctic aerosol, Tellus B, 62, 190–196, https://doi.org/10.1111/j.1600-0889.2010.00453.x, 2010.
Ghan, S. J. and Easter, R. C.: Impact of cloud-borne aerosol representation on aerosol direct and indirect effects, Atmos. Chem. Phys., 6, 4163–4174, https://doi.org/10.5194/acp-6-4163-2006, 2006.
Giles, D., Holben, B., Eck, T., Sinyuk, A., Smirnov, A., Slutsker, I., Dickerson, R. R., Thompson, A. M., and Schafer, J. S.: An analysis of AERONET aerosol absorption properties and classifications representative of aerosol source regions, J. Geophys. Res.-Atmos., 117, D17203, https://doi.org/10.1029/2012jd018127, 2012.
Granados-Muñoz, M. J., Sicard, M., Papagiannopoulos, N., Barragán, R., Bravo-Aranda, J. A., and Nicolae, D.: Two-dimensional mineral dust radiative effect calculations from CALIPSO observations over Europe, Atmos. Chem. Phys., 19, 13157–13173, https://doi.org/10.5194/acp-19-13157-2019, 2019.
Grassl, S. and Ritter, C.: Properties of Arctic aerosol based on sun photometer long-term measurements in Ny-angstrom lesund, Svalbard, Remote Sensing, 11, 1362, https://doi.org/10.3390/rs11111362, 2019.
Hall, J. and Wolff, E.: Causes of seasonal and daily variations in aerosol sea-salt concentrations at a coastal Antarctic station, Atmos. Environ., 32, 3669–3677, https://doi.org/10.1016/s1352-2310(98)00090-9, 1998.
Han, H., Wu, Y., Liu, J., Zhao, T., Zhuang, B., Wang, H., Li, Y., Chen, H., Zhu, Y., Liu, H., Wang, Q., Li, S., Wang, T., Xie, M., and Li, M.: Impacts of atmospheric transport and biomass burning on the inter-annual variation in black carbon aerosols over the Tibetan Plateau, Atmos. Chem. Phys., 20, 13591–13610, https://doi.org/10.5194/acp-20-13591-2020, 2020.
Heintzenberg, J.: Arctic haze-air-pollution in polar-regions, Ambio, 18, 50–55, 1989.
Hirdman, D., Burkhart, J. F., Sodemann, H., Eckhardt, S., Jefferson, A., Quinn, P. K., Sharma, S., Ström, J., and Stohl, A.: Long-term trends of black carbon and sulphate aerosol in the Arctic: changes in atmospheric transport and source region emissions, Atmos. Chem. Phys., 10, 9351–9368, https://doi.org/10.5194/acp-10-9351-2010, 2010.
Holben, B., Eck, T., Slutsker, I., Tanre, D., Buis, J., Setzer, A., Vermote, E., Reagan, J., Kaufman, Y., Nakajima, T., Lavenu, F., Jankowiak, I., and Smirnov, A.: AERONET – A federated instrument network and data archive for aerosol characterization, Remote Sens. Environ., 66, 1–16, https://doi.org/10.1016/s0034-4257(98)00031-5, 1998.
Hsu, N., Tsay, S., King, M., and Herman, J.: Aerosol properties over bright-reflecting source regions, IEEE T. Geosci. Remote, 42, 557–569, https://doi.org/10.1109/tgrs.2004.824067, 2004.
Hsu, N., Jeong, M., Bettenhausen, C., Sayer, A., Hansell, R., Seftor, C., Huang, J., and Tsay, S.: Enhanced Deep Blue aerosol retrieval algorithm: The second generation, J. Geophys. Res.-Atmos., 118, 9296–9315, https://doi.org/10.1002/jgrd.50712, 2013.
Hu, Z., Huang, J., Zhao, C., Jin, Q., Ma, Y., and Yang, B.: Modeling dust sources, transport, and radiative effects at different altitudes over the Tibetan Plateau, Atmos. Chem. Phys., 20, 1507–1529, https://doi.org/10.5194/acp-20-1507-2020, 2020.
Huang, J., Minnis, P., Yi, Y., Tang, Q., Wang, X., Hu, Y., Liu, Z., Ayers, K., Trepte, C., and Winker, D.: Summer dust aerosols detected from CALIPSO over the Tibetan Plateau, Geophys. Res. Lett., 34, L18805, https://doi.org/10.1029/2007gl029938, 2007.
Hughes, M. and Cassano, J.: The climatological distribution of extreme Arctic winds and implications for ocean and sea ice processes, J. Geophys. Res.-Atmos., 120, 7358–7377, https://doi.org/10.1002/2015jd023189, 2015.
Ito, T.: Study of background aerosols in the Antarctic troposphere, J. Atmos. Chem., 3, 69–91, https://doi.org/10.1007/bf00049369, 1985.
Jarvis, A., Reuter, H. I., Nelson, A., and Guevara, E.: Hole-filled seamless SRTM data V4, International Centre for Tropical Agriculture (CIAT), available at: https://srtm.csi.cgiar.org (last access: 24 March 2021), 2008.
Jeong, S., Zhao, C., Andrews, A., Dlugokencky, E., Sweeney, C., Bianco, L., Wilczak, J., and Fischer, M.: Seasonal variations in N2O emissions from central California, Geophys. Res. Lett., 39, L16805, https://doi.org/10.1029/2012gl052307, 2012.
Jia, R., Liu, Y., Chen, B., Zhang, Z., and Huang, J.: Source and transportation of summer dust over the Tibetan Plateau, Atmos. Environ., 123, 210–219, https://doi.org/10.1016/j.atmosenv.2015.10.038, 2015.
Johnson, B.: The semidirect aerosol effect: Comparison of a single-column model with large eddy simulation for marine stratocumulus, J. Climate, 18, 119–130, https://doi.org/10.1175/jcli-3233.1, 2005.
Jung, C., Lee, J., Um, J., Lee, S., Yoon, Y., and Kim, Y.: Estimation of Source-Based Aerosol Optical Properties for Polydisperse Aerosols from Receptor Models, Appl. Sci.-Basel, 9, 1443, https://doi.org/10.3390/app9071443, 2019.
Kahn, R. and Gaitley, B.: An analysis of global aerosol type as retrieved by MISR, J. Geophys. Res.-Atmos., 120, 4248–4281, https://doi.org/10.1002/2015jd023322, 2015.
Kaufman, Y., Tanre, D., Remer, L., Vermote, E., Chu, A., and Holben, B.: Operational remote sensing of tropospheric aerosol over land from EOS moderate resolution imaging spectroradiometer, J. Geophys. Res.-Atmos., 102, 17051–17067, https://doi.org/10.1029/96jd03988, 1997.
Kerminen, V., Teinila, K., and Hillamo, R.: Chemistry of sea-salt particles in the summer Antarctic atmosphere, Atmos. Environ., 34, 2817–2825, https://doi.org/10.1016/s1352-2310(00)00089-3, 2000.
Kim, M.-H., Omar, A. H., Tackett, J. L., Vaughan, M. A., Winker, D. M., Trepte, C. R., Hu, Y., Liu, Z., Poole, L. R., Pitts, M. C., Kar, J., and Magill, B. E.: The CALIPSO version 4 automated aerosol classification and lidar ratio selection algorithm, Atmos. Meas. Tech., 11, 6107–6135, https://doi.org/10.5194/amt-11-6107-2018, 2018.
Kipling, Z., Stier, P., Johnson, C. E., Mann, G. W., Bellouin, N., Bauer, S. E., Bergman, T., Chin, M., Diehl, T., Ghan, S. J., Iversen, T., Kirkevåg, A., Kokkola, H., Liu, X., Luo, G., van Noije, T., Pringle, K. J., von Salzen, K., Schulz, M., Seland, Ø., Skeie, R. B., Takemura, T., Tsigaridis, K., and Zhang, K.: What controls the vertical distribution of aerosol? Relationships between process sensitivity in HadGEM3–UKCA and inter-model variation from AeroCom Phase II, Atmos. Chem. Phys., 16, 2221–2241, https://doi.org/10.5194/acp-16-2221-2016, 2016.
Kittaka, C., Winker, D. M., Vaughan, M. A., Omar, A., and Remer, L. A.: Intercomparison of column aerosol optical depths from CALIPSO and MODIS-Aqua, Atmos. Meas. Tech., 4, 131–141, https://doi.org/10.5194/amt-4-131-2011, 2011.
Koponen, I., Virkkula, A., Hillamo, R., Kerminen, V., and Kulmala, M.: Number size distributions and concentrations of the continental summer aerosols in Queen Maud Land, Antarctica, J. Geophys. Res.-Atmos., 108, 4587, https://doi.org/10.1029/2003jd003614, 2003.
Koren, I., Kaufman, Y., Remer, L., and Martins, J.: Measurement of the effect of Amazon smoke on inhibition of cloud formation, Science, 303, 1342–1345, https://doi.org/10.1126/science.1089424, 2004.
Kumar, M., Singh, R., Murari, V., Singh, A., Singh, R., and Banerjee, T.: Fireworks induced particle pollution: A spatio-temporal analysis, Atmos. Res., 180, 78–91, https://doi.org/10.1016/j.atmosres.2016.05.014, 2016.
Leaitch, W., Sharma, S., Huang, L., Toom-Sauntry, D., Chivulescu, A., Macdonald, A., von Salzen, K., Pierce, J., Betram, A., Schroder, J., Shantz, N., Chang, R., and Norman, A.: Dimethyl sulfide control of the clean summertime Arctic aerosol and cloud, Elementa, 1, 000017, https://doi.org/10.12952/journal.elementa.000017, 2013.
Leaitch, W. R., Kodros, J. K., Willis, M. D., Hanna, S., Schulz, H., Andrews, E., Bozem, H., Burkart, J., Hoor, P., Kolonjari, F., Ogren, J. A., Sharma, S., Si, M., von Salzen, K., Bertram, A. K., Herber, A., Abbatt, J. P. D., and Pierce, J. R.: Vertical profiles of light absorption and scattering associated with black carbon particle fractions in the springtime Arctic above 79∘ N, Atmos. Chem. Phys., 20, 10545–10563, https://doi.org/10.5194/acp-20-10545-2020, 2020.
Levy, R. C., Mattoo, S., Munchak, L. A., Remer, L. A., Sayer, A. M., Patadia, F., and Hsu, N. C.: The Collection 6 MODIS aerosol products over land and ocean, Atmos. Meas. Tech., 6, 2989–3034, https://doi.org/10.5194/amt-6-2989-2013, 2013.
Li, C., Bosch, C., Kang, S., Andersson, A., Chen, P., Zhang, Q., Cong, Z., Chen, B., Qin, D., and Gustafsson, Ö.: Sources of black carbon to the Himalayan-Tibetan Plateau glaciers, Nat. Commun., 7, 12574, https://doi.org/10.1038/ncomms12574, 2016.
Li, F., Ginoux, P., and Ramaswamy, V.: Distribution, transport, and deposition of mineral dust in the Southern Ocean and Antarctica: Contribution of major sources, J. Geophys. Res.-Atmos., 113, D10207, https://doi.org/10.1029/2007jd009190, 2008.
Liu, Y., Sato, Y., Jia, R., Xie, Y., Huang, J., and Nakajima, T.: Modeling study on the transport of summer dust and anthropogenic aerosols over the Tibetan Plateau, Atmos. Chem. Phys., 15, 12581–12594, https://doi.org/10.5194/acp-15-12581-2015, 2015.
Liu, Y., Hua, S., Jia, R., and Huang, J.: Effect of aerosols on the ice cloud properties over the Tibetan Plateau, J. Geophys. Res.-Atmos., 124, 9594–9608, https://doi.org/10.1029/2019jd030463, 2019.
Liu, Y., Li, Y., Huang, J., Zhu, Q., and Wang, S.: Attribution of the Tibetan Plateau to northern drought, Natl. Sci. Rev., 7, 489–492, https://doi.org/10.1093/nsr/nwz191, 2020a.
Liu, Y., Zhu, Q., Hua, S., Alam, K., Dai, T., and Cheng, Y.: Tibetan Plateau driven impact of Taklimakan dust on northern rainfall, Atmos. Environ., 234, 117583, https://doi.org/10.1016/j.atmosenv.2020.117583, 2020b.
Loeb, N. and Su, W.: Direct aerosol radiative forcing uncertainty based on a radiative perturbation analysis, J. Climate, 23, 5288–5293, https://doi.org/10.1175/2010jcli3543.1, 2010.
Lu, L., Bian, L., and Zhang, Z.: Climate change: Impact on the Arctic, Antarctic and Tibetan Plateau, Advances in Polar Science, 22, 67–73, https://doi.org/10.3724/SP. J.1085.2011.00067, 2011.
Lu, Z., Streets, D., Zhang, Q., and Wang, S.: A novel back-trajectory analysis of the origin of black carbon transported to the Himalayas and Tibetan Plateau during 1996–2010, Geophys. Res. Lett., 39, L01809, https://doi.org/10.1029/2011gl049903, 2012.
Lüthi, Z. L., Škerlak, B., Kim, S.-W., Lauer, A., Mues, A., Rupakheti, M., and Kang, S.: Atmospheric brown clouds reach the Tibetan Plateau by crossing the Himalayas, Atmos. Chem. Phys., 15, 6007–6021, https://doi.org/10.5194/acp-15-6007-2015, 2015.
Lyapustin, A., Wang, Y., Korkin, S., and Huang, D.: MODIS Collection 6 MAIAC algorithm, Atmos. Meas. Tech., 11, 5741–5765, https://doi.org/10.5194/amt-11-5741-2018, 2018.
Ma, F. and Guan, Z.: Seasonal variations of aerosol optical depth over East China and India in relationship to the Asian Monsoon circulation, J. Meteorol. Res.-PRC, 32, 648–660, https://doi.org/10.1007/s13351-018-7171-1, 2018.
Marey, H. S., Gille, J. C., El-Askary, H. M., Shalaby, E. A., and El-Raey, M. E.: Aerosol climatology over Nile Delta based on MODIS, MISR and OMI satellite data, Atmos. Chem. Phys., 11, 10637–10648, https://doi.org/10.5194/acp-11-10637-2011, 2011.
Martonchik, J., Diner, D., Kahn, R., Ackerman, T., Verstraete, M., Pinty, B., and Gordon, H. R.: Techniques for the retrieval of aerosol properties over land and ocean using multiangle imaging, IEEE T. Geosci. Remote, 36, 1212–1227, https://doi.org/10.1109/36.701027, 1998.
Martonchik, J., Diner, D., Kahn, R., Gaitley, B., and Holben, B.: Comparison of MISR and AERONET aerosol optical depths over desert sites, Geophys. Res. Lett., 31, L16102, https://doi.org/10.1029/2004gl019807, 2004.
McConnell, J., Aristarain, A., Banta, J., Edwards, P., and Simoes, J.: 20th-Century doubling in dust archived in an Antarctic Peninsula ice core parallels climate change and desertification in South America, P. Natl. Acad. Sci USA, 104, 5743–5748, https://doi.org/10.1073/pnas.0607657104, 2007.
McFarlane, S., Kassianov, E., Flynn, C., and Barnard, J.: Vertical profiles of aerosol extinction and radiative heating at Niamey, Niger, in: American Geophysical Union, Fall Meeting 2007, San Francisco, CA (USA), 2007-12-10 to 2007-12-14, abstract id. A41A-0013, 2007.
Mielonen, T., Arola, A., Komppula, M., Kukkonen, J., Koskinen, J., de Leeuw, G., and Lehtinen, K.: Comparison of CALIOP level 2 aerosol subtypes to aerosol types derived from AERONET inversion data, Geophys. Res. Lett., 36, L18804, https://doi.org/10.1029/2009gl039609, 2009.
Mitchell, J.: Visual range in the polar regions with particulate reference to the Alaskan Arctic, J. Atmos. Terr. Phys., special supplement, 195–211, 1957.
Nabat, P., Somot, S., Mallet, M., Sevault, F., Chiacchio, M., and Wild, M.: Direct and semi-direct aerosol radiative effect on the Mediterranean climate variability using a coupled regional climate system model, Clim. Dynam., 44, 1127–1155, https://doi.org/10.1007/s00382-014-2205-6, 2015.
NASA/LARC/SD/ASDC: CALIPSO Lidar Level 3 Tropospheric Aerosol Profiles, Cloud Free Data, Standard V4-20 [Data set], NASA Langley Atmospheric Science Data Center DAAC, available at: https://doi.org/10.5067/CALIOP/CALIPSO/CAL_LID_L3_ Tropospheric_APro_CloudFree-Standard-V4-20, 2019.
NOAA: GDAS – Daily Tar Files (1° by 1°), NCEI's NOAA National Operational Model Archive and Distribution System (NOMADS), available at: ftp://ftp.arl.noaa.gov/pub/archives/gdas1 (last access: 24 March 2021), 2016.
Nishizawa, T., Okamoto, H., Sugimoto, N., Matsui, I., Shimizu, A., and Aoki, K.: An algorithm that retrieves aerosol properties from dual-wavelength polarized lidar measurements, J. Geophys. Res.-Atmos., 112, D06212, https://doi.org/10.1029/2006jd007435, 2007.
Omar, A., Won, J., Winker, D., Yoon, S., Dubovik, O., and McCormick, M.: Development of global aerosol models using cluster analysis of Aerosol Robotic Network (AERONET) measurements, J. Geophys. Res.-Atmos., 110, D10S14, https://doi.org/10.1029/2004jd004874, 2005.
Peyridieu, S., Chédin, A., Tanré, D., Capelle, V., Pierangelo, C., Lamquin, N., and Armante, R.: Saharan dust infrared optical depth and altitude retrieved from AIRS: a focus over North Atlantic – comparison to MODIS and CALIPSO, Atmos. Chem. Phys., 10, 1953–1967, https://doi.org/10.5194/acp-10-1953-2010, 2010.
Pokharel, M., Guang, J., Liu, B., Kang, S., Ma, Y., Holben, B., Xia, X., Xin, J., Ram, K., Rupakheti, D., Wan, X., Wu, G., Bhattarai, H., Zhao, C., and Cong, Z.: Aerosol properties over Tibetan Plateau from a decade of AERONET measurements: baseline, types, and influencing factors, J. Geophys. Res.-Atmos., 124, 13357–13374, https://doi.org/10.1029/2019jd031293, 2019.
Rap, A., Scott, C., Spracklen, D., Bellouin, N., Forster, P., Carslaw, K., Schmidt, A., and Mann, G.: Natural aerosol direct and indirect radiative effects, Geophys. Res. Lett., 40, 3297–3301, https://doi.org/10.1002/grl.50441, 2013.
Quinn, P., Coffman, D., Kapustin, V., Bates, V., and Covert, D.: Aerosol optical properties in the marine boundary layer during the First Aerosol Characterization Experiment (ACE 1) and the underlying chemical and physical aerosol properties, J. Geophys. Res.-Atmos., 103, 16547–16563, https://doi.org/10.1029/97JD02345, 1998.
Rahul, P., Sonbawne, S., and Devara, P.: Unusual high values of aerosol optical depth evidenced in the Arctic during summer 2011, Atmos. Environ., 94, 606–615, https://doi.org/10.1016/j.atmosenv.2014.01.052, 2014.
Ravi, S., D'Odorico, P., Breshears, D., Field, J., Goudie, A., Huxman, T., Li, J., Okin, G., Swap, R., Thomas, A., Van Pelt, S., Whicker, J., and Zobeck, T.: Aeolian process and the biosphere, Rev. Geophys., 49, RG3001, https://doi.org/10.1029/2010rg000328, 2011.
Righi, M., Klinger, C., Eyring, V., Hendricks, J., Lauer, A., and Petzold, A.: Climate Impact of biofuels in shipping: global model studies of the aerosol indirect effect, Environ. Sci. Technol., 45, 3519–3525, https://doi.org/10.1021/es1036157, 2011.
Rousseau, D., Schevin, P., Duzer, D., Cambon, G., Ferrier, J., Jolly, D., and Poulsen, U.: New evidence of long distance pollen transport to southern Greenland in late spring, Rev. Palaeobot. Palyno., 141, 277–286, https://doi.org/10.1016/j.revpalbo.2006.05.001, 2006.
Russell, P., Kacenelenbogen, M., Livingston, J., Hasekamp, O., Burton, S., Schuster, G., Johnson, M., Knobelspiesse, K., Redemann, J., Ramachandran, S., and Holben, B.: A multiparameter aerosol classification method and its application to retrievals from spaceborne polarimetry, J. Geophys. Res.-Atmos., 119, 9838–9863, https://doi.org/10.1002/2013jd021411, 2014.
Russell, P. B., Bergstrom, R. W., Shinozuka, Y., Clarke, A. D., DeCarlo, P. F., Jimenez, J. L., Livingston, J. M., Redemann, J., Dubovik, O., and Strawa, A.: Absorption Angstrom Exponent in AERONET and related data as an indicator of aerosol composition, Atmos. Chem. Phys., 10, 1155–1169, https://doi.org/10.5194/acp-10-1155-2010, 2010.
Schmeisser, L., Backman, J., Ogren, J. A., Andrews, E., Asmi, E., Starkweather, S., Uttal, T., Fiebig, M., Sharma, S., Eleftheriadis, K., Vratolis, S., Bergin, M., Tunved, P., and Jefferson, A.: Seasonality of aerosol optical properties in the Arctic, Atmos. Chem. Phys., 18, 11599–11622, https://doi.org/10.5194/acp-18-11599-2018, 2018.
Seinfeld, J., Bretherton, C., Carslaw, K., Coe, H., DeMott, P., Dunlea, E., Feingold, G., Ghan, S., Guenther, A., Kahn, R., Kraucunas, I., Kreidenweis, S., Molina, M. J., Nenes, A., Penner, J., Prather, K., Ramanathan, V., Ramaswamy, V., Rasch, P., Ravishankara, A., Rosenfeld, D., Stephens, G., and Wood, R.: Improving our fundamental understanding of the role of aerosol–cloud interactions in the climate system, P. Natl. Acad. Sci. USA, 113, 5781–5790, https://doi.org/10.1073/pnas.1514043113, 2016.
Sharma, S., Ishizawa, M., Chan, D., Lavoue, D., Andrews, E., Eleftheriadis, K., and Maksyutov, S.: 16-year simulation of Arctic black carbon: Transport, source contribution, and sensitivity analysis on deposition, J. Geophys. Res.-Atmos., 118, 943–964, https://doi.org/10.1029/2012jd017774, 2013.
Shimizu, A., Nishizawa, T., Jin, Y., Kim, S.-W., Wang, Z., Batdorj, D., and Sugimoto, N.: Evolution of a lidar network for tropospheric aerosol detection in East Asia, Opt. Eng., 56, 031219, https://doi.org/10.1117/1.Oe.56.3.031219, 2017.
Soja, A., Cofer, W., Shugart, H., Sukhinin, A., Stackhouse, P., McRae, D., and Conard, S.: Estimating fire emissions and disparities in boreal Siberia (1998–2002), J. Geophys. Res.-Atmos., 109, D14S06, https://doi.org/10.1029/2004jd004570, 2004.
Stein, A., Draxler, R., Rolph, G., Stunder, B., Cohen, M., and Ngan, F.: NOAA'S HYSPLIT atmospheric transport and dispersion modeling system, B. Am. Meteorol. Soc., 96, 2059–2077, https://doi.org/10.1175/bams-d-14-00110.1, 2015.
Stohl, A., Andrews, E., Burkhart, J., Forster, C., Herber, A., Hoch, S., Kowal, D., Lunder, C., Mefford, T., Ogren, J. A., Sharma, S., Spichtinger, N., Stebel, K., Stone, R., Strom, J., Torseth, K., Wehrli, C., and Yttri, K. E.: Pan-Arctic enhancements of light absorbing aerosol concentrations due to North American boreal forest fires during summer 2004, J. Geophys. Res.-Atmos., 111, D22214, https://doi.org/10.1029/2006jd007216, 2006.
Stone, R., Sharma, S., Herber, A., Eleftheriadis, K. and Nelson, D.: A characterization of Arctic aerosols on the basis of aerosol optical depth and black carbon measurements, Elementa, 2, p.000027, https://doi.org/10.12952/journal.elementa.000027, 2014.
Sun, T., Che, H., Qi, B., Wang, Y., Dong, Y., Xia, X., Wang, H., Gui, K., Zheng, Y., Zhao, H., Ma, Q., Du, R., and Zhang, X.: Aerosol optical characteristics and their vertical distributions under enhanced haze pollution events: effect of the regional transport of different aerosol types over eastern China, Atmos. Chem. Phys., 18, 2949–2971, https://doi.org/10.5194/acp-18-2949-2018, 2018.
Tackett, J. L., Winker, D. M., Getzewich, B. J., Vaughan, M. A., Young, S. A., and Kar, J.: CALIPSO lidar level 3 aerosol profile product: version 3 algorithm design, Atmos. Meas. Tech., 11, 4129–4152, https://doi.org/10.5194/amt-11-4129-2018, 2018.
Tanre, D., Deschamps, P. Y., Devaux, C., and Herman, M.: Estimation of Saharan aerosol optical thickness from blurring effects in thematic mapper data, J. Geophys. Res.-Atmos., 93, 15955–15964, https://doi.org/10.1029/JD093iD12p15955, 1988.
Tao, S., Wang, W., Liu, W., Zuo, Q., Wang, X., Wang, R., Wang, B., Shen, G., Yang, Y., and He, J.: Polycyclic aromatic hydrocarbons and organochlorine pesticides in surface soils from the Qinghai-Tibetan plateau, J. Environ. Monitor., 13, 175–181, https://doi.org/10.1039/c0em00298d, 2011.
Teinilä, K., Frey, A., Hillamo, R., Tuelp, H. C., and Weller, R.: A study of the sea-salt chemistry using size-segregated aerosol measurements at coastal Antarctic station Neumayer, Atmos. Environ., 96, 11–19, https://doi.org/10.1016/j.atmosenv.2014.07.025, 2014.
Tomasi, C., Kokhanovsky, A., Lupi, A., Ritter, C., Smirnov, A., O'Neill, N., Stone, R., Holben, B., Nyeki, S., Wehrli, C., Stohl, A., Mazzola, M., Lanconelli, C., Vitale, V., Stebel, K., Aaltonen, V., de Leeuw, G., Rodriguez, E., Herber, A., Radionov, V., Zielinski, T., Petelski, T., Sakerin, S., Kabanov, D., Xue, Y., Mei, L., Istomina, L., Wagener, R., McArthur, B., Sobolewski, P., Kivi, R., Courcoux, Y., Larouche, P., Broccardo, S., and Piketh, S.: Aerosol remote sensing in polar regions, Earth-Sci. Rev., 140, 108–157, https://doi.org/10.1016/j.earscirev.2014.11.001, 2015.
Tomasi, C., Vitale, V., Lupi, A., Di Carmine, C., Campanelli, M., Herber, A., Treffeisen, R., Stone, R., Andrews, E., Sharma, S., Radionov, V., von Hoyningen-Huene, W., Stebel, K., Hansen, G., Myhre, C., Wehrli, C., Aaltonen, V., Lihavainen, H., Virkkula, A., Hillamo, R., Stroem, J., Toledano, C., Cachorro, V., Ortiz, P., de Frutos, A., Blindheim, S., Frioud, M., Gausa, M., Zielinski, T., Petelski, T., and Yamanouchi, T.: Aerosols in polar regions: A historical overview based on optical depth and in situ observations, J. Geophys. Res.-Atmos., 112, D16205, https://doi.org/10.1029/2007jd008432, 2007.
Torres, O., Tanskanen, A., Veihelmann, B., Ahn, C., Braak, R., Bhartia, P., Veefkind, P., and Levelt, P.: Aerosols and surface UV products from Ozone Monitoring Instrument observations: An overview, J. Geophys. Res.-Atmos., 112, D24S47, https://doi.org/10.1029/2007JD008809, 2007.
Twomey, S.: Influence of pollution on shortwave albedo of clouds, J. Atmos. Sci., 34, 1149–1152, https://doi.org/10.1175/1520-0469(1977)034<1149:Tiopot>2.0.Co;2, 1977.
VanCuren, R., Cahill, T., Burkhart, J., Barnes, D., Zhao, Y., Perry, K., Cliff, S., and McConnell, J.: Aerosols and their sources at Summit Greenland - First results of continuous size- and time-resolved sampling, Atmos. Environ., 52, 82–97, https://doi.org/10.1016/j.atmosenv.2011.10.047, 2012.
Varnai, T. and Marshak, A.: Global CALIPSO Observations of Aerosol Changes Near Clouds, IEEE Geosci. Remote S., 8, 19–23, https://doi.org/10.1109/lgrs.2010.2049982, 2011.
Vernon, C. J., Bolt, R., Canty, T., and Kahn, R. A.: The impact of MISR-derived injection height initialization on wildfire and volcanic plume dispersion in the HYSPLIT model, Atmos. Meas. Tech., 11, 6289–6307, https://doi.org/10.5194/amt-11-6289-2018, 2018.
Virkkula, A., Teinilä, K., Hillamo, R., Kerminen, V.-M., Saarikoski, S., Aurela, M., Viidanoja, J., Paatero, J., Koponen, I. K., and Kulmala, M.: Chemical composition of boundary layer aerosol over the Atlantic Ocean and at an Antarctic site, Atmos. Chem. Phys., 6, 3407–3421, https://doi.org/10.5194/acp-6-3407-2006, 2006.
Wagenbach, D., Ducroz, F., Mulvaney, R., Keck, L., Minikin, A., Legrand, M., Hall, J., and Wolff, E.: Sea-salt aerosol in coastal Antarctic regions, J. Geophys. Res.-Atmos., 103, 10961–10974, https://doi.org/10.1029/97jd01804, 1998.
Wang, Y., Jiang, J., Su, H., Choi, Y., Huang, L., Guo, J., and Yung, Y.: Elucidating the Role of Anthropogenic Aerosols in Arctic Sea Ice Variations, J. Climate, 31, 99–114, https://doi.org/10.1175/jcli-d-17-0287.1, 2018.
Warneke, C., Froyd, K., Brioude, J., Bahreini, R., Brock, C., Cozic, J., de Gouw, J., Fahey, D., Ferrare, R., Holloway, J., Middlebrook, A., Miller, L., Montzka, S., Schwarz, J., Sodemann, H., Spackman, J., and Stohl, A.: An important contribution to springtime Arctic aerosol from biomass burning in Russia, Geophys. Res. Lett., 37, L01801, https://doi.org/10.1029/2009gl041816, 2010.
Wei, J., Li, Z., Lyapustin, A., Sun, L., Peng, Y., Xue, W., Su, T., and Cribb, M.: Reconstructing 1-km-resolution high-quality PM2.5 data records from 2000 to 2018 in China: spatiotemporal variations and policy implications, Remote Sens. Environ., 252, 112136, https://doi.org/10.1016/j.rse.2020.112136, 2021.
Weller, R., Minikin, A., Petzold, A., Wagenbach, D., and König-Langlo, G.: Characterization of long-term and seasonal variations of black carbon (BC) concentrations at Neumayer, Antarctica, Atmos. Chem. Phys., 13, 1579–1590, https://doi.org/10.5194/acp-13-1579-2013, 2013.
Winker, D., Hunt, W., and McGill, M.: Initial performance assessment of CALIOP, Geophys. Res. Lett., 34, L19803, https://doi.org/10.1029/2007gl030135, 2007.
Winker, D., Pelon, J., Coakley Jr, J., Ackerman, S., Charlson, R., Colarco, P., Flamant, P., Fu, Q., Hoff, R., Kittaka, C., Kubar, T., Le Treut, H., McCormick, M., Megie, G., Poole, L., Powell, K., Trepte, C., Vaughan, M., and Wielicki, B.: The CALIPSO mission a global 3D View of Aerosols and Clouds, B. Am. Meteorol. Soc., 91, 1211–1229, https://doi.org/10.1175/2010bams3009.1, 2010.
Winker, D. M., Tackett, J. L., Getzewich, B. J., Liu, Z., Vaughan, M. A., and Rogers, R. R.: The global 3-D distribution of tropospheric aerosols as characterized by CALIOP, Atmos. Chem. Phys., 13, 3345–3361, https://doi.org/10.5194/acp-13-3345-2013, 2013.
Wu, G., Wan, X., Gao, S., Fu, P., Yin, Y., Li, G., Zhang, G., Kang, S., Ram, K., and Cong, Z.: Humic-Like Substances (HULIS) in Aerosols of Central Tibetan Plateau (Nam Co, 4730 m asl): Abundance, Light Absorption Properties, and Sources, Environ. Sci. Technol., 52, 7203–7211, https://doi.org/10.1021/acs.est.8b01251, 2018.
Xia, X., Wang, P., Wang, Y., Li, Z., Xin, J., Liu, J., and Chen, H.: Aerosol optical depth over the Tibetan Plateau and its relation to aerosols over the Taklimakan Desert, Geophys. Res. Lett., 35, L16804, https://doi.org/10.1029/2008gl034981, 2008.
Xia, X., Zong, X., Cong, Z., Chen, H., Kang, S., and Wang, P.: Baseline continental aerosol over the central Tibetan plateau and a case study of aerosol transport from South Asia, Atmos. Environ., 45, 7370–7378, https://doi.org/10.1016/j.atmosenv.2011.07.067, 2011.
Xia, X., Che, H., Shi, H., Chen, H., Zhang, X., Wang, P., Goloub, P., and Holben, B.: Advances in sunphotometer-measured aerosol optical properties and related topics in China: Impetus and perspectives, Atmos. Res., 249, 105286, https://doi.org/10.1016/j.atmosres.2020.105286, 2021.
Xing, J., Wang, J., Mathur, R., Wang, S., Sarwar, G., Pleim, J., Hogrefe, C., Zhang, Y., Jiang, J., Wong, D. C., and Hao, J.: Impacts of aerosol direct effects on tropospheric ozone through changes in atmospheric dynamics and photolysis rates, Atmos. Chem. Phys., 17, 9869–9883, https://doi.org/10.5194/acp-17-9869-2017, 2017.
Xu, C., Ma, Y. M., Panday, A., Cong, Z. Y., Yang, K., Zhu, Z. K., Wang, J. M., Amatya, P. M., and Zhao, L.: Similarities and differences of aerosol optical properties between southern and northern sides of the Himalayas, Atmos. Chem. Phys., 14, 3133–3149, https://doi.org/10.5194/acp-14-3133-2014, 2014.
Xu, C., Ma, Y. M., You, C., and Zhu, Z. K.: The regional distribution characteristics of aerosol optical depth over the Tibetan Plateau, Atmos. Chem. Phys., 15, 12065–12078, https://doi.org/10.5194/acp-15-12065-2015, 2015.
Xu, X., Wu, H., Yang, X., and Xie, L.: Distribution and transport characteristics of dust aerosol over Tibetan Plateau and Taklimakan Desert in China using MERRA-2 and CALIPSO data, Atmos. Environ., 237, 117670, https://doi.org/10.1016/j.atmosenv.2020.117670, 2020.
Xue, W., Zhang, J., Zhong, C., Ji, D., and Huang, W.: Satellite-derived spatiotemporal PM2.5 concentrations and variations from 2006 to 2017 in China, Science of the Total Environment, 712, 134577, https://doi.org/10.1016/j.scitotenv.2019.134577, 2020.
Yang, Y., Zhao, C., Sun, L., and Wei, J.: Improved Aerosol Retrievals Over Complex Regions Using NPP Visible Infrared Imaging Radiometer Suite Observations, Earth and Space Science, 6, 629–645, https://doi.org/10.1029/2019ea000574, 2019.
Zeng, S., Omar, A., Vaughan, M., Ortiz, M., Trepte, C., Tackett, J., Yagle, J., Lucker, P., Hu, Y., Winker, D., Rodier, S., and Getzewich, B.: Identifying Aerosol Subtypes from CALIPSO Lidar Profiles Using Deep Machine Learning, Atmosphere, 12, 10, https://doi.org/10.3390/atmos12010010, 2021.
Zhao, C. and Garrett, T.: Effects of Arctic haze on surface cloud radiative forcing, Geophys. Res. Lett., 42, 557–564, https://doi.org/10.1002/2014gl062015, 2015.
Zhao, C., Andrews, A., Bianco, L., Eluszkiewicz, J., Hirsch, A., MacDonald, C., Nehrkorn, T., and Fischer, M.: Atmospheric inverse estimates of methane emissions from Central California, J. Geophys. Res.-Atmos., 114, D16302, https://doi.org/10.1029/2008jd011671, 2009.
Zhao, C., Yang, Y., Fan, H., Huang, J., Fu, Y., Zhang, X., Kang, S., Cong, Z., Letu, H., and Menenti, M.: Aerosol characteristics and impacts on weather and climate over the Tibetan Plateau, Natl. Sci. Rev., 7, 492–495, https://doi.org/10.1093/nsr/nwz184, 2020.
Zhao, Z., Cao, J., Shen, Z., Xu, B., Zhu, C., Chen, L. W. A., Su, X., Liu, S., Han, Y., Wang, G., and Ho, K.: Aerosol particles at a high-altitude site on the Southeast Tibetan Plateau, China: Implications for pollution transport from South Asia, J. Geophys. Res.-Atmos., 118, 11360–311375, https://doi.org/10.1002/jgrd.50599, 2013.
Zhu, J., Xia, X., Che, H., Wang, J., Cong, Z., Zhao, T., Kang, S., Zhang, X., Yu, X., and Zhang, Y.: Spatiotemporal variation of aerosol and potential long-range transport impact over the Tibetan Plateau, China, Atmos. Chem. Phys., 19, 14637–14656, https://doi.org/10.5194/acp-19-14637-2019, 2019.
Zou, X., Hou, S., Liu, K., Yu, J., Zhang, W., Pang, H., Hua, R., and Mayewski, P.: Uranium record from a 3 m snow pit at Dome Argus, East Antarctica, Plos One, 13, https://doi.org/10.1371/journal.pone.0206598, 2018.