the Creative Commons Attribution 4.0 License.
the Creative Commons Attribution 4.0 License.
 | 26 Mar 2021
Sensitivities of the Madden–Julian oscillation forecasts to configurations of physics in the ECMWF global model
Jun-Ichi Yano
Nils P. Wedi
The sensitivities of the Madden–Julian oscillation (MJO) forecasts to various different configurations of the parameterized physics are examined with the global model of ECMWF's Integrated Forecasting System (IFS). The motivation for the study was to simulate the MJO as a nonlinear free wave under active interactions with higher-latitude Rossby waves. To emulate free dynamics in the IFS, various momentum-dissipation terms (“friction”) as well as diabatic heating were selectively turned off over the tropics for the range of the latitudes from 20∘ S to 20∘ N. The reduction of friction sometimes improves the MJO forecasts, although without any systematic tendency. Contrary to the original motivation, emulating free dynamics with an operational forecast model turned out to be rather difficult, because forecast performance sensitively depends on the specific type of friction turned off. The result suggests the need for theoretical investigations that much more closely follow the actual formulations of model physics: a naive approach with a dichotomy of with or without friction simply fails to elucidate the rich behaviour of complex operational models. The paper further exposes the importance of physical processes other than convection for simulating the MJO in global forecast models.
- Article
(16749 KB) - Full-text XML
- BibTeX
- EndNote


The Madden–Julian oscillation (MJO; Zhang, 2005) is a prominent tropical variability that many global atmospheric models still have difficulties simulating. In the case of the ECMWF Integrated Forecasting System (IFS), the forecast of the propagation of a pre-existing MJO has much improved in recent years (Vitart, 2014), typically providing persistent MJO signals well beyond the medium-range forecast. However, the IFS still suffers from some difficulties, especially in predicting the onset of MJOs. The capacity to produce extended MJO forecasts is becoming more important with increasing demand for extended forecasts up to a subseasonal range (3–4 weeks) and because the MJO is one of the most prominent and persistent tropical signals to be forecast over this timescale (see Kim et al., 2018).
From an operational point of view, the MJO is typically considered physically forced in the sense that the physical parameterizations (or “physics” for short) in the models are the key to improving the simulation of the MJO, rather than a problem of the dynamical core (e.g. Hirons et al., 2013a, b). The most crucial physical process to be considered is deep convection, which is typically parameterized as a sub-grid-scale process in global models (Plant and Yano, 2015). A majority of the existing theories for the MJO are based on a certain coupling of the large-scale dynamics with convection (e.g. Hayashi, 1970; Lindzen, 1974; Emanuel, 1987; Yano and Emanuel, 1991; Majda and Stechmann, 2009; Fuchs and Raymond, 2017; see also reviews by Zhang et al., 2020; Jiang et al., 2020a). For this reason, a general expectation is that simulations and forecasts of the MJO in the global models must be improved by improving the parametrization of deep convection (see Jiang et al., 2015, 2020b) as well as shallow convection (see Pilon et al., 2015). Thus, existing sensitivity studies on MJO simulations almost exclusively focus on convection parameterizations (e.g. Hirons et al., 2013a, b; Pilon et al., 2015).
The present study examines the sensitivity of the MJO forecasts to physics from a different perspective of Yano and Bonazzola (2009), Yano et al. (2009), Wedi and Smolarkiewicz (2010), Yano and Tribbia (2017), Rostam and Zeitlin (2019), and Wang et al. (2019). According to their perspective, the tropical large-scale dynamics in general and the MJO specifically can be understood in terms of free Rossby wave dynamics, in which model “physics” may still play a role, although secondary to the initiation and evolution. More specifically, Yano and Tribbia (2017) and Rostam and Zeitlin (2019) propose that the MJO is basically understood in terms of a dipolar vortex (vortex pair) symmetric to the Equator, described by a nonlinear analytical solution, called “modon”, which propagates eastwards as observed for the MJO. To investigate this possibility of the MJO as free dynamics in the context of the operational global forecasts, we take the ECMWF global model (IFS) as a basic framework and perform extensive physical sensitivity experiments. See Sect. 2.1 for model details.
To emulate free dynamics within the IFS, physical tendencies of some variables are selectively turned off so that the resulting sensitivities to the corresponding MJO forecasts can be examined. A key process to be turned off in order to emulate free dynamics is the surface friction (or momentum dissipation more generally). This process has been expected to potentially play a crucial role in the MJO dynamics. A classical work by Chang (1977) makes this point by invoking the surface friction as a mechanism to slow down the propagation speed of the eastward-propagating free Kelvin wave to a degree comparable to that of the MJO. The frictional wave-CISK (conditional instability of the second kind) theories by Wang (1988) and Salby et al. (1994) also invoke frictional moisture convergence as a key ingredient in addition to deep convection for explaining the basic dynamics of the MJO. Along with the surface friction, diabatic heating is another key process to be turned off in order to achieve free dynamics.
A shortcoming of the free wave theory of the MJO is that it does not explain an MJO initiation in an obvious manner. Thus, when physical forcings are turned off from a model, an initiation mechanism must be sought. For this reason, particular attention is paid to the potential importance of interactions of the MJO with higher-latitude dynamics. Weickmann et al. (1985) and Knutson and Weickmann (1987) suggest that the interactions with Rossby wave trains from and to higher latitudes are intrinsic parts of the MJO dynamics. Hsu et al. (1990), Gustafson and Weare (2004), Ray and Zhang (2010), Ray and Li (2013), Zhao et al. (2013), and Wang et al. (2019) further suggest that Rossby wave trains from the Northern Hemisphere higher latitudes initiate MJOs. The general importance of higher-latitude variability in MJO dynamics is also suggested by the modelling of MJOs under an equatorial channel configuration, in which a properly prescribed lateral boundary condition is crucial (see Hall et al., 2016, and references therein).
To investigate these aspects of the MJO dynamics, we attempt to simulate the higher-latitude dynamics as properly as possible. In the following sensitivity experiments, a weighting of cos 6ϕ with ϕ of the latitude is adopted so that the effects of the applied sensitivity rapidly tail off polewards of ca. 20∘. Hence, when a certain process is turned off over the tropics, the tendency due to this process is multiplied by 1−cos 6ϕ.
Under this general strategy, four major categories of experiments are performed, as listed in Table 1. These experiments are designed to address the following questions:
-
Can the propagation of the MJO be simulated in a complex forecast model even if the diabatic heating due to convection is turned off?
-
To what extent can the simulated MJO be interpreted in terms of free Rossby wave dynamics?

To address question 1, we turn off all of the diabatic heating in the heat equation (entropy budget) so that an adiabatic free dynamics regime is realized over the tropics. Here, it is crucial to turn off all the diabatic heating, because if the latent heating is turned off, but the radiative cooling tendency of the tropics is maintained, a steady state can only be maintained by turning the mean ascent (associated with moist convection) to a mean descent, which induces diabatic heating that balances the radiative cooling. We turn off the total diabatic heating so that the tendency to generate any vertical motion is suppressed, and a purely horizontal, quasi-non-divergent flow is realized.
To address question 2, we turn off the non-conservative processes (i.e. frictional dissipation in general) in the horizontal momentum equation, because we expect that the free Rossby wave dynamics associated with the MJO are enhanced by turning off the momentum dissipation. As a result, we also expect that Rossby wave interactions between the tropics and the higher latitudes are enhanced. The claim that the MJO is a free Rossby wave also contains another important general implication that the MJO can be principally understood in terms of non-divergent, rotational flows. Thus, an important question to be investigated is the extent to which a non-divergent (rotational) component of the MJO is still maintained by selectively turning off the physics.
The exploratory nature of the present investigation is emphasized. Unfortunately, our goal of emulating the free dynamics is not achieved in any obvious manner without any systematically identifiable trait in these sensitivity experiments. For example, the reduction of momentum-dissipation effects (“frictions”) in the model does not lead to a simple improvement or deterioration of the MJO forecast. The paper focuses on elucidating these complex sensitivities of the MJO forecasts to different configurations of the physics. Detailed descriptions of the results are presented as objectively as possible with the purpose of elucidating real operational issues in improving the MJO forecasts. This is where theoretical investigations are strongly needed to better understand the model behaviour.
For example, the role of friction in the MJO dynamics remains a key question since a pioneering study by Chang (1977); however, the majority of theoretical studies treat it simply as a Rayleigh friction (see Sect. 4 of Yano et al., 2013, for a review of this line of theoretical studies). The present study, in turn, shows that the actual contribution of friction in an operational model is far more complex. Thus, a more serious effort to fill the gap between those idealized theoretical studies and operational problems is required.
The present study is unique with respect to modelling studies, as it examines the roles of more specific physical processes in the MJO dynamics – for example, instead of turning off the whole momentum-dissipation process, individual momentum-dissipation processes are turned off one by one. This is in contrast to mechanism-denial studies (e.g. Kim et al., 2011; Ma and Kuang, 2016), in which a whole process (e.g. momentum dissipation, surface-flux evaporation) is typically turned off (see also e.g. Crueger and Stevens, 2015). The present study is also conceptually different from the mechanism-denial studies. The latter replace the turned-off processes with climatologies, whereas the present study turns off a given process with the goal of getting closer to idealized free dynamics.
However, there is a subtlety in turning off certain physics in a given model, because of their impact on the mean state and the nonlinearity of the system leading to various chain reactions and compensatory behaviour with corresponding changes to the MJO forecast skill. We find that changes in the results due to turning off different physics hardly constitute simple additive processes. Previous studies have found significant changes in the energy cascade behaviour of the IFS model, controlled by certain physics or specific parts thereof (Malardel and Wedi, 2016). A change in the tropical processes clearly influences the interactions of the tropical processes with those at higher latitudes. Therefore, subtle balances between higher latitudes and the tropics must carefully be taken into account for a full interpretation of these sensitivity results.
The main contribution of the present study is to suggest that the MJO dynamics is not just a matter of its coupling with convection, but other physical processes, including friction, actively contribute to defining its dynamics. Another important, rather non-intuitive result is the strong sensitivity of the MJO forecast to initial conditions. The following analysis is focused over the region of the Indian Ocean to the western Pacific (90–180∘ E), where the main activities of the MJO are identified. Although the original study by Madden and Julian (1972) identifies the MJO as a global mode, as the analysis by Milliff and Madden (1996) shows, the continuous mode propagating eastwards beyond the Date Line is rather identified as a free Kelvin wave.
The next section describes the model used in this study (Sect. 2.1), the forecast cases (Sect. 2.2 and 2.3) and the analysis procedure (Sect. 2.4). The results are presented in Sect. 3, and the paper concludes with a discussion in Sect. 4.
2.1 Model description
The IFS version cycle 43r3 (operational from 11 July 2017 to 5 June 2018) is used for the forecast experiments with TCo639 (average grid spacing 18 km) and with 137 vertical levels. The IFS is a spectral transform model solving part of the solution in spectral space, where prognostic variables are represented by spherical harmonics. To calculate nonlinear terms in the equations of motion, to perform the nonlinear (semi-Lagrangian) advection and to calculate the contributions of all physics schemes in grid point columns, the model fields are transformed into a representation in grid point space. A cubic octahedral (reduced) Gaussian grid is used for this purpose, denoted by “TCo” (see Wedi, 2014; Malardel et al., 2016), typically providing a resolution higher than the corresponding linear grid at the same spectral truncation. The model is stepped forward in time using a semi-implicit time discretization for the faster (wave) processes. The model includes a realistic topography and state-of-the-art descriptions of the diabatic forcing processes, including shallow and deep convection, turbulent diffusion, radiation, and five categories for water substance (vapour, liquid, rain, ice and snow). Full model documentation is available from http://www.ecmwf.int/en/publications/ifs-documentation/ (last access: 22 March 2021).
2.2 General description of the study period: association of the vorticity variability with the MJO
As stated in Sect 1, the vorticity is a key variable to be examined in this study. The vorticity field turns out to be rather “noisy” and is dominated by smaller scales over the tropical region: the forecast correlation of the vorticity is typically lost more than 60 % over a single day. For this reason, we judge that the vorticity field is an unreliable variable to diagnose over the tropics. The stream-function field is more robust, being obtained by applying an inverse Laplacian to the vorticity, and due to the nature of this inverse operator, this field is much smoother. This vortex structure is also expected to penetrate through the whole troposphere according to the free Rossby wave theory (see Yano and Tribbia, 2017). However, in data analysis, the lower troposphere tends to be too noisy to identify the MJO signature in the rotational wind field (vorticity) without a proper filtering or composite procedure (see Wang et al., 2019). We focus on the tropopause level (150 hPa) in the following, because, as it turns out, at this level, a coherent rotational flow field associated with the MJO is much easier to identify compared with the lower levels.
To see a clear association of the rotational wind field with the convective variability of the MJO, we show (in Fig. 1) the time–longitude section averaged over 15∘ S–15∘ N for the outgoing longwave radiation (OLR) and the 150 hPa stream function (with the sign flipped for the Southern Hemisphere so that the anticyclonic vorticities are always treated as positive) for the 4-month winter period (November 2016–February 2017) from the ECMWF global analysis (“analysis” hereafter), which is systematically adopted as an observational reference in the following. Here, data are plotted daily with a horizontal resolution of 2.5∘. However, no filter is applied in time nor space. In the OLR field (Fig. 1a), three MJO events are identified over the Indian Ocean to the western Pacific (90–180∘ E) during this period – identified as negative signals (in blue) stretching from the upper left to the lower right: the two major signals are in December and in January–February, and another weak MJO event is identified during December–January.
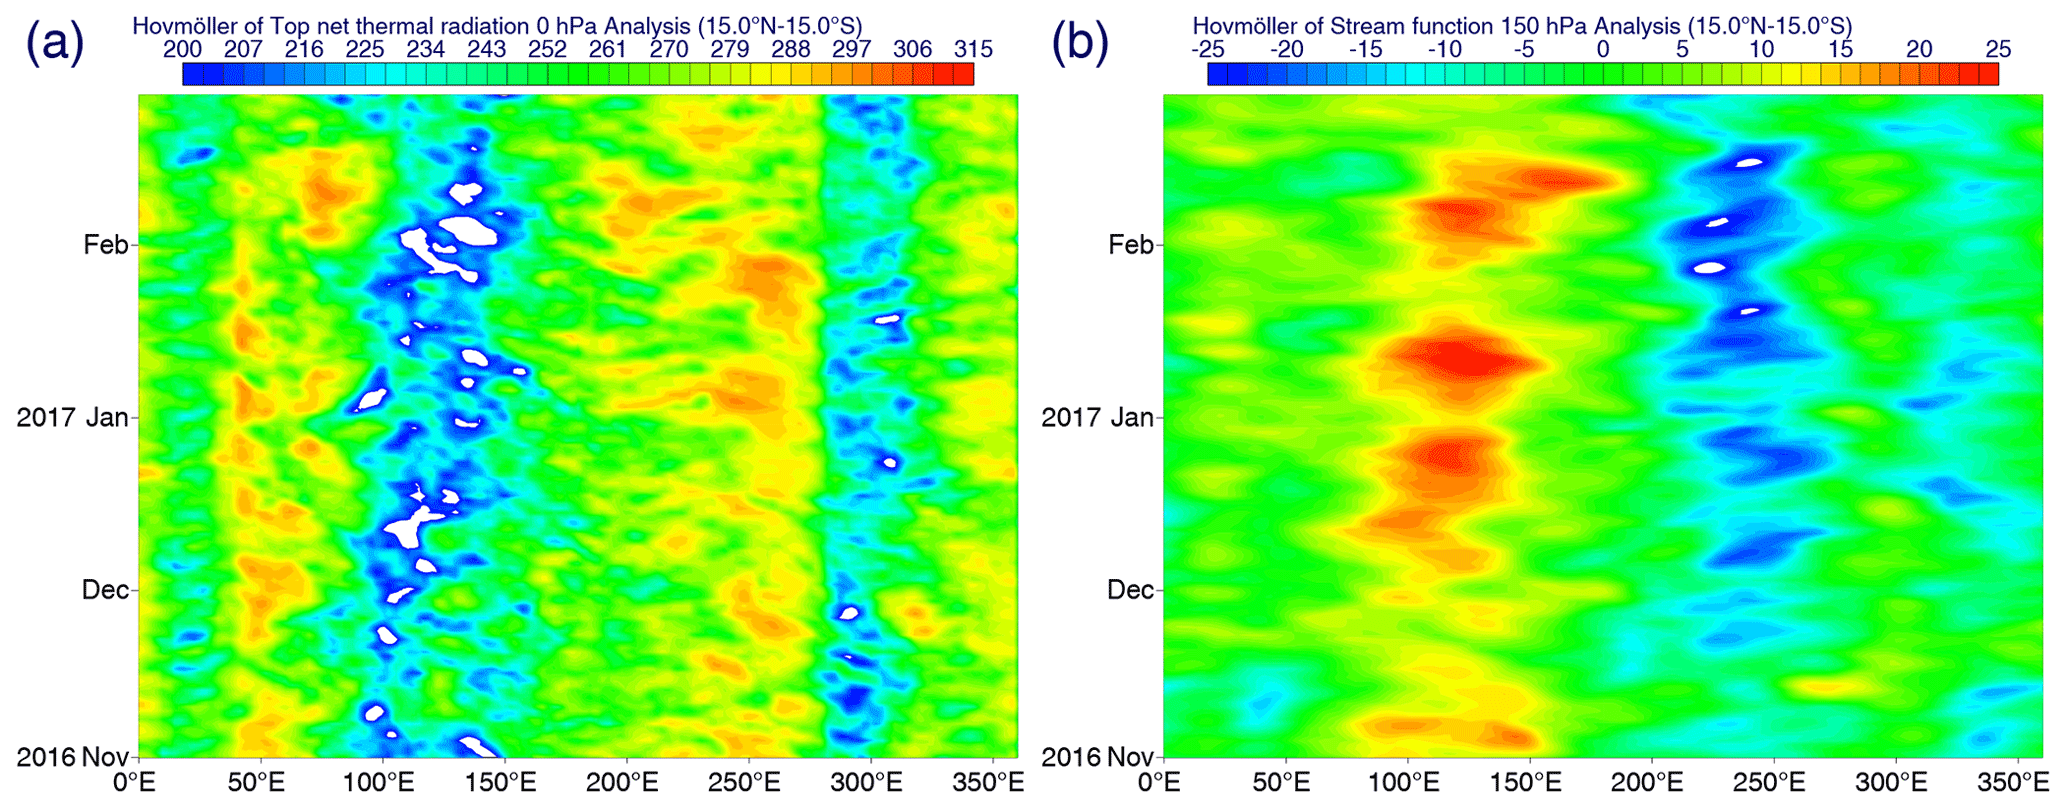
Figure 1Time–longitude sections of the ECMWF analysis averaged over 15∘ S–15∘ N for (a) OLR (K, as equivalent black-body temperature) and (b) the stream function (s−1) at 150 hPa for the 4-month winter period of 2016–2017. In averaging the stream function, the sign is flipped for the Southern Hemisphere.
In association with these three MJO events, high anticyclonic activities (positive signals, in red) over the Indian Ocean to the western Pacific are identified (Fig. 1b), also propagating eastwards with a similar phase speed: the MJO constitutes an anticyclonic vortex pair in the upper troposphere propagating eastwards, as expected from the nonlinear free Rossby wave theory; see Wang et al. (2019) for further discussions. Thus, according to this theory, these features need to be simulated in association with the MJO.
2.3 Choice of the forecast cases
Two forecast cases are mainly considered. Both cover one of the two most prominent MJO events during the northern winter 2016–2017, as seen in Fig. 1. The MJO event considered here corresponds to a low-skill event (Fredric Vitart, personal communication, March 2018) under dichotomic categorization of the MJO forecast difficulties introduced by Kim et al. (2016), which are more difficult than average. Here, a low-skill event is chosen for our experiments for the obvious reason that it is more challenging to forecast. As is seen below, operational control forecasts perform rather poorly; thus, the following question is posed: how can we improve them? Sensitivity experiments are chosen, as discussed in Sect. 1, with the hypothesis in mind that the MJO is a nonlinear free Rossby wave. If this hypothesis is correct, we should obtain better forecasts by turning off selected physics.
The first forecast case (referred to as “standard” in the following; Figs. 2a, 3a) is initiated on 19 January 2017 and run for 20 d. At this initial condition, convection associated with the MJO is already fairly well developed over the Indian Ocean (Fig. 2a), and the key question is whether the model can maintain this convective system and also propagate eastwards as observed. On the other hand, from a dynamical point of view, this is before the anticyclonic activity begins to develop over the Indian Ocean (Fig. 3a). Thus, the key forecast question is whether the model can predict the onset of this activity.
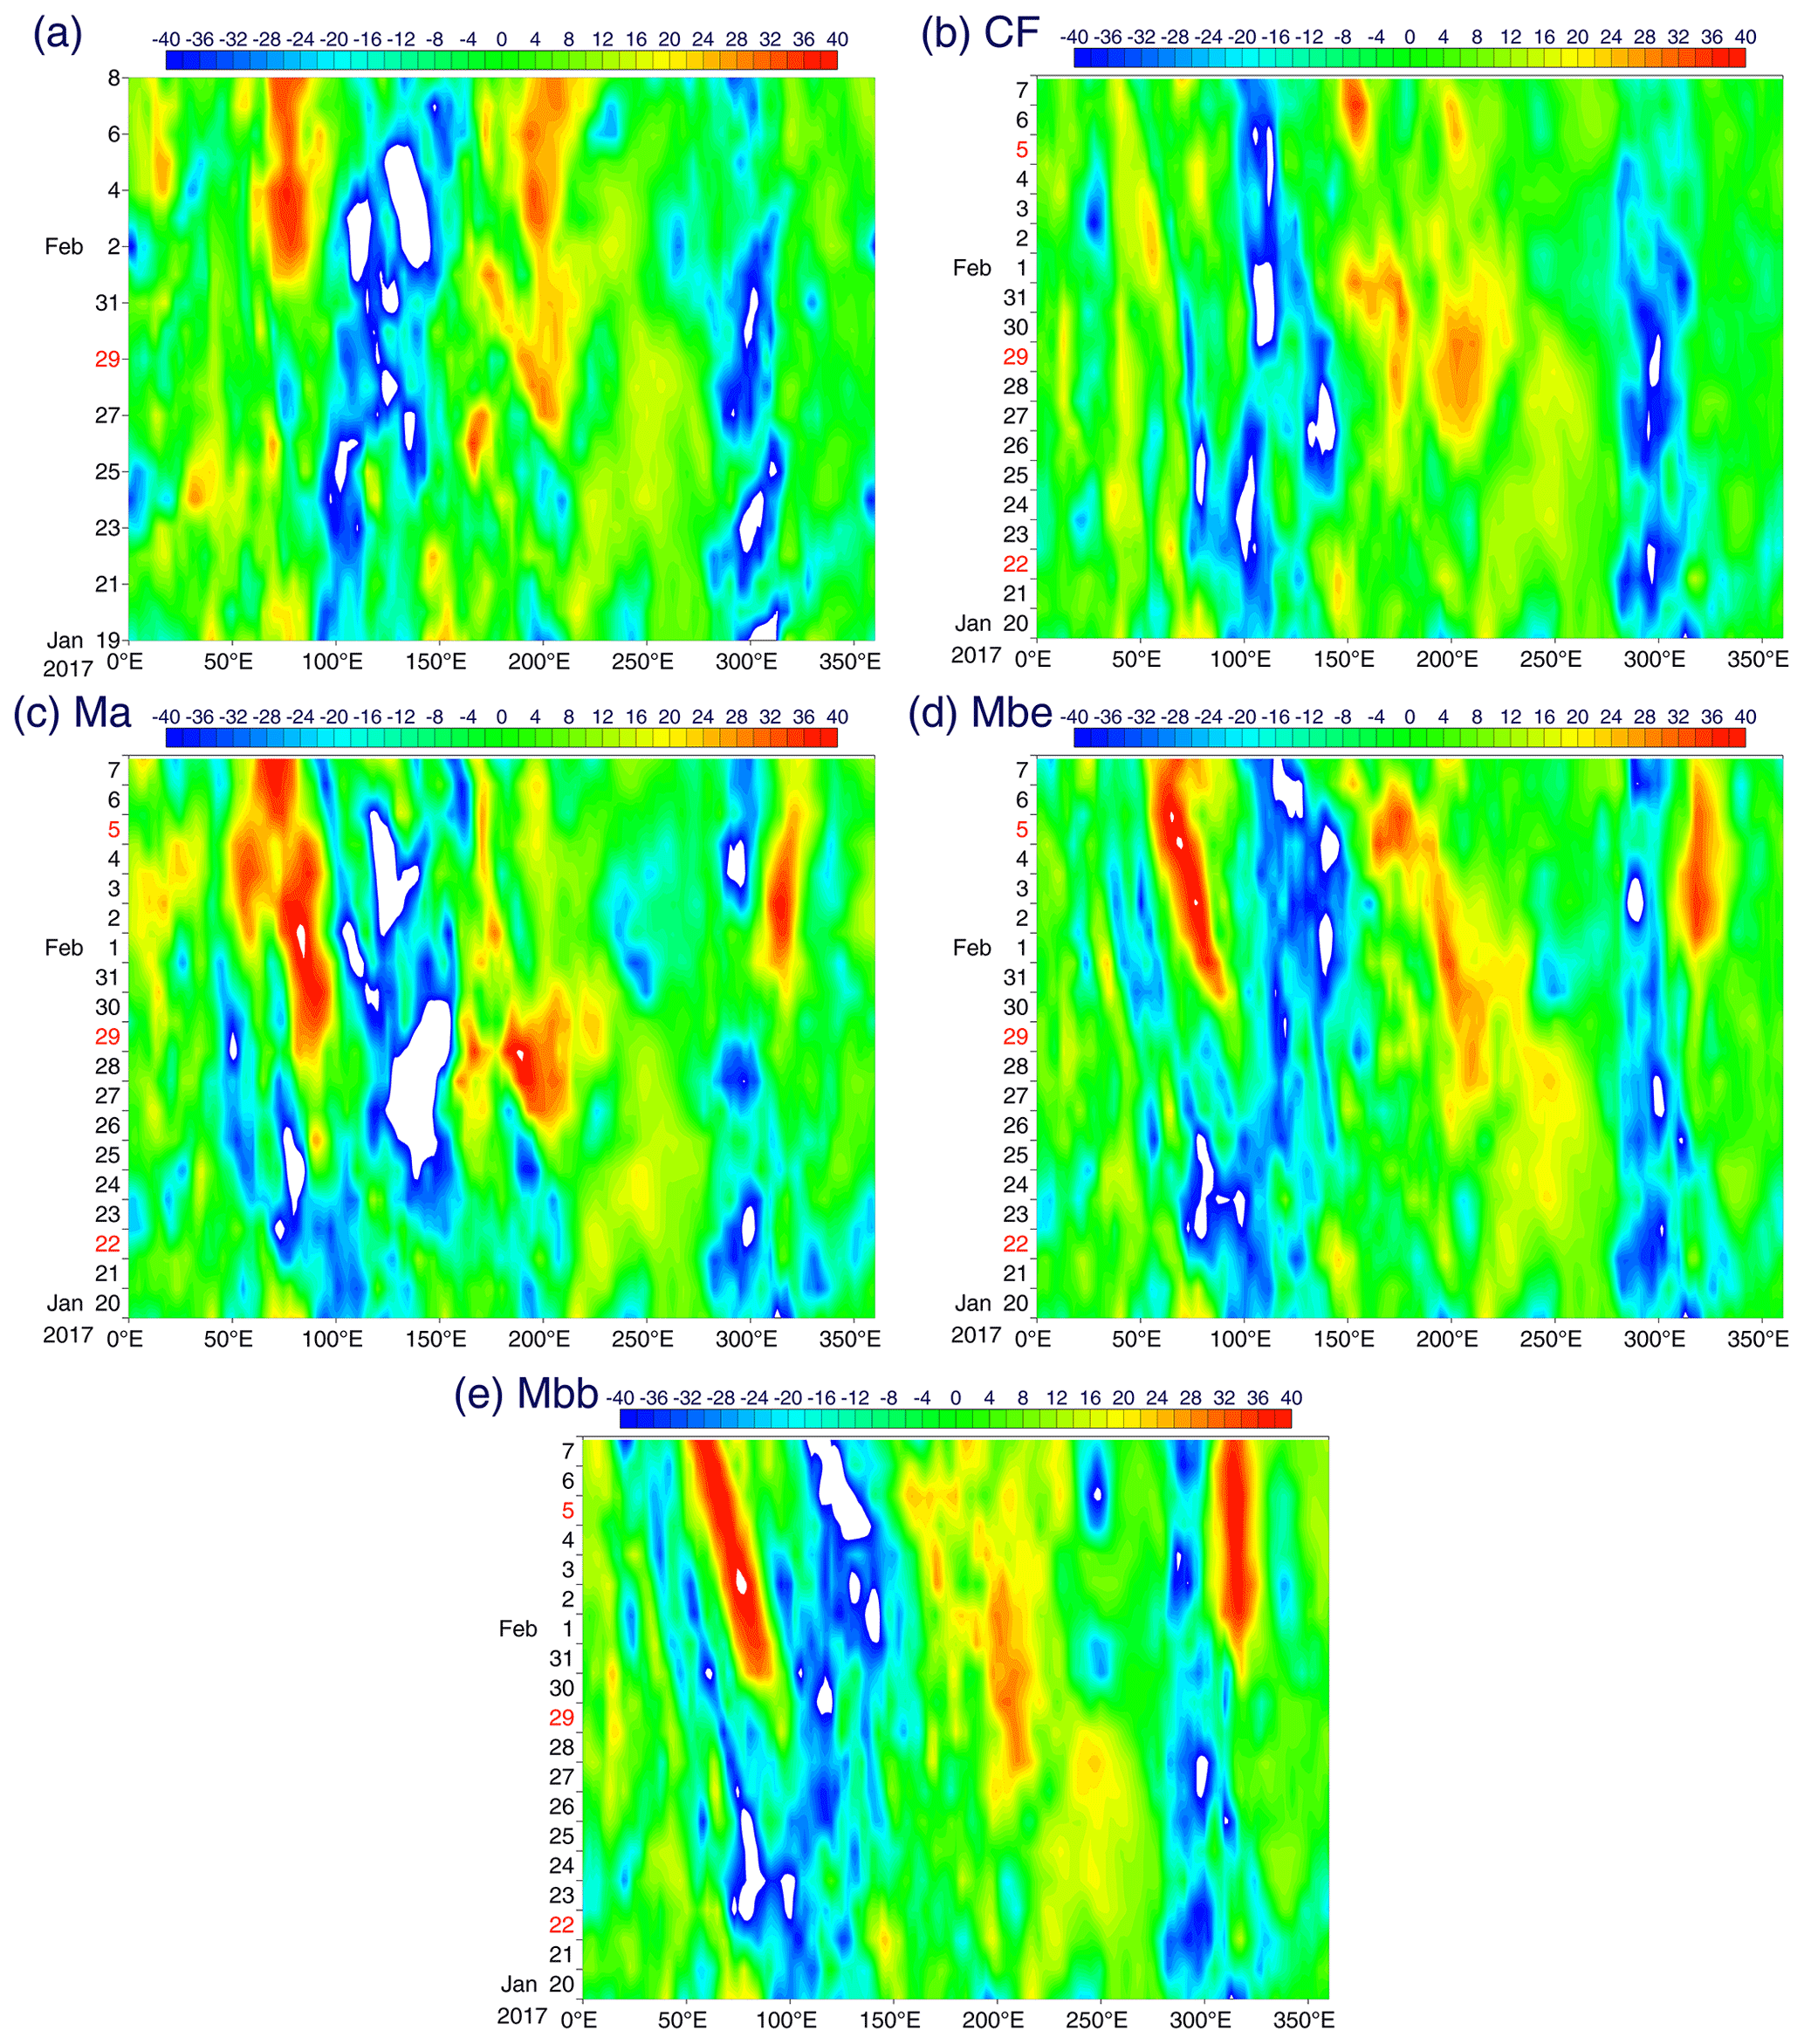
Figure 2Time–longitude sections averaged over 15∘ S–15∘ N of OLR for the standard 20 d forecast case: (a) analysis, (b) CF, (c) Ma, (d) Mbe and (e) Mbb.
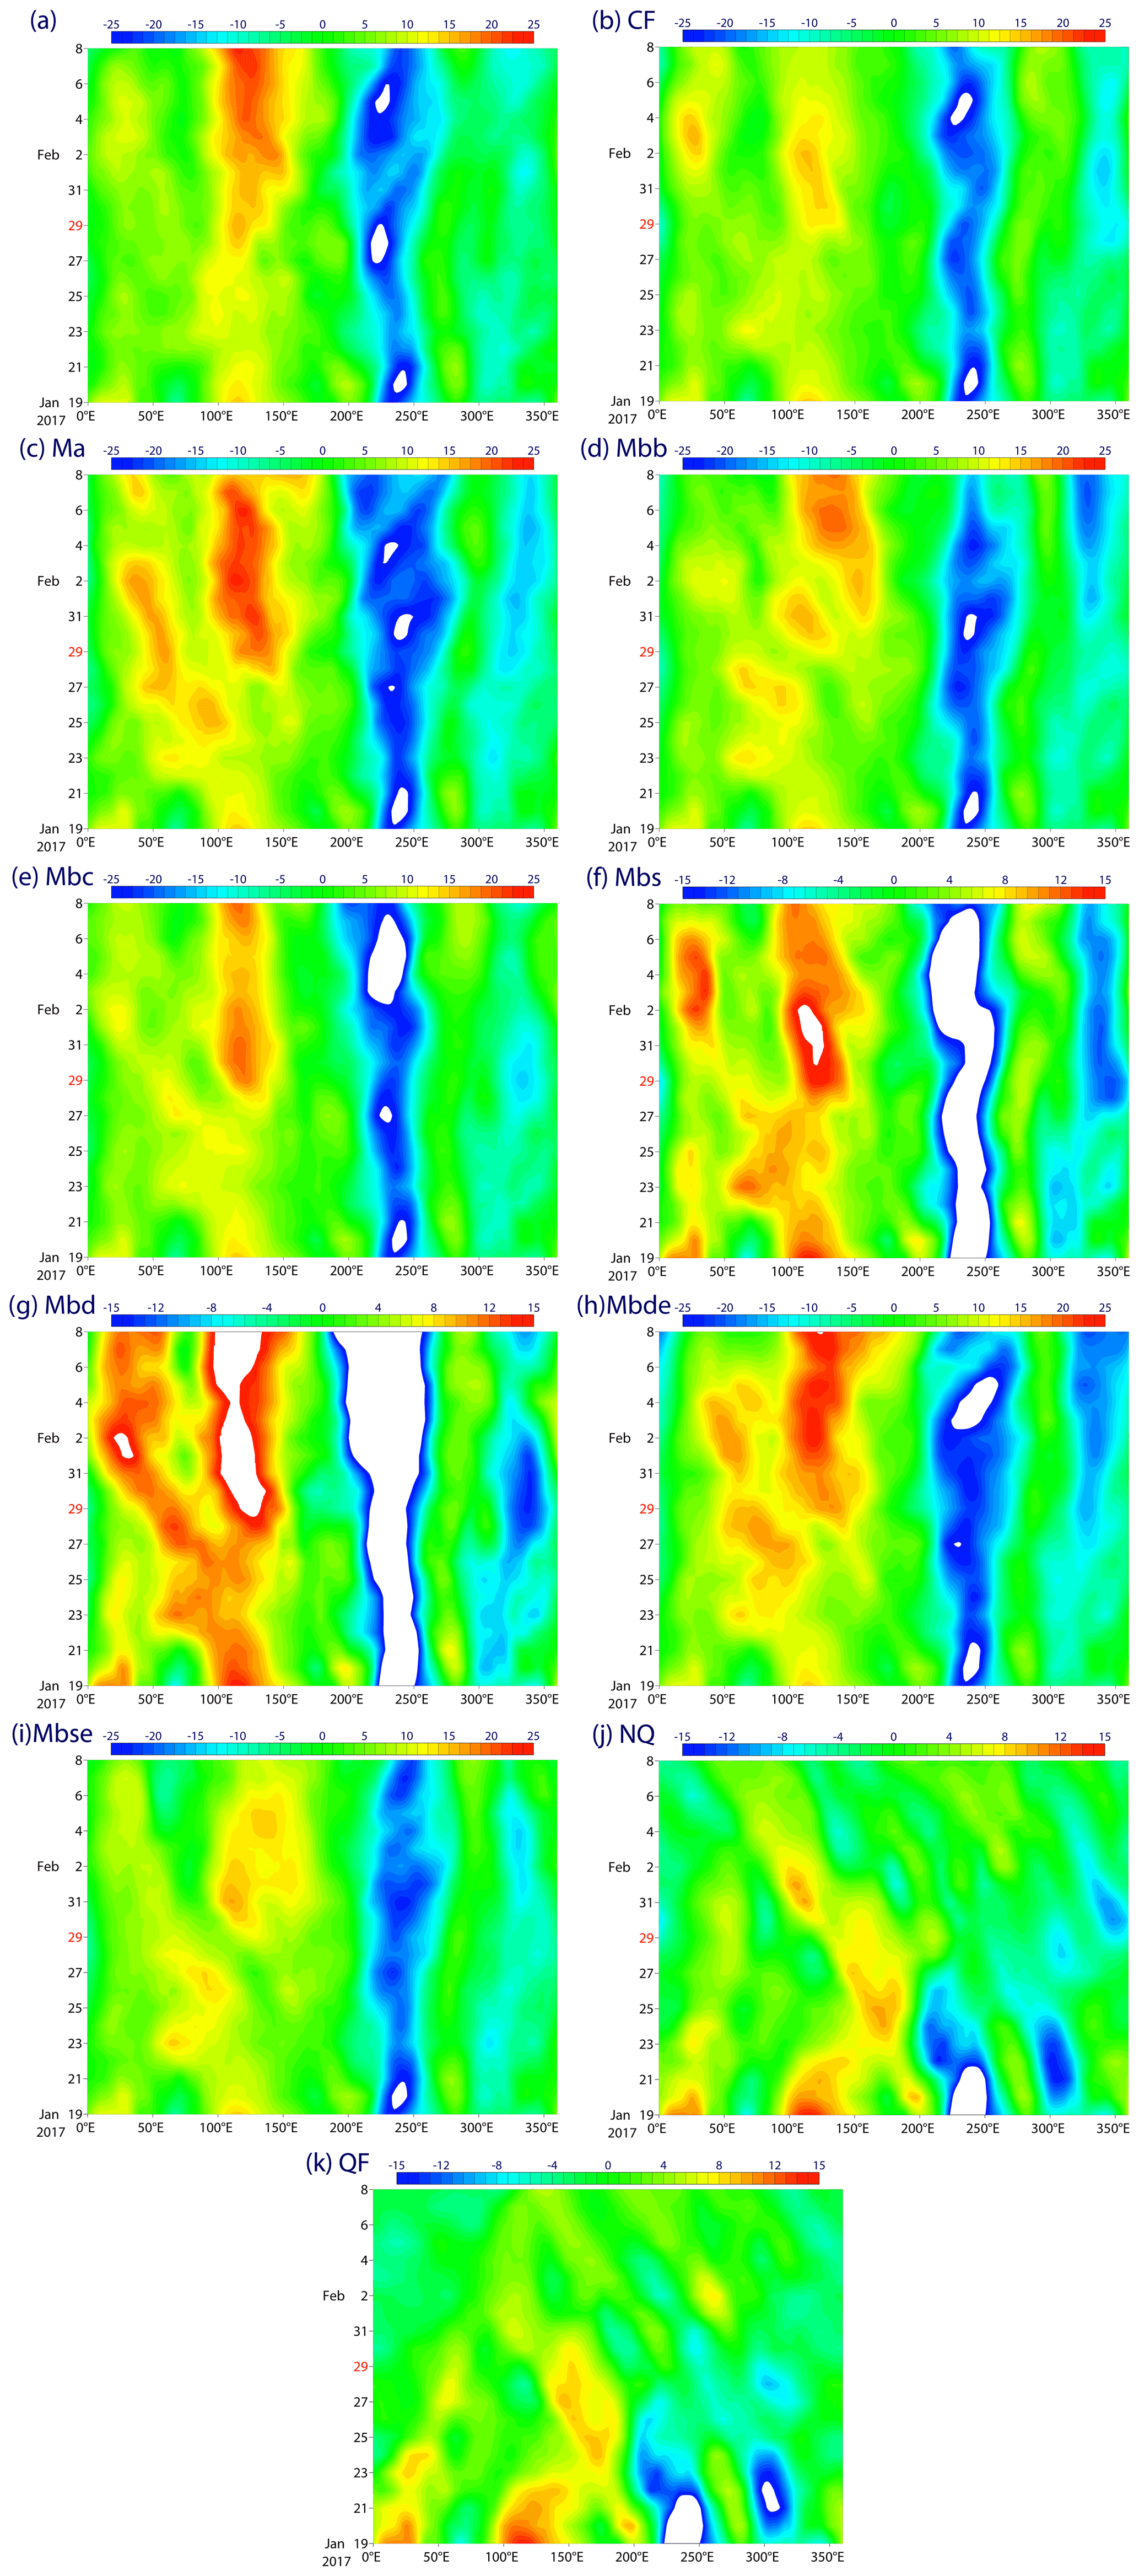
Figure 3Time–longitude sections averaged over 15∘ S–15∘ N of the 150 hPa level stream function for the standard 20 d forecast case: (a) analysis, (b) CF, (c) Ma, (d) Mbb, (e) Mbc, (f) Mbs, (g) Mbd, (h) Mbde, (i) Mbse, (j) NQ and (k) QF.
The second case (referred to as “extended” in the following; Figs. 4a, 5a) is initiated 10 d earlier (9 January) than the standard case and run for 40 d, except for the Mbb case (cf., Table 2) which only runs for 30 d. The initial condition corresponds to the end of a previous MJO, and no mark of convective activity associated with the new MJO is yet to be seen over the Indian Ocean (Fig. 4a). Thus, a key operational challenge is to forecast the onset of convective variability associated with the MJO over the Indian Ocean. From a dynamical point of view, the vortex pair associated with the previous MJO is still well identified over the western Pacific (Fig. 5a). Thus, another operational challenge is to forecast the continuous maintenance of this vortex pair, in association with the subsequent onset of another vortex pair over the Indian Ocean.
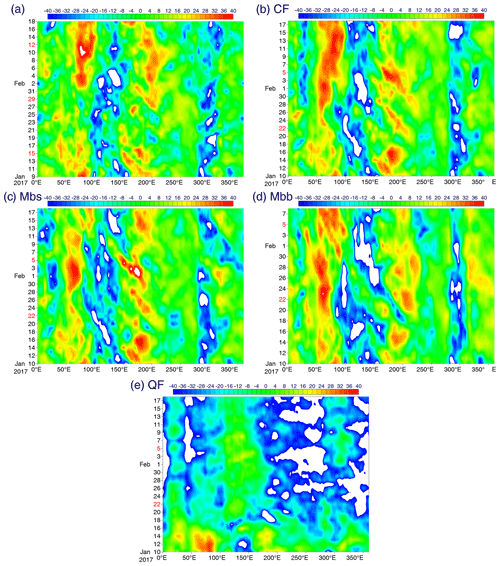
Figure 4Time–longitude sections averaged over 15∘ S–15∘ N of OLR for the 40 d extended forecast case: (a) analysis, (b) CF, (c) Mbs, (d) Mbb and (e) QF. Note that the Mbb case (d) is an exception and only runs for 30 d.
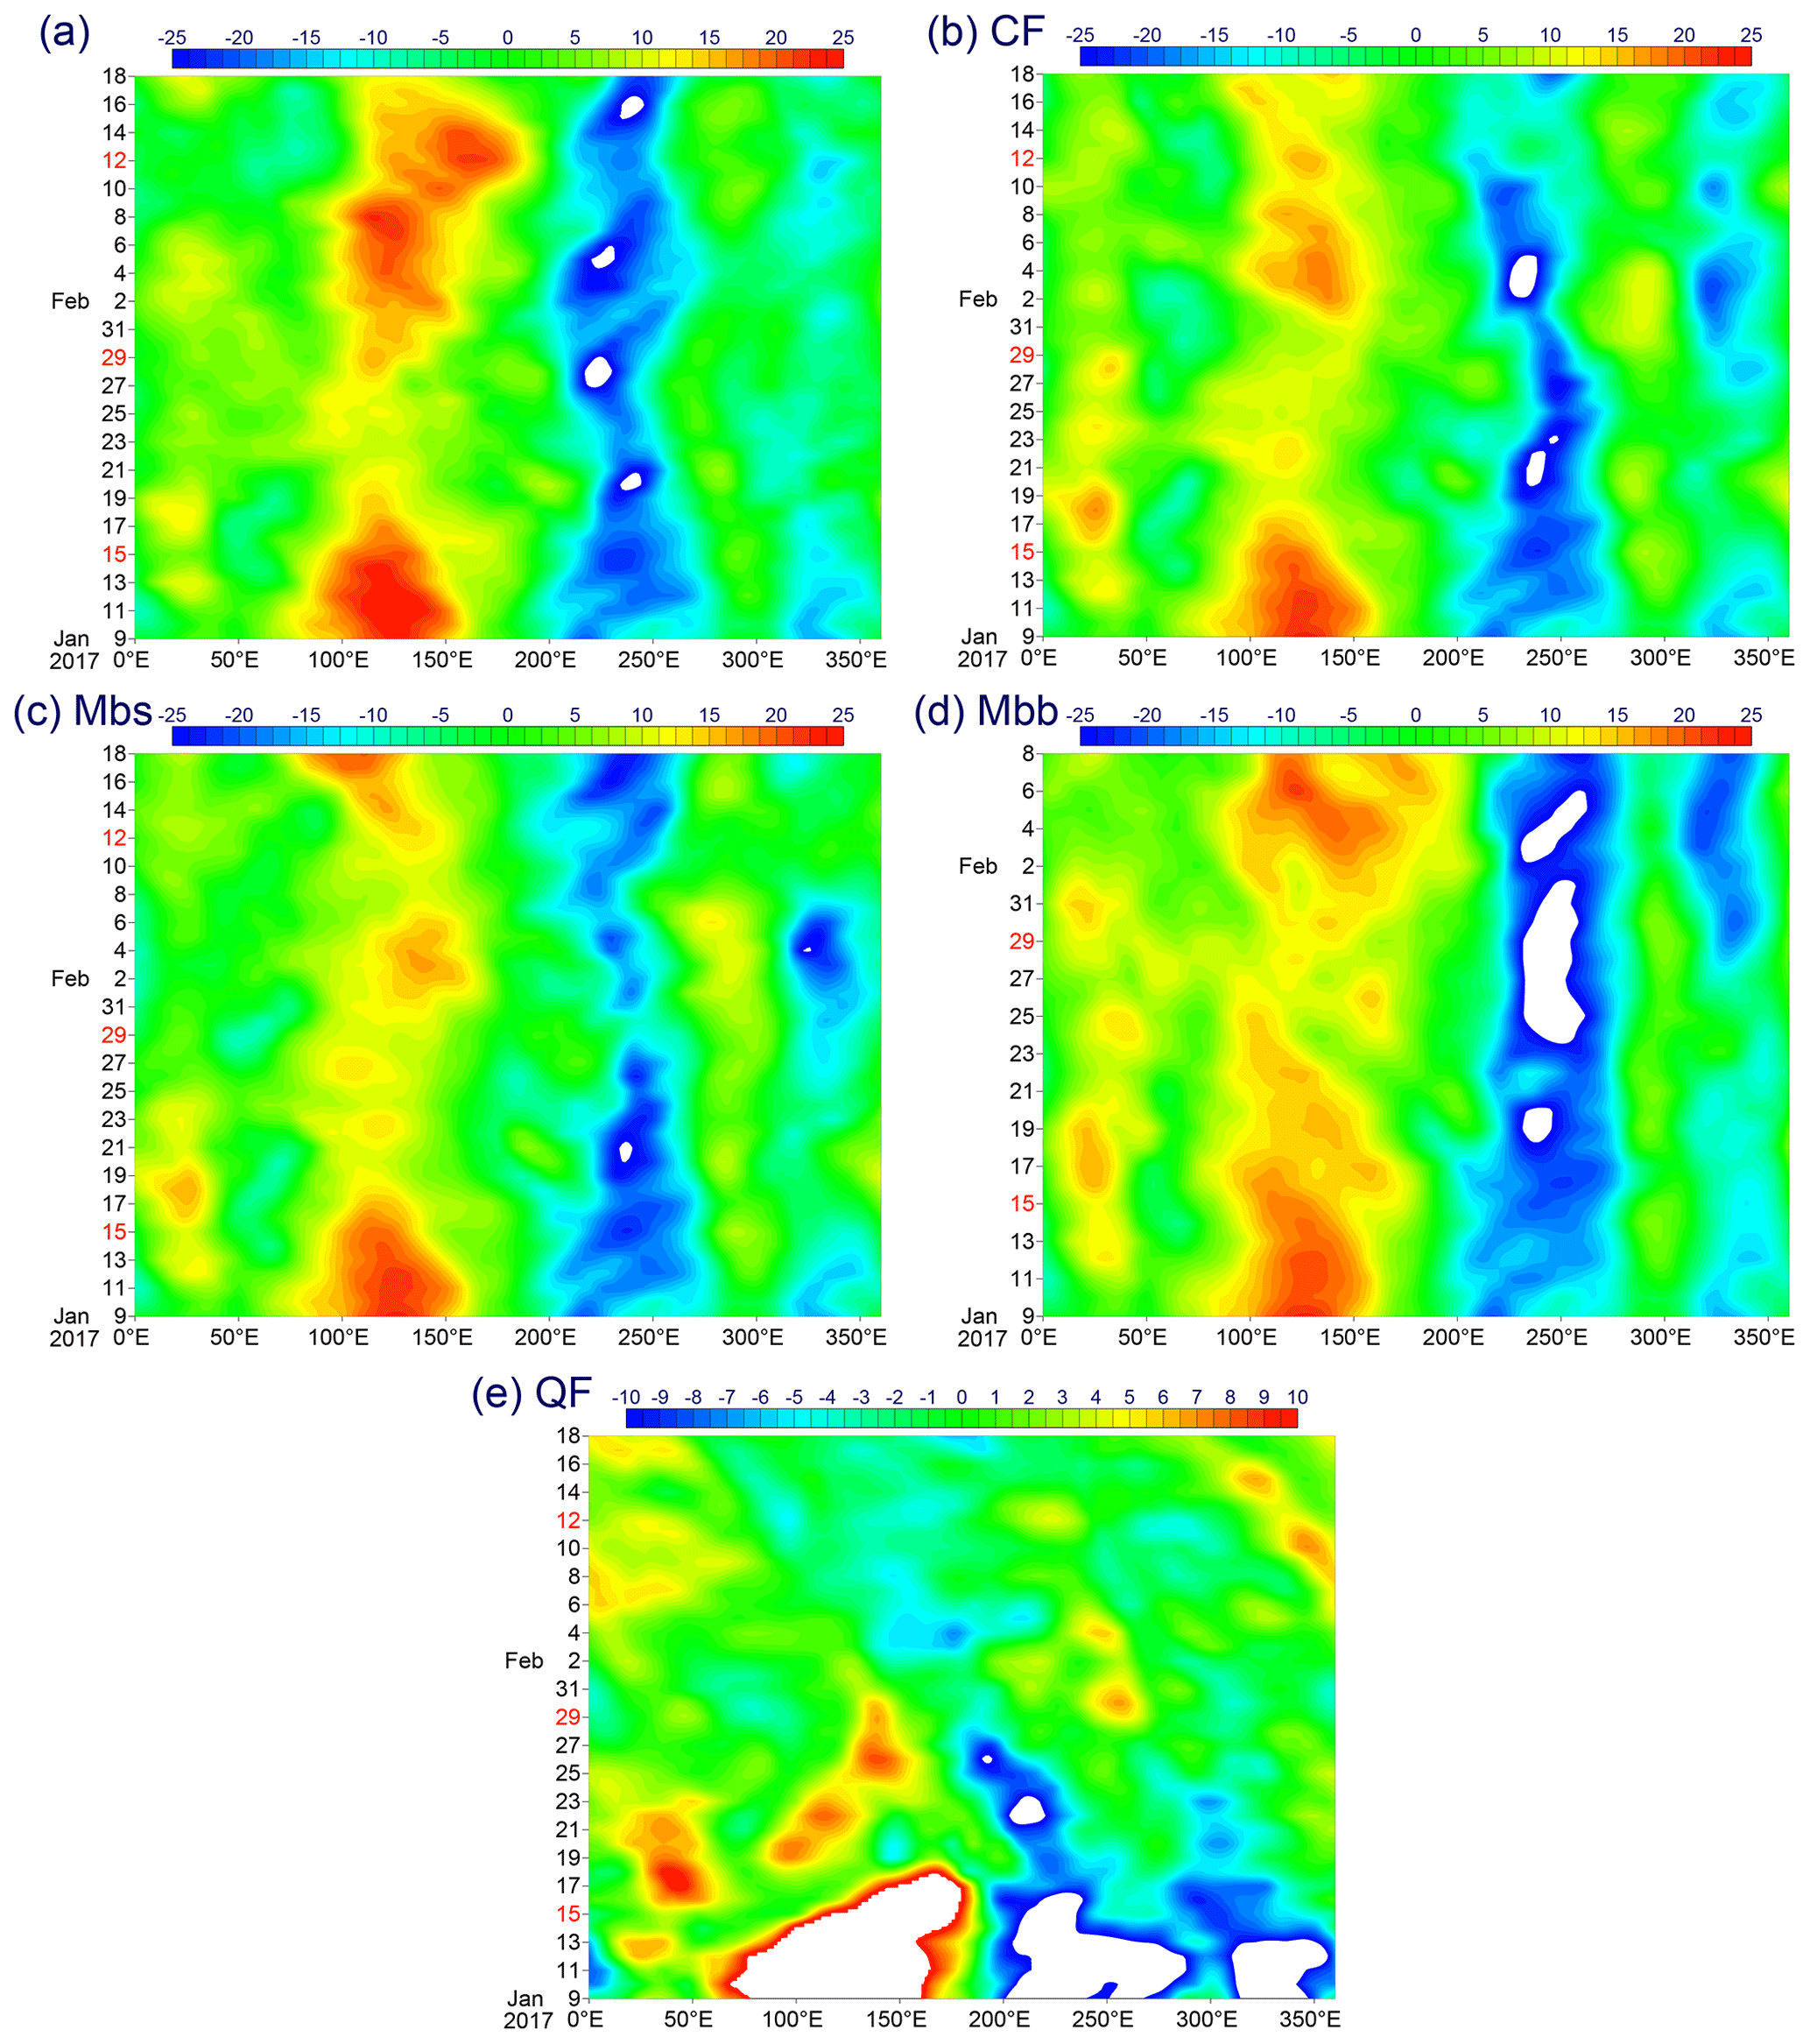
Figure 5Time–longitude sections averaged over 15∘ S–15∘ N of the 150 hPa level stream function for the 40 d extended forecast case: (a) analysis, (b) CF, (c) Mbs, (d) Mbb and (e) QF. Note that the Mbb case (d) is an exception and only runs for 30 d.
Finally, a single quasi-free forecast initiated on the 1 February 2017 is considered (QF). This is a moment when the vortex pair is fully developed over the given MJO event (Fig. 5a), although convection has actually already begun to fade out (Fig. 4a). Thus, this experiment examines whether it is possible to forecast the eastward propagation of this vortex pair even without convection. Table 2 describes the list of sensitivity experiments. As described in Sect. 1, selective physics are turned off, although only over the tropics, in the following experiments, by applying a factor, 1−cos 6ϕ, on a physical term with respect to ϕ of the latitude.
2.4 Analysis procedure
2.4.1 OLR
We take the outgoing longwave radiation (OLR) as a representative of the convective variability by following a standard approach from the literature. Here, however, special considerations are required for this variable, because within the IFS, the longwave radiation (tagged as the “top net thermal radiation”, J m−2) is recorded as accumulated values. As a standard procedure at ECMWF, the emission rate is estimated from the accumulated values as a tendency over 24 h. As the outgoing longwave radiation is not one of the initialization fields, it is not included as an analysis field either. As a result, “observational” OLR is instead estimated from the first 24 h tendency of the operational daily forecasts. For this reason, even the initial 24 h pattern correlation is noticeably less than unity in the following presentations (Fig. 6a). The OLR anomaly is defined as a deviation from the climatology. Here, the climatology is defined as an average over the years 1979–2009 for each given calendar day.
2.4.2 The 150 hPa stream function
To examine the association of the MJO with the vorticity field (or rotational flow), we take the 150 hPa stream function, as already discussed at the beginning of Sect. 2.2.
2.4.3 Verification
In the following, the forecast performance is evaluated by inspecting the time–longitude section of the OLR and the stream function averaged over 15∘ S–15∘ N, considering the fact that the MJO is a longitudinally propagating feature. When latitudinal interactions between the MJO and higher-latitude Rossby waves are concerned, time–latitude sections are examined instead. In the present study, we emphasize the importance of the visual inspection of the forecast performance to compare it with the analysis. In the following, very specific descriptions of the forecast behaviours in comparison with the analysis or a control forecast will be presented, because we believe that these details are the key to understanding the actual processes simulated by these forecasts.
As a basic point of reference, the correlation is computed between the analysis and a forecast over the longitudinal range from 0 to 180∘ E between 15∘ S and 15∘ N. This correlation will be referred as a “pattern correlation” in the following. We adopt this measure because it is a straight manner of comparing the two fields (analysis and forecast) over the tropics without imposing our prejudices of expectations.
Table 2List of sensitivity experiments at TCo639 with 137 vertical levels. The columns show the categories according to Table 1, the label used in the text, the experiment description and the forecast cases (standard and extended).
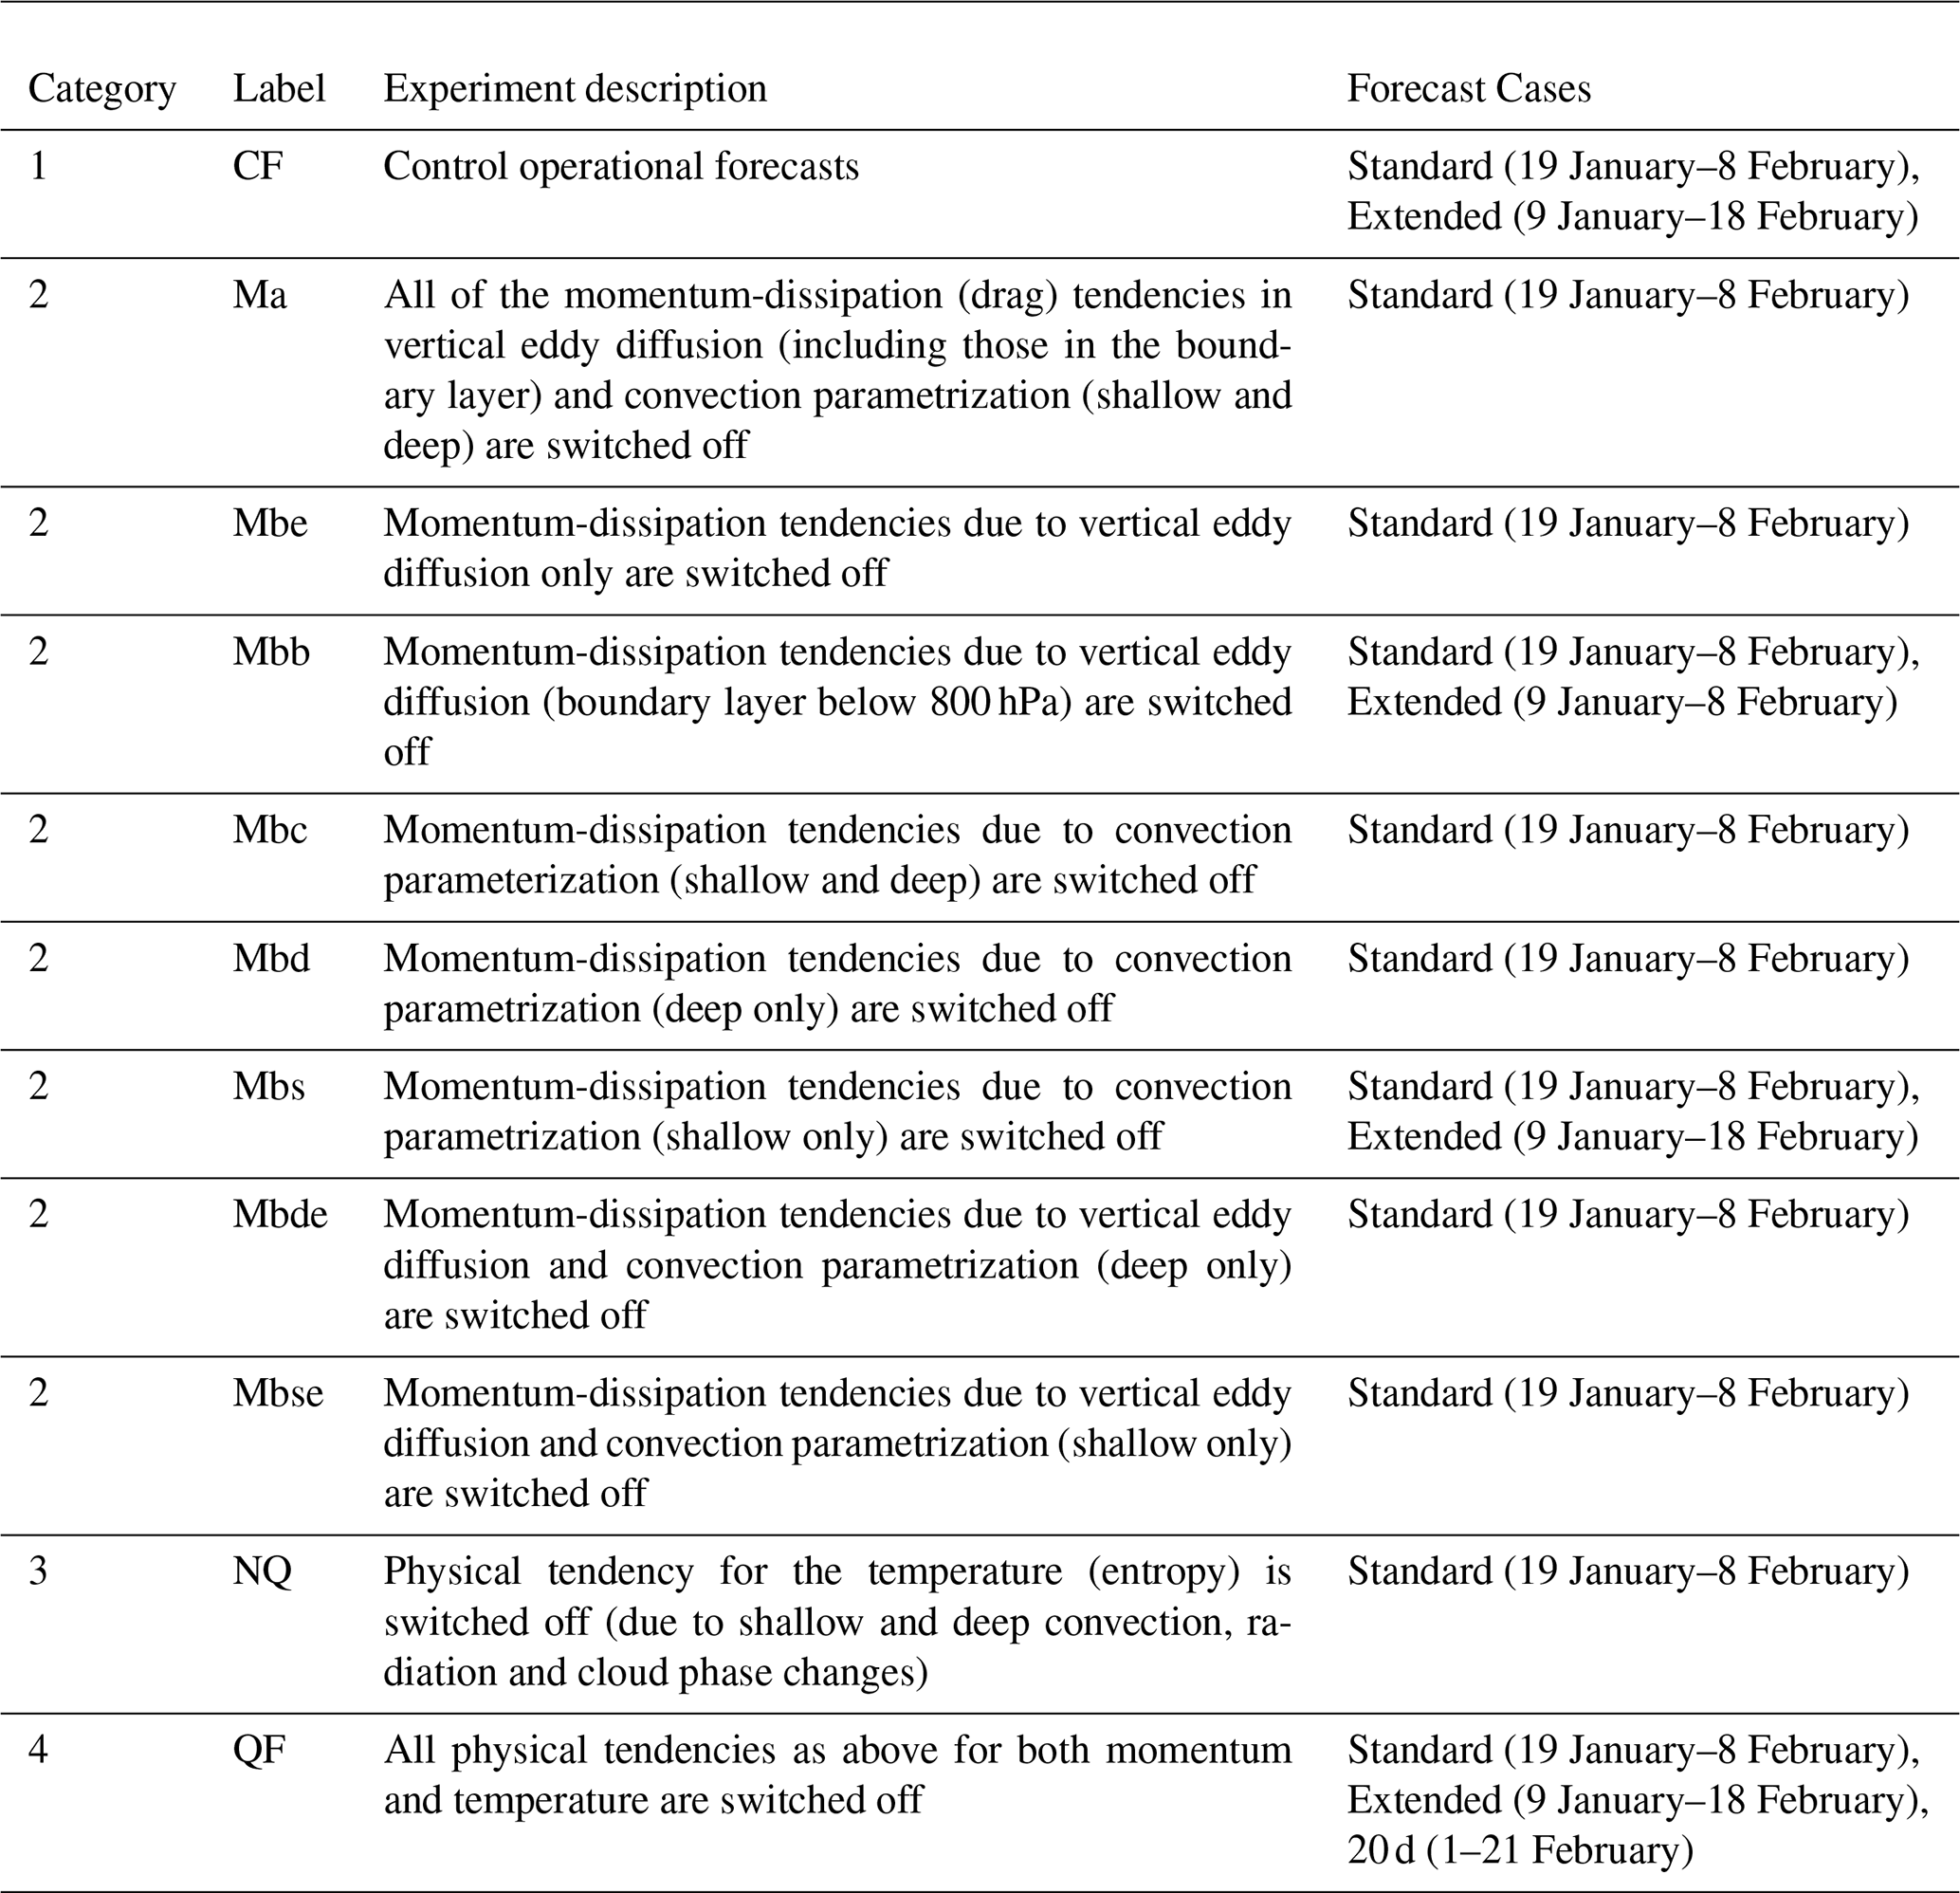
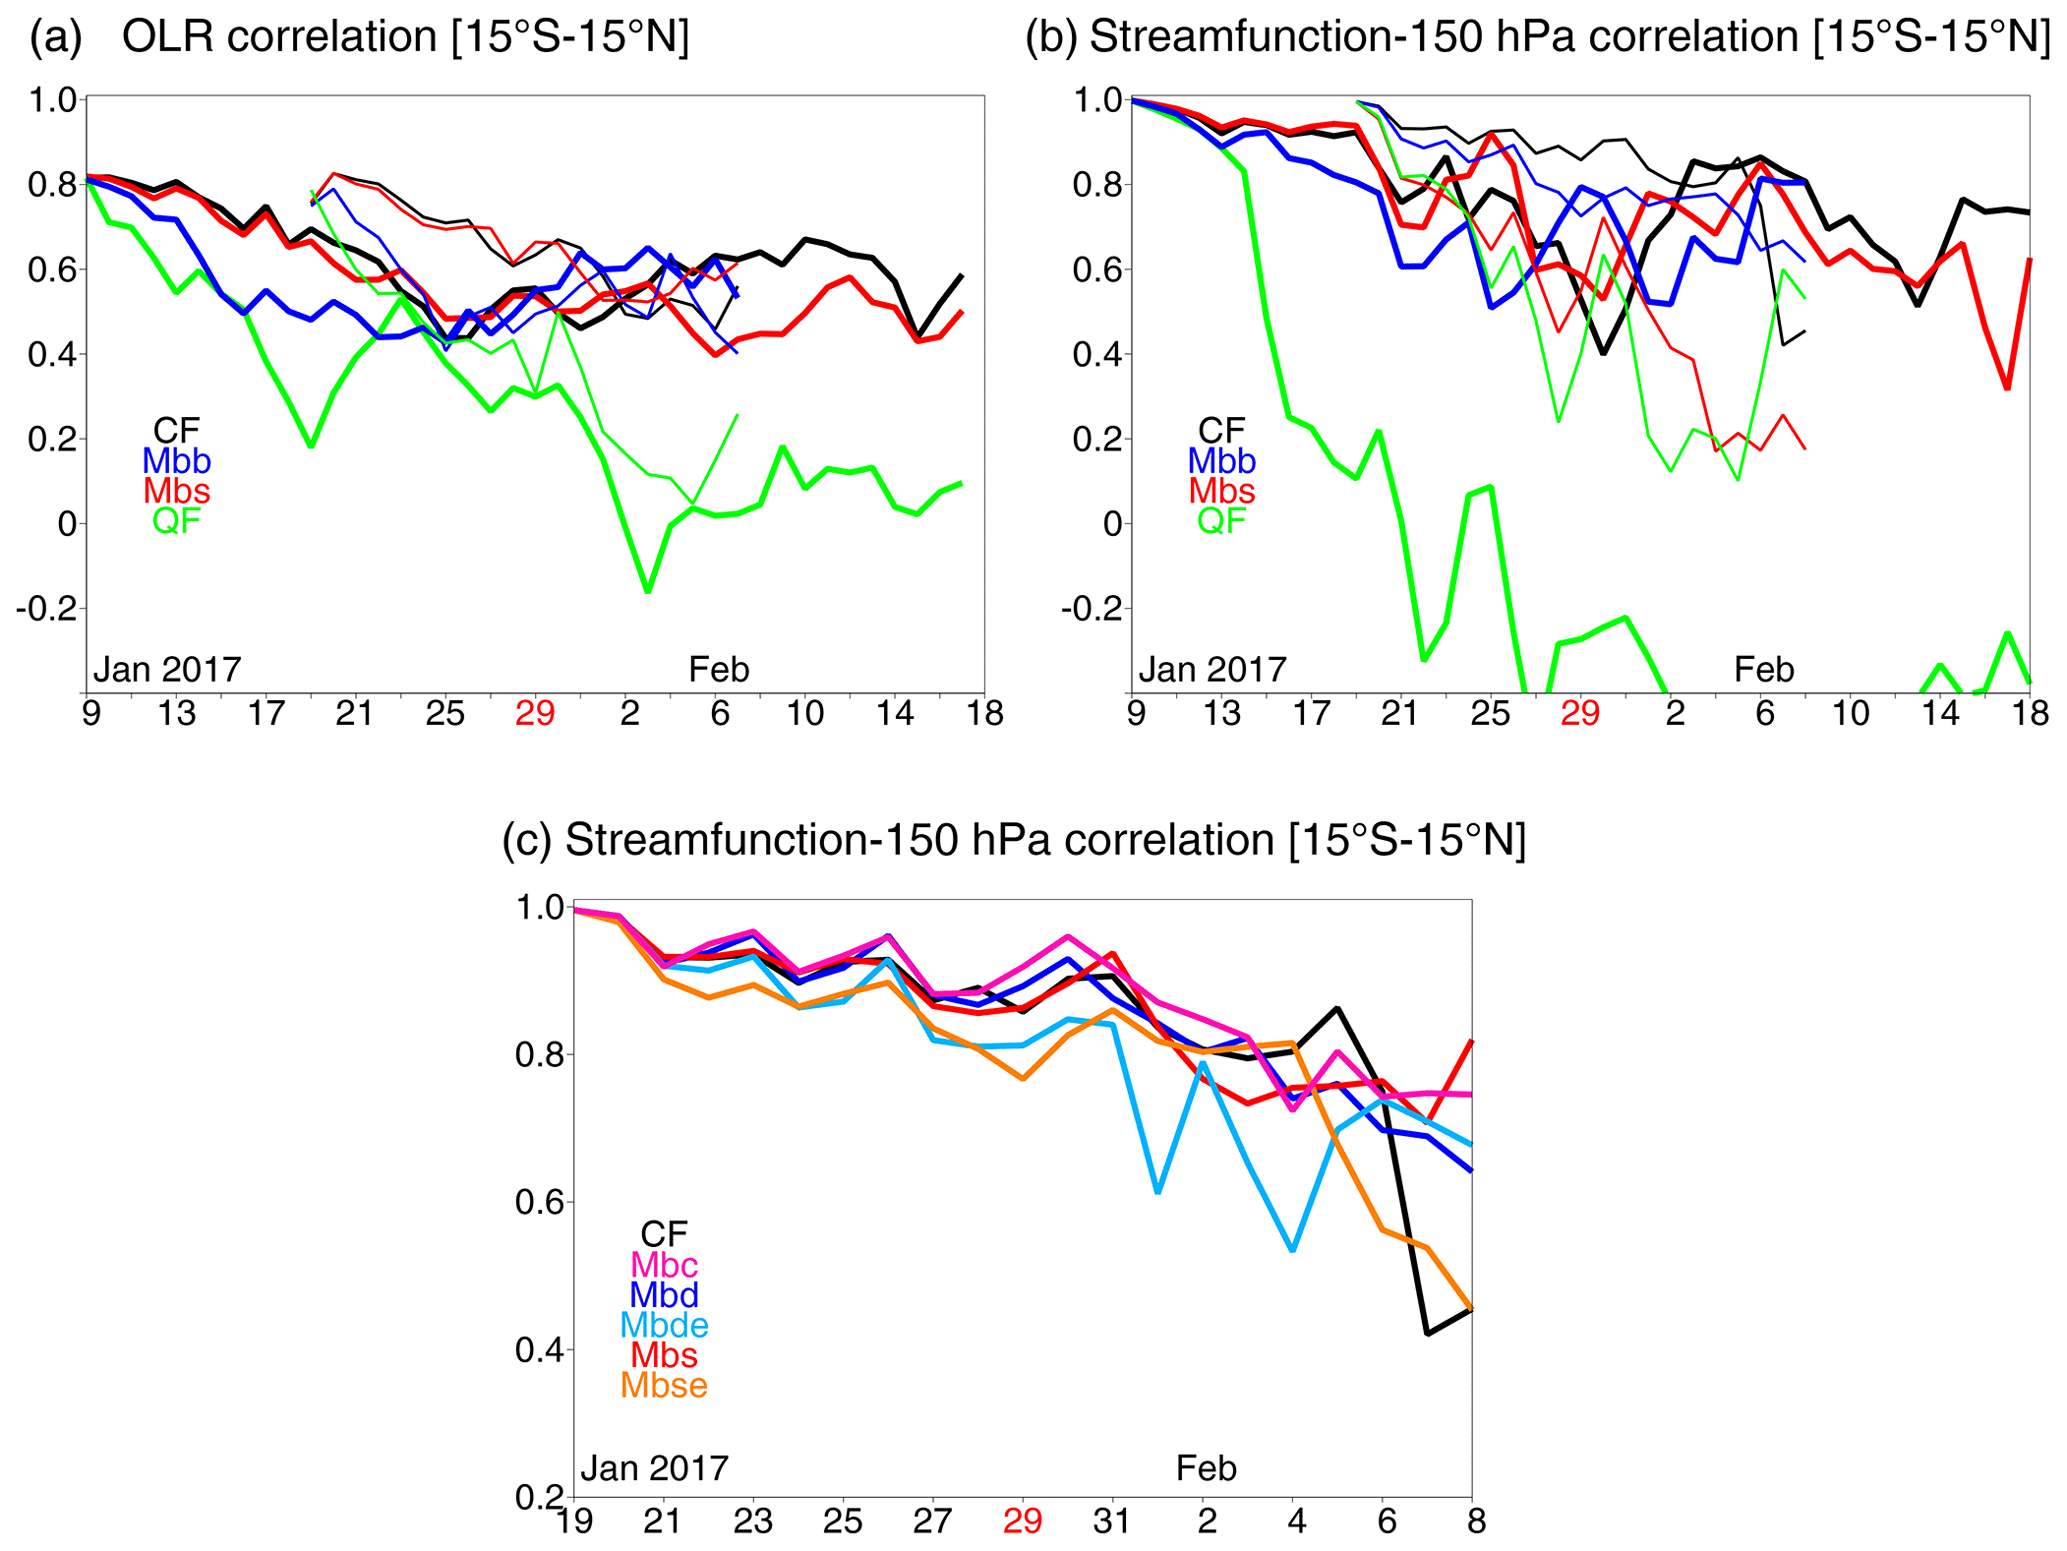
Figure 6Time series of pattern correlations between the forecasts and the analysis over the longitudinal bands between 15∘ S and 15∘ N for (a) OLR and (b, c) the 150 hPa level stream function. The cases shown in panels (a) and (b) are CF (black), Mbb (blue), Mbs (red) and QF (green); the cases shown in panel (c) are CF (black), Mbc (pink), Mbs (red), Mbd (blue), Mbde (light blue) and Mbse (orange). The standard 20 d and the 40 d extended forecasts are shown by thin and thick curves respectively.
Additionally, evolutions of forecasts in the phase space of the real-time multivariate MJO (RMM) index pair (Wheeler and Hendon, 2004) are also presented for selective cases. Here, the RMM index pair is evaluated by projecting the temporal anomaly defined as a deviation from an average over a forecast period. Note that unlike the pattern-correlation analysis, the RMM measures a forecast skill with respect to a prescribed field pattern. This specific design becomes a key limitation of RMM (see Straub, 2013).
3.1 Summary of forecast experiments: the pattern-correlation analyses
The time series of pattern correlations between the forecasts and the analysis in Fig. 6 summarize the experiment results. The anomaly field is considered for the statistics of the OLR, whereas the zonal mean is taken out of the 150 hPa stream function. The first step of verifying the performance of the sensitivity experiments would be to examine how well the convective variability associated with the MJO is predicted by these experiments. The pattern correlations between the simulated OLR and the analysis are shown in Fig. 6a. The same is shown in Fig. 6b for the rotational wind field (150 hPa stream function). Figure 6c is the same as Fig. 6b but focuses on the role of convective frictions (see Sect. 3.3.2).
As another summary of the forecast performances, Fig. 7 present RMM analyses for some selective cases. Here, Fig. 7a and b show the evolution trajectory of the analysis data on the RMM phase space over the standard and extended forecast periods respectively. Evolution of the MJO is represented by a counter-clockwise movement of a trajectory in this phase space, with an initial point marked by a red circle, as seen in both frames. Note that although the extended forecast period contains the standard forecast period as a part, the two trajectories for the ERA5 analysis do not match exactly over the same period due to the different definitions of the temporal anomaly used (defined relative to an average over a selected forecast period). These two trajectory patterns are to be compared with those of sensitivity experiments and control forecasts as a verification. However, the aforementioned mismatching fundamentally limits the applicability of the RMM analysis in the following.
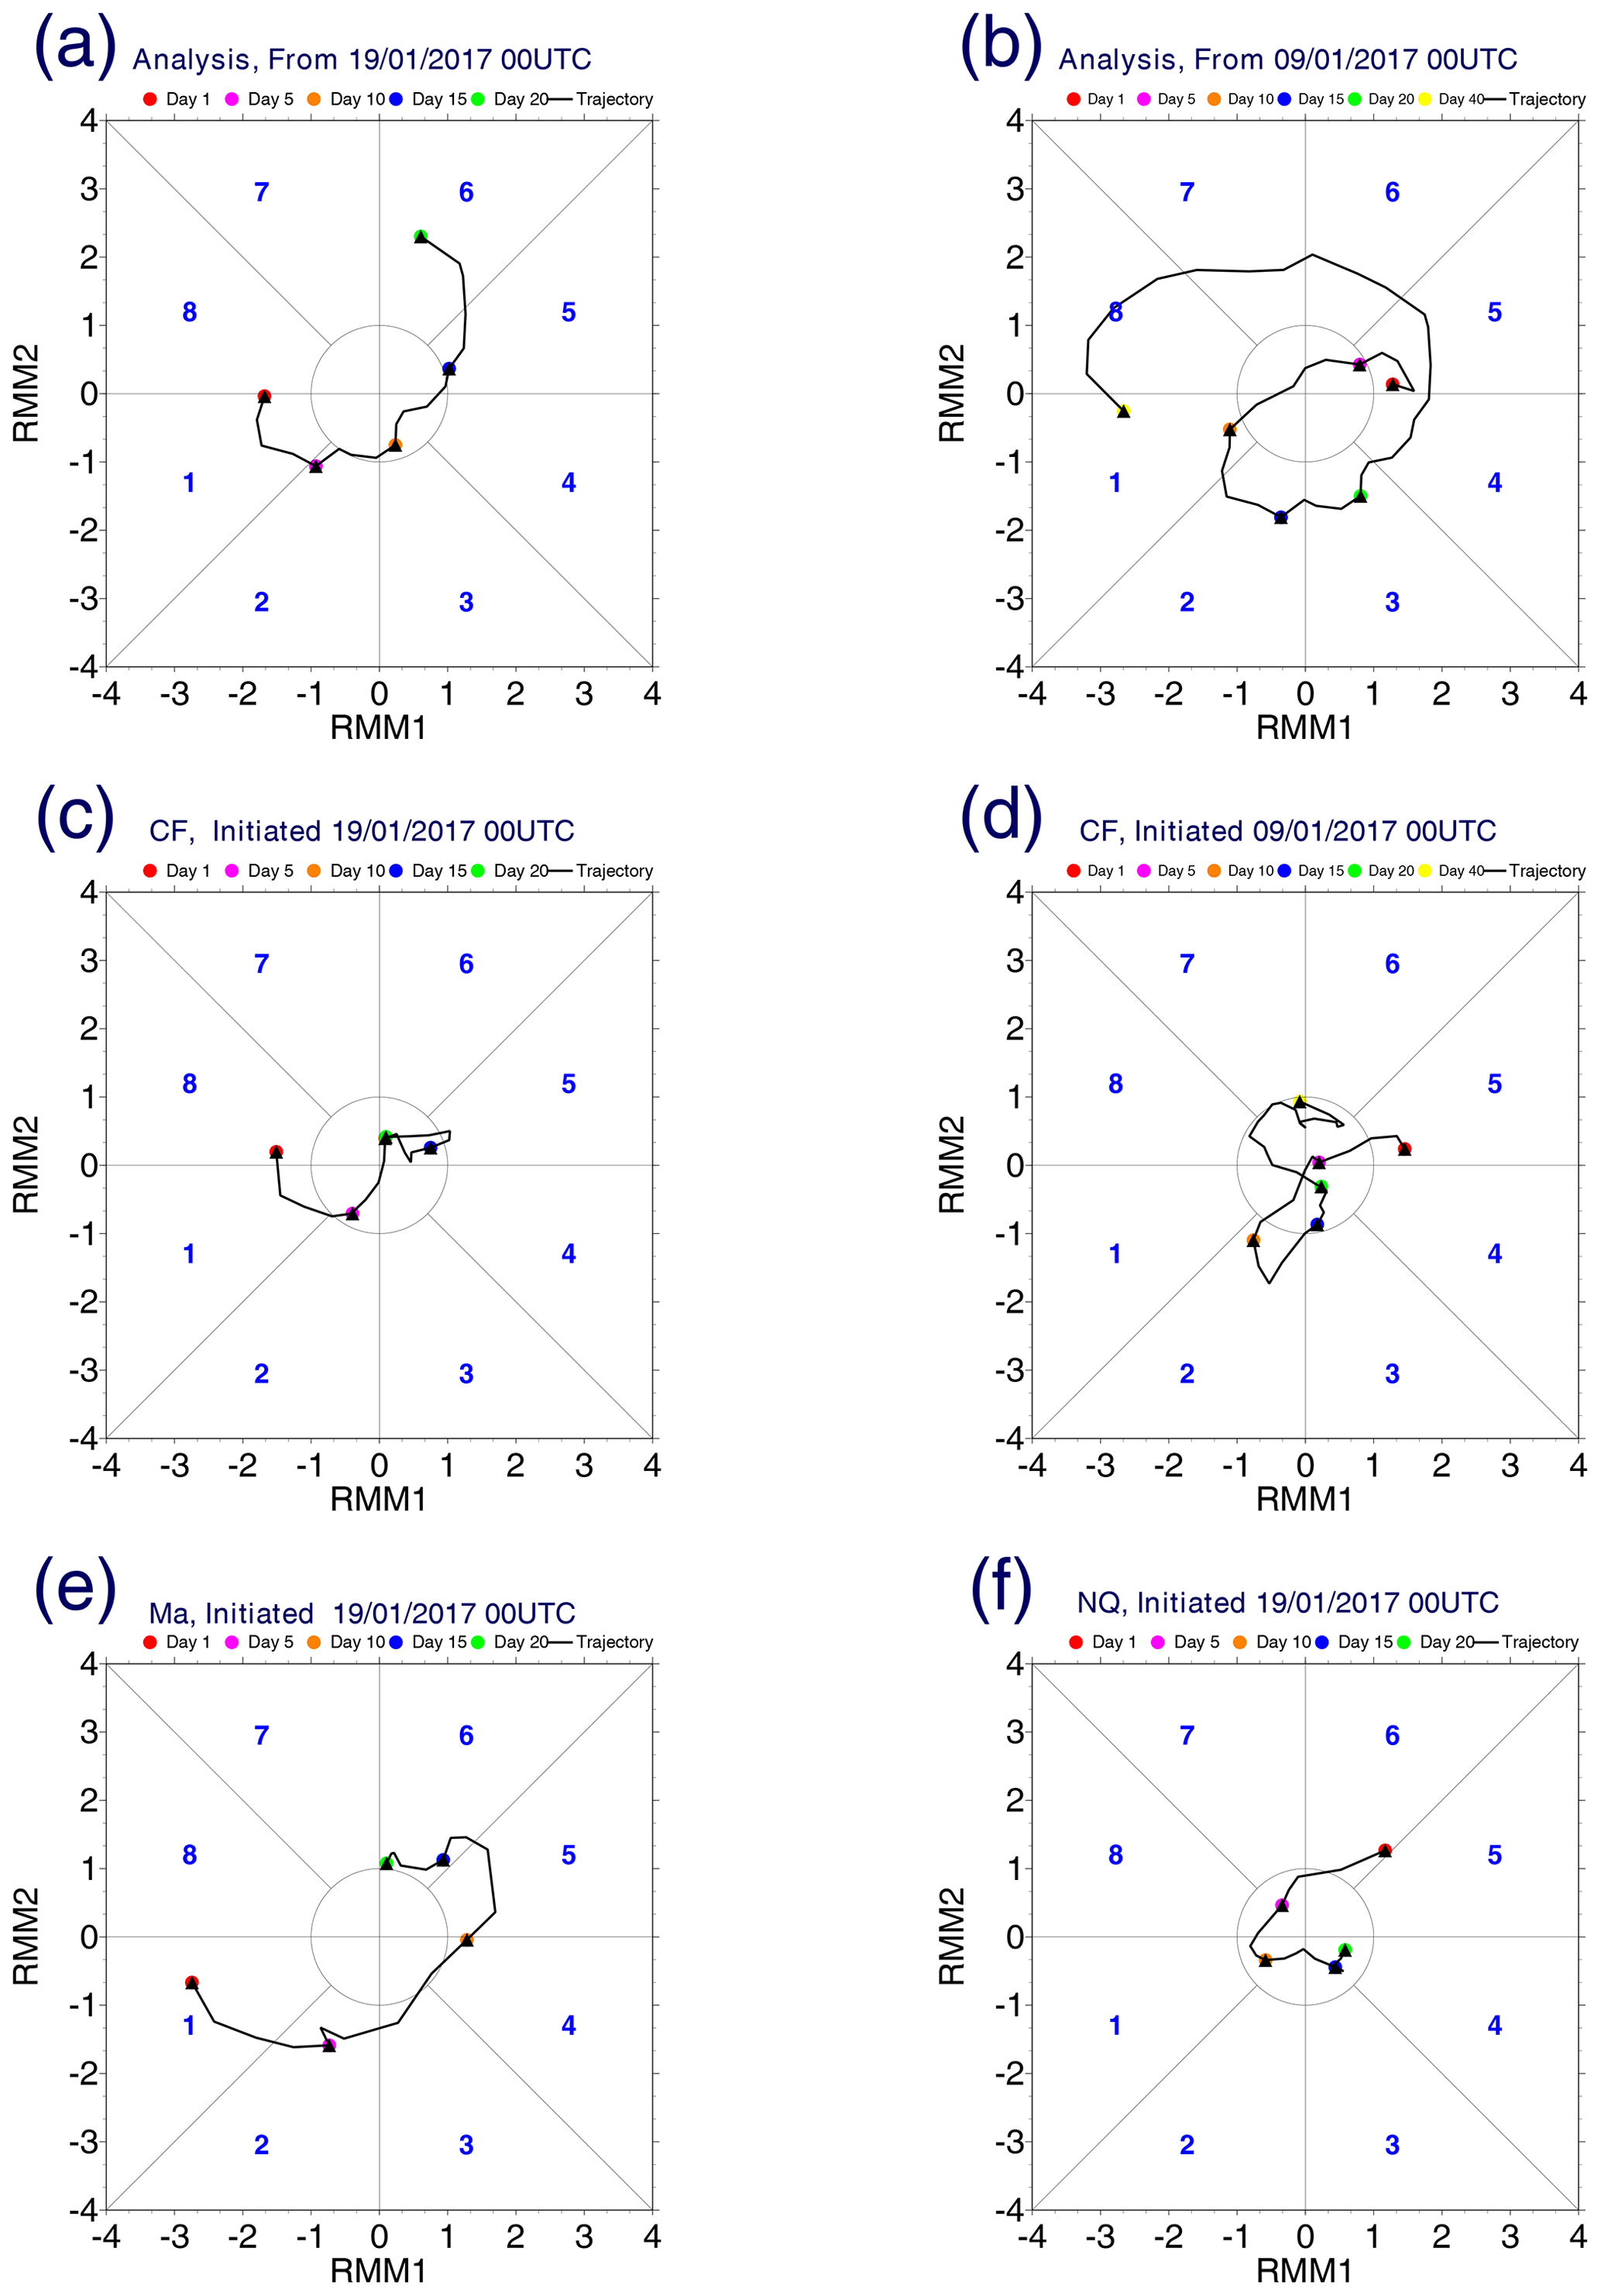
Figure 7RMM plots for the analysis (a, b) and for control forecasts (c, d) for the standard (a, c) and the extended (b, d) forecast cases. The Ma (e) and NQ (f) cases for the standard forecast are also shown.
The remainder of this section proceeds as follows: morphological behaviours of the control forecasts are carefully described in the next subsection (Sect. 3.2), because they provide baselines for interpreting subsequent runs that have selected physics turned off. The following two subsections (Sects. 3.3 and 3.4) look for improvements in the MJO forecasts by removing momentum dissipation as well as diabatic heating effects, as would be expected from the free nonlinear Rossby wave theory. As it turns out, the performance of the MJO forecasts does not depend on these choices of physics in any consistent manner: less momentum friction does not necessarily lead to a further improved MJO forecast, but the skill and MJO propagation sensitively depends on the type of dissipation turned off. The effects are also hardly additive, but nonlinear interactions are clearly occurring between the physics. Thus, contrary to the original motivation stated in Sect. 1, the main purpose of these two subsections becomes a report of these forecast sensitivities in more detail. Careful descriptions will also reveal that improvements in the MJO forecast are hardly a monotonic measure: certain aspects are improved, but this is often associated with the deterioration of other aspects. Section 3.5 focuses on the model performance with respect to simulating interactions between the MJO and higher-latitude Rossby wave activities. Here, we find a consistent tendency for the model to simulate those interactions' features identified in the analysis rather well, although some sensitivities inevitably emerge.
3.2 Control forecasts (CFs)
3.2.1 Standard 20 d control forecast
With the standard 20 d control forecast (CF), the initial 0.7 pattern correlation of OLR with the analysis linearly decreases to 0.5 approximately at the end of the forecast (thin black curve in Fig. 6a). Inspection of the time–longitude section (Fig. 2b) reveals that although the convective variability is persistent in the simulation, it is too stationary (lack of propagation), and as a result, it loses a pattern correlation with the analysis with time (see Fig. 2a).
The standard CF presents a rather high pattern correlation of the 150 hPa stream function with the analysis above 0.8 for the first 16 d (thin black curve in Fig. 6b and c). However, this high pattern correlation turns out to be rather misleading, because a direct inspection of the time–longitude plot (Fig. 3b) reveals that the predicted stream-function signal is much weaker than that reported in the analysis (Fig. 3a). The onset of the anticyclonic vorticity signal centred around 100∘ E on 29 January is correctly predicted, leading to a high pattern correlation, but with a much weaker amplitude, and the signal suddenly dies out on 4 February associated with a sudden drop in the pattern correlation.
As expected from the description so far, the MJO signal as defined by RMM index (Fig. 7c) rapidly decays in the standard CF, and the forecast skill is totally lost in less than 10 d.
3.2.2 The 40 d extended control forecast
When the experiments are initialized 10 d earlier (9 January), the forecast is expected to be harder, because it corresponds to the final stage of the previous MJO, and the next MJO to be predicted has not yet initiated (see Fig. 4a). The pattern correlation of the OLR gradually decreases to 0.4 over 20 d with CF (thick black curve in Fig. 6a). However, from this point, the pattern-correlation value begins to gradually recover, and it exceeds that of the standard 20 d forecast on 2 February, increasing to above 0.6 by 4 February.
Some possible interpretations are inferred from the time–longitude section (Fig. 4b). The last phase of the previous MJO consists of a westward-propagating cloud cluster over the western Pacific, partially driven by the linear Rossby wave dynamics. In the extended CF, this westward-propagating cloud cluster continues to propagate into the Indian Ocean, although it dissipates out in the analysis. The continuous westward propagation effectively simulates the initiation of the new MJO, as observed. The termination of this cloud cluster on 26 January coincides with the initiation of a new cloud cluster to its east. The new cloud cluster is also more persistent than the observed counterpart, which, in turn, contributes to a recovery of the pattern correlation. It is speculated that the persistence of this cloud cluster is helped by a persistent anticyclonic signal over the same region, which is successfully predicted, albeit with a 4 d delay of onset (Fig. 5b). The simulation predicts the initiation of another convectively active phase on 11 February, as observed. However, this convective variability turns out to be more active and persistent than observed.
According to Fig. 7d, the MJO signal defined by the RMM initially decays rapidly over the first 5 d. However, the forecast skill gradually recovers towards the end of the forecast by following a circle marked in the phase space (corresponding to the standard deviation of a climatological RMM index pair).
3.3 Forecasts sensitivities on friction
Forecast performance sensitively changes by turning off some physical processes. We initially focus mostly on the standard 20 d forecasts to elucidate various aspects; we then briefly remark on the 40 d extended forecasts.
3.3.1 Momentum dissipation
Performance of the forecasts for the MJO rotational field sensitively depends on the choice of momentum-dissipation terms. This subsection discusses the overall aspect. The next subsection focuses more specifically on convective friction. The first case to be considered is when the total tendency for the momentum dissipation (both eddy diffusive and convective: Ma) is turned off. The time–longitude section (Fig. 2c) shows that the eastward propagation structure of convection is better simulated than by CF. However, convection also becomes too strong compared with the analysis. More significantly, a clear-sky area (60–70∘ E) behind the MJO convective variability seen in the last 8 d in the analysis (but absent in CF) is successfully predicted in this case. The RMM analysis (Fig. 7e) also shows that the Ma run evolves around a well-defined counter-clockwise circle with a large radius in the phase space.
Turning off the vertical-eddy momentum dissipation both totally (Mbe; Fig. 2d) and only in the boundary layer (BL, below 800 hPa: Mbb; thin blue curves in Figs. 6a and b, 2e) leads to similar results. Inspection of their time–longitude plots shows that the eastward propagation tendency is better simulated by these two cases (Mbe and Mbb) than when the momentum dissipation (drag) is totally turned off (Ma; Fig. 2c). Intensity of convection also decreases to a reasonable level, also presumably contributing to slowing down the propagation (see Seo et al., 2009).
Inspection of the time–longitude sections of the 150 hPa stream function for those cases reveals that the anticyclonic variability associated with the MJO event is better simulated by these cases than by CF: the emission of the Rossby wave energy from the west during 22–28 January is speculated to be a major source (e.g. for initiating the anticyclonic signal associated with the MJO by the time–longitude plots; Fig. 3c for Ma). However, the wave structure to the west of the MJO anticyclone is exaggerated compared with the analysis: it may be interpreted as a westward propagation of a free Rossby wave. A similar feature in the rotational wind field as in Ma is also identified with Mbb (Fig. 3d), although in a more intermittent manner. The forecast performance of these cases for the 150 hPa stream function in terms of the pattern correlation is, however, not any better than the CF case, as seen in Fig. 6b.
3.3.2 Convective friction
Turning off the convective friction tends to prolong the predictability of the MJO signal substantially, as seen with the rotational wind field in Fig. 6c for the standard 20 d forecasts: a pattern correlation is typically maintained at a relatively high value (ca. 0.8) until the end of the forecast, in contrast to a sudden drop in the pattern correlation with CF (down to ca. 0.4) over the last 4 d.
When the convective friction is totally turned off (Mbc; pink in Fig. 6c), the pattern correlation is occasionally higher than the CF case even during the first 16 d of the forecast. Inspection of the time–longitude section (Fig. 3e) shows that the predicted MJO signal in rotational wind field is also comparable to the analysis (Fig. 3a). When only the shallow convective friction is turned off (Mbs; red in Fig. 6b and c), the pattern correlation remains higher during the last phase of the forecast than when the convective friction is totally turned off. In this case, the time–longitude section (Fig. 3f) reveals that the anticyclone signal over 100–120∘ E persists throughout the experiment without a break over the period from 21 to 27 January as observed.
In contrast, when only the deep convective friction is turned off (Mbd; blue in Fig. 6c), the forecast performance substantially deteriorates in the last phase. The deterioration is associated with an over-enhancement of the anticyclonic signal over the last phase (29 January to 8 February; Fig. 3g). When both deep convective and boundary layer frictions are turned off (Fig. 3h: Mbde), the second anticyclonic variability event is too strong and too spread to the west. When shallow convective and boundary layer frictions are turned off (Fig. 3i; Mbse), anticyclonic variabilities dramatically weaken. Specifically, the second anticyclonic variability is too weak and too short: terminated 4 d before the end of the forecast.
Thus, less momentum friction does not positively contribute to the MJO forecast in any consistent manner. Instead, these modifications suggest that the effects of turning off the momentum dissipation are not additive, inferring that some nonlinear interactions are occurring.
3.3.3 The 40 d extended forecasts
With the extended forecast when the shallow convective friction is turned off (Mbs; thick red curve in Fig. 6b and c; Figs. 4c and 5c), the behaviour of the 150 hPa stream function (Fig. 5c) is generally similar to that of the standard CF, except for some precursors for the anticyclonic signal leading to the new MJO event and a redevelopment of the anticyclonic variability towards the end of the forecast. When the boundary layer friction is further turned off (Mbb; 30 d in blue, Figs. 6b, 4d and 5d), the initial anticyclonic variability continues about 6 d longer than observed, and the second anticyclonic variability is also initiated 1–2 d later than observed (Fig. 5d). Its precursor, albeit weak, already has a good pattern correlation with the analysis.
These extended forecasts may be generally interpreted as suggesting that turning off the momentum friction contributes to an improvement in the MJO forecast overall. However, the further removal of the momentum friction in the boundary layer (Mbde and Mbse; light blue and orange in Fig. 6c respectively) slightly reduces the forecast performance.
An initial phase of forecast of the rotational wind field (vorticity field) is easier when the experiment is initiated 10 d earlier, because the initial condition corresponds to the maximum of the anticyclone signal (centred at 100–120∘ E) associated with the previous MJO (Fig. 5a). A gradual decay of the pattern correlation (with this anticyclonic signal) over the next 4 d is reasonably predicted by CF (Fig. 5b), as well as the cases without shallow convective friction (Mbs; Fig. 5c) and without boundary layer momentum dissipation (Mbb; Fig. 5d).
However, further analysis suggests that the 40 d extended CF simulates the rotational field associated with an MJO for an incorrect reason: a dipolar vortex structure, constituting an analogue to the analytical nonlinear modon solution, is formed by the Northern Hemisphere anticyclone with a well-isolated cyclone further north rather than with a Southern Hemisphere counterpart. The same interpretation also applies to the Mbs case.
3.4 Free dynamics experiments
This subsection gradually turns off more forcing and dissipation terms so that the system may gradually approach a state of free dynamics.
We first turn off diabatic heating totally (NQ) so that the vortex dynamics is no longer coupled with convection. Unsurprisingly, the pattern correlation steadily decreases with time approximately linearly to 0.2 towards the end of the standard forecast. The inspection of the time–longitude section of the 150 hPa stream function (Fig. 3j) shows that the rotational wind field at this level decays fairly rapidly without diabatic heating but leaves a small-amplitude wave field. It may be worthwhile emphasizing that the decay process of the anticyclonic signal from the previous MJO is fairly realistic in this forecast, although arguably slightly too fast. A subsequently generated weak wave field may also be worth mentioning: the cyclonic signal centred around 220–250∘ E amplifies realistically as observed and then leads to a westward propagation, presumably as free linear Rossby waves, which turns into a anticyclonic signal around 170∘ E and continues to propagate westward. On 31 January, the anticyclonic signal arrives at 100∘ E. We speculate that it contributes to a significant recovery of the pattern correlation (to approximately 0.6 compared with the value of 0.2 that was seen 2 d earlier). These relatively positive evaluations of the NQ forecast are supported by the RMM analysis (Fig. 7f): it evolves around a well-defined counter-clockwise circle, albeit with a relatively small radius.
When the momentum friction is further turned off (QF), the OLR signal decays over the first few days (ca. 4 d; Fig. 4e) with the 40 d extended forecast. Although some pattern correlations persist beyond this point, this is only achieved by a very weak OLR signal being predicted. With the standard forecast of QF (thin green curves in Fig. 6a and b), rather non-intuitively (despite the lack of momentum dissipation), the westward-propagating Rossby wave signal decays much faster and the amplitude is weaker (Fig. 3k) than the case without the momentum friction turned off (NQ) – by about a factor of 3. As a result, the pattern correlation with the analysis also becomes slightly smaller (by 0.1–0.2). A similar behaviour is also seen with an extended run (QF; Fig. 5e).
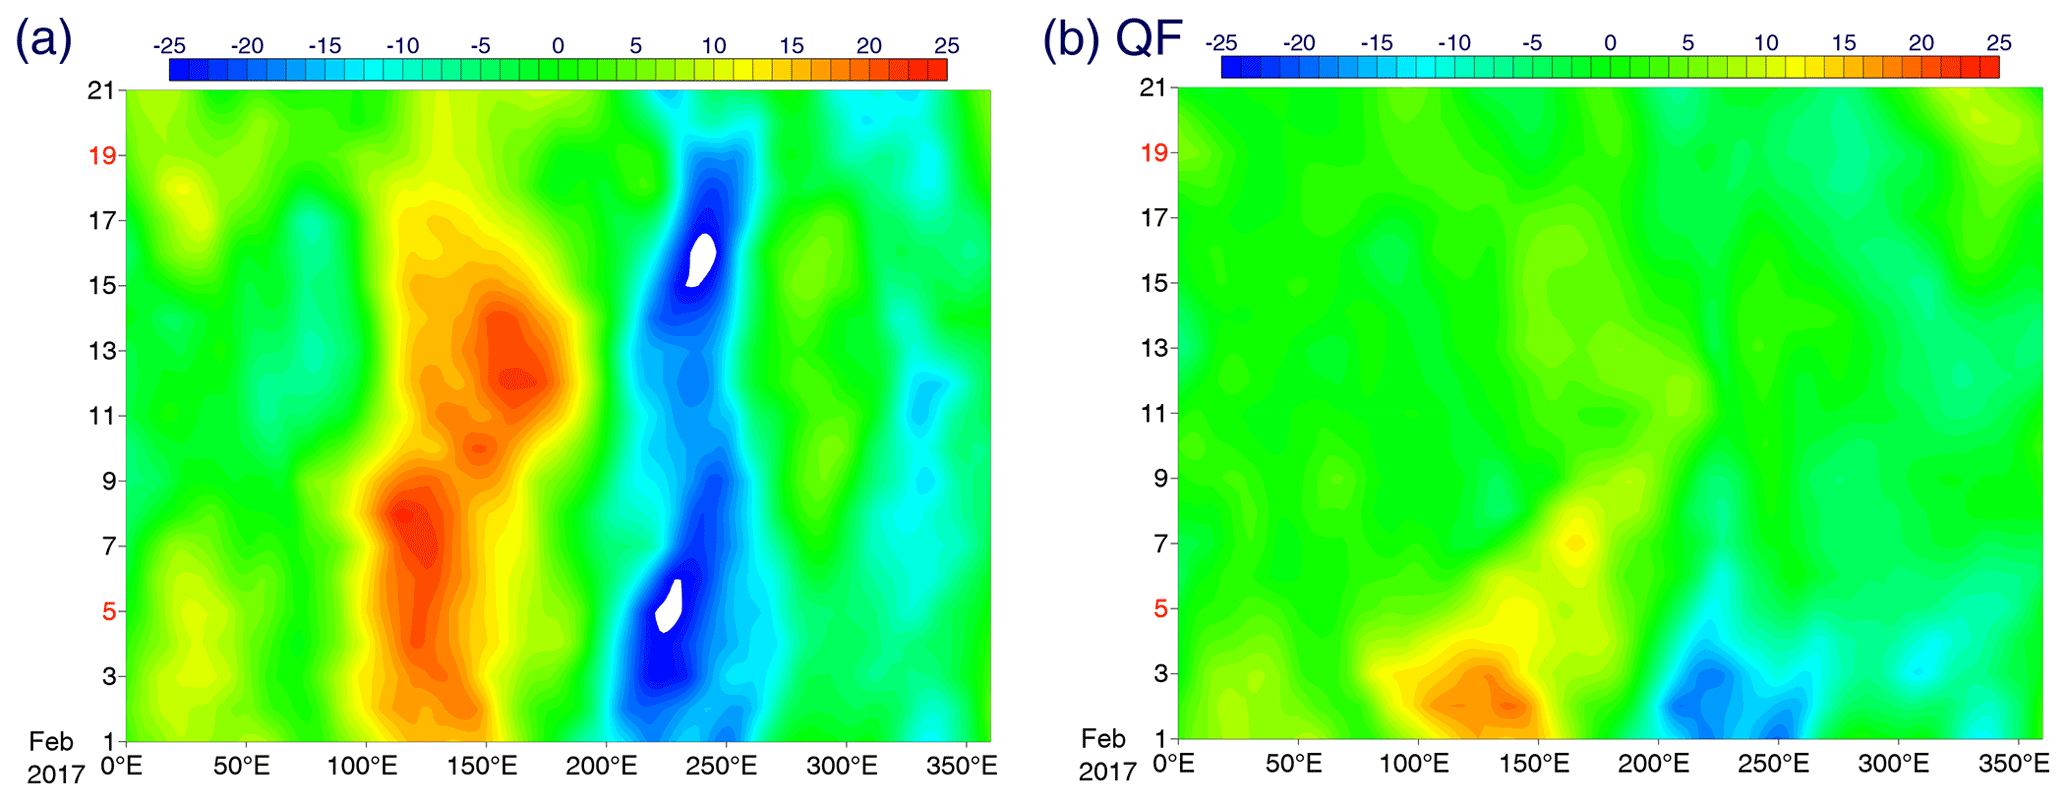
Figure 8Time–longitude sections of the 150 hPa stream function along the Equator (15∘ S–15∘ N) for the 20 d period from 1 February: (a) analysis and (b) QF.
A final experiment to test the idea of free MJO dynamics is initiated on 1 February 2017 (QF), when a vorticity pair associated with the MJO is already fully developed, as seen in the analysis (Fig. 8a). Thus, this experiment examines whether it is possible to forecast the eastward propagation of this vortex pair even without convection. At this phase, convection is no longer very active. The quasi-free forecast of the 150 hPa stream function for 20 d is shown in Fig. 8b. The result is rather disappointing in the sense that the vortex pair rapidly dissipates over the first few days. This suggests that dissipation in the model is still not removed as well as we intend. Nevertheless, a rather surprising behaviour is the eastward propagation of the vortex pair, as expected for nonlinear solitary Rossby waves and the opposite to the propagation direction expected for linear Rossby waves. However, the propagation speed of this decaying vortex pair is much faster than the speed found in the analysis.
3.5 Possible intrusion of an extratropical Rossby wave train: standard 20 d forecasts
Some studies (Hsu et al., 1990; Gustafson and Weare, 2004; Ray and Zhang, 2010; Ray and Li, 2013; Zhao et al., 2013; Wang et al., 2019) have suggested that the intrusion of a Rossby wave train from the Northern Hemisphere to the tropical region can initiate an MJO.
The analysis of a standard 20 d forecast period finds such an example from 20 to 27 January, as depicted in a time–latitude section for the 150 hPa stream function averaged over 20–60∘ E (Fig. 9a): a negative stream-function signal (cyclone) arrives from 80 to 30∘ N over a time duration of about 5 d. An inspection of this time–latitude section gives the impression that the arrival of this signal at 30∘ N helps to revitalize and sustain the anticyclonic signal centred at 15∘ N longer. As its eastward extension is considered the MJO, it leads to the interpretation that the arrival of such a Rossby wave train helps to initiate the anticyclonic variability (vortex pair) associated with the MJO.
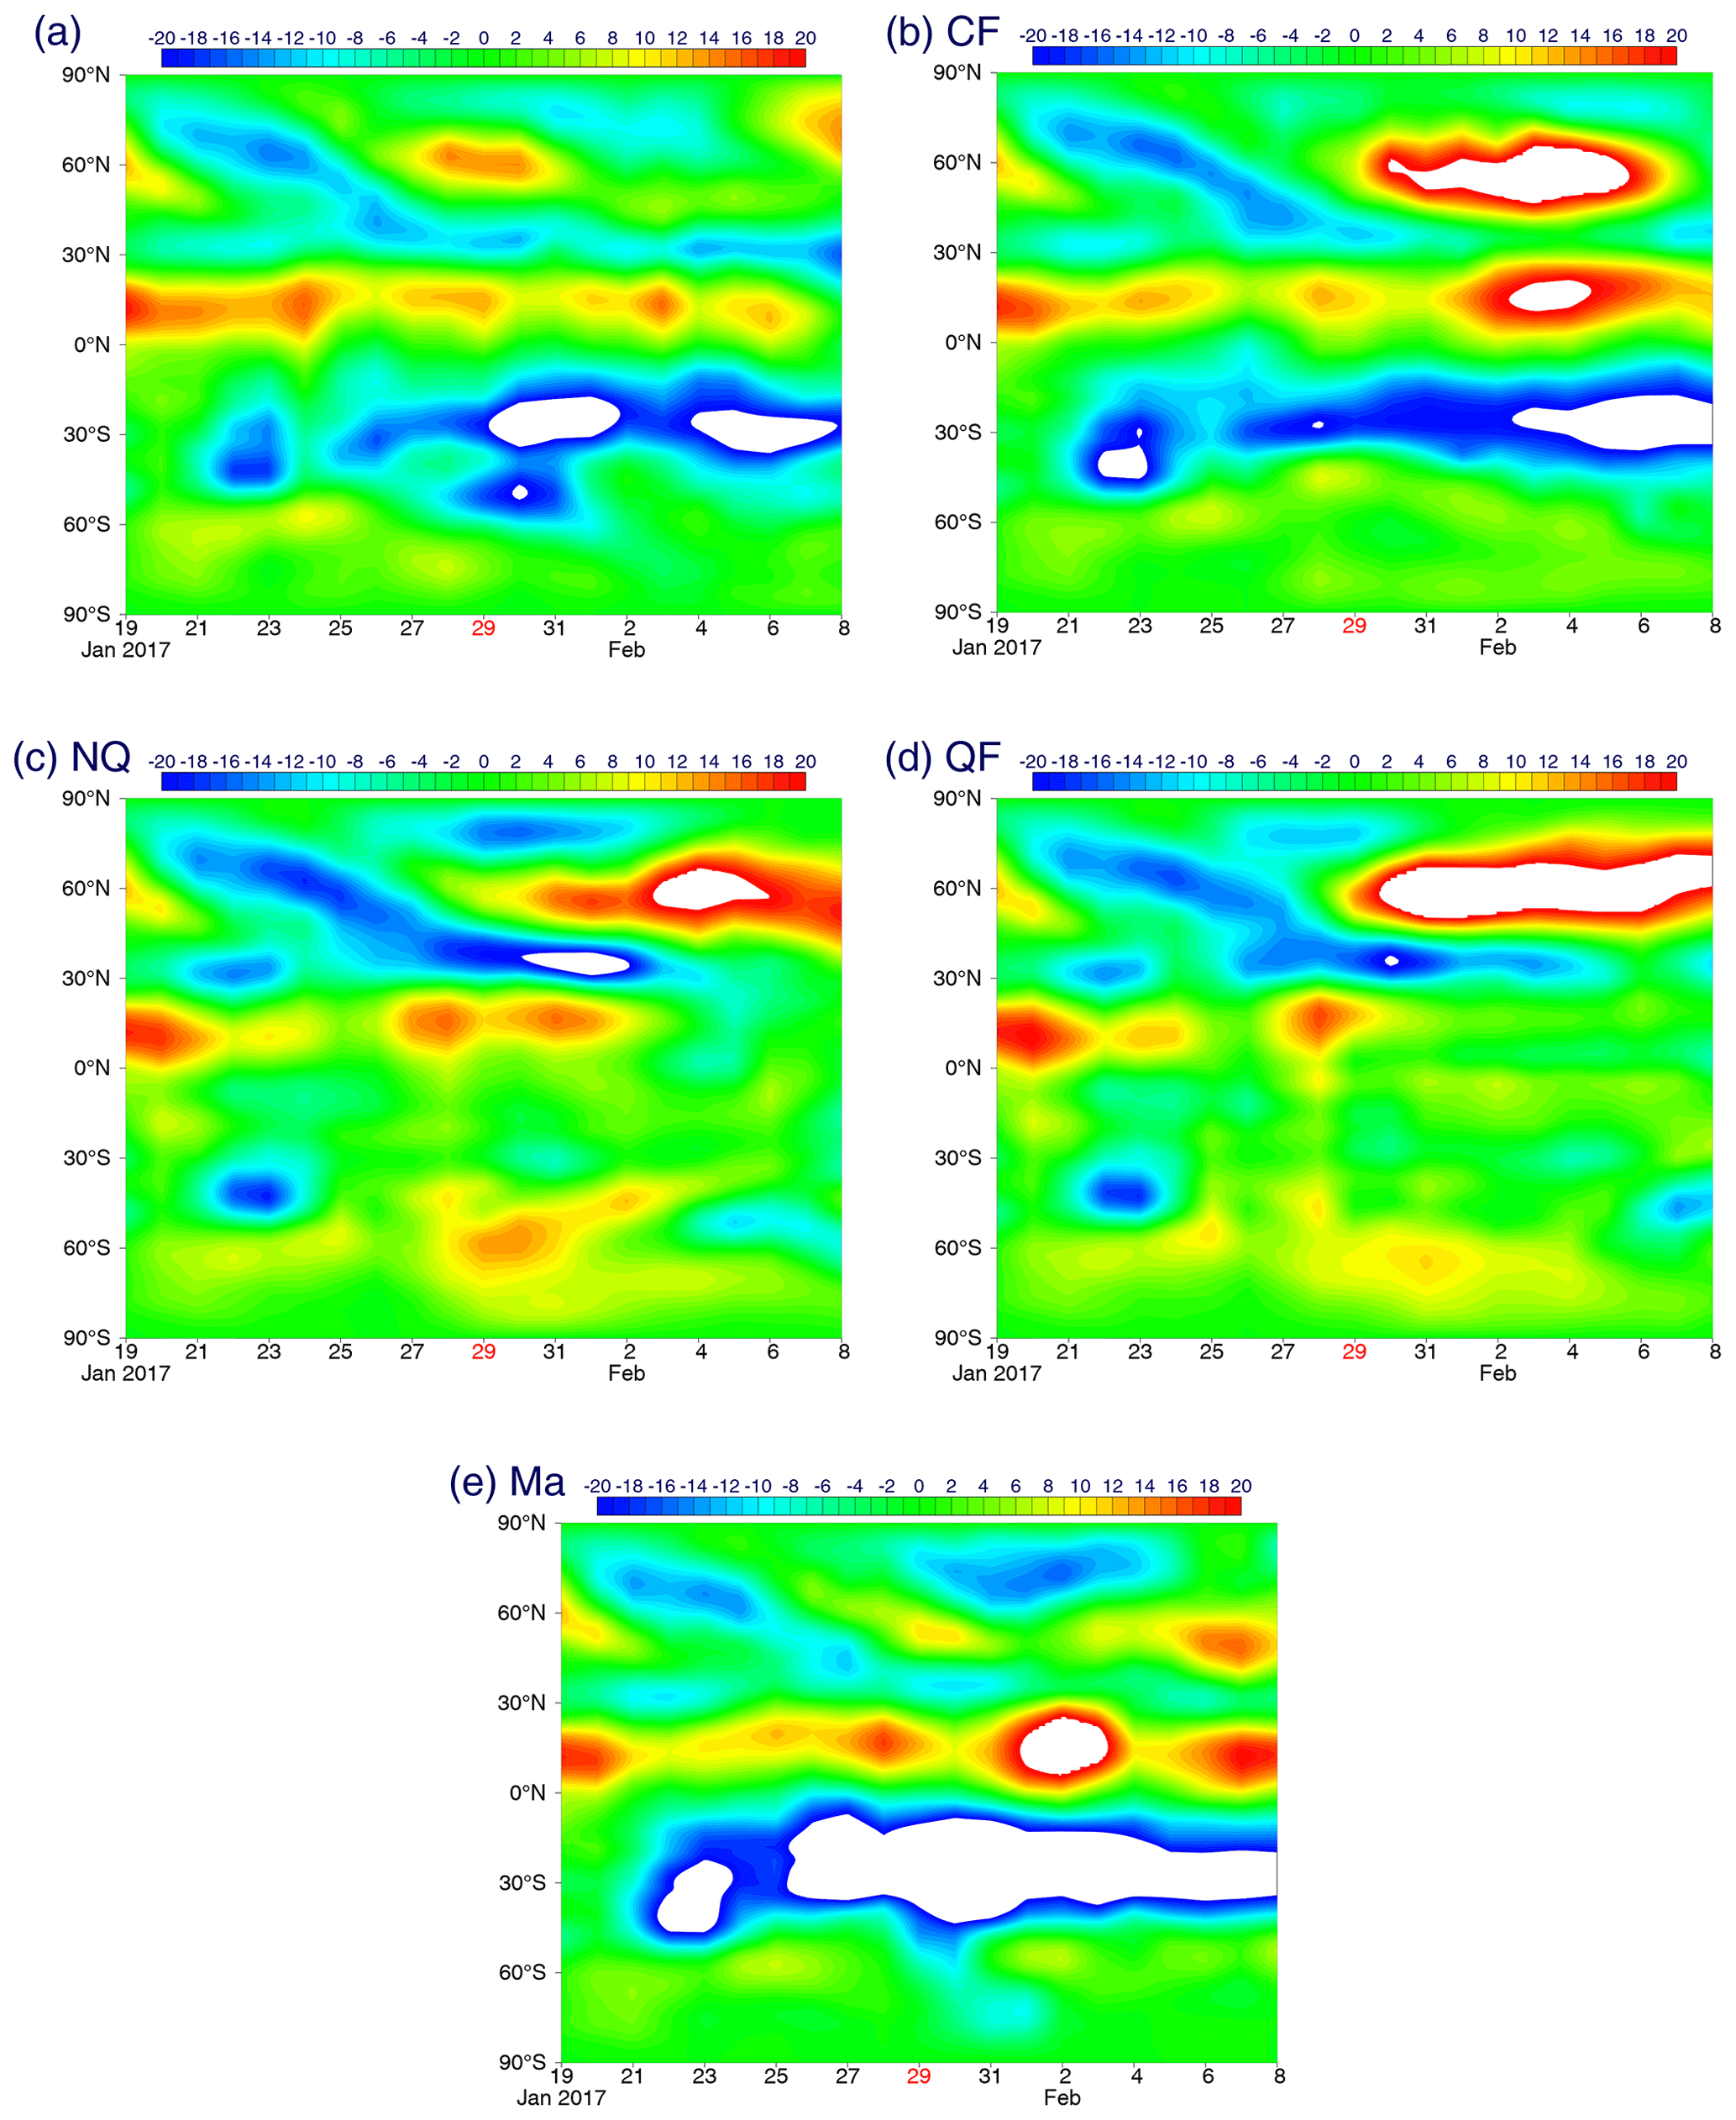
Figure 9Time–latitude sections of the 150 hPa stream function averaged over 20–60∘ E: (a) the analysis for the standard 20 d forecast period, and the standard 20 d forecasts with (b) CF, (c) NQ, (d) QF and (e) Ma.
However, the forecast experiments tend not to favour the above interpretation in terms of the Rossby wave train. To emphasize this point, the performance of the CF for the same period is shown in Fig. 9b: the arrival of the Rossby wave train appears to enhance the anticyclone over the same longitudinal range centred at 15∘ N to a higher degree than in the analysis. However, as a separate time–longitude section (Fig. 3b) shows that the anticyclonic signal associated with MJO decreases faster than observed over the same period with CF.
Three additional experiments (NQ, QF and Ma) provide further insights (Fig. 9c–e). The first is a case with all of the diabatic heating (radiation, convection and cloud physics) turned off (NQ; Fig. 9c). The second case is with both diabatic heating and all the momentum dissipation (vertical eddy transport and convection) turned off (QF; Fig. 9d). In both cases, the arrival of the Rossby wave train with a cyclonic signal to the subtropics (30∘ N) is well simulated, and the resulting cyclone signal along 30∘ N is more persistent than in CF and the analysis. Presumably, the absence of the momentum dissipation helps to amplify the cyclone signal with time along 30∘ N (QF), although it is less persistent than the case without turning off any momentum friction (NQ). In both cases, the further induction of the anticyclone signal along 15∘ N, although identifiable, is much weaker than the CF case, and it totally disappears after 3 February. Finally, when all of the momentum friction is turned off but the diabatic heating is maintained (Ma; Fig. 9e), the cyclonic signal intruding into the subtropical region (ca. 30∘ N) from the higher latitudes becomes even weaker than in the analysis. The anticyclone anomaly is induced along 15∘ N in a realistic manner without further amplification, as in the CF case.
The predictions of the rotational field in standard 20 d forecasts are reasonable overall with respect to patterns but show larger errors in amplitude. An impression is that the MJO dipole is less isolated than in the analysis; thus, the internal (non-evanescent) wave structure leads to westward propagation (or is stalled) rather than eastward.
A main motivation for the present study was to examine the extent to which the MJO can be simulated with a relatively frictionless (physically unforced) setting, which is consistent with the proposed free nonlinear Rossby wave theory for the MJO by Wedi and Smolarkiewicz (2010), Yano and Tribbia (2017), Rostam and Zeitlin (2019), and Wang et al. (2019). The MJO forecast does indeed improve when the momentum dissipation is totally removed (Ma; cf., Figs. 2c and 3c); however, the tendency is hardly consistent: the degree of forecast improvements sensitively depends on the choice of the momentum-dissipation terms that are turned off. The effects are also hardly additive, and certain nonlinear interactions are clearly going on. Most disappointingly, when all of the dissipation and forcing terms both for the momentum and the entropy are turned off (QF), the features associated with MJO disappear rather rapidly (Fig. 3k). Thus, the present study does not support the proposed free nonlinear Rossby wave theory in any consistent manner. Details on the forecast behaviour based on the choice of the physical configurations of the model have been carefully documented to record the unexpected but nevertheless important impact on MJO forecast skill.
There are several lessons to learn from the present sensitivity exercise. The first is the importance of closely evaluating the details of sensitivities of physical processes for the MJO. In typical mechanism-denial studies (e.g. Kim et al., 2011; Ma and Kuang, 2016), the physical process concerned is either totally turned off or maintained. If we would have followed such an approach, the improvement in MJO forecasts due to totally removing momentum dissipation (case Ma) would have simply been interpreted as a positive result for supporting a free wave theory. However, in the present study, the momentum-dissipation processes, arising from various different physical mechanisms, are turned off selectively to verify this initial finding in a more solid manner. As it turns out, the sensitivities of MJO to momentum-dissipation processes are not that simple. Although we are short of making any definite conclusions from our sensitivity study of the MJO on the momentum-dissipation processes, the study suggests the critical importance of examining the physical sensitivities of a phenomenon in more detail rather than simply switching off the entire physical mechanism as has been done in past sensitivity studies. Second, after examining the forecast results closely, we have realized that it is not quite straightforward to simulate a free wave dynamics expected from the theory with a complex state-of-the-art global model, as originally intended. We conclude that this difficulty stems from the need to maintain a realistic background state at the same time (see Ma and Kuang, 2016).
Discussions on some specific runs make this point clearer: with the quasi-free 40 d extended forecast (QF; Fig. 5e), the pre-existing anticyclonic variability over 100–150∘ E persists almost as long as observed (7 d), albeit with weak amplitude. A weakly eastward tendency, which is consistent with the nonlinear free wave theory, may also be noticed in this simulation. In the standard 20 d forecast case, only a reminiscence of the anticyclone signature from the previous MJO event is found around 120∘ E initially in the analysis, and this feature disappears in less than 2 d (Fig. 3b). Note that no convective variability is found in the vicinity of this longitude at the initial time of this forecast period (Fig. 2a). The quasi-free forecast (QF) maintains anticyclonic variability longer than in the analysis, albeit with a weaker amplitude (Fig. 3k).
We interpret these rather subtle results with the quasi-free (QF) forecast experiments as a demonstration of the difficulties in realizing a “realistic” free dynamics experiment. The main problem with the QF forecasts in the present study is the fact that by practically turning off “all” the physical forcings, the basic state of the model also breaks down very rapidly; thus, a proper background state that may support an MJO with free dynamics is also lost very rapidly. It also follows that a free MJO mode also dissipates out very rapidly. A more appropriate manner of performing free dynamics experiments would be to maintain a background state with full physics in place but to introduce quasi-free dynamics only to a perturbation component. The basic idea of this strategy may be understood in analogy with standard perturbation analyses. However, in the present case, perturbations must be treated in a fully nonlinear manner in order to be consistent with our anticipation that the MJO is a fully nonlinear construct. A brute force approach of nudging the model towards a climatology (e.g. Ma and Kuang, 2016) may be valid, but only when the given climatology is a correct “background state” to maintain. A more delicate procedure is required, for example, by using the emerging modelling infrastructure described in Kühnlein et al. (2019) so that any constraints on the evolving nonlinearities are removed.
The present study further suggests that the MJO predictability sensitively depends on the choice of the initial condition in a rather non-intuitive manner, although this is consistent with a clear distinction between high- and low-skill MJO events identified by Kim et al. (2016): longer forecasts from an earlier phase of the MJO may not be harder than a shorter one from a later phase. In the present study, the standard forecasts are initiated (on 19 January) from an early stage of an MJO already present; thus, a successful forecast would simply capture the subsequent development and propagation of this MJO. On the other hand, the 40 d extended forecasts are initiated 10 d earlier towards the end of a previous MJO event. Presumably, the latter is harder to forecast with respect to the MJO evolution, especially the onset of a new MJO. However, an inspection of the time–longitude section suggests a different picture: the longer 40 d extended forecasts tend to regenerate the MJO signal towards the end of the forecasts, and the forecast capacity recovers. In some cases, their performance becomes even better than the shorter standard 20 d forecasts initiated 10 d later in terms of the pattern correlations of the OLR and the 150 hPa stream function (Fig. 6).
As Nakazawa (1988) originally pointed out, the MJO typically constitutes a modulation of the westward-propagating cloud clusters which have scales of a few hundred kilometres. The 9 January, the initiation time of the 40 d extended forecasts, corresponds to the end of the previous MJO event and is also the moment that the last cloud cluster over the western Pacific begins to propagate westwards, which marks the end of this MJO event (Fig. 4a). In the 40 d extended CF (Fig. 4b), this westward-propagating cloud cluster does not die out as observed but continues to propagate westwards to the Indian Ocean, which marks an initiation of a new MJO under this forecast. Although the predicted new MJO weakens out during the middle of the event, we note a recovery of the signal towards the end of the event. These initial condition sensitivities of the MJO forecasts point to the simple fact that the onset as well as the evolution of an MJO should not be considered as isolated events and are better interpreted as a part of a chain of processes in the atmosphere. It also points to the importance of better understanding detailed processes associated with the MJO – in the present case, those of the westward-propagating cloud clusters. Standard MJO indices (e.g. RMM) fail to depict those critical details (see Straub, 2013).
The present study has also elucidated active interactions of MJOs with higher-latitude Rossby wave activities (Fig. 9). Inspections of the latitude–time sections suggest that the performance of the MJO forecasts appears, at least partially, to be helped by the successfully simulated interactions of the MJO with the higher-latitude Rossby waves (Rossby wave trains).
The MJO forecast problem is often reduced to that of convection parameterizations (e.g. Hirons et al., 2013a, b; Jiang et al., 2015, 2020b; Pilon et al., 2015). However, improvement of the MJO forecast, along with the many other forecast issues, is not a matter of fixing a single physical scheme. Rather, we need to examine a forecast model as a whole with its interacting physics for achieving this goal. The present model sensitivity study has exposed the importance of physical processes other than convection for maintaining a realistic tropical mean state and for MJO forecast skill.
The complex behaviour of the IFS model sensitively depending on the choice of the physics that are turned off, as identified in the present study, should be emphasized in its own right. For example, the role of momentum friction, in general, is not simply favourable or unfavourable for MJO forecasts. The behaviour sensitively depends on the precise type of momentum friction being turned off. In other words, the operational model behaviour is not decided by a dichotomy of with or without friction, as typically assumed in theoretical as well as in some model sensitivity studies. By reporting the details of these physical sensitivities on the MJO forecast, the present study strongly suggests the need for theoretical investigations that are much more closely tied to the actual operational formulations of physical parameterization and their impact on the mean circulation rather than merely modulating the (MJO) anomaly.
Model codes developed at ECMWF are the intellectual property of ECMWF and its member states; therefore the IFS code is not publicly available. Access to a reduced model version of the IFS code may be obtained from ECMWF under an OpenIFS licence https://confluence.ecmwf.int/display/OIFS/Release+notes+for+OpenIFS+43r3v1 (last access: 25 March 2021) (ECMWF, 2020).
The data are stored in ECMWF's Meteorological Archive and Retrieval System (MARS) and are accessible from the corresponding author upon reasonable request (email: nils.wedi@ecmwf.int).
Forecast experiments were performed by NPW, and the graphic analyses were mostly performed by JIY. Both authors developed the paper by closely analysing and discussing the results.
The authors declare that they have no conflict of interest.
Discussions with Peter Bechtold and Fredric Vitart are much appreciated. Fredric Vitart also kindly provided us with an RMM plotting package. The bulk of this work was performed during the first author's visit to ECMWF during February–March 2018. Special thanks are due to Peter Haynes, who greatly assisted us during the revision process as the editor in charge; he also suggested several key references.
This paper was edited by Peter Haynes and reviewed by two anonymous referees.
Chang, C. P.: Viscous internal gravity waves and low-frequency oscillations in the tropics, J. Atmos. Sci., 34, 901–910, 1977.
Crueger, T. and Stevens, B.: The effect of atmospheric radiative heating by clouds on the Madden–Julian Oscillation, J. Adv. Model. Earth Sy., 7, 854–864, https://doi.org/10.1002/2015MS000434, 2015.
ECMWF: OpenIFS CY43R3 release notes, available at: https://confluence.ecmwf.int/display/OIFS/Release+notes+for+OpenIFS+43r3v1 (last access: 25 March 2021), 2020.
Emanuel, K. A.: An air–sea interaction model of intraseasonal oscillations in the tropics, J. Atmos. Sci., 44, 2324–2340, 1987.
Fuchs, Ž. and Raymond, D. J.: A simple model of intraseasonal oscillations, J. Adv. Model. Earth Sy., 9, 1195–1211, https://doi.org/10.1002/2017MS000963, 2017.
Gustafson Jr., W. I. and Weare, B. C.: MM5 modeling of the Madden–Julian oscillation in the Indian West Pacific Oceans: Model description and control run results, J. Climate, 17, 1320–1337, 2004.
Hall, N. M. J., Thibaut, S., and Marchesiello, P.: Impact of the observed extratropics on climatological simulations of the MJO in a tropical channel model, Clim. Dynam., 48, 2541–2555, https://doi.org/10.1007/s00382-016-3221-5, 2016.
Hayashi, Y.: A theory of large-scale equatorial waves generated by condensation heat and accelerating the zonal wind, J. Meteorol. Soc. Jpn., 48, 140–160, 1970.
Hirons L. C., Inness, P., Vitart, F., and Bechtold, P.: Understanding advances in the simulation ofintraseasonal variability in the ECMWF model. Part I: The representation of the MJO, Q. J. Roy. Meteor. Soc., 139, 1417–1426. https://doi.org/10.1002/qj.2060, 2013a.
Hirons L. C., Inness, P., Vitart, F., and Bechtold, P.: Understanding advances in the simulation ofintraseasonal variability in the ECMWF model. Part II: The application of process-based diagnostics, Q. J. Roy. Meteor. Soc., 139, 1427–1444, https://doi.org/10.1002/qj.2059, 2013b.
Hsu, H.-H., Hoskins, B. J., and Jin, F.-F.: The 1985/86 intraseasonal oscillation and the role of the extratropics, J. Atmos. Sci., 47, 823–839, 1990.
Jiang, X., Waliser, D. E., Xavier, P. K., Petch, J., Klingaman, N. P., Woolnough, S. J., Guan, B., Bellon, G., Crueger, T., DeMott, C., Hannay, C., Lin, H., Hu, W., Kim, D., Lappen, C.-L., Lu, M.-M., Ma, H.-Y., Miyakawa, T., Ridout, J. A., Schubert, S. D., Scinocca, J., Seo, K.-H., Shindo, E., Song, X., Stan, C., Tseng, W.-L., Wang, W., Wu, T., Wu, X., Wyser, K., Zhang, G. J., and Zhu, H.: Vertical structure and physical processes of the Madden–Julian oscillation: Exploring key model physics in climate simulations, J. Geophys. Res., 120, 2014JD022375, https://doi.org/10.1002/2014JD022375 , 2015.
Jiang, X., Adames, Á. F., Kim, D., Maloney, E. D., Lin, H., Kim, H., Zhang, C., DeMott, C. A., and Klingaman, N. P.: Fifty year of research on the Madden–Julian Oscillation: Recent progress, challenges, and perspectives, J. Geophys. Res., 125, e2019JD030911, https://doi.org/10.1029/2019JD030911, 2020a.
Jiang, X., Maloney, E., and Su, H.: Large-scale controls of propagation of the Madden–Julian Oscillation, Clim. Atmos. Sci., 3, 29, https://doi.org/10.1038/s41612-020-00134-x, 2020b.
Kim, D., Sobel, A. H., and Kang, I.-S.: A mechanism denial study on the Madden–Julian Oscillation, J. Adv. Model. Earth Sy., 3, M12007, https://doi.org/10.1029/2011MS000081, 2011.
Kim, H.-M., Kim, D., Vitart, F., Toma, V. E., Kug, J.-S., and Webster, P. J.: MJO propagation across the Maritime Continent in the ECMWF Ensemble Prediction System, J. Climate, 29, 3973–3988, 2016.
Kim, H., Vitart, F., and Waliser, D. E.: Prediction of the Madden–Julian oscillation: A review, J. Climate, 31, 9425–9443, 2018.
Knutson, T. R. and Weickmann, K. M.: 30–60 day atmospheric oscillations: Composite life cycles of convection and circulation anomalies, Mon. Weather Rev., 115, 1407–1436, 1987.
Kühnlein, C., Deconinck, W., Klein, R., Malardel, S., Piotrowski, Z. P., Smolarkiewicz, P. K., Szmelter, J., and Wedi, N. P.: FVM 1.0: a nonhydrostatic finite-volume dynamical core for the IFS, Geosci. Model Dev., 12, 651–676, https://doi.org/10.5194/gmd-12-651-2019, 2019.
Lindzen, R. S.: Wave-CISK in the tropics, J. Atmos. Sci., 31, 156–179, 1974.
Madden, R. A. and Julian, P. R.: Description of global-scale circulation cells in the tropics with a 40–50 day period, J. Atmos. Sci., 29, 1109–1123, 1972.
Ma, D. and Kuang, Z.: A mechanism-denial study on the Madden–Julian Oscillation with reduced interference from mean state changes, Geophys. Res. Lett., 43, 2989–2997, https://doi.org/10.1002/2016GL067702, 2016.
Majda, A. J. and Stechmann, S. N.: The skeleton of tropical intraseasonal oscillations, P. Natl. Acad. Sci. USA, 106, 8417–8422, 2009.
Malardel, S. and Wedi, N. P.: How does subgrid-scale parametrization influence nonlinear spectral energy fluxes in global NWP models?, J. Geophys. Res, 121, 5395–5410, 2016.
Malardel, S., Wedi, N. P., Deconinck, W., Diamantakis, M., Kühnlein, C., Mozdzynski, G., Hamrud, M., and Smolarkiewicz, P. K.: A new grid for the IFS, ECMWF Newsletter, 146, 23–28, 2016.
Milliff, R. F. and Madden, R. A.: The existence and vertical structure of fast, eastward-moving disturbances in the equatorial troposphere, J. Atmos. Sci., 53, 586–597, 1996.
Nakazawa, T.: Tropical Super clusters within intraseasonal variations over the western Pacific, J. Meteorol. Soc. Jpn., 66, 823–839, 1988.
Pilon, R., Zhang, C., and Dudhia, J.: Roles of deep and shallow convection and microphysics in the MJO simulated by the Model for Prediction Across Scales, J. Geophys. Res.-Atmos., 121, 10575–10600, https://doi.org/10.1002/2015JD024697, 2016.
Plant, R. S. and Yano, J.-I. (Eds): Parameterization of Atmospheric Convection, Volumes I and II, World Scientific, Singapore, Imperial College Press, London, https://doi.org/10.1142/p1005, 2015.
Ray, P. and Li, T.: Relative Roles of Circumnavigating Waves and Extratropics on the MJO and Its Relationship with the Mean State, J. Atmos. Sci., 70, 876–893, 2013.
Ray, P. and Zhang, C.: A case study of the mechanics of extratropical influence on the initiation of the Madden–Julian oscillation, J. Atmos. Sci., 67, 515–528, 2010.
Rostami, M. and Zeitlin, V.: Eastward-moving convection-enhanced modons in shallow water in the equatorial tangent plane featured, Phys. Fluids, 31, 021701, https://doi.org/10.1063/1.5080415, 2019.
Salby, M. L., Garcia, R. R., and Hendon, H. H.: Planetary-scale circulations in the presence of climatological and wave-induced heating, J. Atmos. Sci., 51, 2344–2367, 1994.
Seo, K., Wang, W., Gottschalck, J., Zhang, Q., Schemm, J. E., Higgins, W. R., and Kumar, A.: Evaluation of MJO Forecast Skill from Several Statistical and Dynamical Forecast Models, J. Climate, 22, 2372–2388, https://doi.org/10.1175/2008JCLI2421.1, 2009.
Straub, K. H.: MJO initiation in the real-time multivariate MJO index, J. Climate, 26, 1130–1151, 2013.
Vitart, F.: Evolution of ECMWF sub-seasonal forecast skill scores, Q. J. Roy. Meteor. Soc., 140, 1889–1899, 2014.
Wang, B.: Dynamics of tropical low frequency waves: An analysis of the moist Kelvin wave, J. Atmos. Sci., 45, 2051–2065, 1988.
Wang, D., Yano, J.-I., and Lin, Y.: Madden–Julian oscillations seen in the upper-troposphere vorticity field: Interactions with Rossby-wave trains, J. Atmos. Sci., 76, 1785–1807, https://doi.org/10.1175/JAS-D-18-0172.1, 2019.
Wedi, N. P.: Increasing horizontal resolution in NWP and climate simulations – illusion or panacea?, Philos. T. R. Soc. A, 372, 20130289, https://doi.org/10.1098/rsta.2013.0289, 2014.
Wedi, N. P. and Smolarkiewicz, P. K.: A nonlinear perspective on the dynamics of the MJO: Idealized large-eddy simulations, J. Atmos. Sci., 67, 1202–1217, 2010.
Weickmann, K. M., Lussky, G. R., and Kutzbach, J. E.: Intraseasonal (30–60 day) fluctuations of outgoing longwave radiation and 250 mb streamfunction during northern winter, Mon. Weather Rev., 113, 941–961, 1985.
Wheeler, M. C. and Hendon, H. H.: An all-season real-time multivariate MJO index: Development of an index for monitoring and prediction, Mon. Weather Rev., 132, 1917–1932, 2004.
Yano, J.-I. and Bonazzola, M.: Scale analysis for the large-scale tropical atmospheric dynamics, J. Atmos. Sci., 66, 159–172, 2009.
Yano, J.-I. and Emanuel, K. A.: An improved model of the equatorial troposphere and its coupling with the stratosphere, J. Atmos. Sci., 48, 377–389, 1991.
Yano, J.-I. and Tribbia, J. J.: Tropical atmospheric Madden–Julian oscillation: Strongly-nonlinear free solitary Rossby wave?, J. Atmos. Sci., 74, 3473–3489, 2017.
Yano, J.-I., Mulet, S., and Bonazzola, M.: Large-scale tropical atmosphere: asymptotically non-divergent?, Tellus A, 61, 417–427, 2009.
Yano, J.-I., Bister, M., Fuchs, Ž., Gerard, L., Phillips, V. T. J., Barkidija, S., and Piriou, J.-M.: Phenomenology of convection-parameterization closure, Atmos. Chem. Phys., 13, 4111–4131, https://doi.org/10.5194/acp-13-4111-2013, 2013.
Zhang, C.: Madden–Julian oscillation, Rev. Geophys., 43, RG2003, https://doi.org/10.1029/2004RG000158, 2005.
Zhang, C., Adames, Á. F., Khouider, B., Wang, B., and Yang, D.: Four theories of the Madden–Julian Oscillation, Rev. Geophys., 58, e2019RG000685, https://doi.org/10.1029/2019RG000685, 2020.
Zhao, C., Li, T., and Zhou, T.: Precursor signals and processes associated with MJO initiation over the Tropical Indian Ocean, J. Climate, 26, 291–307, 2013.
friction) as well as diabatic heating were selectively turned off over the tropics for the range of the latitudes from 20° S to 20° N.