the Creative Commons Attribution 4.0 License.
the Creative Commons Attribution 4.0 License.
 | 24 Mar 2021
Investigation of several proxies to estimate sulfuric acid concentration under volcanic plume conditions
Clémence Rose
Matti P. Rissanen
Siddharth Iyer
Jonathan Duplissy
John B. Nowak
Aurélie Colomb
Régis Dupuy
Xu-Cheng He
Janne Lampilahti
Yee Jun Tham
Daniela Wimmer
Jean-Marc Metzger
Pierre Tulet
Jérôme Brioude
Céline Planche
Markku Kulmala
Karine Sellegri
Sulfuric acid (H2SO4) is commonly accepted as a key precursor for atmospheric new particle formation (NPF). However, direct measurements of [H2SO4] remain challenging, thereby preventing the determination of this important quantity, and, consequently, a complete understanding of its contribution to the NPF process. Several proxies have been developed to bridge the gaps, but their ability to predict [H2SO4] under very specific conditions, such as those encountered in volcanic plumes (including, in particular, high sulfur dioxide mixing ratios), has not been evaluated so far. In this context, the main objective of the present study was to develop new proxies for daytime [H2SO4] under volcanic plume conditions and compare their performance to that of the proxies available in the literature. Specifically, the data collected at Maïdo during the OCTAVE (Oxygenated organic Compounds in the Tropical Atmosphere: variability and atmosphere–biosphere Exchanges) 2018 campaign, in the volcanic eruption plume of the Piton de la Fournaise, were first used to derive seven proxies based on knowledge of the sulfur dioxide (SO2) mixing ratio, global radiation, condensation sink (CS) and relative humidity (RH). A specific combination of some or all of these variables was tested in each of the seven proxies. In three of them (F1–F3), all considered variables were given equal weight in the prediction of [H2SO4], whereas adjusted powers were allowed (and determined during the fitting procedure) for the different variables in the other four proxies (A1–A4). Overall, proxies A1–A4 were found to perform better than proxies F1–F3, with, in particular, improved predictive ability for [H2SO4] > 2 × 108 cm−3. The CS was observed to play an important role in regulating [H2SO4], whereas the inclusion of RH did not improve the predictions. A last expression accounting for an additional sink term related to cluster formation, S1, was also tested and showed a very good predictive ability over the whole range of measured [H2SO4]. In a second step, the newly developed proxies were further evaluated using airborne measurements performed in the passive degassing plume of Etna during the STRAP (Synergie Transdisciplinaire pour Répondre aux Aléas liés aux Panaches volcaniques) 2016 campaign. Increased correlations between observed and predicted [H2SO4] were obtained when the dependence of predicted [H2SO4] on the CS was the lowest and when the dependence on [SO2] was concurrently the highest. The best predictions were finally retrieved by the simple formulation of F2 (in which [SO2] and radiation alone were assumed to explain the variations in [H2SO4] with equal contributions), with a pre-factor adapted to the STRAP data. All in all, our results illustrate the fairly good capacity of the proxies available in the literature to describe [H2SO4] under volcanic plume conditions, but they concurrently highlight the benefit of the newly developed proxies for the prediction of the highest concentrations ([H2SO4] > 2–3 × 108 cm−3). Moreover, the contrasting behaviours of the new proxies in the two investigated datasets indicate that in volcanic plumes, like in other environments, the relevance of a proxy can be affected by changes in environmental conditions and that location-specific coefficients do logically improve the predictions.
- Article
(5054 KB) - Full-text XML
-
Supplement
(575 KB) - BibTeX
- EndNote


Sulfuric acid (H2SO4) is commonly accepted as a key precursor for atmospheric new particle formation (NPF) and is, therefore, considered as the main driving species of cluster formation in air quality and climate models (Semeniuk and Dastoor, 2018). While it may not always be determinant in the process (Kirkby et al., 2016; Rose et al., 2018), evidence for the contribution of H2SO4 to the formation and initial growth of particles has been reported from chamber experiments (Kirkby et al., 2011; Duplissy et al., 2016; Lehtipalo et al., 2018) and atmospheric measurements performed in various environments (Frege et al., 2017; Jokinen et al., 2018; Yan et al., 2018). The overall predominant role played by sulfuric acid in cluster formation is particularly related to its very low saturation vapour pressure and high hydrogen bonding capacity (Zhang et al., 2011). Based on laboratory studies, H2SO4 participates in different nucleation mechanisms, including binary water–sulfuric acid cluster formation (e.g. Kirkby et al., 2011; Duplissy et al., 2016) and ternary formation pathways, in which a third stabilizing species, either inorganic (e.g. Jen et al., 2014; Kürten et al., 2016) or organic (e.g. Zhang et al., 2004; Riccobono et al., 2014), is involved. The relative importance of these mechanisms is expected to vary spatially, both horizontally and vertically, depending on the environmental conditions. These conditions, including the availability of precursors as well as temperature and relative humidity levels, also influence the contribution of ions in the process, which seems to be generally limited in the planetary boundary layer but could be more significant in the middle and upper troposphere (e.g. Lovejoy et al., 2004; Hirsikko et al., 2011; Duplissy et al., 2016). Recently, NPF was observed in the volcanic eruption plume of the Piton de la Fournaise (Réunion) (Rose et al., 2019) and in the passive degassing plumes of Etna and Stromboli (Italy) (Sahyoun et al., 2019), where a tight connection between the particle formation rate and [H2SO4] was highlighted. Using indirect quantification of [H2SO4], Rose et al. (2019) concurrently reported a fair agreement between measured cluster formation rates and the values derived from the recent parameterization of water–sulfuric acid binary nucleation by Määttänen et al. (2018), which also predicted a likely significant contribution of ion-induced nucleation in the volcanic plume for [H2SO4] below ∼ 8 × 108 cm−3.
The identification of the vapours involved in the first stages of NPF and further understanding of the process require a direct characterization of the relevant clusters and their precursors. Information about the species contributing to cluster formation with sulfuric acid and preferential formation pathways was gained from laboratory studies (Hanson and Eisele, 2002; Hanson and Lovejoy, 2006). Laboratory experiments have also made it possible to evaluate instrumental set-ups and related protocols for accurate detection and quantification of the clusters and their precursors (Jen et al., 2016; Riva et al., 2019). Measurements of [H2SO4] are currently performed with nitrate ion () based chemical ionization mass spectrometers (CIMS). Specifically, the atmospheric pressure interface time-of-flight mass spectrometer (APi-TOF, Aerodyne Research Inc. and TOFWERK AG; Junninen et al., 2010) equipped with a chemical ionization (CI) inlet (CI-APi-TOF, Jokinen et al., 2012) has been used in most of the recent studies, as it offers a detection limit which is low enough (∼ 2 × 104 cm−3) to allow measurements of [H2SO4] under typical daytime atmospheric conditions (105–107 cm−3) (Kirkby et al., 2016). In the study of Sahyoun et al. (2019), the CI inlet was replaced by an ambient ionization (AI) inlet specifically developed to meet the safety regulation requirements regarding the use of chemicals on board the French ATR 42 research aircraft.
However, as recently noticed by Lu et al. (2019), direct measurements of [H2SO4] remain challenging, because the deployment of CIMS and the analysis of the data they provide require specific expertise. Therefore, for studies in which [H2SO4] is an important variable (i.e. mainly for nucleation and NPF studies), it is useful to be able to predict it from more accessible observations such as SO2 concentration and environmental parameters. This is why several proxies for [H2SO4] have been developed, based on the assumption that H2SO4 mostly results from the oxidation of sulfur dioxide (SO2) by the hydroxyl radical (OH). Thus, these proxies neglect the possible contribution of oxidants other than OH, including, for instance, stabilized Criegee intermediates (Mauldin et al., 2012) or other proposed compounds (e.g. halogen oxides; Berresheim et al., 2014); hence, they only predict daytime [H2SO4]. The first proxies for [H2SO4] were derived by Petäjä et al. (2009) from measurements performed at the SMEAR (Station for Measuring Ecosystem–Atmosphere Relations) II station, in the boreal forest. In line with the existing theory, Petäjä and co-workers simply expressed [H2SO4] as the ratio of a source term ([SO2] × [OH], with [OH] possibly replaced by UVB or global radiation intensity due to the difficulty in obtaining atmospheric [OH]) over a sink term (related to condensation), with both having the same weight in the proxy (i.e. powers equal to unity). Shortly after, Mikkonen et al. (2011) provided new proxies derived from measurements collected at different sites representative of contrasting environments in Europe and North America, also with more variables, including the temperature-dependent reaction rate between SO2 and OH as well as relative humidity (RH). In addition, individual powers were allowed for the different variables and were defined by applying a nonlinear least squares fit to the datasets collected at each site, and, finally, to the combined dataset. Lu et al. (2019) followed a similar approach and developed proxies based on measurements performed in the urban area of Beijing, some of which included [O3] and [HONO] due to the contribution of these two compounds in the production of OH radicals. The main motivation for the study of Lu and co-workers was the likely limited relevance of the previous proxies for the study of frequently highly polluted atmospheres, such as those of Chinese megacities. More recently, Dada et al. (2020) derived new expressions to account for the production of H2SO4 via the oxidation of SO2 by stabilized Criegee intermediates and for the loss of H2SO4 due to cluster formation. This additional source term interestingly made the prediction of night-time H2SO4 possible and also contributed, along with the cluster term, to generally improving the predictive ability of the proxies during daytime. However, one limitation to the use of such formulation is that it requires information on alkene concentrations which is often not available, as pointed out by Dada et al. (2020).
In the absence of direct measurements, as well as of a specific proxy, Boulon et al. (2011) and Rose et al. (2019) used the expressions from Petäjä et al. (2009) and Mikkonen et al. (2011) respectively to estimate [H2SO4] and evaluate its connection with NPF in the volcanic eruption plumes of the respective Eyjafjallajökull and the Piton de la Fournaise volcanos. However, the lack of measured [H2SO4] in these studies obviously made it impossible to assess the performance of the above-mentioned proxies under such unusual conditions; this motivated the present work. The main objective of this study was to develop new proxies for [H2SO4] under volcanic plume conditions and to compare their predictive ability to that of the proxies available in the literature. For that purpose, the first direct measurements of [H2SO4] conducted under plume conditions in the framework of two different projects were used. Specifically, the data collected at the Maïdo observatory (Réunion) during the OCTAVE (Oxygenated organic Compounds in the Tropical Atmosphere: variability and atmosphere–biosphere Exchanges; http://octave.aeronomie.be, last access: 16 March 2021) campaign, in the volcanic eruption plume of the Piton de la Fournaise, were used to derive the proxies, and in a second step, their performance was further evaluated using airborne measurements performed in the passive degassing plume of Etna during the STRAP (Synergie Transdisciplinaire pour Répondre aux Aléas liés aux Panaches volcaniques) campaign (Sahyoun et al., 2019). We otherwise followed the same approach as Mikkonen et al. (2011) and Dada et al. (2020) to develop the proxies.
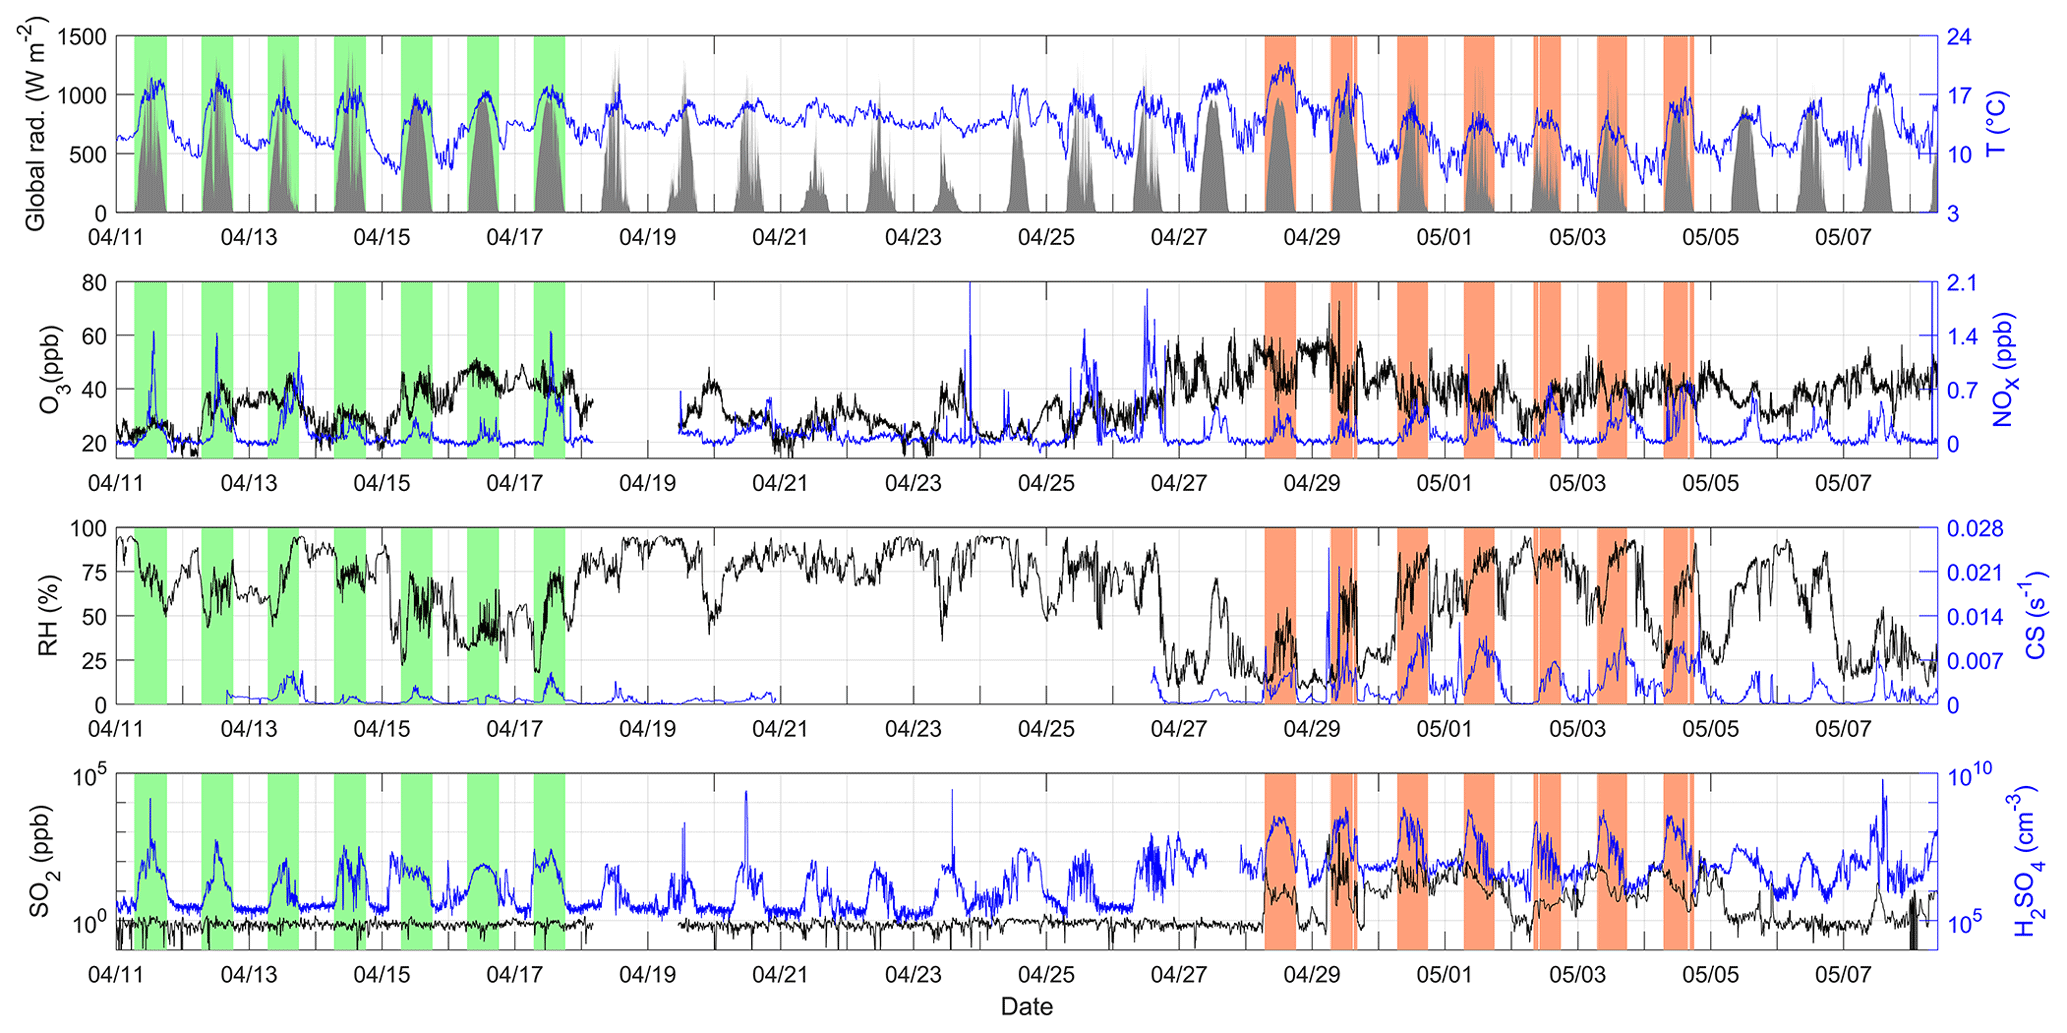
Figure 1Overview of the conditions during the OCTAVE campaign conducted in 2018. All time series are shown in local time (UTC + 4) for easier interpretation of the diurnal cycles. Measurements performed under daytime regular conditions and used to derive the corresponding statistics reported in Table 1 are highlighted by the green shaded areas; similarly, data collected under daytime plume conditions are highlighted by the red shaded areas. Note that with the exception of radiation, which is represented by the grey area in the top panel, the black line represents the variable on the left y axis, and the blue line represents the variable on the right y axis in all other panels. This information on line colour is not directly provided in the plot to preserve the readability of the figure.
2.1 Ground-based measurements performed at the Maïdo observatory during the OCTAVE campaign
Measurements were performed at the Maïdo observatory located on the island of Réunion, in the Indian Ocean (21.080∘ S, 55.383∘ E; 2150 ) in the framework of the OCTAVE 2018 campaign (Fig. 1), which took place between 7 March and 8 May 2018 (note that, for simplicity, this dataset will be referred to as OCTAVE hereafter). Specific attention was paid to the time period between 28 April and 4 May, during which the volcanic eruption plume of the Piton de la Fournaise, located ∼ 39 km from Maïdo in the south-eastern region of the island, was detected at the station (see Sect. 2.3). Detailed information about the facility can be found in Baray et al. (2013), and the instrumental set-up used in the present study has, to a large extent, already been described in Foucart et al. (2018) and Rose et al. (2019). Briefly, the aerosol number size distribution between 10 and 600 nm was retrieved every 7 min by a custom-built differential mobility analyser (DMPS) operated behind a whole air inlet (higher size cut-off of 25 µm for an average wind speed of 4 m s−1). These measurements were used to calculate the condensation sink (CS), which represents the loss rate of vapours, specifically H2SO4, on pre-existing particles (Kulmala et al., 2012). In contrast to the above-mentioned studies, SO2 mixing ratios were measured every minute with a Teledyne API T100U analyser, which has a lower detection limit (0.05 ppb) than that of the instrument previously running at the site. In addition, O3 and NOx mixing ratios were measured with a Thermo Scientific 49i analyser and a Teledyne API T200UP analyser respectively, with respective detection limits of 1 and 0.05 ppb and a time resolution of 1 min. As in Foucart et al. (2018) and Rose et al. (2019), meteorological parameters measured with a time resolution of 3 s were used, including global radiation (SPN1, Delta-T Devices Ltd., resolution 0.6 W m−2), temperature and RH (Vaisala Weather Transmitter WXT510).
A CI-APi-TOF mass spectrometer employing nitrate reagent ions was deployed to retrieve gas-phase H2SO4, as detailed in Jokinen et al. (2012). Briefly, sulfuric acid is deprotonated by ions in the chemical ionization inlet and then directly quantified from signals of resulting bisulfate ion () and its nitric acid cluster (HNO3 ⋅ ). At the highest ambient concentrations, the bisulfate clusters with sulfuric acid and sulfuric acid dimer (i.e. H2SO4 ⋅ and (H2SO4)2 ⋅ respectively) also made a non-negligible contribution and were included in the analysis. To convert the measured ion signals into concentrations, Eq. (1) was used. The measured raw ion signals were normalized by the reagent ion current and multiplied by a calibration factor of C = 1.7 × 10¹⁰ , which was determined by a procedure outlined in Kürten et al. (2012):
Note that the mass spectrometer was calibrated on-site, in the exact position it was sampling the ambient air during the measurement campaign, and up to the high sulfuric acid concentrations observed under the plume conditions.

Figure 2Overview of the conditions during the first part of the ETNA 13 flight. (a) Similarly to Fig. 1, measurements performed under plume conditions are highlighted by the red shaded areas. Note that with the exception of radiation, which is represented by the grey area in the top panel, the black line represents the variable on the left y axis, and the blue line represents the variable on the right y axis in all other panels. (b) Map of the flight. The location of the plume is illustrated by the SO2 levels reported on the coloured path, for which the direction is further indicated by the arrow. The red star indicates the position of the vent.
2.2 Airborne measurements performed during the STRAP campaign
Airborne measurements were conducted in the framework of the STRAP campaign, on 15 and 16 May 2016, in the volcanic plumes of Etna and Stromboli, during passive degassing (Pianezze et al., 2019; Sahyoun et al., 2019). In the present work, we focused on flight ETNA 13 performed around Etna on 15 May, paying specific attention to the first part of the flight between 10:43 and 11:00 UTC (LT − 2 h). This specific period was selected as measurements were performed at constant altitude (∼ 2900 m), thereby making the overall interpretation of the observations easier, and, more importantly, because several latitudinal plume transects were performed at distances between ∼ 7 and 39 km from the vent, resulting in very clear variations in [H2SO4] (see Fig. 2). For simplicity, although they are restricted to the first part of flight ETNA 13, these data will nonetheless be referred to as STRAP data hereafter.
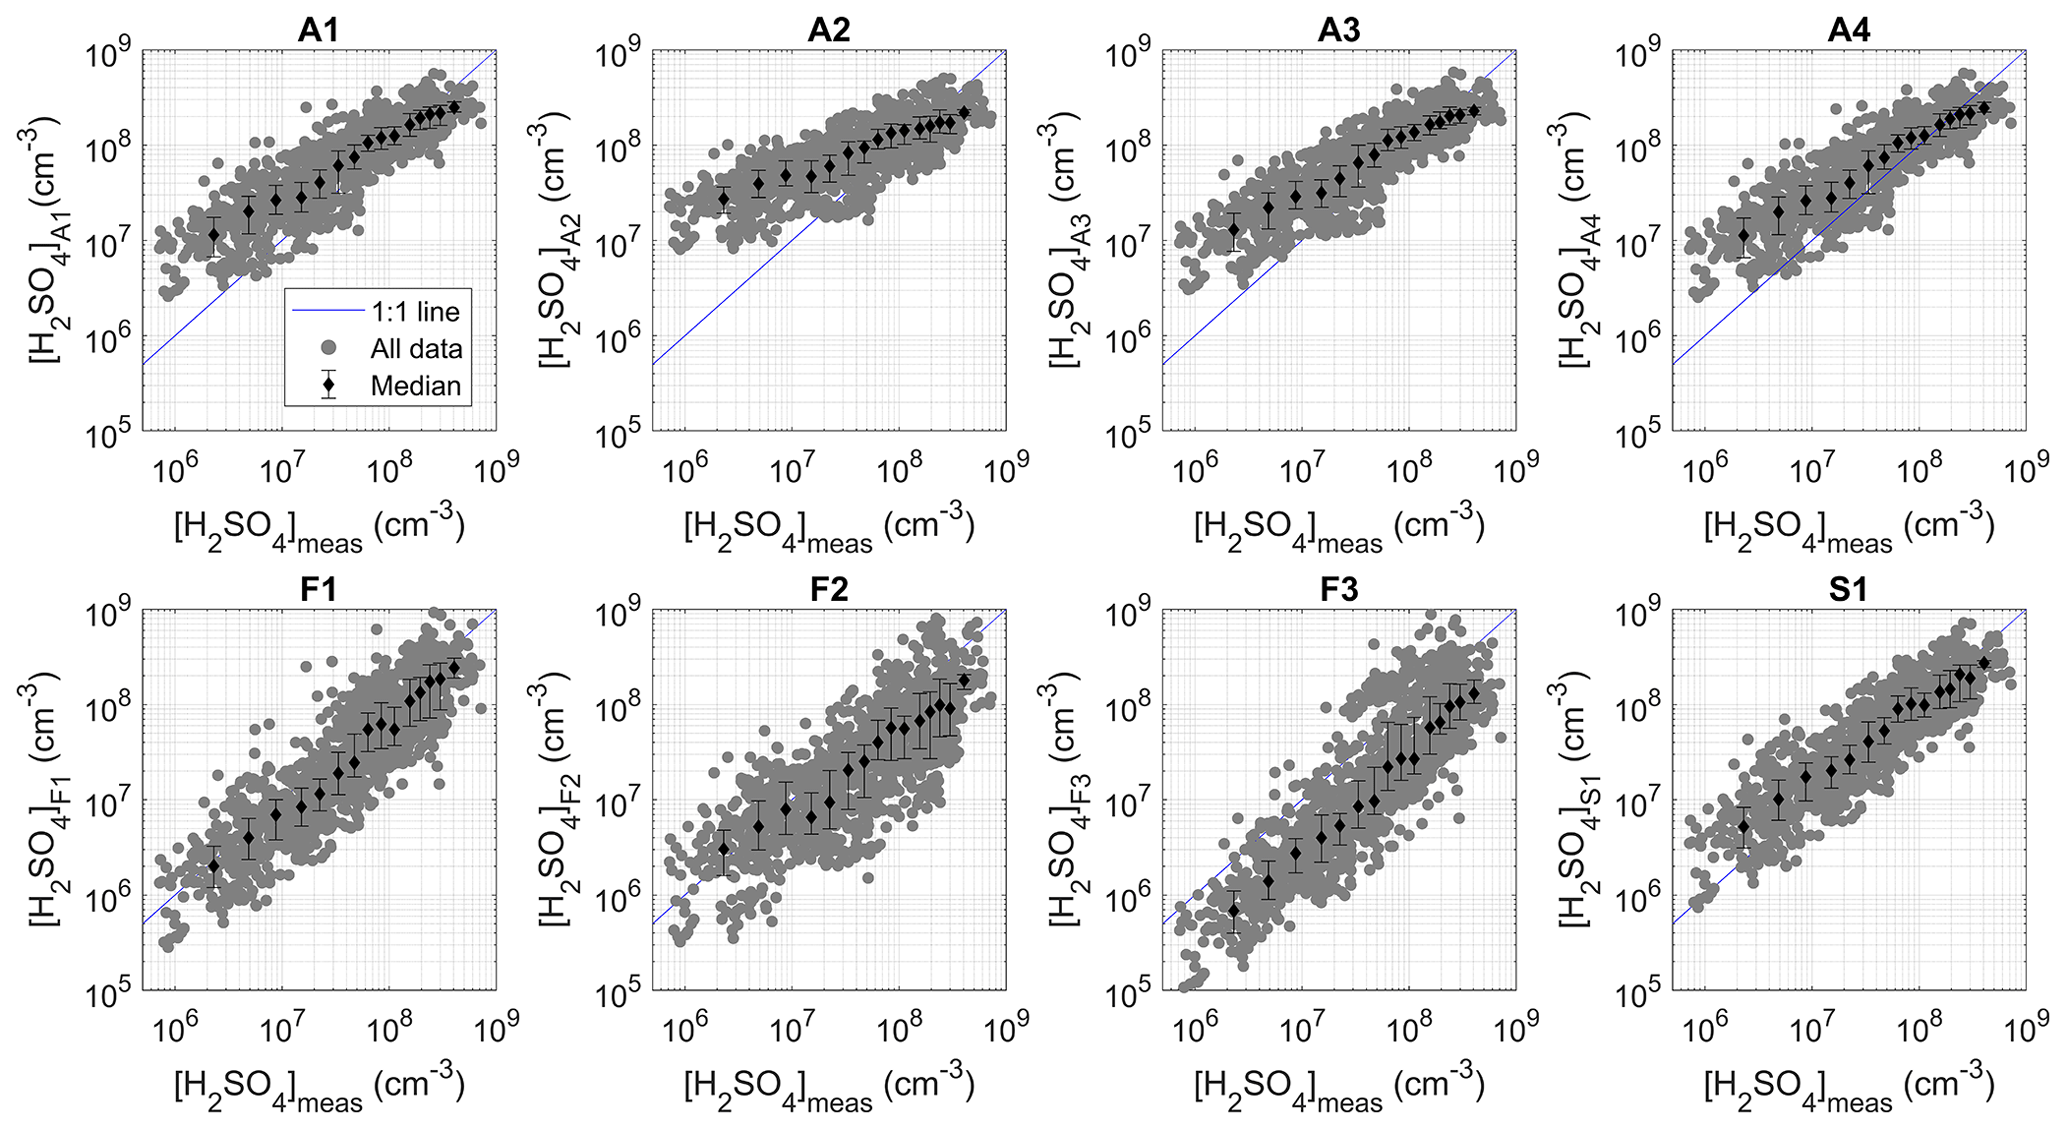
Figure 3Predictions retrieved by the different proxies as a function of measured [H2SO4]. The data points were also divided into 15 bins with an equal number of data points based on measured [H2SO4]. The medians (markers) and the 25th and 75th percentiles (error bars) of [H2SO4] predicted for each bin are also shown.
Measurements were performed on board the French ATR 42 research aircraft operated by SAFIRE (Service des Avions Français Instrumentés pour la Recherche en Environnement). The instrumental set-up available on board the aircraft was previously described by Sahyoun et al. (2019) and is only briefly recalled here. Particle number size distributions in the range between 90 and 3000 nm were measured with a passive cavity aerosol spectrometer probe (PCASP-100X V3.11.0) and were used for the calculation of the CS. One should keep in mind that the CS reported in the present work, although already increased compared with that derived from the > 250 nm particle number concentration by Sahyoun et al. (2019), most likely remains a lower estimate of the actual sink. Indeed, the contribution of sub-90 nm particles to the condensational sink was expected to be significant, in particular because new particle formation and growth events were observed in the passive degassing plume of Etna during flight ETNA 13 (Fig. 3a in Sahyoun et al., 2019). SO2, O3 and NOx mixing ratios were measured with analysers of the exact same type as those used at Maïdo, the main characteristics of which are recalled in Sect. 2.1. Routine meteorological parameters and geographical parameters, which are continuously monitored on board the aircraft, were also used in the analysis, including global radiation, temperature, RH, pressure, altitude, latitude and longitude. All measurements listed above were retrieved with a 1 s time resolution.
Table 1Median and 5th and 95th percentiles of key atmospheric variables measured during daytime under regular and plume conditions during OCTAVE, and under plume conditions during the first part of the ETNA 13 flight (STRAP).
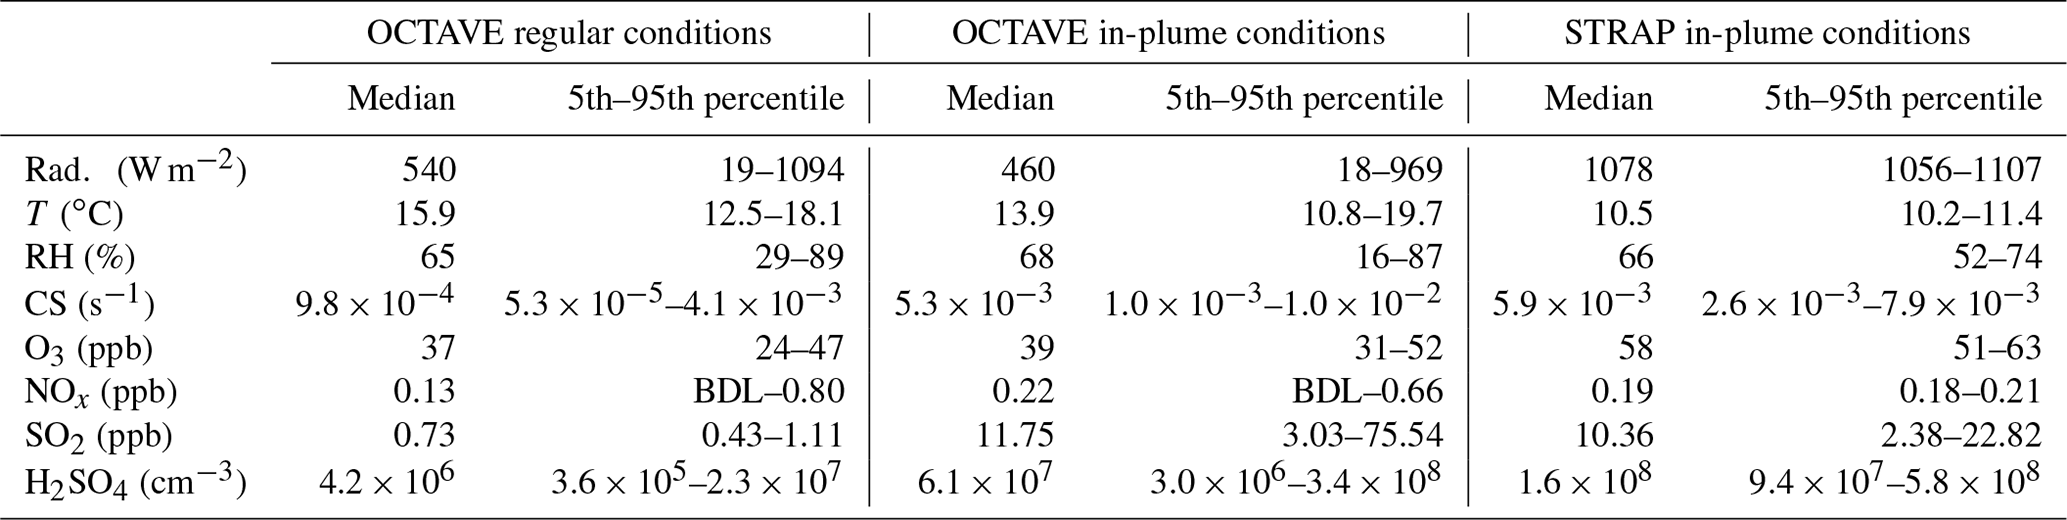
* BDL represents below the detection limit
As previously explained in detail by Sahyoun et al. (2019), sulfuric acid concentrations were measured with an APi-TOF equipped with an ambient ionization (AI) inlet adapted to airborne measurements and used for the first time during STRAP. In contrast to the CI inlet, the AI inlet does not require the use of any chemicals and only includes a soft X-ray source (Hamamatsu L9490) to ionize the sample flow. This direct ionization process was sufficient to get a high enough signal and allow a time resolution as high as 1 s for the corresponding measurements. Moreover, in order to avoid possible effects related to pressure changes on the detection of the AI-APi-TOF, a pressure stabilizing unit was installed in front of the instrument. As detailed in Sahyoun et al. (2019), calibration of this new set-up was performed (with respect to [H2SO4] measurement) during autumn 2016 at the CLOUD CERN facility (Kirkby et al., 2011; Duplissy et al., 2016, and references therein) by comparison with the measurements performed with a nitrate-based CI-APi-TOF under various conditions representative of the atmosphere. During these experiments, was assumed to be the main ionizing agent of H2SO4, as on board the aircraft during the measurement campaign, but the contribution of could not be excluded, in particular in the presence of higher NOx levels (up to 33 ppb) in the CLOUD chamber. Therefore, estimates of [H2SO4] were finally obtained by means of Eq. (2) using the signals measured at = 97 Th () and = 160 Th ( ⋅ H2SO4) by the AI-APi-TOF and a calibration coefficient of C = 4.5 × 10⁹ :
The good correlation obtained between the signals of the well-characterized CI-APi-TOF and the AI-APi-TOF during the calibration experiments can undoubtedly be seen as an indicator of the satisfactory performance of the newly developed inlet and, further, of the derivation of [H2SO4] (see Fig. S3 in the Supplement of Sayhoun et al., 2019). However, it cannot be excluded that [H2SO4] inferred from the measurements carried out during the STRAP campaign were subject to greater uncertainty due to the specific conditions of the volcanic plume, in particular with respect to H2SO4 concentrations, which were on average slightly higher in the plume than in the simulation chamber (≲ 5 × 107 cm−3 in the CLOUD chamber vs. ∼ 1.6 × 108 cm−3 on average during the flight segment of interest; see Table 1 and Fig. 2).
2.3 Overview of the two campaign datasets
An overview of the campaign conditions is presented in Fig. 1 for OCTAVE and, similarly, in Fig. 2 for the first part of flight ETNA 13 performed during STRAP. A broader view of the STRAP campaign, including time series of the variables of interest during all flights, can be found in Sahyoun et al. (2019). For consistency with the previous studies by Rose et al. (2019) and Sahyoun et al. (2019), the occurrence of volcanic plume conditions was assessed based on SO2 mixing ratios, and a threshold of 2 ppb was used for the detection of the plume for both datasets. Daytime in-plume conditions identified during OCTAVE are highlighted by the red boxes in Fig. 1. Specific attention was paid to daytime, when global radiation exceeded 10 W m−2, as the proxies for [H2SO4] discussed in the next sections were assumed to only apply under these conditions, following earlier work by Mikkonen et al. (2011). Note that the eruptive volcanic plume of the Piton de la Fournaise was also detected at Maïdo after 4 May but only during sporadic events, which were, thus, excluded from the present study. Concerning STRAP, measurements were mostly collected under plume conditions during the selected period, as illustrated in Fig. 2a. In-plume conditions were only interrupted during a short 1 min period at ∼ 10:51 UTC, when the aircraft exited the volcanic plume at the end of a latitudinal transect, and during the last 30 s of the selected period, for the same reason (Fig. 2b). Moreover, gaps in radiation data were caused by improper measurements during turns, when the aircraft itself affected the amount of radiation reaching the sensor. In addition to Figs. 1 and 2, the median and the 5th and 95th percentiles of a number of key atmospheric variables are reported in Table 1. Statistics derived from measurements performed under regular conditions at Maïdo (i.e. outside of the volcanic plume) are also reported for further investigation of the influence of the volcanic plume on atmospheric conditions at the site. Note that this “reference” period (Fig. 1, green boxes) was limited to 18 April due to the occurrence of a tropical cyclone during the following days, which had a noticeable effect on atmospheric mixing (see, for instance, temperature) and also lead to measurement issues (e.g. DMPS). Furthermore, data collected before 11 April were excluded from the present work, as H2SO4 measurements could not be performed until this date.
As evidenced in Table 1 and Figs. 1 and 2, in-plume meteorological conditions logically showed stronger variability during OCTAVE than during STRAP, as a result of the longer investigated period and, more importantly, because continuous measurements performed during OCTAVE allowed for the capture of diurnal cycles. Nonetheless, the medians derived from the two datasets were similar for a number of variables, with a ratio < 1.5 for temperature, RH, CS as well as for SO2, O3 and NOx mixing ratios. Note that O3 and NOx mixing ratios were only reported for further comparison of the two campaign datasets and investigation of the conditions in and out of plume; except for an attempt to include [O3] in a sensitivity test, they were not used in the derivation of the proxies. In contrast, larger differences were observed for global radiation and [H2SO4]. As mentioned earlier, lower median radiation in OCTAVE, calculated from all data > 10 W m−2, reflects the diurnal cycle observed at the site, whereas measurements in STRAP were performed over a relatively short period during daytime, under clear-sky conditions. Observed differences in median [H2SO4] were also likely related to the campaigns' design and duration, but we could not exclude that part of this difference was also explained by the use of different instrumental set-ups in the two campaigns as well as by the uncertainty associated with the derivation of [H2SO4] from mass spectrometry data.
As previously reported by Rose et al. (2019), the comparison of in-plume and out-of-plume conditions at Maïdo did not highlight any clear influence of the volcanic plume on meteorological conditions. O3 levels were also very comparable, and the median NOx level was observed to be slightly higher outside the plume (factor of 1.8). In contrast, SO2 mixing ratios and [H2SO4] were logically higher under plume conditions, with 1 order of magnitude higher medians compared with regular conditions. A similar observation was also made for the CS, as a likely result of enhanced secondary aerosol formation in the volcanic plume (Rose et al., 2019). Compared with the sites in the studies by Mikkonen et al. (2011) and Lu et al. (2019), in-plume conditions were characterized by 1–2 and 1–3 order of magnitude higher SO2 mixing ratios and [H2SO4] medians respectively but a comparable or even lower CS. Specifically, [H2SO4] measured under plume conditions was, to our knowledge, the highest ever recorded in the atmosphere. These values could, furthermore, be lower estimations of the actual concentrations when approaching 109 cm−3, due to the likely occurrence of homogeneous condensation of H2SO4 above this threshold (Brus et al., 2010). These specificities of the volcanic plume clearly illustrate the need for (1) a deeper investigation of the performance of the proxies available in the literature under these conditions and (2) further development of proxies adapted to these very specific conditions.
The development of proxies for [H2SO4] under volcanic plume conditions was performed using the exact same approach as in Mikkonen et al. (2011) and, more recently, Dada et al. (2020). Consequently, some of the aspects that were previously described in details in the above-mentioned studies are only briefly recalled here.
As under regular conditions, our current knowledge of H2SO4 production from reactions between SO2 and OH radicals was first used as a basis for the construction of the proxies (Finlayson-Pitts and Pitts, 2000):
Similarly, condensation on existing particles was also assumed to be the main sink of sulfuric acid, so the rate of change of [H2SO4] could be expressed as follows:
where the temperature-dependant reaction rate k () is given by DeMore et al. (1997) and Sander et al. (2002) and is recalled in the Supplement.
[H2SO4] was then deduced from Eq. (3) assuming that the steady state between H2SO4 production and loss also holds under volcanic plume conditions:
Finally, as done earlier by Mikkonen et al. (2011) and, more recently, Dada et al. (2020), global radiation was introduced in Eq. (4) as an indicator of [OH] in order to further simplify the development of the proxies and allow as wide a use as possible in future studies:
where k′ corresponds to the multiplication of k by a factor (to be determined in the fitting procedure) which partly takes the use of global radiation instead of [OH] into account. The formulation of Eq. (5) was tested in proxy F1, which is similar to the proxy initially developed by Petäjä et al. (2009) and latter modified by Mikkonen et al. (2011) to take the temperature-dependant reaction rate k between SO2 and OH into account. Considering the work by Mikkonen et al. (2011), we defined, in parallel, proxy A1, which was similar to F1 but with individual adjusted powers for the different variables, as such an approach was reported to perform better with respect to predicting ambient sulfuric acid levels. In addition to F1 and A1, other proxies, all listed in Table 2, were tested to evaluate the importance of the sink term in determining [H2SO4]; note that “F” proxies include a single fitting parameter and fixed powers (1 or −1) for all variables, whereas “A” proxies allow adjusted fitting parameters for the different variables. Following the approach by Mikkonen et al. (2011), the CS was first removed in proxies F2 and A2 and was reintroduced in proxies F3 and A3 along with RH. The motivation for this last test was that the CS may not always completely reflect the actual sink, as the aerosol sample is systematically dried to below 40 % RH at Maïdo. Applying a specific correction for the hygroscopic particle growth would have required a detailed characterization of this process (e.g. as a function of air mass type, season) which has not been performed at Maïdo and is likely not available at a number of sites where the newly developed proxies could be used. Moreover, according to Mikkonen at al. (2011), such hygroscopicity correction might, at least in some environments, only have a limited effect on the prediction of [H2SO4]. Therefore, similar to Mikkonen et al. (2011), inclusion of RH in the sink term was tested instead. In addition to A3, RH was also included in A4 but as an individual term. Based on earlier work by Mikkonen et al. (2011), the use of global radiation instead of [OH] was assumed to be accounted for in the fitting procedure for all of these proxies, in particular by the mean of parameters K and a for the “F” and “A” proxies respectively.
Table 2Proxy functions. F1 to F3 are the proxies with powers fixed to −1 or 1 for all variables, as predicted by the existing theory, whereas proxies A1 to A4 have individual adjusted powers for each variable. S1 includes the additional H2SO4 sink related to cluster formation. In each of the proxies, k corresponds to the temperature-dependant reaction rate between SO2 and OH. Fitting parameters K in F1–F3, a–f in A1–A4 and α−β in S1 were determined iteratively to minimize the sum of squared residuals associated with each proxy. The pre-factors a and K as well as parameter α are assumed to consider the use of global radiation instead of [OH] in the different proxies.

Finally, a last proxy, S1, was tested to consider the loss of H2SO4 related to molecular cluster formation (Dada et al., 2020). This sink, written as a second-order function of [H2SO4] (β ⋅ [H2SO4]2), was reported to contribute up to ∼35 % of [H2SO4] prediction in Beijing, and we believe that it could also play an important role in the volcanic plume, where nucleation was previously reported to occur frequently (Rose et al., 2019). In order to account for the loss of H2SO4 due to cluster formation, Eq. (3) was modified based on the work by Dada et al. (2020):
where α is the coefficient associated with the H2SO4 production term (which accounts for the use of global radiation instead of [OH]), and β is the fitting parameter associated with the additional sink term.
Again assuming a steady state between H2SO4 production and loss, [H2SO4] could be deduced from Eq. (6) as follows:
This last expression, hereafter referred to as proxy S1 (Table 2), is the same as the proxy derived from Eq. (4) in Dada et al. (2020), except that the reaction rate k was explicitly taken into account.
Additional variables, such as O3 or NOx levels, could also have been introduced in the proxies, as done by Lu et al. (2019). However, as we did not observe a very specific behaviour of these species in the plume compared with regular conditions which could have motivated their inclusion, we rather chose to limit the number of variables to obtain expressions for the proxies that were as simple as possible; only the inclusion of [O3], along with global radiation in the source term, was attempted in a sensitivity test (see Sect. 4.1). Similarly, the dependence of the H2SO4 production term on absolute water concentration was omitted from the present work in order to avoid over-constraints which could prevent the use of the newly developed proxies on datasets collected in different volcanic plumes. More broadly, while Dada et al. (2020) explicitly aimed at understanding the different mechanisms of sulfuric acid formation and loss in different environments, detailed chemical investigation and/or description of the formation pathways of H2SO4 and its precursors in a volcanic plume was beyond the scope of the present work, the objective of which was to obtain the simplest possible description of [H2SO4] from a limited set of commonly measured variables.
The set of parameters leading to the minimum sum of squared residuals was, for each proxy (i.e. K for F1–F3, a–f for A1–A4 and α−β for S1), determined iteratively using the “fminsearch” MATLAB function. The performance of the different proxies was finally evaluated based on the correlation coefficient (R) of observed vs. predicted [H2SO4] and the corresponding sum of squared residuals (SSR), and, similarly to Mikkonen et al. (2011), by calculating the relative error (RE), which is defined as follows for a set of n observations:
where is the mean of observed [H2SO4].
The data were additionally submitted to bootstrap resampling to evaluate the effect of a possible systematic error related to the measurement accuracy of [H2SO4] and predictor variables on the fitting parameters and performance indicators (i.e. R, RE and SSR). The method is described in detail in Dada et al. (2020) and is only briefly recalled here. A total of 10 000 bootstrap resamples were generated from the original dataset by randomly replacing an existing data point with another, and the resulting time series were further multiplied by a set of random factors to simulate the presence of independent systematic errors on the different variables. For each variable, these factors (one per bootstrap sample, i.e. 10 000 in total) were drawn from a uniform distribution (on a logarithmic scale) of possible biases in their respective uncertainty range. Specifically, uncertainties in the range between −50 % and 100 % were considered for measured [H2SO4] (i.e. multiplying factors for [H2SO4] in the bootstrap resamples were between 0.5 and 2) following the work of Kürten et al. (2012). According to calibration data, we assumed an uncertainty of 15 % in the measurement of the SO2 mixing ratio and, similar to Dada et al. (2020), we assumed a 20 % uncertainty in the CS evaluation. An uncertainty of 5 % in the measurement of the remaining variables of interest (i.e. RH and global radiation) was finally accounted for based on the manufacturers' specifications. For each function listed in Table 2, the fitting procedure was first applied to the original dataset to obtain a set of reference parameters for deriving [H2SO4]. The variability of the fitting parameters and performance indicators was then evaluated for each proxy by repeating the same procedure on the bootstrap resamples.
4.1 Derivation of the proxies using measurements performed in the volcanic eruption plume of the Piton de la Fournaise during OCTAVE
As mentioned earlier, only the data collected in the volcanic eruption plume of the Piton de la Fournaise were effectively used to perform the fitting procedures, and the measurements obtained in the passive degassing plume of Etna were used in a second step to further test the newly derived proxies on a different dataset. Such an approach was motivated by two main reasons, which are listed below. We first believe that the variability of the key variables driving H2SO4 production was too limited in the STRAP dataset (Fig. 2, Table 1) to retrieve a realistic picture of the role of these variables in predicting [H2SO4]. This was supported by the unphysical fitting parameters that we obtained when making an attempt to derive some of the proxies listed in Table 2 from this dataset. Moreover, while the questions related to the use of a proxy at different locations and/or under different conditions have been raised in earlier studies, such questions obviously also apply to the volcanic plume, where the conditions are subject to very rapid change and certainly differ depending on the type of plume (e.g. eruptive vs. passive degassing). Thus, we took the opportunity to use the data collected during STRAP to further evaluate how the proxies derived from OCTAVE could be used to predict [H2SO4] in a different volcanic plume with conditions similar to those encountered during OCTAVE.
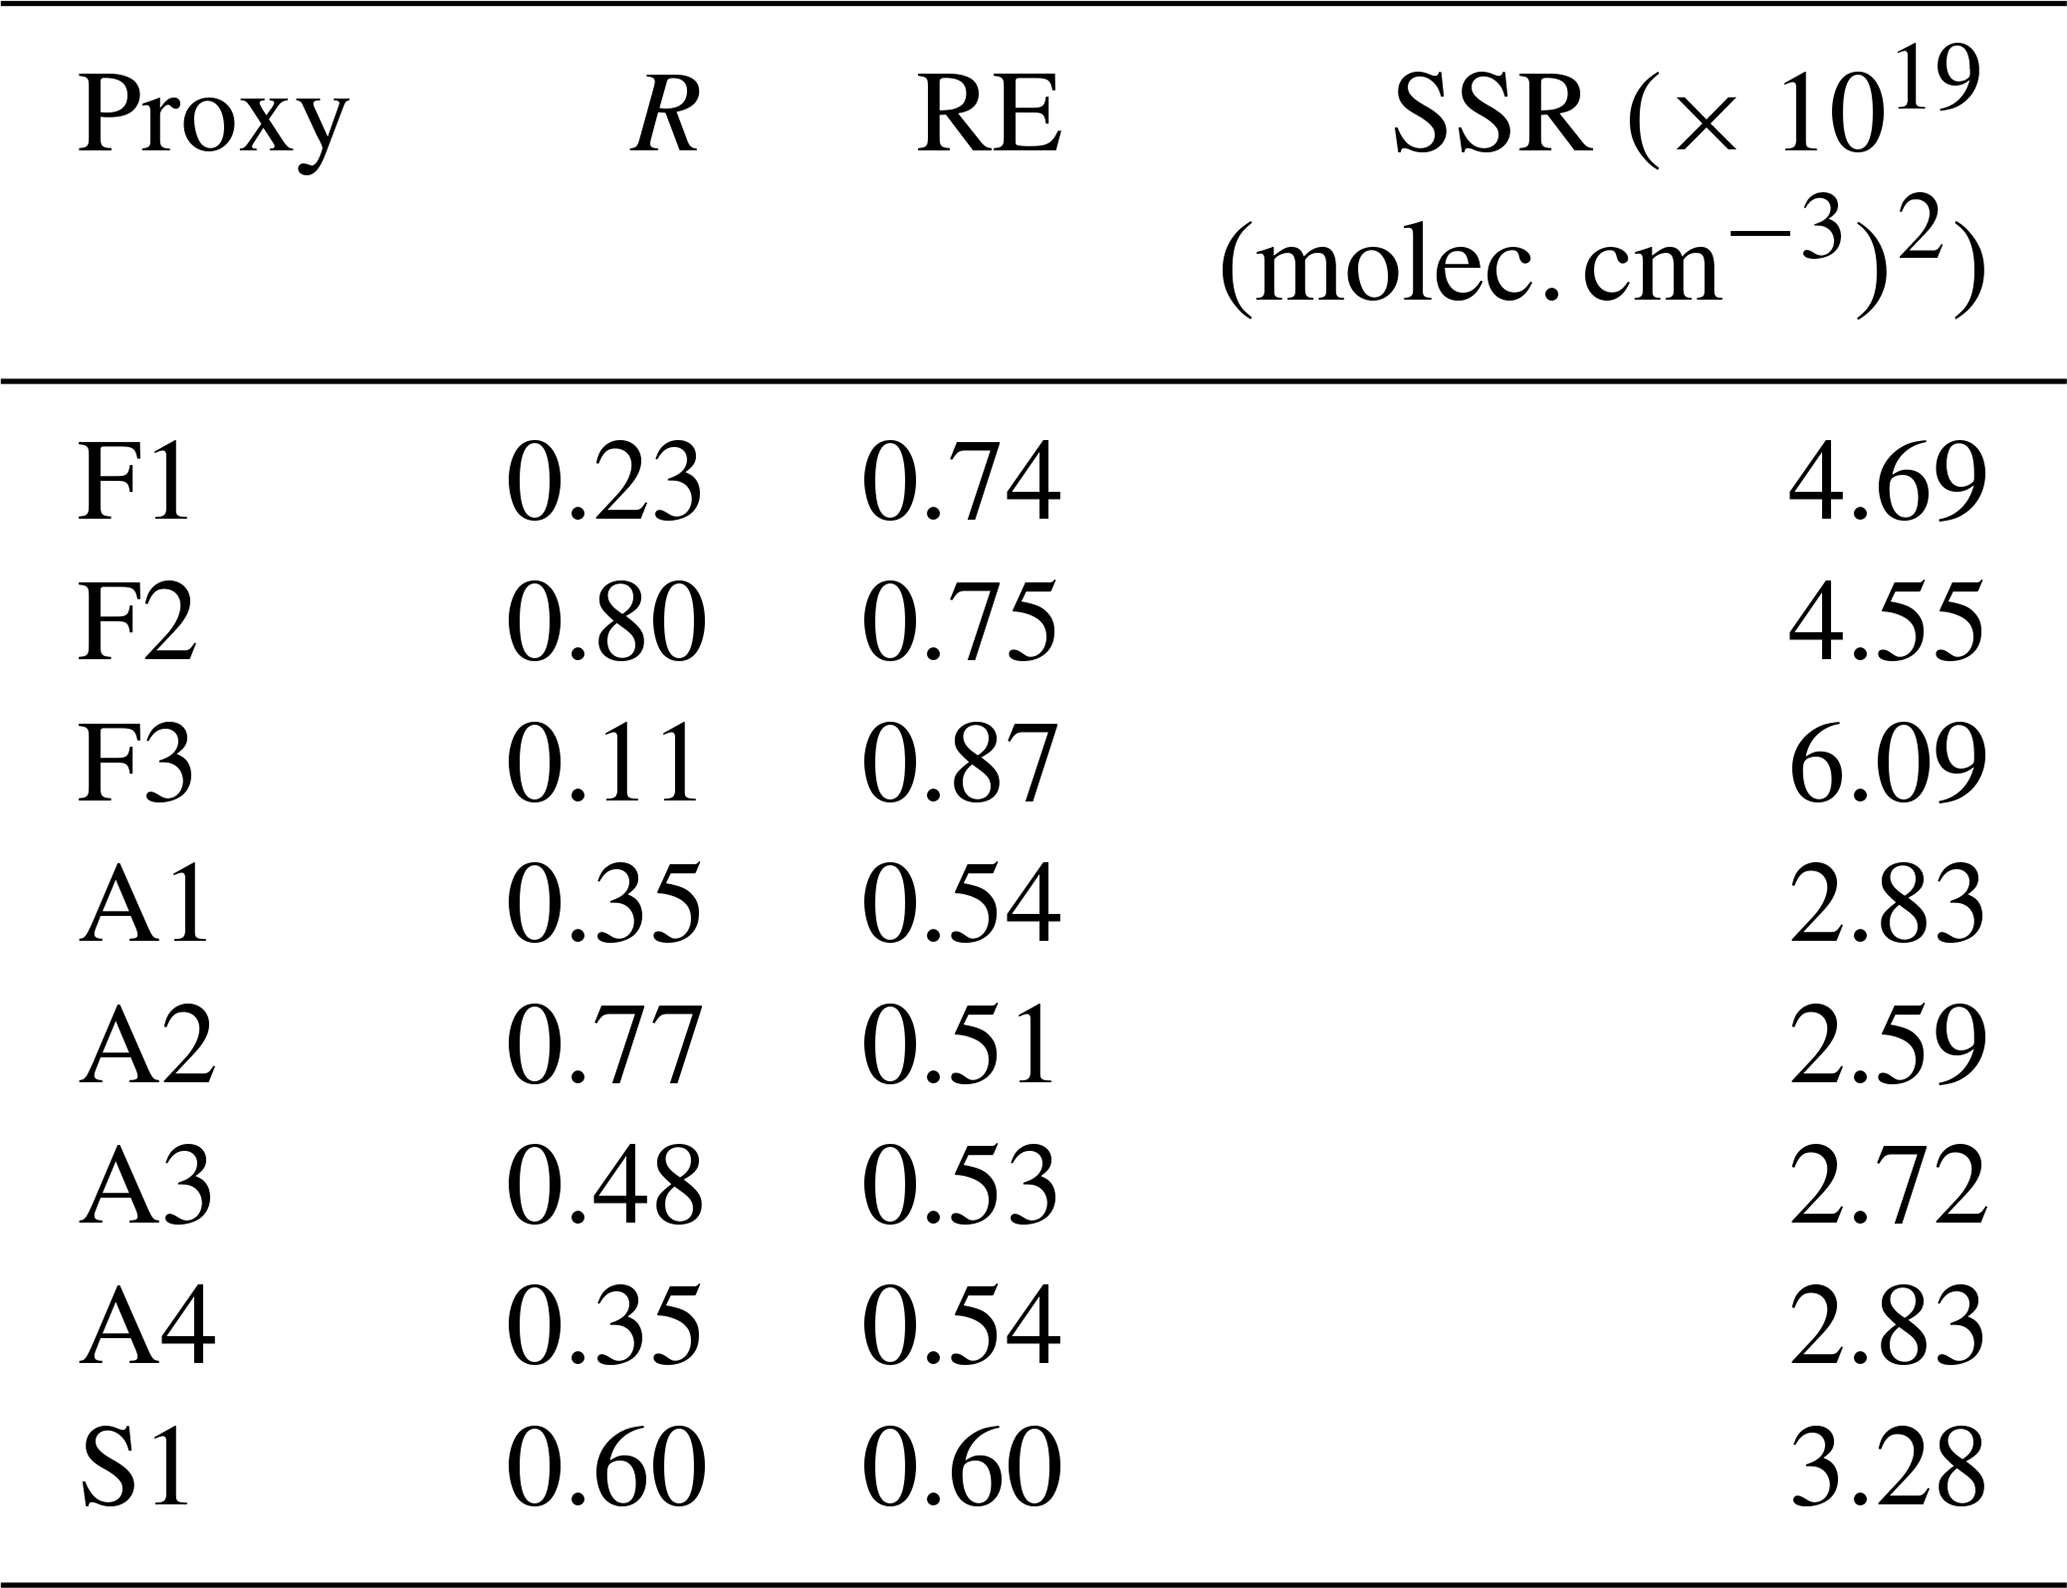
Table 3Fit results. For each proxy, the correlation coefficient (Pearson) between observed [H2SO4] and the predicted values (R), the relative error (RE) and the sum of squared residuals (SSR) are also reported. Numbers in parentheses indicate the 25th and 75th percentiles of the corresponding fitting parameter or performance indicator derived from the bootstrap resamples. For simplicity, the results are reported separately for the three proxy families: (a) F1–F3, which are the proxies with powers fixed to −1 or 1 for all variables; (b) A1–A4, which have individual adjusted powers for each variable; and (c) S1, which includes the additional H2SO4 sink related to cluster formation. Note that based on corresponding p values, all correlations were found to be significant (p < 0.05).
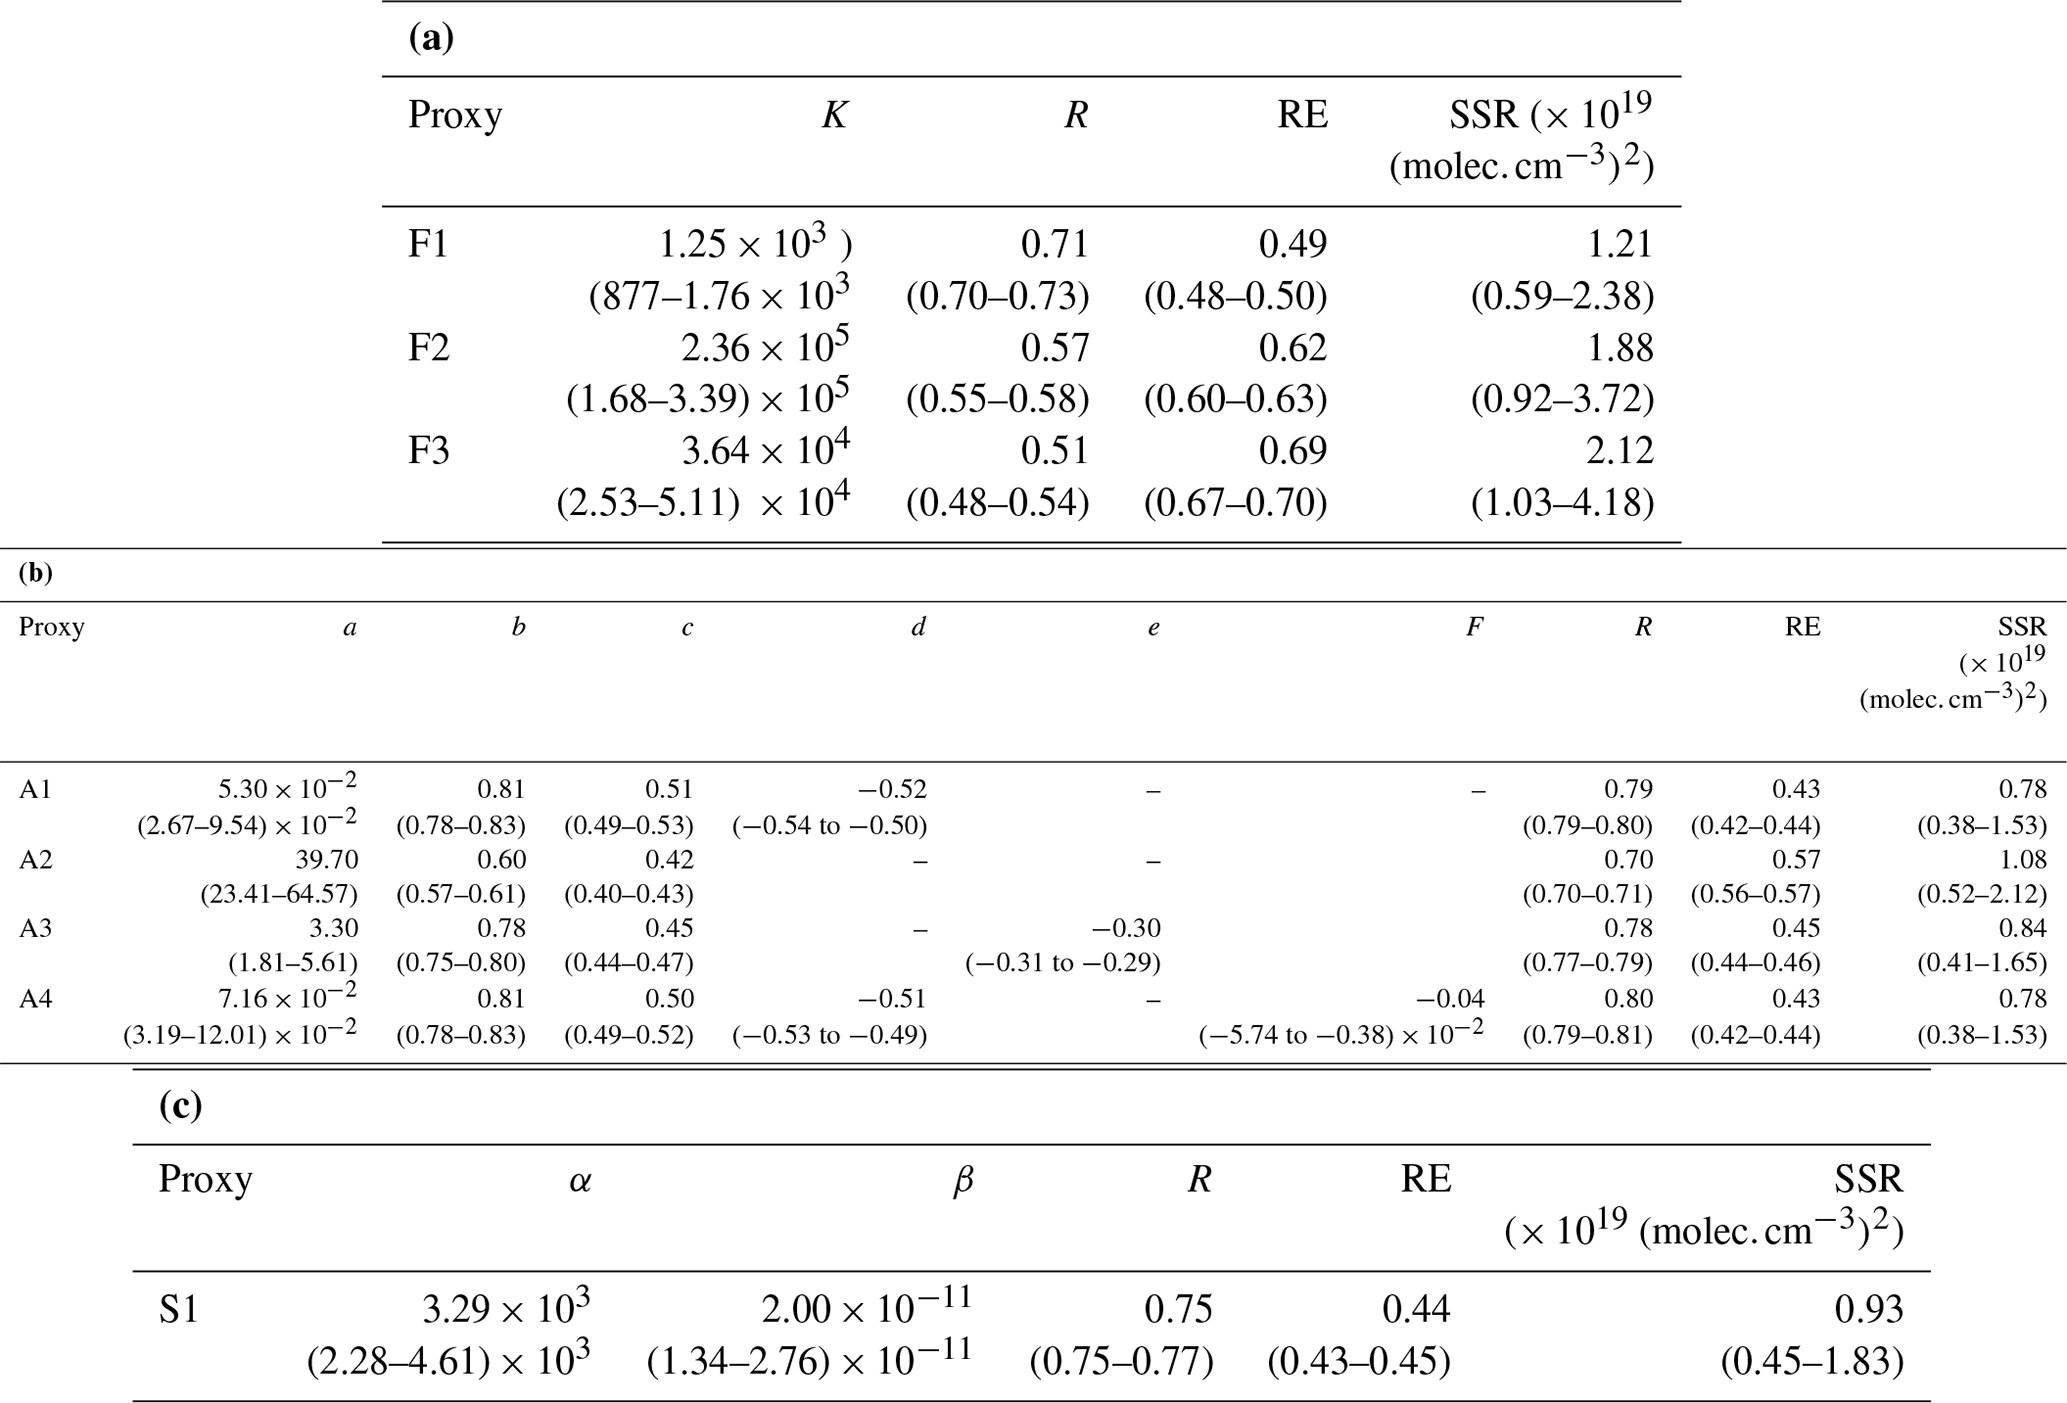
Before proceeding to the fitting, the few data points (eight in total, i.e. 0.5 % of the measurements) corresponding to SO2 > 200 ppb were removed from the OCTAVE dataset; this was due to the fact that they were observed to significantly influence the fitting procedure and, due to the limited number of measurements, probably do not represent [H2SO4] under such a large concentrations of SO2 as a whole. The results of the fitting procedure are presented in Table 3. The following discussion focuses on the fitting parameters and performance indicators (i.e. R, RE and SSR) obtained for the original dataset, but Table 3 also presents an estimate of their variability (25th and 75th percentiles) inferred from the bootstrap procedure introduced in the previous section. Note that in proxies A1–A4, the temperature-dependent reaction rate k was scaled by multiplying it by 1012 to get a more interpretable estimated for a, as previously done by Mikkonen et al. (2011).
Based on the performance indicators reported in Table 3, better overall results were obtained with proxies A1–A4 (adjusted powers) compared with F1–F3 (fixed powers), as reflected by the higher correlation coefficients (0.70–0.80 vs. 0.51–0.71) and lower REs (0.43–0.57 vs. 0.49–0.69) and SSRs (0.78–1.08 × 10¹⁹ vs. 1.21–2.12 × 10¹⁹ ). This observation is in agreement with earlier results by Mikkonen et al. (2011), who found that individual adjusted powers for the different variables improved the predictive ability of the proxies. In contrast, the lower prediction capability observed for F2 and A2 compared with F1 and A1 respectively demonstrates that, unlike in the study of Mikkonen et al. (2011), the CS seemed to play an important role in regulating [H2SO4] in the volcanic plume of the Piton de la Fournaise. The need to take the CS into account when predicting [H2SO4] was also recently highlighted by Lu et al. (2019) and Dada et al. (2020). However, we believe that although it is less accurate than A1, A2 had a very simple expression which could still be used to get fair estimates of [H2SO4] in the absence of CS measurements in the volcanic plume. The reasonable results of A2 also indicate that [SO2] and global radiation alone were capable of explaining a significant fraction of the variation in the sulfuric acid concentration under plume conditions, which was consistent with the relatively strong correlation observed between [H2SO4] and these two variables (0.45 and 0.68 for [SO2] and global radiation respectively; Fig. S1 in the Supplement). Including RH in F3 and A3 did not improve the results compared to F1 and A1. This observation either suggests that the inclusion of RH in the proxies was not adequate or that RH only had a minor effect on the sink term. Different inclusion of RH was tested in proxy A4 but led to very similar results to A1, including identical prediction capability and similar powers for the variables that they have in common. Thus, this observation suggests a minor role of RH on the sink regulating [H2SO4] production, in spite of the relatively high negative correlation observed between [H2SO4] and RH (−0.58, Fig. S1), and contrasts with the results obtained by Mikkonen et al. (2011), who noticed a better performance of the proxies when taking RH into account under regular conditions. Finally, the comparison of proxies F1 and S1 showed an improvement of the proxy including the additional cluster sink term in comparison with the simple proxy, which already had a good predictive ability, but the overall performance of S1 remained slightly lower compared with that of A1. However, whether the overall better performance of A1 was due to the adjusted powers for the different variables, minor role or inadequate formulation of the cluster sink term in S1, remains unknown. In fact, we cannot exclude that the formulation of this additional sink term, which assumes that cluster formation mainly occurs via the stabilization of H2SO4 by bases and was only tested under regular conditions (see Dada et al., 2020, and references therein), was not fully adapted to the specific conditions of the volcanic plume, because of the high concentration of sulfuric acid relative to the presence of bases.
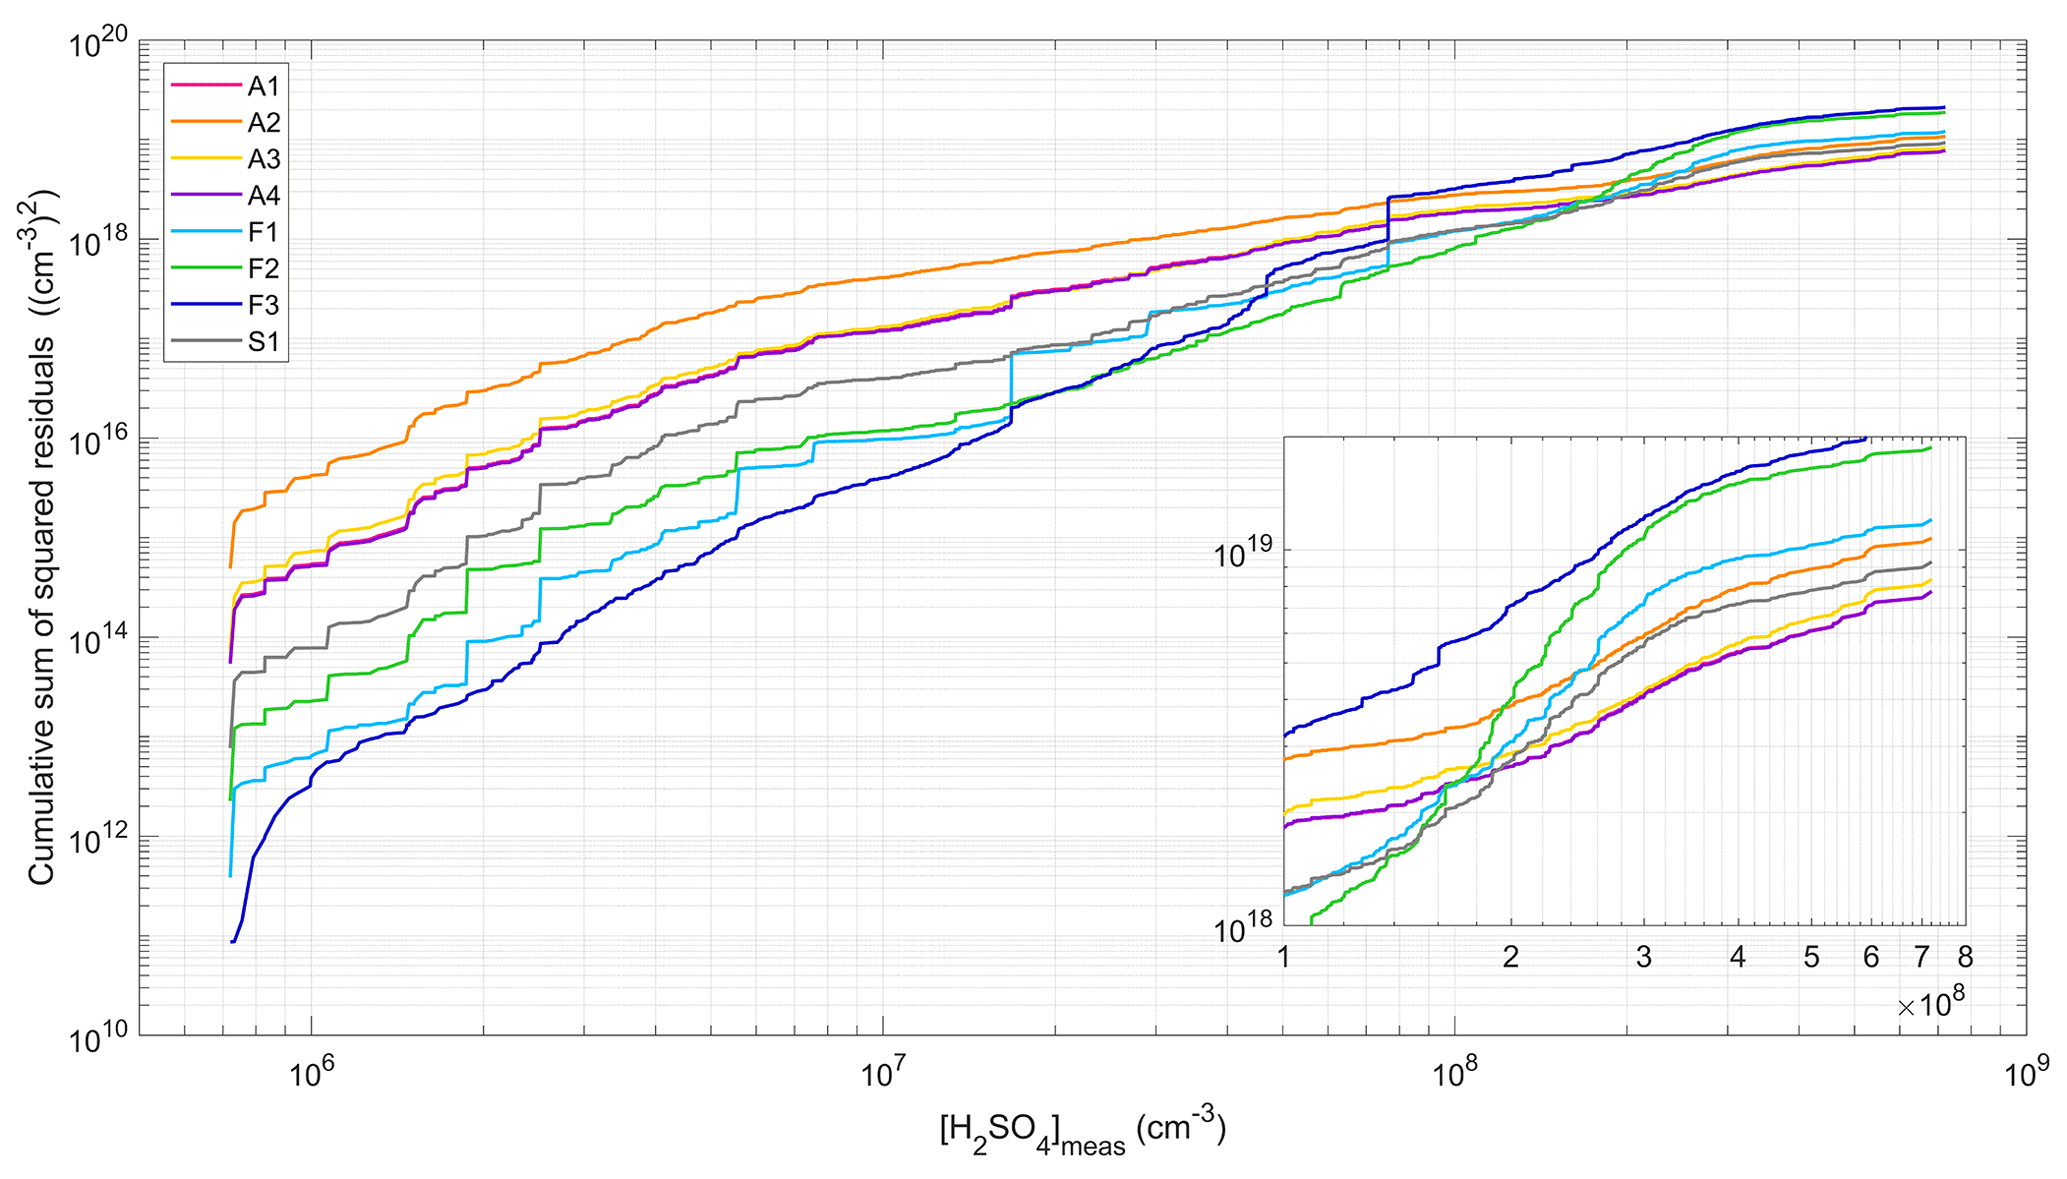
Figure 4Cumulative sum of squared residuals associated with the different proxies. The insert presents a zoomed in section of the results obtained for [H2SO4] > 1 × 108 cm−3.
The preceding analysis was in a first approach exclusively based on the performance indicators calculated for each proxy. However, these indicators mainly reflect the capability of the proxies to predict the highest [H2SO4], as those logically have a very strong impact on the fitting procedure. While these high H2SO4 levels, characteristic of the volcanic plume conditions, were the main scope of this study and, in turn, the target of the newly developed proxies, deeper analysis of the performance of the different proxies over the entire range of measured [H2SO4] was performed in a second step. Figure 3 shows, for each proxy, the scatter plot between measured and predicted [H2SO4]. Correspondingly, Fig. 4 presents the cumulative sum of the squared residuals, which is used to illustrate the discrepancy between observed and predicted values throughout the range of measured [H2SO4] and to further point out that the overall performance of the proxies is determined by their capacity to predict the highest [H2SO4]. As shown in Fig. 4, sharp increases in the cumulative SSR were associated with a few points, indicating strong discrepancies between the corresponding observed and predicted concentrations. These were simultaneously observed for most of the proxies but were more pronounced on average for proxies F1–F3. A possible explanation for that was the power of 1 (or −1) attributed to all of the variables included in these proxies, which likely made the discrepancy caused by an extreme value of any of these variables stronger than for the proxies using lower powers (in terms of absolute value). Thus, this last observation highlights the fact that the interpretation of the SSR must be conducted carefully and crossed with other indicators (such as R or RE), as done in the first part of the analysis, or in light of an additional view of the data, as done below.
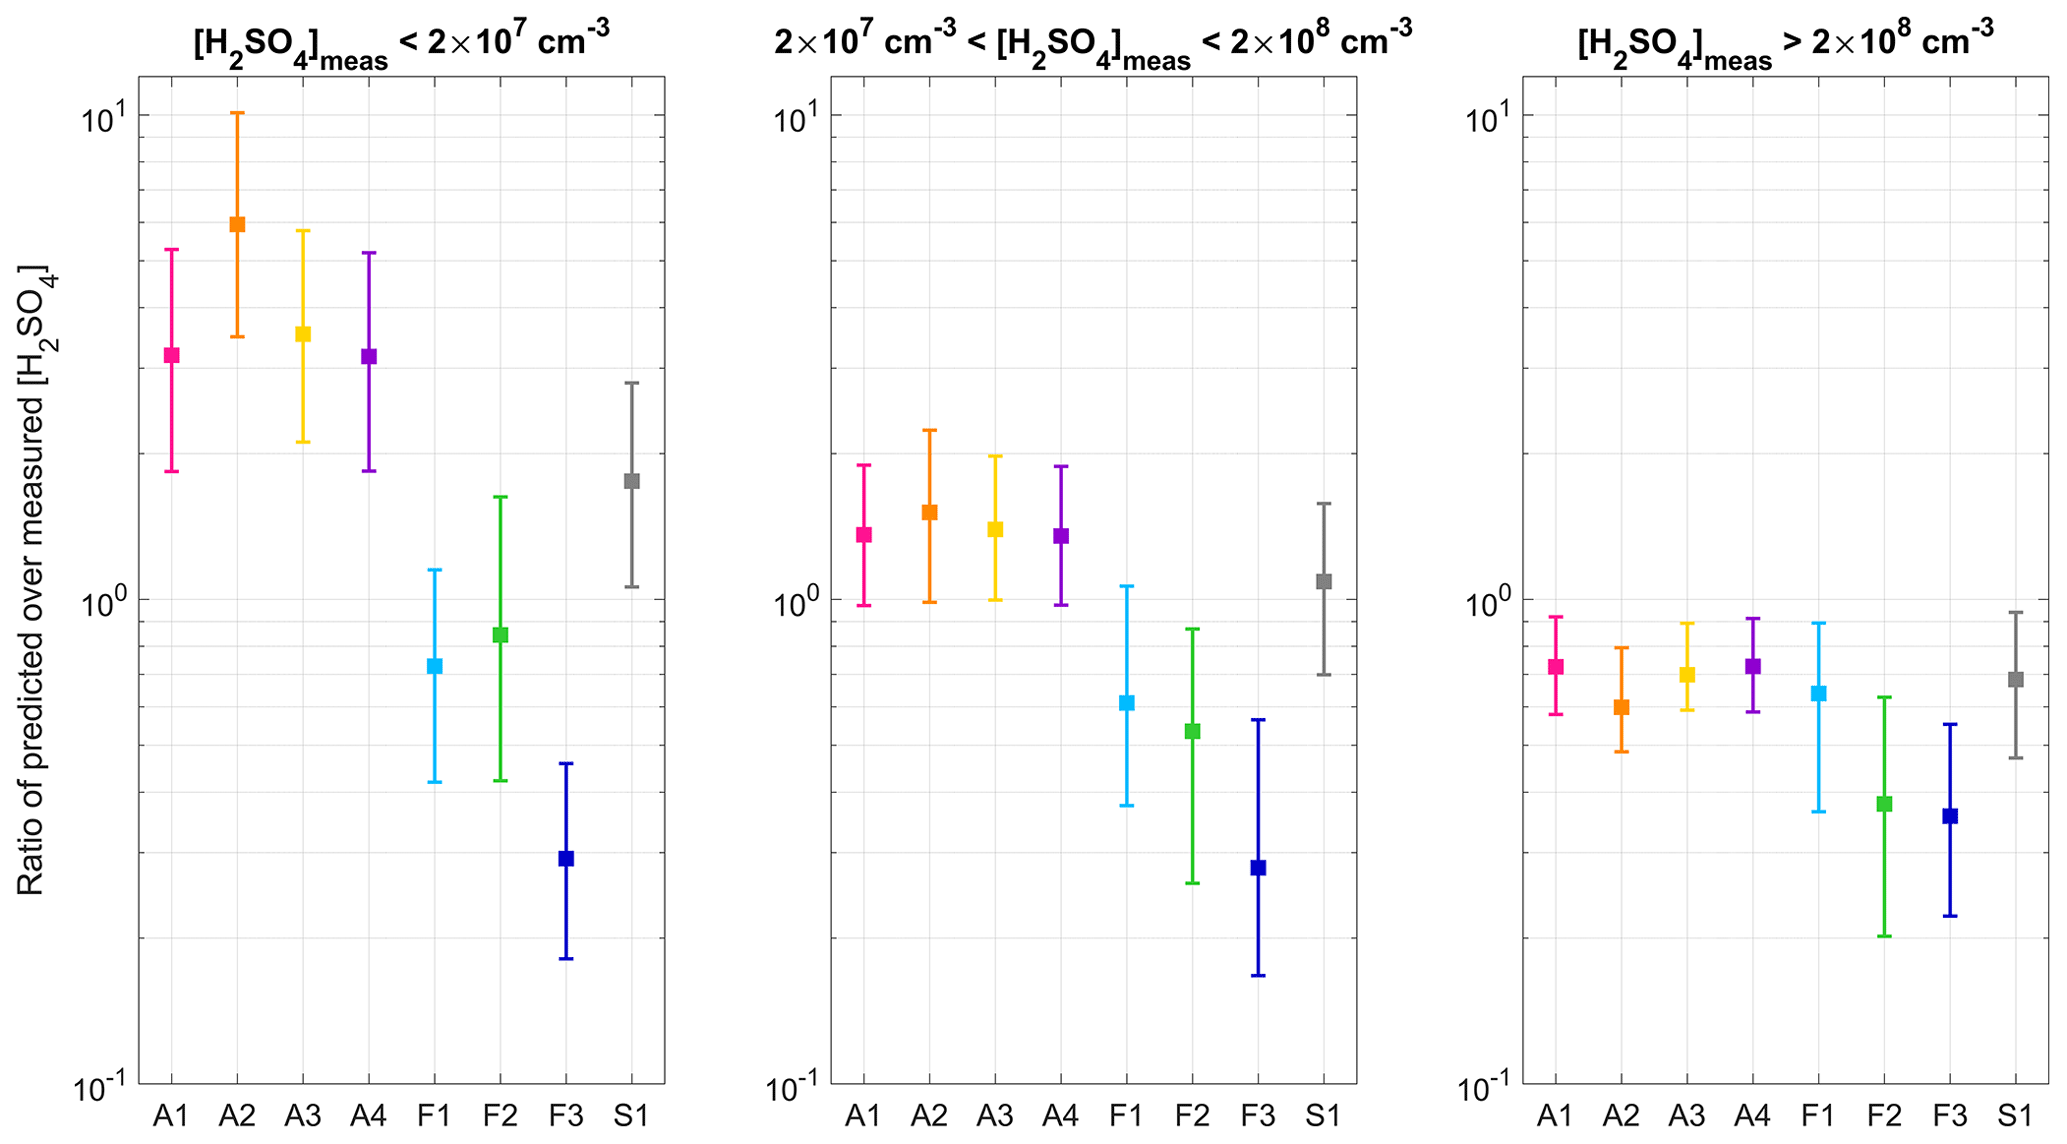
Figure 5Ratio between predicted and measured [H2SO4] in the different [H2SO4] subranges. For each proxy, the marker represents the median of the ratio, and the lower and upper limits of the error bars indicate the 25th and 75th percentiles respectively.
Based on Figs. 3 and 4, three situations could be distinguished in the comparison of the proxies, corresponding to three subranges of measured [H2SO4]. Figure 5 presents, in all three subranges and for each proxy, the median (as well as the 25th and 75th percentiles) of the ratio between predicted and measured [H2SO4]. As evidenced in Figs. 3 and 5, F1, F2 and, more importantly, F3 tended to underestimate [H2SO4] in all subranges. In the case of F3, the systematic underestimation of the observations suggests that the sink resulting from the inclusion of RH along with the CS with the same weight as the source term was too high. However, besides F3, which had the worst results over the whole range of measured [H2SO4], F1 and F2 gave the best predictions for [H2SO4] below 2 × 107 cm−3. In contrast, A1–A4 tended to overestimate these concentrations by factors of between 3 and 6, with the largest discrepancies observed for [H2SO4] < 1 × 107 cm−3 (up to an average of 1 order of magnitude for A2 and, for instance, up to 3 orders of magnitude higher cumulative sum of squared residuals for A2 compared with F1). The predictive ability of S1 was intermediate compared with that of the other proxies, with predicted concentrations slightly overestimated on average (factor of 1.8). The second [H2SO4] subrange, between 2 × 10⁷ and 2 × 108 cm−3, was the one for which all proxies (with the exception of F3) gave the most comparable results. The predictions of S1 were on average the closest to measured values, but they were more dispersed compared with those of A1–A4, which also performed well over this range and retrieved [H2SO4] within a factor of 1.4–1.5 of observations. While remaining close to measured values, the predictions of F1 and F2 were on average slightly less accurate than for the lower concentrations. Over the last [H2SO4] subrange, which was, to a large extent, influencing the overview retrieved by the performance indicators reported in Table 3, the worst results were obtained for F2 and F3. As shown in Fig. 5, the median ratio of predicted over measured [H2SO4] calculated for F1 was, in contrast, relatively close to unity (0.6) and to the median ratios calculated for A1, A3, A4 and S1. However, the predictions of F1 were more dispersed compared with those of the above-mentioned proxies, as illustrated in Fig. 3 and also reflected by the cumulated SSR in Fig. 4, thereby explaining its slightly lower performance depicted in Table 3. Finally, A2, which did not include any sink term, showed the most pronounced deviations over A1–A4 in all three [H2SO4] subranges, further supporting the need to take the CS into account when available. Thus, this deeper analysis confirmed the good performance of A1, A3 and A4 over the range of [H2SO4] which was the most relevant for the plume conditions. However, as already noticed, the advantage of using A3 and A4 was limited, as they both required knowledge of an additional variable (RH) which had almost no effect on the predictions. Besides A1, S1 also appeared to be a good option. In fact, this proxy showed a better predictive ability for [H2SO4] below ∼ 2 × 108 cm−3 (up to 1 order of magnitude lower cumulative SSR), while also performing well at larger concentrations.
As a sensitivity test, an attempt to replace global radiation with the product Rad × [O3] was made in all of the proxies in order to investigate if the explicit consideration of O3, the photolysis of which is the main pathway for OH formation during daytime, would allow for the further optimization of the prediction of [H2SO4]. The corresponding results are reported in the Supplement (Table S1 and Figs. S3 and S4 in the Supplement), but do not highlight any improvement in the performance of the proxies, which, with the exception of A2, all display worse performance indicators than when considering global radiation alone. Limited improvement in the predictive ability of the proxies was also noticed by Lu et al. (2019) when considering [O3] with UVB in the urban atmosphere of Beijing, where the concurrent inclusion of [HONO] seemed, in contrast, to be more critical.
As a last step, we finally compared the predictions of proxies A1 and S1 with the results obtained with the proxy developed by Mikkonen et al. (2011) (hereafter referred to as MIK), whose expression is recalled below:
where k still corresponds to the temperature-dependant reaction rate between SO2 and OH. This proxy was recently used by Rose et al. (2019) to predict [H2SO4] in the volcanic eruption plume of the Piton de la Fournaise in the absence of direct measurements. While S1 had a slightly different structure, A1 was developed using the same approach as for MIK, and similar features were observed in the two proxies, although they were initially dedicated to the description of different environments. As noticed earlier by Mikkonen et al. (2011), power b for global radiation was nearest to unity in A1 (0.81), thereby indicating that, as under regular conditions, radiation was the main driving force for H2SO4 production in the volcanic plume, consistent with the high correlation already highlighted between [H2SO4] and global radiation (Fig. S1). Furthermore, as previously observed by Mikkonen et al. (2011) and Lu et al. (2019), power c for [SO2] was less than unity (0.51), and power d for the CS was closer to zero (−0.52) than assumed in Eq. (5) (and, in turn, proxy F1). Under the conditions of the volcanic eruption plume of the Piton de la Fournaise, this discrepancy between observations and theory was likely explained, at least to a certain extent, by a connection between the CS and [SO2], despite the absence of a statistically significant correlation between these two variables during OCTAVE (Fig. S1). The CS enhancement observed under plume conditions at Maïdo was, however, previously reported to result mainly from secondary aerosol formation processes, which are expected to be tightly connected to H2SO4 and, in turn, SO2, under such conditions (Rose et al., 2019).
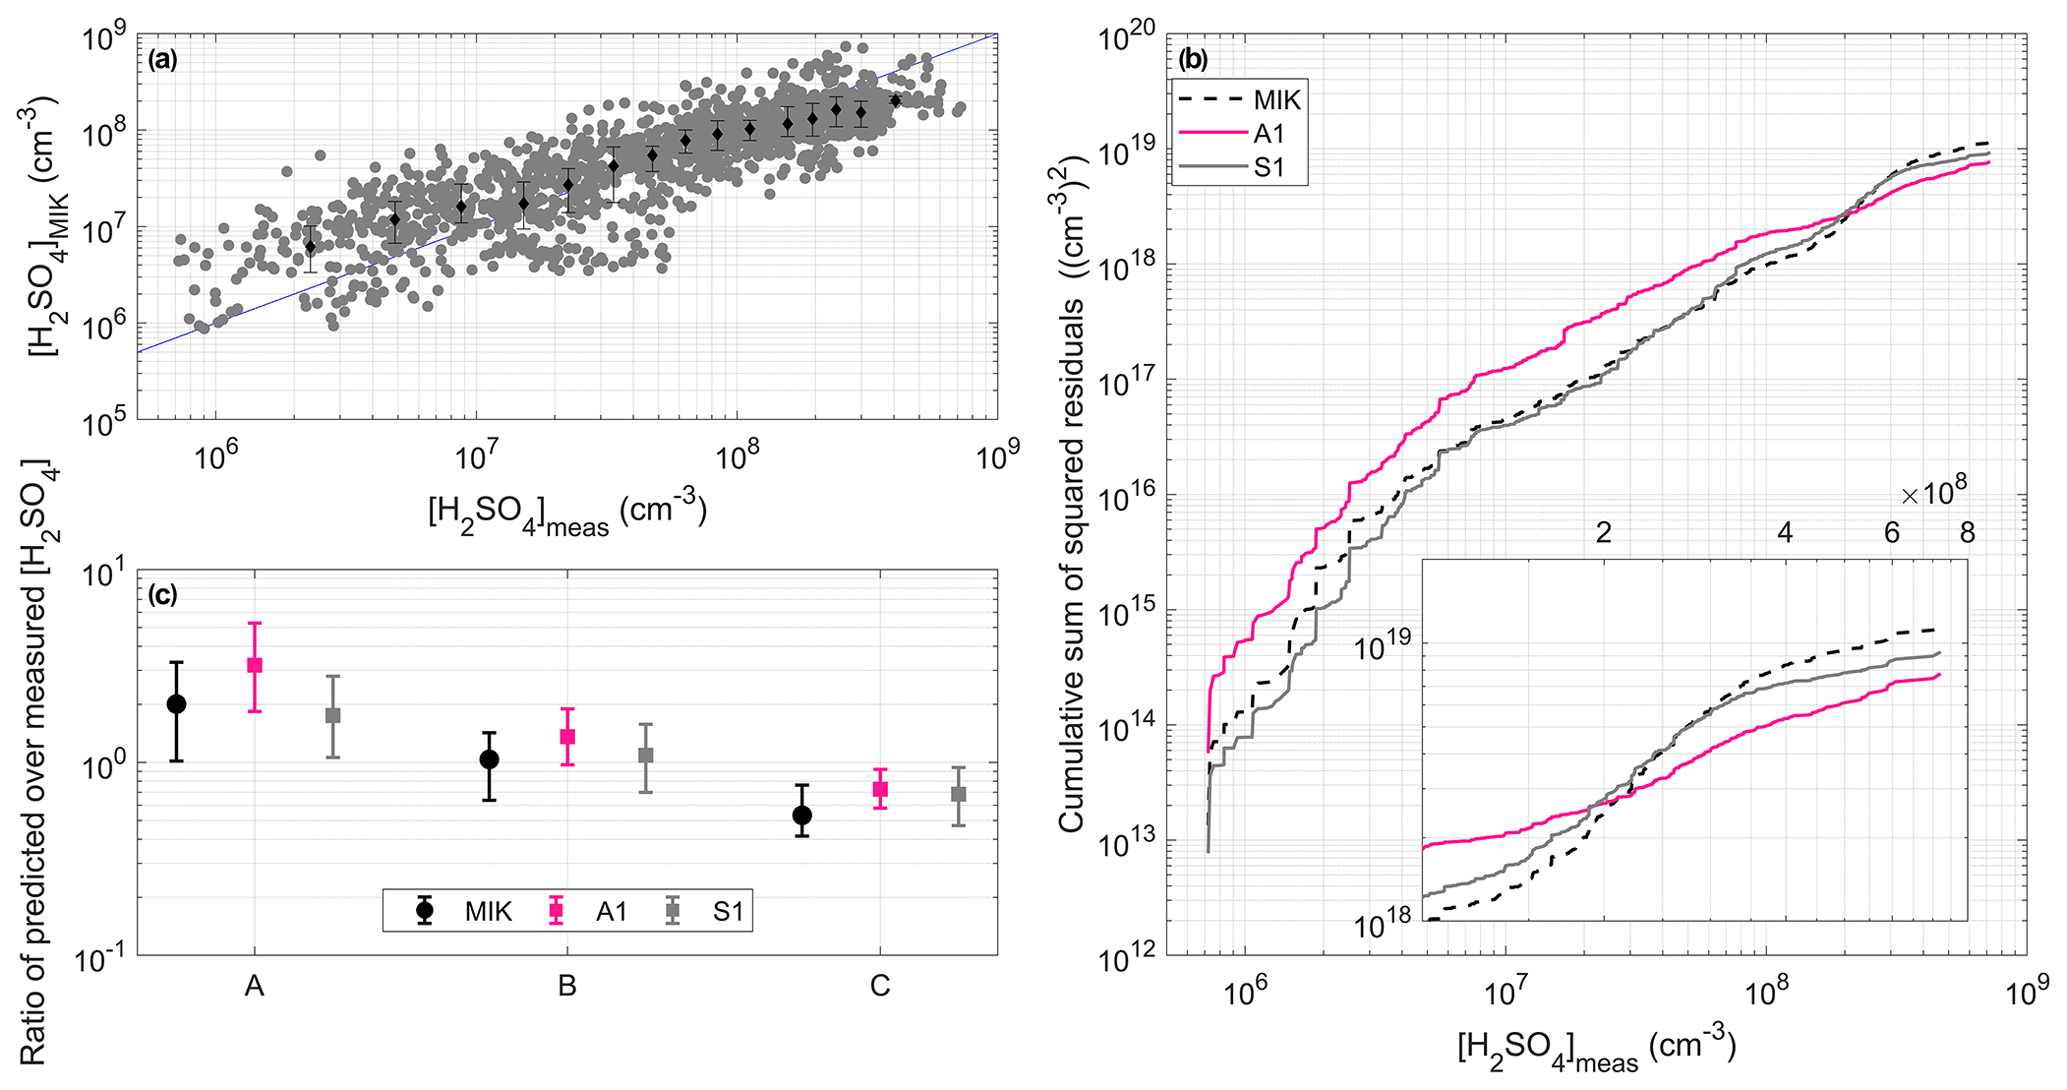
Figure 6Comparison between the results obtained with MIK and the predictions derived from A1 and S1. (a) Predictions retrieved by MIK as a function of measured [H2SO4]. The data points were also divided into 15 bins with an equal number of data points based on measured [H2SO4]. The medians (markers) and the 25th and 75th percentiles (error bars) of [H2SO4] predicted in each bin are also shown. (b) Cumulative sum of squared residuals associated with MIK, A1 and S1. The insert presents a zoomed in section of the results obtained for [H2SO4] > 1 × 108 cm−3. (c) Ratio between predicted and measured [H2SO4] in the different [H2SO4] subranges, with A corresponding to [H2SO4] < 2 × 107 cm−3, B corresponding to [H2SO4] between 2 × 10⁷ and 2 × 108 cm−3, and C corresponding to [H2SO4] > 2 × 108 cm−3. For each proxy, the marker represents the median of the ratio, and the lower and upper limits of the error bars indicate the 25th and 75th percentiles respectively.
Despite its similarity with A1, the behaviour of MIK was generally more comparable to that of S1 (R = 0.70, RE = 0.48 and SSR = 1.14 × 10¹⁹ ), with improved performance in comparison with that of A1 for [H2SO4] ≲ 2 × 108 cm−3 and slightly decreased prediction capability above this threshold (Fig. 6). In particular, MIK showed the best ability to reproduce [H2SO4] in the range between 2 × 10⁷ and 2 × 108 cm−3, while being slightly less accurate on average compared with S1 at lower concentrations, with a median ratio of 2.0 between predicted and measured values. At higher concentrations, the predictions of MIK were slightly more underestimated compared with that of A1 and S1, but they remained, on average, within a factor of 1.9 of measured values (1.4 and 1.5 for A1 and S1 respectively).
All in all, these results suggest that the newly developed proxies A1 and S1 slightly improved the predictions of the high [H2SO4] encountered in volcanic plumes, but they also demonstrate the relatively good ability of the proxy developed earlier by Mikkonen et al. (2011) to reproduce these concentrations. This last observation gives further confidence in the results recently obtained by Rose et al. (2019), who used this last proxy for the investigation of NPF in the volcanic plume of the Piton de la Fournaise.
4.2 Additional evaluation of the proxies using data collected in the passive degassing plume of Etna during STRAP
As mentioned above, the first part of flight ETNA 13, performed between 10:43 and 11:00 UTC on 15 May, was selected for further evaluation of the newly derived proxies. As shown in Sect. 2.3, the conditions encountered during this part of the flight were, for most of the investigated variables, comparable to the average conditions observed in the volcanic plume of the Piton de la Fournaise. However, unlike during OCTAVE, most of these variables only showed very limited variability. Specifically, [H2SO4] values measured in the passive degassing plume of Etna were mainly above 2 × 108 cm−3, i.e. among the highest concentrations measured during OCTAVE and in the [H2SO4] range where contrasting performances have previously been observed for the different proxies.
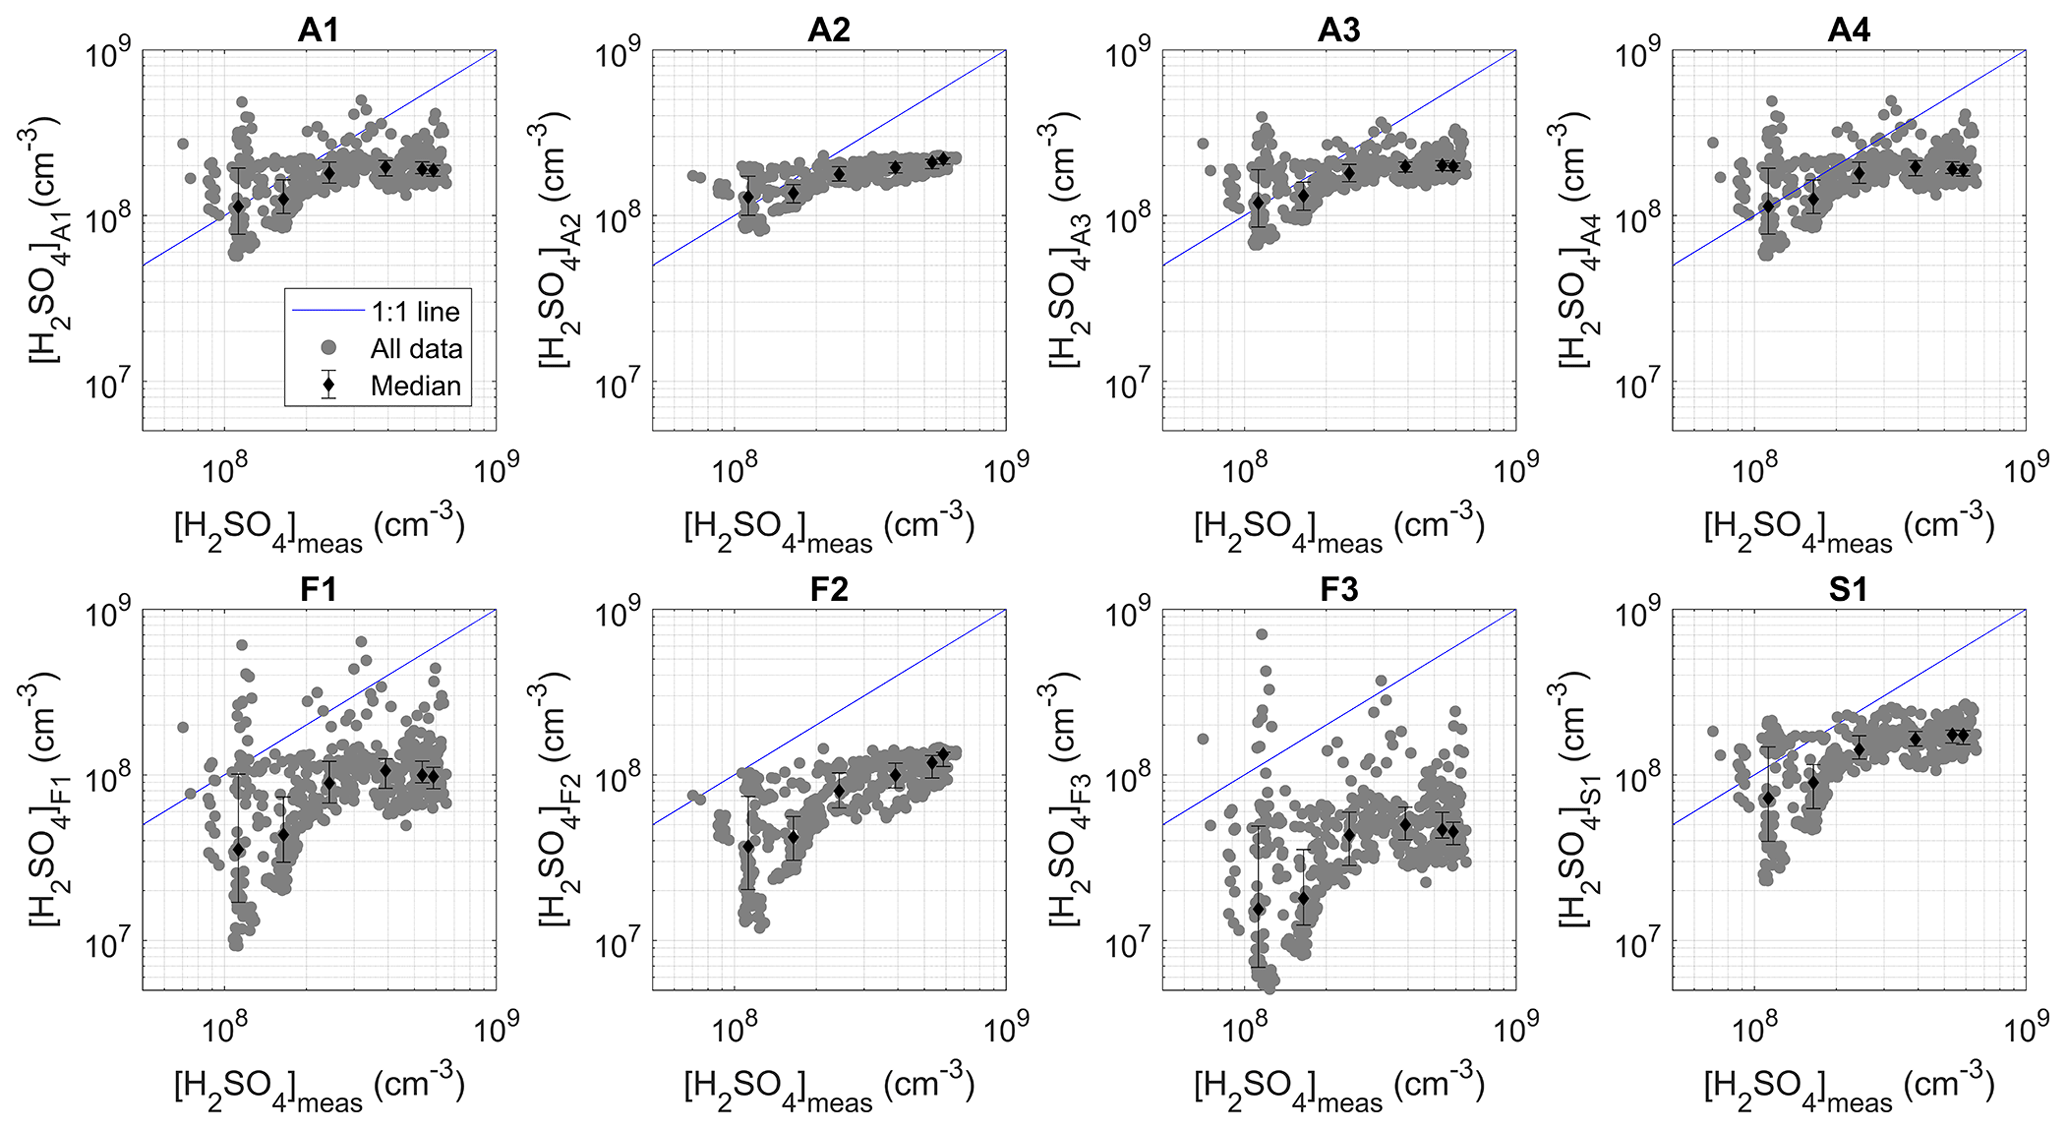
Figure 7Predictions retrieved by the different proxies as a function of [H2SO4] measured during STRAP. The data points were also divided into six bins with an equal number of data points based on measured [H2SO4]. The medians (markers) and the 25th and 75th percentiles (error bars) of [H2SO4] predicted in each bin are also shown.

Figure 8(a) Ratio between predicted and measured [H2SO4], separately for the concentrations below and above 3 × 108 cm−3. For each proxy, the marker represents the median of the ratio, and the lower and upper limits of the error bars indicate the 25th and 75th percentiles respectively. (b) Cumulative sum of squared residuals associated with the different proxies.
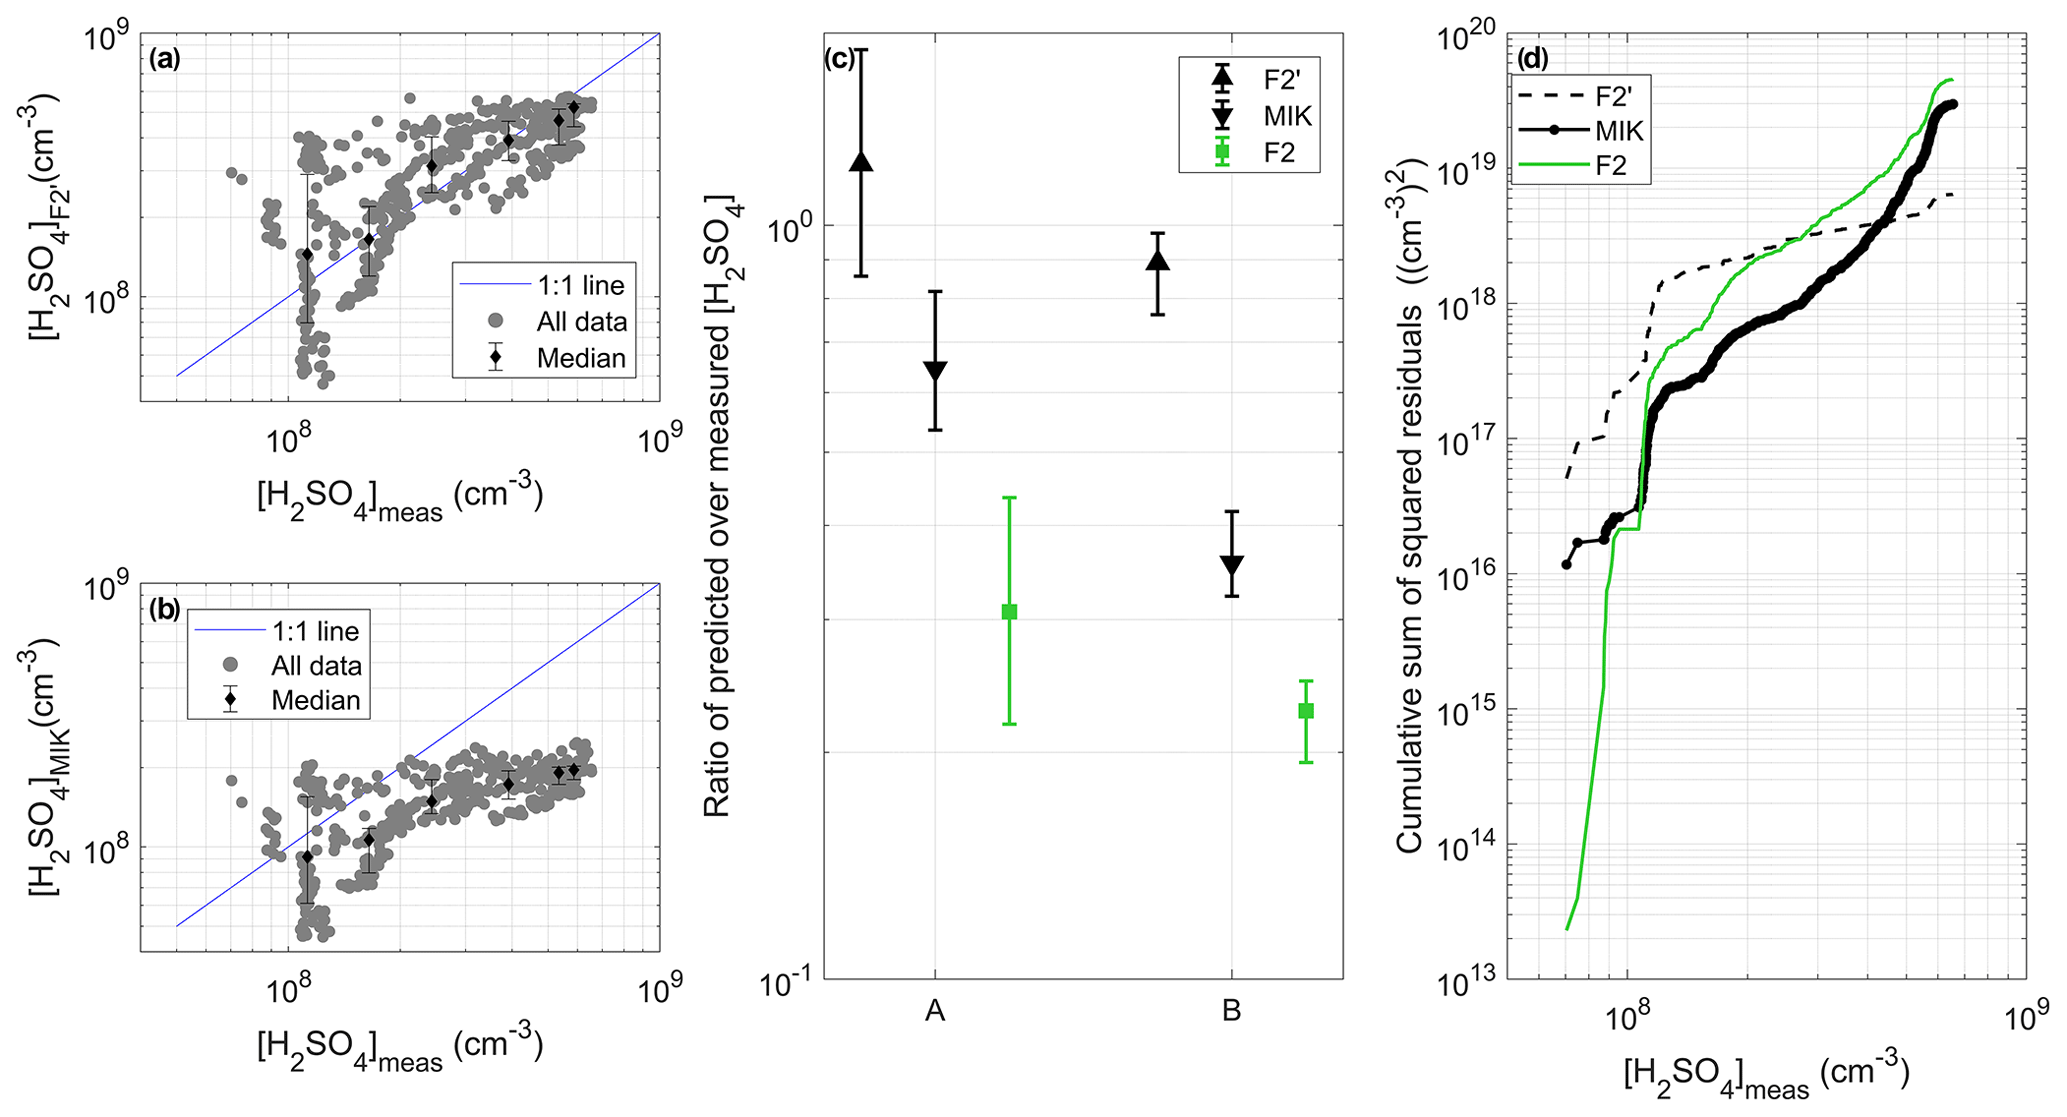
Figure 9(a) Predictions retrieved by the proxy F2' as a function of [H2SO4] measured during STRAP. Panel (b) is the same as panel (a) but for MIK. In panels (a) and (b), the data points were also divided into six bins with an equal number of data points based on measured [H2SO4]. The medians (markers) and the 25th and 75th percentiles (error bars) of [H2SO4] predicted in each bin are also shown. (c) Ratio between predicted and measured [H2SO4], separately for the concentrations below (corresponding to A) and above (corresponding to B) 3 × 108 cm−3. The results obtained with F2 are also reported for direct comparison. For each proxy, the marker represents the median of the ratio, and the lower and upper limits of the error bars indicate the 25th and 75th percentiles respectively. (d) Cumulative sum of squared residuals associated with the different proxies.
Table 4The ability of the newly developed proxies to predict [H2SO4] measured during the ETNA 13 flight. For each proxy, R is the correlation coefficient (Pearson) between predicted and observed [H2SO4], RE is the relative error and SSR is the sum of squared residuals. Note that based on corresponding p values, all correlations were found to be significant (p < 0.05).
As shown in Figs. 7 and 8, proxies F1–F3 were found to systematically underestimate [H2SO4] and were, in turn, associated with higher RE and SSR compared with the other proxies (Table 4). The highest correlation coefficient was, however, obtained for F2 (R = 0.80), closely followed by A2 (R = 0.77), which both did not include any sink term. As illustrated in Fig. 7, this strong correlation between calculated and observed [H2SO4] was likely explained by the fact that the predictions of F2 and A2 were less dispersed overall compared with those of A1, A3 and A4 and, more importantly, F1 and F3, for which the dependence of predicted [H2SO4] on the CS was the strongest (power −1) and resulted in the lowest correlation coefficients. While the inclusion of the CS itself may be called into question by the previous results, these observations also more importantly raise questions regarding the relevance of the further application of fitting parameters derived from OCTAVE in the STRAP dataset. In fact, as mentioned in Sect. 2.3, the CSs were not calculated over the same size range in the two datasets (10–600 nm during OCTAVE and 90–3000 nm during STRAP), and the values calculated for STRAP were likely a lower limit of the actual sink. Furthermore, in spite of the significant correlation observed between the CS and [SO2] (Fig. S2 in the Supplement), the origin of the CS during STRAP might have been less connected to the plume than during OCTAVE and instead more related to the intrusion of more polluted boundary layer air masses at higher altitude, as suggested by the strong link between the CS and RH (Fig. S2). Consequently, the hypothesis of a common origin for the CS and [SO2] explaining the “balance” observed between the powers of these two variables in A1, A3 and A4 may not have held during STRAP. Regarding the last investigated proxy, S1, somewhat intermediate performance was observed, as previously noticed in the OCTAVE dataset. Indeed, the predictions of S1 were generally closer to measurements compared with those of F1–F3 and were not as good as those of A1–A4 on average, as reflected by the corresponding RE and SSR (Table 4). On the other hand, the correlation coefficient obtained for S1 (R = 0.60) was in between the high values obtained for F2 and A2 and those of the remaining proxies.
Besides the CS, which had an obvious effect on the predictions, it was concurrently seen that improved correlations between predicted and observed [H2SO4] were obtained when the dependence on [SO2] was the highest in the proxies, as illustrated in particular by the stronger correlation obtained for F2 compared with A2. This result was consistent with SO2 being the main driver of [H2SO4] variability in the context of STRAP, as suggested by the strong correlation observed between [SO2] and [H2SO4] (Fig. S2), which is also reflected on the time series presented in Fig. 2a. Note that for [SO2], each single reported observation was actually the result of the past 20 s of measurement, thereby explaining the smoother apparent variations compared with that of [H2SO4]. Thus, based on these last observations, it was highly probable that in A1, A3 and A4, in addition to the already mentioned possible issues related to the inclusion of the CS in the proxies, the dependence on [SO2] was too weak to properly reproduce the high [H2SO4] observed in the context of STRAP. As illustrated in Fig. 8a, the predictive ability of A1–A4 was particularly decreased for [H2SO4] > 3 × 108 cm−3, thereby suggesting that, among other possible factors, the dependence of [H2SO4] on [SO2] was not well represented over this range of concentrations. Note that a possible effect of RH and global radiation could not be excluded. However, we believe that inadequate fitting parameters for these two variables would have equally affected all predicted concentrations due to their limited variability. This was, for instance, illustrated for F3, in which the inclusion of RH led to a systematic underestimation of the concentrations and a relatively constant difference with the predictions of F1 over the whole range of measured [H2SO4].
In the case of F1–F3, which had a stronger dependence on [SO2], the average ratio between predicted and observed [H2SO4] was, in contrast, more comparable below and above the identified threshold concentration. This observation suggested that the predictions of these proxies, although obviously affected by the inclusion of the CS and/or RH, could primarily be systematically underestimated due to inadequate values of the pre-factor K. This hypothesis was tested for F2, which had the simplest formulation and displayed the closest ratios (0.31 and 0.23) on both sides of the threshold concentration. For that purpose, the fitting procedure was repeated for F2 using the STRAP data to derive F2', and the adjusted pre-factor K′ (9.27 × 10⁵) significantly improved the results compared with those derived from OCTAVE, as illustrated in Fig. 9 (R = 0.80, RE = 0.26 and SSR = 0.64 × 10¹⁹ ). Note that the evaluation of a possible systematic error related to the measurement accuracy of [H2SO4] and predictor variables on the fitting parameters and performance indicators was omitted from this last test, the purpose of which was simply to get an estimate of the improvement in proxy performance related to the derivation of location-specific coefficients. As a last analysis, the predictions of F2' were finally compared to those of MIK (Fig. 9), which were less accurate on average and logically more comparable to those of A1, A3 and A4, due to their very similar structures. The correlation between predicted and observed [H2SO4] was higher for MIK (R = 0.72) compared with A1, A3 and A4, as a likely result of the lower power of the CS in MIK (−0.13 in MIK against −0.52, −0.30 and −0.51 in A1, A3 and 14 respectively), which otherwise displayed similar RE and SSR values (0.57 and 2.98 × 10¹⁹ respectively).
All in all, these last results demonstrate the ability of the proxies derived from OCTAVE to fairly predict [H2SO4] in the plume of Etna, but they concurrently highlight a limited improvement of the predictions compared with MIK. Together with the improved performance of F2' over F2, this observation illustrates that in volcanic plumes, as in other environments, location-specific coefficients do logically increase the ability of the proxies to reproduce measured concentrations.
Measurements recently performed in the volcanic plumes of the Piton de la Fournaise and Etna have featured sulfuric acid concentrations approaching 109 cm−3. These concentrations are, to our knowledge, the highest ever recorded in the atmosphere and have, in turn, motivated the present work, the main objectives of which were to (1) investigate the performance of the proxies available in the literature for the prediction of [H2SO4] under these conditions and (2) develop proxies adapted to these very specific conditions.
Data collected at Maïdo (Réunion) in the plume of the Piton de la Fournaise, during the OCTAVE campaign which took place in March–May 2018, were used in a first approach. We generally followed the same approach as Mikkonen et al. (2011) to develop proxies able to predict daytime [H2SO4] (global radiation > 10 W m−2), assuming that oxidation of SO2 by the hydroxyl radical OH was the only source of H2SO4 and that [OH] could be replaced by global radiation for simplicity. In a first approach, the condensation sink (CS) was considered as the only sink contributing to the balance of [H2SO4] to derive seven proxies based on the knowledge of SO2 mixing ratios, global radiation and CS. In addition, the inclusion of RH in the sink term was tested in several formulations. In three of the seven proxies (F1–F3), power 1 or −1 was attributed to all included variables, thereby giving them equal weight in the prediction of [H2SO4], whereas adjusted powers were allowed for the different variables in the remaining four proxies (A1–A4). In light of the recent work of Dada et al. (2020), a last expression was tested, S1, which includes an additional sink term related to molecular cluster formation.
Proxies A1–A4 were found to perform better overall compared with F1–F3 in the plume of the Piton de la Fournaise, with, in particular, improved predictive ability for [H2SO4] > 2 × 108 cm−3. The CS was observed to play an important role in regulating [H2SO4], but proxy A2, which did not include the CS contribution, was also able to retrieve fair estimations of [H2SO4], thereby indicating that such a simple expression could be used in the absence of aerosol data. The reasonable results obtained with A2 concurrently demonstrated that (as also observed under regular conditions) SO2 and global radiation alone were capable of explaining a significant fraction of the variation in the sulfuric acid concentration, which is consistent with the strong connection found between [H2SO4] and these key variables. In contrast, the inclusion of RH, either with the CS or with a separate power, did not improve the performance of proxies A3 and A4 respectively compared to A1. This observation suggested a limited effect of RH on the sink regulating H2SO4 production, in spite of the relatively high negative correlation observed between these two variables. More importantly, power −1 attributed to RH in proxy F3 led to a systematic underestimation of [H2SO4]. Finally, proxy S1, which had a somewhat different structure compared with the other proxies and included the additional cluster sink term, also showed a very good predictive ability, close to that of A1 for [H2SO4] > 2 × 108 cm−3 but, on average, higher at smaller concentrations. The capacity of the proxy initially developed by Mikkonen et al. (2011) for the prediction of [H2SO4] under regular conditions to also reproduce [H2SO4] in the plume of the Piton de la Fournaise was finally evaluated against A1 and S1. Despite being lower on average compared with that of the newly developed proxies, the predictive ability of the proxy from that work appeared to be surprisingly good, often close to that of S1.
In a second step, the newly developed proxies were tested on a different dataset, collected on 15 May in the passive degassing plume of Etna, during the first part of flight ETNA 13 (10:43 and 11:00 UTC, i.e. LT − 2 h) performed in the framework of the STRAP campaign. This specific time period was selected as several latitudinal plume transects were performed at constant altitude (∼ 2900 m) at distances between ∼ 7 and 39 km from the vent, resulting in very clear variations in [H2SO4]. Moreover, while only showing little variability, the conditions encountered during this part of the flight were, for most of the investigated variables, similar to the average conditions observed in the plume of the Piton de la Fournaise. In the case of Etna, increased correlations between observed and predicted sulfuric acid concentrations were obtained when the dependence of predicted [H2SO4] on the CS was the lowest and when the dependence on [SO2] was concurrently the highest. In fact, the presence of the CS in the proxies resulted in scattered predictions, and underestimated power for [SO2] was observed to affect their predictive ability, in particular for [H2SO4] > 3 × 108 cm−3. As also seen for the volcanic eruption plume of the Piton de la Fournaise, albeit to a lesser extent, the proxy of Mikkonen et al. (2011) was able to provide reasonable predictions of [H2SO4] on the STRAP dataset, which were very close to those of A1, A3 and A4. The best predictions were finally retrieved by the simple formulation of F2 (which did not consider the CS and had the maximum possible dependence on [SO2]), with a pre-factor adapted to the STRAP data.
All in all, our results illustrate the fairly good capacity of the proxy developed by Mikkonen et al. (2011) to also describe [H2SO4] under volcanic plume conditions, but we concurrently highlight the benefit of the newly developed proxies dedicated to these specific conditions for the prediction of the highest concentrations ([H2SO4] > 2–3 × 108 cm−3). Moreover, the contrasting predictive ability of the new proxies on the two different datasets, OCTAVE and STRAP, indicates that in volcanic plumes, as in other environments, the relevance of a proxy can be affected by changes in environmental conditions, including, in this particular case, the type of plume (e.g. passive vs. eruptive), in connection with the variable nature of the volcanic eruptions. Thus, as in other environments, location-specific coefficients logically improve the predictive ability of the proxies under the above-mentioned conditions.
DMPS data as well as NOx and O3 mixing ratios from Maïdo are available from the EBAS Data Centre. Meteorological parameters, SO2 mixing ratios and CI-APi-TOF data are available from the corresponding author upon request. Measurements performed in the framework of STRAP are available on the STRAP website (http://osur.univ-reunion.fr/recherche/strap/database/, OSU-Réunion, 2021).
The supplement related to this article is available online at: https://doi.org/10.5194/acp-21-4541-2021-supplement.
JB, AC and MPR contributed to the coordination of the OCTAVE 2018 campaign, and MK provided additional financial support with respect to travel costs during the campaign. KS and PT contributed to the coordination of the STRAP project. CR, MPR, SI, AC, XCH, JL, YJT, DW, JMM and PT performed the measurements during the OCTAVE campaign, and KS, AC, RD and JD performed measurements during the STRAP campaign. CR, MPR, SI, JD, CY, JBN, AC, RD and KS analysed the data. CR and MPR wrote the paper. All co-authors contributed to reviewing the paper.
The authors declare that they have no conflict of interest.
The OCTAVE 2018 campaign was performed in the framework of the OCTAVE project of the “Belgian Research Action through Interdisciplinary Networks” 5 (BRAIN-be) research programme (2017–2021) through the Belgian Science Policy Office (BELSPO; contract no. BR/175/A2/OCTAVE). We would like to thank UMS3365 of OSU-Réunion for its support with respect to the deployment of the instruments. The Maïdo site is operated with the support of Université de la Réunion, Météo-France, CNRS-INSU - under the long-term observation programme - and the French Ministry for Research - under the ACTRIS-FR national research infrastructure. The French SNO-CLAP programme is also acknowledged for supporting continuous aerosol measurements at the Maïdo observatory.
Airborne data collected during STRAP were obtained using the aircraft managed by SAFIRE, the French facility for airborne research, an infrastructure of the French National Centre for Scientific Research (CNRS), Météo-France and the French National Centre for Space Studies (CNES).
Support was received from the European Union's Horizon 2020 Research and Innovation programme (ACTRIS TNA; grant agreement no. 654109) to organize part of the measurements conducted during the OCTAVE 2018 campaign. Matti P. Rissanen also appreciates funding from the Academy of Finland (project nos. 299574, 326948 and 331207).
The STRAP project was funded by the Agence Nationale de la Recherche (grant no. ANR-14-CE03-0004-04). Some of the flight hours during STRAP were financed by the French Government Laboratory of Excellence initiative no. ANR-10-LABX-0006 and the Region Auvergne. This is Laboratory of Excellence ClerVolc contribution number 459.
Daniela Wimmer is thankful for the support received from the Austrian Science Fund (FWF, project no. J3951-N36).
This paper was edited by Thomas Karl and reviewed by three anonymous referees.
Baray, J.-L., Courcoux, Y., Keckhut, P., Portafaix, T., Tulet, P., Cammas, J.-P., Hauchecorne, A., Godin Beekmann, S., De Mazière, M., Hermans, C., Desmet, F., Sellegri, K., Colomb, A., Ramonet, M., Sciare, J., Vuillemin, C., Hoareau, C., Dionisi, D., Duflot, V., Vérèmes, H., Porteneuve, J., Gabarrot, F., Gaudo, T., Metzger, J.-M., Payen, G., Leclair de Bellevue, J., Barthe, C., Posny, F., Ricaud, P., Abchiche, A., and Delmas, R.: Maïdo observatory: a new high-altitude station facility at Reunion Island (21∘ S, 55∘ E)) for long-term atmospheric remote sensing and in situ measurements, Atmos. Meas. Tech., 6, 2865–2877, https://doi.org/10.5194/amt-6-2865-2013, 2013.
Berresheim, H., Adam, M., Monahan, C., O'Dowd, C., Plane, J. M. C., Bohn, B., and Rohrer, F.: Missing SO2 oxidant in the coastal atmosphere? – observations from high-resolution measurements of OH and atmospheric sulfur compounds, Atmos. Chem. Phys., 14, 12209–12223, https://doi.org/10.5194/acp-14-12209-2014, 2014.
Boulon, J., Sellegri, K., Hervo, M., and Laj, P.: Observations of nucleation of new particles in a volcanic plume, P. Natl. Acad. Sci. USA, 108, 12223–12226, https://doi.org/10.1073/pnas.1104923108, 2011.
Brus, D., Hyvärinen, A.-P., Viisanen, Y., Kulmala, M., and Lihavainen, H.: Homogeneous nucleation of sulfuric acid and water mixture: experimental setup and first results, Atmos. Chem. Phys., 10, 2631–2641, https://doi.org/10.5194/acp-10-2631-2010, 2010.
Dada, L., Ylivinkka, I., Baalbaki, R., Li, C., Guo, Y., Yan, C., Yao, L., Sarnela, N., Jokinen, T., Daellenbach, K. R., Yin, R., Deng, C., Chu, B., Nieminen, T., Wang, Y., Lin, Z., Thakur, R. C., Kontkanen, J., Stolzenburg, D., Sipilä, M., Hussein, T., Paasonen, P., Bianchi, F., Salma, I., Weidinger, T., Pikridas, M., Sciare, J., Jiang, J., Liu, Y., Petäjä, T., Kerminen, V.-M., and Kulmala, M.: Sources and sinks driving sulfuric acid concentrations in contrasting environments: implications on proxy calculations, Atmos. Chem. Phys., 20, 11747–11766, https://doi.org/10.5194/acp-20-11747-2020, 2020.
DeMore, W., Sander, S., Golden, D., Hampson, R., Kurylo, M., Howard, C., Ravishankara, A., Kolb, C., and Molina, M.: Chemical kinetics and photochemical data for use in stratospheric modeling, Jet Propulsion Laboratory, California Institute of Technology, Evaluation Number 12, JPL Publication 97–4, 266, 1997.
Duplissy, J., Merikanto, J., Franchin, A., Tsagkogeorgas, G., Kangasluoma, J., Wimmer, D., Vuollekoski, H., Schobesberger, S., Lehtipalo, K., Flagan, R. C., Brus, D., Donahue, N. M., Vehkamäki, H., Almeida, J., Amorim, A., Barmet, P., Bianchi, F., Breitenlechner, M., Dunne, E. M., Guida, R., Henschel, H., Junninen, H., Kirkby, J., Kürten, A., Kupc, A., Määttänen, A., Makhmutov, V., Mathot, S., Nieminen, T., Onnela, A., Praplan, A. P., Riccobono, F., Rondo, L., Steiner, G., Tome, A., Walther, H., Baltensperger, U., Carslaw, K. S., Dommen, J., Hansel, A., Petäjä, T., Sipilä, M., Stratmann, F., Vrtala, A., Wagner, P. E., Worsnop, D. R., Curtius, J., and Kulmala, M.: Effect of ions on sulfuric acid-water binary particle formation: 2. Experimental data and comparison with QC-normalized classical nucleation theory, J. Geophys. Res.-Atmos., 121, 1752–1775, https://doi.org/10.1002/2015JD023539, 2016.
Finlayson-Pitts, B. J. and Pitts Jr., J. N.: Chemistry of the Upper and Lower Atmosphere: Theory, Experiments, and Applications, Academic Press, San Diego, CA, USA, 298–299, 2000.
Foucart, B., Sellegri, K., Tulet, P., Rose, C., Metzger, J.-M., and Picard, D.: High occurrence of new particle formation events at the Maïdo high-altitude observatory (2150 m), Réunion (Indian Ocean), Atmos. Chem. Phys., 18, 9243–9261, https://doi.org/10.5194/acp-18-9243-2018, 2018.
Frege, C., Bianchi, F., Molteni, U., Tröstl, J., Junninen, H., Henne, S., Sipilä, M., Herrmann, E., Rossi, M. J., Kulmala, M., Hoyle, C. R., Baltensperger, U., and Dommen, J.: Chemical characterization of atmospheric ions at the high altitude research station Jungfraujoch (Switzerland), Atmos. Chem. Phys., 17, 2613–2629, https://doi.org/10.5194/acp-17-2613-2017, 2017.
Hanson, D. R. and Eisele, F. L.: Measurement of prenucleation molecular clusters in the NH3, H2SO4, H2O system, J. Geophys. Res., 107, AAC 10-11–AAC 10-18, https://doi.org/10.1029/2001jd001100, 2002.
Hanson, D. R. and Lovejoy, E. R.: Measurement of the Thermodynamics of the Hydrated Dimer and Trimer of Sulfuric Acid, J. Phys. Chem. A, 110, 9525–9528, https://doi.org/10.1021/jp062844w, 2006.
Hirsikko, A., Nieminen, T., Gagné, S., Lehtipalo, K., Manninen, H. E., Ehn, M., Hõrrak, U., Kerminen, V.-M., Laakso, L., McMurry, P. H., Mirme, A., Mirme, S., Petäjä, T., Tammet, H., Vakkari, V., Vana, M., and Kulmala, M.: Atmospheric ions and nucleation: a review of observations, Atmos. Chem. Phys., 11, 767–798, https://doi.org/10.5194/acp-11-767-2011, 2011.
Jen, C. N., McMurry, P. H., and Hanson, D. R.: Stabilization of sulfuric acid dimers by ammonia, methylamine, dimethylamine, and trimethylamine, J. Geophys. Res.-Atmos., 119, 7502–7514, https://doi.org/10.1002/2014JD021592, 2014.
Jen, C. N., Zhao, J., McMurry, P. H., and Hanson, D. R.: Chemical ionization of clusters formed from sulfuric acid and dimethylamine or diamines, Atmos. Chem. Phys., 16, 12513–12529, https://doi.org/10.5194/acp-16-12513-2016, 2016.
Jokinen, T., Sipilä, M., Junninen, H., Ehn, M., Lönn, G., Hakala, J., Petäjä, T., Mauldin III, R. L., Kulmala, M., and Worsnop, D. R.: Atmospheric sulphuric acid and neutral cluster measurements using CI-APi-TOF, Atmos. Chem. Phys., 12, 4117–4125, https://doi.org/10.5194/acp-12-4117-2012, 2012.
Jokinen, T., Sipilä, M., Kontkanen, J., Vakkari, V., Tisler, P., Duplissy, E.-M., Junninen, H., Kangasluoma, J., Manninen, H. E., Petäjä, T., Kulmala, M., Worsnop, D. R., Kirkby, J., Virkkula, A., and Kerminen, V.-M.: Ion-induced sulfuric acid–ammonia nucleation drives particle formation in coastal Antarctica, Science Advances, 4, eaat9744, https://doi.org/10.1126/sciadv.aat9744, 2018.
Junninen, H., Ehn, M., Petäjä, T., Luosujärvi, L., Kotiaho, T., Kostiainen, R., Rohner, U., Gonin, M., Fuhrer, K., Kulmala, M., and Worsnop, D. R.: A high-resolution mass spectrometer to measure atmospheric ion composition, Atmos. Meas. Tech., 3, 1039–1053, https://doi.org/10.5194/amt-3-1039-2010, 2010.
Kirkby, J., Curtius, J., Almeida, J., Dunne, E., Duplissy, J., Ehrhart, S., Franchin, A., Gagné, S., Ickes, L., Kürten, A., Kupc, A., Metzger, A., Riccobono, F., Rondo, L., Schobesberger, S., Tsagkogeorgas, G., Wimmer, D., Amorim, A., Bianchi, F., Breitenlechner, M., David, A., Dommen, J., Downard, A., Ehn, M., Flagan, R. C., Haider, S., Hansel, A., Hauser, D., Jud, W., Junninen, H., Kreissl, F., Kvashin, A., Laaksonen, A., Lehtipalo, K., Lima, J., Lovejoy, E. R., Makhmutov, V., Mathot, S., Mikkilä, J., Minginette, P., Mogo, S., Nieminen, T., Onnela, A., Pereira, P., Petäjä, T., Schnitzhofer, R., Seinfeld, J. H., Sipilä, M., Stozhkov, Y., Stratmann, F., Tomé, A., Vanhanen, J., Viisanen, Y., Vrtala, A., Wagner, P. E., Walther, H., Weingartner, E., Wex, H., Winkler, P. M., Carslaw, K. S., Worsnop, D. R., Baltensperger, U., and Kulmala, M.: Role of sulphuric acid, ammonia and galactic cosmic rays in atmospheric aerosol nucleation, Nature, 476, 429–433, https://doi.org/10.1038/nature10343, 2011.
Kirkby, J., Duplissy, J., Sengupta, K., Frege, C., Gordon, H., Williamson, C., Heinritzi, M., Simon, M., Yan, C., Almeida, J., Tröstl, J., Nieminen, T., Ortega, I. K., Wagner, R., Adamov, A., Amorim, A., Bernhammer, A.-K., Bianchi, F., Breitenlechner, M., Brilke, S., Chen, X., Craven, J., Dias, A., Ehrhart, S., Flagan, R. C., Franchin, A., Fuchs, C., Guida, R., Hakala, J., Hoyle, C. R., Jokinen, T., Junninen, H., Kangasluoma, J., Kim, J., Krapf, M., Kürten, A., Laaksonen, A., Lehtipalo, K., Makhmutov, V., Mathot, S., Molteni, U., Onnela, A., Peräkylä, O., Piel, F., Petäjä, T., Praplan, A. P., Pringle, K., Rap, A., Richards, N. A. D., Riipinen, I., Rissanen, M. P., Rondo, L., Sarnela, N., Schobesberger, S., Scott, C. E., Seinfeld, J. H., Sipilä, M., Steiner, G., Stozhkov, Y., Stratmann, F., Tomé, A., Virtanen, A., Vogel, A. L., Wagner, A. C., Wagner, P. E., Weingartner, E., Wimmer, D., Winkler, P. M., Ye, P., Zhang, X., Hansel, A., Dommen, J., Donahue, N. M., Worsnop, D. R., Baltensperger, U., Kulmala, M., Carslaw, K. S. and Curtius, J.: Ion-induced nucleation of pure biogenic particles, Nature, 533, 521–526, https://doi.org/10.1038/nature17953, 2016.
Kulmala, M., Petäjä, T., Nieminen, T., Sipilä, M., Manninen, H. E., Lehtipalo, K., Dal Maso, M., Aalto, P. P., Junninen, H., and Paasonen, P.: Measurement of the nucleation of atmospheric aerosol particles, Nat. Protoc., 7, 1651–1667, https://doi.org/10.1038/nprot.2012.091, 2012.
Kürten, A., Rondo, L., Ehrhart, S., and Curtius, J.: Calibration of a Chemical Ionization Mass Spectrometer for the Measurement of Gaseous Sulfuric Acid, J. Phys. Chem. A, 116, 6375–6386, https://doi.org/10.1021/jp212123n, 2012.
Kürten, A., Bianchi, F., Almeida, J., Kupiainen-Määttä, O., Dunne, E. M., Duplissy, J., Williamson, C., Barmet, P., Breitenlechner, M., Dommen, J., Donahue, N. M., Flagan, R. C., Franchin, A., Gordon, H., Hakala, J., Hansel, A., Heinritzi, M., Ickes, L., Jokinen, T., Kangasluoma, J., Kim, J., Kirkby, J., Kupc, A., Lehtipalo, K., Leiminger, M., Makhmutov, V., Onnela, A., Ortega, I. K., Petäjä, T., Praplan, A. P., Riccobono, F., Rissanen, M. P., Rondo, L., Schnitzhofer, R., Schobesberger, S., Smith, J. N., Steiner, G., Stozhkov, Y., Tomé, A., Tröstl, J., Tsagkogeorgas, G., Wagner, P. E., Wimmer, D., Ye, P., Baltensperger, U., Carslaw, K., Kulmala, M., and Curtius, J.: Experimental particle formation rates spanning tropospheric sulfuric acid and ammonia abundances, ion production rates, and temperatures, J. Geophys. Res.-Atmos., 121, 12377–12400, https://doi.org/10.1002/2015JD023908, 2016.
Lehtipalo, K., Yan, C., Dada, L., Bianchi, F., Xiao, M., Wagner, R., Stolzenburg, D., Ahonen, L. R., Amorim, A., Baccarini, A., Bauer, P. S., Baumgartner, B., Bergen, A., Bernhammer, A.-K., Breitenlechner, M., Brilke, S., Buchholz, A., Buenrostro Mazon, S., Chen, D., Chen, X., Dias, A., Dommen, J., Draper, D. C., Duplissy, J., Ehn, M., Finkenzeller, H., Fischer, L., Frege, C., Fuchs, C., Garmash, O., Gordon, H., Hakala, J., He, X., Heikkinen, L., Heinritzi, M., Helm, J. C., Hofbauer, V., Hoyle, C. R., Jokinen,T., Kangasluoma, J., Kerminen, V.-M., Kim, C., Kirkby, J., Kontkanen, J., Kürten, A., Lawler, M. J., Mai, H., Mathot, S., Mauldin III, R. L., Molteni, U., Nichman, L., Nie, W., Nieminen, T., Ojdanic, A., Onnela, A., Passananti, M., Petäjä, T., Piel, F., Pospisilova, V., Quéléver, L. L. J., Rissanen, M. P., Rose, C., Sarnela, N., Schallhart, S., Schuchmann, S., Sengupta, K., Simon, M., Sipilä, M., Tauber, C., Tomé, A., Tröstl, J., Väisänen, O., Vogel, A. L., Volkamer, R., Wagner, A. C., Wang, M., Weitz, L., Wimmer, D., Ye, P., Ylisirniö, A., Zha, Q., Carslaw, K. S., Curtius, J., Donahue, N. M., Flagan, R. C., Hansel, A., Riipinen, I., Virtanen, A., Winkler, P. M., Baltensperger, U., Kulmala, M., and Worsnop, D. R.: Multicomponent new particle formation from sulfuric acid, ammonia, and biogenic vapors, Science Advances, 4, eaau5363, https://doi.org/10.1126/sciadv.aau5363, 2018.
Lovejoy, E. R., Curtius, J., and Froyd, K. D.: Atmospheric ioninduced nucleation of sulfuric acid and water, J. Geophys. Res., 109, D08204, https://doi.org/10.1029/2003jd004460, 2004.
Lu, Y., Yan, C., Fu, Y., Chen, Y., Liu, Y., Yang, G., Wang, Y., Bianchi, F., Chu, B., Zhou, Y., Yin, R., Baalbaki, R., Garmash, O., Deng, C., Wang, W., Liu, Y., Petäjä, T., Kerminen, V.-M., Jiang, J., Kulmala, M., and Wang, L.: A proxy for atmospheric daytime gaseous sulfuric acid concentration in urban Beijing, Atmos. Chem. Phys., 19, 1971–1983, https://doi.org/10.5194/acp-19-1971-2019, 2019.
Määttänen, A., Merikanto, J., Henschel, H., Duplissy, J., Makkonen, R., Ortega, I. K., and Vehkamäki, H.: New parameterizations for neutral and ion-induced sulfuric acid – water particle formation in nucleation and kinetic regimes, J. Geophys. Res., 123, 1269–1296, https://doi.org/10.1002/2017JD027429, 2018.
Mauldin, R. L., Berndt, T., Sipila, M., Paasonen, P., Petaja, T., Kim, S., Kurten, T., Stratmann, F., Kerminen, V. M., and Kulmala, M.: A new atmospherically relevant oxidant of sulphur dioxide, Nature, 488, 193–196, https://doi.org/10.1038/nature11278, 2012.
Mikkonen, S., Romakkaniemi, S., Smith, J. N., Korhonen, H., Petäjä, T., Plass-Duelmer, C., Boy, M., McMurry, P. H., Lehtinen, K. E. J., Joutsensaari, J., Hamed, A., Mauldin III, R. L., Birmili, W., Spindler, G., Arnold, F., Kulmala, M., and Laaksonen, A.: A statistical proxy for sulphuric acid concentration, Atmos. Chem. Phys., 11, 11319–11334, https://doi.org/10.5194/acp-11-11319-2011, 2011.
OSU-Réunion: GEOSUR, available at: http://osur.univ-reunion.fr/recherche/strap/database/, last access: 17 March 2021.
Petäjä, T., Mauldin, III, R. L., Kosciuch, E., McGrath, J., Nieminen, T., Paasonen, P., Boy, M., Adamov, A., Kotiaho, T., and Kulmala, M.: Sulfuric acid and OH concentrations in a boreal forest site, Atmos. Chem. Phys., 9, 7435–7448, https://doi.org/10.5194/acp-9-7435-2009, 2009.
Pianezze, J., Tulet, P., Foucart, B., Leriche, M., Liuzzo, M., Salerno, G., Colomb, A., Freney, E., and Sellegri, K.: Volcanic plume aging during passive degassing and low eruptive events of Etna and Stromboli volcanoes, J. Geophys. Res.-Atmos., 124, 11389–11405, https://doi.org/10.1029/2019JD031122, 2019.
Riccobono, F., Schobesberger, S., Scott, C. E., Dommen, J., Ortega, I. K., Rondo, L., Almeida, J., Amorim, A., Bianchi, F., Breitenlechner, M., David, A., Downard, A., Dunne, E. M., Duplissy, J., Ehrhart, S., Flagan, R. C., Franchin, A., Hansel, A., Junninen, H., Kajos, M., Keskinen, H., Kupc, A., Kürten, A., Kvashin, A. N., Laaksonen, A., Lehtipalo, K., Makhmutov, V., Mathot, S., Nieminen, T., Onnela, A., Petäjä, T., Praplan, A. P., Santos, F. D., Schallhart, S., Seinfeld, J. H., Sipilä, M., Spracklen, D. V., Stozhkov, Y., Stratmann, F., Tomé, A., Tsagkogeorgas, G., Vaattovaara, P., Viisanen, Y., Vrtala, A., Wagner, P. E., Weingartner, E., Wex, H., Wimmer, D., Carslaw, K. S., Curtius, J., Donahue, N. M., Kirkby, J., Kulmala, M., Worsnop, D. R., and Baltensperger, U.: Oxidation Products of Biogenic Emissions Contribute to Nucleation of Atmospheric Particles, Science, 344, 717–721, 2014.
Riva, M., Rantala, P., Krechmer, J. E., Peräkylä, O., Zhang, Y., Heikkinen, L., Garmash, O., Yan, C., Kulmala, M., Worsnop, D., and Ehn, M.: Evaluating the performance of five different chemical ionization techniques for detecting gaseous oxygenated organic species, Atmos. Meas. Tech., 12, 2403–2421, https://doi.org/10.5194/amt-12-2403-2019, 2019.
Rose, C., Zha, Q., Dada, L., Yan, C., Lehtipalo, K., Junninen, H., Buenrostro Mazon, S., Jokinen, T., Sarnela, N., Sipilä, M., Petäjä, T., Kerminen, V.-M., Bianchi, F. and Kulmala, M.: Observations of biogenic ion-induced cluster formation in the atmosphere, Science Advances, 4, eaar5218, https://doi.org/10.1126/sciadv.aar5218, 2018.
Rose, C., Foucart, B., Picard, D., Colomb, A., Metzger, J.-M., Tulet, P., and Sellegri, K.: New particle formation in the volcanic eruption plume of the Piton de la Fournaise: specific features from a long-term dataset, Atmos. Chem. Phys., 19, 13243–13265, https://doi.org/10.5194/acp-19-13243-2019, 2019.
Sahyoun, M., Freney, E., Brito, J., Duplissy, J., Gouhier, M., Colomb, A., Dupuy, R., Bourianne, T., Nowak, J. B., Yan, C., Petäjä, T., Kulmala, M., Schwarzenboeck, A., Planche, C., and Sellegri, K.: Evidence of new particle formation within Etna and Stromboli volcanic plumes and its parameterization from airborne in-situ measurements, J. Geophys. Res.-Atmos., 124, 5650–5668, https://doi.org/10.1029/2018JD028882, 2019.
Sander, S. P., Friedl, R. R., Golden, D. M., Kurylo, M. J., Huie, R. E., Orkin, V. L., Ravishankara, A. R., Kolb, C. E., and Molina, M. J.: Chemical kinetics and photochemical data for use in stratospheric modeling, in: evaluation 14, JPL Publication 02-25, Jet Propul. Lab., Pasadena, Calif., 2002.
Semeniuk, K. and Dastoor, A.: Current state of aerosol nucleation parameterizations for air-quality and climate modelling, Atmos. Environ., 179, 77–106, https://doi.org/10.1016/j.atmosenv.2018.01.039, 2018.
Yan, C., Dada, L., Rose, C., Jokinen, T., Nie, W., Schobesberger, S., Junninen, H., Lehtipalo, K., Sarnela, N., Makkonen, U., Garmash, O., Wang, Y., Zha, Q., Paasonen, P., Bianchi, F., Sipilä, M., Ehn, M., Petäjä, T., Kerminen, V.-M., Worsnop, D. R., and Kulmala, M.: The role of H2SO4−NH3 anion clusters in ion-induced aerosol nucleation mechanisms in the boreal forest, Atmos. Chem. Phys., 18, 13231–13243, https://doi.org/10.5194/acp-18-13231-2018, 2018.
Zhang, R., Khalizov, A., Wang, L., Hu, M., and Xu, W.: Nucleation and growth of nanoparticles in the atmosphere, Chem. Rev., 112, 1957–2011, 2011.
Zhang, R. Y., Suh, I., Zhao, J., Zhang, D., Fortner, E. C., Tie, X., Molina, L. T. and Molina, M. J.: Atmospheric new particle formation enhanced by organic acids, Science, 304, 1487–1490, https://doi.org/10.1126/science.1095139, 2004.