the Creative Commons Attribution 4.0 License.
the Creative Commons Attribution 4.0 License.
 | 22 Mar 2021
A revised mineral dust emission scheme in GEOS-Chem: improvements in dust simulations over China
Rong Tian
Jianqi Zhao
Mineral dust plays a significant role in climate change and air quality, but large uncertainties remain in terms of dust emission prediction. In this study, we improved treatment of the dust emission process in a global 3-D chemical transport model (GEOS-Chem v12.6.0), by incorporating the geographical variation of aerodynamic roughness length (Z0), smooth roughness length (Z0s) and soil texture and by introducing the Owen effect and the formulation of the sandblasting efficiency α by Lu and Shao (1999). To investigate the impact of the modifications incorporated in the model, several sensitivity simulations were performed for a severe dust storm during 27 March to 2 April 2015 over northern China. Results show that simulated threshold friction velocity is very sensitive to the updated Z0 and Z0s field, with the relative difference ranging from 10 % to 60 % compared to the original model with a uniform value. The inclusion of the Owen effect leads to an increase in surface friction velocity, which mainly occurs in the arid and semi-arid regions of northwest China. The substitution of a fixed value of α assumed in the original scheme with one varying with friction velocity and soil texture based on observations reduces α by 50 % on average, especially over regions with sand texture. Comparisons of sensitivity simulations and measurements show that the revised scheme with the implementation of updates provides more realistic threshold friction velocities and PM10 mass concentrations. The performance of the improved model has been evaluated against surface PM10 observations as well as MODIS aerosol optical depth (AOD) values, showing that the spatial and temporal variation of mineral dust are better captured by the revised scheme. Due to the inclusion of the improvement, average PM10 concentrations at observational sites are more comparable to the observations, and the average mean bias (MB) and normalized mean bias (NMB) values are reduced from −196.29 µg m−3 and −52.79 % to −47.72 µg m−3 and −22.46 % respectively. Our study suggests that the erodibility factor, sandblasting efficiency and soil-related properties which are simply assumed in the empirical scheme may lack a physical mechanism and spatial–temporal representativeness. Further study and measurements should be conducted to obtain a more realistic and detailed map of these parameters in order to improve dust representation in the model.
- Article
(9535 KB) - Full-text XML
-
Supplement
(1430 KB) - BibTeX
- EndNote


Mineral dust is typically produced by wind erosion from regions with arid and semi-arid surfaces in the world and exerts significant impacts on the atmospheric radiation balance (Tegen et al., 1996; DeMott et al., 2010; Kumar et al., 2014; Saidou Chaibou et al., 2020a), climate (DeMott et al., 2003; Mahowald and Kiehl, 2003; Zhao et al., 2012; Chen et al., 2014; Chin et al., 2014), air quality (Giannadaki et al., 2014; Tian et al., 2019) and human health (Goudie, 2014; Tong et al., 2017). The dust emission process has been recognized as a leading contributor to dust aerosol loading. Global mineral dust particles are mainly emitted from North Africa, the Arabian Peninsula, Central Asia, East Asia, Australia and North America, with East Asia (including the Gobi and Taklimakan deserts) accounting for ∼ 20 % of the global dust emission (Ginoux et al., 2004; Nagashima et al., 2016).
In order to properly reproduce the dust emission process, many dust emission schemes have been developed and implemented in both global and regional chemical transport models (CTMs) (e.g., Marticorena and Bergametti, 1995; Lu and Shao, 1999; Alfaro and Gomes, 2001; Shao, 2001, 2004; Shao et al., 2011; Zender et al., 2003; Kok, 2011a, b). Nevertheless, some intercomparison studies demonstrated that there are large discrepancies among different dust emission models (Uno et al., 2006; Todd et al., 2008; Huneeus et al., 2011; Su and Fung, 2015; Ridley et al., 2016; Chen et al., 2017; Ma et al., 2019; Wu et al., 2019; Saidou Chaibou et al., 2020b; Zhao et al., 2020). Ma et al. (2019) quantitatively evaluated the performance of three dust schemes in the Weather Research and Forecasting model coupled with Chemistry (WRF-Chem), two schemes in both CHIMERE and CMAQ and one scheme in CAMx during a dust episode over northern China. Large differences between observed surface PM10 concentrations and the modeling results of each model were found. Among schemes in WRF-Chem, AFWA and UOC_Shao2004 are better correlated with observations compared to GOCART but tend to overestimate dust concentrations. Kang et al. (2011) compared the performance of three dust emission schemes in WRF-Chem over East Asia, showing that the difference of dust emission fluxes between the three schemes ranges from an order of 101 to 102. Ridley et al. (2016) showed that the estimated global dust aerosol optical depth (AOD) varies by over a factor of 5 among four global models (including GEOS-Chem, WRF-Chem, CESM and MERRAero), and dust emissions across North Africa are overestimated, while emissions from Asia and the Middle East are underestimated overall. An intercomparison of 14 CTMs as part of the Model Inter-Comparison Study for Asia (MICS-Asia) phase III project (Chen et al., 2019) showed that nearly all participant models underestimate PM10 levels and that current CTMs have difficulty producing similar dust emissions when adopting different dust schemes.
The uncertainties in dust emission models can be attributed to a number of issues, such as threshold friction velocity, surface wind speed, soil texture, particle size distribution, other soil/surface parameters (e.g., soil moisture, vegetation cover and aerodynamic roughness length) and different physical mechanisms (Tegen, 2003; Zhao et al., 2013; Liu et al., 2018; Chen et al., 2019). Darmenova et al. (2009) conducted a detailed comparison between two schemes developed by Marticorena and Bergametti (1995) and Shao et al. (1996), indicating that wind friction velocity is a significant factor in simulating dust emission, while the aerodynamic roughness length as well as vegetation cover may play an important role at higher wind speed. Many sensitivity experiments have been conducted and have shown that the modeled threshold friction velocity can be modified by soil moisture (Cheng et al., 2008; Mokhtari et al., 2012; Gherboudj et al., 2015; Ju et al., 2018), soil texture (Menut et al., 2013; Gherboudj et al., 2015; Perlwitz et al., 2015a, b; Kontos et al., 2018) and surface roughness (Cheng et al., 2008; Astitha et al., 2012; Menut et al., 2013), which in turn affects the predicted dust emission. In addition, a more accurate value of the sandblasting mass efficiency (α) has been reported to be a crucial factor for a better performance of the dust emission flux (Mokhtari et al., 2012; Klingmüller et al., 2018; Kontos et al., 2018; Ma et al., 2019).
Based on the above studies, it is necessary to take these key parameters, including soil-related properties and empirical input parameters, into full consideration in a dust emission parameterization. Unfortunately, due to limited observations, many of these parameters are not included well in the model. For example, most dust models simply assume constant values of aerodynamic roughness length and soil clay fraction (Ginoux et al., 2001; Tegen et al., 2002; Zender et al., 2003), ignoring their temporal and spatial variability, which may cause uncertainties in the estimated surface friction velocity and threshold friction velocity. During recent decades, with the development of observation technology, detailed information on the surface characteristics appropriate for global and regional models has been provided (Laurent et al., 2005, 2008; Prigent et al., 2005, 2012; Shangguan et al., 2014; Perlwitz et al., 2015a, b). Therefore, adopting more accurate and detailed soil datasets is expected to improve the dust model performance.
In this study, we present an improvement of the dust emission scheme in the GEOS-Chem model by incorporating the updated soil texture and aerodynamic roughness length with spatial variability, the Owen effect and the drag partition correction factor, as well as the updated formulation of the sandblasting efficiency, which together significantly improve the prediction of the dust emission flux and concentrations over China. The objective is to obtain more realistic surface friction velocity (u∗) and threshold friction velocity (u∗t) by considering the effect of soil moisture, surface roughness and soil texture, thus improving the representation of dust emission in the model.
Section 2 gives a detailed description of the GEOS-Chem model and the modifications of the improved scheme, as well as numerical experiments and data description. Sensitivity results are compared in Sect. 3.1 to examine the impacts of the modifications. Section 3.2 presents the comparisons of the improved scheme and original version with observations, to evaluate the performance of the improved scheme. Uncertainties, limitations and future improvements of the emission scheme are discussed in Sect. 3.3, followed by a summary in Sect. 4.
2.1 Model description
The GEOS-Chem model is a global three-dimensional chemical transport model driven by assimilated meteorology. In this work, we use a nested version of GEOS-Chem (v12.6.0) driven by the GEOS-FP-assimilated meteorological field, with a spatial resolution of 0.25∘ × 0.3125∘ and 72 vertical levels for the China region (15–55∘ N, 70–140∘ E) during the period of 27 March to 2 April 2015. The nested-grid GEOS-Chem is developed by Wang et al. (2004) with lateral boundary conditions provided by a global simulation (at 2∘ × 2.5∘ resolution in this study). Many nested-grid GEOS-Chem simulations have been evaluated and applied to the analysis of gaseous and aerosol species over China (Chen et al., 2009; Lin et al., 2014; Zhang et al., 2015; Wang et al., 2013; Li et al., 2019).
GEOS-Chem includes detailed atmospheric chemical mechanism and online aerosol calculations. In this work, we simulate the dust emission with a combination of the dust entrainment and deposition (DEAD) mobilization scheme (Zender et al., 2003) and Global Ozone Chemistry Aerosol Radiation and Transport (GOCART) source function. Mineral dust aerosols are distributed across four size bins (with radius bins of 0.1–1.0, 1.0–1.8, 1.8–3.0 and 3.0–6.0 µm). The mass fractions of each size bin are parameterized by the optimized dust particle size distribution proposed by Zhang et al. (2013). Dry deposition velocities for dust aerosols are computed with the gravitational settling scheme of Fairlie et al. (2007) and aerosol deposition scheme from Zhang et al. (2001). The wet deposition scheme, which includes scavenging in convective updrafts, as well as the rainout and washout of soluble tracers, is described in Liu et al. (2001). Aerosol optical depth is derived online from aerosol concentrations with an externally mixed assumption using relative humidity (RH)-dependent aerosol optical properties from Latimer and Martin (2019). Dust optics are from Ridley et al. (2012).
2.2 Improvement on the dust emission scheme in GEOS-Chem
The standard dust emission scheme in GEOS-Chem is based on a semi-empirical formulation developed by Zender et al. (2003) and is combined with the GOCART source function (Ginoux et al., 2001). In this scheme, the vertical dust flux (F) is proportional to the horizontal saltation flux (Qs), which is the function of surface friction velocity (u∗) and threshold friction velocity (u∗t):
where α is the vertical-to-horizontal flux ratio or sandblasting efficiency, based on the soil clay content (Marticorena and Bergametti, 1995). S is based on the GOCART source function (see Supplement Fig. S1), also named the soil erodibility factor, representing the grid cell fraction of the bare land suitable for mobilization. As is the fraction of snow-covered surface. Cz is the saltation constant (Cz=2.61).
According to the equation, u∗t, u∗ and α are the key input parameters in the accurate prediction of dust emission flux. u∗t is used to describe the characteristics of soil and land surface conditions, representing the resistance of surface to wind erosion. In the standard dust scheme, u∗t is calculated using a semi-empirical formulation as a function of air density and soil particle density (Iversen and White, 1982). Furthermore, two correction terms, including soil moisture correction (Fécan et al., 1999) and drag partition correction (Marticorena and Bergametti, 1995), are also applied to modify u∗t. It should be noted that in the original scheme, the drag partition correction term is eliminated.
u∗ is a description of surface wind speed, which mainly depends on 10 m wind speed taken from meteorological field assuming neutral stability (Bonan, 1996). The Owen effect, which represents a positive feedback between saltation process and friction speed (Owen, 1964), is often adopted in models to modify u∗. However, the Owen effect is eliminated in the original scheme.
Sandblasting efficiency α is parameterized according to the empirical relation described by Marticorena and Bergametti (1995) (MB95), which depends on the soil clay content (Mclay) and is restricted to Mclay < 20 %:
However, in the global model, α tends to be overly sensitive to Mclay. Due to this reason, a globally fixed value of Mclay= 20 % is assumed in the current model (Zender et al., 2003).
It should be noted that some input parameters, data or formulations are quite simplified and need to be improved based on the original dust scheme described above. For example, the aerodynamic roughness length (Z0), the smooth roughness length (Z0s) and the mass fraction of clay in the soil (Mclay) are assumed to be uniform constants, despite the fact that they may vary with time and location. As a result, the simulation of related processes, such as the drag partition effect or soil moisture effect, may lack spatial representation. Therefore further modifications to these variables should be made in order to obtain more realistic dust emissions. Figure 1 presents the schematic diagram of the dust emission schemes in the standard model and the modifications incorporated into this study. The details of the parameterization options and required input parameters are presented in the following sections.
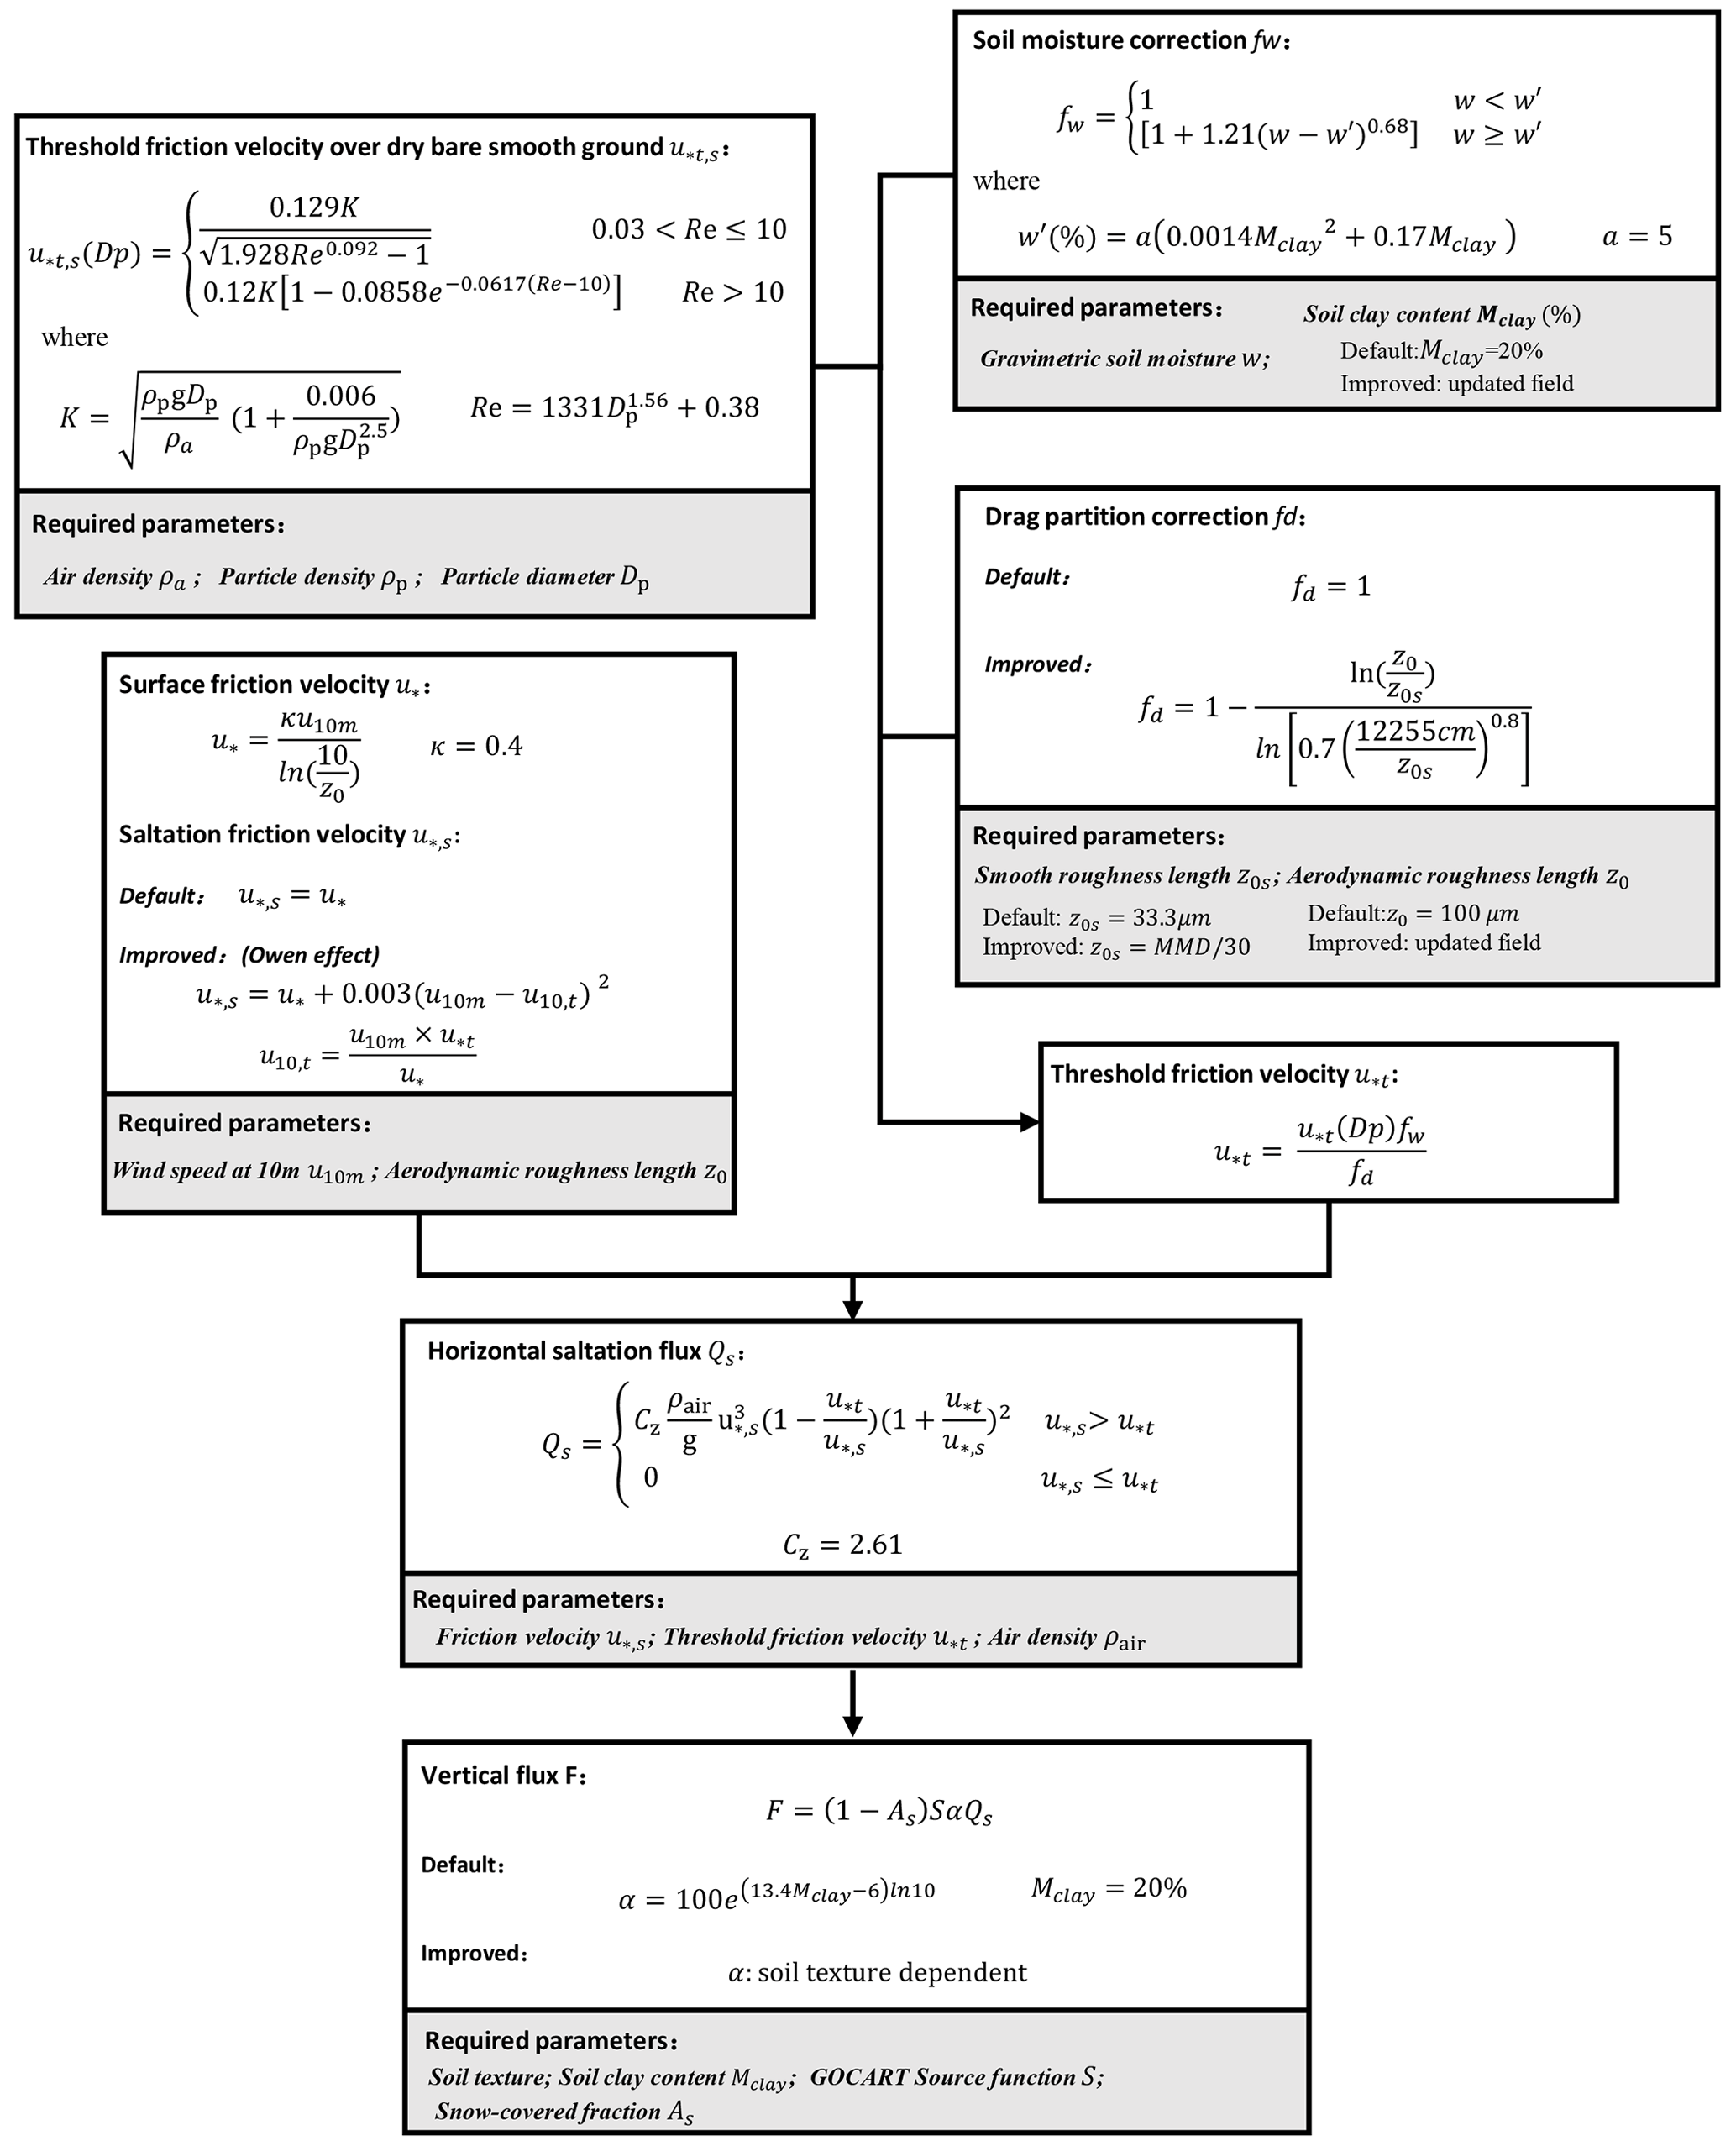
Figure 1Schematic diagram and required input parameters in the dust emission scheme in GEOS-Chem.
2.2.1 Soil type and soil texture data
In the model, Mclay can have an impact on u∗t through modifying the soil moisture correction term, thus influencing the modeled dust emission flux. The soil moisture correction term, defined as fw, is parameterized according to Fécan et al. (1999), which accounts for the increase of u∗t with soil moisture content.
where w is the gravimetric soil moisture and w′ is the soil residual moisture.
With the increase of soil moisture, soil cohesion can be enhanced, particularly over regions with high clay content, thus inhibiting the sandblasting process to some extent. However, as stated above, Mclay is assumed to be a constant equal to 20 % in the original scheme, which can cause uncertainty in dust prediction. In the improved scheme, we employ the gridded data of clay content from the Global Soil Dataset for use in Earth System Models (GSDE) (Shangguan et al., 2014), which is based on the Digital Soil Map of the World (FAO, 1995, 2003) and various regional and national soil databases. Figure 2 shows the updated Mclay from Shangguan et al. (2014) with a horizontal resolution of 2∘ × 2.5∘ at the global scale. Compared to the original fixed value of 20 %, the updated Mclay is generally lower in most of the dust source areas over East Asia.
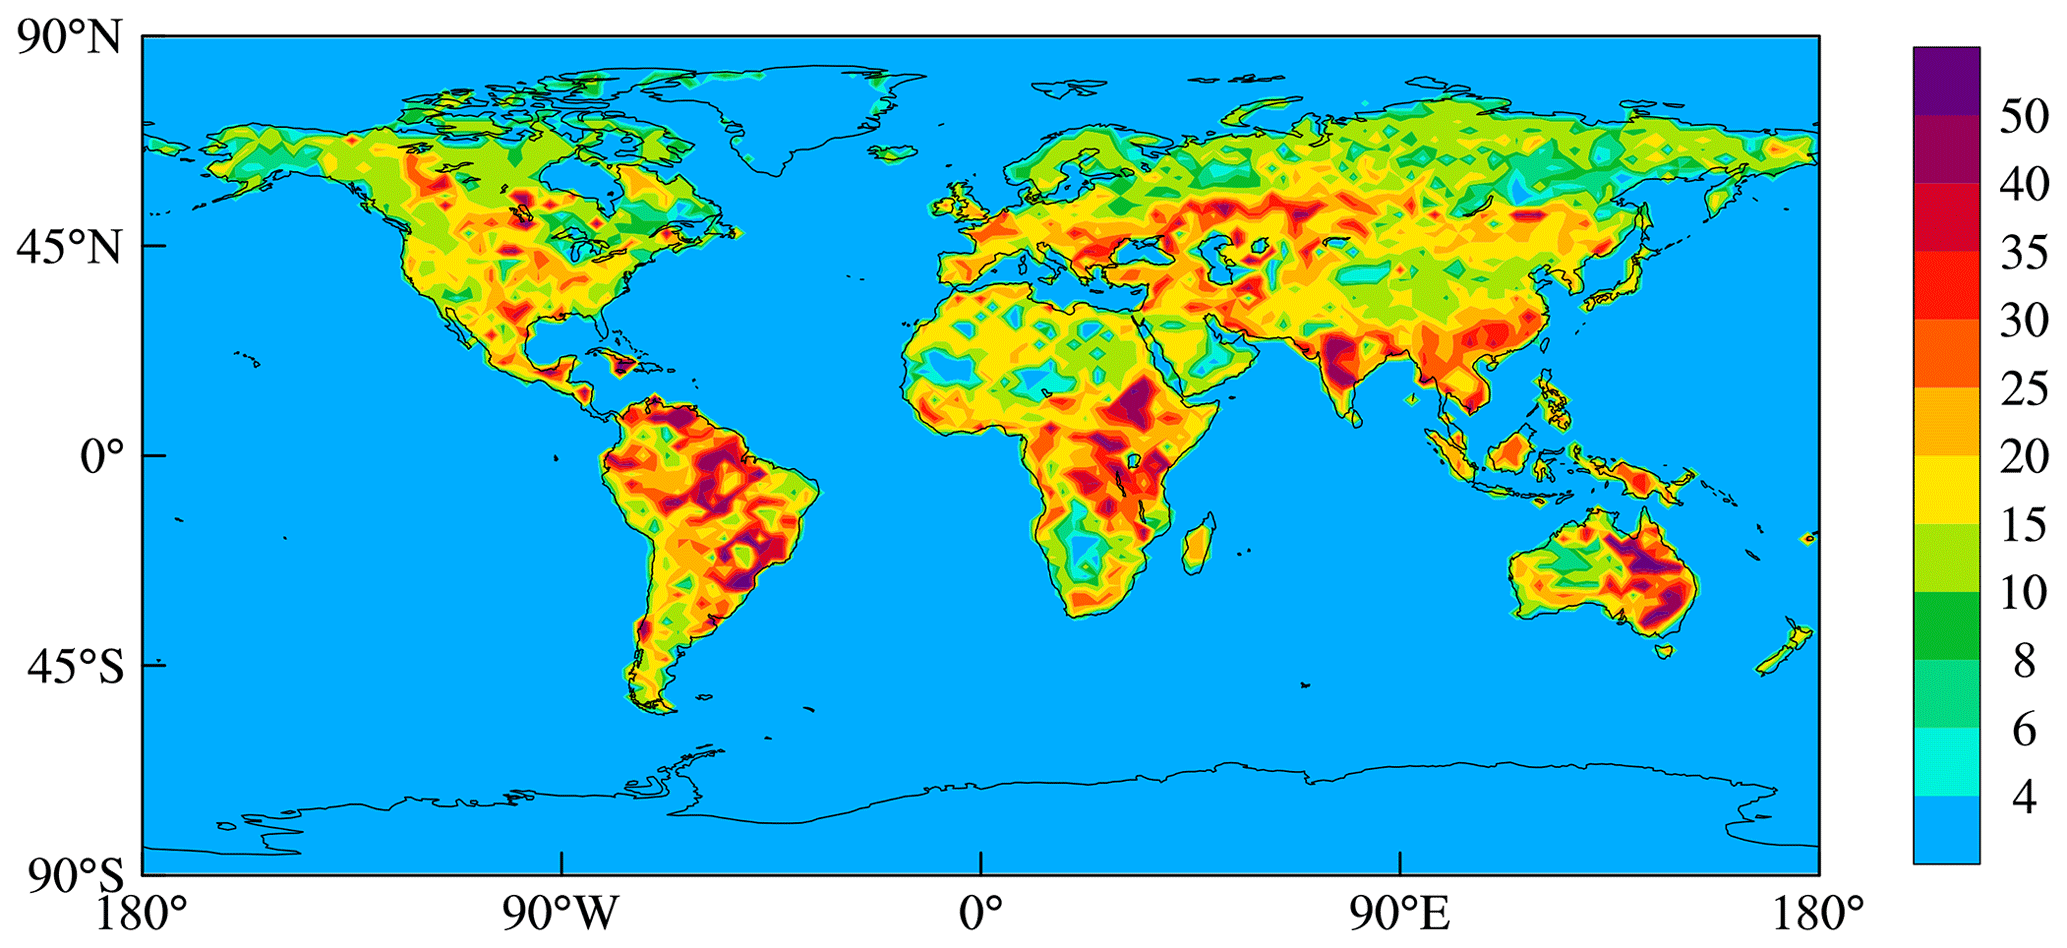
Figure 2Updated input data of global Mclay (%). Data are derived from Shangguan et al. (2014) and are re-gridded to 2∘ × 2.5∘ horizontal resolution in the model.
2.2.2 Surface roughness length
The drag partition is used to describe the impact of roughness elements (such as rocks, pebbles and vegetation) on u∗t. According to Marticorena and Bergametti (1995), the roughness correction term, fd, is a function of the aerodynamic roughness length (Z0) and the smooth roughness length (Z0s):
where the required roughness lengths are set as the constant values of Z0=0.01 and Z0s=0.0033 cm globally.
Z0 represents the roughness length of the overlying non-erodible elements (solid obstacles, such as rocks), which transfers part of the wind momentum from the atmosphere to the surface, dissipating the shear force for particle saltation. Prigent et al. (2005) derived global aerodynamic roughness length in arid and semi-arid areas, retrieved from the ERS-1 satellite measurements with a horizontal resolution of 0.25∘ × 0.25∘ . Here we apply the global monthly mean Z0 fields provided by Prigent et al. (2005) and then re-grid the map to 2∘ × 2.5∘ horizontal resolution for the incorporation into GEOS-Chem. As Fig. 3 shows, compared to the fixed constant assumed in the original version, the updated global Z0 is generally higher. Over northern China, the Z0 value ranges from approximately 0.01 cm over desert regions to 0.07 cm.
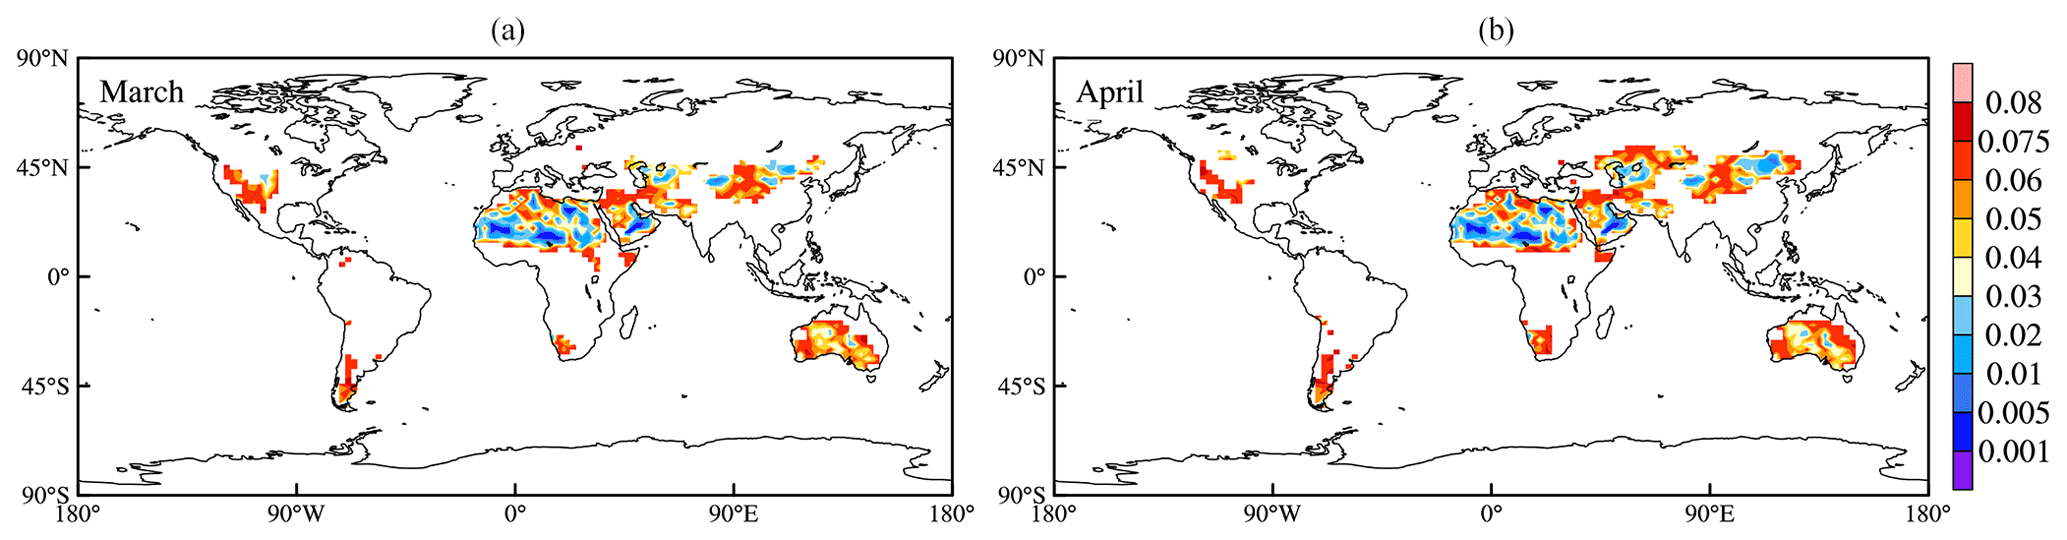
Figure 3Monthly updated input data of global aerodynamic roughness length (Z0) (cm) in March (a) and April (b). Data are derived from Prigent et al. (2005) and are re-gridded to 2∘ × 2.5∘ horizontal resolution in the model.
Z0s characterizes the roughness length of the uncovered, bare erodible surface. Instead of setting Z0s to a fixed value, some studies suggested that Z0s can be estimated as of the coarse-mode mass median diameter (MMD) of soil particles, which will provide a more realistic representation of soil texture distribution (Marticorena and Bergametti, 1995; Laurent et al., 2006; Mokhtari et al., 2012). In the improved version, we adopt this empirical formula, based on updated soil texture classification (Mokhtari et al., 2012; Xi and Sokolik, 2015), to estimate Z0s:
where MMD is the median diameter of the coarsest mode for various soil textures shown in Table 1. The corresponding Z0s values for different soil types are listed in Table 1, and their global distribution are shown in Fig. 4. The soil texture map is obtained based on the Harmonized World Soil Database (HWSD; http://www.iiasa.ac.at/Research/LUC/External-World-soil-database/HTML, last access: 24 April 2020), which provides global sand, silt and clay contents at 30 arcsec resolution. The soil texture dataset is re-gridded to 2∘ × 2.5∘ resolution and then is applied to identify the global soil texture by using the United States Department of Agriculture (USDA) soil texture triangle (based on the amount of sand, clay and silt contents; http://soils.usda.gov/technical/aids/investigations/texture/, last access: 24 April 2020). There are 12 classes of soil defined by USDA. It can be seen from Fig. 5 that loam, sandy loam and clay loam are the dominant soil types over China. Among them, sandy loam and loam occupy the major part of northwest China.
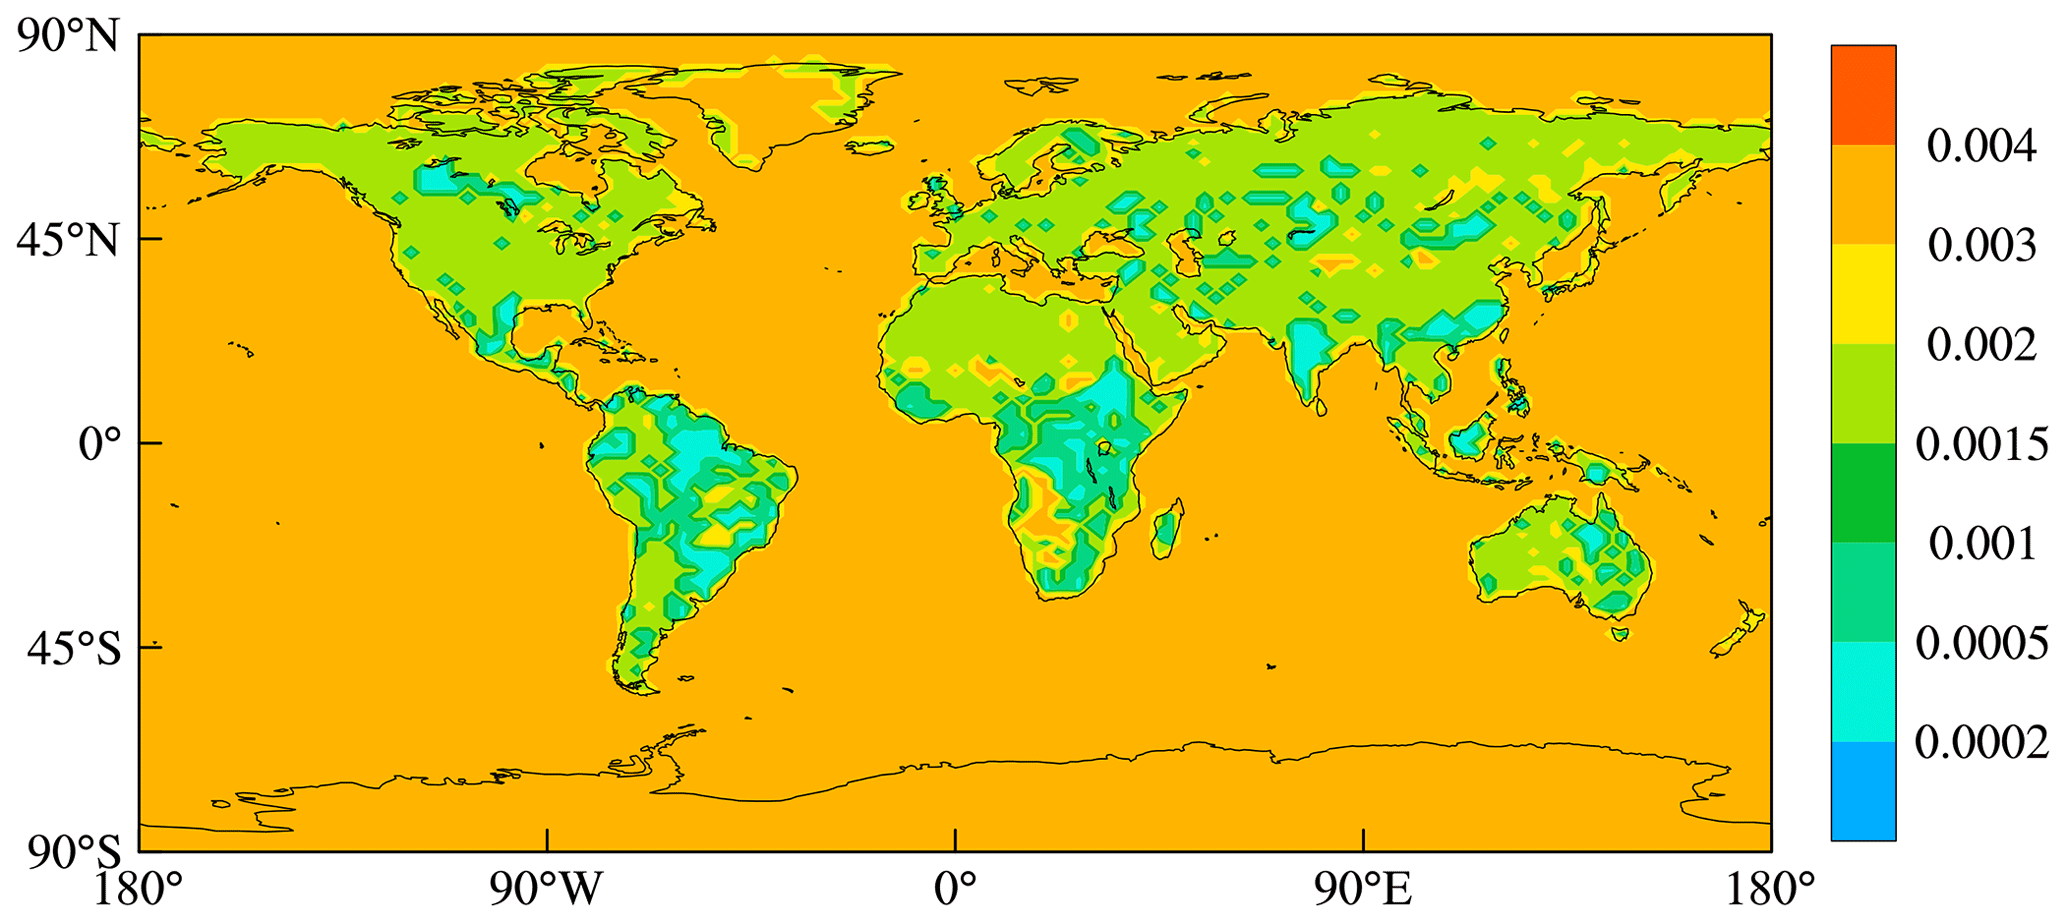
Figure 4Updated global map of smooth roughness length (Z0s) (cm) estimated from the empirical relationship with soil texture.
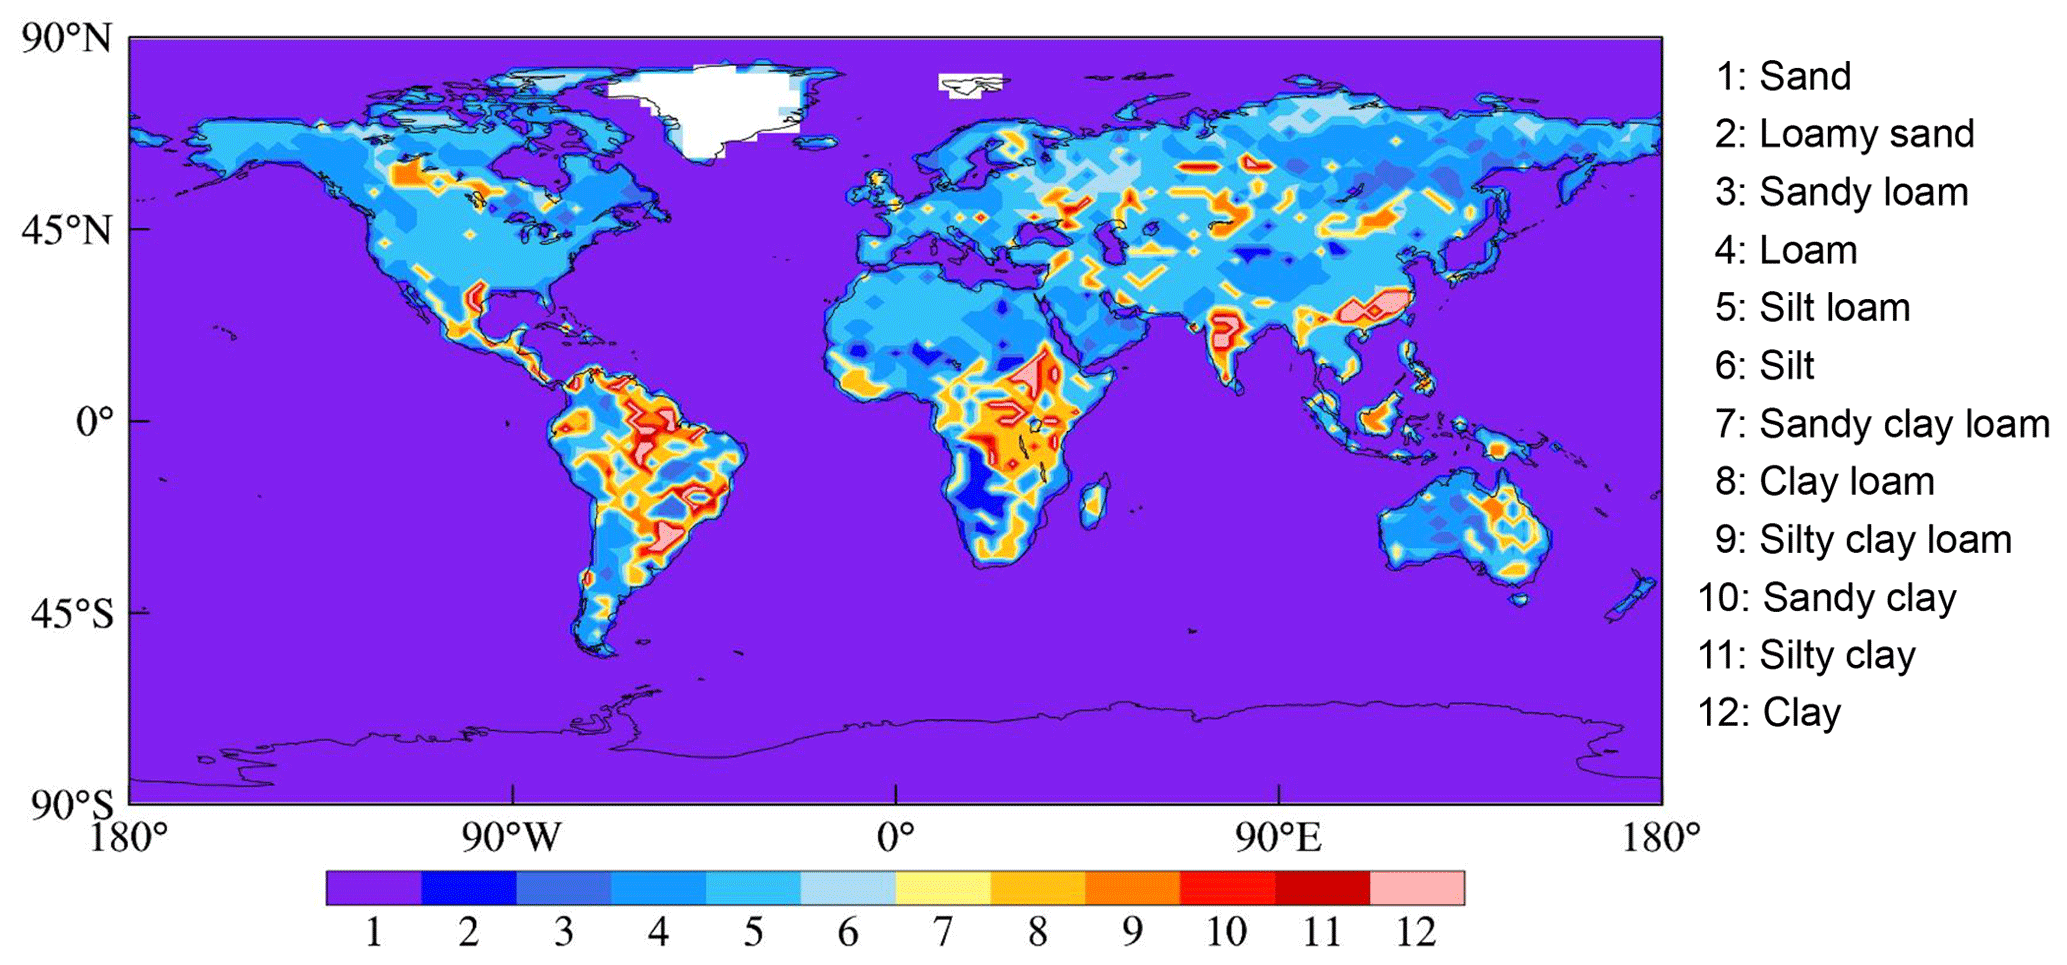
Figure 5Global soil texture map based on the USDA classification.
2.2.3 Sandblasting efficiency α
Sandblasting efficiency α is important in the dust emission calculation as it is used to convert the horizontal saltation mass flux to a vertical dust mass flux. In the original scheme, α is simply expressed as a function of Mclay, which is a fixed value of 20 %. The assumption in the original scheme might cause uncertainty in the modeled flux and make the spatial variation less representative (Mokhtari et al., 2012).
In order to reduce this uncertainty, a more physically based function from Lu and Shao (1999) (LS99) is adopted in our study. Based on wind tunnel experiments carried out by Rice et al. (1996a, b), Lu and Shao (1999) derived the expression of α through theoretical calculation and some simplifications:
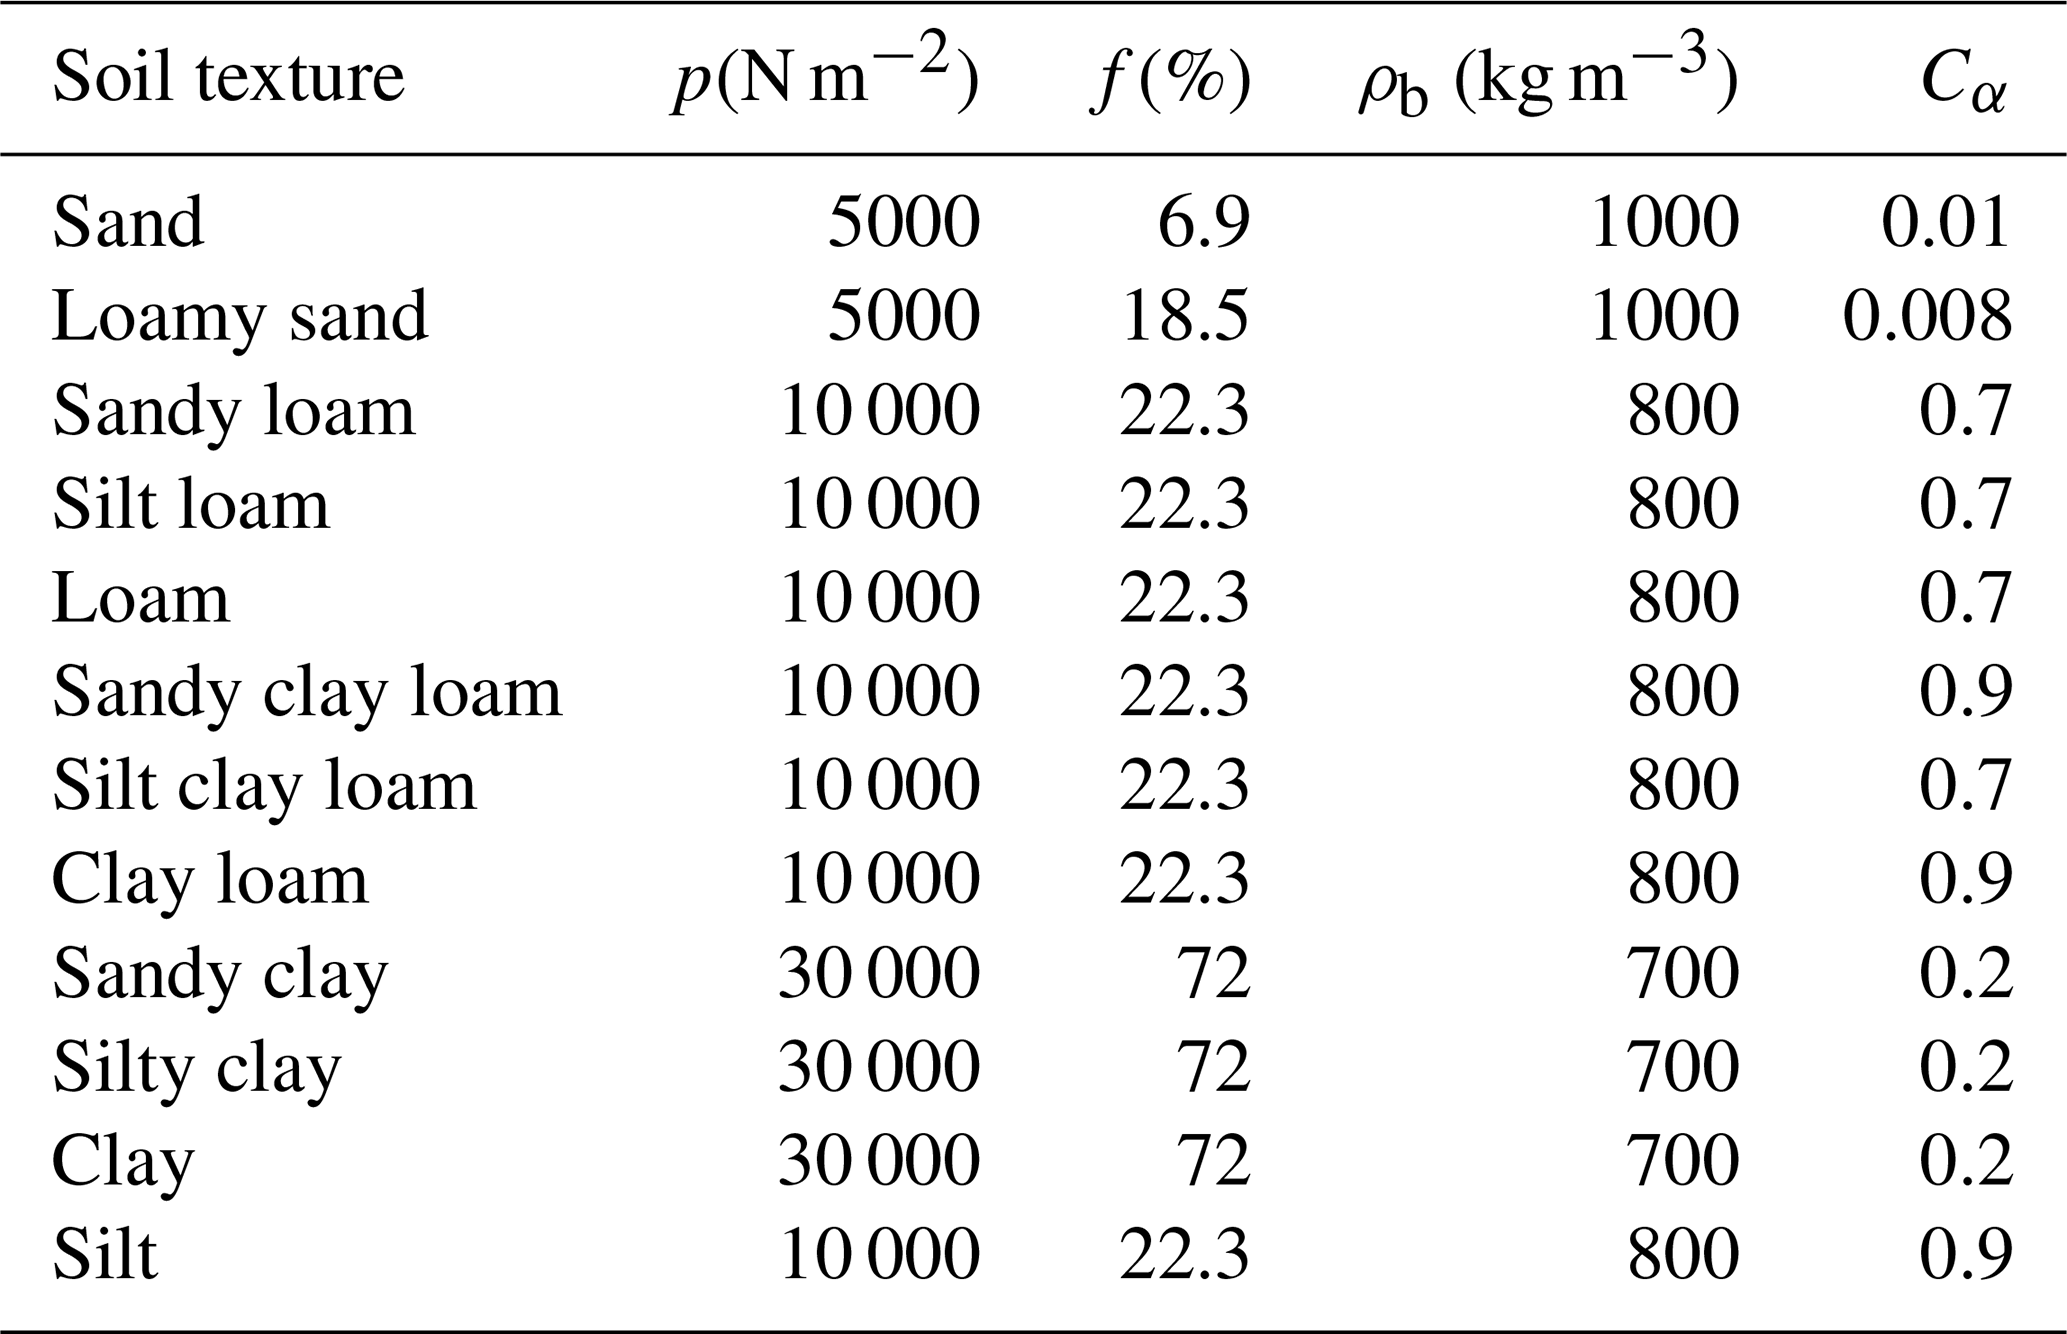
where f is the fine particle content in the soil volume; p is the soil plastic pressure, which represents the magnitude of the surface resistance (N m−2); ρb and ρp are the bulk soil density and particle density, respectively; g is the gravitational acceleration (m s−2); u∗ is the friction velocity (m s−1); and Cα and Cβ are empirical constants. Among these parameters, the values of ρb and p depend upon different soil textures. Some studies (Kang et al., 2011; Foroutan et al., 2017; Ma et al., 2019) have implemented this formulation in the model and proposed the proper range of these parameters over different soil types.
Table 1Input soil aggregate size distribution parameters dependent on soil texture classification following USDA.
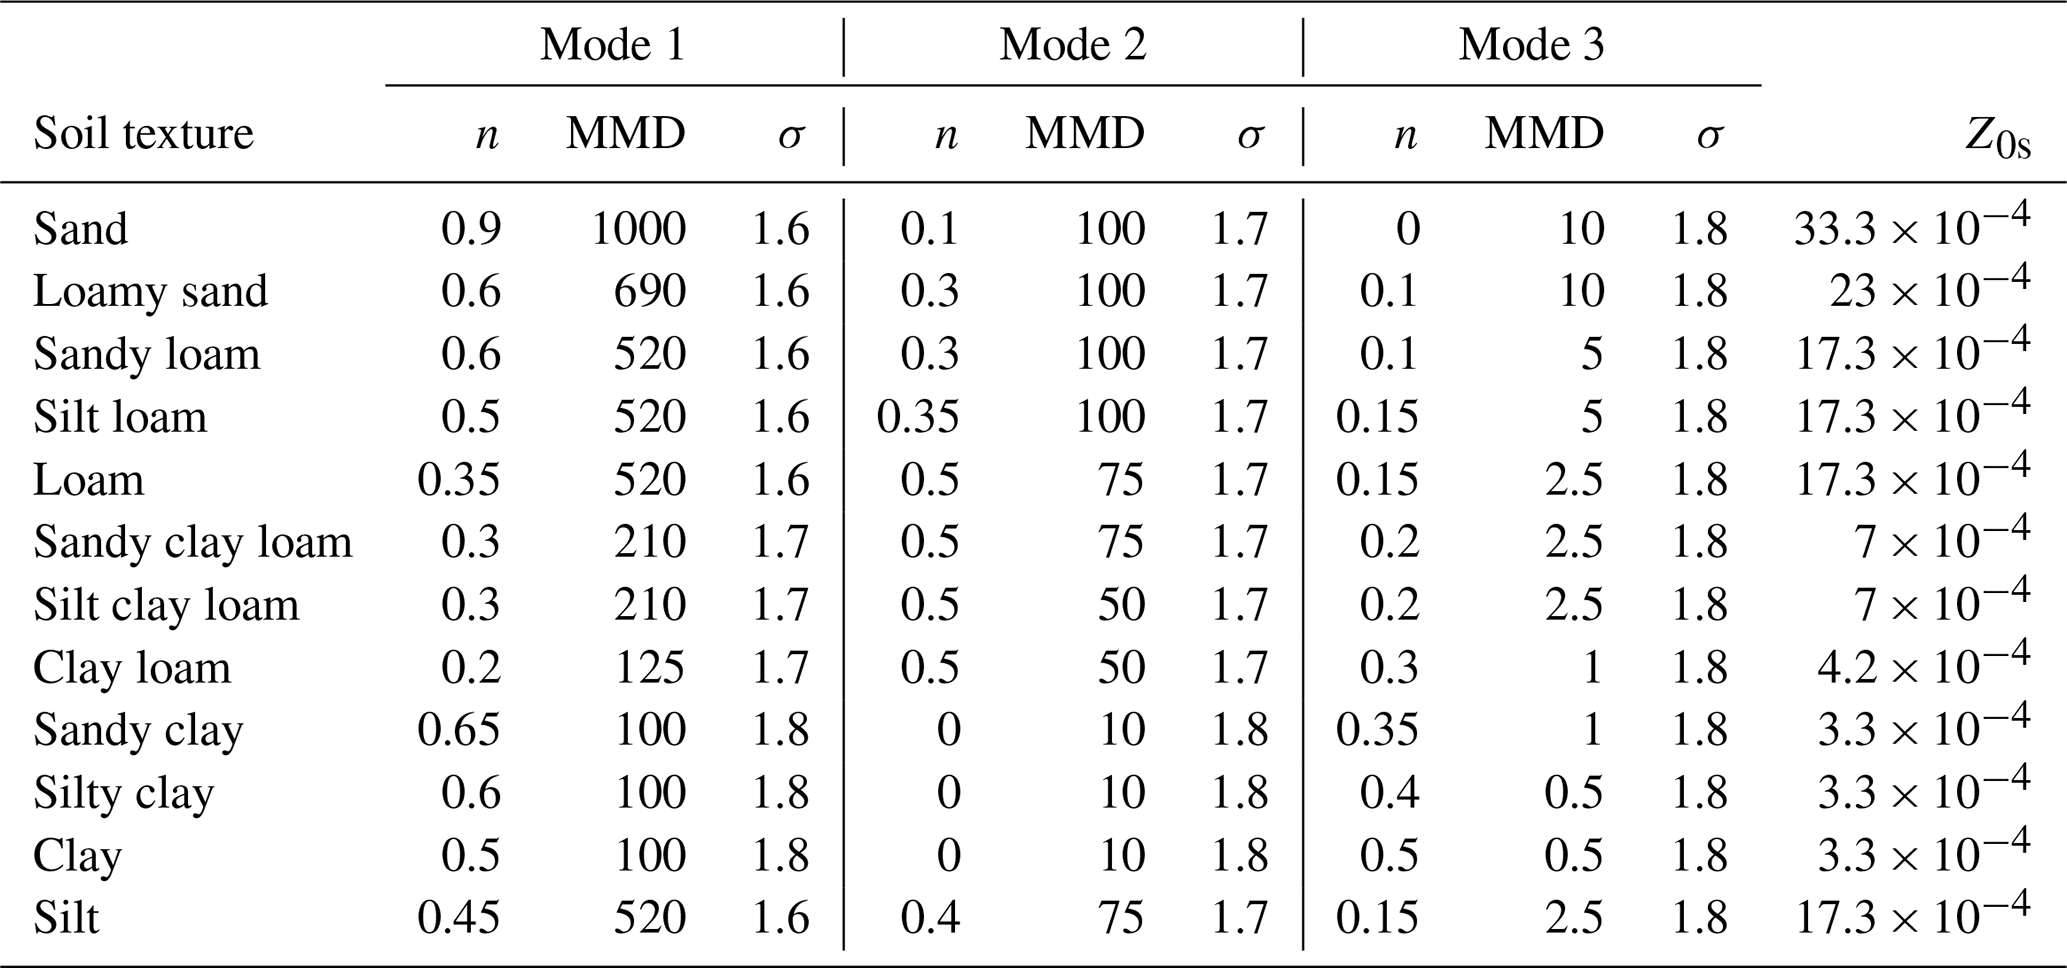
Including three-mode log-normal parameters (mass fraction n (%), mass median diameter MMD (µm) and geometric standard deviation σ) and smooth eolian roughness length z0s (cm).
Many measurements from laboratory experiments and field observations have demonstrated the close relationship between α and u∗ (Gillette et al., 1997; Gomes et al., 2003; Rajot et al., 2003; Roney and White, 2006; Macpherson et al., 2008; Panebianco et al., 2016; Zhang et al., 2016). To improve the original scheme, we extract α from these measurements over different soil types, based on the expression of LS99, as depicted in Fig. 6 and Table 2.
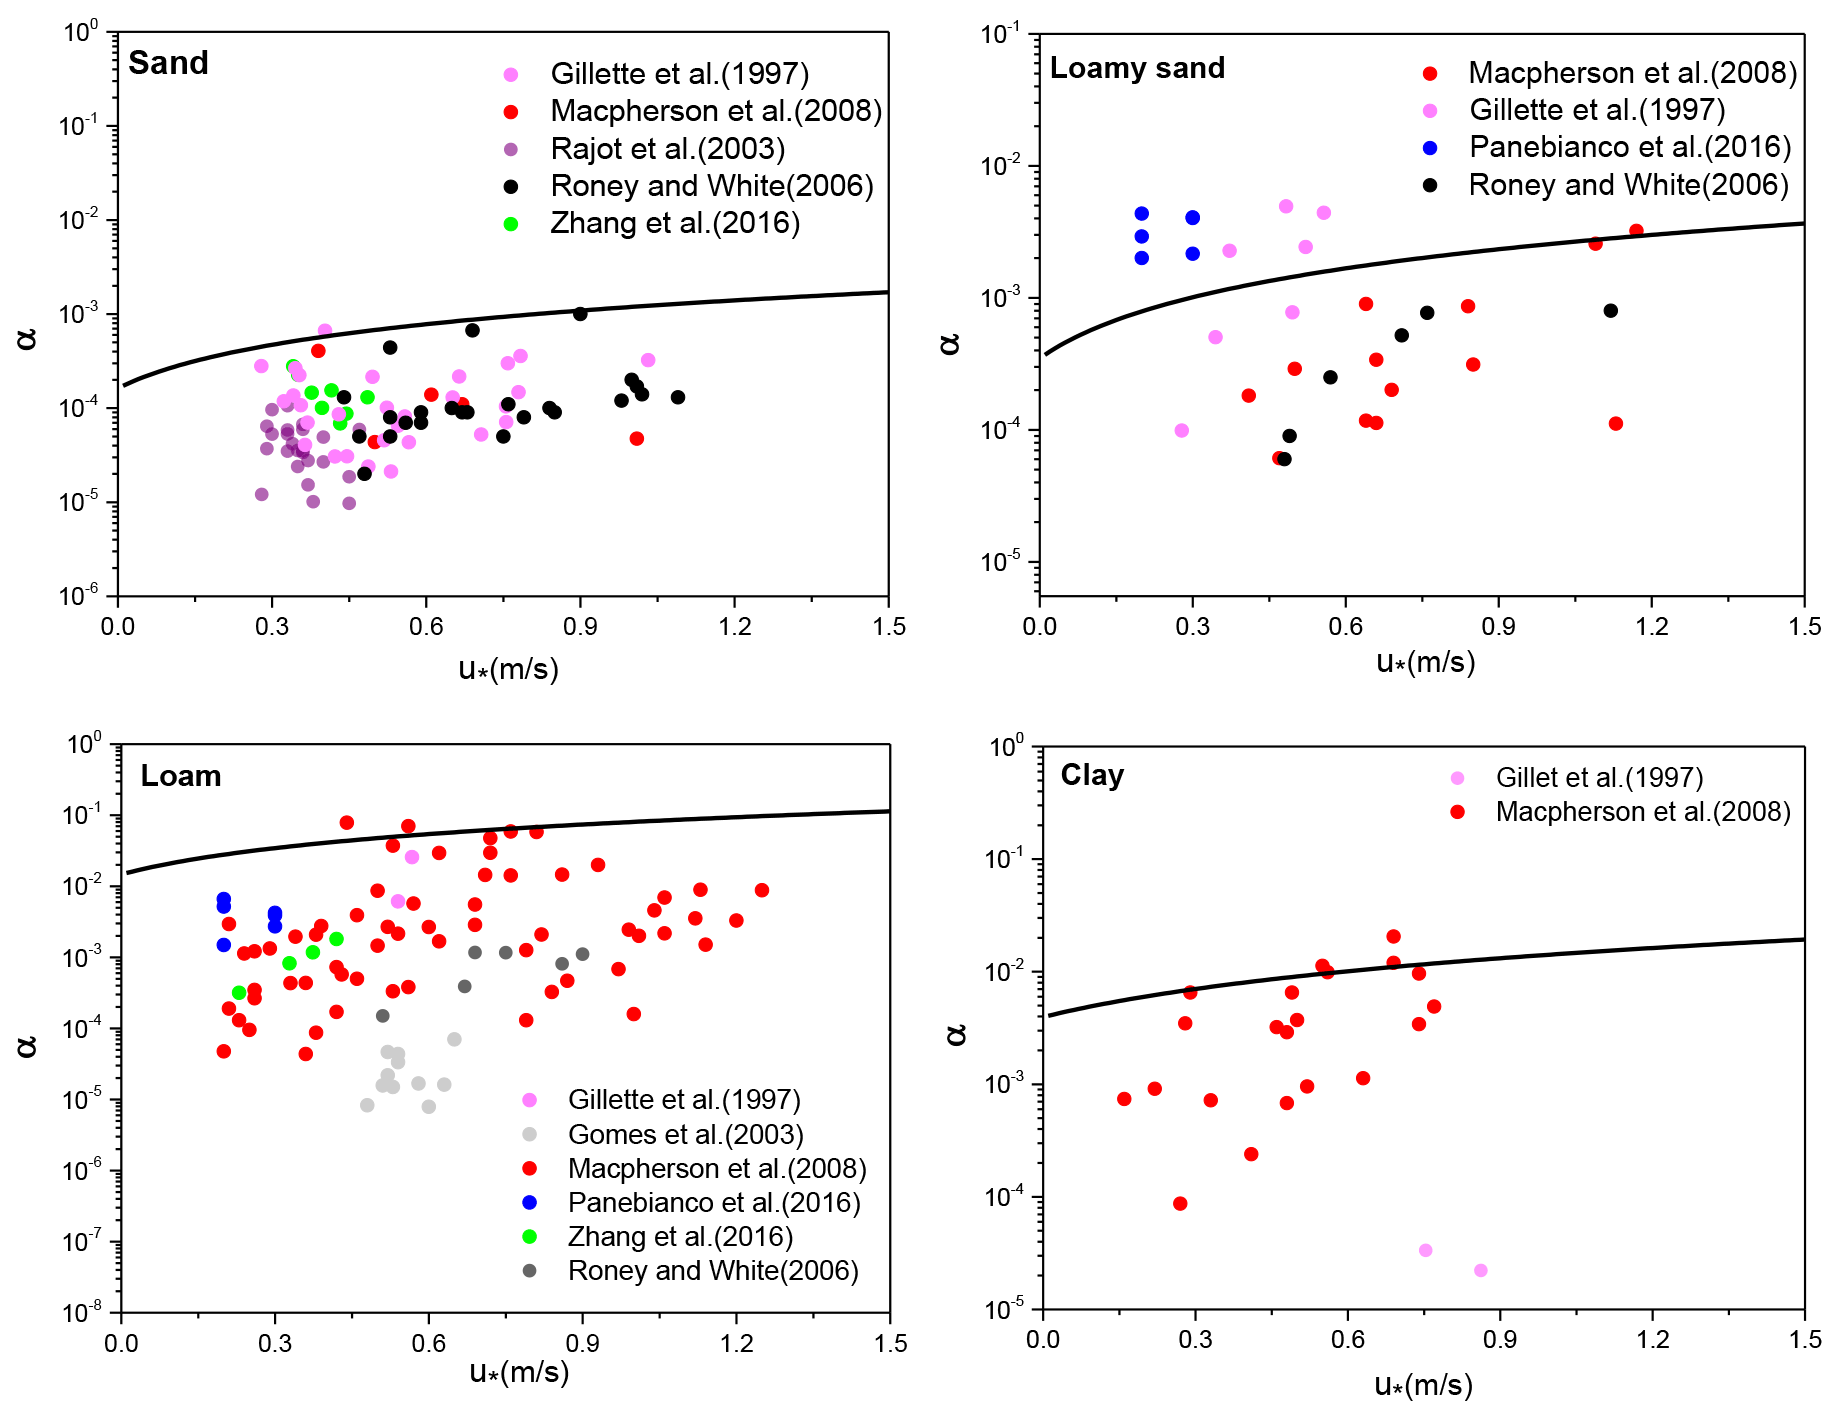
Figure 6Updated sandblasting efficiency α as a function of surface friction velocity u∗ following Lu and Shao (1999) for sand, loamy loam, loam and clay and observations from the literature.
Table 2Input soil-related parameters for different soil texture used in calculation of the sandblasting efficiency α.
2.3 Experiment design
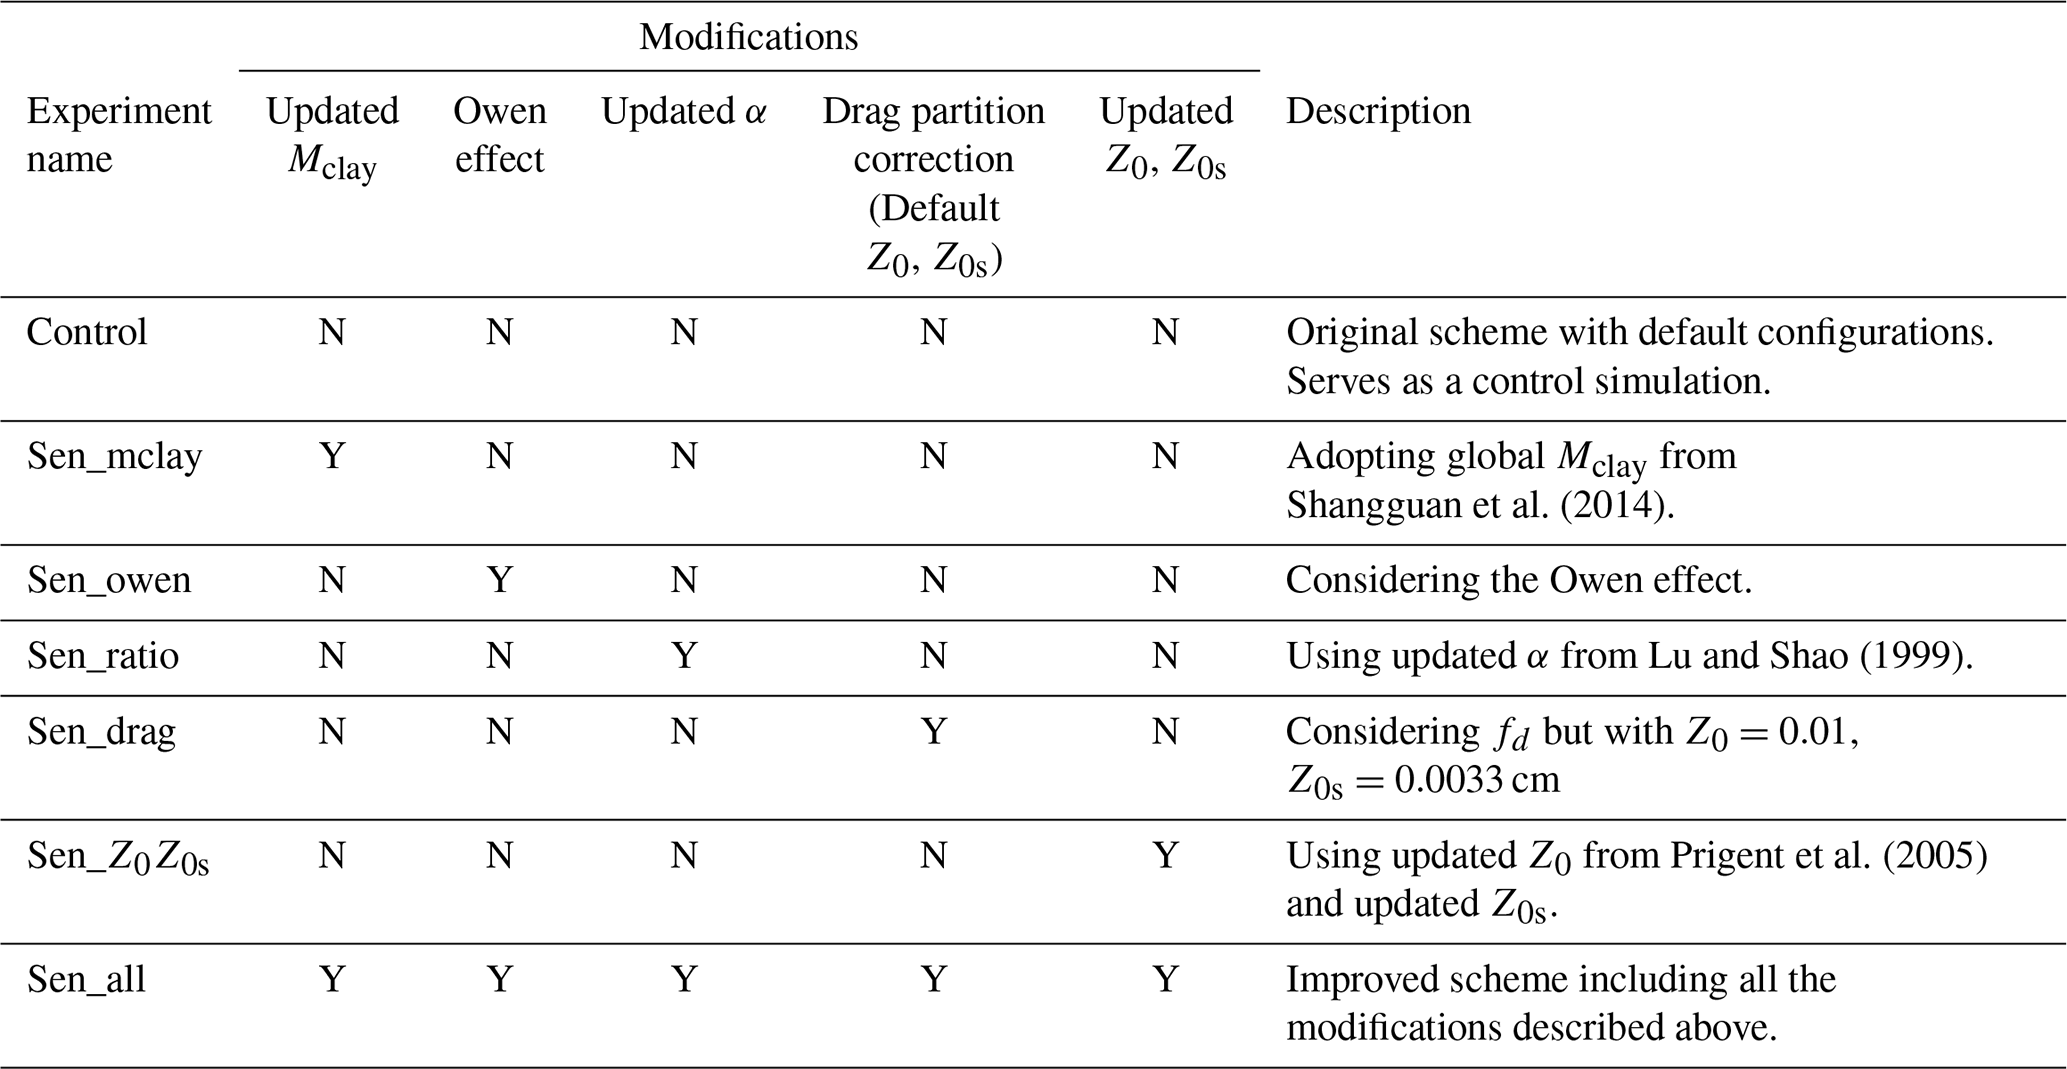
Several sensitivity experiments (Table 3) are conducted to assess the model performance of the modifications in the improved scheme. “Control” is the control run with the dust emission scheme originally implemented by Fairlie et al. (2007). Sen_mclay, Sen_owen, Sen_ratio, Sen_drag and Sen_Z0Z0s are the same as the control run but include the modification of Mclay, the Owen effect, the sandblasting efficiency, the drag partition effect and the updated surface roughness length (Z0 and Z0s) respectively. Sen_all represents the simulation with the improved scheme which accounts for all the modification described above.
2.4 Measurements
The data used in this study include the Moderate Resolution Imaging Spectrometer (MODIS) Level 3 AOD data, hourly observational data of surface PM10 concentration and meteorological field data taken from the Meteorological Information Comprehensive Analysis and Process System (MICAPS). The data used in this study are for the period of 27 March to 2 April 2015.
MODIS aerosol products are used to evaluate model results of AOD. MODIS AOD at 550 nm is obtained from the daily level-3 product from Aqua satellites (MYD08_D3, 1∘ × 1∘ gridded data) and is combined with Deep Blue retrievals which can provide AOD over bright surfaces (i.e., desert regions).
Hourly surface observed PM10 concentration data, collected from about 1000 environmental monitoring stations maintained by the Chinese Ministry of Environmental Protection (MEP; http://www.mee.gov.cn, last access: 24 January 2020), are used to validate the model performance of surface dust concentrations.
Meteorological fields of wind speed taken from the Meteorological Information Combine Analysis and Process system (MICAPS) developed by the Chinese National Meteorological Center (NMC) are used for the evaluation of the wind field in the model. Figures S2–S3 show that the 10 m wind field used in the model scheme generally agrees well with the MICAPS observations over most sites. However, comparisons of the averaged surface wind field between the model input and observations (Fig. S4) show that although the circulation patterns in the model are identical with the observations, surface wind speed in the model tends to be larger than observations (which was also found by Wang et al., 2014), especially over western and northeastern Inner Mongolia.
3.1 Sensitivity study
In order to assess the sensitivity of the dust emission to the modified input parameters or physical processes, several numerical experiments are conducted and compared. Figure 7a presents the relative difference (%) of averaged u∗t during the study period between these sensitivity simulations and the control run. The u∗t values simulated by the control run are generally small, with values less than 0.3 m s−1 (not shown). Wu (2013) indicated that u∗t values over source regions in northern China calculated by Zender et al. (2003) are generally lower (with values ranging from 0.2 to 0.25 m s−1) than the measurement (with values ranging from 0.34 to 0.69 m s−1) and the values calculated by Shao (2004), which is closer to the observations. The sensitivity simulations show that the update of Mclay in Sen_mclay can lead to higher u∗t over northern China and lower u∗t over southern China than the control simulation, which overestimates Mclay over northern China and underestimates it over southern China by setting Mclay to 20 %. In northern China, particularly in arid and semi-arid regions, the updated Mclay will decrease the soil moisture threshold w′ and increase soil moisture term fw, thus leading to a slight increase in u∗t (with magnitude < 10 %). The inhibition of dust emission by surface roughness elements is not taken into account in the original scheme, i.e., fd=1. Some studies (Darmenova et al., 2009; Menut et al., 2013) have demonstrated fd as a function of Z0 and Z0s, implying that fd values increase with Z0 and decrease with Z0s. Compared to the fixed values used in the original scheme, updated Z0 fields used in Sen_Z0Z0s are generally larger, and updated Z0s fields are smaller. Therefore, fd values are increased significantly, particularly over the regions with non-erodible elements (larger Z0). Results show that u∗t is increased when considering the drag partition effect (increased by 10 % in Sen_drag with constant Z0 field), particularly with the updated Z0 and Z0s field (increased by 10 %–60 % in Sen_Z0Z0s). In general, due to the inclusion of Z0, Z0s and Mclay, fd and fw are modified, which results in significant alteration in u∗t (ranging from −8 %–72 % in Sen_all) over China. It can be found that the modification of fd due to updated Z0 and Z0s makes more contribution to the increase in u∗t.

Figure 7Relative difference (%) in simulated averaged threshold friction velocity u∗t (a), surface friction velocity u∗ (b), sandblasting efficiency α (c) and emission flux (d) between sensitivity simulations and the control run during the study period.
The relative difference of u∗ with respect to the control run is also compared in Fig. 7b. Considering the Owen effect in Sen_owen leads to an increase in u∗ by 0 %–39 %, especially over northwest China where surface wind is strong. Modeled u∗ is obtained from u10 m and Z0 under neutral conditions (Bonan, 1996). It can be seen that updated Z0 in Sen_Z0Z0s can modify u∗ by influencing the boundary-layer exchange properties. u∗ over northern China is generally increased by 10 %–22 %, with higher values of Z0 in Sen_Z0Z0s, while it is slightly decreased over the Taklimakan and Gobi deserts. In Sen_all, modeled u∗ is increased by 5 %–50 % over most parts of China.
Figure 7c presents the percentage difference in terms of sandblasting efficiency α. In the original version, α is set as a uniformly constant value (around 0.04) due to the assumption of a fixed Mclay. In Sen_ratio and Sen_all, the u∗-dependent ratio, following LS99, which varies with different soil texture according to observations, is adopted. On average, α is decreased by 50 % with the modification in Sen_ratio and Sen_all. The largest reduction occurs over regions with sand texture, such as over the Taklimakan and Gobi deserts.
As seen from Fig. 7d, the simulated dust emission flux (F) varies significantly among different experiments. Due to the inclusion of updated Mclay, the soil moisture term increases in Sen_mclay, which leads to higher u∗t and lower F over most regions. Accounting for the Owen effect in Sen_owen results in an increase in F of 0 %–314 %, particularly over the northern part of Gansu Province and northwestern Inner Mongolia. A significant reduction in arid and semi-arid regions of northern China is caused by updated α (Sen_ratio). In Sen_drag and Sen_Z0Z0s, the alteration of F values ranges from −100 % to −4 % and −100 % to 50 %, respectively, due to the inclusion of fd with constant Z0 and updated Z0 and Z0s. Due to the combined effects of the modifications, F simulated by Sen_all is generally reduced over northern China, except in some regions of northwest China, where the Owen effect plays a dominant role.
Five sites closer to the dust source area or significantly influenced by dust storms (Xilinguole, Huhehaote, Jiuquan, Kuele and Akesu; locations shown in Fig. S1) are selected to evaluate the performance of the control run and sensitivity simulations. Comparisons of the modeled u∗t (Fig. 8) show that in all sites, modeled u∗t values are increased in Sen_mclay, Sen_drag, Sen_Z0Z0s and Sen_all, compared with the original model, with the highest u∗t simulated by Sen_all. Modeled u∗t values increase from 0.23–0.25 m s−1 in the control run to 0.29–0.37 m s−1 in Sen_all. The reported u∗t values over arid and semi-arid regions of China are around 0.3–0.5 m s−1 (Wang et al., 2009). Wu (2013) summarized that u∗t range from 0.34–0.69 m s−1 over East Asia and indicated that u∗t values calculated by Zender et al. (2003) are relatively lower, ranging from 0.2 to 0.25 m s−1. It is apparent that modeled u∗t values are greatly increased in the revised simulation, which is much closer to the observed values. This improvement is mainly attributed to the update of Z0 and Z0s. Comparisons between the modeled averaged PM10 concentrations and the observational values in five sites show that PM10 levels simulated by Sen_all are closer to observations than many other cases. In summary, Sen_all shows the better agreement with the observations in terms of u∗t and PM10 concentrations.
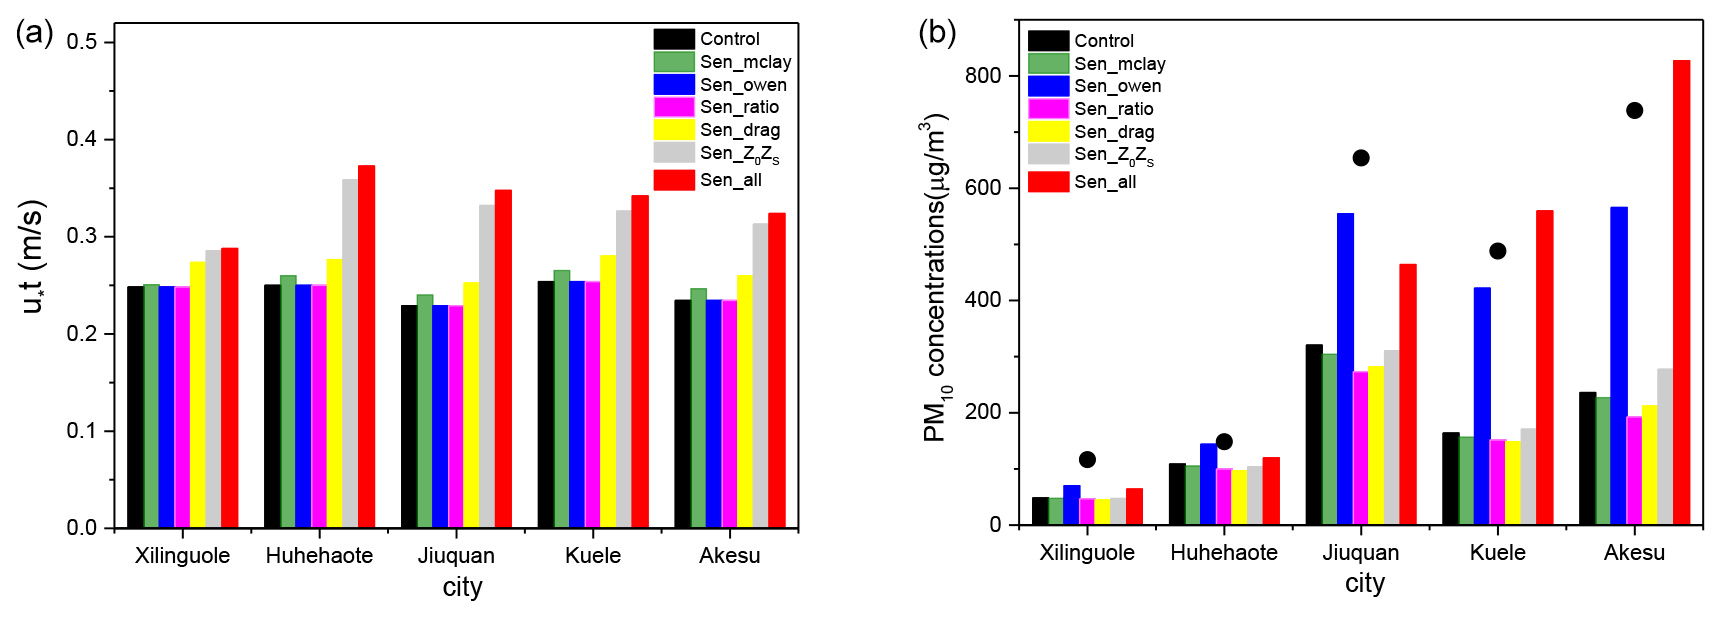
Figure 8Comparisons of simulated averaged threshold friction velocity u∗t (a) and PM10 concentrations (b) at selected sites. Black dots in (b) indicate the observed averaged PM10 concentrations.
3.2 Comparison between the improved scheme and the original scheme with observations
In order to validate the model performance of the improved scheme, time series of the observed surface PM10 concentrations are compared against the modeled values from the control run (the original scheme) and Sen_all (the improved version) during a dust episode from 27 March to 2 April 2015 over northern China. The intensity and evolution of this dust event have been described by Wang et al. (2017), illustrating that dust particles were mainly emitted from Mongolia and the Inner Mongolia region of China and that a dust backflow event took place over northern China on 29 March. Figure 9 compares the hourly modeled PM10 concentrations and observed values for nine selected sites (locations shown in Fig. S3), which are closer to the dust sources or severely affected by the dust event. It shows that the dust concentrations are generally underestimated in the control run, particularly when dust concentrations are quite high, indicating that the original scheme has difficulty in accurately reproducing the dust emission process. Sen_all generally reproduce the PM10 levels better than the control run. Both the magnitude and the temporal evolution of PM10 concentrations are captured in Sen_all quite well, with peak values much closer to the observations. Among these sites, Sen_all shows better performance over North China, e.g., Beijing, Tianjin and Huhehaote. But both the control run and Sen_all fail to capture the peak values from 29 to 30 March. During this period, dust particles, mixed with anthropogenic pollutants, flew back due to the south wind over North China (Wang et al., 2017). Uncertainties in the meteorological field and dust heterogeneous reactions in the model may cause the model bias.
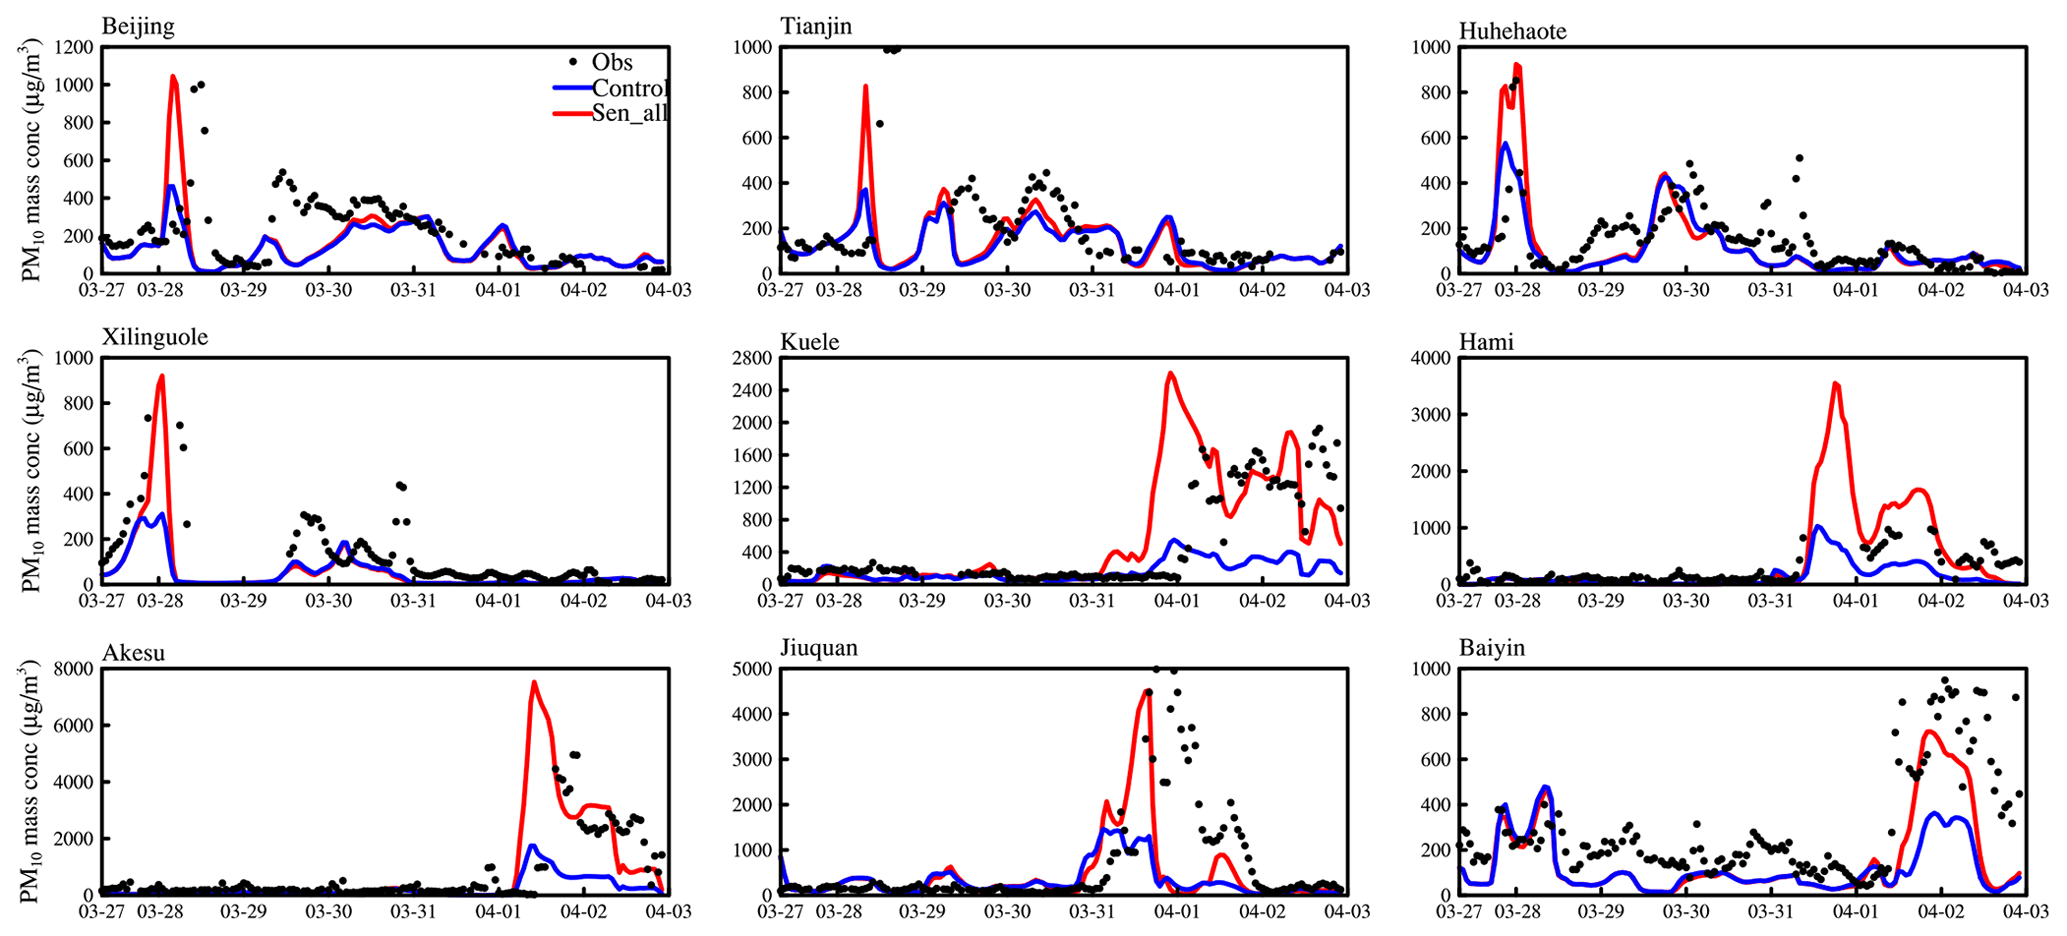
Figure 9Temporal variation of hourly PM10 concentrations from observations (black dots) and simulations of the control run (blue line) and Sen_all (red line) during the study period at nine selected sites.
For specific periods, however, modeled peak values of some sites occur earlier (several hours) than the observations at some sites (e.g., Beijing and Tianjin in 28 March), which could be considered as being a result from the uncertainty in the wind field used in the model. It shows that the surface wind is stronger in the model than the observations (Fig. S2), which may lead to stronger transport of the dust from source regions to downwind areas such as Beijing, Tianjin and Kuele. Instead, modeled and observed peak values of some sites in the source regions (e.g., Huhehaote, Xilinguole and Hami) almost occur simultaneously.
In order to quantify the performance of the model result, some statistical parameters, including the mean values, correlation coefficient (R), mean bias (MB) and normalized mean bias (NMB), are calculated and listed in this paper. The statistical performance for the modeled surface PM10 concentrations from the control run and Sen_all against observations is presented in Table 4. It shows that dust concentrations at all selected sites are significantly underestimated in the control run, especially over northwest regions, with the MB and NMB values ranging from −163.5 to −503.61 µg m−3 and −64.61 % to −68.48 % respectively. It is obvious that Sen_all with updated modification greatly improves the dust concentration prediction, with mean values more comparable to the observations, and the average MB and NMB values reduce from −196.29 µg m−3 and −52.79 % in the control run to −47.72 µg m−3 and −22.46 % respectively. The largest improvement occurs at northwest stations (e.g. Hami, Akesu and Kuele), which are located close to the Taklimakan desert. Over other regions, such as North China (e.g., Beijing, Tianjin, Huhehaote and Xilinguole), the model performance of Sen_all is slightly better than the control run.
Table 4Statistics for observed and simulated (control and Sen_all) surface PM10 concentrations at selected sites.
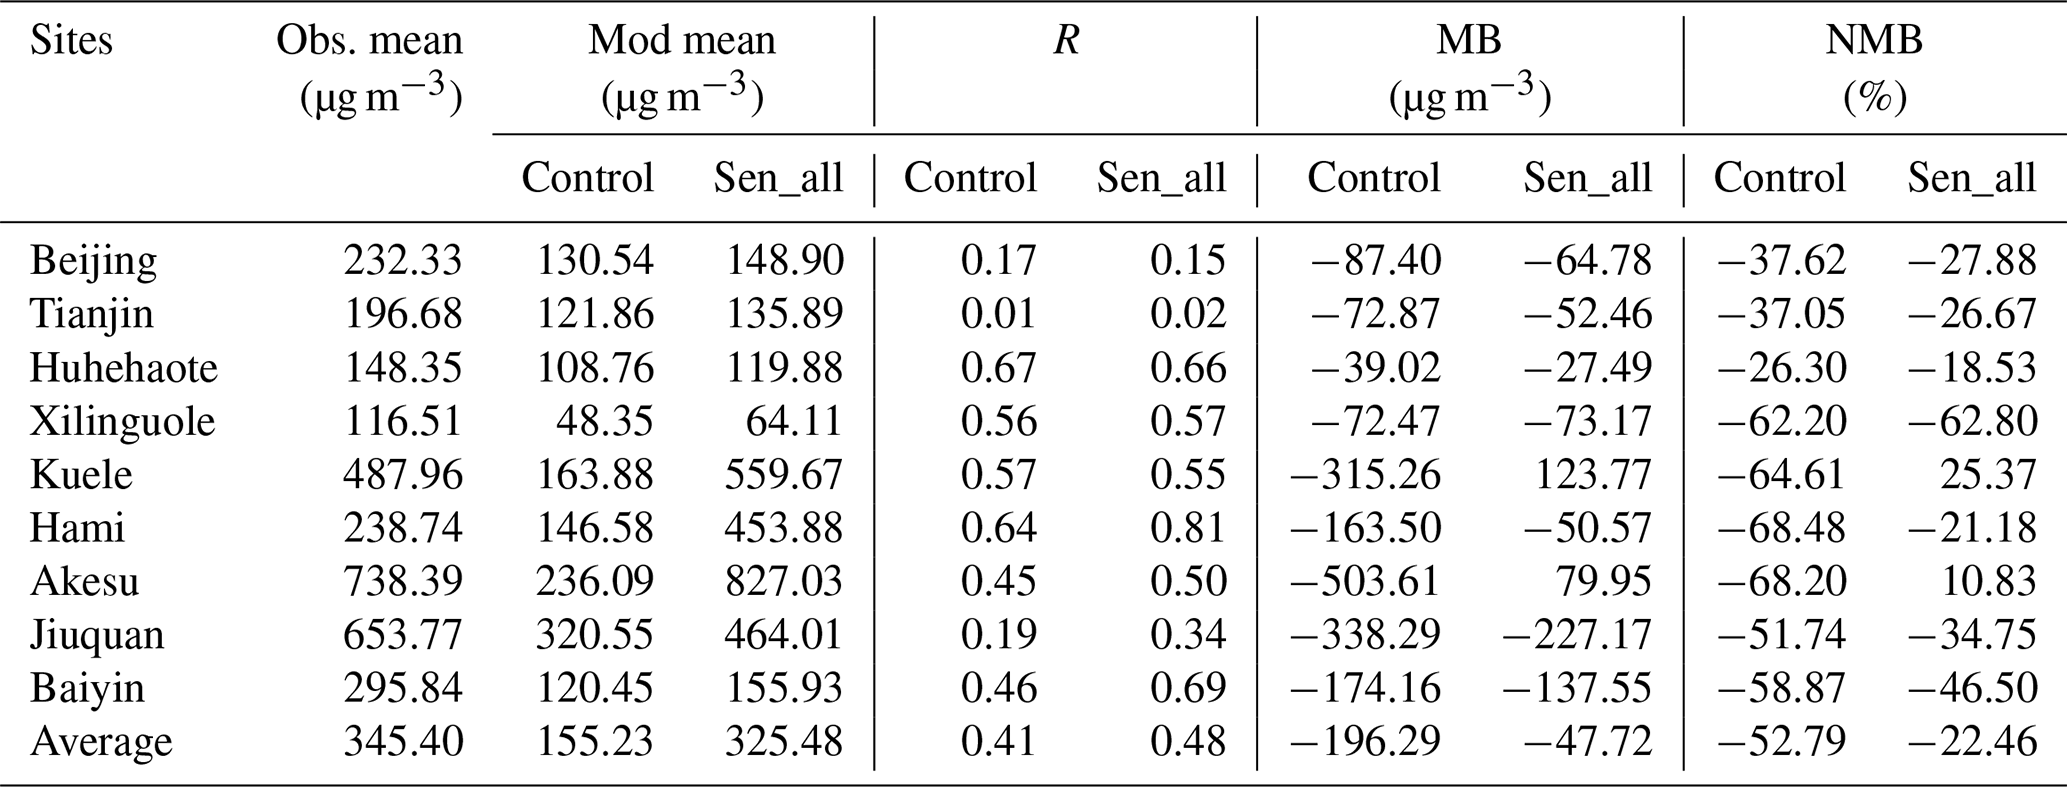
Although the MB and NMB values of most stations are generally lower and the mean values are much closer to observations for the Sen_all simulation, i.e., modifications included improve the underestimation in the control run to some extent, the dust concentrations are still generally underestimated. For stations closer to Gobi desert, such as Xilinguole, Jiuquan and Baiyin, dust concentrations are greatly underestimated, with NMB < −30 %, which is likely due to the uncertainty in the erodibility factor over Gobi desert used in our study (Ginoux et al., 2001). Similarly, Su and Fung (2015) evaluated the performance of dust emission schemes in WRF-Chem over East Asia, pointing out that the erodibility factor from Ginoux et al. (2001) over the Gobi desert is significantly underestimated, which may result in the underestimation of the dust emission over the Gobi desert. Given that the simulated dust emission flux is directly scaled by the erodibility factor, we suggest that the erodibility factor used in our model needs to be updated or improved.
As stated above, although the model can capture the overall temporal variations of surface dust concentrations, modeled peak values occur earlier (about 6 h) than the observations over several stations, which may be attributed to strong transport due to stronger surface wind used in the model. It should be noted here that this model bias contributes a lot to the simulation error, leading to smaller R and greater MB and NMB values. R values will be greatly improved if this bias is eliminated, implying that the input assimilated meteorological field is important for dust emission simulation and needs to be further evaluated and adjusted.
The averaged modeled surface PM10 concentrations with and without modifications (Sen_all and control run respectively) and observational values at ∼ 1400 stations over China during the study period are compared in Fig. 10. It shows that dust concentrations are generally underestimated in the control run (NMB = −16 %, regression slope = 0.4), which could be attributed to the crude representation of soil properties, roughness length and other related elements. Incorporating improvements into the scheme makes the modeling result much closer to the observations, with R values increasing from 0.6 to 0.7, NMB values changing from −16 % to −11 % and the regression slope ranging from 0.4 to 0.6. However, the improved model still tends to underestimate dust concentrations. Unrealistic soil properties (e.g., soil texture or roughness length) and an insufficiently accurate potential source map (the erodibility factor) used to scale the dust emission flux could be the possible causes.
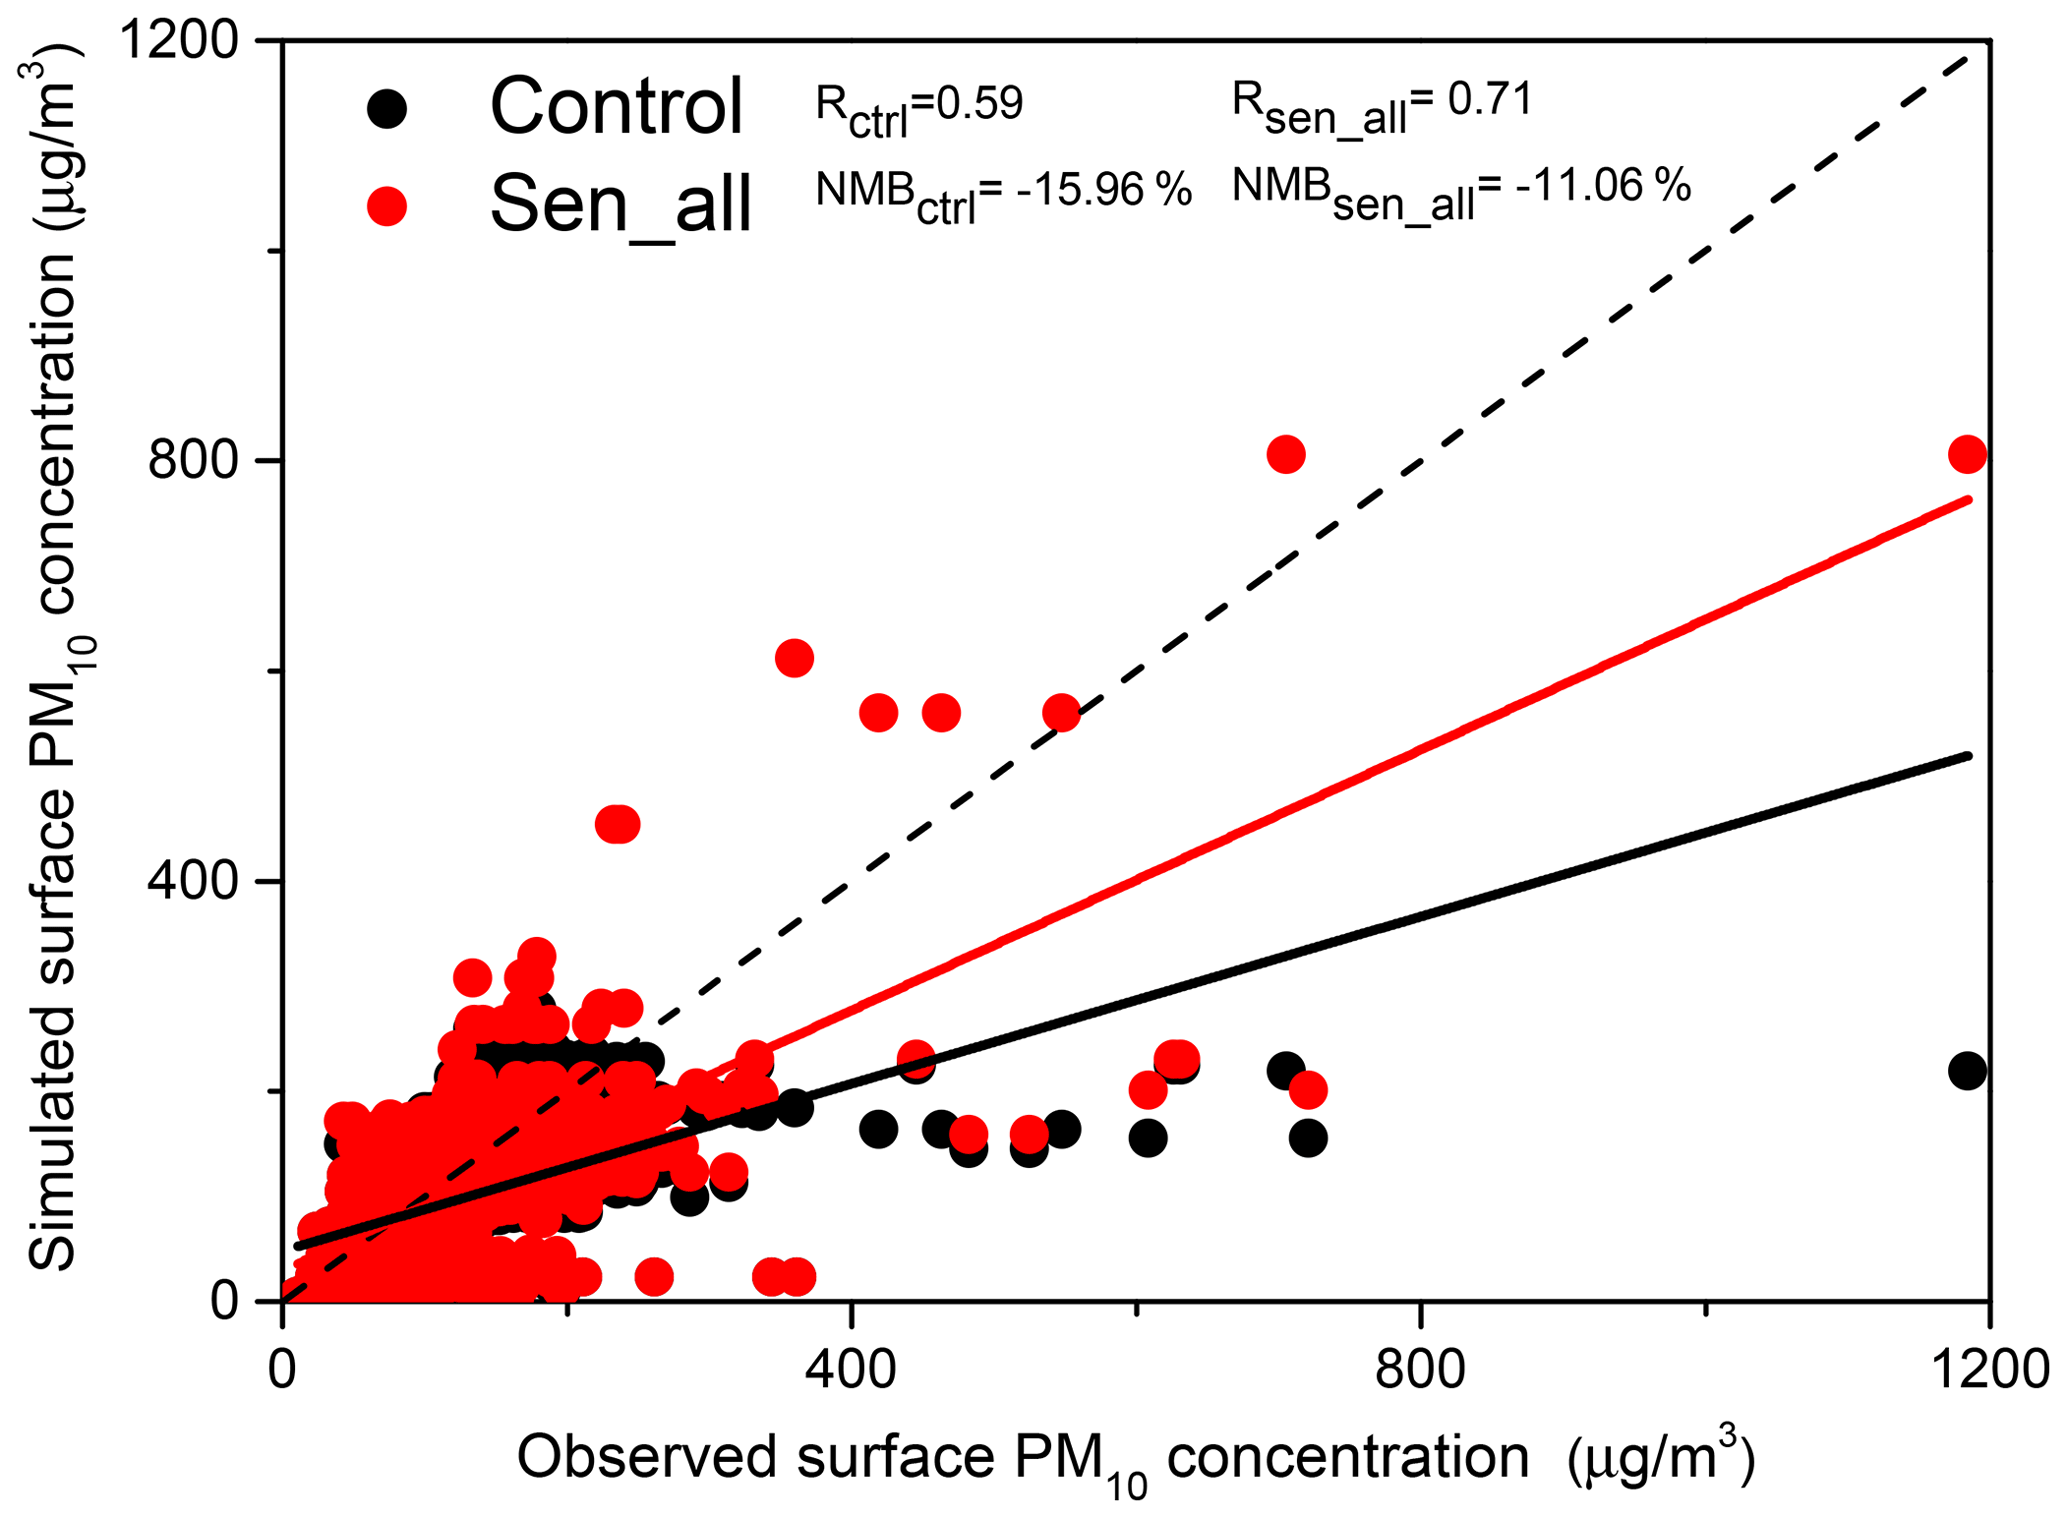
Figure 10Comparison of modeled and measured surface PM10 concentrations at observational sites. The dotted line is the 1:1 line. Model results are taken from the control run and Sen_all respectively.
To further investigate the model performance, spatial distributions of averaged simulated surface PM10 concentrations from the control run and Sen_all and their comparisons against observations are presented in Fig. 11. Results show that both the control run and Sen_all can reproduce the pattern of dust concentrations in the study region, with high values located over northwest China, North China and some areas of northeast China, indicating that GEOS-Chem can represent the main features of dust emission and transport during the dust storm. It is found that for most sites in the control run, the simulated magnitudes are close to the observational values but are underestimated over northwest China (where Gobi and Taklimakan deserts are located) and the North China Plain. The simulated values from Sen_all are generally larger than the control run and are more consistent with measurements both in magnitude and in area extent, especially over the desert region of northwest China. However, dust concentrations are still underestimated over the North China Plain, possibly due to the outdated source map or some potential dust source regions over Inner Mongolia not being included well. In addition, the missing mechanism of secondary aerosol sources in the model such as heterogeneous reactions could also cause the model bias (Zheng et al., 2015; Cheng et al., 2016).
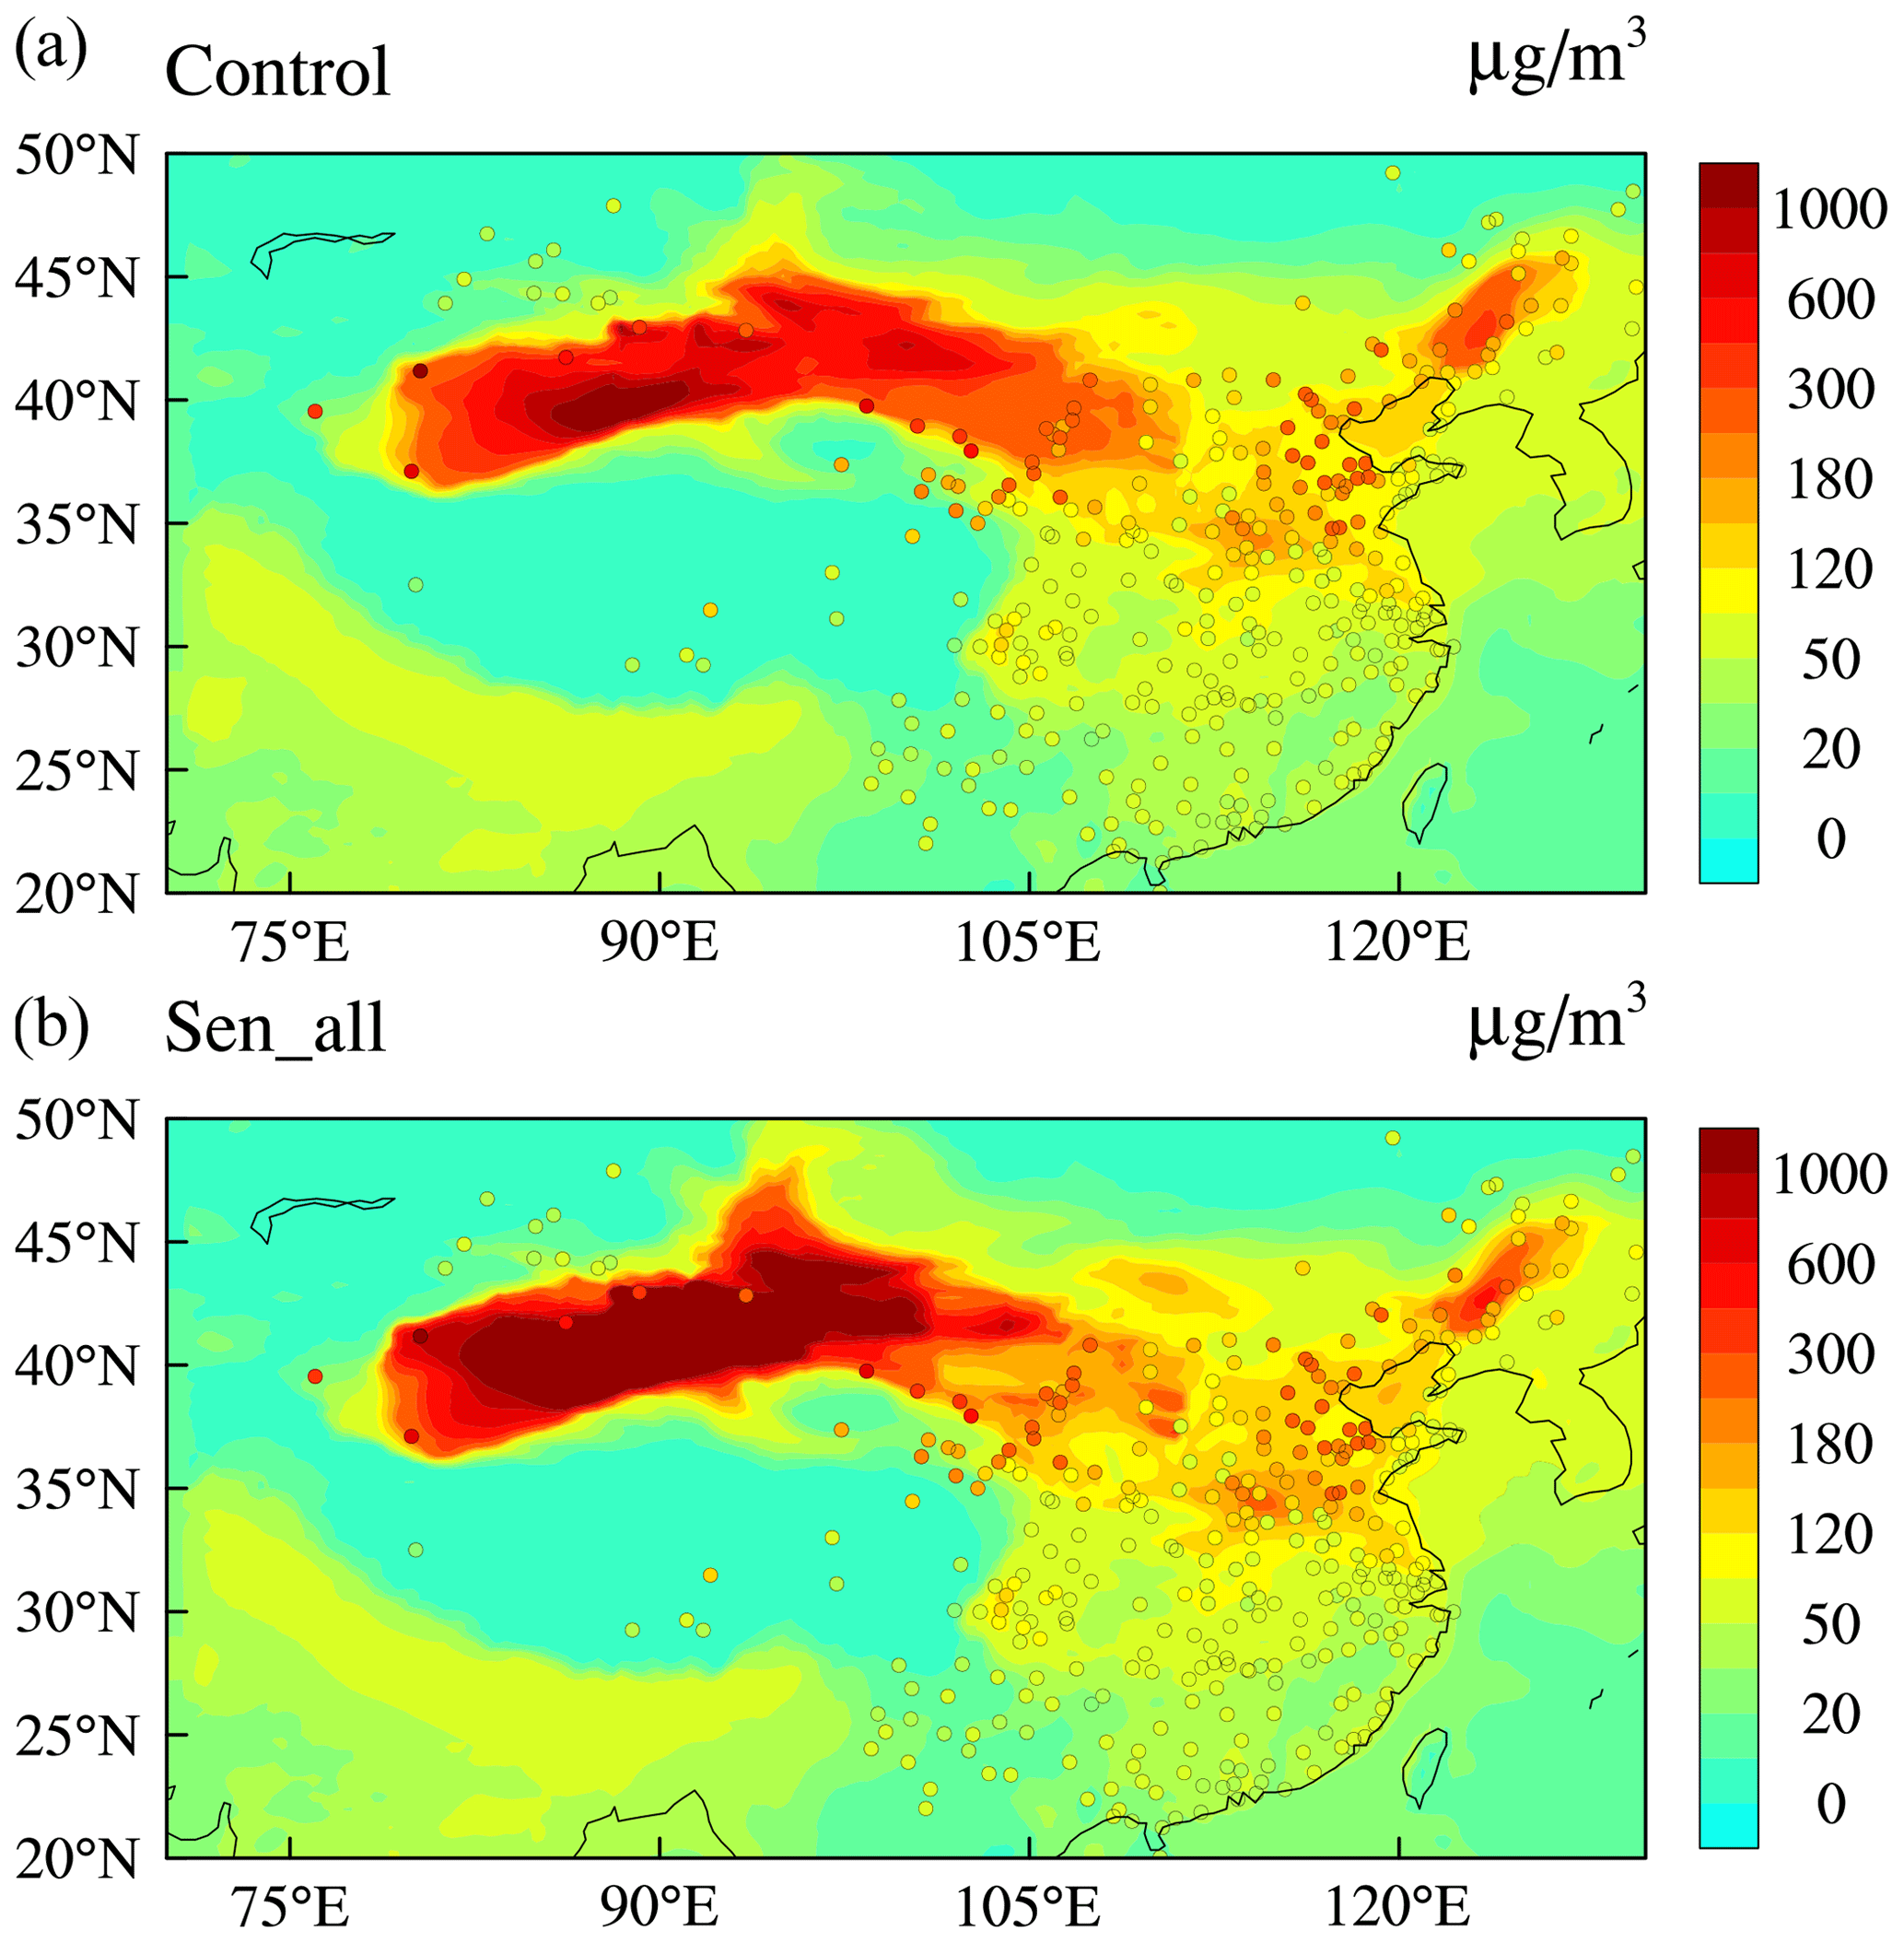
Figure 11Comparison of simulated averaged PM10 surface concentrations from the control run (a) and Sen_all (b) with the observed values.
Figure 12 shows the spatial distribution of simulated averaged AOD from the control run and Sen_all as well as MODIS AOD for the study period. For better comparison, simulated AOD at 13:00 local time (Aqua passage time) is extracted. Results show that the control run reproduces the major regions with high AOD values, e.g., eastern China, but with lower magnitude. The control run also fails to capture the high-AOD area over the Taklimakan desert, while Sen_all could capture it. Compared with the control run, Sen_all generally reproduces the spatial coverage and magnitude of the observed AOD.
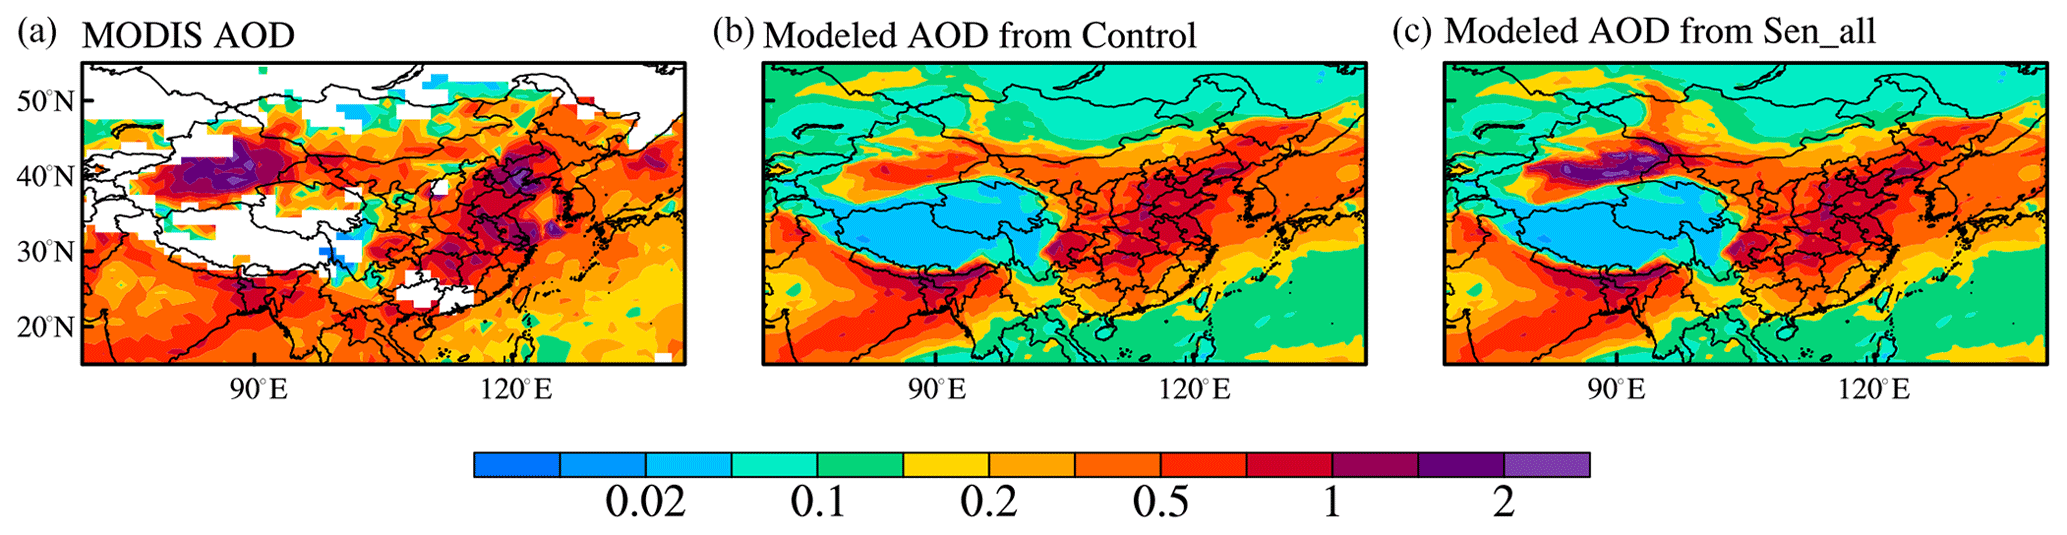
Figure 12Spatial distribution of MODIS-retrieved AOD at 550 nm (a) and simulated AOD at 550 nm from the control run (b) and from Sen_all (c). The simulation results are extracted at 13:00 local time to match the MODIS observation time.
3.3 Discussion
In our study, we point out that the erodibility factor (S) in the model may introduce uncertainty in modeled dust concentrations, especially over Gobi desert. Several studies indicated that S from Ginoux et al. (2001) over the Gobi Desert has been significantly underestimated and needs to be improved (Su and Fung, 2015; Zeng et al., 2020). Wu and Lin (2014) have demonstrated that the potential source regions in the southeast of Mongolia and the middle-east of Inner Mongolia are not well characterized by the S from the GOCART scheme, which results in the underestimation of dust concentration in this area and its downwind regions. In addition, the source function may not provide precise enough information about the recent expansion of dust source areas over northern China, with desertification and deforestation (Ku and Park, 2013). Studies have demonstrated that implementing a physically based parameterization instead of an empirical dust source function, which is usually time-invariant and lacks physical treatment (Kok et al., 2014a, b), or adopting the dynamic dust source function (Xi and Sokolik, 2015) could improve the representation of dust emission. Therefore, the dust source function should be precisely established with new updates and higher resolution using various measurements.
In terms of sandblasting efficiency α, many modeling studies as well as observational analysis have investigated its magnitude and expression, but the results may vary greatly (Kang et al., 2011; Ma et al., 2019). The formulation for α used in our improved scheme is based on LS99, which establishes the relationship between α and u∗, along with other soil-related parameters dependent on soil textures. In this study, we derived α for different soil types based on the reported values, but uncertainties still remain due to limited available measurements. In addition to the expression from MB95 and LS99, there are other α formulations proposed by Shao et al. (1996) (Shao96) and Shao (2004) (Shao04). Different from the empirical function, expressions of Shao96 and Shao04 are more sophisticated, which are the function of u∗t and u∗ respectively, along with some size information of soil particles. Comparisons of different formulations of α for different soil types (Kang et al., 2011; Ma et al., 2019) have shown that the variation in α can reach up to several orders of magnitude, and few equations could reproduce the measured positive correlation between α and u∗, suggesting that α for different soil texture should be further investigated and observed to improve the model accuracy.
In this study, surface conditions including erodibility factor, soil texture, clay content and surface roughness length play a significant role in improving the model performance of u∗, u∗t and F. We conclude that substituting globally fixed values of these properties with more realistic and physical-based ones could reduce the model uncertainty and improve the understanding of the dust emission mechanism. In the physically based scheme, the importance of accurate input surface properties, including soil particle size distribution (Darmenova et al., 2009; Kok, 2011a, b), soil texture (Shao et al., 2011; Foroutan et al., 2017), surface roughness length (Darmenova et al., 2009; Kontos et al., 2018) and soil plastic pressure (Lu and Shao, 1999; Kang et al., 2011), has also been highlighted by many studies. Therefore, accurate and abundant observation data of soil-related properties are urgently needed, particularly over dust source region. Moreover, various and comprehensive observation methods (e.g., experimental data and field and satellite observations) are recommended in order to correct and update the input data.
In this study, we revised the treatments of dust emission processes by considering the effect of soil moisture, surface roughness and soil texture, as well as the Owen effect and a more physically based formulation of the sandblasting efficiency in GEOS-Chem version 12.6.0, in order to improve dust simulation over China. Several sensitivity simulations were conducted during a severe dust storm between 27 March to 2 April 2015 over northern China to analyze the effects of these modifications on u∗, u∗t and the emission flux.
In the improved scheme, we substituted assumed constant values of Z0 and Mclay in the original version with geographical variation maps obtained from the measurement provided by Prigent et al. (2005) and Shangguan et al. (2014) respectively. Z0s and sandblasting efficiency were calculated with formulations based on soil texture data from the FAO dataset, which is more physically based than the original version. In addition, the Owen effect and drag partition correction factor were considered in the improved version.
Sensitivity results showed that the modified fd and fw by inclusion of the updated Z0, Z0s and Mclay resulted in significant alteration in u∗t (ranging from −8 %–72 %) over China. u∗t was increased when including the drag partition effect, particularly with the updated Z0 and Z0s field (increased by 10 %–60 %), which brought the modeled u∗t much closer to the measurements. Considering the Owen effect increased modeled u∗ by 0 %–39 %, especially over northwest China where surface wind is strong. In general, modeled u∗ was increased by 5 %–50 % over most parts of China due to the inclusion of the Owen effect and updated Z0. In terms of sandblasting efficiency, it was decreased by 50 % on average with the updated u∗-dependent ratio following LS99, with the largest reduction occurring over regions with sand texture. Due to the combined effect of updated treatments, the emission flux simulated by the improved scheme was generally decreased over northern China, except in some regions of northwest China, where the Owen effect played a dominant role. Better agreement between the improved model results and observational values was achieved in terms of the u∗t and surface PM10 concentrations in selected typical sites over northern China.
Compared with both surface PM10 observations and MODIS AOD, the revised dust emission scheme produced a better performance in both temporal and spatial variation. Result showed that the dust concentrations were generally underestimated at selected sites in the original scheme, particularly when dust concentrations were high. For the improved scheme, both the magnitude and the temporal evolution of PM10 concentrations were well captured, with peak values much closer to the observations. According to the statistics, with the implementation of the updates, averaged PM10 values at selected sites were more comparable to the observations, and the average MB and NMB values were reduced from −196.29 µg m−3 and −52.79 % in the control run to −47.72 µg m−3 and −22.46 % respectively. However, for some sites closer to Gobi desert, dust concentrations were still underestimated, which was likely attributed to the uncertainty in the erodibility factor over Gobi desert. Comparison of the model results and observed averaged PM10 concentrations at ∼ 1000 stations showed that the revised scheme improved the model performance, with R values increasing from 0.6 to 0.7 and NMB values changing from −16 % to −11 %. Moreover, the improved scheme demonstrated better performance in reproducing the spatial distribution of AOD than the original scheme, particularly over the desert region of northwest China.
In summary, this study indicated that compared to the original scheme, the revised dust emission scheme had an overall better agreement with the measurements. However, more physically based schemes and more detailed up-to-date input parameters should be further investigated and observed to improve the accuracy of model.
Data used in this work can be accessed according to the information given in Sect. 2.4 and the Acknowledgements. The model outputs and codes can be accessed by contacting Rong Tian (rongtian@nuist.edu.cn).
The supplement related to this article is available online at: https://doi.org/10.5194/acp-21-4319-2021-supplement.
RT designed and conducted the model experiments, analyzed the result and wrote the paper. XM supervised the project, proposed scientific suggestions and revised the paper. JZ processed the observation data.
The authors declare that they have no conflict of interest.
We are thankful to Catherine Prigent for kindly providing the input map of global surface aerodynamic roughness length Z0; to Wei Shangguan for providing the soil clay content data, which are available from the website of the Land-Atmospheric Interaction Research Group at Beijing Normal University (http://globalchange.bnu.edu.cn/research/soilw#download, last access: 11 March 2020); and to Sujan Koirala for providing the global soil texture map which can be downloaded from the website (http://hydro.iis.u-tokyo.ac.jp/~sujan/research/gswp3/soil-texture-map.html, last access: 24 April 2020). We are also grateful to the GEOS-Chem Support Team for their management and maintenance of the GEOS-Chem model. We acknowledge NASA, the Chinese Ministry of Environmental Protection and the Chinese National Meteorological Center for providing the MODIS datasets, surface PM10 observations and meteorological measurements respectively.
This study is supported by the National Key R&D Program of China (grant no. 2016YFA0600404), the National Natural Science Foundation of China (grant nos. 42061134009 and 41975002), the National Key R&D Program of China (grant no. 2019YFA0606802), the Second Tibetan Plateau Scientific Expedition and Research (STEP) program (no. 2019QZKK0103) and the Postgraduate Research and Practice Innovation Program of Jiangsu Province (grant no. SJKY19_0962).
This paper was edited by Sachin S. Gunthe and reviewed by two anonymous referees.
Alfaro, S. C. and Gomes, L.: Modelling mineral aerosol production by wind erosion: Emission intensities and aerosol size distributions in source areas, J. Geophys. Res., 106, 18075–18084, https://doi.org/10.1029/2000JD900339, 2001.
Astitha, M., Lelieveld, J., Abdel Kader, M., Pozzer, A., and de Meij, A.: Parameterization of dust emissions in the global atmospheric chemistry-climate model EMAC: impact of nudging and soil properties, Atmos. Chem. Phys., 12, 11057–11083, https://doi.org/10.5194/acp-12-11057-2012, 2012.
Bonan, G. B.: A land surface model (LSM version 1.0) for ecological, hydrological, and atmospheric studies: Technical description and user's guide, Tech. Rep. NCAR/TN-417+STR, Natl. Cent. for Atmos. Res., Boulder, Colo., USA, 1996.
Chen, D., Wang, Y., McElroy, M. B., He, K., Yantosca, R. M., and Le Sager, P.: Regional CO pollution and export in China simulated by the high-resolution nested-grid GEOS-Chem model, Atmos. Chem. Phys., 9, 3825–3839, https://doi.org/10.5194/acp-9-3825-2009, 2009.
Chen, L., Gao, Y., Zhang, M., Fu, J. S., Zhu, J., Liao, H., Li, J., Huang, K., Ge, B., Wang, X., Lam, Y. F., Lin, C.-Y., Itahashi, S., Nagashima, T., Kajino, M., Yamaji, K., Wang, Z., and Kurokawa, J.: MICS-Asia III: multi-model comparison and evaluation of aerosol over East Asia, Atmos. Chem. Phys., 19, 11911–11937, https://doi.org/10.5194/acp-19-11911-2019, 2019.
Chen, S., Zhao, C., Qian, Y., Leung, L. R., Huang, J., Huang, Z., Bi, J., Zhang, W., Shi, J., Yang, L., Li, D., and Li, J.: Regional modeling of dust mass balance and radiative forcing over East Asia using WRF-Chem, Aeolian Res., 15, 15–30, https://doi.org/10.1016/j.aeolia.2014.02.001, 2014.
Chen, S., Huang, J., Qian, Y., Zhao, C., Kang, L., Yang, B., Wang, Y., Liu, Y., Yuan, T., Wang, T., Ma, X., and Zhang, G.: An overview of mineral dust modeling over East Asia, J. Meteorol. Res., 31, 633–653, https://doi.org/10.1007/s13351-017-6142-2, 2017.
Cheng, T., Peng, Y., Feichter, J., and Tegen, I.: An improvement on the dust emission scheme in the global aerosol-climate model ECHAM5-HAM, Atmos. Chem. Phys., 8, 1105–1117, https://doi.org/10.5194/acp-8-1105-2008, 2008.
Cheng, Y., Zheng, G., Wei, C., Mu, Q., Zheng, B., Wang, Z., Gao, M., Zhang, Q., He, K., and Carmichael, G.: Reactive nitrogen chemistry in aerosol water as a source of sulfate during haze events in China, Science Advances, 2, e1601530, https://doi.org/10.1126/sciadv.1601530, 2016.
Chin, M., Diehl, T., Tan, Q., Prospero, J. M., Kahn, R. A., Remer, L. A., Yu, H., Sayer, A. M., Bian, H., Geogdzhayev, I. V., Holben, B. N., Howell, S. G., Huebert, B. J., Hsu, N. C., Kim, D., Kucsera, T. L., Levy, R. C., Mishchenko, M. I., Pan, X., Quinn, P. K., Schuster, G. L., Streets, D. G., Strode, S. A., Torres, O., and Zhao, X.-P.: Multi-decadal aerosol variations from 1980 to 2009: a perspective from observations and a global model, Atmos. Chem. Phys., 14, 3657–3690, https://doi.org/10.5194/acp-14-3657-2014, 2014.
Darmenova, K., Sokolik, I. N., Shao, Y., Marticorena, B., and Bergametti, G.: Development of a physically based dust emission module within the Weather Research and Forecasting (WRF) model: Assessment of dust emission parameterizations and input parameters for source regions in Central and East Asia, J. Geophys. Res., 114, D14201, https://doi.org/10.1029/2008JD011236, 2009.
DeMott, P. J., Sassen, K., Poellot, M. R., Baumgardner, D., Rogers, D. C., Brooks, S. D., Prenni, A. J., and Kreidenweis, S. M.: African dust aerosols as atmospheric ice nuclei, Geophys. Res. Lett., 30, 1732, https://doi.org/10.1029/2003gl017410, 2003.
DeMott, P. J., Prenni, A. J., Liu, X., Kreidenweis, S. M., Petters, M. D., Twohy, C. H., Richardson, M. S., Eidhammer, T., and Rodgers, D. C.: Predicting global atmospheric ice nuclei distributions and their impacts on climate, P. Natl. Acad. Sci. USA, 107, 11217–11222, https://doi.org/10.1073/pnas.0910818107, 2010.
Fairlie, T. D., Jacob, D. J., and Park, R. J.: The impact of transpacific transport of mineral dust in the United States, Atmos. Environ., 41, 1251–1266, https://doi.org/10.1016/j.atmosenv.2006.09.048, 2007.
FAO: The Digitized Soil Map of the World Including Derived Soil Properties (version 3.6), FAO, Rome, Italy, 1995.
FAO: The Digitized Soil Map of the World Including Derived Soil Properties (version 3.6), FAO, Rome, Italy, 2003.
Fécan, F., Marticorena, B., and Bergametti, G.: Parametrization of the increase of the aeolian erosion threshold wind friction velocity due to soil moisture for arid and semi-arid areas, Ann. Geophys., 17, 149–157, https://doi.org/10.1007/s00585-999-0149-7, 1999.
Foroutan, H., Young, J., Napelenok, S., Ran, L., Appel, K. W., Gilliam, R. C., and Pleim, J. E.: Development and evaluation of a physics-based windblown dust emission scheme implemented in the CMAQ modeling system: WINDBLOWN DUST IN CMAQ, J. Adv. Model. Earth Sy., 9, 585–608, https://doi.org/10.1002/2016MS000823, 2017.
Gherboudj, I., Beegum, S. N., Marticorena, B., and Ghedira, H.: Dust emission parameterization scheme over the MENA region: Sensitivity analysis to soil moisture and soil texture: Dust emission over Mena regiopn., J. Geophys. Res. Atmos., 120, 10915–10938, https://doi.org/10.1002/2015JD023338, 2015.
Giannadaki, D., Pozzer, A., and Lelieveld, J.: Modeled global effects of airborne desert dust on air quality and premature mortality, Atmos. Chem. Phys., 14, 957–968, https://doi.org/10.5194/acp-14-957-2014, 2014.
Gillette, D. A., Fryrear, D. W., Gill, T. E., Ley, T., Cahill, T. A., and Gearhart, E. A.: Relation of vertical flux of particles smaller than 10 µm to total aeolian horizontal mass flux at Owens Lake, J. Geophys. Res.-Atmos., 102, 26009–26015, https://doi.org/10.1029/97JD02252, 1997.
Ginoux, P., Chin, M., Tegen, I., Prospero, J. M., Holben, B., Dubovik, O., and Lin, S.-J.: Sources and distributions of dust aerosols simulated with the GOCART model, J. Geophys. Res., 106, 20255–20273, https://doi.org/10.1029/2000JD000053, 2001.
Ginoux, P., Prospero, J. M., Torres, O., and Chin, M.: Long-term simulation of global dust distribution with the GOCART model: correlation with North Atlantic Oscillation, Environ. Model. Softw., 19, 113–128, https://doi.org/10.1016/S1364-8152(03)00114-2, 2004.
Gomes, L., Arrúe, J. L., López, M. V., Sterk, G., Richard, D., Gracia, R., Sabre, M., Gaudichet, A., and Frangi, J. P.: Wind erosion in a semiarid agricultural area of Spain: the WELSONS project, Catena, 52, 235–256, https://doi.org/10.1016/S0341-8162(03)00016-X, 2003.
Goudie, A. S.: Desert dust and human health disorders, Environ. Int., 63, 101–113, https://doi.org/10.1016/j.envint.2013.10.011, 2014.
Huneeus, N., Schulz, M., Balkanski, Y., Griesfeller, J., Prospero, J., Kinne, S., Bauer, S., Boucher, O., Chin, M., Dentener, F., Diehl, T., Easter, R., Fillmore, D., Ghan, S., Ginoux, P., Grini, A., Horowitz, L., Koch, D., Krol, M. C., Landing, W., Liu, X., Mahowald, N., Miller, R., Morcrette, J.-J., Myhre, G., Penner, J., Perlwitz, J., Stier, P., Takemura, T., and Zender, C. S.: Global dust model intercomparison in AeroCom phase I, Atmos. Chem. Phys., 11, 7781–7816, https://doi.org/10.5194/acp-11-7781-2011, 2011.
Iversen, J. D. and White, B. R.: Saltation threshold on Earth, Mars and Venus, Sedimentology, 29, 111–119, https://doi.org/10.1111/j.1365-3091.1982.tb01713.x, 1982.
Ju, T., Li, X., Zhang, H., Cai, X., and Song, Y.: Comparison of two different dust emission mechanisms over the Horqin Sandy Land area: Aerosols contribution and size distributions, Atmos. Environ., 176, 82–90, https://doi.org/10.1016/j.atmosenv.2017.12.017, 2018.
Kang, J.-Y., Yoon, S.-C., Shao, Y., and Kim, S.-W.: Comparison of vertical dust flux by implementing three dust emission schemes in WRF/Chem, J. Geophys. Res., 116, D09202, https://doi.org/10.1029/2010JD014649, 2011.
Klingmüller, K., Metzger, S., Abdelkader, M., Karydis, V. A., Stenchikov, G. L., Pozzer, A., and Lelieveld, J.: Revised mineral dust emissions in the atmospheric chemistry–climate model EMAC (MESSy 2.52 DU_Astitha1 KKDU2017 patch), Geosci. Model Dev., 11, 989–1008, https://doi.org/10.5194/gmd-11-989-2018, 2018.
Kok, J. F.: Does the size distribution of mineral dust aerosols depend on the wind speed at emission?, Atmos. Chem. Phys., 11, 10149–10156, https://doi.org/10.5194/acp-11-10149-2011, 2011a.
Kok, J. F.: A scaling theory for the size distribution of emitted dust aerosols suggests climate models underestimate the size of the global dust cycle, P. Natl. Acad. Sci. USA, 108, 1016–1021, https://doi.org/10.1073/pnas.1014798108, 2011b.
Kok, J. F., Mahowald, N. M., Fratini, G., Gillies, J. A., Ishizuka, M., Leys, J. F., Mikami, M., Park, M.-S., Park, S.-U., Van Pelt, R. S., and Zobeck, T. M.: An improved dust emission model – Part 1: Model description and comparison against measurements, Atmos. Chem. Phys., 14, 13023–13041, https://doi.org/10.5194/acp-14-13023-2014, 2014a.
Kok, J. F., Albani, S., Mahowald, N. M., and Ward, D. S.: An improved dust emission model – Part 2: Evaluation in the Community Earth System Model, with implications for the use of dust source functions, Atmos. Chem. Phys., 14, 13043–13061, https://doi.org/10.5194/acp-14-13043-2014, 2014b.
Kontos, S., Liora, N., Giannaros, C., Kakosimos, K., Poupkou, A., and Melas, D.: Modeling natural dust emissions in the central Middle East: Parameterizations and sensitivity, Atmos. Environ., 190, 294–307, https://doi.org/10.1016/j.atmosenv.2018.07.033, 2018.
Ku, B. and Park, R. J.: Comparative inverse analysis of satellite (MODIS) and ground (PM10) observations to estimate dust emissions in East Asia, Asia-Pac. J. Atmos. Sci., 49, 3–17, https://doi.org/10.1007/s13143-013-0002-5, 2013.
Kumar, R., Barth, M. C., Pfister, G. G., Naja, M., and Brasseur, G. P.: WRF-Chem simulations of a typical pre-monsoon dust storm in northern India: influences on aerosol optical properties and radiation budget, Atmos. Chem. Phys., 14, 2431–2446, https://doi.org/10.5194/acp-14-2431-2014, 2014.
Latimer, R. N. C. and Martin, R. V.: Interpretation of measured aerosol mass scattering efficiency over North America using a chemical transport model, Atmos. Chem. Phys., 19, 2635–2653, https://doi.org/10.5194/acp-19-2635-2019, 2019.
Laurent, B., Marticorena, B., Bergametti, G., Chazette, P., Maignan, F., and Schmechtig, C.: Simulation of the mineral dust emission frequencies from desert areas of China and Mongolia using an aerodynamic roughness length map derived from the POLDER/ADEOS-1 surface products, J. Geophys. Res., 110, D18S04, https://doi.org/10.1029/2004JD005013, 2005.
Laurent, B., Marticorena, B., Bergametti, G., and Mei, F.: Modeling mineral dust emissions from Chinese and Mongolian deserts, Global Planet. Changes, 52, 121–141, https://doi.org/10.1016/j.gloplacha.2006.02.012, 2006. Laurent, B., Marticorena, B., Bergametti, G., Leon, J.-F., and Mahowald, N.: Modeling mineral dust emissions from the Sahara desert using new surface properties and soil database, J. Geophys. Res., 113, D14218, https://doi.org/10.1029/2007JD009484, 2008.
Li, K., Jacob, D. J., Liao, H., Zhu, J., Shah, V., Shen, L., Bates, K. H., Zhang, Q., and Zhai, S.: A two-pollutant strategy for improving ozone and particulate air quality in China, Nat. Geosci., 12, 906–910, https://doi.org/10.1038/s41561-019-0464-x, 2019.
Lin, J., Xin, J., Che, H., Wang, Y., and Donkelaar, A. V.: Clear-sky aerosol optical depth over East China estimated from visibility measurements and chemical transport modeling, Atmos. Environ., 95, 258-267, https://doi.org/10.1016/j.atmosenv.2014.06.044, 2014.
Liu, D., Ishizuka, M., Mikami, M., and Shao, Y.: Turbulent characteristics of saltation and uncertainty of saltation model parameters, Atmos. Chem. Phys., 18, 7595–7606, https://doi.org/10.5194/acp-18-7595-2018, 2018.
Liu, H., Jacob, D. J., Bey, I., and Yantosca, R. M.: Constraints from 210Pb and 7Be on wet deposition and transport in a global three-dimensional chemical tracer model driven by assimilated meteorological fields, J. Geophys. Res., 106, 12109–12128, https://doi.org/10.1029/2000JD900839, 2001.
Lu, H. and Shao, Y.: A new model for dust emission by saltation bombardment, J. Geophys. Res., 104, 16827–16842, https://doi.org/10.1029/1999JD900169, 1999.
Ma, S., Zhang, X., Gao, C., Tong, D. Q., Xiu, A., Wu, G., Cao, X., Huang, L., Zhao, H., Zhang, S., Ibarra-Espinosa, S., Wang, X., Li, X., and Dan, M.: Multimodel simulations of a springtime dust storm over northeastern China: implications of an evaluation of four commonly used air quality models (CMAQ v5.2.1, CAMx v6.50, CHIMERE v2017r4, and WRF-Chem v3.9.1), Geosci. Model Dev., 12, 4603–4625, https://doi.org/10.5194/gmd-12-4603-2019, 2019.
Macpherson, T., Nickling, W. G., Gillies, J. A., and Etyemezian, V.: Dust emissions from undisturbed and disturbed supply-limited desert surfaces, J. Geophys. Res., 113, F02S04, https://doi.org/10.1029/2007JF000800, 2008.
Mahowald, N. and Kiehl, L.: Mineral aerosol and cloud interactions, Geophys. Res. Lett., 30, 1475, https://doi.org/10.1029/2002GL016762, 2003.
Marticorena, B. and Bergametti, G.: Modeling the atmospheric dust cycle: 1. Design of a soil-derived dust emission scheme, J. Geophys. Res., 100, 16415, https://doi.org/10.1029/95JD00690, 1995.
Menut, L., Pérez, C., Haustein, K., Bessagnet, B., Prigent, C., and Alfaro, S.: Impact of surface roughness and soil texture on mineral dust emission fluxes modeling: IMPACT OF ROUGHNESS AND SOIL TEXTURE ON MINERAL DUST, J. Geophys. Res.-Atmos., 118, 6505–6520, https://doi.org/10.1002/jgrd.50313, 2013.
Mokhtari, M., Gomes, L., Tulet, P., and Rezoug, T.: Importance of the surface size distribution of erodible material: an improvement on the Dust Entrainment And Deposition (DEAD) Model, Geosci. Model Dev., 5, 581–598, https://doi.org/10.5194/gmd-5-581-2012, 2012.
Nagashima, K., Suzuki, Y., Irino, T., Nakagawa, T., Tada, R., Hara, Y., Yamada, K., and Kurosaki, Y.: Asian dust transport during the last century recorded in Lake Suigetsu sediments, Geophys. Res. Lett., 43, 2835–2842, https://doi.org/10.1002/2015GL067589, 2016.
Owen, P. R.: Saltation of uniform grains in air, J. Fluid Mech., 20, 225–242, 1964.
Panebianco, J. E., Mendez, M. J., and Buschiazzo, D. E.: PM10 Emission, Sandblasting Efficiency and Vertical Entrainment During Successive Wind-Erosion Events: A Wind-Tunnel Approach, Bound.-Lay. Meteorol., 161, 335–353, https://doi.org/10.1007/s10546-016-0172-7, 2016.
Perlwitz, J. P., Pérez García-Pando, C., and Miller, R. L.: Predicting the mineral composition of dust aerosols – Part 1: Representing key processes, Atmos. Chem. Phys., 15, 11593–11627, https://doi.org/10.5194/acp-15-11593-2015, 2015a.
Perlwitz, J. P., Pérez García-Pando, C., and Miller, R. L.: Predicting the mineral composition of dust aerosols – Part 2: Model evaluation and identification of key processes with observations, Atmos. Chem. Phys., 15, 11629–11652, https://doi.org/10.5194/acp-15-11629-2015, 2015b.
Prigent, C., Tegen, I., Aires, F., Marticorena, B., and Zribi M.: Estimation of the aerodynamic roughness length in arid and semiarid regions over the globe with the ERS scatterometer, J. Geophys. Res., 110, D09205, https://doi.org/10.1029/2004JD005370, 2005.
Prigent, C., Jiménez, C., and Catherinot, J.: Comparison of satellite microwave backscattering (ASCAT) and visible/near-infrared reflectances (PARASOL) for the estimation of aeolian aerodynamic roughness length in arid and semi-arid regions, Atmos. Meas. Tech., 5, 2703–2712, https://doi.org/10.5194/amt-5-2703-2012, 2012.
Rajot, J. L., Alfaro, S. C., Gomes, L., and Gaudichet, A.: Soil crusting on sandy soils and its influence on wind erosion, Catena, 53, 1–16, https://doi.org/10.1016/S0341-8162(02)00201-1, 2003.
Rice M. A., Willetts, B. B. and McEwan, I. K.: Wind erosion of crusted soil sediments, Earth Surf. Proc. Land., 21, 279–293, 1996a.
Rice, M. A., Willetts, B. B., and McEwan, I. K. Observations of collisions of saltating grains with a granular bed from high-speed cine-film, Sedimentology, 43, 21–31, https://doi.org/10.1111/j.1365-3091.1996.tb01456.x, 1996b.
Ridley, D. A., Heald, C. L., and Ford, B.: North African dust transport and deposition: a satellite and model perspective, J. Geophys. Res., 117, D02202, https://doi.org/10.1029/2011JD016794, 2012.
Ridley, D. A., Heald, C. L., Kok, J. F., and Zhao, C.: An observationally constrained estimate of global dust aerosol optical depth, Atmos. Chem. Phys., 16, 15097–15117, https://doi.org/10.5194/acp-16-15097-2016, 2016.
Roney, J. A. and White, B. R.: Estimating fugitive dust emission rates using an environmental boundary layer wind tunnel, Atmos. Environ., 40, 7668–7685, https://doi.org/10.1016/j.atmosenv.2006.08.015, 2006.
Saidou Chaibou, A. A., Ma, X., and Sha, T.: Dust radiative forcing and its impact on surface energy budget over West Africa, Sci. Rep.-UK, 10, 12236, https://doi.org/10.1038/s41598-020-69223-4, 2020a.
Saidou Chaibou, A. A., Ma, X., Kumar, K. R., Jia, H., Tang, Y., and Sha, T.: Evaluation of dust extinction and vertical profiles simulated by WRF-Chem with CALIPSO and AERONET over North Africa, J. Atmos. Sol.-Terr. Phy., 199, 105213, https://doi.org/10.1016/j.jastp.2020.105213, 2020b.
Shangguan, W., Dai, Y., Duan, Q., Liu, B., and Yuan, H.: A global soil data set for earth system modeling, J. Adv. Model. Earth Sy., 6, 249–263, https://doi.org/10.1002/2013MS000293, 2014.
Shao, Y.: A model for mineral dust emission, J. Geophys. Res., 106, 20239–20254, https://doi.org/10.1029/2001JD900171, 2001.
Shao, Y.,: Simplification of a dust emission scheme and comparison with data, J. Geophys. Res., 109, D10202, https://doi.org/10.1029/2003JD004372, 2004.
Shao, Y., Ishizuka, M., Mikami, M., and Leys, J. F.: Parameterization of size-resolved dust emission and validation with measurements, J. Geophys. Res., 116, D08203, https://doi.org/10.1029/2010JD014527, 2011.
Shao, Y. P., Raupach, M. R., and Leys, J. F.: A model for predicting aeolian sand drift and dust entrainment on scales from paddock to region, Austr. J. Soil Res., 34, 309–342, https://doi.org/10.1071/SR9960309, 1996.
Su, L. and Fung, J. C. H.: Sensitivities of WRF-Chem to dust emission schemes and land surface properties in simulating dust cycles during springtime over East Asia: Simulated Dust Cycles Over East Asia, J. Geophys. Res.-Atmos., 120, 11215–11230, https://doi.org/10.1002/2015JD023446, 2015.
Tegen, I.: Modeling the mineral dust aerosol cycle in the climate system, Quaternary Sci. Rev., 22, 1821–1834, 2003.
Tegen, I., Andrew, A. L., and Fung, I.: The influence on climate forcing of mineral aerosols from disturbed soils, Nature, 380, 419–422, https://doi.org/10.1038/380419a0, 1996.
Tegen, I., Harrison, S. P., Kohfeld, K., Prentice, I. C., Coe, M., and Heimann, M.: Impact of vegetation and preferential source areas on global dust aerosol: Results from a model study, J. Geophys. Res.-Atmos., 107, 4576, https://doi.org/10.1029/2001JD000963, 2002.
Tian, R., Ma, X., Jia, H., Yu, F., Sha, T., and Zan, Y.: Aerosol radiative effects on tropospheric photochemistry with GEOS-Chem simulations, Atmos. Environ., 208, 82–94, https://doi.org/10.1016/j.atmosenv.2019.03.032, 2019.
Todd, M. C., Bou Karam, D., Cavazos, C., Bouet, C., Heinold, B., Baldasano, J. M., Cautenet, G., Koren, I., Perez, C., Solmon, F., Tegen, I., Tulet, P., Washington, R., and Zakey, A.: Quantifying uncertainty in estimates of mineral dust flux: an intercomparison of model performance over the Bodele Depression, Northern Chad, J. Geophys. Res., 113, D24107, https://doi.org/10.1029/2008JD010476, 2008.
Tong, D. Q., Wang, J. X. L., Gill, T. E., Lei, H., and Wang, B.: Intensified dust storm activity and Valley fever infection in the southwestern United States, Geophys. Res. Lett., 44, 4304–4312, https://doi.org/10.1002/2017GL073524, 2017.
Uno, I., Wang, Z., Chiba, M., Chun, Y. S., Gong, S. L., Hara, Y., Jung, E., Lee, S.-S., Liu, M., Mikami, M., Music, S., Nickovic, S., Satake, S., Shao, Y., Song, Z., Sugimoto, N., Tanaka, T., and Westphal, D. L.: Dust model intercomparison (DMIP) study over Asia: Overview, J. Geophys. Res., 111, D12213, https://doi.org/10.1029/2005JD006575, 2006.
Wang, C. Z., Niu, S. J., and Zhou, Y.: Recent progress on the observation study of wind erosion in China, Meteorol. Mon., 11107–11116, 2009 (in Chinese).
Wang, Y., Zhang, Q. Q., He, K., Zhang, Q., and Chai, L.: Sulfate-nitrate-ammonium aerosols over China: response to 2000–2015 emission changes of sulfur dioxide, nitrogen oxides, and ammonia, Atmos. Chem. Phys., 13, 2635–2652, https://doi.org/10.5194/acp-13-2635-2013, 2013.
Wang, Y., Zhang, Q., Jiang, J., Zhou, W., Wang, B., He, K., Duan, F., Zhang, Q., Philip, S., and Xie, Y.: Enhanced sulfate formation during China's severe winter haze episode in January 2013 missing from current models: Modeling Winter Haze Formation in China, J. Geophys. Res.-Atmos., 119, 10425-10440, https://doi.org/10.1002/2013JD021426, 2014.
Wang, Y. X., Mcelroy, M. B., Jacob, D. J., and Yantosca, R. M.: A nested grid formulation for chemical transport over Asia: Applications to CO, J. Geophys. Res.-Atmos., 109, D22307, https://doi.org/10.1029/2004JD005237, 2004.
Wang, Z., Pan, X., Uno, I., Li, J., Wang, Z., Chen, X., Fu, P., Yang, T., Kobayashi, H., Shimizu, A., Sugimoto, N., and Yamamoto, S.: Significant impacts of heterogeneous reactions on the chemical composition and mixing state of dust particles: A case study during dust events over northern China, Atmosp. Environ., 159, 83–91, https://doi.org/10.1016/j.atmosenv.2017.03.044, 2017.
Wu, C.-L.: Improvements of Dust Emission Processes in CESM Model and Its Application, doctoral dissertation, University of Chinese Academy of Sciences, 2013 (in Chinese).
Wu, C. L. and Lin Z. H.: Impact of two different dust emission schemes on the simulation of a severe dust storm in East Asia using the WRF/Chem model, Clim. Environ. Res., 19, 419-436, 2014 (in Chinese).
Wu, M., Liu, X., Yang, K., Luo, T., Wang, Z., Wu, C., Zhang, K., Yu, H., and Darmenov, A.: Modeling Dust in East Asia by CESM and Sources of Biases, J. Geophys. Res.-Atmos., 124, 8043–8064, https://doi.org/10.1029/2019JD030799, 2019.
Xi, X. and Sokolik, I. N.: Seasonal dynamics of threshold friction velocity and dust emission in Central Asia, J. Geophys. Res.-Atmos., 120, 1536–1564, https://doi.org/10.1002/2014JD022471, 2015.
Zender, C. S., Bian, H., and Newman, D.: Mineral Dust Entrainment and Deposition (DEAD) model: Description and 1990s dust climatology, J. Geophys. Res., 108, 4416, https://doi.org/10.1029/2002JD002775, 2003.
Zeng, Y., Wang, M., Zhao, C., Chen, S., Liu, Z., Huang, X., and Gao, Y.: WRF-Chem v3.9 simulations of the East Asian dust storm in May 2017: modeling sensitivities to dust emission and dry deposition schemes, Geosci. Model Dev., 13, 2125–2147, https://doi.org/10.5194/gmd-13-2125-2020, 2020.
Zhang, L., Gong, S., Padro, J., and Barrie, L.: A size-segregated particle dry deposition scheme for an atmospheric aerosol module, Atmos. Environ., 35, 549–560, https://doi.org/10.1016/S1352-2310(00)00326-5, 2001.
Zhang, L., Kok, J. F., Henze, D. K., Li, Q., and Zhao, C.: Improving simulations of fine dust surface concentrations over the western United States by optimizing the particle size distribution: Improving Simulated Dust Over Western US, Geophys. Res. Lett., 40, 3270–3275, https://doi.org/10.1002/grl.50591, 2013.
Zhang, L., Liu, L., Zhao, Y., Gong, S., Zhang, X., Henze, D. K., Capps, S. L., Fu, T.-M., Zhang, Q., and Wang, Y.: Source attribution of particulate matter pollution over North China with the adjoint method, Environ. Res. Lett., 10, 084011, https://doi.org/10.1088/1748-9326/10/8/084011, 2015.
Zhang, J., Teng, Z., Huang, N., Guo, L., and Shao, Y.: Surface renewal as a significant mechanism for dust emission, Atmos. Chem. Phys., 16, 15517–15528, https://doi.org/10.5194/acp-16-15517-2016, 2016.
Zhao, C., Liu, X., and Leung, L. R.: Impact of the Desert dust on the summer monsoon system over Southwestern North America, Atmos. Chem. Phys., 12, 3717–3731, https://doi.org/10.5194/acp-12-3717-2012, 2012.
Zhao, C., Chen, S., Leung, L. R., Qian, Y., Kok, J. F., Zaveri, R. A., and Huang, J.: Uncertainty in modeling dust mass balance and radiative forcing from size parameterization, Atmos. Chem. Phys., 13, 10733–10753, https://doi.org/10.5194/acp-13-10733-2013, 2013.
Zhao, J., Ma, X., Wu, S., and Sha, T.: Dust emission and transport in Northwest China: WRF-Chem simulation and comparisons with multi-sensor observations, Atmos. Res., 241, 104978, https://doi.org/10.1016/j.atmosres.2020.104978, 2020.
Zheng, B., Zhang, Q., Zhang, Y., He, K. B., Wang, K., Zheng, G. J., Duan, F. K., Ma, Y. L., and Kimoto, T.: Heterogeneous chemistry: a mechanism missing in current models to explain secondary inorganic aerosol formation during the January 2013 haze episode in North China, Atmos. Chem. Phys., 15, 2031–2049, https://doi.org/10.5194/acp-15-2031-2015, 2015.