the Creative Commons Attribution 4.0 License.
the Creative Commons Attribution 4.0 License.
 | 17 Mar 2021
The prevalence of precipitation from polar supercooled clouds
Ann M. Fridlind
Johannes Verlinde
Andrew S. Ackerman
Grégory V. Cesana
Daniel A. Knopf
Supercooled clouds substantially impact polar surface energy budgets, but large-scale models often underestimate their occurrence, which motivates accurately establishing metrics of basic processes. An analysis of long-term measurements at Utqiaġvik, Alaska, and McMurdo Station, Antarctica, combines lidar-validated use of soundings to identify supercooled cloud layers and colocated ground-based profiling radar measurements to quantify cloud base precipitation. We find that more than 85 % (75 %) of sampled supercooled layers are precipitating over the Arctic (Antarctic) site, with more than 75 % (50 %) precipitating continuously to the surface. Such high frequencies can be reconciled with substantially lesser spaceborne estimates by considering differences in radar hydrometeor detection sensitivity. While ice precipitation into supercooled clouds from aloft is common, we also find that the great majority of supercooled cloud layers without ice falling into them are themselves continuously generating precipitation. Such sustained primary ice formation is consistent with continuous activation of immersion-mode ice-nucleating particles (INPs), suggesting that supercooled cloud formation is a principal gateway to ice formation at temperatures greater than ∘C over polar regions. The prevalence of weak precipitation fluxes is also consistent with supercooled cloud longevity and with well-observed and widely simulated case studies. An analysis of colocated microwave radiometer retrievals suggests that weak precipitation fluxes can be nonetheless consequential to moisture budgets for supercooled clouds owing to small liquid water paths. The results here also demonstrate that the observed abundance of mixed-phase clouds can vary substantially with instrument sensitivity and methodology. Finally, we suggest that these ground-based precipitation rate statistics offer valuable guidance for improving the representation of polar cloud processes in large-scale models.
- Article
(10000 KB) - Full-text XML
- BibTeX
- EndNote


Supercooled clouds exert substantial radiative impacts on the surface energy budget over polar regions (e.g., Dong et al., 2010; Miller et al., 2015; Shupe and Intrieri, 2004; Silber et al., 2019b), and play an important role in Arctic amplification and solar absorption over the Southern Ocean (e.g., Cronin and Tziperman, 2015; McCoy et al., 2014, 2015; Pithan et al., 2018; Tan and Storelvmo, 2019). However, major uncertainties in their representation in climate models (e.g., Cesana et al., 2015; Tsushima et al., 2006) ensue from knowledge gaps concerning the active processes affecting cloud life cycles (e.g., Tan et al., 2016; Kay et al., 2018).
Both ice and liquid precipitation can form in supercooled clouds. At temperatures greater than the homogeneous freezing of water ( ∘C), ice initiation typically requires ice-nucleating particles (INPs; e.g., Hegg and Baker, 2009; Vali et al., 2015), and it may be enhanced by secondary processes such as rime splintering or droplet shattering (e.g., Hallett and Mossop, 1974; Korolev et al., 2020). Once formed, ice hydrometeors grow rapidly by depositional growth both within supercooled cloud and in underlying ice-supersaturated layers (e.g., Pinsky et al., 2015) and by collisions with droplets (riming) and other ice hydrometeors (aggregation) (e.g., Fridlind and Ackerman, 2018). Less commonly formed supercooled drizzle drops grow only within supercooled cloud primarily by accretion of cloud droplets (e.g., Rangno and Hobbs, 2001).
Precipitation impacts the life cycle of supercooled clouds even if the cloud base flux is weak or if it evaporates or sublimates before reaching the surface (e.g., Silber et al., 2019a; Solomon et al., 2011). However, few studies have quantified precipitation occurrence from polar supercooled clouds. McIlhattan et al. (2017) reported that ∼10 % of shallow supercooled clouds are precipitating to the surface, based on Arctic-wide retrievals from the Cloud Profiling Radar (CPR; Tanelli et al., 2008) onboard CloudSat (Stephens et al., 2002). Edel et al. (2020) reported a greater value (∼20 %) by including a lower likelihood of CPR surface precipitation (see Wood, 2011). Also based on CPR measurements, Zhang et al. (2010) found that ∼60 % of polar mid-level supercooled clouds are precipitating at or below cloud base. By contrast, ground-based remote-sensing measurements over the Arctic commonly show essentially continuous precipitation from supercooled cloud decks (e.g., Fridlind and Ackerman, 2018, Fig. 3; Shupe, 2011; Shupe et al., 2006), generally commencing shortly after supercooled cloud formation (e.g., de Boer et al., 2011).
Here we attempt to reconcile a general impression from ground-based measurements that polar supercooled clouds are nearly universally precipitating with a quite wide range of satellite-based estimates. Using multiple years of sounding data and closely colocated ground-based radar observations from Arctic and Antarctic sites, we first evaluate the occurrence of cloud base and surface precipitation from all detected supercooled cloud layers. We then examine the impact of radar sensitivity on precipitation detectability and derive estimates of cloud base precipitation flux. Finally, for single-layer clouds, we provide a rough measure of precipitation impact on cloud lifetime by comparing the estimated cloud base precipitation rates with simultaneous microwave radiometer retrievals of liquid water path.
To detect supercooled cloud layers, we use 6 or 12 hourly soundings acquired at Utqiaġvik (formerly Barrow), North Slope of Alaska (NSA; Verlinde et al., 2016), from November 2011 to April 2019 and 12 hourly soundings acquired at McMurdo Station, Antarctica, between December 2015 and January 2017 (Lubin et al., 2020). After linearly interpolating onto a 15 m grid, supercooled layers are identified where atmospheric temperature is between 0 and −40 ∘C and relative humidity (RH) exceeds 95 % over at least two adjacent grid cells, consistent with an RH uncertainty of 5 % (Holdridge et al., 2011). This method shows good agreement (in more than 90 % of cases) with independent retrievals from lidar measurements (see Silber et al., 2020a, Fig. S1) and permits layer identification over the full column, which is not limited by lidar extinction. While some liquid-bearing air volumes may be missed where the reported in-cloud RH is below the 95 % threshold, these uncommon occurrences have little influence on the results statistically.
To detect precipitation, we use colocated Ka-band zenith-pointing radar (KAZR; Widener et al., 2012) measurements acquired above 300 m (hmin). After interpolating onto the same 15 m grid, hydrometeor-containing range gates are taken as those where radar echoes exceed the noise floor (see Silber et al., 2018a) in at least 50 % of profiles within 15 min after the radiosonde release. We estimate likely biases resulting from the binary averaging (e.g., Smalley et al., 2014) on this occurrence percentage threshold to be below 10 % (not shown). In using a 15 min window we account for sheared fall streak structures, while the short duration mitigates biases during rapid changes in liquid layer height (e.g., Verlinde et al., 2013, Fig. 3). We omit supercooled layers below hmin and above 4.3 km, which is the average altitude reached within 15 min of radiosonde release.
KAZR equivalent reflectivity factor (Ze) and mean Doppler velocity (VD) profiles are arithmetically (linearly) averaged over hydrometeor-containing volumes within each 15 min window. While the sounding-based supercooled cloud detection method is powerful for establishing cloud boundaries, it unfortunately does not allow us to establish the cloud occurrence fraction profile over the 15 min window. The averaging period selected for Ze and VD could result in a potential bias of VD and either bias or overestimation of Ze, depending on whether the full window or the hydrometeor-containing range gate occurrence fraction is used, respectively. Here we omit hydrometeor-free samples from these calculations, resulting in a potential overestimation that is less than 0.5 (0.6) dBZ in more than 90 % of the cases over the NSA (McMurdo) based on hydrometeor-containing range gate occurrence fraction statistics (not shown). Our statistics and conclusions are therefore not sensitive to this choice.
To define precipitation occurrence we require that mean Ze over a fixed depth below liquid cloud base (dmin) exceed a fixed threshold (). In support of that, negative VD values (towards the surface) just below cloud base in more than 95 % of the hydrometeor containing range gates in both datasets indicate the presence of precipitating hydrometeors. By varying dmin and we emulate different range resolutions and instrument or algorithm sensitivity thresholds. The smallest (−50 dBZ) corresponds to the KAZR sensitivity at ∼1 km (see Appendix A), with an effective uncertainty of several dBZ (e.g., Kollias et al., 2019). The smallest dmin (60 m) corresponds to two KAZR range gates. Supercooled cloud layers extending below hmin+dmin are omitted because the cloud base is not discernable by KAZR (below hmin) or an emulation with coarsened vertical resolution (below hmin+dmin). The resulting McMurdo dataset constitutes 236 (dmin=600 m) to 262 (dmin=60 m) profiles with at least one supercooled layer (corresponding to a supercooled cloud occurrence frequency of 29 % to 32 %, respectively), whereas the NSA dataset constitutes 3139 to 4544 profiles (frequency of 38 % to 55 %, respectively), the larger range of which reflects a higher occurrence of supercooled clouds below ∼1 km over the NSA (e.g., Lubin et al., 2020, Fig. 7).
To evaluate surface precipitation occurrence, we compare linearly averaged Ze at hmin to in profiles with at least one supercooled cloud layer. The impact of ground-based versus spaceborne effective hmin (typically ∼0.3 and ∼1.2 km, respectively) on surface precipitation occurrence was estimated at both sites to be roughly ±10 percentage points, suggesting hydrometeor nucleation, growth, evaporation, or sublimation within this “blind zone” (cf. Bennartz et al., 2019; Castellani et al., 2015; Maahn et al., 2014). We note that the impact of the blind zone between the surface and ground-based hmin on precipitation occurrence using high radar sensitivities, similar to those used here, is absent from the literature to our knowledge and merits a dedicated study.
To estimate precipitation rate (R) immediately below cloud base (RCB), following Bühl et al. (2016) and because a reliable retrieval of mass-weighted fall speed is not available, we simply multiply VD magnitudes (when VD is pointing towards the surface) by retrieved ice water content (IWC) following Hogan et al. (2006). Using this method, we do not apply any ice habit property constraints on the observations, which span the full heterogeneous freezing temperature range, but do find some overlap with various Ze–R relationship parameterizations (see Appendix B). We roughly estimate the IWC uncertainty as −90 % to +300 % based on the range of retrieval errors deduced by Heymsfield et al. (2008), by which we implicitly consider potentially different prevailing ice properties from the measurements used in their study. We neglect VD uncertainty (∼0.1 m/s; Widener et al., 2012) since it is comparatively negligible, e.g., ±10 % when considering the distribution of VD values over the NSA (see Silber et al., 2020b). Similarly, we neglect the impact of short-term air-motion variability over VD because it is largely canceled by the VD averaging over the 15 min window, based on a comparison with averaging calculations using 1 h windows. This comparison resulted in similar 15 min and 1 h averaged VD distributions with a mean difference of 1.3 % and 4.5 % at the NSA and McMurdo Station sites, respectively (not shown; see Sedlar and Shupe, 2014; Shupe et al., 2008a, b).
We use microwave radiometer (MWR: Morris, 2006) retrievals of liquid water path (LWP; Cadeddu et al., 2007; Turner et al., 2007) for single-layer profiles (53 % and 60 % of all cloud-containing profiles over NSA and McMurdo Station, respectively). We do not limit LWP to values greater than the widely used uncertainty of 25 g/m2 (e.g., Turner et al., 2007; Westwater et al., 2001) because doing so would exclude frequently occurring tenuous supercooled clouds (e.g., Sedlar, 2014; Silber et al., 2020a), which account for 32 % (73 %) of the NSA (McMurdo) single-layer profiles (shown below). We note that the MWR LWP retrievals predominantly exhibit significantly smaller errors, averaging around 0 g/m2 in bulk statistics (no retrieval bias; see Cadeddu et al., 2009, 2013).
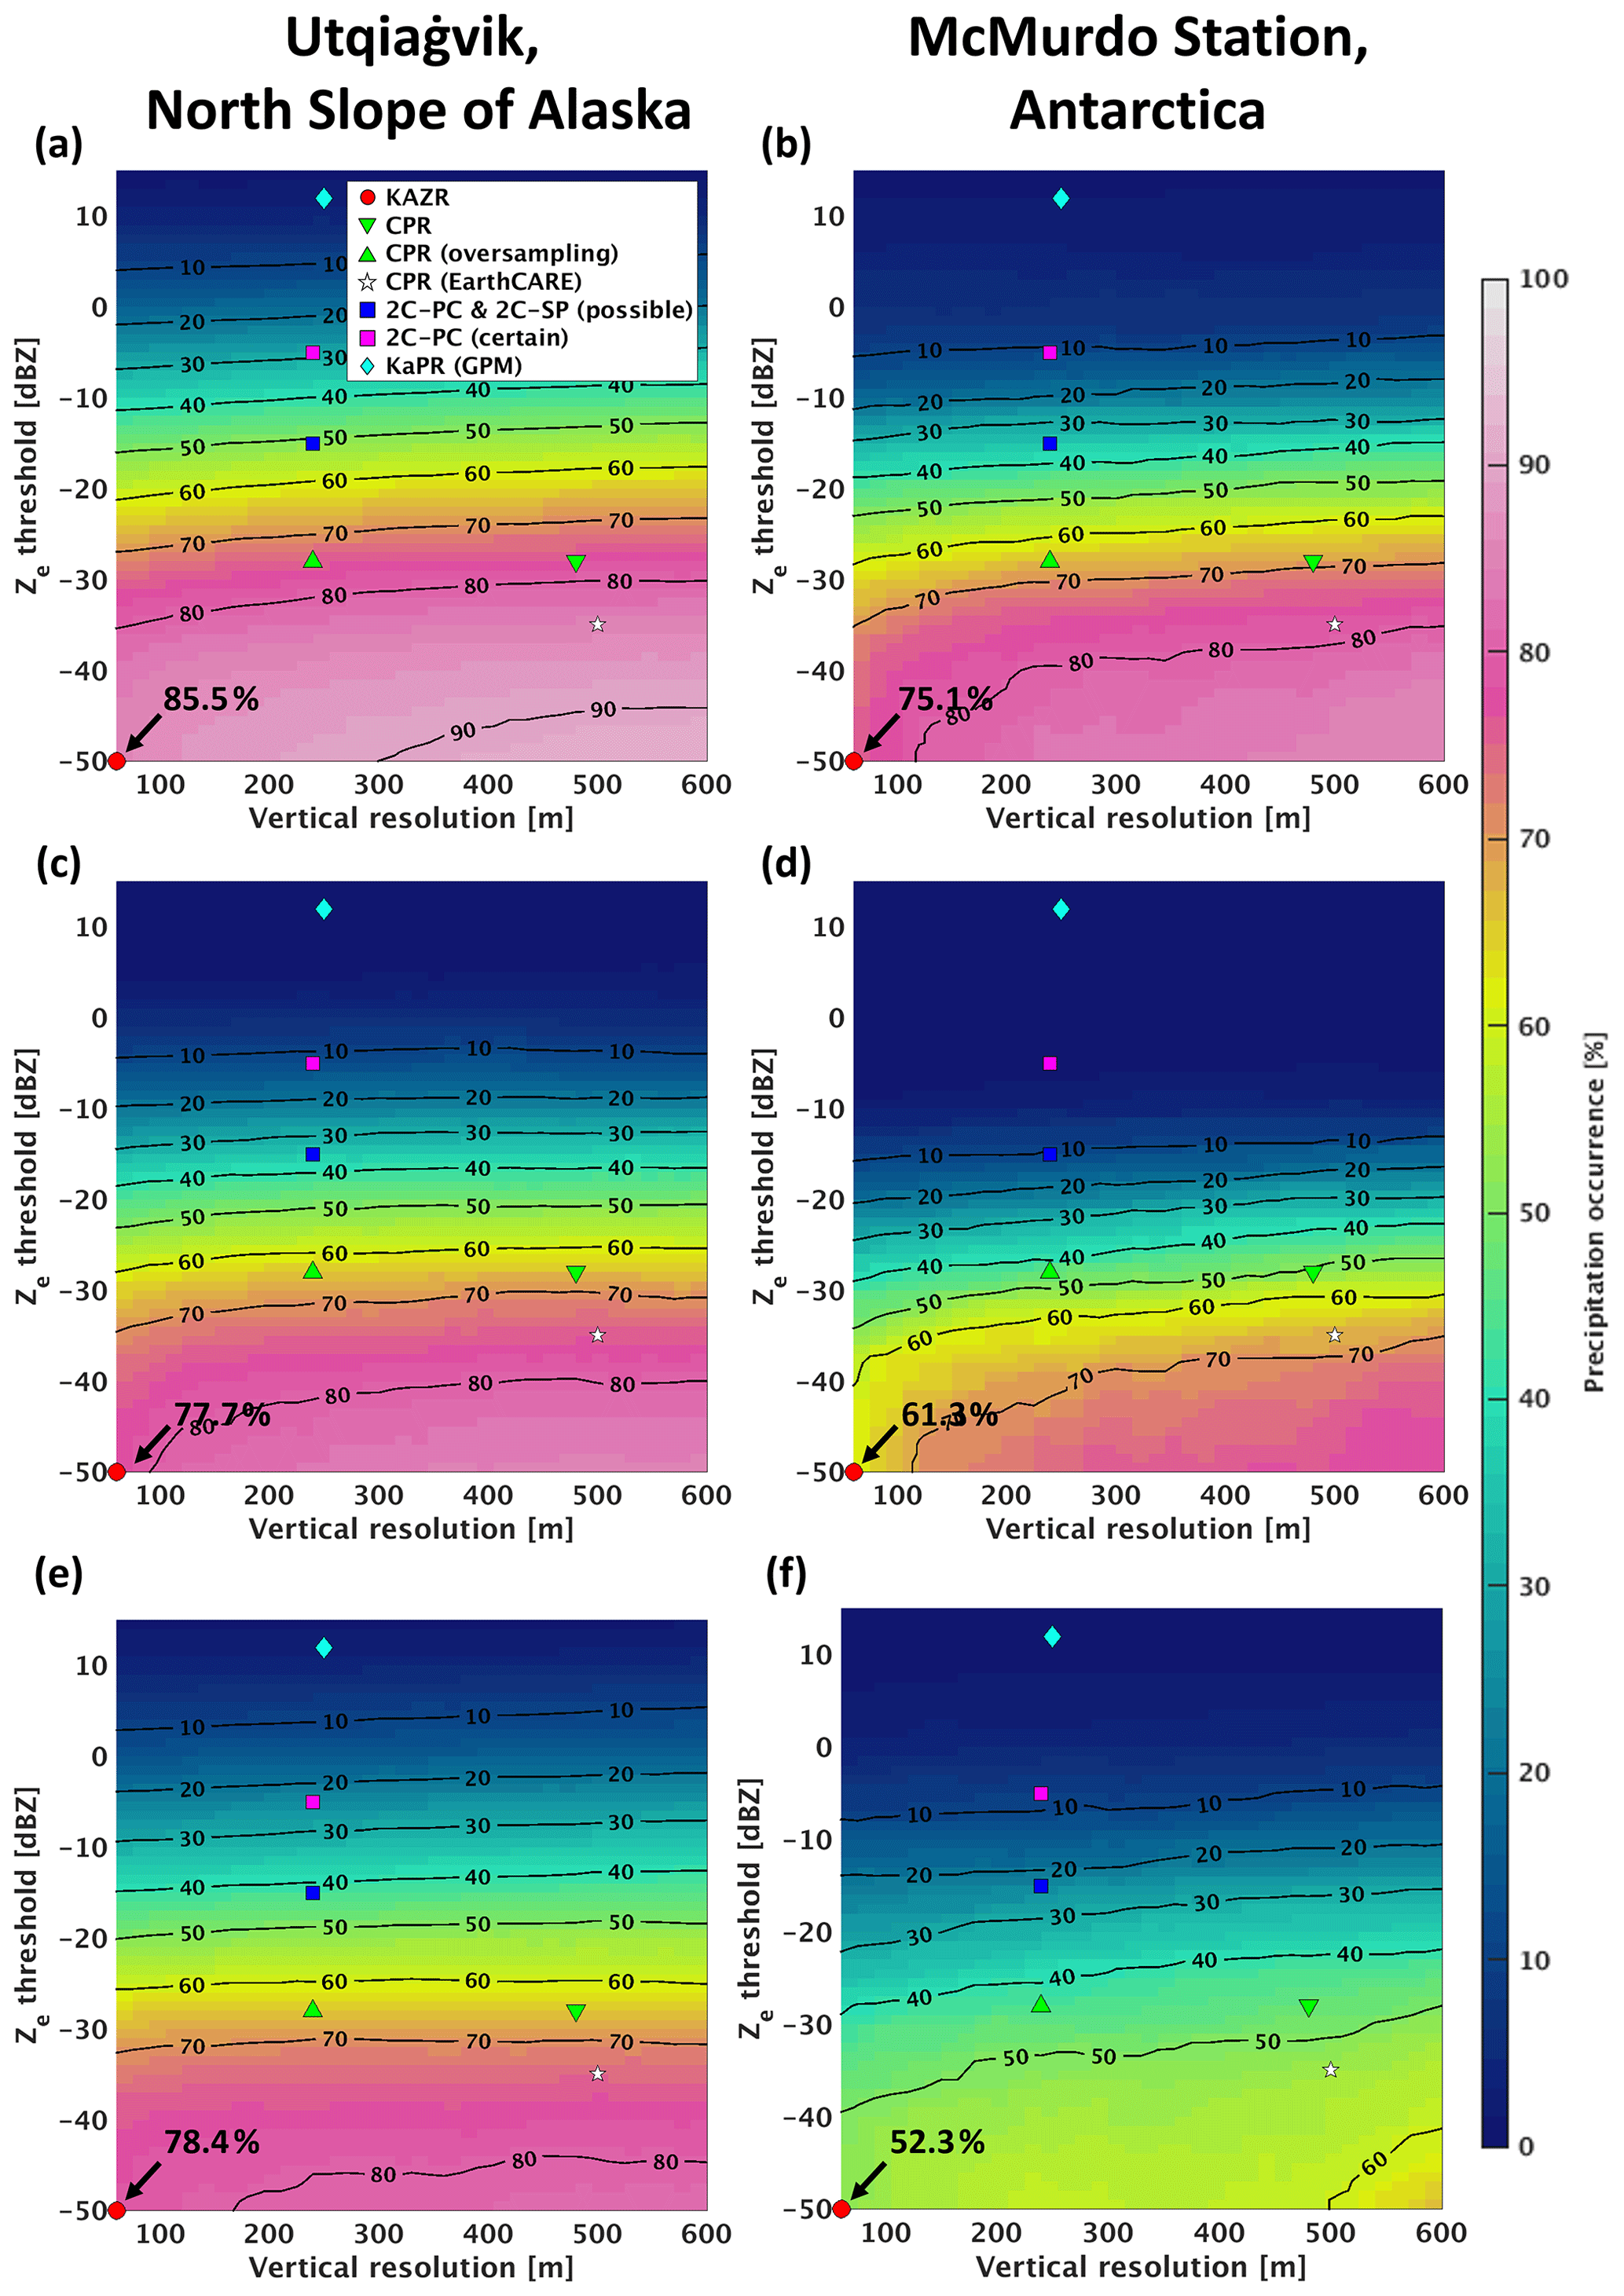
Figure 1Precipitation occurrence over the Arctic site (a, c, e) and Antarctic site (b, d, f) as a function of radar range resolution and equivalent radar reflectivity (Ze) threshold: (a, b) for all supercooled cloud layers at liquid cloud base, (c, d) for the uppermost supercooled layers with no overlying hydrometeor detections, and (e, f) for surface precipitation (defined here as ∼300 m above ground level) from all layer-containing columns. Symbols indicate the range resolutions and detectability thresholds for the KAZR at ∼1 km above ground level, the CloudSat CPR, EarthCARE CPR, the GPM KaPR, and the CloudSat 2C-PC and 2C-SP precipitation detection algorithms (for possible liquid and ice precipitation or certain ice precipitation).
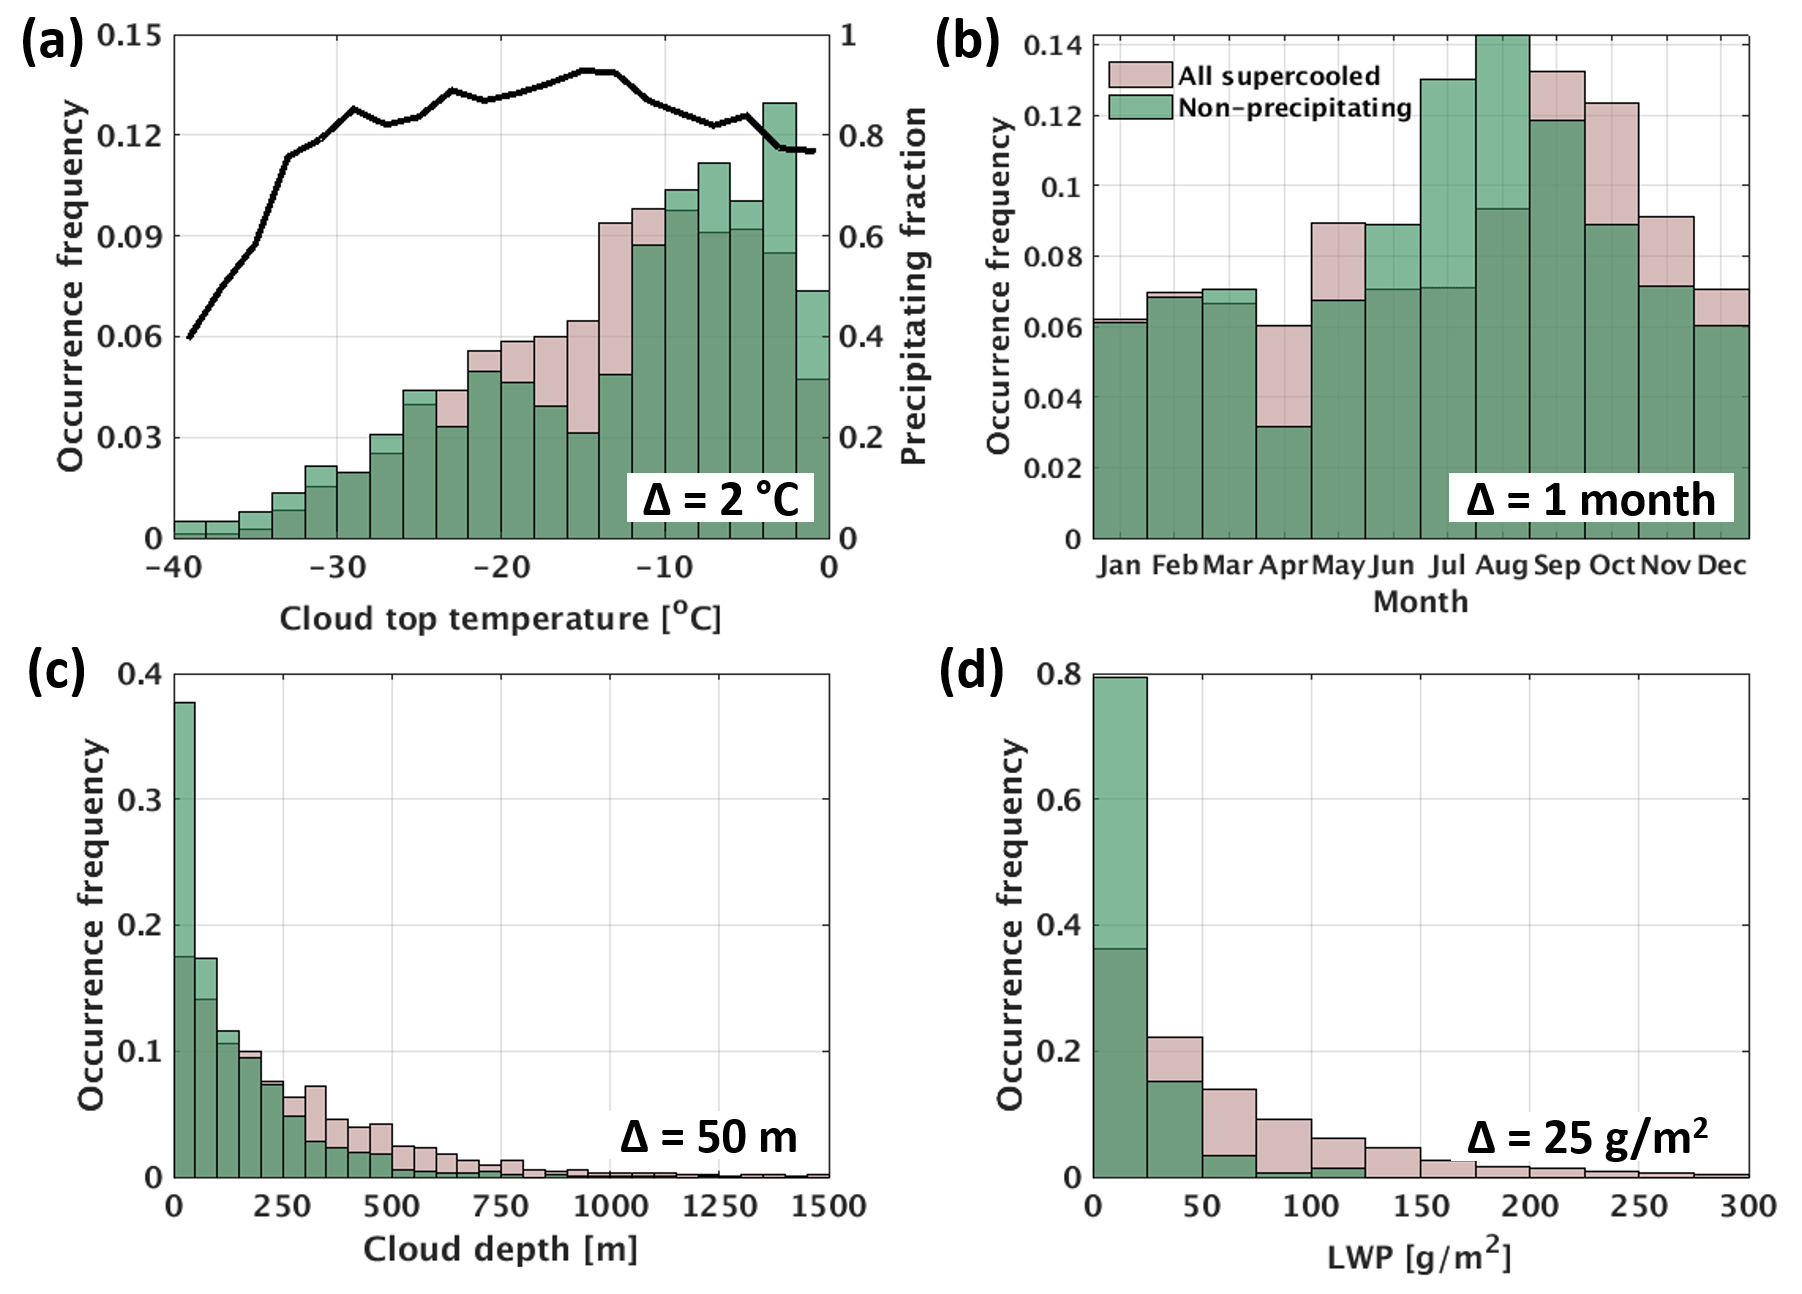
Figure 2(a) Cloud top temperature (TCT; obtained from sounding measurements), (b) month, (c) cloud depth, and (d) liquid water path occurrence frequency histograms for supercooled cloud layers over the NSA (tan) and the non-precipitating subset (green). The histograms in panels (c) and (d) are based on single-layer cases. Precipitating fractions as a function of TCT are shown in panel (a) (black line; note that values for temperatures below −34 ∘C have fewer than 10 samples each, and hence these results are likely not representative).
Based on KAZR measurement capabilities (minimum cloud depth and Ze thresholds of 60 m and −50 dBZ, respectively), we find that more than 85 % (75 %) of all sampled supercooled cloud layers over the NSA (McMurdo) precipitate from liquid cloud base (Fig. 1a, b). Here each supercooled layer is counted separately over columns that contain both single- and multi-layer cases. We interpret these percentages as lower limits on precipitation occurrence. In some cases, KAZR sensitivity appears to be a limiting factor or precipitating ice does not grow large enough to be detected by the KAZR immediately below cloud base (see Appendix C). Such cases may explain the distribution of non-precipitating cloud top temperatures over the NSA reaching a minimum, corresponding to a maximum likelihood of precipitation detection, at −15 ∘C and (to a lesser extent) −5 ∘C (Fig. 2a), where vapor growth rate peaks (e.g., Fukuta and Takahashi, 1999). Similarly, shallow clouds (Fig. 2c) or clouds at the low end of LWP (Fig. 2d), the cases of which frequently overlap (not shown), may hamper ice growth to detectable sizes by limiting the time ice particles can grow via vapor deposition or riming during sedimentation from the (coldest) cloud top regions where INP activation is expected to be strongest.
Over the NSA, where statistics are most robust, cloud base precipitation fraction remains 0.8 or higher throughout the heterogeneous freezing regime (Fig. 2a). Such high fractions are in part influenced by the commonality of seeding from overlying precipitation falling into supercooled cloud tops (primarily ice-phase precipitation, as discussed below), which occurs in 47 % (45 %) of sampled supercooled layers over the NSA (McMurdo) (not shown; cf. Vassel et al., 2019). However, when only the topmost supercooled layers with no overlying precipitation are considered, the percentages are reduced by only roughly 10 % (Fig. 1c, d), suggesting that supercooled clouds are usually generating precipitation.
Surface precipitation occurrence in supercooled cloud-containing profiles is greater than 75 % (50 %) over the NSA (McMurdo) (Fig. 1e, f). Here each column is counted as a single case, regardless of whether it contains one or more supercooled layers, in order to remain comparable with spaceborne statistics that use lidar measurements to detect at least one supercooled layer in a column and radar measurements to detect underlying surface precipitation. The lower percentage over McMurdo Station may be influenced by intense near-surface sublimation augmented by katabatic winds (e.g., Grazioli et al., 2017). The precipitation detected with KAZR may be liquid or ice phase. However, since in these datasets Ze usually increases from cloud base to some distance below (see Appendix D), indicating continued ice growth during sedimentation rather than drizzle or rain evaporation, we infer that ice is the dominant precipitation form (e.g., Edel et al., 2020; Rangno and Hobbs, 2001; Shupe, 2011).
Continuous precipitation of ice from non-seeded supercooled cloud layers suggests continuous in-cloud activation of INP (e.g., de Boer et al., 2011; Westbrook and Illingworth, 2013). Because INP availability generally increases exponentially with decreasing temperature (e.g., DeMott et al., 2010), we posit that longwave radiative cooling is the primary driver of continuous activation of INP initially present in a cloud layer. We note that over such high-latitude regions the cloud top longwave radiative cooling typically remains significantly greater than shortwave radiative heating throughout sunlit periods (e.g., Turner et al., 2018). In the roughly three-quarters of cases where cloud layers are turbulent (Silber et al., 2020a), additional INP may be continuously entrained at cloud top (e.g., Fridlind et al., 2012) and potentially at cloud base via deepening of a decoupled layer (e.g., Avramov et al., 2011) or INP recycling (e.g., Solomon et al., 2015). In non-turbulent layers, progressive saturation of an increasing cloud depth (e.g., Silber et al., 2020a) could also effectively increase the in-cloud INP pool. The overall differences in detected Arctic versus Antarctic precipitation frequency (Fig. 1) are likely influenced by geographical INP variability associated with both long-range transport and local source regions (e.g., Vergara-Temprado et al., 2018), as well as differing cloud temperatures (e.g., Lubin et al., 2020; Scott and Lubin, 2016), which impact INP activation (e.g., Kanji et al., 2017; Knopf et al., 2018).
Profiles of INP or aerosol properties (e.g., Creamean et al., 2018, 2021) are unfortunately not retrievable from the available McMurdo Station and NSA measurements, but we can establish the degree to which non-precipitating cases may exhibit conditions that would likely be associated with a scarcity of activatable INP relative to all clouds for the 7-year NSA dataset. For instance, non-precipitating clouds are more common at temperatures closer to 0 ∘C, where activation of INP is known to be extremely scarce (bars in Fig. 2a; see Rangno and Hobbs, 2001; see also Appendix C). Non-precipitating clouds also occur mostly during summer (Fig. 2b), when INP and aerosol particle concentrations are lowest (e.g., Fountain and Ohtake, 1985; Quinn et al., 2002, 2009). Third, non-precipitating clouds tend to be thinner and lower in LWP (Fig. 2c, d), consistent with slower entrainment. Reduced INP entrainment is also suggested by a statistically significant higher occurrence of non-turbulent clouds being non-precipitating (36 %) relative to the full dataset (27 %; not shown). Finally, radiative cooling and entrainment of INP may also be suppressed by radiative shielding, consistent with 17 % (43 %) greater non-precipitating cloud occurrence when adjoining layers are vertically separated by less than 500 m (100 m) (not shown; cf. Sedlar and Shupe, 2014). We found indications of similar non-precipitating case characteristics over McMurdo Station, but the smaller dataset inhibited a statistically robust analysis.
The detectability of precipitating hydrometeors is a function of the radar characteristics such as operating wavelength, receiver sensitivity, and pulse width, as well as the spatial characteristics of the precipitation (e.g., Lamer et al., 2019). Here we examine the impact of radar range resolution and on the reported precipitation percentage by varying these thresholds to emulate these parameters in other radar systems. Results indicate that reducing the radar range resolution can counterintuitively increase the precipitating cloud percentage owing to the higher probability of detecting larger hydrometeors in a larger volume, but higher can more significantly reduce the cloud and surface precipitation percentages (Fig. 1). For example, emulation of the highest-sensitivity CloudSat CPR corresponds to surface precipitation percentages that are lower than KAZR by 5–10 percentage points (Fig. 1e, f), in agreement with Zhang et al. (2010, their Figs. 6 and 7), who used temperature-dependent Ze thresholds. Emulation of the corresponding to the “precipitation possible” flag of the CloudSat 2C-PRECIP-COLUMN (2C-PC; Haynes et al., 2009) and 2C-SNOW-PROFILE (2C-SP; Wood, 2011, chapter 7; Wood et al., 2014) precipitation detection algorithms yields surface and cloud base precipitation occurrences lower than KAZR by more than 30 (25) points over the NSA (McMurdo) (Fig. 1a, b, e, f). Both precipitation occurrences are lower by 15–20 points more when the corresponding to 2C-PC “solid precipitation certain” flag (−5 dBZ) is emulated (Fig. 1a, b, e, f). These satellite measurement and retrieval sensitivity limitations are accentuated when the Ka-band precipitation radar (KaPR) onboard the Global Precipitation Measurement (GPM) satellite (Hou et al., 2013) sensitivity is adopted for precipitation detection (Fig. 1; estimated detection of 1 in 10 precipitation events; cf. Skofronick-Jackson et al., 2019). This result is consistent with known limitations of the KaPR capability to detect light precipitation (e.g., Hamada and Takayabu, 2016). Aside from this, we note that the GPM inclination angle of 65∘ excludes most polar regions, including the NSA and McMurdo Station, but is high enough to observe some relevant high-latitude regions such as the Southern Ocean.
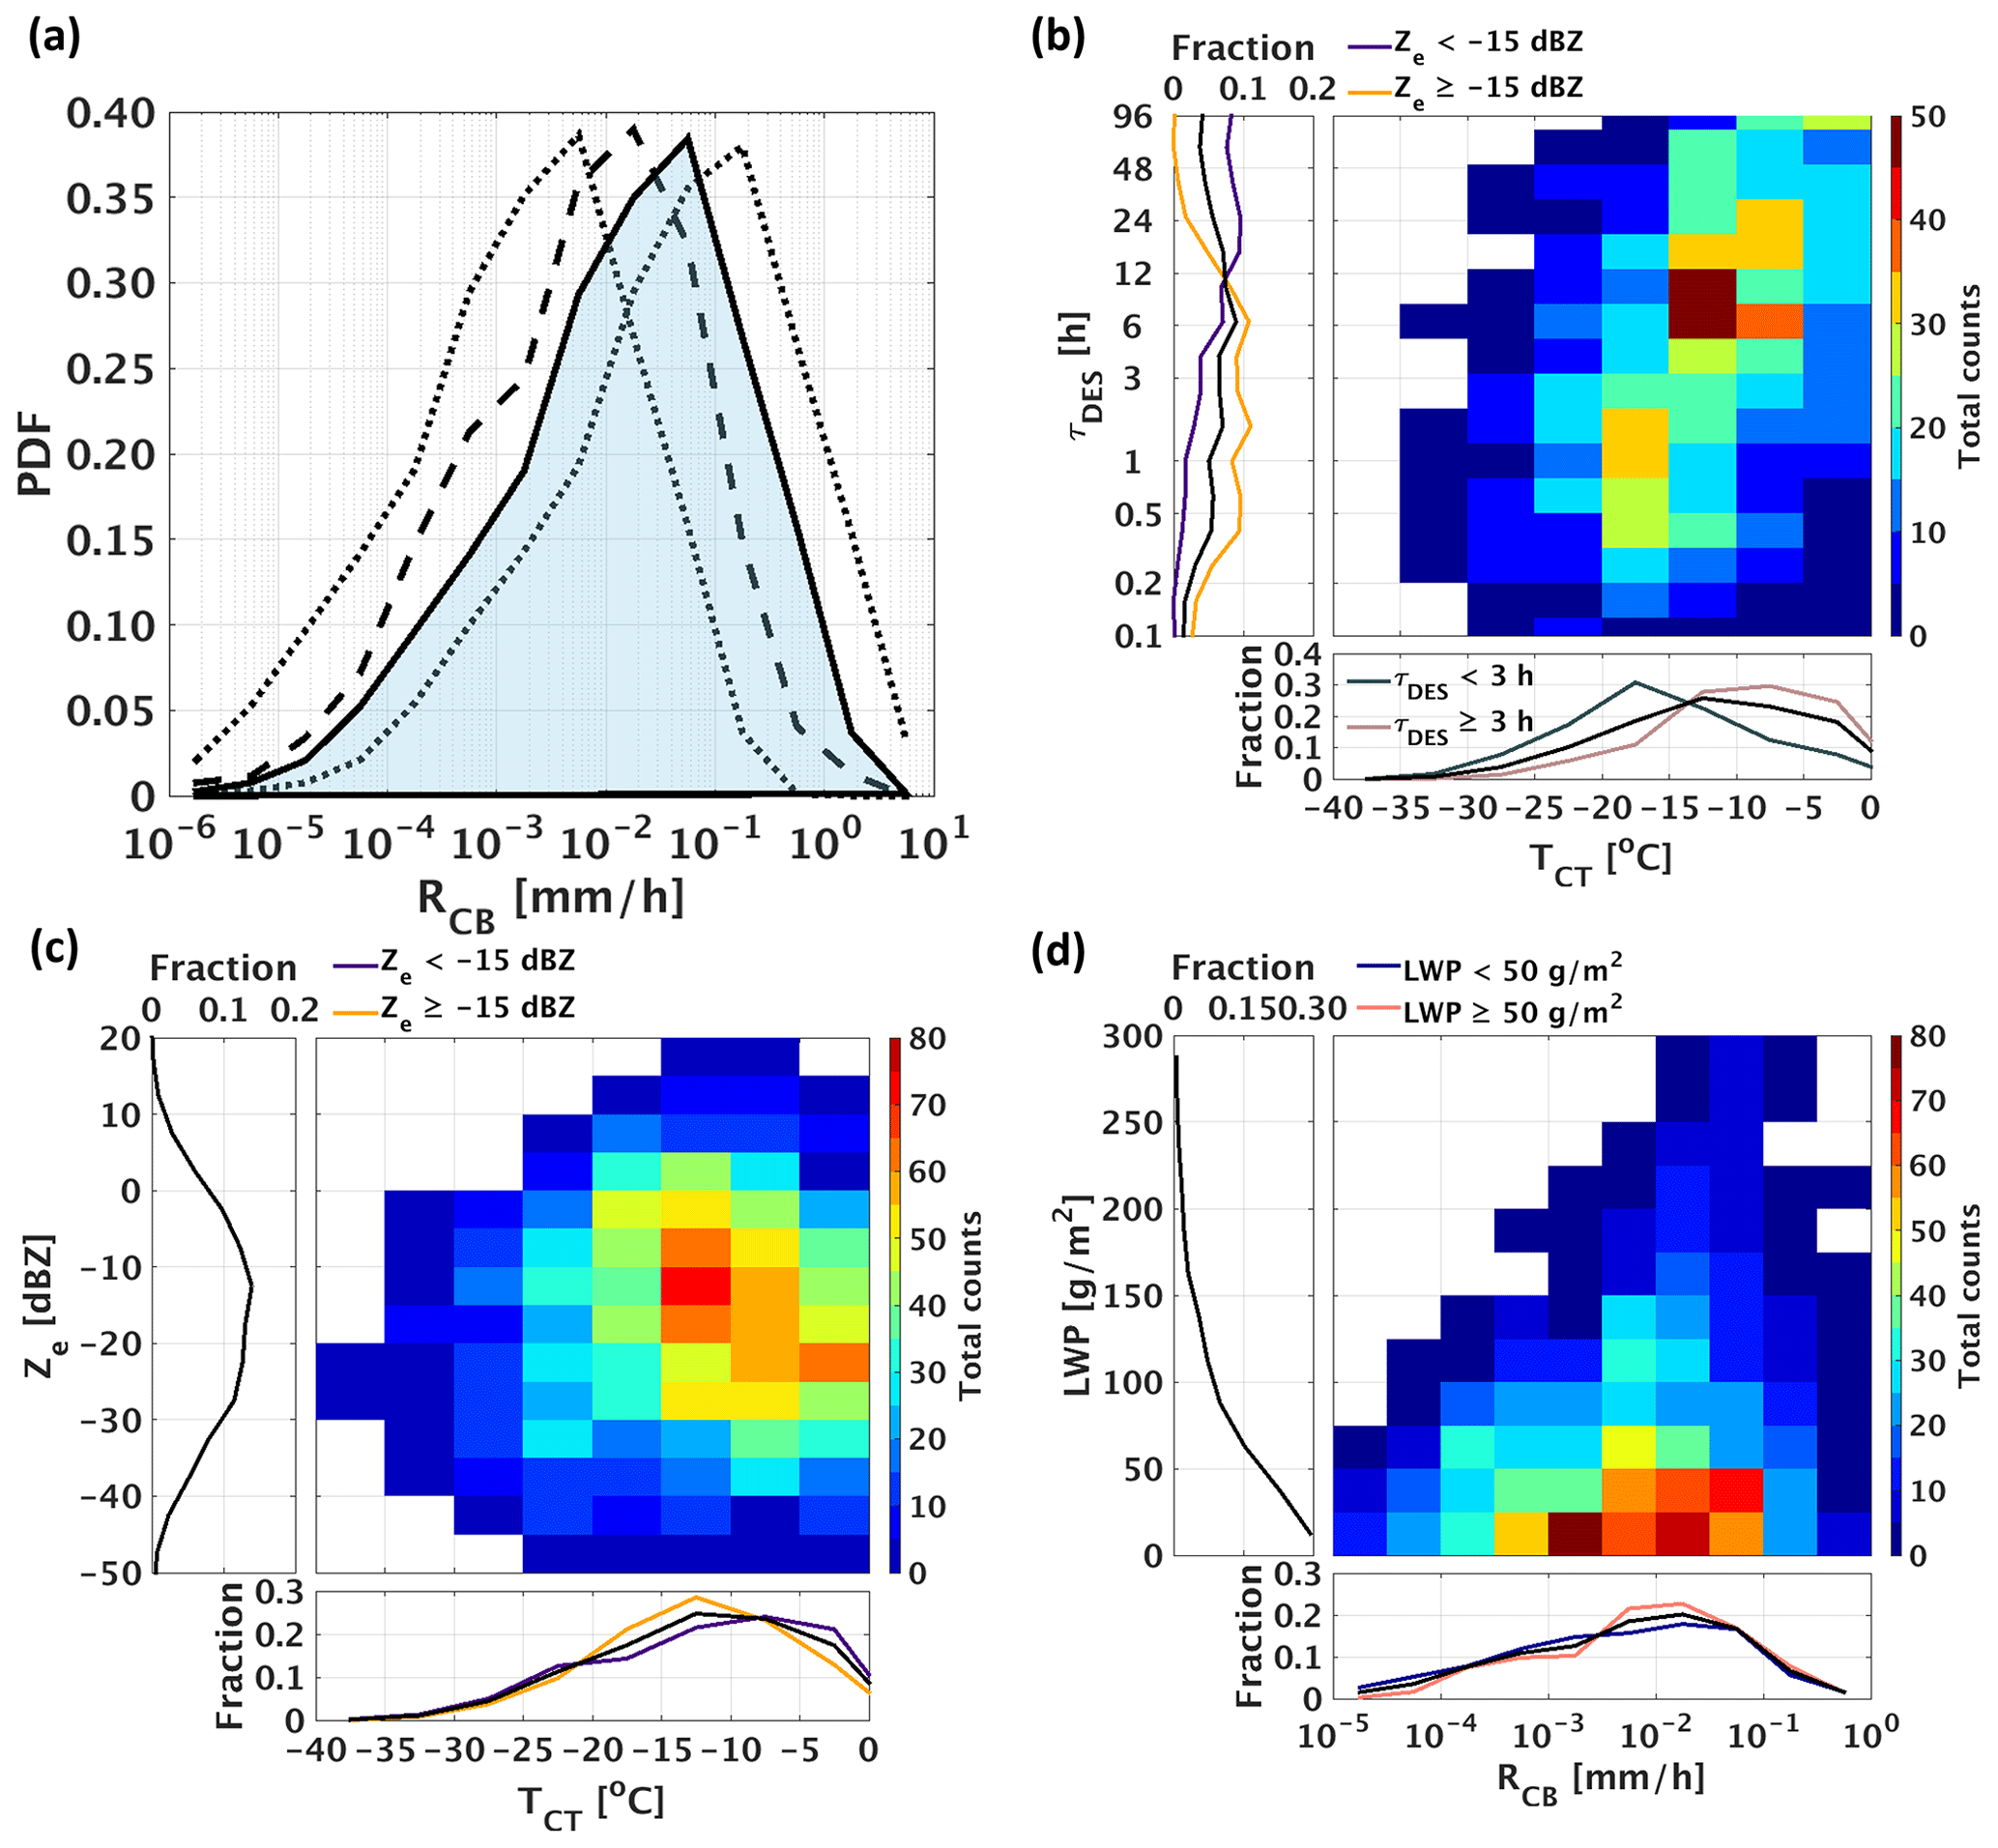
Figure 3Precipitation characteristics over the NSA: (a) estimated cloud base precipitation rate (RCB) probability density function (PDF; calculated over log10 of RCB with a logarithmic bin width of 0.5) over all sampled cases (solid + shaded; 5554 samples) and single-layer cases (dashed; 1591 samples). Dotted curves denote the PDF using RCB at its uncertainty range edges over all samples. (b, c, d) Joint histograms over single-layer cases of precipitation loss timescale τDES (see Sect. 5) versus TCT, KAZR Ze immediately below supercooled cloud base versus TCT, and LWP versus RCB. The τDES and RCB histogram bins have base 10 logarithmic bin widths of 0.2 and 0.5, respectively. Integrated occurrence fractions are shown in the side panels.
When applying the 2C-PC for “certain” and “possible” precipitation (accounting for radar sensitivity and range resolution), our NSA surface precipitation occurrences are still 5–10 points greater than the higher range of central-Arctic values (∼20 %–40 %) estimated by McIlhattan et al. (2017) and Edel et al. (2020), respectively. These remaining differences are likely attributable to hmin differences (see Sect. 2) and the spatial distribution of Arctic precipitation (relatively higher over the NSA; cf. Edel et al., 2020, Fig. 3; McIlhattan et al., 2017, Fig. 7). Altogether, this radar sensitivity analysis can generally reconcile expected high precipitation occurrence from ground-based measurements with variously lower values derived from satellite data. By emulating the and vertical resolution of the future EarthCARE mission's CPR (see Illingworth et al., 2015; Kollias et al., 2014), we find that it may detect precipitation percentages similar to those of KAZR (Fig. 1), thereby better establishing polar precipitation processes.
Finally, we find that the cloud base precipitation occurrence, which is most relevant to cloud lifetimes but currently more challenging to establish well from space, is consistently greater than the surface occurrence. Stratocumulus studies have long focused on both cloud base and surface precipitation owing in part to the effects of drizzle evaporation on boundary layer stability (e.g., Wood, 2012). It is also most natural to assess a process occurrence based on whether that process is active in the clouds at hand, and an active precipitation process in supercooled clouds will be best established from cloud base occurrence. On the one hand, the difference between cloud base and surface precipitation from supercooled clouds is expected to be smaller than for ice-free stratocumulus because ice is expected to be growing during sedimentation at least immediately below liquid cloud base (in contrast to drizzle), owing to the fact that supercooled water implies a supersaturation with respect to ice that increases with decreasing temperature. On the other hand, supercooled polar clouds can also occur at substantially higher altitudes than subtropical stratocumulus, for instance, corresponding to greater potential for sublimation before reaching the surface.
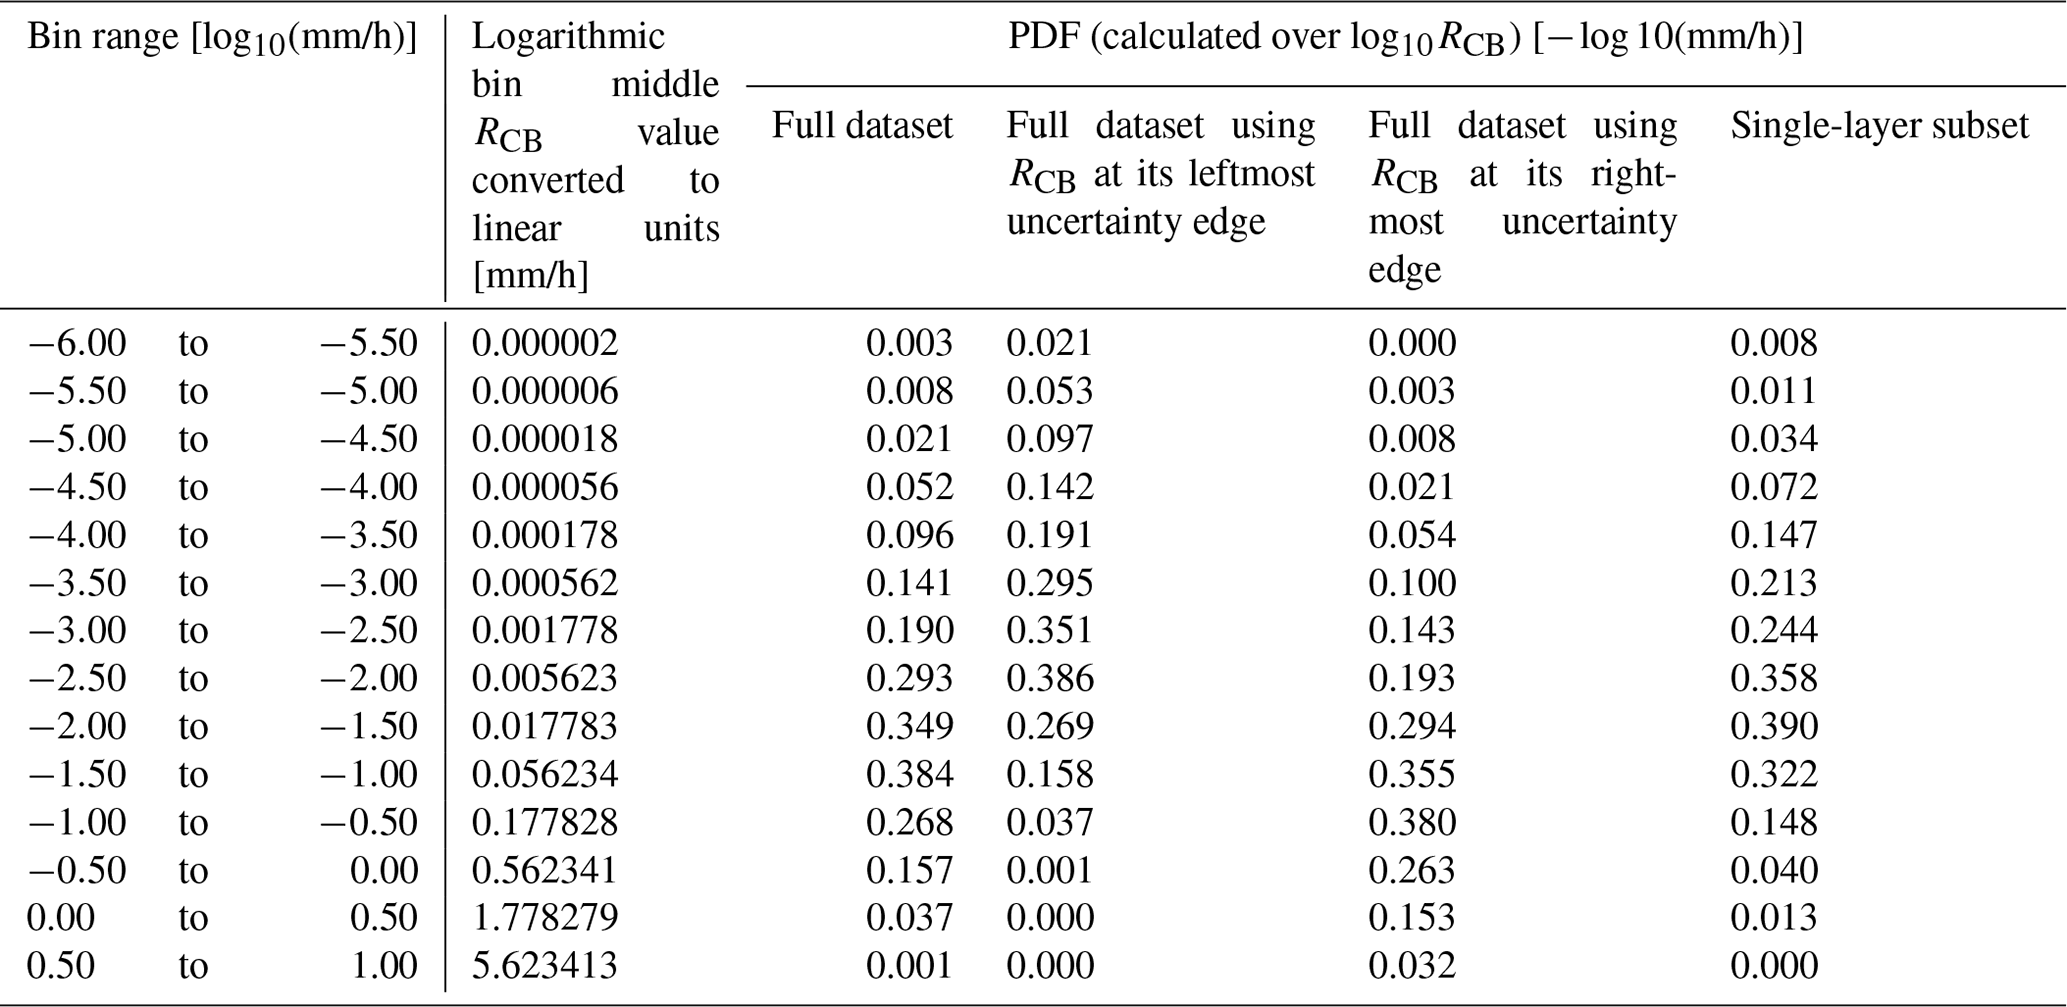
We suggest that these long-term ground-based statistics offer unique guidance for evaluating and improving the representation of supercooled cloud processes in large-scale models, especially when paired with additional colocated measurements. For instance, the probability density function (PDF) of cloud base precipitation rate (RCB) from single-layer clouds over the NSA is similar to that from all layers (Fig. 3a; PDF data are provided in Table B1). Moreover, the PDF shape is largely insensitive to the cutoff altitude (hmin) up to 3 km (see Appendix B). This weak dependence of the RCB PDF on the cloud base height range presents a notable contrast to the strong height dependence of satellite precipitation rate statistics, which do not offer the context of a known liquid cloud base height (e.g., Lemonnier et al., 2020; Pettersen et al., 2018). This is likely because the underlying atmosphere's thermodynamic state has no direct influence on RCB; in other words, below cloud base, precipitation rates are strongly influenced by the underlying supersaturation profile, as evidenced by the large differences between RCB and surface precipitation occurrence statistics. The PDF of RCB therefore offers a simple yet robust cloud process constraint, which is largely isolated from other potential thermodynamic model biases (e.g., Silber et al., 2019d, Fig. 4). We note that because the RCB retrievals, described by the third moment of the size distribution (IWC) weighted by VD, are based on radar reflectivity measurements (sixth moment), the uncertainties associated with the resultant RCB values are likely to be smaller than in equivalent Ze-based retrievals of ice crystal number concentration (zeroth moment) (see Ulbrich, 1983). The Arctic and Antarctic sites represent relatively contrasting polar conditions, with a drier, colder, and more pristine atmosphere over McMurdo Station (e.g., Bromwich et al., 2012; Lubin et al., 2020; Shupe et al., 2011; Silber et al., 2018a). Despite these atmospheric state differences between the two sites, the general similarity of Arctic and Antarctic precipitation occurrence reported here at cloud base strongly suggests that they are regionally representative at least to some degree. In other words, the basic capability of weather and climate models to reproduce a very high frequency of weak precipitation from supercooled cloud bases can be a useful benchmark for the performance of model physics.
Colocated measurements can furthermore serve to strengthen constraints on model processes. For instance, the ratio of a reservoir to a loss rate can be interpreted as a characteristic timescale for the loss process, and a desiccation timescale from precipitation can therefore be calculated as (see Bühl et al., 2016). We find that the joint histogram of τDES and cloud top temperature for single-layer NSA cases (where LWP can be reliably attributed) peaks around 6 to 9 h and −10 to −15 ∘C (Fig. 3b). Supercooled cloud occurrence is substantial in this cloud top temperature range at various levels of Ze (Fig. 3c), such as both above and below −15 dBZ (a common spaceborne threshold; see Figs. 1 and 3c). τDES values shorter than the median Eulerian supercooled cloud persistence of 3 h reported over the NSA (Shupe, 2011) are more common at temperatures below −15 ∘C (Fig. 3b), reflecting the fact that lower RCB values commonly accompany lower LWP clouds (Fig. 3d). Based on these statistics, we conclude that the prevalent weak RCB (Fig. 3a) can be important cloud moisture sinks especially for low temperature and low LWP regimes that are common over polar regions (e.g., Nomokonova et al., 2019; Shupe, 2011; Silber et al., 2018a; Zhang et al., 2010). We postulate that such fluxes are also important to below-cloud moisture budgets owing in part to the likely commonality of continued growth of ice precipitation in sub-cloud ice supersaturated conditions, which will serve to enhance moisture transport even in cases of low cloud base Ze (e.g., just above ; see Appendix D).
To our knowledge, this is the first study to report supercooled cloud base precipitation rates from an extensive sample of atmospheric profiles, including tenuous, opaque, seeded, non-seeded, single, and multi-layer clouds. Similar to Bühl et al. (2016), who studied mid-latitude geometrically thin supercooled clouds, we also evaluate the impact of cloud base ice precipitation rates on cloud life cycle, using ancillary measurements. We find substantially greater surface precipitation occurrence frequencies than previously reported based on lower-sensitivity spaceborne radar measurements. We posit that such persistent ice precipitation from supercooled clouds is likely primarily supported by sustained nucleation and growth of ice crystals resulting from continuous INP activation, consistent with non-precipitating cases occurring preferentially under conditions that would generally hamper INP supply or activation rate. Persistently weak cloud base precipitation rates and precipitation loss timescales (usually >1–10 h) further indicate the commonality of an INP-limited regime. Morrison et al. (2011) demonstrate that if sufficiently high ice concentrations are maintained in large-eddy simulations of a well-mixed cloud-topped boundary layer, for instance, then surface precipitation may desiccate a low-LWP cloud layer within ∼1 h. By contrast, a weakly precipitating, INP-limited regime is consistent with well-observed and widely simulated supercooled cloud case studies derived independently from several Arctic field campaigns (e.g., Fridlind and Ackerman, 2018).
The long-known commonality of ice precipitation from supercooled polar stratus and stratocumulus (e.g., Rangno and Hobbs, 2001), confirmed by these long-term measurements, suggests a role for liquid saturation as a principal gateway to polar ice formation at temperatures between 0 and ∘C (see also de Boer et al., 2011). If INP activation is the main pathway for primary ice formation, activation of immersion-mode INP is likely dominant owing to slow contact rates between droplets and interstitial aerosol particles despite cloud top phoretic enhancements (cf. Fridlind et al., 2012). Such a scenario deprecates INP activation in the deposition mode, consistent with evidence that rates are generally at least an order of magnitude weaker (e.g., Alpert et al., 2011). Supercooled stratus and stratocumulus cloud structures are generally well reproduced by large-eddy simulations when in-cloud ice concentrations similar to those observed are matched (e.g., Ovchinnikov et al., 2014). However, field observational constraints on both INP and ice properties have been generally insufficient to reliably predict and evaluate primary ice formation processes, and various ice multiplication processes remain highly uncertain, preventing robust conclusions from a closure approach to source attribution (Fridlind and Ackerman, 2018; Korolev et al., 2020; Lauber et al., 2018; Zipori et al., 2018).
Since temperature-dependent INP measurements over the Arctic, Antarctic, and Southern Ocean regions show large overlap with INP measurements over the NSA (Belosi et al., 2014; DeMott, 2019; Villanueva et al., 2020; Wex et al., 2019), we postulate that unremitting precipitation is likely a prevalent feature of high-latitude supercooled clouds. Precipitation loss timescales over the NSA suggest that a prevalence of weakly precipitating supercooled clouds is important for in-cloud moisture budget.
A definitional overlap exists between precipitating supercooled clouds as defined in this study and mixed-phase clouds as defined in other studies; namely, supercooled clouds that are precipitating ice are also mixed-phase clouds. Microphysically, this overlap hinges on the rapid equilibration of supercooled cloud water with ambient vapor pressure combined with the rapid growth of ice crystals at liquid saturation. However, Fig. 1 shows that the diagnosed occurrence frequency of precipitating supercooled clouds, and by extension mixed-phase clouds, can depend strongly on instrument sensitivity. The probability of observing ice hydrometeors also increases with a longer duration of measurement averaging window (e.g., Fig. C1). Thus, our analysis demonstrates that the observed abundance of mixed-phase clouds can vary substantially with methodology.
Our findings underscore the importance of a “definition-aware” approach (Kay et al., 2018) to enable valid comparisons between datasets obtained with differently capable instruments or between measurements and model output while considering instrument limitations. Despite the generally high sensitivity of ground-based radar to ice precipitation, we have noted evidence that sensitivity still presents limitations to the detection of precipitation in some cases. While differing approaches to defining precipitation occurrence could have been taken in this study, we conjecture that most would result in comparatively high occurrences relative to satellite remote-sensing capabilities, as also found for warm marine clouds (Lamer et al., 2020). Given that the great majority of clouds over both Arctic and Antarctic sites is usually precipitating, global model biases in precipitation rate could be a greater cause of error than biases in occurrence frequency (cf. Kay et al., 2018), underscoring the difference between precipitating frequently and precipitating heavily.
We use long-term sounding and ground-based radar measurements to characterize the properties of precipitation from supercooled clouds over North Slope of Alaska (NSA) and Antarctic (McMurdo) sites and examine the influence of radar sensitivity on apparent precipitation occurrence. Quantitative analyses support the following conclusions.
-
More than 85 % (75 %) of the detected supercooled cloud layers over the NSA (McMurdo) precipitate from the liquid cloud base, largely in the form of ice, and precipitation is detected close to the surface in more than 75 % (50 %) of supercooled cloud-containing profiles.
-
Such greater prevalence of surface precipitation can be reconciled with spaceborne estimates, some of which are lesser by more than half, by considering the lower sensitivity of spaceborne radars and related precipitation detection algorithms.
-
By extension, insofar as mixed-phase clouds are defined as supercooled clouds that are precipitating ice, the inferred abundance of mixed-phase clouds can vary substantially with instrument sensitivity and methodology.
-
Although roughly half of the detected supercooled cloud layers are seeded by ice precipitation from aloft, precipitation occurrence is only roughly 10 % lower from unseeded relative to all detected supercooled layers, indicating that supercooled clouds are commonly a source of ice in polar regions.
-
Non-precipitating supercooled clouds are preferentially associated with higher temperatures, smaller LWPs, radiative shielding by overlying cloud layers, lack of in-cloud turbulence, and relatively pristine conditions.
-
An analysis of desiccation timescales based on colocated retrievals of LWP for single-layer cases over NSA indicates that the effect of persistent weak precipitation fluxes on in-cloud moisture budgets can be non-negligible owing to the commonality of low cloud LWPs.
The prevalence of precipitating polar supercooled clouds, commensurate with their frequently observed persistence, implies that large-scale models should reflect similar characteristics in order to better represent both the polar atmospheric state (e.g., phase partitioning and radiative fluxes) and cloud processes (e.g., prevalent ice nucleation, growth, and precipitation) (e.g. Mülmenstädt et al., 2020). We suggest that supercooled cloud base precipitation rate statistics, which to our knowledge have not been a focus of model evaluation efforts to date, will be particularly valuable for evaluating and improving the representation of these supercooled cloud processes in large-scale models. In contrast to evaluating precipitation rate statistics at all levels without regard for supercooled cloud boundaries, the precipitation at the cloud base level is detected in observations and evaluated based on model output before extensive growth and/or sublimation throughout the underlying atmosphere, thus improving the robustness of the observational statistics and the isolation of model output from indirect biases associated with the representation of the atmospheric thermodynamic profile. Whereas current spaceborne measurements provide greater coverage, ground-based measurements can overcome some spaceborne observability limitations and provide valuable colocated observations for more detailed model process evaluation.
Figure A1 shows the minimum detectable KAZR Ze over the NSA and McMurdo Station based on analysis of the full dataset discussed in Sect. 2. Because only the KAZR general (GE) mode properly operates below ∼700 and ∼450 m above ground level (a.g.l.) over the NSA and McMurdo Station, respectively, the instrument sensitivity is lower below this height. The profiles suggest that the Ze sensitivity analysis discussed in the main text is influenced by the varying KAZR sensitivity up to dBZ (at 4.3 km, the highest examined altitude), which implies that the actual precipitation percentage is potentially higher for below this value.
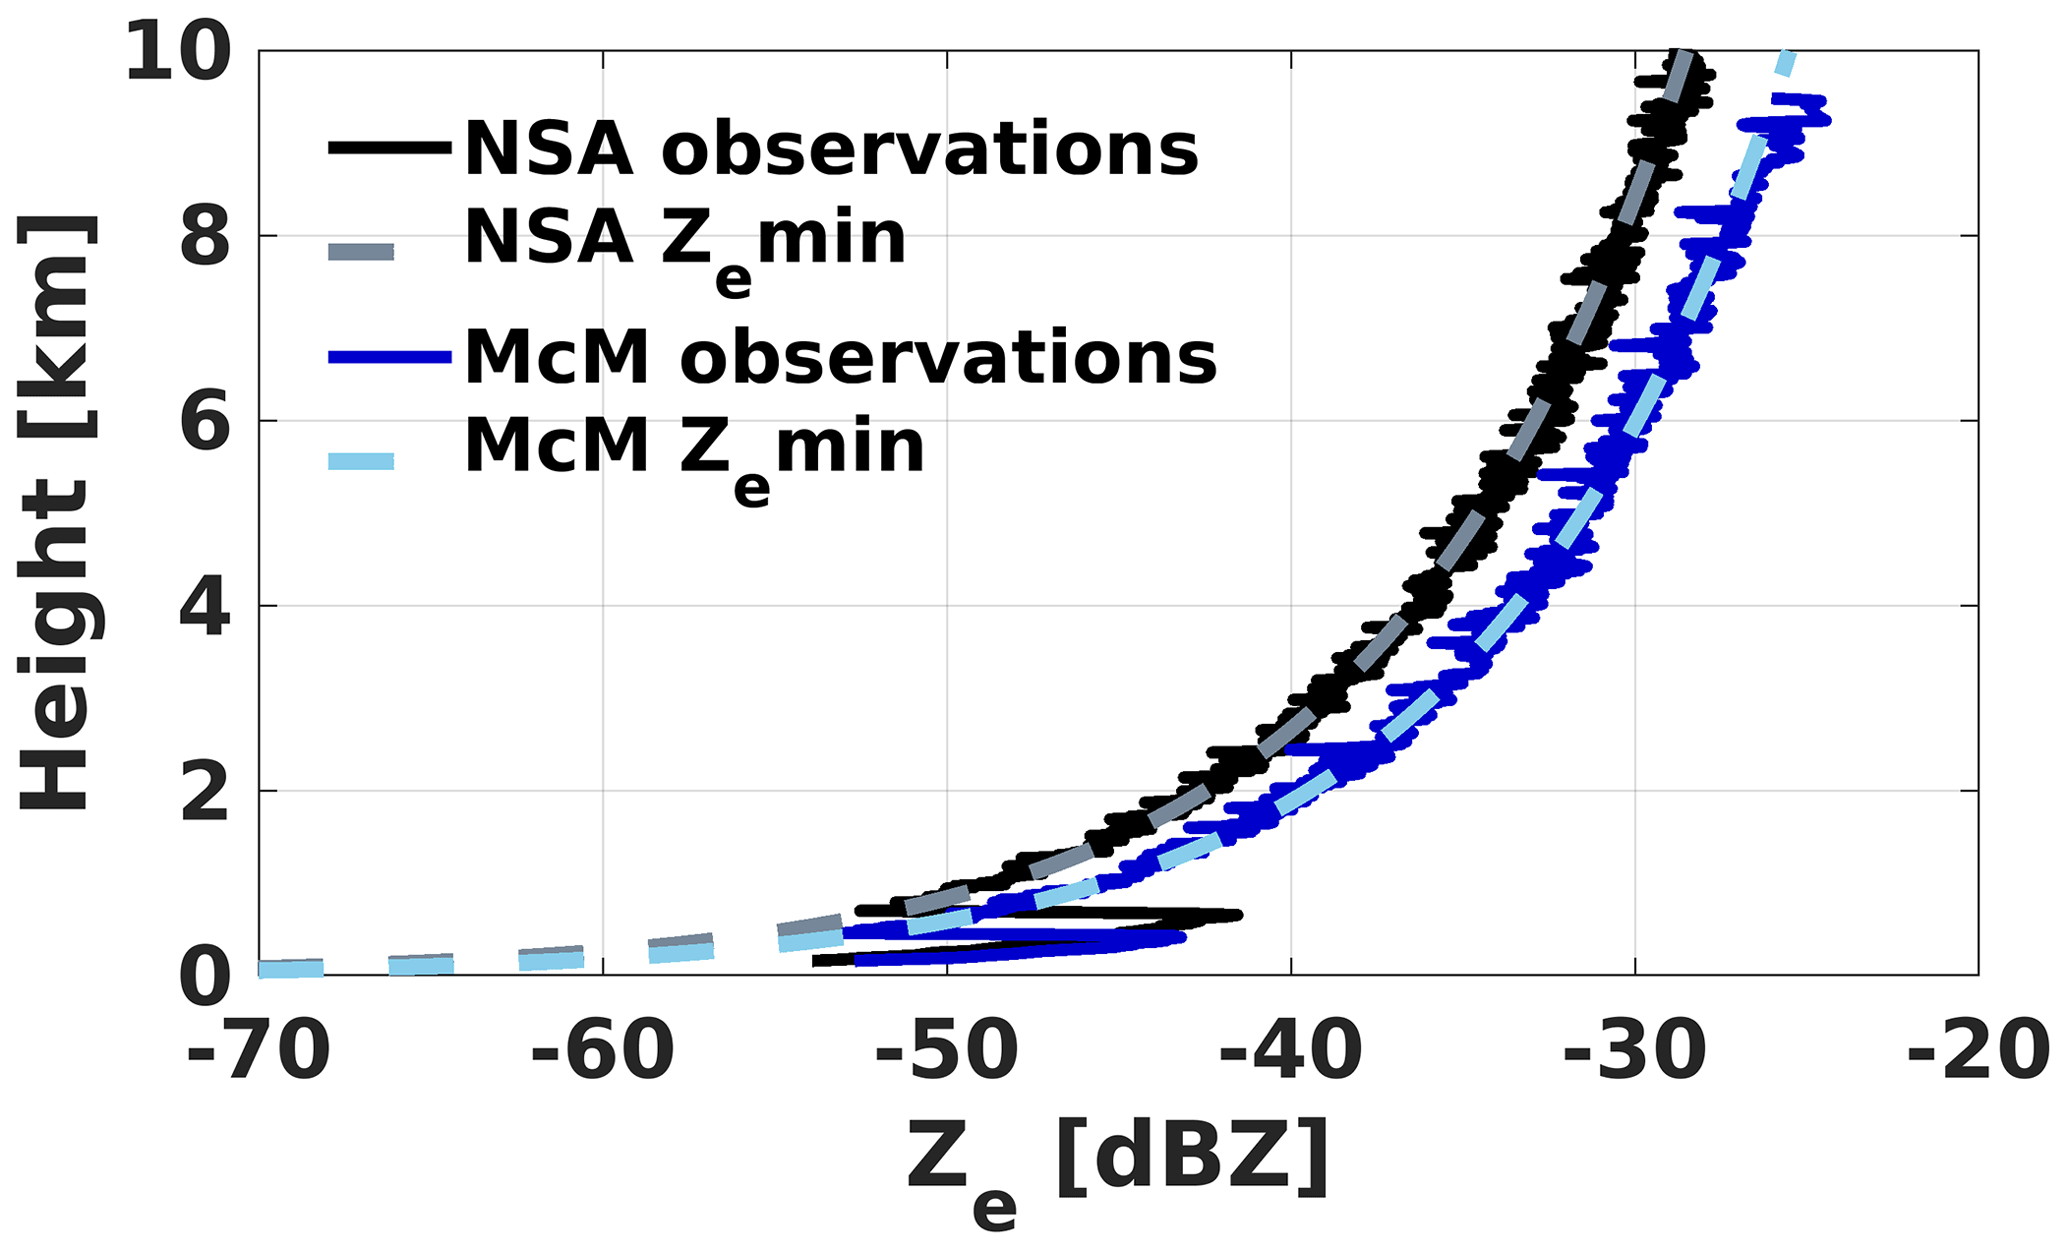
Figure A1Minimum detectable KAZR Ze at the NSA and McMurdo Station based on analysis of the full dataset discussed in Sect. 2. The smooth curves designate the theoretical minimum detectible Ze profile (), using the KAZR Ze sensitivity at 1 km a.g.l.
Figure B1 depicts the PDF of RCB over all sampled NSA cases using a few different Ze–R relationships and various values of the lowest examined (cutoff) KAZR altitude, hmin. The illustrated Ze-R retrievals exhibit different variance in RCB and show some overlap with the method used in this study, in which an hmin value of 300 m was applied (see Table B1 for the corresponding RCB PDF data). When higher hmin values are used, the left tail of the calculated PDF narrows due to the decreasing KAZR sensitivity with increasing height (see Fig. A1), but the general PDF shape, including the RCB at the PDF mode is preserved even though the number of samples can be significantly smaller. Some narrowing of the right end of the PDF can be observed due to local differences in cloud properties at given altitudes (Fig. B1). However, the general robustness of these PDF shapes accentuates the lack of direct dependence of RCB on the thermodynamic structure of the underlying atmosphere, which could grow or sublimate the precipitating ice. Therefore, we suggest that the PDF of RCB may provide a simple yet robust observational constraint for testing large-scale models. We note that a separated analysis of RCB indicates that some seasonal changes in the PDF variance exist, but these changes are rather consistent regardless of hmin (not shown), similar to the robustness of the annual analysis discussed above.
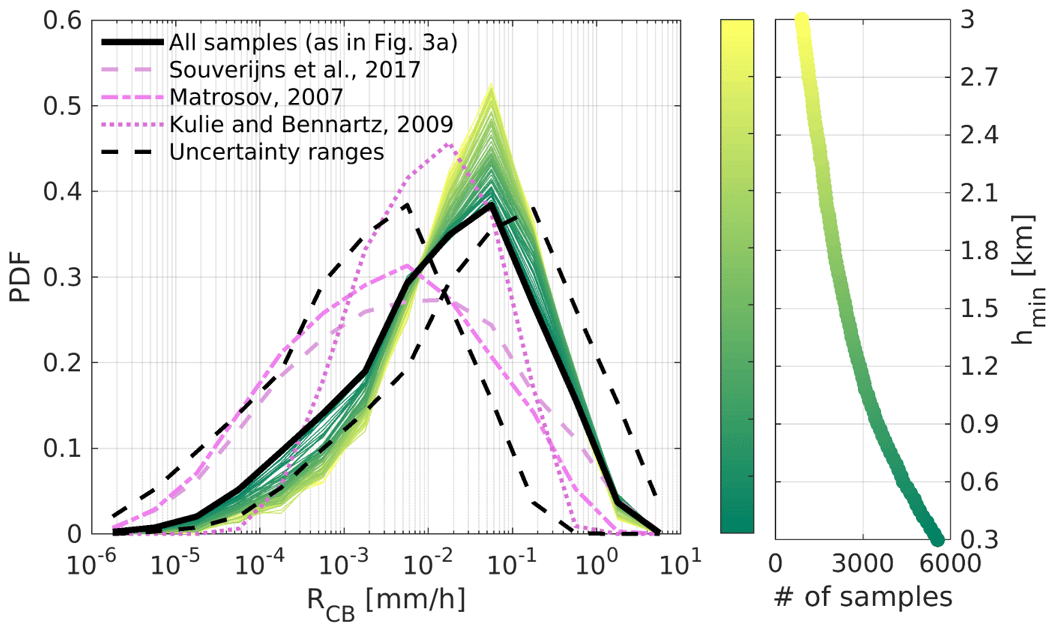
Figure B1The PDF of RCB over all sampled NSA cases (solid black; as in Fig. 3a); dashed black curves denote the PDF using RCB at its uncertainty range edges over all samples (as in Fig. 3a). The pink curves show PDFs of RCB calculated using Ze–R relationships derived by Souverijns et al. (2017; for snowfall rate), Kulie and Bennartz (2009; for aggregates and bullet rosettes above and below −20 ∘C, respectively), and Matrosov (2007; for dendritic aggregates) (see legend for details). The color-scaled curves show the PDFs calculated using the same RCB calculation method as in the text but with various lowest examined (cutoff) KAZR altitudes (hmin); the right panel shows the number of samples for every hmin value.
Figures C1 and C2 provide a few examples of supercooled cloud layers detected over the NSA, in which there are some periods where the clouds apparently do not precipitate, whereas Fig. C3 illustrates the impact of different values on the NSA RCB PDF shape.
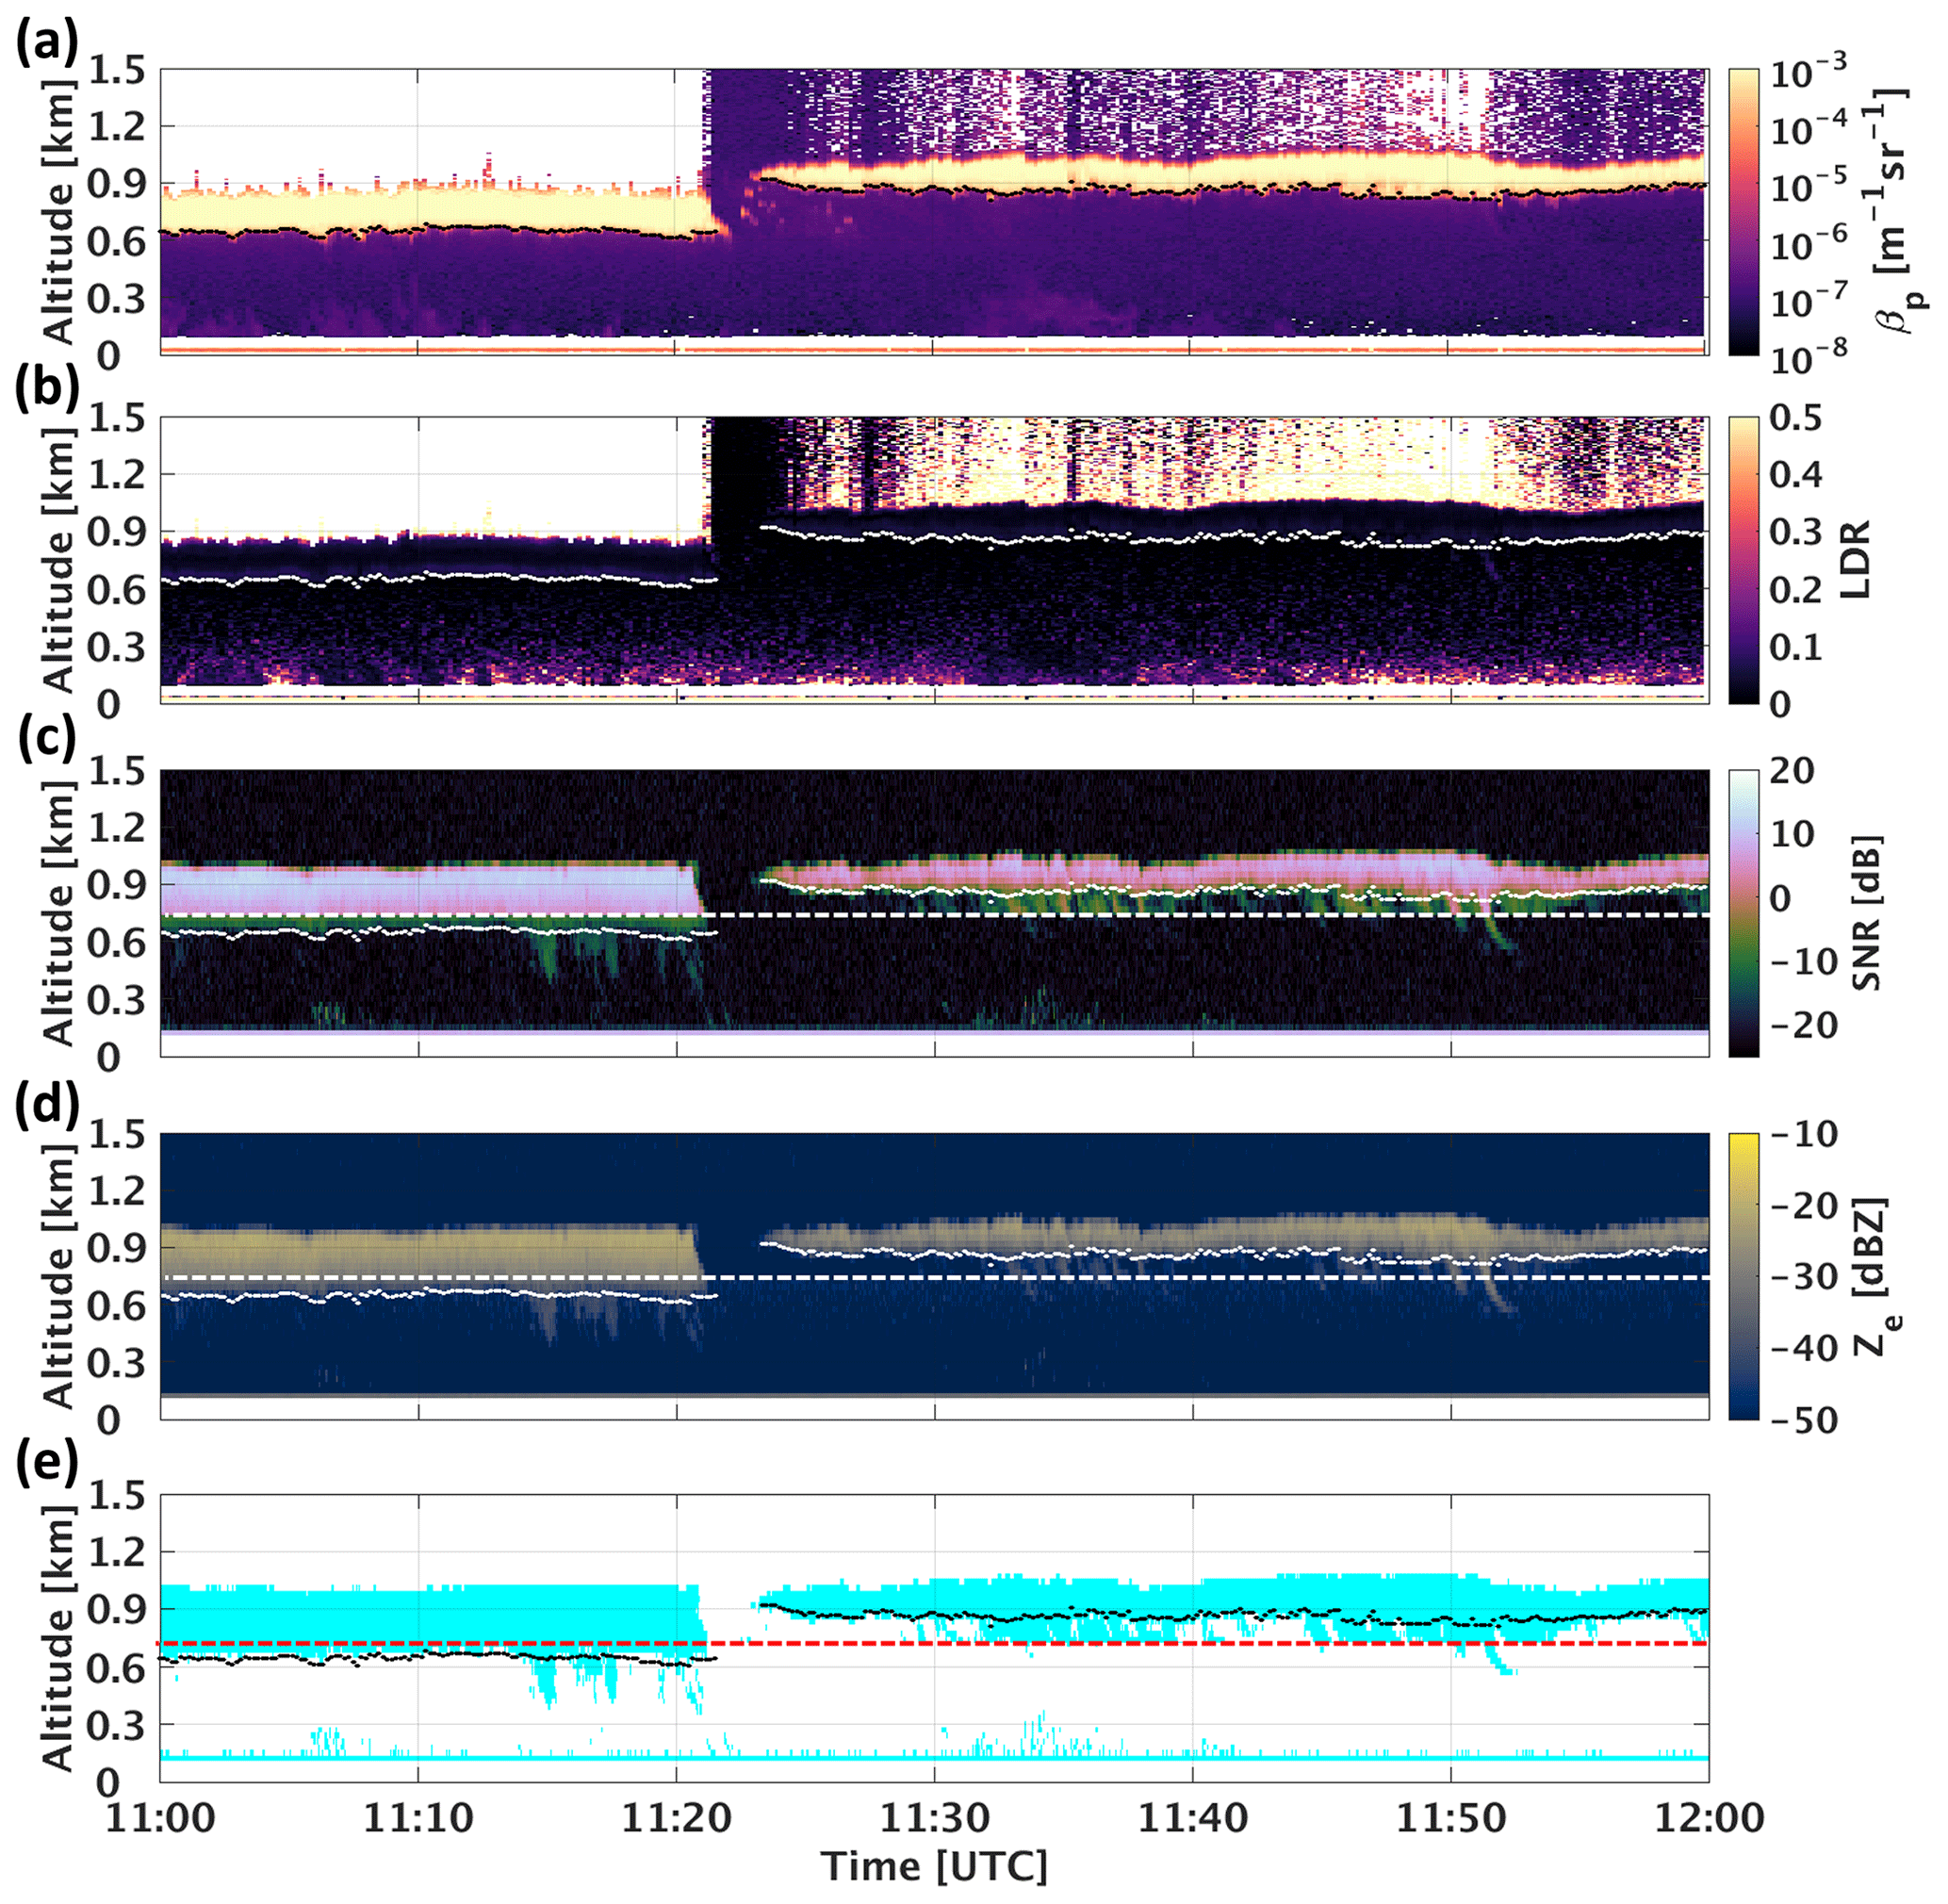
Figure C1Hour containing a non-precipitating supercooled layer between 11:00 and 11:15 UTC on 1 September 2015 over the NSA. (a) High spectral resolution lidar (HSRL; Eloranta, 2005) particulate backscatter cross section, (b) HSRL linear depolarization ratio, (c) KAZR signal-to-noise ratio (SNR), (d) KAZR Ze, and (e) KAZR cloud mask using an SNR threshold of −16 dB (see Silber et al., 2018a). Dashed horizontal white and red lines designate the height below (above) which the KAZR GE (MD) mode is used. Black or white dots designate the HSRL liquid cloud base height data product (see Silber et al., 2018c, for the algorithm description; Silber et al., 2018b, 2019c, for the data product). See Appendix C for discussion.
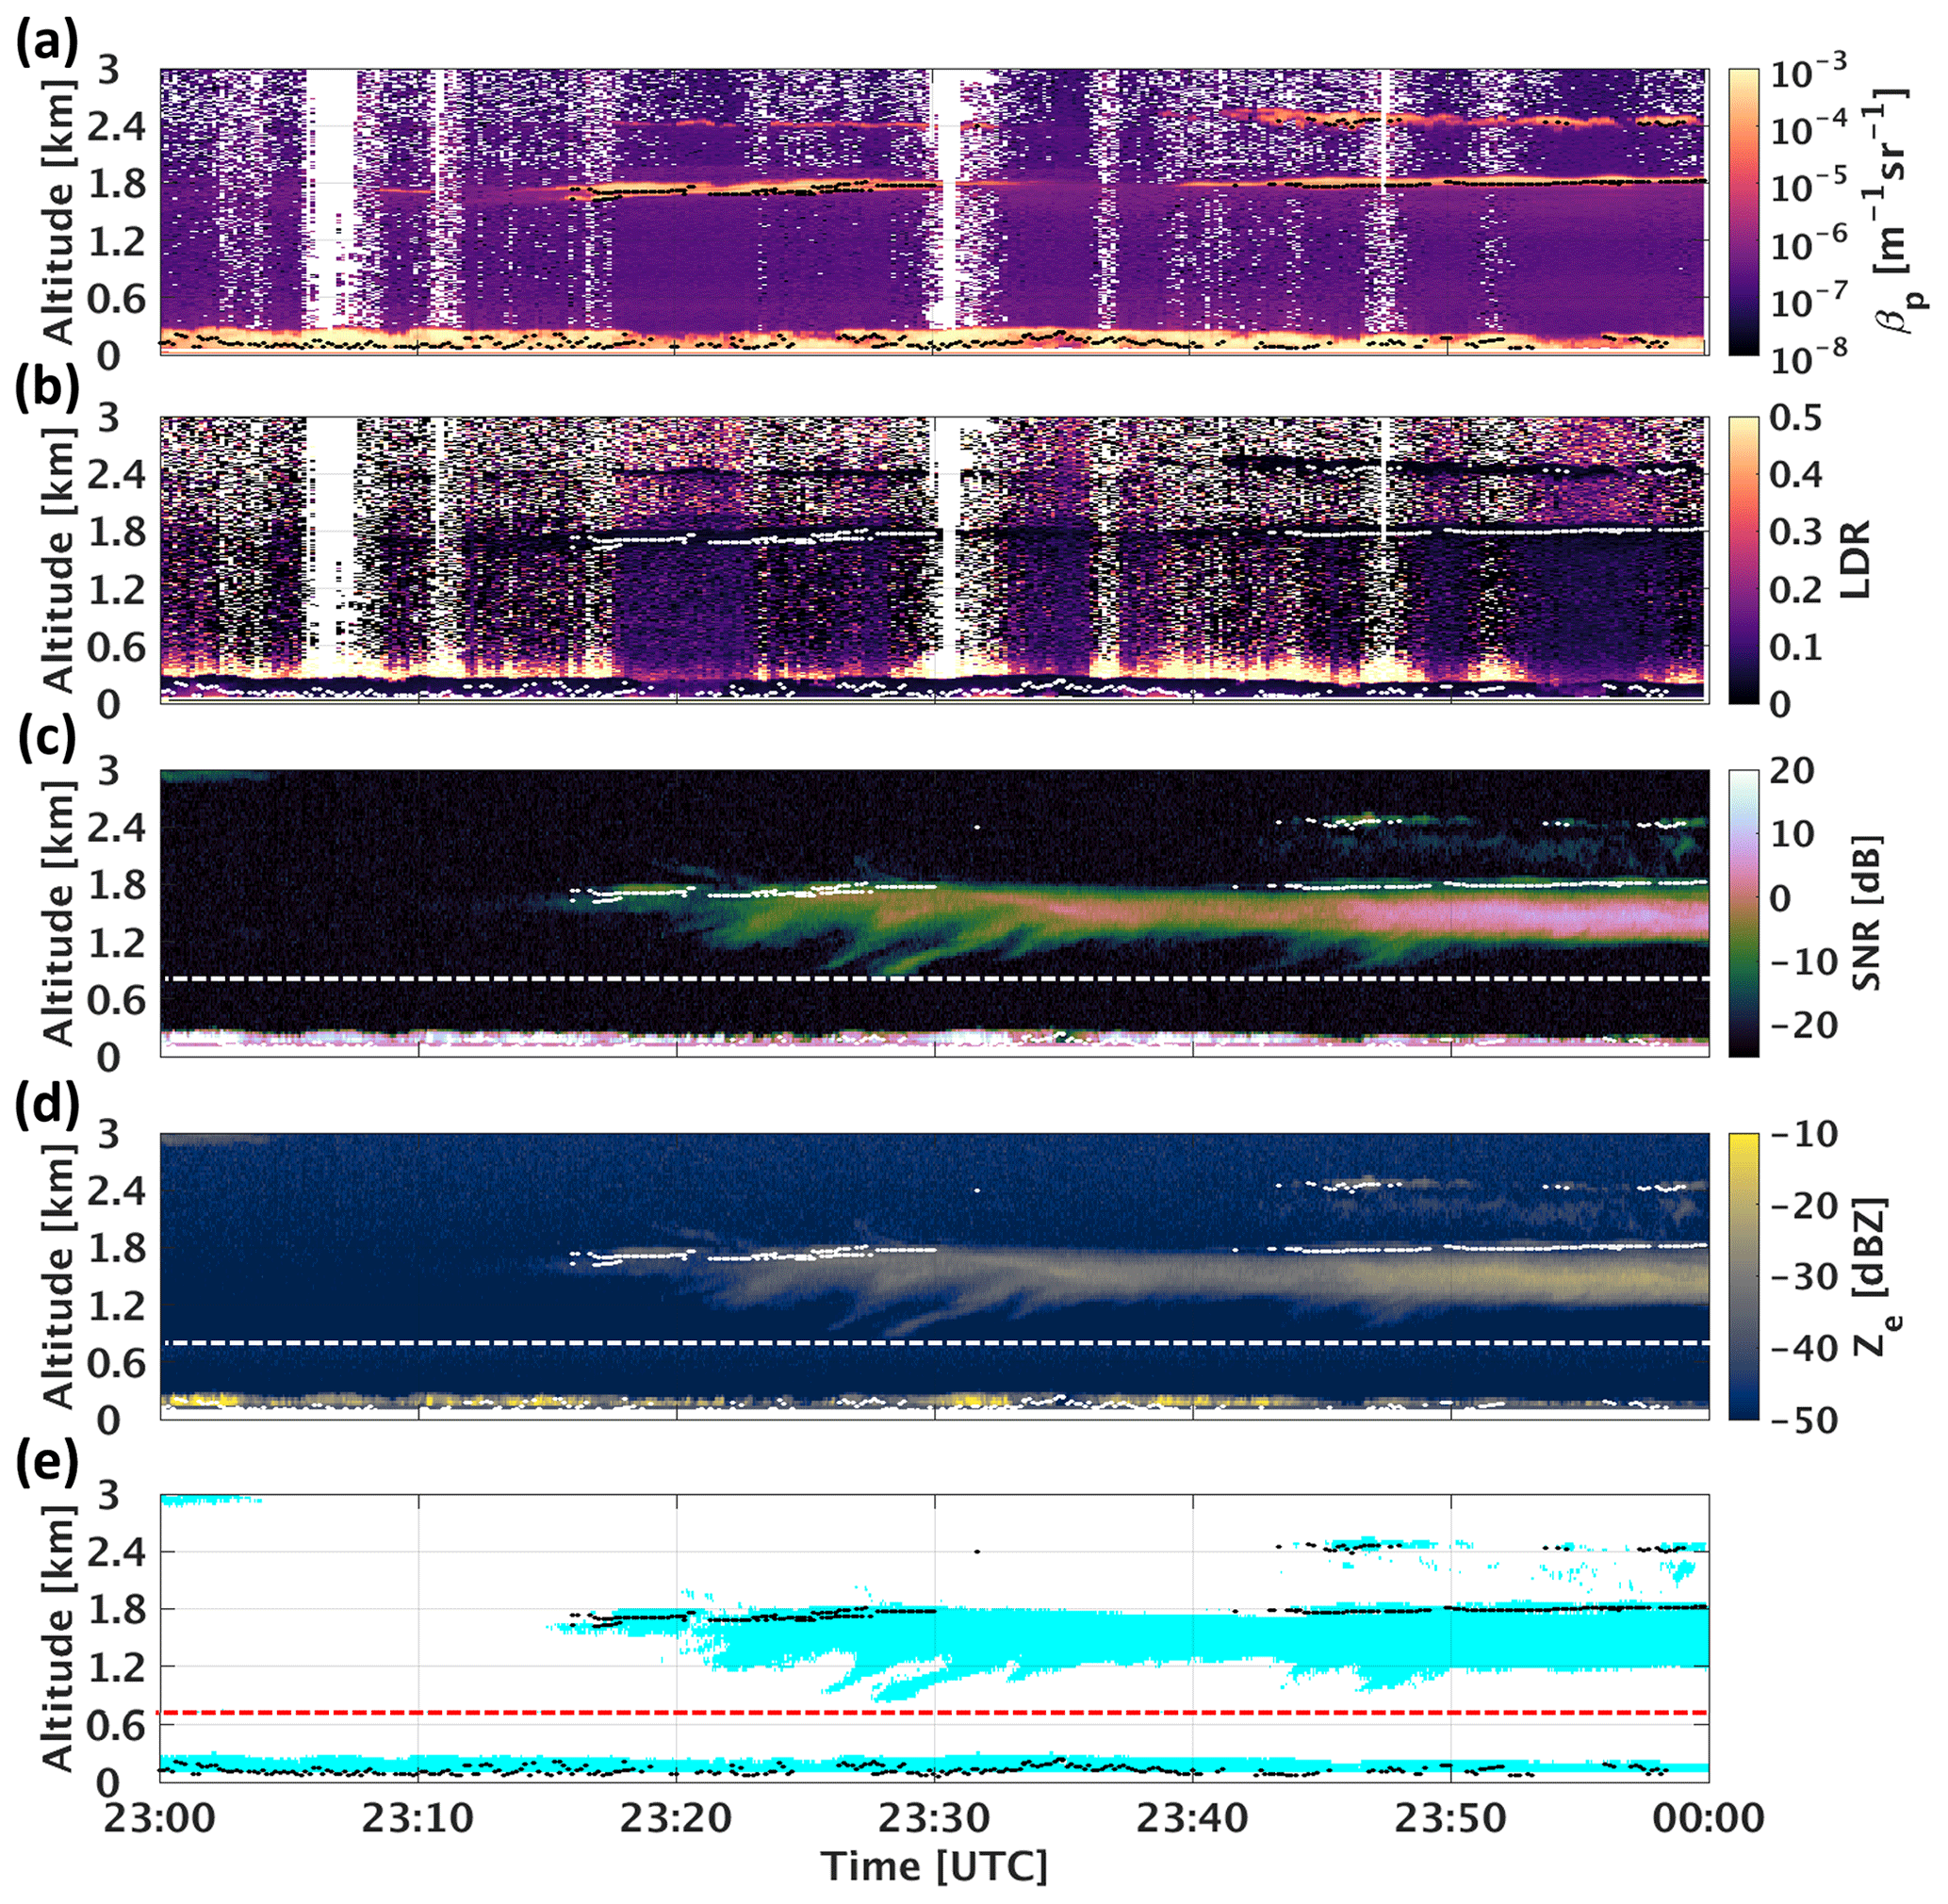
Figure C2The same as in Fig. C1 but for a multi-layer event on 10 November 2015. See Appendix C for discussion.
Figure C1 portrays an hour of remote-sensing measurements from 1 September 2015, during which a non-precipitating supercooled layer is observed between 11:00 and 11:15 UTC. The cloud top temperature is ∘C during this event based on sounding measurements from the same hour. Before 11:15 UTC, there is little apparent precipitation, while in other regions and periods it appears that the KAZR GE mode is not sensitive enough to detect precipitation (note the difference between the detected hydrometeor signal above and below the dashed lines during 11:30–11:40 UTC).
Figure C2 shows a different example of a non-precipitating cloud layer observed on 10 November 2015. The topmost supercooled cloud layer (cloud top temperature of ∘C) detected between 23:40–00:00 UTC appears as not precipitating because there are no detectible KAZR echoes attached to the cloud base. However, precipitating ice is detected by KAZR ∼150 m below the cloud base. Because the relative humidity with respect to ice is above 100 % between cloud base and the precipitating hydrometeors (not shown), we deduce that the cloud is actually precipitating but the backscattered KAZR moderate sensitivity (MD) mode signal is not strong enough to allow detection of these hydrometeors.
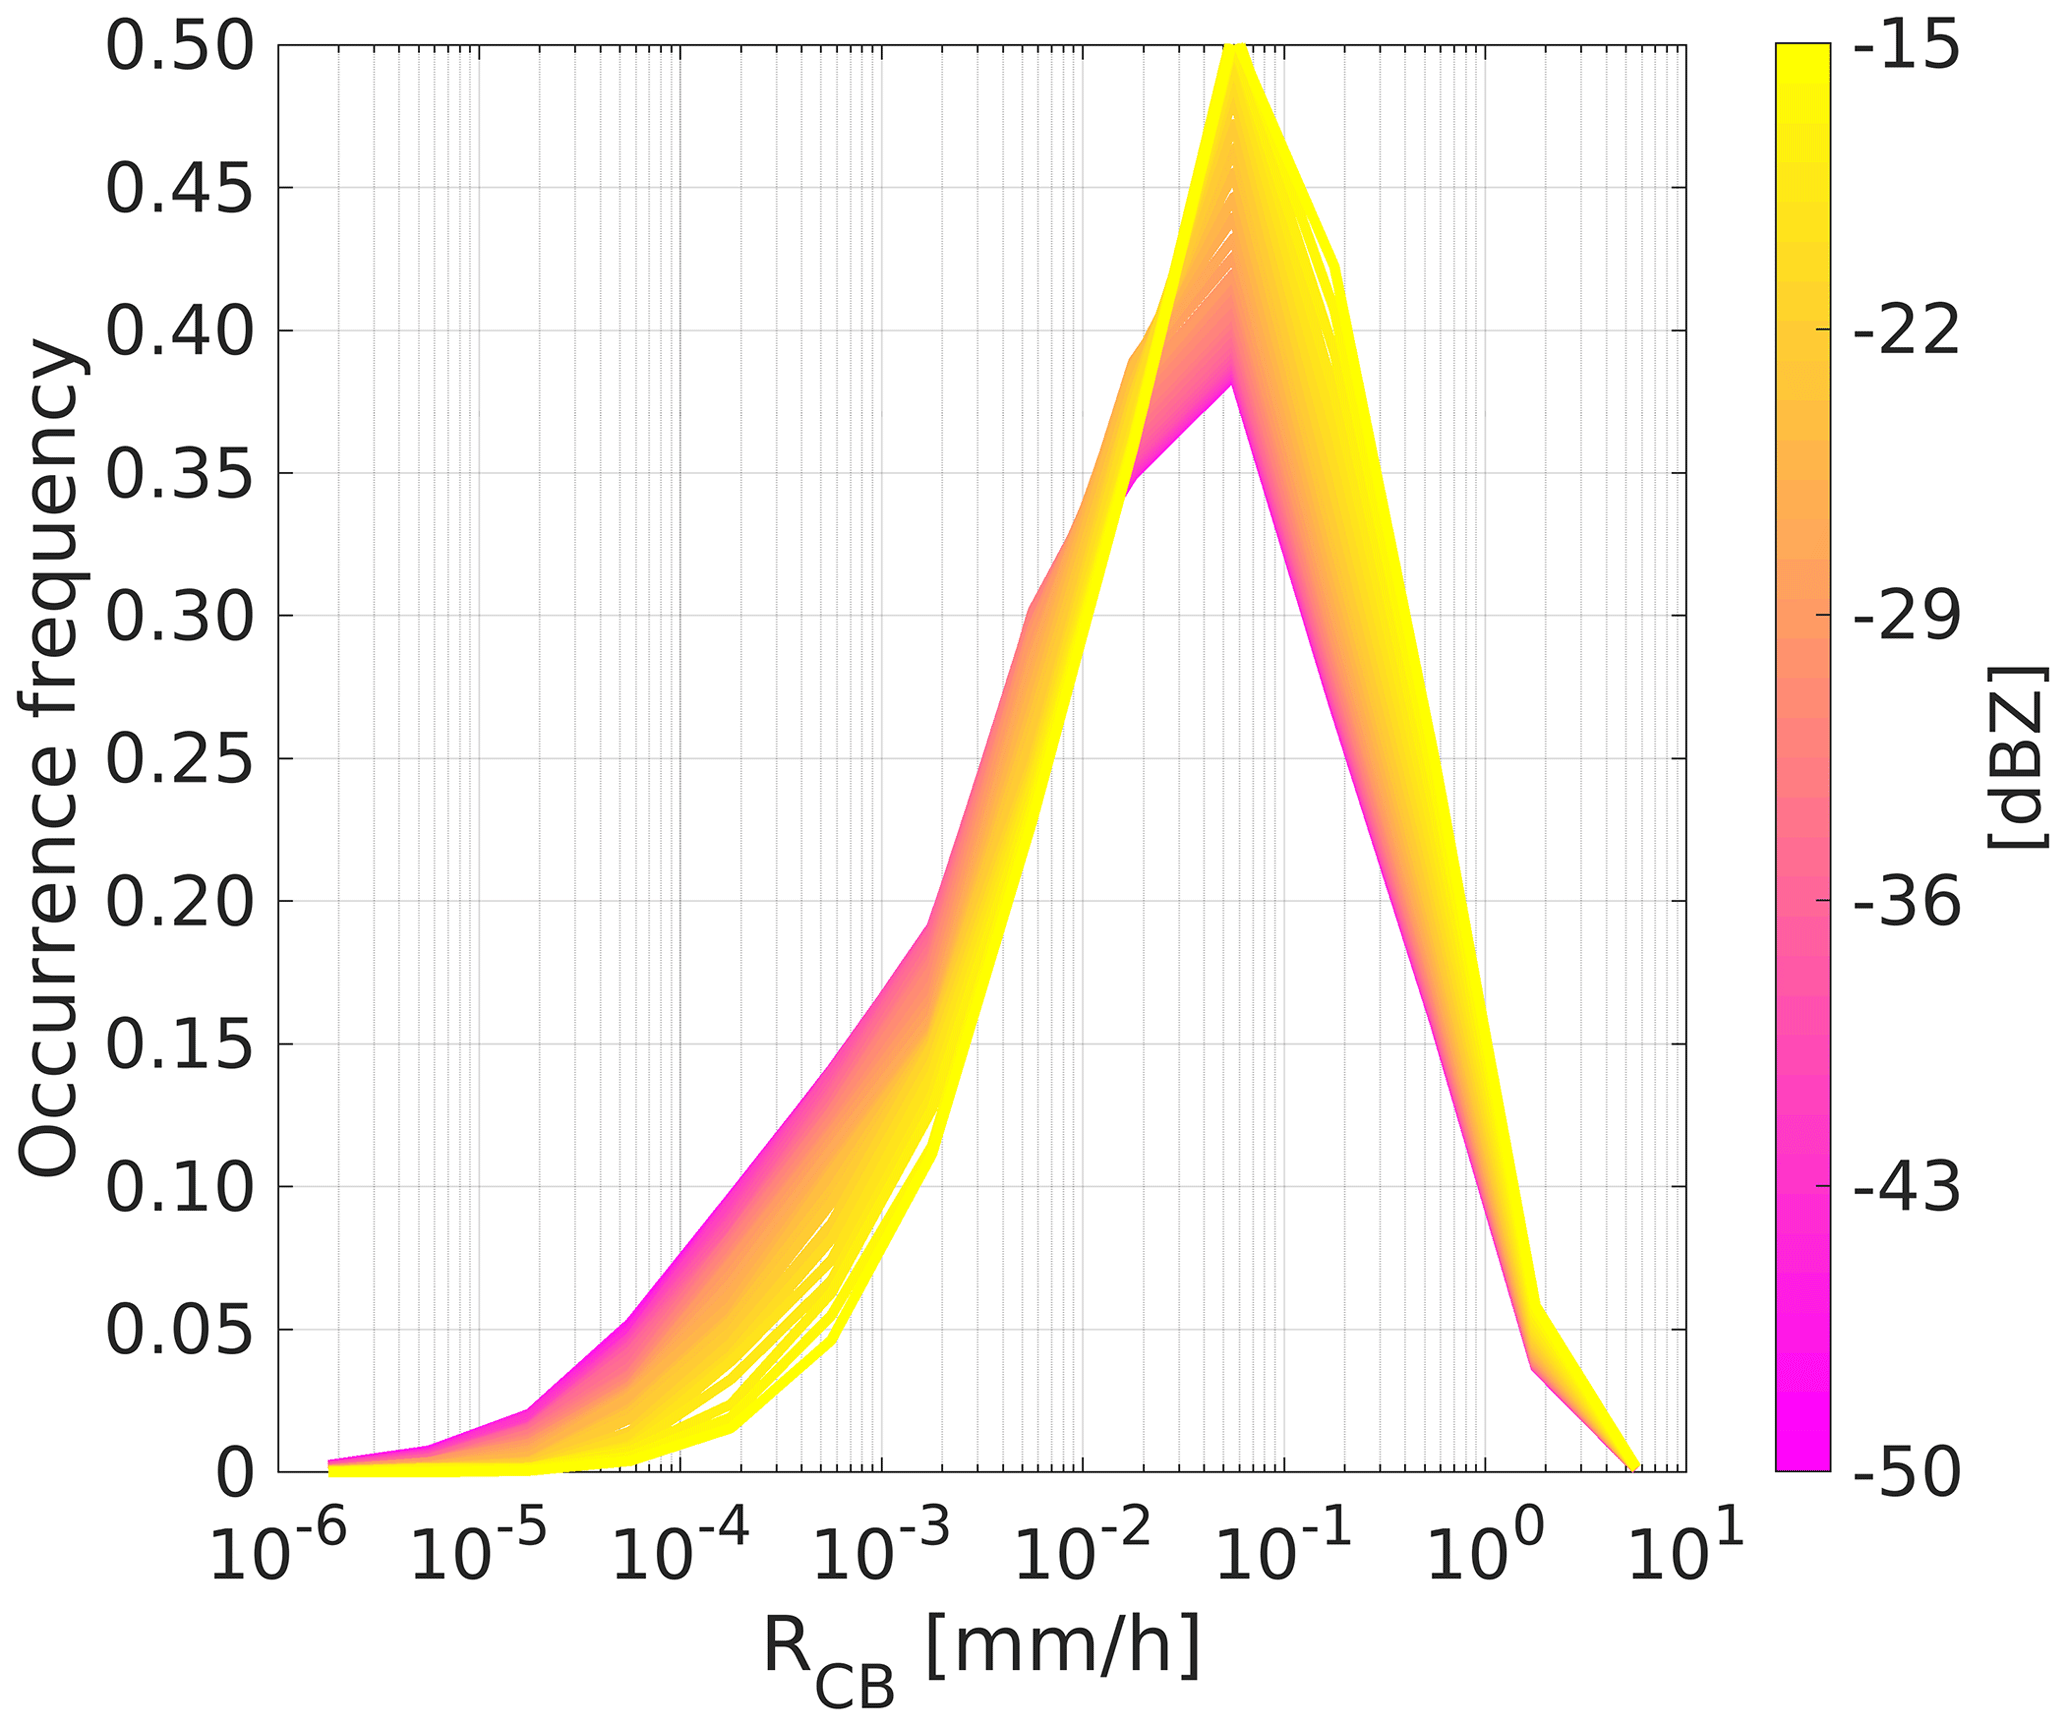
Figure C3The PDF of RCB over the NSA using different values of at 1 km (color scale). See Appendix C for discussion.
Figure C3 depicts the RCB PDF using different values ranging from −50 dBZ (NSA KAZR sensitivity) to −15 dBZ. When the value is reduced, the PDF peak remains constant at 0.05 mm/h, whereas the left PDF tail approaches saturation. These results indicate that there are likely some undetectable weakly precipitating cases owing to radar sensitivity limitations (as exemplified in Figs. C1 and C2). However, the consistency of these patterns and the apparent left PDF tail saturation suggest that (1) there is an upper limit to additional information about existing hydrometeors that radars with higher sensitivities than KAZR may add, and (2) at least in the case of supercooled clouds over the NSA, the KAZR results presented here do approach that limit.
Figure D1 indicates that more than 80 % (90 %) of all precipitating supercooled clouds detected over the NSA (McMurdo) show an increase in Ze between 60 and 150 m below cloud base, thereby providing a lower limit to the presence of precipitating ice. This diagnostic does not rule out the presence of drizzle in ice-bearing air volumes even under highly supercooled conditions (e.g., Silber et al., 2019a), and we expect drizzle exclusively only at the greatest supercooled cloud top temperatures (e.g., Rangno and Hobbs, 2001).
The remaining cases, wherein Ze decreases at altitudes located more than 60 m below cloud base, indicate either sub-saturated conditions with respect to ice resulting in ice sublimation or the presence of precipitating drops; both of these options become more probable under warmer conditions. We note that the slight increase near 0 ∘C over the NSA is likely the result of melting layers producing Ze enhancements (e.g., Lawson and Zuidema, 2009; Li and Moisseev, 2020). Below the cloud top temperature of ∘C, essentially all the detected precipitation-containing air volumes over both sites include ice hydrometeors.
Ice precipitation from supercooled clouds may occasionally produce rather low cloud base Ze (hence, largely low RCB), but ice supersaturated conditions, aggregation, and/or riming in the underlying atmosphere can promote Ze values that are high enough to be considered as precipitation by other Ze-dependent definitions such as those used in satellite retrievals. Figure D2 provides an example of such a case detected over the NSA on 19 January 2015, between 01:00 and 02:00 UTC. Lack of convergence in MWR LWP retrievals throughout this event suggest that the actual LWP could be well below the retrieval uncertainty level. Without seeding ice directly above, it can be deduced that the origin of the ice precipitation in this case is the tenuous liquid-bearing layer detected at ∼2 km, and hence the precipitation is ultimately attributable to this layer (no liquid, no ice). The cloud base Ze is on the order of −43 to −35 dBZ, corresponding with at 2 km over the NSA (see Fig. A1). Nonetheless, continuous ice growth occurs below cloud base owing to the relatively consistent ice supersaturated conditions (RHi >100 %) indicated by the sounding profiles from 2 (4) h prior (following) the examined period (not shown). The KAZR GE spectra profile (right panel) further supports continuous ice growth at the very least down to ∼900 m, where there is an indication of vertical shear of the horizontal wind. We note that Ze in the lowest KAZR GE range gate (∼170 m) ranges between −15 and +3 dBZ during the examined hour (not shown), which would have likely been considered as “certain snowfall” by satellite retrievals (if they were not affected by ground clutter at these low heights), as would most profiles up to 1200 m (just above CPR retrievals' blind zone).

Figure D1Fraction of detected precipitating supercooled clouds over McMurdo Station and the NSA in which Ze increases between 60 and 150 m below cloud base, as a function of upper TCT limit, i.e., including all precipitating supercooled clouds with TCT up to the x axis values (bin widths of 2.5 ∘C). See Appendix D for discussion.
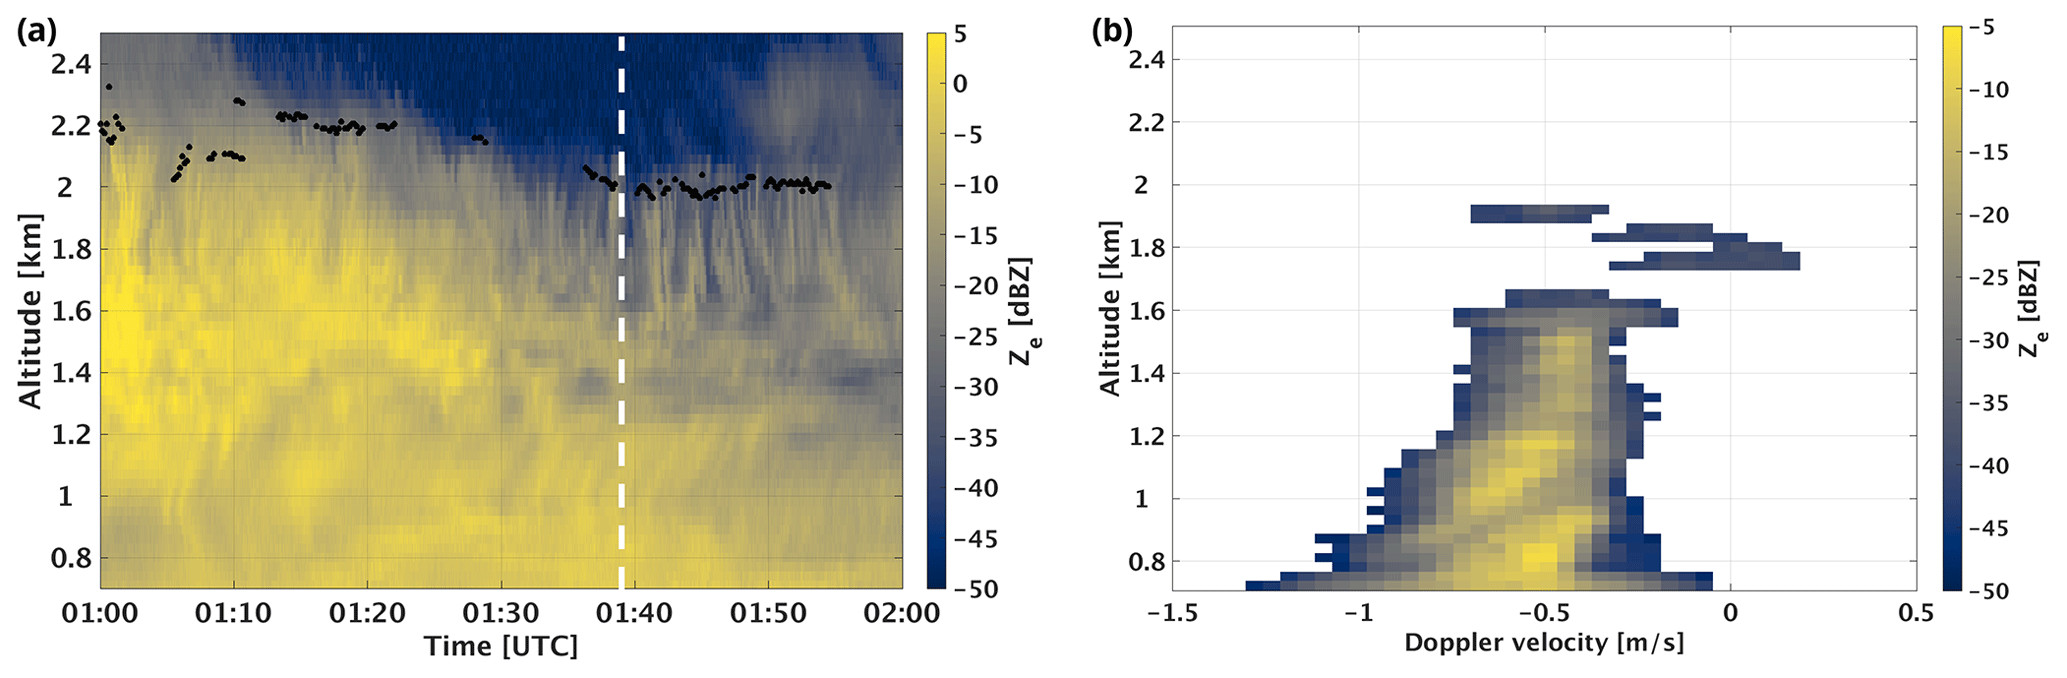
Figure D2(a) KAZR MD mode Ze over the NSA on 19 January 2015 between 01:00 and 02:00 UTC. Black dots designate the HSRL liquid cloud base height data product. (b) KAZR GE spectra profile at 01:39:02 UTC (designated by the dashed white line in the left panel). See Appendix D for discussion.
MWR retrievals (ARM user facility, 2011a, 2016), KAZR raw spectra and moment data (ARM user facility, 2011b, c, d, 2014a, b, 2015a, b), sounding measurements (ARM user facility, 2002, 2015c), and the HSRL liquid cloud base height data product present in Appendix C (Silber et al., 2018b, 2019c), are available in the ARM data archive (http://www.archive.arm.gov, last access: 21 October 2019).
IS conceptualized the study, developed the methodology, performed the formal analysis, and prepared the manuscript. AMF contributed to study conceptualization and manuscript preparation. JV contributed to study conceptualization and development of the methodology and reviewed and edited the manuscript. ASA, GVC, and DAK critically reviewed and edited the manuscript.
Daniel A. Knopf is on the editorial board of Atmospheric Chemistry and Physics.
We thank Tristan L'Ecuyer and Maria Cadeddu for helpful discussions. Israel Silber and Johannes Verlinde are supported by the DOE grant DE-SC0017981. Israel Silber is also supported by DOE grant DE-SC0018046. Daniel A. Knopf acknowledges support by the DOE grants DE-SC0020006 and DE-SC0021034 and NASA award NNX17AJ12G. Ann M. Fridlind and Andrew S. Ackerman are supported by the NASA Radiation Science and Modeling, Analysis and Prediction programs. Grégory V. Cesana is supported by a CloudSat-CALIPSO RTOP at the NASA Goddard Institute for Space Studies.
This research has been supported by the U.S. Department of Energy (grant nos. DE-SC0017981, DE-SC0018046, DE-SC0020006, and DE-SC0021034) and the National Aeronautics and Space Administration (grant no. NNX17AJ12G).
This paper was edited by Corinna Hoose and reviewed by two anonymous referees.
Alpert, P. A., Aller, J. Y., and Knopf, D. A.: Initiation of the ice phase by marine biogenic surfaces in supersaturated gas and supercooled aqueous phases, Phys. Chem. Chem. Phys., 13, 19882–19894, https://doi.org/10.1039/C1CP21844A, 2011.
Atmospheric Radiation Measurement (ARM) user facility: Balloon-Borne Sounding System (SONDEWNPN). 2011-11-01 to 2019-04-30, North Slope Alaska (NSA) Central Facility, Barrow AK (C1), compiled by: Keeler, E., Ritsche, M., Coulter, R., Kyrouac, J., and Holdridge, D., ARM Data Center, https://doi.org/10.5439/1021460, 2002.
Atmospheric Radiation Measurement (ARM) user facility: MWR Retrievals (MWRRET1LILJCLOU). 2011-11-01 to 2019-04-30, North Slope Alaska (NSA) Central Facility, Barrow AK (C1), compiled by: Gaustad, K., Riihimaki, L., and Zhang, D., ARM Data Center, https://doi.org/10.5439/1285691, 2011a.
Atmospheric Radiation Measurement (ARM) user facility: KAZR Corrected Data (KAZRCORGE). 2011-11-11 to 2014-02-07, North Slope Alaska (NSA) Central Facility, Barrow AK (C1), compiled by: Johnson, K., Toto, T., and Jensen, M., ARM Data Center, https://doi.org/10.5439/1228770, 2011b.
Atmospheric Radiation Measurement (ARM) user facility: KAZR Corrected Data (KAZRCORMD). 2011-11-11 to 2014-02-07, North Slope Alaska (NSA) Central Facility, Barrow AK (C1), compiled by: Giangrande, S., ARM Data Center, https://doi.org/10.5439/1350634, 2011c.
Atmospheric Radiation Measurement (ARM) user facility: Ka ARM Zenith Radar (KAZRSPECCMASKGECOPOL). 2015-01-19 to 2015-01-20, North Slope Alaska (NSA) Central Facility, Barrow AK (C1), compiled by: Lindenmaier, I., Bharadwaj, N., Johnson, K., Nelson, D., Isom, B., Hardin, J., Matthews, A., Wendler, T., and Castro, V., ARM Data Center, https://doi.org/10.5439/1025218, 2011d.
Atmospheric Radiation Measurement (ARM) user facility: KAZR Corrected Data (KAZRCORGE). 2014-02-08 to 2019-04-30, North Slope Alaska (NSA) Central Facility, Barrow AK (C1), compiled by: Johnson, K., Toto, T., and Giangrande, S., ARM Data Center, https://doi.org/10.5439/1389054, 2014a.
Atmospheric Radiation Measurement (ARM) user facility: KAZR Corrected Data (KAZRCORMD). 2014-02-08 to 2019-04-30, North Slope Alaska (NSA) Central Facility, Barrow AK (C1), compiled by: Fairless, T., Giangrande, S., and Johnson, K., ARM Data Center, https://doi.org/10.5439/1350634, 2014b.
Atmospheric Radiation Measurement (ARM) user facility: KAZR Corrected Data (KAZRCORGE). 2015-11-18 to 2017-01-02, ARM Mobile Facility (AWR) McMurdo Station Ross Ice Shelf, Antarctica; AMF2 (M1), compiled by: Johnson, K., Toto, T., and Giangrande, S., ARM Data Center, https://doi.org/10.5439/1389054, 2015a.
Atmospheric Radiation Measurement (ARM) user facility: KAZR Corrected Data (KAZRCORMD). 2015-11-17 to 2017-01-02, ARM Mobile Facility (AWR) McMurdo Station Ross Ice Shelf, Antarctica; AMF2 (M1), compiled by: Giangrande, S., ARM Data Center, https://doi.org/10.5439/1350634, 2015b.
Atmospheric Radiation Measurement (ARM) user facility: Balloon-Borne Sounding System (SONDEWNPN). 2015-11-30 to 2017-01-03, ARM Mobile Facility (AWR) McMurdo Station Ross Ice Shelf, Antarctica; AMF2 (M1), compiled by: Keeler, E., Coulter, R., and Kyrouac, J., ARM Data Center, https://doi.org/10.5439/1021460, 2015c.
Atmospheric Radiation Measurement (ARM) user facility: MWR Retrievals (MWRRET1LILJCLOU). 2016-01-30 to 2017-01-01, ARM Mobile Facility (AWR) McMurdo Station Ross Ice Shelf, Antarctica; AMF2 (M1), compiled by: Zhang, D., ARM Data Center, https://doi.org/10.5439/1027369, 2016.
Avramov, A., Ackerman, A. S., Fridlind, A. M., van Diedenhoven, B., Botta, G., Aydin, K., Verlinde, J., Korolev, A. V, Strapp, J. W., McFarquhar, G. M., Jackson, R., Brooks, S. D., Glen, A., and Wolde, M.: Toward ice formation closure in Arctic mixed-phase boundary layer clouds during ISDAC, J. Geophys. Res.-Atmos., 116, D00T08, https://doi.org/10.1029/2011JD015910, 2011.
Belosi, F., Santachiara, G., and Prodi, F.: Ice-forming nuclei in Antarctica: New and past measurements, Atmos. Res., 145–146, 105–111, https://doi.org/10.1016/j.atmosres.2014.03.030, 2014.
Bennartz, R., Fell, F., Pettersen, C., Shupe, M. D., and Schuettemeyer, D.: Spatial and temporal variability of snowfall over Greenland from CloudSat observations, Atmos. Chem. Phys., 19, 8101–8121, https://doi.org/10.5194/acp-19-8101-2019, 2019.
Bromwich, D. H., Nicolas, J. P., Hines, K. M., Kay, J. E., Key, E. L., Lazzara, M. A., Lubin, D., McFarquhar, G. M., Gorodetskaya, I. V., Grosvenor, D. P., Lachlan-Cope, T., and van Lipzig, N. P. M.: Tropospheric clouds in Antarctica, Rev. Geophys., 50, RG1004, https://doi.org/10.1029/2011RG000363, 2012.
Bühl, J., Seifert, P., Myagkov, A., and Ansmann, A.: Measuring ice- and liquid-water properties in mixed-phase cloud layers at the Leipzig Cloudnet station, Atmos. Chem. Phys., 16, 10609–10620, https://doi.org/10.5194/acp-16-10609-2016, 2016.
Cadeddu, M. P., Payne, V. H., Clough, S. A., Cady-Pereira, K., and Liljegren, J. C.: Effect of the Oxygen Line-Parameter Modeling on Temperature and Humidity Retrievals From Ground-Based Microwave Radiometers, IEEE T. Geosci. Remote, 45, 2216–2223, https://doi.org/10.1109/TGRS.2007.894063, 2007.
Cadeddu, M. P., Turner, D. D., and Liljegren, J. C.: A Neural Network for Real-Time Retrievals of PWV and LWP From Arctic Millimeter-Wave Ground-Based Observations, IEEE T. Geosci. Remote, 47, 1887–1900, https://doi.org/10.1109/TGRS.2009.2013205, 2009.
Cadeddu, M. P., Liljegren, J. C., and Turner, D. D.: The Atmospheric radiation measurement (ARM) program network of microwave radiometers: instrumentation, data, and retrievals, Atmos. Meas. Tech., 6, 2359–2372, https://doi.org/10.5194/amt-6-2359-2013, 2013.
Castellani, B. B., Shupe, M. D., Hudak, D. R., and Sheppard, B. E.: The annual cycle of snowfall at Summit, Greenland, J. Geophys. Res.-Atmos., 120, 6654–6668, https://doi.org/10.1002/2015JD023072, 2015.
Cesana, G., Waliser, D. E., Jiang, X., and Li, J.-L. F.: Multimodel evaluation of cloud phase transition using satellite and reanalysis data, J. Geophys. Res.-Atmos., 120, 7871–7892, https://doi.org/10.1002/2014JD022932, 2015.
Creamean, J. M., Primm, K. M., Tolbert, M. A., Hall, E. G., Wendell, J., Jordan, A., Sheridan, P. J., Smith, J., and Schnell, R. C.: HOVERCAT: a novel aerial system for evaluation of aerosol–cloud interactions, Atmos. Meas. Tech., 11, 3969–3985, https://doi.org/10.5194/amt-11-3969-2018, 2018.
Creamean, J. M., de Boer, G., Telg, H., Mei, F., Dexheimer, D., Shupe, M. D., Solomon, A., and McComiskey, A.: Assessing the vertical structure of Arctic aerosols using balloon-borne measurements, Atmos. Chem. Phys., 21, 1737–1757, https://doi.org/10.5194/acp-21-1737-2021, 2021.
Cronin, T. W. and Tziperman, E.: Low clouds suppress Arctic air formation and amplify high-latitude continental winter warming, P. Natl. Acad. Sci. USA, 112, 11490–11495, https://doi.org/10.1073/pnas.1510937112, 2015.
de Boer, G., Morrison, H., Shupe, M. D., and Hildner, R.: Evidence of liquid dependent ice nucleation in high-latitude stratiform clouds from surface remote sensors, Geophys. Res. Lett., 38, L01803, https://doi.org/10.1029/2010GL046016, 2011.
DeMott, P. J.: Measurements and analysis of ice nuclei relevant to west coast U.S. precipitation, DOE-CSU-14354, Department of Energy, United States, 2019.
DeMott, P. J., Prenni, A. J., Liu, X., Kreidenweis, S. M., Petters, M. D., Twohy, C. H., Richardson, M. S., Eidhammer, T., and Rogers, D. C.: Predicting global atmospheric ice nuclei distributions and their impacts on climate, P. Natl. Acad. Sci. USA, 107, 11217–11222, https://doi.org/10.1073/pnas.0910818107, 2010.
Dong, X., Xi, B., Crosby, K., Long, C. N., Stone, R. S., and Shupe, M. D.: A 10 year climatology of Arctic cloud fraction and radiative forcing at Barrow, Alaska, J. Geophys. Res.-Atmos., 115, D17212, https://doi.org/10.1029/2009JD013489, 2010.
Edel, L., Claud, C., Genthon, C., Palerme, C., Wood, N., L'Ecuyer, T., and Bromwich, D.: Arctic Snowfall from CloudSat Observations and Reanalyses, J. Climate, 33, 2093–2109, https://doi.org/10.1175/JCLI-D-19-0105.1, 2020.
Eloranta, E. W.: High spectral resolution lidar, in: Lidar: Range-Resolved Optical Remote Sensing of the Atmosphere, Springer New York, New York, NY, 143–163, 2005.
Fountain, A. G. and Ohtake, T.: Concentrations and Source Areas of Ice Nuclei in the Alaskan Atmosphere, J. Clim. Appl. Meteorol., 24, 377–382, https://doi.org/10.1175/1520-0450(1985)024<0377:CASAOI>2.0.CO;2, 1985.
Fridlind, A. M. and Ackerman, A. S.: Simulations of Arctic Mixed-Phase Boundary Layer Clouds: Advances in Understanding and Outstanding Questions, in Mixed-Phase Clouds Observations and Modeling, edited by: Andronache, C., Elsevier, Amsterdam, the Netherlands, 153–183, 2018.
Fridlind, A. M., van Diedenhoven, B., Ackerman, A. S., Avramov, A., Mrowiec, A., Morrison, H., Zuidema, P., and Shupe, M. D.: A FIRE-ACE/SHEBA Case Study of Mixed-Phase Arctic Boundary Layer Clouds: Entrainment Rate Limitations on Rapid Primary Ice Nucleation Processes, J. Atmos. Sci., 69, 365–389, https://doi.org/10.1175/JAS-D-11-052.1, 2012.
Fukuta, N. and Takahashi, T.: The Growth of Atmospheric Ice Crystals: A Summary of Findings in Vertical Supercooled Cloud Tunnel Studies, J. Atmos. Sci., 56, 1963–1979, https://doi.org/10.1175/1520-0469(1999)056<1963:TGOAIC>2.0.CO;2, 1999.
Grazioli, J., Madeleine, J.-B., Gallée, H., Forbes, R. M., Genthon, C., Krinner, G., and Berne, A.: Katabatic winds diminish precipitation contribution to the Antarctic ice mass balance, P. Natl. Acad. Sci. USA, 114, 10858–10863, https://doi.org/10.1073/pnas.1707633114, 2017.
Hallett, J. and Mossop, S. C.: Production of secondary ice particles during the riming process, Nature, 249, 26–28, https://doi.org/10.1038/249026a0, 1974.
Hamada, A. and Takayabu, Y. N.: Improvements in Detection of Light Precipitation with the Global Precipitation Measurement Dual-Frequency Precipitation Radar (GPM DPR), J. Atmos. Ocean. Tech., 33, 653–667, https://doi.org/10.1175/JTECH-D-15-0097.1, 2016.
Haynes, J. M., L'Ecuyer, T. S., Stephens, G. L., Miller, S. D., Mitrescu, C., Wood, N. B., and Tanelli, S.: Rainfall retrieval over the ocean with spaceborne W-band radar, J. Geophys. Res.-Atmos., 114, D00A22, https://doi.org/10.1029/2008JD009973, 2009.
Hegg, D. A. and Baker, M. B.: Nucleation in the atmosphere, Rep. Prog. Phys., 72, 56801, https://doi.org/10.1088/0034-4885/72/5/056801, 2009.
Heymsfield, A. J., Protat, A., Bouniol, D., Austin, R. T., Hogan, R. J., Delanoë, J., Okamoto, H., Sato, K., van Zadelhoff, G.-J., Donovan, D. P., and Wang, Z.: Testing IWC Retrieval Methods Using Radar and Ancillary Measurements with In Situ Data, J. Appl. Meteorol. Climatol., 47, 135–163, https://doi.org/10.1175/2007JAMC1606.1, 2008.
Hogan, R. J., Mittermaier, M. P., and Illingworth, A. J.: The Retrieval of Ice Water Content from Radar Reflectivity Factor and Temperature and Its Use in Evaluating a Mesoscale Model, J. Appl. Meteorol. Climatol., 45, 301–317, https://doi.org/10.1175/JAM2340.1, 2006.
Holdridge, D., Ritsche, M., Prell, J., and Coulter, R.: Balloon-Borne Sounding System (SONDE) Handbook, ARM-TR-029, DOE Office of Science, Office of Biological and Environmental Research, United States, 2011.
Hou, A. Y., Kakar, R. K., Neeck, S., Azarbarzin, A. A., Kummerow, C. D., Kojima, M., Oki, R., Nakamura, K., and Iguchi, T.: The Global Precipitation Measurement Mission, B. Am. Meteorol. Soc., 95, 701–722, https://doi.org/10.1175/BAMS-D-13-00164.1, 2013.
Illingworth, A. J., Barker, H. W., Beljaars, A., Ceccaldi, M., Chepfer, H., Clerbaux, N., Cole, J., Delanoë, J., Domenech, C., Donovan, D. P., Fukuda, S., Hirakata, M., Hogan, R. J., Huenerbein, A., Kollias, P., Kubota, T., Nakajima, T., Nakajima, T. Y., Nishizawa, T., Ohno, Y., Okamoto, H., Oki, R., Sato, K., Satoh, M., Shephard, M. W., Velázquez-Blázquez, A., Wandinger, U., Wehr, T., and van Zadelhoff, G.-J.: The EarthCARE Satellite: The Next Step Forward in Global Measurements of Clouds, Aerosols, Precipitation, and Radiation, B. Am. Meteorol. Soc., 96, 1311–1332, https://doi.org/10.1175/BAMS-D-12-00227.1, 2015.
Kanji, Z. A., Ladino, L. A., Wex, H., Boose, Y., Burkert-Kohn, M., Cziczo, D. J., and Krämer, M.: Overview of Ice Nucleating Particles, Meteorol. Monogr., 58, 1.1–1.33, https://doi.org/10.1175/AMSMONOGRAPHS-D-16-0006.1, 2017.
Kay, J. E., L'Ecuyer, T., Pendergrass, A., Chepfer, H., Guzman, R., and Yettella, V.: Scale-Aware and Definition-Aware Evaluation of Modeled Near-Surface Precipitation Frequency Using CloudSat Observations, J. Geophys. Res.-Atmos., 123, 4294–4309, https://doi.org/10.1002/2017JD028213, 2018.
Knopf, D. A., Alpert, P. A., and Wang, B.: The Role of Organic Aerosol in Atmospheric Ice Nucleation: A Review, ACS Earth Space Chem., 2, 168–202, https://doi.org/10.1021/acsearthspacechem.7b00120, 2018.
Kollias, P., Tanelli, S., Battaglia, A., and Tatarevic, A.: Evaluation of EarthCARE Cloud Profiling Radar Doppler Velocity Measurements in Particle Sedimentation Regimes, J. Atmos. Ocean. Tech., 31, 366–386, https://doi.org/10.1175/JTECH-D-11-00202.1, 2014.
Kollias, P., Puigdomènech Treserras, B., and Protat, A.: Calibration of the 2007–2017 record of Atmospheric Radiation Measurements cloud radar observations using CloudSat, Atmos. Meas. Tech., 12, 4949–4964, https://doi.org/10.5194/amt-12-4949-2019, 2019.
Korolev, A., Heckman, I., Wolde, M., Ackerman, A. S., Fridlind, A. M., Ladino, L. A., Lawson, R. P., Milbrandt, J., and Williams, E.: A new look at the environmental conditions favorable to secondary ice production, Atmos. Chem. Phys., 20, 1391–1429, https://doi.org/10.5194/acp-20-1391-2020, 2020.
Kulie, M. S. and Bennartz, R.: Utilizing Spaceborne Radars to Retrieve Dry Snowfall, J. Appl. Meteorol. Climatol., 48, 2564–2580, https://doi.org/10.1175/2009JAMC2193.1, 2009.
Lamer, K., Puigdomènech Treserras, B., Zhu, Z., Isom, B., Bharadwaj, N., and Kollias, P.: Characterization of shallow oceanic precipitation using profiling and scanning radar observations at the Eastern North Atlantic ARM observatory, Atmos. Meas. Tech., 12, 4931–4947, https://doi.org/10.5194/amt-12-4931-2019, 2019.
Lamer, K., Kollias, P., Battaglia, A., and Preval, S.: Mind the gap – Part 1: Accurately locating warm marine boundary layer clouds and precipitation using spaceborne radars, Atmos. Meas. Tech., 13, 2363–2379, https://doi.org/10.5194/amt-13-2363-2020, 2020.
Lauber, A., Kiselev, A., Pander, T., Handmann, P., and Leisner, T.: Secondary Ice Formation during Freezing of Levitated Droplets, J. Atmos. Sci., 75, 2815–2826, https://doi.org/10.1175/JAS-D-18-0052.1, 2018.
Lawson, R. P. and Zuidema, P.: Aircraft Microphysical and Surface-Based Radar Observations of Summertime Arctic Clouds, J. Atmos. Sci., 66, 3505–3529, https://doi.org/10.1175/2009JAS3177.1, 2009.
Lemonnier, F., Madeleine, J.-B., Claud, C., Palerme, C., Genthon, C., L'Ecuyer, T., and Wood, N. B.: CloudSat-Inferred Vertical Structure of Snowfall Over the Antarctic Continent, J. Geophys. Res.-Atmos., 125, e2019JD031399, https://doi.org/10.1029/2019JD031399, 2020.
Li, H. and Moisseev, D.: Two Layers of Melting Ice Particles Within a Single Radar Bright Band: Interpretation and Implications, Geophys. Res. Lett., 47, e2020GL087499, https://doi.org/10.1029/2020GL087499, 2020.
Lubin, D., Zhang, D., Silber, I., Scott, R. C., Kalogeras, P., Battaglia, A., Bromwich, D. H., Cadeddu, M., Eloranta, E., Fridlind, A., Frossard, A., Hines, K. M., Kneifel, S., Leaitch, W. R., Lin, W., Nicolas, J., Powers, H., Quinn, P. K., Rowe, P., Russell, L. M., Sharma, S., Verlinde, J., and Vogelmann, A. M.: AWARE: The Atmospheric Radiation Measurement (ARM) West Antarctic Radiation Experiment, B. Am. Meteorol. Soc., 101, E1069–E1091, https://doi.org/10.1175/BAMS-D-18-0278.1, 2020.
Maahn, M., Burgard, C., Crewell, S., Gorodetskaya, I. V, Kneifel, S., Lhermitte, S., Van Tricht, K., and van Lipzig, N. P. M.: How does the spaceborne radar blind zone affect derived surface snowfall statistics in polar regions?, J. Geophys. Res.-Atmos., 119, 13604–13620, https://doi.org/10.1002/2014JD022079, 2014.
Matrosov, S. Y.: Modeling Backscatter Properties of Snowfall at Millimeter Wavelengths, J. Atmos. Sci., 64, 1727–1736, https://doi.org/10.1175/JAS3904.1, 2007.
McCoy, D. T., Hartmann, D. L., and Grosvenor, D. P.: Observed Southern Ocean Cloud Properties and Shortwave Reflection. Part II: Phase Changes and Low Cloud Feedback, J. Climate, 27, 8858–8868, https://doi.org/10.1175/JCLI-D-14-00288.1, 2014.
McCoy, D. T., Hartmann, D. L., Zelinka, M. D., Ceppi, P., and Grosvenor, D. P.: Mixed-phase cloud physics and Southern Ocean cloud feedback in climate models, J. Geophys. Res.-Atmos., 120, 9539–9554, https://doi.org/10.1002/2015JD023603, 2015.
McIlhattan, E. A., L'Ecuyer, T. S., and Miller, N. B.: Observational Evidence Linking Arctic Supercooled Liquid Cloud Biases in CESM to Snowfall Processes, J. Climate, 30, 4477–4495, https://doi.org/10.1175/JCLI-D-16-0666.1, 2017.
Miller, N. B., Shupe, M. D., Cox, C. J., Walden, V. P., Turner, D. D., and Steffen, K.: Cloud Radiative Forcing at Summit, Greenland, J. Climate, 28, 6267–6280, https://doi.org/10.1175/JCLI-D-15-0076.1, 2015.
Morris, V. R.: Microwave radiometer (MWR) handbook, ARM-TR-016, DOE Office of Science, Office of Biological and Environmental Research, United States Department of Energy, United States, 2006.
Morrison, H., Zuidema, P., Ackerman, A. S., Avramov, A., de Boer, G., Fan, J., Fridlind, A. M., Hashino, T., Harrington, J. Y., Luo, Y., Ovchinnikov, M., and Shipway, B.: Intercomparison of cloud model simulations of Arctic mixed-phase boundary layer clouds observed during SHEBA/FIRE-ACE, J. Adv. Model. Earth Sy., 3, M05001, https://doi.org/10.1029/2011MS000066, 2011.
Mülmenstädt, J., Nam, C., Salzmann, M., Kretzschmar, J., L'Ecuyer, T. S., Lohmann, U., Ma, P.-L., Myhre, G., Neubauer, D., Stier, P., Suzuki, K., Wang, M., and Quaas, J.: Reducing the aerosol forcing uncertainty using observational constraints on warm rain processes, Sci. Adv., 6, eaaz6433, https://doi.org/10.1126/sciadv.aaz6433, 2020.
Nomokonova, T., Ebell, K., Löhnert, U., Maturilli, M., Ritter, C., and O'Connor, E.: Statistics on clouds and their relation to thermodynamic conditions at Ny-Ålesund using ground-based sensor synergy, Atmos. Chem. Phys., 19, 4105–4126, https://doi.org/10.5194/acp-19-4105-2019, 2019.
Ovchinnikov, M., Ackerman, A. S., Avramov, A., Cheng, A., Fan, J., Fridlind, A. M., Ghan, S., Harrington, J., Hoose, C., Korolev, A., McFarquhar, G. M., Morrison, H., Paukert, M., Savre, J., Shipway, B. J., Shupe, M. D., Solomon, A., and Sulia, K.: Intercomparison of large-eddy simulations of Arctic mixed-phase clouds: Importance of ice size distribution assumptions, J. Adv. Model. Earth Sy., 6, 223–248, https://doi.org/10.1002/2013MS000282, 2014.
Pettersen, C., Bennartz, R., Merrelli, A. J., Shupe, M. D., Turner, D. D., and Walden, V. P.: Precipitation regimes over central Greenland inferred from 5 years of ICECAPS observations, Atmos. Chem. Phys., 18, 4715–4735, https://doi.org/10.5194/acp-18-4715-2018, 2018.
Pinsky, M., Khain, A., and Korolev, A.: Phase transformations in an ascending adiabatic mixed-phase cloud volume, J. Geophys. Res.-Atmos., 120, 3329–3353, https://doi.org/10.1002/2015JD023094, 2015.
Pithan, F., Svensson, G., Caballero, R., Chechin, D., Cronin, T. W., Ekman, A. M. L., Neggers, R., Shupe, M. D., Solomon, A., Tjernström, M., and Wendisch, M.: Role of air-mass transformations in exchange between the Arctic and mid-latitudes, Nat. Geosci., 11, 805–812, https://doi.org/10.1038/s41561-018-0234-1, 2018.
Quinn, P. K., Miller, T. L., Bates, T. S., Ogren, J. A., Andrews, E., and Shaw, G. E.: A 3-year record of simultaneously measured aerosol chemical and optical properties at Barrow, Alaska, J. Geophys. Res.-Atmos., 107, AAC 8-1–AAC 8-15, https://doi.org/10.1029/2001JD001248, 2002.
Quinn, P. K., Bates, T. S., Schulz, K., and Shaw, G. E.: Decadal trends in aerosol chemical composition at Barrow, Alaska: 1976–2008, Atmos. Chem. Phys., 9, 8883–8888, https://doi.org/10.5194/acp-9-8883-2009, 2009.
Rangno, A. L. and Hobbs, P. V: Ice particles in stratiform clouds in the Arctic and possible mechanisms for the production of high ice concentrations, J. Geophys. Res.-Atmos., 106, 15065–15075, https://doi.org/10.1029/2000JD900286, 2001.
Scott, R. C. and Lubin, D.: Unique manifestations of mixed-phase cloud microphysics over Ross Island and the Ross Ice Shelf, Antarctica, Geophys. Res. Lett., 43, 2936–2945, https://doi.org/10.1002/2015GL067246, 2016.
Sedlar, J.: Implications of Limited Liquid Water Path on Static Mixing within Arctic Low-Level Clouds, J. Appl. Meteorol. Climatol., 53, 2775–2789, https://doi.org/10.1175/JAMC-D-14-0065.1, 2014.
Sedlar, J. and Shupe, M. D.: Characteristic nature of vertical motions observed in Arctic mixed-phase stratocumulus, Atmos. Chem. Phys., 14, 3461–3478, https://doi.org/10.5194/acp-14-3461-2014, 2014.
Shupe, M. D.: Clouds at Arctic Atmospheric Observatories. Part II: Thermodynamic Phase Characteristics, J. Appl. Meteorol. Climatol., 50, 645–661, https://doi.org/10.1175/2010JAMC2468.1, 2011.
Shupe, M. D. and Intrieri, J. M.: Cloud Radiative Forcing of the Arctic Surface: The Influence of Cloud Properties, Surface Albedo, and Solar Zenith Angle, J. Climate, 17, 616–628, https://doi.org/10.1175/1520-0442(2004)017<0616:CRFOTA>2.0.CO;2, 2004.
Shupe, M. D., Matrosov, S. Y., and Uttal, T.: Arctic mixed-phase cloud properties derived from surface-based sensors at SHEBA, J. Atmos. Sci., 63, 697–711, 2006.
Shupe, M. D., Kollias, P., Persson, P. O. G., and McFarquhar, G. M.: Vertical Motions in Arctic Mixed-Phase Stratiform Clouds, J. Atmos. Sci., 65, 1304–1322, https://doi.org/10.1175/2007JAS2479.1, 2008a.
Shupe, M. D., Kollias, P., Poellot, M., and Eloranta, E.: On Deriving Vertical Air Motions from Cloud Radar Doppler Spectra, J. Atmos. Ocean. Tech., 25, 547–557, https://doi.org/10.1175/2007JTECHA1007.1, 2008b.
Shupe, M. D., Walden, V. P., Eloranta, E., Uttal, T., Campbell, J. R., Starkweather, S. M., and Shiobara, M.: Clouds at Arctic Atmospheric Observatories. Part I: Occurrence and Macrophysical Properties, J. Appl. Meteorol. Climatol., 50, 626–644, https://doi.org/10.1175/2010JAMC2467.1, 2011.
Silber, I., Verlinde, J., Eloranta, E. W., and Cadeddu, M.: Antarctic cloud macrophysical, thermodynamic phase, and atmospheric inversion coupling properties at McMurdo Station. Part I: Principal data processing and climatology, J. Geophys. Res.-Atmos., 123, 6099–6121, https://doi.org/10.1029/2018JD028279, 2018a.
Silber, I., Verlinde, J., Eloranta, E. W., Flynn, C. J., and Flynn, D. M.: HSRL Liquid cloud base height / MPL Liquid cloud base height, DOE ARM Data Archive, https://doi.org/10.5439/1438194, 2018b.
Silber, I., Verlinde, J., Eloranta, E. W., Flynn, C. J., and Flynn, D. M.: Polar liquid cloud base detection algorithms for high spectral resolution or micropulse lidar data, J. Geophys. Res.-Atmos., 123, 4310–4322, https://doi.org/10.1029/2017JD027840, 2018c.
Silber, I., Fridlind, A. M., Verlinde, J., Ackerman, A. S., Chen, Y.-S., Bromwich, D. H., Wang, S.-H., Cadeddu, M., and Eloranta, E. W.: Persistent Supercooled Drizzle at Temperatures below −25 ∘C Observed at McMurdo Station, Antarctica, J. Geophys. Res.-Atmos., 124, 10878–10895, https://doi.org/10.1029/2019JD030882, 2019a.
Silber, I., Verlinde, J., Cadeddu, M., Flynn, C. J., Vogelmann, A. M., and Eloranta, E. W.: Antarctic cloud macrophysical, thermodynamic phase, and atmospheric inversion coupling properties at McMurdo Station. Part II: Radiative impact during different synoptic regimes, J. Geophys. Res.-Atmos., 124, 1697–1719, https://doi.org/10.1029/2018JD029471, 2019b.
Silber, I., Verlinde, J., and Eloranta, E. W.: HSRL Liquid cloud base height (nsaC1), DOE ARM Data Archive, https://doi.org/10.5439/1532341, 2019c.
Silber, I., Verlinde, J., Wang, S.-H., Bromwich, D. H., Fridlind, A. M., Cadeddu, M., and Eloranta, E. W.: Cloud Influence on ERA5 and AMPS Surface Downwelling Longwave Radiation Biases in West Antarctica, J. Climate, 32, 7935–7949, https://doi.org/10.1175/JCLI-D-19-0149.1, 2019d.
Silber, I., Fridlind, A. M., Verlinde, J., Russell, L. M., and Ackerman, A. S.: Nonturbulent Liquid-Bearing Polar Clouds: Observed Frequency of Occurrence and Simulated Sensitivity to Gravity Waves, Geophys. Res. Lett., 47, e2020GL087099, https://doi.org/10.1029/2020GL087099, 2020b.
Silber, I., Verlinde, J., Wen, G., and Eloranta, E. W.: Can Embedded Liquid Cloud Layer Volumes Be Classified in Polar Clouds Using a Single-Frequency Zenith-Pointing Radar?, IEEE Geosci. Remote S., 17, 222–226, https://doi.org/10.1109/LGRS.2019.2918727, 2020a.
Skofronick-Jackson, G., Kulie, M., Milani, L., Munchak, S. J., Wood, N. B., and Levizzani, V.: Satellite Estimation of Falling Snow: A Global Precipitation Measurement (GPM) Core Observatory Perspective, J. Appl. Meteorol. Climatol., 58, 1429–1448, https://doi.org/10.1175/JAMC-D-18-0124.1, 2019.
Smalley, M., L'Ecuyer, T., Lebsock, M., and Haynes, J.: A Comparison of Precipitation Occurrence from the NCEP Stage IV QPE Product and the CloudSat Cloud Profiling Radar, J. Hydrometeorol., 15, 444–458, https://doi.org/10.1175/JHM-D-13-048.1, 2014.
Solomon, A., Shupe, M. D., Persson, P. O. G., and Morrison, H.: Moisture and dynamical interactions maintaining decoupled Arctic mixed-phase stratocumulus in the presence of a humidity inversion, Atmos. Chem. Phys., 11, 10127–10148, https://doi.org/10.5194/acp-11-10127-2011, 2011.
Solomon, A., Feingold, G., and Shupe, M. D.: The role of ice nuclei recycling in the maintenance of cloud ice in Arctic mixed-phase stratocumulus, Atmos. Chem. Phys., 15, 10631–10643, https://doi.org/10.5194/acp-15-10631-2015, 2015.
Souverijns, N., Gossart, A., Lhermitte, S., Gorodetskaya, I. V, Kneifel, S., Maahn, M., Bliven, F. L., and van Lipzig, N. P. M.: Estimating radar reflectivity - Snowfall rate relationships and their uncertainties over Antarctica by combining disdrometer and radar observations, Atmos. Res., 196, 211–223, https://doi.org/10.1016/j.atmosres.2017.06.001, 2017.
Stephens, G. L., Vane, D. G., Boain, R. J., Mace, G. G., Sassen, K., Wang, Z., Illingworth, A. J., O'Connor, E. J., Rossow, W. B., Durden, S. L., Miller, S. D., Austin, R. T., Benedetti, A., Mitrescu, C., and CloudSat Science Team, T.: The Cloudsat Mission and the A-Train, B. Am. Meteorol. Soc., 83, 1771–1790, https://doi.org/10.1175/BAMS-83-12-1771, 2002.
Tan, I. and Storelvmo, T.: Evidence of Strong Contributions From Mixed-Phase Clouds to Arctic Climate Change, Geophys. Res. Lett., 46, 2894–2902, https://doi.org/10.1029/2018GL081871, 2019.
Tan, I., Storelvmo, T., and Zelinka, M. D.: Observational constraints on mixed-phase clouds imply higher climate sensitivity, Science, 352, 224–227, https://doi.org/10.1126/science.aad5300, 2016.
Tanelli, S., Durden, S. L., Im, E., Pak, K. S., Reinke, D. G., Partain, P., Haynes, J. M., and Marchand, R. T.: CloudSat's Cloud Profiling Radar After Two Years in Orbit: Performance, Calibration, and Processing, IEEE T. Geosci. Remote, 46, 3560–3573, https://doi.org/10.1109/TGRS.2008.2002030, 2008.
Tsushima, Y., Emori, S., Ogura, T., Kimoto, M., Webb, M. J., Williams, K. D., Ringer, M. A., Soden, B. J., Li, B., and Andronova, N.: Importance of the mixed-phase cloud distribution in the control climate for assessing the response of clouds to carbon dioxide increase: a multi-model study, Clim. Dyn., 27, 113–126, https://doi.org/10.1007/s00382-006-0127-7, 2006.
Turner, D. D., Clough, S. A., Liljegren, J. C., Clothiaux, E. E., Cady-Pereira, K. E., and Gaustad, K. L.: Retrieving Liquid Water Path and Precipitable Water Vapor From the Atmospheric Radiation Measurement (ARM) Microwave Radiometers, IEEE T. Geosci. Remote, 45, 3680–3690, https://doi.org/10.1109/TGRS.2007.903703, 2007.
Turner, D. D., Shupe, M. D.,and Zwink, A. B.: Characteristic Atmospheric Radiative Heating Rate Profiles in Arctic Clouds as Observed at Barrow, Alaska, J. Appl. Meteorol. Climatol., 57, 953–968, https://doi.org/10.1175/JAMC-D-17-0252.1, 2018.
Ulbrich, C. W.: Natural Variations in the Analytical Form of the Raindrop Size Distribution, J. Appl. Meteorol. Climatol., 22, 1764–1775, https://doi.org/10.1175/1520-0450(1983)022<1764:NVITAF>2.0.CO;2, 1983.
Vali, G., DeMott, P. J., Möhler, O., and Whale, T. F.: Technical Note: A proposal for ice nucleation terminology, Atmos. Chem. Phys., 15, 10263–10270, https://doi.org/10.5194/acp-15-10263-2015, 2015.
Vassel, M., Ickes, L., Maturilli, M., and Hoose, C.: Classification of Arctic multilayer clouds using radiosonde and radar data in Svalbard, Atmos. Chem. Phys., 19, 5111–5126, https://doi.org/10.5194/acp-19-5111-2019, 2019.
Vergara-Temprado, J., Miltenberger, A. K., Furtado, K., Grosvenor, D. P., Shipway, B. J., Hill, A. A., Wilkinson, J. M., Field, P. R., Murray, B. J., and Carslaw, K. S.: Strong control of Southern Ocean cloud reflectivity by ice-nucleating particles, P. Natl. Acad. Sci. USA, 115, 2687–2692, https://doi.org/10.1073/pnas.1721627115, 2018.
Verlinde, J., Rambukkange, M. P., Clothiaux, E. E., McFarquhar, G. M., and Eloranta, E. W.: Arctic multilayered, mixed-phase cloud processes revealed in millimeter-wave cloud radar Doppler spectra, J. Geophys. Res.-Atmos., 118, 13199–13213, https://doi.org/10.1002/2013JD020183, 2013.
Verlinde, J., Zak, B. D., Shupe, M. D., Ivey, M. D., and Stamnes, K.: The ARM North Slope of Alaska (NSA) Sites, Meteorol. Monogr., 57, 8.1–8.13, https://doi.org/10.1175/AMSMONOGRAPHS-D-15-0023.1, 2016.
Villanueva, D., Heinold, B., Seifert, P., Deneke, H., Radenz, M., and Tegen, I.: The day-to-day co-variability between mineral dust and cloud glaciation: a proxy for heterogeneous freezing, Atmos. Chem. Phys., 20, 2177–2199, https://doi.org/10.5194/acp-20-2177-2020, 2020.
Westbrook, C. D. and Illingworth, A. J.: The formation of ice in a long-lived supercooled layer cloud, Q. J. Roy. Meteorol. Soc., 139, 2209–2221, https://doi.org/10.1002/qj.2096, 2013.
Westwater, E. R., Han, Y., Shupe, M. D., and Matrosov, S. Y.: Analysis of integrated cloud liquid and precipitable water vapor retrievals from microwave radiometers during the Surface Heat Budget of the Arctic Ocean project, J. Geophys. Res.-Atmos., 106, 32019–32030, https://doi.org/10.1029/2000JD000055, 2001.
Wex, H., Huang, L., Zhang, W., Hung, H., Traversi, R., Becagli, S., Sheesley, R. J., Moffett, C. E., Barrett, T. E., Bossi, R., Skov, H., Hünerbein, A., Lubitz, J., Löffler, M., Linke, O., Hartmann, M., Herenz, P., and Stratmann, F.: Annual variability of ice-nucleating particle concentrations at different Arctic locations, Atmos. Chem. Phys., 19, 5293–5311, https://doi.org/10.5194/acp-19-5293-2019, 2019.
Widener, K. B., Bharadwaj, N., and Johnson, K.: Ka-Band ARM Zenith Radar (KAZR) Instrument Handbook, ARM-TR-106, DOE Office of Science, Office of Biological and Environmental Research, United States, 2012.
Wood, N. B.: Estimation of snow microphysical properties with application to millimeter-wavelength radar retrievals for snowfall rate, Colorado State University, 2011.
Wood, N. B., L'Ecuyer, T. S., Heymsfield, A. J., Stephens, G. L., Hudak, D. R., and Rodriguez, P.: Estimating snow microphysical properties using collocated multisensor observations, J. Geophys. Res.-Atmos., 119, 8941–8961, https://doi.org/10.1002/2013JD021303, 2014.
Wood, R.: Stratocumulus Clouds, Mon. Weather Rev., 140, 2373–2423, https://doi.org/10.1175/MWR-D-11-00121.1, 2012.
Zhang, D., Wang, Z., and Liu, D.: A global view of midlevel liquid-layer topped stratiform cloud distribution and phase partition from CALIPSO and CloudSat measurements, J. Geophys. Res., 115, D00H13, https://doi.org/10.1029/2009JD012143, 2010.
Zipori, A., Reicher, N., Erel, Y., Rosenfeld, D., Sandler, A., Knopf, D. A., and Rudich, Y.: The Role of Secondary Ice Processes in Midlatitude Continental Clouds, J. Geophys. Res.-Atmos., 123, 12712–62777, https://doi.org/10.1029/2018JD029146, 2018.
- Abstract
- Introduction
- Methodology
- Precipitation statistics
- Reconciling apparent precipitation occurrence
- Guidance for large-scale models
- Discussion
- Conclusions
- Appendix A: Minimum detectable KAZR Ze
- Appendix B: Variability of the PDF of RCB using various parameterizations and hmin values
- Appendix C: KAZR sensitivity limitations and associated examples of apparently non-precipitating cases
- Appendix D: Prevalence and intensification of ice-induced Ze below cloud base
- Data availability
- Author contributions
- Competing interests
- Acknowledgements
- Financial support
- Review statement
- References