the Creative Commons Attribution 4.0 License.
the Creative Commons Attribution 4.0 License.
 | 14 Jan 2021
Measurement report: Changing characteristics of atmospheric CH4 in the Tibetan Plateau: records from 1994 to 2019 at the Mount Waliguan station
Shuo Liu
Shuangxi Fang
Peng Liu
Miao Liang
Minrui Guo
Zhaozhong Feng
A 26-year, long-term record of atmospheric methane (CH4) measured in situ at the Mount Waliguan (WLG) station, the only World Meteorological Organization (WMO) and Global Atmosphere Watch (GAW) global station in inland Eurasia, is presented. Overall, a nearly continuous increase in atmospheric CH4 was observed at WLG, with a yearly growth rate of 5.1±0.1 parts per billion (ppb) per year during 1994–2019, except for some particular periods with near-zero or negative values, e.g., 1999–2000 and 2004–2006. The average CH4 mole fraction was only 1799.0±0.4 ppb in 1994 but increased to about 133 ppb and reached a historic level of 1932.0±0.1 ppb in 2019. The case study in the Tibetan Plateau showed that the atmospheric CH4 increased rapidly. During some special periods, it is even larger than that of city regions (e.g., 6.7±0.2 ppb yr−1 in 2003–2007). Generally, the characteristics of CH4 varied in different observing periods as follows: (i) the diurnal cycle has become apparent and the amplitudes of the diurnal or seasonal cycles increased over time; (ii) the wind sectors with elevated CH4 mole fractions switched from ENE-E-ESE-SE-SSE sectors (wind directions) in early periods to NNE-NE-ENE-E sectors in later years; (iii) the area of source regions increased as the years progressed, and strong sources shifted from northeast (city regions) to southwest (northern India); and (iv) the annual growth rates in recent years (e.g., 2008–2019) were significantly larger than those in the early periods (e.g., 1994–2007).
- Article
(9426 KB) - Full-text XML
-
Supplement
(12340 KB) - BibTeX
- EndNote


Since the preindustrial era, the emission of greenhouse gases (GHGs) has increased continuously, and large increases have been found in recent years, with the concentration now being higher than ever (WMO, 2019). The GHGs perturb the infrared radiation balance, which traps the heat in the atmosphere and contributes to global warming, melting glaciers and causing extreme weather events and many other global climate changes (IPCC, 2014). The recent 30-year span from 1983 to 2012 was the warmest of the last 800 years in the Northern Hemisphere, and half of the rising surface temperatures were due to increased GHG emissions (IPCC, 2014). As one of the most important GHGs, methane (CH4) has a global warming effect that is just less than carbon dioxide (CO2; Etminan et al., 2016). CH4 has an 8–12 year lifetime (Battle et al., 1996), with a global warming potential ∼23 times greater than CO2 over a 100-year horizon (Weber et al., 2019). CH4 also contributed to about 17 % of the radiative forcing caused by long-lived greenhouse gases from 1750 to 2016 (Etminan et al., 2016). Since the beginning of the industrial era, the concentration of CH4 has rapidly increased because of the influence of anthropogenic activities (Saunois et al., 2016). Results from ice cores analyses in Antarctica showed that the atmospheric concentration of CH4 has reached an unprecedented level over the last 0.8 million years (IPCC, 2014).
At the beginning of the 1990s, the CH4 mole fraction showed a decreasing trend. Consequently, the reverse trend has been observed since 1998 due to the higher global mean temperature (Dlugokencky et al., 1998; Nisbet et al., 2014). However, a low growth rate was sustained over 1999 to 2006, except for years with El Niño events (2002–2003; Dlugokencky et al., 1998). The annual growth rate dropped from ∼12 ppb yr−1 to near zero from the late 1980s to 2006, followed by a renewed CH4 increase since then (Nisbet et al., 2019). During 2007–2013, the annual growth rate of methane was 5.7±1.2 ppb yr−1. After 2013, the atmospheric CH4 grew at rates not observed, such as 12.7±0.5 ppb yr−1 in 2014 and 10.1±0.7 ppb yr−1 in 2015 (Nisbet et al., 2016, 2019). In the most recent decade, the global mean growth rate was 7.1 ppb yr−1 (WMO, 2019). The World Meteorological Organization (WMO) and Global Atmospheric Watch (GAW) program's annual greenhouse gas bulletin revealed that the global average mole fraction of CH4 reached a new high of 1869±2 ppb in 2018 (Rubino et al., 2019), which was ∼259 % of preindustrial levels (∼722 ppb around 1750 CE – common era; Etheridge et al., 1998; WMO, 2019).
Atmospheric CH4 is mainly emitted from natural sources (e.g., about 40 % from ruminants and wetlands) and anthropogenic sources (e.g., about 60 % from paddies, cattle ranches, coal mines, fossil fuels, and biomass burning; Hausmann et al., 2016; Saunois et al., 2016). Observations from the GAW indicated that the causes of the recent increase were likely attributed to anthropogenic emissions at midlatitudes in the Northern Hemisphere and the wetlands in the tropics (WMO, 2019). The rapid development of population growth, economic expansion, and urbanization of countries has led to more and more fossil fuel production and consumption (e.g., the large-scale exploitation of natural gas, oil, and coal) and biomass burning. Consequently, large amounts of anthropogenic CH4 were emitted around the world in recent years (Galloway, 1989; Streets and Waldhoff, 2000; Wang et al., 2002; Lin et al., 2014; Hausmann et al., 2016). The recent carbon isotope study revealed that biogenic emissions might also have driven CH4 increases, including microbial sources from rice paddies, ruminants, termites, enteric fermentation, or a combination of these (Nisbet et al., 2016; Schaefer et al., 2016; Wolf et al., 2017). About 90 % of the CH4 destruction in the atmosphere is from the reaction with hydroxyl radicals (•OH; Vaghjiani and Ravishankara, 1991; Bousquet et al., 2011), an important oxidant in the troposphere (Logan et al., 1981). Therefore, the interannual variation in •OH or the decline of the oxidative capacity of the atmosphere may also cause the recent increase in the CH4 growth rates (Rigby et al., 2017; Turner et al., 2017). The exact causes of significant increases in the CH4 emissions in the past years remain debated, especially for the anomalous periods with a sudden, large growth due to the sparse time and space measurements and the crude models, which limited our understanding of the global variation in atmospheric CH4 (Saunois et al., 2019; Weber et al., 2019). As a consequence, it will be impractical to predict CH4 trends in the future and then develop realistic management (Nisbet et al., 2019).
Systematic observations are a prerequisite to obtain an accurate understanding of the spatial and temporal behaviors of atmospheric CH4 concentrations. Since 1978, systematic measurements of atmospheric CH4 have been taken around the world (Blake et al., 1982; Rasmussen and Khalil, 1984; Dlugokencky et al., 1994). On the northern slope of the Mauna Loa volcano, Hawaii, there exists the first global station, Mauna Loa (MLO), which has performed at about 3397 m above sea level (a.s.l.) and far away from local sources and sinks. It has the longest record of continuous atmospheric CH4 observations (Keeling et al., 1976). Recently, other stations have been installed for CH4 observations, such as Barrow (BRW), USA, the South Pole (SPO; polar site; Dlugokencky et al., 1995), Cape Grim (CGO), Australia, and Minamitorishima (MNM), Japan (coastal and island sites; Pearman and Beardsmore, 1984; Wada et al., 2007), Jungfraujoch (JFJ), Switzerland, and Mount Waliguan (WGL), China (continental mountain site; Zhou et al., 2004; Loov et al., 2008). Hundreds of CH4 observation stations worldwide are currently running under the framework of the WMO/GAW.
China has the largest anthropogenic CH4 emissions in the world (Janssens-Maenhout et al., 2019). The Tibetan Plateau, with an average altitude of over 4000 m a.s.l., has long been recognized as the roof of the world. By coincidence, the two largest CH4 source regions in the world (i.e., eastern China and northern India) are trapped in between by the Tibetan Plateau (Zhang et al., 2011; Fu et al., 2012; Wilson and Smith, 2015). Under the characteristics of special geographical conditions, lower population density, rare industrial activities, and high sensitivity to external disturbances, the Tibetan Plateau is one of the ideal regions to observe a continual CH4 signal (Zhou et al., 2005; Fu et al., 2012; Zhang et al., 2013). Most of the previous studies reported on the short-term CH4 variations in China and concluded that the long-term observation is of great value to enhance the understanding of the global carbon cycle (Cai et al., 2000; Zou et al., 2005; Wang et al., 2009; Fang et al., 2013; Yuan et al., 2019). As the rapid development of China and India continues, the characteristics of CH4 on the Tibetan Plateau might change significantly over time. Since 1994, in situ measurements of atmospheric CH4 have been launched at the Mt. Waliguan (WLG) station. To study the long-term variations in the atmospheric CH4 and obtain a new insight on its characteristics in the inland of Eurasia, the performance of 26 years of in situ observations at the Mt. Waliguan baseline observatory were evaluated, which is the longest record in China. Temporal patterns, annual variations, long-term trends, air mass transports, and the spatial distribution of potential sources were analyzed. In addition, the case studies combining atmospheric carbon monoxide (CO) measurements and a separate analysis between the Tibetan Plateau and the city regions were performed to constrain the contribution of anthropogenic emissions.
2.1 Measurement site
The Mt. Waliguan (WLG; 36.28∘ N, 100.09∘ E; 3816 m a.s.l.) station is situated at the edge of northeastern Tibetan (Qinghai-Xizang) Plateau, which is in remote western China and isolated from populated and industrial regions (Fig. 1). WLG is the only WMO/GAW global background station in Eurasia and is run by the China Meteorological Administration (CMA). The surroundings of the site are pristine, with sparse vegetation and naturally arid and semiarid grasslands. Small farms with yak and sheep are in the valley. Two adjacent large cities, namely Xining (∼2.2 million population) and Lanzhou, are located about 90 km northeast and 260 km east of the station, respectively. The Longyangxia hydroelectric station (∼380 km2) is located approximately 13 km south to southwest of WLG. The predominant winds at WLG are mainly from the southwest and east in winter and summer, respectively (Zhou et al., 2004; Zhang et al., 2011), which is controlled by the Tibetan Plateau monsoon. Simultaneously, diurnal variations in vertical winds at WLG are influenced by mountain–valley breezes, where upslope flow brings heated air masses from the boundary layer to the site in the daytime and downslope flow results in cool air mass transport from the mountain peak to the site. Under this unique location, the observation at WLG can provide essential information on CH4 sources and sinks from Eurasia (Zhou et al., 2005; Zhang et al., 2013).
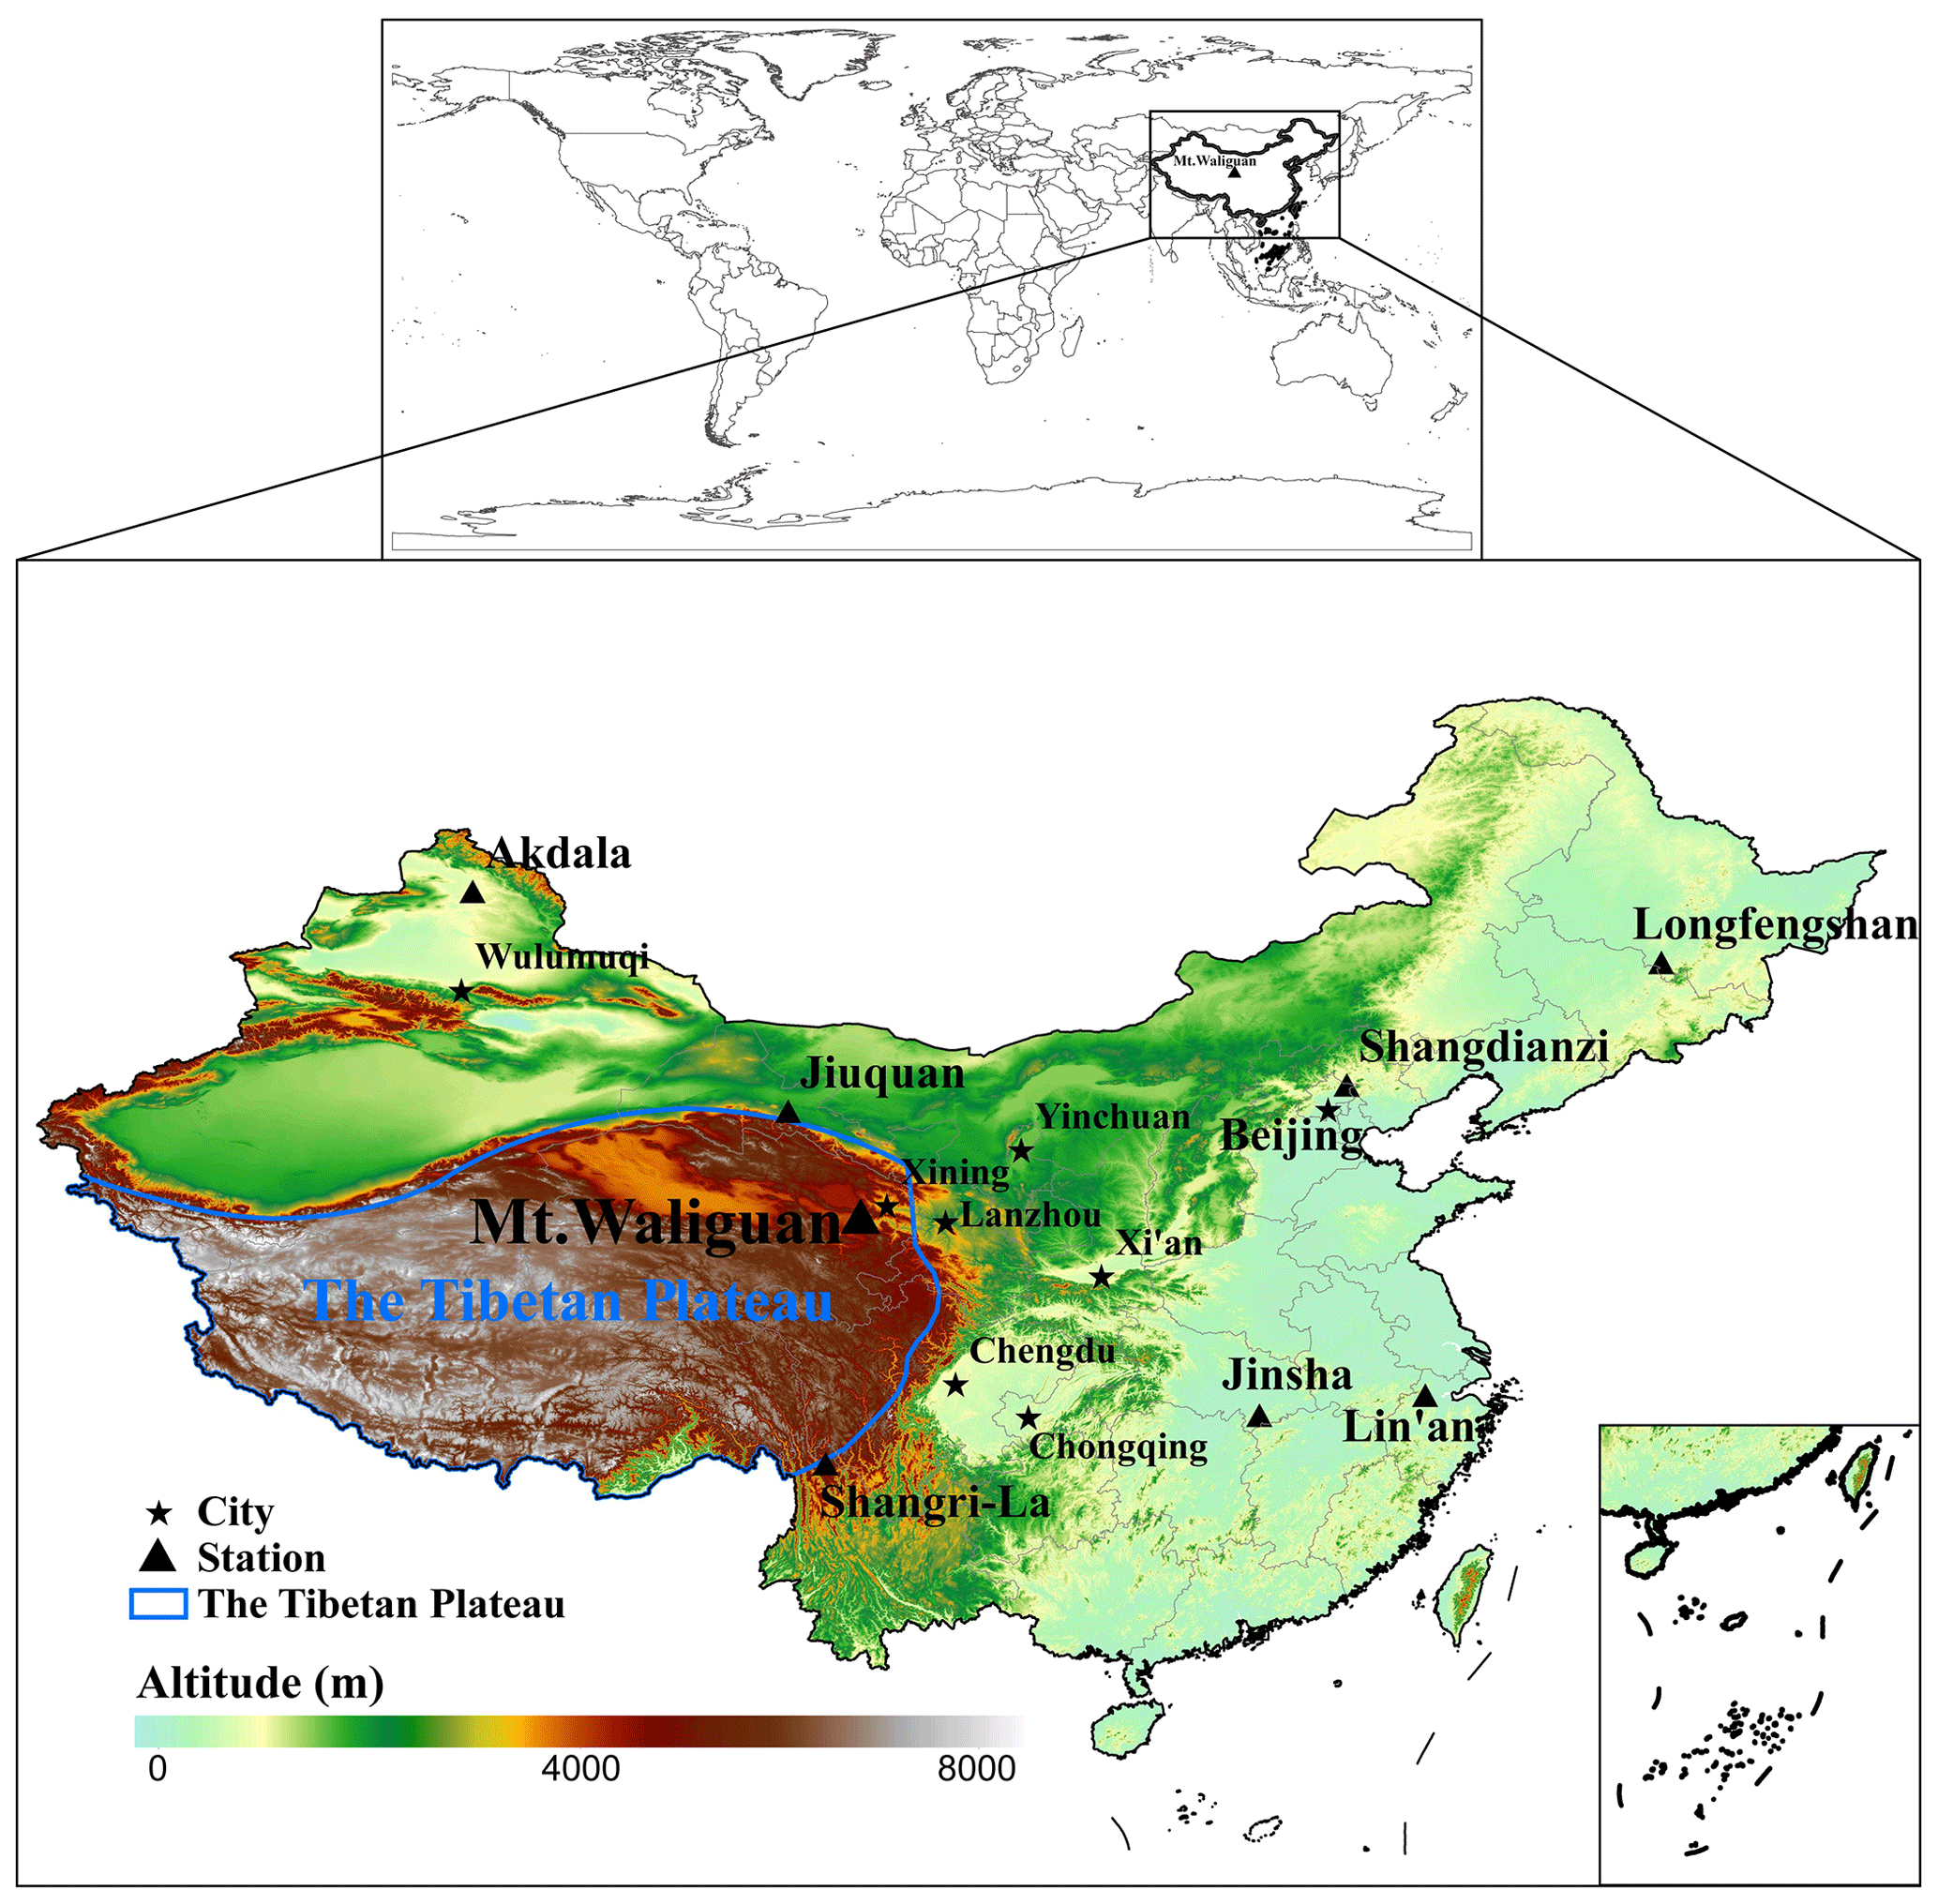
Figure 1The location of Mt. Waliguan (WLG) World Meteorological Organization (WMO) and Global Atmosphere Watch (GAW) global station and the other regional stations in China. The gradient color indicates altitude. The digital elevation model (DEM) was downloaded from the Geospatial Data Cloud site, Computer Network Information Center, Chinese Academy of Sciences (http://www.gscloud.cn, last access: 22 September 2018), and then processed by ArcGis software. The China 1094 map was derived from the © National Geomatics Center of China (http://www.ngcc.cn/ngcc/, last access: 17 March 2018). The world map was obtained from © OpenStreetMap contributors 2019 and is distributed under a Creative Commons BY-SA license (https://www.openstreetmap.org/, last access: 18 February 2018).
2.2 Instrumental setup
Atmospheric CH4 has been measured quasi-continuously, using a Hewlett Packard (HP) 5890 gas chromatograph (GC) equipped with a flame ionization detector (FID), since July 1994, and an Agilent 6890N GC equipped with a FID, since June 2008. Both of the systems used the same sampling procedures. A cavity ring-down spectroscopy system (Picarro G1301) began in January 2009, and the instrument was upgraded to Picarro G2401 in 2015. Ambient air is delivered to the above systems at about 5 L min−1 by a KNF Neuberger N2202 vacuum pump via a dedicated 0.95 cm outer diameter (o.d.) sample line from an 80 m intake line attached to an 89 m steel triangular tower located approximately 15 m from the main observatory. The residence time of the ambient air from the top of the tower to the instrument is 30 s. The ambient air is first passed through a 7 mm stainless steel membrane filter located upstream of the pump and then (after the pump) passed through a pressure relief valve set at 1 atm to release excess air and pressure. The ambient air is then dried to a dew point of approximately −60 ∘C by passing it through a glass trap submerged in a −70 ∘C methanol bath. All standard gases supplied to the instruments are from pressurized 37.5 L treated aluminum alloy cylinders fitted with high-purity, two-stage gas regulators. Stainless-steel tubing (0.32 cm o.d.; 0.22 cm inner diameter – i.d.) is used for the standard gas sample line and the ambient sample line after the cold trap. An automated sampling module equipped with a VICI eight-port valve is designed to sample from separate gas streams (standard tanks and ambient air). According to the comparability target of the WMO/GAW program (WMO, 2019), methane mole fractions are referenced to a working high (WH) standard and a working low (WL) standard. Additionally, a calibrated cylinder filled with compressed ambient air is used as a target (T) gas to check the precision and stability of the system routinely. A diagram of the observing system during different periods is seen in Zhou et al. (2004) and Fang et al. (2013). Here, we focus on the longest continuous measurements of CH4 from August 1994 to December 2019 at WLG. Data gaps in limited periods are because of the malfunction of instrument and the maintenance of the sampling system.
The records of CO in this study were initially observed by a residual gas analyzer (RGA-3) gas chromatograph (GC) equipped with an HgO reduction detector (Trace Analytical Laboratories, Inc.) since 1994. An automated sampling module was designed to sample from ambient air and series nine standards. A detailed diagram of the system was described by Zhang et al. (2011). Since 2010, the CO has been measured by the cavity ring-down spectroscopy instrument (Picarro G1302 and G2401, since 2015). The scale for all of the CO measurements was further updated to WMO X2014A.
2.3 Data processing
Most on-site CH4 observations were unavoidably influenced by local sources and other complex conditions (e.g., traffic transportation and various topography). As a result, the records cannot fully represent the regional atmospheric CH4 in well-mixed conditions (Liu et al., 2019). To obtain regionally representative records, we excluded the CH4 data influenced by local sources adjacent to the site (e.g., agricultural fields, cities, and traffic emissions). The hourly CH4 data were classified as locally or regionally representative through the meteorological approach, which was based on essential meteorological information, similar to previous studies by Zhou et al. (2004) and Liu et al. (2019). In this study, the CH4 records associated with local surface winds from selected sectors, i.e., NNE-NE-ENE in spring, NE-ENE-E-ESE-SE in summer, NE-ENE-E-ESE in autumn, and NE-ENE in winter, were flagged as locally influenced (27.0 %). Subsequently, we rejected a portion of daytime records to minimize the effect of human activities (16.9 %), e.g., 09:00–13:00 local time (LT) in summer and 10:00–17:00 LT in winter. Finally, we filtered CH4 data into locally influenced, when the surface wind speeds were less than 1.5 m s−1, to minimize the very local accumulation (9.2 %).
In order to investigate the influence of anthropogenic emissions from cities and remote areas such as the Tibetan plateau, we divided the CH4 data into two main influencing regions according to the analysis, including the geographical conditions, the effect of surface winds, the long-range transports, and the potential source distributions. The first region covers the northeast and southeast (NNE-NE-ENE-E-ESE-SE) of WLG, which is denoted as city regions (CRs). The second region is located in the south to west (S-SSW-SW-WSW-W) of the station and is the well-known Tibetan (Qinghai-Xizang) Plateau (TP; Fig. S1 in the Supplement). Accordingly, the hourly CH4 records of when the surface winds come from these sectors were divided into two subsets (i.e., TP and CRs). The long-term variations between the two regions and the total regional time series were further compared and analyzed.
To understand the influence of local surface wind, hourly CH4 data was binned into 16 horizontal wind direction classes (Fang et al., 2013). In this study, we used the polarPlot function in the openair package of the statistical software R (R Core Team, 2019). It shows the bivariate (i.e., wind speed and wind direction) polar plot of CH4 concentrations, and the concentrations are calculated as a continuous surface by modeling it using smoothing techniques (Carslaw et al., 2006; Diederich, 2007). Also, the conditional probability function (CPF) was used to investigate the probability of which wind directions are dominated by high CH4 mole fractions (Uria-Tellaetxe and Carslaw, 2014). In order to study the pollution transport pathways of air masses at WLG, the cluster analysis of 3 d back trajectories was applied using the Hybrid Single-Particle Lagrangian Integrated Trajectory (HYSPLIT) dispersion model (Draxier and Hess, 1998; Rousseau et al., 2004) on the strength of gridded meteorological data (2004–2019) from the National Oceanographic and Atmospheric Administration's Air Resources Laboratory (NOAA ARL). The spatial resolution of the model is 0.5×0.5∘, and the model height is 10 km a.s.l. We computed the back trajectories coincident with hourly CH4 mole fractions. The trajectories for January, April, July, and October were calculated to represent the seasons of winter, spring, summer, and autumn, respectively. The spatial source distributions of annual CH4 were analyzed using the potential source contribution function (PSCF) approach, which computed the conditional probability of the residence times of air parcels with greater concentration than threshold transport to the exact receptor site (Ashbaugh et al., 1985). In this study, the PSCF value was calculated in 0.5×0.5∘ grid cell (i, j) as follows:
nij represents the number of endpoints that terminate in the ijth grid cell, while the number of trajectories with concentrations exceeding the threshold value was defined as mij (Polissar et al., 1999). In order to reduce the abnormal influence of small nij values in some grid cells, PSCFij was further computed by an arbitrary weighting function Wij as follows:
Wij represents the weight of the cell (i, j), nij is the number of trajectory endpoints that fall in the ijth grid cell, while the nave shows the mean number of the endpoints in all grid cells.
In order to fill the data gaps so as to evaluate the long-term CH4 trend, we applied the curve-fitting approach by Thoning et al. (1989). We also calculated the trend curve that excluded the influence of seasonal variation and then obtained the annual growth rates by the average of the first derivative of the trend curve. The function consists of the polynomial part and the annual harmonics part, as follows:
k represents the number of polynomials part, and nh is the number of harmonics part. We applied k=3 polynomial terms (a quadratic) for multiyear trends and nh=4 yearly harmonics for seasonal cycles in this study. The fast Fourier transform (FFT) was utilized to smooth the fitting residuals (Press et al., 1992).
The significant difference test was applied by the scheirerRayHare function in the rcompanion package of R software, which is a nonparametric test for a two-way analysis of variance (ANOVA). The multiple comparison was used by a Wilcoxon rank sum test with R (R Core Team, 2019). For the correlation analysis between CH4 and CO, we obtained the detrended time series of CH4 and CO from 2004–2019, based on the method by Thoning et al. (1989). The detrended values are denoted as ΔCH4 and ΔCO, which are the original data points minus the trend curve. To accurately obtain the correlation slopes of ΔCO and ΔCH4, i.e., ΔCO∕ΔCH4, a rolling linear regression was applied to the ΔCH4 and ΔCO time series by the roll_lm function in the roll package of R (R Core Team, 2019). We successively moved a 24 h time window by 1 h over the whole time series. Similar to the study by Tohjima et al. (2014), we set three criteria to achieve a better quality control of the slopes. When (i) the number of the CH4 record is less than five in 24 h, (ii) the coefficient variation in the correlation slope is more than 15 %, and (iii) the absolute value of the correlation slope is less than 0.8 (), the correlation slopes were identified as statistically insignificant and inaccurate and were rejected. In order to understand the year-to-year variations, we analyzed the CH4 variation over different periods in 1994–2019. The entire CH4 time series was divided into five observing periods, i.e., 1994–1997, 1998–2002, 2003–2007, 2008–2012, and 2013–2019 according to the significant stages or the critical time period of atmospheric CH4 variations from previous studies (Zhou et al., 2004; Fang et al., 2013; Zhang et al., 2013; Nisbet et al., 2019; WMO, 2020). Unless otherwise stated, the average values in this study are presented with 95 % confidence intervals (CIs).
3.1 Extracting the regional atmospheric methane
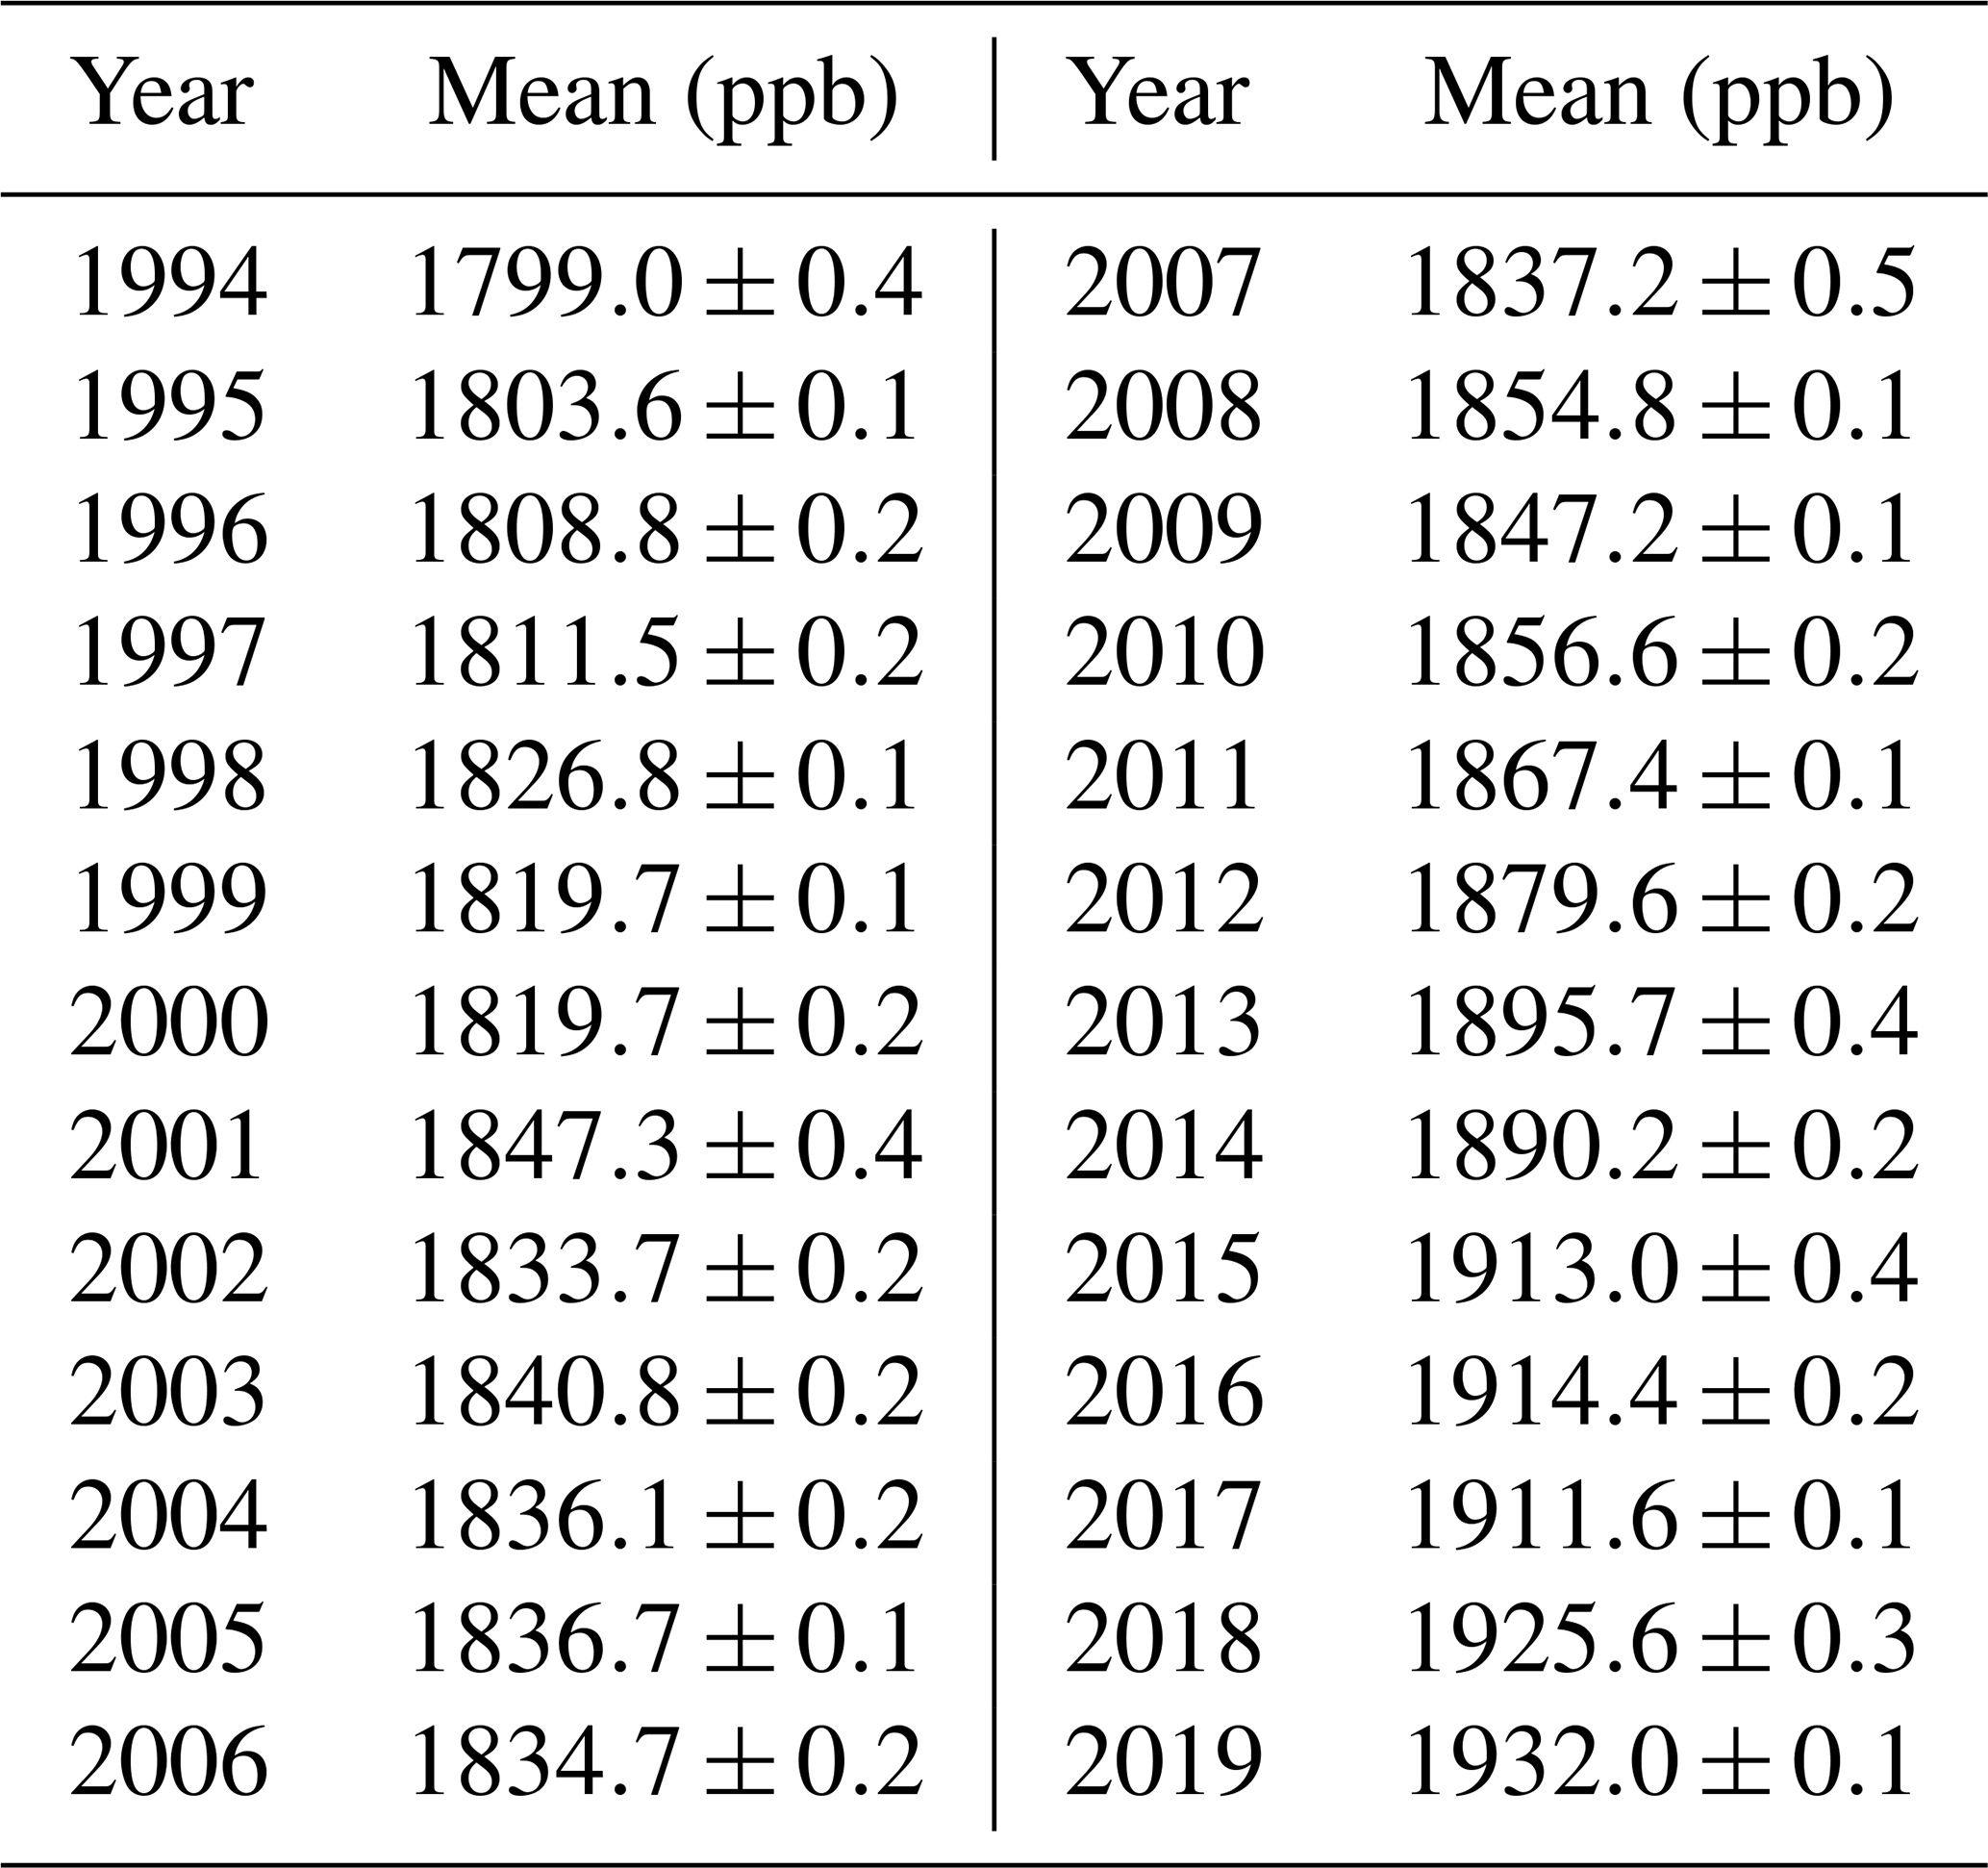
To precisely understand the characteristics of atmospheric CH4, including seasonal cycles and long-term trends, it is vital to identify the CH4 records in well-mixed air without local contaminants (Liu et al., 2019). In this study, hourly CH4 measurements between 1994 and 2019 were analyzed, resulting in 64.0 % of the CH4 data being classified as regionally representative, with an average CH4 mole fraction of 1865.8±0.4 ppb. The average of the locally influenced data (1868.2±0.3 ppb) was larger than that of the regionally representative records (Table 1). The filtered regional or local time series is shown in Fig. 2. It can be seen that the CH4 mole fractions increased from 1994 to 2019. The atmospheric CH4 showed a strong growth and displayed large fluctuation. In 1994, the average CH4 mole fraction was only 1799.0±0.4 ppb; however, the average value increased to 133 ppb by the year 2019 (1932.0±0.1 ppb; Table 2). Compared with the global average mole fractions in recent years, i.e., 1853±2 ppb in 2016, 1859±2 ppb in 2017, and 1869±2 ppb in 2018 (WMO, 2019, 2020), the atmospheric CH4 mole fractions at WLG are significantly higher. These results indicate that WLG has been affected by strong CH4 sources in recent years, which is possibly due to the influence of the two largest source regions of northern India and eastern China (Fang et al., 2013; Zhou et al., 2004).
Table 1The statistics of the filtered CH4 data series over different periods during 1994–2019 at the WLG station. Note: ppb – parts per billion.
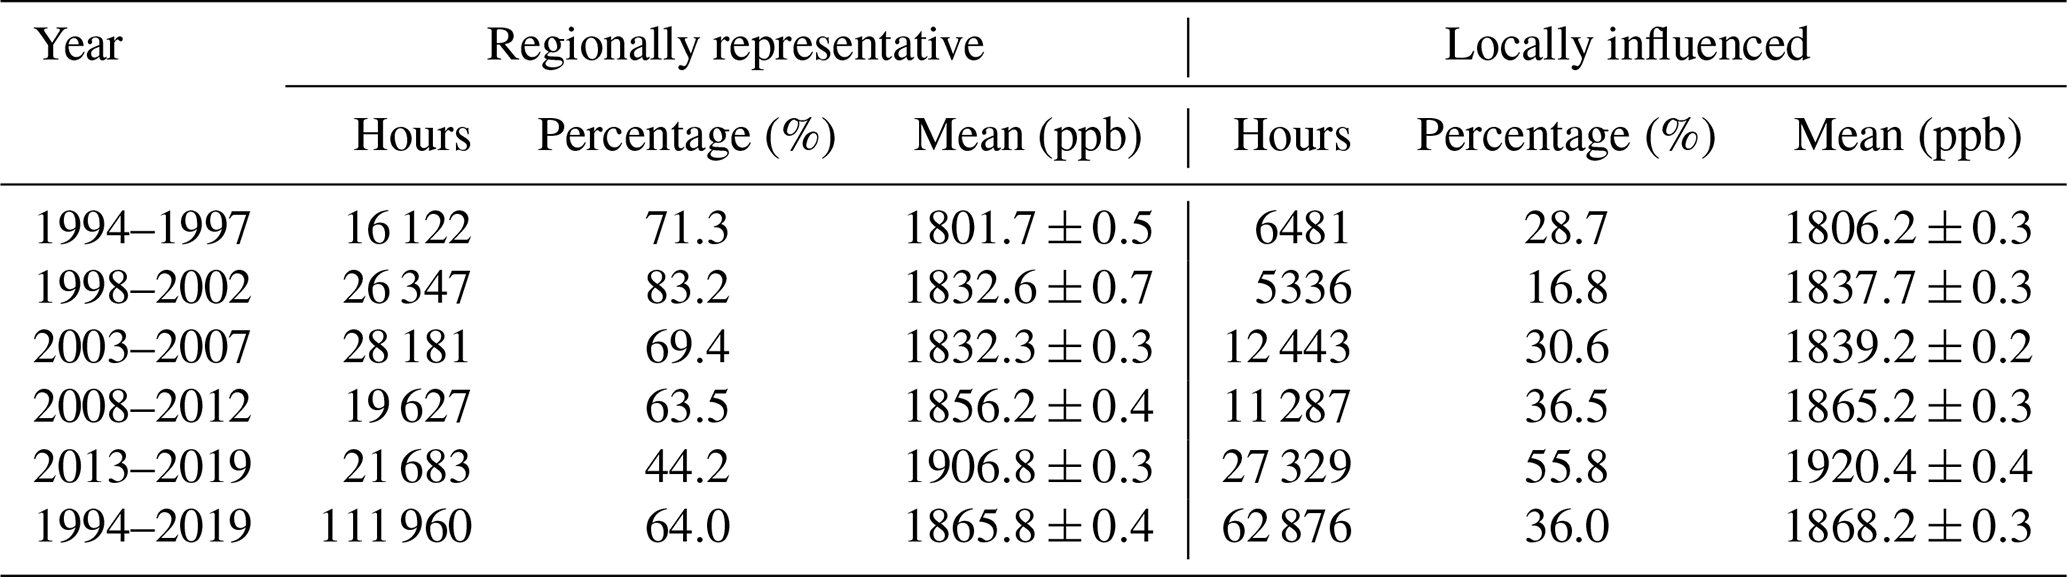
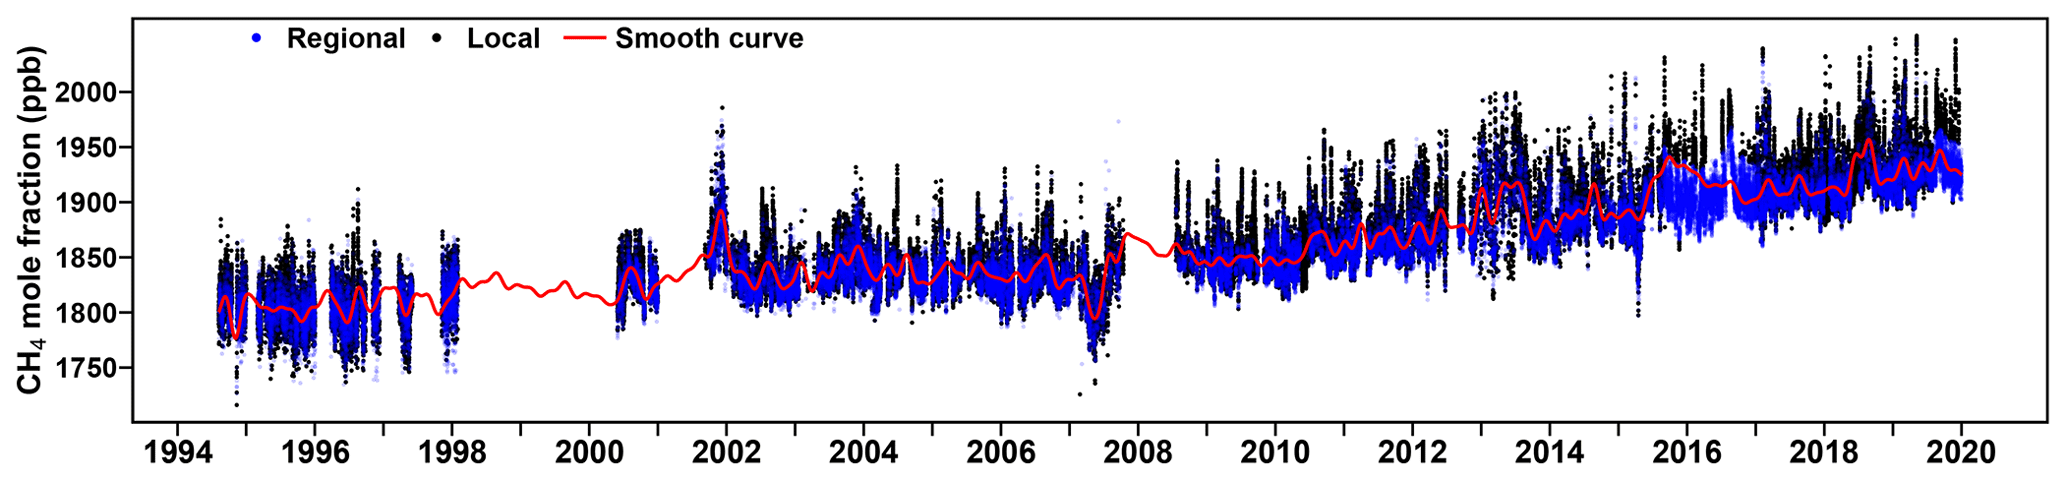
Figure 2The filtered hourly CH4 data series, from 1994 to 2019, at the WLG station. The transparent blue points are regionally representative data. The black points are locally influenced data. The red lines are the smooth values of the regional data obtained by the curve-fitting routine of Thoning et al. (1989).
3.2 Diurnal variations
Distinct diurnal cycles were observed in four seasons during 1994–2019 at WLG. The CH4 mole fraction increased from early morning, reached a maximum at noon, and had a trough in the late afternoon (Fig. 3f). However, differences also existed in the four seasons. In spring and summer, the atmospheric CH4 increased from 09:00 to 13:00 LT at noon, with a daily amplitude of 5.8±2.8 and 4.4±3.4 ppb, respectively (Table S1 in the Supplement). In autumn, the diurnal variation showed an amplitude of 4.3±3.1 ppb, with one peak at noon. In winter, a large increase in CH4 was found during 09:00–17:00 LT, with the largest peak-to-trough amplitude of 7.1±2.9 ppb. Different patterns for diurnal CH4 cycles were also found over different periods. In 1994–2002, the CH4 mole fractions in the winter were higher than the other seasons (Fig. 3a, b), which was likely due to the manner of heating (e.g., large biomass burning) and the adverse diffusion conditions in cold weather (Fang et al., 2013). However, the highest value was found in summer during the periods of 2003–2007, 2008–2012, and 2013–2019 (Fig. 3c–e), which could be ascribed to the transport of anthropogenic emissions (e.g., southeastern cities) by the meteorological factors (Zhang et al., 2013). Additionally, in summer, the intense herding or grazing activities around WLG have enhanced the regional CH4 emissions and, hence, contributed to the higher CH4 mole fractions (Zhou et al., 2004).
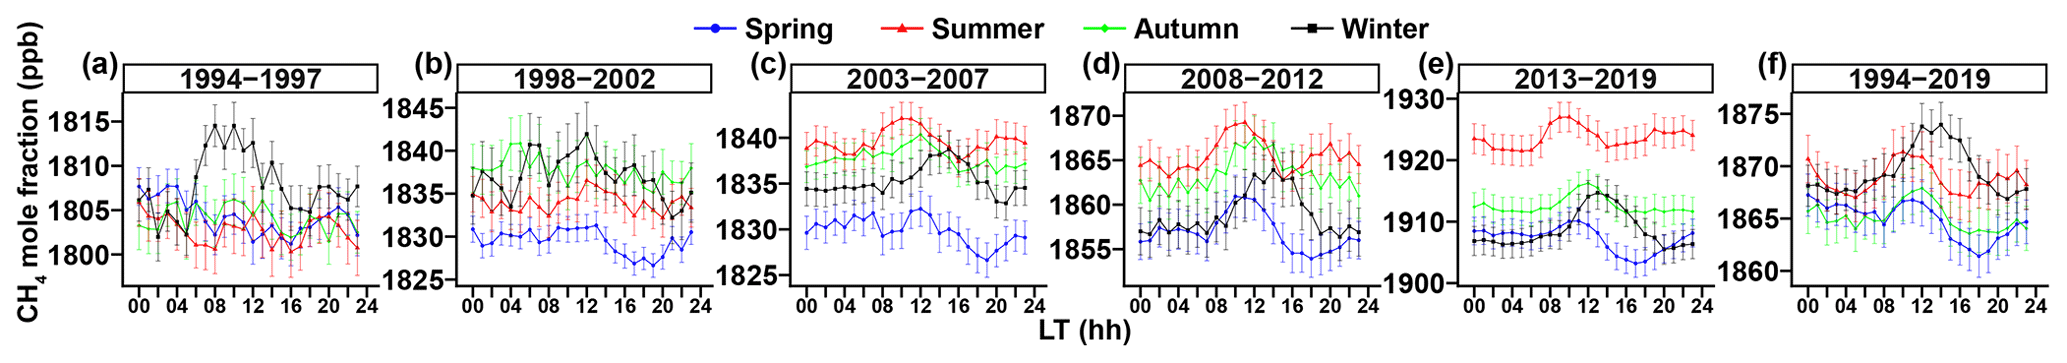
Figure 3Diurnal CH4 cycles in different periods from 1994 to 2019 at the WLG station. The lines with different colors represent various seasons. Error bars indicate the 95 % confidence intervals.
Similar to the previous studies by Zhang et al. (2013) and Fang et al. (2013), diurnal cycles were ambiguous before 2002 (Fig. 3a, b), but significant diurnal variations appeared afterward (Fig. 3c–e), which indicated that the local sources were weak at WLG in the past. The apparent diurnal cycles after 2002 may be attributed to the intense activities by humans (e.g., grazing and burning fuel), which were enhanced in the daytime and weakened at nighttime (Fang et al., 2013). The peak-to-trough amplitude almost increased in almost all seasons. For example, in spring, the amplitude was 6.5±3.1, 4.7±2.1, 5.6±2.7, 7.0±3.1, and 6.9±3.1 ppb over the periods of 1994–1997, 1998–2002, 2003–2007, 2008–2012, and 2013–2019, respectively (Table S1). The meteorological conditions (e.g., diffusion and transport) could also have contributed to the increasing CH4 amplitude. WLG was remote from the populated center; therefore, the good diffusion conditions in the daytime may have brought high anthropogenic emitted CH4 to the site. The increasing amplitude and CH4 mole fractions suggested that WLG was increasingly affected by local and regional anthropogenic sources such as gas exploitation and grazing (Zhou et al., 2004).
3.3 The impact of local surface winds
Similar to the short-term study by Zhou et al. (2004), the atmospheric CH4 at WLG was significantly influenced by local surface winds from the northeastern and southeastern sectors (Fig. 4f). Slight differences were also found among seasons. In the spring, when the wind was originating from the NNE-NE-ENE-E sectors, the atmospheric CH4 was enhanced by 8.0–15.4 ppb, compared to the seasonal average (1862.4±3.7 ppb). In the summer and autumn, the wind from the NNE-NE-ENE-E-ESE-SE produced higher CH4 mole fractions, with an enhancement of 2.5–14.6 and 1.6–19.3 ppb, respectively. In winter, similar to that in spring, the CH4 mole fractions significantly increased from the NNE-NE-ENE-E sectors with a value of 14.7–25.8 ppb higher than the seasonal average (1871.3±6.7 ppb). In summer, the prevailing winds were from the NE-ENE-E-ESE sectors (∼46 %; Fig. S2), and the CH4 mole fractions were also higher in the related sectors. However, in autumn and winter, although the prevailing wind and the high wind speed were from the SSW-SW-WSW-W sectors (∼40 %–50 %; Fig. S2), the high CH4 mole fractions were from the opposite wind sectors of NNE-NE-ENE-E-ESE (Fig. 4f), suggesting that strong local sources were distributed from the northeast to southeast of WLG (city regions) and even covered the emission of natural sources. Causes of the elevated CH4 from these sectors could be attributed to the large plantations of highland barley and the high population density in those areas (Fang et al., 2013). The two largest cities of Xining (with a population of ∼2.2 million) and Lanzhou (with a population of ∼4 million) are also situated in the northeast and east of WLG, respectively. The heavy human activities from anthropogenic fossil combustion, landfills, and livestock could also have emitted large amounts of CH4. Based on the data from the Emissions Database for Global Atmospheric Research (EDGAR), the increase in CH4 emission was 500 kg yr−1 in these two regions throughout 1994–2015 (Crippa et al., 2019a). Also, the Yellow River Canyon (YRC) industrial area, which is ∼500 km northeast of WLG, may also have contributed to the high CH4 values (Zhou et al., 2003). With the rapid development of land use, water utilization, and agriculture sources in the YRC, large CH4 emissions could easily have been transported to WLG. Previous studies on black carbon (BC) and carbon monoxide (CO) also revealed that the high CH4 values at WLG in winter were a result of transport from the YRC (Tang et al., 1999; Zhou et al., 2003).

Figure 4The wind rose distribution of the average CH4 mole fractions from 16 horizontal wind directions over different periods during 1994–2019 at the WLG station. The different colors represent the CH4 data in different seasons. Error bars in all directions indicate 95 % confidence intervals.
The wind rose distribution of CH4 mole fractions indicated that the elevated CH4 mole fractions varied in early periods (i.e., 1994–1997 and 1998–2002) to recent periods (2003–2007, 2008–2012, and 2013–2019). The elevated CH4 was predominately from the ENE-E-ESESE-SSE sectors in the early years (Fig. 4a, b) but evolved to the NNE-NE-ENE-E sectors in later years (Fig. 4c–e). Furthermore, the amplitude of enhancements was also increasing along with the progression of time. For example, in autumn, the maximums were from the east in 1994–1997, ENE in 1998–2002 and again in 2003–2007, northeast in 2008–2012, and finally ENE in 2013–2019, with the successive increases of 8.6, 12.1, 14.7, 16.8, and 18.8 ppb, respectively. Therefore, the local surface wind from the city regions had an increasing effect on the atmospheric CH4 at WLG.
The CPF was applied to hourly CH4 and CO data by considering intervals of entire data percentiles including 0–20th, 20th–40th, 40th–60th, 60th–80th, and 80th–100th to draw the CPF polar plot (Uria-Tellaetxe and Carslaw, 2014). It was clear that the different sources only affected the CH4 mole fractions in different percentile ranges (Fig. 5), meaning that the specific sources were prominent for specific percentile ranges. For most wind speed directions, the CPF probability of the CH4 being greater than the 60th percentile was trending to zero, and most sources contributed to the percentiles less than the 60th for the CH4 mole fraction (e.g., 40th–60th). These results implied that most areas around WLG had a small contribution to the CH4 emissions. In addition, the wind from the northeast and the southeast was important for the cases of the higher percentiles, resulting in the highest CH4 mole fractions of 1870–1907 ppb for the 60th–80th percentiles and 1907–2051 ppb for the 80th–100th percentiles (Fig. 5), which revealed the existence of a northeastern and a southeastern strong source region. The anthropogenic emissions from cities (e.g., Lanzhou or Chengdu) were the only cause for high values in the southeast. It is obvious that the CO sources gradually shifted with the increase in the percentile ranges (Fig. 5). The areas in which the CPF probabilities were higher were the NW-SW sectors when percentages ranged from 0 to 40. Nevertheless, when data exceeded the 60th percentile, the high probability areas completely moved to NE-SE sectors. Similar to that of CH4, the high CO mole fractions were consistent from the eastern regions (urbanized areas; Fig. 5), indicating strong anthropogenic sources in the city regions (e.g., Xining and Lanzhou; Zhang et al., 2011).
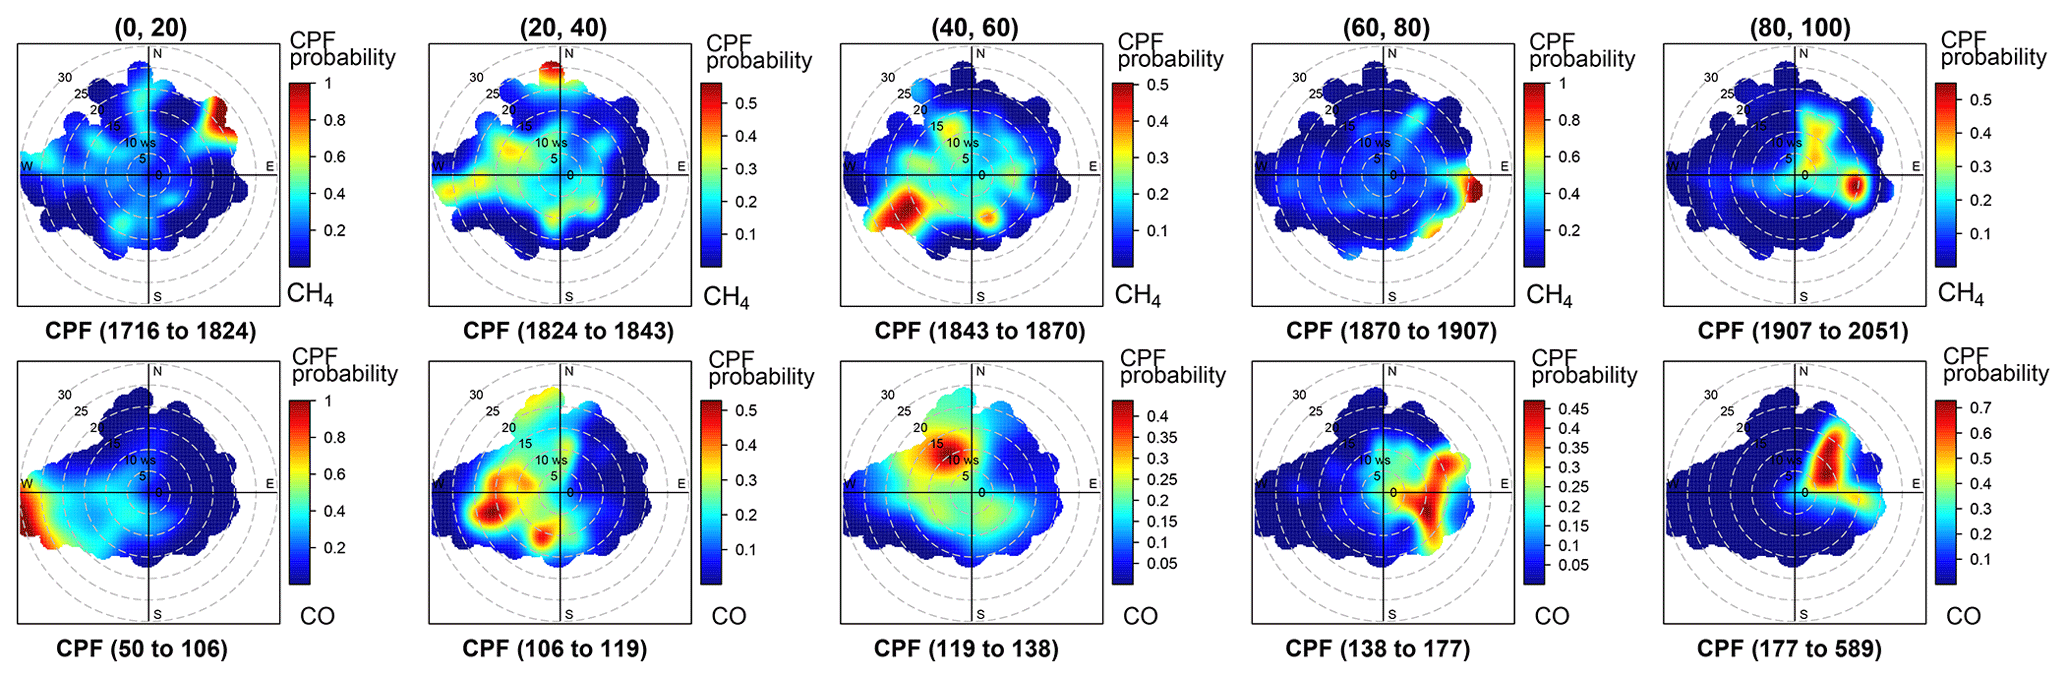
Figure 5The polar plot of the distribution of the CH4 and CO concentration probabilities in different percentile ranges at the WLG station. The analysis was based on the conditional probability functions (CPFs) by Ashbaugh et al. (1985). The top row shows the analysis of CH4 from 1994 to 2019. The bottom row shows the CO measurements in 2004–2019. Note: ws – wind speed. The values at the bottom of each panel show the range of concentrations in the relevant percentile range. Gradient colors represent the levels of CPF probability in different percentile ranges.
3.4 Long-range transport and potential source distributions
3.4.1 Air mass transports
Figure 6 illustrates the cluster analysis of the 3 d back trajectories between 2004 and 2019. In the spring, the majority of the air masses were from the western and northwestern regions, which accounted for about 36.2 % (cluster 3) and 36.4 % (cluster 1) of the total trajectories (Fig. 6a). These air masses were accompanied by lower CH4 mole fractions than those from the eastern and northeastern regions, such as cluster 2 (27.3 % of the total; Table 3). The largest enhancement was also in cluster 2 at ∼6 ppb relative to the average. In the summer, 43.3 % of the air masses were from eastern regions (cluster 3). However, the highest CH4 mole fractions were in cluster 2 from northwestern regions (Fig. 6b). The air masses from eastern and northeastern regions passed over the cities of Xining and Lanzhou (capital of Gansu province), which are populated centers and industrial areas; hence, high CH4 mole fractions were found. However, the higher CH4 mole fractions were also observed when the air masses were from the northwest to the southwest (Table 3), which was because the air masses had passed through the northwest of the Qinghai province and the central area of the Xinjiang Uygur Autonomous Region (XUAR). This is where the Ge'ermu urban area (the second-largest city of Qinghai) was located and where there was, together with rapid industrial development, natural gas and petroleum resource exploitation, and residue burning of large crops; hence, the CH4 emissions were strong (Fang et al., 2013; Zhang et al., 2013). In the autumn, all the air masses were originated from the western and northwestern regions (Fig. 6c). In winter, the air masses primarily came from northwestern and southwestern regions, e.g., cluster 3 (56.4 %) and cluster 1 (32.1 %; Fig. 6d), but the air masses (cluster 2) from the city regions brought the highest CH4 mole fractions, with an enhancement of ∼27 ppb over the seasonal average. Almost all the air masses were from the southwestern or northwestern regions in the autumn and winter, suggesting that these regions that were farther away from the site became strong source contributors to WLG.
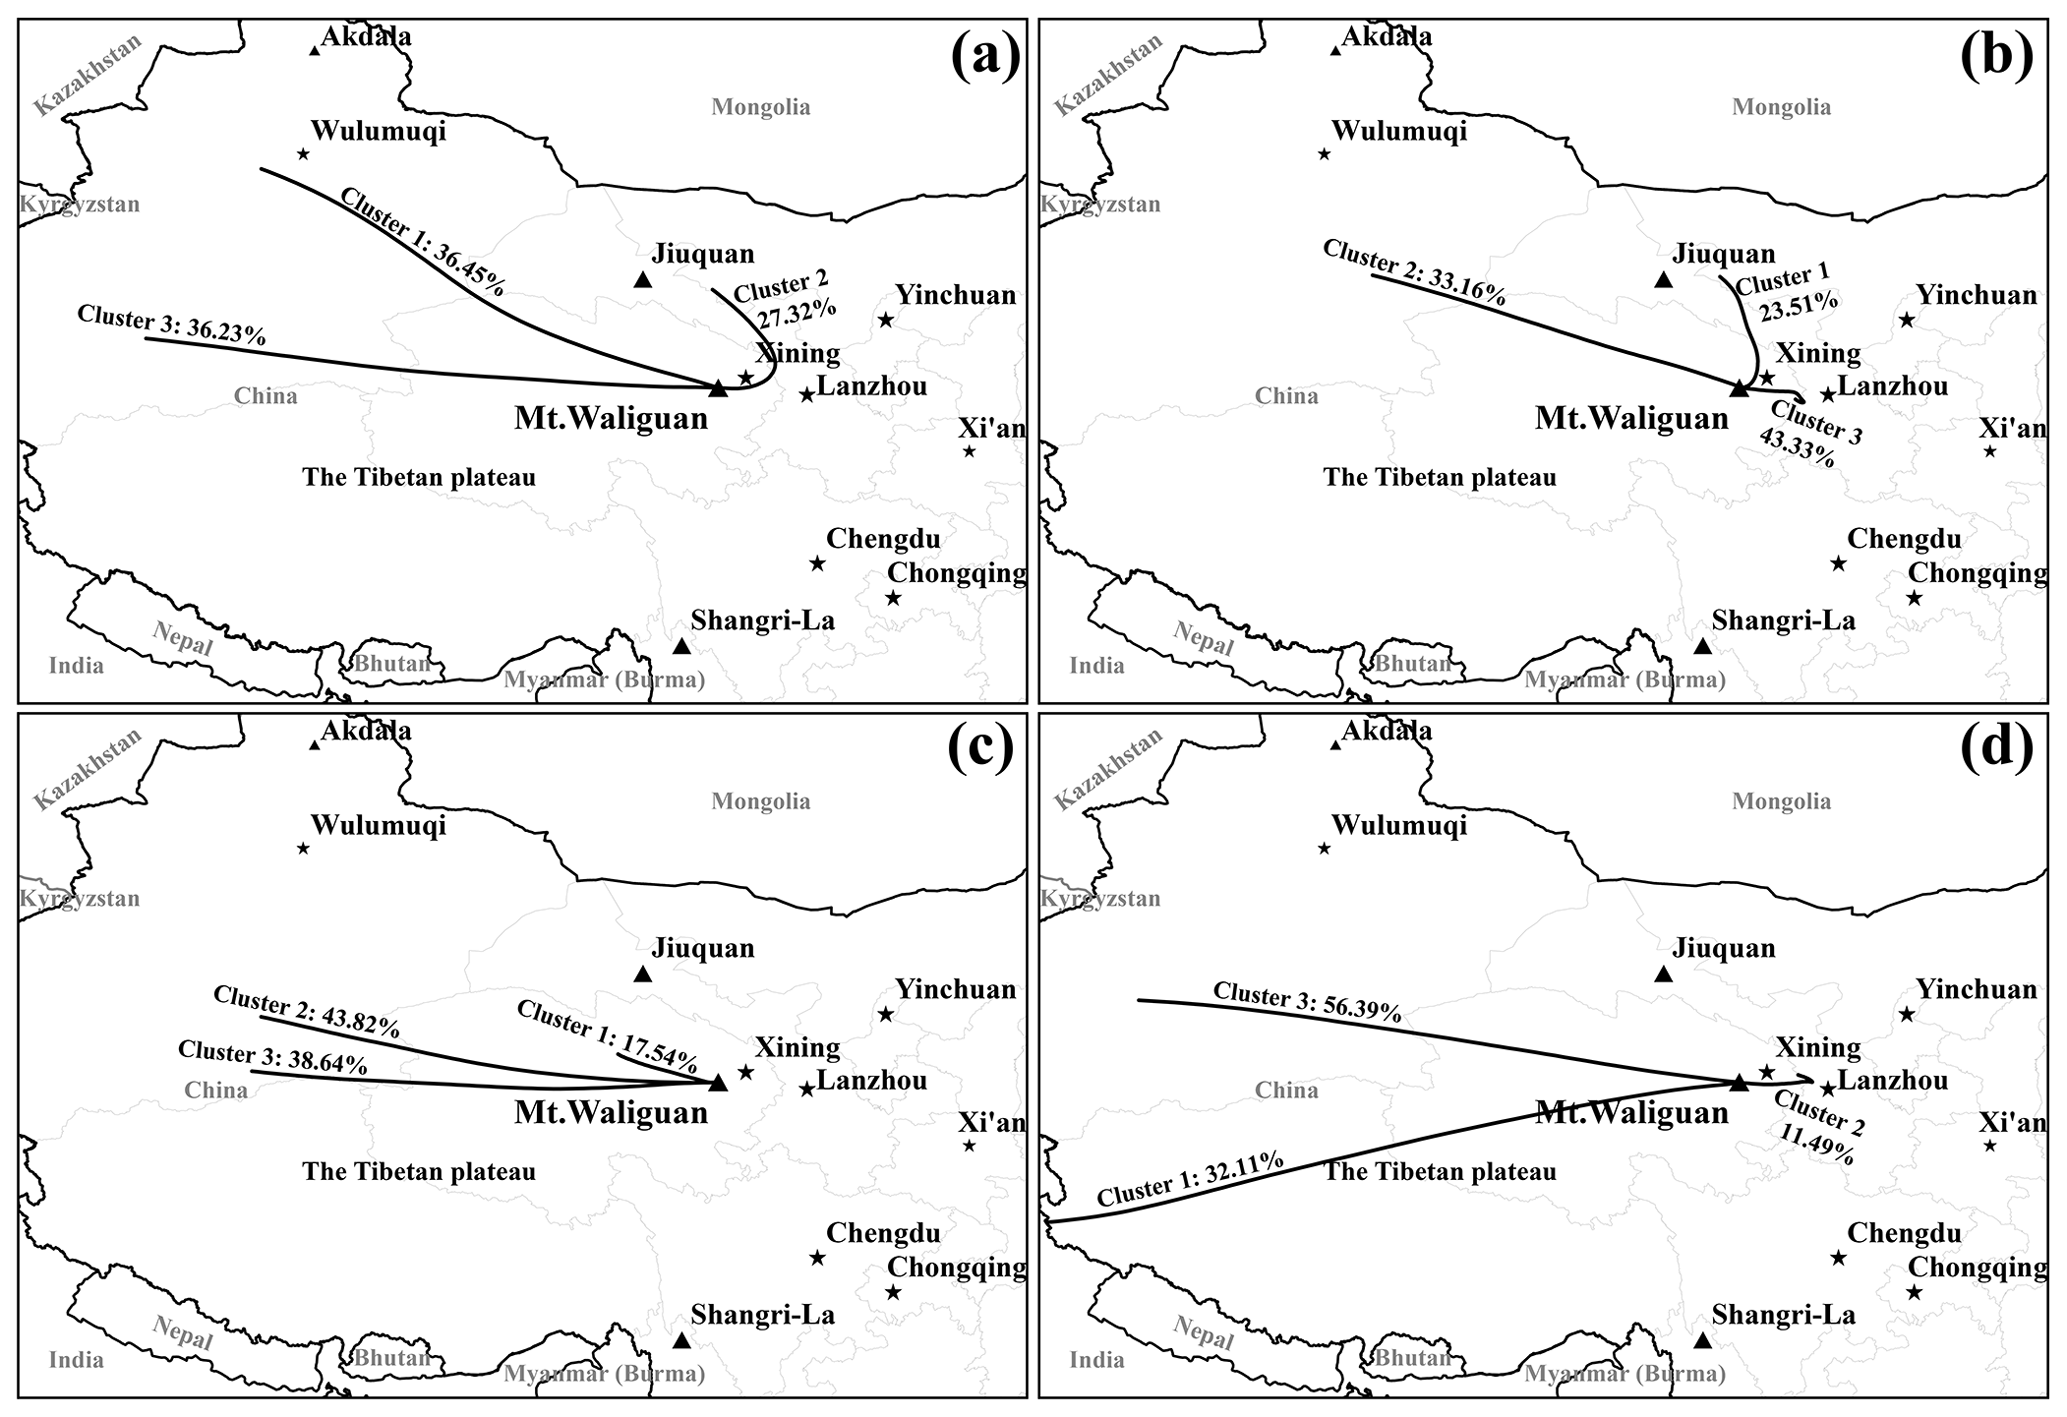
Figure 6Cluster analysis of the 72 h back trajectories in different seasons (spring – a; summer – b; autumn – c; winter – d) during 2004–2019 at the WLG station. The proportion of trajectories in each cluster is also marked.
Table 3The statistics for the cluster analysis result for hourly CH4 data from 2004–2019 at the WLG station. The clusters from urban areas are highlighted in bold.

3.4.2 Spatial distribution of potential source regions
The potential sources were analyzed over different periods, i.e., 2004–2007, 2008–2012, and 2013–2019 (Fig. 7). Generally, the strongest sources were located northeast or southeast of the station, especially in summer, but a large area of sources was identified from the southwestern to the northwestern regions, which also contained CH4 emissions from the northwestern Gansu province, the northwestern Qinghai province, and southeast of the XUAR. Additionally, the source regions differed in various seasons. The potential source regions in the spring (Fig. 7a–c) and winter (Fig. 7j–l) were larger than those in the summer (Fig. 7d–f) and autumn (Fig. 7g–i). The seasonal difference was due to the effect of westerlies or the southeastern monsoons (Zhou et al., 2004).
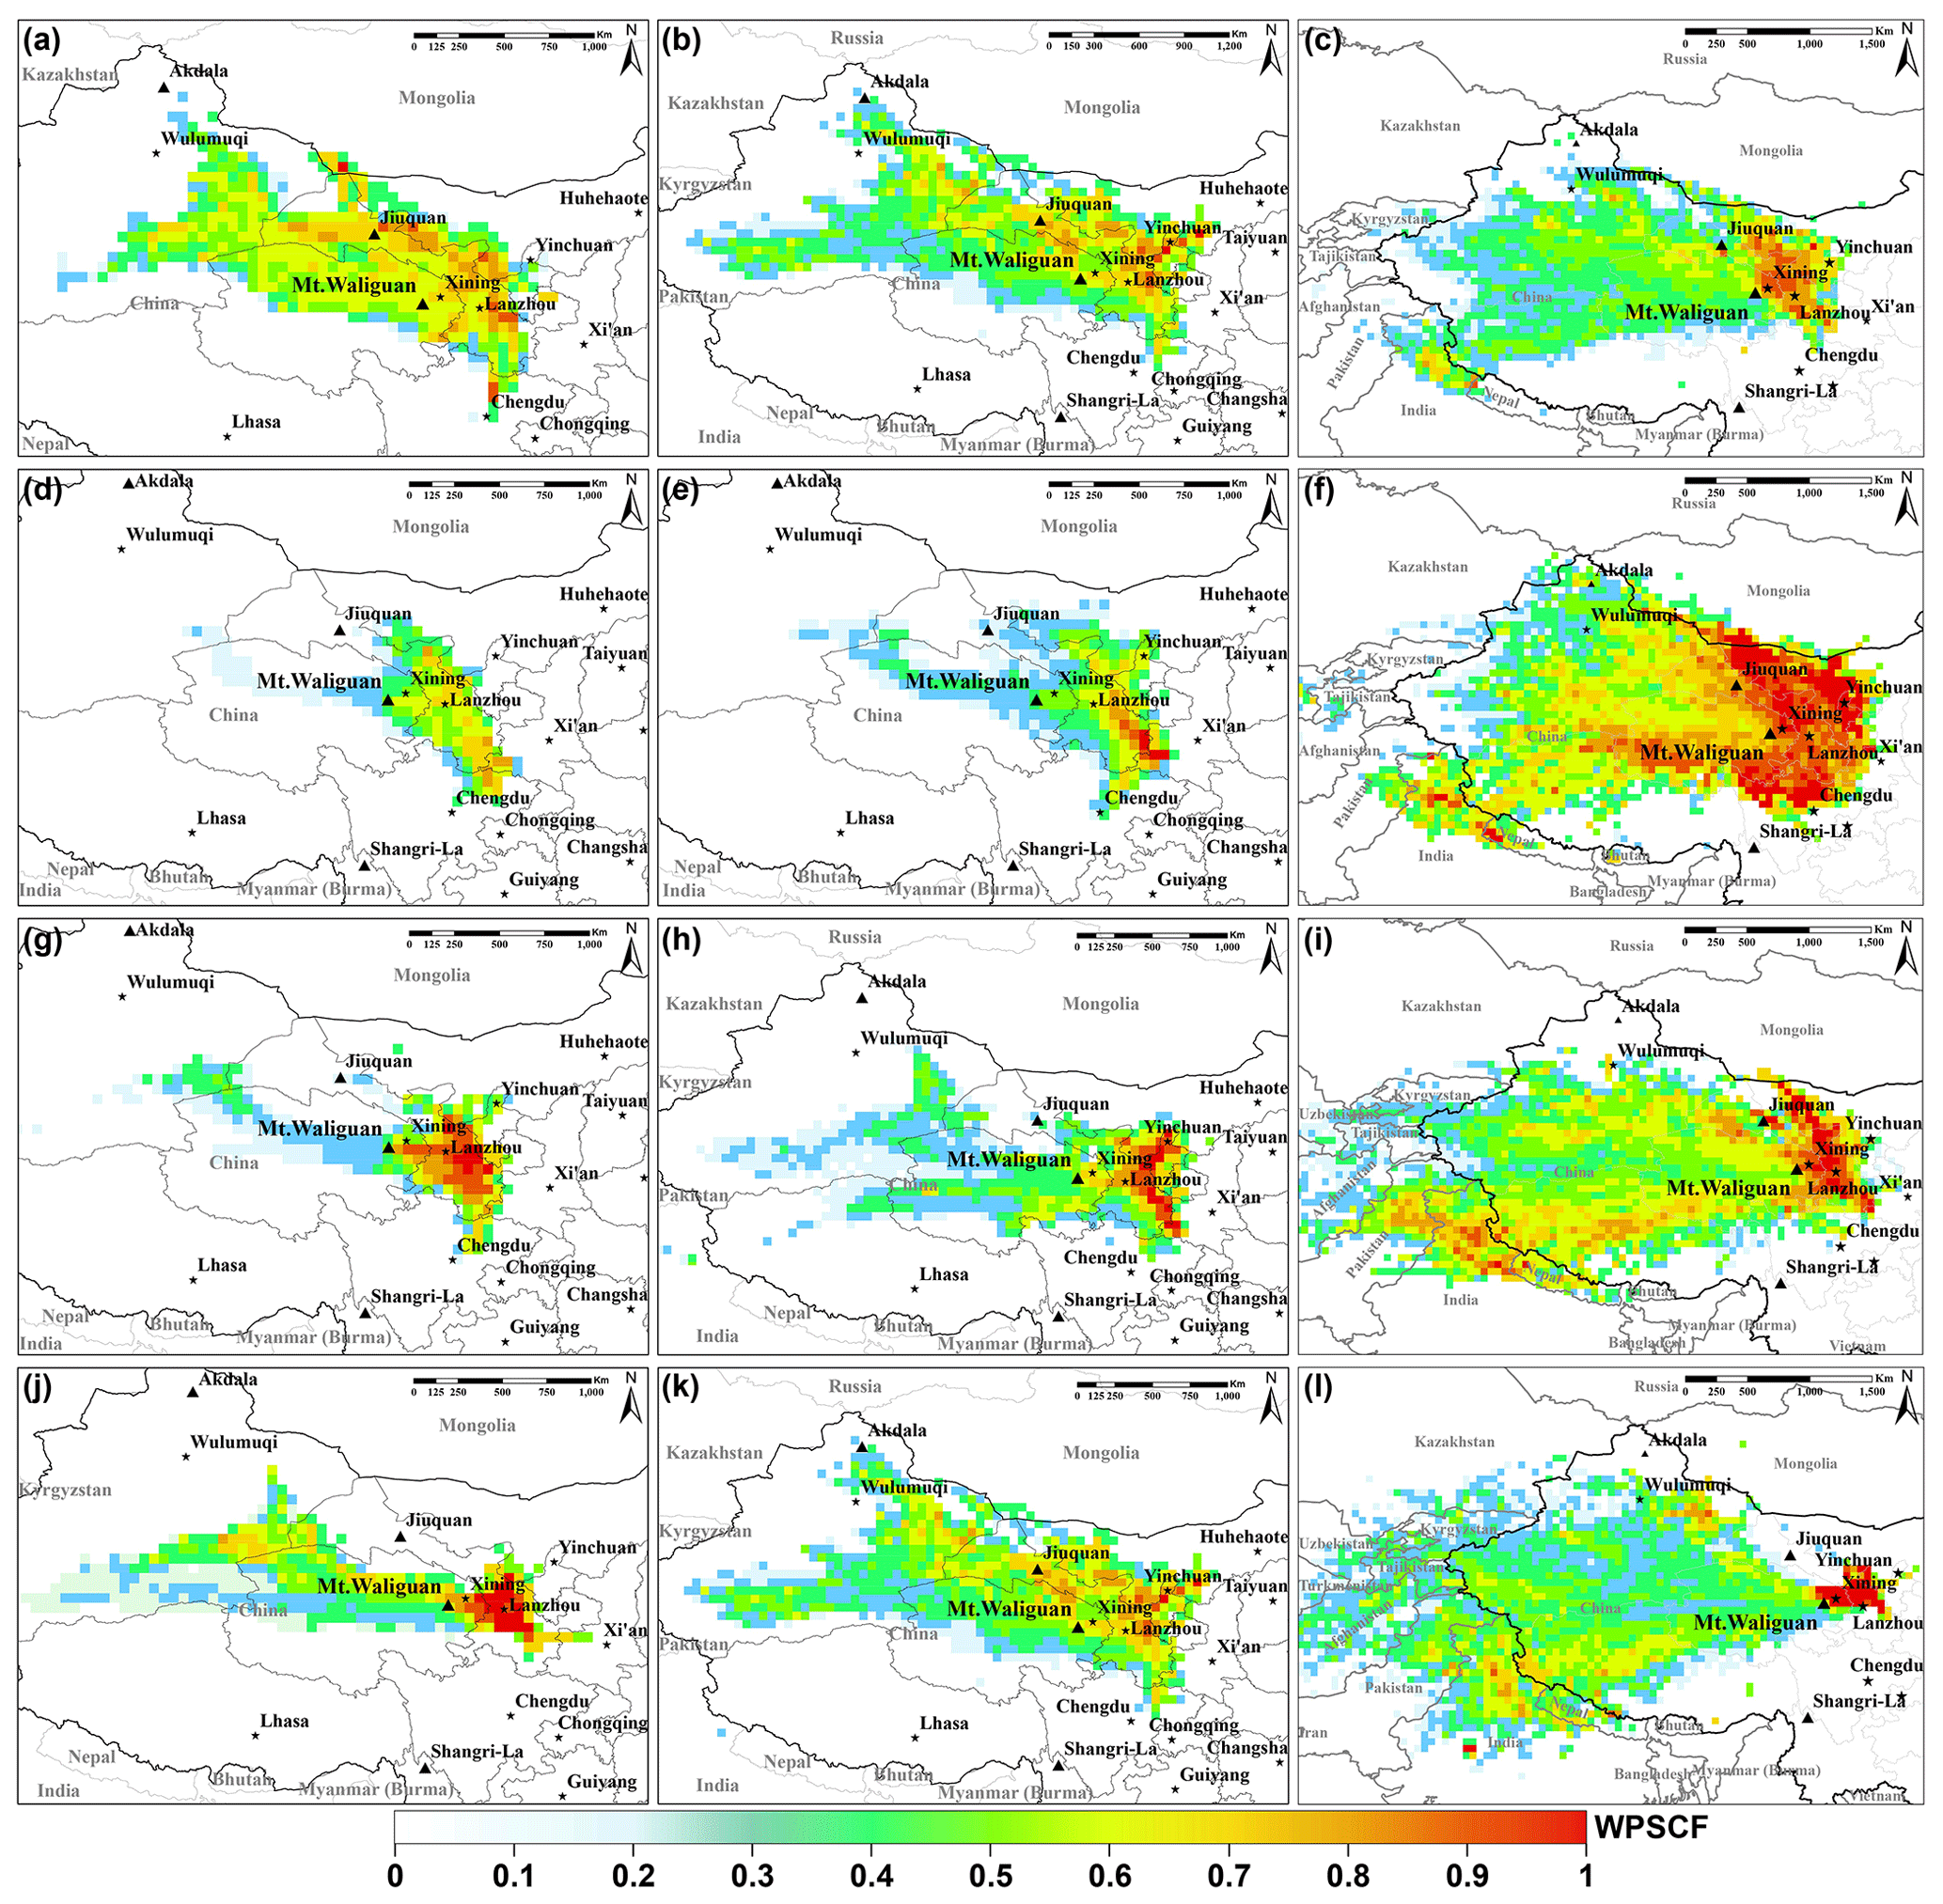
Figure 7The geographical distribution of the weighted potential sources of CH4 in different periods over 2004–2019 at the WLG station. The gradient color shows the strong levels of potential source regions in different seasons, i.e., spring (a, b, c), summer (d, e, f), autumn (g, h, i), and winter (j, k, l) and different periods, i.e., 2004–2007 (a, d, g, j), 2008–2012 (b, e, h, k), and 2013–2019 (c, f, i, l).
There were also trends in the CH4 source regions correlated with specific years, namely (i) the area of the potential source regions was increasing over time, and (ii) the location of strong sources changed along with the time. For example, in autumn and winter, the CH4 sources were very strong in the southeastern and northeastern regions during 2004–2007 (Fig. 7g, i) and then weakened in 2008–2012 (Fig. 7h, k). Finally, from 2013–2019 the sources almost moved to the southwest with a very large distribution area (Fig. 7i, l). More CH4 sources appeared at WLG along with the progression of time, which could have been attributed to the influence of human expansion. The pattern of strong sources moving indicated that the southwestern area relative to WLG, e.g., northern India, was gradually becoming a strong CH4 contributor. India, with abundant cattle and an extensive, large-scale coal mining operation possibly contributed to large amounts of CH4 moving from northern India to the northeastern Tibetan Plateau (Fig. 7i, l; Fu et al., 2012). The analysis of air mass transport (Fig. 6d) also supported the conclusions that the air masses from the southwestern regions contributed the highest CH4 mole fractions. The studies of atmospheric Hg at WLG by Fu et al. (2012) also supported this phenomenon, which found the long-range transport of atmospheric Hg from India to the northeastern Tibetan Plateau.
3.5 Correlation analysis between CH4 and CO
Because parts of the CH4 and CO in atmosphere were from the same anthropogenic sources (e.g., fossil fuel combustion), the long-term trend of ΔCO∕ΔCH4 was helpful in understanding the variation in the sources and sinks in many studies (Buchholz et al., 2016; Niwa et al., 2014; Tohjima et al., 2014; Wada et al., 2011). In this study, the hourly CO data from 2004 to 2019 was used to further analyze the long-term variations in CH4 (Fig. S3). The regression slopes of ΔCO∕ΔCH4 from 2004 to 2019 were analyzed (Fig. S4). Figure 8 presents the seasonal cycles of the ΔCO∕ΔCH4 slopes. Generally, the slopes were larger in summer and smaller in winter during the observation period, except for 2004–2007 where the highest slope was in autumn. This was primarily due to the effect of monsoons and air mass transport. Tohjima et al. (2014) found an opposite variation at Hateruma Island, which showed small slope values in the summer. Wada et al. (2011) analyzed more than 10 years of seasonal variation in the ΔCO∕ΔCH4 ratios at three monitoring stations, i.e., MNM, Yonagunijima (YON), and Ryori (RYO) in Japan, which also showed an opposite trend to that of WLG. This was because these sites were considerably affected by the Asian continental source regions which had enhanced emissions of CH4 in the summer (rice paddies) and CO in the winter (fuel combustion). At WLG, regional polarization in the concentration ratios of CH4 and CO were seen (Fig. S5), which implied different strong source distributions between CH4 and CO. In the summer, the source emissions were mainly from the eastern–southeastern regions (cities) with large amounts of CO but relatively lower CH4, leading to the largest ΔCO∕ΔCH4. In contrast, the sources mostly from southwestern–western regions (Tibetan Plateau) emitted large amounts of CH4 but with relatively lower CO in the winter (Fang et al., 2013; Zhang et al., 2013). Hence, the opposite two air mass transports and source emissions led to a peak in ΔCO∕ΔCH4 in the summer and a trough in the winter (Fig. 8). These results revealed different local sources and sinks, demonstrating the special topography conditions and source distributions around WLG.
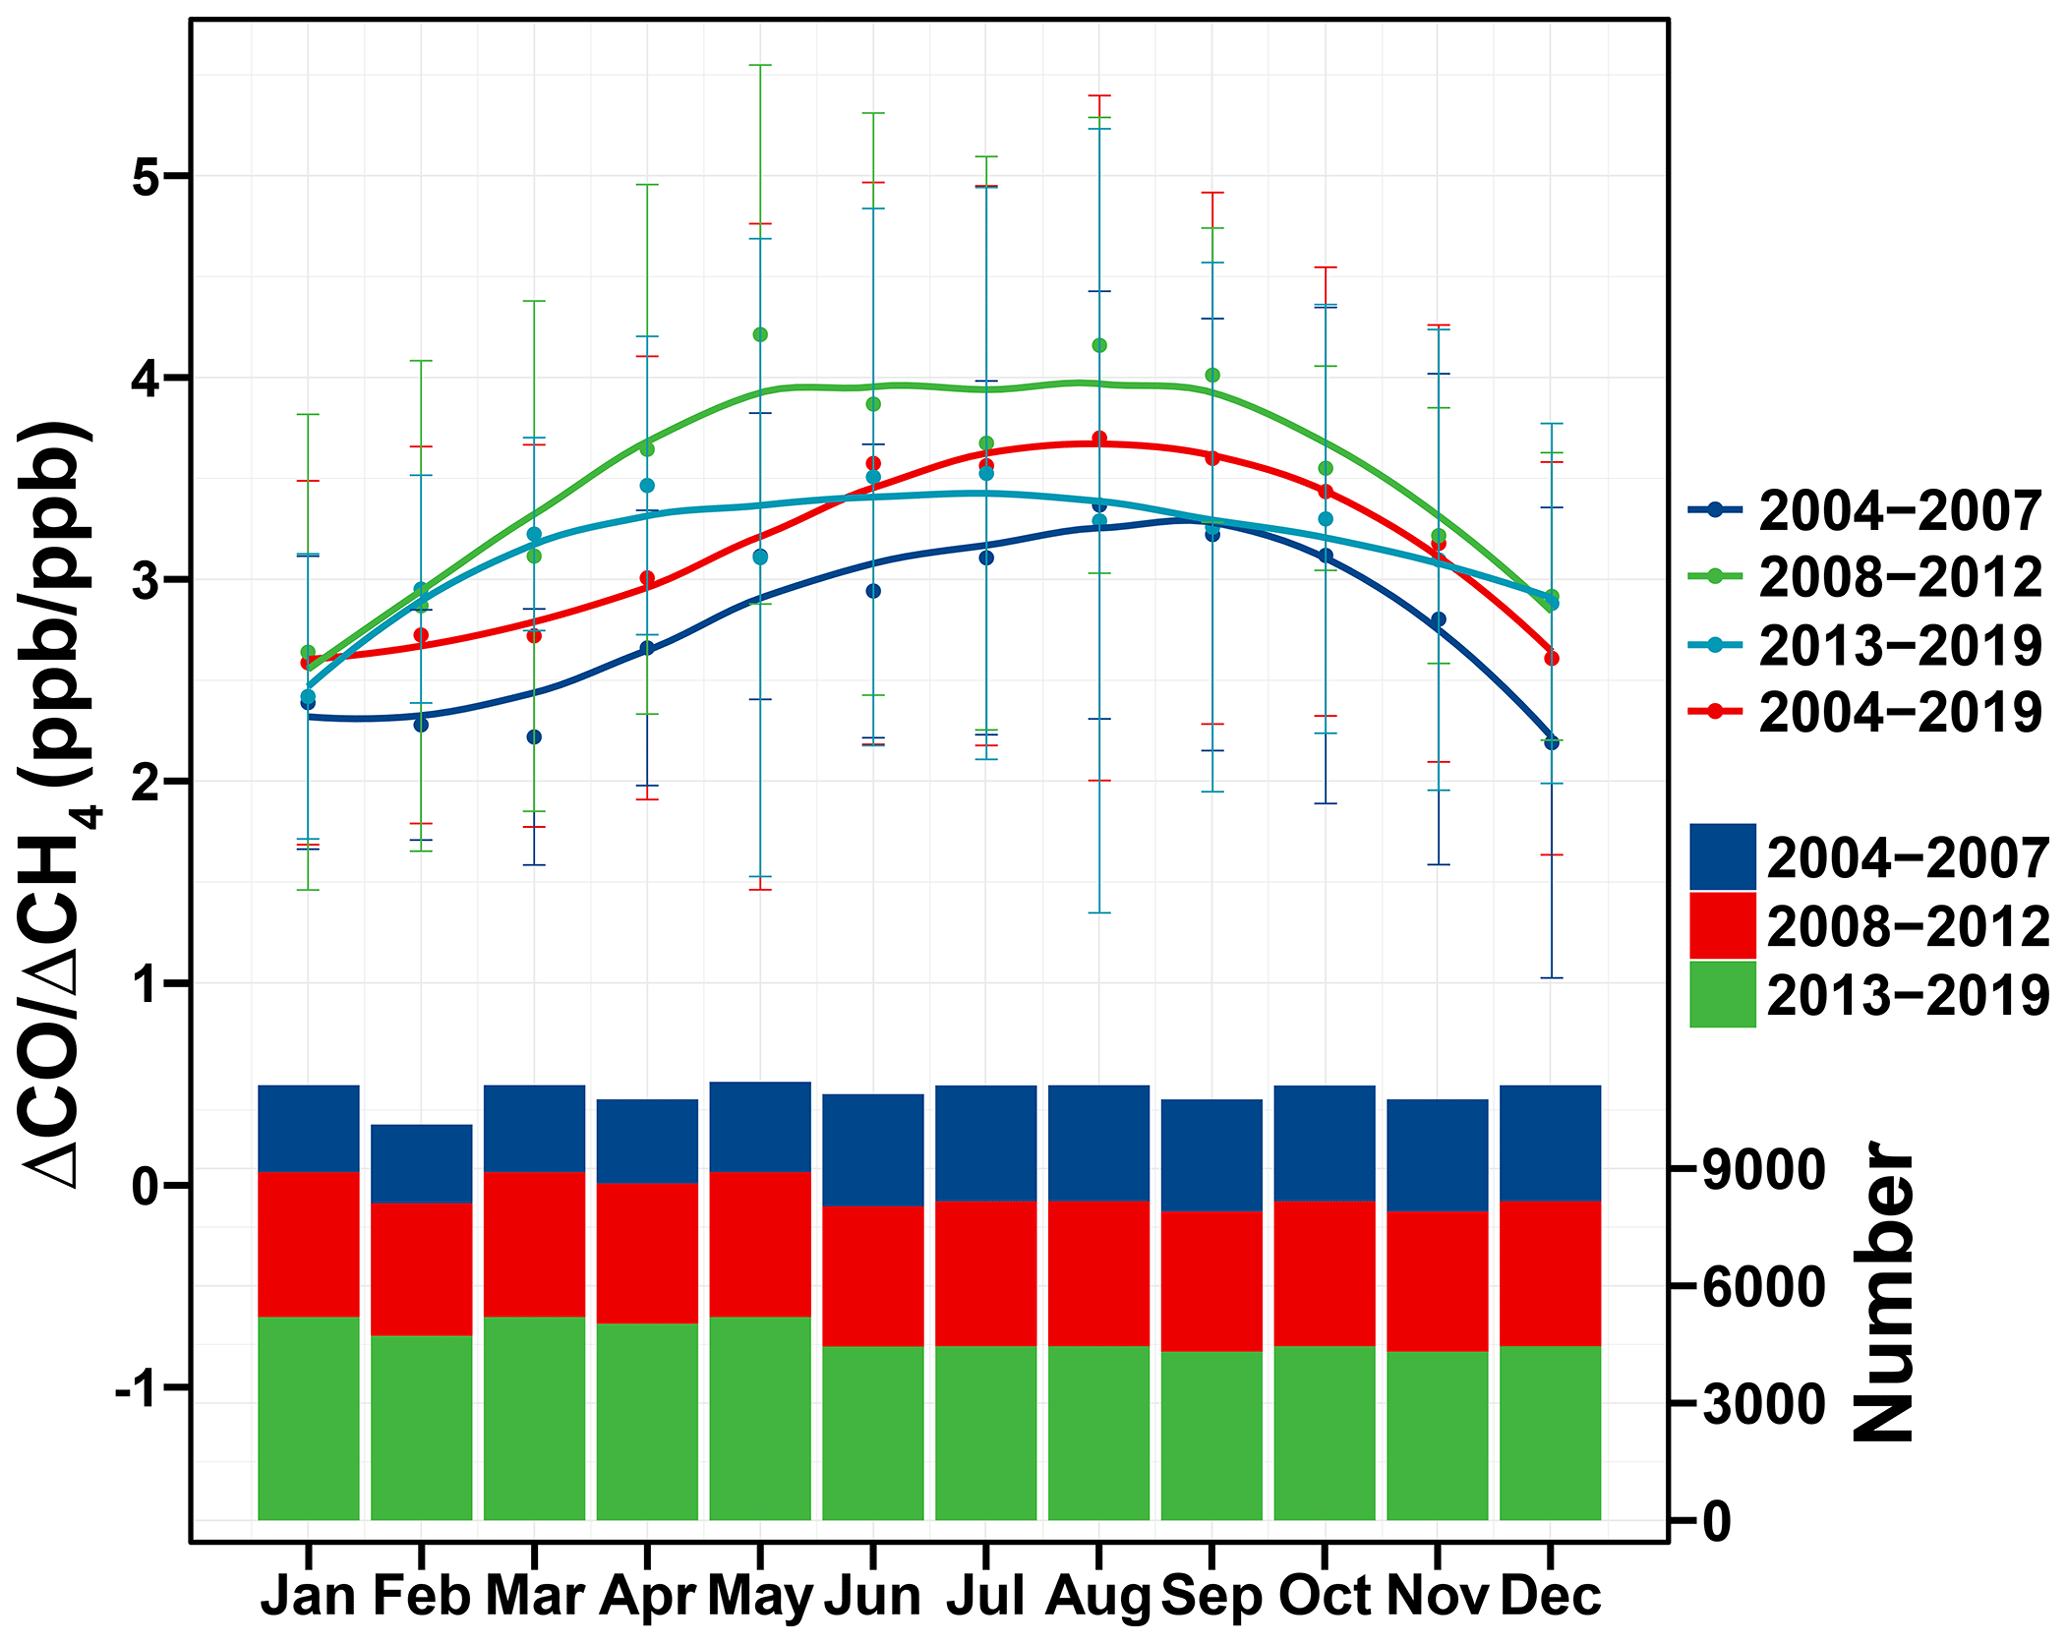
Figure 8The average seasonal variation in the ΔCO∕ΔCH4 slopes during different periods during 2004–2019 at the WLG station. The error bars show the standard deviation of the monthly averages. The lines are the smoothed curve of the averages using the method of local polynomial regression fitting (loess). The vertical bars are the monthly numbers of data in different periods.
The ΔCO∕ΔCH4 slopes showed large fluctuations from 2004 to 2019 at WLG (Fig. 9). The slopes showed a decreasing trend during 2004–2007 but then increased from 2007–2010 and decreased again after 2010. In 2007, a large increase in ΔCH4 appeared, and from 2010 to 2013, the ΔCO decreased significantly (Fig. S4). Before 2010, large air masses and potential source regions were identified in eastern regions (cities) with the highest CO emissions (Fig. 7 and Table 3). After 2010, the southwestern regions had the highest CH4 emissions but relatively low CO emissions. Therefore, the strong seasonal variation in ΔCO∕ΔCH4 also revealed that WLG was affected by different anthropogenic sources, e.g., sources from cities and sources from the Tibetan Plateau during the year, especially in the summer and winter. The long-term trend of the slopes implied that the source emission types (CO sources or CH4 sources) around WLG might have been changing with human activities, like straw burning in the early years or coal mining in recent years.
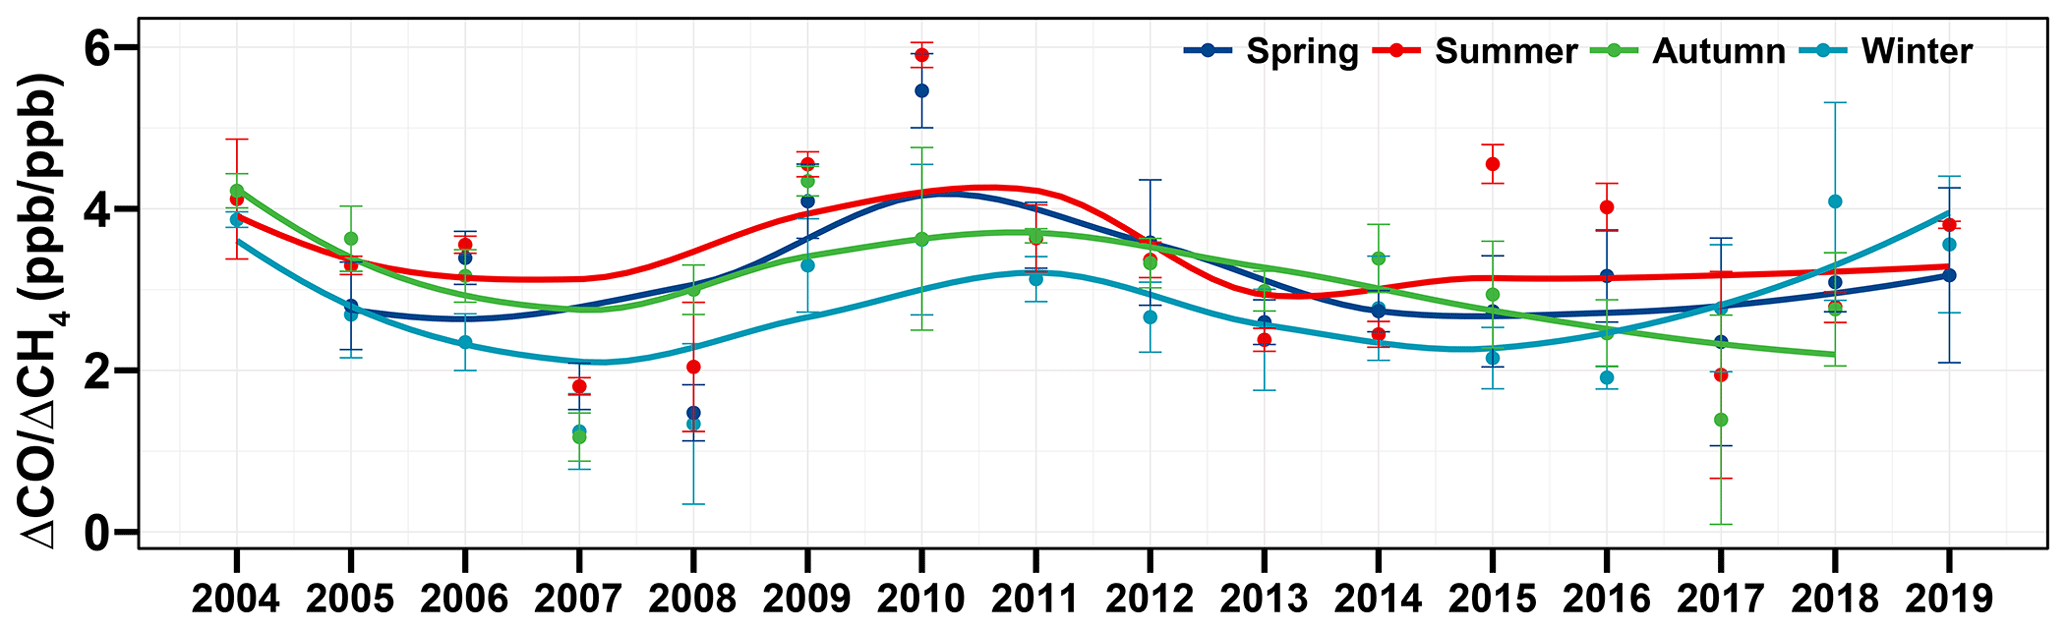
Figure 9The long-term trend of ΔCO∕ΔCH4 slopes over 2004–2019 at the WLG station. The lines are the smoothed curve of the averages using the method of local polynomial regression fitting (loess).
3.6 Variation of long-term records
3.6.1 Seasonal cycles
Overall, the seasonal averages of regionally representative CH4 at WLG were almost in a cycle, starting with summer (1861.7±0.4 ppb), then winter (1856.7±0.3 ppb), autumn (1855.9±0.4 ppb), and spring (1853.1±0.3 ppb), except during 1994–1997 where there was a maximum in the winter and a minimum in the autumn (Fig. 10). Seasonal averages in the CRs were slightly different from those in the TP and even the total regional data. The seasonal averages in the TP were mostly higher than that in the CRs from 1994 to 2019, except for the winter (Table S2). The maximum mole fractions were mostly found in August, and the minimum mole fraction appeared in April for the total regional time series, with a seasonal amplitude of 14.4 ppb. The peak-to-trough amplitude in the CRs (∼16.7 ppb) was higher than that in the TP (∼15.1 ppb) during 1994–2019. The seasonal variations were consistent with the previous short-term studies from 2002–2006 at WLG (Zhang et al., 2013). However, these variations were almost opposite to observations at the adjacent stations of Lin'an, Shangdianzi, and Longfengshan in China (Fang et al., 2013, 2016). For other regional sites in the Asia, Guha et al. (2018) studied seasonal variability at the Sinhagad (SNG) and Cape Rama stations (CRI) over India, which also showed an opposite trend to WLG due to the strong impact of monsoon dynamics. Ahmed et al. (2015) found that the seasonal CH4 showed a maximum in the winter and a minimum in the spring at two urban sites of Guro (GR) and Nowon (NW), in Seoul, South Korea, over 2004–2013. Kim et al. (2015) investigated the decadal variation (1991–2013) in CH4 at the East Asian sites, e.g., Ulaan-Uul (UUM) in Mongolia and Tae-ahn Peninsula (TAP) in South Korea, which again revealed an opposite seasonal trend to that of WLG.
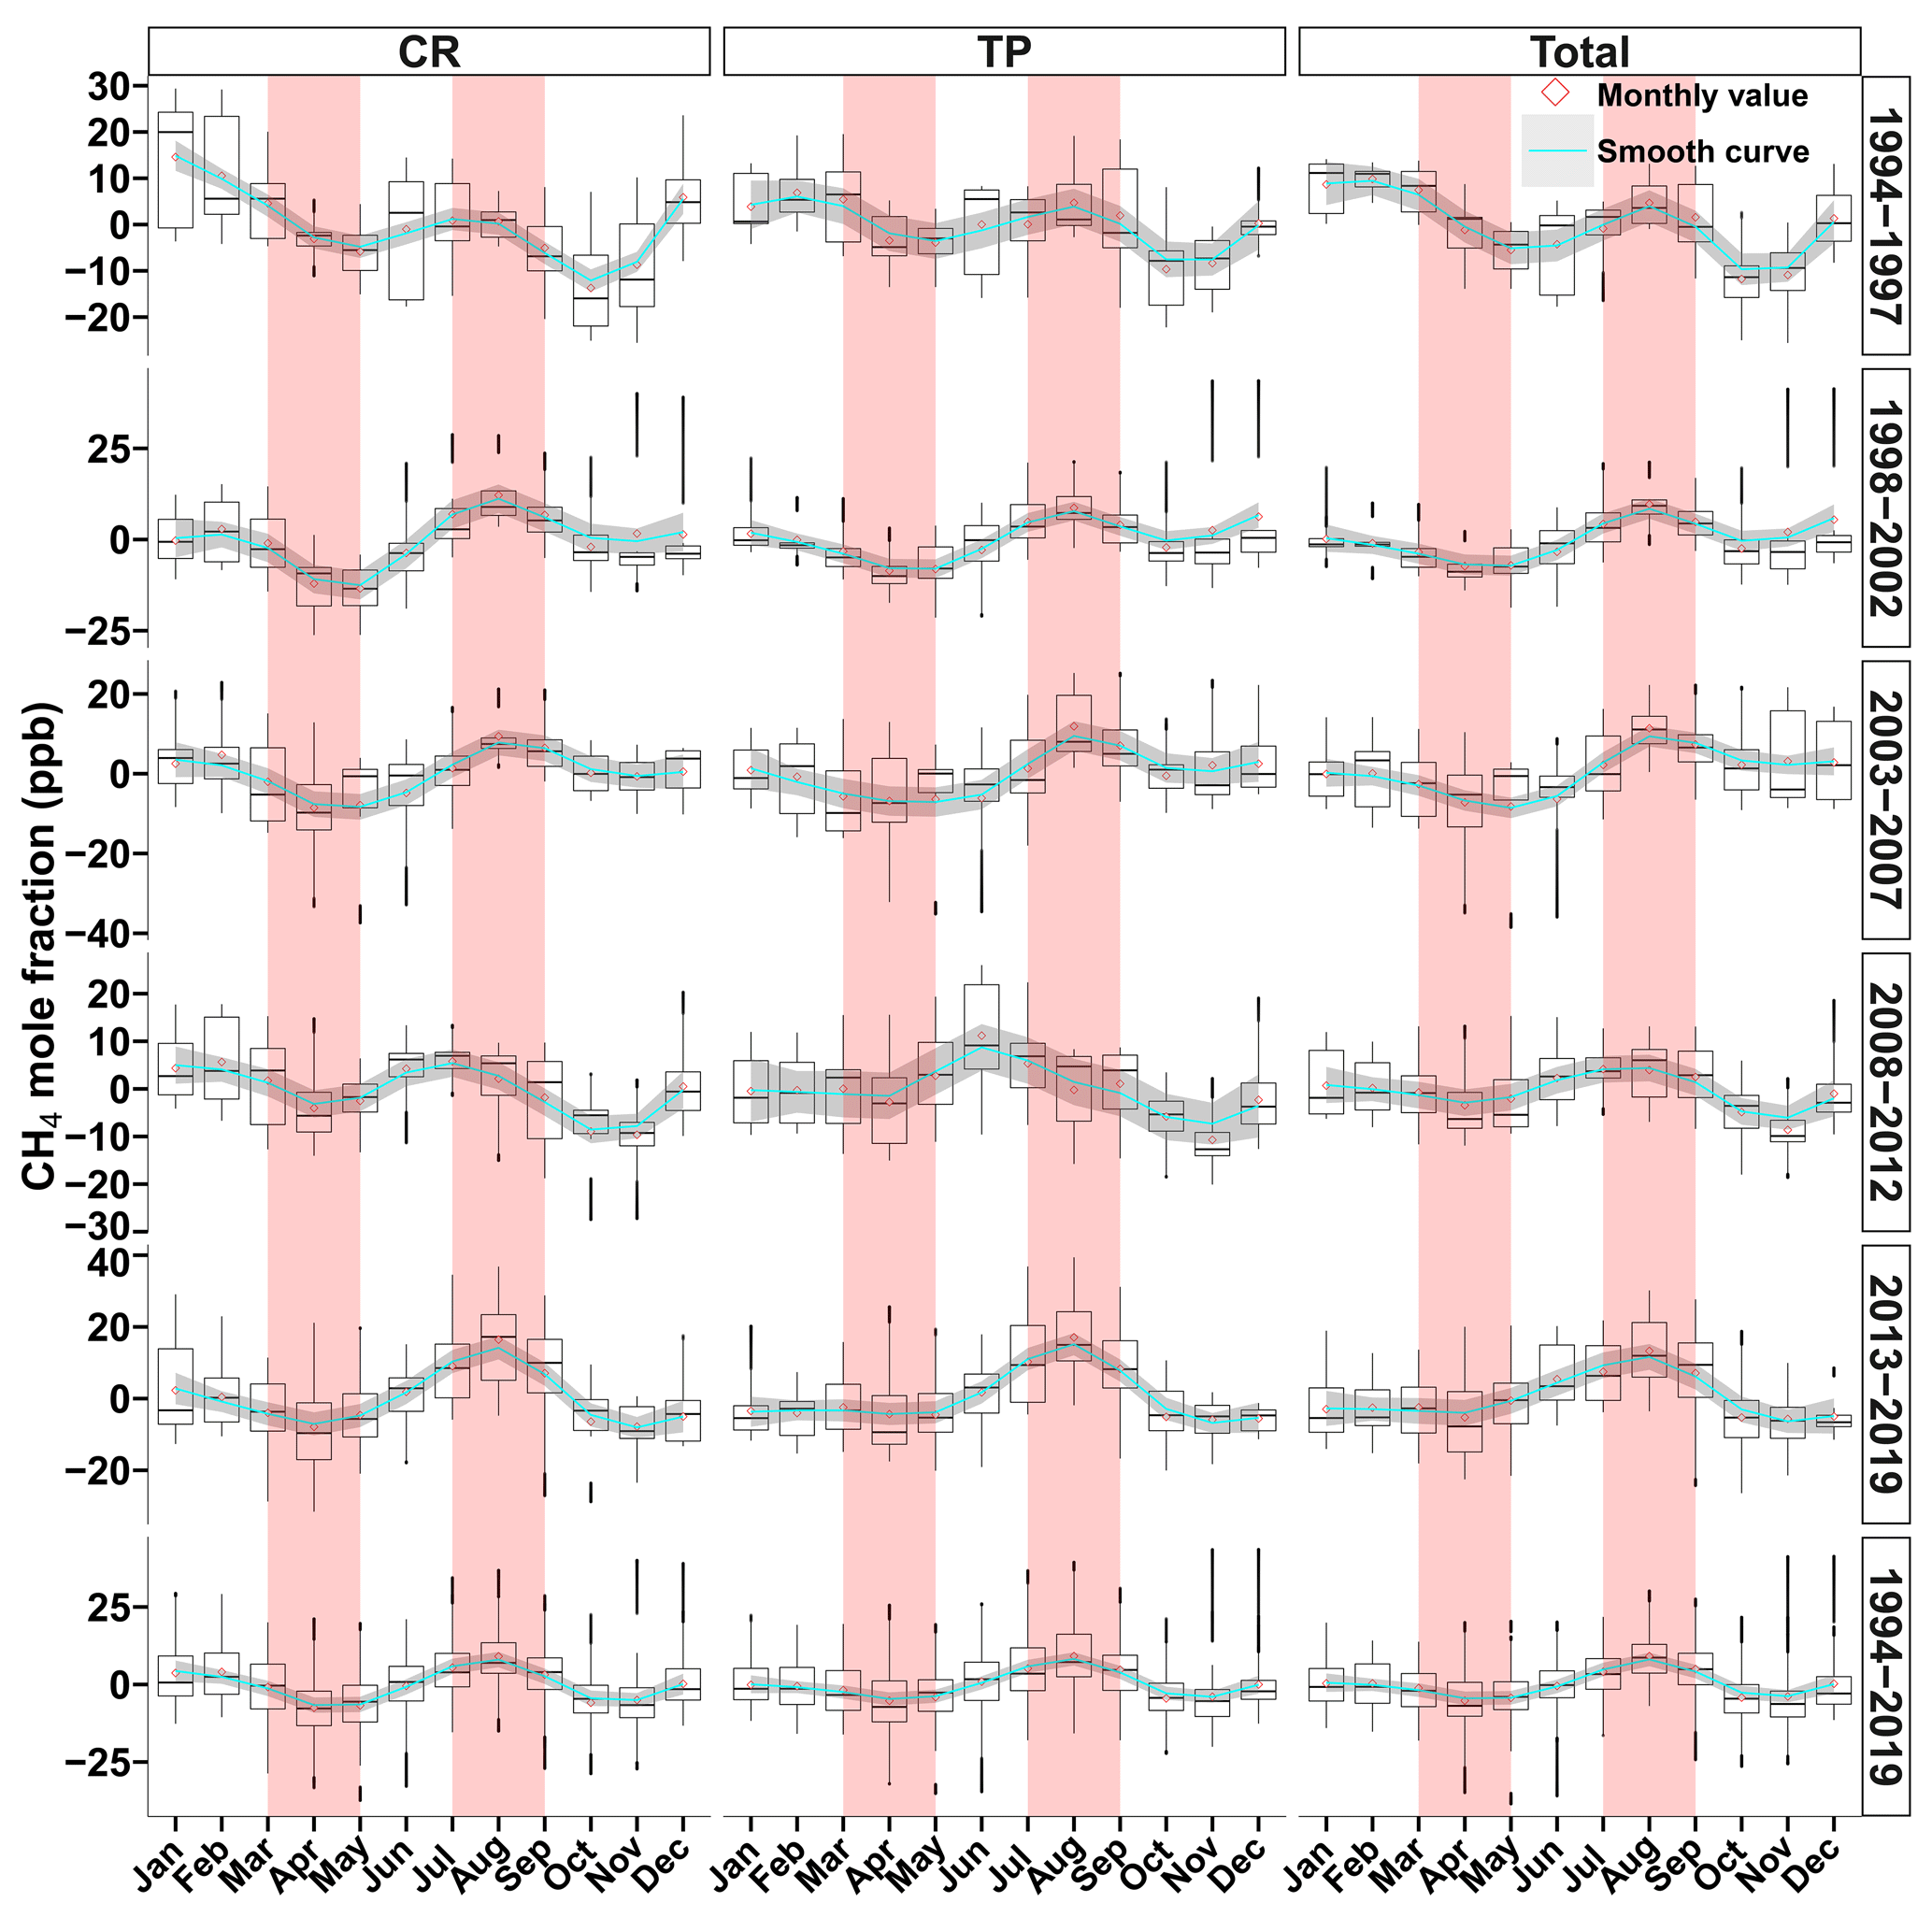
Figure 10Monthly variations in regional CH4 mole fractions from 1994 to 2019 at WLG station. CR, TP, and total represent the measurements from the city region, the Tibetan Plateau, and the total regional records, respectively. The box shows the 25th percentile, the median, and the 75th percentile from bottom to top. The bottom and the top whiskers, respectively, reach the minimum and 1.5 times the interquartile range (IQR). The black points are identified as outliers. The red squares are the averages. The cyan lines are the smoothed curve of the averages using the method of local polynomial regression fitting (loess). The gray bands are the 95 % confidence interval of smoothed curve.
The data were further compared with similar WMO/GAW global stations in the Northern Hemisphere, including MLO (19.54∘ N, −155.58∘ E, 3397 m a.s.l.; Dlugokencky et al., 1995, 2019a), JFJ (46.55∘ N, 7.99∘ E, 3580 m a.s.l.; Zellweger et al., 2016), MNM (24.29∘ N, 153.98∘ E, 7.1 m a.s.l.; Matsueda et al., 2004; Tsutsumi et al., 2006), and the marine boundary layer (MBL) from the NOAA/ESRL laboratory at a similar latitude (Dlugokencky et al., 2019b). It was seen that the stations in the Northern Hemisphere and at the MBL showed an opposite trend to WLG, with the minimum being in summer and maximum in the winter or spring (Fig. 11). The peak in the summer at WLG was attributed to larger grazing, human activities, ruminants, and easterly winds coming from neighboring areas over other seasons. The CH4 emissions from yaks and other ruminants in the Tibetan Plateau (alpine pasture) were very strong in the summer, preceded only by paddy emissions (Fang et al., 2013; Zhang et al., 2013). Furthermore, the dynamic transport by airflow from the polluted northeastern or southeastern region was also strong in summer, which all induced high CH4 mole fractions and, consequently, an opposite trend to other sites (Ma et al., 2002; Xiong et al., 2009).
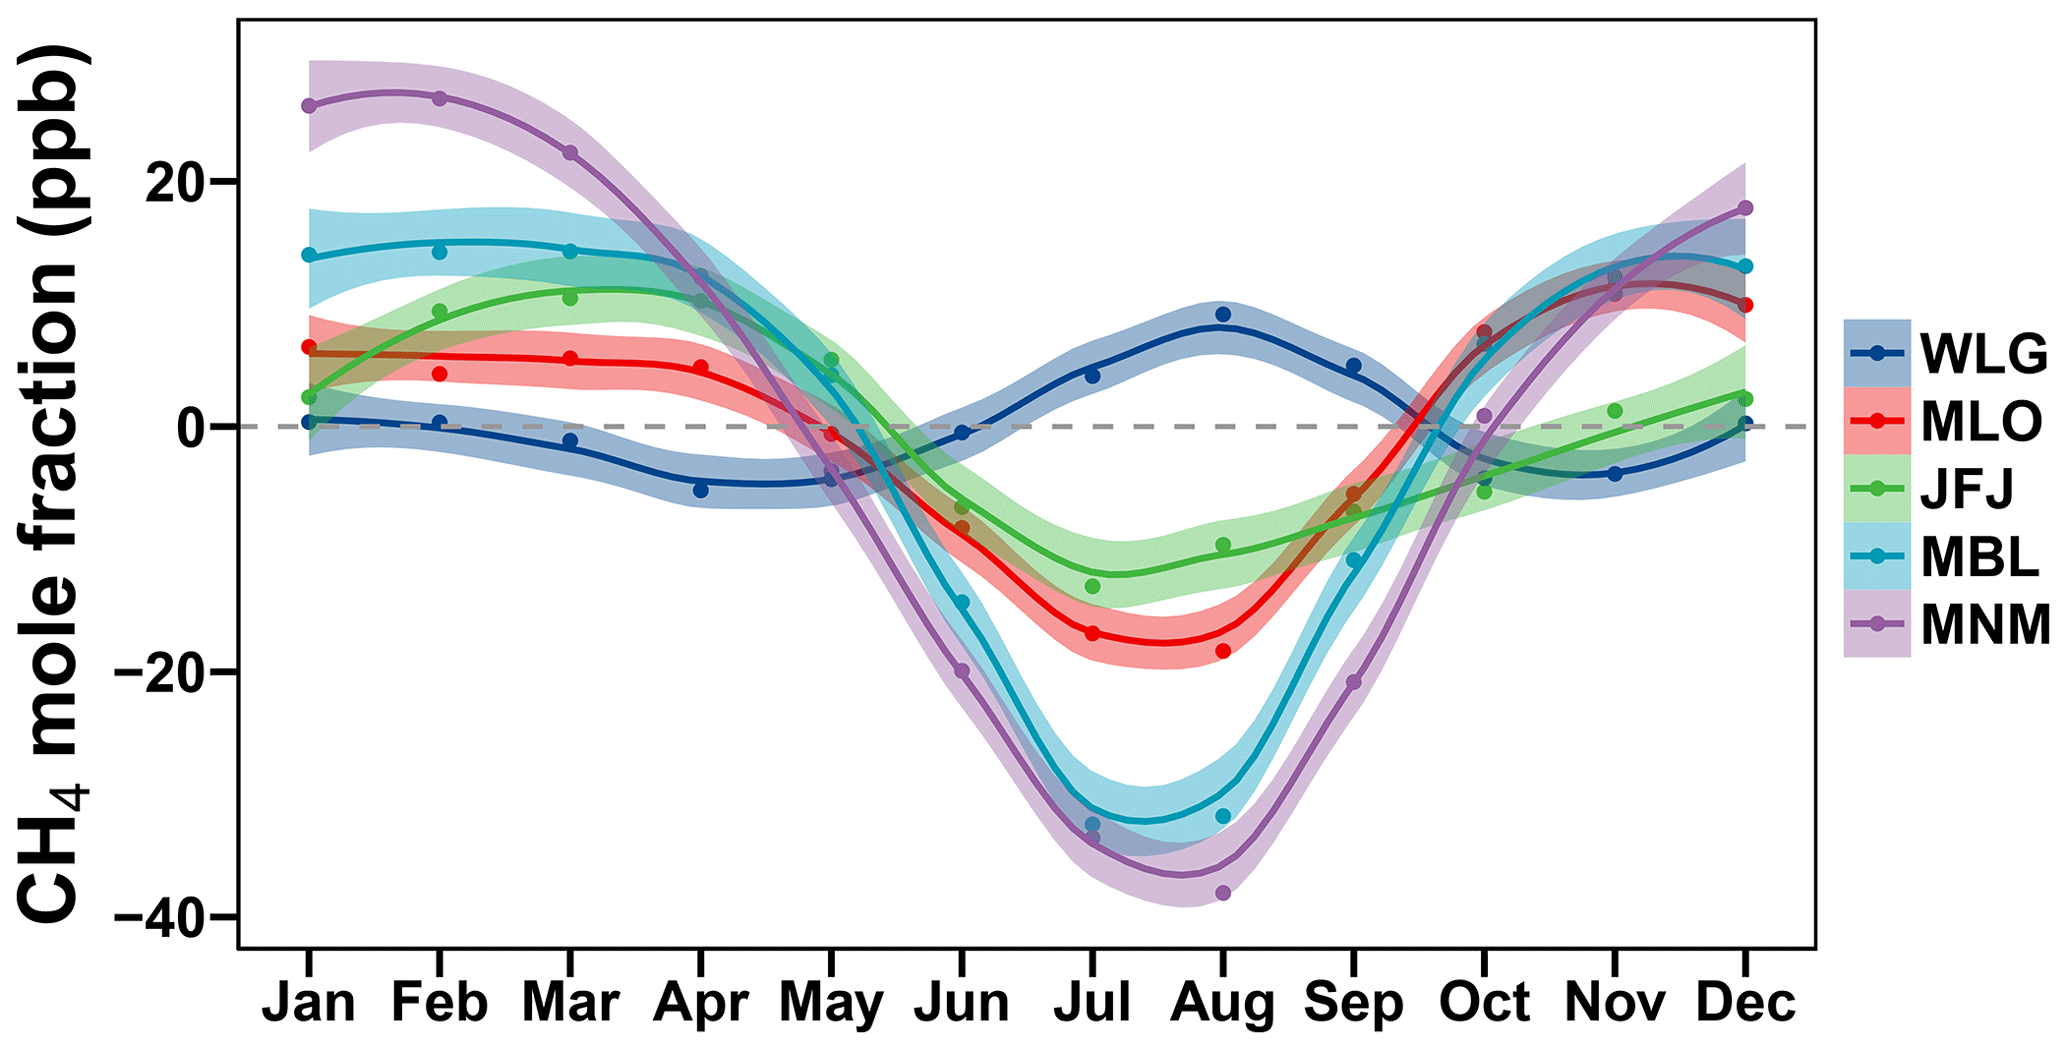
Figure 11The seasonal cycles of atmospheric CH4 observed at the WMO/GAW global stations of Mauna Loa (MLO; 1994–2018), Jungfraujoch (JFJ; 2005–2018), Minamitorishima (MNM; 1994–2019), and Mt. Waliguan (WLG; 1994–2019) in the Northern Hemisphere. The data of other sites (except WLG) are from the World Data Centre for Greenhouse Gases (WDCGG). The data in the marine boundary layer (MBL; 1994–2019) are from NOAA/ESRL laboratory at a similar latitude to WLG.
The seasonal amplitude at WLG (∼14 ppb) was significantly lower than many other sites in the Northern Hemisphere by about 35–70 ppb. Such sites included MLO in North America, BRW in the North Pole, UUM in Mongolia, TAP in South Korea, Ny-Ålesund in Norway, Bialystok in Poland, Ochsenkopf in Germany, and Beromunster in Switzerland (Dlugokencky et al., 1995; Kim et al., 2015; Morimoto et al., 2017; Thompson et al., 2009; Popa et al., 2010; Satar et al., 2016). The MBL also showed a larger amplitude than WLG (Fig. 11). The study at the SNG and CRI over India showed a much larger amplitude close to 200 ppb (Guha et al., 2018). The low amplitude at WLG was because of the high elevation of the continental mountain sites, where there were relatively fewer effects from local influences than at the coastal and island sites (Yuan et al., 2019). Additionally, the seasonal amplitudes indicated different trends between the CRs and TP. For the CRs, the seasonal amplitude decreased at first and then increased over time, which was similar to the variation in the total regional events. But, for the TP, the amplitude had a continuously increasing trend, with values of 15.1, 18.1, 21.4, 20.4, and 23.7 ppb in 1994–1997, 1998–2002, 2003–2007, 2008–2012, and 2013–2019, respectively. This revealed that the Tibetan Plateau was intensively affected by strong regional sources (e.g., grazing or emissions from India) over time.
3.6.2 Long-term trend
The fluctuating trend in atmospheric CH4 during 1994–2019 at WLG (Fig. 12) was similar to the global trend reported by many studies (Bergamaschi et al., 2013; Rigby et al., 2017; Nisbet et al., 2019). In the 1990s, the CH4 growth rates were very small or even negative at WLG. Subsequently, a steady period with near-zero growth rates was found during 2002–2006. However, the atmospheric CH4 increased significantly after 2007 (Fig. 12a). In 1997–1998, 2000–2001, 2007–2008, and 2011–2012, a large fluctuation in the growth rates was found, and a strong growth appeared (Fig. 12b). The growth rates fluctuated evenly with both positive and negative values before 2009. However, almost all of the growth rates showed a positive value after 2009. Three developing stages (i.e., highlighted green, blue, and red blocks in Fig. 12) could be seen from the 1990s to 2010s. The CH4 mole fraction slightly decreased during 1998–2000 (green coloring), then went through a relatively steady period during 2003–2006 (blue coloring), and finally increased rapidly after 2007 (red coloring; Fig. 12).
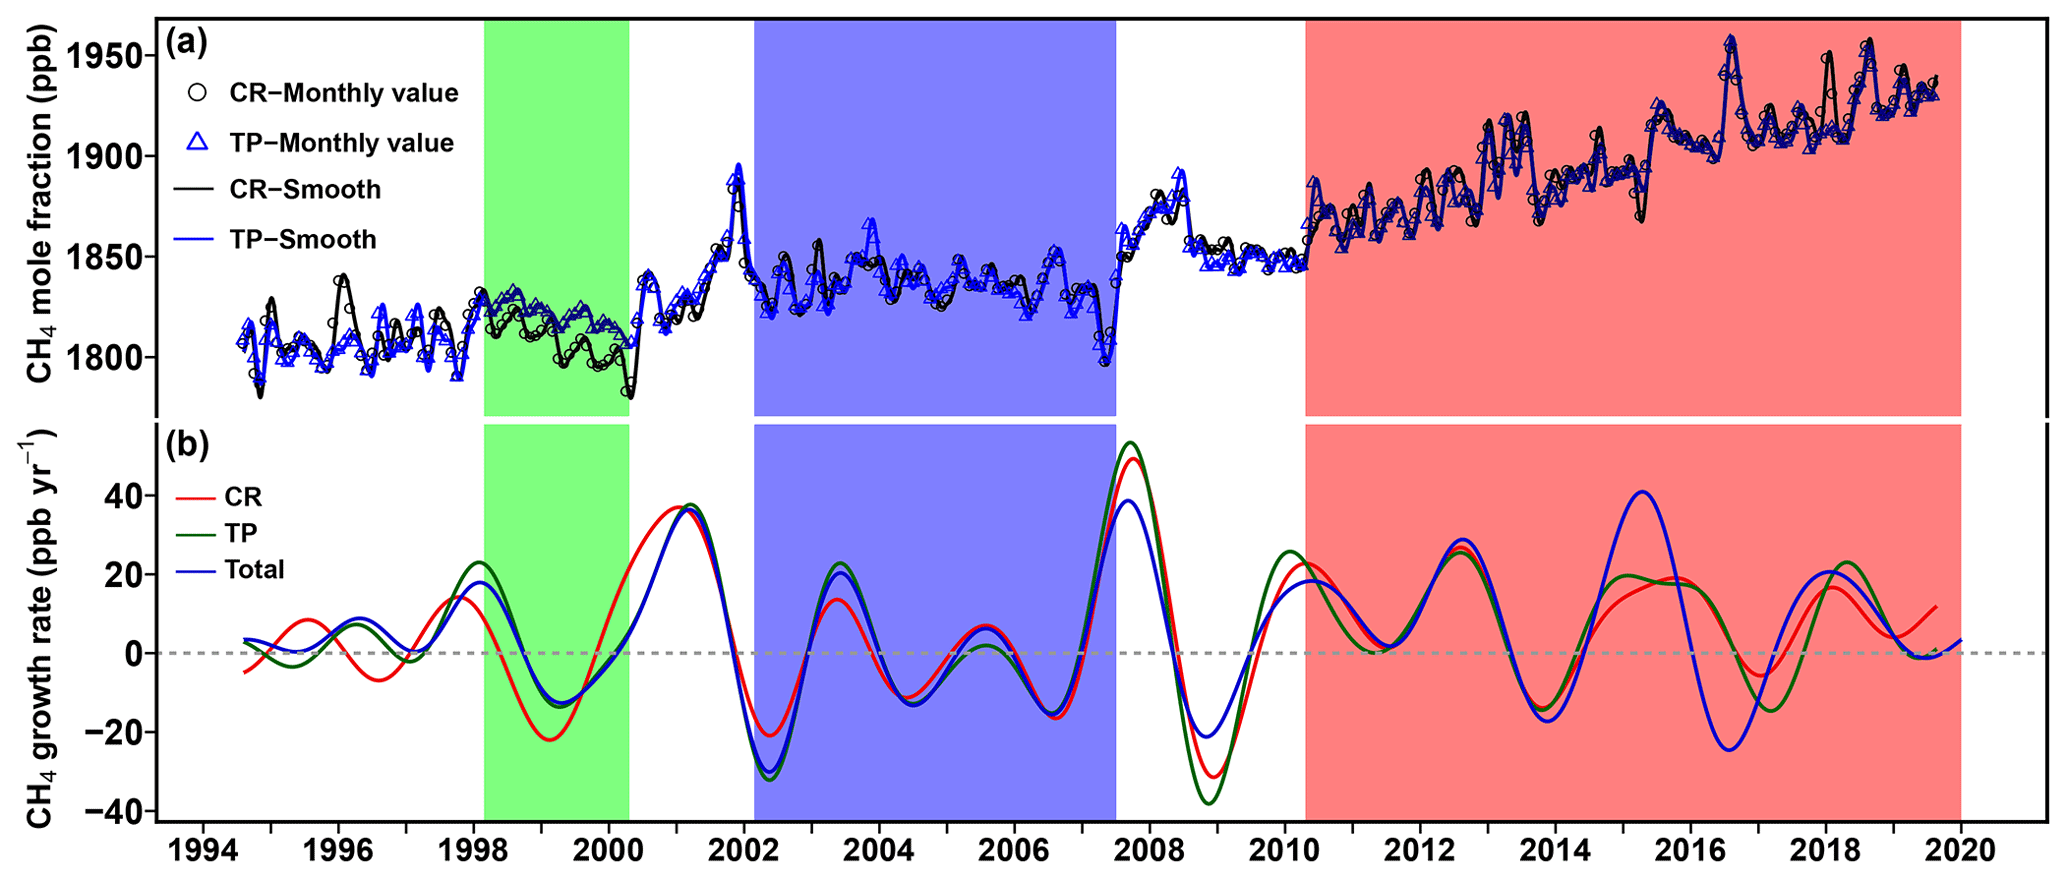
Figure 12(a) The smoothed curves and monthly values of the CH4 mole fractions in the city regions (CRs) and the Tibetan Plateau (TP) during 1994–2019 at the WLG station. (b) The annual growth rates of the atmospheric CH4 records from the CRs and the TP and the total regional time series. The growth rates were calculated from the first derivative of the trend curves. The smoothed curves and the trends were calculated using the method of Thoning et al. (1989).
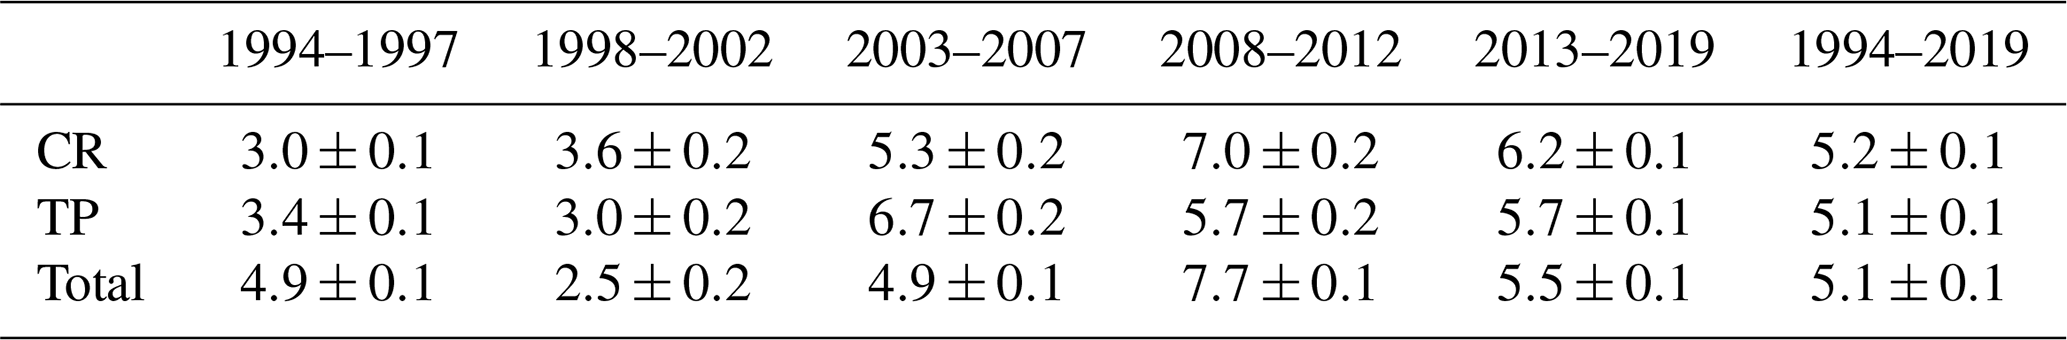
The annual growth rate was 5.1±0.1 ppb yr−1 throughout 1994–2019 at WLG (Table 4). The periodic annual growth rates were 4.9±0.1, 2.5±0.2, 4.9±0.1, 7.7±0.1, and 5.5±0.1 ppb yr−1 during 1994–1997, 1998–2002, 2003–2007, 2008–2012, and 2013–2019, respectively. Similar growth rates were found between the CRs and the TP during 1994–2019 (Fig. S6). In 1994–1997 and 2003–2007, the growth rates in the TP were even larger than that in the CRs (Table 4). These results indicated that there were also strong CH4 sources from the TP. A previous study by Zhou et al. (2004) showed the annual increase in CH4 by 4.5 ppb yr−1 in 1992–2001, which was close to our study in 1994–1997 and 1998–2002. Tohjima et al. (2002) found that the CH4 levels at the Cape Ochiishi and Hateruma island in 1995–2000, respectively, increased by 4.5 and 4.7 ppb yr−1, which were also similar to that of WLG. Tsutsumi et al. (2006) analyzed the trend of hourly CH4 data from 1998 to 2004 on the YON, which showed a similar increase (∼3.0 ppb yr−1) to WLG. The study at the GR and NW in Seoul, South Korea, presented almost an identical trend of 2 ppb yr−1 between 2004 and 2013 (Ahmed et al., 2015), which was lower than that of WLG in similar period. In the early 1990s, the CH4 growth rates at WLG were very low and similar to the global level. The level of •OH radicals might control the decrease or increase in CH4 in the atmosphere during this period (Dlugokencky et al., 1998; Rigby et al., 2017; Turner et al., 2017). However, the growth rates were high in 1998 (Fig. 12b), which may have been due to the high temperatures and a large amount of biomass burning (Cunnold et al., 2002; Lelieveld et al., 2004; Simmonds et al., 2005). The growth rate of CH4 observed at Ny-Ålesund, Norway, increased from 0.3±0.2 ppb yr−1 during 2000–2005 to 5.5±0.2 ppb yr−1 during 2005–2014, which had a similar variation but with a slightly lower growth rates than that of WLG (Morimoto et al., 2017). The study suggested that the temporal pause in 2000–2005 was ascribed to the reductions in CH4 emissions from the microbial and fossil fuel sectors, while the increase in 2005–2014 was due to an increase in microbial release.
Table 4Annual growth rates of atmospheric CH4 in the city regions (CRs), the Tibetan Plateau (TP), and total regional records from 1994 to 2019 at the WLG station.
The constantly larger CH4 growth rate after 2007 at WLG (Fig. 12; Table 4) was similar to the recent studies by Nisbet et al. (2016, 2019), which showed that the global CH4 increased by 5.7±1.2 ppb yr−1 in 2007–2014 and was much higher at 12.7±0.5 ppb yr−1 in 2014, with 10.1±0.7 ppb yr−1 in 2015, 7.0±0.7 ppb yr−1 in 2016, and 7.7±0.7 ppb yr−1 in 2017. The average growth rate in the Northern Hemisphere was 7.3±1.3 ppb in 2007 and 8.1±1.6 ppb in 2008 (Dlugokencky et al., 2009), which was also similar to the observation at WLG (Table 4). After 2007, most sites in the Northern Hemisphere had large CH4 growth rates. Also, the average global growth rate was similar to WLG at 7.1 ppb yr−1 in the most recent 10 years (WMO, 2019). Fang et al. (2013) showed that the annul growth rate of CH4 was 9.4±0.2 ppb yr−1 in 2009–2011 at WLG, which was a little higher than this study in 2008–2012. The adjacent stations in China also revealed the high CH4 growth rates of 8.0±1.2 ppb yr−1 at Lin'an in 2009–2011, 7.9±0.9 ppb yr−1 at Longfengshan in 2009–2011, and 10±0.1 ppb yr−1 at Shangdianzi in 2009–2013 (Fang et al., 2013, 2016), which were all higher than the similar periods of 2008–2012 or 2013–2019 at WLG (Table 4). The CH4 measurements in other countries, such as the Beromünster tall tower station, also showed a high growth rate of 9.66 ppb yr−1 in 2012–2014 (Satar et al., 2016). The warm temperatures, biomass burning, and climatic anomalies (El Niño or La Niña) likely enhanced the CH4 emissions after 2007 (Dlugokencky et al., 2009). The anomalous years of increasing or decreasing (e.g., 2007–2008) might have had a significant influence on the overall CH4 trend (Fig. 12). These frequent anomalies also appeared in most long-term observation stations, e.g., MLO in the USA (Dlugokencky et al., 2009) and the Zugspitze mountain in Germany (Yuan et al., 2019), due to climatic forces such as those exceptions during the El Niño oscillation, i.e., forest fires, volcanic eruptions, and extreme weather events (Keeling et al., 1995; Dlugokencky et al., 2009; Keenan et al., 2016; Nisbet et al., 2019).
Many studies have investigated the potential reasons for the anomalous increase. The study by Satar et al. (2016) at Beromünster, Switzerland, explained that the short-term spikes were possibly related to emissions from agricultural activities, while the longer-lasting peaks were because of air mass transport and mixing. The isotopic evidence suggested that the significant increase in biogenic emissions was the dominant factor leading to the CH4 rise. This was especially true in the tropical wetlands that had strong rainfall anomalies, and agricultural sources such as rice paddies and ruminants were a cause, while fossil fuel emissions were not the main cause (Nisbet et al., 2016). A study of thaw ponds at Arctic regions revealed that there was a very weak correlation between the amount of CH4 released from ponds and environmental factors, e.g., air temperature and atmospheric pressure (Burke et al., 2019). Sweeney et al. (2016), using 29 years of measurements from the North Slope of Alaska (BRW) to investigate the sensitivity of CH4 emissions to the temperature change, revealed that despite the short-term temperature sensitivity increasing CH4 emissions, it would have little impact in the long term. However, up to now, the specific causes of such distinct variability through the years, including the spikes or near-zero CH4 growth rates, have not yet been determined. It is well established that human activities were mainly responsible for the recent rapid CH4 growth rates and anomalies. The analysis from EDGAR showed the CH4 emission per sector in China (Fig. S7; Crippa et al., 2019a). During the observation period, the waste, oil, natural gas combustion, and open burning continuously emitted large amounts of CH4 into the air. After 2000, the CH4 emissions from solid fuel increased greatly in China. After 2003, the CH4 emitted from rice cultivation also increased continuously (Fig. S7). The increased emissions from these sectors greatly contributed to the CH4 increase at WLG and other regions in China. In addition, studies revealed that China's coal sector dominated the positive trend in recent years, which contributed to the highest proportion of anthropogenic CH4 emissions (∼33 %; Janssens-Maenhout et al., 2019; Miller et al., 2019). In 2010–2015, China's coal production increased (from 3400 to 4000 million metric tonnes), but CH4 emissions from rice cultivation, agriculture practices, ruminants, waste, and oil or gas consumption only increased slightly – if at all (U.S. EIA, 2017). Therefore, the control measures of coal mining reduction or limiting natural gas and petroleum exploitation may play an important role in slowing down CH4 emissions in China.
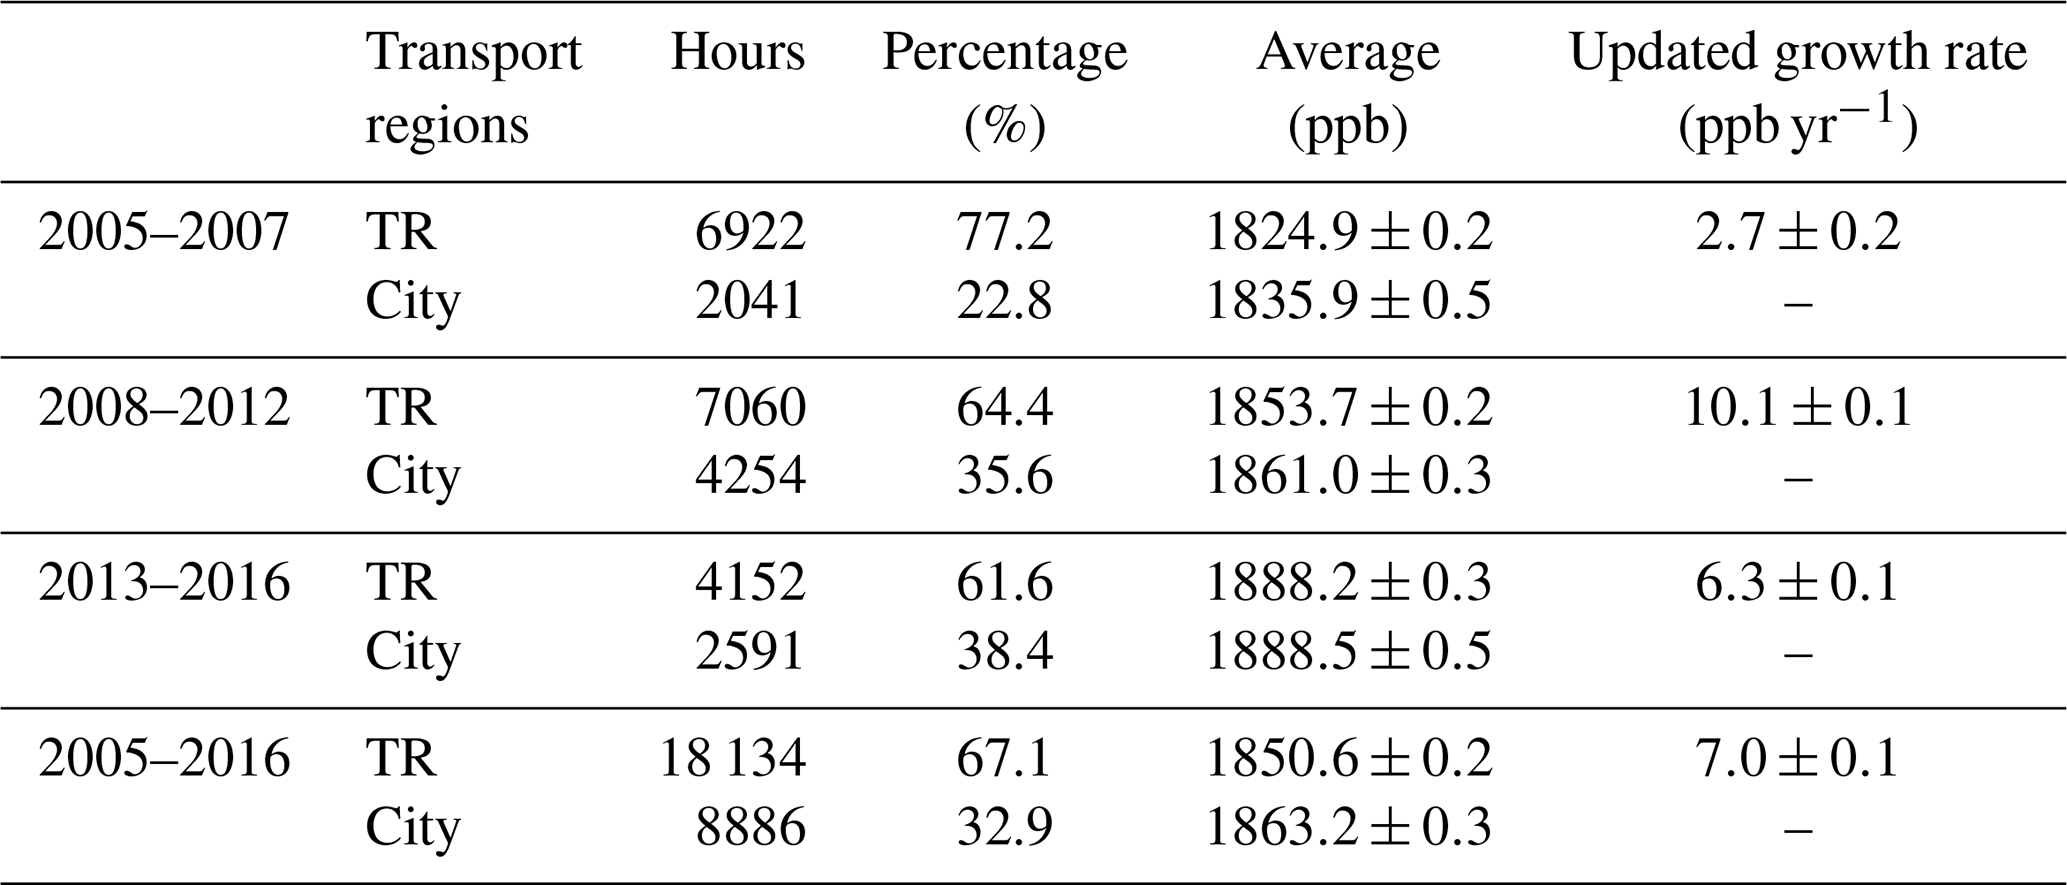
Table 5The statistics of CH4 data without air mass transport regions (TRs) from cities over different periods during 2005–2016 at the WLG station.
3.7 Case study for air mass transport
As described above, the northeastern and southeastern city regions might have acted as strong regional sources influencing the atmospheric CH4 at WLG. Therefore, to analyze the effect of long-range transport of emissions from cities, the regionally representative data was further excluded by air mass transport, and the remaining regional records were denoted as TR. First, the monthly cluster analysis was applied to hourly trajectories over 2005–2007, 2008–2012, and 2013–2017. Then, based on the cluster analysis, the clusters were divided into two groups, i.e., from city regions (red clusters in Fig. S8) and other regions (black clusters in Fig. S8). Finally, the regionally representative data were accordingly classified as two groups based on the cluster results (cities or other). The statistical results were presented in detail in Fig. S8 and Table S3.
Consequently, the proportions of trajectories from cities were 40.3 %, 32.5 %, and 6.8 % in 2005–2007, 2008–2012, and 2013–2017, respectively. About 22.8 %, 35.6 %, and 38.4 % of the regional records were associated with air masses from city regions in 2005–2007, 2008–2012, and 2013–2017, respectively (Table 5). The average CH4 values for the city region air masses (1863.0±0.3 ppb) were higher than the other sectors (1850.6±0.2 ppb; Fig. S9). The overall growth rates of the TR in the periods of 2005–2016 or 1994–2016 were similar to the original data series (Fig. S9). However, after excluding the CH4 records for the air trajectory transports from city regions, the growth rates of the TR in 2008–2012 (10.1±0.1 ppb yr−1) and 2013–2017 (6.3±0.1 ppb yr−1; Table 5) were higher than the original regional data series (i.e., 7.6±0.2 and 5.7±0.1 ppb yr−1; Table 4). These results suggested that there were possibly other strong CH4 sources at WLG that were not from cities, and the southwestern region (northern India) was the most likely contributor. The PSCF analysis also supported this result (Fig. 7). At present, northern India and eastern China are the two largest sources of CH4 at WLG (Fig. S10; Crippa et al., 2019a). Since the Tibetan Plateau is coincidently trapped in the middle of them, the atmospheric CH4 at WLG was very likely dominated by long-range transport from these two regions. Although CH4 emissions increased slowly during 1994–2002 and a negative trend appeared (Fig. S10), significantly increased emissions were found in both southeastern and southwestern Asia after 2007. Chen et al. (2013) illustrated that the warming (0.2 ∘C per decade) in the Tibetan Plateau resulted in substantial emissions of CH4 due to the thawed permafrost and melted glaciers. The rapid increase in CH4 would probably make it difficult to meet the goals of carbon emission reduction in the future. This would be especially true with the scenario of quickly increasing CH4 on the Qinghai–Tibetan Plateau due to the emissions from the two largest source regions of northern India and eastern China. The large growth rate of atmospheric CH4 in the TP revealed that (i) the atmospheric CH4 at WLG was not predominantly influenced by eastern cities in recent years, and (ii) large amounts of CH4 were transported from the Tibetan Plateau to WLG in recent years.
A total of three developing stages of atmospheric CH4 at Mt. Waliguan from the 1990s to 2010s were found. The CH4 mole fractions slightly decreased during 1998–2000, then went through a relatively steady period during 2003–2006, and finally increased rapidly after 2007. Although near-zero and even negative growth appeared in some periods, the overall CH4 increased rapidly, especially in recent years. Although most areas around WLG had small contributions to the CH4 emissions, two strong source regions were found from the northeast and southwest of the site. Northern India has possibly become a stronger contributor than city regions were in the past. The temporal patterns, annual variations, long-term trends, or source distribution of CH4 at WLG were all changed in recent years. We found that WLG was increasingly affected by local sources, such as human activities. Additionally, the Tibetan Plateau was intensively affected by strong sources over time, which showed a larger growth rate than that of the city regions in some periods. The anomalous variation in and unprecedented growth rate of the atmospheric CH4 in this region revealed that controlling CH4 emissions is urgent. Reducing the emissions from strong source sectors like coal mining, natural gas or solid fuel exploitation, and rice cultivation may play an important role in CH4 emissions reduction in China.
The gridded meteorological data (2004–2019) from NOAA-ARL are available at ftp://arlftp.arlhq.noaa.gov/pub/archives/gdas1/ (last access: 2 January 2020, Air Resources Laboratory, ARL, 2020). The data from MLO, JFJ, and MNM stations were downloaded from the World Data Centre for Greenhouse Gases (WDCGG) at https://gaw.kishou.go.jp/search (last access: 10 April 2020, WDCGG, 2020; Dlugokencky et al., 1995, https://doi.org/10.1029/95JD02460; Dlugokencky et al., 2019a, ftp://aftp.cmdl.noaa.gov/data/trace_gases/CH4/in-situ/surface/; Matsueda et al., 2004, https://doi.org/10.2467/mripapers.54.91; Tsutsumi et al., 2006, https://doi.org/10.1016/j.atmosenv.2006.04.036; Zellweger et al., 2016, https://doi.org/10.5194/amt-9-4737-2016). The MBL data are available at ftp://aftp.cmdl.noaa.gov/data/trace_gases/CH4/flask/surface/ (last access: 10 March 2020, Dlugokencky et al., 2019b). The geographical distribution of the annual emission data by Emissions Database for Global Atmospheric Research (EDGAR) are available at https://doi.org/10.2904/JRC_DATASET_EDGAR (Crippa et al., 2019b).
The supplement related to this article is available online at: https://doi.org/10.5194/acp-21-393-2021-supplement.
SL, SF, and ZF designed the research. SL performed the data processing with the assistance of SF and MG. The stations were monitored and maintained ML and PL, and they collected, preprocessed, and provided the hourly observational data set. SL and SF finished the paper with contributions from all the coauthors.
The authors declare that they have no conflict of interest.
This study was funded by the National Key Research and Development Program of China (grant no. 2017YFC0209700). We also thank the staff who have contributed to the system installation and maintenance at Waliguan in the past decades.
This research has been supported by the National Key Research and Development Program of China (grant no. 2017YFC0209700).
This paper was edited by Martin Dameris and reviewed by two anonymous referees.
Ahmed, E., Kim, K. H., Jeon, E. C., and Brown, R. J. C.: Long term trends of methane, non methane hydrocarbons, and carbon monoxide in urban atmosphere, Sci. Total Environ., 518, 595–604, https://doi.org/10.1016/j.scitotenv.2015.02.058, 2015.
Air Resources Laboratory (ARL): Gridded meteorological data (2004–2019), available at: ftp://arlftp.arlhq.noaa.gov/pub/archives/gdas1/, last access: 2 January 2020.
Ashbaugh, L. L., Malm, W. C., and Sadeh, W. Z.: A residence time probability analysis of sulfur concentrations at grand-canyon-national-park, Atmos. Environ., 19, 1263–1270, https://doi.org/10.1016/0004-6981(85)90256-2, 1985.
Battle, M., Bender, M., Sowers, T., Tans, P. P., Butler, J. H., Elkins, J. W., Ellis, J. T., Conway, T., Zhang, N., Lang, P., and Clarke, A. D.: Atmospheric gas concentrations over the past century measured in air from firn at the south pole, Nature, 383, 231–235, https://doi.org/10.1038/383231a0, 1996.
Bergamaschi, P., Houweling, S., Segers, A., Krol, M., Frankenberg, C., Scheepmaker, R. A., Dlugokencky, E., Wofsy, S. C., Kort, E. A., Sweeney, C., Schuck, T., Brenninkmeijer, C., Chen, H., Beck, V., and Gerbig, C.: Atmospheric CH4 in the first decade of the 21st century: Inverse modeling analysis using sciamachy satellite retrievals and NOAA surface measurements, J. Geophys. Res.-Atmos., 118, 7350–7369, https://doi.org/10.1002/jgrd.50480, 2013.
Blake, D. R., Mayer, E. W., Tyler, S. C., Makide, Y., Montague, D. C., and Rowland, F. S.: Global increase in atmospheric methane concentrations between 1978 and 1980, Geophys. Res. Lett., 9, 477–480, https://doi.org/10.1029/GL009i004p00477, 1982.
Bousquet, P., Ringeval, B., Pison, I., Dlugokencky, E. J., Brunke, E.-G., Carouge, C., Chevallier, F., Fortems-Cheiney, A., Frankenberg, C., Hauglustaine, D. A., Krummel, P. B., Langenfelds, R. L., Ramonet, M., Schmidt, M., Steele, L. P., Szopa, S., Yver, C., Viovy, N., and Ciais, P.: Source attribution of the changes in atmospheric methane for 2006–2008, Atmos. Chem. Phys., 11, 3689–3700, https://doi.org/10.5194/acp-11-3689-2011, 2011.
Buchholz, R. R., Paton-Walsh, C., Griffith, D. W. T., Kubistin, D., Caldow, C., Fisher, J. A., Deutscher, N. M., Kettlewell, G., Riggenbach, M., Macatangay, R., Krummel, P. B., and Langenfelds, R. L.: Source and meteorological influences on air quality (CO, CH4 & CO2) at a Southern Hemisphere urban site, Atmos. Environ., 126, 274–289, https://doi.org/10.1016/j.atmosenv.2015.11.041, 2016.
Burke, S. A., Wik, M., Lang, A., Contosta, A. R., Palace, M., Crill, M., and Varner, R. K.: Long-term measurements of methane ebullition from thaw ponds, J. Geophys. Res.-Biogeo., 124, 2208–2221, https://doi.org/10.1029/2018jg004786, 2019.
Cai, Z. C., Tsuruta, H., and Minami, K.: Methane emission from rice fields in China: Measurements and influencing factors, J. Geophys. Res., 105, 17231–17242, https://doi.org/10.1029/2000jd900014, 2000.
Carslaw, D. C., Beevers, S. D., Ropkins, K., and Bell, M. C.: Detecting and quantifying aircraft and other on-airport contributions to ambient nitrogen oxides in the vicinity of a large international airport, Atmos. Environ., 40, 5424–5434, https://doi.org/10.1016/j.atmosenv.2006.04.062, 2006.
Chen, H., Zhu, Q. A., Peng, C. H., Wu, N., Wang, Y. F., Fang, X. Q., Gao, Y. H., Zhu, D., Yang, G., Tian, J. Q., Kang, X. M., Piao, S. L., Ouyang, H., Xiang, W. H., Luo, Z. B., Jiang, H., Song, X. Z., Zhang, Y., Yu, G. R., Zhao, X. Q., Gong, P., Yao, T. D., and Wu, J. H.: The impacts of climate change and human activities on biogeochemical cycles on the Qinghai-Tibetan Plateau, Glob. Change Biol., 19, 2940–2955, https://doi.org/10.1111/gcb.12277, 2013.
Crippa, M., Oreggioni, G., Guizzardi, D., Muntean, M., Schaaf, E., Lo Vullo, E., Solazzo, E., Monforti-Ferrario, F., Olivier, J. G. J., and Vignati, E.: Fossil CO2 and GHG emissions of all world countries – 2019 Report, EUR 29849 EN, Publications Office of the European Union, Luxembourg, ISBN 978-92-76-11100-9, 2019a.
Crippa, M., Solazzo, E., Huang, G., Guizzardi, D., Koffi, E., Muntean, M., Schieberle, C., Friedrich, R., and Janssens-Maenhout, G.: High resolution temporal profiles in the Emissions Database for Global Atmospheric Research (EDGAR), European Commission's Joint Research Centre (JRC), https://doi.org/10.2904/JRC_DATASET_EDGAR, 2019b.
Cunnold, D. M., Steele, L. P., Fraser, P. J., Simmonds, P. G., Prinn, R. G., Weiss, R. F., Porter, L. W., O'Doherty, S., Langenfelds, R. L., Krummel, P. B., Wang, H. J., Emmons, L., Tie, X. X., and Dlugokencky, E. J.: In situ measurements of atmospheric methane at GAGE/AGAGE sites during 1985–2000 and resulting source inferences, J. Geophys. Res., 107, ACH 20-1–ACH 20-18, https://doi.org/10.1029/2001jd001226, 2002.
Diederich, A.: Generalized additive models. An introduction with R, J. Math. Psychol., 51, 339–339, 2007.
Dlugokencky, E. J., Steele, L. P., Lang, P. M., and Masarie, K. A.: The growth-rate and distribution of atmospheric methane, J. Geophys. Res., 99, 17021–17043, https://doi.org/10.1029/94jd01245, 1994.
Dlugokencky, E. J., Steele, L. P., Lang, P. M., and Masarie, K. A.: Atmospheric methane at Mauna-Loa and Barrow observatories: Presentation and analysis of in-situ measurements, J. Geophys. Res., 100, 23103–23113, https://doi.org/10.1029/95JD02460, 1995.
Dlugokencky, E. J., Masarie, K. A., Lang, P. M., and Tans, P. P.: Continuing decline in the growth rate of the atmospheric methane burden, Nature, 393, 447–450, https://doi.org/10.1038/30934, 1998.
Dlugokencky, E. J., Bruhwiler, L., White, J. W. C., Emmons, L. K., Novelli, P. C., Montzka, S. A., Masarie, K. A., Lang, P. M., Crotwell, A. M., Miller, J. B., and Gatti, L. V.: Observational constraints on recent increases in the atmospheric CH4 burden, Geophys. Res. Lett., 36, L18803, https://doi.org/10.1029/2009gl039780, 2009.
Dlugokencky, E. J., Crotwell, A. M., Lang, P. M., and Mund, J. W.: Atmospheric Methane Dry Air Mole Fractions from quasi-continuous measurements at Barrow, Alaska and Mauna Loa, Hawaii, 1986–2018, Version: 2019-03-04, available at: ftp://aftp.cmdl.noaa.gov/data/trace_gases/CH4/in-situ/surface/ (last access: 10 March 2020), 2019a.
Dlugokencky, E. J., Lang, P. M., Crotwell, A. M., Thoning, K. W., and Crotwell, M. J.: Atmospheric Methane Dry Air Mole Fractions from the NOAA ESRL Carbon Cycle Cooperative Global Air Sampling Network, Data Path: ftp://aftp.cmdl.noaa.gov/data/trace_gases/CH4/flask/surface/ (last access: 10 March 2020), 2019b.
Draxier, R. R. and Hess, G. D.: An Overview of the HYSPLIT_4 Modelling Systemfor Trajectories, Dispersion, and Deposition, Aust. Meteorol. Mag., 47, 295–308, 1998.
Etheridge, D. M., Steele, L. P., Francey, R. J., and Langenfelds, R. L.: Atmospheric methane between 1000 A.D. and present: Evidence of anthropogenic emissions and climatic variability, J. Geophys. Res.-Atmos., 103, 15979–15993, https://doi.org/10.1029/98jd00923, 1998.
Etminan, M., Myhre, G., Highwood, E. J., and Shine, K. P.: Radiative forcing of carbon dioxide, methane, and nitrous oxide: A significant revision of the methane radiative forcing, Geophys. Res. Lett., 43, 12614–12623, https://doi.org/10.1002/2016gl071930, 2016.
Fang, S. X., Zhou, L. X., Masarie, K. A., Xu, L., and Rella, C. W.: Study of atmospheric CH4 mole fractions at three WMO/GAW stations in China, J. Geophys. Res.-Atmos., 118, 4874–4886, https://doi.org/10.1002/jgrd.50284, 2013.
Fang, S. X., Tans, P. P., Dong, F., Zhou, H. G., and Luan, T.: Characteristics of atmospheric CO2 and CH4 at the Shangdianzi regional background station in China, Atmos. Environ., 131, 1–8, https://doi.org/10.1016/j.atmosenv.2016.01.044, 2016.
Fu, X. W., Feng, X., Liang, P., Deliger, Zhang, H., Ji, J., and Liu, P.: Temporal trend and sources of speciated atmospheric mercury at Waliguan GAW station, Northwestern China, Atmos. Chem. Phys., 12, 1951–1964, https://doi.org/10.5194/acp-12-1951-2012, 2012.
Galloway, J. N.: Atmospheric acidification – projections for the future, Ambio, 18, 161–166, 1989.
Guha, T., Tiwari, Y. K., Valsala, V., Lin, X., Ramonet, M., Mahajan, A., Datye, A., and Kumar, K. R.: What controls the atmospheric methane seasonal variability over India?, Atmos. Environ., 175, 83–91, https://doi.org/10.1016/j.atmosenv.2017.11.042, 2018.
Hausmann, P., Sussmann, R., and Smale, D.: Contribution of oil and natural gas production to renewed increase in atmospheric methane (2007–2014): top–down estimate from ethane and methane column observations, Atmos. Chem. Phys., 16, 3227–3244, https://doi.org/10.5194/acp-16-3227-2016, 2016.
IPCC: Climate Change 2014: Synthesis Report. Contribution of Working Groups I, II and III to the Fifth Assessment Report of the Intergovernmental Panel on Climate Change, edited by: Core Writing Team, Pachauri, R. K., and Meyer, L. A., IPCC, Geneva, Switzerland, 151 pp., 2014.
Janssens-Maenhout, G., Crippa, M., Guizzardi, D., Muntean, M., Schaaf, E., Dentener, F., Bergamaschi, P., Pagliari, V., Olivier, J. G. J., Peters, J. A. H. W., van Aardenne, J. A., Monni, S., Doering, U., Petrescu, A. M. R., Solazzo, E., and Oreggioni, G. D.: EDGAR v4.3.2 Global Atlas of the three major greenhouse gas emissions for the period 1970–2012, Earth Syst. Sci. Data, 11, 959–1002, https://doi.org/10.5194/essd-11-959-2019, 2019.
Keeling, C. D., Bacastow, R. B., Bainbridge, A. E., Ekdahl, C. A., Guenther, P. R., Waterman, L. S., and Chin, J. F. S.: Atmospheric carbon-dioxide variations at Mauna-Loa observatory, Hawaii, Tellus, 28, 538–551, 1976.
Keeling, C. D., Whorf, T. P., Wahlen, M., and Vanderplicht, J.: Interannual extremes in the rate of rise of atmospheric carbon-dioxide since 1980, Nature, 375, 666–670, https://doi.org/10.1038/375666a0, 1995.
Keenan, T. F., Prentice, I. C., Canadell, J. G., Williams, C. A., Wang, H., Raupach, M., and Collatz, G. J.: Recent pause in the growth rate of atmospheric CO2 due to enhanced terrestrial carbon uptake, Nat. Commun., 7, 13428, https://doi.org/10.1038/ncomms13428, 2016.
Kim, H. S., Chung, Y. S., Tans, P. P., and Dlugokencky, E. J.: Decadal trends of atmospheric methane in East Asia from 1991 to 2013, Air Qual. Atmos. Hlth, 8, 293–298, https://doi.org/10.1007/s11869-015-0331-x, 2015.
Lelieveld, J., Dentener, F. J., Peters, W., and Krol, M. C.: On the role of hydroxyl radicals in the self-cleansing capacity of the troposphere, Atmos. Chem. Phys., 4, 2337–2344, https://doi.org/10.5194/acp-4-2337-2004, 2004.
Lin, M. Y., Horowitz, L. W., Oltmans, S. J., Fiore, A. M., and Fan, S. M.: Tropospheric ozone trends at Mauna Loa observatory tied to decadal climate variability, Nat. Geosci., 7, 136–143, https://doi.org/10.1038/ngeo2066, 2014.
Liu, S., Fang, S. X., Liang, M., Ma, Q. L., and Feng, Z. Z.: Study on CO data filtering approaches based on observations at two background stations in China, Sci. Total Environ., 691, 675–684, https://doi.org/10.1016/j.scitotenv.2019.07.162, 2019.
Logan, J. A., Prather, M. J., Wofsy, S. C., and McElroy, M. B.: Tropospheric chemistry: A global perspective, J. Geophys. Res., 86, 7210–7254, https://doi.org/10.1029/JC086iC08p07210, 1981.
Loov, J. M. B., Henne, S., Legreid, G., Staehelin, J., Reimann, S., Prévôt, A. S. H., Steinbacher, M., and Vollmer, M. K.: Estimation of background concentrations of trace gases at the Swiss Alpine site Jungfraujoch (3580 m asl), J. Geophys. Res., 113, D22305, https://doi.org/10.1029/2007jd009751, 2008.
Ma, J. Z., Tang, J., Zhou, X. J., and Zhang, X. S.: Estimates of the chemical budget for ozone at Waliguan observatory, J. Atmos. Chem., 41, 21–48, https://doi.org/10.1023/a:1013892308983, 2002.
Matsueda, H., Sawa, Y., Wada, A., Inoue, H. Y., Kazuto Suda, K., Hirano, Y., Tsuboi, K., and Nishioka, S.: Methane standard gases for atmospheric measurements at the MRI and JMA and intercomparison experiments, Pap. Meteor. Geophys., 54, 91–109, https://doi.org/10.2467/mripapers.54.91, 2004.
Miller, S. M., Michalak, A. M., Detmers, R. G., Hasekamp, O. P., Bruhwiler, L. M. P., and Schwietzke, S.: China's coal mine methane regulations have not curbed growing emissions, Nat. Commun., 10, 303, https://doi.org/10.1038/s41467-018-07891-7, 2019.
Morimoto, S., Fujita, R., Aoki, S., Goto, D., and Nakazawa, T.: Long-term variations of the mole fraction and carbon isotope ratio of atmospheric methane observed at Ny-Ålesund, Svalbard from 1996 to 2013, Tellus B, 69, 1380497, https://doi.org/10.1080/16000889.2017.1380497, 2017.
Nisbet, E. G., Dlugokencky, E. J., and Bousquet, P.: Methane on the rise-again, Science, 343, 493–495, https://doi.org/10.1126/science.1247828, 2014.
Nisbet, E. G., Dlugokencky, E. J., Manning, M. R., Lowry, D., Fisher, R. E., France, J. L., Michel, S. E., Miller, J. B., White, J. W. C., Vaughn, B., Bousquet, P., Pyle, J. A., Warwick, N. J., Cain, M., Brownlow, R., Zazzeri, G., Lanoisellé, M., Manning, A. C., Gloor, E., Worthy, D. E. J., Brunke, E.-G., Labuschagne, C., Wolff, E. W., and Ganesan, A. L.: Rising atmospheric methane: 2007–2014 growth and isotopic shift, Global Biogeochem. Cy., 30, 1356–1370, https://doi.org/10.1002/2016gb005406, 2016.
Nisbet, E. G., Manning, M. R., Dlugokencky, E. J., Fisher, R. E., Lowry, D., Michel, S. E., Myhre, C. L., Platt, S. M., Allen, G., Bousquet, P., Brownlow, R., Cain, M., France, J. L., Hermansen, O., Hossaini, R., Jones, A. E., Levin, I., Manning, A. C., Myhre, G., Pyle, J. A., Vaughn, B. H., Warwick, N. J., and White, J. W. C.: Very strong atmospheric methane growth in the 4 years 2014–2017: Implications for the paris agreement, Global Biogeochem. Cy., 33, 318–342, https://doi.org/10.1029/2018gb006009, 2019.
Niwa, Y., Tsuboi, K., Matsueda, H., Sawa, Y., Machida, T., Nakamura, M., Kawasato, T., Saito, K., Takatsuji, S., Tsuji, K., Nishi, H., Dehara, K., Baba, Y., Kuboike, D., Iwatsubo, S., Ohmori, H., and Hanamiya, Y.: Seasonal variations of CO2, CH4, N2O and CO in the mid-troposphere over the western North Pacific observed using a C-130H cargo aircraft, J. Meteorol. Soc. Jpn., 92, 55–70, https://doi.org/10.2151/jmsj.2014-104, 2014.
Pearman, G. I. and Beardsmore, D. J.: Atmospheric carbon-dioxide measurements in the Australian region - 10 years of aircraft data, Tellus B, 36, 1–24, https://doi.org/10.1111/j.1600-0889.1984.tb00047.x, 1984.
Polissar, A. V., Hopke, P. K., Paatero, P., Kaufmann, Y. J., Hall, D. K., Bodhaine, B. A., Dutton, E. G., and Harris, J. M.: The aerosol at barrow, alaska: Long-term trends and source locations, Atmos. Environ., 33, 2441–2458, https://doi.org/10.1016/s1352-2310(98)00423-3, 1999.
Popa, M. E., Gloor, M., Manning, A. C., Jordan, A., Schultz, U., Haensel, F., Seifert, T., and Heimann, M.: Measurements of greenhouse gases and related tracers at Bialystok tall tower station in Poland, Atmos. Meas. Tech., 3, 407–427, https://doi.org/10.5194/amt-3-407-2010, 2010.
Press, W. H., Flannery, B. P., Teukolsky, S. A., and Vetterling, W. T.: Numerical recipes in C: The art of scientific programming, Cambridge University Press, New York, Section, 10, 408–412, 1992.
Rasmussen, R. A. and Khalil, M. A. K.: Atmospheric methane in the recent and ancient atmospheres – concentrations, trends, and interhemispheric gradient, J. Geophys. Res., 89, 11599–11605, https://doi.org/10.1029/JD089iD07p11599, 1984.
R Core Team: R: a language and environment for statistical computing, R Foundation for Statistical Computing, Vienna, Austria, available at: http://www.R-project.org/, last access: 5 July 2019.
Rigby, M., Montzka, S. A., Prinn, R. G., White, J. W. C., Young, D., O'Doherty, S., Lunt, M. F., Ganesan, A. L., Manning, A. J., Simmonds, P. G., Salameh, P. K., Harth, C. M., Muhle, J., Weiss, R. F., Fraser, P. J., Steele, L. P., Krummel, P. B., McCulloch, A., and Park, S.: Role of atmospheric oxidation in recent methane growth, P. Natl. Acad. Sci. USA, 114, 5373–5377, https://doi.org/10.1073/pnas.1616426114, 2017.
Rousseau, D. D., Duzer, D., Etienne, J. L., Cambon, G., Jolly, D., Ferrier, J., and Schevin, P.: Pollen record of rapidly changing air trajectories to the North Pole, J. Geophys. Res., 109, D06116, https://doi.org/10.1029/2003jd003985, 2004.
Rubino, M., Etheridge, D. M., Thornton, D. P., Howden, R., Allison, C. E., Francey, R. J., Langenfelds, R. L., Steele, L. P., Trudinger, C. M., Spencer, D. A., Curran, M. A. J., van Ommen, T. D., and Smith, A. M.: Revised records of atmospheric trace gases CO2, CH4, N2O, and δ13C−CO2 over the last 2000 years from Law Dome, Antarctica, Earth Syst. Sci. Data, 11, 473–492, https://doi.org/10.5194/essd-11-473-2019, 2019.
Satar, E., Berhanu, T. A., Brunner, D., Henne, S., and Leuenberger, M.: Continuous measurements (2012–2014) at Beromünster tall tower station in Switzerland, Biogeosciences, 13, 2623–2635, https://doi.org/10.5194/bg-13-2623-2016, 2016.
Saunois, M., Bousquet, P., Poulter, B., Peregon, A., Ciais, P., Canadell, J. G., Dlugokencky, E. J., Etiope, G., Bastviken, D., Houweling, S., Janssens-Maenhout, G., Tubiello, F. N., Castaldi, S., Jackson, R. B., Alexe, M., Arora, V. K., Beerling, D. J., Bergamaschi, P., Blake, D. R., Brailsford, G., Brovkin, V., Bruhwiler, L., Crevoisier, C., Crill, P., Covey, K., Curry, C., Frankenberg, C., Gedney, N., Höglund-Isaksson, L., Ishizawa, M., Ito, A., Joos, F., Kim, H.-S., Kleinen, T., Krummel, P., Lamarque, J.-F., Langenfelds, R., Locatelli, R., Machida, T., Maksyutov, S., McDonald, K. C., Marshall, J., Melton, J. R., Morino, I., Naik, V., O'Doherty, S., Parmentier, F.-J. W., Patra, P. K., Peng, C., Peng, S., Peters, G. P., Pison, I., Prigent, C., Prinn, R., Ramonet, M., Riley, W. J., Saito, M., Santini, M., Schroeder, R., Simpson, I. J., Spahni, R., Steele, P., Takizawa, A., Thornton, B. F., Tian, H., Tohjima, Y., Viovy, N., Voulgarakis, A., van Weele, M., van der Werf, G. R., Weiss, R., Wiedinmyer, C., Wilton, D. J., Wiltshire, A., Worthy, D., Wunch, D., Xu, X., Yoshida, Y., Zhang, B., Zhang, Z., and Zhu, Q.: The global methane budget 2000–2012, Earth Syst. Sci. Data, 8, 697–751, https://doi.org/10.5194/essd-8-697-2016, 2016.
Saunois, M., Stavert, A. R., Poulter, B., Bousquet, P., Canadell, J. G., Jackson, R. B., Raymond, P. A., Dlugokencky, E. J., Houweling, S., Patra, P. K., Ciais, P., Arora, V. K., Bastviken, D., Bergamaschi, P., Blake, D. R., Brailsford, G., Bruhwiler, L., Carlson, K. M., Carrol, M., Castaldi, S., Chandra, N., Crevoisier, C., Crill, P. M., Covey, K., Curry, C. L., Etiope, G., Frankenberg, C., Gedney, N., Hegglin, M. I., Höglund-Isaksson, L., Hugelius, G., Ishizawa, M., Ito, A., Janssens-Maenhout, G., Jensen, K. M., Joos, F., Kleinen, T., Krummel, P. B., Langenfelds, R. L., Laruelle, G. G., Liu, L., Machida, T., Maksyutov, S., McDonald, K. C., McNorton, J., Miller, P. A., Melton, J. R., Morino, I., Müller, J., Murguia-Flores, F., Naik, V., Niwa, Y., Noce, S., O'Doherty, S., Parker, R. J., Peng, C., Peng, S., Peters, G. P., Prigent, C., Prinn, R., Ramonet, M., Regnier, P., Riley, W. J., Rosentreter, J. A., Segers, A., Simpson, I. J., Shi, H., Smith, S. J., Steele, L. P., Thornton, B. F., Tian, H., Tohjima, Y., Tubiello, F. N., Tsuruta, A., Viovy, N., Voulgarakis, A., Weber, T. S., van Weele, M., van der Werf, G. R., Weiss, R. F., Worthy, D., Wunch, D., Yin, Y., Yoshida, Y., Zhang, W., Zhang, Z., Zhao, Y., Zheng, B., Zhu, Q., Zhu, Q., and Zhuang, Q.: The Global Methane Budget 2000–2017, Earth Syst. Sci. Data, 12, 1561–1623, https://doi.org/10.5194/essd-12-1561-2020, 2019.
Schaefer, H., Fletcher, S. E. M., Veidt, C., Lassey, K. R., Brailsford, G. W., Bromley, T. M., Dlugokencky, E. J., Michel, S. E., Miller, J. B., Levin, I., Lowe, D. C., Martin, R. J., Vaughn, B. H., and White, J. W. C.: A 21st-century shift from fossil-fuel to biogenic methane emissions indicated by 13CH4, Science, 352, 80–84, https://doi.org/10.1126/science.aad2705, 2016.
Simmonds, P. G., Manning, A. J., Derwent, R. G., Ciais, P., Ramonet, M., Kazan, V., and Ryall, D.: A burning question. Can recent growth rate anomalies in the greenhouse gases be attributed to large-scale biomass burning events?, Atmos. Environ., 39, 2513–2517, https://doi.org/10.1016/j.atmosenv.2005.02.018, 2005.
Streets, D. G. and Waldhoff, S. T.: Present and future emissions of air pollutants in China: SO2, NOx, and CO, Atmos. Environ., 34, 363–374, https://doi.org/10.1016/s1352-2310(99)00167-3, 2000.
Sweeney, C., Dlugokencky, E., Miller, C. E., Wofsy, S., Karion, A., Dinardo, S., Chang, R. Y. W., Miller, J. B., Bruhwiler, L., Crotwell, A. M., Newberger, T., McKain, K., Stone, R. S., Wolter, S. E., Lang, P. E., and Tans, P.: No significant increase in long-term CH4 emissions on north slope of Alaska despite significant increase in air temperature, Geophys. Res. Lett., 43, 6604–6611, https://doi.org/10.1002/2016gl069292, 2016.
Tang, J., Wen, Y. P., and Zhou, L. X.:, Observational study of black carbon aerosol in western China, J. Appl. Meteor. Sci., 10, 160–170, 1999.
Thompson, R. L., Manning, A. C., Gloor, E., Schultz, U., Seifert, T., Hänsel, F., Jordan, A., and Heimann, M.: In-situ measurements of oxygen, carbon monoxide and greenhouse gases from Ochsenkopf tall tower in Germany, Atmos. Meas. Tech., 2, 573–591, https://doi.org/10.5194/amt-2-573-2009, 2009.
Tohjima, Y., Machida, T., Utiyama, M., Katsumoto, M., Fujinuma, Y., and Maksyutov, S.: Analysis and presentation of in situ atmospheric methane measurements from Cape Ochi-ishi and Hateruma island, J. Geophys. Res., 107, ACH 8-1–ACH 8-11, https://doi.org/10.1029/2001jd001003, 2002.
Tohjima, Y., Kubo, M., Minejima, C., Mukai, H., Tanimoto, H., Ganshin, A., Maksyutov, S., Katsumata, K., Machida, T., and Kita, K.: Temporal changes in the emissions of CH4 and CO from China estimated from CH4∕CO2 and CO∕CO2 correlations observed at Hateruma Island, Atmos. Chem. Phys., 14, 1663–1677, https://doi.org/10.5194/acp-14-1663-2014, 2014.
Thoning, K. W., Tans, P. P., and Komhyr, W. D.: Atmospheric carbon dioxide at Mauna Loa observatory: 2. Analysis of the NOAA GMCC data, 1974–1985, J. Geophys. Res., 94, 8549–8565, https://doi.org/10.1029/JD094iD06p08549, 1989.
Tsutsumi, Y., Mori, K., Ikegami, M., Tashiro, T., and Tsuboi, K.: Long-term trends of greenhouse gases in regional and background events observed during 1998–2004 at Yonagunijima located to the east of the Asian continent, Atmos. Environ., 40, 5868–5879, https://doi.org/10.1016/j.atmosenv.2006.04.036, 2006.
Turner, A. J., Frankenbergb, C., Wennberg, P. O., and Jacob, D. J.: Ambiguity in the causes for decadal trends in atmospheric methane and hydroxyl, P. Natl. Acad. Sci. USA, 114, 5367–5372, https://doi.org/10.1073/pnas.1616020114, 2017.
Uria-Tellaetxe, I. and Carslaw, D. C.: Conditional bivariate probability function for source identification, Environ. Modell. Softw., 59, 1–9, https://doi.org/10.1016/j.envsoft.2014.05.002, 2014.
U.S. EIA (US Energy Information Administration): International energy statistics, U.S. EIA, Washington, DC, available at: https://www.eia.gov/beta/international/data/browser/ (last access: 19 May 2018), 2017.
Vaghjiani, G. L. and Ravishankara, A. R.: New measurement of the rate coefficient for the reaction of OH with methane, Nature, 350, 406–409, https://doi.org/10.1038/350406a0, 1991.
Wada, A., Sawa, Y., Matsueda, H., Taguchi, S., Murayama, S., Okubo, S., and Tsutsumi, Y.: Influence of continental air mass transport on atmospheric CO2 in the western North Pacific, J. Geophys. Res., 112, D07311, https://doi.org/10.1029/2006jd007552, 2007.
Wada, A., Matsueda, H., Sawa, Y., Tsuboi, K., and Okubo, S.: Seasonal variation of enhancement ratios of trace gases observed over 10 years in the western North Pacific, Atmos. Environ., 45, 2129–2137, https://doi.org/10.1016/j.atmosenv.2011.01.043, 2011.
Wang, D. Q., Chen, Z. L., and Xu, S. Y.: Methane emission from Yangtze estuarine wetland, china, J. Geophys. Res.-Biogeosci., 114, G02011, https://doi.org/10.1029/2008JG000857, 2009.
Wang, T., Cheung, T. F., Li, Y. S., Yu, X. M., and Blake, D. R.: Emission characteristics of CO, NOx, SO2 and indications of biomass burning observed at a rural site in eastern China, J. Geophys. Res., 107, ACH 9-1–ACH 9-10, https://doi.org/10.1029/2001JD000724, 2002.
Weber, T., Wiseman, N. A., and Kock, A.: Global ocean methane emissions dominated by shallow coastal waters, Nat. Commun., 10, 4584, https://doi.org/10.1038/s41467-019-12541-7, 2019.
Wilson, M. C. and Smith, A. T.: The pika and the watershed: The impact of small mammal poisoning on the ecohydrology of the Qinghai-Tibetan Plateau, Ambio, 44, 16–22, https://doi.org/10.1007/s13280-014-0568-x, 2015.
WMO: The State of Greenhouse Gases in the Atmosphere Based on Global Observations through 2018, WMO Greenhouse Gas Bulletin No. 15, 2–3, 2019.
WDCGG (World Data Centre for Greenhouse Gases): Data Summary: Greenhouse Gases and Other Atmospheric Gases, WDCGG No. 43, Japan Meteorological Agency, available at: https://gaw.kishou.go.jp/static/publications/summary/sum43/sum43.pdf, last access: 10 April 2020.
Wolf, J., Asrar, G. R., and West, T. O.: Revised methane emissions factors and spatially distributed annual carbon fluxes for global livestock, Carbon Balanc. Manag., 12, 16, https://doi.org/10.1186/s13021-017-0084-y, 2017.
Xiong, X., Houweling, S., Wei, J., Maddy, E., Sun, F., and Barnet, C.: Methane plume over south Asia during the monsoon season: satellite observation and model simulation, Atmos. Chem. Phys., 9, 783–794, https://doi.org/10.5194/acp-9-783-2009, 2009.
Yuan, Y., Ries, L., Petermeier, H., Trickl, T., Leuchner, M., Couret, C., Sohmer, R., Meinhardt, F., and Menzel, A.: On the diurnal, weekly, and seasonal cycles and annual trends in atmospheric CO2 at Mount Zugspitze, Germany, during 1981–2016, Atmos. Chem. Phys., 19, 999–1012, https://doi.org/10.5194/acp-19-999-2019, 2019.
Zellweger, C., Emmenegger, L., Firdaus, M., Hatakka, J., Heimann, M., Kozlova, E., Spain, T. G., Steinbacher, M., van der Schoot, M. V., and Buchmann, B.: Assessment of recent advances in measurement techniques for atmospheric carbon dioxide and methane observations, Atmos. Meas. Tech., 9, 4737–4757, https://doi.org/10.5194/amt-9-4737-2016, 2016.
Zhang, F., Zhou, L. X., Novelli, P. C., Worthy, D. E. J., Zellweger, C., Klausen, J., Ernst, M., Steinbacher, M., Cai, Y. X., Xu, L., Fang, S. X., and Yao, B.: Evaluation of in situ measurements of atmospheric carbon monoxide at Mount Waliguan, China, Atmos. Chem. Phys., 11, 5195–5206, https://doi.org/10.5194/acp-11-5195-2011, 2011.
Zhang, F., Zhou, L., and Xu, L.: Temporal variation of atmospheric CH4 and the potential source regions at Waliguan, China, Sci. China Earth Sci., 56, 727–736, https://doi.org/10.1007/s11430-012-4577-y, 2013.
Zhou, L., Worthy, D. E. J., Lang, P. M., Ernst, M. K., Zhang, X. C., Wen, Y. P., and Li, J. L.: Ten years of atmospheric methane observations at a high elevation site in western China, Atmos. Environ., 38, 7041–7054, https://doi.org/10.1016/j.atmosenv.2004.02.072, 2004.
Zhou, L. X., Tang, J., Wen, Y. P., Li, J. L., Yan, P., and Zhang, X. C.: The impact of local winds and long-range transport on the continuous carbon dioxide record at Mount Waliguan, China, Tellus B, 55, 145–158, https://doi.org/10.1034/j.1600-0889.2003.00064.x, 2003.
Zhou, L. X., Conway, T. J., White, J. W. C., Mukai, H., Zhang, X. C., Wen, Y. P., Li, J. L., and MacClune, K.: Long-term record of atmospheric CO2 and stable isotopic ratios at Waliguan observatory: Background features and possible drivers, 1991–2002, Global Biogeochem. Cy., 19, GB3021, https://doi.org/10.1029/2004gb002430, 2005.
Zou, J. W., Huang, Y., Jiang, J. Y., Zheng, X. H., and Sass, R. L.: A 3-year field measurement of methane and nitrous oxide emissions from rice paddies in China: Effects of water regime, crop residue, and fertilizer application, Global Biogeochem. Cy., 19, GB2021, https://doi.org/10.1029/2004gb002401, 2005.