the Creative Commons Attribution 4.0 License.
the Creative Commons Attribution 4.0 License.
 | 05 Mar 2021
Measurement report: Cloud processes and the transport of biological emissions affect southern ocean particle and cloud condensation nuclei concentrations
Gregory C. Roberts
Georges Saliba
Lynn M. Russell
Cynthia Twohy
J. Michael Reeves
Ruhi S. Humphries
Melita D. Keywood
Jason P. Ward
Ian M. McRobert
Long-range transport of biogenic emissions from the coast of Antarctica, precipitation scavenging, and cloud processing are the main processes that influence the observed variability in Southern Ocean (SO) marine boundary layer (MBL) condensation nuclei (CN) and cloud condensation nuclei (CCN) concentrations during the austral summer. Airborne particle measurements on the HIAPER GV from north–south transects between Hobart, Tasmania, and 62∘ S during the Southern Ocean Clouds, Radiation Aerosol Transport Experimental Study (SOCRATES) were separated into four regimes comprising combinations of high and low concentrations of CCN and CN. In 5 d HYSPLIT back trajectories, air parcels with elevated CCN concentrations were almost always shown to have crossed the Antarctic coast, a location with elevated phytoplankton emissions relative to the rest of the SO in the region south of Australia. The presence of high CCN concentrations was also consistent with high cloud fractions over their trajectory, suggesting there was substantial growth of biogenically formed particles through cloud processing. Cases with low cloud fraction, due to the presence of cumulus clouds, had high CN concentrations, consistent with previously reported new particle formation in cumulus outflow regions. Measurements associated with elevated precipitation during the previous 1.5 d of their trajectory had low CCN concentrations indicating CCN were effectively scavenged by precipitation. A coarse-mode fitting algorithm was used to determine the primary marine aerosol (PMA) contribution, which accounted for <20 % of CCN (at 0.3 % supersaturation) and cloud droplet number concentrations. Vertical profiles of CN and large particle concentrations (Dp>0.07 µm) indicated that particle formation occurs more frequently above the MBL; however, the growth of recently formed particles typically occurs in the MBL, consistent with cloud processing and the condensation of volatile compound oxidation products.
CCN measurements on the R/V Investigator as part of the second Clouds, Aerosols, Precipitation, Radiation and atmospheric Composition Over the southeRn Ocean (CAPRICORN-2) campaign were also conducted during the same period as the SOCRATES study. The R/V Investigator observed elevated CCN concentrations near Australia, likely due to continental and coastal biogenic emissions. The Antarctic coastal source of CCN from the south, CCN sources from the midlatitudes, and enhanced precipitation sink in the cyclonic circulation between the Ferrel and polar cells (around 60∘ S) create opposing latitudinal gradients in the CCN concentration with an observed minimum in the SO between 55 and 60∘ S. The SOCRATES airborne measurements are not influenced by Australian continental emissions but still show evidence of elevated CCN concentrations to the south of 60∘ S, consistent with biogenic coastal emissions. In addition, a latitudinal gradient in the particle composition, south of the Australian and Tasmanian coasts, is apparent in aerosol hygroscopicity derived from CCN spectra and aerosol particle size distribution. The particles are more hygroscopic to the north, consistent with a greater fraction of sea salt from PMA, and less hygroscopic to the south as there is more sulfate and organic particles originating from biogenic sources in coastal Antarctica.
- Article
(903 KB) - Full-text XML
-
Supplement
(613 KB) - BibTeX
- EndNote


The marine boundary layer (MBL) over the Southern Ocean (SO) displays some of the most pristine conditions in the world, with few anthropogenic influences, making cloud properties and radiative forcing particularly sensitive to relatively small changes in aerosol source emissions (Downey et al., 1990; Fossum et al., 2018; Hudson et al., 1998; Li et al., 2018; McCoy et al., 2015; Murphy et al., 1998b; Pandis et al., 1994; Pierce and Adams, 2006; Pringle et al., 2009; Whittlestone and Zahorowski, 1998; Wood et al., 2015; Yoon and Brimblecombe, 2002). In spite of a growing number of studies, climate models still struggle to represent SO cloud radiative properties, partly because their representation of available cloud condensation nuclei (CCN) is not well constrained (Bodas-Salcedo et al., 2014; Brient et al., 2019; Carslaw et al., 2013; Efraim et al., 2020; Hyder et al., 2018; Lee et al., 2015; Mace and Protat, 2018; Mccoy et al., 2014; Ogunro et al., 2018; Schmale et al., 2019; Seinfeld et al., 2016; Trenberth and Fasullo, 2010). Understanding the impact of SO particle sources on the cloud system and their variability is required for accurate prediction of SO cloud properties and to understand the impact of aerosol–cloud interactions on the Earth's energy budget. These issues motivated the Southern Ocean Clouds, Radiation Aerosol Transport Experimental Study (SOCRATES), which conducted in situ measurements of clouds and aerosol over the SO on board the NSF/NCAR HIAPER Gulfstream V (GV) (Laursen et al., 2006).
Aerosol in the SO typically originates from natural marine sources and are rarely influenced by continental or anthropogenic sources. These marine sources consist of primary marine aerosol (PMA) particles produced from sea spray and bubble bursting, as well as secondary organic and sulfate particles formed from biologically emitted volatile organic compounds (VOCs) such as dimethyl sulfide (DMS) (Bates et al., 1998b, 2012; Covert et al., 1992; Frossard et al., 2014; Middlebrook et al., 1998; Murphy et al., 1998a; Pirjola et al., 2000; Quinn et al., 2000, 2017; Rinaldi et al., 2010; Saliba et al., 2019, 2020). Primary particles from the Antarctic continent are not a major source of particles to the SO because it is mostly covered in ice (Chambers et al., 2017), leaving the main sources of primary aerosol from Antarctica limited to local anthropogenic pollution from research stations, blowing snow, frost flowers, and sea bird emissions (Frieß et al., 2004; Huang and Jaeglé, 2017; Liu et al., 2018; Schmale et al., 2013).
New particle formation (NPF) from the oxidation of marine biologically emitted VOCs occurs mostly in the free troposphere (FT) where the particle condensational sink and temperature are lower than in the MBL, which are prevalent conditions over the SO (Raes et al., 1997; Yue and Deepak, 1982). While NPF has been observed in the marine boundary layer, often at coastal locations (Covert et al., 1992; Humphries et al., 2015; Kyrö et al., 2013; Pirjola et al., 2000; Weller et al., 2015), it occurs more commonly in the FT (Bates et al., 1998b; Clarke et al., 1998; Humphries et al., 2016; O'Dowd et al., 1997; De Reus et al., 2000; Sanchez et al., 2018; Yoon and Brimblecombe, 2002) owing to the absence of PMA in the FT (McCoy et al., 2015). Regions of sea ice melt on the Antarctic coast have been observed to be a significant source of methanesulfonic acid (MSA) as well as DMS (O'Dowd et al., 1997; Vana et al., 2007), known precursors of NPF (Almeida et al., 2013; Dawson et al., 2012). In addition, NPF is commonly associated with cumulus outflow regions due to the DMS-rich air lofted by the convection and the high relative humidity, creating an environment allows binary nucleation between sulfuric acid (a DMS oxidation product) and water (Bates et al., 1998b; Clarke et al., 1999; Cotton et al., 1995; Perry and Hobbs, 1994; Twohy et al., 2002). Ternary nucleation with ammonia or amines is also possible, particularly in Antarctic coastal regions downwind of penguin colonies (Weber et al., 1998).
The remote midlatitude SO contains much less biological activity near the ocean surface relative to the Antarctic continental coast, which creates a latitudinal gradient in the contribution of particles from biogenic sources, with the exception of some biological hotspots such as near South Georgia (Alroe et al., 2020; Humphries et al., 2016; Kim et al., 2019; O'Dowd et al., 1997; O'Shea et al., 2017; Schmale et al., 2019; Weller et al., 2018). Shipborne observations in the region south of Australia show a distinct increase in aerosol concentrations south of 64∘ S, where CN concentrations are about 5 times higher during the austral spring months (Humphries et al., 2016). The seasonal variability of biogenically derived particles is linked to seasonal variations in SO biological activity (Ayers and Gras, 1991; Korhonen et al., 2008). On the Antarctic peninsula, NPF events occurred mostly during the austral summer, with CCN concentrations (at 0.4 % supersaturation) increasing on average by 11 % (Kim et al., 2019). Similarly, higher average concentrations of cloud droplet number concentrations (CDNC) are observed in the austral summer (Mace and Avey, 2017; McCoy et al., 2015). Some studies suggest biologically productive waters enhance PMA production (Fuentes et al., 2010), while other studies find that biogenic content has little to no influence on PMA production (Bates et al., 2020; Collins et al., 2016). In any case, PMA CCN is found to have little seasonal variability relative to biogenic CCN (Vallina et al., 2006), likely driven by small seasonal differences in wind speed (Saliba et al., 2019). Organic enrichment of PMA in biologically productive waters may further reduce their hygroscopicity (Burrows et al., 2018; Cravigan et al., 2020; Law et al., 2017; Meskhidze and Nenes, 2010).
Long-range transport of aerosol and gaseous precursors in the MBL and FT from the Antarctic continental coast plays a significant role in increasing CN, CCN, and CDNC concentrations in the SO (Bates et al., 1998a; Clarke et al., 1998, 2013; Dzepina et al., 2015; Korhonen et al., 2008; Woodhouse et al., 2010). With substantial growth of newly formed particles by the uptake of VOC oxidation products through cloud processing, particles from biogenic sources may grow CCN larger and subsequently increase CDNC (Hoppel et al., 1986; Hudson et al., 2015; Pirjola et al., 2004; Russell et al., 2007; Sanchez et al., 2018). Cloud processing occurs when small particles activate to form cloud droplets, leading to enhanced condensation of VOC oxidation products onto the droplet because the droplet surface area is larger than that of the unactivated particles. Aqueous-phase oxidation of absorbed VOCs also results in the formation of less volatile compounds, which remain in the particle phase upon evaporation of the water (Hoppel et al., 1986). In the event that the cloud droplets do not precipitate, the evaporated particles are larger than their original size since aqueous oxidation of volatile compounds (i.e., DMS, MSA, SO2 and nitric acid) have formed non-volatile sulfates and nitrates that remain in the particle phase. This added mass eventually shifts Aitken-mode particles to the accumulation mode (Hoppel et al., 1986; Hudson et al., 2015; Kaufman and Tanré, 1994; Sanchez et al., 2017; Schmale et al., 2019). Results from McCoy et al. (2015) show that, despite the ambiguous results from focused modeling and observational studies of such aerosol processes, their general global model simulations of natural aerosol account for more than half the spatial and temporal variability in the satellite-derived CDNC over the SO. These areas of enhanced CDNC also correlate with areas of high chlorophyll-a, a tracer for phytoplankton activity, which increases secondary sulfate and organic aerosol concentrations (Krüger and Grabßl, 2011; McCoy et al., 2015). SO satellite-derived cloud properties such as liquid water content (LWC), effective radius, and cloud fraction showed seasonal variations that resulted in a difference in cloud radiative forcing (i.e., surface cooling) between 14 and 23 W m−2 (Mccoy et al., 2014). Increased CDNC is also shown to correlate with enhanced cloud fraction, significantly increasing overall cloud shortwave forcing (Rosenfeld et al., 2019). If cloud droplets precipitate, CN and CCN concentrations are reduced through precipitation scavenging (Croft et al., 2010; Stevens and Feingold, 2009).
In this study, we discuss airborne aerosol measurements in the SO region south of Australia (Fig. 1) from the SOCRATES campaign and briefly discuss shipborne CCN measurements made on the R/V Investigator for the CAPRICORN2 campaign, which was conducted in the same time frame and region as SOCRATES. The SOCRATES measurements are divided into four categories based on the total CN and CCN0.3 (CCN concentration at 0.3 % supersaturation) to identify differences in processes and sources that lead to the observed variability of measurements. A back-trajectory analysis is performed to identify the source of air parcels and their history with respect to their proximity to clouds and precipitation. Additionally, a PMA-mode fitting algorithm (Saliba et al., 2019) is utilized to understand the contribution of PMA to CCN and observed CDNC concentrations. The findings describe the observed spatial gradients and relative importance of biogenic sulfate and PMA to CDNCs, which ultimately contribute to improving estimates of the energy budget in the SO.
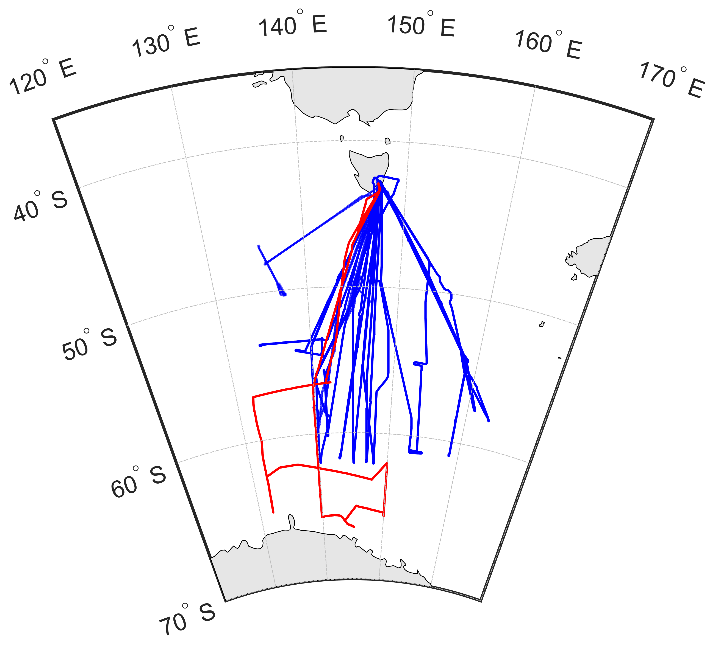
Figure 1SOCRATES and CAPRICORN-2 study region. Blue and red lines represent the SOCRATES flight tracks and CAPRICORN-2 R/V Investigator tracks, respectively.
2.1 NSF/NCAR HIAPER GV measurements and R/V Investigator CCN measurements
Airborne measurements were collected on the NSF/NCAR Gulfstream-V High-performance Instrumented Airborne Platform for Environmental Research (GV HIAPER) observational platform. The GV was stationed at the Hobart International Airport, Tasmania, during the austral summer between 15 January and 24 February 2018. The flight strategy during SOCRATES involved ferrying out to a predetermined area of interest followed by a series of straight vertical profiles and level legs to sample below, in, and above clouds. The GV HIAPER conducted 15 research flights (RFs) over the SO between 42.5 and 62.1∘ S and between 133.8 and 163.1∘ E at altitudes ranging from 50–7500 m. Flight tracks are shown in Fig. 1 and flight strategy are discussed in McFarquhar et al. (2020).
A wing-mounted ultra-high-sensitivity aerosol spectrometer (UHSAS, Droplet Measurement Technologies, Boulder, CO) measured particle size distribution between 0.06 and 1.0 µm in diameter; however, the 0.06–0.07 µm diameter range was not used in this analysis due to instrument noise. Ambient subsaturated particles collected with the UHSAS were dried through a de-icing system (designed to vary the temperature and pressure of sampled air to prevent ice formation in the inlet). A condensation particle counter (CPC, TSI 3760A) was used to measure total particle concentrations (CN, diameter >0.01 µm). CCN measurements were performed with two miniature continuous-flow streamwise thermal gradient chambers, one in scanning supersaturation mode and one in constant supersaturation mode (Roberts and Nenes, 2005). The miniature CCN counters are custom-made and operate with the same physical principles described by Roberts and Nenes (2005). Empirical calibrations are derived using dried monodisperse ammonium sulfate particles that are measured by the CCN counter and a CN counter to derive the activated fraction. The critical supersaturation in this study was derived by Kohler theory using a Van 't Hoff factor of 3.0 as an upper limit for ammonium sulfate. Using a Van 't Hoff factor of 2.52 (Petters and Kreidenweis, 2007; Rose et al., 2008) would shift the CCN spectra to larger supersaturations by less than 10 %. An instrument model, discussed in Roberts and Nenes (2005) showed a standard deviation in the supersaturation estimate of about ±0.01 %. The supersaturation range of the scanning CCN counter flow rates and temperature gradients vary from 0.09 to 0.22 L min−1 and 8 to 12 K, respectively. A sinusoidal pattern from high-flow and high-temperature gradient to low-flow and low-temperature gradient with a period of 10 min generated a continuous CCN spectra every 5 min that spanned from 0.06 % to 0.87 % supersaturation. The constant supersaturation CCN counter operated at constant flow and temperature gradient of 0.15 L min−1 and 9 K for a 0.43 % supersaturation (referred to as CCN0.43) at 1 Hz and was used to identify CCN gradients in vertical profiles (Sect. 3.6). CCN concentration at 0.3 % supersaturation (CCN0.3, derived from the scanning CCN counter) was used throughout this study as a reference CCN concentration because CCN0.3 corresponded best to observed CDNCs (Sect. 3.3). The internal chamber pressure of both CCN counters was controlled to 400 hPa. A cloud droplet probe (CDP, DMT, Boulder, CO) was used to measure cloud droplet concentration (2–50 µm wet diameter). The CCN spectra and UHSAS number concentrations on the GV were used to estimate the hygroscopicity parameter at 0.07 µm diameter (κ70) for each MBL leg. For this calculation, the critical supersaturation is derived from the CCN spectra, where the UHSAS concentration at 0.07 µm diameter is equivalent to the CCN concentration. All particle measurements were converted to surface standard temperature and pressure (see the Supplement, for example). CN and CCN measurements made in cloud (defined by CDP measurements of LWC >0.1 g kg−1) were excluded from the analysis due to the influence of droplet shattering within the aerosol inlets. During the research flights, areas of intense precipitation were avoided, but some measurements were made under drizzle and light rain conditions; however, there was no evidence of droplet shattering in the inlets under these conditions.
In addition to the SOCRATES GV HIAPER measurements, the R/V Investigator (CSIRO, Hobart, Tasmania) also collected aerosol and sea water samples during the second Clouds, Aerosols, Precipitation, Radiation and atmospheric Composition Over the southeRn Ocean (CAPRICORN-2) campaign. The CAPRICORN-2 study was conducted from 10 January to 21 February 2018, overlapping the SOCRATES study. The R/V Investigator covered a north–south transect over the SO, starting at Hobart, Tasmania (43∘ S), reaching approximately 66∘ S, and then returning to Hobart (Fig. 1). In this study, CCN measurements collected on the R/V Investigator were measured with a commercially available streamwise CCN counter (CCN-100, Droplet Measurement Technologies, Boulder, CO) that measured CCN concentration between 0.25 % and 1.05 % supersaturation with a stepwise scan. Each CCN spectrum took approximately 1 h to complete. R/V Investigator CCN at 0.3 % are analyzed and compared to the GV HIAPER CCN0.3 measurements. The full CCN dataset collected on the R/V Investigator during CAPRICORN2 are available at Humphries et al. (2020). Details of the aerosol sampling system on board the R/V Investigator are presented in Humphries et al. (2019) and Alroe et al. (2020). In short, aerosol sampling occurred via a common sampling inlet mounted on a mast at the bow of the ship, located 18 m above sea level. The CCN counter sampled from a manifold located 8 m below the mast in the ship's bow.
2.2 Model data
2.2.1 HYSPLIT-GDAS
In this study, HYSPLIT hourly 5 d back trajectories were performed with the Global Data Assimilation System (GDAS, ftp://arlftp.arlhq.noaa.gov/pub/archives/gdas0p5/, last access: 23 January 2020) (Rolph et al., 2017; Stein et al., 2015) at 0.5∘ resolution for each CCN spectrum in the MBL leg (below the cloud layer if clouds are present). The latitude, longitude, and altitude (50–500 m) averaged for each CCN spectra (∼150 s, ∼15–20 km horizontal distance) collected during the MBL legs on the GV HIAPER were used as starting points for the back trajectories. Antarctica is the only continent over which back trajectories passed; none of the airborne aerosol measurements in the MBL were influenced by continental Australia. The only anthropogenic influences were potentially ship tracks and research stations in Antarctica, which we assume to have a negligible impact in this study.
2.2.2 ECMWF ReAnalysis (ERA5)
ERA5 is the 5th generation of a climate reanalysis dataset from the European Centre for Medium-Range Weather Forecasts (ECMWF) (Copernicus Climate Change Service (C3S), 2017). The ERA5 model assimilates satellite, ground, and airborne measurements to archive the state of the weather and climate. The ERA5 total precipitation and low-level cloud fraction was used for the time period covering the SOCRATES campaign to identify the role of clouds and precipitation in changing CN and CCN concentrations. The ERA5 time resolution is hourly, and spatial resolution is 0.25∘.
2.3 Primary marine aerosol (PMA) fitting algorithm
The PMA concentration was determined by fitting the UHSAS distribution of particles greater than 0.2 µm diameter to a single lognormal mode. A single lognormal mode has been found to represent PMA in ambient measurements (Modini et al., 2015; Quinn et al., 2017; Saliba et al., 2019). While this method was previously used on dry particle number size distributions ranging from 0.02 to 5.0 µm (Saliba et al., 2019), the UHSAS measures the particle number size distribution between 0.07 and 1.0 µm diameter. In addition, PMA particles in the SOCRATES campaign were not fully dried and a relatively narrow deliquesced mode (geometric standard deviation = 1.44 ± 0.25) is present at approximately 0.6 µm diameter. This deliquesced mode was present despite the findings by Strapp et al. (1992), suggesting the de-icing heaters of the PCASP-100X (which are identical to those used for the UHSAS) is expected to dry the particles to less than 40 % relative humidity. We hypothesize that the low residence time of the aerosol in the instrument (∼0.2 s) prevented the large hygroscopic sea salt from fully drying before being measured. This 0.6 µm deliquescent mode was consistently fit by the algorithm. The deliquesced PMA particles affect the mode diameter of the fitted PMA size distribution but not the retrieved PMA (and CCN0.3) number concentrations. The concentration of particles in this fitted mode correlated moderately with wind speed (Sect. 3.5), similar to previous measurements of PMA estimated with this method (Modini et al., 2015; Quinn et al., 2017; Saliba et al., 2019), indicating the fitted mode is a viable approximation of PMA concentrations. The estimated PMA mode diameter and geometric width (0.59 ± 0.04 µm, 1.44 ± 0.25, respectively) are consistent with sea salt distributions (from PMA) observed on size-resolved particles collected in the marine boundary layer during SOCRATES and analyzed with transmission electron microscopy (TEM). The TEM analysis showed that ∼70–95 % of marine boundary layer particles >0.5 µm in optical diameter are PMA sea spray (Twohy et al., 2021).
3.1 Particle regimes
MBL CN and CCN0.3 measured on the GV HIAPER MBL legs ranged from 116 to 1153 and 17 to 264 cm−3 and averaged 540 ± 246 and 123 ± 58 cm−3, respectively. Figure 2b shows the CN and CCN0.3 concentrations averaged over each CCN spectra scan during GV HIAPER MBL legs throughout the SOCRATES field project (with the exception of RF 14 when the scanning CCN counter malfunctioned). To determine which atmospheric processes drove the variability of nearly an order of magnitude in CN and CCN0.3, the measurements were divided into four regimes. The regime thresholds were selected based on the bimodality of observed CN and CCN0.3 concentrations shown by the histograms and kernel density functions in Fig. 2a, c. Using this approach, rather than grouping all values into a single bin, each measurement is represented by a normal distribution and integrated to produce the kernel density estimate. The optimal kernel density estimate bandwidth was found to be 28 and 91 for CCN0.3 and CN, respectively, and calculated using the “ksdensity” function from MATLAB (2019), derived from theory developed by DeVeaux et al. (1999). The Hartigan's Dip test (Hartigan and Hartigan, 1985) determined that the distribution was not unimodal (p value <0.01) for both CN and CCN0.3, thereby validating the use of a bimodal distribution for this analysis. The bimodal distribution minima correspond to 125 and 750 cm−3 for CCN0.3 and CN, respectively. Even though only CCN0.3 was used to determine the particle regimes, Fig. 3a illustrates the systematic differences between the averaged CCN spectra and CN concentrations for each of the regimes. The bimodal CCN0.3 and CN regimes were combined for a total of four regimes. Table 1 shows the average CCN0.3 and CN concentrations for each of the four regimes, which are distinguished by permutations of high and low CCN0.3 and CN concentrations.
Table 1Mean and standard deviation of CN and CCN0.3 number concentration for the four identified regimes measured in the GV MBL legs.

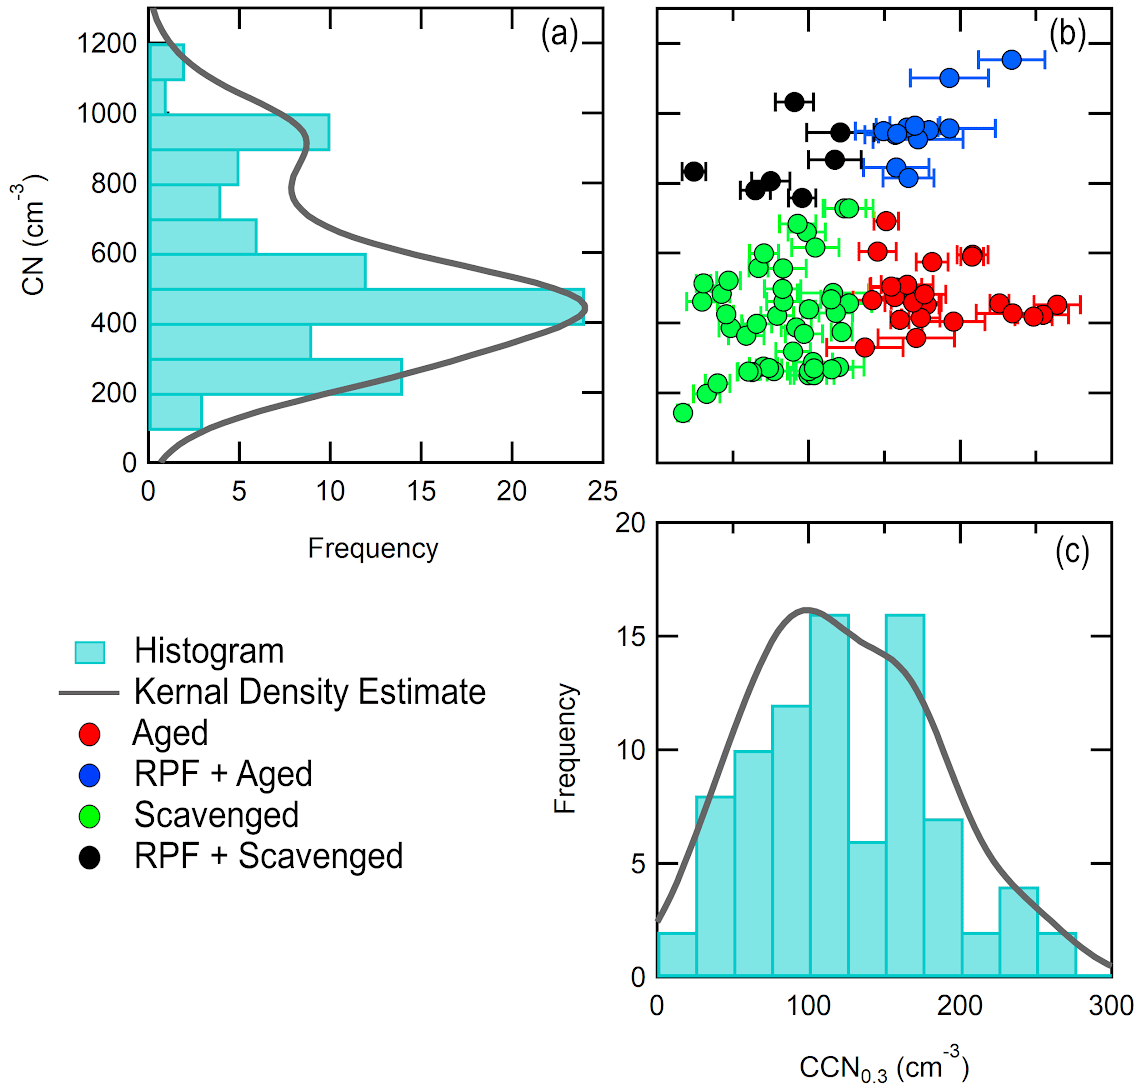
Figure 2Histograms and kernel density estimates of (a) CN concentrations and (c) MBL CCN0.3 (CCN concentration at 0.3 % supersaturation). (b) MBL CN and CCN0.3. Measurements are divided into four particle regimes based on the observed bimodal distributions of both CN and CCN0.3. Error bars represent the standard error.
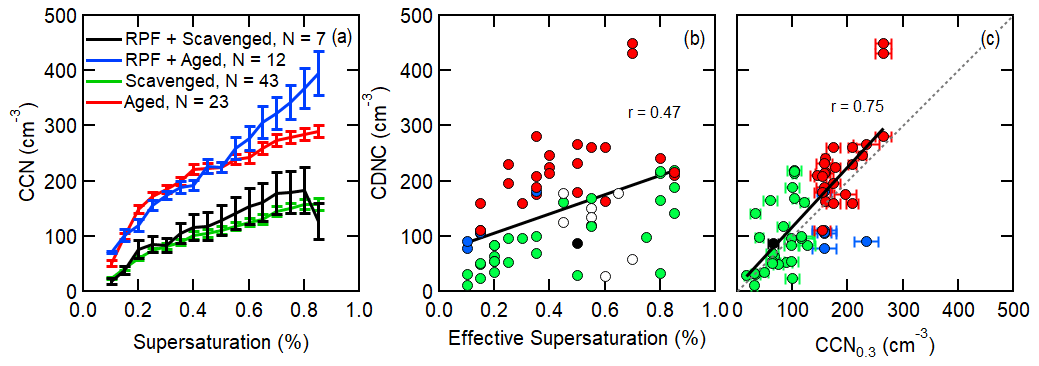
Figure 3(a) Mean MBL CCN spectra for each regime. The number of samples (N) at each supersaturation of the CCN spectra varied from the number of samples in the legend because CCN spectra scans were occasionally not fully completed by the end of the MBL leg. Error bars represent the standard error (σ/). Correlations of measured CDNC with (b) calculated effective supersaturation and (c) measured MBL CCN0.3. Empty points did not have a corresponding CCN0.3 or CN measurement. Solid lines in (b) and (c) represent linear fits and the dashed line in (c) represents the 1:1 line. Error bars represent the standard error.
To differentiate the four regimes in the text, we have given them each abbreviated descriptive names based on their CN and CCN0.3 concentrations, where the regime with high CN and CCN concentrations is referred to as “Recent particle formation (RPF) + aged”, the regime with low CN and CCN concentrations is referred to as “scavenged”, the regime with low CN and high CCN concentrations is referred to as “aged”, and finally the regime with high CN and low CCN concentrations is referred to as “RPF + scavenged”. The classification of each regime is based on the relative concentration of Aitken + accumulation-mode particles (CN) and accumulation-mode particles (CCN sizes), with a naming convention that describes the corresponding air mass history. Similar to analyses in previous studies, the relative contribution of the accumulation mode to the total particle concentration is used to identify recent particle formation (RPF) events and growth of small (<0.07 µm diameter) particles to accumulation-mode or CCN sizes (Kalivitis et al., 2015; Kleinman et al., 2012; Williamson et al., 2019). The scavenged regime is named based on evidence indicating the removal of CCN-sized particles through precipitation scavenging (Sect. 3.3). The aged regime represents cases in which accumulation mode is prominent and CCN particle concentrations are relatively high, likely due to atmospheric processes that increase particle size over time, such as the condensation of VOC oxidation products or cloud processing (Sect. 3.2 and 3.3, respectively). The RPF regimes exhibit a high CN concentration (>10 nm diameter), indicative of recent particle formation (Sect. 3.2).
3.2 Back trajectories
Previous studies have shown long-range transport of particles and VOCs can affect locally observed particle concentrations and chemical properties (Dzepina et al., 2015; Korhonen et al., 2008). In addition, atmospheric processes affecting particle concentrations upstream of the measurement location reduce the correlation of particle properties to individual (or discrete) processes, such as precipitation, cloud processing, and NPF (Albrecht, 1989; Bates et al., 1998b; Russell et al., 2009; Sanchez et al., 2018; Stevens and Feingold, 2009; Stevens and Seifert, 2008; Vallina et al., 2006; Wood et al., 2015). Lagrangian HYSPLIT back trajectories initiated at MBL leg altitudes (50–500 m) were used to determine the path traveled by the parcel of air for the previous 5 d for each of the MBL legs (Fig. 4). Consistent patterns are apparent for each of the particle regimes. Specifically, the back trajectories for the aged particle regime (Fig. 4d) are consistently from the south along the Antarctic coast, which is associated with the elevated ocean surface emissions of DMS and other VOCs produced by phytoplankton activity (Alroe et al., 2020; Humphries et al., 2016; Kim et al., 2019; O'Dowd et al., 1997; O'Shea et al., 2017; Weller et al., 2018). In contrast, the high CN regimes (RPF + aged and RPF + scavenged) exhibit back trajectories generally from the west from the SO. The scavenged regime consists of back trajectories from both the west and the south, signifying that atmospheric processes rather than the parcel paths and origins influence the observed CN and CCN concentrations.
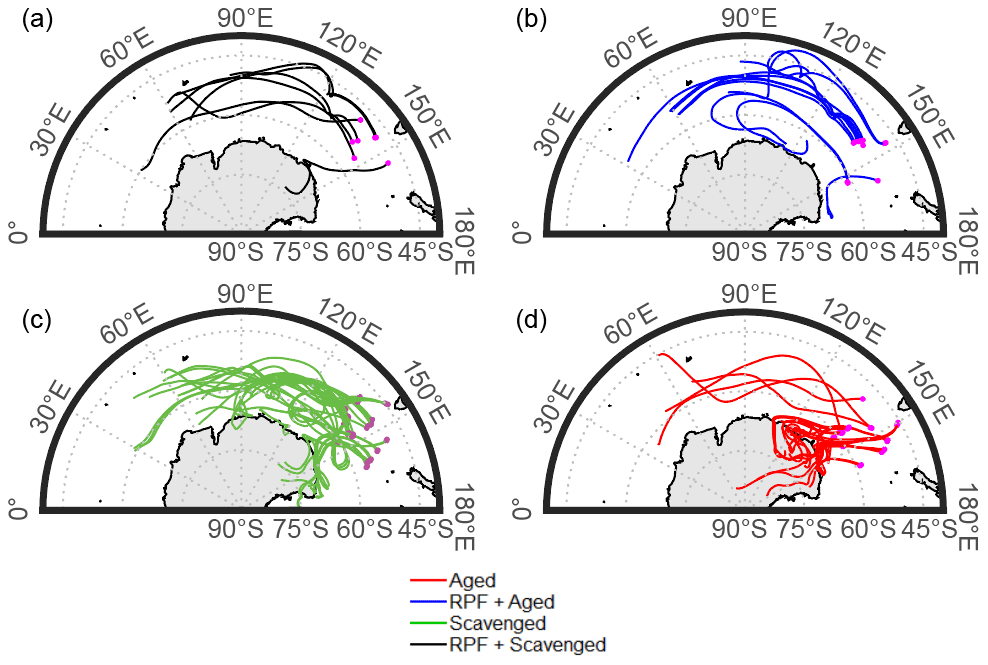
Figure 4The 5 d HYSPLIT back trajectories starting from MBL legs (at 50–500 m a.m.s.l., magenta points) for each particle regime.
3.3 Cloud processing
Relating the identified regimes to the observed cloud processes provides insight into how cloud processes affect CN and CCN concentrations. Figure 3c shows that CCN0.3 and CDNC correlated moderately (r=0.75), the highest correlation of CCN concentrations relative to other supersaturations, indicating that CCN0.3 is a good proxy for CDNC, which is similar to previous estimates of marine cloud-effective supersaturations (Martin et al., 1994; Snider et al., 2003). For this comparison, the 90th percentile of CDNC from each vertical profile is matched to the nearest below-cloud MBL leg CCN concentration. The use of the 90th percentile of CDNC excludes measurements that are heavily influenced by entrainment drying and also excludes outliers. As expected, the aged particle regime accounted for cases with the highest CDNCs (192 ± 100), while the scavenged particle regime accounted for the lowest observed CDNC (111 ± 72). Few CDNC measurements are associated with the RPF (high CN) regimes, suggesting fewer clouds are associated with this regime. Figure 3b shows the cloud-effective supersaturation and its relationship to the CDNC. The cloud-effective supersaturation is calculated as the supersaturation where the CCN concentration was equal to the 90th percentile of the measured CDNC. Typically, clouds contain a range of peak supersaturations, which are controlled by the strength of the updraft and the cloud droplet number concentration (Hudson and Svensson, 1995; Pawlowska and Grabowski, 2006; Siebert and Shaw, 2017). The effective supersaturation accounts for the CCN that have activated adiabatically near cloud base and subsequently dried through sub-adiabatic mixing processes (Sanchez et al., 2017). In general, the observed CDNC weakly correlate to the effective supersaturation (Fig. 3b, r=0.47). The two regimes with aged particles (high CCN) consistently had higher CDNCs than the scavenged regime, highlighting the role of CCN concentrations as CDNC. It is also important to note that CDNC can still be relatively high (∼200 cm−3) in regimes with low CCN under conditions of high in-cloud supersaturations generated by strong updrafts or with relatively low PMA concentrations, which also allows for the generation of higher in-cloud supersaturations (Fossum et al., 2020).
To identify the effect of precipitation on CCN concentrations, CCN0.3 is compared to the total precipitation (obtained from ERA5) integrated over a 35 h back trajectory, as shown in Fig. 5a. Manton et al. (2020) showed that the ERA5 annual cycle of precipitation across the SO is consistent with in situ data, but it is important to note that there is large uncertainty because of the low number of observations to constrain the ERA5. As expected, the two scavenged regimes (with lower CCN0.3 concentrations) corresponded to higher total precipitation. Figure 5b shows the Pearson correlation coefficient comparing the base 10 logarithm of the integrated total precipitation over back-trajectory times of 0 to 120 h and CCN concentrations between 0.1 % and 0.8 % supersaturation. The Pearson's coefficient r value peaked for 35 h back trajectories at CCN supersaturations ranging from 0.3 % to 0.5 % (similar to effective in-cloud supersaturations, Fig. 5b), indicating air parcel history, particularly in the last 1.5 d, is important for determining atmospheric processes that affect CCN concentration. The Pearson's coefficient for CCN0.1 was consistently the lowest, likely because CCN0.1 is associated with PMA, which is quickly replenished in the MBL through sea spray emissions. Similarly, the Pearson's coefficient for CCN0.87 was also low, likely because this CCN size is associated with RPF particles that are replenished in the FT and subsequently grow to larger sizes (and lower supersaturation CCN).
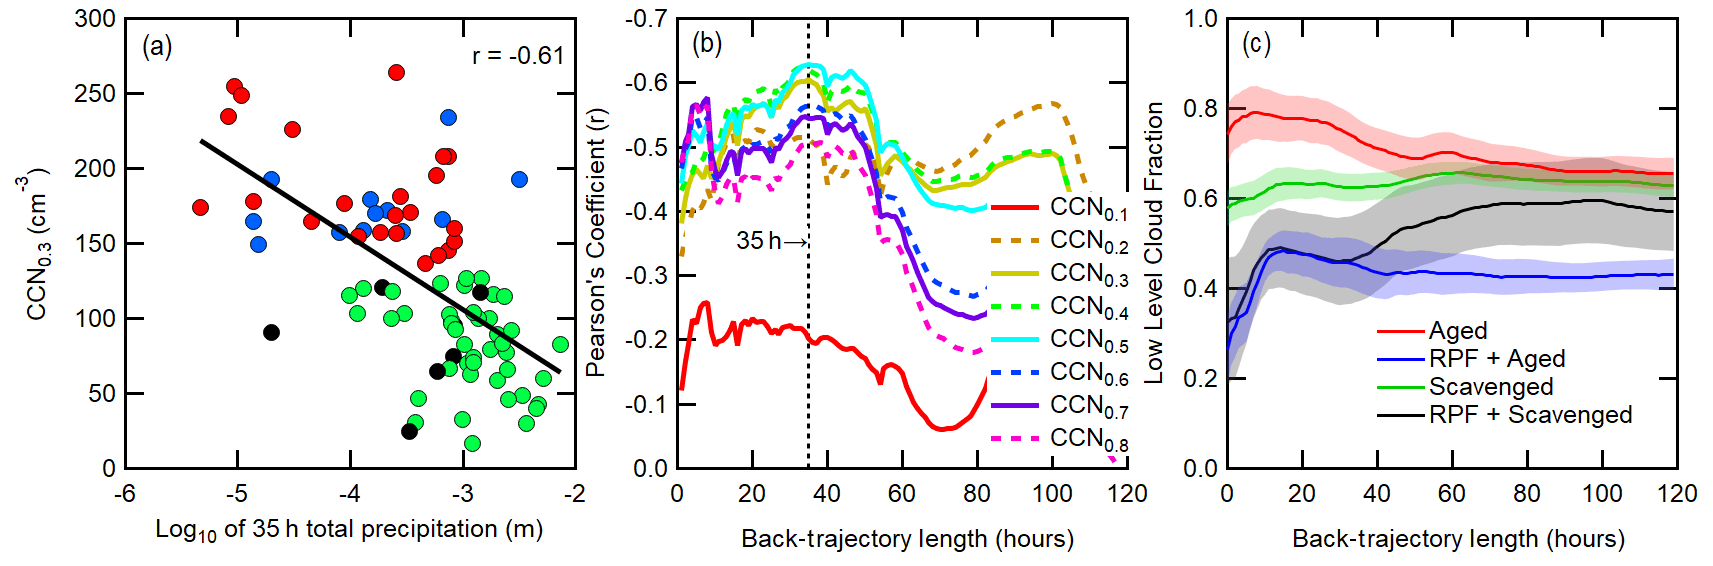
Figure 5(a) Correlation of MBL CCN0.3 and total precipitation that occurred along a 35 h HYSPLIT back trajectory. Colors correspond to the legend in (c). (b) CCN and back-trajectory total precipitation correlation coefficient as a function of back-trajectory length. The vertical dashed line indicates a peak in correlation with CCN0.3 at 35 h. (c) Particle regime averaged ERA5 low-level cloud fraction over the 5 d back trajectory. Shaded areas represent the standard error.
Figure 5c shows the MBL cloud fraction (obtained from ERA5) over the 120 h back trajectory averaged for each particle regime. Similar to ERA5 precipitation, there are also a low number of observations to constrain the ERA5 cloud fraction product. Ship measurements in the region south of Australia were recently shown to be consistent with daily averaged observations and ERA5 cloud fraction values of 0.75 ± 0.23 and 0.71 ± 0.27, respectively, providing some confidence in the ERA5 (Wang et al., 2020). The two regimes with RPF (RPF and RPF + scavenged; high CN) are associated with lower cloud fraction (<0.6), which suggests the presence of cumulus clouds. NPF has previously been observed in cumulus cloud outflow regions (Bates et al., 1998b; Clarke et al., 1999; Cotton et al., 1995; Perry and Hobbs, 1994) and is likely the main source of CN in these RPF regimes. In contrast, the aged particle regimes correspond to high MBL cloud fraction (>0.6), which is consistent with stratus and stratocumulus clouds. Stratus and stratocumulus clouds typically include less precipitation, allowing more cloud processing of CN to CCN sizes (Flossmann and Wobrock, 2019; Hoppel et al., 1990; Hudson et al., 2015; Neubauer et al., 2014). In addition, the concentration of ultrafine particles (Dp<30 nm) also decreases through Brownian scavenging of interstitial particles onto cloud droplets (Croft et al., 2010), and thus higher cloud fractions further reduce CN concentrations. The back trajectories associated with the aged regime (Fig. 4d) typically originate from SO storm tracks to the south, which is consistent with the elevated cloud fraction shown in Fig. 5c. The storm track frequency peaks around 60∘ S (Li et al., 2009), suggesting parcels of air entering the storm track from the south have also been influenced by coastal Antarctic biogenic DMS and other VOC emissions, eventually leading to increases in CCN concentrations via cloud processing in the absence of precipitation. Schmale et al. (2019) and Alroe et al. (2020) also find that the higher fraction of particles serving as CCN near the coast of Antarctica are also from biologically derived particles. The trajectories associated with the RPF and the RPF + aged regimes are typically from the west and have fewer clouds. While these regimes have elevated CN concentrations, they are not linked to Antarctic coastal sources within the last 120 h (Fig. 4a, b). Long-range transport of aerosol particles and their precursors for more than 5 d is possible in the absence of major sinks (i.e., precipitation) (Feichter and Leisner, 2009). The existence of both aged and RPF in the same regime suggests particles have experienced some cloud processing and input from a recent particle formation event. The cloud fraction for the RPF + aged regime is significantly lower than the aged regime (Fig. 5c).
3.4 Latitudinal gradient
Both the airborne GV HIAPER and shipborne R/V Investigator measurements showed latitudinal (north–south) gradients in CCN concentrations, although differences in the sampling strategies between the two platforms do result in slight differences in the observed latitudinal gradients (discussed in detail below). Both sets of measurements showed high CCN concentrations near Antarctica (Fig. 6a–c) consistent with Antarctic coastal biological emissions as a source of aerosol precursors. Back trajectories (Fig. 4d; aged regime) show that long-range transport of these Antarctic coastal emissions generates elevated aerosol concentrations as far north as ∼50∘ S, almost 2000 km away from the Antarctic coast. The Pearson's coefficient comparing airborne CCN0.3 measurements with latitude suggests there is not a significant correlation (; Fig. 6b), unless the particles that were transported 2000 km across the SO from the Antarctic coast are excluded (). Similarly, there is no significant trend in airborne CN (Dp>0.01 µm) with latitude (r=0.16) even though previous studies have noted a distinct increase in CN and CCN concentrations near the Antarctic shelf at 64∘ S (Alroe et al., 2020; Humphries et al., 2016). In SOCRATES, however, airborne measurements on the GV HIAPER reached only 62.1∘ S and did not capture the expected distinct increase in CN concentrations above the Antarctic coastal areas.

Figure 6(a) The 5∘ latitude bin averaged CCN0.3 from the R/V Investigator. Correlation of latitude to (b) HIAPER GV CCN0.3, (c) total particle concentration with Dp>0.07 µm (UHSAS), and (d) κ derived at 0.07 µm. White points in (c) and (d) did not have a corresponding CCN0.3 or CN measurement. Pearson's coefficient for (b) is when excluding the three outliers at ∼46∘ S highlighted in the black square. Error bars represent the standard error.
A latitudinal gradient is observed in both the GV HIAPER UHSAS particle (Dp>0.07 µm) and CCN concentrations; however, the differences in their slopes imply a north–south gradient in particle composition (i.e., hygroscopicity) across the SO, as identified by the hygroscopicity parameter (κ70) for Dp>0.07 µm (Fig. 6d). The presence of a latitudinal gradient in aerosol concentrations (Dp>0.07 µm) and a weak gradient in the GV HIAPER CCN implies a north–south gradient in particle composition (i.e., hygroscopicity) across the SO. Figure 6d shows the hygroscopicity parameter (κ) for Dp>0.07 µm derived at each MBL leg. The lower κ (less hygroscopic aerosol) at high latitudes is consistent with sulfates and organic aerosol from biogenic emissions, which have relatively low κ values (κ=0.6–0.9 and κ<0.2, respectively) compared to PMA (κ∼1.0; Christiansen et al., 2020; Zieger et al., 2017) present in primary emissions at lower latitudes (Kreidenweis and Asa-Awuku, 2013; Petters and Kreidenweis, 2007). These results are consistent with findings of Schmale et al. (2019) showing MSA, an aerosol component associated with biogenic emissions, contributed about 2.5 times more mass in the Antarctic coastal region compared to the remote SO. Furthermore, the elevated CCN near the Antarctic coast is also consistent with a higher incidence of cloud processing in the region, despite the lower particle hygroscopicity (Alroe et al., 2020; Schmale et al., 2019). As PMA (mostly comprised of sea salt) is present all over the SO, relatively high κ values are found north of ∼55∘ S, where there are fewer biologically derived organic and sulfate particles. The latitudinal trend of decreasing κ (i.e., more hygroscopic chemical composition toward the lower latitudes) implies particles further south in the SO will need higher in-cloud supersaturations to activate particles of the same size compared to middle regions of the SO where there are fewer biologically derived particles. Alternatively, particle growth and aging enhances the particle's ability to be CCN active even with a low hygroscopicity and small initial size. Despite the lower observed hygroscopicity of particles at high latitudes based on the airborne measurements, there are a greater number of CCN available (Fig. 6b) to increase cloud droplet number and potentially enhance cloud reflectivity at higher latitudes.
Measurements from the R/V Investigator during the CAPRICORN-2 study show minima in CCN concentrations around 60∘ S (Fig. 6a), which corresponds to the maximum in SO storm track activity (Li et al., 2009); however, this minima in CCN is not observed from the GV measurements and is not as pronounced in similar ship measurements at the same time (Humphries et al., 2021). As expected, based on the GV measurements, there are elevated CCN concentrations to the south of 60∘ S related to biogenic emissions from the Antarctic coastal areas. There are also elevated CCN concentrations north of 50∘ S measured on the R/V Investigator, probably related to continental emissions from Australia, elevated biomass emissions of VOCs (aerosol precursors), as suggested by increasing chlorophyll-a concentrations north of the subantarctic front (McCoy et al., 2015), and even long-range transport of Antarctic coastal emissions (Ayers and Gillett, 2000; Twohy et al., 2021). The different latitudinal trends in CCN observed by the GV HIAPER and R/V Investigator are likely a result of the different temporal and spatial sampling strategies between the aircraft and the ship. The GV transects were repeated 15 times over 40 d while avoiding actively precipitating clouds and represent the CCN variability across the SO. The GV typically started MBL measurements south of 50∘ S, so the trend in CCN concentrations is not as apparent in the GV measurements compared to the CCN gradient measured on the R/V Investigator. The R/V Investigator transected the SO twice, with each transect occurring over 20 d.
3.5 Primary marine aerosol (PMA)
To explore the contribution of marine sources to CCN and CDNC, PMA was estimated from the UHSAS distributions through fitting of the PMA mode using the algorithm from Saliba et al. (2019). The retrieved PMA concentrations varied between <1 and 25 cm−3, with an average of 6 ± 3 cm−3. The mode diameter of the retrieved PMA number size distribution was 0.59 ± 0.04 µm, which is consistent with the average mode diameter observed in the North Atlantic of 0.54 ± 0.21 µm (Saliba et al., 2019). The low geometric width (1.44 ± 0.25) of the PMA mode relative to Saliba et al. (2019) (ranging from 1.5–4.0) likely reflects the available statistics (N=74) and the possibility that the PMA particles were not completely dry (Sect. 2.3). The calculated PMA number concentrations moderately correlated to wind speed (r=0.53, Fig. 7a), as also reported by Saliba et al. (2019) over the North Atlantic and Bates et al. (1998b) south of Australia. Using the ratio of the PMA and CCN0.3 concentration (Fig. 7b), the PMA contribution to SO clouds can be estimated. PMA accounts for up to ∼20 % of CCN0.3 (and CDNC), even for conditions with precipitation scavenging in the previous 1.5 d (Fig. 5a), and only a small fraction compared to the biogenically generated aerosol. These results are consistent with Twohy et al. (2021) who found sea spray aerosol comprised a minority of cloud droplet residual number in three SOCRATES cases. Similarly, Quinn et al. (2017) found that PMA contributed to less than 30 % of CCN number concentration (at 0.3 % supersaturation) from measurements collected during other field campaigns conducted between 130∘ E (near Tasmania) and eastward to 60∘ W (near South America). In addition, Schmale et al. (2019) showed over three measurement legs that spanned the entire longitudinal range of the SO that the average PMA contribution to CCN ranged from 19 %–32 % at a supersaturation of 0.15 %. However, others have reported higher contributions of >50 % and even up to 100 % at high wind speeds (>16 m s−1) for supersaturations ≤0.3 %, during the austral summer (Fossum et al., 2018; Yoon and Brimblecombe, 2002).
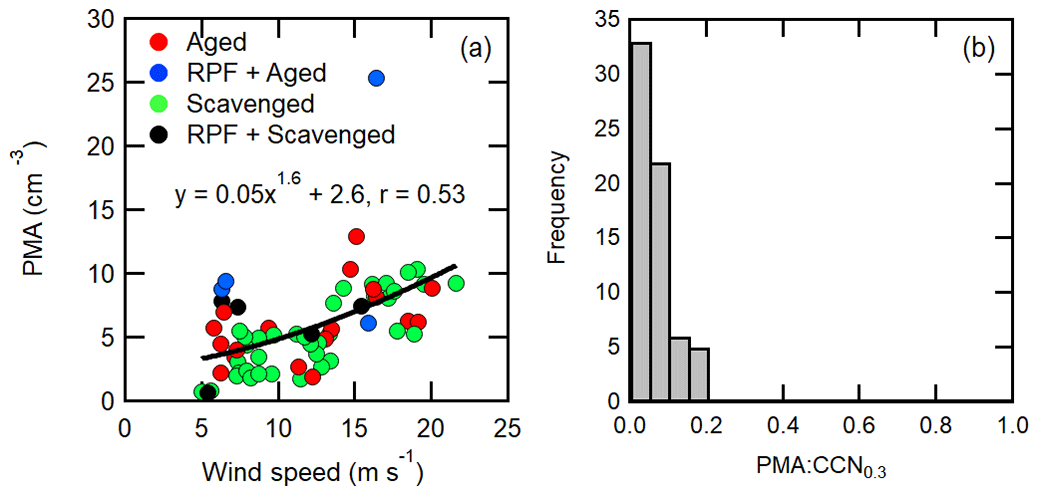
Figure 7(a) Correlation of estimated PMA concentration and wind speed and (b) the fraction of PMA accounting for CCN0.3 for MBL legs. Exclusion of the outlier in (a) increases the Pearson coefficient to 0.59.
3.6 Vertical transport
High concentrations of aerosol particles in the MBL can be formed during NPF events in the FT and subsequently entrained downward into the MBL (Bates et al., 1998a; Clarke et al., 1996, 2013; Korhonen et al., 2008; Pirjola et al., 2000; De Reus et al., 2000; Russell et al., 1998; Sanchez et al., 2018; Thornton et al., 1997; Yoon and Brimblecombe, 2002). The nucleation of new aerosol particles often occurs in the FT owing to the low total condensational sink and cold temperatures (Raes et al., 1997; Yue and Deepak, 1982). It has traditionally been thought that the SO is a possible exception to this trend because the SO MBL is a pristine environment with few anthropogenic sources, relatively low particle concentrations (condensational sink), and low temperatures compared to other MBLs around the world (Covert et al., 1992; Humphries et al., 2015; Pirjola et al., 2000; Yue and Deepak, 1982). To determine if the SO MBL truly is an exception to the trend of NPF typically occurring in the FT, we compare the concentrations of FT and BL CN and UHSAS concentrations across the MBL. CN (Dp>0.01 µm) and UHSAS (Dp>0.07 µm) concentrations in the MBL (CNMBL; UHSASMBL) and above the MBL inversion (CNInv; UHSASInv) are shown in Figs. 8d and 9, respectively. To identify if MBL CN concentrations are higher, similar, or lower than CN concentrations above the MBL inversion in Fig. 8d, the vertical profiles of CN are divided into three subsections, corresponding to classification where CN CNInv>1.3 (Fig. 8a), 1.3> CN CNInv>0.7 (Fig. 8b), and CN CNInv<0.7 (Fig. 8c). Figure 8a–c show examples of two CN and CCN0.43 vertical profiles. Figure 8a and c show profiles of CN concentrations when CNCNInv>1 (consistent with particle formation occurring in the MBL) and CN CNInv<1 (consistent with particle formation in the FT or decoupled layer). When CNCNInv ∼1, particle formation has not recently occurred in either the MBL or above the inversion (Fig. 8b), and mixing across the inversion homogenizes the aerosol concentrations between the FT and MBL. During this study, the CNInv is generally greater than CNMBL, which suggests particle formation occurs more frequently above the MBL inversion, either in the FT or a decoupled layer above the marine boundary layer. Despite the lack of influence from continental and anthropogenic particles as condensational sinks in the SO, the presence of a small concentration of PMA particles can lead to a high total particle surface area (Cainey and Harvey, 2002; Sanchez et al., 2021; Yoon and Brimblecombe, 2002) and prevent NPF in the MBL. This is also shown in the histogram of the CNCNInv ratio (Fig. 10a), which typically has a value of less than unity. These results are consistent with previous findings that the observed long-range transport of particles and their precursors from phytoplankton blooms (Fig. 4d) typically occurs above the MBL (Hudson et al., 1998; Korhonen et al., 2008; Meskhidze and Nenes, 2006; Russell et al., 1998; Sanchez et al., 2018; Thornton et al., 1997; Williamson et al., 2019; Yoon and Brimblecombe, 2002).
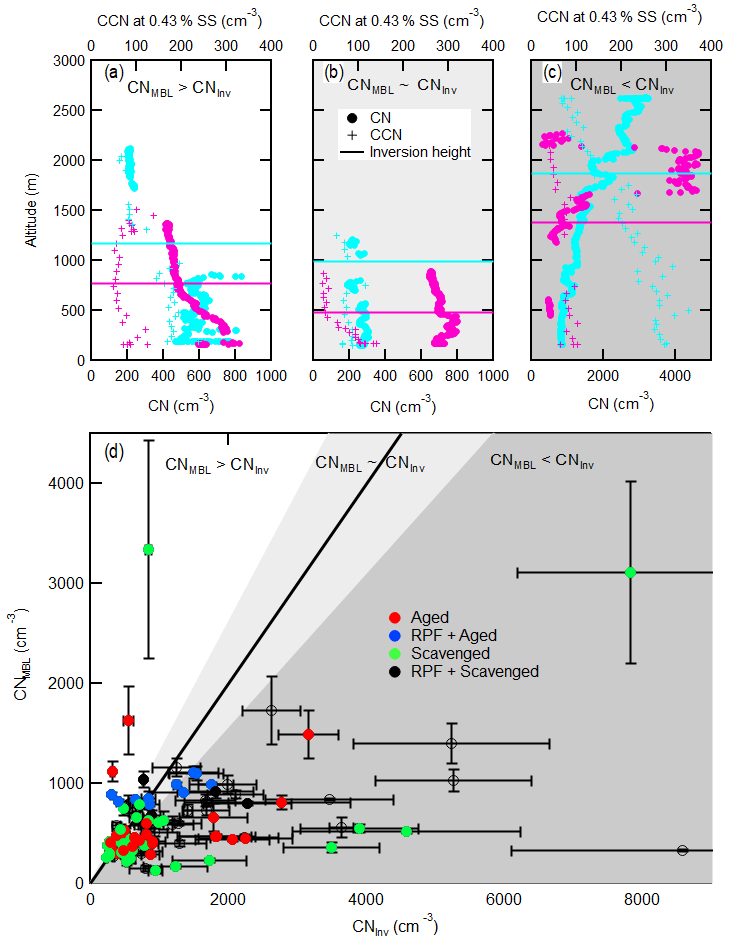
Figure 8Vertical profiles of CN and CCN at 0.43 % supersaturation corresponding to (a) elevated CN concentrations in the MBL, (b) well-mixed CN profiles, and (c) elevated CN concentrations aloft. The cyan and magenta points in (a–c) represent two different vertical profiles. (d) Comparison of CN measured in the surface-coupled MBL and decoupled layer or FT. Error bars represent standard error. Empty markers do not have a corresponding CCN0.3 measurement.
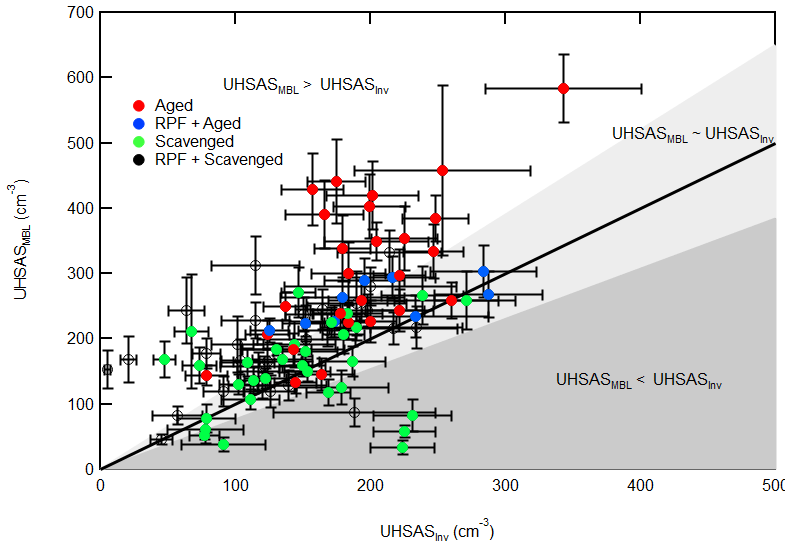
Figure 9Comparison of UHSAS concentrations (Dp>0.07 µm) measured in the surface-coupled MBL and decoupled layer or FT. Error bars represent standard error. Empty markers do not have a corresponding CCN0.3 measurement.

Similarly, Fig. 9 compares UHSAS concentrations (Dp>0.07 µm) in the MBL to those above the MBL inversion. As the UHSAS provided vertical profiles of the aerosol, we use the UHSAS to complement the static CCN measurements to assess the vertical extent of cloud-active aerosol. CCN0.3 and CCN0.4 correlate well with UHSAS (Dp>0.07 µm) concentrations (r=0.94). Contrary to the vertical extent of CN, UHSAS (Dp>0.07 µm) and CCN0.43 concentrations are generally greater in the MBL compared to above the MBL inversion (Figs. 8a–c, 10b), which suggests that high MBL UHSAS concentrations resulted from the growth of Aitken mode particles to CCN sizes through cloud processing (Sect. 3.2.2) (Hudson et al., 1998) or gas-phase to particle-phase condensation in the MBL (Pirjola et al., 2004; Russell et al., 2007; Sanchez et al., 2018) and is consequently associated with the aged regime (Fig. 9). Precipitation also likely played a role in depleting UHSAS and CCN-sized particles (Dp>0.07 µm) for the scavenged regimes.
GV HIAPER airborne measurements collected during the Southern Ocean Clouds, Radiation Aerosol Transport Experimental Study (SOCRATES) of CN and CCN over the Southern Ocean (SO) during the austral summer were separated into four regimes based on back trajectories and CN-to-CCN ratios. Airborne CCN measurements were also compared to shipborne measurements on the R/V Investigator collected on the second Clouds, Aerosols, Precipitation, Radiation and atmospheric Composition Over the southeRn Ocean (CAPRICORN-2) campaign. The airborne measurements on the GV HIAPER show a weak gradient in CCN at 0.3 % supersaturation (CCN0.3) with increasing CCN concentrations to the south between 44 to 62.1∘ S, which may be caused by aerosol precursors from Antarctic coastal biological emissions. Shipborne CCN measurements on the R/V Investigator also show gradients between 44 to 67∘ S, with a minimum around 60∘ S where the peak frequency of SO storm tracks occurs (Li et al., 2009). Enhanced ship-based CCN concentrations north of 50∘ S are likely from Australia. In one case enhanced CCN concentration measured on the GV near the Australian coast is shown to be from long-range transport from Antarctic coastal emissions. Elevated CCN concentrations to the south of 60∘ S originate from biogenic emissions from the Antarctic coastal area. The differences in the observed trends between airborne and shipborne CCN concentrations is likely due to the different sampling strategies.
The particle regimes from the GV measurements were determined from the observed bimodal distributions in CN and CCN0.3 concentrations, with minimum values at 750 and 125 cm−3, respectively. CCN0.3 was used for this analysis because concentrations at 0.3 % supersaturation showed the highest correlation with observed cloud droplet number concentrations (CDNCs). Four regimes have been identified based on back trajectories and CN and CCN0.3 concentrations, which ranged from 116–1153 and 17–264 cm−3, respectively. These regimes are labeled (1) scavenged regime, with low CN and CCN0.3 concentrations; (2) scavenged + recent particle formation (RPF) regime, with high CN and low CCN0.3 concentrations; (3) aged regime, with low CN and high CCN0.3 concentrations; and (4) RPF + aged regime, with high CN and CCN0.3 concentrations. Back trajectories associated with the aged regime consistently intersected the Antarctic coast, an area with elevated phytoplankton biomass relative to the open ocean and a source of biogenic emissions. The Antarctic coastal emissions generate a latitudinal gradient in the UHSAS (Dp>0.07 µm) and CCN concentrations, as well as a gradient in particle composition (inferred from hygroscopicity). The hygroscopicity gradient was derived from aerosol size distributions (UHSAS) and CCN spectra and resulted in less hygroscopic aerosol (lower κ) to the south, indicating CCN contained more biogenic sulfate and organics relative to those further north, which likely contained a larger fraction of more hygroscopic sea salt. Biogenic emissions from coastal Antarctic areas accounted for most of the CCN and CDNC concentrations in the SO during the austral summer, while PMA only accounted for about 20 % of observed CCN and CDNC.
Precipitation over the ∼1.5 d trajectory inversely correlates with CCN concentrations, indicating precipitation scavenging is a major sink of CCN in the SO. The boundary layer cloud fraction was highest for the aged (high-CCN) regime, suggesting cloud processing significantly enhanced CCN concentrations (CCN0.3=185 ± 38 cm−3 for the aged regime) in non-precipitating clouds. High CN concentrations (Dp>0.01 µm), characteristic of recent particle formation (RPF), corresponded to cases with low cloud fractions, which is consistent with particle formation in cumulus outflow, also found in previous studies (Bates et al., 1998b; Clarke et al., 1999; Cotton et al., 1995; Perry and Hobbs, 1994). RPF is the main eventual source of CCN number concentration in the SO. In addition, CN concentrations were typically lower in the MBL relative to concentrations above the MBL, suggesting that RPF typically occurred above the MBL inversion – either in the FT or a decoupled layer. In contrast, CCN and particle concentrations with Dp>0.07 µm (UHSAS) were higher in the MBL, suggesting growth of recently formed particles to CCN sizes occurred after mixing into the MBL and subsequent aging through gas-to-particle conversion and cloud processing.
Due to the remoteness of the SO, biogenic Antarctic coastal emissions appear to be the main CCN source to the SO MBL. Long-range transport of these emissions is shown to enhance measured particle concentrations up to 2000 km away and contribute significantly to the concentration and variability of SO CCN and CDNC. These results indicate that changes in future coastal Antarctica SO phytoplankton production caused by climate change (Deppeler and Davidson, 2017) could have significant ramifications for CCN concentrations and cloud properties in the SO. This work provides measurements that are rare for this region of the globe and may help reduce discrepancies between models and observations of CN and CCN concentrations.
SOCRATES CCN data can be found at https://doi.org/10.5065/D6Z036XB (Sanchez and Roberts, 2018). The SOCRATES GV navigation and microphysics data can be found at https://doi.org/10.5065/D6M32TM9 (UCAR/NCAR, 2017). GDAS data are available at ftp://arlftp.arlhq.noaa.gov/pub/archives/gdas0p5/ (Kleist et al., 2009). ERA5 data are available at https://doi.org/10.26023/Z0M2-M6YK-XD12 (ECMWF, 2018). All data and samples acquired on the CAPRICORN-2 voyage are made publicly available in accordance with CSIRO Marine National Facility policy. Processed R/V Investigator CCN data for CAPRICORN-2 are available at https://doi.org/10.25919/2h1c-t753 (Humphries et al., 2020). Raw data are available by contacting the data librarians (datalibrariansoamnf@csiro.au).
The supplement related to this article is available online at: https://doi.org/10.5194/acp-21-3427-2021-supplement.
KJS and GCR were responsible for the conceptualization, methodology, software, and the writing of the original draft. KJS performed the formal analysis and visualization. GCR and LMR were responsible for supervision, project administration, and funding acquisition. All authors participated in curating data, writing, review, and editing.
The authors declare that they have no conflict of interest.
The authors wish to thank the CSIRO Marine National Facility (MNF) for its support in the form of sea time on R/V Investigator, support personnel, scientific equipment, and data management. We thank the UCAR/NCAR-Earth Observing Laboratory and the flight crew for all the work done to obtain the measurements used in this paper.
This research has been supported by the National Science Foundation (grant nos. AGS-1660374, AGS-1660509, and AGS-1660605).
This paper was edited by Paul Zieger and reviewed by Luke Cravigan and two anonymous referees.
Albrecht, B. A.: Aerosols, cloud microphysics, and fractional cloudiness, Science, 245, 1227–1230, https://doi.org/10.1126/science.245.4923.1227, 1989.
Almeida, J., Schobesberger, S., Kürten, A., Ortega, I. K., Kupiainen-Määttä, O., Praplan, A. P., Adamov, A., Amorim, A., Bianchi, F., Breitenlechner, M., David, A., Dommen, J., Donahue, N. M., Downard, A., Dunne, E., Duplissy, J., Ehrhart, S., Flagan, R. C., Franchin, A., Guida, R., Hakala, J., Hansel, A., Heinritzi, M., Henschel, H., Jokinen, T., Junninen, H., Kajos, M., Kangasluoma, J., Keskinen, H., Kupc, A., Kurtén, T., Kvashin, A. N., Laaksonen, A., Lehtipalo, K., Leiminger, M., Leppä, J., Loukonen, V., Makhmutov, V., Mathot, S., McGrath, M. J., Nieminen, T., Olenius, T., Onnela, A., Petäjä, T., Riccobono, F., Riipinen, I., Rissanen, M., Rondo, L., Ruuskanen, T., Santos, F. D., Sarnela, N., Schallhart, S., Schnitzhofer, R., Seinfeld, J. H., Simon, M., Sipilä, M., Stozhkov, Y., Stratmann, F., Tomé, A., Tröstl, J., Tsagkogeorgas, G., Vaattovaara, P., Viisanen, Y., Virtanen, A., Vrtala, A., Wagner, P. E., Weingartner, E., Wex, H., Williamson, C., Wimmer, D., Ye, P., Yli-Juuti, T., Carslaw, K. S., Kulmala, M., Curtius, J., Baltensperger, U., Worsnop, D. R., Vehkamäki, H., and Kirkby, J.: Molecular understanding of sulphuric acid-amine particle nucleation in the atmosphere, Nature, 502, 359–363, https://doi.org/10.1038/nature12663, 2013.
Alroe, J., Cravigan, L. T., Miljevic, B., Johnson, G. R., Selleck, P., Humphries, R. S., Keywood, M. D., Chambers, S. D., Williams, A. G., and Ristovski, Z. D.: Marine productivity and synoptic meteorology drive summer-time variability in Southern Ocean aerosols, Atmos. Chem. Phys., 20, 8047–8062, https://doi.org/10.5194/acp-20-8047-2020, 2020.
Ayers, G. P. and Gillett, R. W.: DMS and its oxidation products in the remote marine atmosphere: Implications for climate and atmospheric chemistry, J. Sea Res., 43, 275–286, https://doi.org/10.1016/S1385-1101(00)00022-8, 2000.
Ayers, G. P. and Gras, J. L.: Seasonal relationship between cloud condensation nuclei and aerosol methanesulphonate in marine air, Nature, 353, 834–835, https://doi.org/10.1038/353834a0, 1991.
Bates, T. S., Huebert, B. J., Gras, J. L., Griffiths, F. B., and Durkee, P. A.: International Global Atmospheric Chemistry (IGAC) Project's First Aerosol Characterization Experiment (ACE 1): Overview, J. Geophys. Res.-Atmos., 103, 16297–16318, https://doi.org/10.1029/97JD03741, 1998a.
Bates, T. S., Kapustin, V. N., Quinn, P. K., Covert, D. S., Coffman, D. J., Mari, C., Durkee, P. A., De Bruyn, W. J. and Saltzman, E. S.: Processes controlling the distribution of aerosol particles in the lower marine boundary layer during the first aerosol characterization experiment (ACE 1), J. Geophys. Res.-Atmos., 103, 16369–16383, https://doi.org/10.1029/97JD03720, 1998b.
Bates, T. S., Quinn, P. K., Frossard, A. A., Russell, L. M., Hakala, J., Petäjä, T., Kulmala, M., Covert, D. S., Cappa, C. D., Li, S. M., Hayden, K. L., Nuaaman, I., McLaren, R., Massoli, P., Canagaratna, M. R., Onasch, T. B., Sueper, D., Worsnop, D. R., and Keene, W. C.: Measurements of ocean derived aerosol off the coast of California, J. Geophys. Res.-Atmos., 117, 13, https://doi.org/10.1029/2012JD017588, 2012.
Bates, T. S., Quinn, P. K., Coffman, D. J., Johnson, J. E., Upchurch, L., Saliba, G., Lewis, S., Graff, J., Russell, L. M., and Behrenfeld, M. J.: Variability in Marine Plankton Ecosystems Are Not Observed in Freshly Emitted Sea Spray Aerosol Over the North Atlantic Ocean, Geophys. Res. Lett., 47, e2019GL085938, https://doi.org/10.1029/2019GL085938, 2020.
Bodas-Salcedo, A., Williams, K. D., Ringer, M. A., Beau, I., Cole, J. N. S., Dufresne, J. L., Koshiro, T., Stevens, B., Wang, Z., and Yokohata, T.: Origins of the solar radiation biases over the Southern Ocean in CFMIP2 models, J. Climate, 27, 41–56, https://doi.org/10.1175/JCLI-D-13-00169.1, 2014.
Brient, F., Roehrig, R., and Voldoire, A.: Evaluating Marine Stratocumulus Clouds in the CNRM-CM6-1 Model Using Short-Term Hindcasts, J. Adv. Model. Earth Syst., 11, 127–148, https://doi.org/10.1029/2018MS001461, 2019.
Burrows, S. M., Easter, R., Liu, X., Ma, P.-L., Wang, H., Elliott, S. M., Singh, B., Zhang, K., and Rasch, P. J.: OCEANFILMS sea-spray organic aerosol emissions – Part 1: implementation and impacts on clouds, Atmos. Chem. Phys. Discuss. [preprint], https://doi.org/10.5194/acp-2018-70, in review, 2018.
Cainey, J. M. and Harvey, M.: Dimethylsulfide, a limited contributor to new particle formation in the clean marine boundary layer, Geophys. Res. Lett., 29, 32-1–32-4, https://doi.org/10.1029/2001GL014439, 2002.
Carslaw, K. S., Lee, L. A., Reddington, C. L., Pringle, K. J., Rap, A., Forster, P. M., Mann, G. W., Spracklen, D. V., Woodhouse, M. T., Regayre, L. A., and Pierce, J. R.: Large contribution of natural aerosols to uncertainty in indirect forcing, Nature, 503, 67–71, https://doi.org/10.1038/nature12674, 2013.
Chambers, S. D., Choi, T., Park, S. J., Williams, A. G., Hong, S. B., Tositti, L., Griffiths, A. D., Crawford, J., and Pereira, E.: Investigating Local and Remote Terrestrial Influence on Air Masses at Contrasting Antarctic Sites Using Radon-222 and Back Trajectories, J. Geophys. Res.-Atmos., 122, 13525–13544, https://doi.org/10.1002/2017JD026833, 2017.
Christiansen, S., Ickes, L., Bulatovic, I., Leck, C., Murray, B. J., Bertram, A. K., Wagner, R., Gorokhova, E., Salter, M. E., Ekman, A. M. L., and Bilde, M.: Influence of Arctic Microlayers and Algal Cultures on Sea Spray Hygroscopicity and the Possible Implications for Mixed-Phase Clouds, J. Geophys. Res.-Atmos., 125, https://doi.org/10.1029/2020JD032808, 2020.
Clarke, A. D., Li, Z., and Litchy, M.: Aerosol dynamics in the equatorial Pacific marine boundary layer: microphysics, diurnal cycles and entrainment, Geophys. Res. Lett., 23, 733–736, https://doi.org/10.1029/96GL00778, 1996.
Clarke, A. D., Davis, D., Kapustin, V. N., Eisele, F., Chen, G., Paluch, I., Lenschow, D., Bandy, A. R., Thornton, D., Moore, K., Mauldin, L., Tanner, D., Litchy, M., Carroll, M. A., Collins, J., and Albercook, G.: Particle nucleation in the tropical boundary layer and its coupling to marine sulfur sources, Science, 282, 89–92, https://doi.org/10.1126/science.282.5386.89, 1998.
Clarke, A. D., Kapustin, V. N., Eisele, F. L., Weber, R. J., and McMurry, P. H.: Particle production near marine clouds: Sulfuric acid and predictions from classical binary nucleation, Geophys. Res. Lett., 26, 2425–2428, https://doi.org/10.1029/1999GL900438, 1999.
Clarke, A. D., Freitag, S., Simpson, R. M. C., Hudson, J. G., Howell, S. G., Brekhovskikh, V. L., Campos, T., Kapustin, V. N., and Zhou, J.: Free troposphere as a major source of CCN for the equatorial pacific boundary layer: long-range transport and teleconnections, Atmos. Chem. Phys., 13, 7511–7529, https://doi.org/10.5194/acp-13-7511-2013, 2013.
Collins, D. B., Bertram, T. H., Sultana, C. M., Lee, C., Axson, J. L., and Prather, K. A.: Phytoplankton blooms weakly influence the cloud forming ability of sea spray aerosol, Geophys. Res. Lett., 43, 9975–9983, https://doi.org/10.1002/2016GL069922, 2016.
Copernicus Climate Change Service (C3S): ERA5: Fifth generation of ECMWF atmospheric reanalyses of the global climate, Copernicus Clim. Chang. Serv. Clim. Data Store (CDS), available at: https://cds.climate.copernicus.eu/cdsapp#!/home (last access: 4 April 2018), 2017.
Cotton, W. R., Alexander, G. D., Hertenstein, R., Walko, R. L., McAnelly, R. L., and Nicholls, M.: Cloud venting – A review and some new global annual estimates, Earth Sci. Rev., 39, 169–206, https://doi.org/10.1016/0012-8252(95)00007-0, 1995.
Covert, D. S., Kapustin, V. N., Quinn, P. K., and Bates, T. S.: New particle formation in the marine boundary layer, J. Geophys. Res., 97, 20581–20589, https://doi.org/10.1029/92jd02074, 1992.
Cravigan, L. T., Mallet, M. D., Vaattovaara, P., Harvey, M. J., Law, C. S., Modini, R. L., Russell, L. M., Stelcer, E., Cohen, D. D., Olsen, G., Safi, K., Burrell, T. J., and Ristovski, Z.: Sea spray aerosol organic enrichment, water uptake and surface tension effects, Atmos. Chem. Phys., 20, 7955–7977, https://doi.org/10.5194/acp-20-7955-2020, 2020.
Croft, B., Lohmann, U., Martin, R. V., Stier, P., Wurzler, S., Feichter, J., Hoose, C., Heikkilä, U., van Donkelaar, A., and Ferrachat, S.: Influences of in-cloud aerosol scavenging parameterizations on aerosol concentrations and wet deposition in ECHAM5-HAM, Atmos. Chem. Phys., 10, 1511–1543, https://doi.org/10.5194/acp-10-1511-2010, 2010.
Dawson, M. L., Varner, M. E., Perraud, V., Ezell, M. J., Gerber, R. B., and Finlayson-Pitts, B. J.: Simplified mechanism for new particle formation from methanesulfonic acid, amines, and water via experiments and ab initio calculations, P. Natl. Acad. Sci. USA., 109, 18719–18724, https://doi.org/10.1073/pnas.1211878109, 2012.
Deppeler, S. L. and Davidson, A. T.: Southern Ocean phytoplankton in a changing climate, Front. Mar. Sci., 4, 40, https://doi.org/10.3389/fmars.2017.00040, 2017.
DeVeaux, R. D., Bowman, A. W., and Azzalini, A.: Applied Smoothing Techniques for Data Analysis, Oxford University Press Inc., New York., 1999.
Downey, A., Jasper, J. D., Gras, J. J., and Whittlestone, S.: Lower tropospheric transport over the Southern Ocean, J. Atmos. Chem., 11, 43–68, https://doi.org/10.1007/BF00053667, 1990.
Dzepina, K., Mazzoleni, C., Fialho, P., China, S., Zhang, B., Owen, R. C., Helmig, D., Hueber, J., Kumar, S., Perlinger, J. A., Kramer, L. J., Dziobak, M. P., Ampadu, M. T., Olsen, S., Wuebbles, D. J., and Mazzoleni, L. R.: Molecular characterization of free tropospheric aerosol collected at the Pico Mountain Observatory: a case study with a long-range transported biomass burning plume, Atmos. Chem. Phys., 15, 5047–5068, https://doi.org/10.5194/acp-15-5047-2015, 2015.
Efraim, A., Rosenfeld, D., Schmale, J., and Zhu, Y.: Satellite Retrieval of Cloud Condensation Nuclei Concentrations in Marine Stratocumulus by Using Clouds as CCN Chambers, J. Geophys. Res.-Atmos., 125, 1–11, https://doi.org/10.1029/2020JD032409, 2020.
European Centre for Medium Range Weather Forecasts (ECMWF): ECMWF 0.1 Degree IFS Model Data, Version 1.0, UCAR/NCAR – Earth Observing Laboratory, https://doi.org/10.26023/Z0M2-M6YK-XD12, 2018.
Feichter, J. and Leisner, T.: Climate engineering: A critical review of approaches to modify the global energy balance, Eur. Phys. J. Spec. Top., 176, 81–92, https://doi.org/10.1140/epjst/e2009-01149-8, 2009.
Flossmann, A. I. and Wobrock, W.: Cloud processing of aerosol particles in marine stratocumulus clouds, Atmosphere-Basel, 10, 520, https://doi.org/10.3390/atmos10090520, 2019.
Fossum, K. N., Ovadnevaite, J., Ceburnis, D., Dall'Osto, M., Marullo, S., Bellacicco, M., Simó, R., Liu, D., Flynn, M., Zuend, A., and O'Dowd, C.: Summertime Primary and Secondary Contributions to Southern Ocean Cloud Condensation Nuclei, Sci. Rep.-UK, 8, 13844, https://doi.org/10.1038/s41598-018-32047-4, 2018.
Fossum, K. N., Ovadnevaite, J., Ceburnis, D., Preißler, J., Snider, J. R., Huang, R. J., Zuend, A., and O'Dowd, C.: Sea-spray regulates sulfate cloud droplet activation over oceans, NPJ Clim. Atmos. Sci., 3, 14, https://doi.org/10.1038/s41612-020-0116-2, 2020.
Frieß, U., Hollwedel, J., König-Langlo, G., Wagner, T., and Platt, U.: Dynamics and chemistry of troposheric bromine explosion events in the Antarctic coastal region, J. Geophys. Res.-Atmos., 109, 1–15, https://doi.org/10.1029/2003jd004133, 2004.
Frossard, A. A., Russell, L. M., Burrows, S. M., Elliott, S. M., Bates, T. S., and Quinn, P. K.: Sources and composition of submicron organic mass in marine aerosol particles, J. Geophys. Res.-Atmos., 119, 12977–13003, https://doi.org/10.1002/2014JD021913, 2014.
Fuentes, E., Coe, H., Green, D., de Leeuw, G., and McFiggans, G.: On the impacts of phytoplankton-derived organic matter on the properties of the primary marine aerosol – Part 1: Source fluxes, Atmos. Chem. Phys., 10, 9295–9317, https://doi.org/10.5194/acp-10-9295-2010, 2010.
Hartigan, J. A. and Hartigan, P. M.: The Dip Test of Unimodality, Ann. Stat., 13, 70–84, https://doi.org/10.1214/aos/1176346577, 1985.
Hoppel, W. A., Frick, G. M., and Larson, R. E.: Effect of nonprecipitating clouds on the aerosol size distribution in the marine boundary layer, Geophys. Res. Lett., 13, 125–128, https://doi.org/10.1029/GL013i002p00125, 1986.
Hoppel, W. A., Fitzgerald, J. W., Frick, G. M., Larson, R. E., and Mack, E. J.: Aerosol size distributions and optical properties found in the marine boundary layer over the Atlantic Ocean, J. Geophys. Res., 95, 3659–3686, https://doi.org/10.1029/JD095iD04p03659, 1990.
Huang, J. and Jaeglé, L.: Wintertime enhancements of sea salt aerosol in polar regions consistent with a sea ice source from blowing snow, Atmos. Chem. Phys., 17, 3699–3712, https://doi.org/10.5194/acp-17-3699-2017, 2017.
Hudson, J. G. and Svensson, G.: Cloud microphysical relationships in California marine stratus, J. Appl. Meteorol., 34, 2655–2666, https://doi.org/10.1175/1520-0450(1995)034<2655:CMRICM>2.0.CO;2, 1995.
Hudson, J. G., Xie, Y., and Yum, S. S.: Vertical distributions of cloud condensation nuclei spectra over the summertime Southern Ocean, J. Geophys. Res., 103, 16609–16624, https://doi.org/10.1029/97JD03438, 1998.
Hudson, J. G., Noble, S., and Tabor, S.: Cloud supersaturations from CCN spectra Hoppel minima, J. Geophys. Res., 120, 3436–3452, https://doi.org/10.1002/2014JD022669, 2015.
Humphries, R., McRobert, I., Ward, J., Harnwell, J., and Keywood, M.: CAPRICORN2 – Atmospheric aerosol measurements from the RV Investigator voyage in 2018.v1, CSIRO Data Collect, https://doi.org/10.25919/2h1c-t753, 2020.
Humphries, R. S., Schofield, R., Keywood, M. D., Ward, J., Pierce, J. R., Gionfriddo, C. M., Tate, M. T., Krabbenhoft, D. P., Galbally, I. E., Molloy, S. B., Klekociuk, A. R., Johnston, P. V., Kreher, K., Thomas, A. J., Robinson, A. D., Harris, N. R. P., Johnson, R., and Wilson, S. R.: Boundary layer new particle formation over East Antarctic sea ice – possible Hg-driven nucleation?, Atmos. Chem. Phys., 15, 13339–13364, https://doi.org/10.5194/acp-15-13339-2015, 2015.
Humphries, R. S., Klekociuk, A. R., Schofield, R., Keywood, M., Ward, J., and Wilson, S. R.: Unexpectedly high ultrafine aerosol concentrations above East Antarctic sea ice, Atmos. Chem. Phys., 16, 2185–2206, https://doi.org/10.5194/acp-16-2185-2016, 2016.
Humphries, R. S., McRobert, I. M., Ponsonby, W. A., Ward, J. P., Keywood, M. D., Loh, Z. M., Krummel, P. B., and Harnwell, J.: Identification of platform exhaust on the RV Investigator, Atmos. Meas. Tech., 12, 3019–3038, https://doi.org/10.5194/amt-12-3019-2019, 2019.
Humphries, R. S., Keywood, M. D., Gribben, S., McRobert, I. M., Ward, J. P., Selleck, P., Taylor, S., Harnwell, J., Flynn, C., Kulkarni, G. R., Mace, G. G., Protat, A., Alexander, S. P., and McFarquhar, G.: Southern Ocean latitudinal gradients of Cloud Condensation Nuclei, Atmos. Chem. Phys. Discuss. [preprint], https://doi.org/10.5194/acp-2020-1246, in review, 2021.
Hyder, P., Edwards, J. M., Allan, R. P., Hewitt, H. T., Bracegirdle, T. J., Gregory, J. M., Wood, R. A., Meijers, A. J. S., Mulcahy, J., Field, P., Furtado, K., Bodas-Salcedo, A., Williams, K. D., Copsey, D., Josey, S. A., Liu, C., Roberts, C. D., Sanchez, C., Ridley, J., Thorpe, L., Hardiman, S. C., Mayer, M., Berry, D. I., and Belcher, S. E.: Critical Southern Ocean climate model biases traced to atmospheric model cloud errors, Nat. Commun., 9, 3625, https://doi.org/10.1038/s41467-018-05634-2, 2018.
Kalivitis, N., Kerminen, V.-M., Kouvarakis, G., Stavroulas, I., Bougiatioti, A., Nenes, A., Manninen, H. E., Petäjä, T., Kulmala, M., and Mihalopoulos, N.: Atmospheric new particle formation as a source of CCN in the eastern Mediterranean marine boundary layer, Atmos. Chem. Phys., 15, 9203–9215, https://doi.org/10.5194/acp-15-9203-2015, 2015.
Kaufman, Y. J. and Tanré, D.: Effect of variations in super-saturation on the formation of cloud condensation nuclei, Nature, 369, 45–48, https://doi.org/10.1038/369045a0, 1994.
Kim, J., Yoon, Y. J., Gim, Y., Choi, J. H., Kang, H. J., Park, K.-T., Park, J., and Lee, B. Y.: New particle formation events observed at King Sejong Station, Antarctic Peninsula – Part 1: Physical characteristics and contribution to cloud condensation nuclei, Atmos. Chem. Phys., 19, 7583–7594, https://doi.org/10.5194/acp-19-7583-2019, 2019.
Kleinman, L. I., Daum, P. H., Lee, Y.-N., Lewis, E. R., Sedlacek III, A. J., Senum, G. I., Springston, S. R., Wang, J., Hubbe, J., Jayne, J., Min, Q., Yum, S. S., and Allen, G.: Aerosol concentration and size distribution measured below, in, and above cloud from the DOE G-1 during VOCALS-REx, Atmos. Chem. Phys., 12, 207–223, https://doi.org/10.5194/acp-12-207-2012, 2012.
Kleist, D. T., Parrish, D. F., Derber, J. C., Treadon, R., Wu, W.-S., and Lord, S.: Introduction of the GSI into the NCEP Global Data Assimilation System, Weather Forecast., 24 , 1691–1705, https://doi.org/10.1175/2009WAF2222201.1, 2009 (data available at: ftp://arlftp.arlhq.noaa.gov/pub/archives/gdas0p5/, last access: 23 January 2020).
Korhonen, H., Carslaw, K. S., Spracklen, D. V., Mann, G. W., and Woodhouse, M. T.: Influence of oceanic dimethyl sulfide emissions on cloud condensation nuclei concentrations and seasonality over the remote Southern Hemisphere oceans: A global model study, J. Geophys. Res.-Atmos., 113, D15204, https://doi.org/10.1029/2007JD009718, 2008.
Kreidenweis, S. M. and Asa-Awuku, A.: Aerosol Hygroscopicity: Particle Water Content and Its Role in Atmospheric Processes, in Treatise on Geochemistry, Second Edition, Vol. 5, pp. 331–361, Elsevier, Amsterdam, the Netherlands, 2013.
Krüger, O. and Grabßl, H.: Southern Ocean phytoplankton increases cloud albedo and reduces precipitation, Geophys. Res. Lett., 38, L08809, https://doi.org/10.1029/2011GL047116, 2011.
Kyrö, E.-M., Kerminen, V.-M., Virkkula, A., Dal Maso, M., Parshintsev, J., Ruíz-Jimenez, J., Forsström, L., Manninen, H. E., Riekkola, M.-L., Heinonen, P., and Kulmala, M.: Antarctic new particle formation from continental biogenic precursors, Atmos. Chem. Phys., 13, 3527–3546, https://doi.org/10.5194/acp-13-3527-2013, 2013.
Laursen, K. K., Jorgensen, D. P., Brasseur, G. P., Ustin, S. L., and Huning, J. R.: Hiaper: The next generation NSF/NCAR research aircraft, B. Am. Meteorol. Soc., 87, 896–909, https://doi.org/10.1175/BAMS-87-7-896, 2006.
Law, C. S., Smith, M. J., Harvey, M. J., Bell, T. G., Cravigan, L. T., Elliott, F. C., Lawson, S. J., Lizotte, M., Marriner, A., McGregor, J., Ristovski, Z., Safi, K. A., Saltzman, E. S., Vaattovaara, P., and Walker, C. F.: Overview and preliminary results of the Surface Ocean Aerosol Production (SOAP) campaign, Atmos. Chem. Phys., 17, 13645–13667, https://doi.org/10.5194/acp-17-13645-2017, 2017.
Lee, Y. H., Adams, P. J., and Shindell, D. T.: Evaluation of the global aerosol microphysical ModelE2-TOMAS model against satellite and ground-based observations, Geosci. Model Dev., 8, 631–667, https://doi.org/10.5194/gmd-8-631-2015, 2015.
Li, C., Yuan, X., and Patoux, J.: Satellite-based midlatitude cyclone statistics over the Southern Ocean: 1. Scatterometer-derived pressure fields and storm tracking, J. Geophys. Res.-Atmos., 114, D04105, https://doi.org/10.1029/2008JD010873, 2009.
Li, J., Michalski, G., Davy, P., Harvey, M., Katzman, T., and Wilkins, B.: Investigating Source Contributions of Size-Aggregated Aerosols Collected in Southern Ocean and Baring Head, New Zealand Using Sulfur Isotopes, Geophys. Res. Lett., 45, 3717–3727, https://doi.org/10.1002/2018GL077353, 2018.
Liu, J., Dedrick, J., Russell, L. M., Senum, G. I., Uin, J., Kuang, C., Springston, S. R., Leaitch, W. R., Aiken, A. C., and Lubin, D.: High summertime aerosol organic functional group concentrations from marine and seabird sources at Ross Island, Antarctica, during AWARE, Atmos. Chem. Phys., 18, 8571–8587, https://doi.org/10.5194/acp-18-8571-2018, 2018.
Mace, G. G. and Avey, S.: Seasonal variability of warm boundary layer cloud and precipitation properties in the Southern Ocean as diagnosed from A-Train data, J. Geophys. Res., 122, 1015–1032, https://doi.org/10.1002/2016JD025348, 2017.
Mace, G. G. J. and Protat, A.: Clouds over the Southern Ocean as observed from the R/V Investigator during CAPRICORN. Part I: Cloud occurrence and phase partitioning, J. Appl. Meteorol. Climatol., 57, 1783–1803, https://doi.org/10.1175/JAMC-D-17-0194.1, 2018.
Manton, M. J., Huang, Y., and Siems, S. T.: Variations in Precipitation across the Southern Ocean, J. Climate, 33, 10653–10670, https://doi.org/10.1175/jcli-d-20-0120.1, 2020.
Martin, G. M., Johnson, D. W., and Spice, A.: The Measurement and Parameterization of Effective Radius of Droplets in Warm Stratocumulus Clouds, J. Atmos. Sci., 51, 1823–1842, https://doi.org/10.1175/1520-0469(1994)051<1823:tmapoe>2.0.co;2, 1994.
MathWorks Inc.: MATLAB and Statistics Toolbox Release 2019b:, Natick, Massachusetts, United States, available at: https://www.mathworks.com/help/stats/ (last access: 18 December 2020), 2019.
Mccoy, D. T., Hartmann, D. L., and Grosvenor, D. P.: Observed Southern Ocean cloud properties and shortwave reflection. Part II: Phase changes and low cloud feedback, J. Clim., 27, 8858–8868, https://doi.org/10.1175/JCLI-D-14-00288.1, 2014.
McCoy, D. T., Burrows, S. M., Wood, R., Grosvenor, D. P., Elliott, S. M., Ma, P. L., Rasch, P. J., and Hartmann, D. L.: Natural aerosols explain seasonal and spatial patterns of Southern Ocean cloud albedo, Sci. Adv., 1, e1500157–e1500157, https://doi.org/10.1126/sciadv.1500157, 2015.
McFarquhar, G. M., Bretherton, C., Marchand, R., Protat, A., DeMott, P. J., Alexander, S. P., Roberts, G. C., Twohy, C. H., Toohey, D., Siems, S., Huang, Y., Wood, R., Rauber, R. M., Lasher-Trapp, S., Jensen, J., Stith, J., Mace, J., Um, J., Järvinen, E., Schnaiter, M., Gettelman, A., Sanchez, K. J., McCluskey, C. S., Russell, L. M., McCoy, I. L., Atlas, R., Bardeen, C. G., Moore, K. A., Hill, T. C. J., Humphries, R. S., Keywood, M. D., Ristovski, Z., Cravigan, L., Schofield, R., Fairall, C., Mallet, M. D., Kreidenweis, S. M., Rainwater, B., D'Alessandro, J., Wang, Y., Wu, W., Saliba, G., Levin, E. J. T., Ding, S., Lang, F., Truong, S. C. H., Wolff, C., Haggerty, J., Harvey, M. J., Klekociuk, A., and McDonald, A.: Observations of clouds, aerosols, precipitation, and surface radiation over the Southern Ocean: An overview of CAPRICORN, MARCUS, MICRE and SOCRATES, B. Am. Meteor. Soc., 1–92, https://doi.org/10.1175/bams-d-20-0132.1, 2020.
Meskhidze, N. and Nenes, A.: Phytoplankton and cloudiness in the southern ocean, Science, 314, 1419–1423, https://doi.org/10.1126/science.1131779, 2006.
Meskhidze, N. and Nenes, A.: Effects of Ocean Ecosystem on Marine Aerosol-Cloud Interaction, Adv. Meteorol., 2010, 1–13, https://doi.org/10.1155/2010/239808, 2010.
Middlebrook, A. M., Murphy, D. M., and Thomson, D. S.: Observations of organic material in individual marine particles at Cape Grim during the First Aerosol Characterization Experiment (ACE 1), J. Geophys. Res. Atmos., 103, 16475–16483, https://doi.org/10.1029/97JD03719, 1998.
Modini, R. L., Frossard, A. A., Ahlm, L., Russell, L. M., Corrigan, C. E., Roberts, G. C., Hawkins, L. N., Schroder, J. C., Bertram, A. K., Zhao, R., Lee, A. K. Y., Abbatt, J. P. D., Lin, J., Nenes, A., Wang, Z., Wonaschütz, A., Sorooshian, A., Noone, K. J., Jonsson, H., Seinfeld, J. H., Toom-Sauntry, D., Macdonald, A. M., and Leaitch, W. R.: Primary marine aerosol-cloud interactions off the coast of California, J. Geophys. Res., 120, 4282–4303, https://doi.org/10.1002/2014JD022963, 2015.
Murphy, D. M., Thomson, D. S., Middlebrook, A. M., and Schein, M. E.: In situ single-particle characterization at Cape Grim, J. Geophys. Res.-Atmos., 103, 16485–16491, https://doi.org/10.1029/97JD03281, 1998a.
Murphy, D. M., Anderson, J. R., Qulnn, P. K., Mclnnes, L. M., Brechtel, F. J., Kreidenwels, S. M., Middlebrook, A. M., Pósfai, M., Thomson, D. S., and Buseck, P. R.: Influence of sea-salt on aerosol radiative properties in the Southern Ocean marine boundary layer, Nature, 392, 62–65, https://doi.org/10.1038/32138, 1998b.
Neubauer, D., Lohmann, U., Hoose, C., and Frontoso, M. G.: Impact of the representation of marine stratocumulus clouds on the anthropogenic aerosol effect, Atmos. Chem. Phys., 14, 11997–12022, https://doi.org/10.5194/acp-14-11997-2014, 2014.
O'Dowd, C. D., Smith, M. H., Consterdine, I. E., and Lowe, J. A.: Marine aerosol, sea-salt, and the marine sulphur cycle: A short review, Atmos. Environ., 31, 73–80, https://doi.org/10.1016/S1352-2310(96)00106-9, 1997.
O'Shea, S. J., Choularton, T. W., Flynn, M., Bower, K. N., Gallagher, M., Crosier, J., Williams, P., Crawford, I., Fleming, Z. L., Listowski, C., Kirchgaessner, A., Ladkin, R. S., and Lachlan-Cope, T.: In situ measurements of cloud microphysics and aerosol over coastal Antarctica during the MAC campaign, Atmos. Chem. Phys., 17, 13049–13070, https://doi.org/10.5194/acp-17-13049-2017, 2017.
Ogunro, O. O., Elliott, S. M., Wingenter, O. W., Deal, C., Fu, W., Collier, N. and Hoffman, F. M.: Evaluating uncertainties in marine biogeochemical models: Benchmarking aerosol precursors, Atmosphere-Basel, 9, 1–21, https://doi.org/10.3390/atmos9050184, 2018.
Pandis, S. N., Russell, L. M., and Seinfeld, J. H.: The relationship between DMS flux and CCN concentration in remote marine regions, J. Geophys. Res., 99, 16945–16957, https://doi.org/10.1029/94jd01119, 1994.
Pawlowska, H., Grabowski, W. W. , and Brenguier, J.-L.: Observations of the width of cloud droplet spectra in stratocumulus, Geophys. Res. Lett., 33, L19810, https://doi.org/10.1029/2006GL026841, 2006.
Perry, K. D. and Hobbs, P. V.: Further evidence for particle nucleation in clear air adjacent to marine cumulus clouds, J. Geophys. Res., 99, 22803–22818, https://doi.org/10.1029/94jd01926, 1994.
Petters, M. D. and Kreidenweis, S. M.: A single parameter representation of hygroscopic growth and cloud condensation nucleus activity, Atmos. Chem. Phys., 7, 1961–1971, https://doi.org/10.5194/acp-7-1961-2007, 2007.
Pierce, J. R. and Adams, P. J.: Global evaluation of CCN formation by direct emission of sea salt and growth of ultrafine sea salt, J. Geophys. Res.-Atmos., 111, D06203, https://doi.org/10.1029/2005JD006186, 2006.
Pirjola, L., O'Dowd, C. D., Brooks, I. M., and Kulmala, M.: Can new particle formation occur in the clean marine boundary layer?, J. Geophys. Res.-Atmos., 105, 26531–26546, https://doi.org/10.1029/2000JD900310, 2000.
Pirjola, L., Lehtinen, K. E. J., Hansson, H. C., and Kulmala, M.: How important is nucleation in regional/global modelling?, Geophys. Res. Lett., 31, L12109, https://doi.org/10.1029/2004GL019525, 2004.
Pringle, K. J., Carslaw, K. S., Spracklen, D. V., Mann, G. M., and Chipperfield, M. P.: The relationship between aerosol and cloud drop number concentrations in a global aerosol microphysics model, Atmos. Chem. Phys., 9, 4131–4144, https://doi.org/10.5194/acp-9-4131-2009, 2009.
Quinn, P. K., Bates, T. S., Miller, T. L., Coffman, D. J., Johnson, J. E., Harris, J. M., Ogren, J. A., Forbes, G., Anderson, T. L., Covert, D. S., and Rood, M. J.: Surface submicron aerosol chemical composition: What fraction is not sulfate?, J. Geophys. Res.-Atmos., 105, 6785–6805, https://doi.org/10.1029/1999JD901034, 2000.
Quinn, P. K., Coffman, D. J., Johnson, J. E., Upchurch, L. M., and Bates, T. S.: Small fraction of marine cloud condensation nuclei made up of sea spray aerosol, Nat. Geosci., 10, 674–679, https://doi.org/10.1038/ngeo3003, 2017.
Raes, F., Van Dingenen, R., Cuevas, E., Van Velthoven, P. F. J., and Prospero, J. M.: Observations of aerosols in the free troposphere and marine boundary layer of the subtropical Northeast Atlantic: Discussion of processes determining their size distribution, J. Geophys. Res.-Atmos., 102, 21315–21328, https://doi.org/10.1029/97jd01122, 1997.
De Reus, M., Ström, J., Curtius, J., Pirjola, L., Vignati, E., Arnold, F., Hansson, H. C., Kulmala, M., Lelieveld, J., and Raes, F.: Aerosol production and growth in the upper free troposphere, J. Geophys. Res.-Atmos., 105, 24751–24762, https://doi.org/10.1029/2000JD900382, 2000.
Rinaldi, M., Decesari, S., Finessi, E., Giulianelli, L., Carbone, C., Fuzzi, S., O'Dowd, C. D., Ceburnis, D., and Facchini, M. C.: Primary and Secondary Organic Marine Aerosol and Oceanic Biological Activity: Recent Results and New Perspectives for Future Studies, Adv. Meteorol., 2010, 1–10, https://doi.org/10.1155/2010/310682, 2010.
Roberts, G. C. and Nenes, A.: A continuous-flow streamwise thermal-gradient CCN chamber for atmospheric measurements, Aerosol Sci. Technol., 39, 206–221, https://doi.org/10.1080/027868290913988, 2005.
Rolph, G., Stein, A., and Stunder, B.: Real-time Environmental Applications and Display sYstem: READY, Environ. Model. Softw., 95, 210–228, https://doi.org/10.1016/j.envsoft.2017.06.025, 2017.
Rose, D., Gunthe, S. S., Mikhailov, E., Frank, G. P., Dusek, U., Andreae, M. O., and Pöschl, U.: Calibration and measurement uncertainties of a continuous-flow cloud condensation nuclei counter (DMT-CCNC): CCN activation of ammonium sulfate and sodium chloride aerosol particles in theory and experiment, Atmos. Chem. Phys., 8, 1153–1179, https://doi.org/10.5194/acp-8-1153-2008, 2008.
Rosenfeld, D., Zhu, Y., Wang, M., Zheng, Y., Goren, T., and Yu, S.: Aerosol-driven droplet concentrations dominate coverage and water of oceanic low-level clouds, Science, 363, eaav0566, https://doi.org/10.1126/science.aav0566, 2019.
Russell, L. M., Lenschow, D. H., Laursen, K. K., Krummel, P. B., Siems, S. T., Bandy, A. R., Thornton, D. C., and Bates, T. S.: Bidirectional mixing in an ACE 1 marine boundary layer overlain by a second turbulent layer, J. Geophys. Res.-Atmos., 103, 16411–16432, https://doi.org/10.1029/97JD03437, 1998.
Russell, L. M., Mensah, A. A., Fischer, E. V., Sive, B. C., Varner, R. K., Keene, W. C., Stutz, J., and Pszenny, A. A. P.: Nanoparticle growth following photochemical α- and β-pinene oxidation at Appledore Island during International Consortium for Research on Transport and Transformation/Chemistry of Halogens at the Isles of Shoals 2004, J. Geophys. Res.-Atmos., 112, https://doi.org/10.1029/2006JD007736, 2007.
Russell, L. M., Takahama, S., Liu, S., Hawkins, L. N., Covert, D. S., Quinn, P. K. and Bates, T. S.: Oxygenated fraction and mass of organic aerosol from direct emission and atmospheric processing measured on the R/V Ronald Brown during TEXAQS/GoMACCS 2006, J. Geophys. Res.-Atmos., 114, https://doi.org/10.1029/2008JD011275, 2009.
Saliba, G., Chen, C. L., Lewis, S., Russell, L. M., Rivellini, L. H., Lee, A. K. Y., Quinn, P. K., Bates, T. S., Haëntjens, N., Boss, E. S., Karp-Boss, L., Baetge, N., Carlson, C. A., and Behrenfeld, M. J.: Factors driving the seasonal and hourly variability of sea-spray aerosol number in the North Atlantic, P. Natl. Acad. Sci. USA, 116, 20309–20314, https://doi.org/10.1073/pnas.1907574116, 2019.
Saliba, G., Chen, C. L., Lewis, S., Russell, L. M., Quinn, P. K., Bates, T. S., Bell, T. G., Lawler, M. J., Saltzman, E. S., Sanchez, K. J., Moore, R., Shook, M., Rivellini, L. H., Lee, A., Baetge, N., Carlson, C. A., and Behrenfeld, M. J.: Seasonal Differences and Variability of Concentrations, Chemical Composition, and Cloud Condensation Nuclei of Marine Aerosol Over the North Atlantic, J. Geophys. Res.-Atmos., 125, e2020JD033145, https://doi.org/10.1029/2020JD033145, 2020.
Sanchez, K. and Roberts, G.: SOCRATES CCN measurements, Version 1.1, UCAR/NCAR – Earth Observing Laboratory, https://doi.org/10.5065/D6Z036XB, 2018.
Sanchez, K. J., Zhang, B., Liu, H., Saliba, G., Chen, C.-L., Lewis, S. L., Russell, L. M., Shook, M. A., Crosbie, E. C., Ziemba, L. D., Brown, M. D., Shingler, T. J., Robinson, C. E., Wiggins, E. B., Thornhill, K. L., Winstead, E. L., Jordan, C., Quinn, P. K., Bates, T. S., Porter, J., Bell, T. G., Saltzman, E. S., Behrenfeld, M. J., and Moore, R. H.: Linking marine phytoplankton emissions, meteorological processes, and downwind particle properties with FLEXPART, Atmos. Chem. Phys., 21, 831–851, https://doi.org/10.5194/acp-21-831-2021, 2021.
Sanchez, K. J., Roberts, G. C., Calmer, R., Nicoll, K., Hashimshoni, E., Rosenfeld, D., Ovadnevaite, J., Preissler, J., Ceburnis, D., O'Dowd, C., and Russell, L. M.: Top-down and bottom-up aerosol–cloud closure: towards understanding sources of uncertainty in deriving cloud shortwave radiative flux, Atmos. Chem. Phys., 17, 9797–9814, https://doi.org/10.5194/acp-17-9797-2017, 2017.
Sanchez, K. J., Chen, C. L., Russell, L. M., Betha, R., Liu, J., Price, D. J., Massoli, P., Ziemba, L. D., Crosbie, E. C., Moore, R. H., Müller, M., Schiller, S. A., Wisthaler, A., Lee, A. K. Y., Quinn, P. K., Bates, T. S., Porter, J., Bell, T. G., Saltzman, E. S., Vaillancourt, R. D., and Behrenfeld, M. J.: Substantial Seasonal Contribution of Observed Biogenic Sulfate Particles to Cloud Condensation Nuclei, Sci. Rep.-UK, 8, 3235, https://doi.org/10.1038/s41598-018-21590-9, 2018.
Schmale, J., Schneider, J., Nemitz, E., Tang, Y. S., Dragosits, U., Blackall, T. D., Trathan, P. N., Phillips, G. J., Sutton, M., and Braban, C. F.: Sub-Antarctic marine aerosol: dominant contributions from biogenic sources, Atmos. Chem. Phys., 13, 8669–8694, https://doi.org/10.5194/acp-13-8669-2013, 2013.
Schmale, J., Baccarini, A., Thurnherr, I., Henning, S., Efraim, A., Regayre, L., Bolas, C., Hartmann, M., Welti, A., Lehtipalo, K., Aemisegger, F., Tatzelt, C., Landwehr, S., Modini, R. L., Tummon, F., Johnson, J. S., Harris, N., Schnaiter, M., Toffoli, A., Derkani, M., Bukowiecki, N., Stratmann, F., Dommen, J., Sperger, U. B., Wernli, H., Rosenfeld, D., Gysel-Beer, M., and Carslaw, K. S.: Overview of the antarctic circumnavigation expedition: Study of preindustrial-like aerosols and their climate effects (ACE-SPACE), B. Am. Meteor. Soc., 100, 2260–2283, https://doi.org/10.1175/BAMS-D-18-0187.1, 2019.
Seinfeld, J. H., Bretherton, C., Carslaw, K. S., Coe, H., DeMott, P. J., Dunlea, E. J., Feingold, G., Ghan, S., Guenther, A. B., Kahn, R., Kraucunas, I., Kreidenweis, S. M., Molina, M. J., Nenes, A., Penner, J. E., Prather, K. A., Ramanathan, V., Ramaswamy, V., Rasch, P. J., Ravishankara, A. R., Rosenfeld, D., Stephens, G., and Wood, R.: Improving our fundamental understanding of the role of aerosol-cloud interactions in the climate system, P. Natl. Acad. Sci. USA, 113, 5781–5790, https://doi.org/10.1073/pnas.1514043113, 2016.
Siebert, H. and Shaw, R. A.: Supersaturation fluctuations during the early stage of cumulus formation, J. Atmos. Sci., 74, 975–988, https://doi.org/10.1175/JAS-D-16-0115.1, 2017.
Snider, J. R., Guibert, S., Brenguier, J. L., and Putaud, J. P.: Aerosol activation in marine stratocumulus clouds: 2. Köhler and parcel theory closure studies, J. Geophys. Res.-Atmos., 108, 8629, https://doi.org/10.1029/2002jd002692, 2003.
Stein, A. F., Draxler, R. R., Rolph, G. D., Stunder, B. J. B., Cohen, M. D., and Ngan, F.: NOAA's HYSPLIT Atmospheric Transport and Dispersion Modeling System, B. Am. Meteorol. Soc., 96, 2059–2077, https://doi.org/10.1175/BAMS-D-14-00110.1, 2015.
Stevens, B. and Feingold, G.: Untangling aerosol effects on clouds and precipitation in a buffered system, Nature, 461, 607–613, https://doi.org/10.1038/nature08281, 2009.
Stevens, B. and Seifert, A.: Understanding macrophysical outcomes of microphysical choices in simulations of shallow cumulus convection, J. Meteorol. Soc. Jpn, 86A, 143–162, https://doi.org/10.2151/jmsj.86A.143, 2008.
Strapp, J. W., Leaitch, W. R., and Liu, P. S. K.: Hydrated and dried aerosol-size-distribution measurements from the Particle Measuring Systems FSSP-300 probe and the deiced PCASP-100X probe, J. Atmos. Ocean. Technol., 9, 548–555, https://doi.org/10.1175/1520-0426(1992)009<0548:HADASD>2.0.CO;2, 1992.
Thornton, D. C., Bandy, A. R., Blomquist, B. W., Bradshaw, J. D., and Blake, D. R.: Vertical transport of sulfur dioxide and dimethyl sulfide in deep convection and its role in new particle formation, J. Geophys. Res.-Atmos., 102, 28501–28509, https://doi.org/10.1029/97jd01647, 1997.
Trenberth, K. E. and Fasullo, J. T.: Simulation of present-day and twenty-first-century energy budgets of the southern oceans, J. Climate, 23, 440–454, https://doi.org/10.1175/2009JCLI3152.1, 2010.
Twohy, C. H., Clement, C. F., Gandrud, B. W., Weinheimer, A. J., Campos, T. L., Baumgardner, D., Brune, W. H., Faloona, I., Sachse, G. W., Vay, S. A., and Tan, D.: Deep convection as a source of new particles in the midlatitude upper troposphere, J. Geophys. Res.-Atmos., 107, AAC 6-1–AAC 6-10, https://doi.org/10.1029/2001JD000323, 2002.
Twohy, C. H., DeMott, P. J., Russell, L. M., Toohey, D. W., Rainwater, B., Geiss, R., Sanchez, K. J., Lewis, S., Roberts, G., Humphries, R. S., McCluskey, C. S., Moore, K. A., Selleck, P. W., Keywood, M. D., Ward, J. P., and McRobert, I. M.: Cloud-Nucleating Particles over the Southern Ocean in a Changing Climate, Earths Future, e2020EF001673, https://doi.org/10.1029/2020EF001673, accepted, 2021.
UCAR/NCAR – Earth Observing Laboratory: Low Rate (LRT - 1 sps) Navigation, State Parameter, and Microphysics Flight-Level Data, Version 2.0, UCAR/NCAR – Earth Obs. Lab., https://doi.org/10.5065/D6M32TM9, 2017.
Vallina, S. M., Simó, R., and Gassó, S.: What controls CCN seasonality in the Southern Ocean? A statistical analysis based on satellite-derived chlorophyll and CCN and model-estimated OH radical and rainfall, Global Biogeochem. Cy., 20, GB1014, https://doi.org/10.1029/2005GB002597, 2006.
Vana, M., Virkkula, A., Hirsikko, A., Aalto, P., Kulmala, M., and Hillamo, R.: Air Ion Measurements During a Cruise from Europe to Antarctica, in: Nucleation and Atmospheric Aerosols, edited by: O'Dowd, C. D. and Wagner, P. E., Springer Netherlands, Dordrecht, 368–372, 2007.
Wang, H., Klekociuk, A. R., French, W. J. R., Alexander, S. P., and Warner, T. A.: Measurements of cloud radiative effect across the Southern Ocean (43∘ S–79∘ S, 63∘ E–158∘ W), Atmosphere-Basel, 11, 949, https://doi.org/10.3390/ATMOS11090949, 2020.
Weber, R. J., McMurry, P. H., Mauldin, L., Tanner, D. J., Eisele, F. L., Brechtel, F. J., Kreidenweis, S. M., Kok, G. L., Schillawski, R. D., and Baumgardner, B.: A study of new particle formation and growth involving biogenic and trace gas species measured during ACE 1, J. Geophys. Res.-Atmos., 103, 16385–16396, https://doi.org/10.1029/97JD02465, 1998.
Weller, R., Schmidt, K., Teinilä, K., and Hillamo, R.: Natural new particle formation at the coastal Antarctic site Neumayer, Atmos. Chem. Phys., 15, 11399–11410, https://doi.org/10.5194/acp-15-11399-2015, 2015.
Weller, R., Legrand, M., and Preunkert, S.: Size distribution and ionic composition of marine summer aerosol at the continental Antarctic site Kohnen, Atmos. Chem. Phys., 18, 2413–2430, https://doi.org/10.5194/acp-18-2413-2018, 2018.
Whittlestone, S. and Zahorowski, W.: Baseline radon detectors for shipboard use: Development and deployment in the First Aerosol Characterization experiment (ACE 1), J. Geophys. Res.-Atmos., 103, 16743–16751, https://doi.org/10.1029/98JD00687, 1998.
Williamson, C. J., Kupc, A., Axisa, D., Bilsback, K. R., Bui, T. P., Campuzano-Jost, P., Dollner, M., Froyd, K. D., Hodshire, A. L., Jimenez, J. L., Kodros, J. K., Luo, G., Murphy, D. M., Nault, B. A., Ray, E. A., Weinzierl, B., Wilson, J. C., Yu, F., Yu, P., Pierce, J. R., and Brock, C. A.: A large source of cloud condensation nuclei from new particle formation in the tropics, Nature, 574, 399–403, https://doi.org/10.1038/s41586-019-1638-9, 2019.
Wood, R., Wyant, M., Bretherton, C. S., Rémillard, J., Kollias, P., Fletcher, J., Stemmler, J., De Szoeke, S., Yuter, S., Miller, M., Mechem, D., Tselioudis, G., Chiu, J. C., Mann, J. A. L., O'Connor, E. J., Hogan, R. J., Dong, X., Miller, M., Ghate, V., Jefferson, A., Min, Q., Minnis, P., Palikonda, R., Albrecht, B., Luke, E., Hannay, C., and Lin, Y.: Clouds, aerosols, and precipitation in the marine boundary layer: An arm mobile facility deployment, B. Am. Meteor. Soc., 96, 419–439, https://doi.org/10.1175/BAMS-D-13-00180.1, 2015.
Woodhouse, M. T., Carslaw, K. S., Mann, G. W., Vallina, S. M., Vogt, M., Halloran, P. R., and Boucher, O.: Low sensitivity of cloud condensation nuclei to changes in the sea-air flux of dimethyl-sulphide, Atmos. Chem. Phys., 10, 7545–7559, https://doi.org/10.5194/acp-10-7545-2010, 2010.
Yoon, Y. J. and Brimblecombe, P.: Modelling the contribution of sea salt and dimethyl sulfide derived aerosol to marine CCN, Atmos. Chem. Phys., 2, 17–30, https://doi.org/10.5194/acp-2-17-2002, 2002.
Yue, G. K. and Deepak, A.: Temperature dependence of the formation of sulfate aerosols in the stratosphere, J. Geophys. Res., 87, 3128, https://doi.org/10.1029/jc087ic04p03128, 1982.
Zieger, P., Väisänen, O., Corbin, J. C., Partridge, D. G., Bastelberger, S., Mousavi-Fard, M., Rosati, B., Gysel, M., Krieger, U. K., Leck, C., Nenes, A., Riipinen, I., Virtanen, A., and Salter, M. E.: Revising the hygroscopicity of inorganic sea salt particles, Nat. Commun., 8, 15883, https://doi.org/10.1038/ncomms15883, 2017.