the Creative Commons Attribution 4.0 License.
the Creative Commons Attribution 4.0 License.
 | 03 Mar 2021
Observation of absorbing aerosols above clouds over the south-east Atlantic Ocean from the geostationary satellite SEVIRI – Part 2: Comparison with MODIS and aircraft measurements from the CLARIFY-2017 field campaign
Peter Francis
Steven J. Abel
Paul A. Barrett
Keith N. Bower
Michael I. Cotterell
Ian Crawford
Nicholas W. Davies
Cathryn Fox
Stuart Fox
Justin M. Langridge
Kerry G. Meyer
Steven E. Platnick
Kate Szpek
Jim M. Haywood
To evaluate the SEVIRI retrieval for aerosols above clouds presented in Part 1 of the companion paper, the algorithm is applied over the south-east Atlantic Ocean during the CLARIFY-2017 field campaign period. The first step of our analysis compares the retrieved aerosol and cloud properties against equivalent products from the MODIS MOD06ACAERO retrieval (Meyer et al., 2015). While the correlation between the two satellite retrievals of the above-cloud aerosol optical thickness (AOT) is good (R = 0.78), the AOT retrieved by SEVIRI is 20.3 % smaller than that obtained from the MODIS retrieval. This difference in AOT is attributed mainly to the more absorbing aerosol model assumed for the SEVIRI retrieval compared to MODIS. The underlying cloud optical thickness (COT) derived from the two satellites is in good agreement (R = 0.90). The cloud droplet effective radius (CER) retrieved by SEVIRI is consistently smaller than MODIS by 2.2 µm, which is mainly caused by the use of different spectral bands of the satellite instruments. In the second part of our analysis, we compare the forecast water vapour profiles used for the SEVIRI atmospheric correction as well as the aforementioned aerosol and cloud products with in situ measurements made from the Facility for Airborne Atmospheric Measurements (FAAM) aircraft platform during the CLARIFY-2017 campaign. Around Ascension Island, the column water vapour used to correct the SEVIRI signal is overestimated by 3.1 mm in the forecast compared to that measured by dropsondes. However, the evidence suggests that the accuracy of the atmospheric correction improves closer to the African coast. Consistency is observed between the SEVIRI above-cloud AOT and in situ measurements (from cavity ring-down spectroscopy instruments) when the measured single-scattering albedo is close to that assumed in the retrieval algorithm. On the other hand, the satellite retrieval overestimates the AOT when the assumed aerosol model is not absorbing enough. Consistency is also found between the cloud properties retrieved by SEVIRI and the CER measured by a cloud droplet probe and the liquid water path derived from a microwave radiometer. Despite the instrumental limitations of the geostationary satellite, the consistency obtained between SEVIRI, MODIS and the aircraft measurements demonstrates the ability of the retrieval in providing additional information on the temporal evolution of the aerosol properties above clouds.
- Article
(6931 KB) - Full-text XML
- Companion paper
-
Supplement
(1656 KB) - BibTeX
- EndNote


To accurately predict future climate, it is essential to reduce the uncertainty in the representation of aerosols, clouds and their radiative impacts in climate models (Myhre et al., 2013). Therefore, new in situ and remote sensing strategies are needed to improve our understanding of aerosol–cloud–radiation interactions and to constrain models (Seinfeld et al., 2016). The south-east Atlantic Ocean (SEAO) is an ideal region to analyse the effects of partially absorbing aerosols on the radiative budget, the atmospheric stability, clouds and precipitation. The biomass burning aerosols emitted from July to October in southern Africa are mostly transported westward in the residual continental boundary layer in the free troposphere (Abel et al., 2020). These absorbing biomass burning particles are frequently observed above the extensive stratocumulus deck covering the SEAO. For this reason, the region has been the focus of much work over the past few years. Using aircraft and surface-based instrumentation, large-scale field campaigns have been deployed in 2016–2018 (Zuidema et al., 2016), within the NASA ORACLES (ObseRvations of Aerosols above CLouds and their intEractionS; Redemann et al., 2020), the US DOE LASIC (Layered Atlantic Smoke Interactions with Clouds; Zuidema et al., 2016), the French AEROCLO-sA (AErosol RadiatiOn and CLouds in Southern Africa; Formenti et al., 2019) and the UK CLARIFY-2017 (CLouds and Aerosol Radiative Impacts and Forcing for Year 2017; Haywood et al., 2021) programmes. Airborne in situ instruments, active and passive remote sensing instruments, and radiosondes as well as continuous ground-based measurements have been deployed to characterize biomass burning aerosols, clouds and radiation. In addition to improving our knowledge about aerosol–cloud–radiation interaction processes and constraining numerical weather forecast and climate models, this dataset provides, for the first time, direct observations of aerosol above clouds for validating emerging satellite retrievals.
Until recently, aerosol retrievals from passive satellites were limited to cloud-free skies, and their validation was performed against the widely available datasets from ground-based measurements such as aerosol optical depth from the AERONET (Aerosol Robotic NETwork) sun-photometer network. There has been a growing interest in developing methods to quantify aerosols above clouds from space because absorbing aerosols above cloud have long been recognized to exert a significant, but poorly quantified, positive radiative effect (e.g. Keil and Haywood, 2003). While lidar retrievals of aerosols above cloud have been available for some time from the active CALIOP (Cloud-Aerosol Lidar with Orthogonal Polarization) instrument (Hu et al., 2007; Chand et al., 2008; Liu et al., 2015), retrievals of aerosols from passive instrumentation have also been developed. Studies based on the OMI (Ozone Monitoring Instrument; Torres et al., 2012; de Graaf et al., 2019), SCIAMACHY (SCanning Imaging Absorption SpectroMeter for Atmospheric CHartographY; de Graaf et al., 2012), MODIS (MODerate resolution Imaging Spectroradiometer; Jethva et al., 2013; Meyer et al., 2015; Sayer et al., 2016) and POLDER (POLarization and Directionality of the Earth's Reflectances; Waquet et al., 2013; Peers et al., 2015) satellite instruments have already demonstrated the potential of retrieving both cloud properties and above-cloud aerosol optical thickness (AOT) from passive sensors or deriving the direct radiative effect of aerosols above clouds. These new observations have been used in recent satellite-based studies on the direct radiative effect of aerosols above clouds in the SEAO region (Wilcox, 2012; Peers et al., 2015; Zhang et al., 2016b; de Graaf et al., 2019; Kacenelenbogen et al., 2019). However, validation exercises are needed to evaluate the accuracy of these new methodologies. Intercomparisons of the results from the A-train constellation have been performed to evaluate the consistency among satellite retrievals (Jethva et al., 2014; Deaconu et al., 2017). De Graaf et al. (2020) have compared the direct radiative effect of aerosols above clouds obtained from SCIAMACHY, OMI/MODIS and POLDER and have shown that differences can be expected from instruments with different spatial resolution due to 3D effects of clouds. Despite independent techniques and/or instruments being compared, this type of analysis cannot be considered a “true” validation exercise. To provide an independent validation of the above-cloud AOT from the MODIS “colour-ratio” method, Jethva et al. (2016) used airborne measurements from previous aircraft measurement campaigns. However, more direct comparison of aerosol and cloud properties is now possible with the measurements made during the latest field experiments. Data collected during the ORACLES campaign have recently been used to evaluate the above-cloud AOT retrieved by the updated Deep Blue algorithm that is used in aerosol retrievals from the MODIS and the VIIRS (Visible Infrared Imaging Radiometer Suite) instruments (Sayer et al., 2019).
In the companion paper (Part 1; Peers et al., 2019), an algorithm to retrieve aerosols above clouds from the geostationary SEVIRI instrument was presented. The first step of the method consists of correcting the SEVIRI-measured reflectances for the large impact of the transmittance of atmospheric gases. This correction uses water vapour concentration profiles from the Met Office Unified Model forecast. Then, the above-cloud AOT, the cloud optical thickness (COT) and the cloud droplet effective radius (CER) are simultaneously retrieved from the spectral dependence of the signal in the visible to short-wave infrared (SWIR) region; this retrieval method is similar to those used to assess aerosol and cloud properties from OMI and MODIS satellite data. The benefit from using data from the SEVIRI instrument is the high temporal frequency of acquisition. With an observation every 15 min, the satellite instrument on board the geostationary platform MSG (Meteosat Second Generation) allows the tracking of the transport of biomass burning plumes above clouds and monitoring of the evolution of the cloud cover (Chang and Christopher, 2016; Seethala et al., 2018). In Sect. 2 of this paper, the SEVIRI retrieval will be compared against the aerosol and cloud products from the MODIS retrieval developed by Meyer et al. (2015) to assess the consistency of the two retrievals over space and time. Section 3 is dedicated to the validation of the atmospheric correction scheme, in addition to benchmarking the retrieved aerosol and cloud properties against the in situ measurements made from an aircraft platform during CLARIFY-2017. Section 4 presents discussion and conclusions.
2.1 Dataset and methodology
The first part of this analysis consists of evaluating the consistency (or lack thereof) between the aerosol and cloud products retrieved from SEVIRI and MODIS. The MODIS MOD06ACAERO algorithm developed by Meyer et al. (2015) relies on the colour-ratio effect to retrieve the above-cloud AOT, the COT and the CER using six channels from the visible to the SWIR. The measurements are compared with precomputed look-up tables (LUTs) via an optimal estimation method. The cloud properties are the same as those assumed for the MODIS operational cloud retrieval MOD06 (Platnick et al., 2003), and the aerosol model corresponds to the absorbing model used for the MODIS Dark Target Land Aerosol Product MOD04 (Levy et al., 2009). The retrieval is run for both the Terra and Aqua satellites, providing retrievals in the morning and afternoon respectively.
Although the SEVIRI and the MODIS retrievals are based on the same approach, there are inherent differences between the two satellite instruments. For instance, the SEVIRI algorithm uses three spectral bands from 0.64 to 1.64 µm while MODIS uses six channels, which cover a wider range (0.47 to 2.10 µm). The SEVIRI channels are also more affected by absorption from atmospheric gases than the MODIS channels because of their bandwidth and their position in the solar spectrum. Finally, the visible channels of SEVIRI have a sampling distance of 3 km at nadir, as opposed to the 1 km spatial resolution of MODIS. These factors suggest that MODIS retrievals of above-cloud aerosol absorption might be more sensitive and accurate compared to those from SEVIRI. Therefore, it is reasonable to assess the performance of the SEVIRI algorithm by comparing retrieved properties against those from MODIS. Note that, throughout this paper, the subscripts MODIS and SEVIRI refer to the quantity relative to the MOD06ACAERO and the SEVIRI above-cloud-aerosol retrievals respectively.
For both sensors, filters have been implemented to ensure that the measurements have been performed in optimum conditions for the retrieval of aerosol and cloud properties. Firstly, colour-ratio-based techniques do not perform well over optically thin clouds as the difficulty in separating the scattering from the clouds and the aerosols increases. Secondly, the forward radiative transfer models used for the retrievals are 1D radiative transfer codes and can become unstable at cloud edges and for inhomogeneous or sub-pixel clouds because the independent pixel approximation is not strictly valid and the plane-parallel bias is not negligible (e.g. Marshak and Davis, 2005). The MODIS algorithm provides pixel-level estimates of the retrieval uncertainty. When the retrieval uncertainty is larger than 100 % and/or the COTMODIS is lower than 4, the above-cloud AOTMODIS is rejected. Note that the filter on the AOT uncertainty partly removes the lowest AOTs. Pixels identified as partly cloudy and/or associated with cloud edges are not processed by the MOD06ACAERO retrieval. For SEVIRI, the retrieval is performed for COTSEVIRI larger than three, and poorly fitted measurements and observations in the glory backscattering region are removed. Cloud edges, fractional cloud coverage and heterogeneous clouds are also rejected from the SEVIRI results using observations aggregated at a 0.1∘ × 0.1∘ grid resolution. Readers are referred to Meyer et al. (2015) and Peers et al. (2019) for a complete description of the MODIS and the SEVIRI filters. Note that those filters have been applied to the satellite data used in both Sects. 2 and 3. Comparisons at the native resolution of the instruments is challenging, notably because of the rapid temporal evolution and advection of the clouds. In Sect. 2, the aerosol and cloud properties from both methods are aggregated onto a 0.1∘ × 0.1∘ grid. Each MODIS overpass is compared with the closest SEVIRI slot in time, which means that there is never more than 8 min between the two satellite observations. Throughout this study, intrinsic optical parameters and derived extrinsic properties such as optical thickness refer to values at an optical wavelength of 0.55 µm.
2.2 Results
2.2.1 Case study
The consistency between the MODIS and SEVIRI retrievals is first assessed for a single case study. The RGB composite of the SEVIRI slot on 4 September 2017 at 10:15 UTC is shown in Fig. 1. The aerosol and cloud properties observed by SEVIRI are presented in Fig. 2 together with the MODIS products from the Terra overpasses at 10:00 UTC (east) and 11:40 UTC (west). The spatial distribution of the above-cloud AOT detected by SEVIRI (Fig. 2a) is typical of the SEAO during the fire season. A biomass burning plume is observed close to the source, from 13 to 30∘ S along the African coast. The above-cloud AOT is largest close to Angola, with values up to 1.5. A second plume of moderate intensity (AOTSEVIRI ≈ 0.5) is detected offshore, around [10∘ S, 10∘ W]. Between those plumes, the AOT retrieved above clouds by SEVIRI is relatively low at between 0.0 and 0.3. A very good spatial agreement is observed with the MOD06ACAERO product (Fig. 2d), but the values are slightly larger than the SEVIRI AOT. For instance, the local average next to the coast is 0.8 for MODIS against 0.7 for SEVIRI. A strong visual agreement is also observed between the cloud properties retrieved with SEVIRI (Fig. 2b and c) and MODIS (Fig. 2e and f). Both satellites detect shallow clouds with small droplets off the coast of Namibia and optically thicker clouds with larger droplets on the north-western part of the map. However, the CERs retrieved by SEVIRI are smaller than the MODIS CER by 2 µm on average over the map. One can also see that the SEVIRI retrieval rejects more cloudy pixels than the MODIS one, especially in the more broken cloud regions in the south-western part of the region. For methods based on the colour-ratio effect, the above-cloud AOT can only be retrieved when the cloud is bright enough. The SEVIRI algorithm rejects both the aerosol and cloud products when the COT is lower than 3, whereas the threshold of 4 on the COT of the MOD06ACAERO retrieval is used to reject the above-cloud AOT product only. This difference in the cloud sampling between the two methods can lead to a significant difference when comparing the regional mean of the above-cloud direct radiative effect (Zhang et al., 2016b). However, the 0.1∘ × 0.1∘ grid resolution used here is close to the typical resolution of global operational numerical weather prediction models that can examine the impact of clouds. Therefore, when comparing to global climate models (e.g. as per the model/POLDER comparison detailed in Haywood et al., 2021), users are advised to use a similar screening procedure to the satellite retrieval.
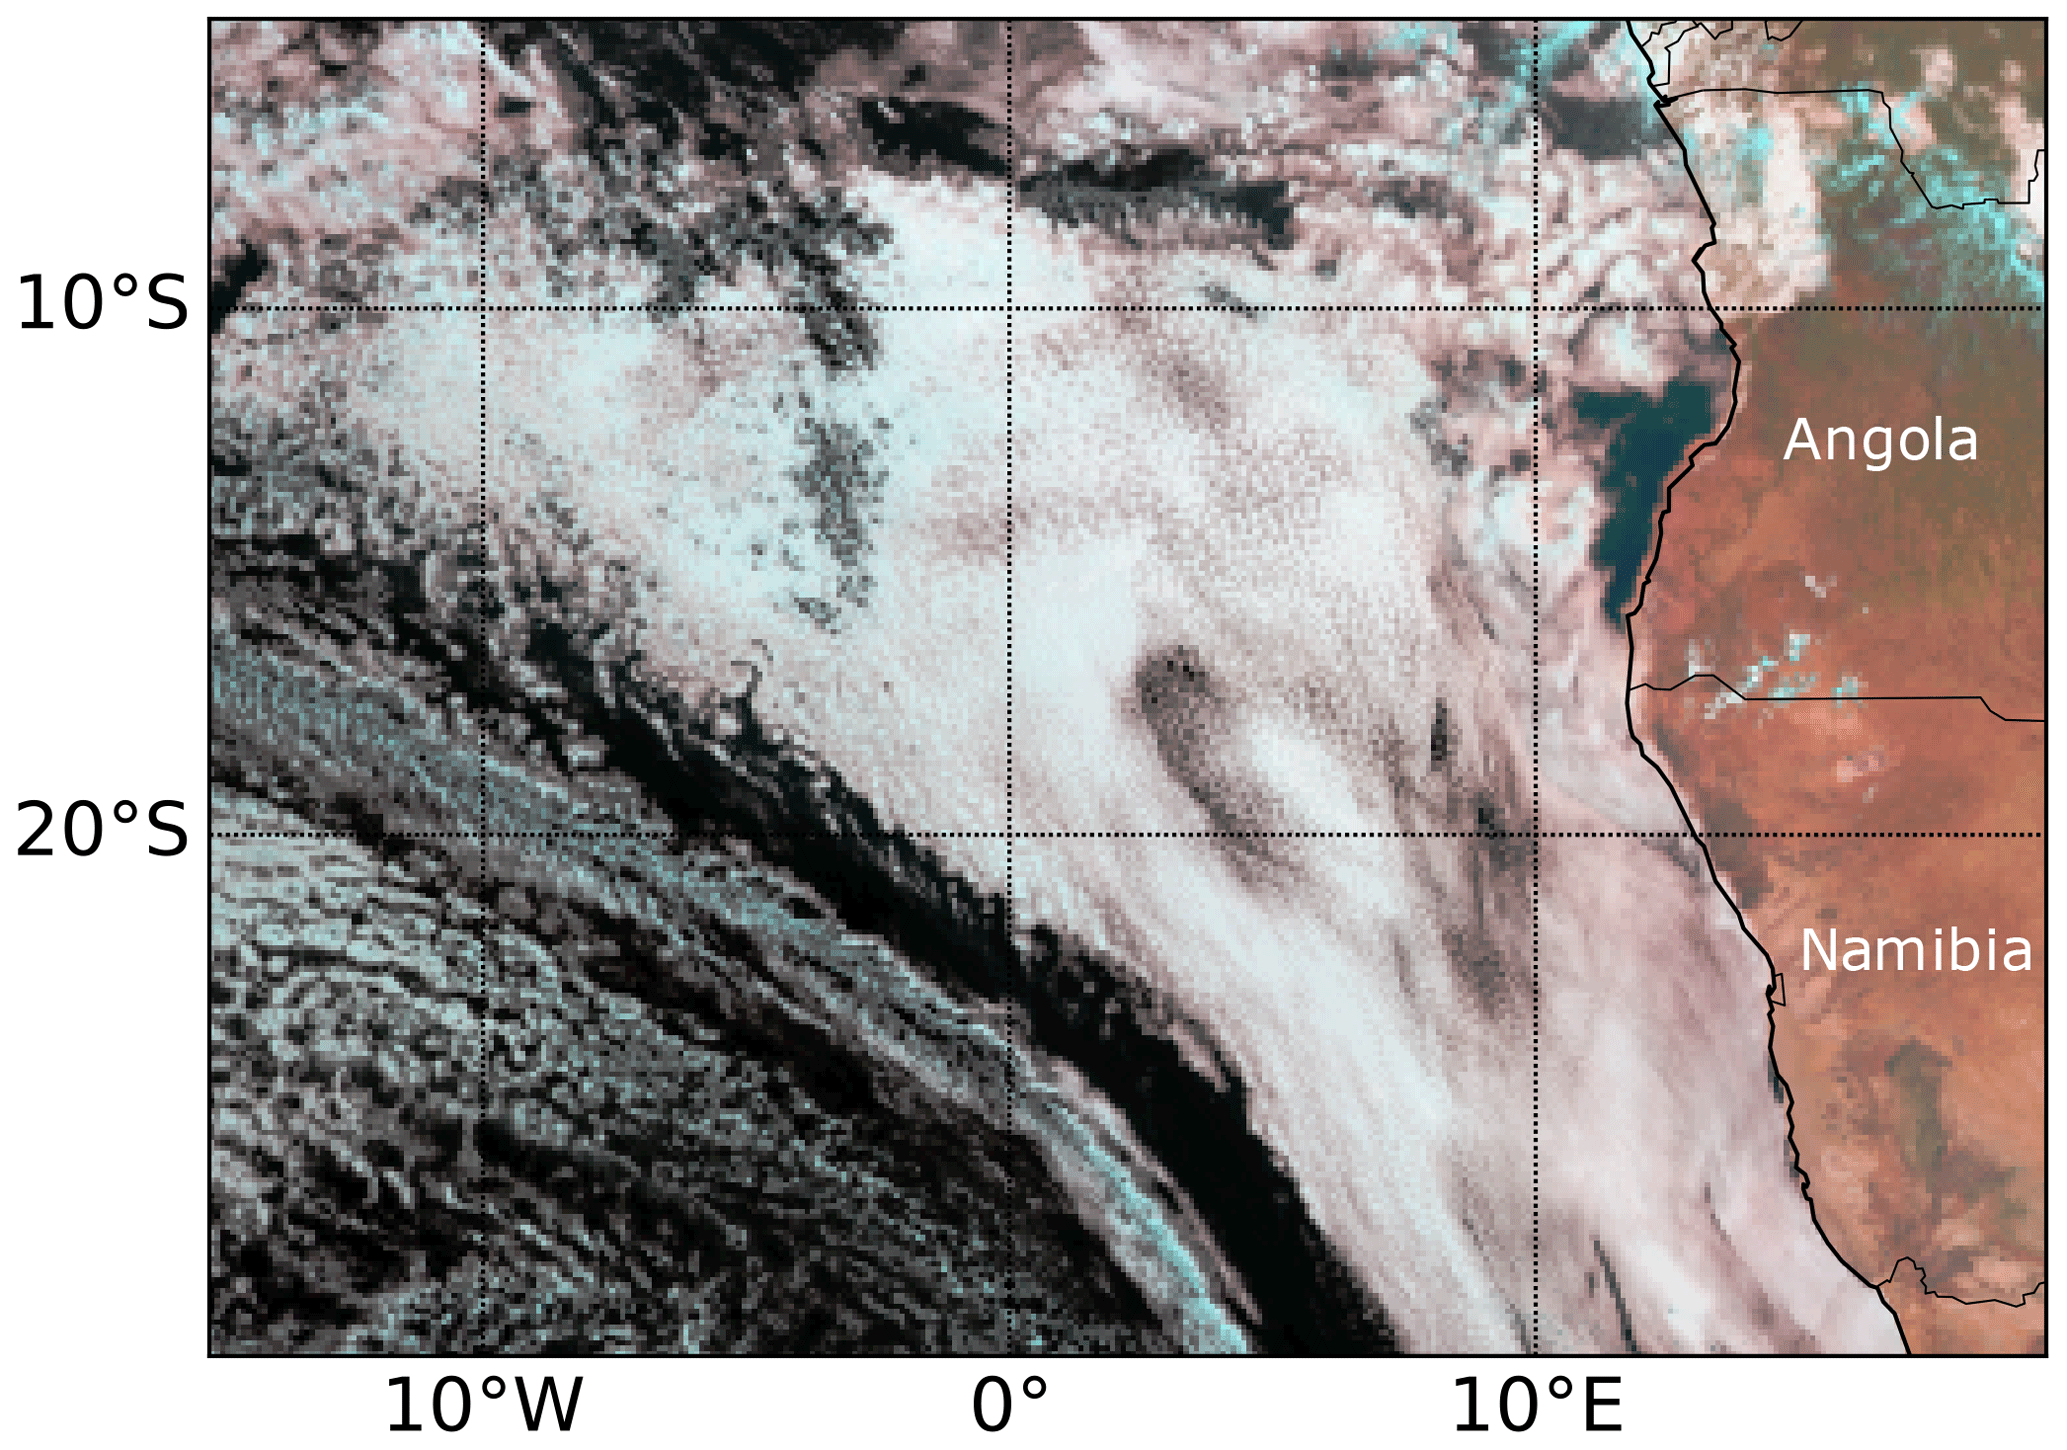
Figure 1RGB composite obtained from the SEVIRI 0.64 (blue), 0.81 (green) and 1.64 µm (red) channels for 4 September 2017 at 10:15 UTC over the SEAO.
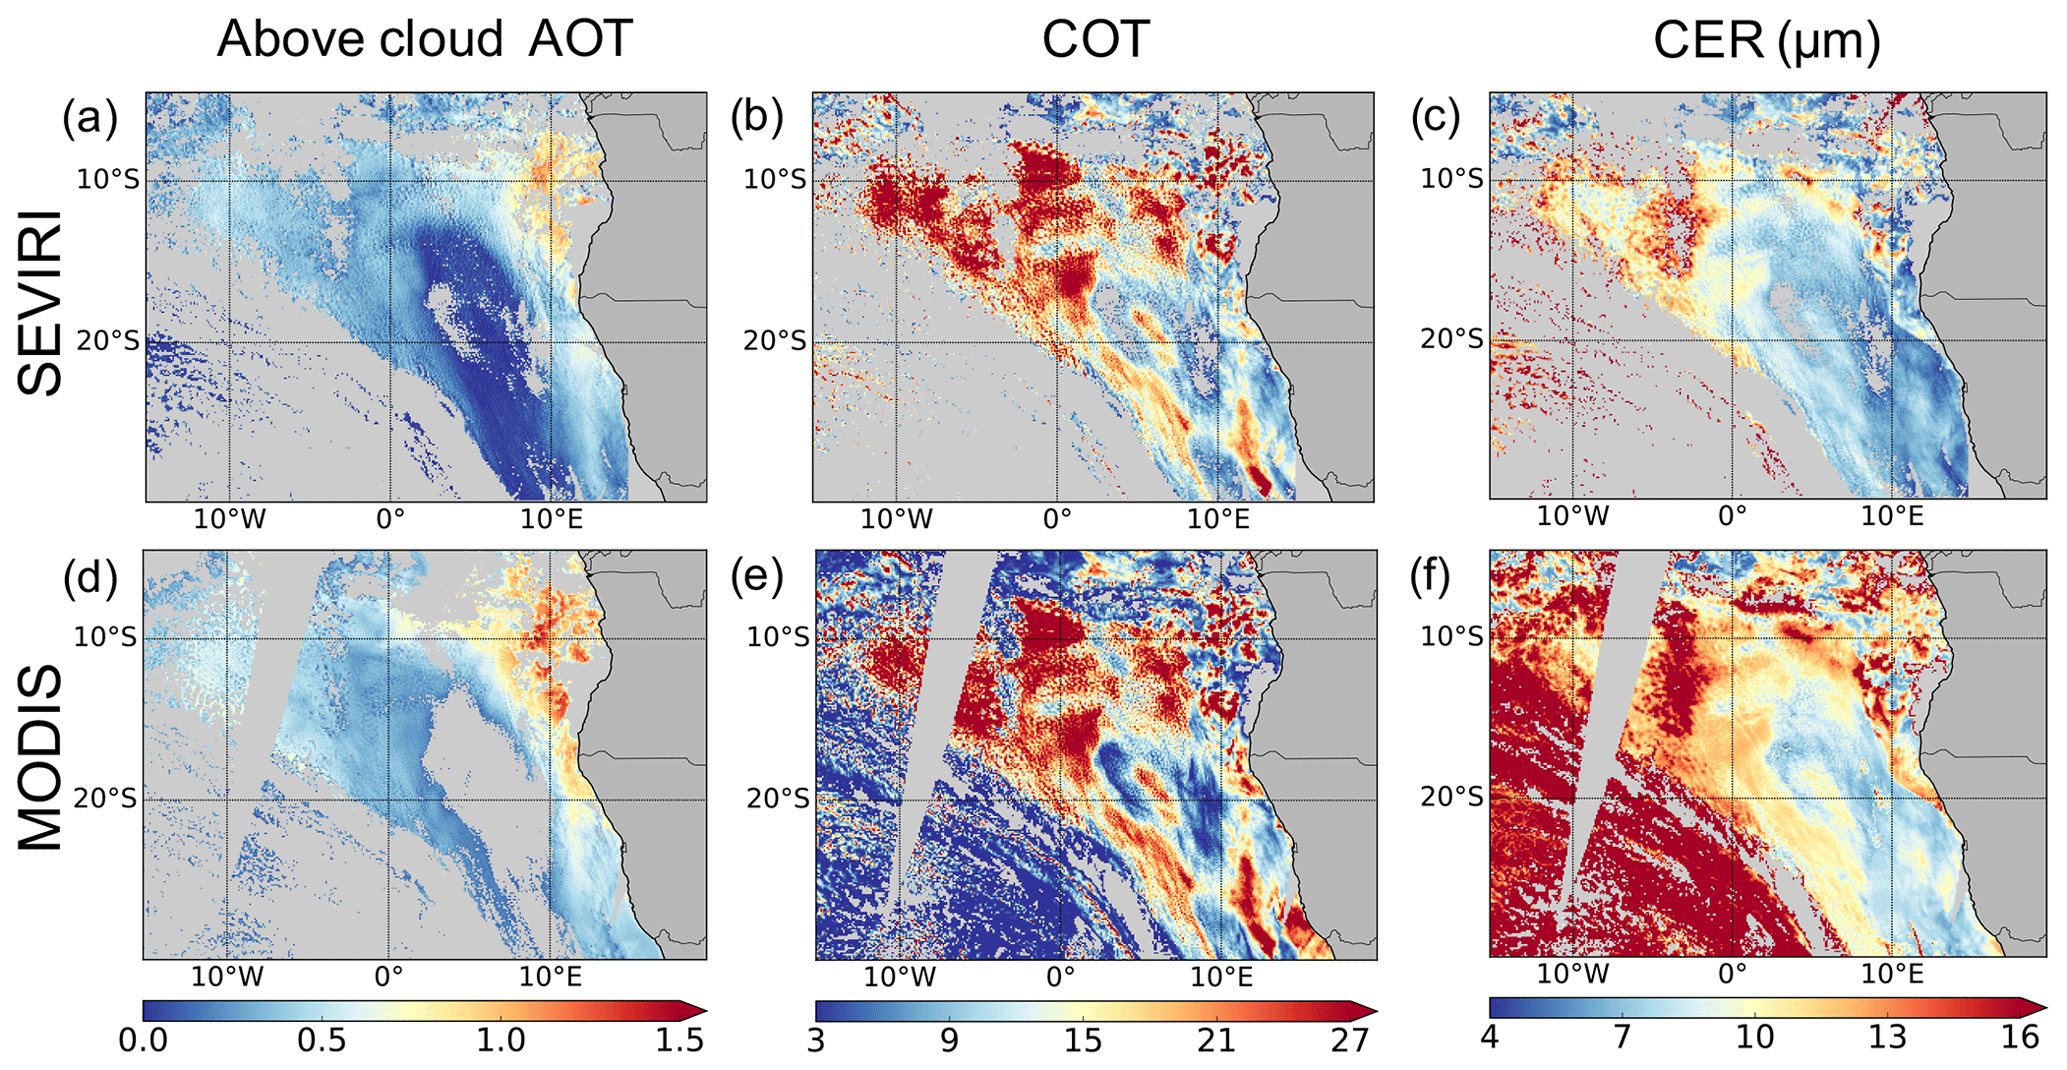
Figure 2Above-cloud AOT at the 0.55 µm optical wavelength and cloud properties retrieved from SEVIRI measurements on 4 September 2017 at 10:15 UTC over the SEAO (a–c) and corresponding Terra MODIS observations (10:00 UTC for the east overpass and 11:40 UTC for the west overpass) from the MOD06ACAERO algorithm (d–f).
2.2.2 Statistical comparisons
In this section, we extend our comparison of SEVIRI and MODIS retrievals of aerosol and cloud properties to 9 d of observations between 28 August and 5 September 2017 (i.e. during the CLARIFY-2017 deployment of the BAe146 FAAM aircraft). During this time period, there were 34 MODIS overpasses between 0∘ N–30∘ S and 20∘ W–15∘ E. In addition to the filters described in Sect. 2.1, observations associated with CERSEVIRI > 30 µm are removed to be consistent with the upper limit of the MODIS retrieval. Figure 3 shows the correlation between the SEVIRI and MODIS retrievals of aerosol and cloud properties. The mean, median and standard deviation of the collocated data have been calculated for each satellite product and are summarized in Table 1.

Figure 3Scatterplots and data distributions for the comparison of the above-cloud AOT (a), AAOT (b), COT (c) and CER (d) from SEVIRI and MODIS MOD06ACAERO retrieval between 28 August and 5 September 2017 over the area between 0∘ N–30∘ S and 20∘ W–15∘ E. The solid lines represent the linear regression and the dashed lines are the 1 : 1 lines. R corresponds to the Pearson's correlation coefficient.
Table 1Summary statistics of the aerosol and cloud properties retrieved by SEVIRI and MODIS compared in Fig. 3.


Figure 4Comparison of the above-cloud AOT retrieved by SEVIRI and MODIS (MOD06ACAERO) in the morning of 4 September 2017 over the area between 0∘ N–30∘ S and 20∘ W–15∘ E. Panel (a) corresponds to the SEVIRI retrieval using the CLARIFY-2017 aerosol model, and panel (b) shows the SEVIRI retrieval using the same aerosol model as the MODIS retrieval. The solid lines represent the linear regression, and the dashed lines are the 1 : 1 lines. R corresponds to the Pearson's correlation coefficient.
Similar to the single case study reported in the previous section, a correlation (Pearson's correlation coefficient R of 0.78) is evident between the SEVIRI and the MODIS above-cloud AOT. The error bars in Fig. 3a represent the uncertainty associated with the retrieved AOT. In Peers et al. (2019), the uncertainty of the AOT retrieved by SEVIRI due to the aerosol, the cloud model, the Rayleigh scattering (i.e. the altitude of the aerosol and the cloud layer) and the water vapour correction has been estimated to be 40 %, 0.3 %, 2.5 % and 10 % respectively. The uncertainty due to the measurements has been estimated by calculating the standard deviation of the SEVIRI AOT in Fig. 3a for each AOT bin. The total uncertainty is obtained by combining the uncertainties listed above, assuming they are independent (i.e. using the square root of the sum of squares). The MODIS uncertainty, which is provided by the algorithm, accounts for the above-cloud column two-way transmittance errors, the Rayleigh scattering errors, the measurement errors and the errors due to the aerosol and the cloud model. As with SEVIRI, the aerosol model assumption is typically the largest source of uncertainty in the MODIS retrieval (Meyer et al., 2015). Figure 3a shows that smaller values are retrieved by SEVIRI, with the straight-line fit of SEVIRI versus MODIS retrievals of AOT having a slope of 0.71. However, a non-linear relationship can be observed in Fig. 3a between the two retrieved AOTs. A difference of 20.3 % is obtained in the mean values observed by the two satellites. This can be explained mainly by the differences in the aerosol model assumed for the retrieval. In the companion paper (Peers et al., 2019), it is shown that the assumed aerosol single-scattering albedo (SSA) can have a large impact on the retrieved above-cloud AOT. For the MOD06ACAERO algorithm, the assumed microphysical properties of aerosols are a function of the AOT (Levy et al., 2009). This results in an SSA at 0.55 µm of 0.86, 0.87 and 0.88 for an AOT of 0.1, 0.5 and 1.5 respectively. The aerosol model assumed for the SEVIRI retrieval is based on high-quality aerosol size distribution data and high-accuracy cavity ring-down (CRD) and photoacoustic spectrometer (PAS) data (Davies et al., 2019; Taylor et al., 2020; Wu et al., 2020) measured by the FAAM aircraft in the vicinity of Ascension Island. This aerosol model has a fixed SSA of 0.85 (see Sect. 3), which is more absorbing than the MODIS aerosol model. To reduce the influence of the assumed SSA on the results, the absorbing AOT (AAOT) has been compared and is shown in Fig. 3b. A better agreement is observed in the AAOT, with a slope of 0.87 and a correlation coefficient of 0.78. A slightly non-linear relationship is still observed between the two AAOTs, with the SEVIRI AAOT smaller than the MODIS retrieval by 7.5 % on average. The SSA assumption not only has a large impact on the scattering AOT, it also influences, to a lesser extent, the AAOT. Peers et al. (2019) also showed that the AAOT is sensitive to the assumed asymmetry factor. The asymmetry factor assumption for the MOD06ACAERO retrieval is AOT dependent (with the asymmetry factor taking values of 0.60 and 0.62 at a wavelength of 0.55 µm for AOT values of 0.5 and 1.5 respectively) and is smaller than the asymmetry factor assumed for the SEVIRI algorithm (i.e. 0.65 at 0.55 µm). To confirm that the aerosol model assumptions are the primary cause of differences in retrieved AOT, the SEVIRI retrieval has been run using both the CLARIFY-2017 and the MOD06ACAERO aerosol models for the case study described in Sect. 2.2.1. The comparison of the both sets of AOT with MODIS is plotted in Fig. 4. The slope of the regression line between SEVIRI and MODIS is 0.81 with the CLARIFY-2017 model, and it is 1.05 when the same model (i.e. MOD06ACAERO model) is used. Moreover, the mean AOT for this case study is 0.44 for MODIS, 0.33 for SEVIRI using the CLARIFY-2017 model and 0.44 for SEVIRI using the MOD06ACAERO model. This confirms that, for AOT larger than 0.25, the differences between the SEVIRI and the MODIS retrieval are mainly due to the assumed aerosol properties. While the CLARIFY-2017 and ORACLES observations provide a thorough and comprehensive analysis of the biomass burning aerosol optical properties, which are adopted by the SEVIRI and MODIS satellite retrievals, representing the level of complexity of the variation in optical properties owing to evolution of flaming to smouldering combustion during the biomass burning season (Eck et al., 2003) and the complexity of aerosol ageing processes (e.g. Wu et al., 2020; Taylor et al., 2020) is beyond current observational capabilities. The non-linearity of the AOT and AAOT comparison as well as the differences between the SEVIRI and MODIS distributions at low values can be partly explained by the MODIS filter on the AOT uncertainty. With the signal-to-noise ratio being smaller at low AOT, the near-zero AOTMODIS values are typically associated with an uncertainty larger than 100 % and are discarded. Although no filters are applied to remove those results in the SEVIRI dataset, their contribution to the total direct radiative effect over the south-east Atlantic is expected to be small.
Figure 3c and d show the COT and CER comparisons and confirm the strong correlation (R = 0.91) observed in the case study. The CER linear regression is characterized by a slope of 0.87 and an intercept of −0.8 µm, which indicates that the SEVIRI CER is generally smaller than the MODIS observations. On average, the CER values retrieved by SEVIRI and MODIS differ by 2.2 µm. For passive satellite sensors, the CER is typically retrieved from measurements in a water-absorbing spectral band in the SWIR region. Here, the SEVIRI algorithm uses the 1.64 µm channel while the MODIS retrieval relies primarily on the 2.10 µm channel. Because of the different penetration depth of the reflected photons (Platnick, 2000), the MODIS retrieval of CER at 2.10 µm is sensitive to the upper-cloud microphysics while the CER retrieved by SEVIRI at 1.64 µm is representative of the droplets lower down in the cloud. Therefore, as the droplet size increases from the base to the top of the cloud, the CER retrieved from the 2.10 µm channel should be larger than the CER retrieved from the 1.64 µm channel. To assess the impact of the difference of spectral band, the MOD06 CERs retrieved from the 1.6 and 2.1 µm channels from MODIS (Platnick et al., 2015) have been compared when the above-cloud AOT is lower than 0.5 for the case study presented earlier. The CER retrieved from the 1.6 µm channel is lower than the one retrieved from the 2.1 µm by 0.5 µm, which is consistent with the analysis from Platnick (2000). Differences in the cloud parameterization, such as the refractive index and the effective variance, also affect the CER retrieval (Arduini et al., 2005; Painemal and Zuidema, 2011; Platnick et al., 2019), although the impact is expected to depend on the observed scattering angle. Biases could also arise from an offset in the absolute calibration of the SEVIRI 1.64 µm band compared to MODIS (Meirink et al., 2013).
A strong linear relationship is obtained between the SEVIRI and the MODIS COT, and a difference of only 1.5 (10.5 %) is observed between the two mean values, with the MODIS COT being larger on average. The agreement between the two satellites is better at lower COT and the differences increase with the COT. The spatial resolution of the instrument has an impact on the COT retrieval via the plane-parallel bias (Cahalan et al., 1994; Szczap et al., 2000; Zhang et al., 2016a). The relationship between the top-of-cloud reflectance and the COT is convex, which means that the COT derived from the mean reflectance of a pixel is smaller than the COT calculated from the mean COTs within the pixel. Zeng et al. (2012) have shown that subpixel inhomogeneities cause satellite sensors with a coarser spatial resolution, such as SEVIRI, to retrieve a smaller COT. Also, as the clouds becomes thicker, the visible and the near-infrared (NIR) measurements become less sensitive to the COT for both instruments. Using a radiative transfer code to simulate the SEVIRI signal, we estimate that an error of +1.5 µm on the CER retrieved by SEVIRI causes a bias of +0.3 for a COT of 5.0 and +4.9 for a COT of 45. Therefore, differences in the retrieved CER could partly explain the low bias on the SEVIRI COT compared to MODIS at a large COT.
Note that the cloud properties from SEVIRI and MODIS have also been compared for low above-cloud AOT (AOT < 0.05) to separate the impact of the aerosol correction from the cloud retrieval itself. Figure S1 in the Supplement shows that similar relationships are obtained with and without aerosol above clouds.
3.1 Instruments
3.1.1 EXtinction, SCattering and Absorption of Light for AirBorne Aerosol Research (EXSCALABAR)
EXtinction, SCattering and Absorption of Light for AirBorne Aerosol Research (EXSCALABAR) is a state-of-the-art suite of spectrometers for measuring in situ aerosol optical properties aboard the UK research aircraft (FAAM BAe-146, https://www.faam.ac.uk, last access: 15 February 2021). EXSCALABAR includes cavity ring-down spectroscopy (CRDS) and photoacoustic spectroscopy (PAS) instruments for the measurement of extinction and absorption coefficients at several wavelengths respectively. We now briefly describe the measurement capabilities of EXSCALABAR and how it was operated during CLARIFY-2017, while the reader is referred to previous publications for complete details on calibration, operating principles and instrument descriptions (Davies et al., 2018, 2019; Cotterell et al., 2019a). In particular, Davies et al. (2019) outlined the same sample conditioning and operation of the spectrometers during the airborne measurements used in this work.
Four CRDS channels measured extinction at wavelengths of 405 and 658 nm, with three 405 nm channels measuring the extinction for aerosol at relative humidities (RH) of < 10 %, 70 % and 90 % and the 658 nm channel operating under dry conditions (< 10 % RH) only. The CRDS instruments use high-finesse optical cavities formed from two highly reflective mirrors separated by ∼ 40 cm to achieve total optical path lengths of the order of 5–11 km through the aerosol sample. Intensity-modulated laser light is passively coupled into each optical cavity and a photodetector used to monitor the decay of light exiting the rear mirror following each on–off laser cycle. The signal exiting the cavity decays exponentially and is fitted to extract the -folding time, referred to as the ring-down time. The change in ring-down time between an empty cavity (i.e. a sample devoid of any light-scattering and light-absorbing aerosols) and a cavity filled with aerosol sample enables the aerosol extinction coefficient αext to be calculated (Davies et al.,2018). The long path lengths achieved in CRDS provide measurements of aerosol extinction to a sensitivity better than 0.2 Mm−1 for 1 s sampling.
EXSCALABAR also included five PAS instruments that measured aerosol absorption coefficients under dry conditions (< 10 % RH). Three PAS instruments sampled the dried aerosol directly, with each spectrometer operating at a different visible wavelength (405, 515 or 658 nm). Two further 405 and 658 nm spectrometers sampled aerosol that had additionally passed over a thermal denuder (a heated carbon catalyst) and are used to remove semi-volatile organic aerosol components that can act to enhance light absorption by refractory components. However, the 658 nm spectrometer that sampled thermally denuded aerosol did not provide data during CLARIFY-2017 due to a faulty laser. Briefly, PAS measures light absorption coefficients for in situ aerosol in a non-contact manner (i.e. not using filter collection). Laser light is intensity-modulated to heat aerosol particles within an acoustic resonance cell, leading to the generation and amplification of a sound wave as particles liberate their heat to surrounding air. This sound wave is measured using a microphone and is directly proportional to the aerosol absorption coefficient, with the constant of proportionality determined by calibrating each PAS instrument using ozone-laden air with a known absorption coefficient. Again, we refer the reader to previous work on the principles of photoacoustic spectroscopy (Davies et al., 2018; Cotterell et al., 2019b), assessment of the accuracy of PAS aerosol absorption measurements (Davies et al., 2018) and calibration of PAS instruments with ozone (Cotterell et al., 2019a).
EXSCALABAR operated behind a 1 µm diameter impactor to remove supermicron aerosols and sampled from the aircraft via a modified Rosemount inlet. It extracted an aerosol-laden sample from this inlet at a rate of 7 L min−1. The sample underwent flow conditioning that included passing the sample through a Nafion dryer to dry the sample to < 10 % RH and then through an NOx O3 scrubber to remove gas phase species that would have otherwise contributed to the measured light extinction and absorption. The conditioned sample was split using a series of Brechtel precision flow splitters to provide samples to each spectrometer.
3.1.2 Microwave Airborne Radiometer Scanning System (MARSS)
Previous studies (e.g. English 1995; Zuidema et al., 2012) have demonstrated that airborne millimetre-wave radiometers can be used to retrieve liquid water path (LWP) in stratocumulus clouds. Such microwave retrievals are not contaminated by the presence of absorbing biomass burning aerosol above clouds (e.g. Haywood et al., 2004). In this study, we use downward-looking views from the 89 and 157 GHz channels on the Microwave Airborne Radiometer Scanning System (MARSS) (McGrath and Hewison, 2001). Over the ocean, the downward-looking measurements are sensitive to absorption and emission by cloud liquid water as the sea surface provides a relatively cold radiative background due to its low emissivity at these frequencies. LWP retrievals using downward-looking MARSS observations on the FAAM aircraft have been used previously by Abel et al. (2017) in their study of a cold-air outbreak. Our retrieval method is based on the optimal estimation method (Rodgers, 1976) and is broadly similar to that described by English (1995). Radiative transfer simulations are performed using the Atmospheric Radiative Transfer Simulator (ARTS) model (Buehler et al., 2018), with background profiles of temperature and humidity taken from dropsondes released close to the location of the above-cloud runs. The surface emissivity is calculated using the fast ocean surface emissivity model FASTEM (Liu et al., 2010), with the surface temperature taken from infrared measurements during below-cloud runs and wind speed taken from the dropsondes. The cloud liquid water content is assumed to increase linearly from cloud base to cloud top, and the altitudes of the cloud base and top are estimated from aircraft profiles through the cloud layer. Cloud liquid water absorption is calculated using the Ellison (2007) model. The retrieved parameters are the liquid water path (LWP) and the column-integrated water vapour, which are used to scale the background profiles of liquid water content and water vapour in the forward model to provide the closest match to the observed brightness temperatures.
Errors in the MARSS LWP retrievals arise from several sources, including errors in the forward model used in the retrieval, the instrument noise and calibration errors. Instrument noise and calibration errors are estimated to be less than 1 K, and the combined instrument and forward-model error in the retrieval is assumed to be uncorrelated with a standard deviation of 2 K. The overall uncertainty in the retrieved LWP is estimated by combining the posterior error covariance from the retrieval with sensitivity estimates derived by perturbing fixed input parameters such as the sea surface temperature, wind speed, cloud-top and cloud-base heights, and water vapour profile within plausible ranges. The total uncertainty is estimated to be approximately 40 g m−2 at low LWP (< 200 g m−2), and it increases with increasing LWP, becoming about 10 %–12 % at large LWP (> 400 g m−2).
3.1.3 Cloud Droplet Probe (CDP)
The Droplet Measurement Technologies Cloud Droplet Probe (CDP) is a forward-scattering optical particle counter which can detect particles over the nominal size range of 3 to 50 µm. Light from a 658 nm diode laser illuminates the sample volume, and scattered light is collected over a 1.7 to 14∘ solid angle. The incoming beam is split using a 50 : 50 optical beam splitter, where one beam is focused through an optical mask before being sampled by a so-called qualifier photodetector and the other by the sizer detector. This detection configuration is used to qualify the depth of field (DOF) where the signal from the qualifier detector multiplied by 2 must exceed the signal from the sizer for the particle to register as being measured within the DOF. Particles which do not meet this criterion are rejected. The signal pulses from DOF-accepted particles are digitized from their raw analogue voltages; the peak value corresponding to the scattering cross section is then segregated into one of 30 bins, and the sum of counts in each bin over the sampling integration period is transmitted to a logging computer running PADS (version 3.11) software.
A 10-point glass bead calibration spanning the instrument's detection range was performed before each day of flying throughout the CLARIFY-2017 campaign. The nominal bead size is corrected for the differences between the refractive indices of glass and water, and the water-corrected size is used to calibrate the instrument's sizing response. The calibration was found to be consistent across the campaign, resulting in an approximate 7 % under-sizing correction being applied to the instrument's sizing response.
3.2 Atmospheric profile
The atmospheric correction is an essential step of the SEVIRI above-cloud-aerosol retrieval. The spectral contrast between the 0.6 and the 0.8 µm channels, which is used to retrieve the above-cloud AOT, is especially sensitive to the absorption from water vapour (Peers et al., 2019). To remove the contribution of water vapour from the signal, the transmittances from the cloud top to the top of the atmosphere are calculated using the humidity profiles from the operational forecast configuration of the global Met Office Unified Model (Brown et al., 2012) and the cloud-top height retrieved from the SEVIRI infrared channels (Francis et al., 2008; Hamann et al., 2014). The humidity and temperature profiles used in the correction scheme are evaluated against those from the dropsondes deployed during the CLARIFY-2017 flights. Figure 5 shows the location of the flights analysed in this paper. Note that owing to difficulties in transmitting data from such a remote location, the dropsonde measurements from the campaign have not been assimilated in the model forecasts. The above-cloud and the full-column integrated water vapour are calculated from the sondes and the forecast profiles. For both the model and the measurements, the highest altitude is considered to be the altitude at which the sonde has been dropped and, for the full-column integration, the bottom altitude corresponds to the lowest altitude measured by the sonde. To be consistent with the atmospheric correction scheme, the above-cloud water vapour from the forecast is calculated using the cloud-top height from SEVIRI. For the dropsondes, the cloud-top height is defined at the altitude of the temperature inversion, which is consistent with lidar and in situ observations from the aircraft (e.g. Haywood et al., 2021). To assess the added value brought by the forecast model, the water vapour content has been calculated for the tropical atmospheric profile from McClatchey et al. (1972) using the cloud-top height retrieved with SEVIRI. Figure 6 shows the integrated water vapour comparison of the dropsondes, the forecast and the McClatchey atmospheric model. The dew point and temperature profiles from the dropsonde, the numerical weather prediction (NWP) model and the McClatchey model are shown for each flight in Fig. S2 of the Supplement. The NWP and the McClatchey integrated column water vapour above cloud are plotted against the measurements from the dropsonde in Fig. S3 of the Supplement. The problem in assuming a single profile for water vapour from McClatchey climatologies is evident from the gross overestimation of water vapour and the limited variability which comes only from changes in the cloud height (R = 0 in Fig. S3). When NWP model data are used, the amount of water vapour used for the atmospheric correction is strongly correlated with the dropsonde observations (R = 0.89 in Fig. S3), but the integrated water vapour path is larger by 3.1 mm on average compared to the dropsonde measurements. On the other hand, the full column water vapour from the forecast and the observations follows the same trend with a mean absolute difference of 1.5 mm in integrated water vapour path. Much of this difference is explained by the underestimation of the altitude of the cloud top retrieved by SEVIRI, with a mean bias of −265 m. When the cloud-top height from the dropsonde is used to calculate the integrated water vapour above cloud from the forecast, the absolute difference to the measurements is reduced to 0.7 mm on average, which indicates a reasonable performance of the model in forecasting the vertical profile of humidity. The SEVIRI cloud-top height retrieval is derived by conversion of the observed brightness temperature to a cloud-top height assuming the temperature profile from the Met Office forecasts. Therefore, a reasonable consistency is observed between the retrieved cloud-top height and the altitude of the temperature inversion from the model, with an absolute difference of 88 m. The individual profiles shown in Fig. S2 in the Supplement show that the model does not quite capture the depth of the boundary layer. However, no evidence of a correlation between the cloud-top height error and the presence of absorbing aerosols in the boundary layer has been observed. While identifying the causes of these biases is complex and beyond the scope of this paper, it is worth mentioning that the boundary layer depth in the model is highly influenced by the balance between the subsidence and the entrainment rate.
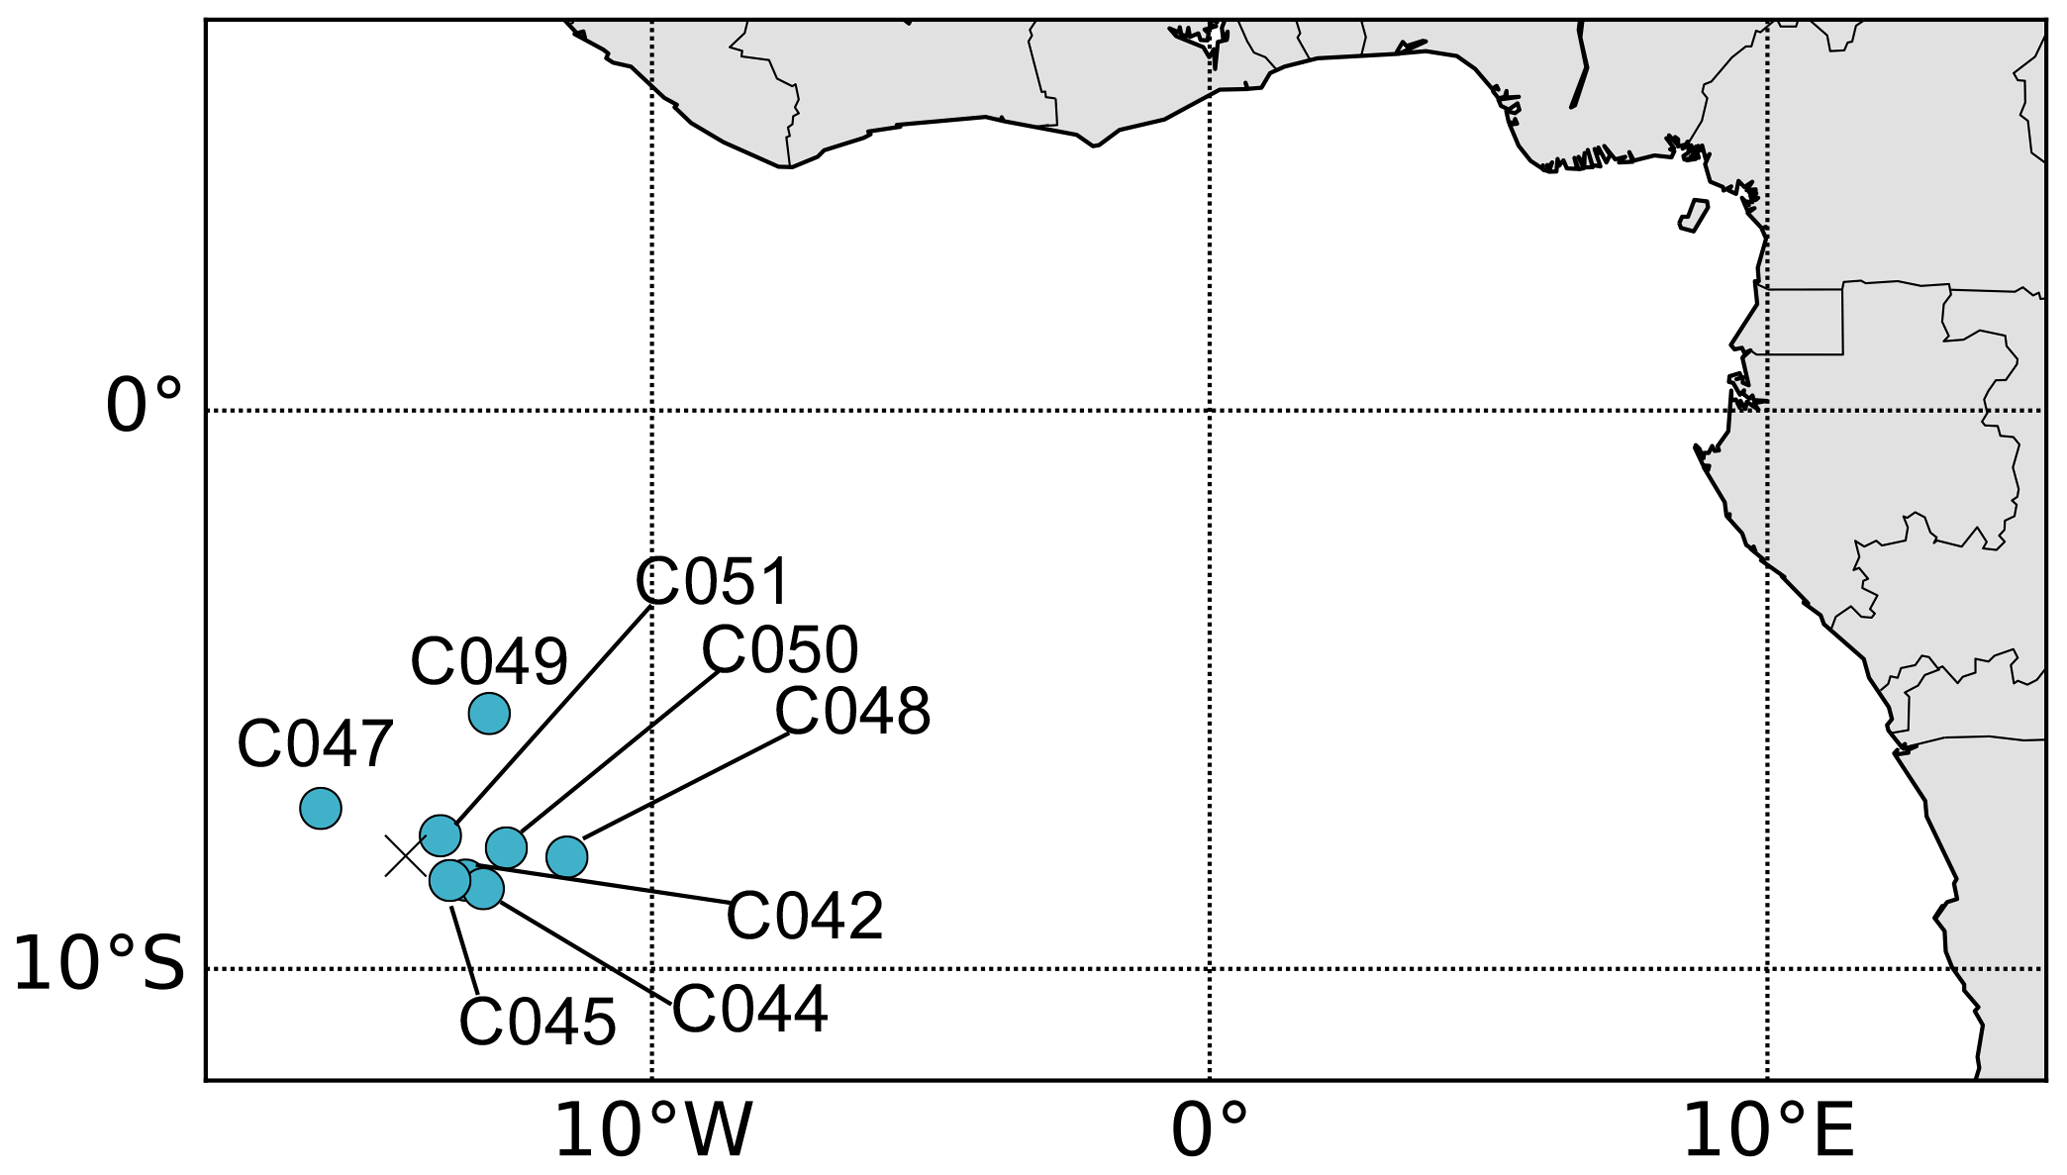
Figure 5Map showing the geographical location of the dropsonde observations used in Sect. 3. The cross corresponds to Ascension Island.

Figure 6Comparison of the water vapour integrated over the full column (lighter shades) and above clouds (darker shades) from the dropsondes, the forecast and the McClatchey tropical atmospheric profile. For the McClatchey and the forecast, the top of the cloud is based on the cloud-top height retrieved by SEVIRI.
The overestimation of the water vapour in the atmospheric correction, which disproportionately affects the 0.8 µm channel where water vapour absorption is stronger (see Fig. 3 in Peers et al., 2019), indicates that an overestimation of the above-cloud AOT retrieved by SEVIRI may be expected due to an artificially enhanced spectral contrast between 0.6 and 0.8 µm. In Fig. 5, one can see that the dropsondes have been launched in a small region around Ascension Island. Its remote location implies that the number of highly accurate measurements available for model assimilations is limited to the radiosonde releases from Ascension Island and therefore relies heavily on vertically integrated atmospheric state variables retrieved from satellites. Therefore, it might reasonably be expected that the performance of the forecast model and the cloud-top height retrieval could vary with the distance from the African continent where radiosonde launches are less sparse. In the absence of in situ atmospheric sounding between Ascension Island and the African coast, the comparison of the above-cloud-aerosol properties retrieved from SEVIRI and MODIS can be considered an indirect evaluation of the atmospheric correction scheme, since the MODIS channels used for the retrieval are barely impacted by the absorption from water vapour, provided that the differences due to the assumptions on the aerosol microphysical properties are accounted for. To minimize the influence of the aerosol model differences between the two retrievals, we have chosen to compare the AAOT. The SEVIRI and the MODIS collocated observations from Sect. 2.2.2 (i.e. from 28 August to 5 September 2017 and over 0∘ N–30∘ S and 20∘ W–15∘ E) have been used, removing AAOTSEVIRI lower than 0.03. Figure 7 shows the difference Δ of the mean AAOT as a function of the longitude, with ΔAAOT defined as
An increase in ΔAAOT can be observed from east to west. The AAOTSEVIRI is 8.3 % smaller than the AAOTMODIS close to the continent. The sign of the difference changes at 2.7∘ E. From west of 5∘ W, a sharp increase in ΔAAOT is observed, reaching 28.8 % at 15∘ W. This trend between SEVIRI and MODIS may therefore be related to a trend in the accuracy of the atmospheric correction scheme. As explained in Sect. 2.2.2, the AAOT from SEVIRI is expected to be slightly smaller than MODIS because of the different assumptions on the SSA and the asymmetry factor. The small low bias on the SEVIRI AAOT compared to MODIS suggests a good performance of the forecast model and the cloud-top height retrieval next to the coast. From the coast to 9∘ W, the difference between the SEVIRI and the MODIS AAOT is lower than 10 %. In Fig. 7, the longitudes associated with the dropsonde measurements are indicated by the grey lines and correspond to the region where ΔAAOT is the largest. Therefore, the overestimation of humidity in the forecast model (as demonstrated in Fig. 6) is likely a major contributor to biases in SEVIRI retrievals of AAOT, particularly at remote locations where very few observation data for humidity are available for assimilation into model forecasts. While our analysis suggests that errors in humidity in the model may well be the cause of the zonal discrepancy between the AAOT in MODIS and SEVIRI, we cannot definitively conclude this is the case. More detailed comparisons of atmospheric moisture fields from other high quality observations such as from the ORACLES or AEROCLO-sA vertical profiles against those from the Unified model would be necessary, but this is beyond the scope of the present work.

Figure 7Longitudinal variation in the above-cloud AAOT from SEVIRI (black solid line), MODIS (black dashed line) and the difference ΔAAOT in percentage (blue line) for the data used in Fig. 3, removing AAOTSEVIRI lower than 0.03. The dashed vertical lines correspond to the location of the dropsondes used in Fig. 6.
3.3 Aerosol layer
To survey the full column of aerosols and characterize the aerosol–radiation interactions, a series of manoeuvres described as a “Z” pattern were performed on multiple flights during the campaign (Haywood et al., 2021). These patterns start at an altitude of about 7 km with a straight level run and dropsonde deployment above the aerosol plume, followed by a 180∘ turn and a profile descent through the main aerosol layers to an altitude of around a couple hundred metres above the cloud top. Then, a level 180∘ turn and another straight level run was performed along the same ground position as the upper run. Finally, subsequent to a further reciprocal turn, a profile descent was made through the cloud to 15 m above sea level. The extinction and absorption measured from EXSCALABAR during the two-part descent profiles have been used to calculate the total and absorption AOT above clouds at the wavelengths of the instrument and interpolated to 0.55 µm. The above-cloud AOT from SEVIRI has been obtained by averaging the observations acquired during the descent (i.e. four to five 15 min time slots) over an area within a 60 km radius from the position of the aircraft in the middle of the profile descent, which covers roughly the distance travelled by the aircraft. Additionally, the above-cloud AOT retrieved from the closest MODIS overpass (i.e. Terra in the morning and Aqua in the afternoon) has been averaged over the same area as SEVIRI. The impact of the time difference between the MODIS and the aircraft observations (lower than 2.5 h) on the AOT comparison is assumed to be negligible as the time and space variation in the aerosol distribution is expected to be small over this timescale.
The comparison of the above-cloud AOT from the in situ and the satellite measurements is presented in Fig. 8. The darker colours represent the AAOT contribution to the AOT and the error bars correspond to the standard deviation calculated for each flight of the MODIS and SEVIRI AOT retrieved within the 60 km radius. The (nominally dry aerosol) SSAs obtained at 0.55 µm from EXSCALABAR for each flight are indicated above the in situ measurement bars. Note however that in the free troposphere above the marine boundary layer, the relative humidity is typically around 30 %, and hence any hygroscopic growth is likely to be small (i.e. lower than 2 % according to Magi and Hobbs, 2003). For clarity, the AAOT bar chart comparison is also shown in Fig. S4 in the Supplement. Given the limited size of the dataset, the consistency observed between the SEVIRI above-cloud AOT and the in situ measurements, which is shown in Fig. S5 of the Supplement, is promising (R = 0.75). Except for flights C044 and C051, the above-cloud AOT measured by EXSCALABAR is within the standard deviation of the mean AOT retrieved from both SEVIRI and MODIS. The SSA derived from EXSCALABAR ranges from 0.798 to 0.858, suggesting some variations in the level of aerosol absorption. The SSAs assumed for both satellite retrievals (i.e. SSAMODIS ≈ 0.87 and SSASEVIRI ≈ 0.85) are in the upper bound of this range. As shown in Peers et al. (2019), colour-ratio-based retrieval method is sensitive to the aerosol absorption above clouds, which means that the retrieval of the AAOT above cloud is less sensitive to the assumed SSA than the AOT. This could explain why a better agreement is obtained between the in situ measurements and the satellite products on the AAOT than on the AOT for all flights except C044, C048 and C051. Both satellite AOTs for flight C044 are larger than AOTEXSCALABAR, but the AAOTs from EXSCALABAR and MODIS are in agreement while the AAOT from SEVIRI is larger. Contrary to SEVIRI, the MODIS channels used for the retrieval are barely impacted by the absorption from above-cloud water vapour. The AOT differences observed for this flight are consistent with the large overestimation of the water vapour by the SEVIRI atmospheric correction scheme in this case, as observed in Fig. 6. For C048, the AOTs retrieved from MODIS and SEVIRI are associated with especially large standard deviations. Although the in situ AOT is within the spread of the satellite retrievals, AOTSEVIRI is about 47 % larger than EXSCALABAR while AOTMODIS is about 32 % smaller. As confirmed by the satellite images, broken cloud cover was observed during this flight. Additionally, the SEVIRI and MODIS observations indicate that the in situ measurements were performed at the south-western edge of an aerosol plume where strong aerosol gradients were present. The low cloud fraction together with the strong above-cloud AOT gradient in this region could explain the differences observed between the satellite retrievals and the in situ measurements. Finally, both satellite retrievals overestimate the above-cloud AOT measured by the aircraft during C051. The overestimation from SEVIRI cannot be totally attributed to the atmospheric correction scheme because the AOT from SEVIRI is consistent with MODIS.
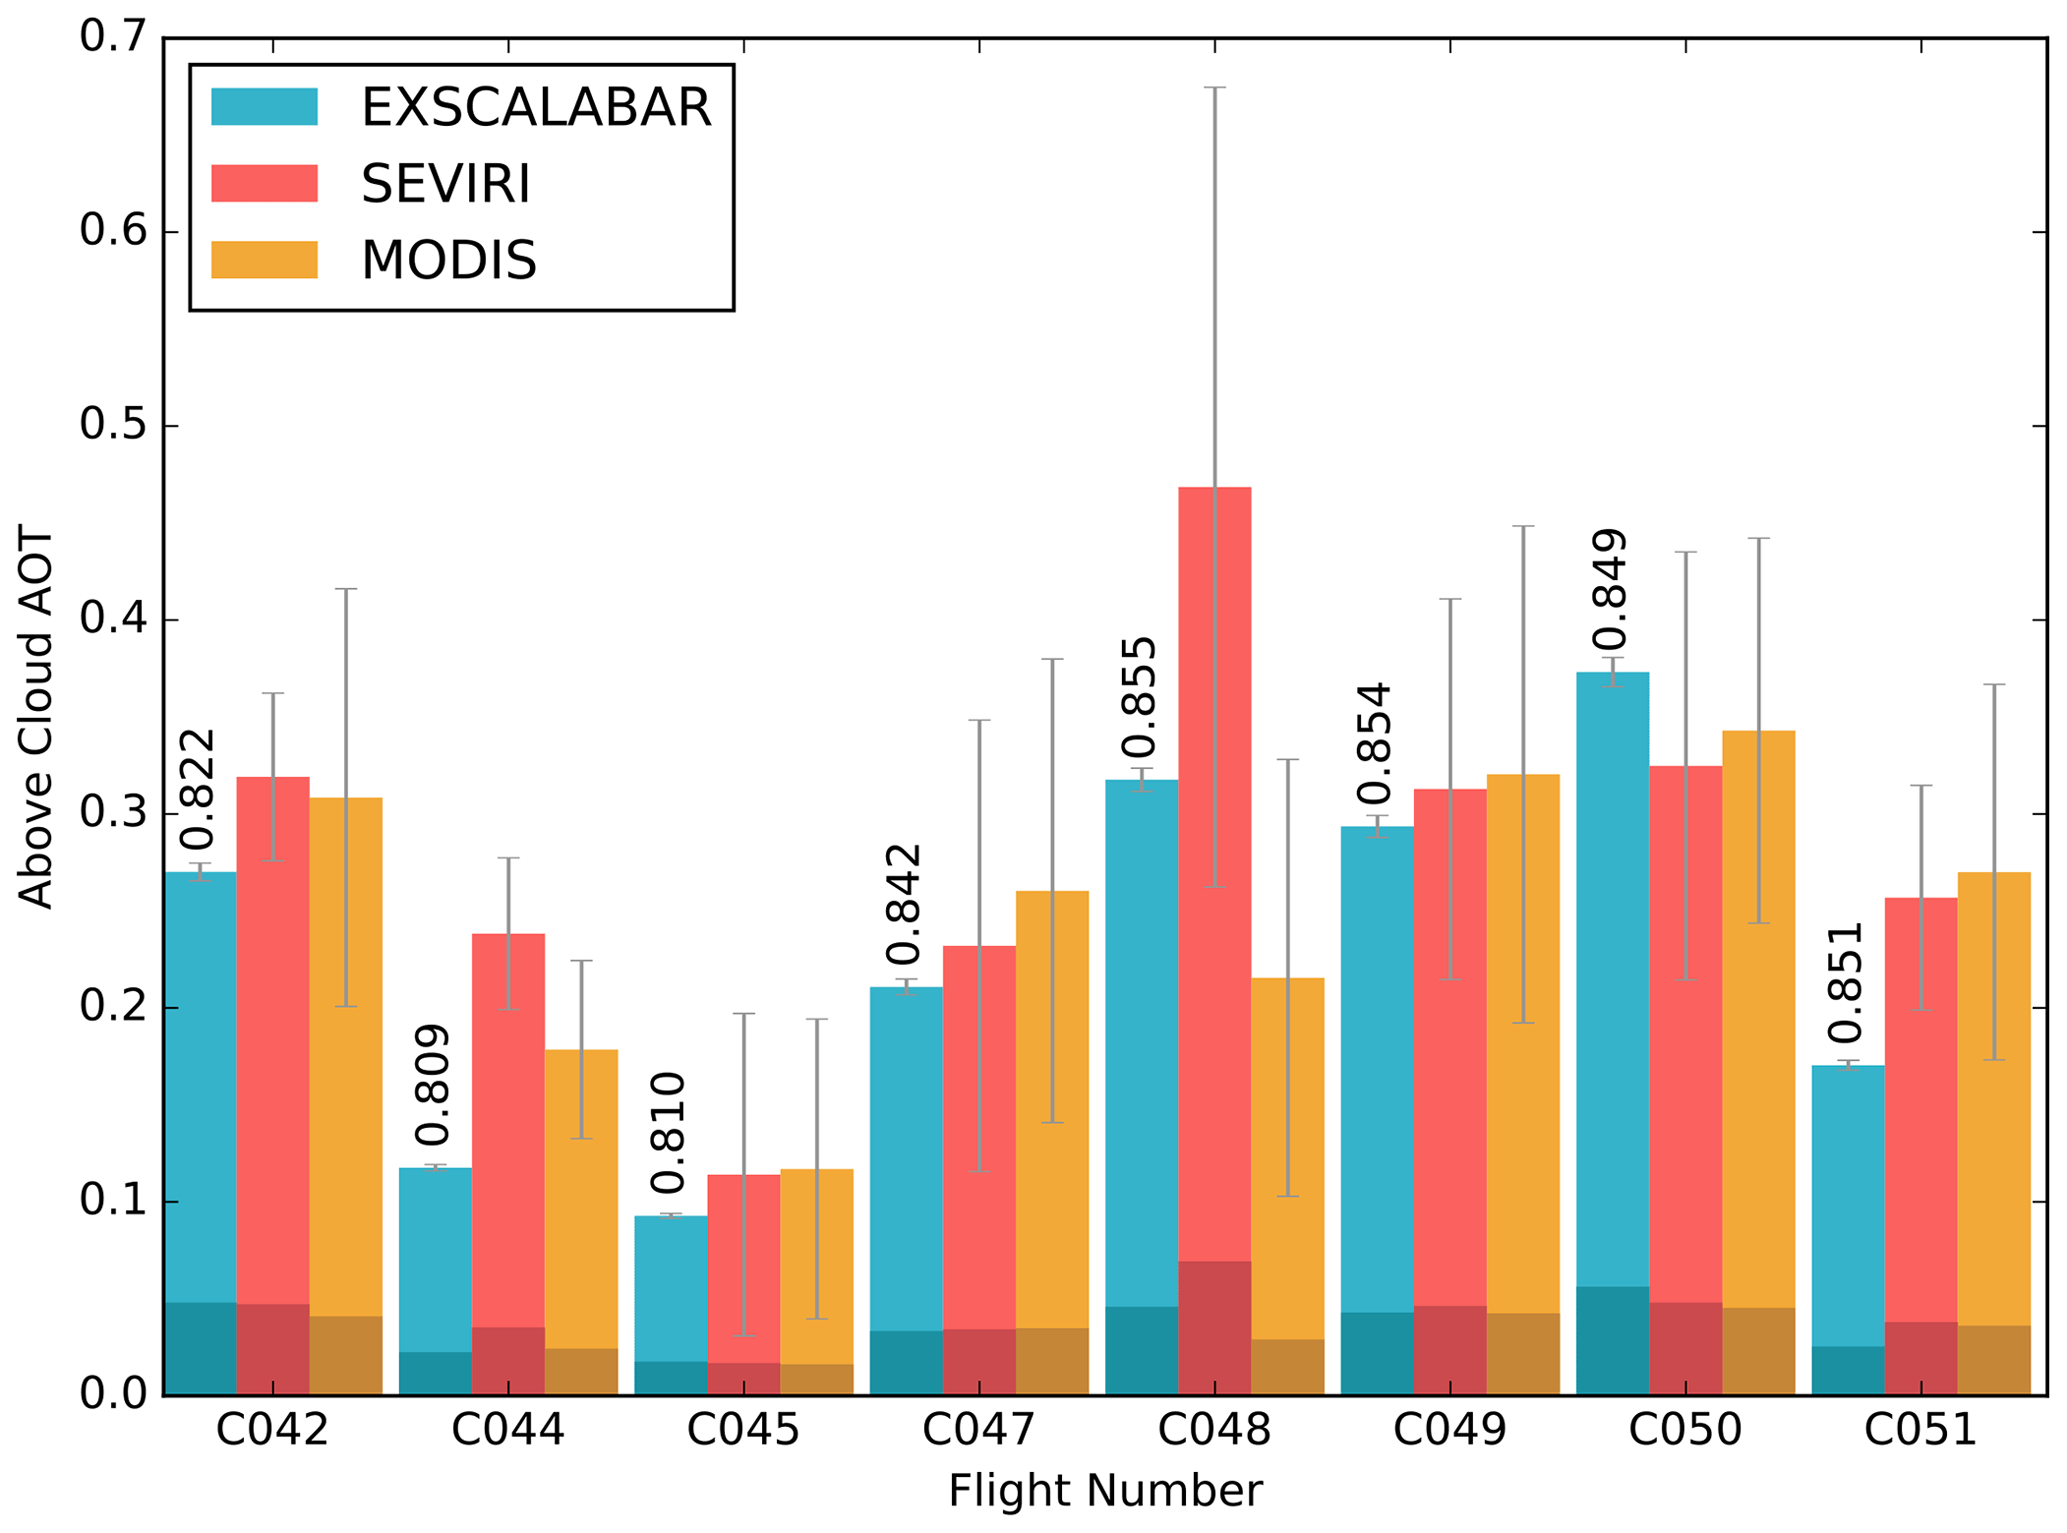
Figure 8Comparison of the above-cloud AOT (lighter shades) and AAOT (darker shades) retrieved by SEVIRI and MODIS and measured by EXSCALABAR during descent profiles. The error bars represent the uncertainties of the EXSCALABAR measurements and the standard deviation of the satellite product within a 60 km radius around the aircraft measurements for SEVIRI and MODIS. The SSA has been calculated at 0.55 µm from the EXSCALABAR observations and included as an annotation over the EXSCALABAR above-cloud AOT.
Table 2Dry extinction (ext) measured by EXSCALABAR at 405 nm averaged over 100 m above and below the cloud (Mm−1) and collocated CER (µm) retrieved by SEVIRI and MODIS.
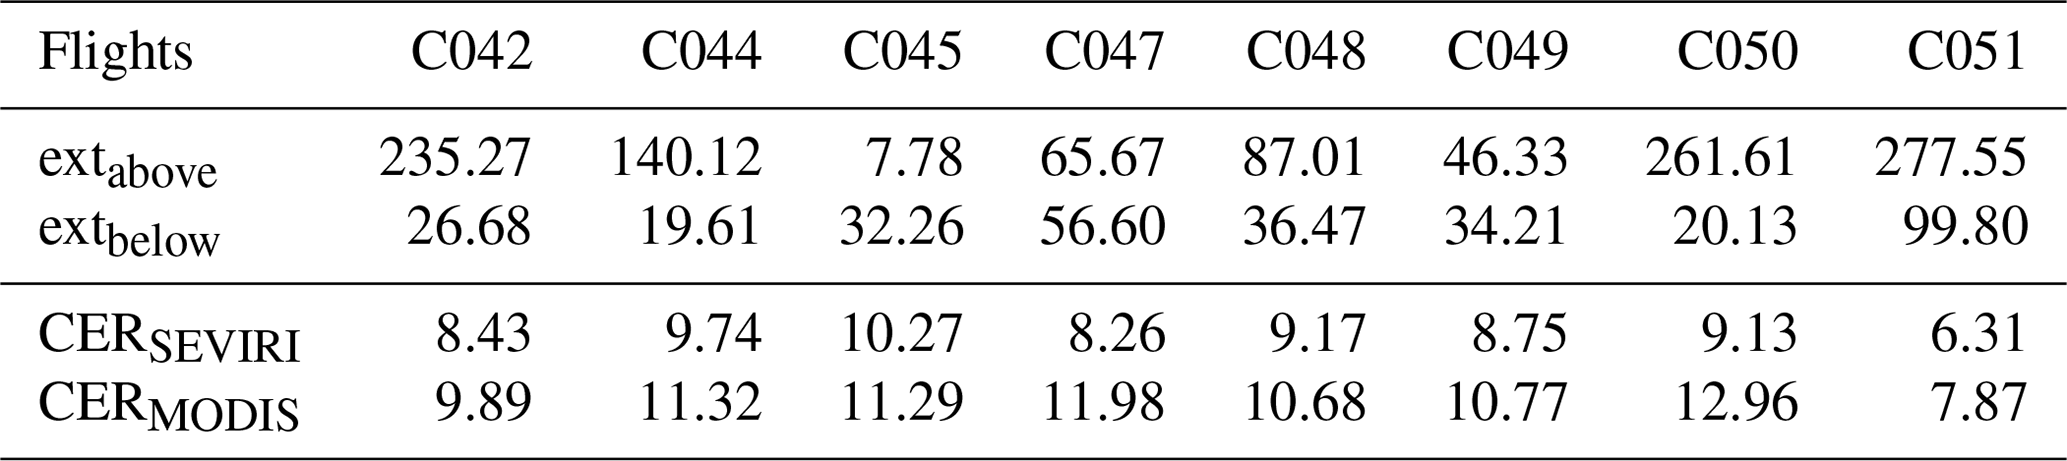
Information on the vertical profile of aerosols can be used to further investigate the differences between satellite observations and in situ measurements. After the descent profile through the aerosol layer, a profile descent through the cloud was typically performed, which allowed sampling of marine boundary layer aerosols directly underneath the clouds. Table 2 summarizes the extinction measured by EXSCALABAR directly above and under the stratocumulus cloud layer as well as the collocated CER retrieved by SEVIRI and MODIS. Note that the MODIS observations do not temporally correspond to the SEVIRI and EXSCALABAR measurements and that the purpose here is to illustrate the differences in the cloud properties between the flights. The collocated CER averaged over the CDP transect for flights C042 to C050 is around 9.1 µm for SEVIRI and 11.3 µm for MODIS. For C051, both satellites retrieve significantly smaller droplets, with a difference of 2.8 and 3.4 µm for SEVIRI and MODIS respectively, which could potentially be caused by aerosol–cloud interactions. In addition, in situ measurements indicate that the air directly underneath the stratocumulus cloud is 3.2 times more polluted for flight C051 than for the other flights, suggesting a significant entrainment of biomass burning aerosol into the marine boundary layer. Figure 9a and b show the CER retrieved by SEVIRI and MODIS as a function of the extinction measured respectively directly above and below the cloud. While the correlation obtained with the above-cloud extinction is moderate (R = 0.58), there is a convincing relationship between below-cloud extinction and the CER (R = 0.86). Although these results are far from robust considering the limited number of measurements available, this is consistent with the observations from Diamond et al. (2018). Using data from the ORACLES campaign, they observed a correlation between the presence of smoke in the marine boundary layer and changes in the cloud microphysics. They have also reported that the presence of smoke directly above cloud is not necessarily an indicator of aerosol–cloud interactions because the mixing of elevated smoke into the boundary layer typically takes a couple of days. Pollution within clouds tends to increase the cloud albedo by acting as cloud condensation nuclei but can also increase their absorption coefficient (Twomey, 1977). Although the brightening of the clouds is typically the dominant effect, the presence of absorbing smoke within the cloud could have an impact on the spectral variation in the cloud reflectance. Both the SEVIRI and the MODIS algorithms assume that the entire aerosol layer is located above an unpolluted cloud and do not account for aerosols within the cloud. Therefore, a reduction in the cloud albedo in the visible–SWIR range due to pollution within the cloud layer could be interpreted by colour-ratio-based retrievals as an additional aerosol signal, leading to an overestimation of the above-cloud AOT.
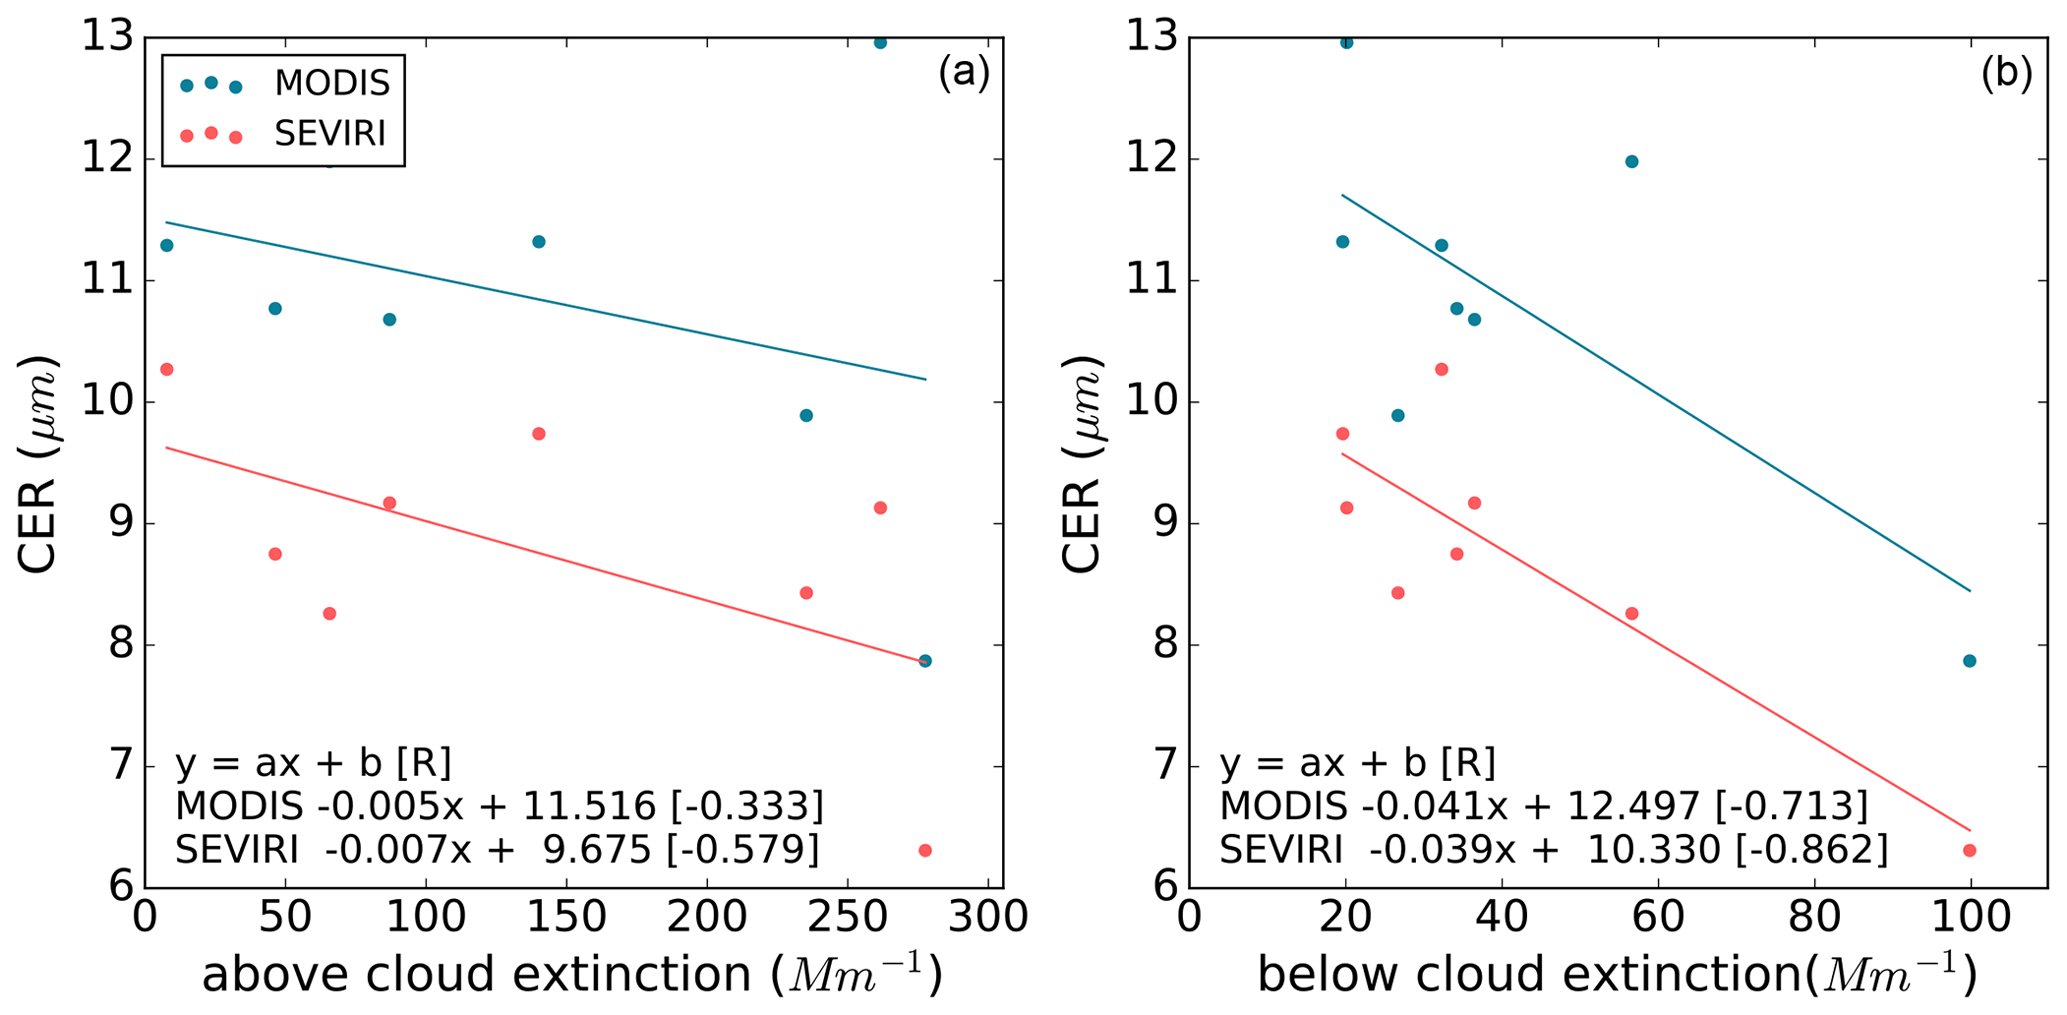
Figure 9CER (µm) retrieved by SEVIRI (red) and MODIS (blue) as a function of the dry extinction (Mm−1) measured by EXSCALABAR at 405 nm and averaged over 100 m directly above (a) and below the cloud (b). The linear regression fits are defined by the slope a, the intercept b and the Pearson's correlation coefficient R.
3.4 Cloud layer
3.4.1 Cloud droplet effective radius (CER)
The cloud droplet size distribution has been measured with a CDP during straight level runs at about 100 m below the cloud top. Figure 10 shows the time series of the CER measured by the aircraft (blue dot) with the closest SEVIRI retrieval in space and time (red line). In addition to the above-cloud-aerosol algorithm, the CER has been retrieved considering an above-cloud AOT of zero and is plotted in orange. The grey areas represent the pixels that have been rejected by the algorithm's filters, which include measurements poorly fitted by the algorithm, observations in the backscattering glory region, COT lower than 3, cloud edges and inhomogeneous clouds (Sect. 2.1). The CER retrieved from SEVIRI is plotted against the CDP measurements in Fig. S6 of the Supplement. The consistency observed between the in situ measurements and the satellite retrievals is good (R = 0.77 in Fig. S6), with both the variation in CER during a single flight and the inter-flight differences being well represented. The range and the variation in the CER are well reproduced by SEVIRI, especially for the flights C044, C049 and C051 for which the mean difference between the satellite and the CDP is less than 0.4 µm. On the other hand, the valid CER retrieved by SEVIRI is on average 1.5 µm lower than the aircraft measurements over the C050 transect. Compared to the other flights, there is a stronger variability in the CER measured during C050. One-dimensional cloud property retrievals, such as the SEVIRI above-cloud-aerosol algorithm, tend to underestimate the CER in the case of subpixel heterogeneity (Marshak et al., 2006; Zhang and Platnick, 2011; Zhang et al., 2012, 2016a). Time differences between the aircraft and the satellite observations also add uncertainty in the comparison of the cloud properties, especially when the cloud layer changes quickly. In Fig. 10c, a mirror-image symmetry in the CDP measurements is observed before and after 16:09 UTC. This is caused by a 180∘ turn performed by the aircraft between 16:08 and 16:10 UTC followed by a slightly offset reciprocal run to fly through the same cloud. The fact that the CERs measured at the end of this run (i.e. after 16:18 UTC) are smaller by about 2 µm than the CERs measured at the beginning of the first run (between 15:55 and 15:58 UTC) suggests a relatively fast evolution of the cloud and/or an inadequate horizontal or vertical offset in the reciprocal leg. The vertical distribution of the CER also has an influence on the comparison with the satellite retrieval as the altitude of the measurements could differ from the expected peak of the vertical weighting function of the SEVIRI 1.64 µm channel. Although the aircraft was flying at a constant altitude during the CDP measurements, it is difficult to precisely assess the relative position of the cloud top. Finally, we note that the impact of not taking the biomass burning aerosol layer above the cloud into account usually leads to an underestimation of less than 1 µm on the CER. In the grey areas of Fig. 10b and c, unrealistically large cloud droplets are retrieved by the above-cloud-aerosol algorithm at the beginning of the C049 transect and just before and after the turn at 16:09 UTC during C050. As confirmed by the aircraft observations, these pixels correspond to cloud edges. For partially cloudy fields of view, the darker portions of the pixel (either clear sky or optically thinner cloud) decrease the reflectance, resulting in an increase in the retrieved CER (Zhang et al., 2012). These biases confirm that the filters implemented for the above-cloud-aerosol retrieval are useful in enhancing the quality of the SEVIRI retrieval products.
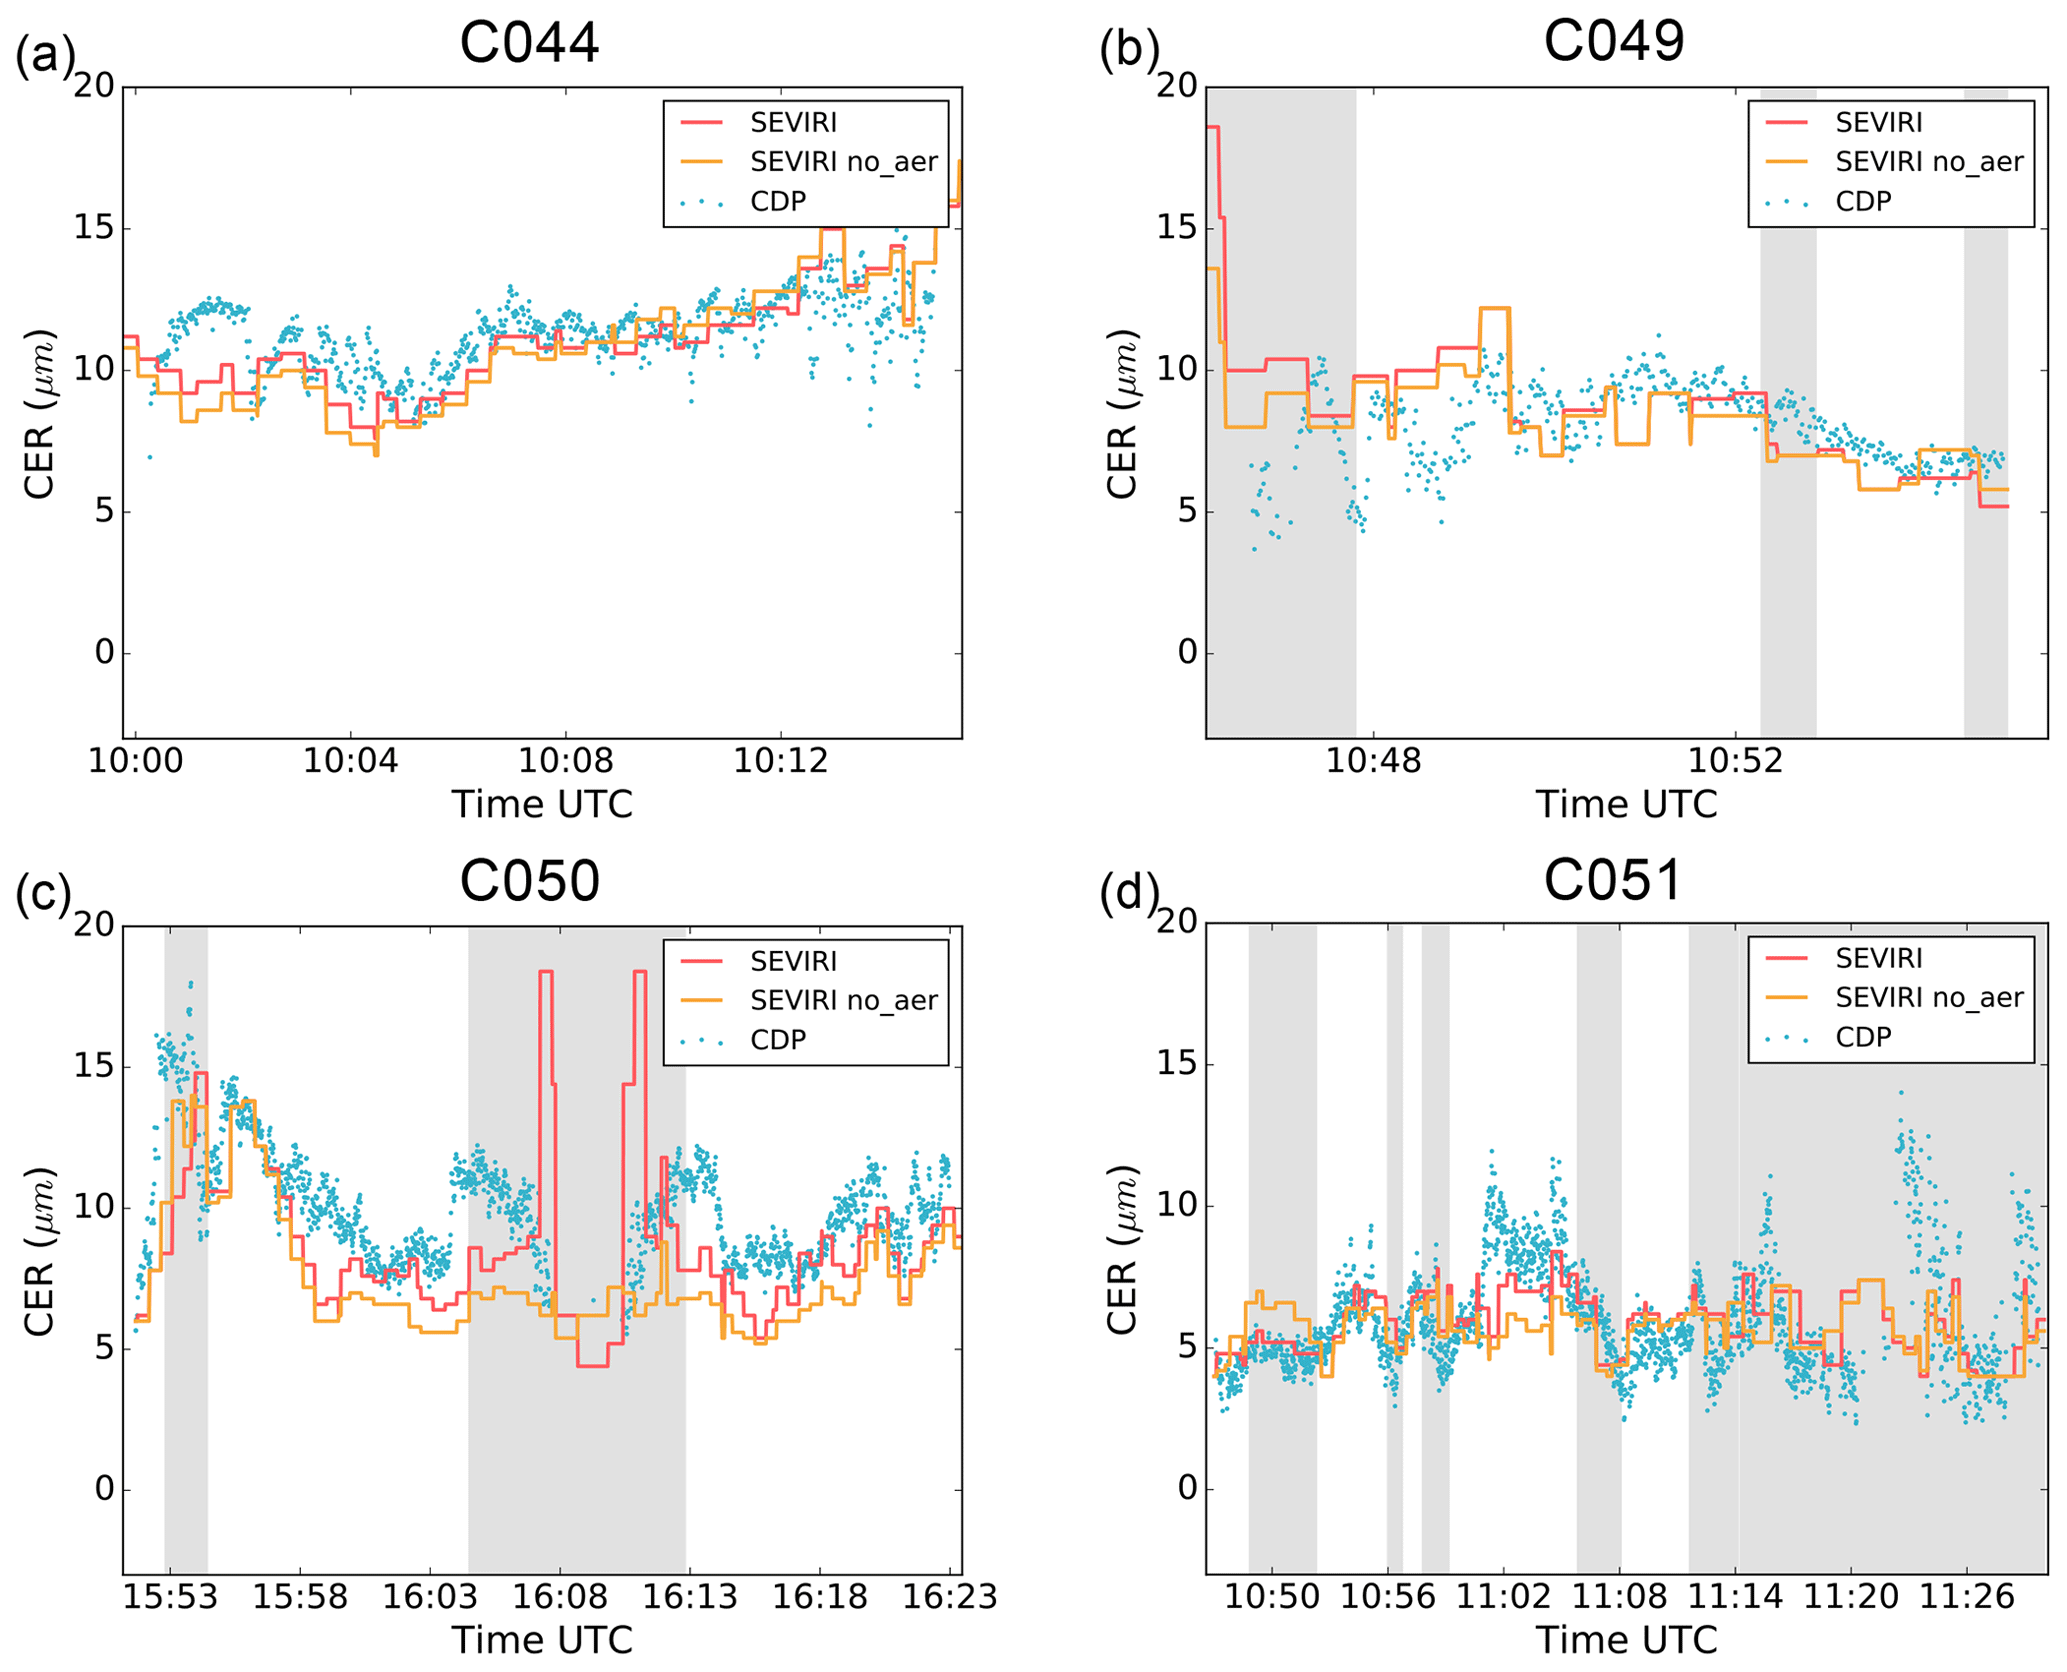
Figure 10Comparison of the CER measured by the CDP during the straight level run through clouds from flights C044 (a), C049 (b), C050 (c) and C051 (d) and the collocated SEVIRI retrievals with and without taking into account the absorption of aerosol above clouds. The grey areas correspond to the SEVIRI pixels that are rejected because of the filters on cloud inhomogeneity, cloud edges and/or unsatisfying fit of the measurements by the forward model.
3.4.2 Liquid water path (LWP)
The LWP has been retrieved using the microwave measurements from the MARSS instrument during the lower-altitude straight level runs of the Z-patterns. The dominant cloud regime around Ascension Island typically consists of a stratocumulus layer above shallow cumulus (Zhang and Zuidema, 2019). For the flights selected here, the CDP measurements from the vertical profiles indicate that the shallow cumulus layer consisted of smaller droplets than the upper stratocumulus and that the liquid water content increases with height. Considering an adiabatic cloud, the LWP from SEVIRI is derived from the retrieved COT and CER using the following relationship:
where ρl is the density of liquid water. It should be noted that the effective radius at the cloud top is expected to be slightly larger than the CER retrieved by SEVIRI because of penetration depth effects (Platnick, 2000), which could lead to a small underestimation of the LWP from SEVIRI. It is also important to add that the MARSS retrieval makes no distinction between cloud liquid and precipitation and returns the total liquid water path. On the other hand, the LWP obtained from SEVIRI does not account for precipitation. Therefore, the LWP from MARSS is expected to be larger than SEVIRI in the presence of rain and drizzle drops.
Although the aircraft measurements are collocated with the closest SEVIRI retrieval in space and time, the cloud field is expected to change between consecutive SEVIRI observations. To optimize the analysis against the satellite retrieval, we have selected the flights for which the cloud field changed the least between the observations from the top and the bottom leg of the Z-pattern by visual inspection of the radiometer signal.
Figure 11a, b and c show the LWP from MARSS (blue) and from the SEVIRI above-cloud-aerosol algorithm (red) against the time (UTC) of the aircraft measurements for the flights C042, C049 and C050. Additionally, the LWP from SEVIRI is plotted against the MARSS retrieval in Fig. S7 in the Supplement. Although a moderate correlation is obtained (R = 0.56 in Fig. S7), similarities can be observed between the variations in LWPMARSS and LWPSEVIRI. The observations during the C042 transect contain two main features: the first one is detected by MARSS and SEVIRI between 10:06 and 10:11 UTC while the second one (between 10:12 and 10:17 UTC) appears slightly earlier in the satellite retrieval. The collocated LWPSEVIRI also seems to be shifted to an earlier time by about 1 min compared to MARSS for C049 and C050. Differences are also observed, notably during C050 (Fig. 11c) between 15:27 and 15:30 UTC where LWPMARSS ranges from 100 to 170 g m−2 and LWPSEVIRI is around 45 g m−2. Such discrepancies and shifts can be introduced by the differences in sampling time between the aircraft and the SEVIRI snapshot. We also note the large range of values obtained by MARSS, with LWP up to 868 g m−2. Such a high LWP translates into a COT of 156 for a CER of 10 µm. On the other hand, the maximum LWP reached by the satellite retrieval is much lower, with a value of 514 g m−2. It should be noted that the COT upper bound in the look-up tables used for the SEVIRI algorithm has been set to 80 for computational efficiency. However, the proportion of clouds with COT larger than 80 is expected to be negligible on the regional scale as 99 % of the SEVIRI observations used in Fig. 3b have a COT lower than 40. An underestimation of the COT due to the plane-parallel bias (Cahalan et al., 1994; Szczap et al., 2000) can also cause lower LWP in the satellite observations. Moreover, the peaks of LWP from MARSS and the overall larger values than SEVIRI could also be attributed to the contribution of drizzle and precipitation which is not accounted for in the LWP derived from the satellite. In-flight visual observations report drizzle during the three flights, and droplets with an effective radius larger than 100 µm were detected by a two-dimensional stereo probe during C049 and C050. There is no clear evidence of precipitation in the measurements from the vertical profiles, but it is difficult to completely discount this type of local precipitation events during the long runs above cloud top that were performed with MARSS. Considering the time mismatch issues and the technical limits of the algorithm, there is a very satisfactory agreement between the LWP retrieved from the above-cloud-aerosol retrieval and the aircraft observations.
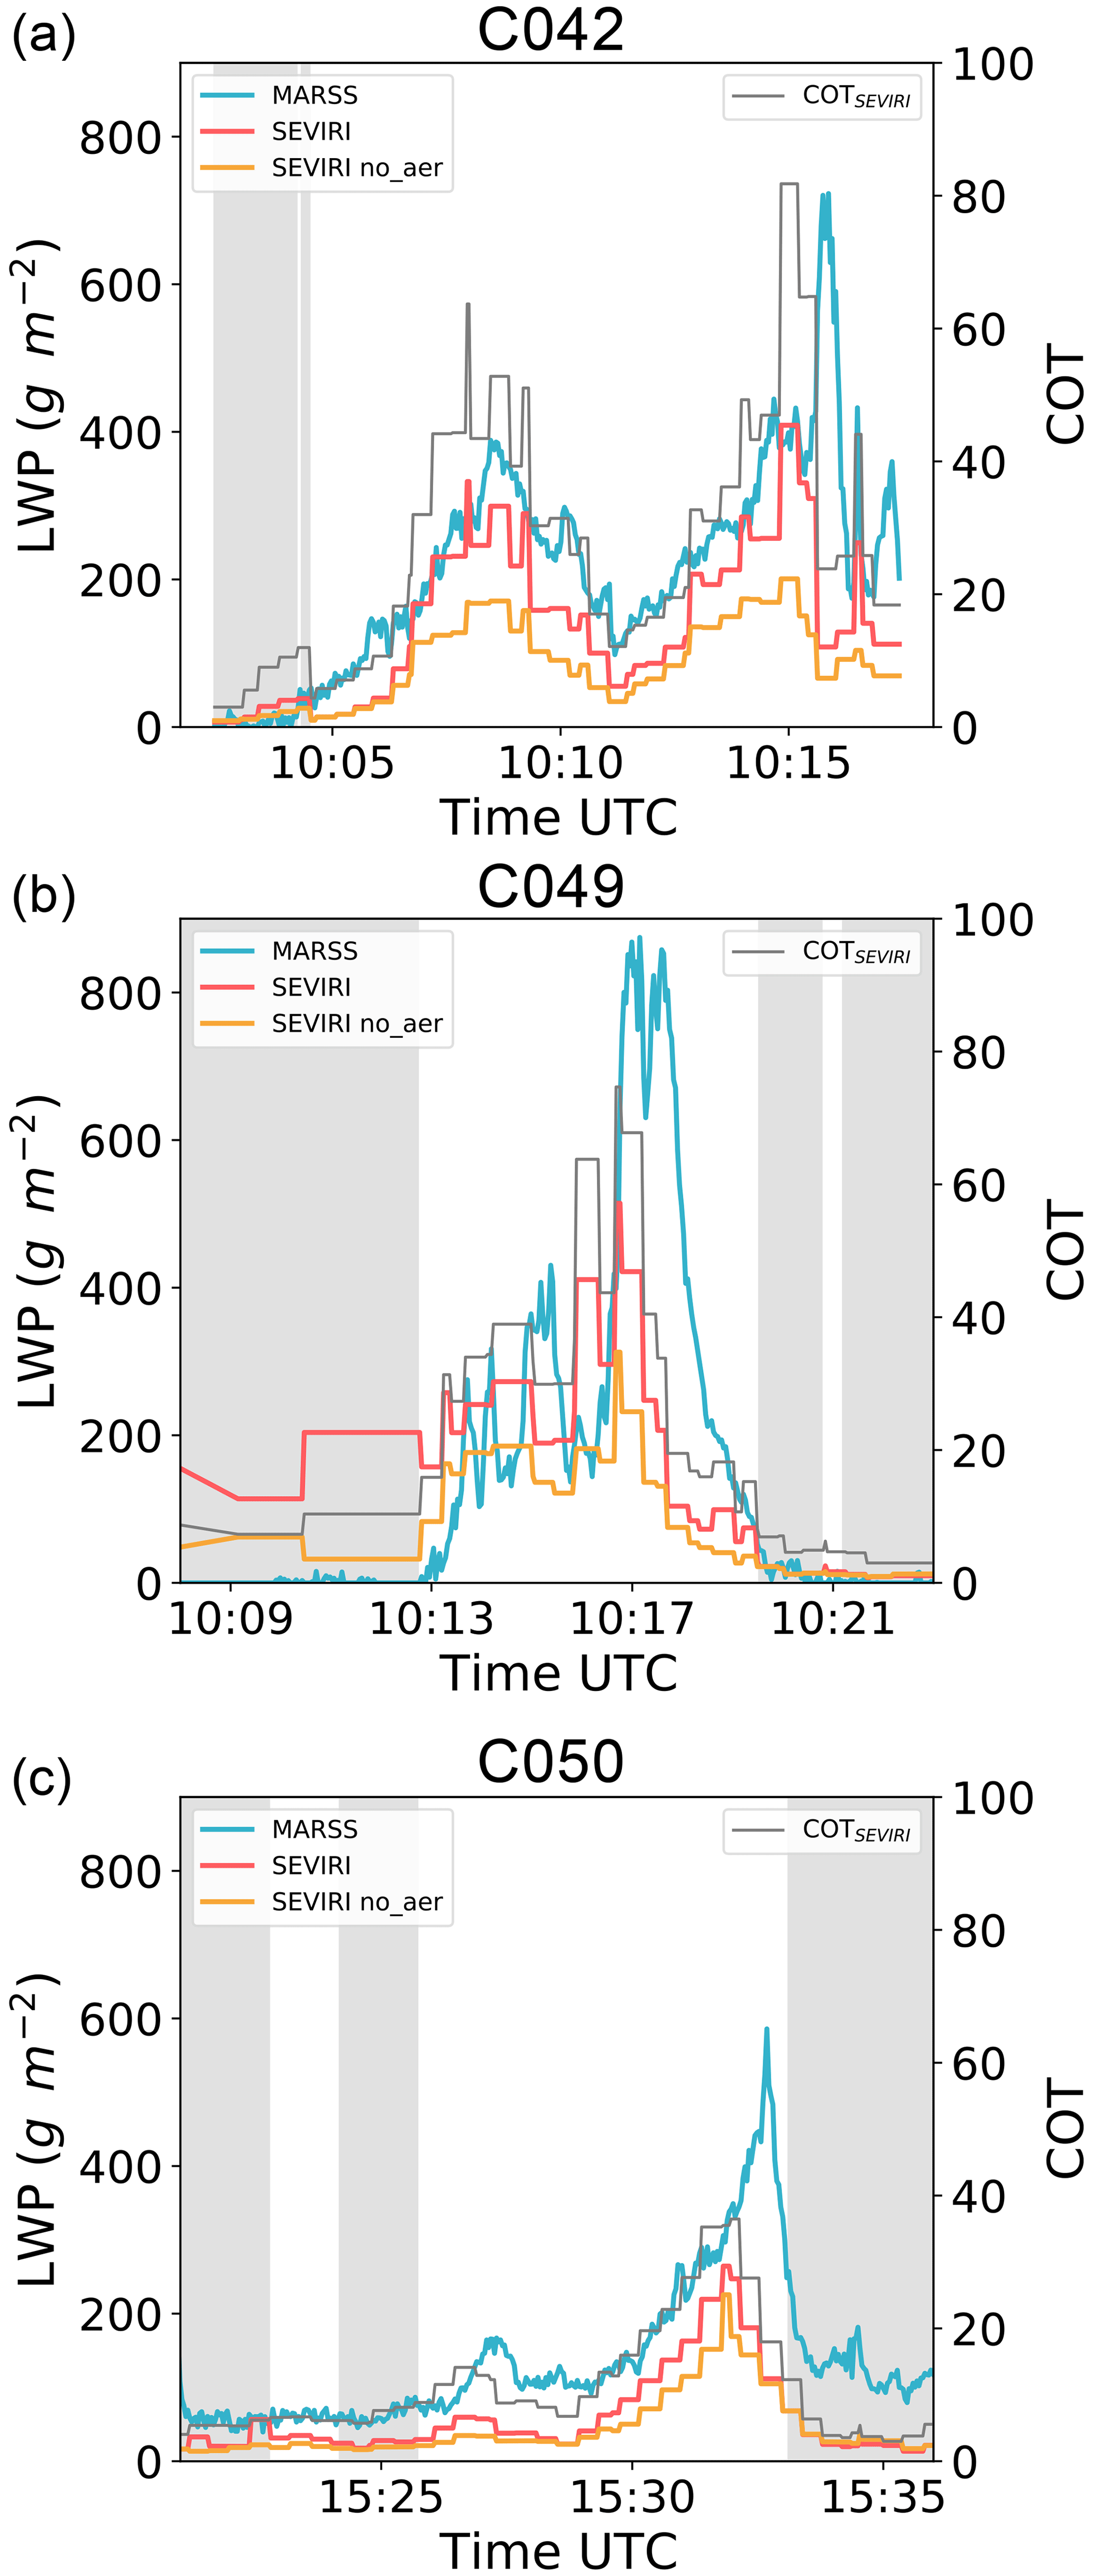
Figure 11Comparison of the LWP measured from MARSS (blue) during straight level run above the clouds from flights C042 (a), C049 (b) and C050 (c) and collocated LWP from SEVIRI calculated based on the COT and CER retrieved with (red) and without (orange) taking into account the absorption of aerosol above clouds. The COT retrieved by SEVIRI taking into account the overlying aerosols is plotted in black. The grey areas correspond to the SEVIRI pixels that are rejected because of the filters on cloud inhomogeneity, cloud edges and/or unsatisfying fit of the measurements by the forward model.
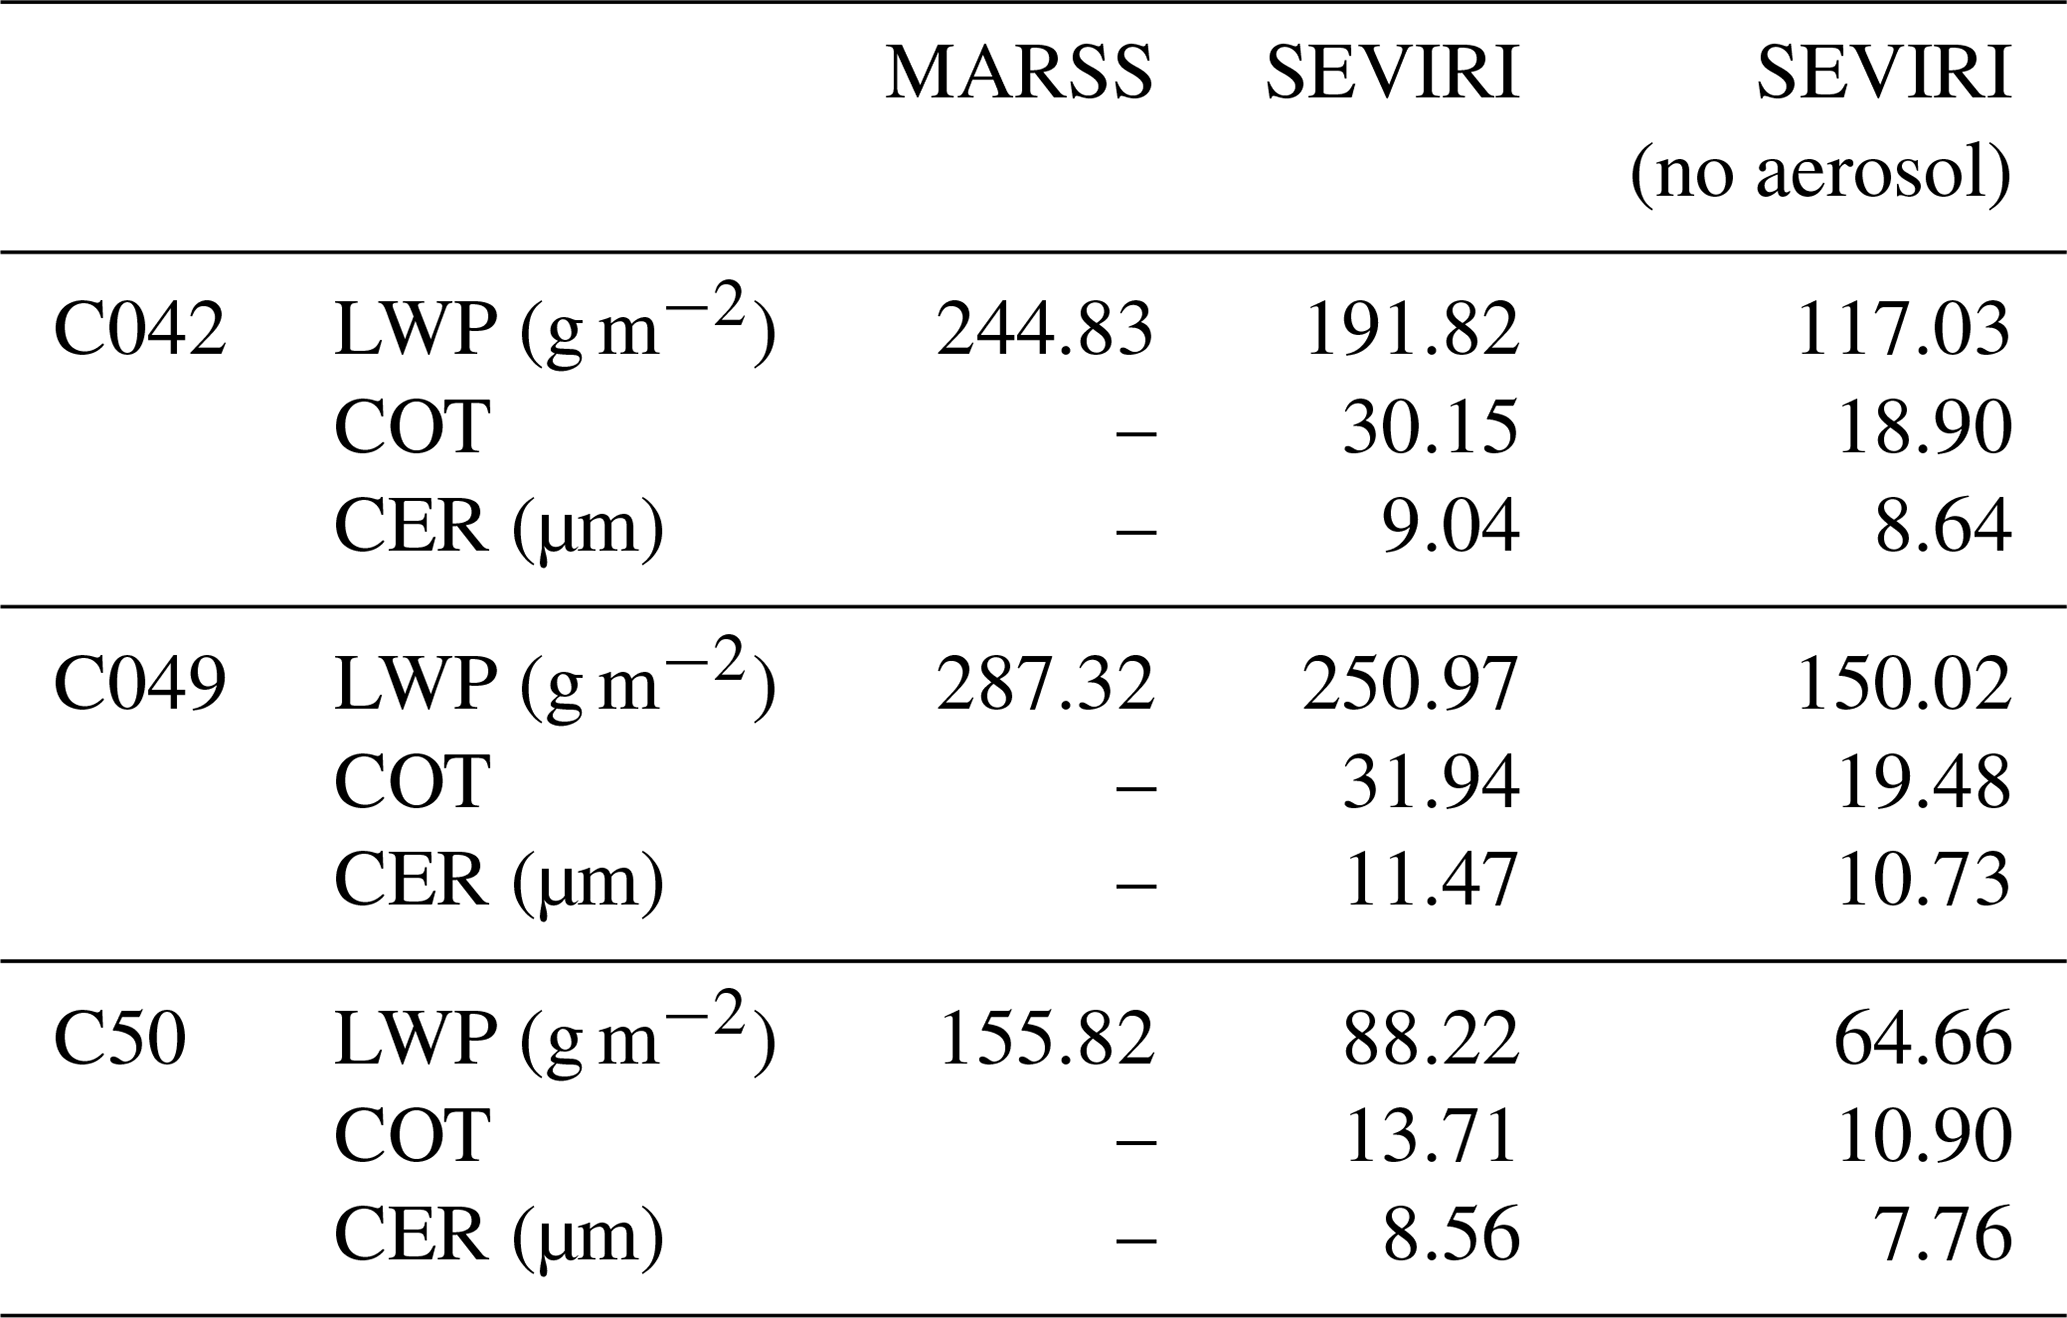
The LWP retrieved by SEVIRI when the above-cloud AOT is forced to 0 is shown in Fig. 11 in orange. As expected, omitting the presence of absorbing aerosol leads to an underestimation of the LWP from the passive remote sensing instrument (e.g. Haywood et al., 2004), with a mean bias of 55.8 g m−2. Table 3 compares the mean LWP from MARSS and SEVIRI for each flight as well as the mean COT and CER retrieved from satellite with and without taking into account the aerosol absorption above the clouds. The impact of the biomass burning aerosol on the CER retrieval is lower than 0.8 µm and therefore represents only a small fraction of the bias on the LWP. However, the “no-aerosol” retrieval underestimates the COT by 34.7 % compared to the above-cloud aerosol algorithm, which accounts for 93.2 % of the bias on the retrieved LWP.
Table 3Mean LWP observed by MARSS during the straight level run above the clouds and collocated cloud properties retrieved by SEVIRI with and without taking into account the absorption of aerosol above clouds.
The objective of this paper is to assess the performance of the SEVIRI retrieval of aerosol and cloud properties in cases where aerosols overlie clouds. The first part of the exercise consisted of the intercomparison of the MODIS and the SEVIRI products. Although both algorithms rely on the colour-ratio effect, the analysis shows the impact of the satellite instrument characteristics and the choice of the aerosol model assumption on the retrieved aerosol and cloud properties. The above-cloud AOT from SEVIRI is found to be lower than MODIS by 20.3 %. This is mainly attributed to the fact that the aerosol model assumed for the SEVIRI retrieval is more absorbing than MODIS. Regarding the cloud properties, a very good agreement is observed on the COT while the CER from SEVIRI is consistently smaller than MODIS by 2.2 µm. The latter is partly explained by the difference of spectral band used for the retrieval (i.e. 1.64 µm for SEVIRI and 2.1 µm for MODIS), which implies different penetration depths of the photons inside the clouds.
Secondly, the SEVIRI products have been validated against a set of in situ and remote sensing measurements from a research aircraft platform during the CLARIFY-2017 field campaign. Water vapour profiles from dropsondes were used to evaluate the atmospheric correction scheme. The analysis has revealed that the algorithm tends to overestimate the amount of water vapour above clouds around the CLARIFY-2017 region, which should lead to an overestimation of the AOT. The comparison of the measured profiles with the forecast revealed that the overestimation of the water vapour above cloud is caused by an underestimation of the cloud-top height retrieved by SEVIRI by an altitude of 260 m on average. Comparison of the absorbing AOT from SEVIRI and MODIS suggests that the accuracy of the atmospheric correction scheme is likely to be better closer to the coast, where the largest amounts of biomass burning aerosols are observed.
The AOT was calculated above clouds based on the extinction profiles from EXSCALABAR for eight flights. The satellite retrieval is found to overestimate the AOT when the sampled aerosols are more absorbing than the assumed aerosol model, but a better agreement is obtained on the above-cloud AAOT. We also observed an overestimation of the AOT in a case where measurements suggest interaction between aerosol and cloud droplets. The CER from SEVIRI has been validated against the cloud droplet size measured by the aircraft-mounted CDP. The LWP has been calculated from the COT and CER retrieved from SEVIRI and compared to the microwave measurements from MARSS. The main cause of discrepancies in the cloud properties appears to be the temporal mismatch between SEVIRI and the aircraft measurements.
Although the variations in the satellite LWP follow those of the aircraft observations, the LWP obtained from SEVIRI is typically smaller than the measurements from MARSS. The drizzle observed during these flights partly explains this discrepancy as the LWP from SEVIRI does not account for drizzle and rain while the MARSS instrument does. An underestimation of the LWP due to an underestimation of the COT by SEVIRI can also be expected in the case of extremely large LWPs (i.e. > 600 g m−2) because the algorithm is limited to a COT of 80. Given the limitations inherent to this validation exercise and the technical restrictions of the retrieval, a good agreement has been observed between the satellite products and the aircraft measurements. As expected, biases are observed on the cloud properties retrieved without considering the aerosol absorption above cloud, notably on the COT, which accounts for 93 % of the low bias obtained on the LWP.
Validation and intercomparison exercises are necessary to provide confidence in the satellite-based retrievals and to understand their limitations. In the present paper, we have identified two main sources of uncertainty on the SEVIRI above-cloud-aerosol products: the accuracy of the atmospheric correction and the assumed microphysical model of aerosol, especially the SSA. For the former, the overall agreement between MODIS and SEVIRI shows that the atmospheric correction method relying on model forecast humidities appears satisfactory. Although its accuracy decreases far from the coast, the use of the water vapour profiles from the forecast is a significant improvement compared to the use of simple standard atmosphere climatological values.
Regarding the assumed microphysical properties of the aerosol, the recent field campaigns (Zuidema et al., 2018; Pistone et al., 2019; Taylor et al., 2020; Wu et al., 2020) have examined the variability of the SSA of biomass burning aerosol over the SEAO. Although the aerosol model used for the retrieval is based on in situ observations from CLARIFY-2017, using a single aerosol model to retrieve the above-cloud AOT is a limitation. However, accounting for the variability of the aerosol microphysical properties in current satellite retrievals is not currently possible. Given the algorithmic assumptions and the technical limitations, the consistency observed between SEVIRI, MODIS and the airborne measurements is encouraging, which indicates that the geostationary instrument is able to provide complementary information on aerosols above clouds. These high-temporal-resolution observations would significantly enhance our knowledge on the aerosol interaction with both radiation and cloud as well as the aerosol transport in a region associated with the largest inter-model differences. The longitudinal variations in AAOT caused by inaccuracies in the atmospheric correction are unlikely to cause significant problems in assessing the temporal evolution of biomass burning aerosol plume radiative forcing over short timescales, but they need to be borne in mind when assessing longer-range plume transport.
The validation of a satellite retrieval needs a large number of observations, and the analysis presented here can be considered as a first step in an ongoing continuous effort. Other datasets, such as the measurements from ORACLES and AEROCLO-sA field campaigns, can help to further assess the accuracy of the algorithm and will be the subject of future work.
The SEVIRI data used for this study are available from the corresponding author, Fanny Peers, upon reasonable request. MODIS above-cloud data products are available from Kerry G. Meyer (kerry.meyer@nasa.gov) upon request. The FAAM aircraft data are available at the Centre for Environmental Data Analysis from http://data.ceda.ac.uk/badc/faam/data/ (CEDA, 2021).
The supplement related to this article is available online at: https://doi.org/10.5194/acp-21-3235-2021-supplement.
FP, PF and JMH developed the concept and the ideas for this paper. PF implemented the atmospheric correction scheme and FP the SEVIRI retrieval algorithm. The SEVIRI products have been processed by FP. KGM and SEP developed the MOD06ACAERO retrieval and generated the MODIS data. CF, FP, IC, JML, KNB, MIC, NWD, PAB, SJA and JMH were involved in the operational flying during the campaign as mission scientists or operators of non-core instrumentation. Post-deployment analysis of observational and model data was carried out by CF, FP, IC, JML, KNB, KS, MIC, NWD, PAB, SF, SJA and JMH. FP carried out the analysis and prepared the paper with contributions from all co-authors.
The authors declare that they have no conflict of interest.
This article is part of the special issue “New observations and related modelling studies of the aerosol–cloud–climate system in the Southeast Atlantic and southern Africa regions (ACP/AMT inter-journal SI)”. It is not associated with a conference.
We thank the Natural Environment Research Council (NERC) and the Norwegian Research Council for their financial support. Airborne data were obtained using the BAe-146 Atmospheric Research Aircraft operated by Directflight Ltd. and managed by the Facility for Airborne Atmospheric Measurements (FAAM), which is jointly supported by NERC and the Met Office.
This research has been supported by the Natural Environment Research Council (NERC) via the CLARIFY-2017 project (grant no. NE/L013479/1) and the Research Council of Norway via the projects AC/BC (grant no. 240372) and NetBC (grant no. 244141).
This paper was edited by Paquita Zuidema and reviewed by Zhibo Zhang and two anonymous referees.
Abel, S. J., Boutle, I. A., Waite, K., Fox, S., Brown, P. R., Cotton, R., Lloyd, G., Choularton, T. W., and Bower, K. N.: The role of precipitation in controlling the transition from stratocumulus to cumulus clouds in a Northern Hemisphere cold-air outbreak, J. Atmos. Sci., 74, 2293–2314, https://doi.org/10.1175/JAS-D-16-0362.1, 2017.
Abel, S. J., Barrett, P. A., Zuidema, P., Zhang, J., Christensen, M., Peers, F., Taylor, J. W., Crawford, I., Bower, K. N., and Flynn, M.: Open cells exhibit weaker entrainment of free-tropospheric biomass burning aerosol into the south-east Atlantic boundary layer, Atmos. Chem. Phys., 20, 4059–4084, https://doi.org/10.5194/acp-20-4059-2020, 2020.
Arduini, R., Minnis, P., Smith Jr., W., Ayers, J., Khaiyer, M., and Heck, P.: Sensitivity of satellite-retrieved cloud properties to the effective variance of cloud droplet size distribution, Technical Report, Science Applications International Corporation, Hampton, VA, USA, available at: https://www.arm.gov/publications/proceedings/conf15/extended_abs/arduini_rf.pdf (last access: 15 February 2021), 2005.
Brown, A., Milton, S., Cullen, M., Golding, B., Mitchell, J., and Shelly, A.: Unified modeling and prediction of weather and climate: A 25-year journey, B. Am. Meteorol. Soc., 93, 1865–1877, https://doi.org/10.1175/BAMS-D-12-00018.1, 2012.
Buehler, S. A., Mendrok, J., Eriksson, P., Perrin, A., Larsson, R., and Lemke, O.: ARTS, the Atmospheric Radiative Transfer Simulator – version 2.2, the planetary toolbox edition, Geosci. Model Dev., 11, 1537–1556, https://doi.org/10.5194/gmd-11-1537-2018, 2018.
Cahalan, R. F., Ridgway, W., Wiscombe, W. J., Bell, T. L., and Snider, J. B.: The Albedo of Fractal Stratocumulus Clouds, J. Atmos. Sci., 51, 2434–2455, https://doi.org/10.1175/1520-0469(1994)051<2434:TAOFSC>2.0.CO;2, 1994.
Centre for Environmental Data (CEDA): Facility for Airborne Atmospheric Measurements (FAAM) flights, available at: http://data.ceda.ac.uk/badc/faam/data/, last access: 15 February 2021.
Chand, D., Anderson, T., Wood, R., Charlson, R., Hu, Y., Liu, Z., and Vaughan, M.: Quantifying above-cloud aerosol using spaceborne lidar for improved understanding of cloudy-sky direct climate forcing, J. Geophys. Res.-Atmos., 113, D13206, https://doi.org/10.1029/2007JD009433, 2008.
Chang, I. and Christopher, S. A.: Identifying Absorbing Aerosols Above Clouds From the Spinning Enhanced Visible and Infrared Imager Coupled With NASA A-Train Multiple Sensors, IEEE T. Geosci. Remote, 54, 3163–3173, https://doi.org/10.1109/TGRS.2015.2513015, 2016.
Cotterell, M. I., Orr-Ewing, A. J., Szpek, K., Haywood, J. M., and Langridge, J. M.: The impact of bath gas composition on the calibration of photoacoustic spectrometers with ozone at discrete visible wavelengths spanning the Chappuis band, Atmos. Meas. Tech., 12, 2371–2385, https://doi.org/10.5194/amt-12-2371-2019, 2019a.
Cotterell, M. I., Ward, G. P., Hibbins, A. P., Haywood, J. M., Wilson, A., and Langridge, J. M.: Optimizing the performance of aerosol photoacoustic cells using a finite element model. Part 1: Method validation and application to single-resonator multipass cells, Aerosol Sci. Tech., 53, 1107–1127, https://doi.org/10.1080/02786826.2019.1650161, 2019b.
Davies, N. W., Cotterell, M. I., Fox, C., Szpek, K., Haywood, J. M., and Langridge, J. M.: On the accuracy of aerosol photoacoustic spectrometer calibrations using absorption by ozone, Atmos. Meas. Tech., 11, 2313–2324, https://doi.org/10.5194/amt-11-2313-2018, 2018.
Davies, N. W., Fox, C., Szpek, K., Cotterell, M. I., Taylor, J. W., Allan, J. D., Williams, P. I., Trembath, J., Haywood, J. M., and Langridge, J. M.: Evaluating biases in filter-based aerosol absorption measurements using photoacoustic spectroscopy, Atmos. Meas. Tech., 12, 3417–3434, https://doi.org/10.5194/amt-12-3417-2019, 2019.
Deaconu, L. T., Waquet, F., Josset, D., Ferlay, N., Peers, F., Thieuleux, F., Ducos, F., Pascal, N., Tanré, D., Pelon, J., and Goloub, P.: Consistency of aerosols above clouds characterization from A-Train active and passive measurements, Atmos. Meas. Tech., 10, 3499–3523, https://doi.org/10.5194/amt-10-3499-2017, 2017.
de Graaf, M., Tilstra, L. G., Wang, P., and Stammes, P.: Retrieval of the aerosol direct radiative effect over clouds from spaceborne spectrometry, J. Geophys. Res.-Atmos., 117, D07207, https://doi.org/10.1029/2011JD017160, 2012.
de Graaf, M., Tilstra, L. G., and Stammes, P.: Aerosol direct radiative effect over clouds from a synergy of Ozone Monitoring Instrument (OMI) and Moderate Resolution Imaging Spectroradiometer (MODIS) reflectances, Atmos. Meas. Tech., 12, 5119–5135, https://doi.org/10.5194/amt-12-5119-2019, 2019.
de Graaf, M., Schulte, R., Peers, F., Waquet, F., Tilstra, L. G., and Stammes, P.: Comparison of south-east Atlantic aerosol direct radiative effect over clouds from SCIAMACHY, POLDER and OMI–MODIS, Atmos. Chem. Phys., 20, 6707–6723, https://doi.org/10.5194/acp-20-6707-2020, 2020.
Diamond, M. S., Dobracki, A., Freitag, S., Small Griswold, J. D., Heikkila, A., Howell, S. G., Kacarab, M. E., Podolske, J. R., Saide, P. E., and Wood, R.: Time-dependent entrainment of smoke presents an observational challenge for assessing aerosol–cloud interactions over the southeast Atlantic Ocean, Atmos. Chem. Phys., 18, 14623–14636, https://doi.org/10.5194/acp-18-14623-2018, 2018.
Eck, T. F., Holben, B. N., Ward, D. E., Mukelabai, M. M., Dubovik, O., Smirnov, A., Schafer, J. S., Hsu, N. C., Piketh, S. J., Queface, A., Roux, J. L., Swap, R. J., and Slutsker, I.: Variability of biomass burning aerosol optical characteristics in southern Africa during the SAFARI 2000 dry season campaign and a comparison of single scattering albedo estimates from radiometric measurements, J. Geophys. Res.-Atmos., 108, 8477, https://doi.org/10.1029/2002JD002321, 2003.
Ellison, W.: Permittivity of pure water, at standard atmospheric pressure, over the frequency range 0–25 THz and the temperature range 0–100 C, J. Phys. Chem. Ref. Data, 36, 1–18, https://doi.org/10.1063/1.2360986, 2007.
English, S.: Airborne radiometric observations of cloud liquid-water emission at 89 and 157 GHz: Application to retrieval of liquid-water path, Q. J. Roy. Meteor. Soc., 121, 1501–1524, https://doi.org/10.1002/qj.49712152702, 1995.
Formenti, P., D’Anna, B., Flamant, C., Mallet, M., Piketh, S. J., Schepanski, K., Waquet, F., Auriol, F., Brogniez, G., Burnet, F., Chaboureau, J., Chauvigné, A., Chazette, P., Denjean, C., Desboeufs, K., Doussin, J., Elguindi, N., Feuerstein, S., Gaetani, M., Giorio, C., Klopper, D., Mallet, M. D., Nabat, P., Monod, A., Solmon, F., Namwoonde, A., Chikwililwa, C., Mushi, R., Welton, E. J., and Holben, B.: The Aerosols, Radiation and Clouds in southern Africa (AEROCLO-sA) field campaign in Namibia: overview, illustrative observations and way forward, B. Am. Meteorol. Soc., 100, 1277–1298, https://doi.org/10.1175/BAMS-D-17-0278.1, 2019.
Francis, P. N., Hocking, J. A., and Saunders, R. W.: Improved diagnosis of low-level cloud from MSG SEVIRI data for assimilation into Met Office limited area models, in: Proceedings of the 2008 EUMETSAT Meteorological Satellite Conference, 8–12 September 2008, Darmstadt, Germany, 2008.
Hamann, U., Walther, A., Baum, B., Bennartz, R., Bugliaro, L., Derrien, M., Francis, P. N., Heidinger, A., Joro, S., Kniffka, A., Le Gléau, H., Lockhoff, M., Lutz, H.-J., Meirink, J. F., Minnis, P., Palikonda, R., Roebeling, R., Thoss, A., Platnick, S., Watts, P., and Wind, G.: Remote sensing of cloud top pressure/height from SEVIRI: analysis of ten current retrieval algorithms, Atmos. Meas. Tech., 7, 2839–2867, https://doi.org/10.5194/amt-7-2839-2014, 2014.
Haywood, J. M., Osborne, S. R., and Abel, S. J.: The effect of overlying absorbing aerosol layers on remote sensing retrievals of cloud effective radius and cloud optical depth, Q. J. Roy. Meteor. Soc., 130, 779–800, https://doi.org/10.1256/qj.03.100, 2004.
Haywood, J. M., Abel, S. J., Barrett, P. A., Bellouin, N., Blyth, A., Bower, K. N., Brooks, M., Carslaw, K., Che, H., Coe, H., Cotterell, M. I., Crawford, I., Cui, Z., Davies, N., Dingley, B., Field, P., Formenti, P., Gordon, H., de Graaf, M., Herbert, R., Johnson, B., Jones, A. C., Langridge, J. M., Malavelle, F., Partridge, D. G., Peers, F., Redemann, J., Stier, P., Szpek, K., Taylor, J. W., Watson-Parris, D., Wood, R., Wu, H., and Zuidema, P.: The CLoud–Aerosol–Radiation Interaction and Forcing: Year 2017 (CLARIFY-2017) measurement campaign, Atmos. Chem. Phys., 21, 1049–1084, https://doi.org/10.5194/acp-21-1049-2021, 2021.
Hu, Y., Vaughan, M., Liu, Z., Powell, K., and Rodier, S.: Retrieving optical depths and lidar ratios for transparent layers above opaque water clouds from CALIPSO lidar measurements, IEEE Geosci. Remote S., 4, 523–526, https://doi.org/10.1109/LGRS.2007.901085, 2007.
Jethva, H., Torres, O., Remer, L. A., and Bhartia, P. K.: A Color Ratio Method for Simultaneous Retrieval of Aerosol and Cloud Optical Thickness of Above-Cloud Absorbing Aerosols From Passive Sensors: Application to MODIS Measurements, IEEE T. Geosci. Remote, 51, 3862–3870, https://doi.org/10.1109/TGRS.2012.2230008, 2013.
Jethva, H., Torres, O., Waquet, F., Chand, D., and Hu, Y.: How do A-train sensors intercompare in the retrieval of above-cloud aerosol optical depth? A case study-based assessment, Geophys. Res. Lett., 41, 186–192, https://doi.org/10.1002/2013GL058405, 2014.
Jethva, H., Torres, O., Remer, L., Redemann, J., Livingston, J., Dunagan, S., Shinozuka, Y., Kacenelenbogen, M., Rosenheimer, M. S., and Spurr, R.: Validating MODIS above-cloud aerosol optical depth retrieved from “color ratio” algorithm using direct measurements made by NASA's airborne AATS and 4STAR sensors, Atmos. Meas. Tech., 9, 5053–5062, https://doi.org/10.5194/amt-9-5053-2016, 2016.
Kacenelenbogen, M. S., Vaughan, M. A., Redemann, J., Young, S. A., Liu, Z., Hu, Y., Omar, A. H., LeBlanc, S., Shinozuka, Y., Livingston, J., Zhang, Q., and Powell, K. A.: Estimations of global shortwave direct aerosol radiative effects above opaque water clouds using a combination of A-Train satellite sensors, Atmos. Chem. Phys., 19, 4933–4962, https://doi.org/10.5194/acp-19-4933-2019, 2019.
Keil, A. and Haywood, J.: Solar radiative forcing by biomass aerosol particles over marine clouds during SAFARI-2000, J. Geophys. Res., 108, 8467, https://doi.org/10.1029/2002JD002315, 2003.
Levy, R. C., Remer, L. A., Tanre, D., Mattoo, S., and Kaufman, Y. J.: Algorithm for remote sensing of tropospheric aerosol over dark targets from MODIS, Collections 005 and 051, Revision 2 February 2009, MODIS algorithm theoretical basis document, 2009.
Liu, Q., Weng, F., and English, S. J.: An improved fast microwave water emissivity model, IEEE T. Geosci. Remote, 49, 1238–1250, https://doi.org/10.1109/TGRS.2010.2064779, 2010.
Liu, Z., Winker, D., Omar, A., Vaughan, M., Kar, J., Trepte, C., Hu, Y., and Schuster, G.: Evaluation of CALIOP 532 nm aerosol optical depth over opaque water clouds, Atmos. Chem. Phys., 15, 1265–1288, https://doi.org/10.5194/acp-15-1265-2015, 2015.
Magi, B. I. and Hobbs, P. V.: Effects of humidity on aerosols in southern Africa during the biomass burning season, J. Geophys. Res.-Atmos., 108, 8495, https://doi.org/10.1029/2002JD002144, 2003.
Marshak, A. and Davis, A.: 3D radiative transfer in cloudy atmospheres, Springer Science and Business Media, https://doi.org/10.1007/3-540-28519-9, 2005.
Marshak, A., Platnick, S., Várnai, T., Wen, G., and Cahalan, R. F.: Impact of three-dimensional radiative effects on satellite retrievals of cloud droplet sizes, J. Geophys. Res.-Atmos., 111, D09207, https://doi.org/10.1029/2005JD006686, 2006.
McClatchey, R. A., Fenn, R. W., Selby, J. A., Volz, F., and Garing, J.: Optical properties of the atmosphere, Technical Report, Air Force Cambridge Research Labs, Hanscom, MA, USA, 1972.
McGrath, A. and Hewison, T.: Measuring the accuracy of MARSS – An airborne microwave radiometer, J. Atmos. Ocean. Tech., 18, 2003–2012, https://doi.org/10.1175/1520-0426(2001)018<2003:MTAOMA>2.0.CO;2, 2001.
Meirink, J. F., Roebeling, R. A., and Stammes, P.: Inter-calibration of polar imager solar channels using SEVIRI, Atmos. Meas. Tech., 6, 2495–2508, https://doi.org/10.5194/amt-6-2495-2013, 2013.
Meyer, K., Platnick, S., and Zhang, Z.: Simultaneously inferring above-cloud absorbing aerosol optical thickness and underlying liquid phase cloud optical and microphysical properties using MODIS, J. Geophys. Res.-Atmos., 120, 5524–5547, https://doi.org/10.1002/2015JD023128, 2015.
Myhre, G., Samset, B. H., Schulz, M., Balkanski, Y., Bauer, S., Berntsen, T. K., Bian, H., Bellouin, N., Chin, M., Diehl, T., Easter, R. C., Feichter, J., Ghan, S. J., Hauglustaine, D., Iversen, T., Kinne, S., Kirkevåg, A., Lamarque, J.-F., Lin, G., Liu, X., Lund, M. T., Luo, G., Ma, X., van Noije, T., Penner, J. E., Rasch, P. J., Ruiz, A., Seland, Ø., Skeie, R. B., Stier, P., Takemura, T., Tsigaridis, K., Wang, P., Wang, Z., Xu, L., Yu, H., Yu, F., Yoon, J.-H., Zhang, K., Zhang, H., and Zhou, C.: Radiative forcing of the direct aerosol effect from AeroCom Phase II simulations, Atmos. Chem. Phys., 13, 1853–1877, https://doi.org/10.5194/acp-13-1853-2013, 2013.
Painemal, D. and Zuidema, P.: Assessment of MODIS cloud effective radius and optical thickness retrievals over the Southeast Pacific with VOCALS-REx in situ measurements, J. Geophys. Res.-Atmos., 116, D24206, https://doi.org/10.1029/2011JD016155, 2011.
Peers, F., Waquet, F., Cornet, C., Dubuisson, P., Ducos, F., Goloub, P., Szczap, F., Tanré, D., and Thieuleux, F.: Absorption of aerosols above clouds from POLDER/PARASOL measurements and estimation of their direct radiative effect, Atmos. Chem. Phys., 15, 4179–4196, https://doi.org/10.5194/acp-15-4179-2015, 2015.
Peers, F., Francis, P., Fox, C., Abel, S. J., Szpek, K., Cotterell, M. I., Davies, N. W., Langridge, J. M., Meyer, K. G., Platnick, S. E., and Haywood, J. M.: Observation of absorbing aerosols above clouds over the south-east Atlantic Ocean from the geostationary satellite SEVIRI – Part 1: Method description and sensitivity, Atmos. Chem. Phys., 19, 9595–9611, https://doi.org/10.5194/acp-19-9595-2019, 2019.
Pistone, K., Redemann, J., Doherty, S., Zuidema, P., Burton, S., Cairns, B., Cochrane, S., Ferrare, R., Flynn, C., Freitag, S., Howell, S. G., Kacenelenbogen, M., LeBlanc, S., Liu, X., Schmidt, K. S., Sedlacek III, A. J., Segal-Rozenhaimer, M., Shinozuka, Y., Stamnes, S., van Diedenhoven, B., Van Harten, G., and Xu, F.: Intercomparison of biomass burning aerosol optical properties from in situ and remote-sensing instruments in ORACLES-2016, Atmos. Chem. Phys., 19, 9181–9208, https://doi.org/10.5194/acp-19-9181-2019, 2019.
Platnick, S.: Vertical photon transport in cloud remote sensing problems, J. Geophys. Res.-Atmos., 105, 22919–22935, https://doi.org/10.1029/2000JD900333, 2000.
Platnick, S., King, M. D., Ackerman, S. A., Menzel, W. P., Baum, B. A., Riédi, J. C., and Frey, R. A.: The MODIS cloud products: Algorithms and examples from Terra, IEEE T. Geosci. Remote, 41, 459–473, https://doi.org/10.1109/TGRS.2002.808301, 2003.
Platnick, S., Ackerman, S., King, M., Meyer, K., Menzel, W., Holz, R., Baum, B., and Yang, P.: MODIS atmosphere L2 cloud product (06_L2), NASA MODIS Adaptive Processing System, Goddard Space Flight Center, Greenbelt, MD, USA, 2015.
Platnick, S., Heidinger, A., Ackerman, S. A., Amarasinghe, N., Dutcher, S., Frey, R., Hubanks, P., Li, Y., Marchant, B., Meyer, K. G., Holz, R. E., Walther, A., Wang, C., and Wind, G.: EOS MODIS and SNPP VIIRS Cloud Properties: User Guide for the Climate Data Record Continuity Level-2 Cloud Top and Optical Properties Product (CLDPROP), Technical Report, NASA Goddard Space Flight Center, Greenbelt, MD, USA, 2019.
Redemann, J., Wood, R., Zuidema, P., Doherty, S. J., Luna, B., LeBlanc, S. E., Diamond, M. S., Shinozuka, Y., Chang, I. Y., Ueyama, R., Pfister, L., Ryoo, J., Dobracki, A. N., da Silva, A. M., Longo, K. M., Kacenelenbogen, M. S., Flynn, C. J., Pistone, K., Knox, N. M., Piketh, S. J., Haywood, J. M., Formenti, P., Mallet, M., Stier, P., Ackerman, A. S., Bauer, S. E., Fridlind, A. M., Carmichael, G. R., Saide, P. E., Ferrada, G. A., Howell, S. G., Freitag, S., Cairns, B., Holben, B. N., Knobelspiesse, K. D., Tanelli, S., L'Ecuyer, T. S., Dzambo, A. M., Sy, O. O., McFarquhar, G. M., Poellot, M. R., Gupta, S., O'Brien, J. R., Nenes, A., Kacarab, M. E., Wong, J. P. S., Small-Griswold, J. D., Thornhill, K. L., Noone, D., Podolske, J. R., Schmidt, K. S., Pilewskie, P., Chen, H., Cochrane, S. P., Sedlacek, A. J., Lang, T. J., Stith, E., Segal-Rozenhaimer, M., Ferrare, R. A., Burton, S. P., Hostetler, C. A., Diner, D. J., Platnick, S. E., Myers, J. S., Meyer, K. G., Spangenberg, D. A., Maring, H., and Gao, L.: An overview of the ORACLES (ObseRvations of Aerosols above CLouds and their intEractionS) project: aerosol-cloud-radiation interactions in the Southeast Atlantic basin, Atmos. Chem. Phys. Discuss. [preprint], https://doi.org/10.5194/acp-2020-449, in review, 2020.
Rodgers, C. D.: Retrieval of atmospheric temperature and composition from remote measurements of thermal radiation, Rev. Geophys., 14, 609–624, https://doi.org/10.1029/RG014i004p00609, 1976.
Sayer, A. M., Hsu, N., Bettenhausen, C., Lee, J., Redemann, J., Schmid, B., and Shinozuka, Y.: Extending “Deep Blue” aerosol retrieval coverage to cases of absorbing aerosols above clouds: Sensitivity analysis and first case studies, J. Geophys. Res.-Atmos., 121, 4830–4854, https://doi.org/10.1002/2015JD024729, 2016.
Sayer, A. M., Hsu, N. C., Lee, J., Kim, W. V., Burton, S., Fenn, M. A., Ferrare, R. A., Kacenelenbogen, M., LeBlanc, S., Pistone, K., Redemann, J., Segal-Rozenhaimer, M., Shinozuka, Y., and Tsay, S.-C.: Two decades observing smoke above clouds in the south-eastern Atlantic Ocean: Deep Blue algorithm updates and validation with ORACLES field campaign data, Atmos. Meas. Tech., 12, 3595–3627, https://doi.org/10.5194/amt-12-3595-2019, 2019.
Seethala, C., Meirink, J. F., Horváth, Á., Bennartz, R., and Roebeling, R.: Evaluating the diurnal cycle of South Atlantic stratocumulus clouds as observed by MSG SEVIRI, Atmos. Chem. Phys., 18, 13283–13304, https://doi.org/10.5194/acp-18-13283-2018, 2018.
Seinfeld, J. H., Bretherton, C., Carslaw, K. S., Coe, H., DeMott, P. J., Dunlea, E. J., Feingold, G., Ghan, S., Guenther, A. B., Kahn, R., Kraucunas, I., Kreidenweis, S. M., Molina, M., Nenes, A., Penner, J. E., Prather, K. A., Ramanathan, V., Ramaswamy, V., Rasch, P. J., Ravishankara, A. R., Rosenfeld, D., Stephens, G., and Wood, R.: Improving our fundamental understanding of the role of aerosol-cloud interactions in the climate system, P. Natl. Acad. Sci., 113, 5781–5790, https://doi.org/10.1073/pnas.1514043113, 2016.
Szczap, F., Isaka, H., Saute, M., Guillemet, B., and Ioltukhovski, A.: Effective radiative properties of bounded cascade nonabsorbing clouds: Definition of the equivalent homogeneous cloud approximation, J. Geophys. Res.-Atmos., 105, 20617–20633, https://doi.org/10.1029/2000JD900146, 2000.
Taylor, J. W., Wu, H., Szpek, K., Bower, K., Crawford, I., Flynn, M. J., Williams, P. I., Dorsey, J., Langridge, J. M., Cotterell, M. I., Fox, C., Davies, N. W., Haywood, J. M., and Coe, H.: Absorption closure in highly aged biomass burning smoke, Atmos. Chem. Phys., 20, 11201–11221, https://doi.org/10.5194/acp-20-11201-2020, 2020.
Torres, O., Jethva, H., and Bhartia, P. K.: Retrieval of Aerosol Optical Depth above Clouds from OMI Observations: Sensitivity Analysis and Case Studies, J. Atmos. Sci., 69, 1037–1053, https://doi.org/10.1175/JAS-D-11-0130.1, 2012.
Twomey, S.: The influence of pollution on the shortwave albedo of clouds, J. Atmos. Sci., 34, 1149–1152, https://doi.org/10.1175/1520-0469(1977)034<1149:TIOPOT>2.0.CO;2, 1977.
Waquet, F., Peers, F., Ducos, F., Goloub, P., Platnick, S., Riedi, J., Tanré, D., and Thieuleux, F.: Global analysis of aerosol properties above clouds, Geophys. Res. Lett., 40, 5809–5814, https://doi.org/10.1002/2013GL057482, 2013.
Wilcox, E. M.: Direct and semi-direct radiative forcing of smoke aerosols over clouds, Atmos. Chem. Phys., 12, 139–149, https://doi.org/10.5194/acp-12-139-2012, 2012.
Wu, H., Taylor, J. W., Szpek, K., Langridge, J. M., Williams, P. I., Flynn, M., Allan, J. D., Abel, S. J., Pitt, J., Cotterell, M. I., Fox, C., Davies, N. W., Haywood, J., and Coe, H.: Vertical variability of the properties of highly aged biomass burning aerosol transported over the southeast Atlantic during CLARIFY-2017, Atmos. Chem. Phys., 20, 12697–12719, https://doi.org/10.5194/acp-20-12697-2020, 2020.
Zeng, S., Cornet, C., Parol, F., Riedi, J., and Thieuleux, F.: A better understanding of cloud optical thickness derived from the passive sensors MODIS/AQUA and POLDER/PARASOL in the A-Train constellation, Atmos. Chem. Phys., 12, 11245–11259, https://doi.org/10.5194/acp-12-11245-2012, 2012.
Zhang, J. and Zuidema, P.: The diurnal cycle of the smoky marine boundary layer observed during August in the remote southeast Atlantic, Atmos. Chem. Phys., 19, 14493–14516, https://doi.org/10.5194/acp-19-14493-2019, 2019.
Zhang, Z. and Platnick, S.: An assessment of differences between cloud effective particle radius retrievals for marine water clouds from three MODIS spectral bands, J. Geophys. Res., 116, D20215, https://doi.org/10.1029/2011JD016216, 2011.
Zhang, Z., Ackerman, A. S., Feingold, G., Platnick, S., Pincus, R., and Xue, H.: Effects of cloud horizontal inhomogeneity and drizzle on remote sensing of cloud droplet effective radius: Case studies based on large-eddy simulations, J. Geophys. Res.-Atmos., 117, D19208, https://doi.org/10.1029/2012JD017655, 2012.
Zhang, Z., Werner, F., Cho, H. M., Wind, G., Platnick, S., Ackerman, A. S., Di Girolamo, L., Marshak, A., and Meyer, K.: A framework based on 2-D Taylor expansion for quantifying the impacts of subpixel reflectance variance and covariance on cloud optical thickness and effective radius retrievals based on the bispectral method, J. Geophys. Res.-Atmos., 121, 7007–7025, https://doi.org/10.1002/2016jd024837, 2016a.
Zhang, Z., Meyer, K., Yu, H., Platnick, S., Colarco, P., Liu, Z., and Oreopoulos, L.: Shortwave direct radiative effects of above-cloud aerosols over global oceans derived from 8 years of CALIOP and MODIS observations, Atmos. Chem. Phys., 16, 2877–2900, https://doi.org/10.5194/acp-16-2877-2016, 2016b.
Zuidema, P., Leon, D., Pazmany, A., and Cadeddu, M.: Aircraft millimeter-wave passive sensing of cloud liquid water and water vapor during VOCALS-REx, Atmos. Chem. Phys., 12, 355–369, https://doi.org/10.5194/acp-12-355-2012, 2012.
Zuidema, P., Redemann, J., Haywood, J., Wood, R., Piketh, S., Hipondoka, M., and Formenti, P.: Smoke and clouds above the southeast Atlantic: Upcoming field campaigns probe absorbing aerosol's impact on climate, B. Am. Meteorol. Soc., 97, 1131–1135, https://doi.org/10.1175/BAMS-D-15-00082.1, 2016.
Zuidema, P., Sedlacek III, A. J., Flynn, C., Springston, S., Delgadillo, R., Zhang, J., Aiken, A. C., Koontz, A., and Muradyan, P.: The Ascension Island boundary layer in the remote southeast Atlantic is often smoky, Geophys. Res. Lett., 45, 4456–4465, https://doi.org/10.1002/2017GL076926, 2018.