the Creative Commons Attribution 4.0 License.
the Creative Commons Attribution 4.0 License.
 | 03 Mar 2021
First validation of GOME-2/MetOp absorbing aerosol height using EARLINET lidar observations
Konstantinos Michailidis
Maria-Elissavet Koukouli
Nikolaos Siomos
Dimitris Balis
Olaf Tuinder
L. Gijsbert Tilstra
Lucia Mona
Gelsomina Pappalardo
Daniele Bortoli
The aim of this study is to investigate the potential of the Global Ozone Monitoring Experiment-2 (GOME-2) instruments, aboard the Meteorological Operational (MetOp)-A, MetOp-B and MetOp-C satellite programme platforms, to deliver accurate geometrical features of lofted aerosol layers. For this purpose, we use archived ground-based lidar data from stations available from the European Aerosol Research Lidar Network (EARLINET) database. The data are post-processed using the wavelet covariance transform (WCT) method in order to extract geometrical features such as the planetary boundary layer (PBL) height and the cloud boundaries. To obtain a significant number of collocated and coincident GOME-2 – EARLINET cases for the period between January 2007 and September 2019, 13 lidar stations, distributed over different European latitudes, contributed to this validation. For the 172 carefully screened collocations, the mean bias was found to be −0.18 ± 1.68 km, with a near-Gaussian distribution. On a station basis, and with a couple of exceptions where very few collocations were found, their mean biases fall in the ± 1 km range with an associated standard deviation between 0.5 and 1.5 km. Considering the differences, mainly due to the temporal collocation and the difference, between the satellite pixel size and the point view of the ground-based observations, these results can be quite promising and demonstrate that stable and extended aerosol layers as captured by the satellite sensors are verified by the ground-based data. We further present an in-depth analysis of a strong and long-lasting Saharan dust intrusion over the Iberian Peninsula. We show that, for this well-developed and spatially well-spread aerosol layer, most GOME-2 retrievals fall within 1 km of the exact temporally collocated lidar observation for the entire range of 0 to 150 km radii. This finding further testifies for the capabilities of the MetOp-borne instruments to sense the atmospheric aerosol layer heights.
- Article
(13328 KB) - Full-text XML
- BibTeX
- EndNote


Aerosols are important constituents of the atmosphere, influencing both the air quality and the Earth's climate. They scatter and absorb solar and terrestrial radiation (direct effect), and can act as cloud condensation nuclei (CCN) in liquid water clouds (Bougiatioti et al., 2016; Georgoulias et al., 2020) and as ice-nucleating particles (INPs) in mixed-phase and ice clouds (indirect effect) (Seinfeld et al., 2016). Changes in their concentration affect cloud extent, lifetime, particle size and radiative properties (Ansmann et al., 2019; Laaksonen et al., 2020). However, the overall uncertainties in the radiative forcing effect of aerosols (anthropogenic and natural) still remain very high (IPCC, 2014). These uncertainties can only be reduced by better quantifying the vertical and horizontal distribution of aerosols over several stations. Knowledge of geometrical features of aerosol layers is essential for understanding the impact of aerosols on the climate system. The aerosol height quantification of smoke, dust, biomass burning aerosols and volcanic ash is a critical determinant of global aerosol transport and dispersion (Balis et al., 2016; Ansmann et al., 2018; Nanda et al., 2020). The spatial and temporal variation aerosol layer height is associated with the major aerosol sources and the atmospheric dynamics. Aerosol vertical distributions are affected by aerosol emissions and deposition processes, aerosol microphysical properties, meteorological conditions and chemical processes. Lidar aerosol vertical profiles provide an important means of evaluating and improving aerosol models. Atmospheric aerosol models are generally sensitive in the vertical distribution of aerosols with large regional variability (Kipling et al., 2016). In the framework of aviation safety, it is important to have accurate knowledge about the height of aerosol layers in the atmosphere since dust, biomass burning and ash particles can be transported over large distances away from their source, and so global monitoring is essential (e.g. Pappalardo et al., 2010, 2013; Balis et al., 2016; Soupiona et al., 2020, Adam et al., 2020).
There are several differences in the sensing principles between active and passive remote sensing of aerosols, specifically in terms of the vertical resolution. Lidar (light detection and ranging) remote sensing techniques can provide accurate vertical profiles of the aerosol backscatter and extinction coefficients, which are representative of aerosol load, with a vertical resolution of a few metres (Papayannis et al., 2008). Active remote sensing instruments, like lidars – that are part of the European Aerosol Research Lidar Network (EARLINET; Pappalardo et al., 2014) – have been used to distinguish between different aerosol types by providing vertical profiles of aerosol optical properties, as well to understand the three-dimensional structure and variability in time of the aerosol field (Amiridis et al., 2015; Ansmann et al., 2018; Voudouri et al., 2019). Although they provide great details in the vertical direction, lidar-measured aerosol profiles are subjected to limited spatial and temporal coverage. On the other hand, passive spaceborne remote sensing instrumentation has the ability to measure a specific point on Earth once a day for polar-orbiting satellite missions and several times in the day for geostationary missions. Polar satellites such as the Meteorological Operational (MetOp) satellite programme series offer the advantage of global and daily coverage and instruments such as Global Ozone Monitoring Experiment-2 (GOME-2) have already been used for aerosol detection (Hassinen et al., 2016). Therefore, combined studies based on ground-based lidars together with atmospheric satellites will allow full exploitation of these data for a detailed description of the temporal and spatial distribution and evolution on a global scale.
The only way to obtain the temporal and spatial variations of aerosol profiles on a global scale is through satellite remote sensing. Passive satellite remote sensing of aerosol layer height by far cannot provide the same details as active remote sensing techniques but adds an important extension compared to active remote sensing in terms of spatial coverage. Spaceborne lidars, such as the Cloud-Aerosol Lidar with Orthogonal Polarization (CALIOP) aboard the Cloud-Aerosol Lidar and Infrared Pathfinder Satellite Observation (CALIPSO; Winker et al., 2009), provide measurements of high spatial and temporal distributions of aerosol and clouds and their geometrical and optical properties (Vaughan et al., 2009). While CALIOP has excellent vertical resolution and has the ability to resolve the layer heights of multiple plumes in a single profile, its swath width is very narrow and has a 16 d global coverage compared to the passive sensors, which have daily global coverage. Several previous studies, different algorithms and sensitivity analyses have employed a variety of definitions of the aerosol height from passive instruments until now (Sun et al., 2019). Some important mentions of missions for aerosol layer height (ALH) retrieval are the Ozone Monitoring Instrument (OMI) aboard the NASA Aura satellite (Chimot et al., 2018), the Multi-angle Imaging SpectroRadiometer (MISR) aboard the NASA Terra satellite (Nelson et al., 2013), the Deep Space Climate Observatory (DSCOVR) mission with its Earth Polychromatic Imaging Camera (EPIC) (Xu et al., 2019) and currently the TROPOspheric Monitoring Instrument (TROPOMI) instrument aboard the Sentinel-5 Precursor satellite (Veefkind et al., 2012). Over the next years, missions like the upcoming Tropospheric Emissions: Monitoring Pollution mission (TEMPO) (Zoogman et al., 2017) and the Multi-Angle Imager for Aerosols (MAIA) mission (Davis et al., 2017) are expected to provide aerosol height retrievals as well. These instruments are examples of missions demonstrably more capable of retrieving aerosol layer height.
In this study, we provide a quantitative assessment of level-2 absorbing aerosol height product derived by GOME-2 aboard the MetOp platforms (Munro et al., 2016; Hassinen et al., 2016), using EARLINET lidar data as reference. Furthermore, a case study with several MetOp overpasses close to the EARLINET station of Évora, Portugal, (38.56∘ N, −7.91∘ E; 293 m a.s.l.) on 20–23 February 2017, is analysed to demonstrate the performance of the GOME-2 absorbing aerosol height (AAH) retrieval for a strong Saharan dust event. This paper is organized as follows. In Sect. 2, the GOME-2/MetOp satellite-borne instrument and the European Aerosol Research Lidar Network (EARLINET) are described. The data and methodology are briefly described in Sect. 3. In Sect. 4, the network-based intercomparison results between GOME-2 and EARLINET and a selected dust case are presented. Finally, Sect. 5 contains the summary and the conclusions of this article.
2.1 Description of the GOME-2 instrument
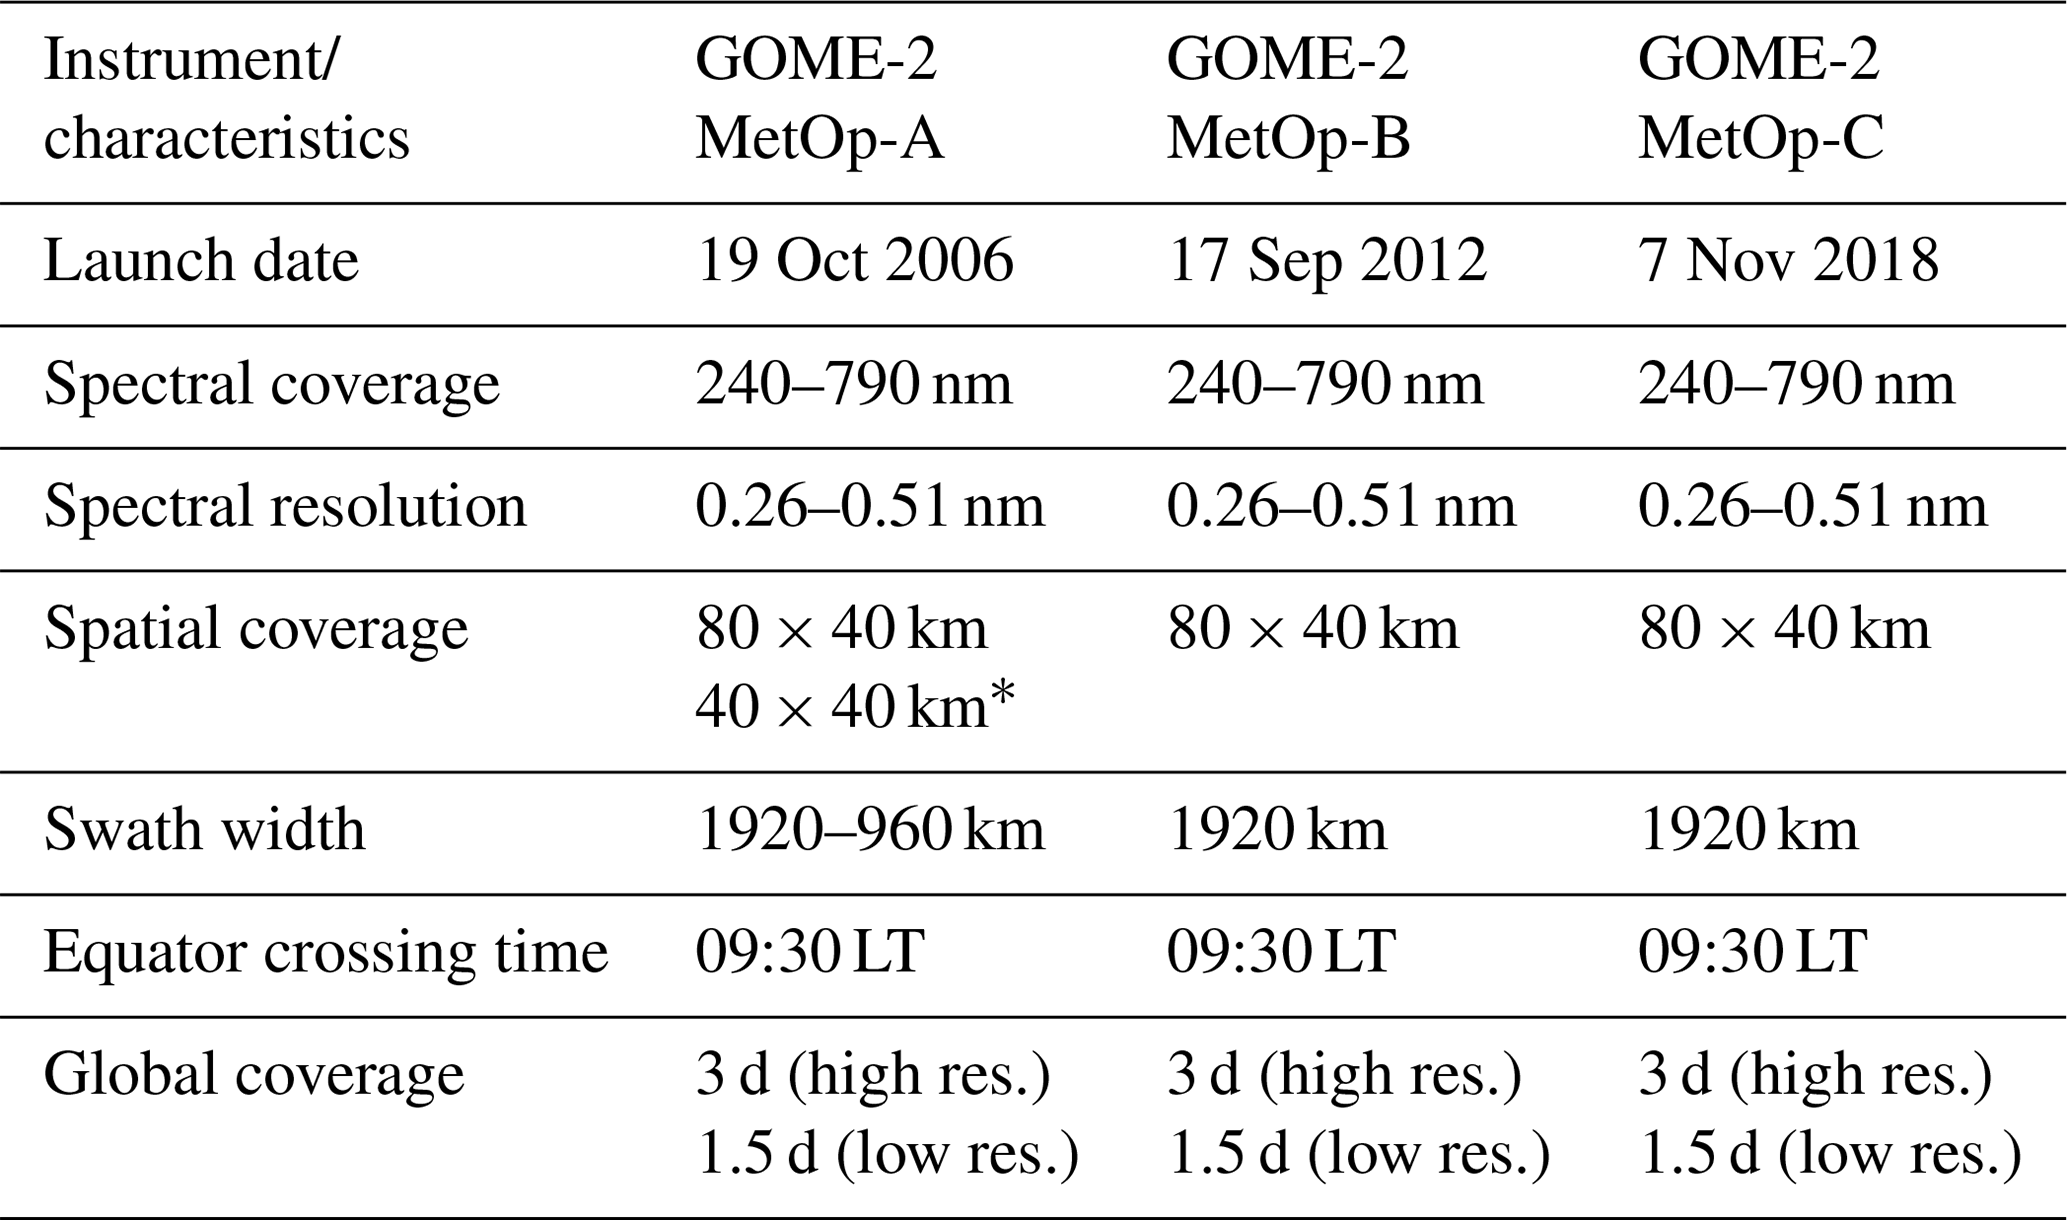
The GOME-2 instrument, aboard the MetOp-A, -B and -C platforms, is a UV–VIS–NIR (ultraviolet–visible–near-infrared) nadir-viewing scanning spectrometer, with an across-track scan time of 6 s and a nominal swath width of 1920 km, which provides global coverage of the sunlit part of the atmosphere within a period of approximately 1.5 d (Hassinen et al., 2016; Munro et al., 2016). The MetOp satellite series is the core element of the European Organization for the Exploitation of Meteorological Satellites (EUMETSAT) Polar System (EPS), developed in partnership with the European Space Agency (ESA). The primary GOME-2 instrument aboard MetOp performs equally well, and the main characteristics are listed in Table 1. The three GOME-2 instruments provide unique and long datasets for atmospheric research and applications. The complete mission time is expected to cover the 2007–2024 period. The AC SAF (Satellite Application Facility on Atmospheric Composition monitoring) is responsible for the development and distribution of the GOME-2 level-2 products accessed through the AC SAF web portal, https://acsaf.org/, last access: 12 February 2021.
Table 1Summary of the GOME-2 instrument main characteristics. The * indicates GOME-2A tandem operation starting from 15 July 2013.
2.2 The EARLINET network
The EARLINET network was founded in 2000 as a research project for establishing a quantitative, comprehensive and statistically significant database for the horizontal, vertical and temporal distribution of aerosols on a continental scale (Pappalardo et al., 2014). Since then, EARLINET has continued to provide the most extensive collection of ground-based data for the aerosol vertical distribution over Europe. EARLINET is one of the components of ACTRIS, the European Aerosol Clouds and Trace gases Research Infrastructure, now in its implementation phase. Within ACTRIS, many developments have been realized in EARLINET improving the quality assurance of the lidar systems and the quality control procedures of the lidar data (e.g. Freudenthaler et al., 2016, 2018). Additionally, improvements in retrieved products as well as advanced products have been developed through integration with observations from other ACTRIS components. The single calculus chain (SCC) is a major component of the ACTRIS Aerosol Remote Sensing Node (ARES) responsible for the curation and the processing of the ACTRIS aerosol remote sensing data (D'Amico et al., 2015; Mattis et al., 2016).
The geographical distribution of the lidar stations can be found on the EARLINET website (https://www.earlinet.org/index.php?id=105, last access: 12 February 2021). Aerosol lidar observations in the framework of EARLINET are performed according to a common schedule and on preselected dates. The schedule involves three measurements per week, namely one during daytime at around local noon on Monday at 14:00 ± 1 UTC and two during nighttime on Monday and Thursday at sunset +2 or 3 h to enable Raman extinction retrievals. Furthermore, observations are devoted to monitoring special events over the continent, such as Saharan dust outbreaks, forest fires, photochemical smog and volcanic eruptions (e.g. Amiridis et al., 2009; Sicard et al., 2011; Pappalardo et al., 2013; Fernández et al., 2019; Soupiona et al., 2018, 2019, 2020). EARLINET observations have already been used for climatological studies (e.g. Giannakaki et al., 2010; Siomos et al., 2018), long-range transport analysis (Ansmann et al., 2003; Papayannis et al., 2008) and aerosol characterization of dust forecast modelling (Perez et al., 2006; Mona et al., 2012, 2014), among others. Furthermore, retrieval algorithms related to aerosol microphysical properties were developed with real multi-wavelength lidar data (Müller et al., 2007; Tesche et al., 2008; Balis et al., 2010; Mamouri et al., 2012). So far, EARLINET represents an available tool for validation and exploitation of data from the CALIPSO (Winker et al., 2009) mission, and several studies have investigated the CALIPSO products (e.g. Mona et al., 2009; Pappalardo et al., 2010; Amiridis et al., 2015; Papagiannopoulos et al., 2016). Also, the multi-wavelength EARLINET data will be very useful for the validation of current and future satellite missions, such as the ESA Explorer missions Atmospheric Dynamics Mission – Aeolus (ADM-Aeolus), Sentinel-5 Precursor (S5P), Earth Clouds, Aerosols and Radiation Explorer (EarthCARE).
Some of the EARLINET systems perform 24/7 continuous measurements as, for example, the PollyXT systems (Baars et al., 2016; Engelmann et al., 2016). It hence follows that EARLINET consists of rather different lidar systems regarding the number of measured wavelengths and signal channels, the detection range, which is mainly determined by laser power and telescope size and number, the optical design and the electronic signal detection techniques. The majority of EARLINET stations are equipped with multi-wavelength Raman channels and many of them operate depolarization channels that measure the depolarization of the emitted linearly polarized radiation. In order to ensure qualitative and consistent data processing within the EARLINET network, algorithm intercomparison campaigns have been organized (e.g. Pappalardo et al., 2004; Wandinger et al., 2016; Amodeo et al., 2018). These campaigns aimed to assure the homogeneity of the data despite the differences in the lidar systems of the stations.
3.1 Satellite data (GOME-2)
3.1.1 Absorbing Aerosol Index
The Absorbing Aerosol Index (AAI) indicates the presence of elevated numbers of absorbing aerosols in the Earth's atmosphere. It is a unitless index and separates the spectral contrast at two UV wavelengths (340 and 380 nm) caused by aerosol scattering and absorption from other effects, including molecular Rayleigh scattering, surface reflection and gaseous absorption (Torres et al., 1998). The aerosol types that are mostly seen in the AAI are desert dust and biomass burning aerosols. AAI is a unitless parameter, with higher values indicating an elevated number of aerosols present in the atmosphere. Negative values are caused by the presence of clouds and/or scattering aerosol in the scene. However, a positive value for the AAI can only be explained by the presence of absorbing aerosols. The paper of de Graaf et al. (2005) provides several sensitivity analyses that detail the importance of the aerosol height for the interpretation of the AAI. The AAI from GOME-2 is produced by the Royal Netherlands Meteorological Institute (KNMI) – within the framework of the AC SAF. The GOME-2 AAI products are calculated for all three satellite instruments (MetOp-A, MetOp-B and MetOp-C), and data are available starting from January 2007, December 2012 and January 2019, respectively (AC SAF: https://acsaf.org/datarecord_access.php, last access: 12 February 2021; KNMI: http://www.temis.nl/airpollution/absaai/, last access: 12 February 2021).
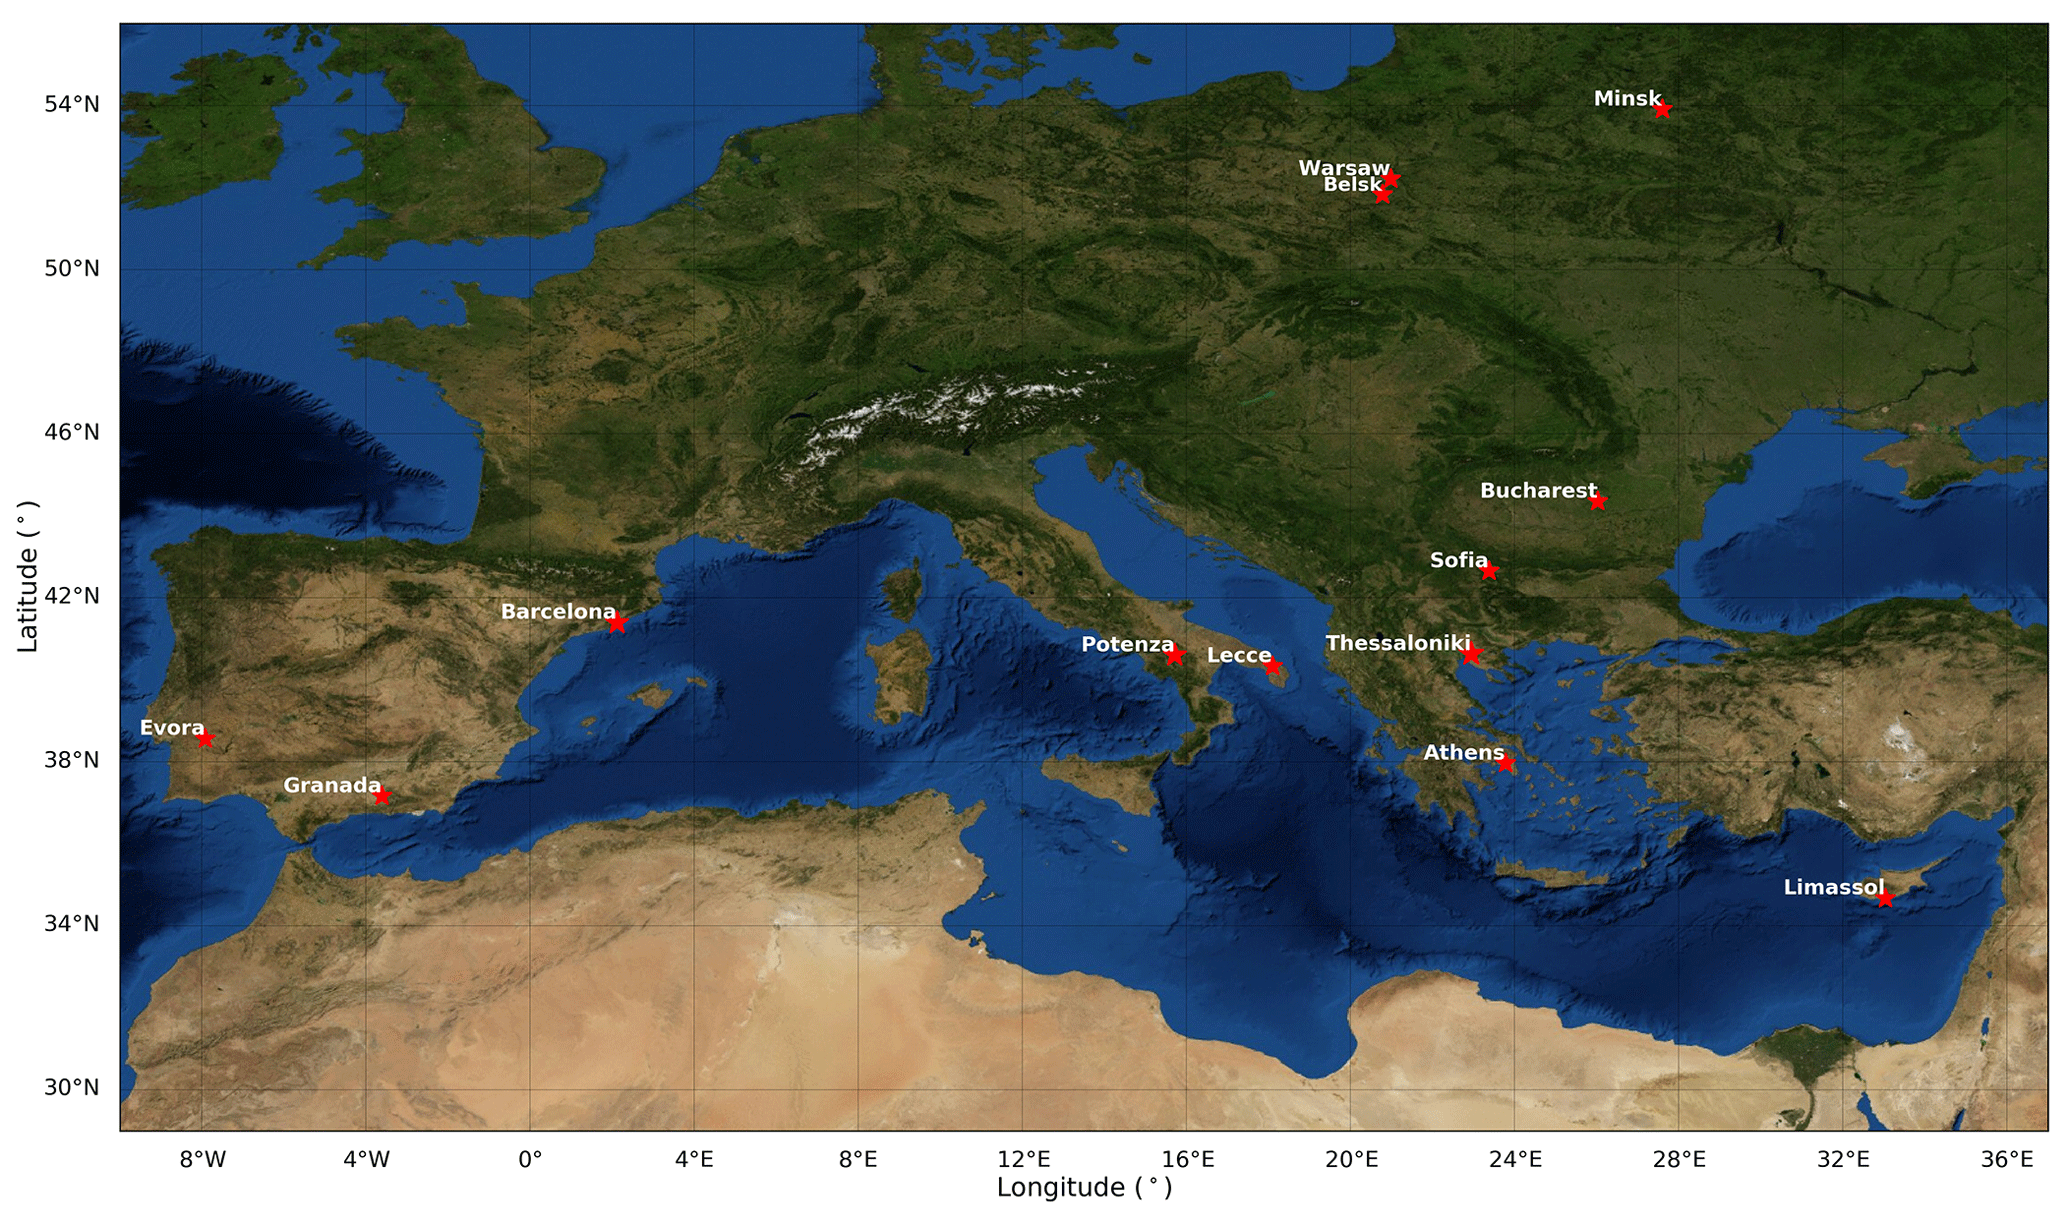
Figure 1Geographical distribution of EARLINET lidar stations used in this study.
3.1.2 Absorbing aerosol height
The AAH is a new operational AC SAF EUMETSAT product for aerosol layer height detection, developed by KNMI within the AC SAF. It uses the AAI as an indicator to derive the actual height of the absorbing aerosol layer in the O2-A band using the Fast Retrieval Scheme for Clouds from the Oxygen A band (FRESCO) algorithm (Wang et al., 2008, 2012; Tilstra et al., 2010, 2012). The retrieved aerosol height varies from the bottom to the top of the aerosol layer, depending on the aerosol optical thickness (AOT), solar zenith angle (SZA) and actual aerosol layer top height (Wang et al., 2008). The AAH product can be used to monitor volcanic eruptions globally and provide the height of the ash layers (Balis et al., 2016). The AAH is very sensitive to cloud contamination. However, aerosols and clouds can prove difficult to distinguish, and AAH is computed for different FRESCO cloud fractions. FRESCO is able to determine the height of an absorbing aerosol layer not only in the absence of clouds but under certain conditions also in the presence of clouds. Further details and more information associated with the AAH product are available in the product user manual (PUM) and algorithm theoretical basis document (ATBD; Tilstra et al. 2019, PUM; Tilstra et al., 2020). The product is available openly from the AC SAF repository (https://acsaf.org/offline_access.php, last access: 12 February 2021) and has been officially validated (De Bock, et al., 2020). As discussed in the ATBD, observation pixels with AAI values below 2.0 correspond to scenes with too-low levels of aerosol to result in a reliable AAH retrieval. Also, for AAI values larger than 2.0 but smaller than 4.0, the aerosol layer is not in all cases thick enough for a reliable retrieval. However, most of our aerosol cases correspond to AAI values below the 4.0 level. The AAH product is provided, among others, with the related standard deviation value. In summary, the AAH algorithm retrieves, from the GOME-2 level-1b product, the following parameters: CF (effective aerosol/cloud fraction), CH (aerosol or cloud height), SA (scene albedo), SH (scene height). Two different aerosol/cloud layer heights (CH and SH) are determined by the AAH algorithm. It is up to the algorithm to decide which of the two is the best candidate to represent the actual AAH level. According to Wang et al. (2012), in order to distinguish whether the contribution of clouds is crucial, three situations about the reliability of the AAH product are used and the effective CF is used to check in which of these regimes is the better solution (A: high reliability, B: medium reliability, C: low reliability). In more detail:
-
Regime A (CF ≤0.25) refers to the situation in which there is either only a low degree of cloud cover or the aerosol optical depth is sufficiently large to compensate the presence of a cloud layer below the aerosol layer. Exceptions are cases with low aerosol numbers, but these scenes were filtered out beforehand by demanding that the AAI must be higher than a threshold AAI value.
-
Regime B (0.25< CF <0.75) is an intermediate regime, and the AAH found this way is likely to underestimate the AAH in some cases; the reliability attributed to this regime is medium.
-
Regime C (CF ≥0.75) is the situation of a thick cloud layer present in the scene. In this case, an aerosol layer is only retrieved successfully when the aerosol layer is sufficiently thick. The reliability is therefore characterized as low. More information can found in Wang et al. (2012).
In Sect. 3.2, a pie chart (see Fig. 6) with the distribution of reliability category (regimes) of collocated observations is presented, including the contribution of clouds.
3.1.3 Ground-based lidar data (EARLINET)
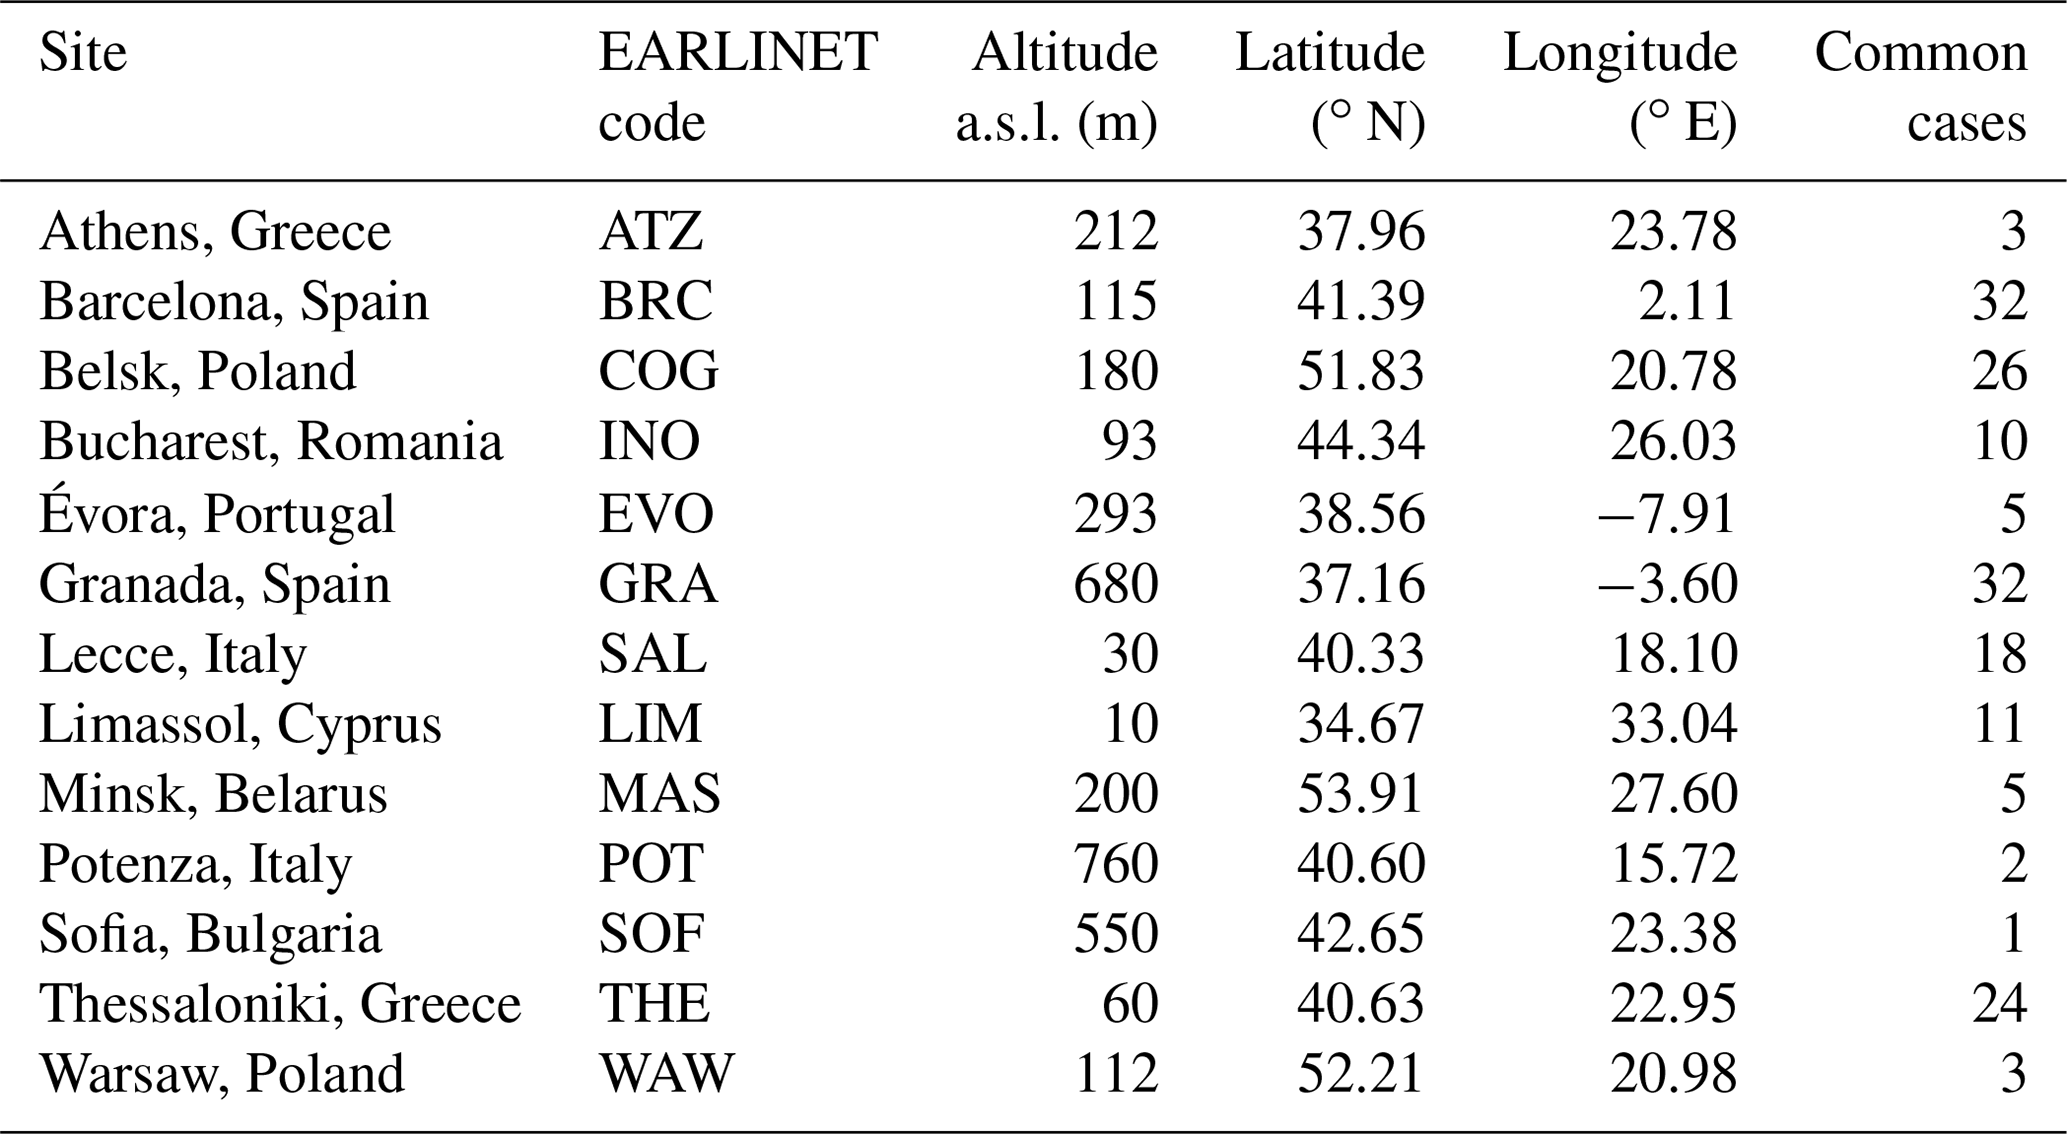
The EARLINET database represents the largest collection of ground-based data of the vertical aerosol distribution on a continental scale. EARLINET members, as well as external users, get access to the database through a web interface (https://www.earlinet.org, last access: 23 April 2020). Additionally, EARLINET data are permanently indexed and published at World Data Center for Climate (WDCC) (https://www.earlinet.org/index.php?id=247, last access: 12 February 2021). The main information stored in the files of the EARLINET database is the vertical distribution of aerosol backscatter and extinction coefficients. Additionally, there are more optional variables included in the files, such as the lidar ratio, the particle linear depolarization ratio and the water vapour mixing ratio profiles. In this study, we use the backscatter profiles for aerosol layer height retrieval. The backscatter files contain at least a profile of the aerosol backscatter coefficient (m−1 sr−1) derived from the elastic backscatter signal and may be accompanied by an extinction coefficient profile. Here, we use the vertical information of backscatter profiles (at 1064 and 532 nm in some cases) for selected EARLINET stations. Quality-assurance (QA) tests have been established and software intercomparison campaigns (Wandinger et al., 2016; Freudenthaler et al., 2018) have been organized in the framework of EARLINET in order to assure the homogeneity of the data despite the differences in the lidar systems of the stations. A list of the EARLINET stations used for the validation of GOME-2 AAH and their geographical coordinates is given in Table 2 and presented in Fig. 1. The stations are located such that four European regions are covered: central Europe, western Mediterranean, central Mediterranean and eastern Mediterranean. In this way, a large variety of aerosol optical and geometrical characteristics can be investigated.
Table 2Locations of EARLINET lidar stations order by site, with their geographical coordinates and GOME-2/MetOp cases considered in the validation process.
3.1.4 Wavelet covariance transform method
In this section, we analyse the algorithmic processes that are required to extract geometrical features from lidar signals employed in this work. The aerosol geometrical properties carry information about the structure of lidar profiles, such as the boundary layer height and the features of the lofted aerosol layers, and can be obtained from any lidar profile. In this study, a full lidar dataset from 13 EARLINET stations has been used for the calculations. Some lidar optical products, however, are more reliable to use than others. For example, the longer wavelengths typically magnify the differences in the vertical distribution of the aerosol load, resulting in layers that are easier to identify. Furthermore, the Raman inversion always results in profiles that are less structured for the extinction coefficients than the backscatter coefficients. This is the reason why we prioritize them so as to produce geometrical properties (Baars et al., 2008; Siomos et al., 2017). The product with the highest potential to magnify the aerosol layer structure available is selected for each measurement. More specifically, the backscatter products are prioritized over the extinction products and the longer wavelengths over the shorter ones. For this study, backscatter profiles at 1064 nm have been chosen primarily and in some cases backscatter profiles at 532 nm have been chosen.
The wavelet covariance transform (WCT) technique has proved to be one of the most reliable methods for the planetary boundary layer (PBL) top detection. Many methods have been proposed for the calculation of the PBL height from lidar data (e.g. Flamant et al., 1997; Brooks, 2003; Banks et al., 2016; Kokkalis et al., 2020). Our analysis is based on the method of Baars et al. (2008) that applies the WCT to the raw lidar data in order to extract geometrical features such as the PBL height, aerosol and cloud boundaries. The WCT transformation has also been applied successfully in the past on other lidar products (e.g. Kalman, 1960; Rocadenbosch et al., 1999). Siomos et al. (2017), for example, use an adaptation of the WCT method to calculate the geometrical features from the aerosol concentration profiles. The wavelet covariance transform was defined as a means of detecting step changes in a signal. It is based upon a compound step function, the Haar function h, defined as shown in Eq. (1):
Here, is the Haar function, a is the dilation of the Haar function indicating the size of the window (or dilation), b is the centre of the Haar function (or the translation), and z is the altitude range. The covariance transform of the Haar function, Wf(a,b), is defined as shown in Eq. (2):
where f(z) is the backscatter lidar signal, z0 and z1 are the lowest altitude and the highest altitudes of possible layers heights. The Wf(a,b) is referred to as the wavelet coefficient. These variables define the window function. Based on the defined lower and upper limits, the Haar transform is calculated. The obtained Haar values are subjected to the covariance transform, and the maximum negative value of the covariance transform provides the aerosol layer top. The key issues of performing the WCT are the determination of the dilation value of the Haar function. As with previous studies (Brooks et al., 2003; Baars et al., 2008), the dilation factor a affects the number of covariance wavelet transform coefficient local minima. Larger values of dilation factor reveal a few large local minima at the height of the biggest aerosol loading in the aerosol backscatter profile. In addition, lower dilation values create local minima at heights of smaller aerosol loads in the profiles. A dilation of 0.5 km is used in this study for the lofted aerosol layer height calculations. An example of a lidar backscatter profile with resulting WCT profile from the Barcelona lidar station (Universitat Politechnica de Catalunya, Barcelona – UPC) on 29 June 2019 is given in Fig. 2. This figure reasonably shows the ability of the lidar to detect multiple layers. The blue lines refer to the S–G (Savitzky–Golay smoothed signal) and the yellow one to the noisy backscatter lidar signal. The horizontal dashed red line represents the detected aerosol layer top applying the WCT methodology, and three aerosol layers are detected, according the methodology that we follow. Applying the WCT, we can check if there are strong variations in the backscatter coefficient profile within an aerosol layer, which may lead to a classification of a separate layer. The coloured “star” symbols represent the local maxima (purple) and minima (red) of wavelet transform signal.
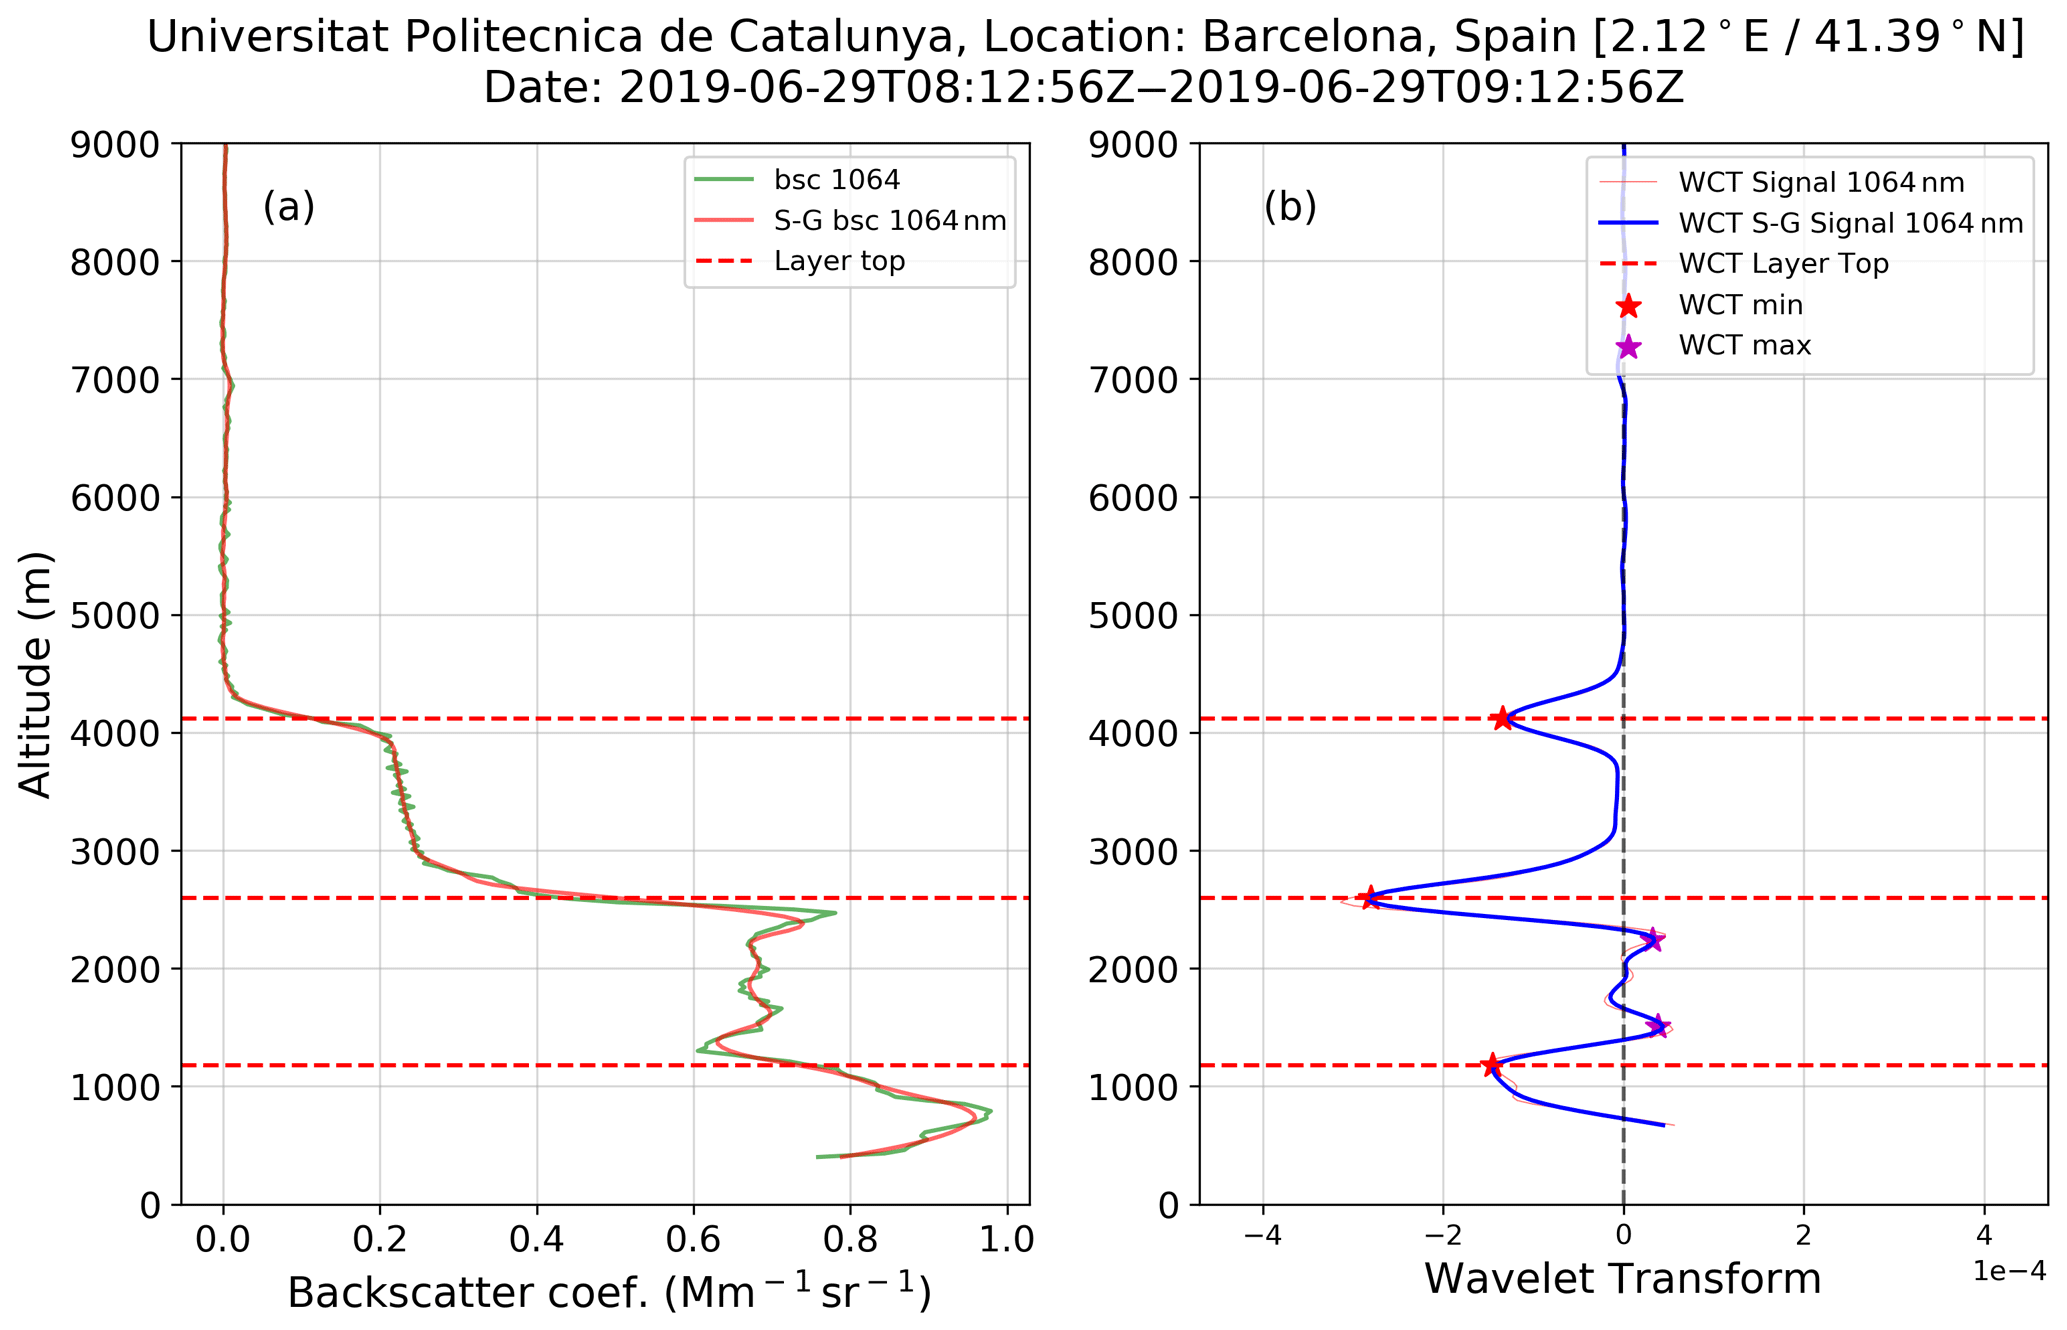
Figure 2Barcelona lidar station (Universitat Politechnica de Catalunya, Barcelona – UPC): (a) lidar backscatter profile at 1064 nm and (b) resulting WCT profile on 29 June 2019. The horizontal dashed red line represents the detected aerosol layer top applying the WCT methodology. The label “S–G” indicates that a Savitzky–Golay filter was used to reduce to noise variance in the backscatter profile. The coloured “star” symbols represent the local maxima (purple) and minima (red) of wavelet transform signal.
3.2 Validation methodology and collocation criteria
The validation of products with a typical resolution of several kilometres against point-like ground-based measurements involves uncertainties. A key question is how well the ground-based observation represents a larger area around the measurement site and to a large extent depends on the characteristics of the station location (urban, suburban, etc.). In this study, to obtain a significant number of collocated GOME-2 – EARLINET cases, data from 13 EARLINET stations were used for the GOME-2 AAH product validation as shown in Table 2. As the UV–VIS satellite instruments provide daytime observations, only the lidar measurements temporally close to the satellite overpass are used in this comparison. To achieve a good agreement between retrieved aerosol height form O2-A band observations and ground-based lidar measurements is very challenging and depends on some assumptions (Sanders et al., 2015). The lidar backscatter profiles are used to retrieve aerosol layer height (ALH) information of the aerosol vertical profile, while the AAH product is extracted by the GOME-2 algorithm. For the comparison of GOME-2 AAH against aerosol height from EARLINET lidars, the coincidence criteria are set to a 150 km search radius between the satellite pixel centre and the geolocation of the ground-based station. The lidar measurements closest to the GOME-2 overpass time within a 5 h temporal interval were selected for every available day of measurement to ensure a sufficiently large collocation database. It should also be noted that the temporal criterion is necessary since most of the EARLINET lidar observations occur at noon or night, while the MetOp orbits are in the morning. For each ground-based measurement, only the spatially closest GOME-2 measurements were selected for the comparison study.
Furthermore, certain criteria for ensuring the quality and representativeness of the satellite measurements, such as sun glint, solar eclipse events, and AAI values greater than 2, were taken into account. In this study, we use only the pixels containing positive AAI values, corresponding to absorbing aerosols, and especially only values greater than (or equal to) 2.0. According to Tilstra et al. (2019), observation pixels with AAI values below 2.0 correspond to scenes with too-low levels of aerosol to result in a reliable AAH retrieval. This threshold does not apply to every passive satellite instrument which retrieves the aerosol layer height product. For example, the TROPOMI ALH is only retrieved for pixels with UV AI (calculated by the 354–388 nm wavelength pair) larger than 1. In addition, non-converging pixels with AAH set to be 15 km are also excluded. Due to the use of the FRESCO algorithm, GOME-2 is limited to a maximum height of 15 km for the AAH retrieval and hence cannot detect layers higher than 15 km. Table 3 lists the GOME-2 quality-assurance thresholds applied in the EARLINET comparison. Selecting these criteria, the total set of available satellite pixels is quite small. Most of the satellite measurements available from GOME-2/MetOp refer to cases with AAI between 2 and 4.
Table 3List of GOME-2 quality-assurance thresholds applied in the EARLINET comparison.

Applying all these selection criteria resulted in a total of 272 correlative GOME-2 – EARLINET cases suitable for the comparison study and representativeness of the GOME-2 level-2 AAH product. However, it quickly became clear that further consideration of the individuality of each sensing instrument is required. A large number of GOME-2 AAH heights below the 1 km level are reported, which in most cases are unlikely to be retrieved from a lidar backscatter profile due to the system overlap (Wandinger and Ansmann, 2002). This is a common source of uncertainty when dealing with lidar data, due to hardware limitations that determine the altitude above which a profile contains trustworthy values. This is demonstrated in the 0–1 km bin of Fig. 3, where the collocations are separated depending on the AAH reported per instrument. Most of the vertical lidar profiles begin over 0.8–1.0 km, and it is indeed quite rare to find profiles starting below of these values. Therefore, in this study, a threshold value of 1.0 km for the signal altitude is selected, under which we will not take into account observations in our analysis. The backscatter profiles archived in the EARLINET database have a variable height range which typically extends up to 5–6 km, where the most of the lidar signals have an optimal signal-to-noise ratio. Therefore, as can also be seen for the last bar, for heights above 6 km (see Fig. 3), there are very few cases where the lidars report heights above that altitude. Collocated cases where the lidar ALH values are greater than 7 km have been removed from the study.
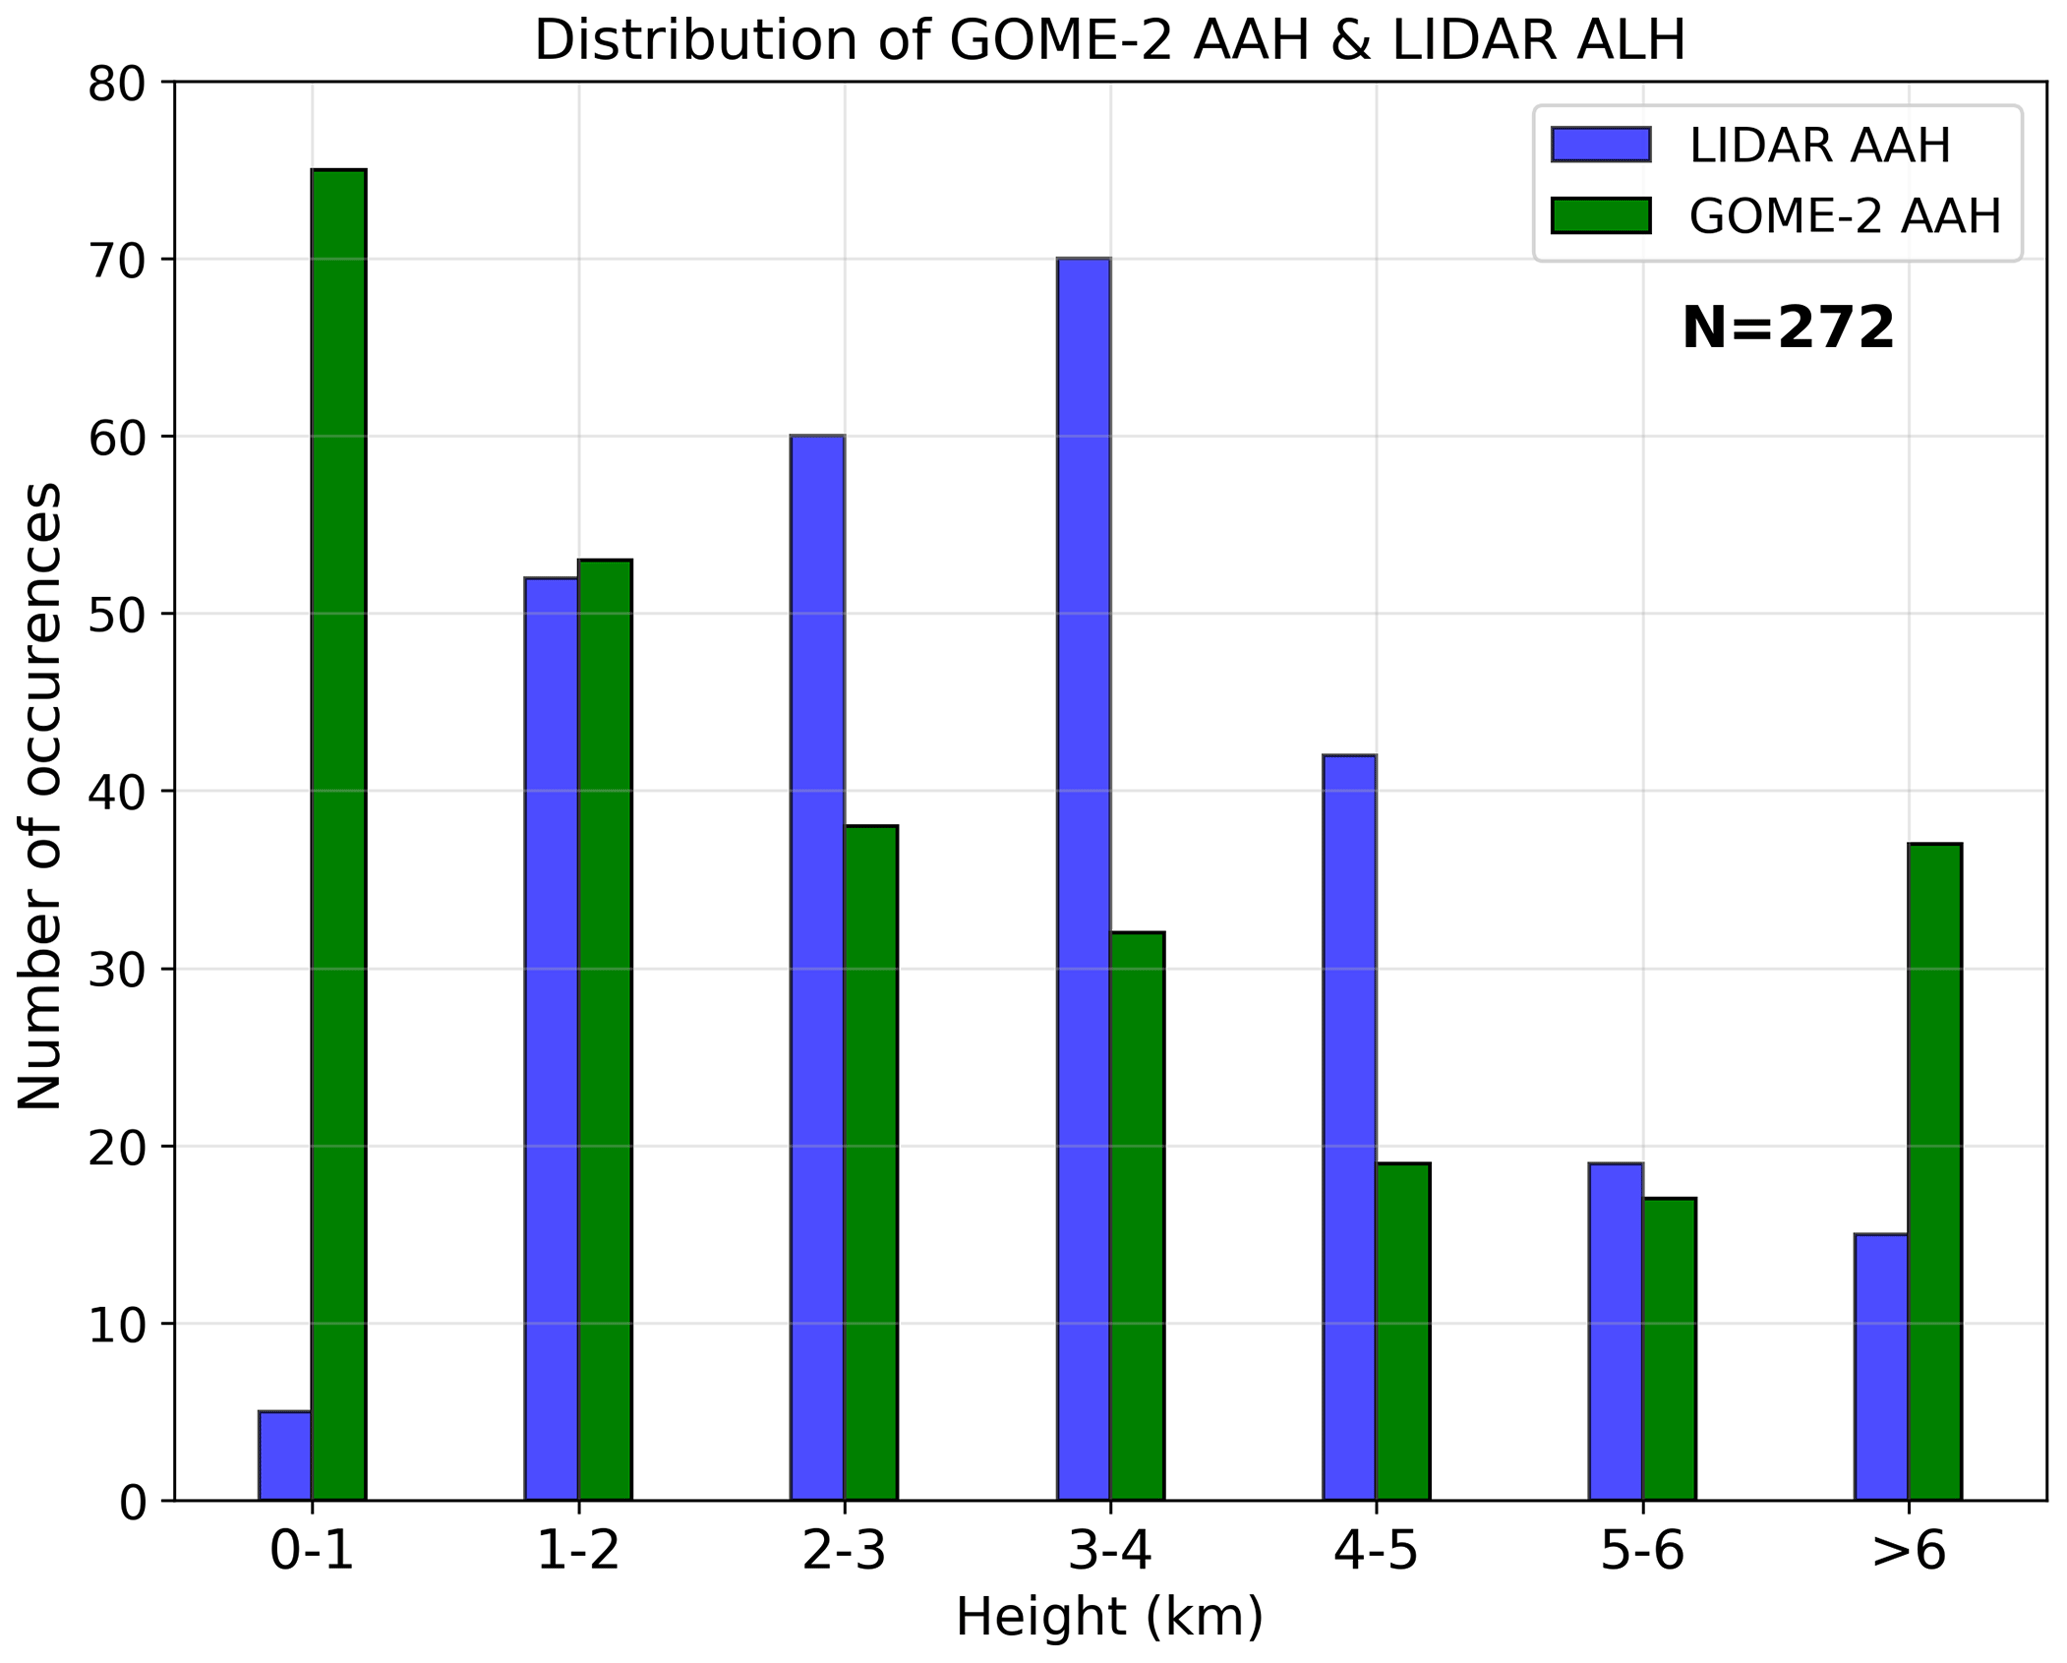
Figure 3Bar plot of GOME-2 AAH (green) and EARLINET ALH (blue) stations. The height ranges of bins are between 0–1, 1–2, 2–3, 3–4, 4–5, 5–6 and > 6 km. The bar counts indicate the number of collocated cases.
As a result of this extra restriction in collocation, the number of GOME-2 – EARLINET cases considered in the assessment of the accuracy and representativeness of the GOME-2 AAH are provided in Table 2 including the code name of the EARLINET station used in figures further in the text. Figure 4a shows the distribution of available of collocated cases for each lidar station and in Fig. 4b the distribution of all collocations by year. All three GOME-2 instruments are considered in a single satellite data pool. Figure 5 shows the spatial distribution of all collocated layers around each EARLINET station considered (Athens, Barcelona, Belsk, Bucharest, Granada, Évora, Lecce, Limassol, Minsk, Potenza, Sofia, Thessaloniki and Warsaw), while the concentric red circles denote regions of 150 km from the location of these stations. In Fig. 6, the distribution of reliability category (regime) of collocated observations is presented, including the contribution of clouds. The effective CF is a primary indicator for the AAH algorithm and is used to check which of these regimes is more reliable for retrieving the AAH. It is clear that most of the collocated cases belong to the high (regime A) and medium (regime B) reliability categories. We take into account all the regime flags of pixels regardless of the reliability. According to Wang et al. (2012), regime C is the situation of a thick cloud layer present in the scene. In this case, an aerosol layer is only retrieved successfully when the aerosol layer is sufficiently thick.
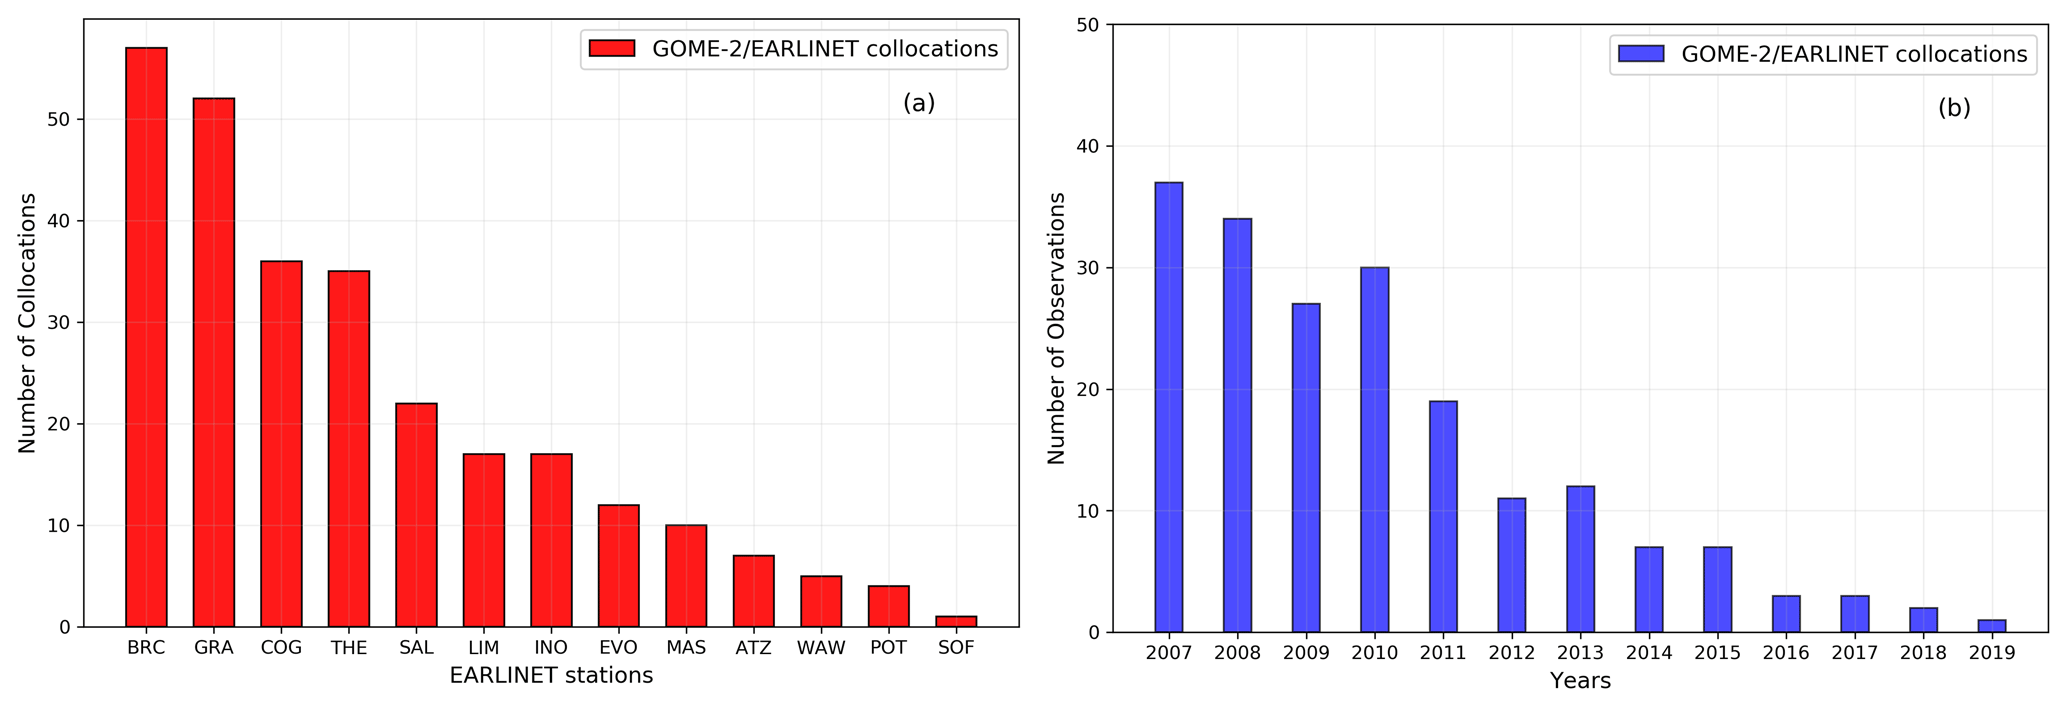
Figure 4Distribution of collocated cases with minimum distance from each lidar station, for a radius distance of 150 km around each EARLINET station (a) and distribution of all collocated cases by year for the study period (2007–2019) (b). Refer to Table 2 for the EARLINET code names shown in the x axis.
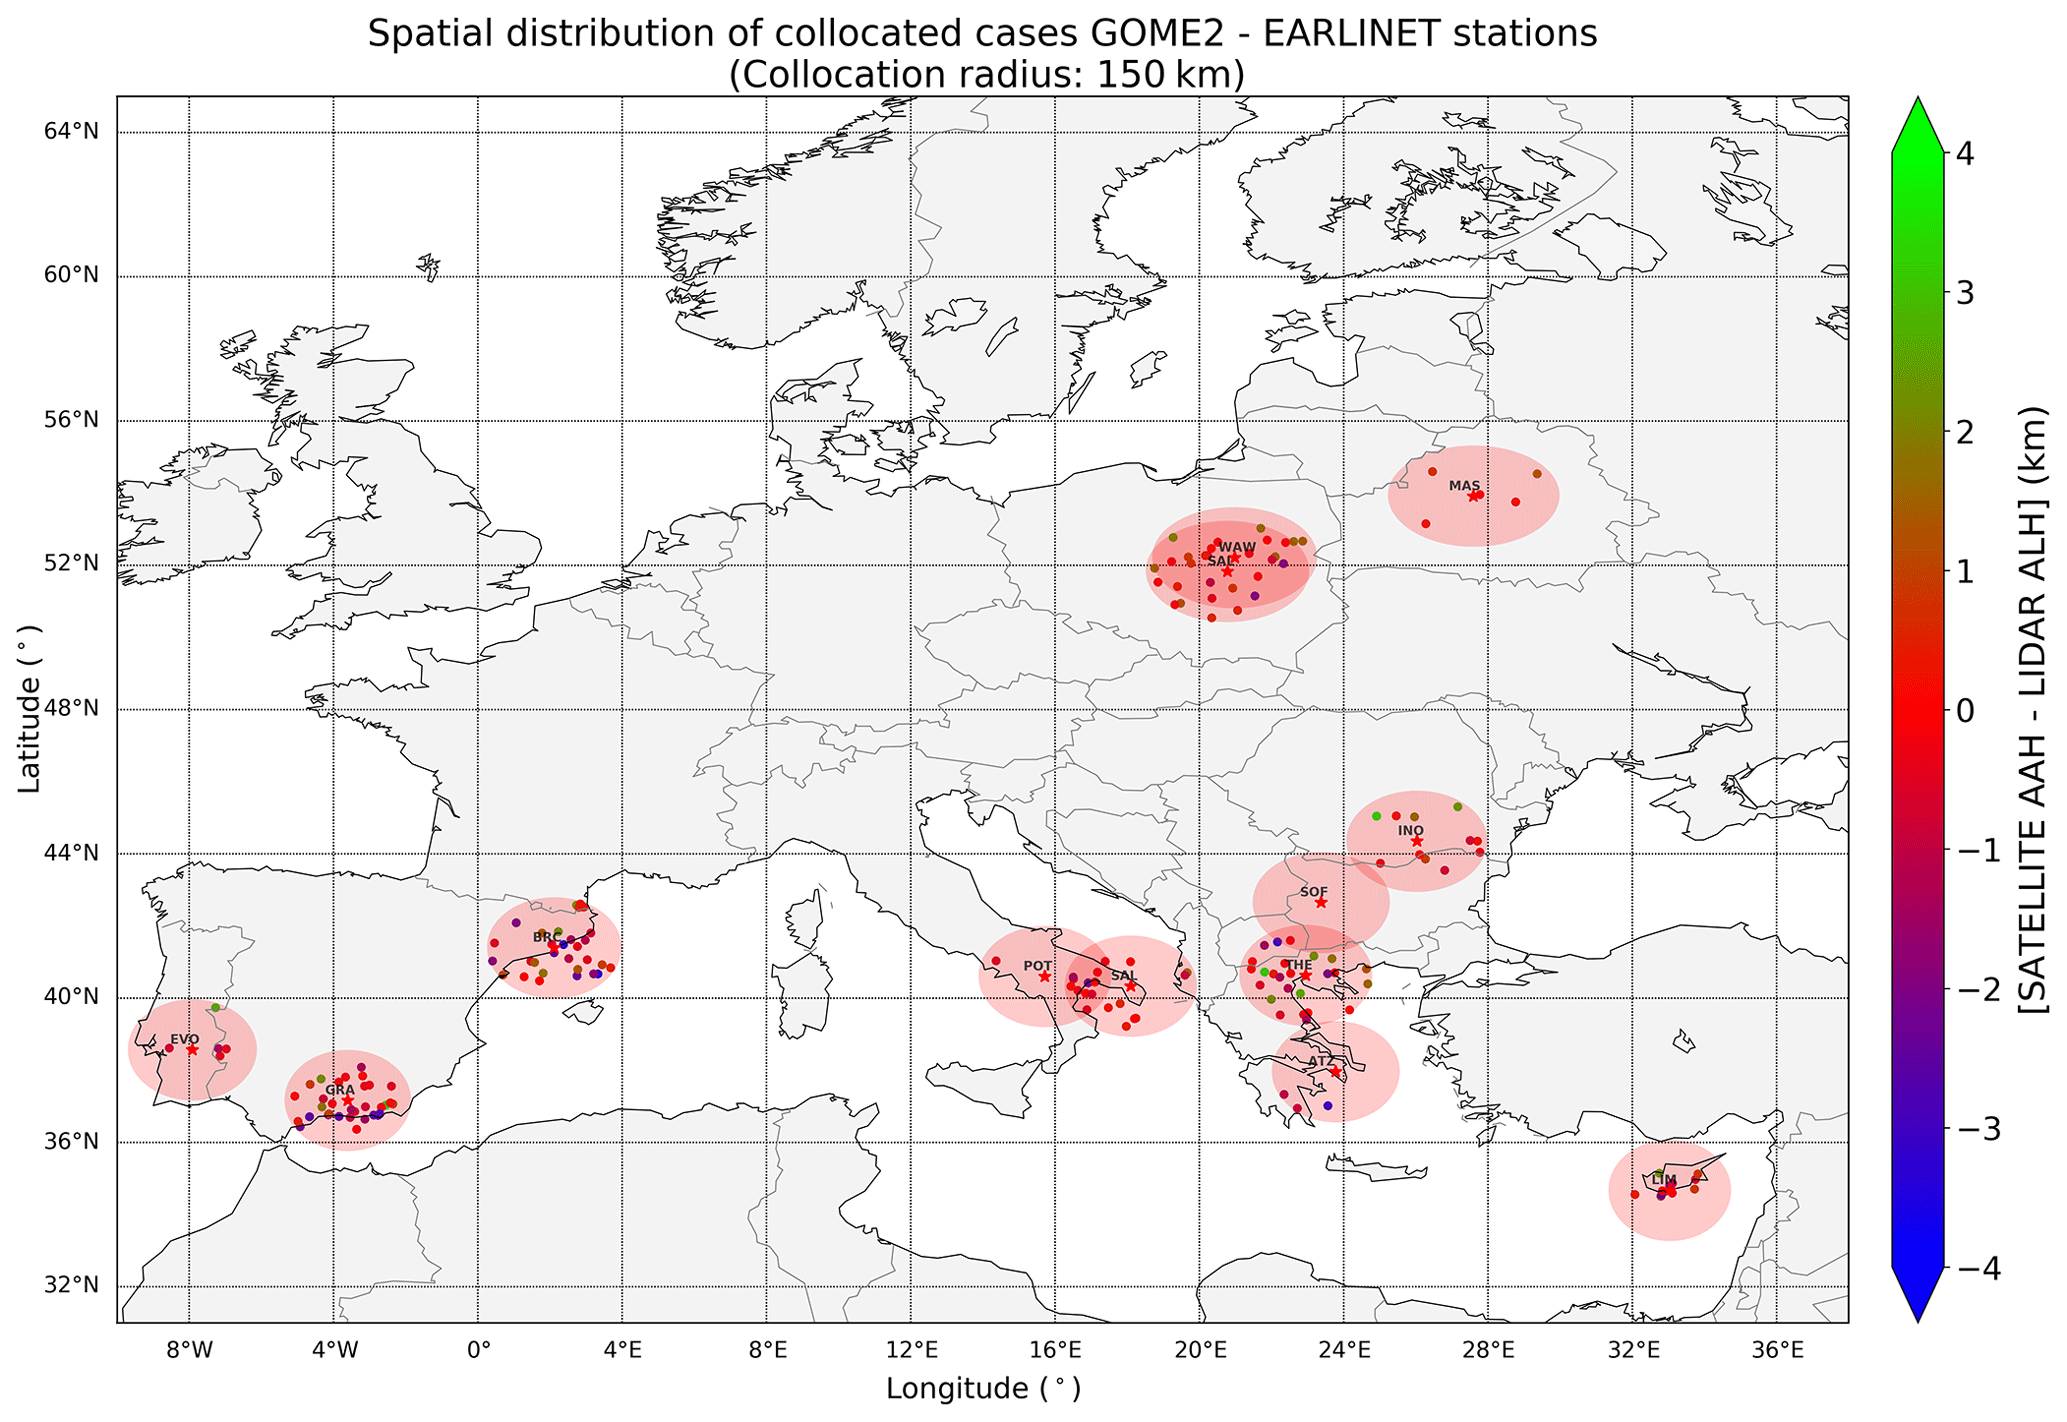
Figure 5Spatial distribution of collocated pairs between GOME-2/MetOp and EARLINET stations for the sites including in the validation study. The colour codes denote the absolute difference between GOME-2/MetOp AAH and the retrieved aerosol height from EARLINET data for each collocated pair. The concentric red circles denote regions of 150 km from the location of EARLINET stations. Refer to Table 2 for the EARLINET code names shown in the legend.
4.1 GOME-2 and EARLINET comparison statistics
In this section, an overall assessment of the GOME-2 retrieved AAH product is given using the total dataset of GOME-2 – EARLINET collocated cases. Figure 7 shows the distribution of GOME-2 AAH and EARLINET aerosol height differences. The histogram plot refers to the total of 172 collocated cases. The near-Gaussian distribution of the absolute difference is centred slightly to the left, indicating lower GOME-2 AAH values on average with a mean bias of −0.18 km and standard deviation of 1.68 km, a very promising result considering all the individual uncertainties of both datasets as well as the collocation criteria. The related metrics are given in Table 4. Figure 8 shows the updated bar plot, effectively demonstrating the reason for the lingering differences between the two datasets. A comparison for all study stations can be seen in Fig. 9 where the collocations are now colour coded based on their associated AAI value. The overall agreement is quite satisfactory, with most lidar AAH values between 1 and 7 km, while the GOME-2 AAH results range a bit higher up to ∼ 8 km. The individual station statistics are given in Table 5, sorted by the number of collocations found for each station. The mean bias (GOME-2 AAH minus EARLINET ALH) falls well within the ± 1 km range, with an associated standard deviation between 0.5 and ∼ 2 km. Considering the differences mainly in the temporal collocation and the difference between the satellite pixel size and the point view of the ground-based observations, these results are quite promising, as the stable aerosol layers are well captured by the satellite sensors.
Table 4Statistical metrics from the validation between GOME-2 AAH and EARLINET retrieved aerosol layer height.
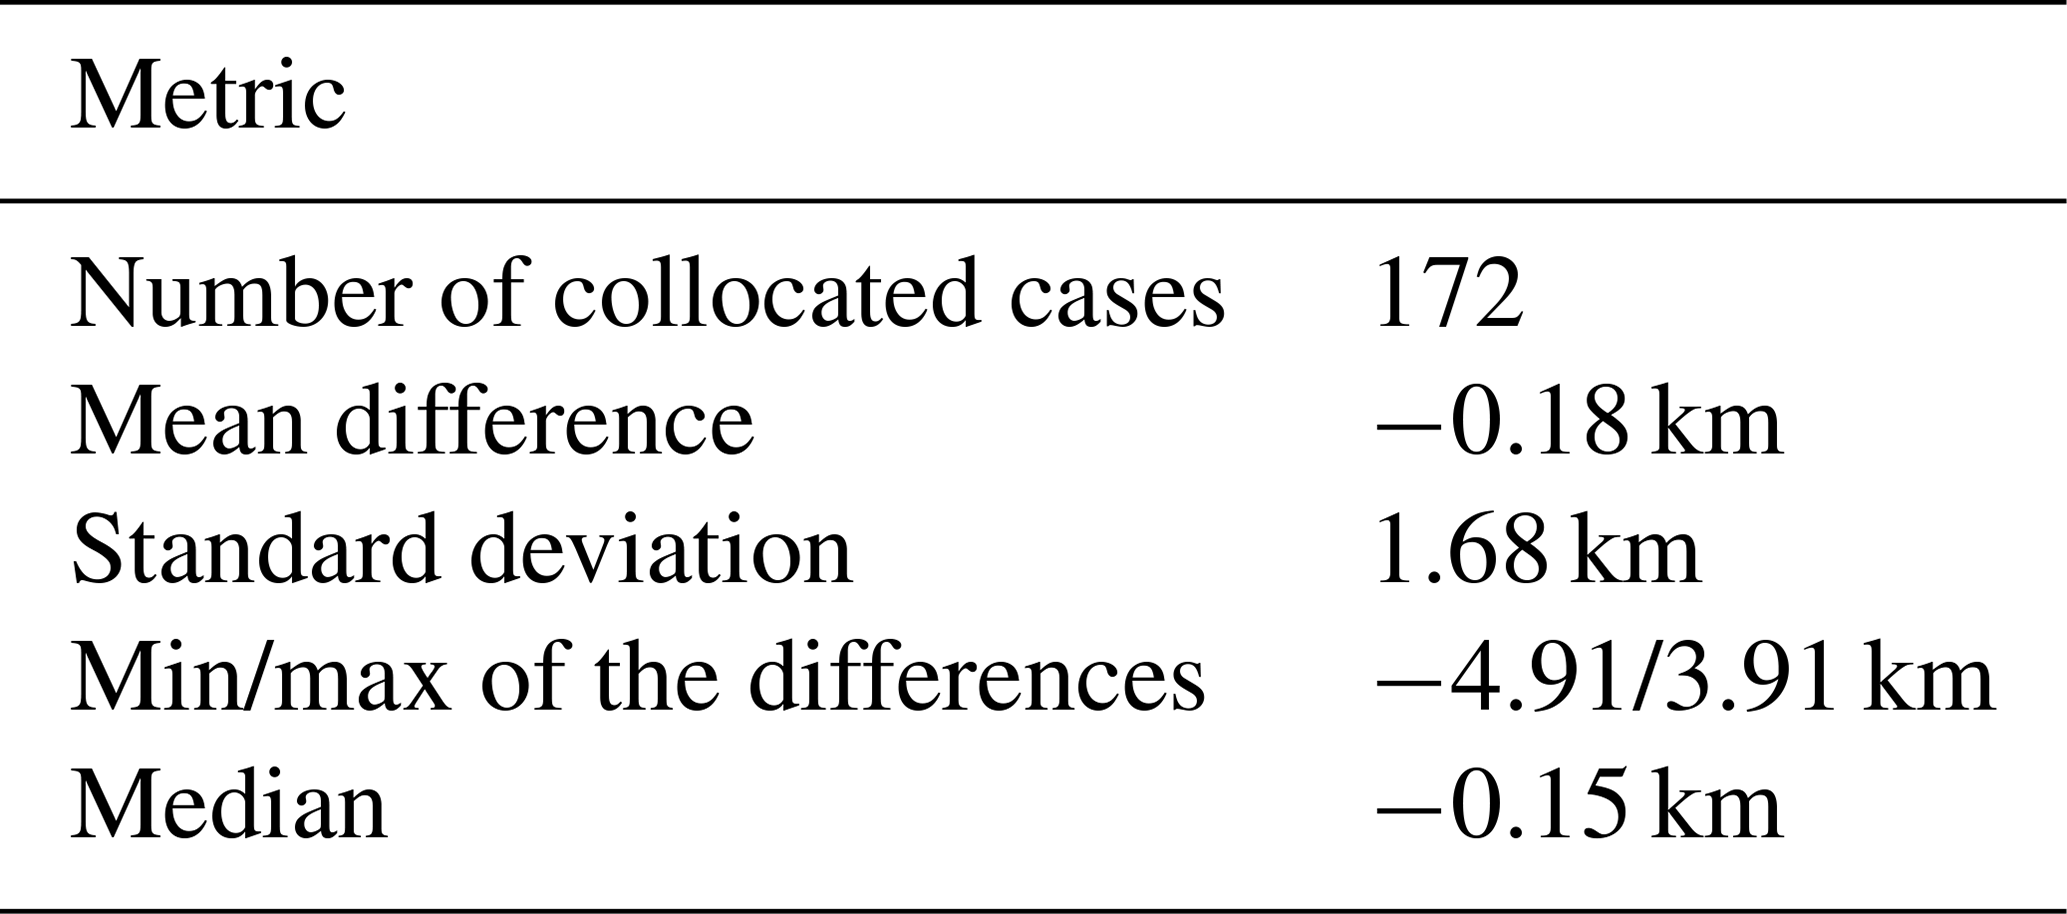
Table 5Summary of statistics for the comparisons between GOME-2 AAH and LIDAR ALH for all stations* sorted by maximum number of collocations found.
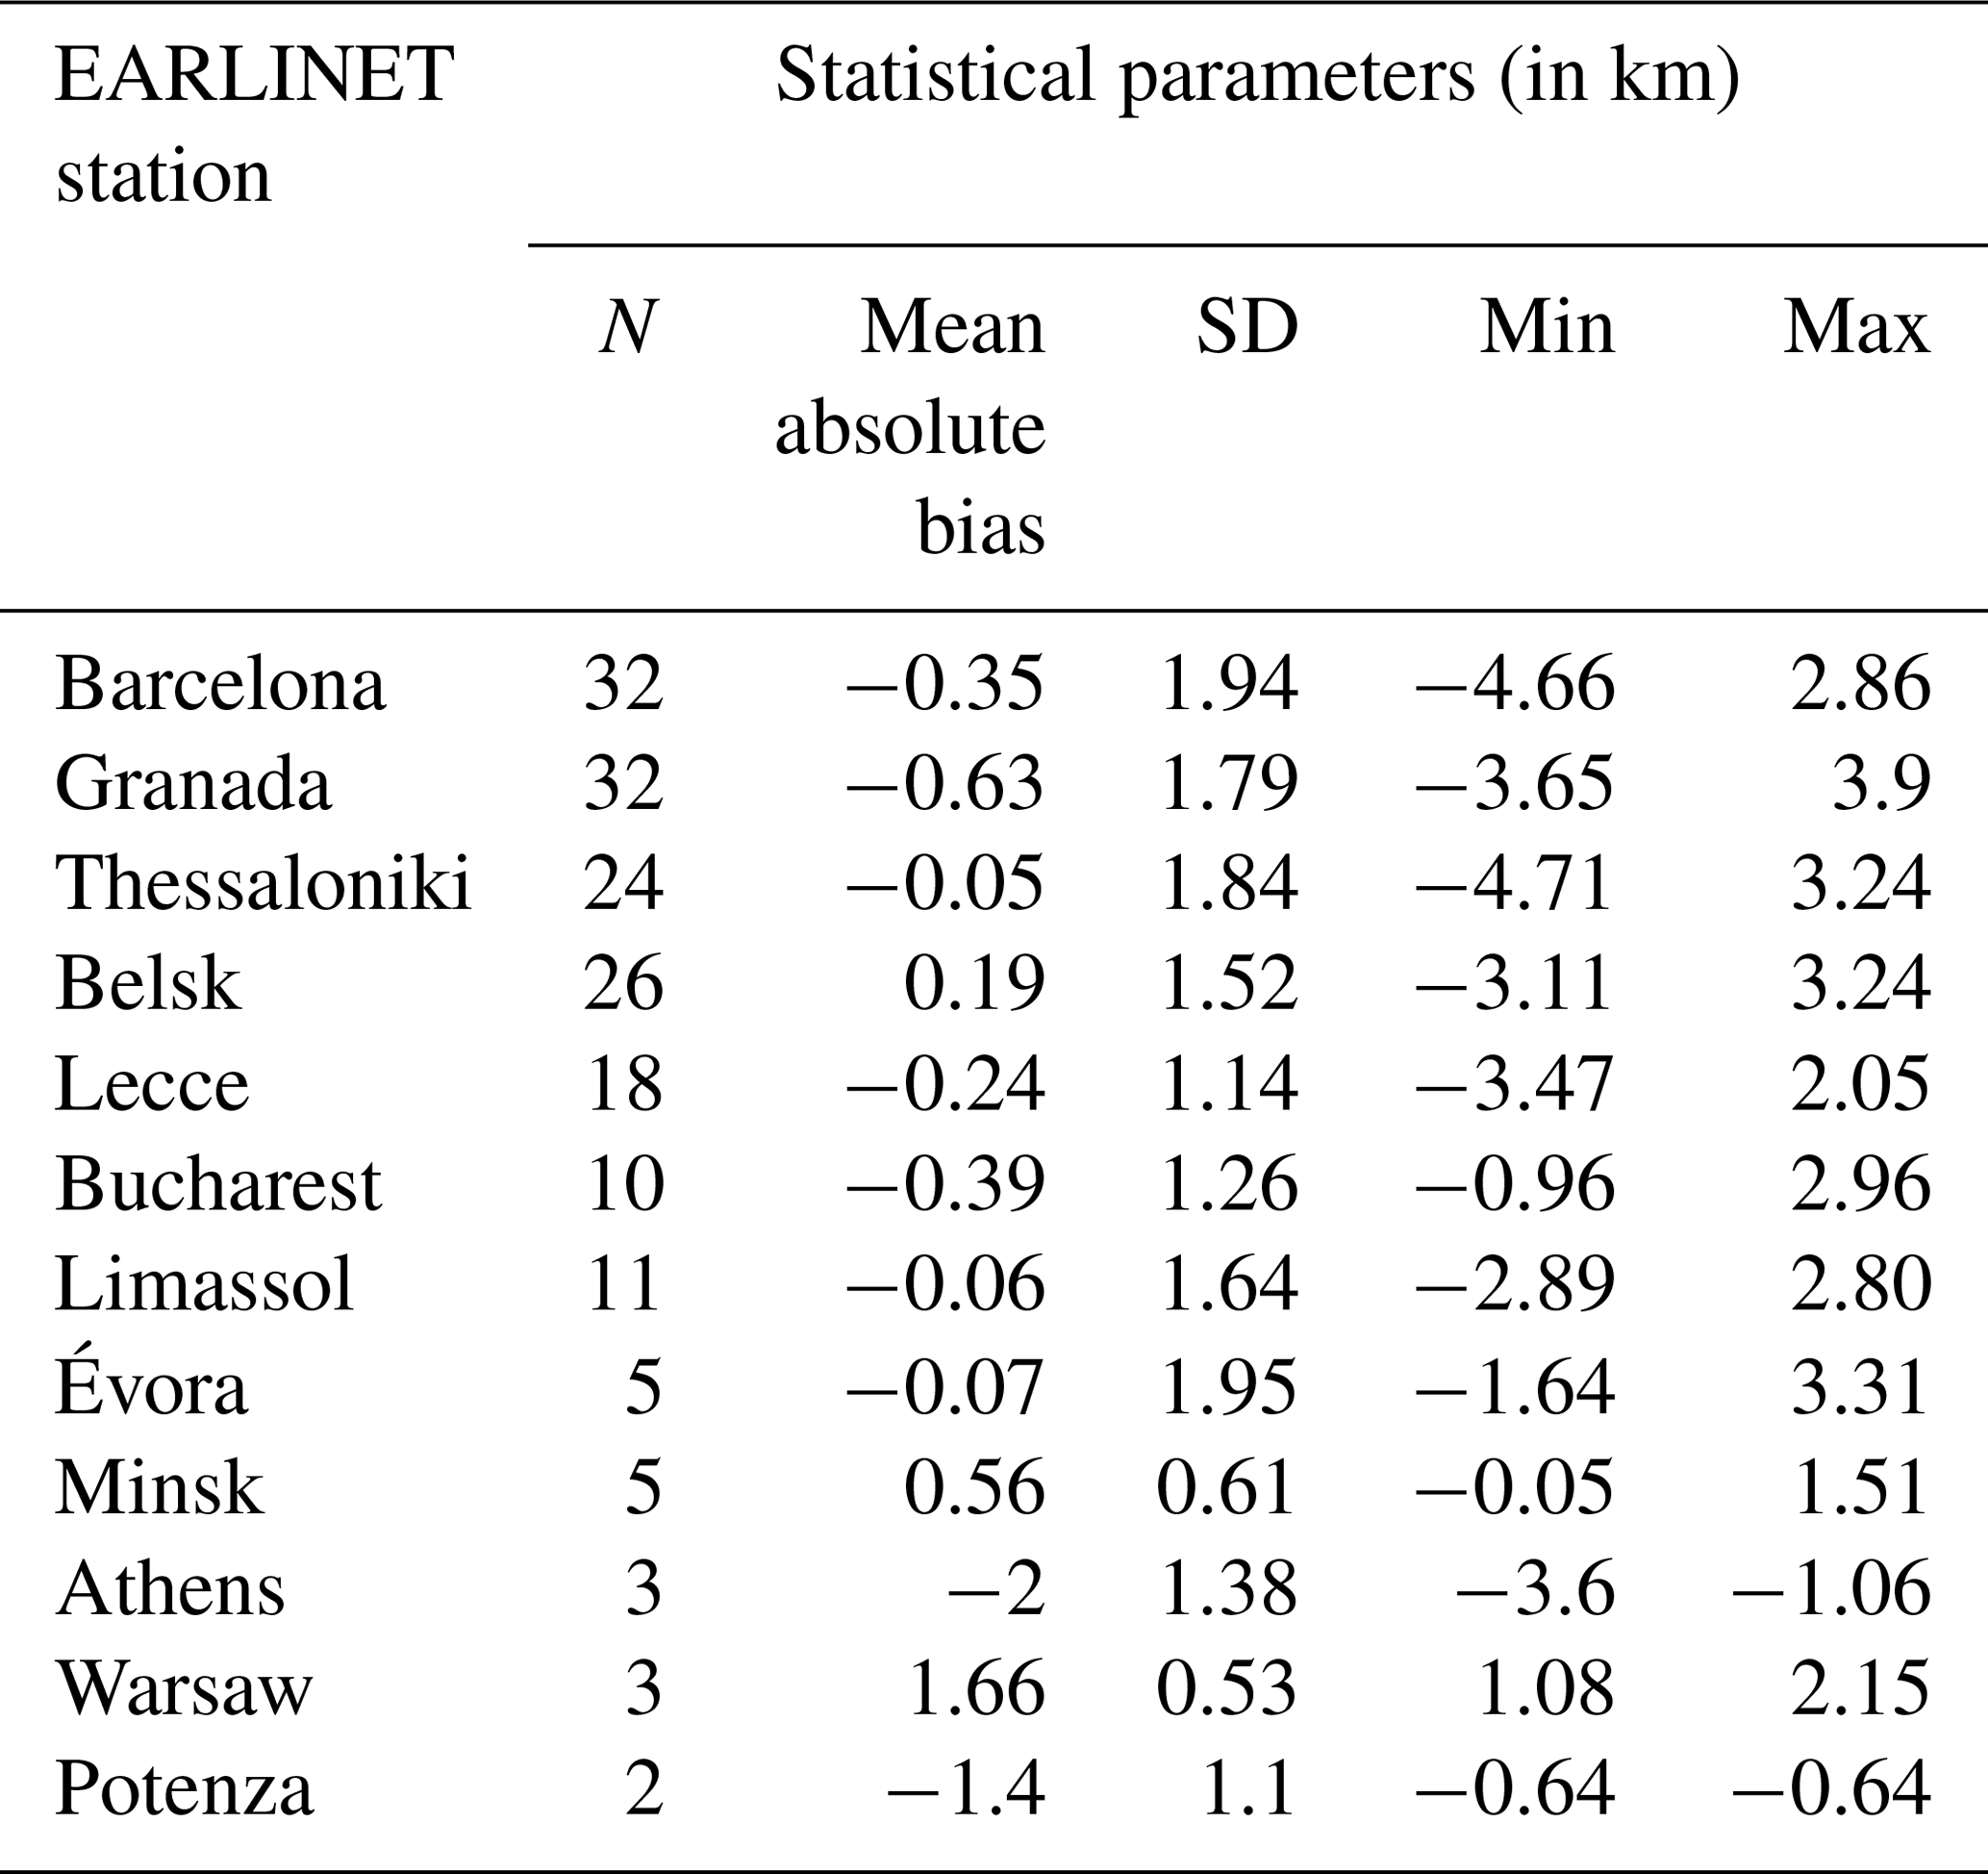
* The station of Sofia has only one collocation; therefore, it is not shown.
Some of the lingering differences may be explained as follows: as per Fig. 3, the geometrical and technical characteristics of each lidar system determine the height range where backscatter profiles can be retrieved, and this can affect the comparisons at very low and very high ALHs. Additionally, GOME-2 AAH retrieval assumes a single aerosol layer in the atmospheric column, while it is a common feature to have more layers in the column. This is well captured by the lidar observations, but when making the GOME-2 against lidar comparison there is some uncertainty regarding which lidar-derived layer should be compared to the GOME-2 equivalent one.
4.2 Saharan dust outbreak event between 21 and 23 February 2017
An intense Saharan dust episode occurred between 20 and 23 February over the Iberian Peninsula. Analysis of the meteorological conditions during this dust event are described in Fernández et al. (2019). In this section, we present the evolution of the dust outbreak event that was captured by the Évora, Portugal, lidar station between 21 and 23 February 2017, as well as the GOME-2 AAH observations.
4.2.1 Évora lidar station
This Évora station is located about 100 km eastward from the western Atlantic Ocean. Due to its geographical location, Évora is influenced by different aerosol types, namely urban, as well as mineral and forest fire aerosol particles. The lidar system installed here (Portable Aerosol and Cloud Lidar; PAOLI) is a multi-wavelength Raman lidar belonging to the PollyXT family (Baars et al., 2016) with high temporal and spatial resolution, operating since September 2009. It is installed at the Évora Atmospheric Sciences Observatory (EVASO) and operated by the University of Évora (UE) and the Institute of Earth Sciences (ICT) (38.56∘ N, −7.91∘ E; 293 m a.s.l.). The instrument features three elastic channels in the UV–VIS–IR range (355, 532 and 1064 nm), two inelastic (Raman) channels (387 and 607 nm) and a polarization channel which detects the cross-polarized signal at 532 nm. PAOLI is participating both in the EARLINET and the Spanish and Portuguese Aerosol Lidar Network (SPALINET) (Sicard et al., 2009, 2011). The Évora lidar system, part of EARLINET, has been quality assured through direct intercomparisons, both at hardware and algorithm levels (Pappalardo et al., 2004). During daytime, data provided by the Klett technique (Klett, 1981, 1985) use a constant lidar ratio value as input to retrieve the backscatter coefficient values with an average uncertainty of the order of 20 %–30 % (Pappalardo et al., 2014).
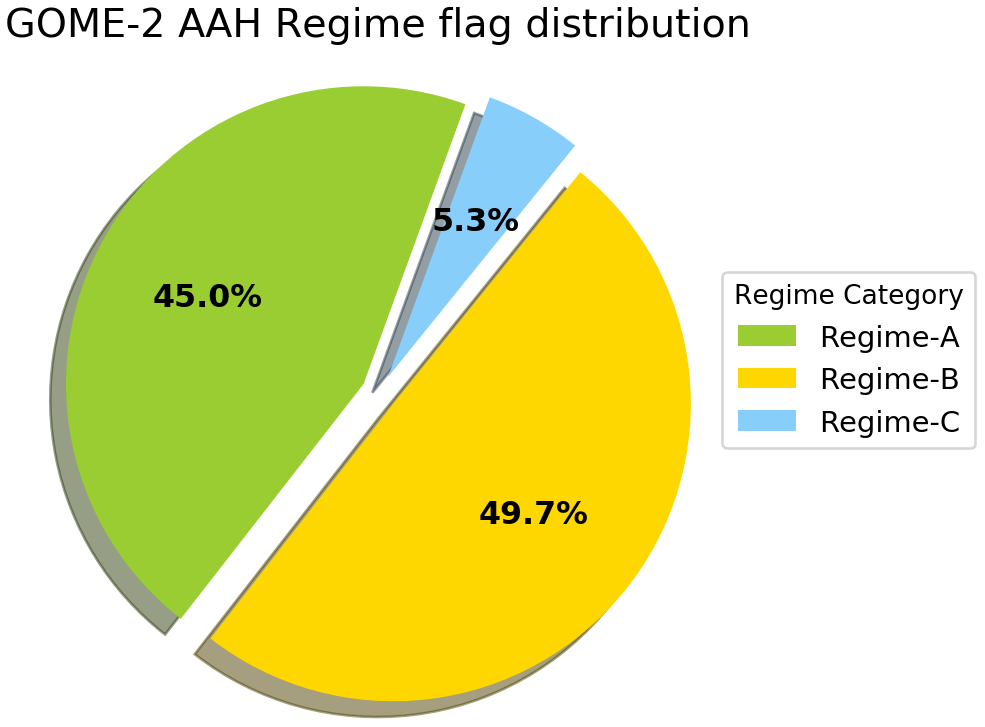
Figure 6Distribution of AAH product reliability (regime flag) related to degree of cloud cover (effective cloud fraction) for the selected collocated observations as per Sect. 3.1.2 (A: high reliability, B: medium reliability, C: low reliability).
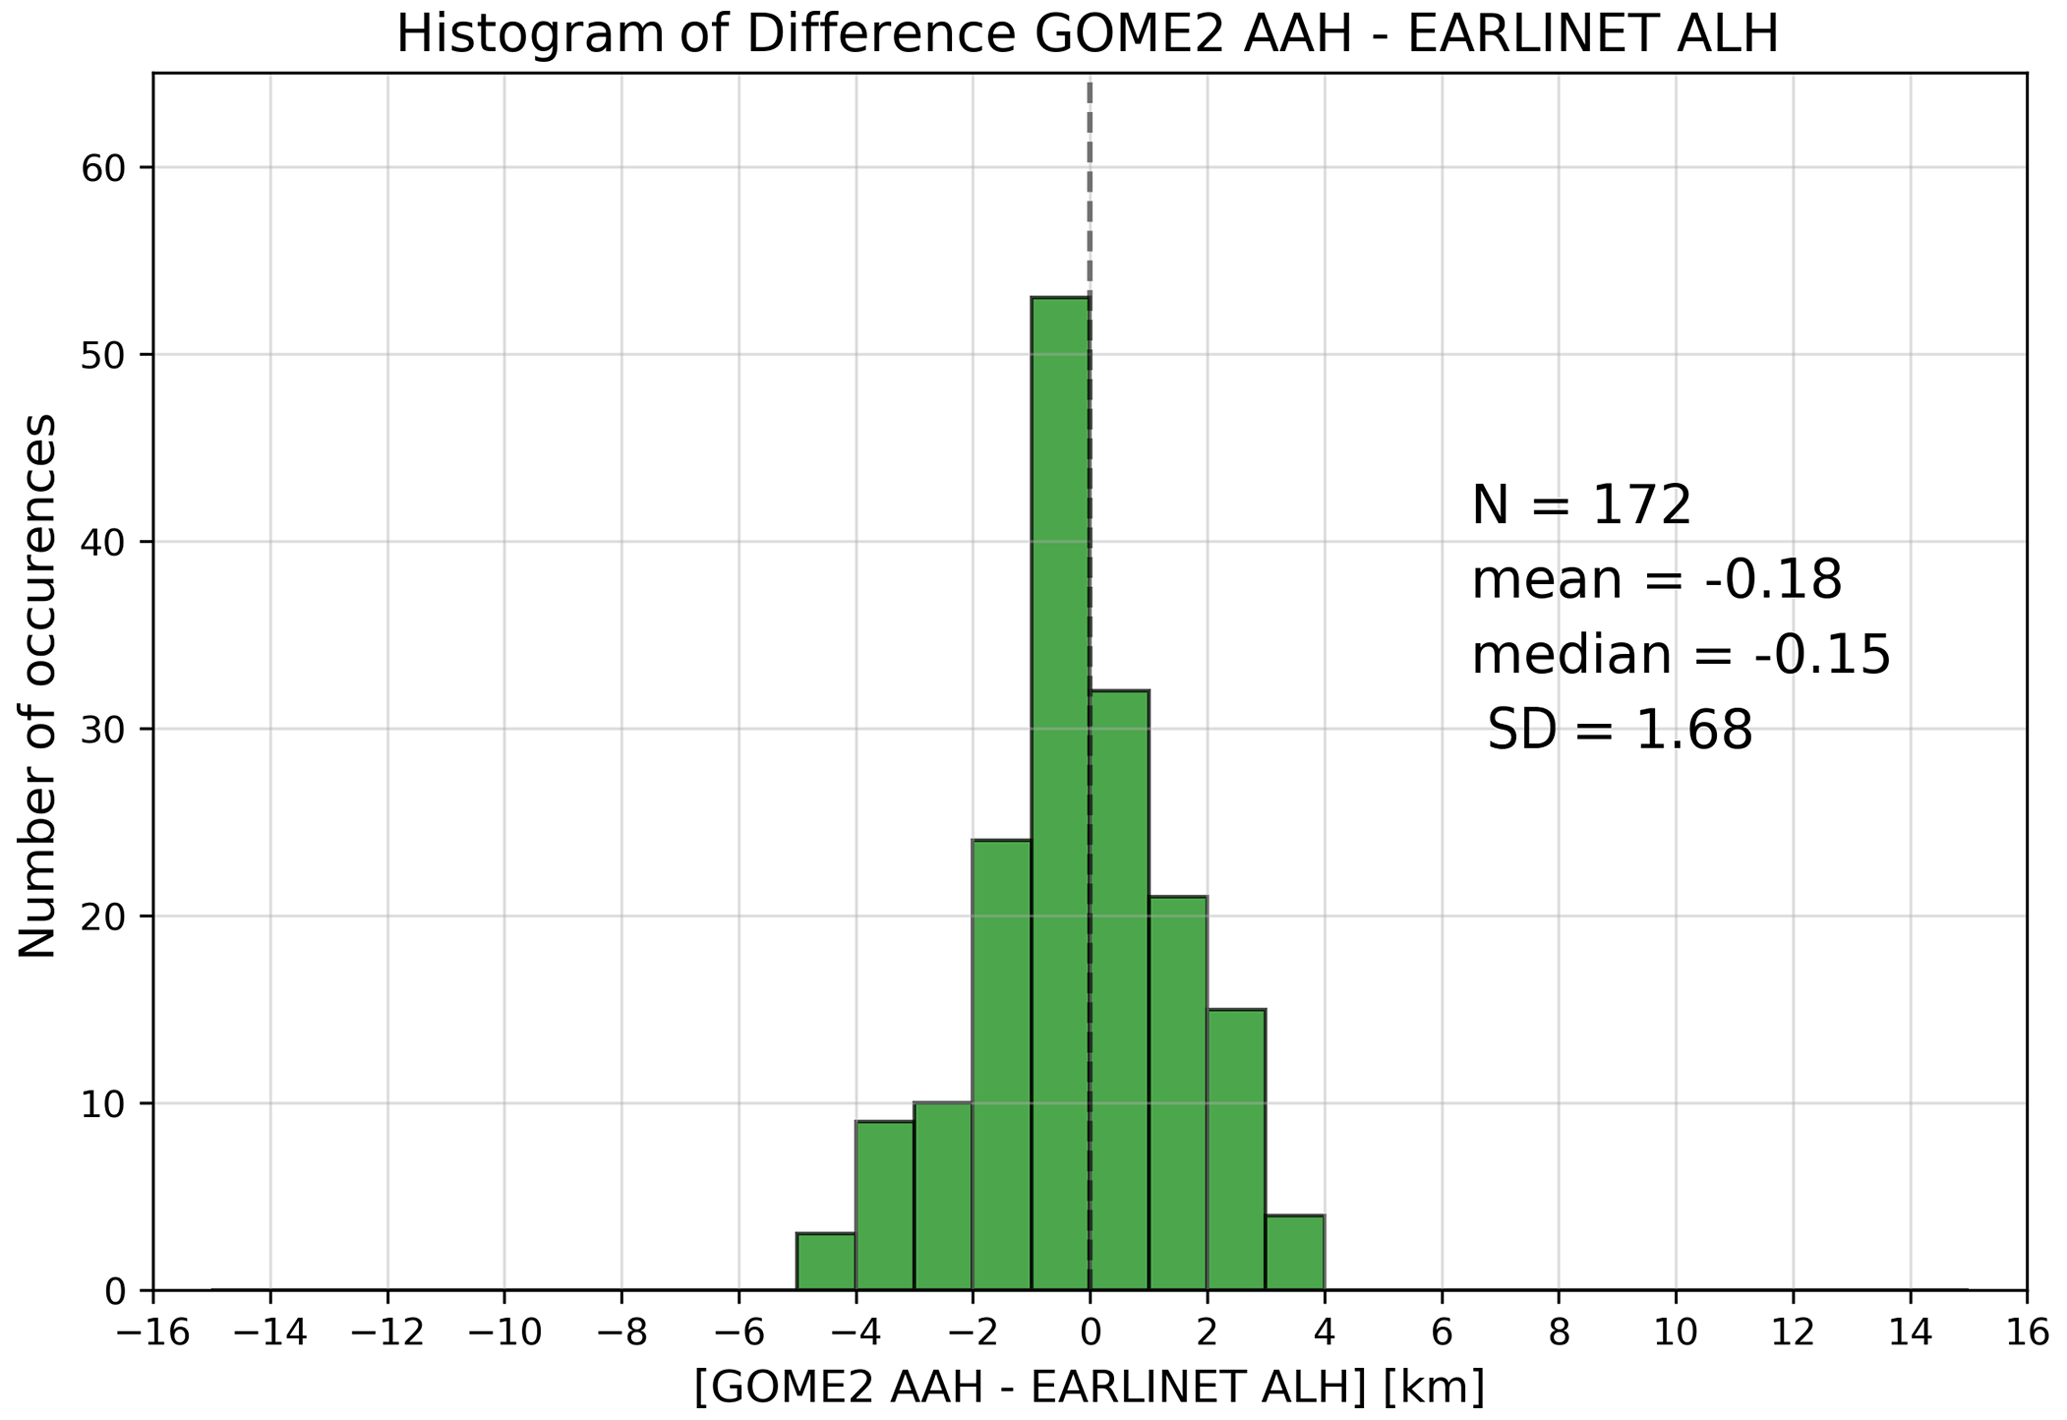
Figure 7Histogram of absolute differences between GOME-2 AAH and aerosol layer height obtained from EARLINET backscatter profiles (using the WCT method), calculated for all collocated cases.
4.2.2 Case study: Évora, 21–23 February 2017
In February 2017, an exceptionally extreme event affected the whole Iberian Peninsula, as examined with the Aerosol Robotic Network (AERONET), EARLINET lidars and passive satellite observations (Fernández et al., 2019). MetOp overpasses close to the EARLINET station of Évora are analysed here to demonstrate the performance of the GOME-2 instrument under the intense Saharan dust outbreak (see Fig. 13). This typical case concerns an intense Saharan dust outbreak, which lasted for 3 d (21–23 February 2017) and was successfully followed during these 3 d by the Évora lidar station. A combined use of lidar profiles, back-trajectory analysis, dust models and satellite observations allows the identification of Saharan dust cases. Figure 10 shows the temporal evolution of the total attenuated aerosol backscatter coefficient at 1064 nm (m−1 sr−1) over Évora on 21–23 February.
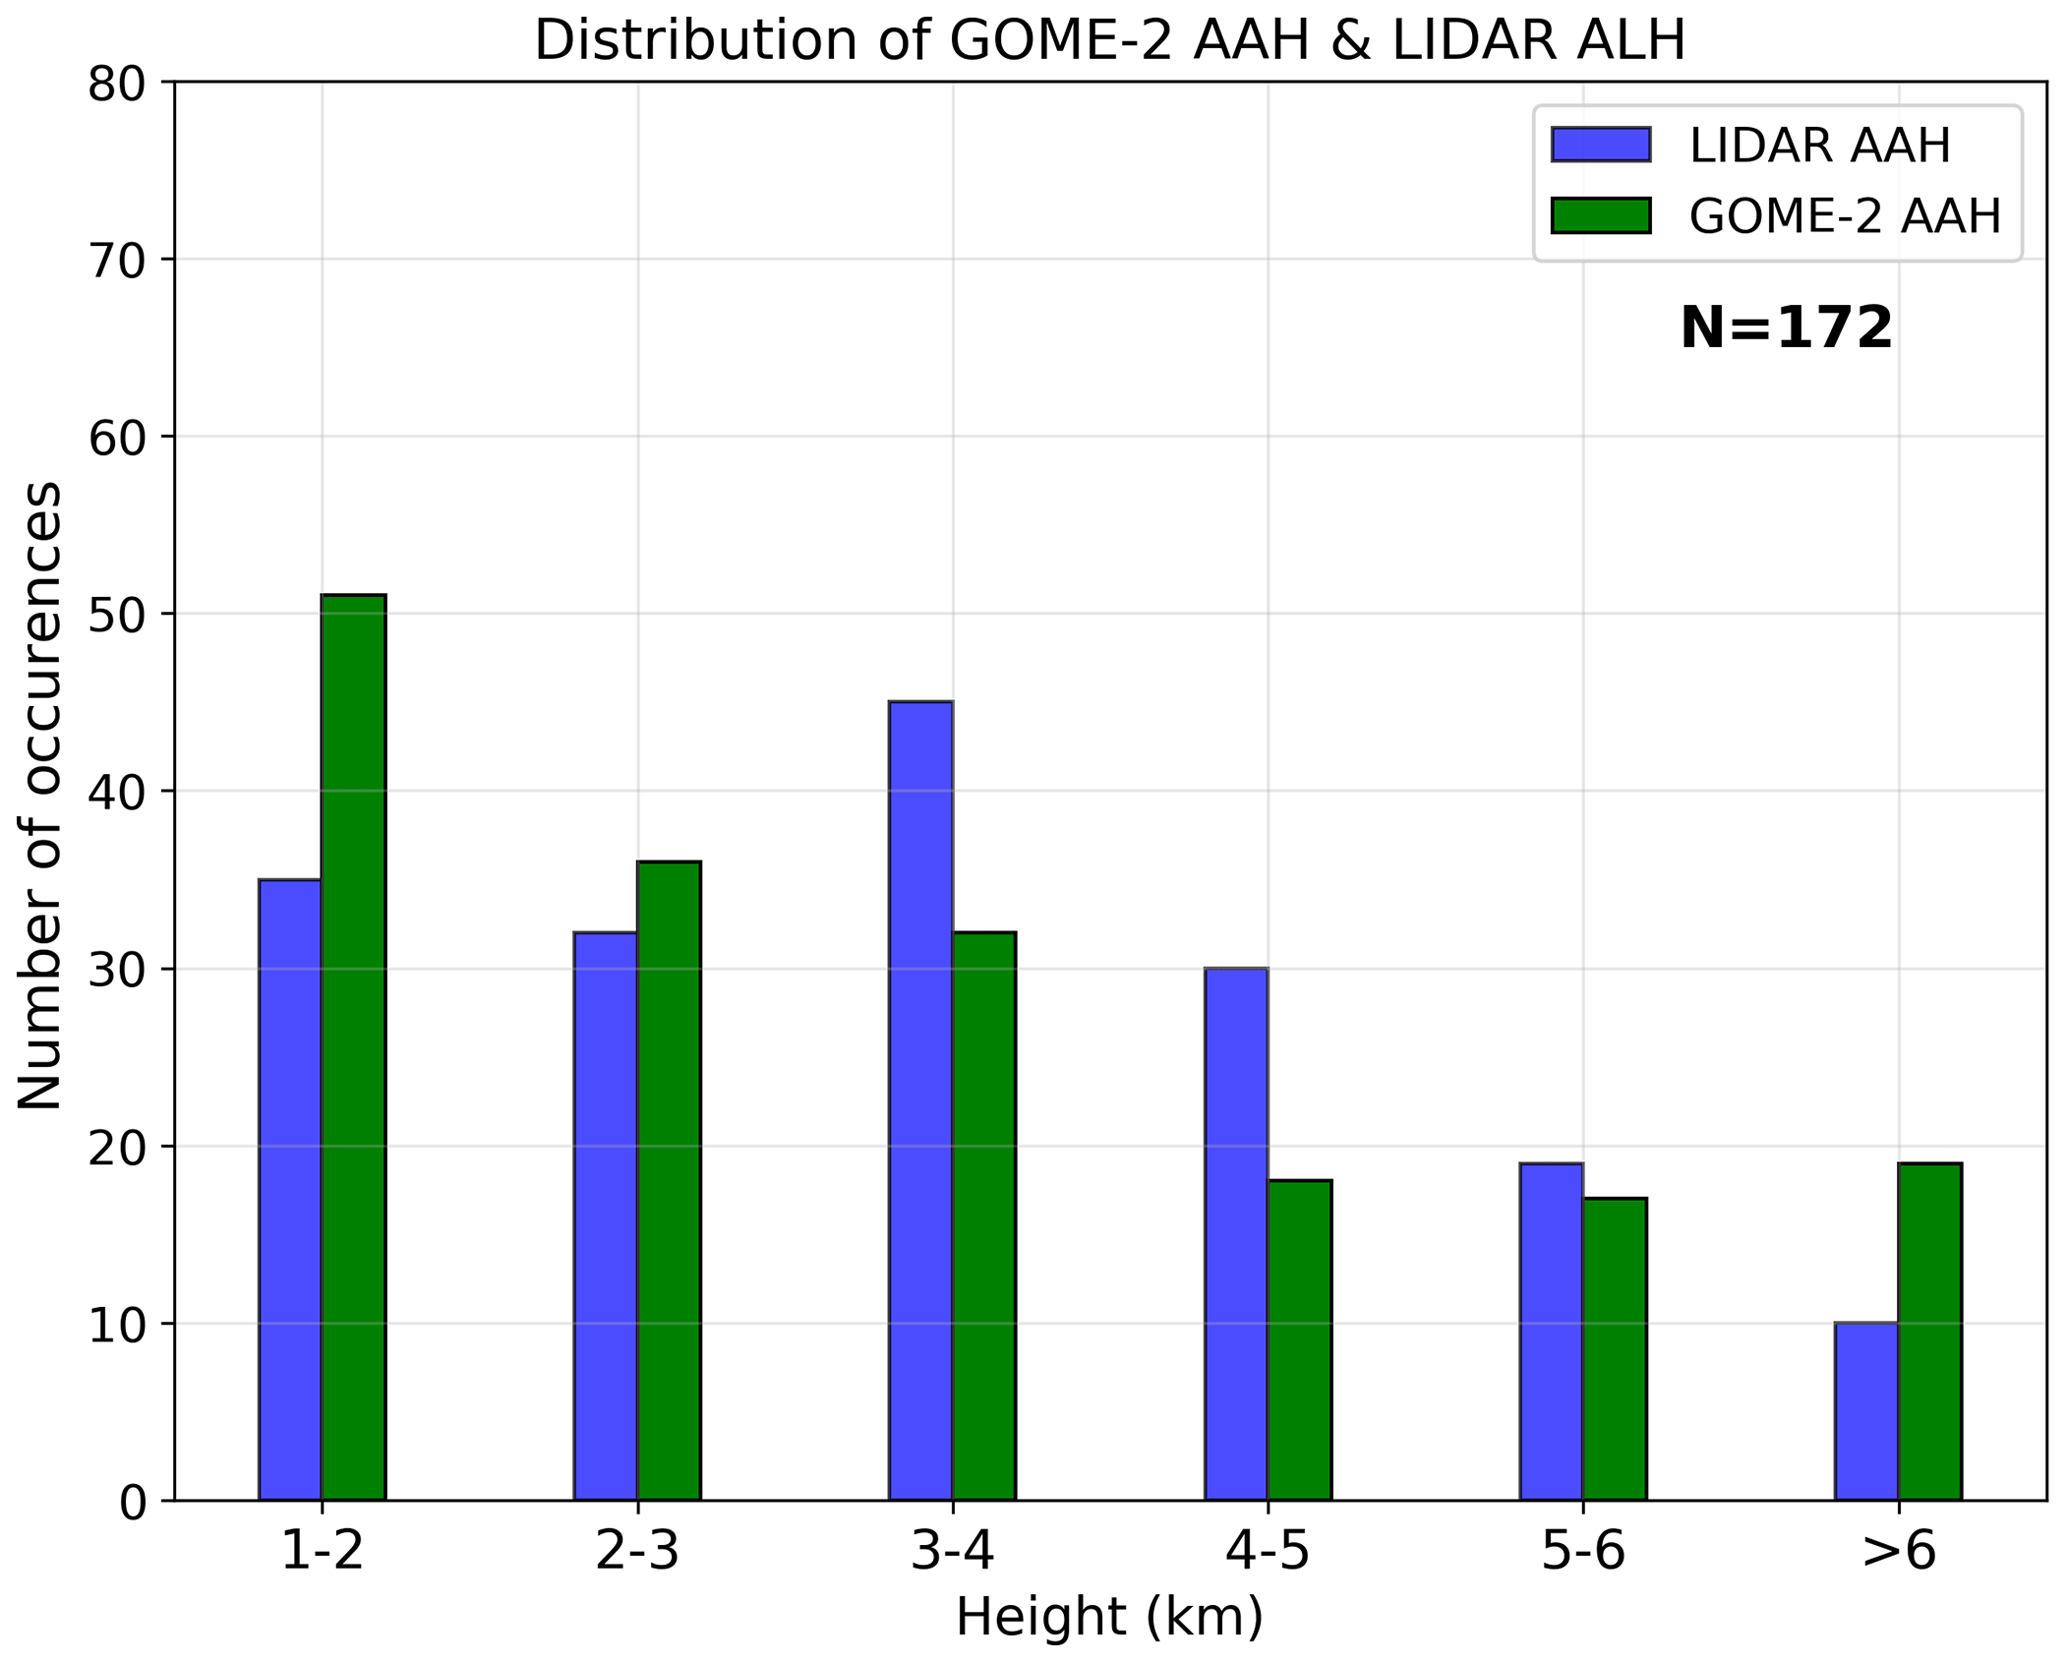
Figure 8Bar plot of GOME-2 AAH (green) and EARLINET ALH (blue) station occurrences. The height ranges of bins are between 1–2, 2–3, 3–4, 4–5, 5–6 and >6 km.

Figure 9Scatterplot between GOME-2 AAH and aerosol layer height from EARLINET stations, for the total of collocated cases. The associated AAI value is colour coded.
In order to verify the origin of the aerosol layers, observed by the ground-based lidar and GOME-2/MetOp satellite, we calculated backward air-mass trajectories by using the HYSPLIT model (Hybrid Single-Particle Lagrangian Integrated Trajectory; available online at http://ready.arl.noaa.gov/HYSPLIT.php, last access: 12 February 2021) through the READY system at the site of Air Resources Laboratory (ARL) of NOAA (National Oceanic and Atmospheric Administration) in the US (Stein et al., 2015; Rolph et al., 2017). GDAS (Global Data Analysis System) meteorological files with a spatial resolution of every 3 h, generated and maintained by ARL, are used as data input. The calculations of backward air-mass trajectories show the provenance of the air mass traversed for a chosen time period before arriving at Évora at 10:00 UTC. The temporal evolution of 5 d backward trajectories, from 21–23 February 2017 for arrival heights 1000 (red), 2000 (blue) and 3500 m (green) to cover the height range of the observed layers that we recognize in structures of height–time displays of the range-corrected lidar signal, is shown in Fig. 11. The trajectory analysis reveals that the origin of aerosol air masses is indeed the Sahara.
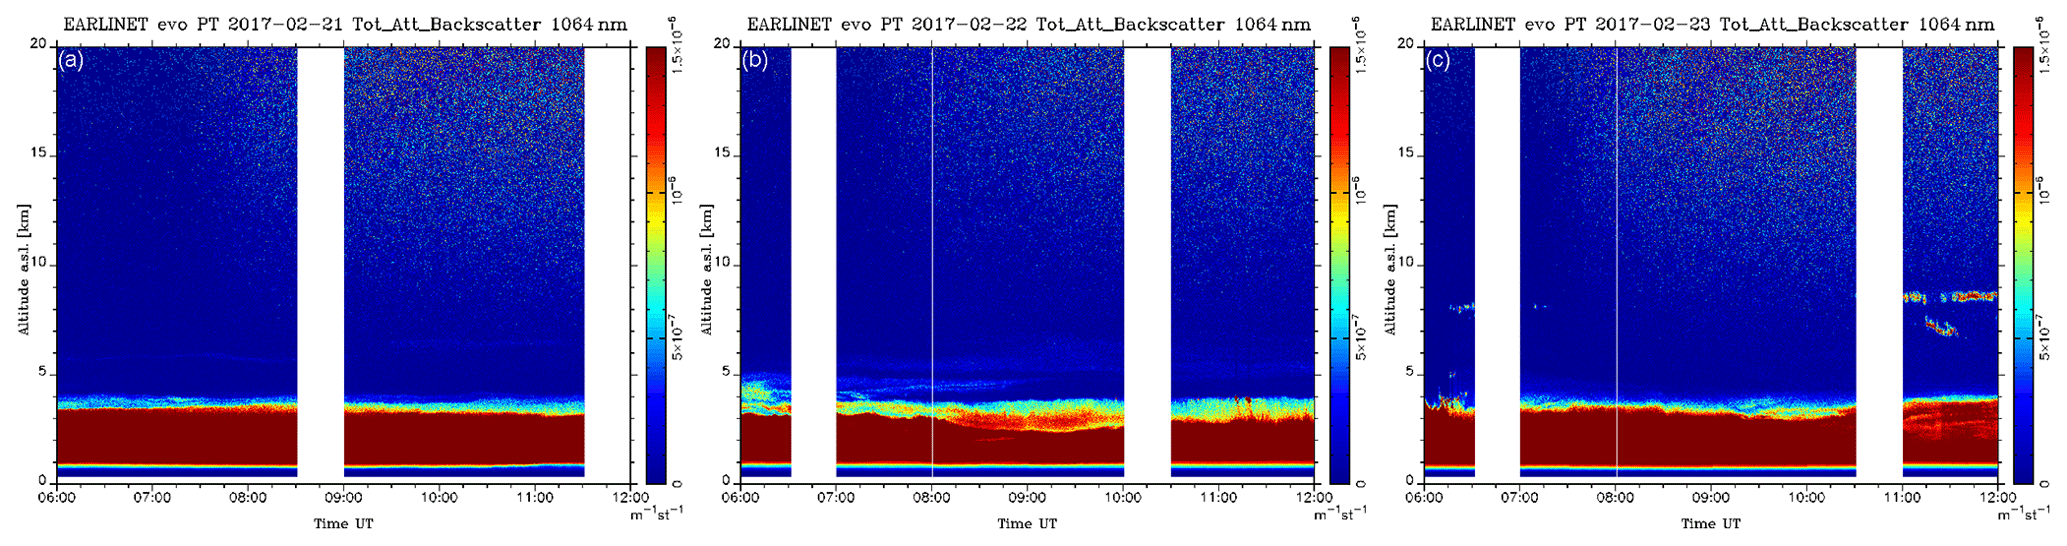
Figure 10Quicklook images corresponding to the total attenuated backscatter at 1064 nm observed with the EARLINET Évora lidar for 21 (a), 22 (b) and 23 February 2017 (c) nicely show the evolution of this particular dust event (https://quicklooks.earlinet.org/, last access: 12 February 2021). (Blue colours indicate a weak backscattering signal, and yellow and red colours indicate a higher backscattering signal.)
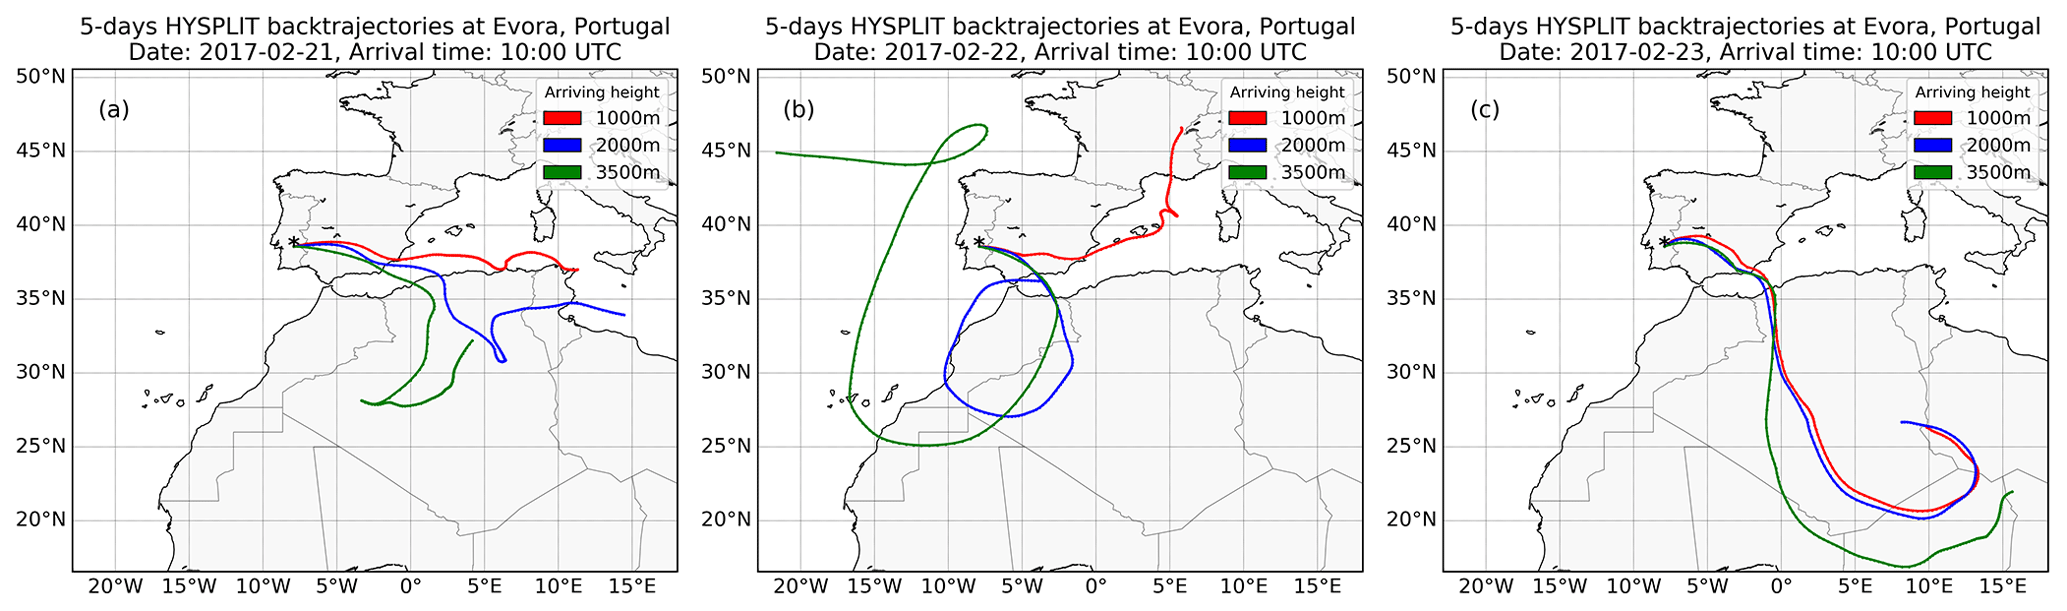
Figure 11The 5 d NOAA HYSPLIT backward trajectories ending at the position of Évora at 10:00 UTC (38.56∘ N, −7.91∘ E) for 21 (a), 22 (b) and 23 February (c) nicely show the evolution of this particular dust event.
In Fig. 12, satellite maps from the Moderate Resolution Imaging Spectroradiometer (MODIS; Levy et al., 2013), an instrument aboard the Terra satellite, show the dust being transported by air masses over the Atlantic before returning towards Portugal and Spain on 21 (Fig. 12a), 22 (Fig. 12b) and 23 February 2017 (Fig. 12c). To illustrate the evaluation methodology for the GOME-2 level-2 AAH, a pair of collocated and concurrent GOME-2 and EARLINET lidar observations is shown in Fig. 13. We apply the proposed methodology in the measurement performed on the morning of 23 February 2017. The case study was selected as a large set of GOME-2 AAH retrieved pixels is available, and extremely high values of AAI are observed, indicating the large aerosol dust load during this day. The retrieved AAH pixels are shown in Fig. 13b, d and the retrieved AAI in Fig. 13a, c. Data gaps in the maps represent screened-out bright pixels due to either cloud or pixels affected by the sun glint effect; recall that AAH retrievals are only available when AAI is ≥2. We will examine this date in particular later on, as the extremely high AAI values, as well as the direct temporal morning collocations, give us confidence in the resulting comparisons.
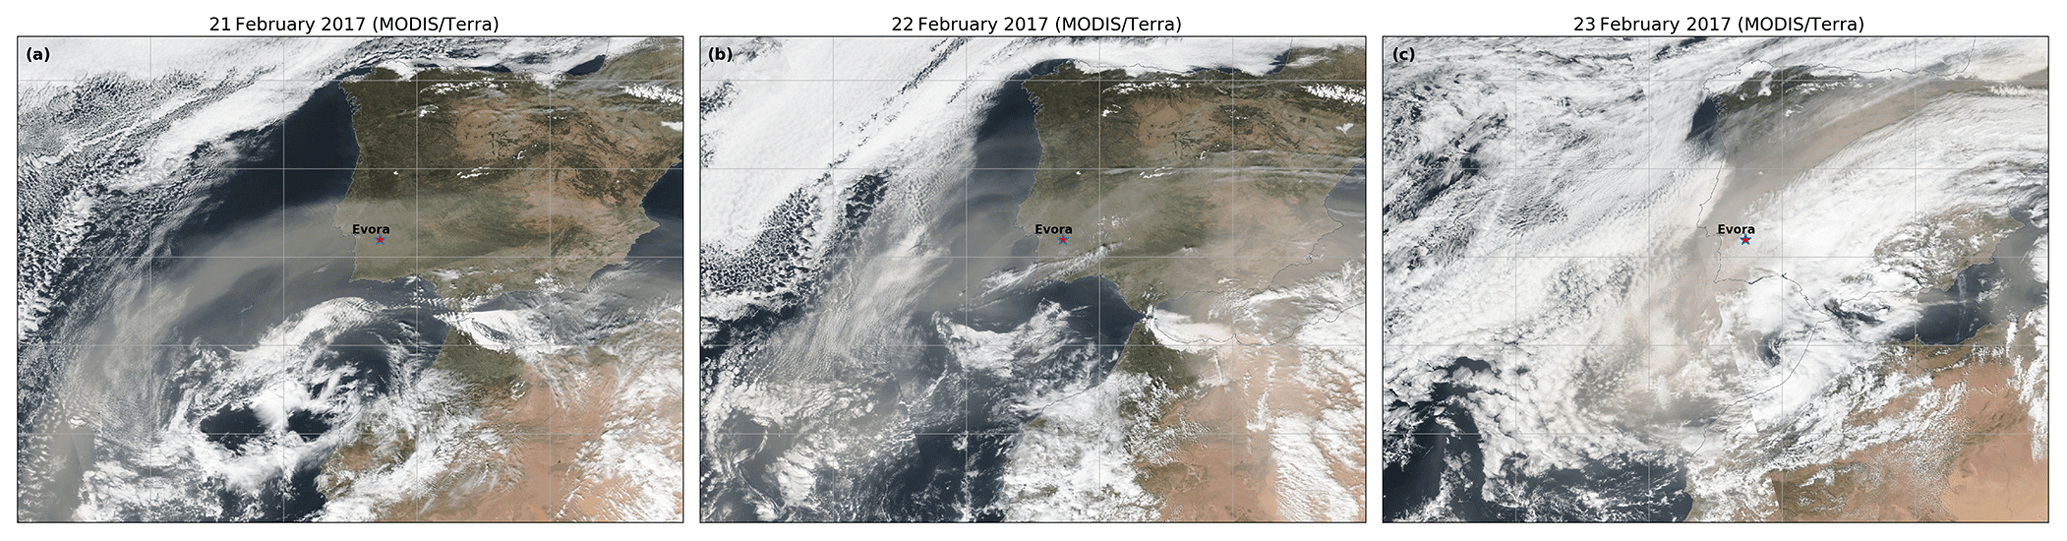
Figure 12Images of Saharan dust transport as captured by the MODIS/Terra satellite, on 21 (a), 22 (b) and 23 February 2017 (c), over the Iberian Peninsula. The orange line denotes the Terra overpasses on 21 (∼ 11:00 LST), 22 (∼ 12:00 LST) and 23 February 2017 (∼ 11:00 LST) (https://worldview.earthdata.nasa.gov/, last access: 12 February 2021).
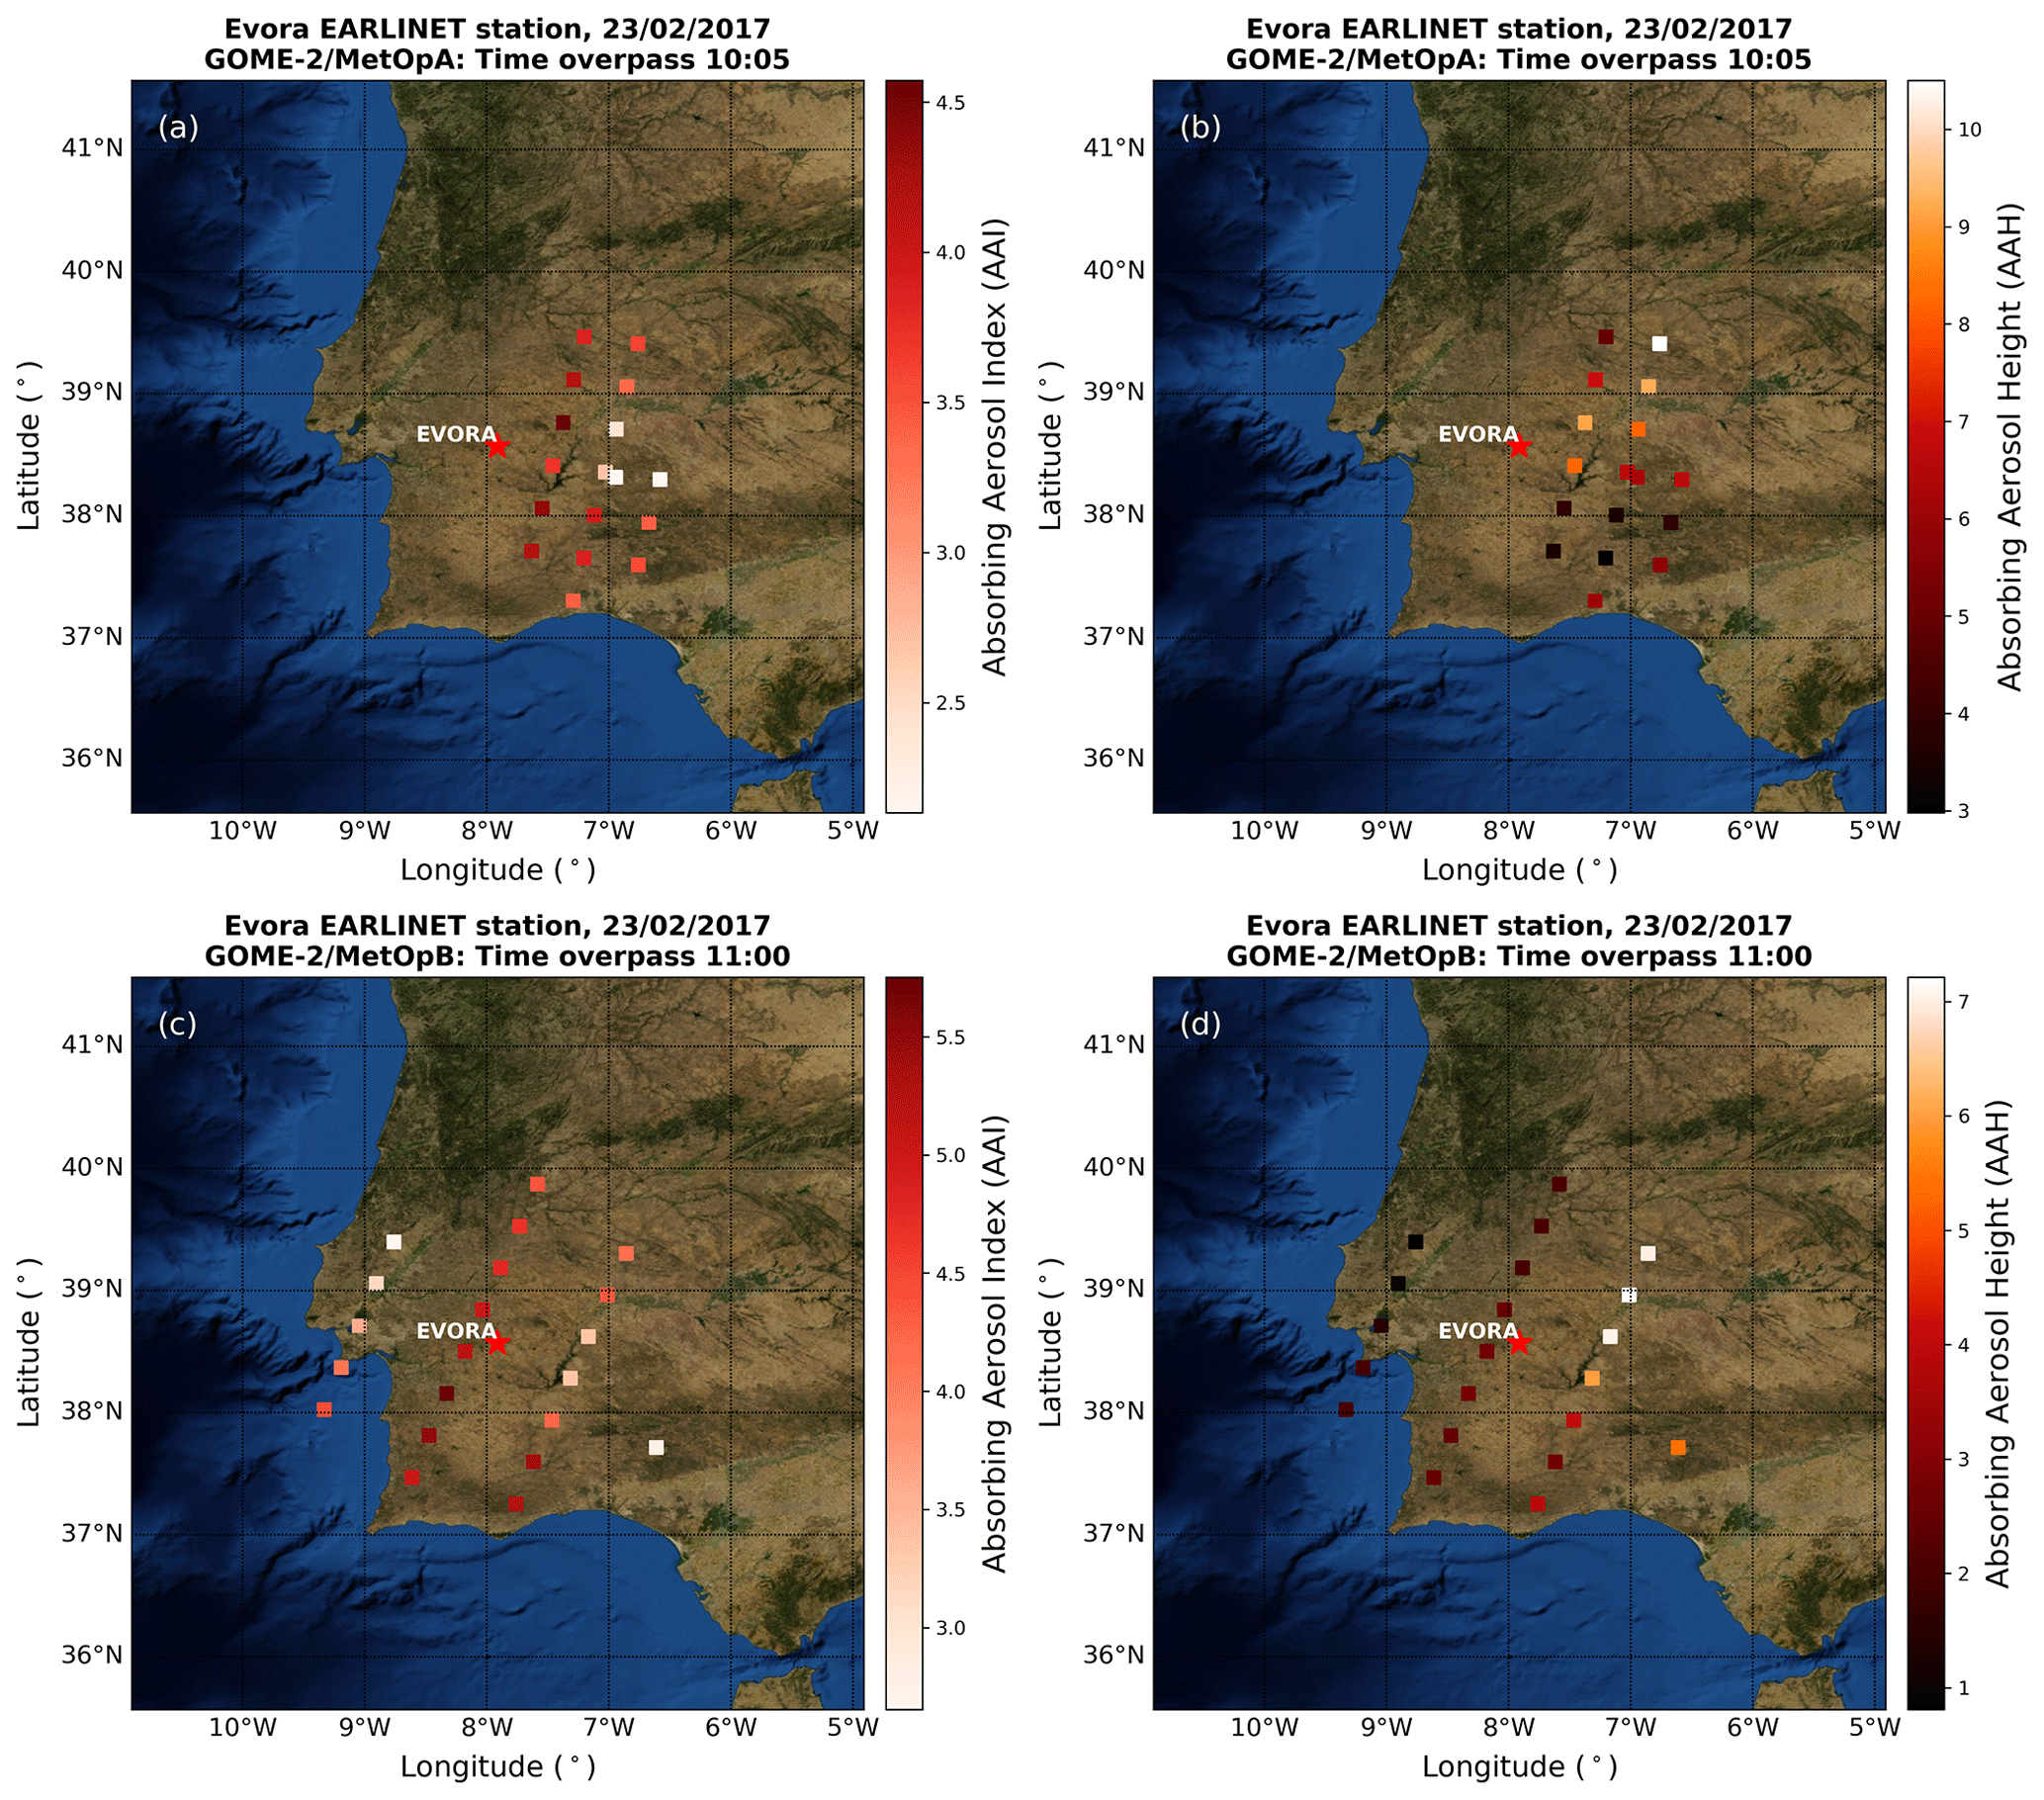
Figure 13The Saharan dust transport on 23 February 2017 over the Iberian Peninsula. The Évora station is marked with the red star. The colour schemes illustrate the altitude of the AAH (b–d) and the AAI (a–c) as observed by GOME-2A (a–b) at 10:00 UTC and GOME-2B (c–d) at 11:00 UTC.
As previously mentioned, both ground- and satellite-based instruments followed this major dust event for 3 d in February 2017. An example of the equivalent backscatter profiles observed by the EARLINET station and the information about coincidence of AAH measured by GOME-2 are reported in Fig. 14. The horizontal dashed blue lines in the left plots indicate the AAH value derived from the centred GOME-2 pixel. Additional information, such as the AAH, aerosol height error, AAI, CF and distance of collocated centred GOME-2 pixels from EARLINET station, is displayed in the legend. On 21 February, a well-defined aerosol layer is picked up by the lidar at 10:01:23 UTC (Fig. 14a), spanning between 1.5 and 3 km. The collocated GOME-2B observation between 09:59 and 10:30 UTC, at a distance of 62.7 km from the ground station, has an associated AAI value of 2.65, cloud fraction of 10 % and an AAH estimate at 2.07 km (dashed blue line), well within the range seen by the lidar at the surface. For the case of 22 February, the aerosol layer appears to split into two separate plumes (Fig. 14c), with GOME-2A reporting an AAI value of 2.07, i.e. quite close to the threshold value of 2.0. Even though the cloud fraction remains low (∼ 10 %), the satellite AAH estimate is quite low (0.8 km). On 23 February (Fig. 14e, f), GOME-2B reports a pixel quite close to the station, at 25 km, and even though the reported AAH of 2.8 km (dashed blue line) is well within the range of the aerosol layer height reported by the lidar, the high cloud fraction of 45 % and associated extreme AAI value of 5.75 make it difficult to draw further conclusions.

Figure 14Évora lidar backscatter profiles (red and green lines; a, c and e) and WCT method applied at 1064 nm (stars; b, d and f) and GOME-2A, GOME-2B AAH (dashed blue line) and associated error, AAI, CF and distance (legend) for 21 (a–b), 22 (b–c) and 23 February (e–f).
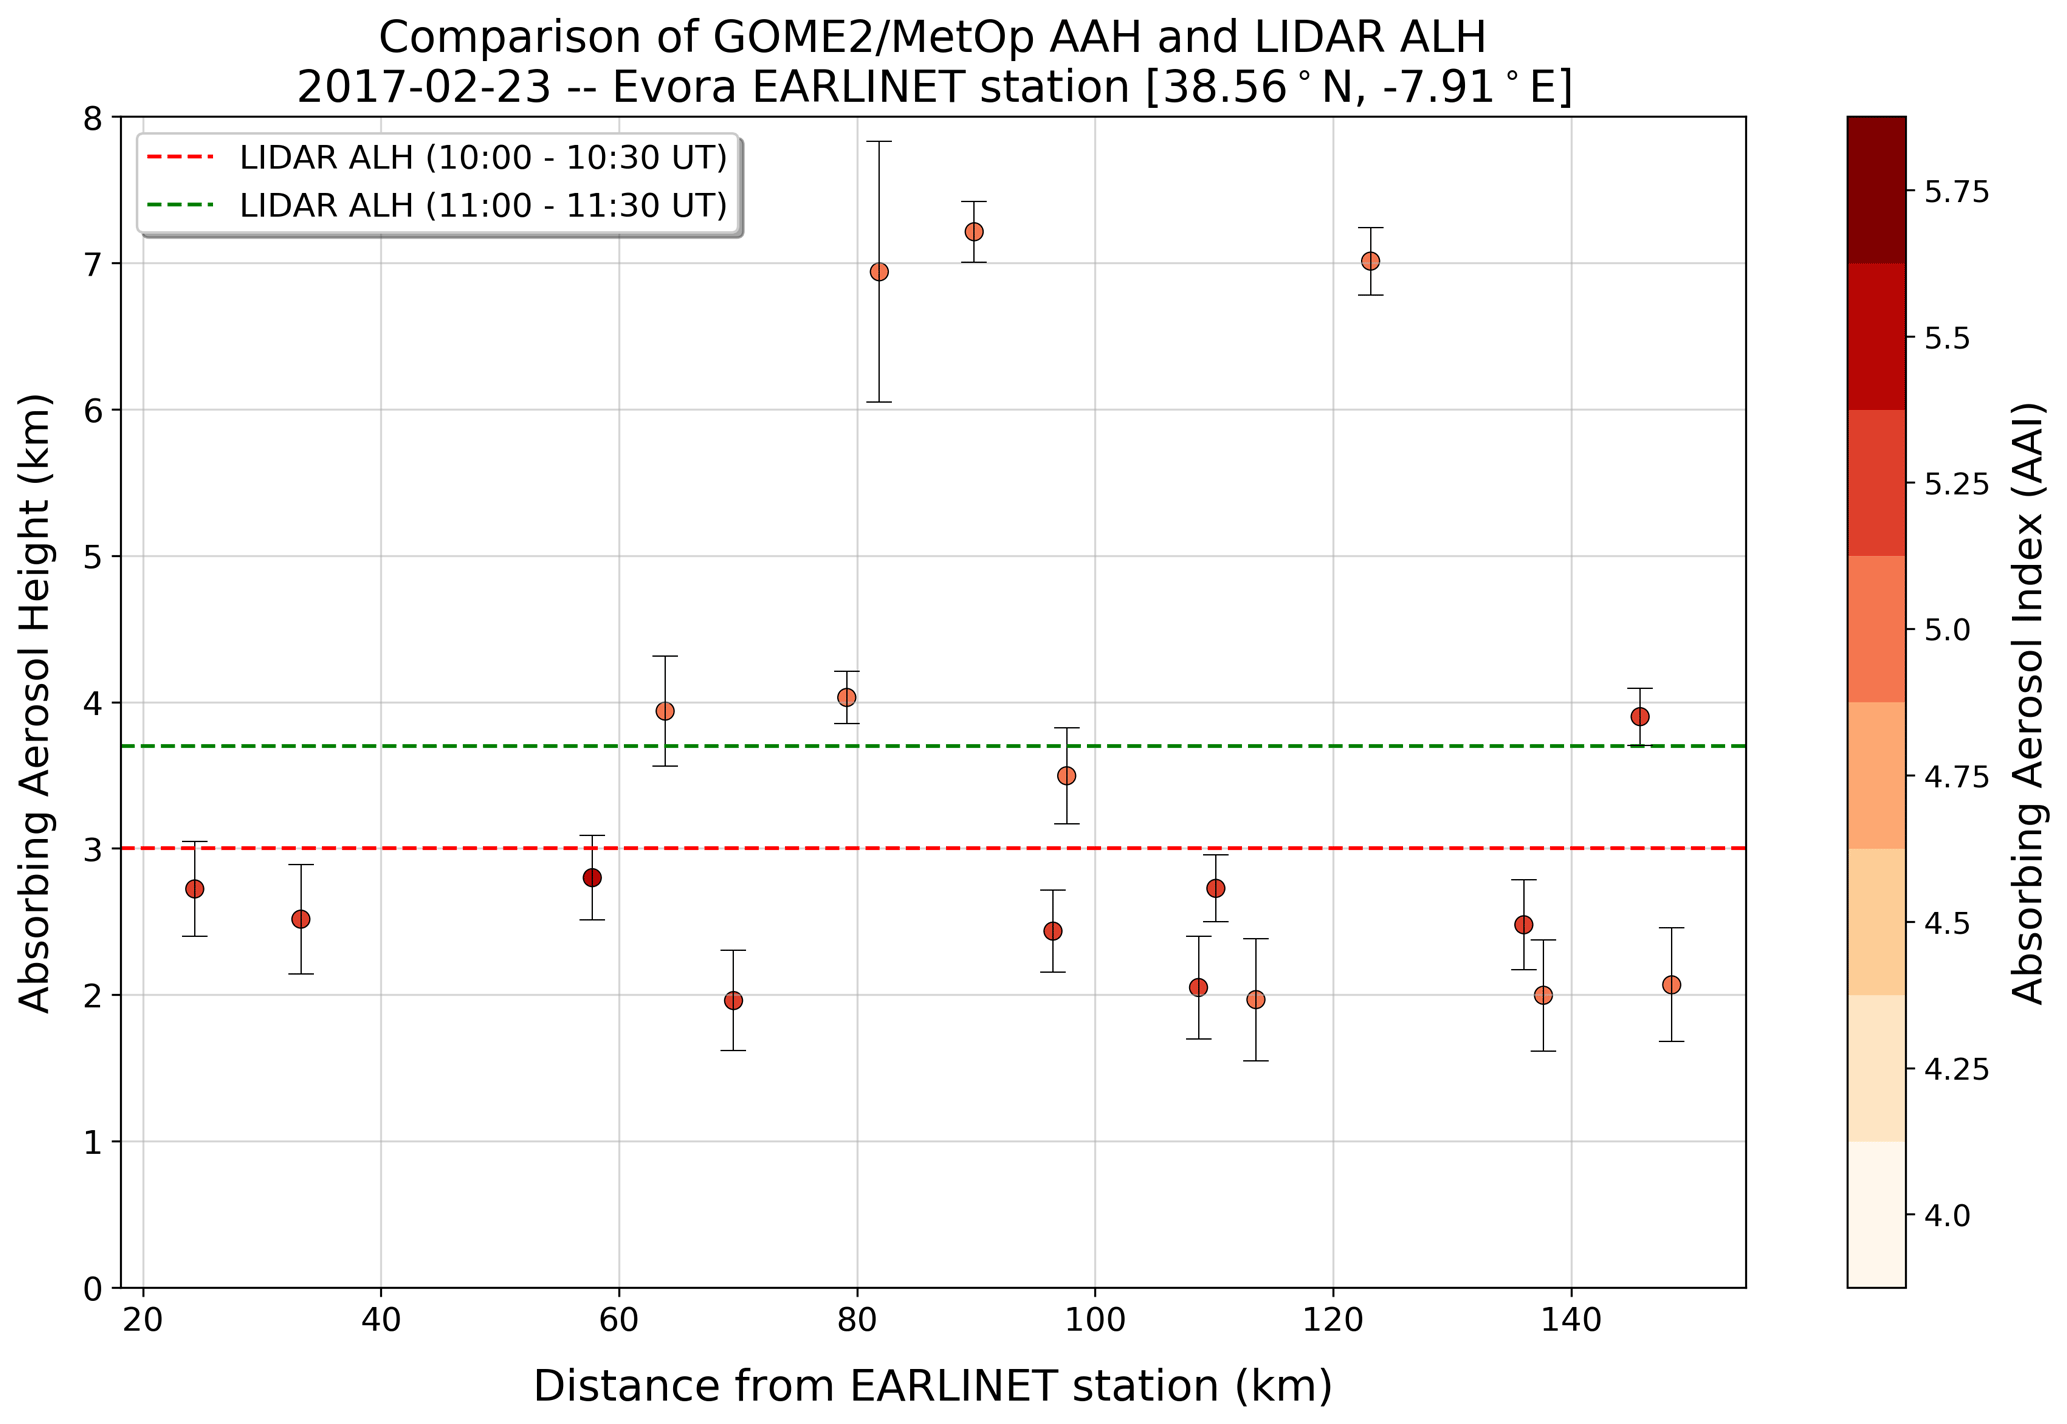
Figure 15GOME-2 AAH (coloured dots) against the distance of the retrieved pixels from Évora lidar station on 23 February 2017. The colour scale on the right indicates the AAI for GOME-2 pixels. The two dashed lines correspond to the simultaneous lidar observations at 10:00–10:30 UTC (red) and 11:00-11:30 UTC (green).
In Fig. 15, we show the comparisons for all GOME-2 pixels against the simultaneous lidar observation for 23 February over the Évora station. The collocated points are colour coded by their associated AAI value. In this way, we can assess whether the general agreement shown by the collocations of Fig. 13 can be turned into a generalized comment on the behaviour of the GOME-2 AAH algorithm for cases of high AAI and good temporal collocations. Due to the sufficient number of collocations in this case study, only observations with AAI larger than 4 are shown. The spread of the satellite estimates is within ± 1 km from the lidar observations (dashed red and green lines) for the vast majority of the cases shown, for all spatial distances between ground and satellite pixel. The results of this study case could be also interpreted by taking into account the representativeness study done using EARLINET and CALIPSO data (Pappalardo et al., 2010) during an intense dust case on 27–30 May 2008. The agreement seems to decrease with larger distances, and this follows the loss of correlation between observations when the distance from the station increases. Additionally, in the same study, Pappalardo et al. (2010) demonstrate that at 100 km maximum horizontal distance, the variability is already strong with time differences larger than 1 h, so this is probably the reason for the observed differences between satellite and ground-based observations. These results further strengthen our original assessment that the satellite algorithm is mature enough to observe stable and homogeneously distributed aerosol layers in the troposphere.
In this paper, we presented the first validation results of GOME-2/MetOp AAH product using lidar data from the EARLINET database. From this scope, lidar backscatter profiles at 1064 nm have been chosen primarily, and in some cases backscatter profiles at 532 nm have been chosen. The total number of carefully screened collocations with the EARLINET lidar measurements was 172 for the three GOME-2 instruments aboard MetOp-A, MetOp-B and MetOp-C between 2007 and 2019. A wide choice of lidar stations around Europe was made in order to examine the behaviour of the comparisons for different common aerosol loads over the locations: southern European stations are often affected by Saharan dust intrusions, central European stations are further affected by local and transboundary pollution events of both anthropogenic and natural origin, and northern European stations are mostly free of dust and most sense particles of anthropogenic provenance. A spatial collocation criterion of 150 km, and temporal of 5 h, were selected so as to obtain a sufficient number of collocations. The official lidar EARLINET dataset has been post-reprocessed by an automatic geometrical feature detection algorithm known as the WCT algorithm. The WCT method make use of the elastic backscattered coefficient at 532 and 1064 nm in combination with criteria flags. This method can be only applied in stations with at least one elastically resolved backscatter profile. The results of this article encourage the operational usage of the WCT-based algorithms in validation processes. The intercomparison results are very promising, showing that the GOME-2 AAH measurements provide a good estimation of the aerosol layer altitudes sensed by the ground-based lidar instruments. On average, the mean absolute bias (GOME-2 minus lidar height) was found to be −0.18 ± 1.68 km, with a near-Gaussian distribution and minimum and maximum differences of ∼ ± 5 km. On a station basis, and with a couple of exceptions, their mean biases fall in the ± 1 km range, with an associated standard deviation between 0.5 and 2 km. Considering the differences, mainly due to the temporal collocation and the difference between the satellite pixel size and the point view of the ground-based observations, these results are quite promising and demonstrate that stable aerosol layers are well captured by the satellite sensors. The official AC SAF requirements for the accuracy of the GOME-2 AAH product state that, for heights <10 km, the threshold accuracy is 3 km, the target accuracy is 2 km, and the optimal accuracy is 1 km. This validation effort shows that for all cases the target accuracy is achieved, and for specific aerosol heights, also the optimal is achieved, which is well within user requirements.
An extreme Saharan dust event, which advected large dust loads from the northern African continent over Iberian Peninsula on 21–23 February 2017, was analysed in detailed. In this case, numerous collocations were found within ± 30 min with the Évora, Portugal, lidar system. This permitted a more stringent criterion on the AAI to be used, permitting collocations with associated AAI >4 to be considered. This validation effort shows that for all cases the target accuracy is achieved, and for well-developed and spatially well-spread aerosol layers, GOME-2 retrievals also meet the optimum user requirements for the aerosol layer height of 1 km. This finding further testifies for the capabilities of the MetOp-borne instruments to sense the atmospheric aerosol layer height. EARLINET represents an optimal tool to validate satellite instrument data and to provide necessary information to fully exploit the data produced. Furthermore, the EARLINET network is a suitable database to contribute also to future passive satellite missions such as TROPOMI (Veefkind et al., 2012) aboard the S5P satellite for the validation of aerosol layer height products.
The data of the GOME-2 AAH product are provided by KNMI in the framework of the EUMETSAT AC SAF. GOME-2 AAI browsed images are freely distributed via the TEMIS website at http://www.temis.nl, last access: 12 February 2021. EARLINET aerosol profile data are reported in the EARLINET database (https://data.earlinet.org, last access: 12 February 2021) and are accessible from its repository and from the ACTRIS data portal (http://actris.nilu.no, last access: 12 February 2021). The data policy of these data is harmonized with the ACTRIS data policy. The authors gratefully acknowledge the NOAA ARL for the provision of the HYSPLIT transport and dispersion model and/or READY website https://www.ready.noaa.gov, last access: 12 February 2021 used in this publication.
KM carried out the processing of satellite and lidar measurements and prepared the figures of the manuscript. MEK and DB were responsible for the methodology and conceptualization of the paper. GP and LM ensured the provision of the QA EARLINET data. OT and LGT were responsible for providing satellite data, detailed description and use of the GOME-2 AAH product. NS contributed to the development of the automatic algorithm for the aerosol layer detection using lidar data. DB reviewed the case study of the Évora EARLINET station, as presented in the paper. KM prepared the manuscript with contributions from all co-authors.
The authors declare that they have no conflict of interest.
This article is part of the special issue “EARLINET aerosol profiling: contributions to atmospheric and climate research”. It is not associated with a conference.
The authors would like to thank the PIs of all EARLINET stations and their staff for establishing and maintaining the EARLINET sites and for the provision of ground-based lidar data used in this paper. The data of the GOME-2 AAI are provided by KNMI in framework of the EUMETSAT AC SAF. The authors acknowledge EARLINET for providing aerosol lidar profiles available at https://data.earlinet.org/, last access: 12 February 2021.
This research has been supported by the project “PANhellenic infrastructure for Atmospheric Composition and climatE change” (grant no. MIS 5021516), which is implemented under the action “Reinforcement of the Research and Innovation Infrastructure”, funded by the operational programme “Competitiveness, Entrepreneurship and Innovation” (NSRF 2014–2020) and co-financed by Greece and the European Union (European Regional Development Fund). This research has been also supported by the ACTRIS-2 project, funded from the European Union's Horizon 2020 research and innovation programme (grant agreement no. 654109), and by ACTRIS-IMP (implementation project), funded in the frame of the H2020 programme (grant agreement no. 871115). The work is partially supported by the European Union through the European Regional Development Fund, included in the COMPETE 2020 (Operational Program Competitiveness and Internationalization) through the ICT project (grant no. UIDB/04683/2020) with the reference no. POCI-01-0145-FEDER-007690 and also through TOMAQAPA (grant no. PTDC/CTAMET/29678/2017).
This paper was edited by Eduardo Landulfo and reviewed by two anonymous referees.
Adam, M., Nicolae, D., Stachlewska, I. S., Papayannis, A., and Balis, D.: Biomass burning events measured by lidars in EARLINET – Part 1: Data analysis methodology, Atmos. Chem. Phys., 20, 13905–13927, https://doi.org/10.5194/acp-20-13905-2020, 2020.
Amiridis, V., Balis, D. S., Giannakaki, E., Stohl, A., Kazadzis, S., Koukouli, M. E., and Zanis, P.: Optical characteristics of biomass burning aerosols over Southeastern Europe determined from UV-Raman lidar measurements, Atmos. Chem. Phys., 9, 2431–2440, https://doi.org/10.5194/acp-9-2431-2009, 2009.
Amiridis, V., Marinou, E., Tsekeri, A., Wandinger, U., Schwarz, A., Giannakaki, E., Mamouri, R., Kokkalis, P., Binietoglou, I., Solomos, S., Herekakis, T., Kazadzis, S., Gerasopoulos, E., Proestakis, E., Kottas, M., Balis, D., Papayannis, A., Kontoes, C., Kourtidis, K., Papagiannopoulos, N., Mona, L., Pappalardo, G., Le Rille, O., and Ansmann, A.: LIVAS: a 3D multi-wavelength aerosol/cloud database based on CALIPSO and EARLINET, Atmos. Chem. Phys., 15, 7127–7153, https://doi.org/10.5194/acp-15-7127-2015, 2015.
Amodeo, A., D'Amico, G., Giunta, A., Papagiannopoulos, N., Papayannis, A., Argyrouli, A., Mylonaki, M., Tsaknakis, G., Kokkalis, P., Soupiona, R., and Tzanis, C.: ATHLI16: the ATHens lidar intercomparison campaign, in: 28th international laser radar conference, Bucharest, Romania, 25–30 June 2017, 176, 09008, https://doi.org/10.1051/epjconf/201817609008, 2018.
Ansmann, A., Bosenberg, J., Chaikovsky, A., Cameron, A., Eckhardt, S., Eixmann, R., Freudenthaler, V., Ginoux, P., Komguem,P., Linne, H., Angel Lopez Marquez, M., Matthias, V., Mattis, I., Mitev, V., Müller, D., Music, S., Nickovic, S., Pelon, J.,Sauvage, L., Sobolewsky, P., Srivastava, M. K., Stohl, A., Torres,O., Vaughan, G., Wandinger, U., and Wiegner, M.: Long-range transport of Saharan dust to northern Europe: The 11–16 October 2001 outbreak observed with EARLINET, J. Geophys. Res., 108, 4783, https://doi.org/10.1029/2003JD003757, 2003.
Ansmann, A., Baars, H., Chudnovsky, A., Mattis, I., Veselovskii, I., Haarig, M., Seifert, P., Engelmann, R., and Wandinger, U.: Extreme levels of Canadian wildfire smoke in the stratosphere over central Europe on 21–22 August 2017, Atmos. Chem. Phys., 18, 11831–11845, https://doi.org/10.5194/acp-18-11831-2018, 2018.
Ansmann, A., Mamouri, R.-E., Bühl, J., Seifert, P., Engelmann, R., Hofer, J., Nisantzi, A., Atkinson, J. D., Kanji, Z. A., Sierau, B., Vrekoussis, M., and Sciare, J.: Ice-nucleating particle versus ice crystal number concentrationin altocumulus and cirrus layers embedded in Saharan dust: a closure study, Atmos. Chem. Phys., 19, 15087–15115, https://doi.org/10.5194/acp-19-15087-2019, 2019.
Baars, H., Ansmann, A., Engelmann, R., and Althausen, D.: Continuous monitoring of the boundary-layer top with lidar, Atmos. Chem. Phys., 8, 7281–7296, https://doi.org/10.5194/acp-8-7281-2008, 2008.
Baars, H., Kanitz, T., Engelmann, R., Althausen, D., Heese, B., Komppula, M., Preißler, J., Tesche, M., Ansmann, A., Wandinger, U., Lim, J.-H., Ahn, J. Y., Stachlewska, I. S., Amiridis, V., Marinou, E., Seifert, P., Hofer, J., Skupin, A., Schneider, F., Bohlmann, S., Foth, A., Bley, S., Pfüller, A., Giannakaki, E., Lihavainen, H., Viisanen, Y., Hooda, R. K., Pereira, S. N., Bortoli, D., Wagner, F., Mattis, I., Janicka, L., Markowicz, K. M., Achtert, P., Artaxo, P., Pauliquevis, T., Souza, R. A. F., Sharma, V. P., van Zyl, P. G., Beukes, J. P., Sun, J., Rohwer, E. G., Deng, R., Mamouri, R.-E., and Zamorano, F.: An overview of the first decade of PollyNET: an emerging network of automated Raman-polarization lidars for continuous aerosol profiling, Atmos. Chem. Phys., 16, 5111–5137, https://doi.org/10.5194/acp-16-5111-2016, 2016.
Balis, D., Giannakaki, E., Müller, D., Amiridis, V., Kelektsoglou, K., Rapsomanikis, S., and Bais, A.: Estimation of the microphysical aerosol properties over Thessaloniki, Greece, during the SCOUT-O3 campaign with the synergy of Raman lidar and sunphotometer data, J. Geophys. Res., 115, D08202, https://doi.org/10.1029/2009JD013088, 2010.
Balis, D., Koukouli, M.-E., Siomos, N., Dimopoulos, S., Mona, L., Pappalardo, G., Marenco, F., Clarisse, L., Ventress, L. J., Carboni, E., Grainger, R. G., Wang, P., Tilstra, G., van der A, R., Theys, N., and Zehner, C.: Validation of ash optical depth and layer height retrieved from passive satellite sensors using EARLINET and airborne lidar data: the case of the Eyjafjallajökull eruption, Atmos. Chem. Phys., 16, 5705–5720, https://doi.org/10.5194/acp-16-5705-2016, 2016.
Banks, R. F., Tiana-Alsina, J., Baldasano, J. M., Rocadenbosch, F., Papayannis, A., Solomos, S., and Tzanis, C. G: Sensitivity of boundary-layer variables to PBL schemes in the WRF model based on surface meteorological observations, lidar, and radiosondes during the HygrA-CD campaign, Atmos. Res., 176–177, 185–201, https://doi.org/10.1016/j.atmosres.2016.02.024, 2016.
Bougiatioti, A., Bezantakos, S., Stavroulas, I., Kalivitis, N., Kokkalis, P., Biskos, G., Mihalopoulos, N., Papayannis, A., and Nenes, A.: Biomass-burning impact on CCN number, hygroscopicity and cloud formation during summertime in the eastern Mediterranean, Atmos. Chem. Phys., 16, 7389–7409, https://doi.org/10.5194/acp-16-7389-2016, 2016.
Brooks, I. M.: Finding Boundary Layer Top: Application of a Wavelet Covariance Transform to Lidar Backscatter Profiles, J. Atmos. Ocean. Tech., 20, 1092–1105, https://doi.org/10.1175/1520-0426(2003)020<1092:FBLTAO>2.0.CO;2, 2003.
Caicedo, V., Rappenglück, B., Lefer, B., Morris, G., Toledo, D., and Delgado, R.: Comparison of aerosol lidar retrieval methods for boundary layer height detection using ceilometer aerosol backscatter data, Atmos. Meas. Tech., 10, 1609–1622, https://doi.org/10.5194/amt-10-1609-2017, 2017.
Chimot, J., Veefkind, J. P., Vlemmix, T., and Levelt, P. F.: Spatial distribution analysis of the OMI aerosol layer height: a pixel-by-pixel comparison to CALIOP observations, Atmos. Meas. Tech., 11, 2257–2277, https://doi.org/10.5194/amt-11-2257-2018, 2018.
D'Amico, G., Amodeo, A., Baars, H., Binietoglou, I., Freudenthaler, V., Mattis, I., Wandinger, U., and Pappalardo, G.: EARLINET Single Calculus Chain – overview on methodology and strategy, Atmos. Meas. Tech., 8, 4891–4916, https://doi.org/10.5194/amt-8-4891-2015, 2015.
Davis, A. B., Kalashnikova, O. V., and Diner, D. J.: Aerosol Layer Height over Water from O2A-Band: Mono-Angle Hyperspectral and/or Bi-Spectral Multi-Angle Observations, https://doi.org/10.20944/preprints201710.0055.v1, 2017.
De Bock, V., Decloo, A., Michailidis, K., Koukouli, M., and Balis, D.: SAF/AC VALIDATION REPORT, Absorbing Aerosol Height, SAF/AC/AUTH-RMI/VR/001, available at: https://acsaf.org/docs/vr/Validation_Report_AAH_Jul_2020.pdf, last access: 15 October 2020.
De Graaf, M., Stammes, P., Torres, O., and Koelemeijer, R. B. A.: Absorbing Aerosol Index: sensitivity analysis, application to GOME and comparison with TOMS, J. Geophys. Res., 110, D01201, https://doi.org/10.1029/2004JD005178, 2005.
Engelmann, R., Kanitz, T., Baars, H., Heese, B., Althausen, D., Skupin, A., Wandinger, U., Komppula, M., Stachlewska, I. S., Amiridis, V., Marinou, E., Mattis, I., Linné, H., and Ansmann, A.: The automated multiwavelength Raman polarization and water-vapor lidar PollyXT: the neXT generation, Atmos. Meas. Tech., 9, 1767–1784, https://doi.org/10.5194/amt-9-1767-2016, 2016.
Fernández, A. J., Sicard, M., Costa, M. J., Guerrero-Rascado, J. L., Gómez-Amo, J. L., Molero, F., Barragán, R., Basart S., Bortoli, D., Bedoya-Velásquez, A. E., Utrillas, M. P., Salvador, P., Granados-Muñoz, M. J., Potes, M., Ortiz-Amezcua, P., Martínez-Lozano, J. A., Artíñano, B., Muñoz-Porcar, C., Salgado, R., Román, R., Rocadenbosch, F., Salgueiro, V., Benavent-Oltra, J. A., Rodríguez-Gómez, A., Alados-Arboledas, L., Comerón, A., and Pujadas, M.: Extreme, wintertime Saharan dust intrusion in the Iberian Peninsula: Lidar monitoring and evaluation of dust forecast models during the February 2017 event, Atmos. Res., 228, 223–241, https://doi.org/10.1016/j.atmosres.2019.06.007, 2019.
Flamant, C., Pelon, J., Flamant, P. H., and Durand Lidar, P.: determination of the entrainment zone thickness at the top of the unstable marine atmospheric boundary layer, Bound.-Lay. Meteorol., 83, 247–284, 1997.
Freudenthaler, V.: About the effects of polarising optics on lidar signals and the Δ90 calibration, Atmos. Meas. Tech., 9, 4181–4255, https://doi.org/10.5194/amt-9-4181-2016, 2016.
Freudenthaler, V., Linné, H., Chaikovski, A., Rabus, D., and Groß, S.: EARLINET lidar quality assurance tools, Atmos. Meas. Tech. Discuss. , https://doi.org/10.5194/amt-2017-395, in review, 2018.
Georgoulias, A. K., Marinou, E., Tsekeri, A., Proestakis, E., Akritidis, D., Alexandri, G., Zanis, P., Balis, D., Marenco, F., Tesche, M., and Amiridis, V.: A first case study of CCN concentrations from spaceborne lidar observations, Remote Sens.-Basel, 12, 1557, https://doi.org/10.3390/rs12101557, 2020.
Giannakaki, E., Balis, D. S., Amiridis, V., and Zerefos, C.: Optical properties of different aerosol types: seven years of combined Raman-elastic backscatter lidar measurements in Thessaloniki, Greece, Atmos. Meas. Tech., 3, 569–578, https://doi.org/10.5194/amt-3-569-2010, 2010.
Hassinen, S., Balis, D., Bauer, H., Begoin, M., Delcloo, A., Eleftheratos, K., Gimeno Garcia, S., Granville, J., Grossi, M., Hao, N., Hedelt, P., Hendrick, F., Hess, M., Heue, K.-P., Hovila, J., Jønch-Sørensen, H., Kalakoski, N., Kauppi, A., Kiemle, S., Kins, L., Koukouli, M. E., Kujanpää, J., Lambert, J.-C., Lang, R., Lerot, C., Loyola, D., Pedergnana, M., Pinardi, G., Romahn, F., van Roozendael, M., Lutz, R., De Smedt, I., Stammes, P., Steinbrecht, W., Tamminen, J., Theys, N., Tilstra, L. G., Tuinder, O. N. E., Valks, P., Zerefos, C., Zimmer, W., and Zyrichidou, I.: Overview of the O3M SAF GOME-2 operational atmospheric composition and UV radiation data products and data availability, Atmos. Meas. Tech., 9, 383–407, https://doi.org/10.5194/amt-9-383-2016, 2016.
IPCC: Climate Change 2014, Synthesis Report, Contribution of Working Groups I, II and III to the Fifth Assessment Report of the Intergovernmental Panel on Climate Change, edited by: The Core Writing Team, Pachauri, R. K., and Meyer, L. A., The Intergovernmental Panel on Climate Change (IPCC), Geneva, Switzerland, 151 pp., available at: http://www.ipcc.ch/report/ar5/syr/ (last access: 8 April 2020), 2014.
Kalman, R. E.: A new approach to linear filtering and prediction problems, J. Basic Eng.-T. ASME, 82, 35–45, 1960.
Kipling, Z., Stier, P., Johnson, C. E., Mann, G. W., Bellouin, N., Bauer, S. E., Bergman, T., Chin, M., Diehl, T., Ghan, S. J., Iversen, T., Kirkevåg, A., Kokkola, H., Liu, X., Luo, G., van Noije, T., Pringle, K. J., von Salzen, K., Schulz, M., Seland, Ø., Skeie, R. B., Takemura, T., Tsigaridis, K., and Zhang, K.: What controls the vertical distribution of aerosol? Relationships between process sensitivity in HadGEM3–UKCA and inter-model variation from AeroCom Phase II, Atmos. Chem. Phys., 16, 2221–2241, https://doi.org/10.5194/acp-16-2221-2016, 2016.
Klett, J. D.: Stable analytical inversion solution for processing lidar returns, Appl. Optics, 20, 211–220, https://doi.org/10.1364/AO.20.000211, 1981.
Klett, J. D.: Lidar inversion with variable backscatter/extinction ratios, Appl. Optics, 24, 1638–1643, 1985.
Kokkalis, P., Alexiou, D., Papayannis, A., Rocadenbosch, F., Soupiona O., Raptis, P. I., Mylonaki, M., Tzanis, G. C., and Christodoulakis, J.: Application and Testing of the Extended-Kalman-Filtering Technique for Determining the Planetary Boundary-Layer Height over Athens, Greece, Bound.-Lay. Meteorol., 176, 125–147, https://doi.org/10.1007/s10546-020-00514-z, 2020.
Laaksonen, A., Malila, J., and Nenes, A.: Heterogeneous nucleation of water vapor on different types of black carbon particles, Atmos. Chem. Phys., 20, 13579–13589, https://doi.org/10.5194/acp-20-13579-2020, 2020.
Levy, R. C., Mattoo, S., Munchak, L. A., Remer, L. A., Sayer, A. M., Patadia, F., and Hsu, N. C.: The Collection 6 MODIS aerosol products over land and ocean, Atmos. Meas. Tech., 6, 2989–3034, https://doi.org/10.5194/amt-6-2989-2013, 2013.
Mamouri, R. E., Papayannis, A., Amiridis, V., Müller, D., Kokkalis, P., Rapsomanikis, S., Karageorgos, E. T., Tsaknakis, G., Nenes, A., Kazadzis, S., and Remoundaki, E.: Multi-wavelength Raman lidar, sun photometric and aircraft measurements in combination with inversion models for the estimation of the aerosol optical and physico-chemical properties over Athens, Greece, Atmos. Meas. Tech., 5, 1793–1808, https://doi.org/10.5194/amt-5-1793-2012, 2012.
Mattis, I., D'Amico, G., Baars, H., Amodeo, A., Madonna, F., and Iarlori, M.: EARLINET Single Calculus Chain – technical – Part 2: Calculation of optical products, Atmos. Meas. Tech., 9, 3009–3029, https://doi.org/10.5194/amt-9-3009-2016, 2016.
Mona, L., Pappalardo, G., Amodeo, A., D'Amico, G., Madonna, F., Boselli, A., Giunta, A., Russo, F., and Cuomo, V.: One year of CNR-IMAA multi-wavelength Raman lidar measurements in coincidence with CALIPSO overpasses: Level 1 products comparison, Atmos. Chem. Phys., 9, 7213–7228, https://doi.org/10.5194/acp-9-7213-2009, 2009.
Mona, L., Liu, Z., Müller, D., Omar, A., Papayannis, A., Pappalardo, G., Sugimoto, N., and Vaughan, M.: Lidar measurements for desert dust characterization: An overview, Adv. Meteorol., 2012, 36 pp., https://doi.org/10.1155/2012/356265, 2012.
Mona, L., Papagiannopoulos, N., Basart, S., Baldasano, J., Binietoglou, I., Cornacchia, C., and Pappalardo, G.: EARLINET dust observations vs. BSC-DREAM8b modeled profiles: 12-year-long systematic comparison at Potenza, Italy, Atmos. Chem. Phys., 14, 8781–8793, https://doi.org/10.5194/acp-14-8781-2014, 2014.
Müller, D., Ansmann, A., Mattis, I., Tesche, M., Wandinger, U., Althausen, D., and Pisani, G.: Aerosol-type-dependent lidar ratios observed with Raman lidar, J. Geophys. Res.-Atmos., 112, D16202, https://doi.org/10.1029/2006JD008292, 2007.
Munro, R., Lang, R., Klaes, D., Poli, G., Retscher, C., Lindstrot, R., Huckle, R., Lacan, A., Grzegorski, M., Holdak, A., Kokhanovsky, A., Livschitz, J., and Eisinger, M.: The GOME-2 instrument on the Metop series of satellites: instrument design, calibration, and level 1 data processing – an overview, Atmos. Meas. Tech., 9, 1279–1301, https://doi.org/10.5194/amt-9-1279-2016, 2016.
Nanda, S., de Graaf, M., Veefkind, J. P., Sneep, M., ter Linden, M., Sun, J., and Levelt, P. F.: A first comparison of TROPOMI aerosol layer height (ALH) to CALIOP data, Atmos. Meas. Tech., 13, 3043–3059, https://doi.org/10.5194/amt-13-3043-2020, 2020.
Nelson, D. L., Garay, M. J., Kahn, R. A., and Dunst, B. A.: Stereoscopic height and wind retrievals for aerosol plumes with the MISR INteractive eXplorer (MINX), Remote Sens.-Basel, 5, 4593–4628, https://doi.org/10.3390/rs5094593, 2013.
Papagiannopoulos, N., Mona, L., Alados-Arboledas, L., Amiridis, V., Baars, H., Binietoglou, I., Bortoli, D., D'Amico, G., Giunta, A., Guerrero-Rascado, J. L., Schwarz, A., Pereira, S., Spinelli, N., Wandinger, U., Wang, X., and Pappalardo, G.: CALIPSO climatological products: evaluation and suggestions from EARLINET, Atmos. Chem. Phys., 16, 2341–2357, https://doi.org/10.5194/acp-16-2341-2016, 2016.
Papayannis, A., Amiridis, V., Mona, L., Tsaknakis, G., Balis, D., Bösenberg, J., Chaikovski, A., De Tomasi, F., Grigorov, I., Mattis, I., Mitev, V., Müller, D., Nickovic, S., Perez, C., Pietruczuk, A., Pisani, G., Ravetta, F., Rizi, V., Sicard, M., Trickl, T., Wiegner, M., Gerding, M., Mamouri, R. E., D'Amico, G., and Pappalardo, G.: Systematic lidar observations of Saharan dust over Europe in the frame of EARLINET (2000–2002), J. Geophys. Res., 113, D10204, https://doi.org/10.1029/2007JD009028, 2008.
Pappalardo, G., Amodeo, A., Pandolfi, M., Wandinger, U., Ansmann, A., Bösenberg, J., Matthias, V., Amiridis, V., De Tomasi, F., Frioud, M., Iarlori, M., Komguem, L., Papayannis, A., Rocadenbosch, F., and Wang, X.: Aerosol lidar intercomparison in the framework of the EARLINET project 3, Raman lidar algorithm for aerosol extinction, backscatter and lidar ratio, Appl. Optics, 43, 5370–5385, 2004.
Pappalardo, G., Wandinger, U., Mona, L., Hiebsch, A., Mattis, I., Amodeo, A., Ansmann, A., Seifert, P., Linné, H., Apituley, A., Alados Arboledas, L., Balis, D., Chaikovsky, A., D'Amico, G., De Tomasi, F., Freudenthaler, V., Giannakaki, E., Giunta, A., Grigorov, I., Iarlori, M., Madonna, F., Mamouri, R., Nasti, L., Papayannis, A., Pietruczuk, A., Pujadas, M., Rizi, V., Rocadenbosch, F., Russo, F., Schnell, F., Spinelli, N., Wang, X., and Wiegner, M.: EARLINET correlative measurements for CALIPSO: first intercomparison results, J. Geophys. Res., 115, D00H19, https://doi.org/10.1029/2009JD012147, 2010.
Pappalardo, G., Mona, L., D'Amico, G., Wandinger, U., Adam, M., Amodeo, A., Ansmann, A., Apituley, A., Alados Arboledas, L., Balis, D., Boselli, A., Bravo-Aranda, J. A., Chaikovsky, A., Comeron, A., Cuesta, J., De Tomasi, F., Freudenthaler, V., Gausa, M., Giannakaki, E., Giehl, H., Giunta, A., Grigorov, I., Groß, S., Haeffelin, M., Hiebsch, A., Iarlori, M., Lange, D., Linné, H., Madonna, F., Mattis, I., Mamouri, R.-E., McAuliffe, M. A. P., Mitev, V., Molero, F., Navas-Guzman, F., Nicolae, D., Papayannis, A., Perrone, M. R., Pietras, C., Pietruczuk, A., Pisani, G., Preißler, J., Pujadas, M., Rizi, V., Ruth, A. A., Schmidt, J., Schnell, F., Seifert, P., Serikov, I., Sicard, M., Simeonov, V., Spinelli, N., Stebel, K., Tesche, M., Trickl, T., Wang, X., Wagner, F., Wiegner, M., and Wilson, K. M.: Four-dimensional distribution of the 2010 Eyjafjallajökull volcanic cloud over Europe observed by EARLINET, Atmos. Chem. Phys., 13, 4429–4450, https://doi.org/10.5194/acp-13-4429-2013, 2013.
Pappalardo, G., Amodeo, A., Apituley, A., Comeron, A., Freudenthaler, V., Linné, H., Ansmann, A., Bösenberg, J., D'Amico, G., Mattis, I., Mona, L., Wandinger, U., Amiridis, V., Alados-Arboledas, L., Nicolae, D., and Wiegner, M.: EARLINET: towards an advanced sustainable European aerosol lidar network, Atmos. Meas. Tech., 7, 2389–2409, https://doi.org/10.5194/amt-7-2389-2014, 2014.
Pérez, C., Nickovic, S., Baldasano, J. M., Sicard, M., Rocadenbosch, F., and Cachorro, V. E.: A long Saharan dust event over the western Mediterranean: lidar, Sun photometer observations, and regional dust modeling?, J. Geophys. Res., 111, D15214, https://doi.org/10.1029/2005JD006579, 2006.
Rocadenbosch, F., Soriano, C., Comerón, A., and Baldasano, J.-M.: Lidar inversion of atmospheric backscatter and extinction-to-backscatter ratios by use of a Kalman filter, Appl. Opt., 38, 3175–3189, https://doi.org/10.1364/AO.38.003175, 1999.
Rolph, G., Stein, A., and Stunder, B.: Real-time Environmental Applications and Display system: READY, Environ. Modell. Softw., 95, 210–228, https://doi.org/10.1016/j.envsoft.2017.06.025, 2017.
Sanders, A. F. J., de Haan, J. F., Sneep, M., Apituley, A., Stammes, P., Vieitez, M. O., Tilstra, L. G., Tuinder, O. N. E., Koning, C. E., and Veefkind, J. P.: Evaluation of the operational Aerosol Layer Height retrieval algorithm for Sentinel-5 Precursor: application to O2 A band observations from GOME-2A, Atmos. Meas. Tech., 8, 4947–4977, https://doi.org/10.5194/amt-8-4947-2015, 2015.
Seinfeld, J. H., Bretherton, C. S., Carslaw, K. S., Coe, H., De-Mott, P. J., Dunlea, E. J., Feingold, G., Ghan, S. J., Guenther, A. B., Kahn, R. A., Kracunas, I. P., Kreidenweis, S. M., Molina, M. J., Nenes, A., Penner, J. E., Prather, K. A., Ramanathan, V., Ramaswamy, V., Rasch, P. J., Ravishankara, A. R., Rosenfeld, D., Stephens, G., and Wood, R.: Improving our fundamental understanding of the role of aerosol-cloud interactions in the climate system, P. Natl. Acad. Sci. USA, 113, 5781–5790, https://doi.org/10.1073/pnas.1514043113, 2016.
Sicard, M., Molero, F., Guerrero-Rascado, J. L., Pedros, R., Exposito, F. J., Cordoba-Jabonero, C., Boların, J. M., Comeron, A., Rocadenbosch, F., Pujadas, M., Alados-Arboledas, L., Martinez-Lozano, J. A., Diaz, J. P., Gil, M., Requena, A., Navas-Guzman, F., and Moreno, J. M.: Aerosol lidar intercomparison in the framework of SPALINET – the SPAnish LIdar NETwork: methodology and results, IEEE T. Geosci. Remote, 47, 3547–3559, 2009.
Sicard, M., Pujadas, M., Alados-Arboledas, L., Pedros, R., Diaz, J. P., Cordoba-Jabonero, C., Requena, A., Comeron, A., Rocadenbosch, F., Wagner, F., Rodrigues, J., and Moreno, J. M.: SPALINET: The Spanish and Portuguese aerosol lidar network, Opt. Pura Appl., 44, 1–5, 2011.
Siomos, N., Balis, D. S., Poupkou, A., Liora, N., Dimopoulos, S., Melas, D., Giannakaki, E., Filioglou, M., Basart, S., and Chaikovsky, A.: Investigating the quality of modeled aerosol profiles based on combined lidar and sunphotometer data, Atmos. Chem. Phys., 17, 7003–7023, https://doi.org/10.5194/acp-17-7003-2017, 2017.
Siomos, N., Balis, D. S., Voudouri, K. A., Giannakaki, E., Filioglou, M., Amiridis, V., Papayannis, A., and Fragkos, K.: Are EARLINET and AERONET climatologies consistent? The case of Thessaloniki, Greece, Atmos. Chem. Phys., 18, 11885–11903, https://doi.org/10.5194/acp-18-11885-2018, 2018.
Soupiona, O., Papayannis, A., Kokkalis, P., Mylonaki, M., Tsaknakis, G., Argyrouli, A., and Vratolis, S.: Long-term systematic profiling of dust aerosol optical properties using the EOLE NTUA lidar system over Athens, Greece (2000–2016), Atmos. Environ., 183, 165–174, https://doi.org/10.1016/j.atmosenv.2018.04.011, 2018.
Soupiona, O., Samaras, S., Ortiz-Amezcua, P., Böckmann, C., Papayannis, A., Moreira, G. A., Benavent-Oltra, J. A., Guerrero-Rascado, J. L., Bedoya-Velásquez, A. E., Olmo, F. J., Román, R., Kokkalis, P., Mylonaki, M., Alados-Arboledas, L., Papanikolaou, C. A., and Foskinis, R.: Retrieval of optical and micro-physical properties of transported Saharan dust over Athens andGranada based on multi-wavelength Raman lidar measurements: Study of the mixing processes, Atmos. Environ., 214, 116824, https://doi.org/10.1016/j.atmosenv.2019.116824, 2019.
Soupiona, O., Papayannis, A., Kokkalis, P., Foskinis, R., Sánchez Hernández, G., Ortiz-Amezcua, P., Mylonaki, M., Papanikolaou, C.-A., Papagiannopoulos, N., Samaras, S., Groß, S., Mamouri, R.-E., Alados-Arboledas, L., Amodeo, A., and Psiloglou, B.: EARLINET observations of Saharan dust intrusions over the northern Mediterranean region (2014–2017): properties and impact on radiative forcing, Atmos. Chem. Phys., 20, 15147–15166, https://doi.org/10.5194/acp-20-15147-2020, 2020.
Stein, A. F., Draxler, R. R, Rolph, G. D., Stunder, B. J. B., Cohen, M. D., and Ngan, F.: NOAA's HYSPLIT atmospheric transport and dispersion modeling system, B. Am. Meteorol. Soc., 96, 2059–2077, https://doi.org/10.1175/BAMS-D-14-00110.1, 2015.
Sun, J., Veefkind, P., Nanda, S., van Velthoven, P., and Levelt, P.: The role of aerosol layer height in quantifying aerosol absorption from ultraviolet satellite observations, Atmos. Meas. Tech., 12, 6319–6340, https://doi.org/10.5194/amt-12-6319-2019, 2019.
Tesche, M., Müller, D., Ansmann, A., Hu, M., Zhang, Y. H. Retrieval of microphysical properties of aerosol particles from one-wavelength Raman lidar and multiwavelength Sun photometer observations, Atmos. Environ., 42, 6398–6404, https://doi.org/10.1016/j.atmosenv.2008.02.014, 2008.
Tilstra, L. G., Tuinder, O. N. E., and Stammes, P.: GOME-2 Absorbing Aerosol Index: statistical analysis, comparison to GOME-1 and impact of instrument degradation, in: Proceedings of the 2010 EUMETSAT Meteorological Satellite Conference, EUMETSAT P.57, ISBN 978-92-9110-089-7, 20–24 September, Cordoba, Spain, 2010.
Tilstra, L. G., de Graaf, M., Aben, I., and Stammes, P.: In-flight degradation correction of SCIAMACHY UV reflectances and Absorbing Aerosol Index, J. Geophys. Res., 117, D06209, https://doi.org/10.1029/2011JD016957, 2012.
Tilstra, L. G., Tuinder, O., Wang, P., and Stammes, P.: Algorithm Theoretical Basis Document GOME-2 Absorbing Aerosol Height, SAF/AC//KNMI/ATBD/005, Royal Netherlands Meteorological Institute, de Bilt, the Netherlands, 32, available at: https://acsaf.org/docs/atbd/Algorithm_Theoretical_Basis_Document_AAH_Apr_2019.pdf (last access: 15 October 2020), 2019.
Tilstra, L. G., Tuinder, O., Wang, P., and Stammes, P.: Product User Manual GOME-2 Absorbing Aerosol Height, SAF/AC/KNMI/PUM/006, Royal Netherlands Meteorological Institute, de Bilt, the Netherlands, 28, available at: https://acsaf.org/docs/pum/Product_User_Manual_AAH_Aug_2020.pdf, last access: 15 October 2020.
Torres, O., Bhartia, P. K., Herman, J. R., Ahmad, Z., and Gleason, J.: Derivation of aerosol properties from satellite measurements of backscattered ultraviolet radiation: Theoretical basis, J. Geophys. Res.-Atmos., 103, 17099–17110, https://doi.org/10.1029/98JD00900, 1998.
Vaughan, M. A., Powell, K. A., Kuehn, R. E., Young, S. A., Winker, D. M., Hostetler, C. A., Hunt, W. H., Liu, Z. Y., McGill, M. J., and Getzewich, B. J.: Fully automated detection of cloud and aerosol layers in the CALIPSO lidar measurements, J. Atmos. Ocean. Tech., 26, 2034–2050, https://doi.org/10.1175/2009jtecha1228.1, 2009.
Veefkind, J. P., Aben, I., McMullan, K., Förster, H., de Vries, J., Otter, G., Claas, J., Eskes, H. J., de Haan, J. F., Kleipool, Q., van Weele, M., Hasekamp, O., Hoogeveen, R., Landgraf, J., Snel, R., Tol, P., Ingmann, P., Voors, R., Kruizinga, B., Vink, R., Visser, H., and Levelt, P. F.: TROPOMI on the ESASentinel-5 Precursor: A GMES mission for global observations of the atmospheric composition for climate, air quality and ozone layer applications, Remote Sens. Environ., 120, 70–83, https://doi.org/10.1016/j.rse.2011.09.027, 2012.
Voudouri, K. A., Siomos, N., Michailidis, K., Papagiannopoulos, N., Mona, L., Cornacchia, C., Nicolae, D., and Balis, D.: Comparison of two automated aerosol typing methods and their application to an EARLINET station, Atmos. Chem. Phys., 19, 10961–10980, https://doi.org/10.5194/acp-19-10961-2019, 2019.
Wandinger, U. and Ansmann, A.: Experimental determination of the lidar overlap profile with Raman lidar, Appl. Optics, 41, 511–514, https://doi.org/10.1364/AO.41.000511, 2002.
Wandinger, U., Freudenthaler, V., Baars, H., Amodeo, A., Engelmann, R., Mattis, I., Groß, S., Pappalardo, G., Giunta, A., D'Amico, G., Chaikovsky, A., Osipenko, F., Slesar, A., Nicolae, D., Belegante, L., Talianu, C., Serikov, I., Linné, H., Jansen, F., Apituley, A., Wilson, K. M., de Graaf, M., Trickl, T., Giehl, H., Adam, M., Comerón, A., Muñoz-Porcar, C., Rocadenbosch, F., Sicard, M., Tomás, S., Lange, D., Kumar, D., Pujadas, M., Molero, F., Fernández, A. J., Alados-Arboledas, L., Bravo-Aranda, J. A., Navas-Guzmán, F., Guerrero-Rascado, J. L., Granados-Muñoz, M. J., Preißler, J., Wagner, F., Gausa, M., Grigorov, I., Stoyanov, D., Iarlori, M., Rizi, V., Spinelli, N., Boselli, A., Wang, X., Lo Feudo, T., Perrone, M. R., De Tomasi, F., and Burlizzi, P.: EARLINET instrument intercomparison campaigns: overview on strategy and results, Atmos. Meas. Tech., 9, 1001–1023, https://doi.org/10.5194/amt-9-1001-2016, 2016.
Wang, P., Stammes, P., van der A, R., Pinardi, G., and van Roozendael, M.: FRESCO+: an improved O2 A-band cloud retrieval algorithm for tropospheric trace gas retrievals, Atmos. Chem. Phys., 8, 6565–6576, https://doi.org/10.5194/acp-8-6565-2008, 2008.
Wang, P., Tuinder, O. N. E., Tilstra, L. G., de Graaf, M., and Stammes, P.: Interpretation of FRESCO cloud retrievals in case of absorbing aerosol events, Atmos. Chem. Phys., 12, 9057–9077, https://doi.org/10.5194/acp-12-9057-2012, 2012.
Winker, D. M., Vaughan, M. A., Omar, A., Hu, Y., Powell, K. A., Liu, Z., Hunt, W. H., and Young, S. A.: Overview of the CALIPSO mission and CALIOP data processing algorithms, J. Atmos. Ocean. Technol., 26, 2310–2323, https://doi.org/10.1175/2009JTECHA1281.1, 2009.
Xu, X., Wang, J., Wang, Y., Zeng, J., Torres, O., Reid, J. S., Miller, S. D., Martins, J. V., and Remer, L. A.: Detecting layer height of smoke aerosols over vegetated land and water surfaces via oxygen absorption bands: hourly results from EPIC/DSCOVR in deep space, Atmos. Meas. Tech., 12, 3269–3288, https://doi.org/10.5194/amt-12-3269-2019, 2019.
Zoogman, P., Liu, X., Suleiman, R. M., Pennington, W. F., Flittner, D. E., Al-Saadi, J. A., Hilton, B. B., Nicks, D. K., Newchurch, M. J., Carr, J. L., Janz, S. J., Andraschko, M. R., Arola, A., Baker, B. D., Canova, B. P., Chan Miller, C., Cohen, R. C., Davis, J. E., Dussault, M. E., Edwards, D. P., Fishman, J., Ghulam, A., González Abad, G., Grutter, M., Herman, J. R., Houck, J., Jacob, D. J., Joiner, J., Kerridge, B. J., Kim, J., Krotkov, N. A., Lamsal, L., Li, C., Lindfors, A., Martin, R. V., McElroy, C. T., McLinden, C., Natraj, V., Neil, D. O., Nowlan, C. R., O'Sullivan, E. J., Palmer, P. I., Pierce, R. B., Pippin, M. R., Saiz-Lopez, A., Spurr, R. J. D., Szykman, J. J., Torres, O., Veefkind, J. P., Veihelmann, B., Wang, H., Wang, J., and Chance, K.: Tropospheric emissions: Monitoring of pollution (TEMPO), J. Quant. Spectrosc. Ra., 186, 17–39, https://doi.org/10.1016/j.jqsrt.2016.05.008, 2017.