the Creative Commons Attribution 4.0 License.
the Creative Commons Attribution 4.0 License.
 | 13 Jan 2021
Photochemical degradation of iron(III) citrate/citric acid aerosol quantified with the combination of three complementary experimental techniques and a kinetic process model
Peter A. Alpert
Pablo Corral Arroyo
Beiping Luo
Frederic Schneider
Jacinta Xto
Thomas Huthwelker
Camelia N. Borca
Katja D. Henzler
Jörg Raabe
Benjamin Watts
Hartmut Herrmann
Thomas Peter
Markus Ammann
Ulrich K. Krieger
Iron(III) carboxylate photochemistry plays an important role in aerosol aging, especially in the lower troposphere. These complexes can absorb light over a broad wavelength range, inducing the reduction of iron(III) and the oxidation of carboxylate ligands. In the presence of O2, the ensuing radical chemistry leads to further decarboxylation, and the production of .OH, , peroxides, and oxygenated volatile organic compounds, contributing to particle mass loss. The .OH, , and peroxides in turn reoxidize iron(II) back to iron(III), closing a photocatalytic cycle. This cycle is repeated, resulting in continual mass loss due to the release of CO2 and other volatile compounds. In a cold and/or dry atmosphere, organic aerosol particles tend to attain highly viscous states. While the impact of reduced mobility of aerosol constituents on dark chemical reactions has received substantial attention, studies on the effect of high viscosity on photochemical processes are scarce. Here, we choose iron(III) citrate (FeIII(Cit)) as a model light-absorbing iron carboxylate complex that induces citric acid (CA) degradation to investigate how transport limitations influence photochemical processes. Three complementary experimental approaches were used to investigate kinetic transport limitations. The mass loss of single, levitated particles was measured with an electrodynamic balance, the oxidation state of deposited particles was measured with X-ray spectromicroscopy, and radical production and release into the gas phase was observed in coated-wall flow-tube experiments. We observed significant photochemical degradation with up to 80 % mass loss within 24 h of light exposure. Interestingly, we also observed that mass loss always accelerated during irradiation, resulting in an increase of the mass loss rate by about a factor of 10. When we increased relative humidity (RH), the observed particle mass loss rate also increased. This is consistent with strong kinetic transport limitations for highly viscous particles. To quantitatively compare these experiments and determine important physical and chemical parameters, a numerical multilayered photochemical reaction and diffusion (PRAD) model was developed that treats chemical reactions and the transport of various species. The PRAD model was tuned to simultaneously reproduce all experimental results as closely as possible and captured the essential chemistry and transport during irradiation. In particular, the photolysis rate of FeIII, the reoxidation rate of FeII, production, and the diffusivity of O2 in aqueous FeIII(Cit) ∕ CA system as function of RH and FeIII(Cit) ∕ CA molar ratio could be constrained. This led to satisfactory agreement within model uncertainty for most but not all experiments performed. Photochemical degradation under atmospheric conditions predicted by the PRAD model shows that release of CO2 and repartitioning of organic compounds to the gas phase may be very important when attempting to accurately predict organic aerosol aging processes.
- Article
(6203 KB) - Full-text XML
- BibTeX
- EndNote


Photochemistry in the atmosphere (either in the gas phase or in the particle phase) plays an important role in aerosol aging processes. Photochemically produced free radicals in the gas phase (mainly .OH) can be taken up by aerosol particles, inducing multiphase chemistry. However, uptake is limited by the collision rate and condensed phase molecular transport when diffusion coefficients are sufficiently low, which restricts chemical reactions to the near-surface region of the particle. In contrast, photochemically generated radicals in aerosol particles can be present throughout their bulk due to light penetrating their whole volume. Radical production induced by a direct photochemical reaction occurs when the energy of light quanta is high enough (mostly the UV part of the solar spectrum) to cause bond cleavage or rearrangement in a molecule. In the lower troposphere where UV light intensity is low, indirect photochemistry initiated by near UV and visible radiation may become significant. Important indirect photochemical processes are transition metal complex photochemistry and photosensitized processes (Corral Arroyo et al., 2018; George et al., 2015). This work focuses on iron carboxylate-catalyzed photochemistry due to its abundance and reactivity in the atmosphere.
Iron is the most abundant transition metal in the earth's crust. Wind erosion is the main source of iron in the atmosphere, but anthropogenic activities such as industrial processes, traffic, and combustion processes can also potentially release iron in particulate form (Deguillaume et al., 2005). Depending on parameters such as temperature, pH value, ionic strength, and the concentration of involved substances, iron can combine with inorganic or organic ligands to form complexes (Deguillaume et al., 2005; Faust and Hoigné, 1990; Kieber et al., 2005). Iron can be found complexed with low molecular weight inorganic species such as the hydroxide anion (OH−), sulfate (), and sulfite () (Brandt and van Eldik, 1995; Hofmann et al., 1991; Weschler et al., 1986). Quantifying iron atmospheric processing and solubility is of global importance, especially for nutrient input into the world's oceans (Hamilton et al., 2019; Kanakidou et al., 2018). Heterogeneous chemistry involving particulate iron and SO2 can result in sulfate formation and increase aerosol loading (Grgić et al., 1998, 1999; Grgić, 2009). Additionally, iron photochemical processing in aerosol particles, fog droplets, and cloud water is an important radical source (Bianco et al., 2020; Abida et al., 2012) and sink for organic compounds (Weller et al., 2014, 2013; Herrmann et al., 2015). Organic compounds are a major component in atmospheric aerosol particles and have received more and more attention as potential ligands for iron(III) complexation. For instance, humic-like substances derived from water-soluble organic compounds have been reported to be strong chelating ligands with iron(III) (Dou et al., 2015; Kieber et al., 2003; Okochi and Brimblecombe, 2002; Willey et al., 2000). Oxalate and other carboxylates have been identified to be important ligands for iron(III) because they are available in sufficient amounts (Chebbi and Carlier, 1996; Kahnt et al., 2014; Kawamura et al., 1985) and the carboxylate groups are acidic enough to dissociate and chelate with iron(III) at atmospheric pH values (Okochi and Brimblecombe, 2002). Field studies have confirmed that soluble iron is mostly in complexes with carboxylate functions (Tapparo et al., 2020; Tao and Murphy, 2019).
In atmospheric aqueous phases, iron normally exists in oxidation states (II) and (III) and they can convert into each other via redox cycling. The ratio between iron(II) and iron(III) in aerosol particles is quite variable and depends on several factors such as the presence of light, oxidizing compounds, and ligands. For example, Grgić et al. (1999) reported that the concentration ratio of iron(II) to iron(III) varied between 0.9 and 3.1 in urban aerosol particles with a size range of 0.4–1.6 µm. Iron(III) carboxylate complexes are well-known photoactive compounds (Wang et al., 2012; Weller et al., 2013, 2014). They can easily get excited by light in the UV–VIS range, inducing ligand-to-metal charge transfer (LMCT) (Cieśla et al., 2004), which is an inner-sphere electron transfer (i.e., the electron transfer occurs via a covalently bound bridging ligand) from the carboxylate group to the iron. Investigations using time-resolved transient spectroscopy reported the formation of long-lived radical complexes, , with lifetimes on the order of a millisecond, followed by the dissociation to the organic radical and an FeII aqua complex (Feng et al., 2007; Glebov et al., 2011; Pozdnyakov et al., 2009; Zhang et al., 2009):
will decarboxylate almost instantaneously (kR3≈109–1012 s−1) (Abel et al., 2003; Bockman et al., 1997; Hilborn and Pincock, 1991):
The alkyl radical R. will react rapidly with dissolved O2, producing a peroxy radical with (von Sonntag and Schuchmann, 1991):
Subsequent reactions of R. and are specific depending on the type of ligand and its substitution.
In this work we investigated iron(III) citrate ([FeIII(OOCCH2)2C(OH)(COO)], in short FeIII(Cit)), as a model species to better understand iron carboxylate photochemistry in atmospheric aerosol particles. Our FeIII(Cit) system undergoes LMCT reactions in the same way as countless other iron(III) carboxylate compounds (Cieśla et al., 2004; Weller et al., 2013, 2014). Its photochemical reaction scheme is well established in both solution (Abida et al., 2012; Faust and Zepp, 1993; Pozdnyakov et al., 2012) and solid states (Abrahamson et al., 1994). Citric acid (CA) is an established proxy for oxygenated atmospheric organic matter with its thermodynamic properties, water diffusivity, and viscosity having been well studied (Lienhard et al., 2012, 2014; Song et al., 2016). For these reasons, it is a valid and reliable proxy for atmospheric iron carboxylate photochemical processes.
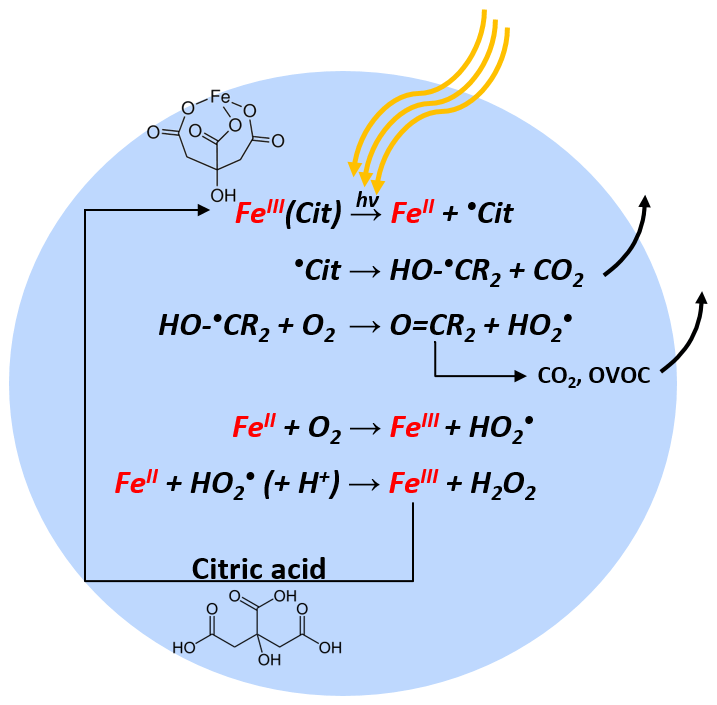
As schematically described in Fig. 1, FeIII(Cit) absorbs light up to 500 nm, inducing LMCT, followed by immediate decarboxylation of the central carboxyl group since the hydroxyl group adjacent to a carboxyl group facilitates decarboxylation (Weller et al., 2013). In the presence of O2, oxidants such as and H2O2 will be produced, which can oxidize FeII back to FeIII via Fenton reactions (Fenton, 1894) with additional oxidant production. FeIII then combines with another CA molecule in this aqueous system, closing the photocatalytic cycle, in which iron acts as a catalyst for CA degradation. In addition, the generation of reactive oxygen species (ROS) and peroxy radicals leads to further decarboxylation and more production of oxygenated volatile organic compounds (OVOCs) (e.g., acetone) (Pozdnyakov et al., 2008; Wang et al., 2012). Therefore, this photodegradation process is potentially an important sink of carboxylate groups in the troposphere.
We expect that the chemistry subsequent to the initial photochemical reaction steps in the aerosol phase will be significantly altered by diffusion limitations when FeIII(Cit) particles mixed with CA attain a high viscosity. As viscosity increases, molecular diffusion coefficients tend to decrease (Koop et al., 2011) and therefore photochemical cycling will also be slow. Increasing water content is expected when the relative humidity (RH) increases and will effectively plasticize particles (Koop et al., 2011) leading to better mixing of all compounds within the particles and faster photochemical cycling when compared with lower RH. However, these effects have been investigated in dark systems but not in photochemical systems (Berkemeier et al., 2016; Shiraiwa et al., 2011; Shiraiwa and Seinfeld, 2012; Steimer et al., 2015a). In order to better understand this system and how it reacts to RH, we used a triad of photochemical experiments including electrodynamic balance (EDB) measurements, scanning transmission X-ray microscopy coupled with near-edge X-ray absorption fine structure (STXM/NEXAFS) spectroscopy, and a coated-wall flow-tube (CWFT) experiments to investigate how particle size, mass, and indicators of chemical composition change during photochemical processes. In this work we mostly focus on the humidity dependence of this photochemical degradation, while Alpert et al. (2021) focus on the impacts on ROS and the fate of free radicals during this photochemical degradation.
To perform a quantitative comparison of these experiments and determine their relevant properties, a numerical multilayered photochemical reaction and diffusion (PRAD) model was developed that treats chemical reactions and the transport of various species. In addition, we will use the PRAD model to simulate photochemical aging processes under atmospheric conditions. In the following we briefly discuss our experimental approaches in Sect. 2 and include a detailed explanation of the PRAD model in Sect. 2.5. A comparison between the experimental results and the PRAD model is presented in Sect. 3. Finally, we discuss the impact and atmospheric importance of kinetic limitations to photochemical degradation in Sect. 4.
2.1 Solution preparation
CA (≥ 99.5 %) and iron(III) citrate tribasic monohydrate (18 %–20 % Fe basis) were purchased from Sigma-Aldrich. Iron(II) citrate (FeII(HCit)) was purchased from Dr. Paul Lohmann GmbH KG. Dilute aqueous solutions of FeIII(Cit) ∕ CA and FeII(HCit) ∕ CA were made in ultrapure water (18 M Ω cm−1, Milli-Q). Since FeIII(Cit) only dissolves slowly in water, CA solutions with suspended FeIII(Cit) crystals were sonicated for at least 24 h. The same dissolving procedure was also applied to the FeII(HCit) powders. Note that all procedures were done under red light illumination because FeIII(Cit) is light sensitive. The molar ratio between FeIII(Cit) and CA was different for each experimental method used in this study. For EDB, STXM/NEXAFS, and CWFT experiments, stock solutions were prepared with molar ratios of 0.05, 1.0, and 0.07, respectively.
2.2 Bulk property measurements by EDB
We used an EDB to measure the mass loss in single, levitated particles under irradiation. The experimental setup has been described previously (Steimer et al., 2015b). In short, an electrically charged aqueous particle (radius ∼ 10 µm) is injected into an EDB. The balance is of the double ring design (Davis et al., 1990) with a high AC voltage applied to the two parallel electrode rings and a DC voltage across the hyperbolic endcaps. The DC field compensates the gravitational force of the particle and is used as a measure for the mass of the particle. The EDB is placed in a three-wall glass chamber with a cooling liquid (ethanol) pumped through the two inner walls and an insulation vacuum between two outer walls to control the temperature (T) at the location where the particle levitates. The RH within the chamber is regulated by adjusting the ratio of a dry and a humidified gas flow through the chamber. In the experiments described in this work, we used a typical total flow of 40 sccm and set the total pressure inside the cell at 8×10⁴ Pa.
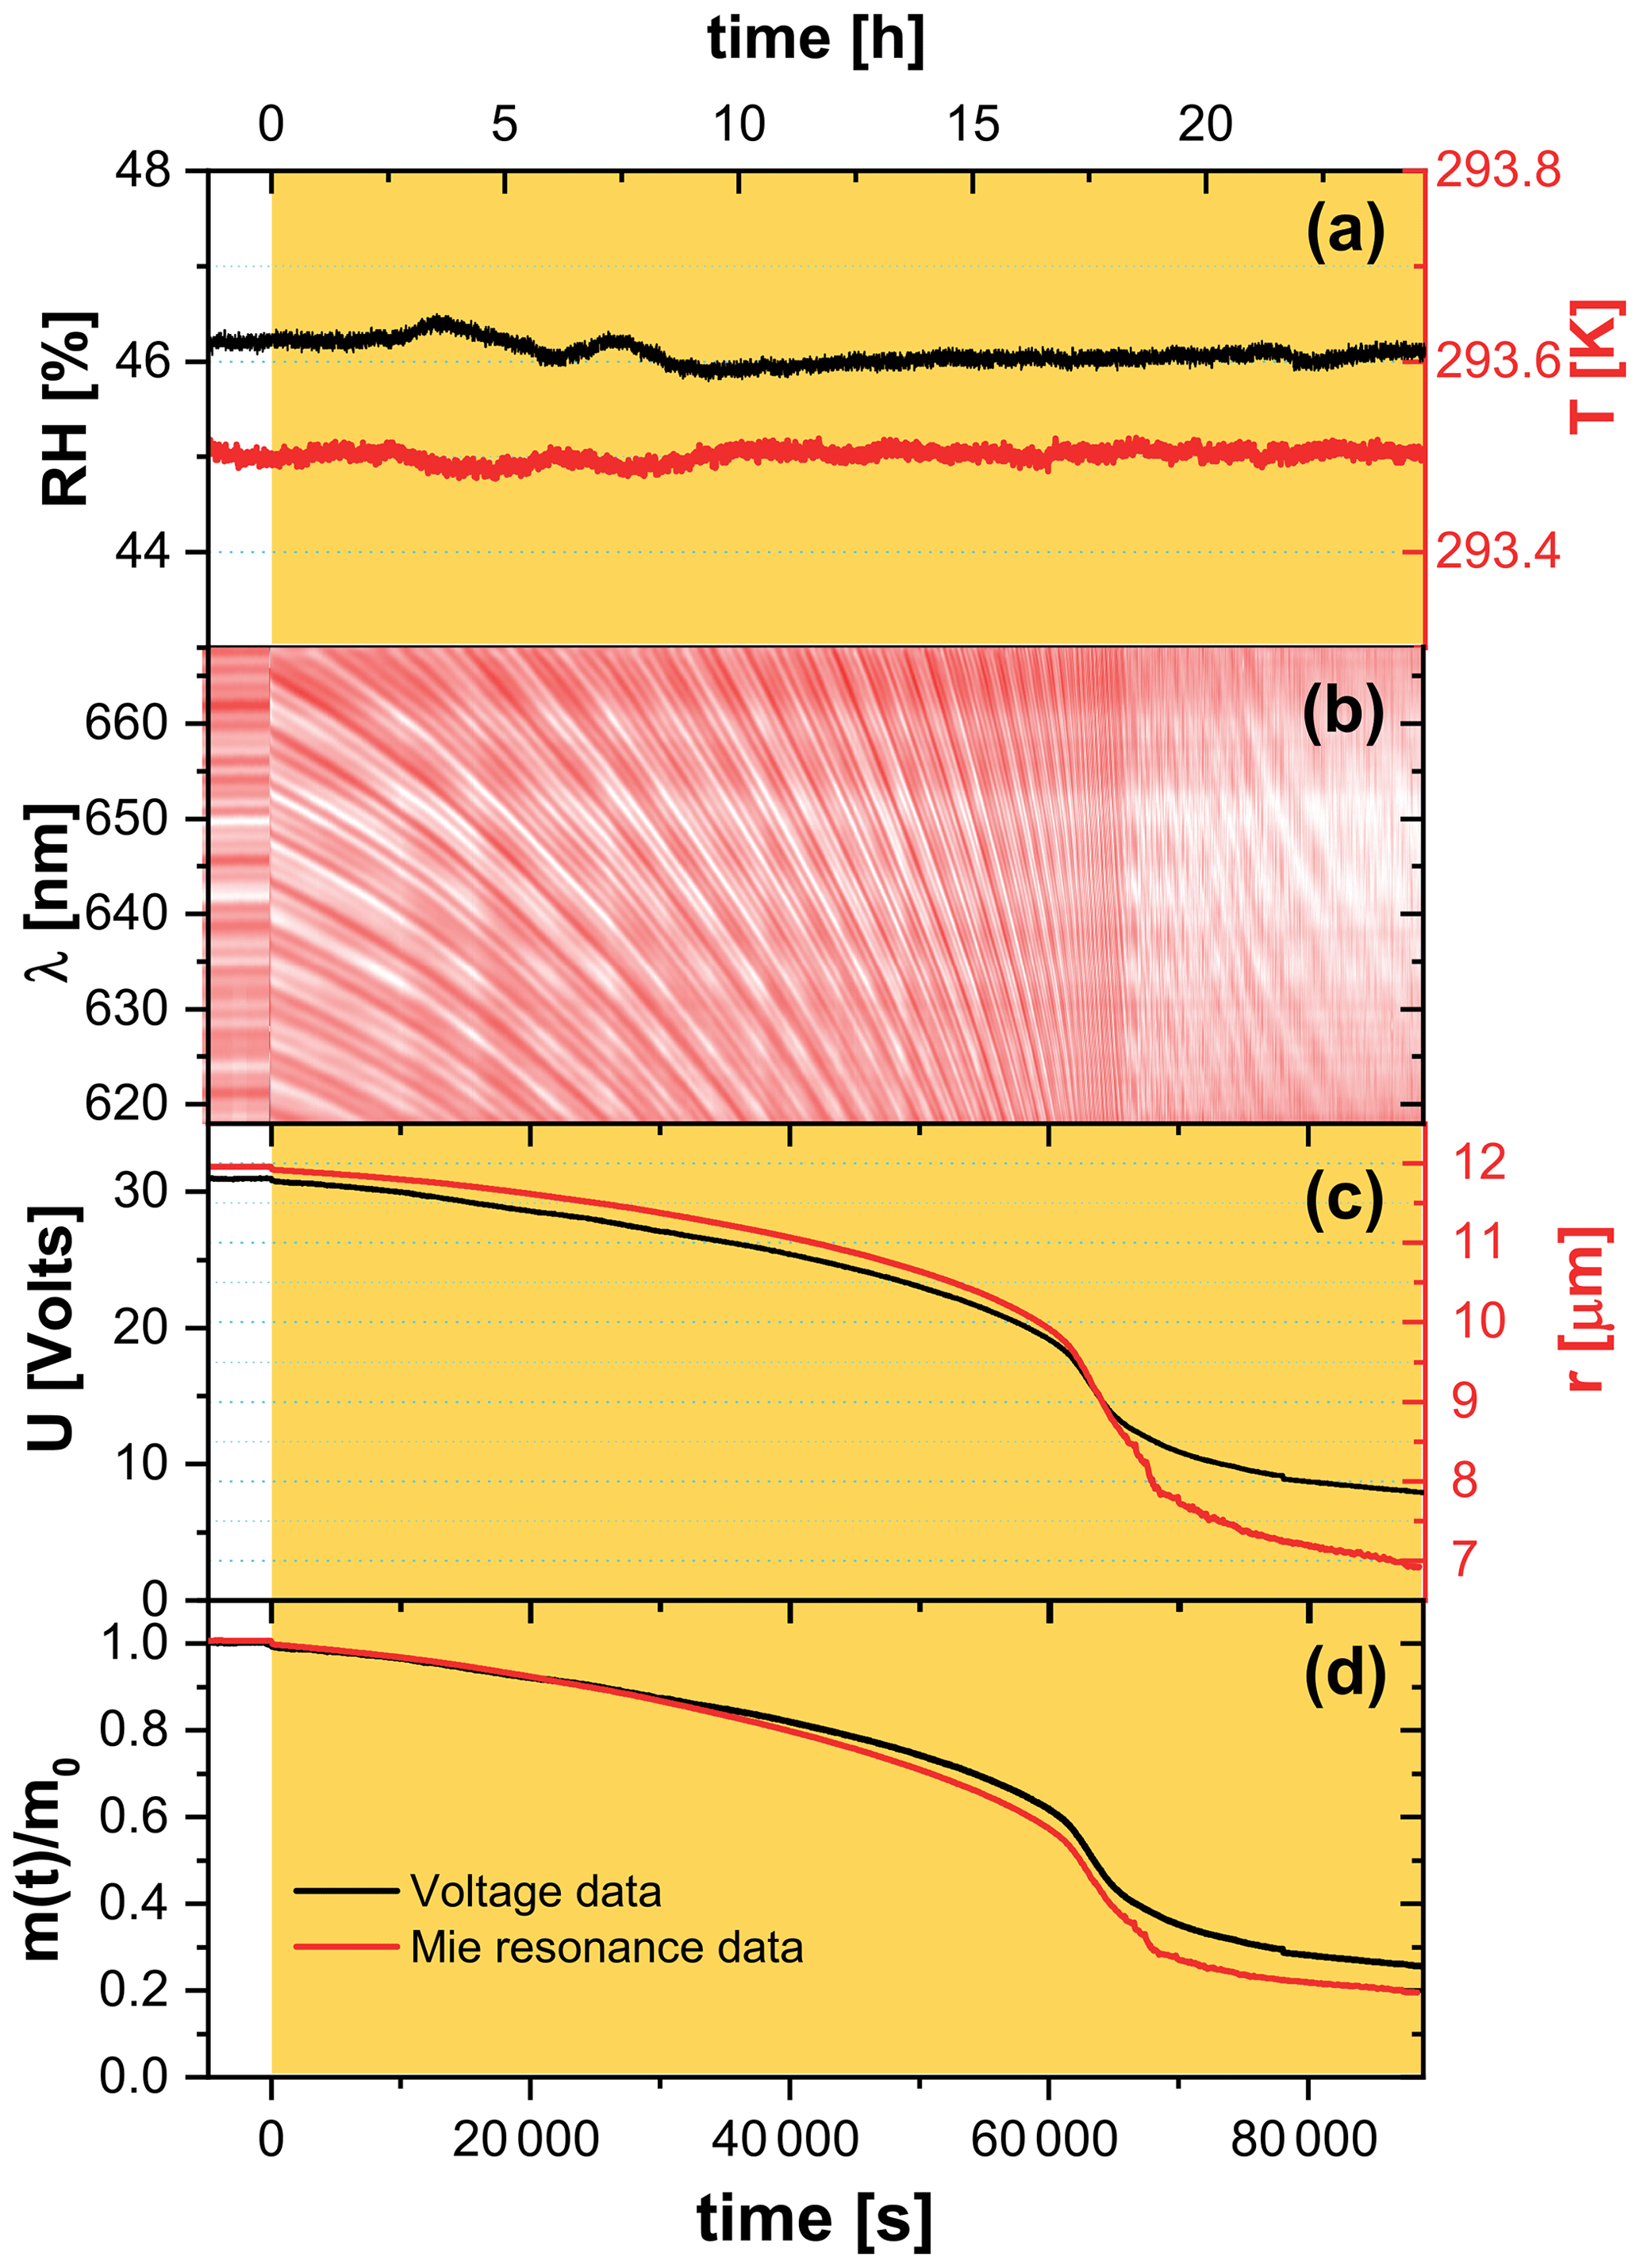
Figure 2Raw EDB experimental data for a FeIII(Cit)/CA (molar ratio of 0.05) particle. (a) Relative humidity (left axis, black) and temperature (right axis, red) of the droplet. (b) Intensity map of low-resolution Mie-resonance spectra. (c) Black line: DC voltage that compensates gravitational force; red line: radius of the droplet, with the initial value of the particle radius determined using high-resolution Mie-resonance spectroscopy (not shown), and the change in radius determined from low-resolution Mie-resonance data given in (b). (d) Normalized mass remaining ratio deduced from DC voltage (black), and from Mie-resonance shift (red) – assuming constant density. Yellow shaded region in panels (a), (c), and (d) indicate the time of laser irradiation with 0.25 W cm−2 at 375 nm.
The spherical particles were characterized by two methods based on Mie-resonance spectroscopy: (i) a narrow bandwidth tunable diode laser (TDL, tuning range 765–781 nm) was used to determine the refractive index and radius simultaneously with high-precision (Steimer et al., 2015b); and (ii) simultaneously, a broad-band LED centered around 640 nm was used to illuminate the particle. The backscatter signal from the LED was recorded using a spectrograph with a slow-scan back-illuminated charge-coupled device (CCD) array detector to follow the resonance wavelength shift of the particle (Zardini et al., 2006). If we assume the refractive index stays constant during the experiment, the radius change of a particle is easily calculated from this resonance wavelength shift:
We illuminated particles to induce a photochemical reaction with either a CW diode laser emitting at 375 nm (LuxX 375-20, Omicron Laserage) or a frequency-doubled diode laser emitting at 473 nm (gem 473, Laser Quantum). At wavelengths of 375 and 473 nm, FeIII(Cit) is reported to have a molar absorptivity of 796 and 60.7 , respectively (Pozdnyakov et al., 2008).
In a typical EDB experiment, we let the particle equilibrate to RH and T in a pure O2 gas phase for up to 10 h in the dark before irradiation. Exemplary raw data of an experiment at 46 % RH and 293.5 K are shown in Fig. 2. The measured DC voltage compensating for the gravitational force, as well as the radius of the particle deduced from Mie-resonance spectroscopy, decreased dramatically during illumination in the first 18 h, with more than half of the initial mass lost to the gas phase. Note that the radius and mass loss rates increased as seen in Fig. 2c. We assumed the refractive index and density of the particle did not change upon photochemistry and therefore the mass loss calculated from the DC voltage could be directly compared with size change by calculating the particle mass remaining ratio,
where m0 is the particle mass prior to irradiation. Mass loss derived from both ways independently is shown in Fig. 2d and reveal that there is a little difference between the mass loss up to t≈65 000 s, corresponding to when . Therefore, the refractive index and density are mostly governed by those of aqueous CA up until half the particle mass is lost. The total mass loss over 24 h irradiation is more significant and drops by 80 % for the particular experiment shown in Fig. 2. In addition, we observed the mass loss rate was initially ∼1.3 % h−1 and increased to ∼14 % h−1 when 40 % to 60 % of the initial mass was lost. This mass loss acceleration is discussed in further detail with the help of the PRAD model simulations in the Sect. 3.1. At t≈65 000 s, the mass loss slowed down considerably when we observed a distortion in the Mie-resonance pattern (Fig. 2b and video in the Supplement). The distortion may be attributable to partial crystallization of iron citrate in the particle, which would explain the slowing photochemical degradation.
2.3 Chemical characterization by STXM/NEXAFS
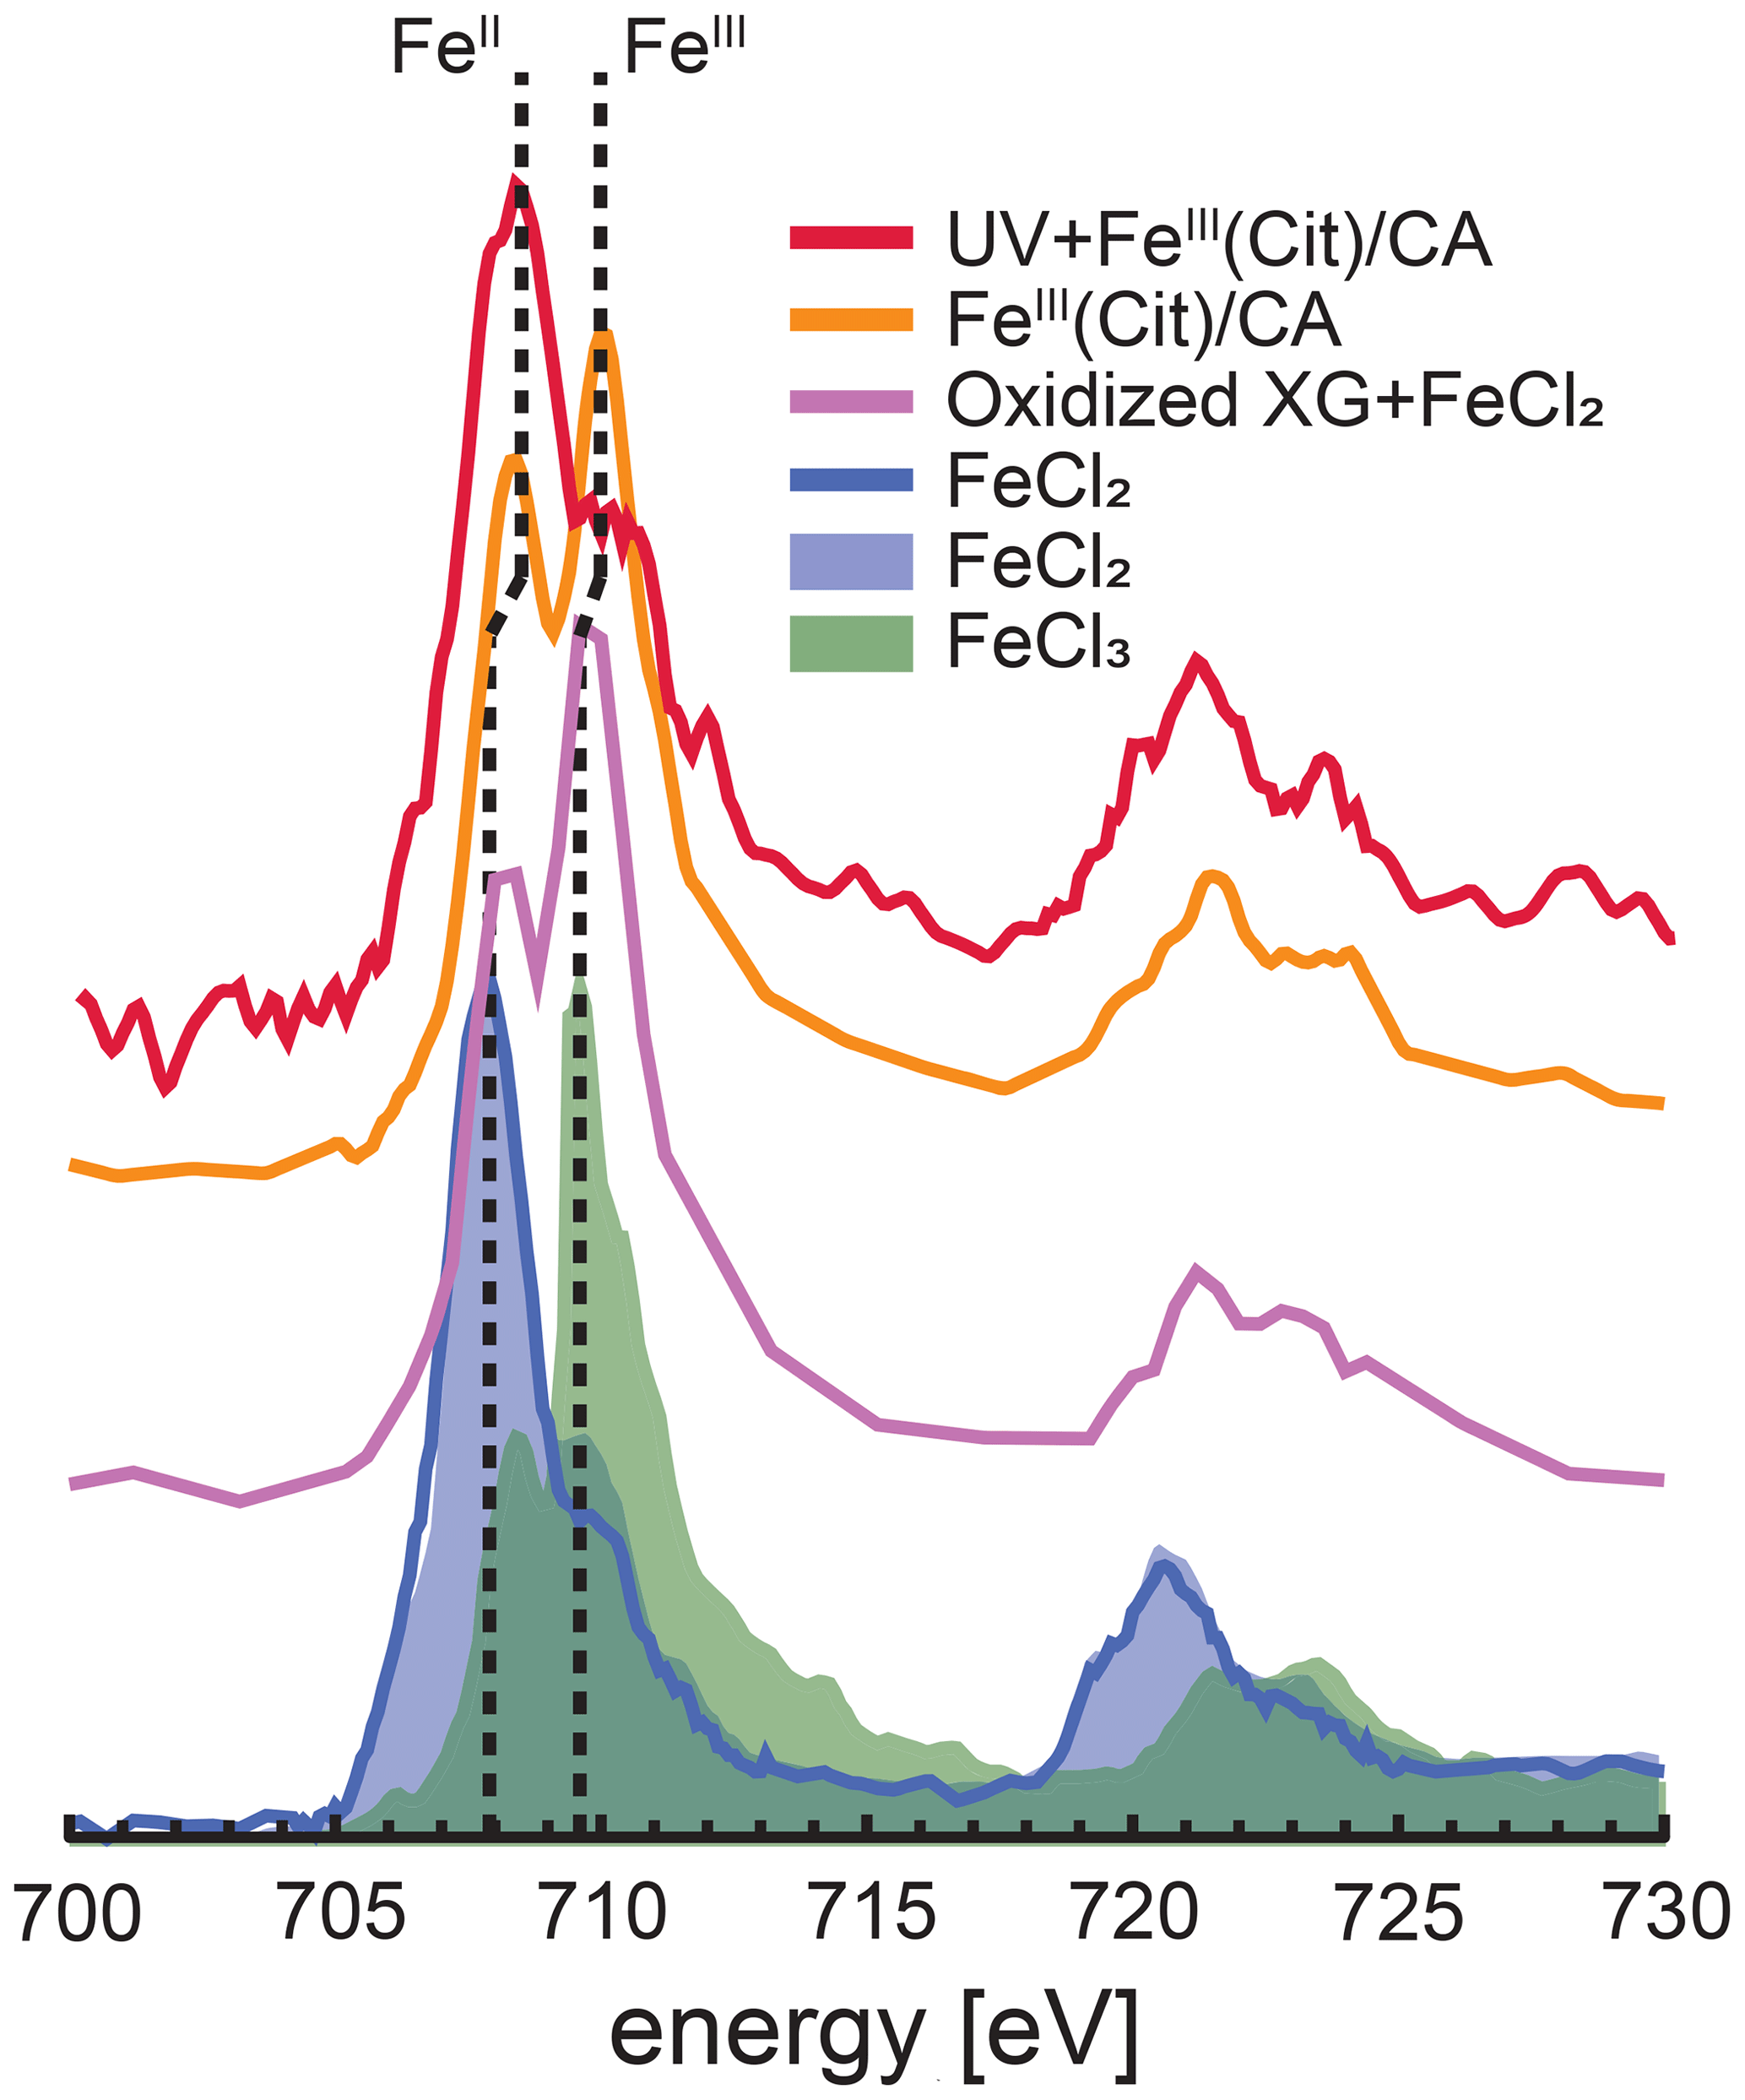
Figure 3Iron L-edge NEXAFS spectra of FeIII(Cit) ∕ CA particles before and after irradiation with UV light shown as orange and red, respectively. The previously recorded spectrum from mixed xanthan gum (XG) and FeCl2 particles exposed to ozone is shown as the purple line, and a spectrum from FeCl2 particles is shown as the blue line (Alpert et al., 2019). FeCl2 and FeCl3 spectra from Moffet et al. (2012) are shown as the blue and green shading, respectively. The vertical dashed lines indicate that peak X-ray absorption at 707.9 eV shifted to 708.3 eV for FeII and 709.6 eV shifted to 710.0 eV for FeIII.
STXM/NEXAFS measurements were performed at the PolLux endstation located at the Swiss Light Source (SLS) to obtain the Fe oxidation state of particles between 0.2 and 2 µm in diameter (Flechsig et al., 2007; Frommherz et al., 2010; Raabe et al., 2008). Particles containing FeIII(Cit) ∕ CA were nebulized from aqueous solution with a mole ratio between FeIII(Cit) : CA of 1 : 1. They were dried in air at RH < 30 % and impacted onto silicon nitride membranes mounted in portable sample holders. The sample holders were transported to the endstation in an evacuated container and shielded against ambient light. Once there, they were mounted in the PolLux environmental microreactor (Huthwelker et al., 2010) and kept under a total pressure of 1.5×10⁴ Pa, T=293.5 K, RH = 40, 50 or 60 %, with a controlled gas flow. Further details of sample preparation have been previously reported (Alpert et al., 2019; Huthwelker et al., 2010; Steimer et al., 2014). The microreactor was mounted in a vacuum chamber for in situ STXM/NEXAFS analysis. When desired, the microreactor could operate in vacuum conditions without a gas flow. The transmission of X-ray photons through the particles was measured and converted to optical density, , where I and I0 are the transmitted and incident photon flux as a function of X-ray energy. The Fe L-edge absorption was probed over the X-ray energy range of 700–735 eV. Figure 3 shows an example of NEXAFS spectra of FeIII(Cit) ∕ CA particles before (orange) and after (red) irradiation with UV light. X-ray energy calibration was consistently performed using FeCl2 and compared with the existing literature for FeCl2 and FeCl3 salts (Moffet et al., 2012) and a mixture of xanthan gum and FeCl2 oxidized by O3 (Alpert et al., 2019). The peak absorption for iron(II) and iron(III) are at X-ray energies of 708.3 and 710.0 eV. We were capable of resolving peaks separated by 0.4 eV at the Fe L-edge. Ferrous and ferric iron peaks are separated by 1.7 eV and thus clearly distinguishable. Following a previous procedure (Alpert et al., 2019), we imaged particles at these two energies to determine the OD ratio between them. The fraction of FeIII out of total Fe, β, was then determined using the parameterization from Moffet et al. (2012). It is important to note that the X-ray energy absorption peaks observed for FeCl2 and FeCl3 were identical for FeCl2 mixed with xanthan gum either unexposed or exposed to O3 (Alpert et al., 2019). However, we have found that these peaks shifted by about +0.4 eV, possibly due to the strong complexation with CA. Small shifts in energy can occur depending on the chemical environment surrounding Fe atoms (Garvie et al., 1994; Moffet et al., 2012). In agreement with Alpert et al. (2019), the peak absorption energies for our particles were independent of RH from 0 % to 60 % within ±0.2 eV. When calculating β, we always imaged particles at 708.3 and 710.0 eV.
2.4 production determined by CWFT
The release upon irradiation of a FeIII(Cit) ∕ CA thin film was measured by scavenging with an excess of NO in a CWFT reactor (Duran glass, inside diameter 1.2 cm, length 50 cm). The film was composed of FeIII(Cit) ∕ CA, and deposited inside the tubular glass flow tube with a thickness between 0.15 and 0.2 µm and an error of about 20 %. Details of the film preparation have been described previously (Corral Arroyo et al., 2018; González Palacios et al., 2016). Seven UV lamps (UV-A range, Philips Cleo Effect) were mounted surrounding the glass reactor held at 298.15 K. The total light output between 300 and 590 nm was 210 W m−2. The flows of N2, O2, and NO passing through the reactor were controlled. The NO concentration during CWFT photochemical experiments was in excess (> 1013 molecules cm−3) to efficiently scavenge 99 % of produced by the film. The concentration of NO was tracked by a chemiluminescence detector (Ecophysics CLD 77 AM). In an example CWFT experiment at RH = 29.3 %, a clear NO loss was observed when the UV lights were switched on as shown in Fig. 4, which was due to the release of radicals into the gas phase and reaction of NO with forming NO2 and OH.. OH. is then scavenged by NO producing HONO. The production of HONO was routinely checked as described in González Palacios et al. (2016). Therefore, the production rate of , , was calculated from the loss rate of NO assuming a 2 : 1 ratio to conversion:
where [NO] is the loss of gas-phase concentration of NO in molecules cm−3, flow is the volumetric gas flow in the CWFT in cm3 s−1, and Sfilm is the surface area of the film in cm2.
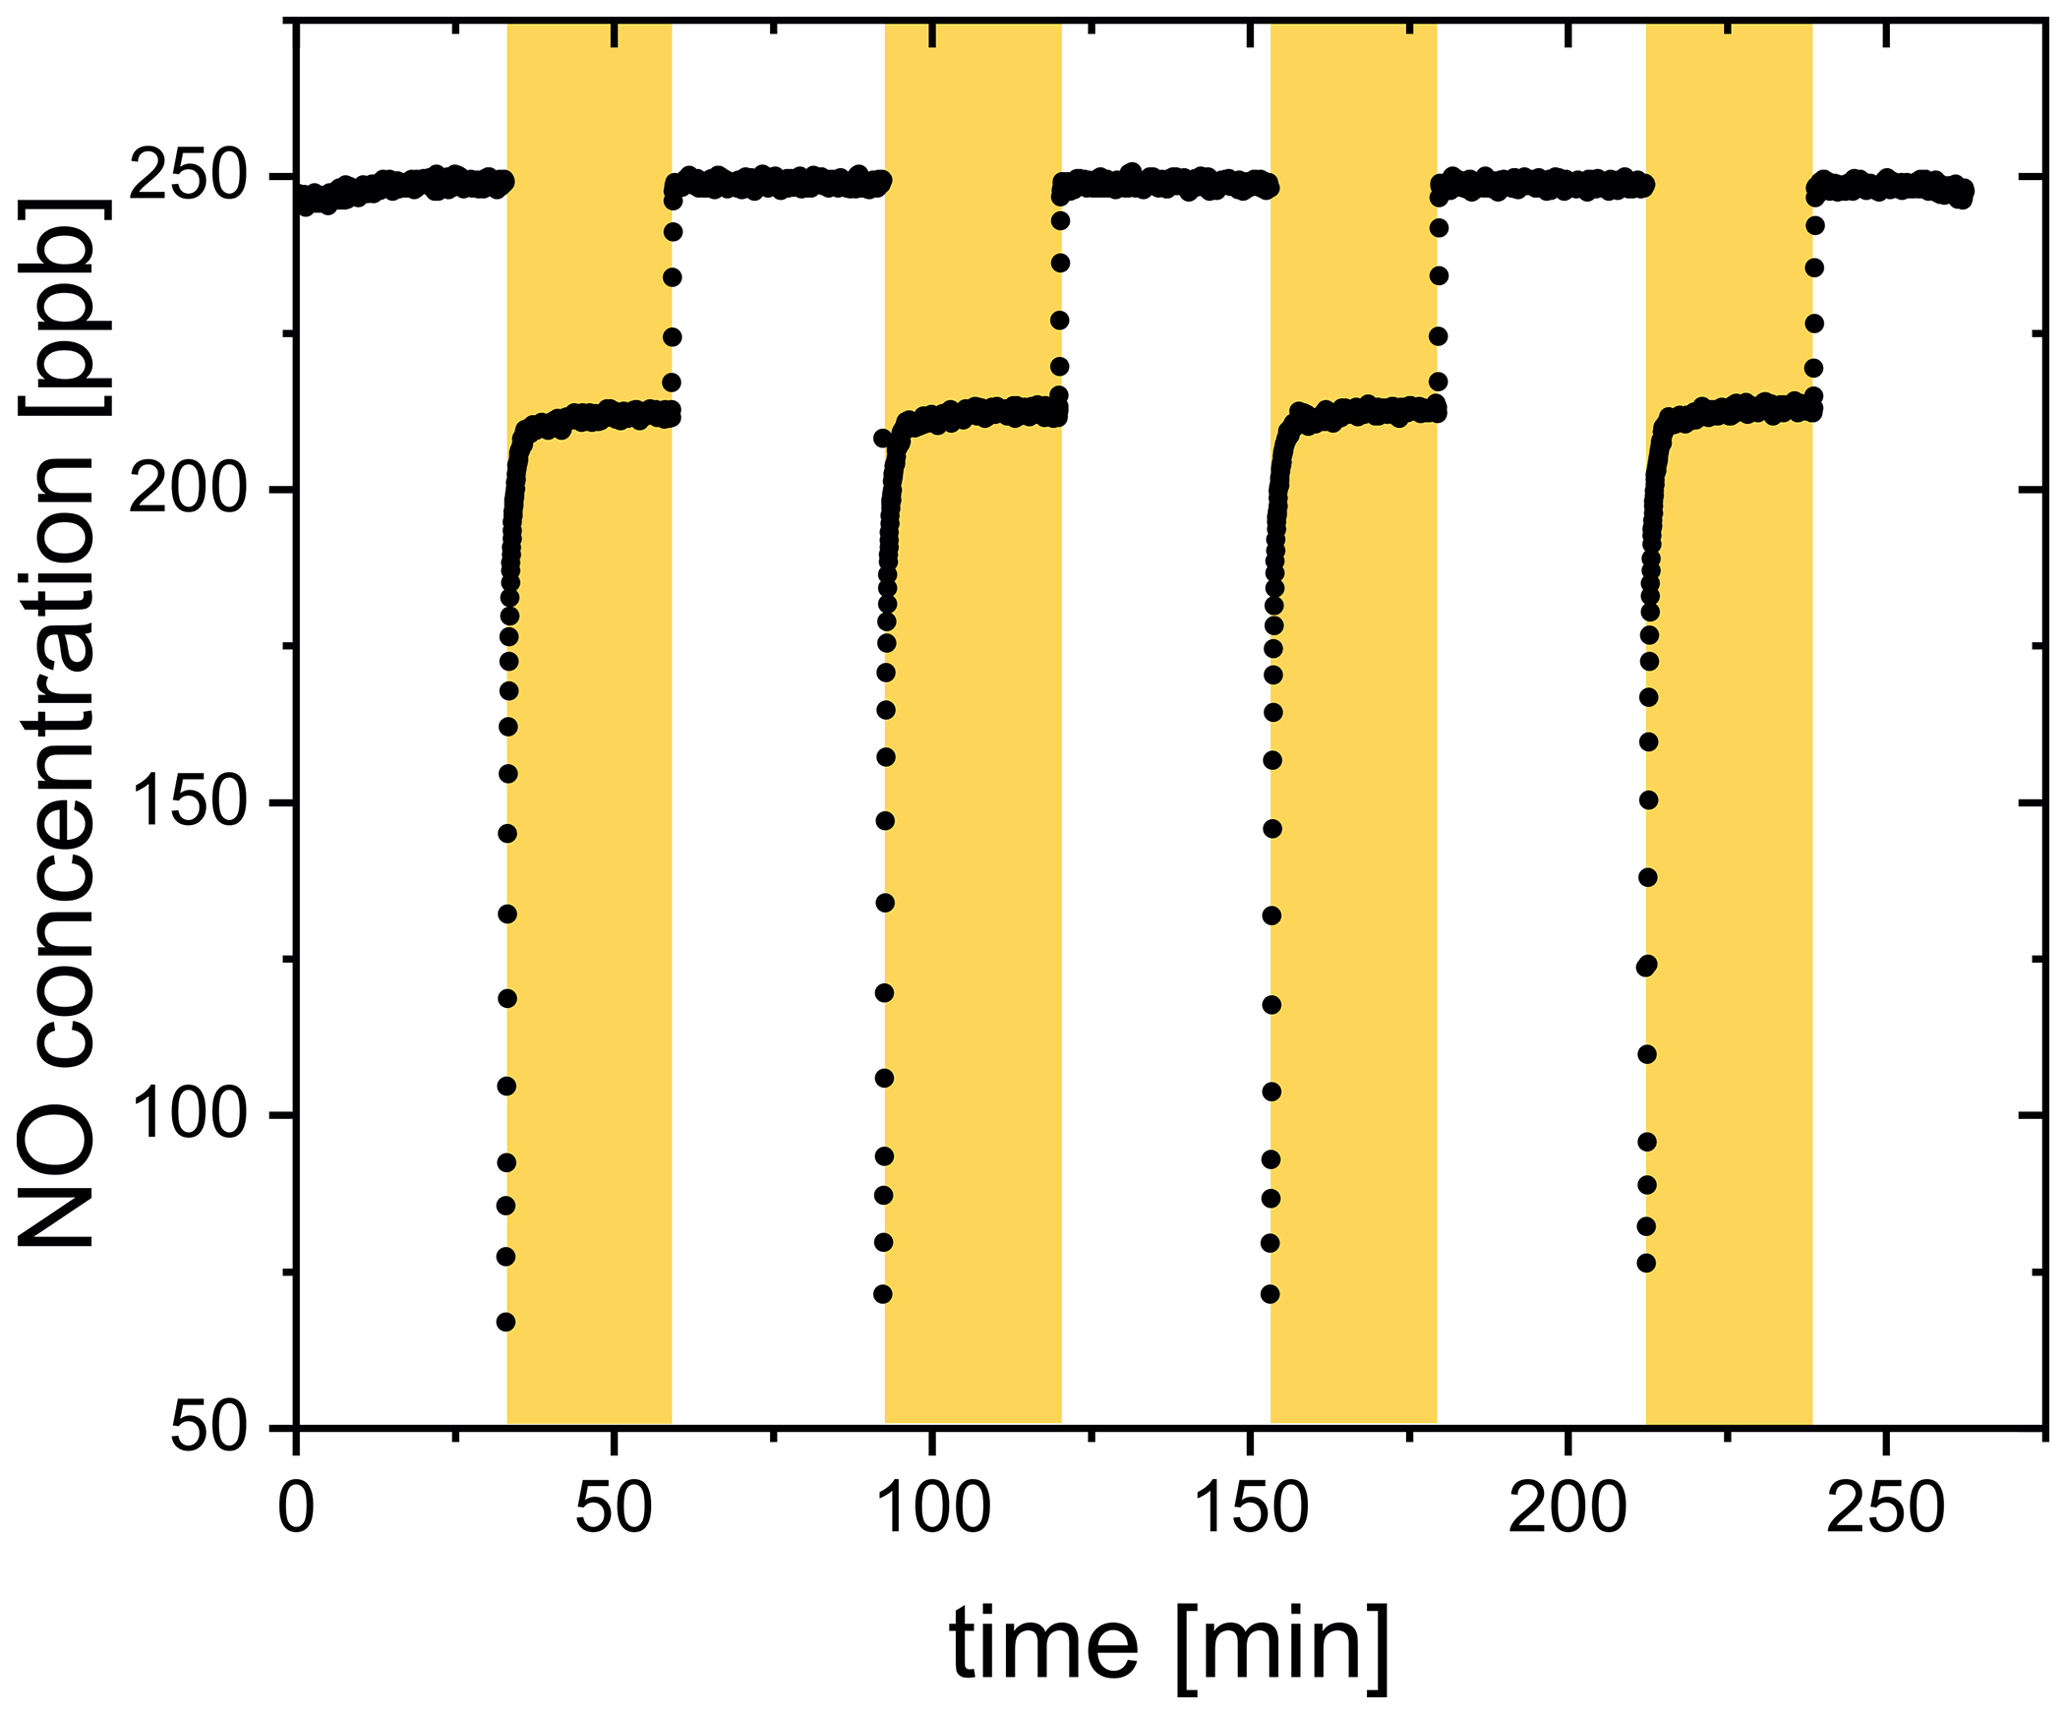
Figure 4NO concentration raw data from a CWFT film containing FeIII(Cit) ∕ CA (molar ratio of 0.07) with lamps on (yellow shaded region) and off at 29.3 % RH and 298.15 K.
2.5 Development of the photochemical reaction and diffusion (PRAD) model
We developed a PRAD model to interpret our experiments and to understand any feedback between transport limitations and photochemistry, especially under low RH conditions, corresponding to high viscosity of the particle phase. The PRAD model consists of two modules: a detailed chemical process module, treating equilibria and chemical reactions, and a transport module handling the physical transport of all species (including diffusion in the aqueous phase as well as gas–particle phase partitioning). Conceptually, the PRAD model relies on the kinetic model framework for aerosol surface chemistry and gas–particle interactions (Pöschl et al., 2007), which is similar, for example, to the KM-GAP model (Shiraiwa et al., 2012). Numerically, the PRAD model uses a Euler forward step method as explained in detail below, while KM-GAP solves coupled differential equations. In passing, there are alternative approaches; for example, Kinetiscope (Houle et al., 2015) does not integrate sets of coupled differential equations to predict the time history of a chemical system. Instead, it uses a general stochastic algorithm to propagate a reaction.
As illustrated in Fig. 5, the PRAD model divides a spherical droplet into a number of shells, n, which exchange molecules after each chemical time step. Shell thickness and the number of shells were adjusted to enable the resolution of steep concentration gradients within a reasonable computation time. The volume of each shell was constant instead of the thickness and the shells become thinner and thinner from the center to the surface of the particle. For each shell and at each time step, we first calculated the composition using the thermodynamic equilibria of the FeIII(Cit) ∕ CA system, as listed in Table 2. The Newton–Raphson method (Burden and Faires, 2011) was then used to calculate the turnover and the concentration of products and reactants over time for the chemical reactions also listed in Table 2 with a fixed time step of 0.2 s. After each time step, diffusion of all species between the shells and the evaporation of products (or condensation of the reactant O2) were computed. The time step, Δt, for physical transport processes was determined dynamically to ensure both numerical stability and computational efficiency.
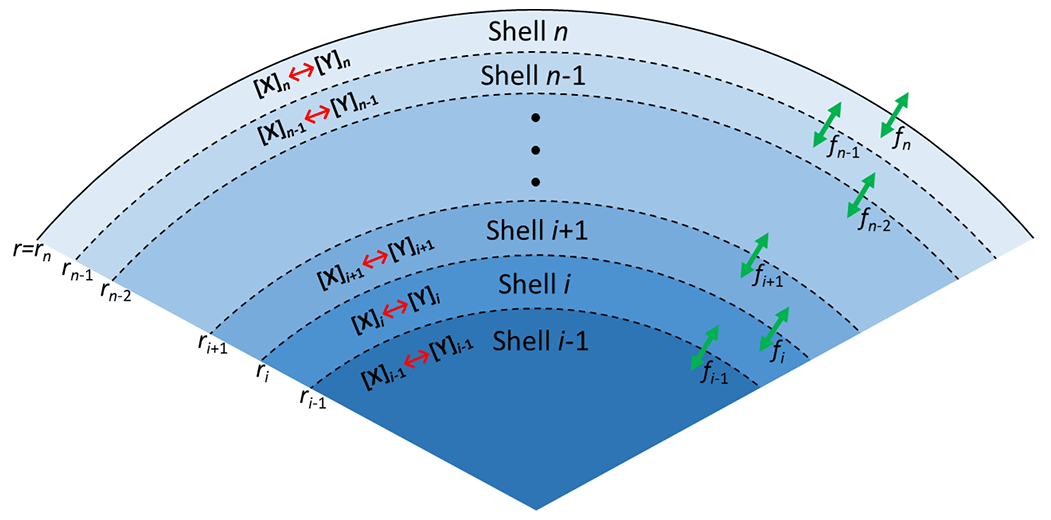
Figure 5Schematic illustration of the PRAD model showing the shells, transport fluxes (green arrows), and chemical processes (red arrows) of each species. The particle is radially symmetric with the surface of the particle marked as rn.
For each species, the molar flux from shell i to the next shell i+1 was calculated as
where Dl is the liquid phase diffusion coefficient of the corresponding species. Shell i extends from ri−1 to ri, while shell i+1 extends from ri to ri+1, with r being the distance from the particle center. In Eq. (4), c is the molar concentration in each shell of the aqueous particle, defined as
where Ni is moles of a particular species in shell i, and Vi is the total volume of shell i.
At the outermost shell n, the gas–particle phase partitioning of each species was determined by the modified Raoult's law. The flux from shell n into the gas phase, fn, was calculated to be
where Dg is the gas phase diffusion coefficient of the corresponding species, and R is the gas constant. ppartial is the partial pressure of the species in the gas phase at infinite distance from the particle. Based on Henry’s law, vapor pressure of the species pvapor is defined as
where cn is the molar concentration in the outermost shell n, and H is the Henry's law coefficient. Substituting Eq. (7) into Eq. (6) leads to
We calculated the partial pressure of H2O from RH, and took the partial pressure of O2 based on the total pressure and the fraction of O2 gas flow used in experiments. For other species, ppartial is negligible and assumed to be zero. So, for all species other than H2O and O2, fn simplifies to
Based on the calculated fluxes, the change in moles, ΔNi, of each species in Δt was given by
from which the concentration and corresponding shell thickness using the molar volume of each species were recalculated for the next time step.
The chemical loss rate of O2 was treated in the liquid phase diffusion module instead of in the chemical module, since the loss can be very fast and its lifetime can be smaller than 10−6 s. If O2 loss due to reaction was determined in the chemical module, a chemical time step of 10−6 s would result in extensive computational time beyond what is reasonable for this study. Therefore, within each liquid phase diffusion time step, in addition to the physical transport, the chemical loss of O2 molecules was calculated in each shell:
Integration yields
where is the total chemical reaction rate of O2. In the outermost shell n, O2 molar concentration is assumed to be at steady state all times, meaning that the chemical loss of O2 is always compensated by the condensation of O2 from the gas phase:
Substituting Eq. (5) in Eq. (13), we calculate the moles of O2 in this shell, , as
where is Henry’s law coefficient of O2.
All iron-containing compounds and all free ions are assumed not to evaporate from the particle phase. All other species have Henry's law coefficients given in Table 1. If the evaporation rate of some species is fast enough, then their concentration in the outermost shell n can always be at steady state, which means
that is,
From Eq. (16), cn can be deduced to be
And the number of moles of the volatile species in the outermost shell Nn as
We have parameterized aqueous and gas phase diffusion coefficients, and , respectively, for all species j given in Appendix A1 and A2. There are several other assumptions and approximations made to adapt this model to the aqueous FeIII(Cit) ∕ CA system:
-
We always set water activity in the particle phase in equilibrium with the gas phase, since the RH of the gas phase did not change during each experiment.
-
The bulk accommodation coefficients of all species were assumed to be 1.
-
Neglecting the influence of FeIII(Cit), the water activity was taken from that of CA (), which was determined from the mass fraction of CA, WCA, by Lienhard et al. (2012):
with
and
The water activity of citrate () was calculated using the same equation
where the mass fraction of citrate WCit was treated in two fractions: citrate without Fe and citrate containing Fe. The water activity of an aqueous 1 M FeIII(Cit) solution was determined using a water activity meter (AquaLab water, Model 3B, Decagon Devices, USA) at room temperature. We found this water activity corresponds to that of a 0.81 M aqueous CA solution. Therefore, for calculating water activity, all iron-containing citrate complexes (either FeII or FeIII) were treated with a reduced concentration: namely with a factor of 0.81 of the corresponding citrate molarity. Hence, the overall amount of citrate was calculated as
accordingly and WCit was determined using
where MCit and are the molar mass of CA and water, respectively. For other species j, the contribution to the water activity is proportional to their molar volume (MVj), so that in total,
-
FeIII(Cit) photolysis, decarboxylation, and oxidation of the alcohol group in presence of O2 yields the compounds or O=C(CH2COOH)2, which are C5 species. We assumed that half of the C5 species undergo photochemical reactions to produce CO2 and compounds with 2–4 carbon atoms, C4, C3 and C2 (see Reactions R10–R14 shown in Table 2), all of which are capable of being released to the gas phase depending on their solubility.
-
We estimated the quantum yield in Reactions (R1) and (R2) in Table 2, as Φ=1.0 at λ=375 nm and Φ=0.002 at λ=473 nm (Dou et al., 2019), and we parameterized Φ as a function of wavelength, λ:
In total, the PRAD model includes 13 equilibria and 17 chemical reactions among 32 species, as well as their condensed phase diffusivities and Henry's law coefficients. Some of these parameters are known from previous studies (see Tables 1 and 2 for references), while others are not known and difficult to estimate. For instance, even though absorption spectra of FeIII(Cit) have been measured in aqueous solution (Pozdnyakov et al., 2012), the corresponding quantum yield has not, which leaves the photolysis rate of FeIII(Cit), j, unknown. Also, there are no data reported on the diffusivity of O2 in aqueous CA solutions, and the chemical reaction rate of the oxidation of the FeII citrate complex by O2 is quite uncertain (Gonzalez et al., 2017). In order to find the optimal parameter set, we compared the experimental data of the three setups taken under well-controlled conditions with model predictions and tuned the unknown parameters manually.
Table 1Liquid phase diffusivity factors (normalized to water) and Henry's law coefficients (Sander, 2015) of major species in the FeIII(Cit) photochemistry system.
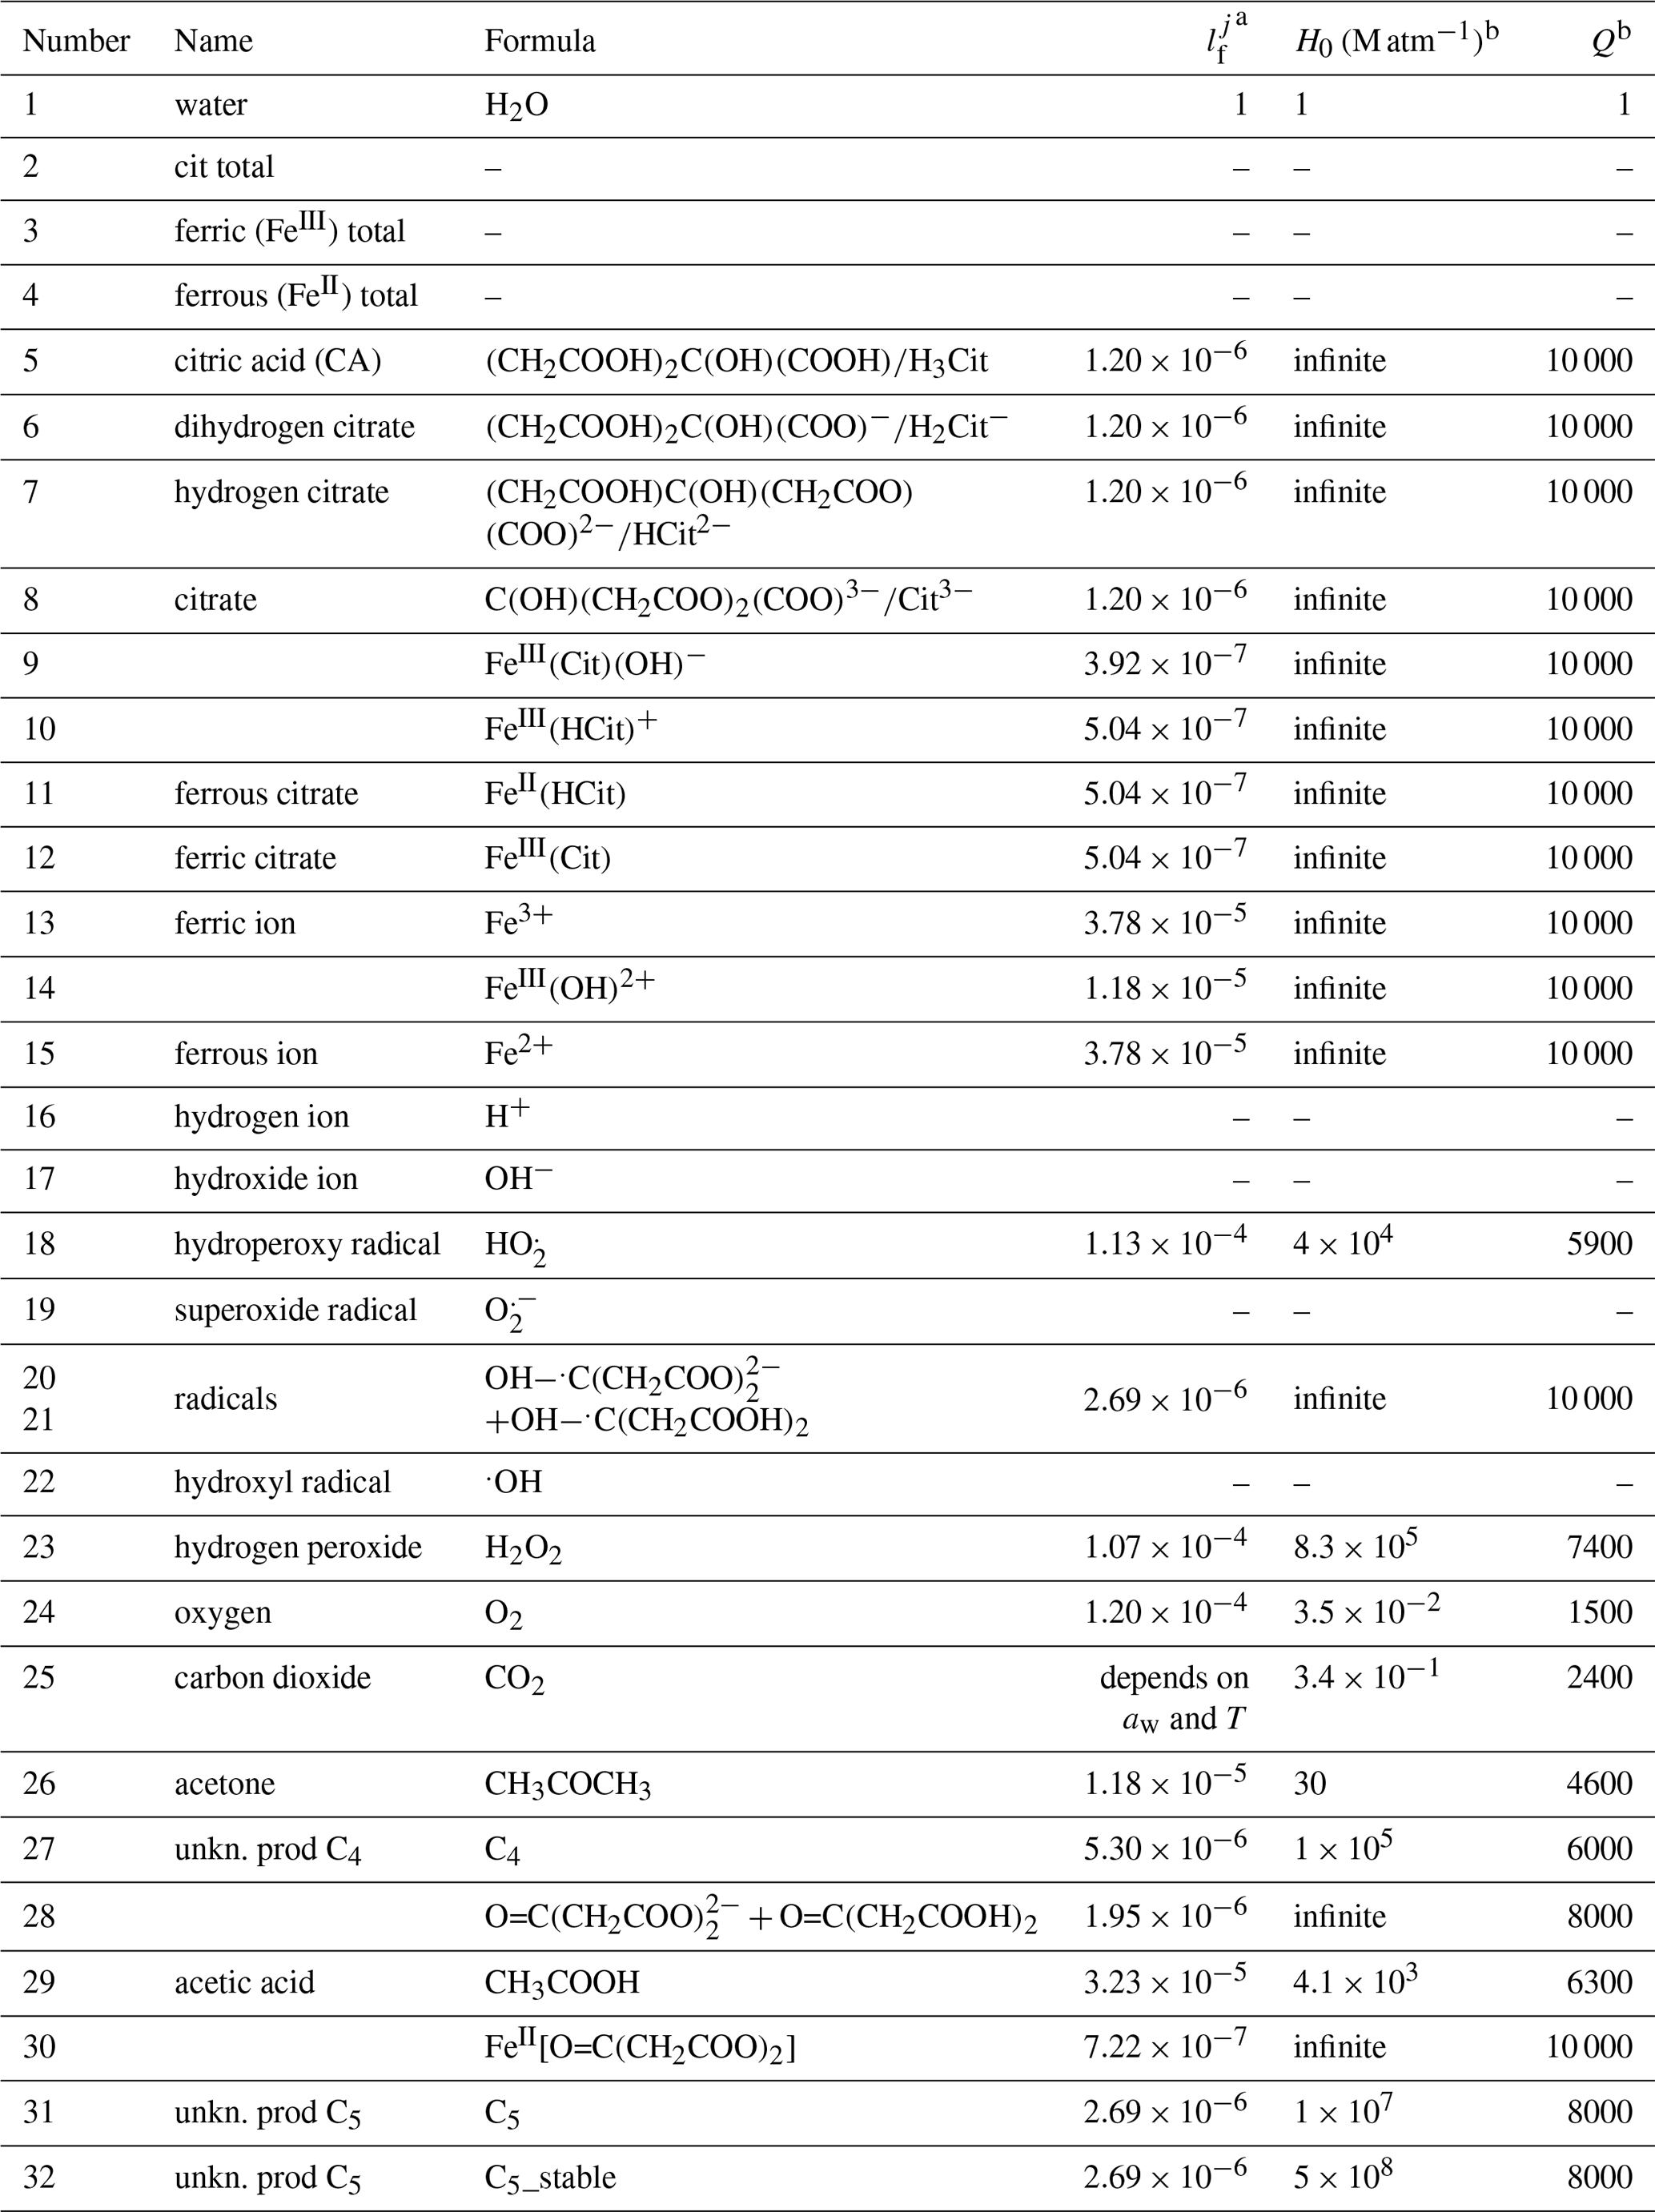
a is a factor of the diffusion coefficient of each species j normalized to that of water. b Henry's law is described as a function of temperature T: .
We restricted our tuning of the parameters to reach satisfactory agreement with all experimental data simultaneously. The equilibrium constants and rate coefficients that were tuned are indicated in Table 2 (the sensitivity of the PRAD model results to a few of its parameters is shown in Appendix A5). The parameters were adjusted in a wide and acceptable range until a good representation of our data could be obtained. For example, the fraction of iron(III) in a photoactive complex (equilibrium E5 in Table 2) must have been high enough to reproduce STXM/NEXAFS observations that iron could be reduced to low levels as seen in Fig. 7 described below. In comparison, equilibrium constant of E7 must have been much lower than equilibrium constant of E5 so that the amount of iron(III) in a nonphotoactive complex was small compared to being in complex with citrate. As another example, oxidation of Fe2+ (Reactions R5–R8 in Table 2) is fairly well referenced, and therefore we adjusted the rate of Reaction (R9) until the model reoxidation rates matched those observed. Tuning of individual bulk diffusion coefficients for all species was not attempted. Instead, we simplified the representation of diffusion coefficients using a parameterization as a function of molar mass, as described in Appendix A1. The two constants in Eq. (A8) and the two constants in Eq. (A3) were tuned, resulting in the absolute diffusion coefficients shown in Fig. A1. Henry's law coefficients for gasses were tuned, however purposefully set at values higher than expected for pure water or highly dilute aqueous solution. This was inspired by previous studies regularly reporting solubility of, e.g., O2 and CO2 higher in a variety of organic liquids than water (Fogg, 1992; Battino et al., 1983). It is important to note that the result of this tuning does not mean that we found the global minimum in the parameter space (see, e.g., (Berkemeier et al., 2017)). A thorough search for a global minimum for our model with 16 tuning parameters for chemistry, four tuning parameters (and our parameterization) for diffusion, and nine tuning parameters for solubility is computationally very expensive and beyond the scope of this paper. However, for our purpose here, namely modeling typical timescales of photochemical degradation of organic aerosol under atmospheric conditions (see Sect. 3.5), the PRAD model framework should allow sufficiently accurate predictions. In other words, we expect similar mass degradation in atmospheric particles due to the fact that many other relevant iron carboxylate compounds undergo LMCT similarly as to our model system (Weller et al., 2013, 2014). Additionally, if a particular system requires parameter values that significantly differ from ours, the PRAD model framework itself should still be valid. Note that careful evaluation is needed when picking a single parameter of the PRAD model for use in another context. Comparisons of the refined model with our experimental data are shown in the next section.
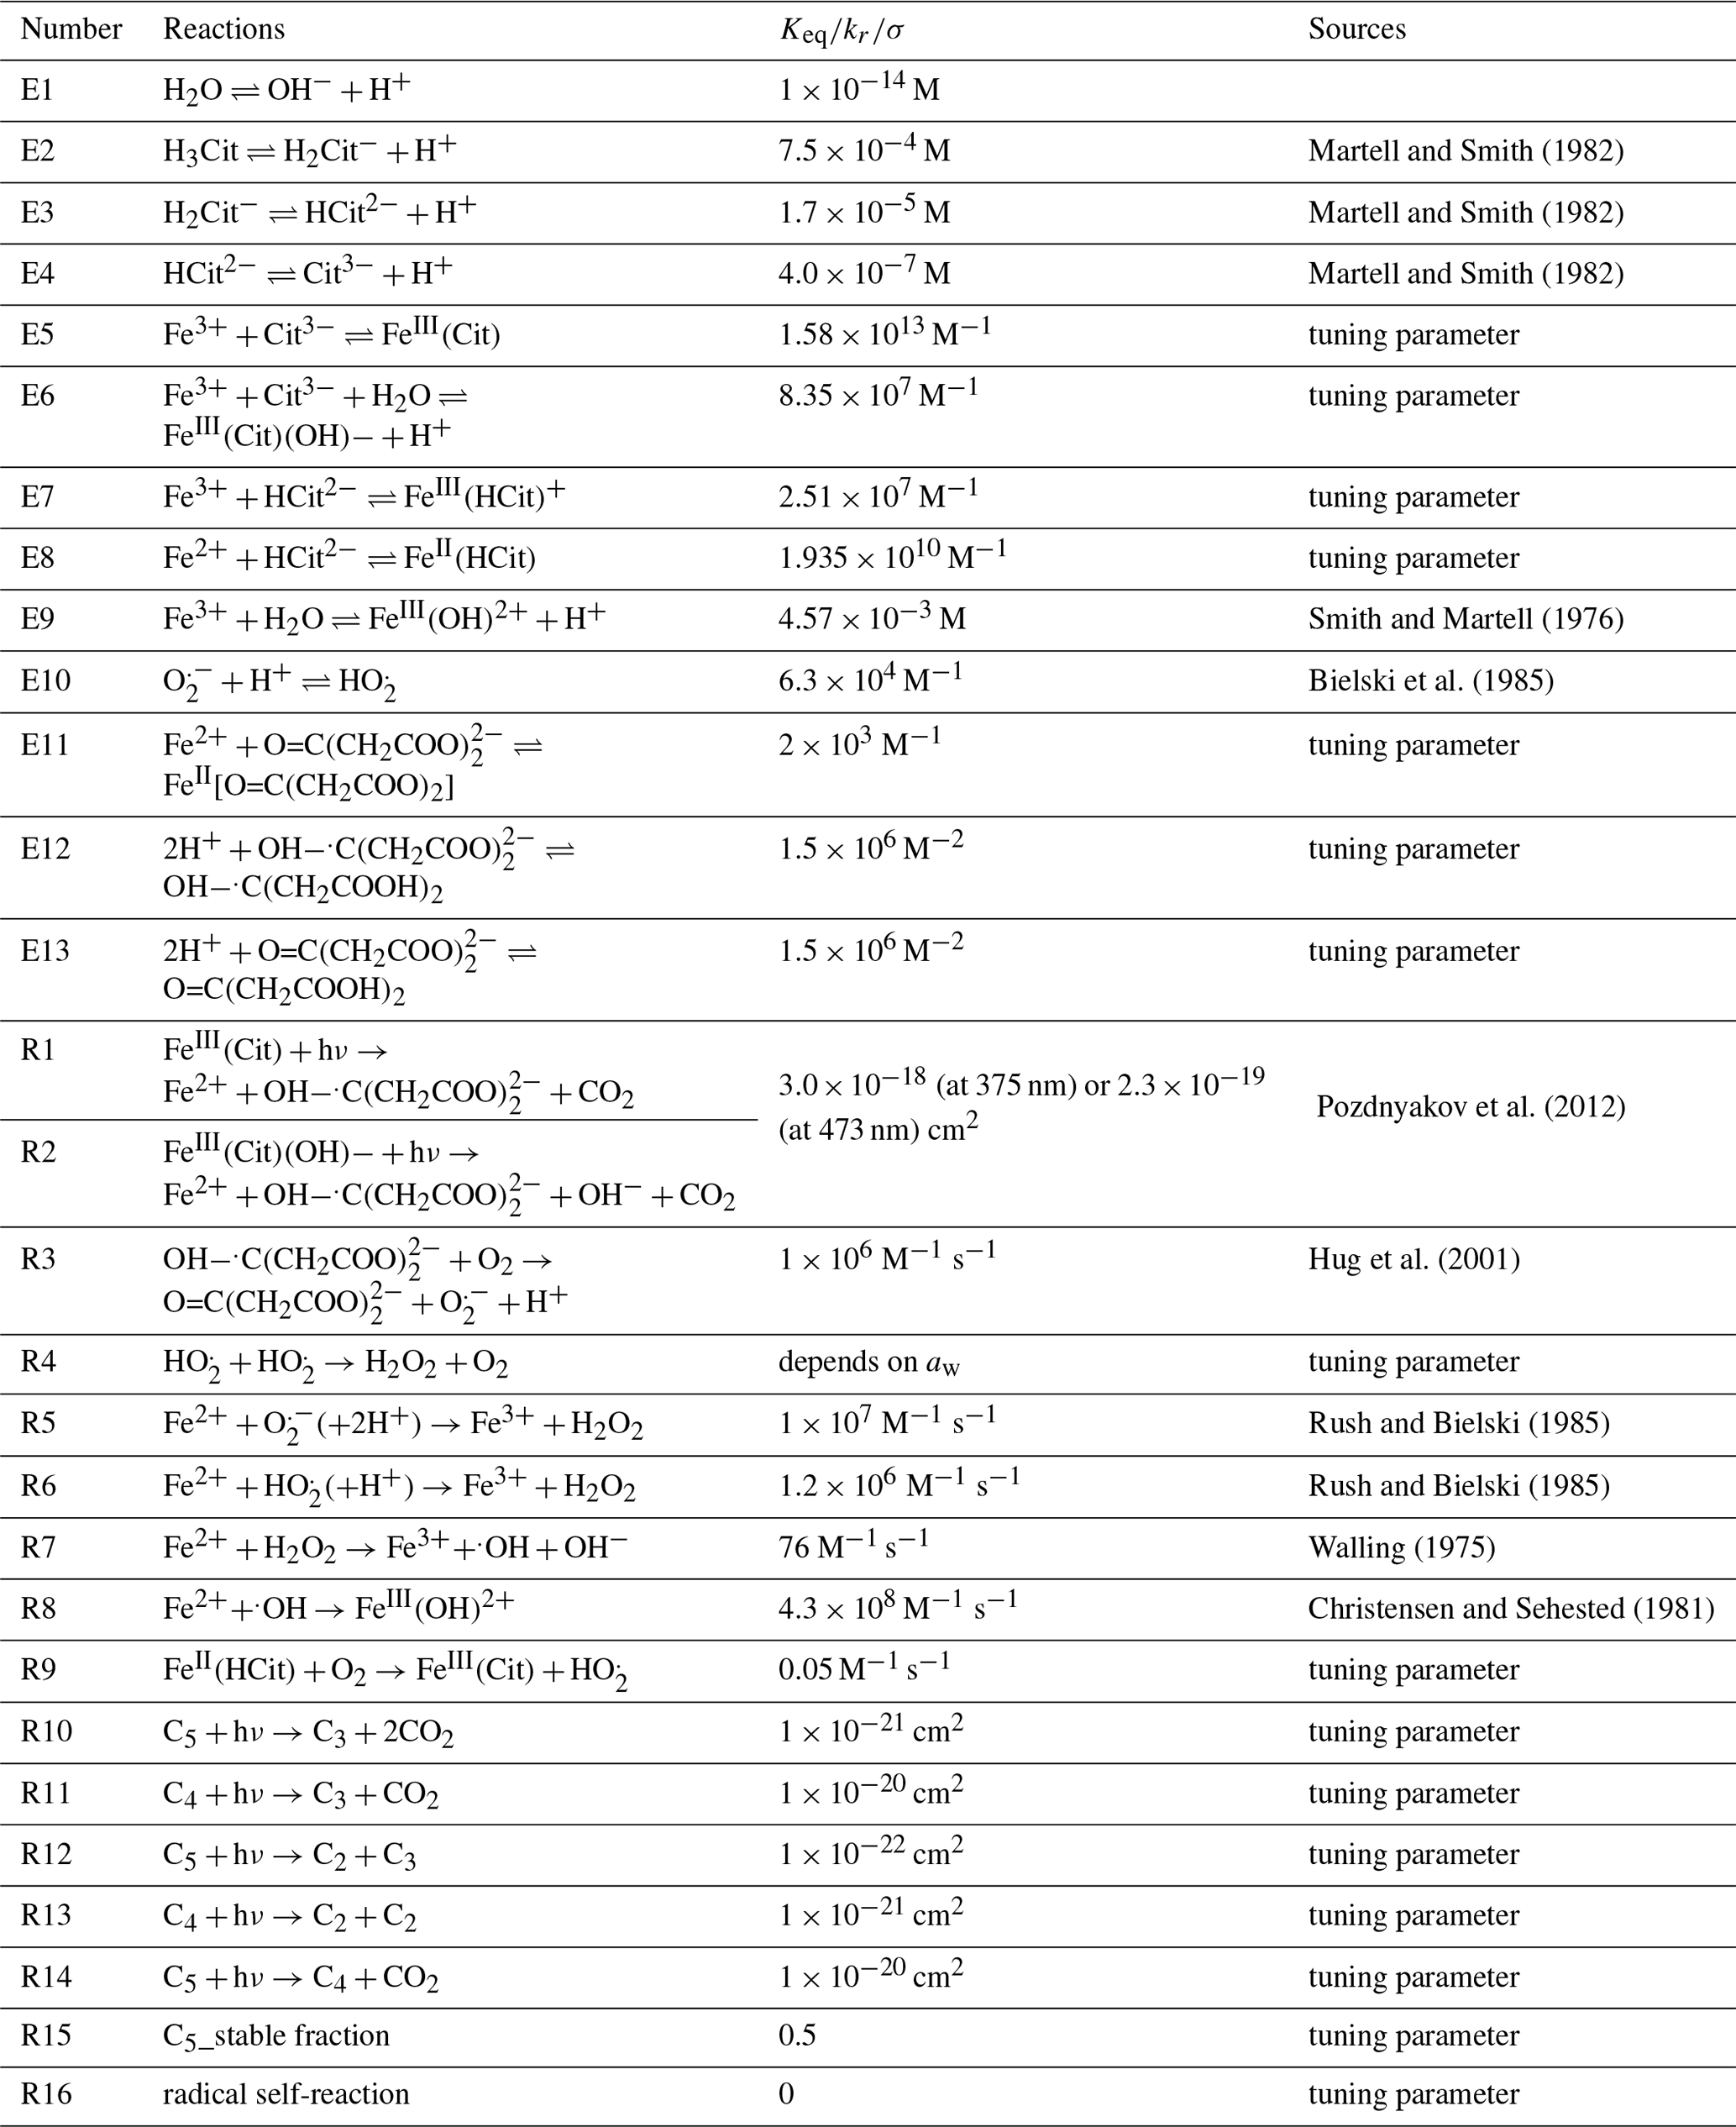
Martell and Smith (1982)Martell and Smith (1982)Martell and Smith (1982)Smith and Martell (1976)Bielski et al. (1985)Pozdnyakov et al. (2012)Hug et al. (2001)Rush and Bielski (1985)Rush and Bielski (1985)Walling (1975)Christensen and Sehested (1981)Table 2Compilation of equilibria, chemical reactions, and corresponding rate constants in FeIII(Cit) photochemistry system.
3.1 The effect of RH on photocatalytic degradation efficiency
We performed experiments with single, levitated particles under continuous UV irradiation (375 nm) in pure O2 at different RH to assess the effects of RH on the photocatalytic cycle shown in Fig. 1 and tested the model performance under these conditions. Qualitatively, a continuous decrease of particle mass and size is expected to occur due to evaporation of volatile products, as shown in Fig. 2. Figure 6 shows the fraction of particle mass remaining with the irradiation time at three different RH calculated from resonance wavelength shifts (Eqs. 1 and 2). Clearly, particle mass was lost to the gas phase with time due to the evaporation of photochemical products and, similarly to Fig. 2, all data show a very significant acceleration of mass loss with time. After tuning some of the parameters of the model as further discussed below, the PRAD model simulations reproduces our data with a very similar trend and magnitude over all, which gives us confidence that the PRAD model captures the essential chemistry and transport during irradiation. (How particle mass evolves subsequently until 80 % mass loss in both experiments and models is shown in Fig. A4.) However, the model is not able to capture the full degree of acceleration of the degradation rate, as it does not attempt to include the complete multigenerational oxidation chemistry at the level of individual components after initial radical production.
The degradation processes were faster at higher RH. At lower RH, the particle was expected to be more viscous, diffusion coefficients were expected to be lower, products were generated at a lower rate, and volatile products moved more slowly to the surface to evaporate. More importantly, O2 taken up by the particle from the gas phase diffused more slowly into the bulk of the particle at lower RH. Thus, less and H2O2 formed and less FeII could be reoxidized from the surface to the center of the particle. The observed gradient in the FeIII fraction, β, and the modeled gradients in O2 and ROS in the particle have been shown with radial profiles in Alpert et al. (2021). This resulted in fewer photochemically active FeIII complexes available for photocatalytic degradation. The characteristic degradation time shortened by a factor of 5.5 when RH increased from 46 % and 61 %, which demonstrates that photochemical cycling is highly sensitive to the microphysical conditions. The diffusivity of O2 must have significantly impacted reoxidation rates. In addition, the diffusion coefficients of both FeII and FeIII species increases with RH. Therefore, the molecular transport between both iron and oxygen reactants increases causing a highly nonlinear trend in increasing mass loss with increasing RH.
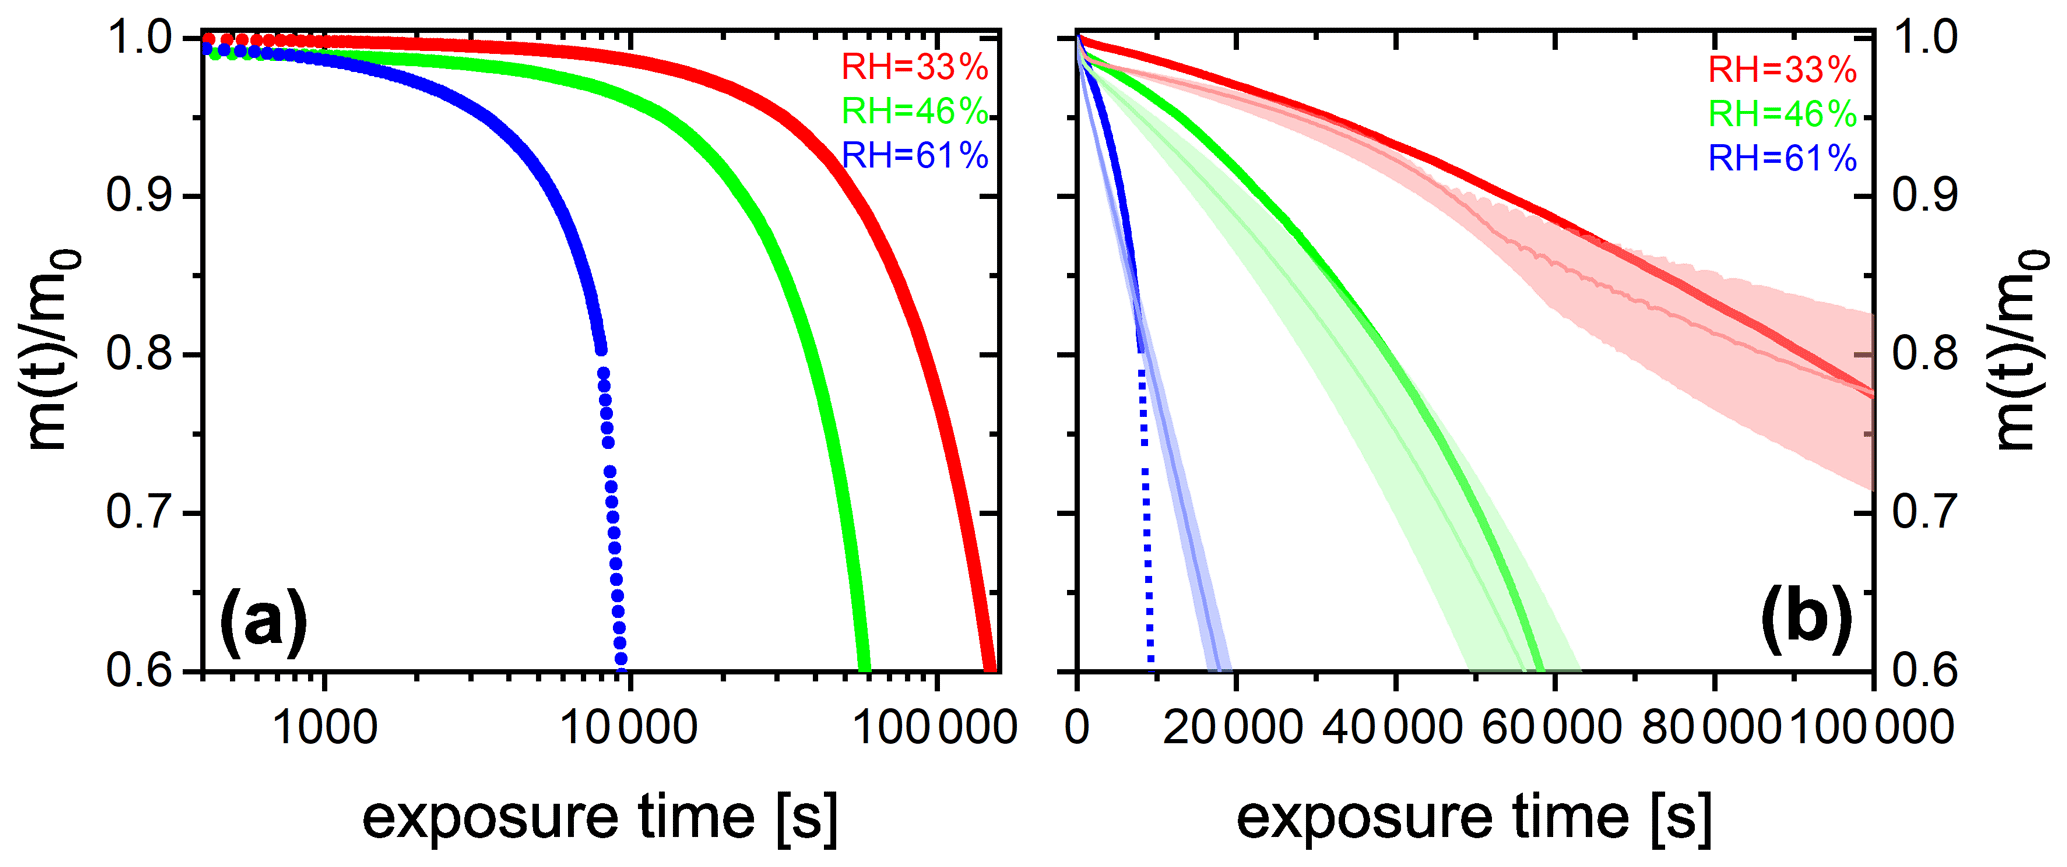
Figure 6(a) FeIII(Cit) ∕ CA (molar ratio 0.05) particle mass change with irradiation time (log scale) at different RH: 33 % (red), 46 % (green), and 61 % (blue). The irradiation wavelength was 375 nm, its intensity was 0.25 W cm−2, and the experimental temperature was 293.5 K. (b) EDB experimental data in (a) with PRAD outputs at corresponding RH (with ±2 % RH uncertainty shown as shaded area) as a function of irradiation time (linear scale).
3.2 Determination of iron(III) reduction rate and iron(II) reoxidation rate by STXM/NEXAFS
In STXM/NEXAFS experiments, the freshly prepared FeIII(Cit) mixed with CA at x=1.0 particles were irradiated to determine the FeIII(Cit) photolysis rate, as shown in Fig. 7. Each experimental data point is the average FeIII fraction from 16–36 individual particles. Fitting an exponential function, , yields and a first-order decay rate of s−1. The LED power at the sample was measured to be 5.9±0.6 mW in total and had a Gaussian spectral profile between 361 and 374 nm at full width half maximum. When mounting the UV fiber optics and collimator lens for multiple samples, the illuminated area had a circle equivalent diameter of 5±1.5 mm. Using the absorption cross section calculated from the molar attenuation coefficient (Pozdnyakov et al., 2008), Φ=1.0 and propagating all uncertainties yields a photochemical reaction rate of s−1, which is in agreement with jobs. This implies that assuming a quantum yield of 1 at these UV wavelengths is reasonable. This calculated value for the photochemical reaction rate was used in the PRAD model for analyzing the STXM/NEXAFS experiments shown in Fig. 7. We note that our estimate of the photochemical reduction rate and agreement with data is based on the reproducibility of setting up our optical system in the X-ray vacuum chamber. In Fig. 8 (discussed below), this setup procedure was performed for RH = 40 % and RH = 50–60 % independently, and still, iron reduction was in agreement with model predictions in the first minutes after UV light was switched off. The width of the red shading in Fig. 7 is large and the UV-fiber setup was likely the largest source of error for j. A better estimate would require repeat measurements as a function of RH, e.g., to elucidate any systematic uncertainty on iron reduction reactions due to viscosity changes. However, this was not possible as usage of the X-ray beam for STXM/NEXAFS experiments was limited to a few days to complete all experiments.
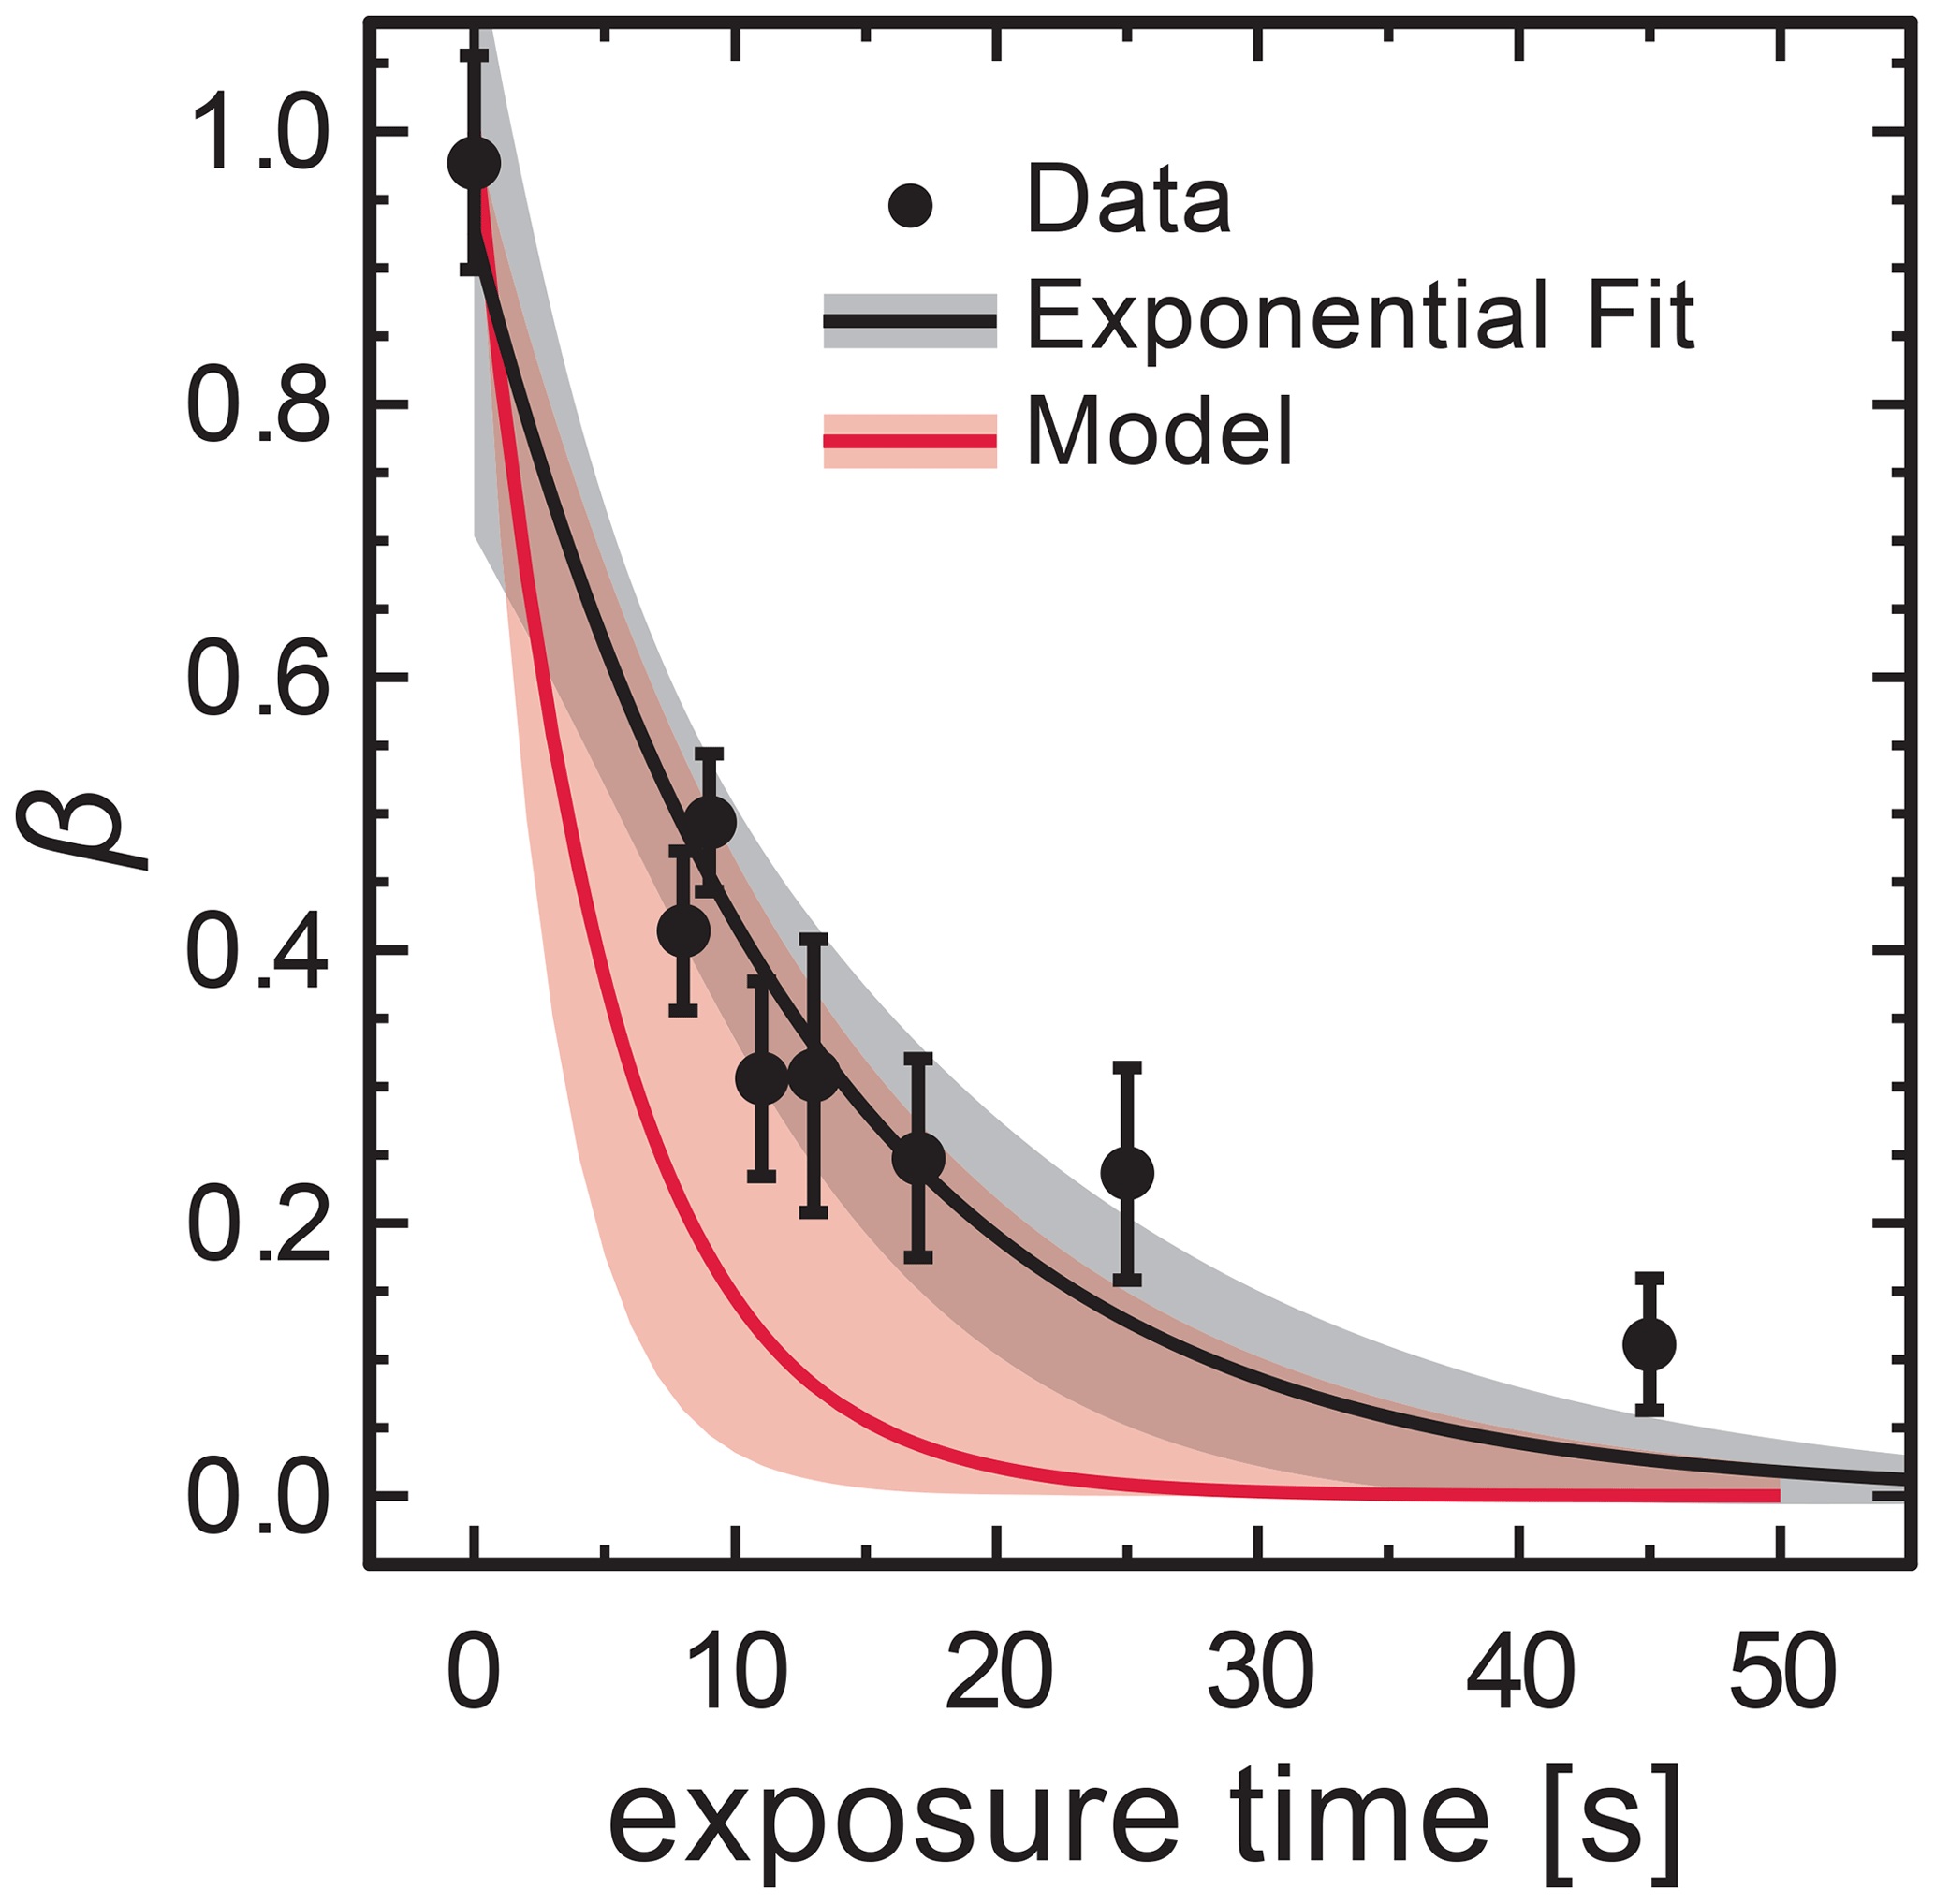
Figure 7Loss of FeIII in FeIII(Cit) ∕ CA (molar ratio of 1) particles as a function of light exposure time determined using STXM/NEXAFS at 293.5 K. Each data point is the average FeIII fraction over about 16–36 individual particles. An exponential fit, , yields for the initial condition and a first-order decay rate of s−1. The black shading indicates 95 % confidence on the exponential fit. The PRAD model prediction and uncertainty are given as red solid line and shading, respectively, and use a calculated decay rate of s−1.
In a different set of experiments, we irradiated particles using a much lower power setting with s−1 in a mixed He and O2 atmosphere and at a fixed RH for 15 min to reduce FeIII to FeII. The UV light was then switched off to allow reoxidation in the dark while measuring β over time. Figure 8 shows β as a function of time at RH = 40 %, 50 %, and 60 %. Clearly, the FeIII fraction increased more significantly more slowly with time at drier conditions. While particles were observed to reoxidize to β=0.7 within 2 h at 60 % RH and expected to be completely reoxidized within about 6 h according to the PRAD model simulations, no significant reoxidation occurred on this timescale for the particles exposed to only 40 % RH. Modeling the reoxidation with the PRAD model yields very satisfactory agreement indicating that the diffusivity parameterizations of the model are capturing the RH dependence of the molecular transport in the viscous matrix.
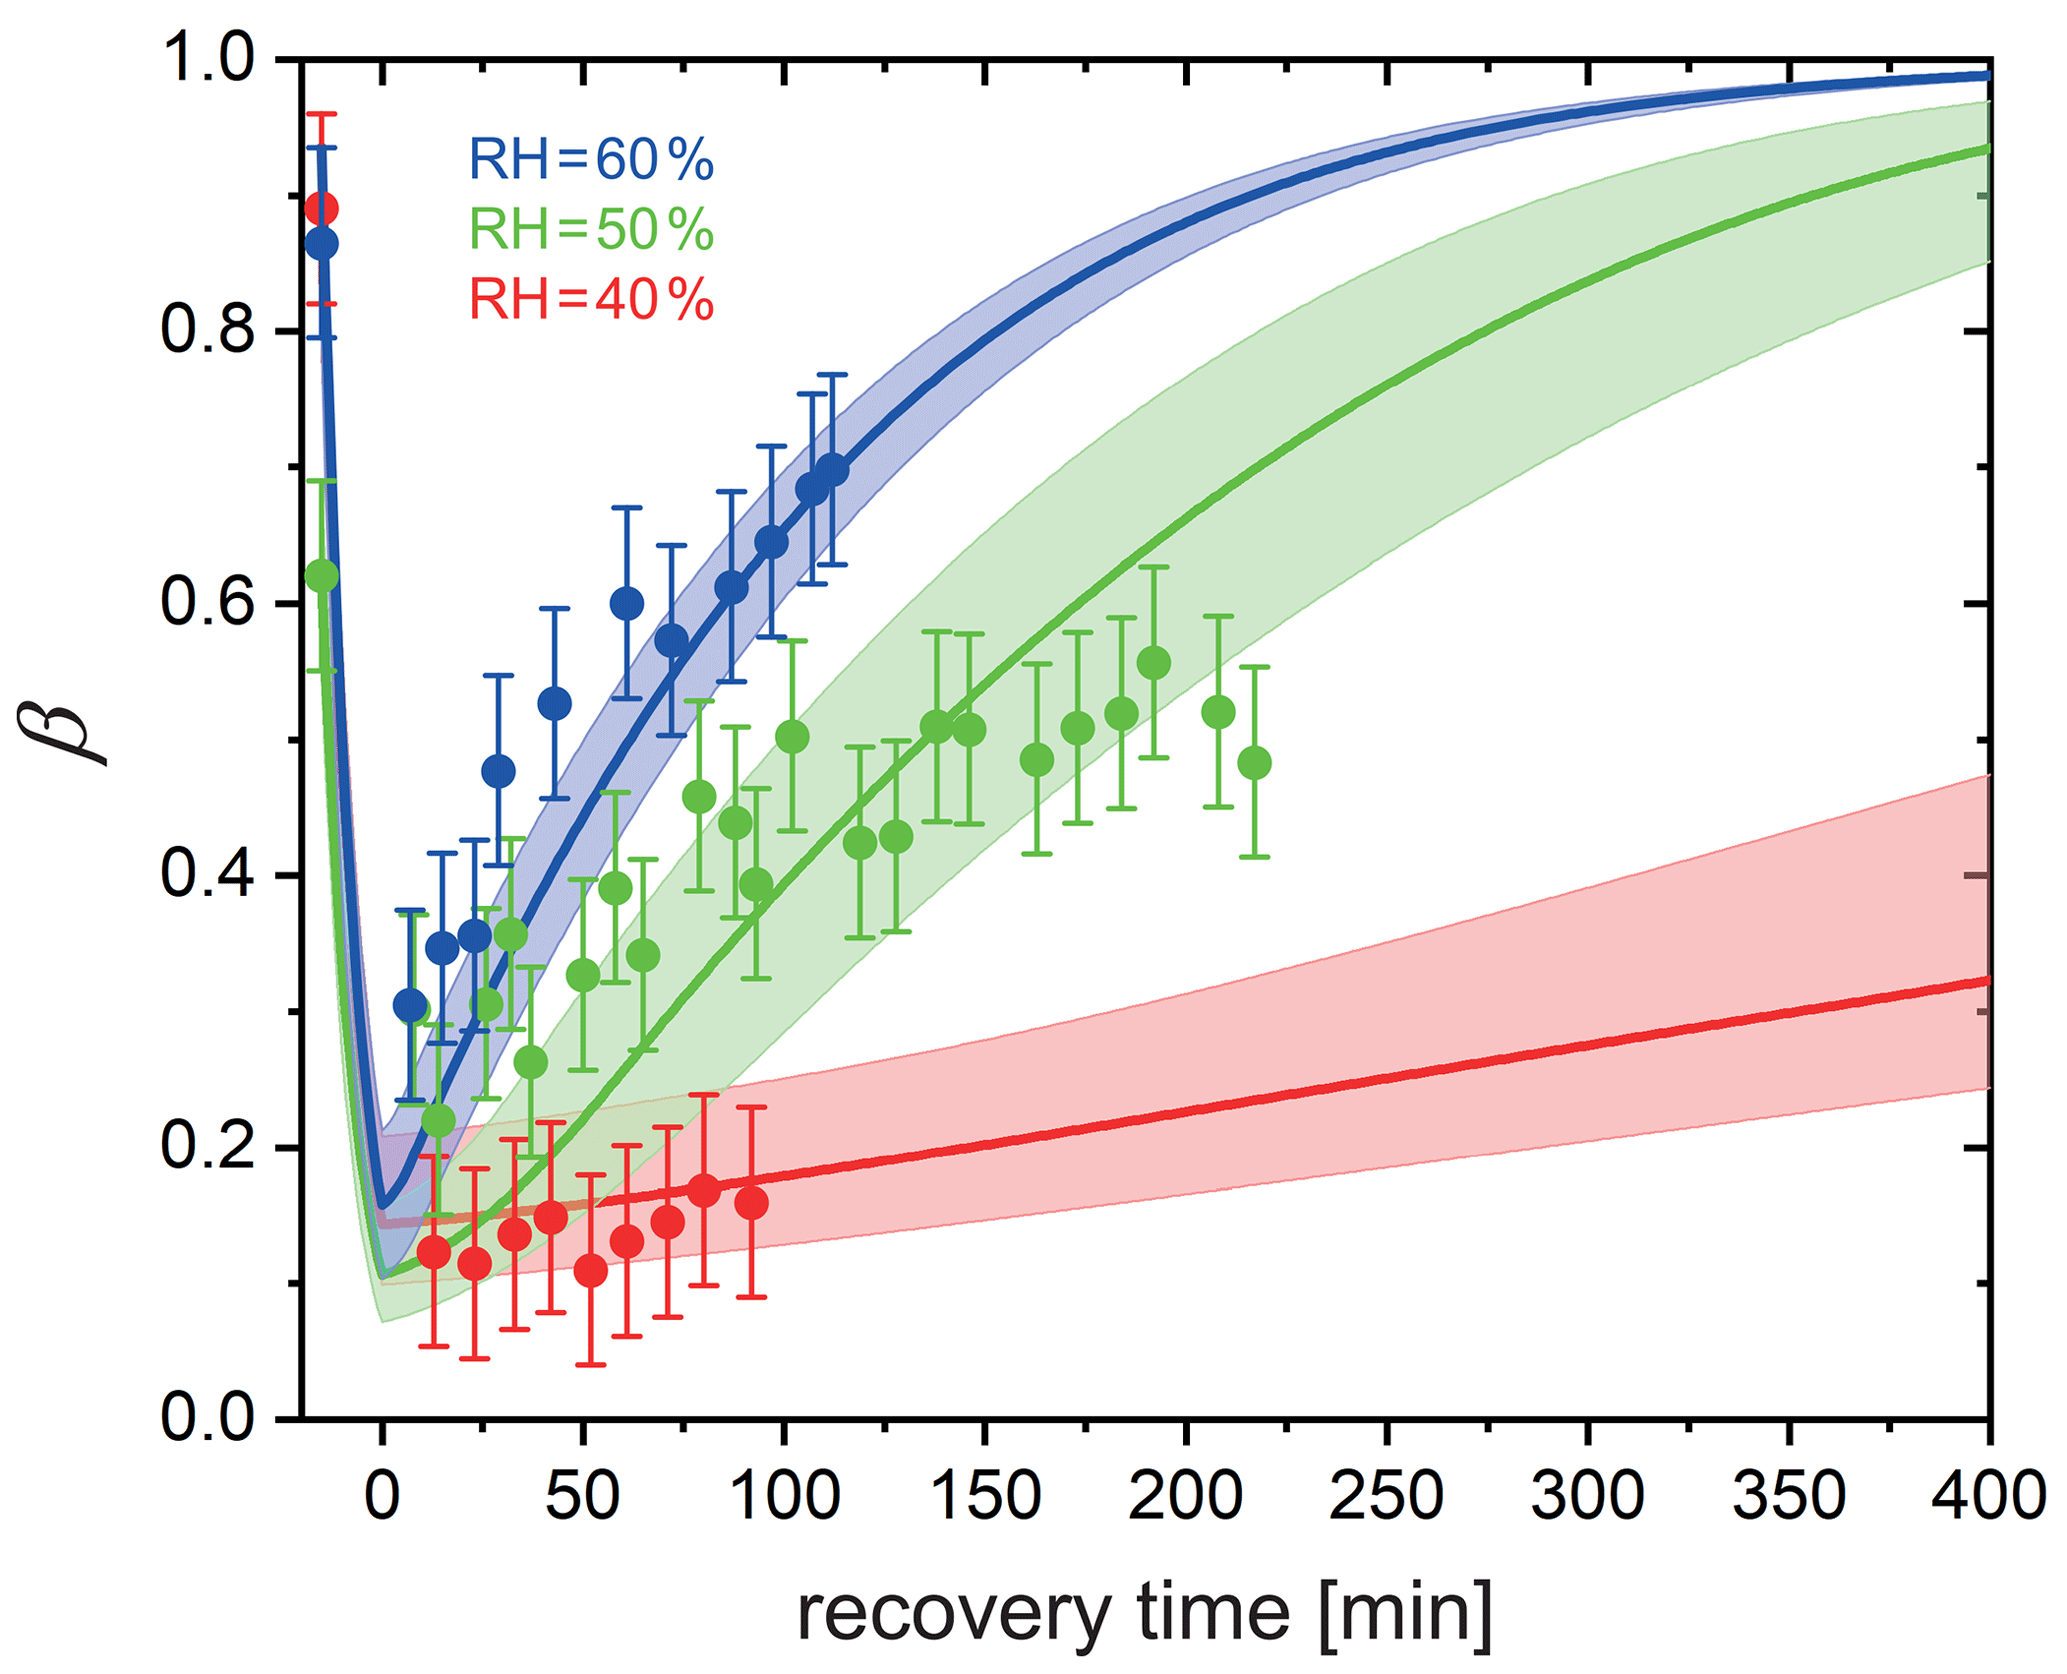
Figure 8Reoxidation of FeIII as a function of exposure time in O2 from STXM observations. Time before 0 represents the initial 15 min irradiation procedure under He. FeIII(Cit) ∕ CA (molar ratio of 1) particles at 293.5 K with 40 % RH (red dots), 50 % RH (green dots), and 60 % RH (blue dots). Lines: red (40 % RH), green (50 % RH), and blue (60 % RH) are the FeIII fractions predicted using the PRAD model, the shaded areas indicate model output assuming ±2 % RH, ±0.07 initial FeIII fraction, and ±1.8 % light intensity uncertainty in the STXM experimental conditions.
3.3 Determination of iron(II) reoxidation rate with single, levitated particles using EDB
As the experiments with single, levitated particles yield only bulk properties and not the oxidation state of iron citrate directly, we designed a dedicated experimental procedure to indirectly determine the reoxidation rate of FeII. We used multiple irradiation and reoxidation repetitions as shown schematically in Fig. 9. Initially, we exposed a newly injected FeIII(Cit) ∕ CA aqueous particle to blue laser irradiation (473 nm, 4 W cm−2) in pure N2 for 500 s to ensure all FeIII was reduced through photolysis (Reactions R1 and R2 listed in Table 2). As previously described, these reactions led to CO2 production with subsequent loss of CO2 to the gas phase, which was observed as a shift in the Mie-resonance wavelength. This shift is shown in Fig. 2b and on an enlarged scale in Fig. 10. After irradiation, we switched the gas flow from N2 to O2 in the dark, and FeII was oxidized back to FeIII over time in this period, either by ROS (Reactions R5–R8) or directly by O2 (Reaction R9). After a defined time spent in O2, the gas flow was switched back to N2 followed by irradiation to repeat the photolysis step done initially. The ratio of the Mie-resonance wavelength shift of the two photolysis steps was set to be proportional to the ratio of reoxidized FeIII∕Fetot. These two steps (i.e., photolysis in N2 and reoxidation in O2) were repeated several times, but between each irradiation the particle was exposed to O2 for different time periods. Following this procedure we intended to map out the characteristic time for reoxidation at various RH.
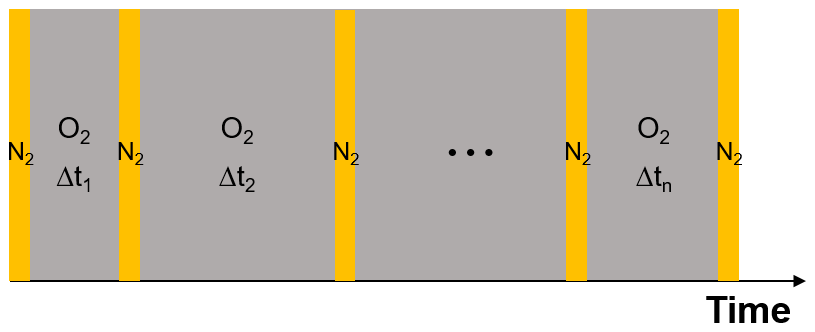
Figure 9Schematic of the experimental procedure to investigate the reoxidation rate of FeII. Orange columns represent laser irradiation (473 nm, 4 W cm−2). Each irradiation takes place in pure N2 for a period of 500 s. Grey columns mark the recovery process in pure O2 in the dark; here the time interval is varied. For details, see text.

Figure 10Temporal evolution of two Mie-resonance wavelength shifts and particle mass changes normalized to the wavelength and mass prior to irradiation; the experiment was done at 48 % RH and 293.5 K. The orange area marks the time with irradiation (473 nm, 4 W cm−2). Black: first irradiation with a fresh FeIII(Cit) ∕ CA particle in N2, red: irradiation in N2 right after the particle recovered in O2 for 45 min in the dark. Two horizontal dashed lines are indicating the final mass remaining after CO2 loss to the gas phase. For an explanation of the scaling of the third axis, indicating the equivalent FeIII∕Fetot ratio, see text.
An example of the corresponding raw data (293.5 K and 48 % RH) and retrieved oxidation state is shown Fig. 10. Black circles indicate the first irradiation step with a fresh FeIII(Cit) ∕ CA particle, and red circles indicate the irradiation step that followed the particle after exposure to O2 for 45 min in the dark. Clearly, the resonance wavelength decreased more during the first irradiation than the second. Therefore, we can conclude unambiguously that the FeIII(Cit) ∕ CA particle initially had more FeIII than what could be reoxidized in O2 for 45 min. Quantitative scaling, however, requires knowledge of the initial FeIII fraction. Our experiments showed that long exposure (tens of hours) to O2 yielded larger Mie-resonance shifts than those of the initial photolysis of the freshly prepared particle. This indicated that the initial FeIII fraction was less than 1.0. Hence, we accordingly normalized the FeIII fraction to the data at long (>15 h) exposure times. For the experiment included in Fig. 10, for example, the initial FeIII fraction of the particle was 0.76, indicating that the particle was partially reduced during sample preparation. After the particle was totally photoreduced, exposure to O2 for 45 min did not reoxidize all reduced FeII to FeIII; only 0.36 FeIII was recovered (as shown by two horizontal dashed lines in Fig. 10).
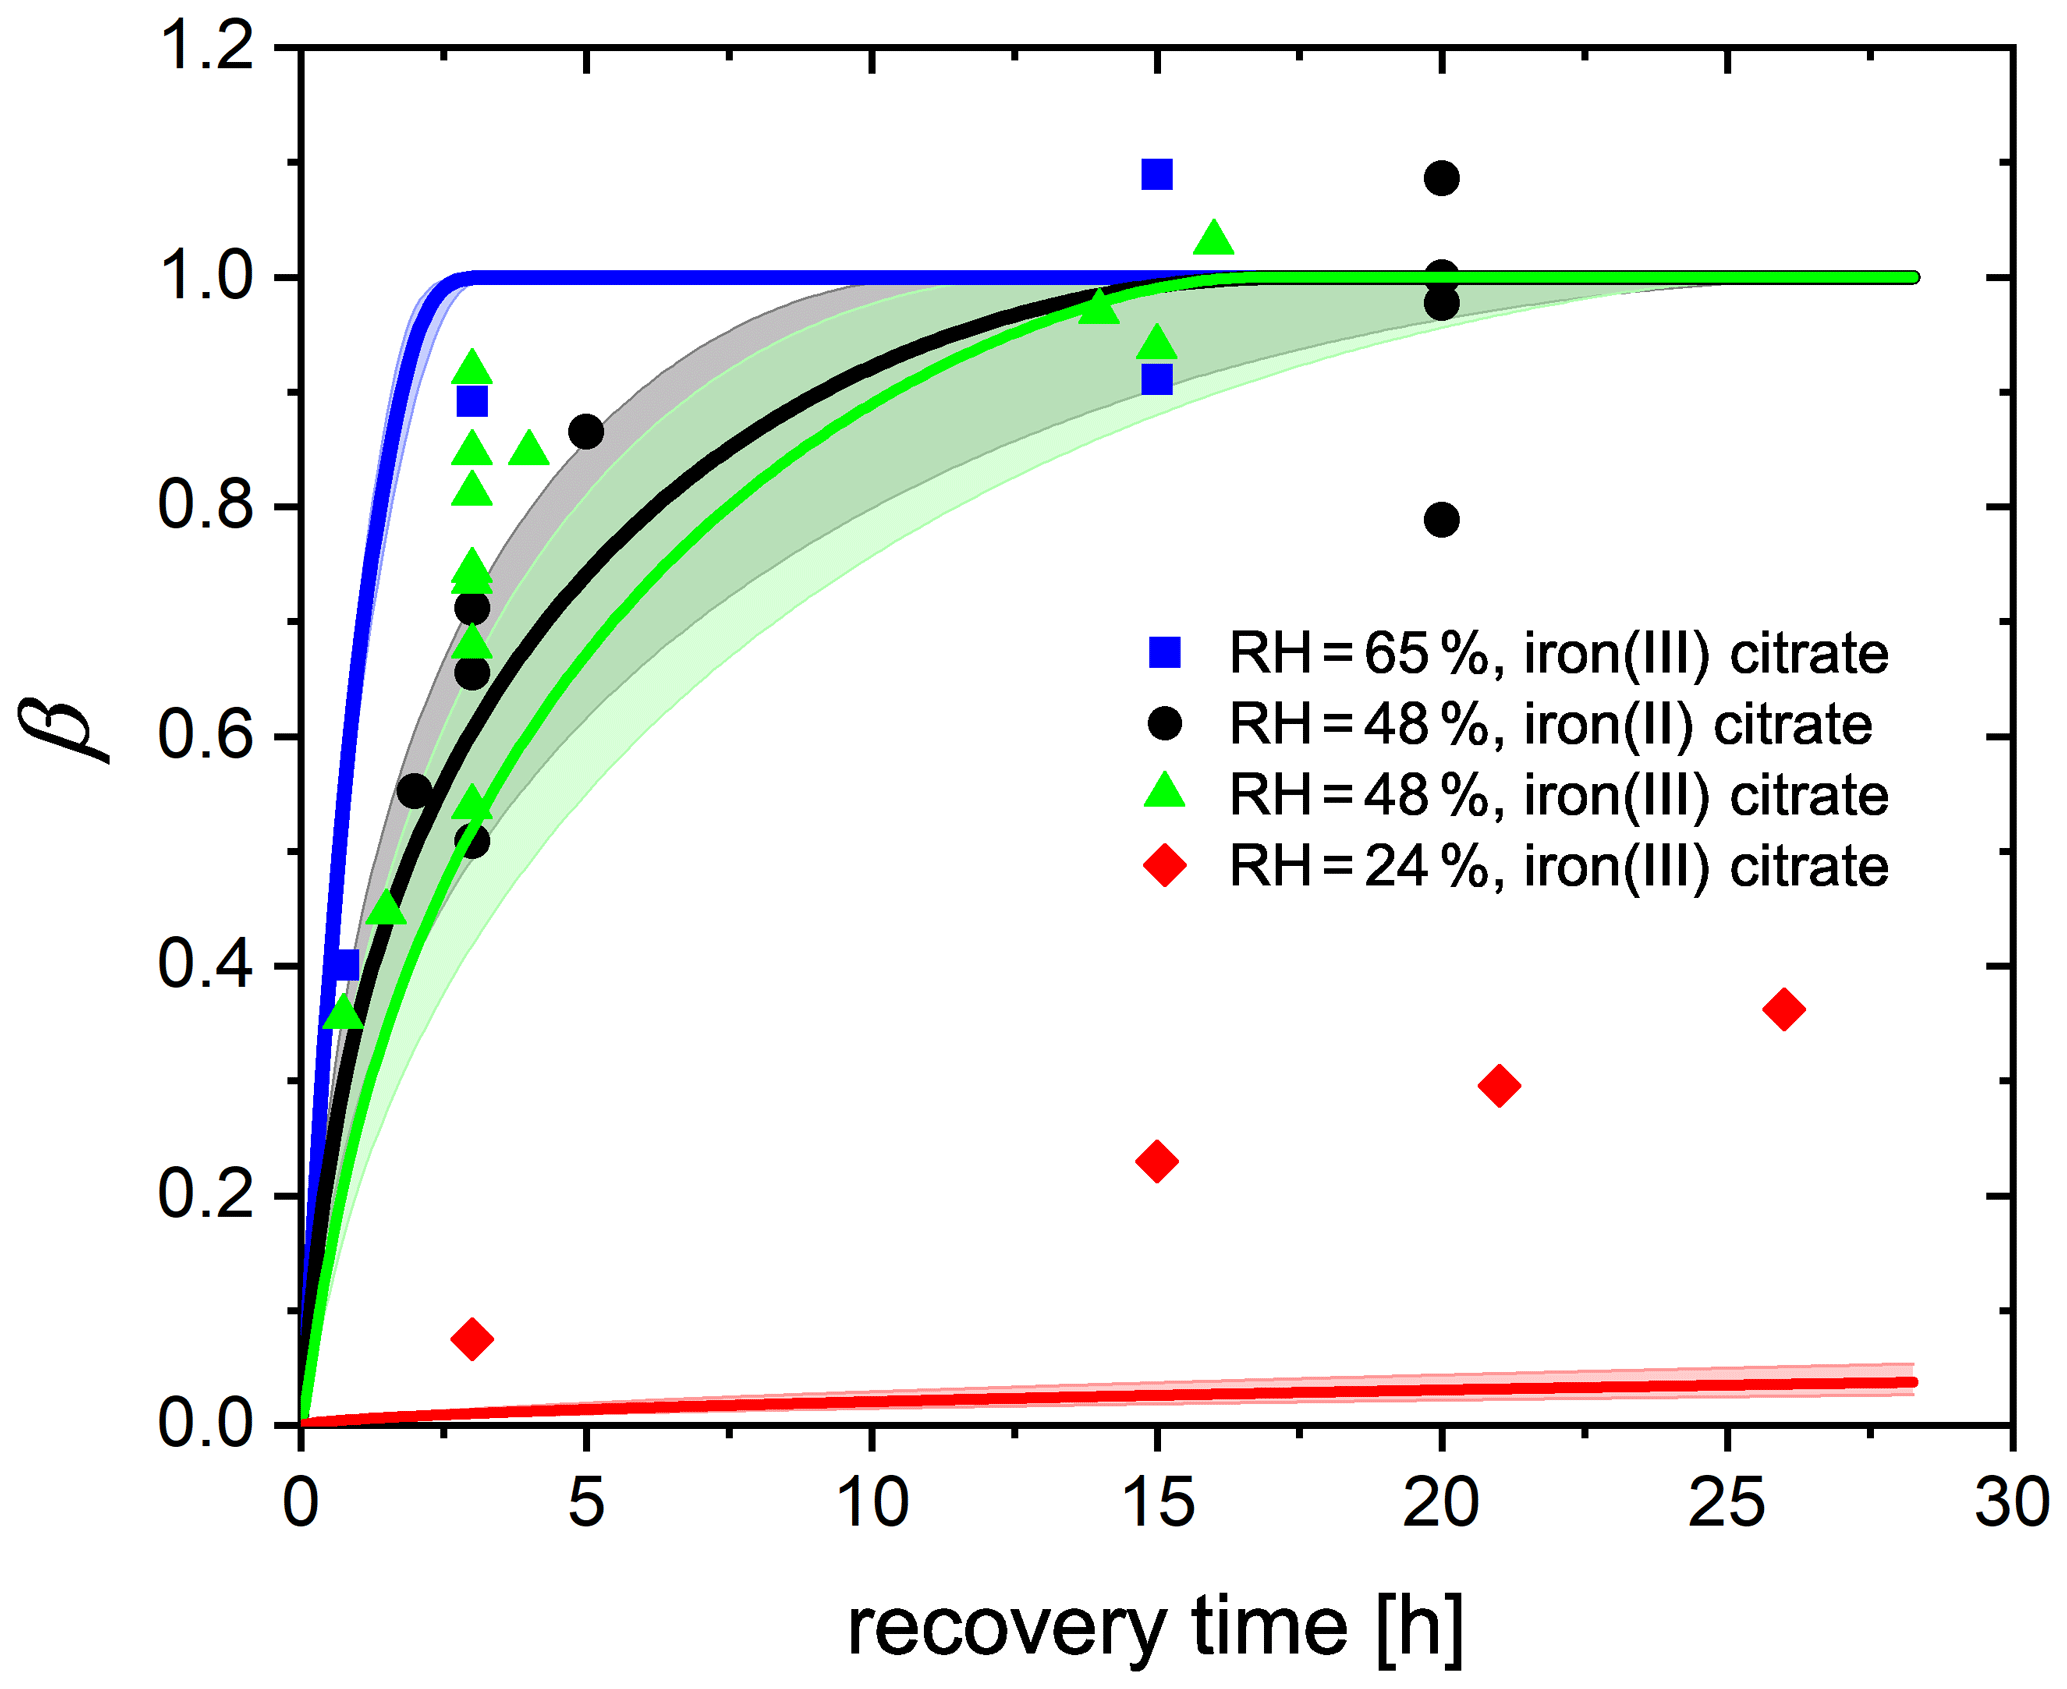
Figure 11FeIII fraction after different time intervals of recovery in O2 from EDB observations. FeIII(Cit) ∕ CA (molar ratio of 0.05) particles at 293.5 K with 24 % RH (red diamonds), 48 % RH (green triangles), and 65 % RH (blue squares). Black dots: experiments with FeII(HCit) ∕ CA particles at 48 % RH. Lines: red (24 % RH), black (48 % RH), and blue (65 % RH) are the FeIII fractions predicted using the PRAD model; the shaded areas indicate model output assuming ±2 % RH uncertainty in the EDB experimental conditions.
Another set of experiments was done by starting with freshly injected FeII(HCit) ∕ CA particles instead of FeIII(Cit) ∕ CA. The only difference in experimental procedure, compared to what is described above, is that there is no first irradiation step. Instead, the particle is initially exposed to O2 in the dark for a certain time interval, during which FeII is oxidized only directly by O2 (Reaction R9). Afterwards, the same irradiation and recovery procedures as reported above were used. The equivalent FeIII fractions of all experiments are shown in Fig. 11. Any uncertainty in the normalization of an individual experiment will cause a corresponding uncertainty in the normalized mass loss, which made estimating the uncertainty for individual data points impossible. Nevertheless, from the complete data set, it was evident that with longer time intervals in O2, more FeIII was recovered. At 48 % and 65 % RH, about 10 and 3 h exposure to O2, respectively, was sufficient for all FeII to be reoxidized, while at 24 % RH, the recovery even after 25 h was not yet complete. The general trend is consistent with our observation in the STXM/NEXAFS experiments (Sect. 3.2) and can be attributed to molecular diffusion limitations at lower RH: it takes more time for O2 to diffuse into the particle and for FeII to diffuse out to the surface of the particle to react with O2. It was also evident from these data that FeII reoxidized by O2 is as important as FeII reoxidized by radicals and peroxides as there is no significant difference between the experiments starting from FeII(HCit) ∕ CA compared to those with FeIII(Cit) ∕ CA. In addition, it indicates that both iron(II) and iron(III) can act as a photocatalyst as long as iron(II) can be oxidized to iron(III), which was also confirmed by Grgić et al. (1999).
By tuning the direct oxidation rate of FeII(HCit) by O2 (Reaction R9) and the diffusivity of O2, we are able to model the recovery rate at different RH using the PRAD model as shown in Fig. 11. There is satisfactory agreement for the larger RH, but significant underestimation of reoxidation for the experiments at 24 % RH. Our model requires the reaction rate coefficient of Reaction (R9) to be 0.05 , which is a factor of 60 smaller than the value that Gonzalez et al. (2017) estimated from their model (3±0.7 ). The liquid phase diffusivity of O2 in our model is m2 s−1 at 24 % RH, m2 s−1 at 48 % RH, and m2 s−1 at 65 % RH. These diffusivities of O2 are 2–4 orders of magnitude smaller than those of CO2 determined in Dou et al. (2019). However, we need to stress that in the model, some of the iron-related complex equilibrium constants, their diffusion coefficients, and the Henry's law coefficient of O2 at different water activities are highly uncertain as well, yielding to a significant uncertainty in the determination of O2 diffusivity. For example, if the solubility of O2 was less than what our parameters predict now, a larger O2 diffusivity would be consistent with our data. In addition, with the total gas flow used in our experiments, it takes about 8 min for replacing the entire EDB gas volume from N2 to O2, and from the response of the particle to flow condition change, we estimate an interval of about 30 min to reach full equilibration to the new gas phase conditions. Therefore, the lifetime of organic radicals needs to be reconsidered. In the PRAD model, we do not take the radical–radical self-reactions (Reaction R16) into account, which may turn out to be a significant sink for the radicals. However, it should be pointed out that the parameter set we have now is a good compromise with additional constraints from STXM/NEXAFS and CWFT experiments.
Another approximate approach to analyze the data of Fig. 11 is to use the analytical solutions for a reacto-diffusive kinetic regime. Here, O2 taken up from the gas phase by a particle remains confined to a very thin layer below its surface compared to its size provided it reacts reasonably fast with the organic components. Under these conditions there are always pairs of reaction rate and diffusion constants representing the experiments equally well (Alpert et al., 2019; Steimer et al., 2014). In the reacto-diffusive framework, with a constrained reaction rate and Henry's law coefficient of O2, the diffusion coefficient of O2 can be estimated to be and m2 s−1 at 48 % and 65 % RH, respectively (details are given in Appendix A4). These are both 1 order of magnitude less than the values from PRAD model prediction, but still consistent with each other when considering all uncertainties.
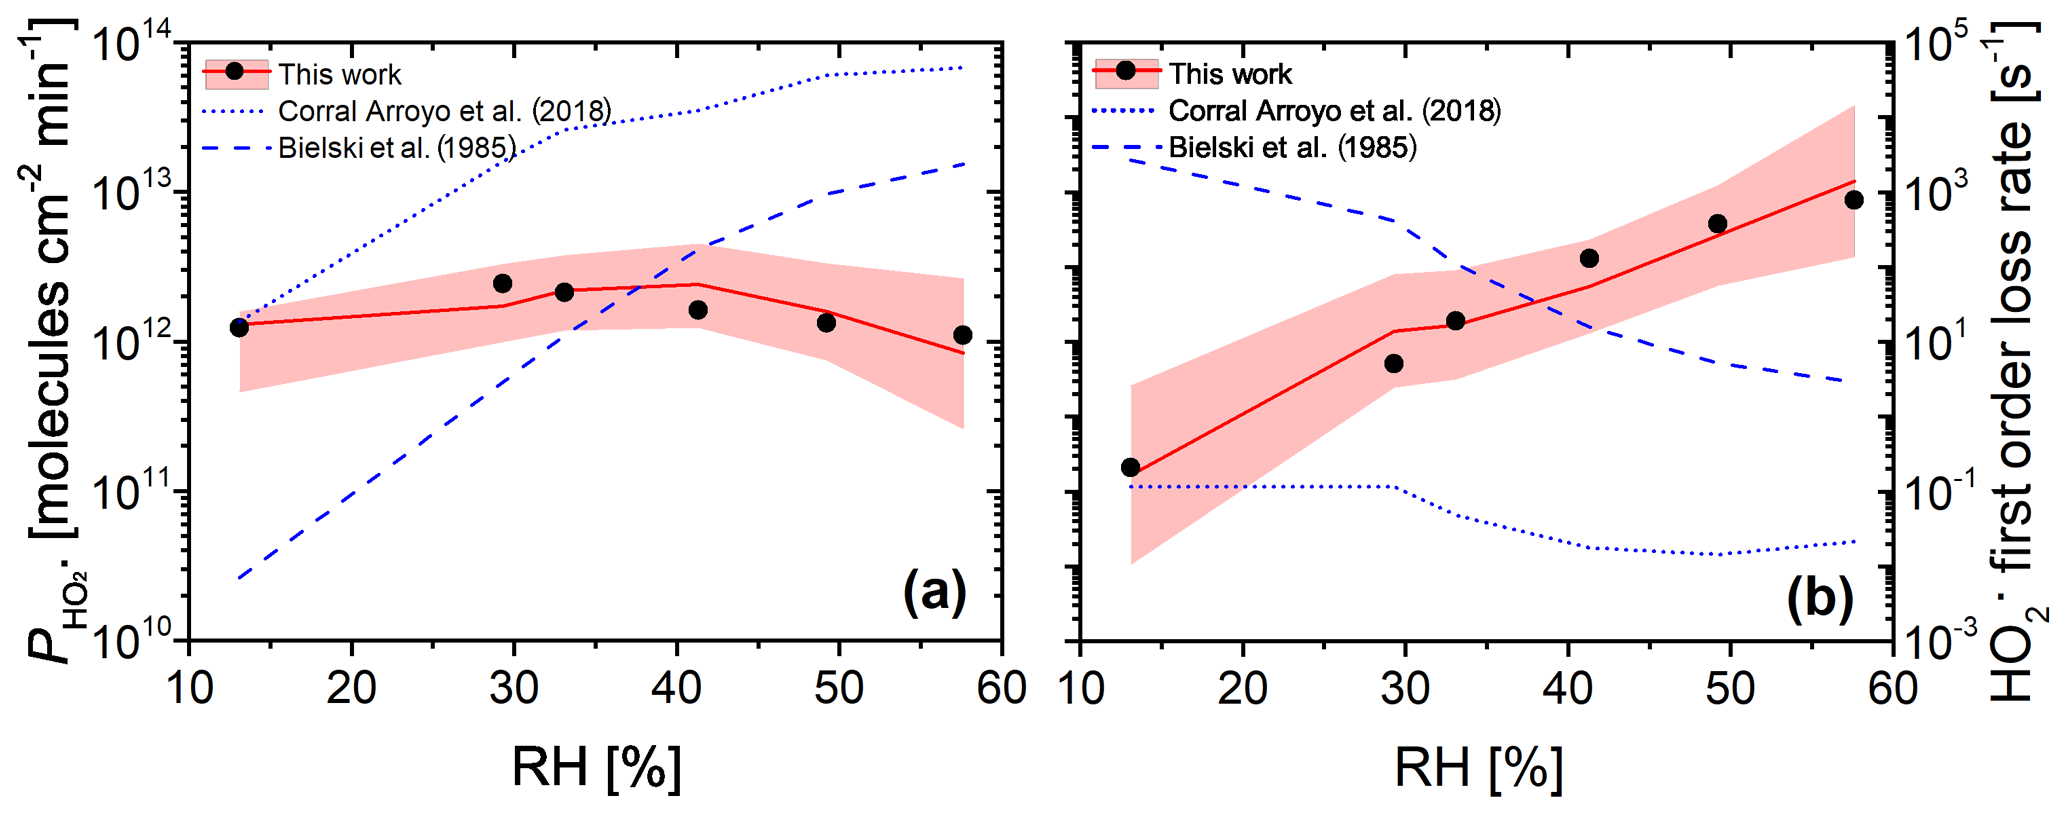
Figure 12(a) Measured (black dots, experimental uncertainty of 3 % smaller than symbol size) and modeled (red line and shaded area) production from continued photochemistry of FeIII(Cit) ∕ CA (molar ratio of 0.07) films as a function of RH in CWFT experiments. Dotted and dashed blue lines were determined from parameterization of k5 as a function of RH (Corral Arroyo et al., 2018) and in dilute aqueous solution (Bielski et al., 1985), respectively. (b) The maximum first-order loss rate determined from the result of the maximum concentration times self-reaction rate, k5, which was adjusted to match observations in panel (a) (black dots), or times k5 parameterized as a function of RH for our PRAD model (Eq. A11) with confidence interval of 95 % (red line and shading), or times k5 from Corral Arroyo et al. (2018) (dotted blue line), or (Bielski et al., 1985) (dashed blue line).
3.4 production measured by CWFT experiments
The CWFT experiment allows us to investigate another aspect of the photochemistry of the FeIII(Cit) ∕ CA system. According to Reactions (R1)–(R3) shown in Table 2, the radical is produced upon irradiation and will partition to the gas phase. Figure 12a shows the RH dependence of production, , from thin films in the CWFT experiment. We observed that increased with RH when the RH was increased from 13 % to 29 % by a factor of about 2. This may be expected since an increase from 13 % to 29 % RH leads to increasing molecular diffusion coefficients and faster chemical cycling (Lienhard et al., 2014; Song et al., 2016). However, at RH between 30 % and 60 %, decreased with RH, with a production rate at 60 % similar to the rate under dry conditions. This is probably due to the decreasing concentrations of donors (e.g., FeIII(Cit) and Cit.). But the decrease in concentrations with RH is too small compared to the increase in diffusion coefficients with RH. This means that there must be a strong sink of in the condensed phase when RH increases, which was confirmed by an increasing first-order loss rate as shown by black dots in Fig. 12b. When predicting with the PRAD model using a constant self-reaction rate of (Bielski et al., 1985) or a linearly increasing with RH, as in Corral Arroyo et al. (2018), the model deviates significantly from the data and does not exhibit the observed trend of decreasing for RH > 30 %. Both assumptions lead to a continuous increase of with RH as indicated by dashed and dotted blue lines in Fig. 12a, with a decrease in the first-order loss rate as shown in Fig. 12b, which is opposite from our adjustment. Therefore, we argue that the effects of the increasing diffusivity and the stronger sink of HO2 with RH compensate each other, making almost independent of RH.
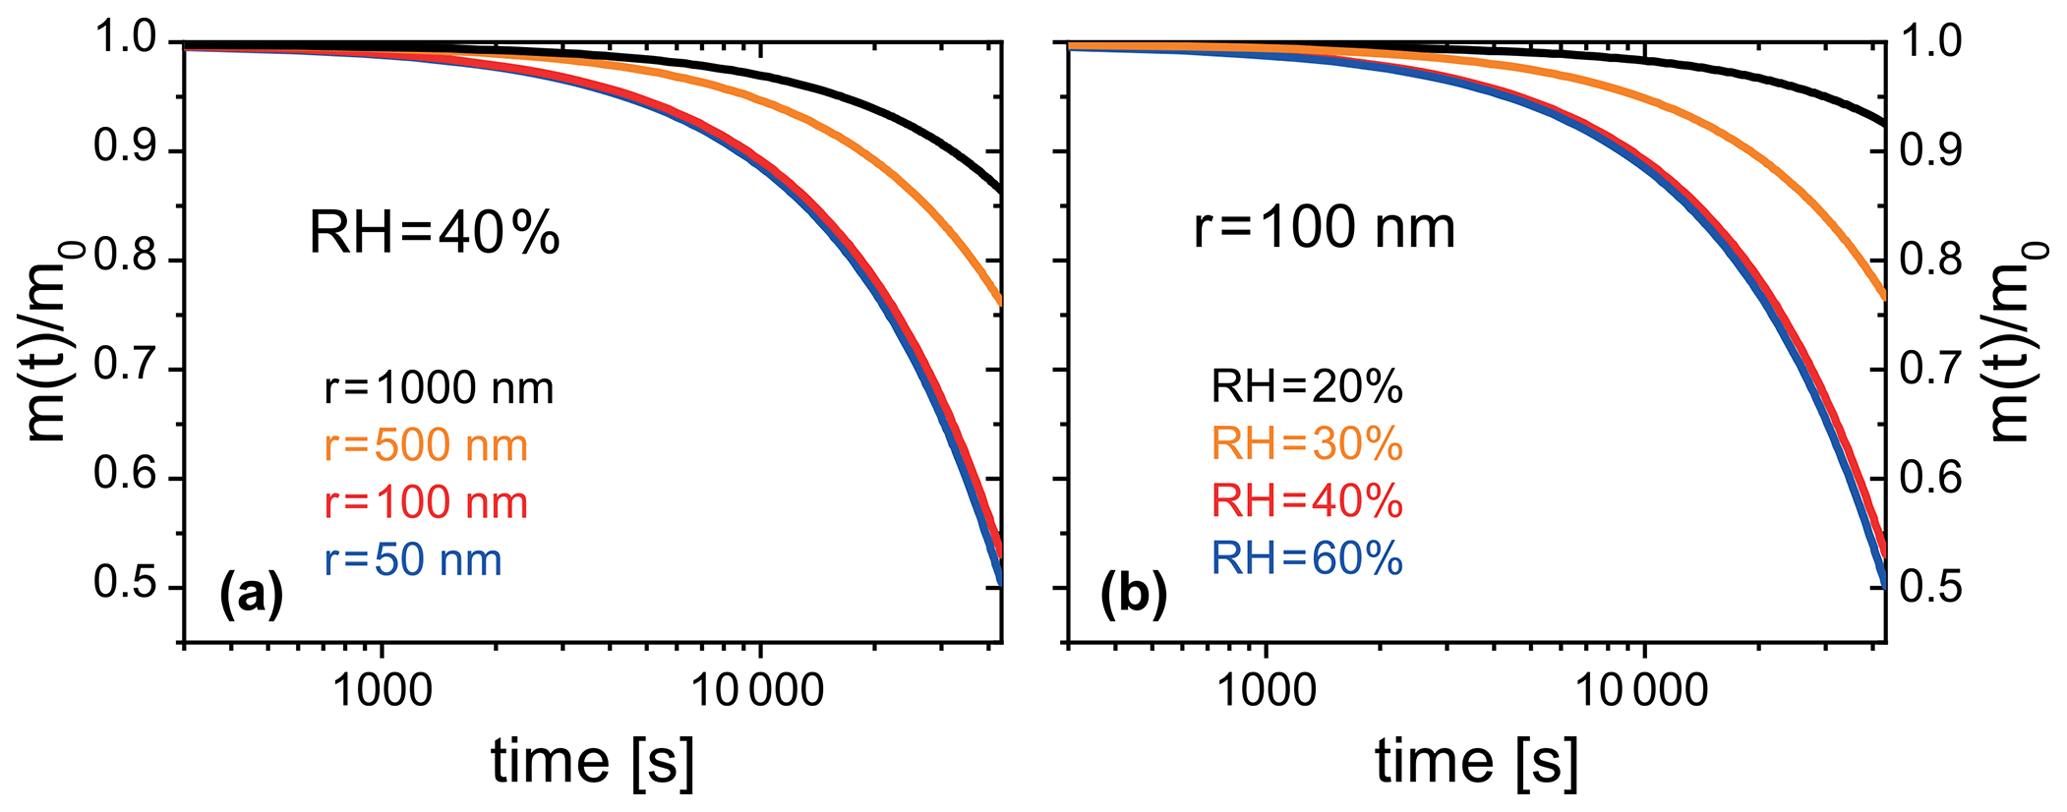
Figure 13PRAD simulated organic mass loss of FeIII(Cit) ∕ CA (molar ratio of 0.01) for (a) particles of different radii at 40 % RH, and (b) particles with a radius of 100 nm at different RH. All simulations were performed at 293.5 K and for 12 h solar irradiation at 30∘ zenith angle (Madronich et al., 1995).
3.5 Photochemical degradation under atmospheric conditions
The PRAD model was also developed to be used in more general particle systems. After establishing a parameter set for the PRAD model framework that satisfactorily explains the experimental data obtained with three complementary experimental techniques over a wide parameter range, we used the model to predict photochemical degradation of organic aerosol particles containing carboxylate complexes. For example, an aqueous organic acid particle with a dust inclusion containing iron may exhibit a low enough pH to dissolve part of the iron of the dust inclusion and form photoreactive iron carboxylate complexes (George et al., 2012, 2015). If we take the PRAD model as being representative for such a class of particles, we may estimate the degradation of the organic mass by volatilization of products to the gas phase. Figure 13 show examples of such PRAD model predictions: we assume that the organic mass of the particle is composed of aqueous FeIII(Cit) ∕ CA with a molar ratio of the latter being 0.01. Here, panel (a) illustrates size dependence and panel (b) illustrates RH dependence for particles exposed to air at 293.5 K and an actinic flux at 30∘ zenith angle (Madronich et al., 1995). After 12 h exposure to sunlight, the organic mass of the particle (here, CA) was photochemically processed to CO2 and smaller compounds of high volatility yielding a combined mass loss to the gas phase of up to 50 % depending on size and RH.
To better understand the importance of mass loss in this generalized system, we make a simple and modest comparison of mass loss in Fig. 13 on the order of 20 % over 5 h with ambient mass accumulation measured in the field. Our results are equal to a mass loss rate of about 0.4 assuming an aerosol population with an organic mass of ∼ 10 µg m−3 (air) undergoing iron carboxylate photochemistry. This rate is much higher than the observed organic mass accumulation in ambient air masses due to photochemical aging during atmospheric transport at about 0.06 or 6 µg m−3 over 4 d (Zaveri et al., 2012; Moffet et al., 2012). This implies that the mass loss rates are fast enough to affect the balance between aerosol mass accumulation and loss. Hence, photochemical degradation may be very significant in iron-containing organic aerosol, perhaps even more important than degradation through reactions with gas phase oxidants.
Note that our model does not fully capture the acceleration of degradation as discussed in Sect. 3.1. Therefore, we argue that the degradation presented in Fig. 13 represents a lower limit of the expected degradation under atmospheric conditions. Clearly, panel (a) indicates that smaller particles degrade significantly faster than larger ones. However, the size dependence is more complex than the expected simple square law if reactions were purely limited by condensed phase diffusion. For particles with a radius larger than 50 nm, the time to repartition 10 % of the mass to the gas phase depends almost linearly on size for these specific conditions. Panel (b) shows that photochemical processes are faster at higher RH corresponding to less viscous particles. The relative mass loss after 12 h irradiation between 20 % and 60 % RH is almost an order of magnitude larger for the highest RH compared to dry conditions because of transport limitations at low RH. However, it should be noted that the relative mass loss at higher humidities (between 40 % and 60 % RH) is quite similar. Here, the photochemical degradation is barely limited by condensed phase diffusivity, but by iron availability in the particle. These simulations show the potential of photochemical degradation under atmospheric conditions; a systematic study exploring the whole range of atmospheric conditions is beyond the scope to this work.
We used three complementary experimental techniques to characterize the impact of reduced mobility of aerosol constituents on photochemical degradation in highly viscous particles. As an atmospherically relevant model system, we chose aqueous FeIII(Cit) ∕ CA particles. These three experimental techniques investigated specific aspects of this photochemical reaction system. In EDB experiments, we measured the mass loss relating to the continual production and loss of CO2 and other volatile products. We observed very significant condensed phase degradation and strong acceleration of the degradation rate with time. Further studies are needed to quantify all atmospheric implications, but our study suggests that photochemistry in iron-containing organic aerosol will lead to a significant repartitioning of condensed phase mass to the gas phase. We used STXM/NEXAFS to directly measure iron oxidation state in situ with an environmental microreactor. These experiments yielded valuable information about where iron photochemical reduction and reoxidation reactions took place, namely only very close to the surface, and it allowed us to characterize to what degree iron compounds diffused inside single particles. We showed that O2 uptake and diffusion into a particle is a limiting factor considering the reactions required to produce species with an oxidative potential. In addition, we found that the direct O2 reaction with iron(II) organic complexes does occur and generates radicals inside the particle. Flow-tube experiments performed on thin FeIII(Cit) films showed continuous production of , revealing a radical source inside the particles driven by photochemistry.
All data were used to constrain equilibrium and kinetic parameters as well as reaction rate coefficients in a new PRAD model with sufficient complexity to allow comparison with data of all experiments simultaneously. In particular, we were able to constrain the photolysis rate of FeIII due to the use of various light sources with various spectral intensities, while capturing the photochemical reduction. In addition, we determined the production rate and its first-order loss rate, and the diffusivity of O2 in aqueous FeIII(Cit) ∕ CA system as a function of RH and FeIII(Cit) ∕ CA molar ratio with a choice of O2 related reaction rate coefficient and O2 Henry's law coefficient.
Although a systematic study exploring the whole range of atmospheric conditions was beyond the scope to this work, there are some aspects of the PRAD model and certain parameters that we argue are reliable and pertinent to atmospheric aerosol photochemistry. First, coefficients in the PRAD model framework can be changed to predict mass loss rates of a different iron carboxylate complex system. We are fairly confident that diffusion coefficients of CO2 and H2O can be used for atmospheric aerosol particles as these were obtained in a more targeted study (Dou et al., 2019). Mass loss rates in general are fairly reliable to be used in atmospheric particles as these are linked to photochemical reaction rates that have been characterized (Weller et al., 2013, 2014). Finally, reoxidation rates and production of radicals are also reliable, as the system is largely reacto-diffusion limited (see Appendix A4) and these rates occur on the same scales as observed mass loss rates. In our companion paper (Alpert et al., 2021), we show a detailed analysis of radical concentrations in ambient aerosol particles for a range of atmospheric conditions and iron content. However, our model still needs major improvements, such as including peroxy radical chemistry and better constraints on individual parameters such as diffusion coefficients and reaction rate constants. The overall rate may be well constrained by our experimental studies, however more targeted observations may be necessary for an accurate representation of O2 chemistry, solubility, and molecular transport independently of each other within aerosol particles. The chemical evolution of the organic species resulting from the continual photochemical oxidation was not the scope of the present study. A separate study focusing on individual OVOCs and condensed phase products is currently underway that will allow us to better constrain the chemical regimes and the evolution of the oxidation state of the organic fraction with time. This will also allow us to assess more details of organic peroxy radical chemistry that help explain the observed “missing” sink in this system. Furthermore, testing the PRAD model with different organic carboxylate ligands is desirable to broaden its applicability.
Using the PRAD model for predicting photochemical degradation for iron-containing organic aerosol under atmospheric conditions let us conclude that this pathway of repartitioning condensed phase mass to the gas phase is important and its regional and global impact should be investigated in further modeling studies. The PRAD model may serve as a basic framework for the chemistry and transport of compounds in single particles for such studies.
A1 Parameterization of
The liquid phase diffusion coefficients, , where j is an index for all species, depend on RH, T and the molar ratio, x, between FeIII(Cit) and CA. was scaled with the diffusion coefficient of water in a FeIII(Cit) ∕ CA aqueous system, , using a scaling factor, , following
has not been previously determined for aqueous FeIII(Cit) ∕ CA although solution viscosity has and was found to be higher than aqueous CA solutions when x>0.05 (Alpert et al., 2021), implying slower molecular transport. Lienhard et al. (2014) reported the diffusion coefficient of water in aqueous CA without iron (i.e., x=0), . In order to determine in the PRAD model for a single experiment with a fixed value of x, was scaled with using another factor, fs, following
where
The diffusion coefficient of CO2 at T=20 ∘C and x=0.05, , was independently measured by Dou et al. (2019) as a function of aw. We parameterized as
where m2 s−1 is the diffusion coefficient of CO2 at T=20 ∘C, x=0.05, and aw=0. The T dependent diffusion coefficient of CO2 in water in Eq. (A4) is
where m2 s−1, Ts=227.0 K, and m=1.7094. In the exponent terms of Eq. (A4),
where A=0.2824 and . In order to introduce a x dependence of for various experiments reported here, fs from Eq. (A3) for water was applied following
For all other species (excluding H2O and CO2), was determined using Eq. (A1) with
where, Mj, is molar mass. The diffusion coefficients of H2O, CO2, O2, and CA as a function of aw at x=0.05 and 1.0 are plotted in Fig. A1. Generally, always decreases when RH or T is lowered. decreases when x increases beyond 0.05, but remains relatively constant otherwise. One caveat to using Eqs. (A1)–(A8) to calculate is that mass loss will ultimately lead to an increase in x, however, the PRAD model keeps fixed throughout the course of a model run. Since we observed increasing mass loss rates over time, any decrease in leading to slower chemical cycling due to increasing x was likely a minor effect. Moreover, the product distribution and any effect on diffusion coefficients was unknown, so further time-resolved adjustments to were not considered. We suggest future studies investigate how molecular transport changes over the photochemical lifetime of iron carboxylate complexes.
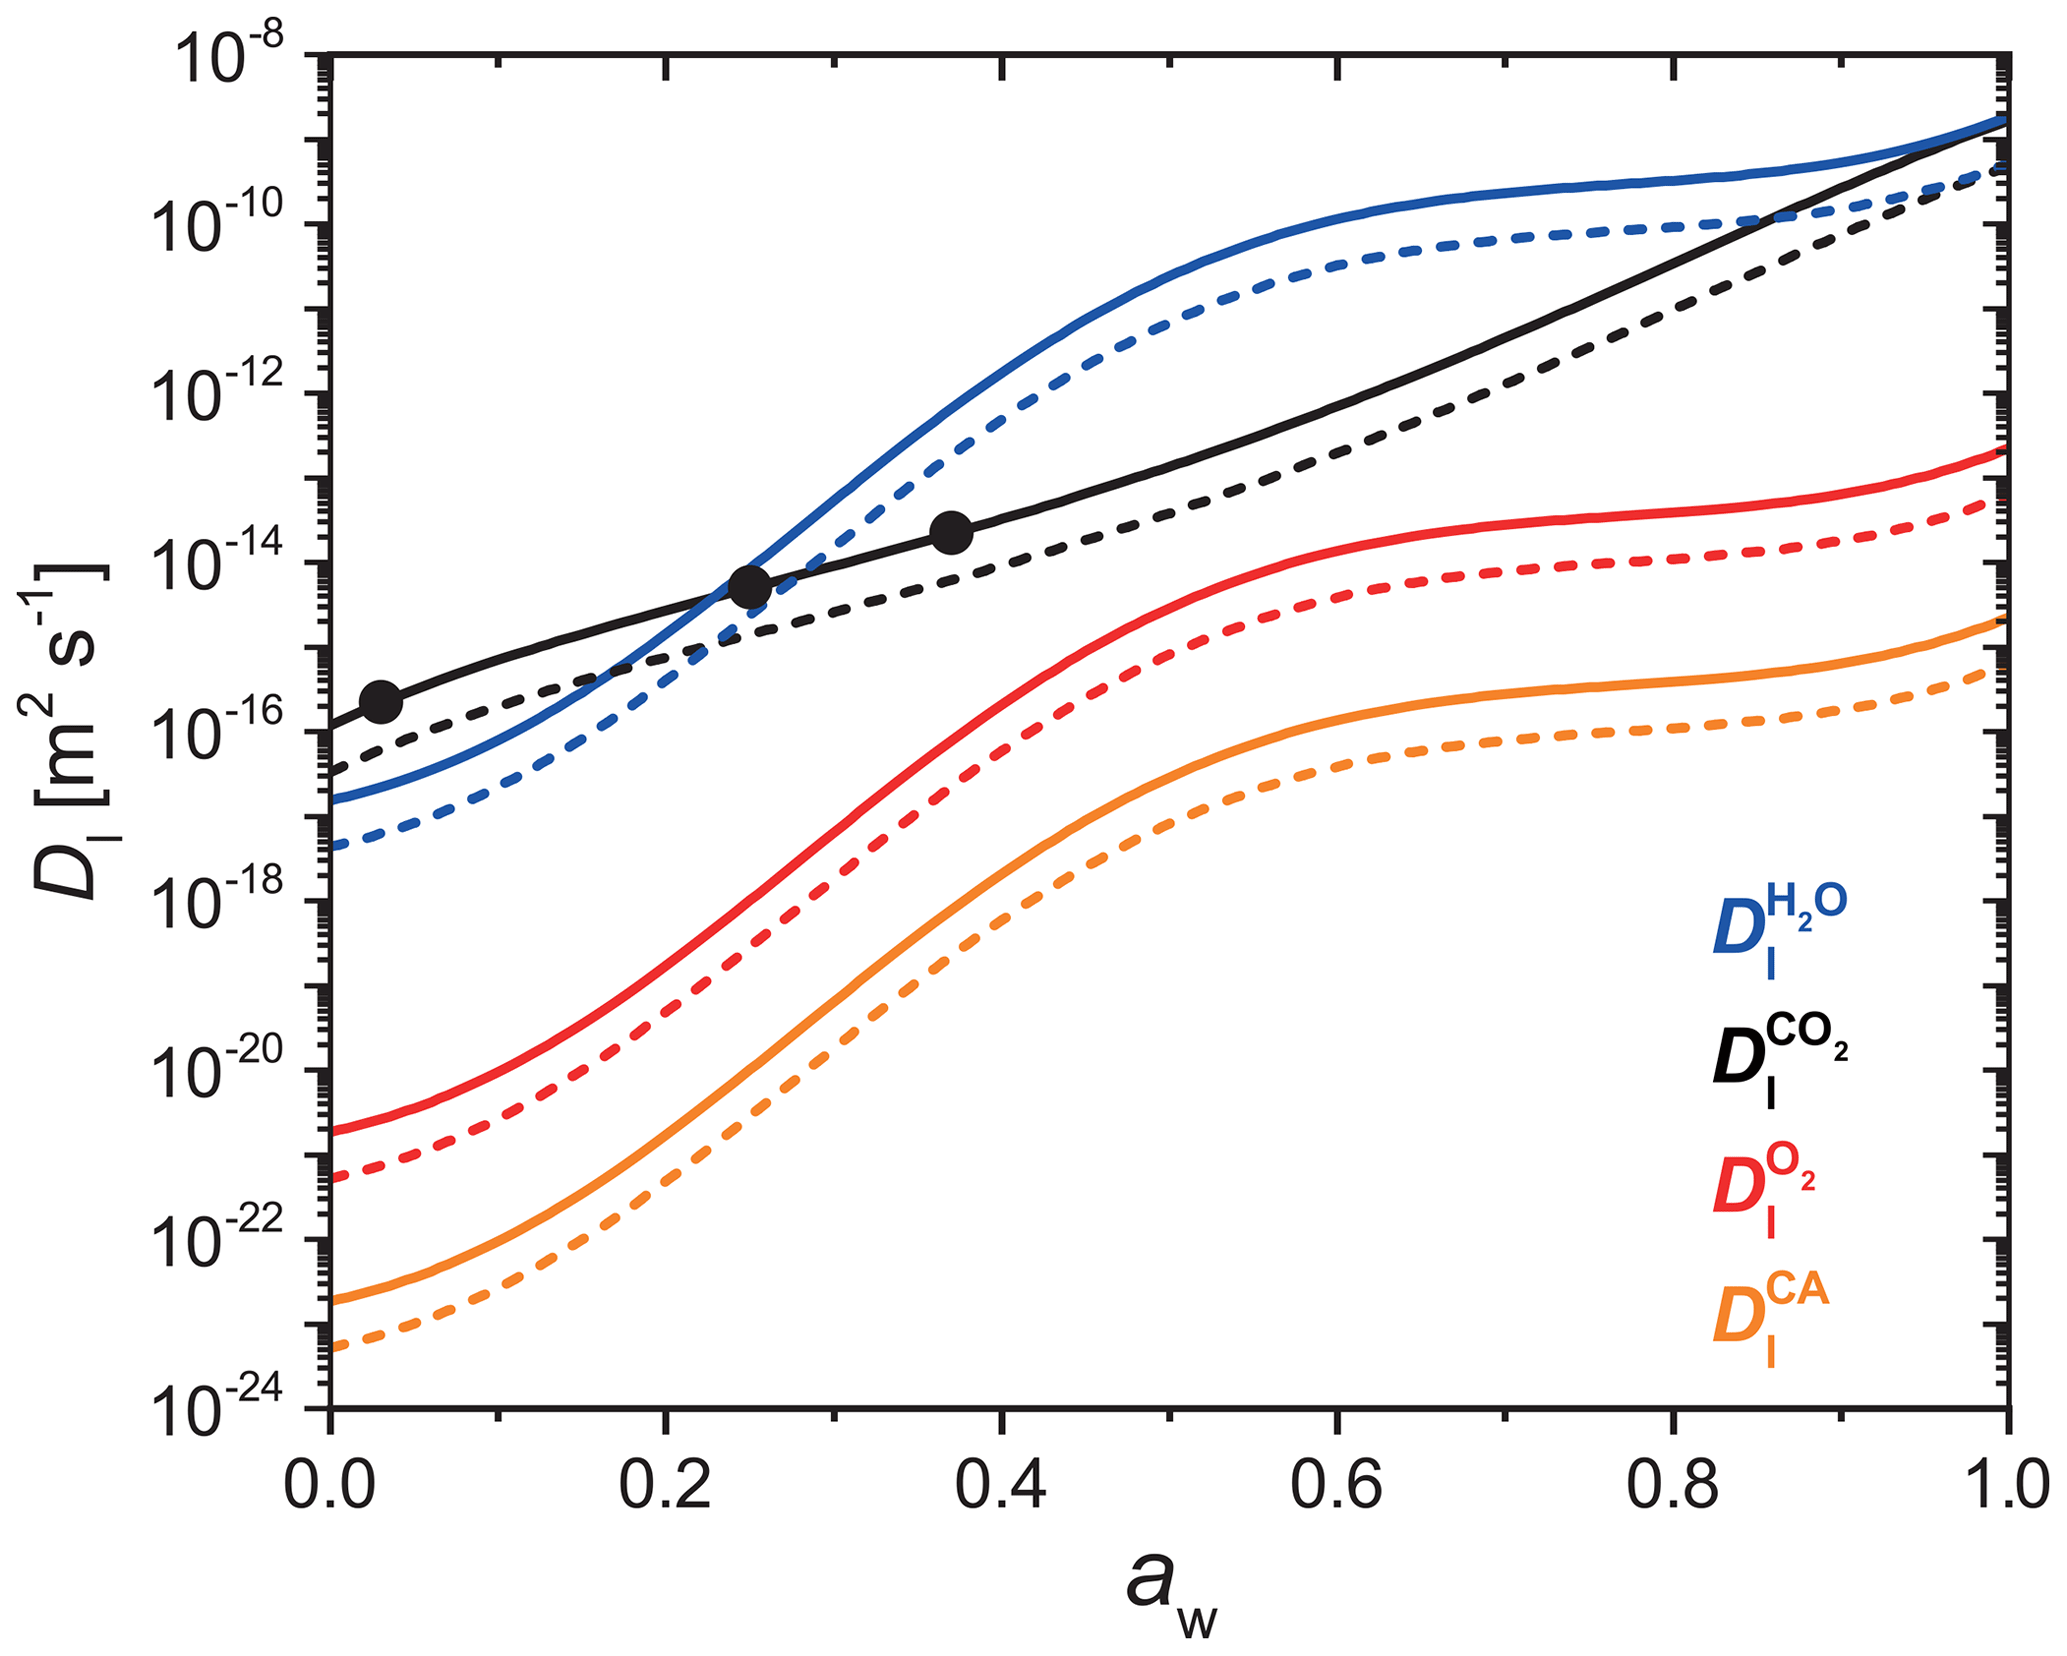
Figure A1Parameterized liquid phase diffusion coefficients of H2O (blue), CO2 (black), O2 (red), and CA (orange) as a function of water activity at FeIII(Cit) ∕ CA molar ratio of 0.05 (solid lines) and 1.0 (dashed lines). The three black dots are measured CO2 diffusivity in a FeIII(Cit) ∕ CA particle with a molar ratio of 0.05 (Dou et al., 2019). These parameters are given for a temperature of 293.5 K.
A2 Parameterization of
The gas phase diffusivity of each species j, , was approximated via its molar mass (Mj) compared to that of water (),
with
where T0=273.15 K, p0=1013.25 mbar, and is in cm2 s−1 (Pruppacher and Klett, 2010).
A3 Parameterization of k5
Based on the measurement of production as a function of RH using CWFT experiments, the self-reaction rate (Reaction R4 in Table 2), k5, was adjusted so the PRAD model would exactly reproduce the data. We parameterized k5 as a third degree polynomial function of RH (%):
as shown in Fig. A2.

Figure A2Adjusted values of the self-reaction rate used in the PRAD model to exactly reproduce measured for CWFT experiments are shown as black dots. The red line and shading is the new parameterization (Eq. A11) and confidence intervals at 95 % for the self-reaction rate as a function of RH.
A4 β estimated by a reacto-diffusive framework
It is well known that multiphase reactions can follow a reacto-diffusive kinetic regime (Alpert et al., 2019; Steimer et al., 2014). For reacto-diffusive limitations as observed in Fig. 11, the FeIII fraction as a function of time was calculated as
with the assumption that β0=0, i.e., there was no FeIII at t=0:
where and are the Henry’s law coefficient and diffusion coefficient, respectively, for O2 in the FeIII(Cit) ∕ CA matrix, is the pressure of O2, is the total reaction rate of O2, and dp is diameter of the single particle. when
In a typical EDB experiment, dp=20 µm, M atm−1, Pa =0.789 atm, and . [Fetot] is 0.3192, 0.2763, and 0.2345 M at 24 %, 48 %, and 65 % RH, respectively. From EDB data points in Fig. 11, we estimated that of FeIII can be fully recovered after around 1.7 h at 48 % RH and 0.45 h at 65 % RH. Thus, the diffusion coefficient of O2 can be estimated to be and m2 s−1 at 48 % and 65 % RH, respectively, which are both 1 order of magnitude less than the values from PRAD model prediction, but still consistent with each other when considering all uncertainties. It should be noted that in Eq. (A14), is actually the constraint, thus any uncertainty in or can change .
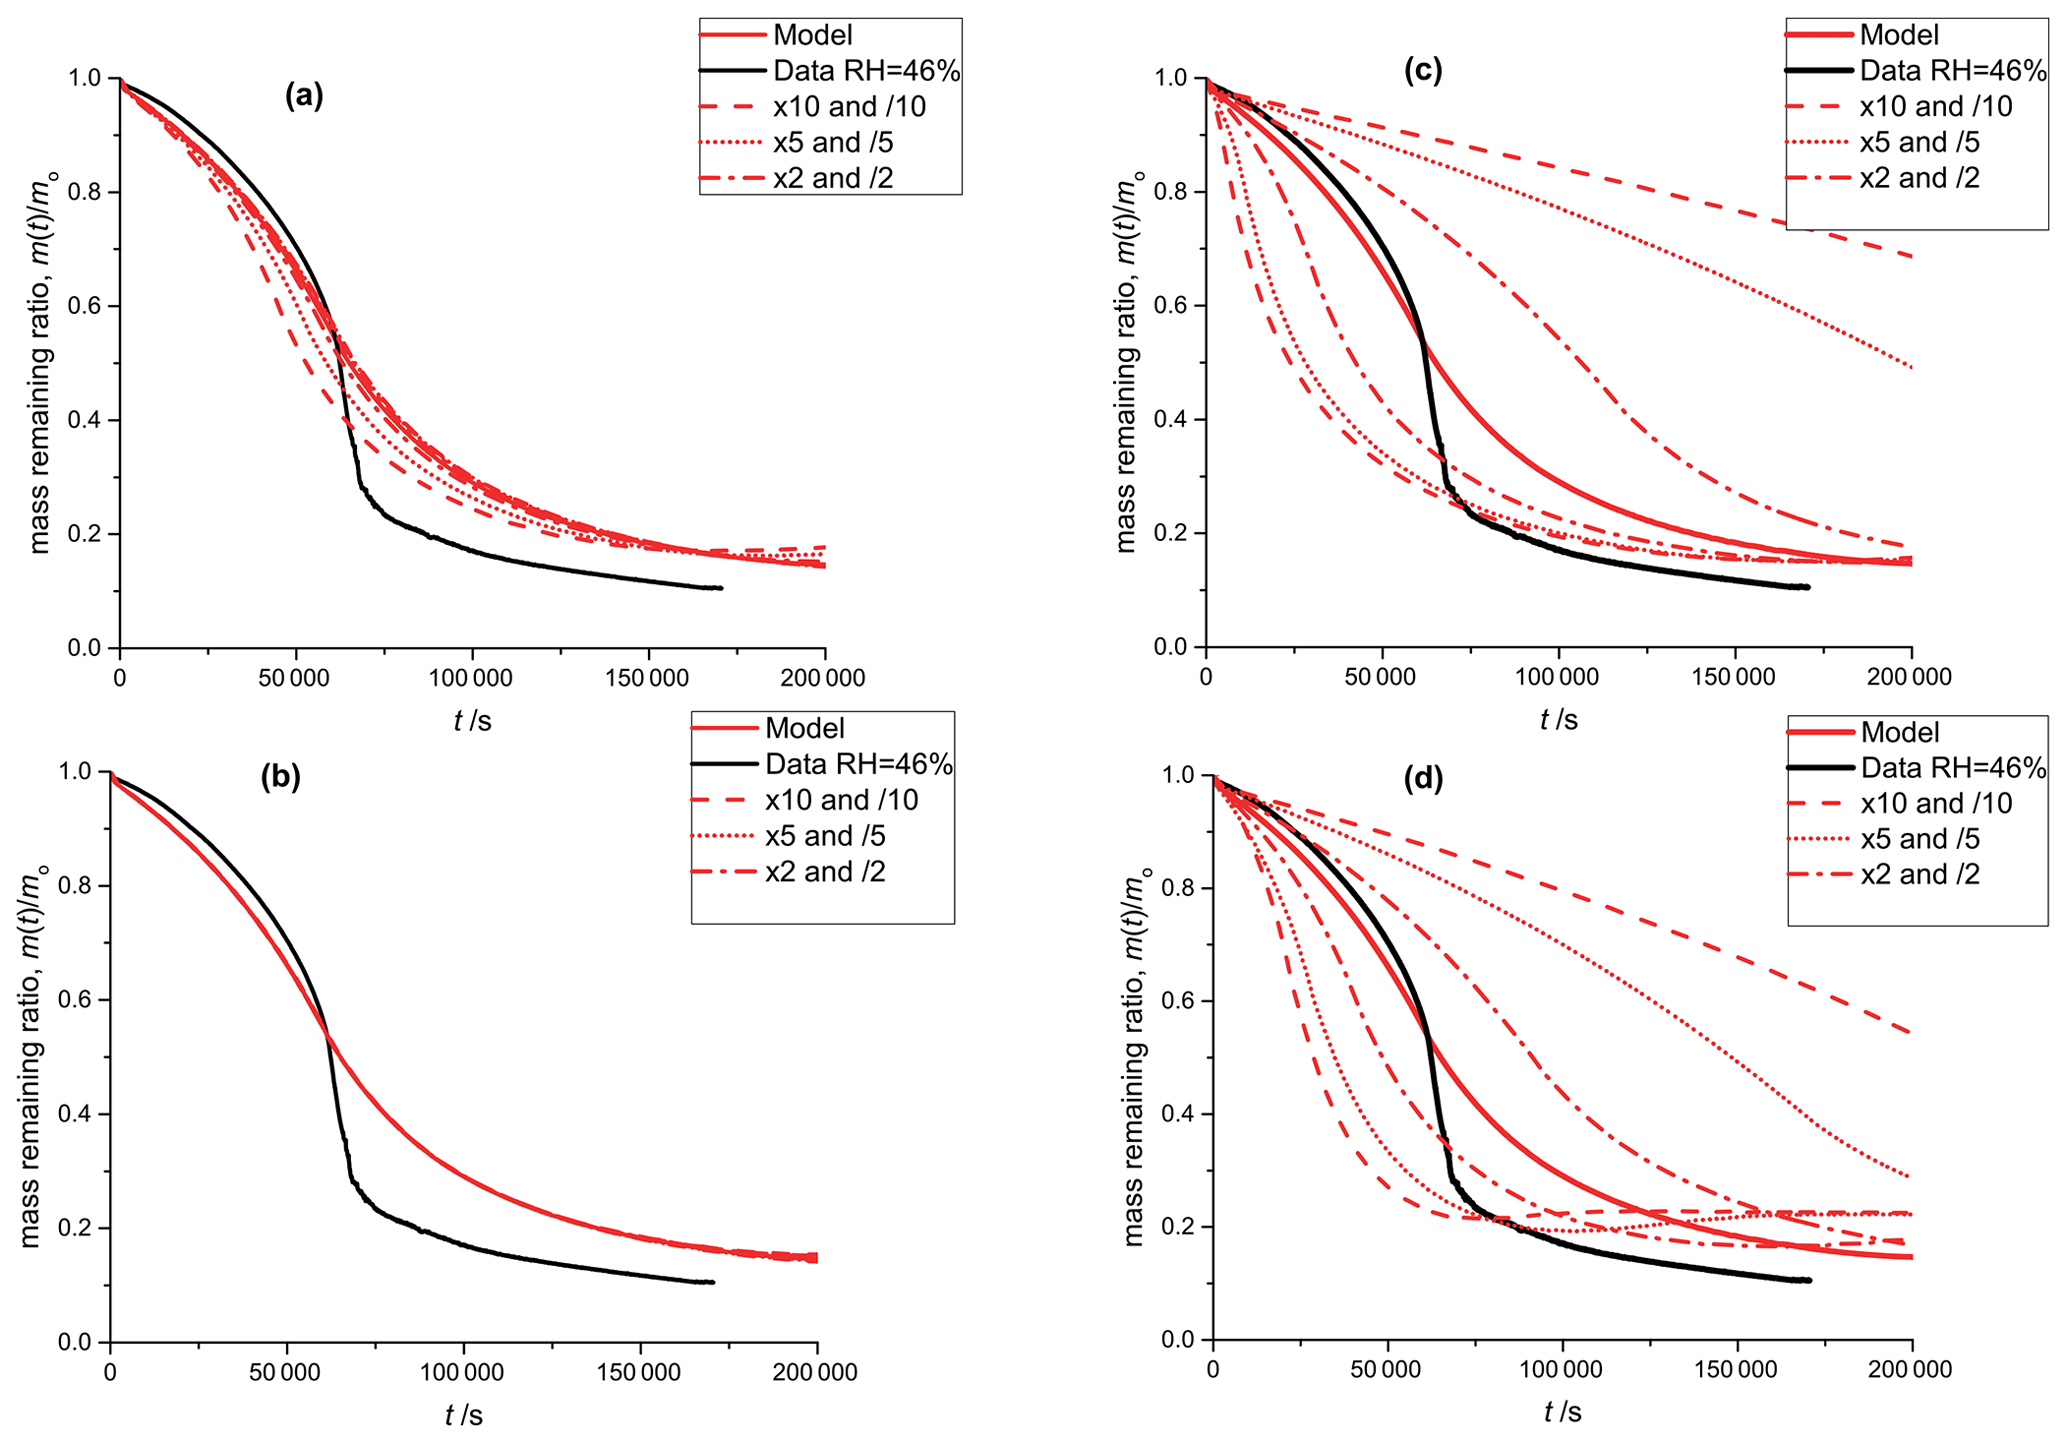
Figure A3Black: mass remaining data versus time of the photodegradation experiment discussed in Sect. 3.1; RH 46 %. Red lines: model outputs obtained by varying a single parameter with factors: 10 and 0.1 (dashed), 5 and 0.2 (dotted), 2 and 0.5 (dash-dotted), 1 (solid). In panel (a), the equilibrium constant of E8 is varied and in panel (b) the equilibrium constant of equilibrium E5 is varied. Panel (c) shows the sensitivity to the reaction constant (Reaction R9, see Table 2) and panel (d) shows the sensitivity to oxygen diffusivity (Table 1).
A5 Sensitivity of the PRAD model to various model parameters
As discussed in Sect. 2.5, we performed manual tuning of the PRAD model parameters to reach satisfactory agreement with all experimental data simultaneously. To show the sensitivity of the PRAD model results to a few of its parameters, Fig. A3 shows again the data of the photocatalytic degradation experiment at 46 % RH described in Sect. 3.1. In addition, we show the output of the model as well as model outputs obtained by varying one of the parameters by the indicated factors while keeping all other parameters constant. Clearly, the sensitivities of the model output to varying these parameters are very different: while the model output is quite sensitive to varying the rate constant for the oxidation of FeII(HCit) (Reaction R9 in Table 2) as well as to oxygen diffusivity, the sensitivity to the equilibrium constant E8, , is significantly smaller and the model is basically insensitive to the equilibrium constant E5, . In other words, this experiment alone allows us to constrain Reaction (R9) or oxygen diffusivity as long as the other parameter is known, but does not allow us to constrain the constants for the two equilibria.
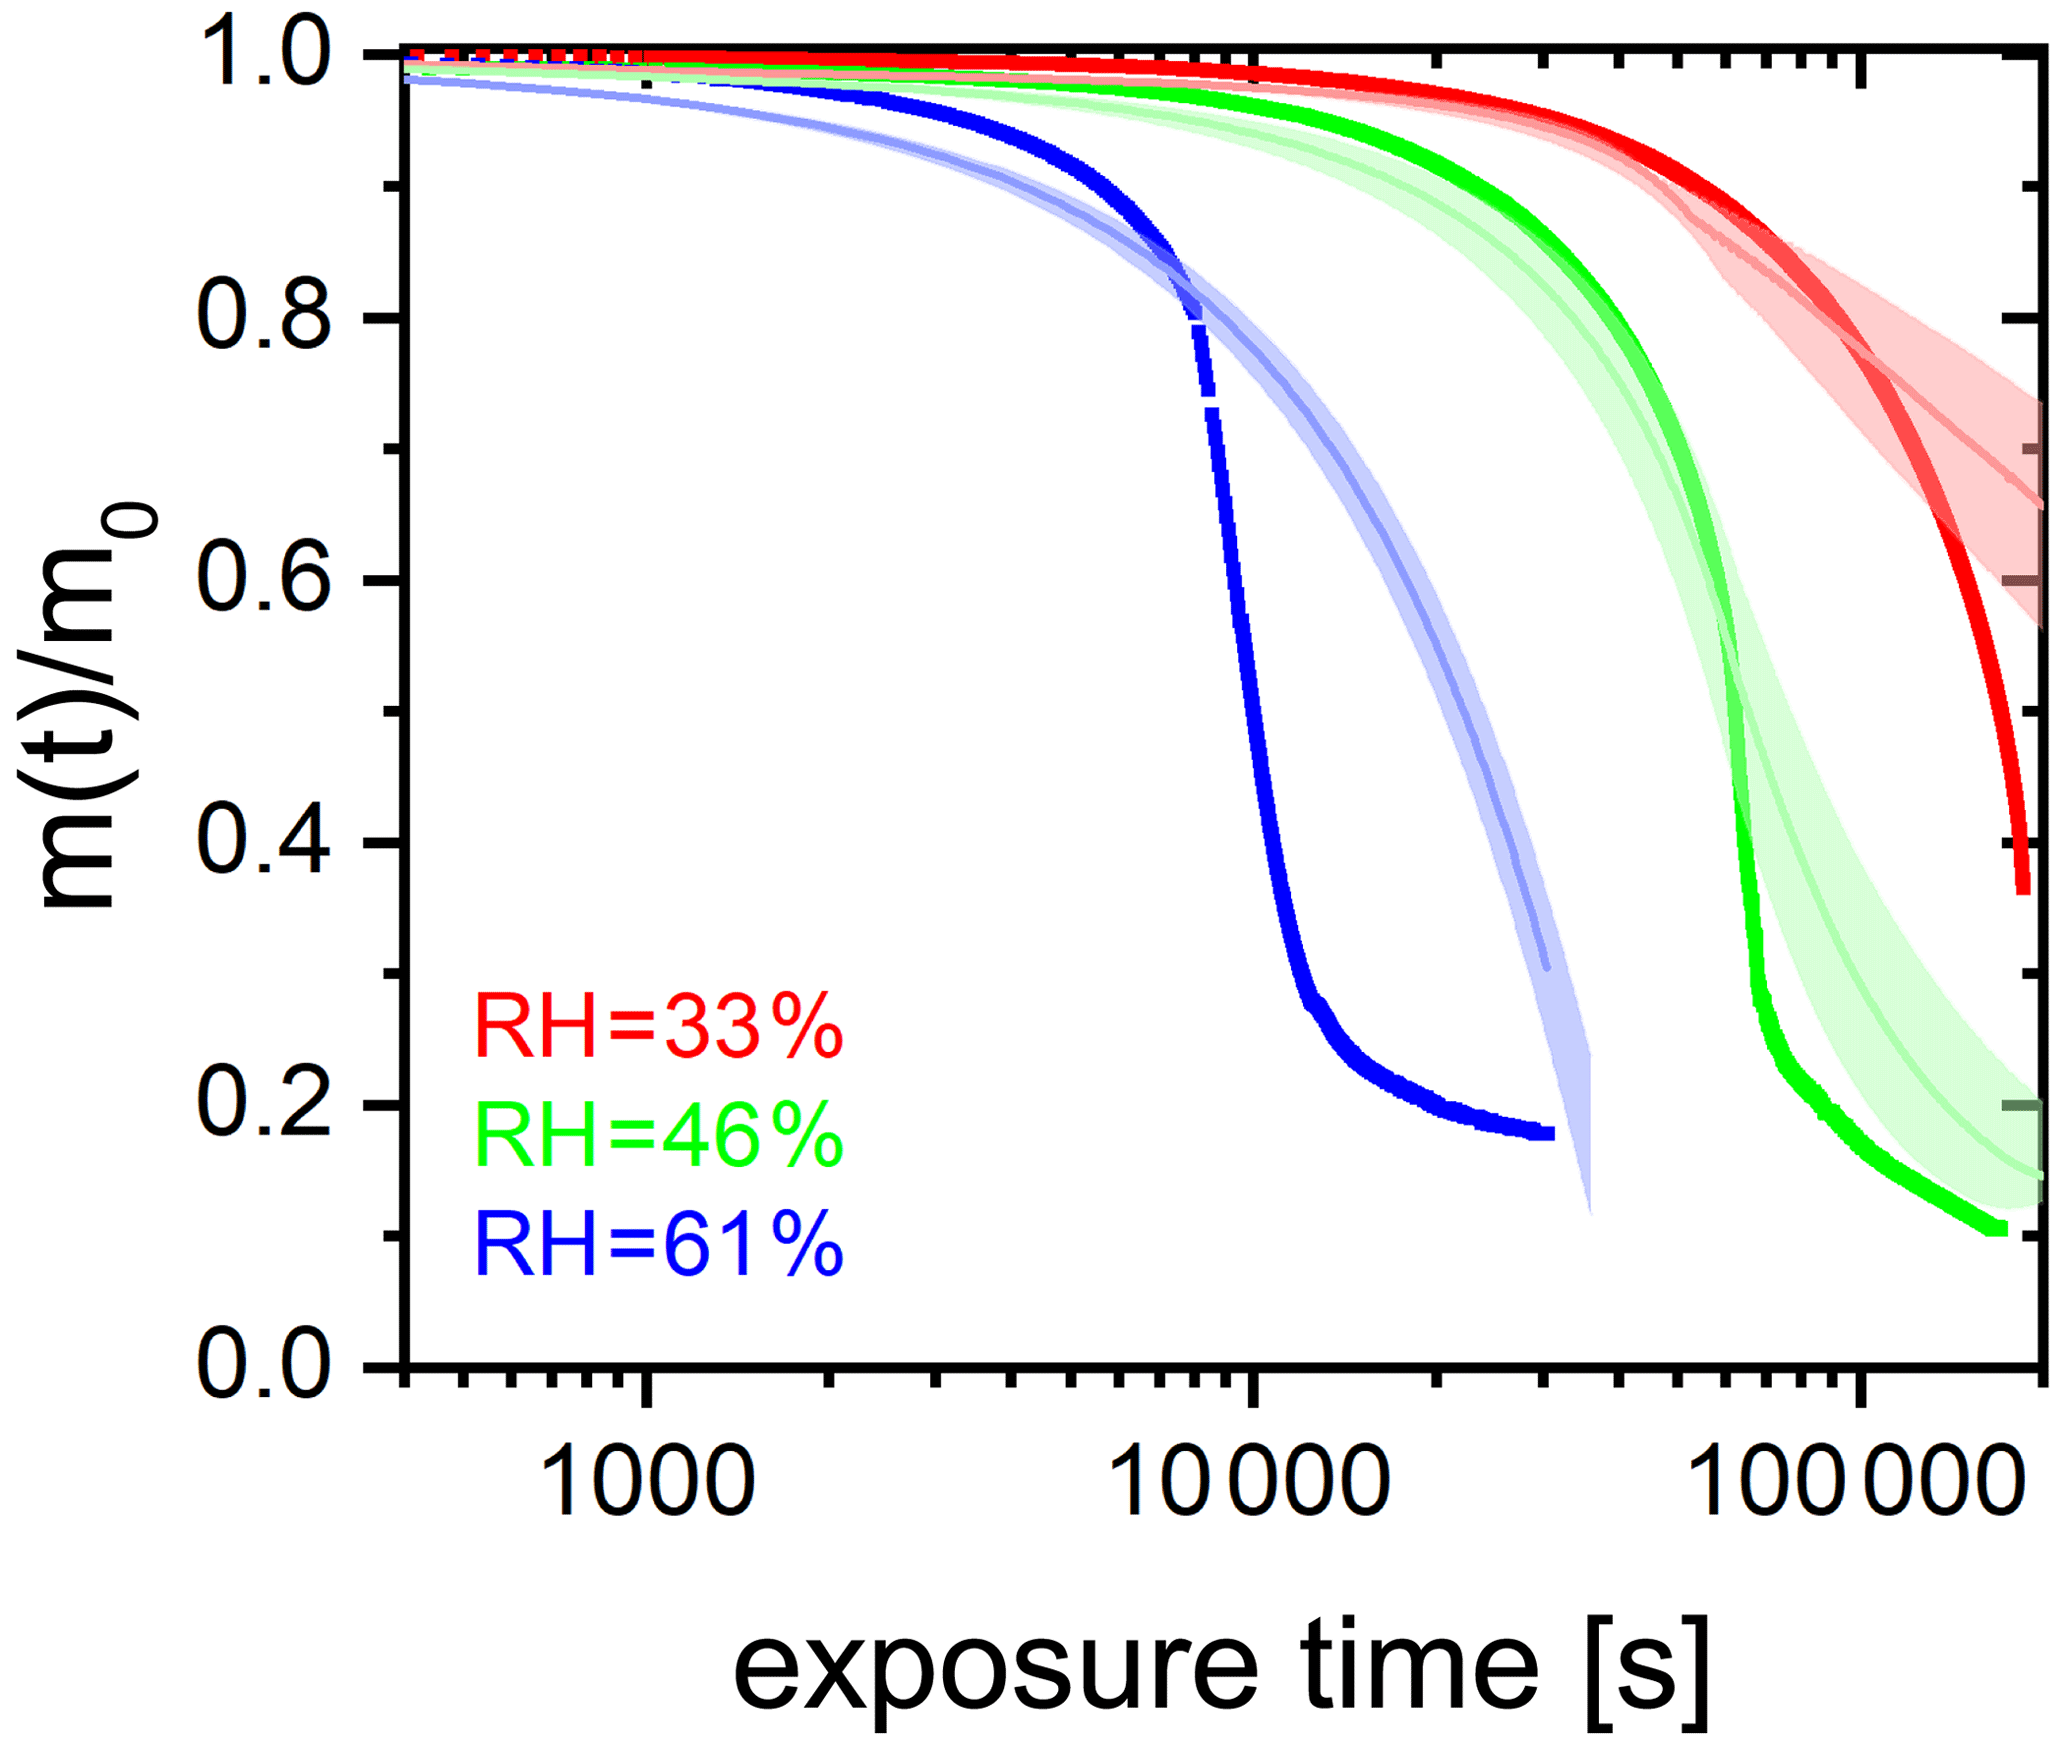
Figure A4FeIII(Cit) ∕ CA (molar ratio 0.05) particle mass change with irradiation time (log scale) at different RH: 33 % (red), 46 % (green), and 61 % (blue). The irradiation wavelength was 375 nm, its intensity was 0.25 W cm−2, and the experimental temperature was 293.5 K. Thick lines are EDB experimental data. Thin lines are PRAD model outputs (with ±2 % RH uncertainty shown as the shaded area).
A6 The full EDB data set showing the RH effect on photocatalytic degradation efficiency
Figure 6 in the main text shows the photochemical degradation up to a mass remaining ratio of 0.6 and compares its temporal evolution with the PRAD model output. Here, we show in Fig. A4 for completeness the full experimental data set. Clearly seen is the shift to longer time scales with decreasing RH and that the PRAD model is no longer capable of accurately capturing the mass loss once about 20 % of the initial mass is lost. However, we may conclude that even for mass remaining ratios lower than 0.5, the experimental data show a very significant shift of the degradation time scales with RH, but the total photochemical mass loss remains of the same order of magnitude, independent of RH.
The data that support the findings of this study are available from the corresponding authors upon request. The PRAD model code is publicly available and accessible here: https://doi.org/10.3929/ethz-b-000451609 (Dou et al., 2020), and from the corresponding author upon request.
The video supplement related to this article is available online at: https://doi.org/10.5446/47955 (Dou, 2020).
JD wrote the manuscript. MA and UKK conceptualized and planned the study. JD conducted the EDB experiments, water activity measurements, and data analysis, and the interpretation was supervised by UKK. PAA planned and conducted the STXM/NEXAFS experiments supervised by BW and MA. JD, PCA, JX, TH, CNB, and KDH also conducted STXM/NEXAFS experiments. BW, JR, and PAA conducted STXM/NEXAFS data analysis and interpretation. PCA conducted CWFT experiments, and the data analysis and interpretation was supervised by MA. FS conducted viscosity experiments and the data analysis and interpretation was supervised by PAA. BL wrote and developed the PRAD model with the assistance of JD and PAA. HH advised on the photochemical reaction mechanisms. All coauthors discussed the results and commented on the manuscript.
The authors declare that they have no conflict of interest.
We thank Nir Bluvshtein for helpful discussions.
This research was supported by the Swiss National Science Foundation (grant no. 200021 163074/1). The PolLux end station was financed by the German Ministerium für Bildung und Forschung (BMBF) through contracts 05K16WED and 05K19WE2.
This paper was edited by Alexander Laskin and reviewed by four anonymous referees.
Abel, B., Assmann, J., Buback, M., Grimm, C., Kling, M., Schmatz, S., Schroeder, J., and Witte, T.: Ultrafast decarboxylation of carbonyloxy radicals: Influence of molecular structure, J. Phys. Chem. A, 107, 9499–9510, https://doi.org/10.1021/jp0350823, 2003. a
Abida, O., Kolar, M., Jirkovsky, J., and Mailhot, G.: Degradation of 4-chlorophenol in aqueous solution photoinduced by Fe(III)–citrate complex, Photochem. Photobiol. Sci., 11, 794–802, https://doi.org/10.1039/c2pp05358f, 2012. a, b
Abrahamson, H. B., Rezvani, A. B., and Brushmiller, J.: Photochemical and spectroscopic studies of complexes, of iron(III) with citric acid and other carboxylic acids, Inorg. Chim. Acta, 226, 117–127, https://doi.org/10.1016/0020-1693(94)04077-X, 1994. a
Alpert, P. A., Corral Arroyo, P., Dou, J., Krieger, U. K., Steimer, S. S., Förster, J. D., Ditas, F., Pöhlker, C., Rossignol, S., Passananti, M., Perrier, S., George, C., Shiraiwa, M., Berkemeier, T., Watts, B., and Ammann, M.: Visualizing reaction and diffusion in xanthan gum aerosol particles exposed to ozone, Phys. Chem. Chem. Phys., 21, 20613–20627, https://doi.org/10.1039/c9cp03731d, 2019. a, b, c, d, e, f, g, h
Alpert, P. A., Dou, J., Corral Arroyo, P., Schneider, F., Xto, J., Luo, B., Peter, T., Huthwelker, T., Borca, C. N., Henzler, K. D., Herrmann, H., Raabe, J., Watts, B., Krieger, U. K., and Ammann, M.: Photolytic radical persistence due to anoxia in viscous Aerosol particles, Nat. Commun., accepted, 2021. a, b, c, d
Battino, R., Rettich, T. R., and Tominaga, T.: The Solubility of Oxygen and Ozone in Liquids, J. Phys. Chem. Ref. Data, 12, 163–178, https://doi.org/10.1063/1.555680, 1983. a
Berkemeier, T., Steimer, S. S., Krieger, U. K., Peter, T., Pöschl, U., Ammann, M., and Shiraiwa, M.: Ozone uptake on glassy, semi-solid and liquid organic matter and the role of reactive oxygen intermediates in atmospheric aerosol chemistry, Phys. Chem. Chem. Phys., 18, 12662–12674, https://doi.org/10.1039/C6CP00634E, 2016. a
Berkemeier, T., Ammann, M., Krieger, U. K., Peter, T., Spichtinger, P., Pöschl, U., Shiraiwa, M., and Huisman, A. J.: Technical note: Monte Carlo genetic algorithm (MCGA) for model analysis of multiphase chemical kinetics to determine transport and reaction rate coefficients using multiple experimental data sets, Atmos. Chem. Phys., 17, 8021–8029, https://doi.org/10.5194/acp-17-8021-2017, 2017. a
Bianco, A., Passananti, M., Brigante, M., and Mailhot, G.: Photochemistry of the Cloud Aqueous Phase: A Review, Molecules, 25, 423, https://doi.org/10.3390/molecules25020423, 2020. a
Bielski, B. H. J., Cabelli, D. E., Arudi, R. L., and Ross, A. B.: Reactivity of radicals in aqueous solution, J. Phys. Chem. Ref. Data, 14, 1041–1100, https://doi.org/10.1063/1.555739, 1985. a, b, c, d
Bockman, T. M., Hubig, S. M., and Kochi, J. K.: Direct observation of ultrafast decarboxylation of acyloxy radicals via photoinduced electron transfer in carboxylate ion pairs, J. Org. Chem., 62, 2210–2221, https://doi.org/10.1021/JO9617833, 1997. a
Brandt, C. and van Eldik, R.: Transition metal-catalyzed oxidation of sulfur(IV) oxides. Atmospheric-relevant processes and mechanisms, Chem. Rev., 95, 119–190, https://doi.org/10.1021/cr00033a006, 1995. a
Burden, R. L. and Faires, J. D.: Numerical Analysis, 9th edn., Brooks/Cole, Boston, MA, USA, 2011. a
Chebbi, A. and Carlier, P.: Carboxylic acids in the troposphere, occurrence, sources, and sinks: A review, Atmos. Environ., 30, 4233–4249, https://doi.org/10.1016/1352-2310(96)00102-1, 1996. a
Christensen, H. and Sehested, K.: Pulse radiolysis at high temperatures and high pressures, Radiat. Phys. Chem., 18, 723–731, https://doi.org/10.1016/0146-5724(81)90195-3, 1981. a
Cieśla, P., Kocot, P., Mytych, P., and Stasicka, Z.: Homogeneous photocatalysis by transition metal complexes in the environment, J. Mol. Catal. A-Chem., 224, 17–33, https://doi.org/10.1016/j.molcata.2004.08.043, 2004. a, b
Corral Arroyo, P., Bartels-Rausch, T., Alpert, P. A., Dumas, S., Perrier, S., George, C., and Ammann, M.: Particle-phase photosensitized radical production and aerosol aging, Environ. Sci. Technol., 52, 7680–7688, https://doi.org/10.1021/acs.est.8b00329, 2018. a, b, c, d, e
Davis, E. J., Buehler, M. F., and Ward, T. L.: The double-ring electrodynamic balance for microparticle characterization, Rev. Sci. Instrum., 61, 1281–1288, https://doi.org/10.1063/1.1141227, 1990. a
Deguillaume, L., Leriche, M., Desboeufs, K., Mailhot, G., George, C., and Chaumerliac, N.: Transition metals in atmospheric liquid phases: Sources, reactivity, and sensitive parameters, Chem. Rev., 105, 3388–3431, https://doi.org/10.1021/cr040649c, 2005. a, b
Dou, J., Lin, P., Kuang, B. Y., and Yu, J. Z.: Reactive oxygen species production mediated by humic-like substances in atmospheric aerosols: Enhancement effects by pyridine, imidazole, and their derivatives, Environ. Sci. Technol., 49, 6457–6465, https://doi.org/10.1021/es5059378, 2015. a
Dou, J., Luo, B., Peter, T., Alpert, P. A., Corral Arroyo, P., Ammann, M., and Krieger, U. K.: Carbon dioxide diffusivity in single, levitated organic aerosol particles, J. Phys. Chem. Lett., 10, 4484–4489, https://doi.org/10.1021/acs.jpclett.9b01389, 2019. a, b, c, d, e
Dou, J.: Shift of Mie-resonance pattern with time, TIB, https://doi.org/10.5446/47955, 2020. a
Dou, J., Alpert, P. A., Corral Arroyo, P., Luo, B., Schneider, F., Xto, J., Huthwelker, T., Borca, C. N., Henzler, K. D., Raabe, J., Watts, B., Herrmann, H., Peter, T., Ammann, M., and Krieger, U. K.: Photochemical degradation of iron(III) citrate/citric acid aerosol quantified with the combination of three complementary experimental techniques and a kinetic process model, ETH Zurich, https://doi.org/10.3929/ethz-b-000451609, last access: 24 December 2020. a
Faust, B. C. and Hoigné, J.: Photolysis of Fe(III)-hydroxy complexes as sources of OH radicals in clouds, fog and rain, Atmospheric Environment. Pt A, 24, 79–89, https://doi.org/10.1016/0960-1686(90)90443-Q, 1990. a
Faust, B. C. and Zepp, R. G.: Photochemistry of aqueous iron(III)-polycarboxylate complexes: roles in the chemistry of atmospheric and surface waters, Environ. Sci. Technol., 27, 2517–2522, https://doi.org/10.1021/es00048a032, 1993. a
Feng, W., Nansheng, D., Glebov, E. M., Pozdnyakov, I. P., Grivin, V. P., Plyusnin, V. F., and Bazhin, N. M.: Kinetics and mechanism of photolysis of the iron(III) complex with tartaric acid, Russ. Chem. Bull., 56, 900–903, https://doi.org/10.1007/s11172-007-0136-7, 2007. a
Fenton, H. J. H.: LXXIII.—Oxidation of tartaric acid in presence of iron, J. Chem. Soc., Trans., 65, 899–910, https://doi.org/10.1039/CT8946500899, 1894. a
Flechsig, U., Quitmann, C., Raabe, J., Böge, M., Fink, R., and Ade, H.: The PolLux Microspectroscopy Beam line at the Swiss Light Source, AIP Conf. Proc., 879, 505–508, https://doi.org/10.1063/1.2436109, 2007. a
Fogg, P. G. T. (Ed.): Carbon Dioxide in Non–Aqueous Solvents At Pressures Less Than 200 KPa, vol. 50, Pergamon Press, Oxford, https://doi.org/10.1016/C2009-0-00247-5, 1992. a
Frommherz, U., Raabe, J., Watts, B., Stefani, R., Ellenberger, U., Garrett, R., Gentle, I., Nugent, K., and Wilkins, S.: Higher Order Suppressor (HOS) for the PolLux Microspectroscope Beamline at the Swiss Light Source SLS, AIP Conf. Proc., 1234, 429–432, https://doi.org/10.1063/1.3463232, 2010. a
Garvie, L. A., Craven, A. J., and Brydson, R.: Use of electron-energy loss near-edge fine structure in the study of minerals, Am. Mineral., 79, 411–425, 1994. a
George, C., D'Anna, B., Herrmann, H., Weller, C., Vaida, V., Donaldson, D. J., Bartels-Rausch, T., and Ammann, M.: Emerging areas in atmospheric photochemistry, in: Topics in Current Chemistry, vol. 339, 1–53, Springer, Berlin, Heidelberg, https://doi.org/10.1007/128_2012_393, 2012. a
George, C., Ammann, M., D'Anna, B., Donaldson, D. J., and Nizkorodov, S. A.: Heterogeneous photochemistry in the atmosphere, Chem. Rev., 115, 4218–4258, https://doi.org/10.1021/cr500648z, 2015. a, b
Glebov, E. M., Pozdnyakov, I. P., Grivin, V. P., Plyusnin, V. F., Zhang, X., Wu, F., and Deng, N.: Intermediates in photochemistry of Fe(III) complexes with carboxylic acids in aqueous solutions, Photochem. Photobiol. Sci., 10, 425–430, https://doi.org/10.1039/C0PP00151A, 2011. a
Gonzalez, D. H., Cala, C. K., Peng, Q., and Paulson, S. E.: HULIS enhancement of hydroxyl radical formation from Fe(II): kinetics of fulvic acid-Fe(II) complexes in the presence of lung antioxidants, Environ. Sci. Technol., 51, 7676–7685, https://doi.org/10.1021/acs.est.7b01299, 2017. a, b
González Palacios, L., Corral Arroyo, P., Aregahegn, K. Z., Steimer, S. S., Bartels-Rausch, T., Nozière, B., George, C., Ammann, M., and Volkamer, R.: Heterogeneous photochemistry of imidazole-2-carboxaldehyde: HO2 radical formation and aerosol growth, Atmos. Chem. Phys., 16, 11823–11836, https://doi.org/10.5194/acp-16-11823-2016, 2016. a, b
Grgić, I.: Metals in Aerosols, chap. 5, 117–139, John Wiley & Sons, Ltd, https://doi.org/10.1002/9781444305388.ch5, 2009. a
Grgić, I., Dovžan, A., Berčič, G., and Hudnik, V.: The effect of atmospheric organic compounds on the Fe-catalyzed S(IV) autoxidation in aqueous solution, J. Atmos. Chem., 29, 315–337, https://doi.org/10.1023/A:1005918912994, 1998. a
Grgić, I., Poznič, M., and Bizjak, M.: S(IV) autoxidation in atmospheric liquid water: The role of Fe(II) and the effect of oxalate, J. Atmos. Chem., 33, 89–102, https://doi.org/10.1023/A:1006141913681, 1999. a, b, c
Hamilton, D. S., Scanza, R. A., Feng, Y., Guinness, J., Kok, J. F., Li, L., Liu, X., Rathod, S. D., Wan, J. S., Wu, M., and Mahowald, N. M.: Improved methodologies for Earth system modelling of atmospheric soluble iron and observation comparisons using the Mechanism of Intermediate complexity for Modelling Iron (MIMI v1.0), Geosci. Model Dev., 12, 3835–3862, https://doi.org/10.5194/gmd-12-3835-2019, 2019. a
Herrmann, H., Schaefer, T., Tilgner, A., Styler, S. A., Weller, C., Teich, M., and Otto, T.: Tropospheric Aqueous-Phase Chemistry: Kinetics, Mechanisms, and Its Coupling to a Changing Gas Phase, Chem. Rev., 115, 4259–4334, https://doi.org/10.1021/cr500447k, 2015. a
Hilborn, J. W. and Pincock, J. A.: Rates of decarboxylation of acyloxy radicals formed in the photocleavage of substituted 1-naphthylmethyl alkanoates, J. Am. Chem. Soc., 113, 2683–2686, https://doi.org/10.1021/ja00007a049, 1991. a
Hofmann, H., Hoffmann, P., and Lieser, K. H.: Transition metals in atmospheric aqueous samples, analytical determination and speciation, Fresenius J. Anal. Chem., 340, 591–597, https://doi.org/10.1007/BF00322435, 1991. a
Houle, F. A., Hinsberg, W. D., and Wilson, K. R.: Oxidation of a model alkane aerosol by OH radical: the emergent nature of reactive uptake, Phys. Chem. Chem. Phys., 17, 4412–4423, https://doi.org/10.1039/C4CP05093B, 2015. a
Hug, S. J., Canonica, L., Wegelin, M., Gechter, D., and von Gunten, U.: Solar oxidation and removal of arsenic at circumneutral pH in iron containing waters, Environ. Sci. Technol., 35, 2114–2121, https://doi.org/10.1021/es001551s, 2001. a
Huthwelker, T., Zelenay, V., Birrer, M., Krepelova, A., Raabe, J., Tzvetkov, G., Vernooij, M. G., and Ammann, M.: An in situ cell to study phase transitions in individual aerosol particles on a substrate using scanning transmission x-ray microspectroscopy, Rev. Sci. Instrum., 81, 113706, https://doi.org/10.1063/1.3494604, 2010. a, b
Kahnt, A., Iinuma, Y., Blockhuys, F., Mutzel, A., Vermeylen, R., Kleindienst, T. E., Jaoui, M., Offenberg, J. H., Lewandowski, M., Böge, O., Herrmann, H., Maenhaut, W., and Claeys, M.: 2-Hydroxyterpenylic acid: An oxygenated marker compound for α-pinene secondary organic aerosol in ambient fine aerosol, Environ. Sci. Technol., 48, 4901–4908,https://doi.org/10.1021/es500377d, 2014. a
Kanakidou, M., Myriokefalitakis, S., and Tsigaridis, K.: Aerosols in atmospheric chemistry and biogeochemical cycles of nutrients, Environ. Res. Lett., 13, 063004, https://doi.org/10.1088/1748-9326/aabcdb, 2018. a
Kawamura, K., Ng, L. L., and Kaplan, I. R.: Determination of organic acids (C1–C10) in the atmosphere, motor exhausts, and engine oils, Environ. Sci. Technol., 19, 1082–1086, https://doi.org/10.1021/es00141a010, 1985. a
Kieber, R. J., Hardison, D. R., Whitehead, R. F., and Willey, J. D.: Photochemical production of Fe(II) in rainwater, Environ. Sci. Technol., 37, 4610–4616, https://doi.org/10.1021/es030345s, 2003. a
Kieber, R. J., Skrabal, S. A., Smith, B. J., and Willey, J. D.: Organic complexation of Fe(II) and its impact on the redox cycling of iron in rain, Environ. Sci. Technol., 39, 1576–1583, https://doi.org/10.1021/es040439h, 2005. a
Koop, T., Bookhold, J., Shiraiwa, M., and Pöschl, U.: Glass transition and phase state of organic compounds: dependency on molecular properties and implications for secondary organic aerosols in the atmosphere, Phys. Chem. Chem. Phys., 13, 19238–19255, https://doi.org/10.1039/c1cp22617g, 2011. a
Lienhard, D. M., Bones, D. L., Zuend, A., Krieger, U. K., Reid, J. P., and Peter, T.: Measurements of thermodynamic and optical properties of selected aqueous organic and organic-inorganic mixtures of atmospheric relevance, J. Phys. Chem. A, 116, 9954–9968, https://doi.org/10.1021/jp3055872, 2012. a, b
Lienhard, D. M., Huisman, A. J., Bones, D. L., Te, Y.-F., Luo, B. P., Krieger, U. K., and Reid, J. P.: Retrieving the translational diffusion coefficient of water from experiments on single levitated aerosol droplets, Phys. Chem. Chem. Phys., 16, 16677–16683, https://doi.org/10.1039/C4CP01939C, 2014. a, b, c
Madronich, S., McKenzie, R. L., Caldwell, M., and Björn, L. O.: Changes in ultraviolet-radiation reaching the earths surface, Ambio, 24, 143–152, available at: http://lup.lub.lu.se/record/134508 (last access: 24 December 2020), 1995. a, b
Martell, A. E. and Smith, R. M.: Critical stability constants, vol. 5, Springer US, Boston, MA, USA, 1982. a, b, c
Moffet, R. C., Furutani, H., Rödel, T. C., Henn, T. R., Sprau, P. O., Laskin, A., Uematsu, M., and Gilles, M. K.: Iron speciation and mixing in single aerosol particles from the Asian continental outflow, J. Geophys. Res., 117, D07204, https://doi.org/10.1029/2011JD016746, 2012. a, b, c, d, e
Okochi, H. and Brimblecombe, P.: Potential trace metal–organic complexation in the atmosphere, Sci. World J., 2, 767–786, https://doi.org/10.1100/tsw.2002.132, 2002. a, b
Pöschl, U., Rudich, Y., and Ammann, M.: Kinetic model framework for aerosol and cloud surface chemistry and gas-particle interactions – Part 1: General equations, parameters, and terminology, Atmos. Chem. Phys., 7, 5989–6023, https://doi.org/10.5194/acp-7-5989-2007, 2007. a
Pozdnyakov, I. P., Kel, O. V., Plyusnin, V. F., Grivin, V. P., and Bazhin, N. M.: New insight into photochemistry of ferrioxalate, J. Phys. Chem. A, 112, 8316–8322, https://doi.org/10.1021/jp8040583, 2008. a, b, c
Pozdnyakov, I. P., Glebov, E. M., Plyusnin, V. F., Grivin, V. P., Bunduki, E., Goryacheva, N. V., Gladki, V., and Duka, G. G.: Photochemistry of Fe(III) complex with glyoxalic acid in aqueous solution, High Energ. Chem., 43, 406–409, https://doi.org/10.1134/S0018143909050129, 2009. a
Pozdnyakov, I. P., Kolomeets, A. V., Plyusnin, V. F., Melnikov, A. A., Kompanets, V. O., Chekalin, S. V., Tkachenko, N., and Lemmetyinen, H.: Photophysics of Fe(III)–tartrate and Fe(III)–citrate complexes in aqueous solutions, Chem. Phys. Lett., 530, 45–48, https://doi.org/10.1016/j.cplett.2012.01.051, 2012. a, b, c
Pruppacher, H. and Klett, J.: Microstructure of atmospheric clouds and precipitation, in: Microphysics of Clouds and Precipitation, vol. 18, 10–73, Springer Netherlands, Dordrecht, https://doi.org/10.1007/978-0-306-48100-0_2, 2010. a
Raabe, J., Tzvetkov, G., Flechsig, U., Böge, M., Jaggi, A., Sarafimov, B., Vernooij, M. G., Huthwelker, T., Ade, H., Kilcoyne, D., Tyliszczak, T., Fink, R. H., and Quitmann, C.: PolLux: A new facility for soft x-ray spectromicroscopy at the swiss light source, Rev. Sci. Instrum., 79, 113704, https://doi.org/10.1063/1.3021472, 2008. a
Rush, J. D. and Bielski, B. H. J.: Pulse radiolytic studies of the reaction of with Fe(II)/Fe(III) ions. The reactivity of with ferric ions and its implication on the occurrence of the Haber-Weiss reaction, J. Phys. Chem., 89, 5062–5066, https://doi.org/10.1021/j100269a035, 1985. a, b
Sander, R.: Compilation of Henry's law constants (version 4.0) for water as solvent, Atmos. Chem. Phys., 15, 4399–4981, https://doi.org/10.5194/acp-15-4399-2015, 2015. a
Shiraiwa, M. and Seinfeld, J. H.: Equilibration timescale of atmospheric secondary organic aerosol partitioning, Geophys. Res. Lett., 39, L24801, https://doi.org/10.1029/2012GL054008, 2012. a
Shiraiwa, M., Ammann, M., Koop, T., and Pöschl, U.: Gas uptake and chemical aging of semisolid organic aerosol particles, P. Natl. Acad. Sci. USA, 108, 11003–11008, https://doi.org/10.1073/pnas.1103045108, 2011. a
Shiraiwa, M., Pfrang, C., Koop, T., and Pöschl, U.: Kinetic multi-layer model of gas-particle interactions in aerosols and clouds (KM-GAP): linking condensation, evaporation and chemical reactions of organics, oxidants and water, Atmos. Chem. Phys., 12, 2777–2794, https://doi.org/10.5194/acp-12-2777-2012, 2012. a
Smith, R. M. and Martell, A. E.: Critical Stability Constants, vol. 4, Springer US, Boston, MA, USA, https://doi.org/10.1007/978-1-4757-5506-0, 1976. a
Song, Y. C., Haddrell, A. E., Bzdek, B. R., Reid, J. P., Bannan, T., Topping, D. O., Percival, C., and Cai, C.: Measurements and predictions of binary component aerosol particle viscosity, J. Phys. Chem. A, 120, 8123–8137, https://doi.org/10.1021/acs.jpca.6b07835, 2016. a, b
Steimer, S. S., Lampimäki, M., Coz, E., Grzinic, G., and Ammann, M.: The influence of physical state on shikimic acid ozonolysis: a case for in situ microspectroscopy, Atmos. Chem. Phys., 14, 10761–10772, https://doi.org/10.5194/acp-14-10761-2014, 2014. a, b, c
Steimer, S. S., Berkemeier, T., Gilgen, A., Krieger, U. K., Peter, T., Shiraiwa, M., and Ammann, M.: Shikimic acid ozonolysis kinetics of the transition from liquid aqueous solution to highly viscous glass, Phys. Chem. Chem. Phys., 17, 31101–31109, https://doi.org/10.1039/C5CP04544D, 2015a. a
Steimer, S. S., Krieger, U. K., Te, Y.-F., Lienhard, D. M., Huisman, A. J., Luo, B. P., Ammann, M., and Peter, T.: Electrodynamic balance measurements of thermodynamic, kinetic, and optical aerosol properties inaccessible to bulk methods, Atmos. Meas. Tech., 8, 2397–2408, https://doi.org/10.5194/amt-8-2397-2015, 2015b. a, b
Tao, Y. and Murphy, J. G.: The Mechanisms Responsible for the Interactions among Oxalate, pH, and Fe Dissolution in PM2.5, ACS Earth Space Chem., 3, 2259–2265, https://doi.org/10.1021/acsearthspacechem.9b00172, 2019. a
Tapparo, A., Di Marco, V., Badocco, D., D’Aronco, S., Soldà, L., Pastore, P., Mahon, B. M., Kalberer, M., and Giorio, C.: Formation of metal-organic ligand complexes affects solubility of metals in airborne particles at an urban site in the Po valley, Chemosphere, 241, 125025, https://doi.org/10.1016/j.chemosphere.2019.125025, 2020. a
von Sonntag, C. and Schuchmann, H.-P.: Aufklärung von Peroxyl-Radikalreaktionen in wäßriger Lösung mit strahlenchemischen Techniken, Angew. Chem., 103, 1255–1279, https://doi.org/10.1002/ange.19911031006, 1991. a
Walling, C.: Fenton's reagent revisited, Acc. Chem. Res., 8, 125–131, https://doi.org/10.1021/ar50088a003, 1975. a
Wang, Z., Chen, C., Ma, W., and Zhao, J.: Photochemical coupling of iron redox reactions and transformation of low-molecular-weight organic matter, J. Phys. Chem. Lett., 3, 2044–2051, https://doi.org/10.1021/jz3005333, 2012. a, b
Weller, C., Horn, S., and Herrmann, H.: Photolysis of Fe(III) carboxylato complexes: Fe(II) quantum yields and reaction mechanisms, J. Photochem. Photobiol. A Chem., 268, 24–36, https://doi.org/10.1016/j.jphotochem.2013.06.022, 2013. a, b, c, d, e, f
Weller, C., Tilgner, A., Bräuer, P., and Herrmann, H.: Modeling the impact of iron-carboxylate photochemistry on radical budget and carboxylate degradation in cloud droplets and particles, Environ. Sci. Technol., 48, 5652–5659, https://doi.org/10.1021/es4056643, 2014. a, b, c, d, e
Weschler, C. J., Mandich, M. L., and Graedel, T. E.: Speciation, photosensitivity, and reactions of transition metal ions in atmospheric droplets, J. Geophys. Res., 91, 5189, https://doi.org/10.1029/JD091iD04p05189, 1986. a
Willey, J. D., Kieber, R. J., Williams, K. H., Crozier, J. S., Skrabal, S. A., and Avery, G. B.: Temporal variability of iron speciation in coastal rainwater, J. Atmos. Chem., 37, 185–205, https://doi.org/10.1023/A:1006421624865, 2000. a
Zardini, A. A., Krieger, U. K., and Marcolli, C.: White light Mie resonance spectroscopy used to measure very low vapor pressures of substances in aqueous solution aerosol particles, Optics Express, 14, 6951–6962, https://doi.org/10.1364/OE.14.006951, 2006. a
Zaveri, R. A., Shaw, W. J., Cziczo, D. J., Schmid, B., Ferrare, R. A., Alexander, M. L., Alexandrov, M., Alvarez, R. J., Arnott, W. P., Atkinson, D. B., Baidar, S., Banta, R. M., Barnard, J. C., Beranek, J., Berg, L. K., Brechtel, F., Brewer, W. A., Cahill, J. F., Cairns, B., Cappa, C. D., Chand, D., China, S., Comstock, J. M., Dubey, M. K., Easter, R. C., Erickson, M. H., Fast, J. D., Floerchinger, C., Flowers, B. A., Fortner, E., Gaffney, J. S., Gilles, M. K., Gorkowski, K., Gustafson, W. I., Gyawali, M., Hair, J., Hardesty, R. M., Harworth, J. W., Herndon, S., Hiranuma, N., Hostetler, C., Hubbe, J. M., Jayne, J. T., Jeong, H., Jobson, B. T., Kassianov, E. I., Kleinman, L. I., Kluzek, C., Knighton, B., Kolesar, K. R., Kuang, C., Kubátová, A., Langford, A. O., Laskin, A., Laulainen, N., Marchbanks, R. D., Mazzoleni, C., Mei, F., Moffet, R. C., Nelson, D., Obland, M. D., Oetjen, H., Onasch, T. B., Ortega, I., Ottaviani, M., Pekour, M., Prather, K. A., Radney, J. G., Rogers, R. R., Sandberg, S. P., Sedlacek, A., Senff, C. J., Senum, G., Setyan, A., Shilling, J. E., Shrivastava, M., Song, C., Springston, S. R., Subramanian, R., Suski, K., Tomlinson, J., Volkamer, R., Wallace, H. W., Wang, J., Weickmann, A. M., Worsnop, D. R., Yu, X.-Y., Zelenyuk, A., and Zhang, Q.: Overview of the 2010 Carbonaceous Aerosols and Radiative Effects Study (CARES), Atmos. Chem. Phys., 12, 7647–7687, https://doi.org/10.5194/acp-12-7647-2012, 2012. a
Zhang, X., Gong, Y., Wu, F., Deng, N., Pozdnyakov, I. P., Glebov, E. M., Grivin, V. P., Plyusnin, V. F., and Bazhinb, N. M.: Photochemistry of the iron(III) complex with pyruvic acid in aqueous solutions, Russ. Chem. Bull., 58, 1828–1836, https://doi.org/10.1007/s11172-009-0249-2, 2009. a