the Creative Commons Attribution 4.0 License.
the Creative Commons Attribution 4.0 License.
 | 02 Mar 2021
Biodegradation by bacteria in clouds: an underestimated sink for some organics in the atmospheric multiphase system
Amina Khaled
Minghui Zhang
Pierre Amato
Anne-Marie Delort
Barbara Ervens
Water-soluble organic compounds represent a significant fraction of total atmospheric carbon. The main oxidants towards them in the gas and aqueous phases are OH and NO3 radicals. In addition to chemical solutes, a great variety of microorganisms (e.g., bacteria, viruses, fungi) have been identified in cloud water. Previous lab studies suggested that for some organics, biodegradation by bacteria in water is comparable to their loss by chemical processes. We perform model sensitivity studies over large ranges of biological and chemical process parameters using a box model with a detailed atmospheric multiphase chemical mechanism and biodegradation processes to explore the importance of biodegradation of organics in the aqueous phase. Accounting for the fact that only a small number fraction of cloud droplets (∼0.0001–0.001) contains active bacterial cells, we consider only a few bacteria-containing droplets in the model cloud. We demonstrate that biodegradation might be most efficient for water-soluble organic gases with intermediate solubility ( [M atm−1] ≤106, e.g., formic and acetic acids). This can be explained by the transport limitation due to evaporation of organics from bacteria-free droplets to the gas phase, followed by the dissolution into bacteria-containing droplets. For cloud condensation nuclei (CCN)-derived compounds, such as dicarboxylic acids, the upper limit of organic loss by biodegradation can be approximated by the amount of organics dissolved in the bacteria-containing droplets (<0.1 %). We compare results from our detailed drop-resolved model to simplified model approaches, in which (i) either all cloud droplets are assumed to contain the same cell concentration (0.0001–0.001 cell per droplet), or (ii) only droplets with intact bacterial cells are considered in the cloud (liquid water content vol vol). Conclusions based on these approaches generally overestimate the role of biodegradation, particularly for highly water-soluble organic gases. Our model sensitivity studies suggest that current atmospheric multiphase chemistry models are incomplete for organics with intermediate solubility and high bacterial activity.
- Article
(15091 KB) - Full-text XML
- Companion paper 1
- Companion paper 3
-
Supplement
(926 KB) - BibTeX
- EndNote


Clouds provide a medium for multiphase chemical reactions, in which chemical species from the aqueous, solid, and gas phases are transformed and can affect significantly the transport and distribution of chemical species in the atmosphere (Lelieveld and Crutzen, 1991). The chemical composition of cloud water is a complex mixture containing a multitude of organic and inorganic species with a range of chemical and physical properties (e.g., reactivity, solubility, volatility). The organic fraction includes water-soluble organic gases and water-soluble cloud condensation nuclei (CCN)-derived components, such as aldehydes, mono- and dicarboxylic acids, and organonitrogen and organosulfur compounds. Water-soluble organic gases are dissolved from the gas phase to the aqueous phase; CCN-derived compounds enter the aqueous phase via nucleation scavenging of condensation nuclei (CCN) (Ervens, 2015; Löflund et al., 2002). Water-soluble organic carbon (WSOC) constitutes a significant portion of the total atmospheric organic carbon mass, ranging from ∼14 % to ∼64 % depending on the sampling location (Decesari et al., 2000; Gao et al., 2016; Varga et al., 2001).
In addition to chemical solutes, cloud water contains microorganisms such as bacteria, yeast, and fungi (Delort et al., 2010; Hu et al., 2018). Typical concentrations of bacterial cells are on the order of 106 to 108 cells L−1; fungi and yeast cell concentrations are usually lower (∼105 to ∼107 cells L−1) (Amato et al., 2007b; Sattler et al., 2001). The atmosphere is a stressful environment for microorganisms (low temperature, UV exposure, acidic pH, quick hydration–drying cycles, and the presence of oxidants such as OH and H2O2) (Sattler et al., 2001), which might limit the survival time of cells in the atmosphere.
Several studies have shown that bacteria can grow and be metabolically active in cloud droplets. Marker compounds such as adenosine 5′-triphosphate (ATP) (Amato et al., 2007c), rRNA (Krumins et al., 2014a), or mRNA (Amato et al., 2019) have been used to demonstrate metabolic activity in the atmosphere. The ADP ATP ratio (where ADP is adenosine diphosphate), monitored during lab experiments with real cloud water, showed that even after exposure to oxidants over several hours, biodegradation rates were not significantly affected (Vaïtilingom et al., 2013). Metabolic activity and cell generation of bacteria is likely restricted to the time cells spend in clouds due to the abundance of liquid water (Ervens and Amato, 2020; Haddrell and Thomas, 2017); bacteria have been found to be dormant at lower relative humidity than in clouds (Kaprelyants and Kell, 1993).
The metabolic activity of bacterial strains identified in cloud water (e.g., Pseudomonas, Sphingomonas) has been investigated in lab studies, and it was shown that they can biodegrade organics (e.g., malonate, succinate, adipate, pimelate, formaldehyde, methanol, acetate, formate, phenol, and catechol) (Amato et al., 2007a; Ariya et al., 2002; Delort et al., 2010; Fankhauser et al., 2019; Husárová et al., 2011; Jaber et al., 2020; Vaïtilingom et al., 2010, 2011, 2013). Based on comparisons of experimentally derived biodegradation rates to chemical rates of oxidation reactions by radicals (e.g., OH, NO3) in the aqueous phase, it was concluded that they might be similar under some conditions and that, depending on the abundance and metabolic activity of bacteria strains, oxidation and biodegradation processes of organics may compete in clouds. The biodegradation rate likely depends on the availability of the substrate in the aqueous phase. In the case of soluble substrates, it can be expected that uptake of soluble substrates from the gas phase leads to a continuous replenishment of the organics.
There are several estimates of WSOC loss by bacteria on a global scale: Sattler et al. (2001) estimated a sink of 1–10 Tg yr−1, smaller than the estimate by Vaïtilingom et al. (2013) (10–50 Tg yr−1). However, the latter is likely an overestimate as complete respiration was implied, i.e., total conversion of organics into CO2. More conservatively, Ervens and Amato (2020) suggested a global WSOC loss of 8–11 Tg yr−1, being comparable to that by chemical processes (8–20 Tg yr−1). Similarly, Fankhauser et al. (2019) postulated that the role of biodegradation is likely small, but they did not quantify the loss of different organics by bacteria.
Current atmospheric multiphase chemistry models include chemical mechanisms of different complexity with up to thousands of chemical reactions describing the transformation of inorganic and organic compounds, e.g., (Ervens et al., 2003a; Mouchel-Vallon et al., 2017; Tilgner et al., 2013; Woo and McNeill, 2015). However, they do not include the biodegradation of organics by bacteria despite the available data sets discussed above.
Cloud chemistry models often assume initially identical composition of all cloud droplets. While this might be a reasonable assumption for the chemical droplet composition due to internally mixed CCN and the phase transfer from the gas phase into all droplets, it is not appropriate for the distribution of bacteria. Due to their small number fraction of the total CCN concentration (0.001 %–0.1 %, e.g., Zhang et al., 2020), the fraction of cloud droplets that contain bacterial cells is small (<0.001). Thus, to explore biodegradation of organics in the atmospheric multiphase system, a realistic distribution within cloud droplet population needs to be assumed.
The aim of our study is to identify conditions under which biodegradation in clouds is significant in the atmosphere. Using a cloud multiphase box model, we explore the biological and chemical degradation of organic compounds over large parameter ranges of biodegradation activities, chemical rate constants, and Henry's law constants. We compare (1) the biodegradation rates in the aqueous phase to the chemical rates in both phases and (2) the fraction of organics consumed by biodegradation to that by chemical processes. The results of our sensitivity studies elucidate the organics for which biodegradation competes with chemical processes. Our study will give guidance for future experimental and modeling studies to further complete atmospheric models in order to more comprehensively describe organic degradation in the atmosphere.
2.1 Description of the multiphase box model
We use a multiphase box model with detailed gas- and aqueous-phase chemistry (75 species, 44 gas-phase reactions, 31 aqueous reactions) (Ervens et al., 2008).
The chemical aqueous-phase mechanism with rate constants is listed in Table S1 in the Supplement. The chemical gas-phase mechanism is based on the NCAR Master Mechanism (Aumont et al., 2000; Madronich and Calvert, 1989).
The two phases are coupled by 26 phase transfer processes which are described kinetically based on the resistance model by Schwartz (1986). The parameters describing the phase transfer of the soluble species are presented in Table S2. In addition, the initial mixing ratios of gas-phase species are included in Table S3. The equations for the mass transfer coefficient kmt and the differential equations for the aqueous- and gas-phase concentrations can be found in the Supplement (Eq. S1–S3; Section “Description of phase transfer”) (Seinfeld and Pandis, 1998). In addition to the base chemical mechanism, we define one organic species “Org” that undergoes chemical radical reactions in the gas and aqueous phases and biodegradation by bacteria only in the aqueous phase in a small subset of the droplets as shown in Fig. 1. We consider a polydisperse droplet population of 263 droplets cm−3 in 11 size classes with drop diameters of and a total liquid water content of vol vol. Only one droplet size class includes bacterial cells (Ddroplet=20 µm; Ndroplet= cell concentration =0.01 cm(gas)−3). Thus, the cell concentration in the cloud water ( cell L−1) is similar to that found in ambient clouds and as used in lab experiments (Vaïtilingom et al., 2013). The model simulations are performed for 600 s, which corresponds approximately to the droplet lifetime during one cloud cycle (Ervens et al., 2004).
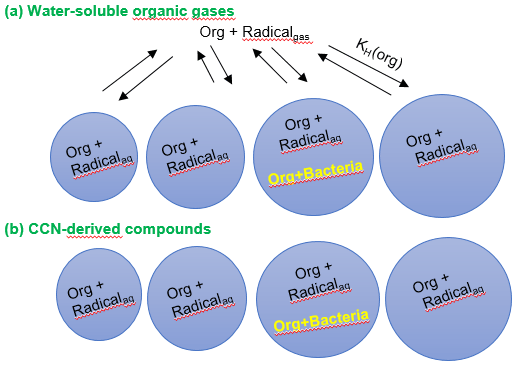
Figure 1Schematic of the multiphase box model including chemical radical reactions in the gas and aqueous phases. Chemical reactions occur in both phases and in all droplets, whereas biodegradation processes only occur in the aqueous phase in a small fraction of droplets, depending on the assumed bacterial cell concentration in clouds. (a) Water-soluble organic gases that partition between the two phases; (b) CCN-derived compounds that only get processed in the aqueous phase.
We categorize four various compound groups based on their solubility in water and their Henry's law constant, and we distinguish the following:
-
Low-solubility species with KH<103 M atm−1. Their dissolved fraction is <1 % for the liquid water content (LWC) of 0.68 g m−3 in our model.
-
Intermediate-solubility species with M atm−1 with dissolved fractions of ∼1 %–95 % (LWC=0.68 g m−3).
-
High-solubility species with KH>106 M atm−1 for which the dissolved fraction exceeds 95 % (LWC=0.68 g m−3).
-
Water-soluble CCN components which are dissolved in the aqueous phase upon dissolution of the condensation nucleus on which the cloud droplet grew. While these compounds have usually low volatility or are semivolatile, they also need to be water soluble to be available for aqueous-phase processes.
2.2 Kinetic data in the gas and aqueous phases
2.2.1 Chemical rates and Henry's law constants
Table 1 includes chemical rate constants for radical (OH, NO3) reactions in the aqueous and gas phases for organic compounds, for which lab data on their biodegradation rates are available (Sect. 2.2.2). These data cover ranges of 103≤kchemaq [M−1 s−1] ≤1010 and [cm3 s−1 ] , respectively, over which the model sensitivity studies in the following are performed.
Table 1Literature data on chemical rate constants in the aqueous (kOH,aq; ) and gas phases (kOH,gas; ) and physical Henry's law constants (KH) and effective Henry's law constants (KH(eff)) for acids at pH=3 and pH=6, respectively.
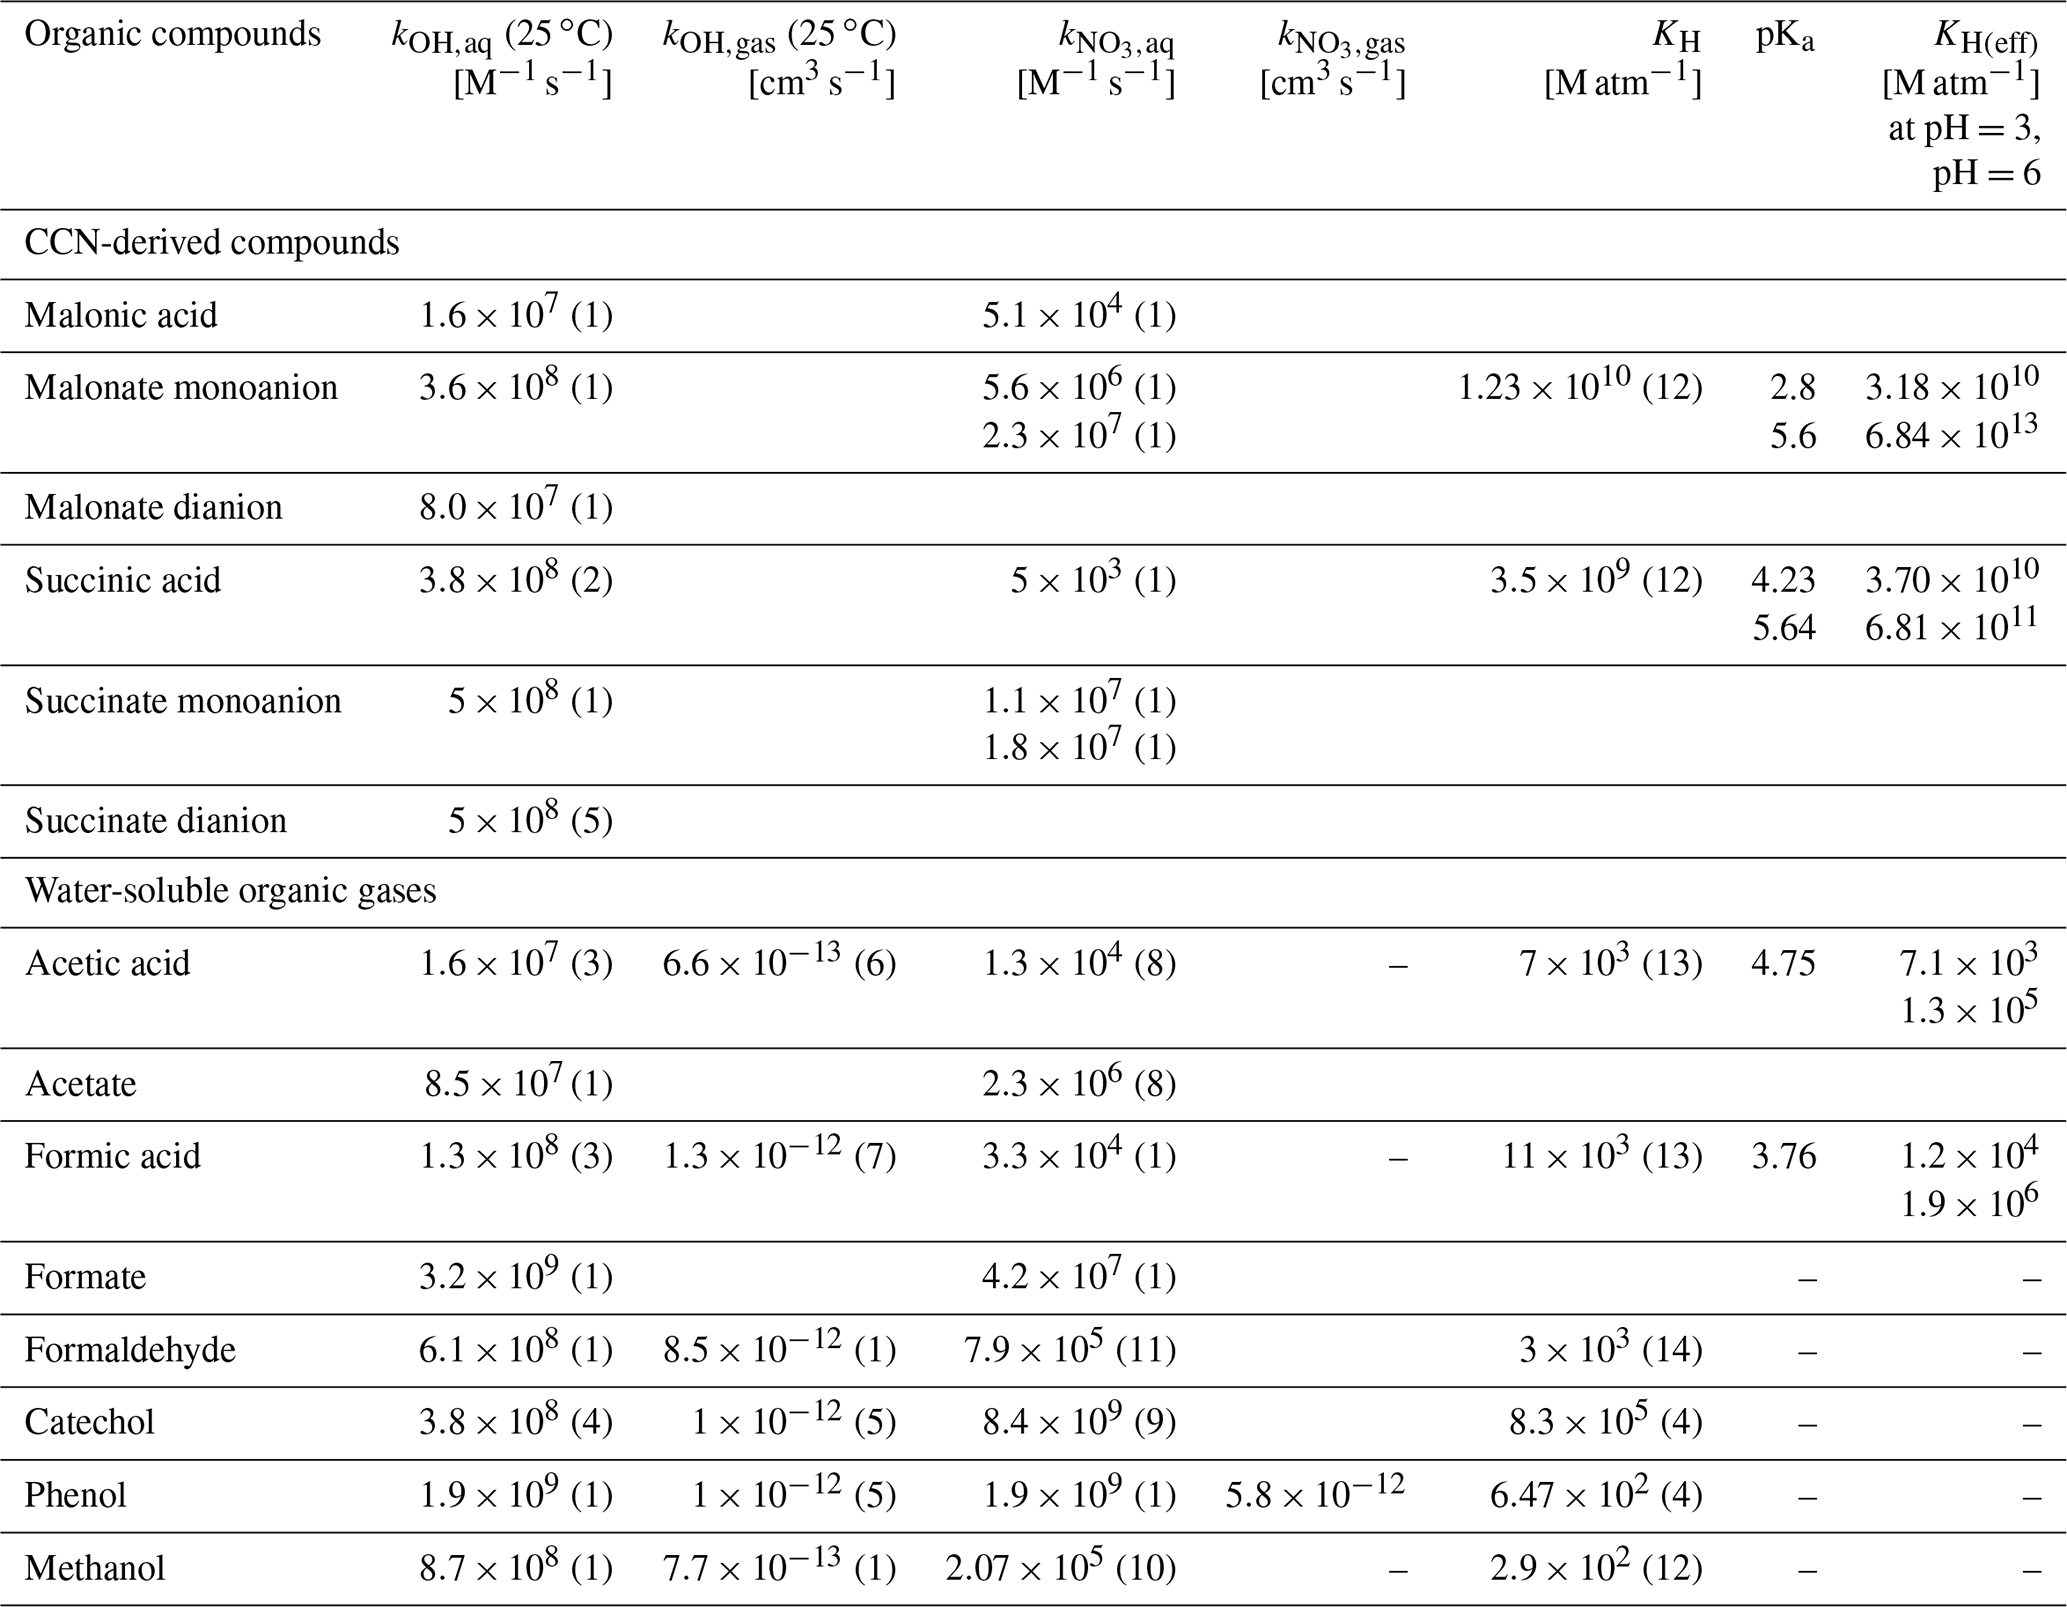
1: Herrmann (2003), 2: Cabelli et al. (1985), 3: Vaïtilingom et al. (2010), 4: Pillar et al. (2014), 5: Ervens et al. (2003c), 6: Butkovskaya et al. (2004), 7: Anglada (2004), 8: Exner et al. (1994), 9: Hoffmann et al. (2018), 10: Mezyk et al. (2017), 11: Gaillard De Sémainville et al. (2007), 12: Sander (2015), 13: Johnson et al. (1996), 14: Allou et al. (2011). “–” means no rate constant available.
In order to generalize our results for different radical concentrations, we present them in terms of chemical rates Rchem [s−1], i.e., as the products of the rate constants kchemaq and kchemgas and radical concentrations:
Typical radical concentrations are on the order of 10−15 mol L−1 for OH and NO3 radicals in the aqueous phase of clouds (Arakaki et al., 2013; Herrmann, 2003) and 106 and 107–108 cm−3 in the gas phase, respectively (Cantrell et al., 1997; Khan et al., 2008). The Henry's law constants for the same organic compounds are also listed in Table 1. They cover a range of 102≤KH [M atm−1] ≤109. For carboxylic acids, we also report effective Henry's law constants at pH=3 and pH=6 as being typical for cloud water.
2.2.2 Biodegradation rates
In the literature, experimental rates for metabolic processes are usually reported in units of [mol cell−1 s−1] (Table 2). We converted these rates into first-order loss rates [s−1] by dividing them by the ratio of the concentration of the organic compound [mol L−1] to Ccell,aq [cell L−1] used in the respective experiments. To obtain a value with units corresponding to chemical rate constants, this rate is divided by the constant model cell concentration ( cell L−1) resulting in a range of [L cell−1 s−1] . This cell concentration is on the same order of magnitude as found in many clouds (Amato et al., 2007c).
Table 2Summary of biodegradation rates from the literature and calculated rate constants (kbact) for the consumption of small organic species by bacteria isolated from cloud water.
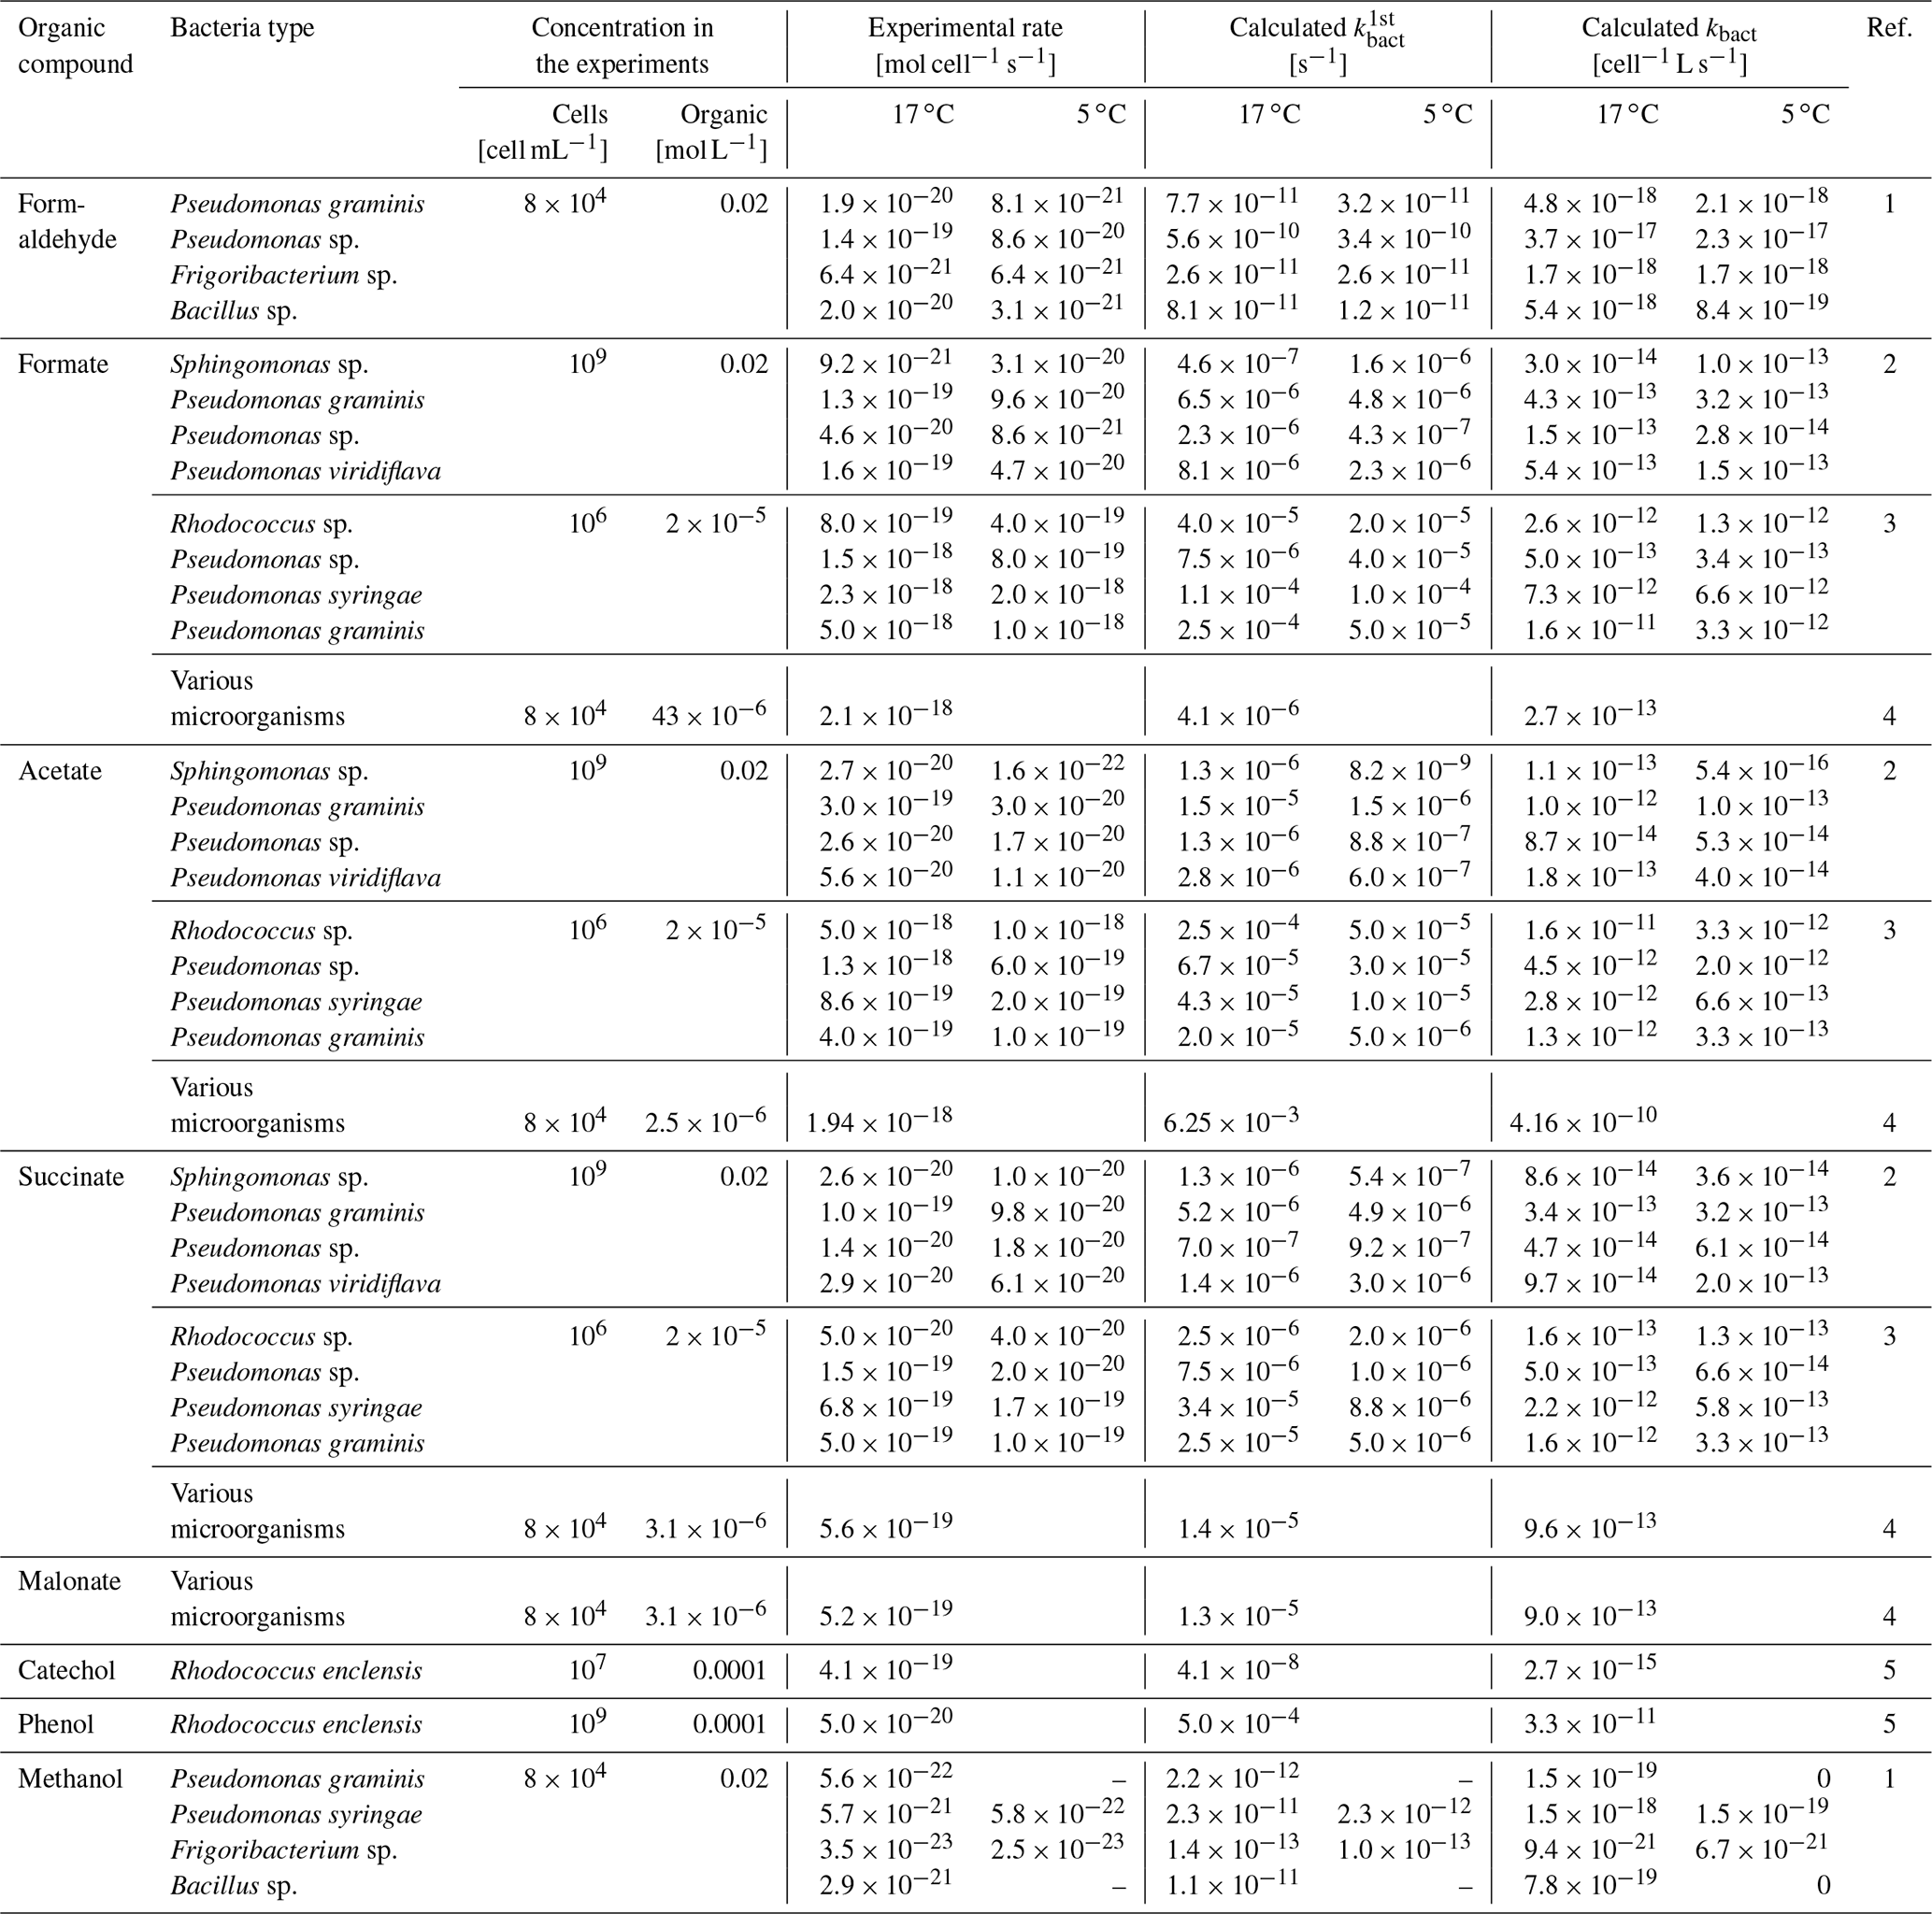
1: Husárová et al. (2011), 2: Vaïtilingom et al. (2010), 3: Vaïtilingom et al. (2011), 4: Vaïtilingom et al. (2013), 5: Jaber et al. (2020). Several experiments showed that temperature only had a small influence on the biodegradation rates that differed at most by a factor of 2 in experiments at 5 or 17 ∘C (Husárová et al., 2011; Vaïtilingom et al., 2010, 2011).
Experiments with 17 different cloud bacteria in artificial cloud water with pH=5.0 and pH=6.5 also showed nearly identical results (Vaïtilingom et al., 2011). Similar results were shown by Razika et al. (2010), who demonstrated that biodegradation rates of phenol by Pseudomonas aeruginosa were very similar when incubated at pH=5.8, 7.0, and 8.0. When exposed to very broad ranges of external pH values, bacteria can control their intracellular pH (∼6.5–7) by internal buffering (Delort et al., 2017). As biodegradation occurs inside the cell, it takes place at these (nearly) neutral conditions. The efficiency of buffering decreases at extreme conditions, e.g., pH<2 or pH>10 (Guan and Liu, 2020). However, such a pH range is not representative for cloud water where more moderate pH values (∼3–6) are typically found (Deguillaume et al., 2014). Therefore, we do not consider a potential pH dependency of biodegradation rates in our model studies.
Similar to the chemical processes (Eqs. 1 and 2), we express the biological activity in terms of a rate:
where kbact is the bacterial rate constant [L cell−1 s−1], and Ccell,aq is the concentration of bacteria in cloud water [cell L−1].
2.3 Definition of model output parameters
2.3.1 Relative contributions to biodegradation and chemical loss rates
Several previous studies compared biodegradation and chemical rates in order to conclude on the potential importance of biological processes in clouds (Ariya et al., 2002; Husárová et al., 2011; Jaber et al., 2020; Vaïtilingom et al., 2011, 2013). Similarly, we define the relative contributions of the bacterial and the chemical processes in the two phases to the total loss rate of an organic compound.
where Corg,aq and Corg,gas are the concentration of water-soluble organic gases in the aqueous [mol L−1] and gas phases [cm−3], respectively. Their relative contributions are then expressed as
where these fractions always add up to 100 %. As CCN-derived compounds are only in the aqueous phase, .
2.3.2 Contributions to total loss of organics by bacterial and chemical processes
While frbact, frchemaq, and frchemgas define the relative importance of the bacterial and chemical loss rates, they do not give quantitative information on the total loss of the organics. To define this sink strength, we introduce the parameter Lt [%] as
where [Org]0 is the initial organic concentration (1 ppb) and [Org]t is the organic concentration at time t (for most simulations: t=600 s). Accordingly, Lbact, Lchemaq and Lchemgas are the fractions [%] of organics consumed by bacteria and radicals in the aqueous and gas phases, respectively.
As both the fractions “fr” and L are expressed in percent, we divided by 100 % in Eqs. (11)–(13). Unlike the sum of frbact, frchemaq, and frchemgas that always yields 100 % (Eqs. 7–9), by definition Lt does not have to reach 100 %. As we only consider one cloud cycle in our simulations (t=600 s), the values of Lt, Lbact, Lchemgas, and Lchemaq are rather small (a few percent at most); however, it should be kept in mind that particles likely undergo multiple cloud cycles during their residence time in the atmosphere. Thus, the contribution of chemical and biological processes to the total loss for a specific organic species can be extrapolated for longer timescales based on our results. However, as one of the main goals of our study is to compare biodegradation to the better constrained chemical losses, our conclusions will be independent of the timescales.
3.1 Relative loss rate of organics by biological processes (frbact)
3.1.1 frbact of water-soluble organic gases
We first compare the contributions of biodegradation and chemical losses to the total loss rate for water-soluble organic gases. In order to cover a representative parameter range of the physicochemical properties of the organic compound, we performed five simulations in which the full ranges of KH and of Rchemaq over 8 orders of magnitude were explored (Sect. 2.2). The simulations differ by the assumptions of Rchemgas and Rbact that are kept constant in the individual model runs. For the results shown in Fig. 2a, b, and c, we applied , 10−6, and 10−4 s−1 and s−1, respectively. For the three sets of simulations shown in Fig. 2b, d, and e, s−1 and Rchemgas equal to 10−6, 10−5, and 10−4 s−1 were assumed. Thus, in total three values each for Rchemgas and Rbact are discussed in the following.

Figure 2Relative contribution of bacteria to the total loss rate of organics (frbact, Eq. 7) as a function of Rchemaq and KH. All figure panels have the same scales on the ordinates and abscissas. The simulations were performed for constant values of Rbact and Rchemgas; their values are indicated in the box at the bottom right.
In general, for all combinations of Rchemgas and Rbact, the highest frbact is predicted for organics with the highest solubility (KH [M atm−1] ≥108) and lowest chemical reaction rate in the aqueous phase (Rchemaq [s−1] ). For the lowest biological activity ( s−1, Fig. 2a), frbact reaches a maximum value of ∼100 %. For higher biological activity ( and 10−4 s−1), frbact is always smaller and only reaches at most ∼80 % (Fig. 2b and c). This trend seems counterintuitive as for the highest Rbact the highest importance of biodegradation may be expected. We will explore the reasons for this further in Sect. 3.1.2 where we compare loss rates in individual droplets as a function of time.
The comparison of Fig. 2b and c shows that the parameter ranges, for which frbact has the maximum value, are broader for higher Rbact: when s−1 (Fig. 2b), frbact is ∼80 % within the ranges of [M atm−1] and [s−1] ; i.e., both Rchemaq and KH span about 2 orders of magnitude. For s−1 (Fig. 2c), these ranges are [M atm−1] and s−1] , i.e., wider by about 2 and 1 orders of magnitude, respectively.
This widening of the parameter space can be explained by the contributions of the chemical processes to the total organic loss rate, i.e., frchemaq and frchemgas (Figs. S1 and S2 in the Supplement); for the two values of Rbact, frchemaq is highest (>80 %) for a combination of (i) [M atm−1] ≤109 and [s−1] , or of (ii) low or intermediate solubility ( [M atm−1] ) and high chemical aqueous-phase reactivity ( [s−1] ). These trends are due to the predominant partitioning of highly soluble organics to the aqueous phase (>90 % for KH≥106 M atm−1). If Rchemaq is low, the organics do not undergo efficient chemical processes in the aqueous phase. Therefore, frbact is highest for this parameter combination. The comparison of the results for s−1 and three values of Rchemgas (Fig. 2b, d, e) shows a decrease in the maximum value of frbact from 80 % (Fig. 2b) to 4 % (Fig. 2e) for similar ranges of KH and Rchemaq because of the dependence of frbact on frchemgas: for compounds with highest Rchemgas, the dominant loss is the gas-phase reaction, leading to a high frchemgas and consequently to a lower frbact (Fig. 2e). Therefore, the parameter ranges of KH and Rchemaq, where frbact is maximum, do not change for different Rchemgas but decrease when the gas-phase chemistry dominates the loss of the organic species.
Overall, the variation in frbact as a response to changes in Rchemaq, Rchemgas, and KH shows different sensitivities: for example, for organics with KH=106 M atm−1, s−1, and s−1, frbact is ∼8 % when s−1 (red area in Fig. 2a). This fraction increases to frbact∼73 %, i.e., by a factor of ∼9, when s−1 (blue area in Fig. 2b) and approaches ∼80 % when s−1 (purple area in Fig. 2c). Similarly, for organics with KH∼106 M atm−1, s−1, and s−1, an increase in Rchemgas from 10−6 s−1 (Fig. 2b) to 10−5 s−1 (Fig. 2d) and 10−4 s−1 (Fig. 2e) decreases frbact from 73 % to 23 % and 3 %, respectively. Based on these nonlinear trends, one can hypothesize that (i) a change in Rbact and/or Rchemgas translates into a less than proportional change in frbact, and (ii) an increase in Rbact might translate into a larger change in frbact than an increase in Rchemgas by the same factor. Therefore, frbact is more sensitive to a change in Rbact than in Rchemgas. Given that Rchemgas only differs by about 2 orders of magnitude for most organics relevant in the atmospheric multiphase system (Table 1), we conclude that frbact may be largely independent of the gas-phase chemical reactivity. Additional sensitivity studies (not shown) reveal that using combinations of Rbact and Rchemgas other than those in Fig. 2 result in slightly different locations of the maximum of frbact but in similar shapes and widths of parameter spaces, for which frbact is maximum. Therefore, our conclusions on the sensitivities seem robust for wide parameter ranges and combinations.
3.1.2 frbact of CCN-derived compounds and comparison to water-soluble organic gases
For CCN-derived compounds, the analysis of frbact is limited to exploring the ranges of Rbact and Rchemaq (Fig. 1). Similar to the findings based on Fig. 2a, b, and c for water-soluble organic gases, highest values of frbact are predicted for intermediate values of [s−1] and Rchemaq [s−1] ; for the highest biological activity ( s−1), frbact is nearly zero (Fig. 3). In order to understand the reasons for these trends, we explore in the following the variables determining frbact (Eq. 7).

Figure 3Relative contribution of bacteria to the total loss rate of CCN-derived organics (frbact, Eq. 7) as a function of Rbact [s−1] and Rchemaq [s−1].
As shown in Fig. 1, only one drop size class in the model contains bacteria; in all other droplets, the bacterial activity is zero, and only chemical processes occur. In Fig. 4a, we show the evolution of the organic concentration of CCN-derived compounds in the bacteria-containing droplets ([Org]bact) over 600 s, s−1, and s−1, i.e., for relatively low chemical reactivity in both phases. It is obvious that for the highest Rbact (10−4 s−1), the organics are immediately depleted, whereas for lower biological activity ( s−1), [Org]bact decreases more slowly or even stays constant ( s−1). As for the highest Rbact, the concentration approaches zero after ∼10 s, (Eq. 4) becomes negligible and frbact approaches 0 % (Eq. 7, Fig. 4c). In Fig. 4b, we show the equivalent to Fig. 4a but for water-soluble organic gases and for three KH values (102, 105, and 109 M atm−1). For the lowest Rbact and all KH values, [Org]bact stays also nearly constant at the initial value as the organics are not efficiently consumed in any droplet. For the intermediate and highest Rbact (10−6 and 10−4 s−1) and KH=109 M atm−1, [Org]bact remains higher than for the CCN-derived compounds and levels off at t∼300 s. For these two, Rbact, [Org]bact significantly drops by several orders of magnitude. However, unlike for the CCN-derived compounds, frbact does not drop to ∼0 % but levels off at ∼70 % for KH=109 M atm−1 (Fig. 4d). For these two Rbact and KH=105 M atm−1, [Org]bact stays also nearly constant over the whole simulation time (600 s) and is higher for lowest Rbact=10−6 s−1 (Fig. 4b). However, frbact is higher for the highest s−1 (Fig. 4d). Fig. S3a and b show the ratio of the organic concentrations in bacteria-containing and bacteria-free droplets of the same diameter (20 µm). For these conditions of low Rchemgas and Rchemaq, the concentration ratio is near unity for both CCN-derived compounds and water-soluble organic gases (KH=105 and 109 M atm−1) when s−1. For higher s−1 and KH=105 and 109 M atm−1, the concentration ratio for the water-soluble organic gases is near unity and 10−3, respectively, and for the CCN-derived compounds it is much lower (). For s−1, this ratio is also higher for KH=105 M atm−1 than for KH=109 M atm−1 ( and 10−5, respectively) and for CCN-derived compounds. It can be summarized that (1) for water-soluble organic gases the concentration in bacteria-containing droplets is higher for compounds with intermediate solubility (KH∼105 M atm−1) than for highly soluble ones (KH=109 M atm−1), and (2) the concentration in bacteria-containing droplets is predicted to be always smaller for the CCN-derived compounds than for the water-soluble organic gases with at least intermediate solubility.
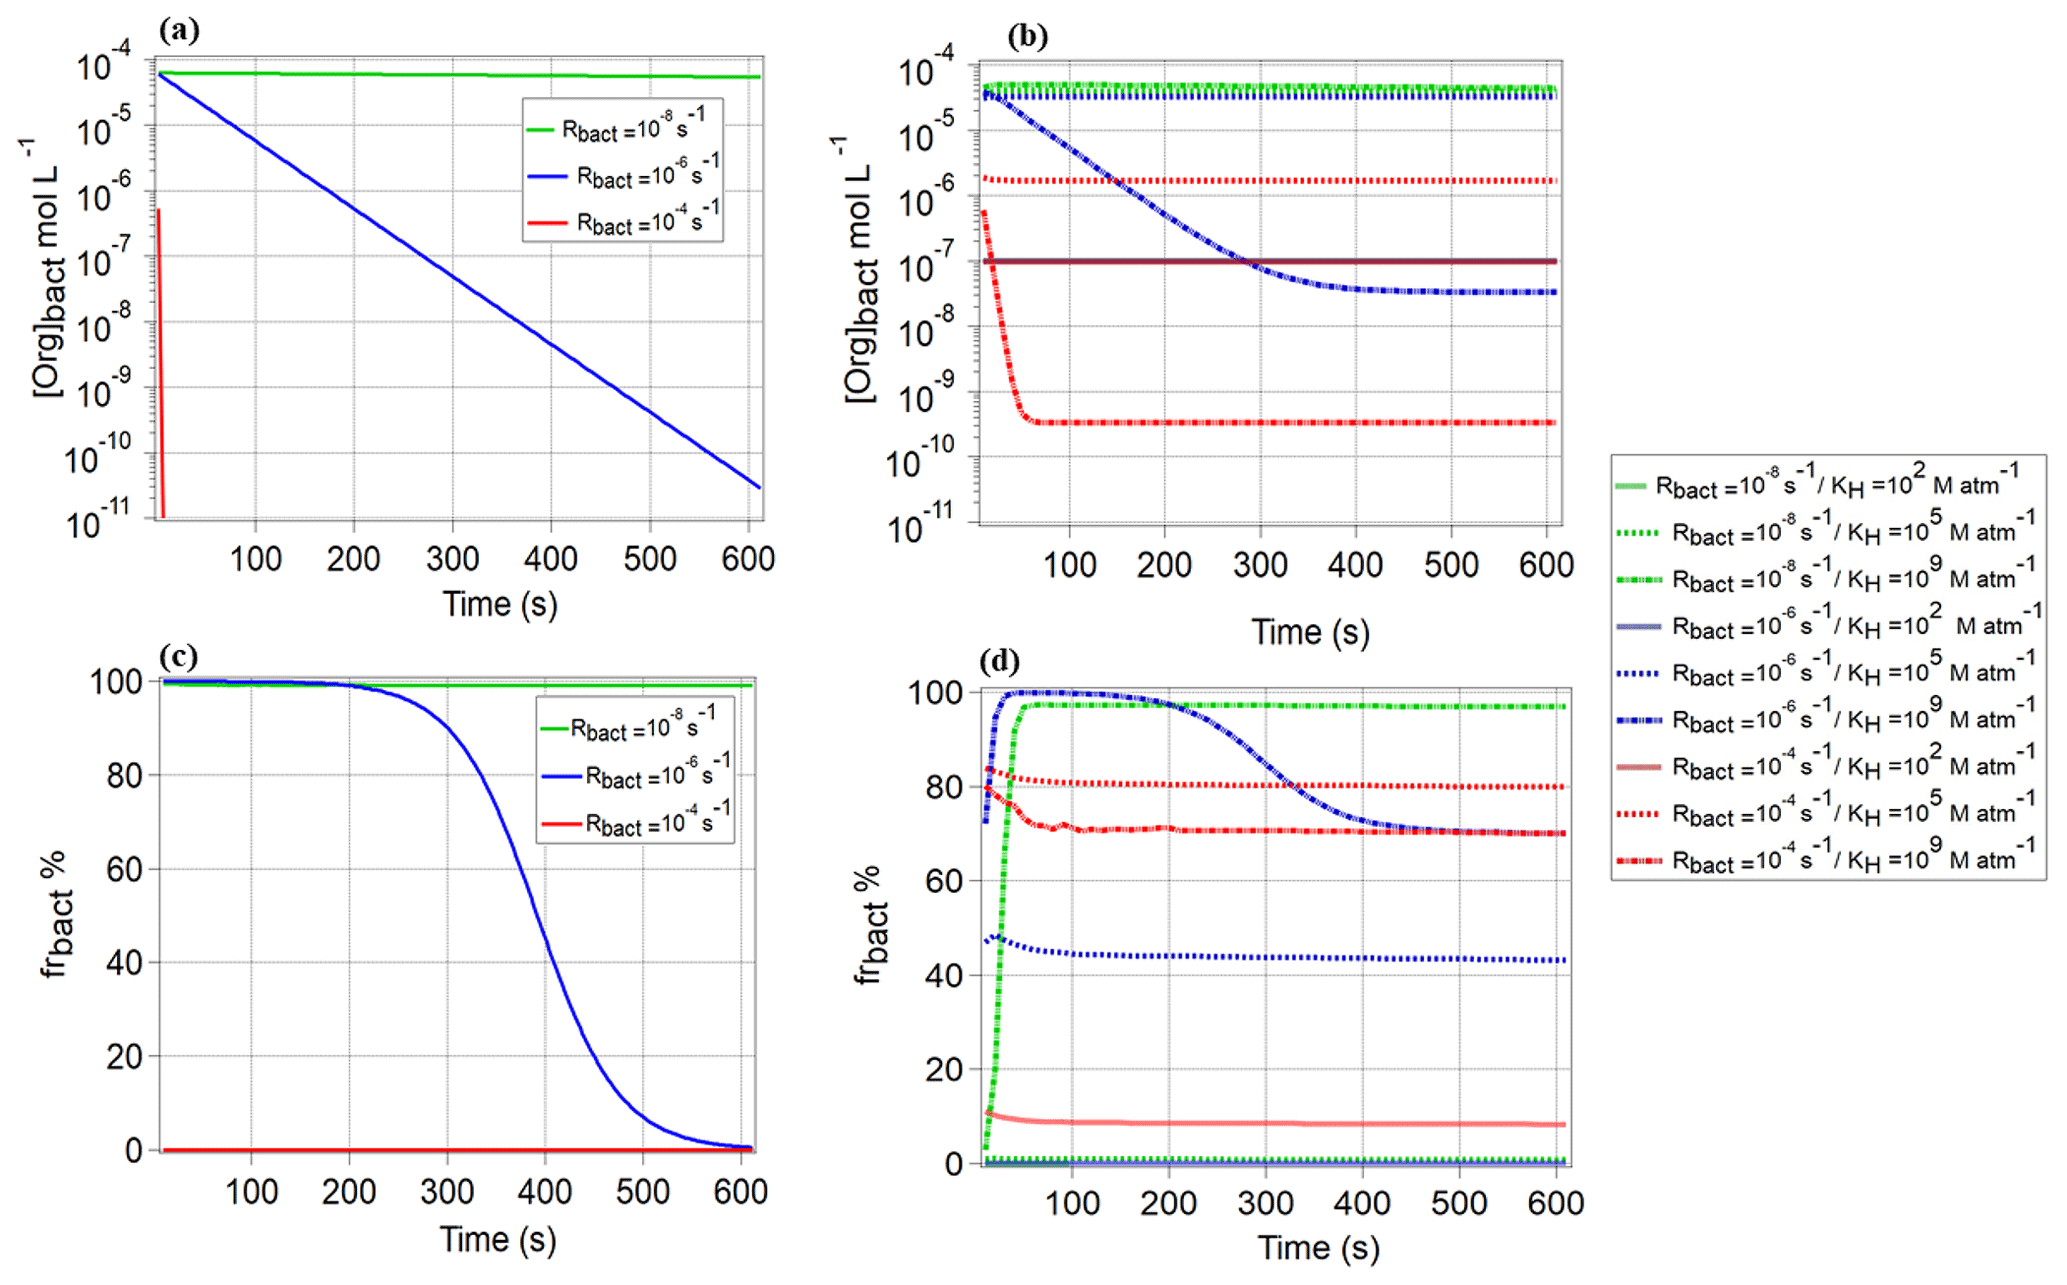
Figure 4Comparison of the organic concentration in the bacteria-containing droplets [Org]bact [mol L−1] for (a) CCN-derived compounds, (b) water-soluble organic gases (KH=102, 105 and 109 M atm−1), and (c, d) the resulting frbact for these compounds. Results are shown for , 10−6, and 10−4 s−1; s−1; and s−1.
This difference between water-soluble organic gases and CCN-derived compounds can be explained by the schematic in Fig. 5: the insets in the droplets schematically depict the temporal evolution of the organic concentrations as shown in Fig. 4. The efficient consumption of organics by bacteria in the bacteria-containing droplets (I) leads to a significant decrease in the organic concentration in these droplets. For water-soluble organic gases, this results in a strong deviation from thermodynamic equilibrium of the gas- and aqueous-phase concentrations, as defined by Henry's law (II). As a consequence, organics diffuse from the gas phase into the bacteria-containing droplets (III). As this diffusion leads to a decrease in the gas-phase concentration, thermodynamic equilibrium between the gas phase and the bacteria-free droplets is not fulfilled anymore (IV), resulting in a concentration gradient between these droplets and the gas phase. Finally, organics from the bacteria-free droplets evaporate to replenish the gas-phase concentration (V) and eventually the organic concentration in the bacteria-containing droplets. These coupled equilibria between the gas phase and droplets lead to a continuous replenishment of water-soluble organic gases in the bacteria-containing droplets. However, since all processes are associated with different timescales (evaporation, gas-phase diffusion, transport through the gas water interface, loss by chemical and biological processes in the aqueous phase; Schwartz, 1986), thermodynamic equilibrium is not instantaneously established. For organics with low KH (∼102 M atm−1), the fraction of dissolved material is very small; therefore, organics are mostly consumed in the gas phase and only a small fraction partitions to the droplets. For intermediate KH(∼105 M atm−1), the consumption of the organics in the bacteria-containing droplets is fast, leading to large concentration gradients between the phases. Consequently, the evaporation and diffusion rates are high; thus, the replenishment of the bacteria-containing droplets by the organics is most efficient. Extremely highly soluble organics (KH∼109 M atm−1) are nearly completely dissolved in the aqueous phase; thus, only a small fraction will be consumed by the bacteria, leading to relatively smaller concentration gradients between gas and bacteria-containing droplets (process I and Fig. 4b) and therefore to less efficient replenishment and longer timescales to establish thermodynamic equilibrium. Thus for such organics, the organic consumption by bacteria is relatively less efficient. For CCN-derived compounds, only process I occurs as there is no coupling to the gas phase; thus, only the amount of organics that is initially dissolved in the bacteria-containing droplets can be consumed.

Figure 5Schematic of the partitioning of water-soluble organic gases between the bacteria-containing and bacteria-free droplets and the gas phase: the inset figures show the temporal evolution of the organic concentration in the bacteria-containing droplets ([Org]bact) and bacteria-free droplets ([Org]non−bact) for water-soluble organic gases with KH=105 and 109 M atm−1.
3.2 Total loss of the organic compound (Lt) and sinks of organics by bacteria (Lbact)
3.2.1 Lt for water-soluble organic gases
While the analysis of frbact in Sect. 3.1 quantifies the relative importance of the biological and chemical processes for the organic loss, we explore in the following the absolute loss of these processes (Lt, Eq. 10).
Unlike the sum of frbact, frchemaq, and frchemgas that always yields 100 %, the ranges of Lt that will be discussed in the following are rather small, i.e., [%] ≤12, given that we only simulate approximately one cloud cycle (600 s). Figure 6 shows Lt for the same parameters (Rchemgas, Rbact) as in Fig. 2. For all combinations of Rbact and Rchemgas, the highest values of Lt are predicted for organics with highest KH and Rchemaq. Generally, all panels show the highest values for Lt for the highest Rchemaq, but in all panels there is a small maximum for low-to-intermediate KH and nearly independent of Rchemaq. This feature becomes more prominent with increasing Rchemgas (10−6, 10−5, 10−4 s−1, Fig. 6c–e), with the overall highest Lt (∼12 %) for the highest Rchemgas and lowest KH. Comparing Fig. 6a, b, and c, for which the model conditions only differ in Rbact, a small increase in Lt from 1.2 % to 1.6 % at intermediate KH values can be seen. We focus on these trends in Sect. 3.2.2 where Lbact, i.e., the contribution of the bacterial process to Lt, will be explored. Comparing the contours of the three panels shows that Lt is additive as with increasing Rbact, Lt reaches a maximum (1.6 %) at KH of ∼104 M atm−1, and Rchemaq is s−1 (Fig. 6c). Similar to our findings for frbact (Sect. 3.1.1), we also see in the trends of Lt that a change of several orders of magnitude in Rbact or Rchemgas translates into a smaller change in Lt. Thus, one can conclude that Lt has a similarly low sensitivity to the various parameters as frbact.
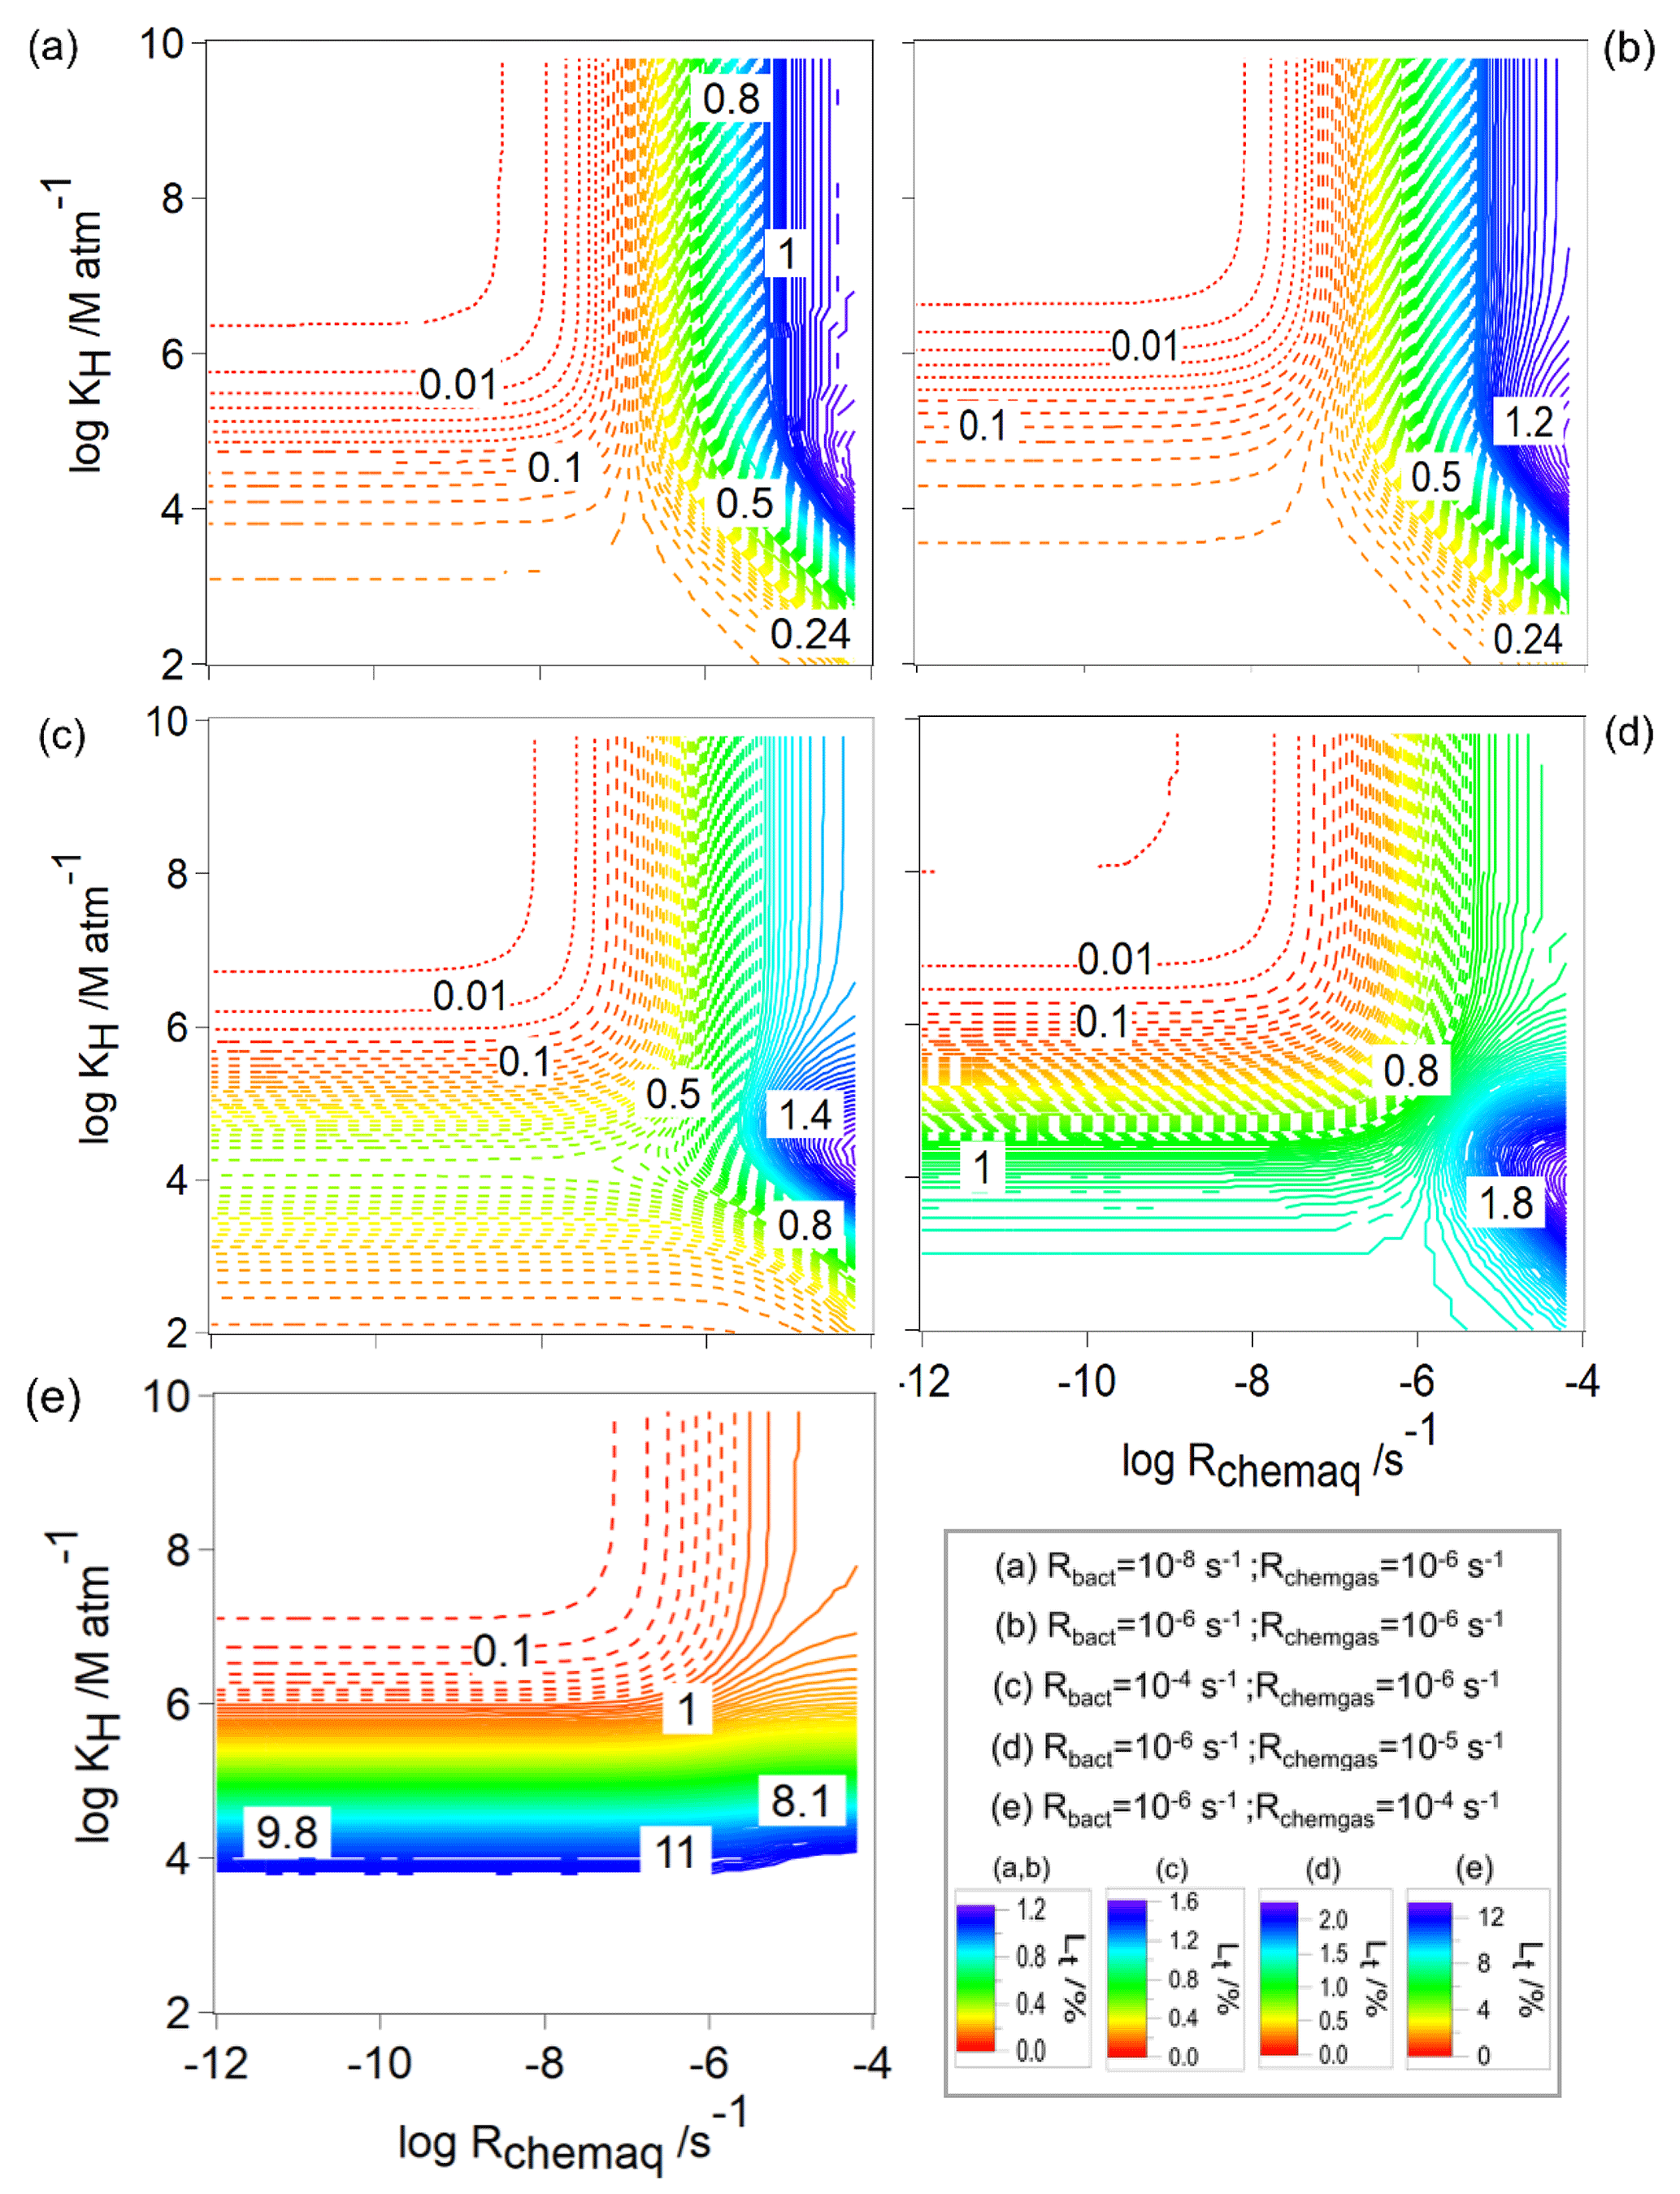
Figure 6The total loss of water-soluble organic gases (Lt, Eq. 10) as a function of Rchemaq and KH. All figure panels have the same scales on the ordinates and abscissas. The simulations were performed for constant values of Rbact and Rchemgas; their values are indicated in the box at the bottom right.
3.2.2 Lbact for water-soluble organic gases
To understand the contribution of bacteria (Lbact) in the total consumption of the organics (Lt), we explore Lbact for the same values of Rbact and Rchemgas as in Figs. 2 and 6 (Fig. 7). As suggested in the comparison of Fig. 6a–c, the contribution of the organic loss by bacteria increases with increasing Rbact (Fig. 7a–c); i.e., Lbact increases from 0.025 % to 0.45 %.
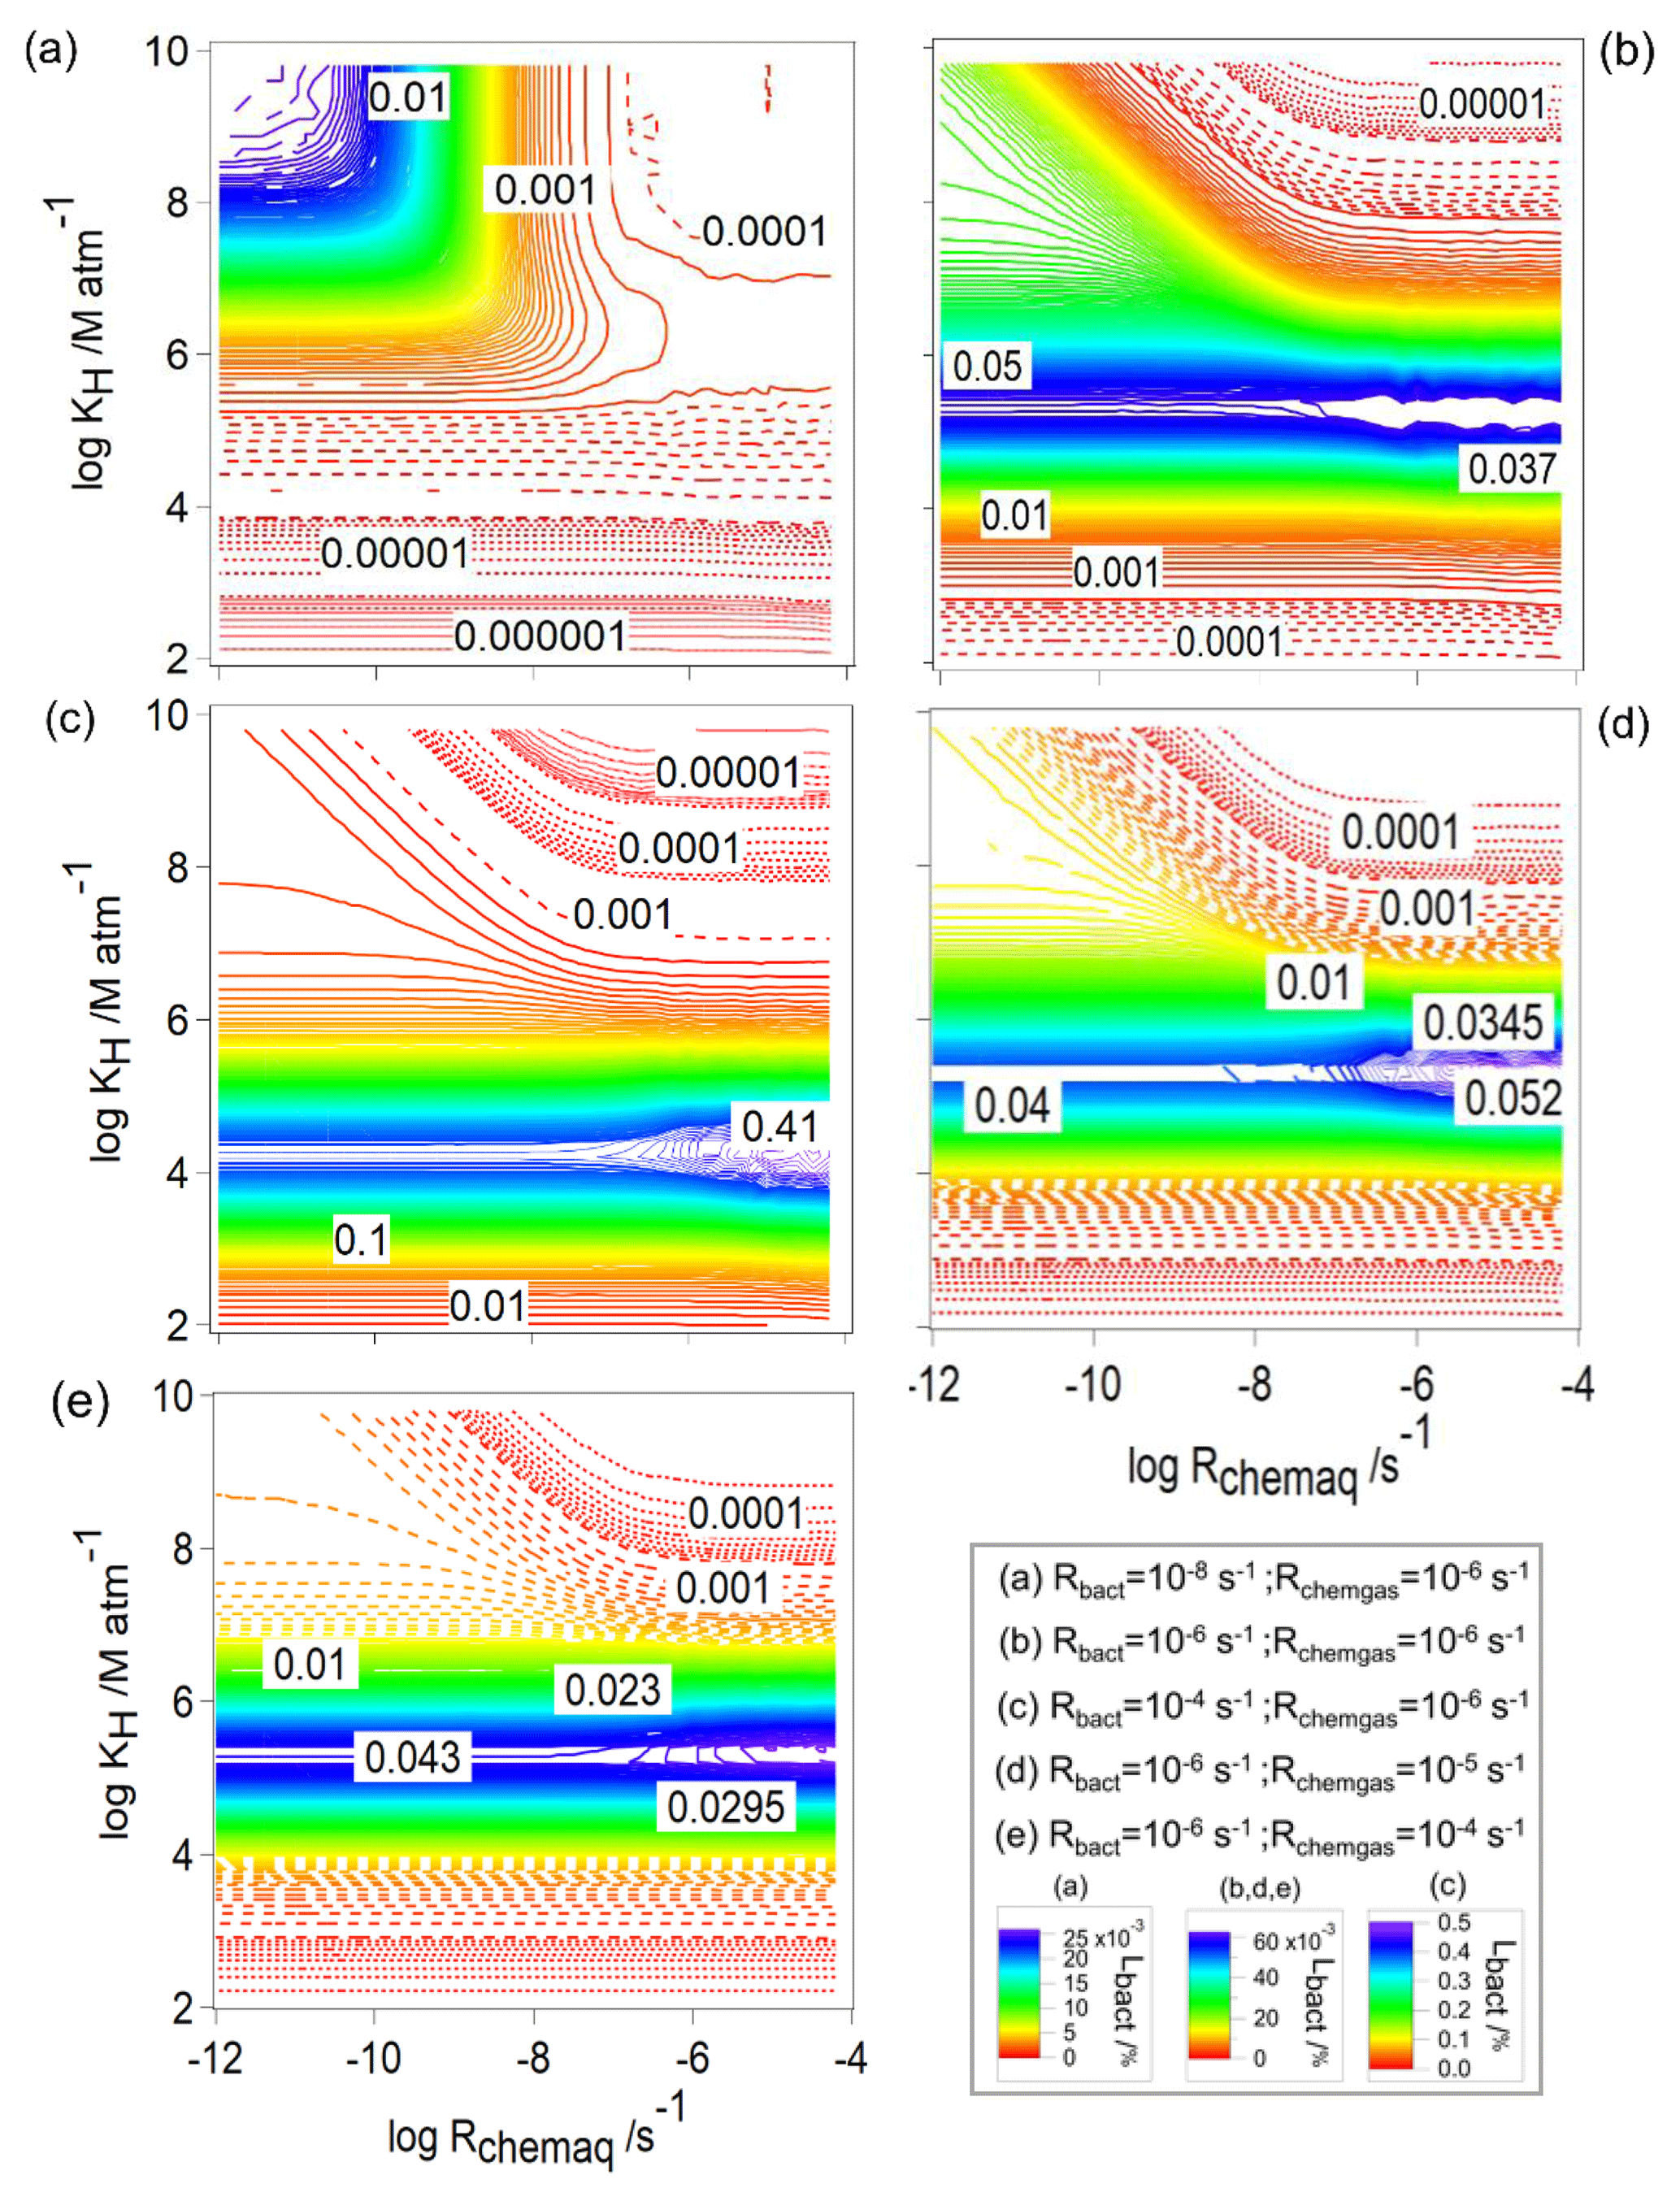
Figure 7The loss of water-soluble organic gases by bacteria (Lbact, Eq. 11) as a function of Rchemaq and KH. All figure panels have the same scales on the ordinates and abscissas. The simulations were performed for constant values of Rbact and Rchemgas; their values are indicated in the box at the bottom right.
For all conditions, there is a contribution of Lbact∼0.025 % for the lowest Rchemaq and highest KH, i.e., when chemical activity in the aqueous phase is lowest and solubility is highest. However, when s−1, the maximum value of Lbact is predicted for a narrow range of [M atm−1] ≤106, nearly independent of Rchemaq. The highest value of Lbact (0.4 %) is observed for highest Rbact ( s−1; Fig. 7c). This corresponds to nearly a quarter of the total loss (Lt≤1.4 %; Fig. 6c). To further explore why Lbact has a maximum for these intermediate values of KH, we compare Lbact for KH=102, 105, and 109 M atm−1 for s−1, s−1, and s−1, i.e., for the same conditions as the examples in Fig. 4b and d. When KH is low (102 M atm−1), a very small fraction (0.16 %) of the organics is dissolved; thus, Lbact is lowest. For KH=109 M atm−1 (Fig. 4b, blue line), [Org]aq is low because – as mentioned before – it is consumed quickly and the transport from the gas phase is not fast enough, resulting in a low Lbact. For KH∼105 M atm−1 (Fig. 4b, blue line), [Org]aq is relatively high, because the thermodynamic equilibrium can be more quickly established and thus Lbact is high.
For each set of conditions, i.e., in the various panels of Fig. 7, the maximum value Lbact is independent of Rchemaq and does not greatly vary for the same Rbact ( %) (Fig. 7b, d, e). This is unlike the trends of frbact (Fig. 2) that show a decrease with increasing Rchemaq. By definition (Eq. 7), frbact and frchemaq are coupled; thus, an increase in one value causes a decrease in the other. Contrary, Lbact is independent of the chemical contributions as it describes the absolute consumption rate related to the initial organic concentration. Comparing the trends in Figs. 2 and 7, it is evident that the maximum of Lbact (intermediate KH, independent of Rchemaq) does not coincide with the parameter ranges for which frbact is maximum (highest KH, lowest Rchemaq). This finding highlights that previous estimates on the importance of biodegradation that were solely based on comparing rates (e.g., Jaber et al., 2020) are misleading. In these studies, it was concluded that biodegradation for highly soluble compounds is likely most important.
3.2.3 Lt and Lbact for CCN-derived compounds
For CCN-derived compounds, the analysis of trends in Lt is simpler as it is the sum of Lbact and Lchemaq only. Lt increases with increasing Rchemaq, nearly independently of Rbact up to a maximum value of ∼1.1 % (Fig. 8a). Comparison of Lt to Lbact (Fig. 8b) shows that the consumption by bacteria is smaller by several orders of magnitude ( %); thus, it is not a major contribution to the total loss. Figures 3 and 8b exhibit similar contours; i.e., after 600 s simulation time, the highest relative and absolute contributions are predicted for CCN-derived compounds with intermediate bacterial and low aqueous-phase chemical activity. The trend in Fig. 8b can also be explained by the findings in Fig. 4: after 600 s, the CCN-derived compounds in the bacteria-containing droplets are completely depleted for high Rbact; thus, both frbact and Lbact approach zero. Since there is no exchange with the gas phase or other replenishment of CCN-derived compounds into bacteria-containing droplets, Lbact,maximum of these compounds can be estimated: if one assumes in a first approximation that the mass fraction of CCN-derived compounds in the initial CCN population scales with the liquid water content associated with the resulting droplets, one can conclude that at most 0.0065 % (= LWC(bacteria-containing droplets total LWC) can be consumed.
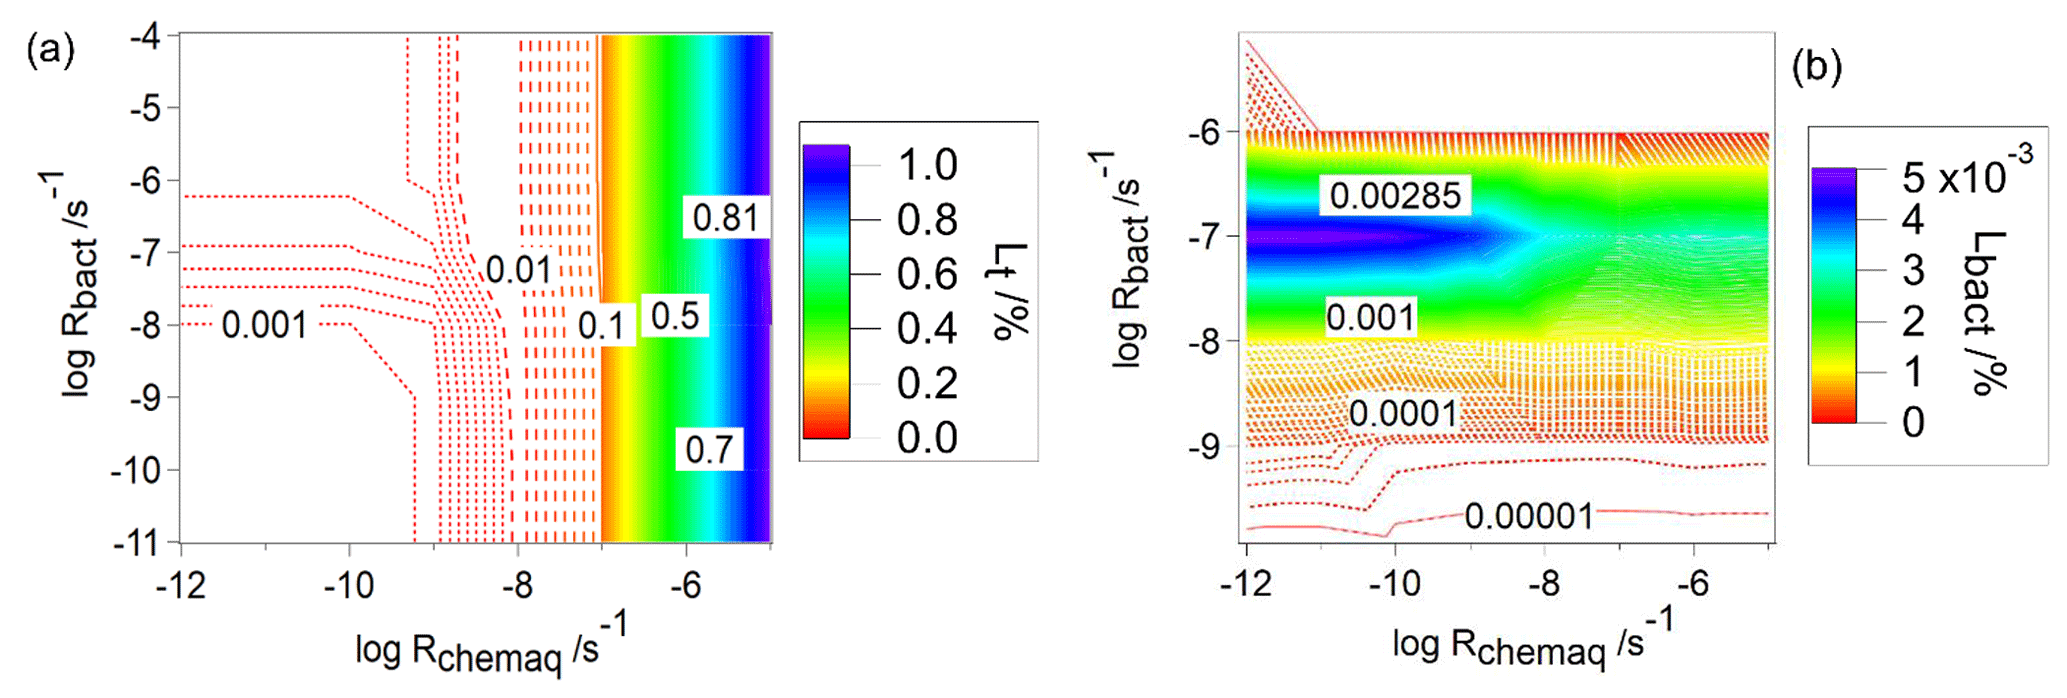
Figure 8Predicted loss of CCN-derived species as a function of Rchemaq and Rbact, (a) total loss (Lt), (b) loss by biodegradation (Lbact).
3.3 Comparison of our model approach to simplified assumptions
3.3.1 Simplified model approaches
The results in Fig. 4 demonstrate that the coupled equilibria between the gas phase and the droplets with and without bacteria need to be considered, in order to correctly predict the organic sink strength by bacterial processes in the multiphase system. Previous estimates of the role of biodegradation in the multiphase system have been performed assuming simplified assumptions. (i) For the bulk model, biodegradation and chemical rates were compared in a bulk aqueous phase (Vaïtilingom et al., 2013) or in a population of droplets with identical composition (Jaber et al., 2020). However, since the bacterial cell concentration (∼0.01 cells cm−3) in clouds is much smaller than the droplet number concentration (=263 droplets cm−3, in our model), this results in a ratio of bacterial cells per droplet. (ii) For the low-LWC model, the multiphase system is considered with only droplets that contain an intact bacterial cell, resulting in a liquid water content of vol vol, similar to Fankhauser et al. (2019). In Fig. 9, we schematically contrast these approaches. While it is clear that none of the two approaches reflect the conditions as encountered in real clouds, we will analyze in the following the extent to which these simplified model approaches lead to similar results as predicted in our detailed model discussed so far (Fig. 1).
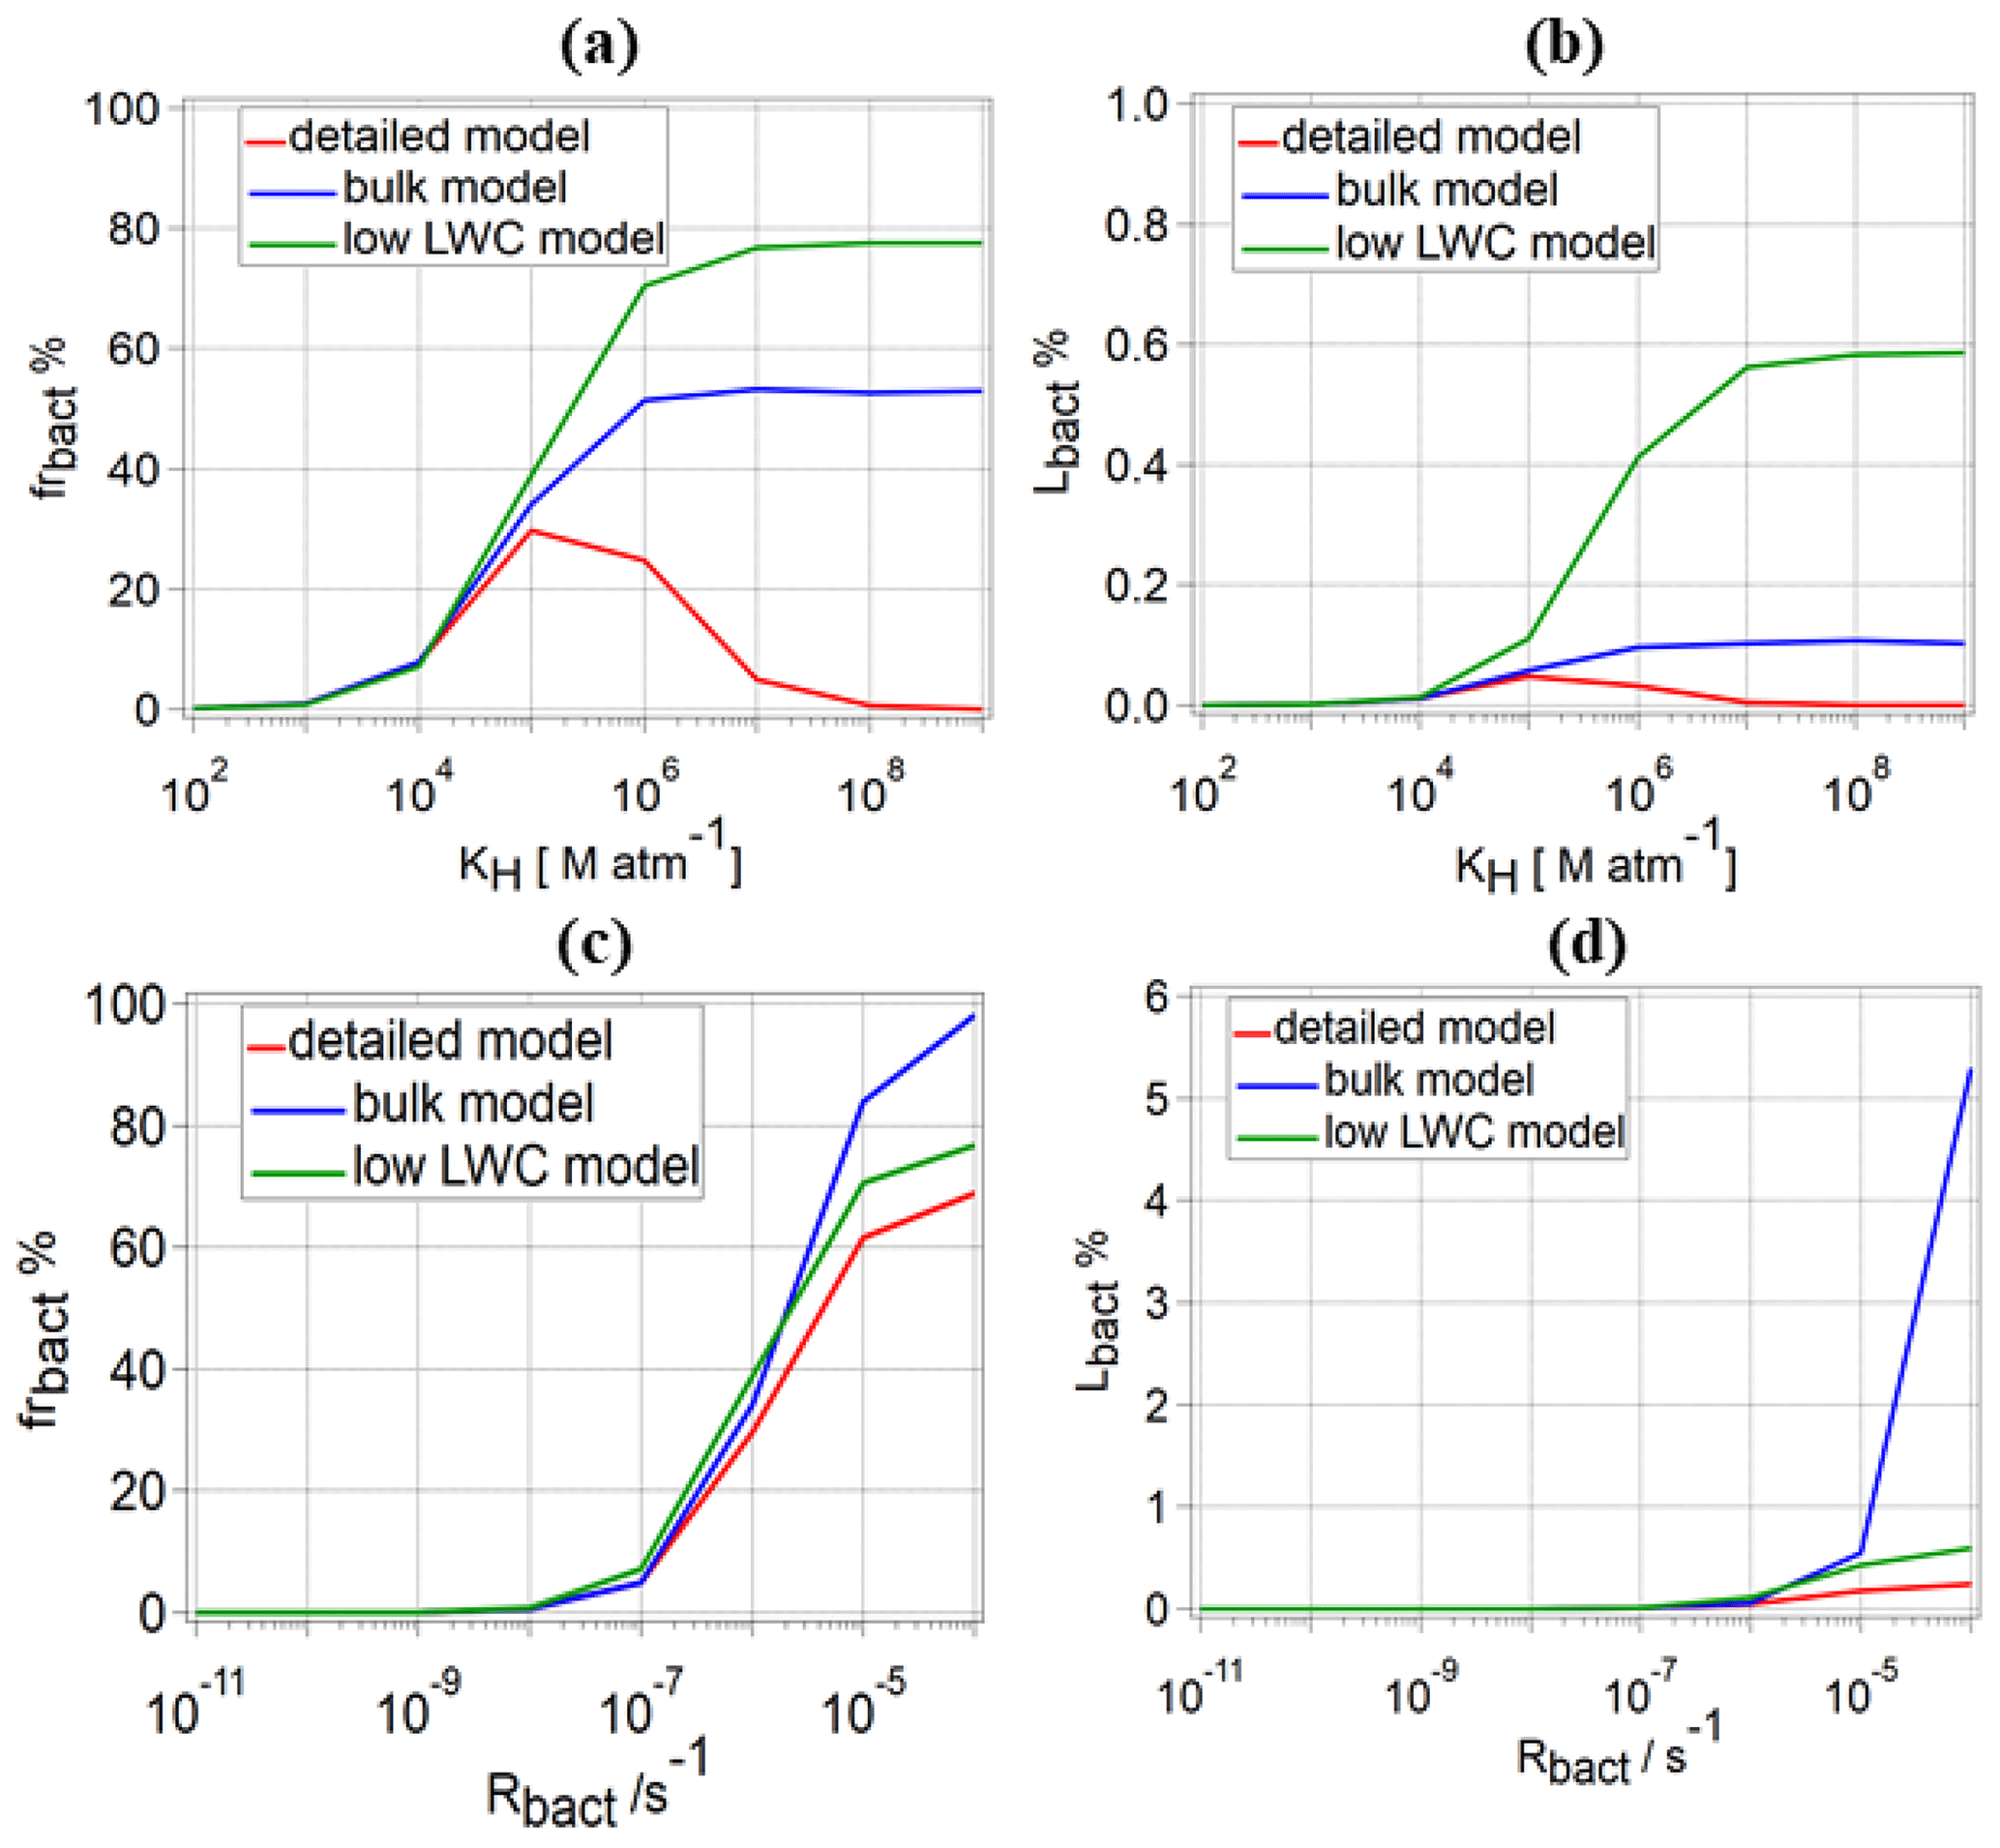
Figure 9Comparison of (a) frbact and (b) Lbact for water-soluble organic gases for three different model approaches: detailed model (red line), bulk approach (blue line), and low-LWC model (green line) for different values of KH, s−1, s−1, and s−1; (c) frbact and (d) Lbact for water-soluble organic gases for the same approaches for different Rbact, one value for KH=105 M atm−1, two values for Rchemaq (10−7 s−1, 10−11 s−1), and s−1.
3.3.2 Comparison of frbact, Lt, and Lbact using simplified model approaches
For water-soluble organic gases, we compare frbact and Lbact for the three model approaches for the full range of KH values, s−1, s−1, and s−1 (Fig. 9a, b). For 102≤KH [M atm−1] ≤104, only a small difference in frbact and Lbact is predicted for a given Rbact because of the low organic fraction in the aqueous phase. For all KH values, frbact is the highest for the low-LWC model approach, because it only considers bacteria-containing droplets and thus neglects the aqueous-phase chemistry in a majority of droplets; therefore, frchemaq is significantly underestimated. Consequently, the competition between biodegradation and chemical degradation takes place only in the bacteria-containing droplets, and frbact is the highest.
For 105≤KH [M atm−1] ≤107, Lbact values based on the bulk and low-LWC models are higher than for the detailed model. For example, for KH=106 M atm−1, Lbact values in the low-LWC model are 4.3 and 12.7 times higher than in the bulk and our detailed models, respectively. For the highest KH (107≤KH [M atm−1] ≤109), the comparison of Lbact for s−1 shows that both simplified model approaches overestimate Lbact by up to several orders of magnitude (Fig. 9b) for KH=108 M atm−1 ( %; %; %). For organics with intermediate or low solubility, the differences between the three models are smaller. Given that we identified biodegradation to be most important for organics with intermediate solubility (Sect. 3.2.2), we compare frbact and Lbact for KH=105 M atm−1, s−1, and s−1 as a function of Rbact (Fig. 9c, d). Similar to the results from the detailed model (Sect. 3.1.2), the low-LWC approach leads to frbact<100 % at t=600 s, because organics are efficiently consumed in the bacteria-containing droplets. However, for the bulk model, frbact is ∼100 % for the highest Rbact, even after 600 s, because bacterial processes take place in all droplets with a reduced efficiency as compared to the processes in the single droplet in the detailed model. Consequently, the concentration of organics in all droplets remains relatively high for extended timescales, even for the highest Rbact. Figure 9d shows the dependence of Lbact between the three models on Rbact: for s−1, Lbact is similar for the detailed and the bulk models ( %), whereas it is twice as high for the low-LWC model ( %). However, for the highest Rbact (10−4 s−1), the highest Lbact is predicted by the bulk approach (∼5 %) which is more than 2 orders of magnitude higher than predicted from the detailed model (∼0.2 %). The similarity of Lbact between the detailed and the bulk models for s−1 is due to the efficient replenishment of organics with intermediate KH (Fig. 5); i.e., the amounts of organics available to bacteria are similar. However, for the highest Rbact, Lbact is much higher for the bulk model, because the consumption of the organics occurs without any kinetic limitations of the various transport processes that are only presented by the detailed model.
For the CCN-derived compounds, we compare frbact and Lbact for different Rbact and two Rchemaq (10−11 and 10−7 s−1) (Fig. S4a, b). For s−1 and s−1, frbact is about 99 % for all three approaches, which is not the case for highest Rchemaq (10−7 s−1) (Fig. S4a). However, for s−1, frbact is ∼0 % (at t=600 s) in the detailed model for both Rchemaq values for the reasons explained in Sect. 3.1.2, whereas frbact∼99 % for the bulk model because of continuous bacterial activity in all droplets. Moreover, frbact and Lbact are always 100 % for the low-LWC model. The role of aqueous-phase chemistry in the multiphase system is predicted to be negligible by the low-LWC approach as it is equally reduced as the LWC, leading to the dominance of the bacterial processes. If we compare Lbact for the bulk (blue line in Fig. S4b) and the detailed models (red line), one finds an increasing discrepancy between the model results: for the lowest Rbact considered here (10−8 s−1) and the two Rchemaq values : 10−11 s−1 and 10−7 s−1, respectively, Lbact for the bulk model is predicted to be ∼9.3 and 11.6 times higher than for the detailed model. For s−1 and the two Rchemaq values, this factor increases to 2.5×10⁴ and 1.3×10⁶. For the highest s−1, Lbact between the bulk and our detailed model after 600 s of simulation cannot be reasonably compared as in the detailed model after <100 s. The CCN-derived compounds in the bacteria-containing droplets are completely depleted for high Rbact; thus, no further consumption occurs (Lbact∼0 %) (Sect. 3.2.3). In the bulk model, the organic consumption by bacteria is predicted to occur continuously as the bacteria could, in theory, consume all organics on “infinite” timescales.
Our model comparison shows that for water-soluble organic gases and CCN-derived compounds, both the bulk and low-LWC models overestimate the importance of biodegradation, i.e., both frbact and Lbact. The biases are highest in the bulk approach for high Rbact and high KH. Also, the comparison shows that the bulk approach leads to wrong conclusions in terms of the importance of biodegradation as a function of the solubility of organics. Our model analysis emphasizes that a detailed model is needed in order to correctly represent the partitioning of water-soluble organic gases between the gas phase and the droplets with and without bacteria.
4.1 Lbact of organic cloud water constituents
Based on our model sensitivity studies discussed in the previous sections and the literature data for cloud water organics summarized in Tables 1 and 2, we assess the importance of biodegradation of these compounds. The contour plots representations in Fig. 10 are the same as in Fig. 7a–c (water-soluble organic gases) and Fig. 8b (CCN-derived compounds). The added symbols correspond to Lbact of the compounds in Table 1 for a single Rbact in each figure panel. Given that Rchemgas only differs by about 2 orders of magnitude for the organics in Table 1, we present the results with s−1. The reasoning for the assumed single Rbact is further discussed in Sect. 4.2.

Figure 10(a–c) Lbact for water-soluble organic gases. The contour plots are identical to Fig. 7a–c. Symbols show combinations of Rchemaq and KH for specific compounds (Table 1). For all simulations, s−1; (a) s−1, (b) s−1, (c) s−1, and (d) Lbact for CCN-derived organics (Table 1). The contour plot is identical to Fig. 8b. Note that Rchemaq and Rbact for succinate (pH=6) are nearly identical to the values for succinic acid (pH=3) and were therefore omitted from the figure.
For the carboxylic acids, two values are shown, i.e., KH(eff) and Rchemaq at pH=3 and 6 (Table 3). Rchemaq at the two pH values are calculated based on the rate constants kchemaq as a function of the proportion of the acidic and anionic forms depending on pH and pKa and the rate constants of the OH reactions for the acid and anion. Similarly, rate constants for other (e.g., NO3) reactions could be derived using data summarized in Table 1.
Table 3kbact [cell L−1] calculated from literature data, theoretical Ccell [cell L−1] based on Eq. (14), and the ratio for three Rbact values (10−8, 10−6 and 10−4 s−1) for water-soluble organic gases and CCN-derived compounds. Values with * show bacterial concentrations that are realistic for cloud water.

As discussed in Sect. 2.2.2 and by Vaïtilingom et al. (2013), the bacterial activity does not show any systematic difference in this pH range; therefore, we only show one Rbact value for each acid. For the lowest Rbact (10−8 s−1), the physicochemical properties (KH(eff), Rchemaq) of the water-soluble organic gases (acetic acid acetate, formic acid formate, formaldehyde, catechol, phenol and methanol) are in the range where Lbact has its minimum values of [%] (Fig. 10a).
For higher Rbact (10−6 s−1, Fig. 10b), which implies higher cell concentration in the cloud, highly soluble compounds, such as acetate and catechol, are in the range where Lbact shows a maximum ( [%] ≤0.06) and less soluble compounds such as formic acid, formate, and formaldehyde (104<KH(eff) [M atm−1] <106) are in the area where [%] ≤0.04. Less soluble compounds (KH(eff)<103 M atm−1), such as acetic acid, phenol, and methanol are in the area of much lower Lbact ( [%] ). As discussed in Sect. 3.2, the maximum value of Lbact increases with higher Rbact and is predicted for compounds with moderate KH(eff) (Fig. 5). Therefore, at the highest assumed Rbact (10−4 s−1), the less soluble compounds formic acid, formaldehyde, and acetic acid are in the range where Lbact has its maximum values (0.3<Lbact [%] <0.4; Fig. 10c).
Figure 10d repeats the full parameter ranges of Rbact and Rchemaq. We discuss Lbact for the CCN-derived compounds (malonic acid, malonate, succinic acid, succinate) for the same Rbact as in Fig. 10a–c: the maximum consumption of CCN-derived compounds by bacteria corresponds to the fraction of the organics present in bacteria-containing droplets (∼0.0065 % in our simulations). Therefore, the predicted Lbact [%] values are very similar for all compounds considered here (malonate malonic acid and succinate succinic acid) and do not differ, independently of Rbact.
4.2 Dependence of Lbact on bacterial cell concentration in cloud water
According to Eq. (3), Rbact is the product of the biodegradation rate constant kbact [cell L−1] (Table 2) and the cell concentration Ccell [cell L−1]. Based on the three Rbact values and the kbact data for the various organics, we calculate Ccell,theoretical that would be needed to reach these Rbact:
The resulting Ccell,theoretical [cell L−1] values are listed in Table 3, together with kbact [cell L−1]. Among the water-soluble organic gases, Ccell,theoretical is predicted to be [cell L−1] ≤107 for acetic acid, formic acid, and phenol, while it is much higher ( [cell L−1] ≤1015) for catechol, formaldehyde, and methanol that have much lower kbact than the former compounds. Typical bacterial cell concentrations in cloud water are in the range of 106–108 cell L−1 (Amato et al., 2007b). Comparing this range to Ccell,theoretical reveals that for several compounds Ccell,theoretical falls into a realistic range (values with * in Table 3); for ambient cell concentrations in cloud water, malonic acid malonate, succinic acid succinate, acetic acid acetate, formic acid formate, cathecol, and phenol might fall into a range where the maximum consumption of organics by biodegradation can be expected, while for formaldehyde and methanol Ccell,theoretical is unrealistic (≥109 cells L−1) based on the available studies of bacterial cell concentrations in cloud water.
4.3 For which organics is biodegradation an efficient sink in the atmosphere?
The maximum value of Lbact is ∼0.7 % in all our simulations, but one should keep in mind that also the predicted Lt is not higher than a few percent (Fig. 6a–c) as we restrict our simulations to the timescale of approximate one cloud cycle. However, in a relative sense, our results allow us to compare the importance of biodegradation to chemical loss for the compounds shown in Fig. 10. To quantify the contribution of bacteria to the total consumption (Lt), we list the ratio in Table 3. Our results clearly show that biodegradation might add significantly to the loss of formic acid formate () and acetic acid acetate () at cell concentrations of and 2×10⁶ cells L−1, respectively. These acids contribute on average ∼68 % to the total dissolved carbon in cloud and fog water (Herckes et al., 2013). Their removal by dry and wet deposition is considered the major loss process in the atmosphere (Khare et al., 1999). However, several studies also suggested that the oxidation of formic acid formate in cloud water may be a net sink (Jacob, 1986). Measurements during different seasons in the Amazon showed that indeed formic and acetic acids have stronger sinks during the wet season (Herlihy et al., 1987). While wet deposition was described to contribute, to a large extent, to the observed removal; chemical and possibly bacterial processes were suggested to act as additional sinks. While the latter was regarded as being inefficient due to long incubation time as observed in lab experiments, more recent experiments suggest that such incubation times are likely not occurring in the atmosphere where bacterial cells are continuously exposed to water and substrates (Amato et al., 2007a; Vaïtilingom et al., 2010, 2013). We conclude that biodegradation of these major cloud water organics may be a significant sink under ambient conditions, possibly even comparable to the loss by chemical reactions. While phenol is not a major contributor to the WSOC content in cloud water (5–95 nM) (Jaber et al., 2020) as compared to 10 µM (Ervens et al., 2003b; Löflund et al., 2002; Sun et al., 2016) for formic and acetic acids, respectively, its degradation processes in the atmosphere might be of interest due to its toxic properties. Overall, our results are in agreement with previous findings that neither chemical processes nor biodegradation are major WSOC losses as compared to deposition (Ervens and Amato, 2020; Fankhauser et al., 2019). However, in order to comprehensively describe the loss processes and timescales of organic degradation and residence timescales in the atmosphere, both chemical and biological processes should be considered. Hence, we suggest that biological processes of organics with properties similar to those of formic and acetic acids and phenol ( [M atm−1] , s−1) should be included in atmospheric multiphase models.
The importance of biodegradation of CCN-derived compounds is limited by the number fraction of cloud droplets that contain bacteria. Malonate malonic acid and succinate succinic acid contribute on average to <5 % to the total organic aerosol mass in ambient particles, e.g., Fu et al. (2013) and Kawamura and Ikushima (1993). Their loss by chemical and biological processes will not affect the total carbon budget to a large extent nor the budget of the individual compounds. These conclusions can be generalized for other CCN-derived aerosol constituents, for which biodegradation has been suggested to occur in the atmosphere. Our assumption of static cloud droplets in the box model is certainly a simplified representation of cloud microphysics. Droplets might experience collision coalescence in clouds, leading to mixing of the cloud water constituents in the resulting larger droplets. However, such processes are unlikely to add significantly to the loss of CCN-derived compounds by bacteria due to (i) the number small fraction of bacteria-containing droplets (0.001–0.0001) and (ii) the limited atmospheric residence time of large droplets which are efficiently removed by precipitation as a function of drop size (Beard and Ochs, 1984).
Our model sensitivity study is the first comprehensive analysis of the importance of biodegradation of organics by bacteria in the atmospheric multiphase system in comparison to chemical loss for wide ranges of chemical and biodegradation kinetic data. We use a box model with drop-size-resolved aqueous-phase chemistry and additional biological processes that only occur in a small number of cloud droplets, in agreement with ambient ratios of cell and droplet concentrations. We neglect the fact that bacterial cells may form agglomerates in the atmosphere; consequently, there might be more than one cell per droplet. This effect could be included in our model by multiplying the biological activity in the respective droplets with the number of cells.
We compare the predicted loss rates of chemical processes in both phases to those of biological processes in the aqueous phase only. In addition to presenting the relative loss rates (frbact, frchem) as in previous studies (Jaber et al., 2020; Vaïtilingom et al., 2010), we discuss the relative amounts of organics (Lt) consumed by chemical (Lchem) and biological processes (Lbact). We find that the relative loss rate of organics by biological processes (frbact) is generally higher for water-soluble organic gases than for CCN-derived compounds. However, the total loss of the organics (Lt) is predicted to not reach any value higher than ∼12 %, because our simulations were restricted to a period of 600 s (approximately the drop lifetime within one cloud cycle); it would be higher if the total particle processing time during multiple cloud cycles in the atmosphere were considered. The contribution of bacteria (Lbact) to the total loss is predicted to be highest for water-soluble organic gases with intermediate solubility ( [M atm−1] ). This can be explained by the replenishment of these compounds in the bacteria-containing droplets upon uptake from the gas phase and evaporation from the bacteria-free droplets, in which less efficient consumption of the organics occurs. Less soluble organics (KH<104 M atm−1) that partition to a smaller extent (<1 %) to the aqueous phase are mostly consumed by chemical processes in the gas phase; more soluble compounds (KH>106 M atm−1) are predominately partitioned to the aqueous phase. Thus, the evaporation to the gas phase and consequently the redistribution from the bacteria-free to the bacteria-containing droplets is kinetically more limited and less efficient. The ratio of the consumption of water-soluble organic gases by bacteria to the total loss () might be as high as 0.7 for high biological activity and cell concentrations (∼108 cells L−1). These values suggest that biological processes might add significantly (>70 %) to the loss processes in the atmospheric multiphase system for organics with intermediate solubility such as formic acid formate, acetic acid acetate, or phenol. For CCN-derived compounds, the amount of organics consumed by bacteria is restricted to the fraction of the organic species dissolved in bacteria-containing droplets (∼0.001 %) as no efficient replenishment from the gas phase or from the other droplets occurs. Thus, biodegradation of CCN-derived compounds does not significantly affect their atmospheric budget. Recent experiments of airborne bacteria suggested that metabolic rates are a function of substrate availability in oligotrophic media such as cloud droplets (Krumins et al., 2014b). In the case of CCN-derived organics or those that are inefficiently replenished by uptake from the gas phase, substrate limitation might result in lower biodegradation rates. Currently, no data are available on the absolute changes in kbact at different levels of substrate availability and/or on the timescales during which kbact might adjust to such conditions. In addition, the biodegradation rates may be affected under highly acidic conditions. Some studies demonstrated that some bacteria can develop an acid resistance to survive under acidic conditions (Lu et al., 2013). However, these strategies do not necessarily imply that the bacteria maintain the same biodegradation activities at high acidity, but they allow for survival of the cells in the atmosphere. It can be expected that internal buffering of bacterial cells allows them to maintain their metabolic activity over wide pH ranges (∼3 to 6) as found in cloud water. Therefore, we do not consider a potential pH dependency of biodegradation rates in our model studies.
In addition to our detailed model with a realistic bacterial cell distribution within a cloud droplet population, we apply simpler model approaches: (i) similar to many chemical model studies, bacterial cells are distributed equally in all droplets (“bulk approach”), resulting in cell concentrations of 10−5 cells per droplet, which is clearly an unphysical assumption for intact bacterial cells. (ii) A multiphase system with only cloud droplets which contain bacteria resulting in a liquid water content of vol vol as compared to vol vol in clouds (“low-LWC approach”) is applied. Comparing Lbact predicted from these approaches to results of our detailed model shows that all approaches agree in predicting Lbact for organics of low solubility (KH(eff)<104 M atm−1). However, for such species the importance of biodegradation is low due to their inefficient partitioning to the aqueous phase. The bulk approach increasingly overestimates Lbact of organics with higher KH; the greatest discrepancy is predicted for highly soluble compounds (KH(eff)>106 M atm−1) as the bulk approach does not take into account the kinetic limitation due to the organic species redistribution between the bacteria-free and bacteria-containing droplets. As the bulk approach implies organics in all droplets, it does not allow for limiting the organic species consumption by biodegradation. Predictions of the relative role of biodegradation as compared to chemical processes by the low-LWC approach are biased high, because the loss due to aqueous-phase processes is only considered in an unrealistically small fraction of droplets.
The current data sets for microbial rates of organic compounds are limited to very few compounds. Our model sensitivity study shows that biodegradation by bacteria in clouds is most efficient for compounds with intermediate (effective) Henry's law constants (∼104 M atm−1 M atm−1) as found for common cloud water constituents such as formic acid formate and acetic acid acetate but also for less abundant species such as phenol, largely independent of their chemical reactivity. Our framework allows us to estimate the potential importance of biodegradation of organics in comparison to chemical processes. It also gives guidance to future lab and model studies to further explore the role of biodegradation of specific organics in the multiphase system.
All model input data are summarized in Tables S1–S3 in the Supplement.
The supplement related to this article is available online at: https://doi.org/10.5194/acp-21-3123-2021-supplement.
AK and BE designed and carried out the model studies and wrote the article. MZ, PA, and AMD contributed with fruitful discussions and gave constructive feedback on the article.
The authors declare that they have no conflict of interest.
This research has been supported by the French National Research Agency (ANR) (grant no. ANR-17-MPGA-0013).
This paper was edited by Susannah Burrows and reviewed by two anonymous referees.
Allou, L., El Maimouni, L., and Le Calvé, S.: Henry's law constant measurements for formaldehyde and benzaldehyde as a function of temperature and water composition, Atmos. Environ., 45, 2991–2998, https://doi.org/10.1016/j.atmosenv.2010.05.044, 2011.
Amato, P., Demeer, F., Melaouhi, A., Fontanella, S., Martin-Biesse, A.-S., Sancelme, M., Laj, P., and Delort, A.-M.: A fate for organic acids, formaldehyde and methanol in cloud water: their biotransformation by micro-organisms, Atmos. Chem. Phys., 7, 4159–4169, https://doi.org/10.5194/acp-7-4159-2007, 2007a.
Amato, P., Parazols, M., Sancelme, M., Mailhot, G., Laj, P., and Delort, A. M.: An important oceanic source of micro-organisms for cloud water at the Puy de Dôme (France), Atmos. Environ., 41, 8253–8263, https://doi.org/10.1016/j.atmosenv.2007.06.022, 2007b.
Amato, P., Parazols, M., Sancelme, M., Laj, P., Mailhot, G., and Delort, A. M.: Microorganisms isolated from the water phase of tropospheric clouds at the Puy de Dôme: Major groups and growth abilities at low temperatures, FEMS Microbiol. Ecol., 59, 242–254, https://doi.org/10.1111/j.1574-6941.2006.00199.x, 2007c.
Amato, P., Besaury, L., Joly, M., Penaud, B., Deguillaume, L., and Delort, A. M.: Metatranscriptomic exploration of microbial functioning in clouds, Sci. Rep.-UK, 9, 1–12, https://doi.org/10.1038/s41598-019-41032-4, 2019.
Anglada, J. M.: Complex mechanism of the gas phase reaction between formic acid and hydroxyl radical. Proton coupled electron transfer versus radical hydrogen abstraction mechanisms, J. Am. Chem. Soc., 126, 9809–9820, https://doi.org/10.1021/ja0481169, 2004.
Arakaki, T., Anastasio, C., Kuroki, Y., Nakajima, H., Okada, K., Kotani, Y., Handa, D., Azechi, S., Kimura, T., Tsuhako, A., and Miyagi, Y.: A general scavenging rate constant for reaction of hydroxyl radical with organic carbon in atmospheric waters, Environ. Sci. Technol., 47, 8196–8203, https://doi.org/10.1021/es401927b, 2013.
Ariya, P. A., Nepotchatykh, O., Ignatova, O., and Amyot, M.: Microbiological degradation of atmospheric organic compounds, Geophys. Res. Lett., 29, 34–41, https://doi.org/10.1029/2002gl015637, 2002.
Aumont, B., Madronich, S., Bey, I., and Tyndall, G.: Contribution of Secondary VOC to the Composition of Aqueous Atmospheric Particles: A Modeling Approach, J. Atmos. Chem., 35, 59–75, https://doi.org/10.1023/a:1006243509840, 2000.
Beard, K. V. and Ochs, H. T.: Collection and coalescence efficiencies for accretion, J. Geophys. Res., 89, 7165–7169, https://doi.org/10.1029/JD089iD05p07165, 1984.
Butkovskaya, N. I., Kukui, A., Pouvesle, N., and Le Bras, G.: Rate constant and mechanism of the reaction of OH radicals with acetic acid in the temperature range of 229–300 K, J. Phys. Chem. A, 108, 7021–7026, https://doi.org/10.1021/jp048444v, 2004.
Cabelli, D. E. and Bielski, B. H.: pulse radiolysis study of some dicarboxylic acids of the citric acid cycle. The kinetics and spectral properties of the free radicals formed by reactions with the HO radical, Z. Naturforsch. B, 40, 1731–1737, https://doi.org/10.1515/znb-1985-1223, 1985.
Cantrell, C. A., Shetter, R. E., Calvert, J. G., Eisele, F. L., and Tanner, D. J.: Some considerations of the origin of nighttime peroxy radicals observed in MLOPEX 2c, J. Geophys. Res.-Atmos., 102, 15899–15913, https://doi.org/10.1029/97jd01120, 1997.
Decesari, S., Facchini, M. C., Fuzzi, S., and Tagliavini, E.: Characterization of water-soluble organic compounds in atmospheric aerosol: A new approach, J. Geophys. Res.-Atmos., 105, 1481–1489, https://doi.org/10.1029/1999JD900950, 2000.
Deguillaume, L., Charbouillot, T., Joly, M., Vaïtilingom, M., Parazols, M., Marinoni, A., Amato, P., Delort, A.-M., Vinatier, V., Flossmann, A., Chaumerliac, N., Pichon, J. M., Houdier, S., Laj, P., Sellegri, K., Colomb, A., Brigante, M., and Mailhot, G.: Classification of clouds sampled at the puy de Dôme (France) based on 10 yr of monitoring of their physicochemical properties, Atmos. Chem. Phys., 14, 1485–1506, https://doi.org/10.5194/acp-14-1485-2014 2014.
Delort, A.-M., Vaïtilingom, M., Amato, P., Sancelme, M., Parazols, M., Mailhot, G., Laj, P., and Deguillaume, L.: A short overview of the microbial population in clouds: Potential roles in atmospheric chemistry and nucleation processes, Atmos. Res., 98, 249–260, https://doi.org/10.1016/j.atmosres.2010.07.004, 2010.
Delort, A.-M., Deguillaume, L., Renard, P., Vinatier, V., Canet, I., Vaïtilingom, M., and Chaumerliac, N.: Impacts on Cloud Chemistry, in: Microbiology of Aerosols, edited by: Delort, A. M. and Amato, P., John Wiley & Sons, Inc., Hoboken, NJ, 221–248, https://doi.org/10.1002/9781119132318.ch3b, 2017.
Ervens, B.: Modeling the Processing of Aerosol and Trace Gases in Clouds and Fogs, Chem. Rev., 115, 4157–4198, https://doi.org/10.1021/cr5005887, 2015.
Ervens, B. and Amato, P.: The global impact of bacterial processes on carbon mass, Atmos. Chem. Phys., 20, 1777–1794, https://doi.org/10.5194/acp-20-1777-2020, 2020.
Ervens, B., George, C., Williams, J. E., Buxton, G. V., Salmon, G. A., Bydder, M., Wilkinson, F., Dentener, F., Mirabel, P., Wolke, R., and Herrmann, H.: CAPRAM 2.4 (MODAC mechanism): An extended and condensed tropospheric aqueous phase mechanism and its application, J. Geophys. Res.-Atmos., 108, 4426, https://doi.org/10.1029/2002jd002202, 2003a.
Ervens, B., Herckes, P., Feingold, G., Lee, T., Collett, J. L., and Kreidenweis, S. M.: On the drop-size dependence of organic acid and formaldehyde concentrations in fog, J. Atmos. Chem., 46, 239–269, https://doi.org/10.1023/A:1026393805907, 2003b.
Ervens, B., Gligorovski, S. and Herrmann, H.: Temperature-dependent rate constants for hydroxyl radical reactions with organic compounds in aqueous solutions, Phys. Chem. Chem. Phys., 5, 1811–1824, https://doi.org/10.1039/b300072a, 2003c.
Ervens, B., Feingold, G., Frost, G. J., and Kreidenweis, S. M.: A modeling of study of aqueous production of dicarboxylic acids: 1. Chemical pathways and speciated organic mass production, J. Geophys. Res., 109, D15205, https://doi.org/10.1029/2003JD004387, 2004.
Ervens, B., Carlton, A. G., Turpin, B. J., Altieri, K. E., Kreidenweis, S. M., and Feingold, G.: Secondary organic aerosol yields from cloud-processing of isoprene oxidation products, Geophys. Res. Lett., 35, L02816, https://doi.org/10.1029/2007GL031828, 2008.
Exner, M., Herrmann, H., and Zellner, R.: Rate constants for the reactions of the NO3 radical with and in aqueous solution between 278 and 328 K, J. Atmos. Chem., 18, 359–378, https://doi.org/10.1007/BF00712451, 1994.
Fankhauser, A. M., Antonio, D. D., Krell, A., Alston, S. J., Banta, S., and McNeill, V. F.: Constraining the Impact of Bacteria on the Aqueous Atmospheric Chemistry of Small Organic Compounds, ACS Earth Sp. Chem., 3, 1485–1491, https://doi.org/10.1021/acsearthspacechem.9b00054, 2019.
Fu, P., Kawamura, K., Usukura, K., and Miura, K.: Dicarboxylic acids, ketocarboxylic acids and glyoxal in the marine aerosols collected during a round-the-world cruise, Mar. Chem., 148, 22–32, https://doi.org/10.1016/j.marchem.2012.11.002, 2013.
Gaillard De Sémainville, P., Hoffmann, D., George, C. and Herrmann, H.: Study of nitrate radical (NO3) reactions with carbonyls and acids in aqueous solution as a function of temperature, Phys. Chem. Chem. Phys., 9, 958–968, https://doi.org/10.1039/b613956f, 2007.
Gao, Y., Lee, S. C., Huang, Y., Chow, J. C., and Watson, J. G.: Chemical characterization and source apportionment of size-resolved particles in Hong Kong sub-urban area, Atmos. Res., 170, 112–122, https://doi.org/10.1016/j.atmosres.2015.11.015, 2016.
Guan, N. and Liu, L.: Microbial response to acid stress: mechanisms and applications, Appl. Microbiol. Biotechnol., 51–65, https://doi.org/10.1007/s00253-019-10226-1, 2020.
Haddrell, A. E. and Thomas, R. J.: Aerobiology: Experimental considerations, observations, and future tools, Appl. Environ. Microbiol., 83, e00809-17, https://doi.org/10.1128/AEM.00809-17, 2017.
Herckes, P., Valsaraj, K. T., and Collett, J. L.: A review of observations of organic matter in fogs and clouds: Origin, processing and fate, Atmos. Res., 132–133, 434–449, https://doi.org/10.1016/j.atmosres.2013.06.005, 2013.
Herlihy, L. J., Galloway, J. N., and Mills, A. L.: Bacterial utilization of formic and acetic acid in rainwater, Atmos. Environ., 21, 2397–2402, https://doi.org/10.1016/0004-6981(87)90374-X, 1987.
Herrmann, H.: Kinetics of Aqueous Phase Reactions Relevant for Atmospheric Chemistry, Chem. Rev., 103, 4691–4716, https://doi.org/10.1021/cr020658q, 2003.
Hoffmann, E. H., Tilgner, A., Wolke, R., Böge, O., Walter, A., and Herrmann, H.: Oxidation of substituted aromatic hydrocarbons in the tropospheric aqueous phase: Kinetic mechanism development and modelling, Phys. Chem. Chem. Phys., 20, 10960–10977, https://doi.org/10.1039/c7cp08576a, 2018.
Hu, W., Niu, H., Murata, K., Wu, Z., Hu, M., Kojima, T., and Zhang, D.: Bacteria in atmospheric waters: Detection, characteristics and implications, Atmos. Environ., 179, 201–221, https://doi.org/10.1016/j.atmosenv.2018.02.026, 2018.
Husárová, S., Vaïtilingom, M., Deguillaume, L., Traikia, M., Vinatier, V., Sancelme, M., Amato, P., Matulová, M., and Delort, A. M.: Biotransformation of methanol and formaldehyde by bacteria isolated from clouds. Comparison with radical chemistry, Atmos. Environ., 45, 6093–6102, https://doi.org/10.1016/j.atmosenv.2011.06.035, 2011.
Jaber, S., Lallement, A., Sancelme, M., Leremboure, M., Mailhot, G., Ervens, B., and Delort, A.-M.: Biodegradation of phenol and catechol in cloud water: comparison to chemical oxidation in the atmospheric multiphase system, Atmos. Chem. Phys., 20, 4987–4997, https://doi.org/10.5194/acp-20-4987-2020, 2020.
Jacob, D. J.: Chemistry of OH in remote clouds and its role in the production of formic acid and peroxymonosulfate, J. Geophys. Res., 91, 9807–9826, https://doi.org/10.1029/jd091id09p09807, 1986.
Johnson, B. J., Betterton, E. A., and Craig, D.: Henry's Law coefficients of formic and acetic acids, J. Atmos. Chem., 24, 113–119, https://doi.org/10.1007/BF00162406, 1996.
Kaprelyants, A. S. and Kell, D. B.: Dormancy in stationary-phase cultures of Micrococcus luteus: Flow cytometric analysis of starvation and resuscitation, Appl. Environ. Microbiol., 59, 3187–3196, https://doi.org/10.1128/aem.59.10.3187-3196.1993, 1993.
Kawamura, K. and Ikushima, K.: Seasonal Changes in the Distribution of Dicarboxylic Acids in the Urban Atmosphere, Environ. Sci. Technol., 27, 2227–2235, https://doi.org/10.1021/es00047a033, 1993.
Khan, M. A. H., Ashfold, M. J., Nickless, G., Martin, D., Watson, L. A., Hamer, P. D., Wayne, R. P., Canosa-Mas, C. E., and Shallcross, D. E.: Night-time NO3 and OH radical concentrations in the United Kingdom inferred from hydrocarbon measurements, Atmos. Sci. Lett., 9, 140–146, https://doi.org/10.1002/asl.175, 2008.
Khare, P., Kumar, N., Kumari, K. M., and Srivastava, S. S.: Atmospheric formic and acetic acids: An overview, Rev. Geophys., 37, 227–248, https://doi.org/10.1029/1998RG900005, 1999.
Krumins, V., Mainelis, G., Kerkhof, L. J., and Fennell, D. E.: Substrate-Dependent rRNA Production in an Airborne Bacterium, Environ. Sci. Technol. Lett., 1, 376–381, https://doi.org/10.1021/ez500245y, 2014a.
Krumins, V., Mainelis, G., Kerkhof, L. J., and Fennell, D. E.: Substrate-Dependent rRNA Production in an Airborne Bacterium, Environ. Sci. Technol. Lett., 1, 376–381, https://doi.org/10.1021/ez500245y, 2014b.
Lelieveld, J. and Crutzen, P. J.: The role of clouds in tropospheric photochemistry, J. Atmos. Chem., 12, 229–267, https://doi.org/10.1007/BF00048075, 1991.
Löflund, M., Kasper-Giebl, A., Schuster, B., Giebl, H., Hitzenberger, R., and Puxbaum, H.: Formic, acetic, oxalic, malonic and succinic acid concentrations and their contribution to organic carbon in cloud water, Atmos. Environ., 36, 1553–1558, https://doi.org/10.1016/S1352-2310(01)00573-8, 2002.
Lu, P., Ma, D., Chen, Y., Guo, Y., Chen, G. Q., Deng, H., and Shi, Y.: L-glutamine provides acid resistance for Escherichia coli through enzymatic release of ammonia, Cell Res., 23, 635–644, https://doi.org/10.1038/cr.2013.13, 2013.
Madronich, S. and Calvert, J. G.: The NCAR Master Mechanism of the Gas Phase Chemistry – Version 2.0, No. NCAR/TN-333+STR, University Corporation for Atmospheric Research, https://doi.org/doi10.5065/D6HD7SKH, 1989.
Mezyk, S. P., Cullen, T. D., Rickman, K. A., and Mincher, B. J.: The Reactivity of the Nitrate Radical (NO3) in Aqueous and Organic Solutions, Int. J. Chem. Kinet., 49, 635–642, https://doi.org/10.1002/kin.21103, 2017.
Mouchel-Vallon, C., Deguillaume, L., Monod, A., Perroux, H., Rose, C., Ghigo, G., Long, Y., Leriche, M., Aumont, B., Patryl, L., Armand, P., and Chaumerliac, N.: CLEPS 1.0: A new protocol for cloud aqueous phase oxidation of VOC mechanisms, Geosci. Model Dev., 10, 1339–1362, https://doi.org/10.5194/gmd-10-1339-2017, 2017.
Pillar, E. A., Camm, R. C., and Guzman, M. I.: Catechol oxidation by ozone and hydroxyl radicals at the air-water interface, Environ. Sci. Technol., 48, 14352–14360, https://doi.org/10.1021/es504094x, 2014.
Razika, B., Abbes, B., Messaoud, C., and Soufi, K.: Phenol and Benzoic Acid Degradation by Pseudomonas aeruginosa, J. Water Resour. Prot., 2, 1–4, https://doi.org/10.4236/jwarp.2010.29092, 2010.
Sander, R.: Compilation of Henry's law constants (version 4.0) for water as solvent, Atmos. Chem. Phys., 15, 4399–4981, https://doi.org/10.5194/acp-15-4399-2015, 2015.
Sattler, B., Puxbaum, H., and Psenner, R.: Bacterial growth in supercooled cloud droplets, Geophys. Res. Lett., 28, 239–242, https://doi.org/10.1029/2000GL011684, 2001.
Schwartz, S. E.: Mass-Transport Considerations Pertinent to Aqueous Phase Reactions of Gases in Liquid-Water Clouds, in: Chemistry of Multiphase Atmospheric Systems, edited by: Jaeschke, W., Springer, Berlin, Heidelberg, NATO ASI Series, Series G: Ecological Sciences, vol 6., https://doi.org/10.1007/978-3-642-70627-1_16, 1986.
Seinfeld, J. H. and Pandis, S. N.: Atmospheric Chemistry and Physics, John Wiley & Sons, New York, 1998.
Sun, X., Wang, Y., Li, H., Yang, X., Sun, L., Wang, X., Wang, T., and Wang, W.: Organic acids in cloud water and rainwater at a mountain site in acid rain areas of South China, Environ. Sci. Pollut. Res., 23, 9529–9539, https://doi.org/10.1007/s11356-016-6038-1, 2016.
Tilgner, A., Bräuer, P., Wolke, R., and Herrmann, H.: Modelling multiphase chemistry in deliquescent aerosols and clouds using CAPRAM3.0i, J. Atmos. Chem., 70, 221–256, https://doi.org/10.1007/s10874-013-9267-4, 2013.
Vaïtilingom, M., Amato, P., Sancelme, M., Laj, P., Leriche, M., and Delort, A. M.: Contribution of microbial activity to carbon chemistry in clouds, Appl. Environ. Microbiol., 76, 23–29, https://doi.org/10.1128/AEM.01127-09, 2010.
Vaïtilingom, M., Charbouillot, T., Deguillaume, L., Maisonobe, R., Parazols, M., Amato, P., Sancelme, M., and Delort, A.-M.: Atmospheric chemistry of carboxylic acids: microbial implication versus photochemistry, Atmos. Chem. Phys., 11, 8721–8733, https://doi.org/10.5194/acp-11-8721-2011, 2011.
Vaïtilingom, M., Deguillaume, L., Vinatier, V., Sancelme, M., Amato, P., Chaumerliac, N., and Delort, A.-M.: Potential impact of microbial activity on the oxidant capacity and organic carbon budget in clouds, P. Natl. Acad. Sci. USA, 110, 559–564, https://doi.org/10.1073/pnas.1205743110, 2013.
Woo, J. L. and McNeill, V. F.: simpleGAMMA v1.0 – a reduced model of secondary organic aerosol formation in the aqueous aerosol phase (aaSOA), Geosci. Model Dev., 8, 1821–1829, https://doi.org/10.5194/gmd-8-1821-2015, 2015.
Zhang, M., Khaled, A., Amato, P., Delort, A.-M., and Ervens, B.: The effect of biological particles and their ageing processes on aerosol radiative properties: Model sensitivity studies, Atmos. Chem. Phys. Discuss. [preprint], https://doi.org/10.5194/acp-2020-781, in review, 2020.