the Creative Commons Attribution 4.0 License.
the Creative Commons Attribution 4.0 License.
 | 25 Feb 2021
Aqueous-phase behavior of glyoxal and methylglyoxal observed with carbon and oxygen K-edge X-ray absorption spectroscopy
Georgia Michailoudi
Jack J. Lin
Hayato Yuzawa
Masanari Nagasaka
Marko Huttula
Nobuhiro Kosugi
Theo Kurtén
Minna Patanen
Glyoxal (CHOCHO) and methylglyoxal (CH3C(O)CHO) are well-known components of atmospheric particles and their properties can impact atmospheric chemistry and cloud formation. To get information on their hydration states in aqueous solutions and how they are affected by the addition of inorganic salts (sodium chloride (NaCl) and sodium sulfate (Na2SO4)), we applied carbon and oxygen K-edge X-ray absorption spectroscopy (XAS) in transmission mode. The recorded C K-edge spectra show that glyoxal is completely hydrated in the dilute aqueous solutions, in line with previous studies. For methylglyoxal, supported by quantum chemical calculations we identified not only C–H, C=O and C–OH bonds, but also fingerprints of C–OH(CH2) and C=C bonds. The relatively low intensity of C=O transitions implies that the monohydrated form of methylglyoxal is not favored in the solutions. Instead, the spectral intensity is stronger in regions where products of aldol condensation and enol tautomers of the monohydrates contribute. The addition of salts was found to introduce only very minor changes to absorption energies and relative intensities of the observed absorption features, indicating that XAS in the near-edge region is not very sensitive to these intermolecular organic–inorganic interactions at the studied concentrations. The identified structures of glyoxal and methylglyoxal in an aqueous environment support the uptake of these compounds to the aerosol phase in the presence of water and their contribution to secondary organic aerosol formation.
- Article
(1812 KB) - Full-text XML
-
Supplement
(454 KB) - BibTeX
- EndNote


Aerosol particles in the atmosphere have several important effects on atmospheric chemistry and climate. They interact with solar radiation and participate in cloud formation. The lack of firm constraints on aerosol–cloud interactions translates into the largest single source of uncertainty in predictions of future climate (IPCC, 2013). Some of the processes which contribute prominently to this uncertainty are the formation of secondary organic aerosol (SOA) from volatile precursors in the atmosphere and the aqueous-phase interactions of organic compounds impacting aerosol hygroscopic growth and cloud formation potential. Previous work has revealed a large potential impact of interactions between organic and inorganic compounds on their gas–particle partitioning and water uptake properties (Kurtén et al., 2014; Hansen et al., 2015). However, such interactions, including salting in and out effects, i.e., non-ideal solute–solute interactions in solution phase, are currently poorly described on the molecular level and have been characterized theoretically or experimentally only for a limited number of atmospherically relevant systems. Salting in and out effects refer here to the increase or decrease in the solubility of the organic solute (glyoxal and methylglyoxal) in water due to the presence of a co-solute, in this case an inorganic salt (NaCl, Na2SO4), in the solution.
Glyoxal (CHOCHO) and methylglyoxal (CH3C(O)CHO) are two α-dicarbonyl compounds which are produced for example in the gas-phase oxidation of isoprene (Stavrakou et al., 2009), and they can be lost in the gas phase by photochemical reactions (Chen et al., 2000) and oxidation by OH radical (Tyndall et al., 1995). These small molecules have high pure-compound saturation vapor pressures but are nevertheless known to make significant contributions to SOA formation, being comparable to the contribution of more chemically complex compounds (Fu et al., 2008; Stavrakou et al., 2009). A key to the atmospheric importance of α-dicarbonyls is their versatile reactivity in the condensed phase. Previous studies have suggested reaction partners for irreversible condensed-phase reactions of glyoxal (and to a lesser extent, methylglyoxal) under several experimental conditions (photochemistry, different particle size and amount of water) including organic and inorganic acids (Surratt et al., 2007), amines (De Haan et al., 2009b; Kliegman and Barnes, 1970), ammonia (Nozière et al., 2009; Galloway et al., 2009) and amino acids (De Haan et al., 2009a). Aqueous-phase glyoxal and methylglyoxal can be involved in two-step hydration reactions as shown in Fig. 1 (Malik and Joens, 2000; Kua et al., 2008; Nemet et al., 2004; Krizner et al., 2009; Kroll et al., 2017). Glyoxal has two aldehyde groups, which can yield diol and tetrol species upon uptake of water. Methylglyoxal has two carbonyl groups, one aldehyde and one ketone. For glyoxal, both hydration steps have large equilibrium constants (Table 1), while for methylglyoxal, the hydration constant Khyd1 of the first step in the aldehyde group (Fig. 1) is very large but the second step of the hydration in the ketone group has a lower value (Nemet et al., 2004; Krizner et al., 2009). Hydrate formation has been reported to increase the effective Henry's law constant of glyoxal by almost 5 orders of magnitude (Ervens and Volkamer, 2010; Wasa and Musha, 1970), and methylglyoxal is likely to display similar behavior with a calculated equilibrium constant for the monohydrate formation reaction above 1000. Upon hydration, glyoxal and methylglyoxal can also react with themselves to form dimers and oligomers (Ervens and Volkamer, 2010; Liggo et al., 2005; Kroll et al., 2005; Wang et al., 2010; Galloway et al., 2009). Both the hydrates and dimers or oligomers are covalently bound species, not hydrogen-bonded clusters.
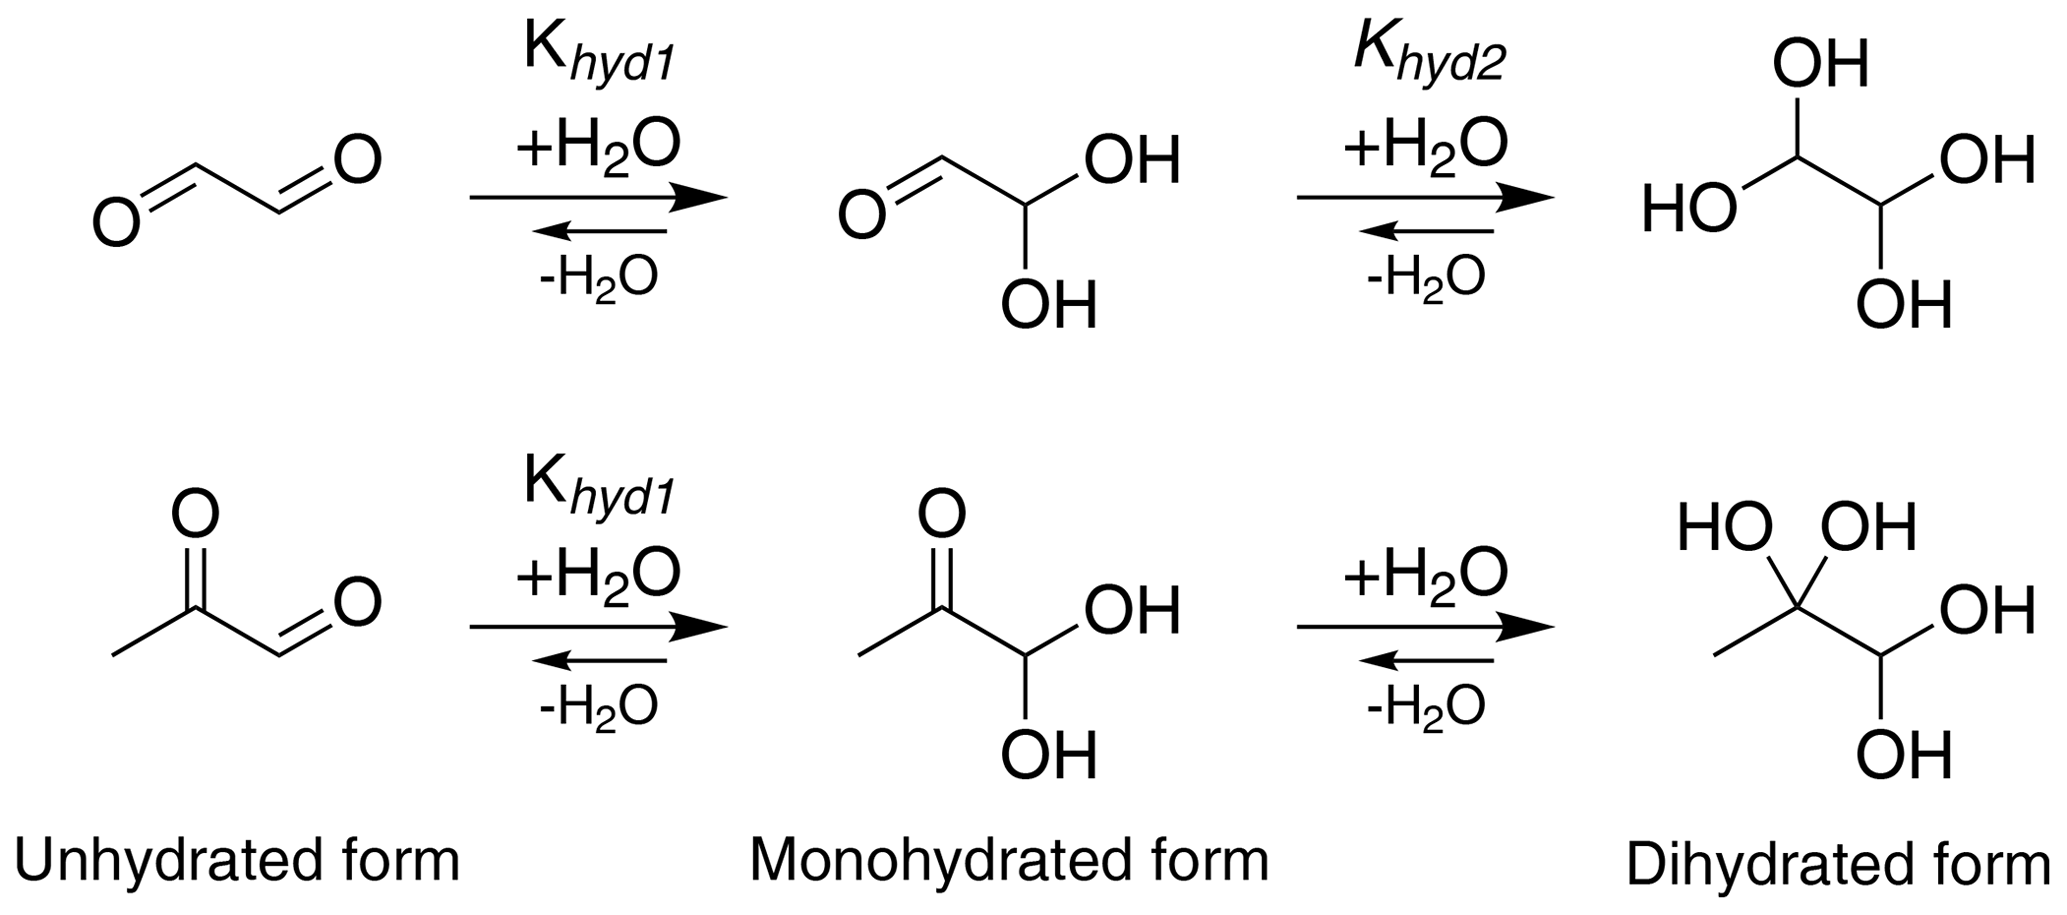
Figure 1Formation of mono- and dihydrated glyoxal (first row) and methylglyoxal (second row). The values of equilibrium constants, Khyd1 and Khyd2, are shown in Table 1.
Table 1Properties of the studied organic and inorganic compounds, including organic hydrates: molecular formula, aqueous solubility (Csol [g/100 g]) at 25 ∘C and equilibrium constant (K) for each hydration step. To the best of our knowledge, the equilibrium constant for the second hydration step of methylglyoxal, Khyd2, is not available in the literature.
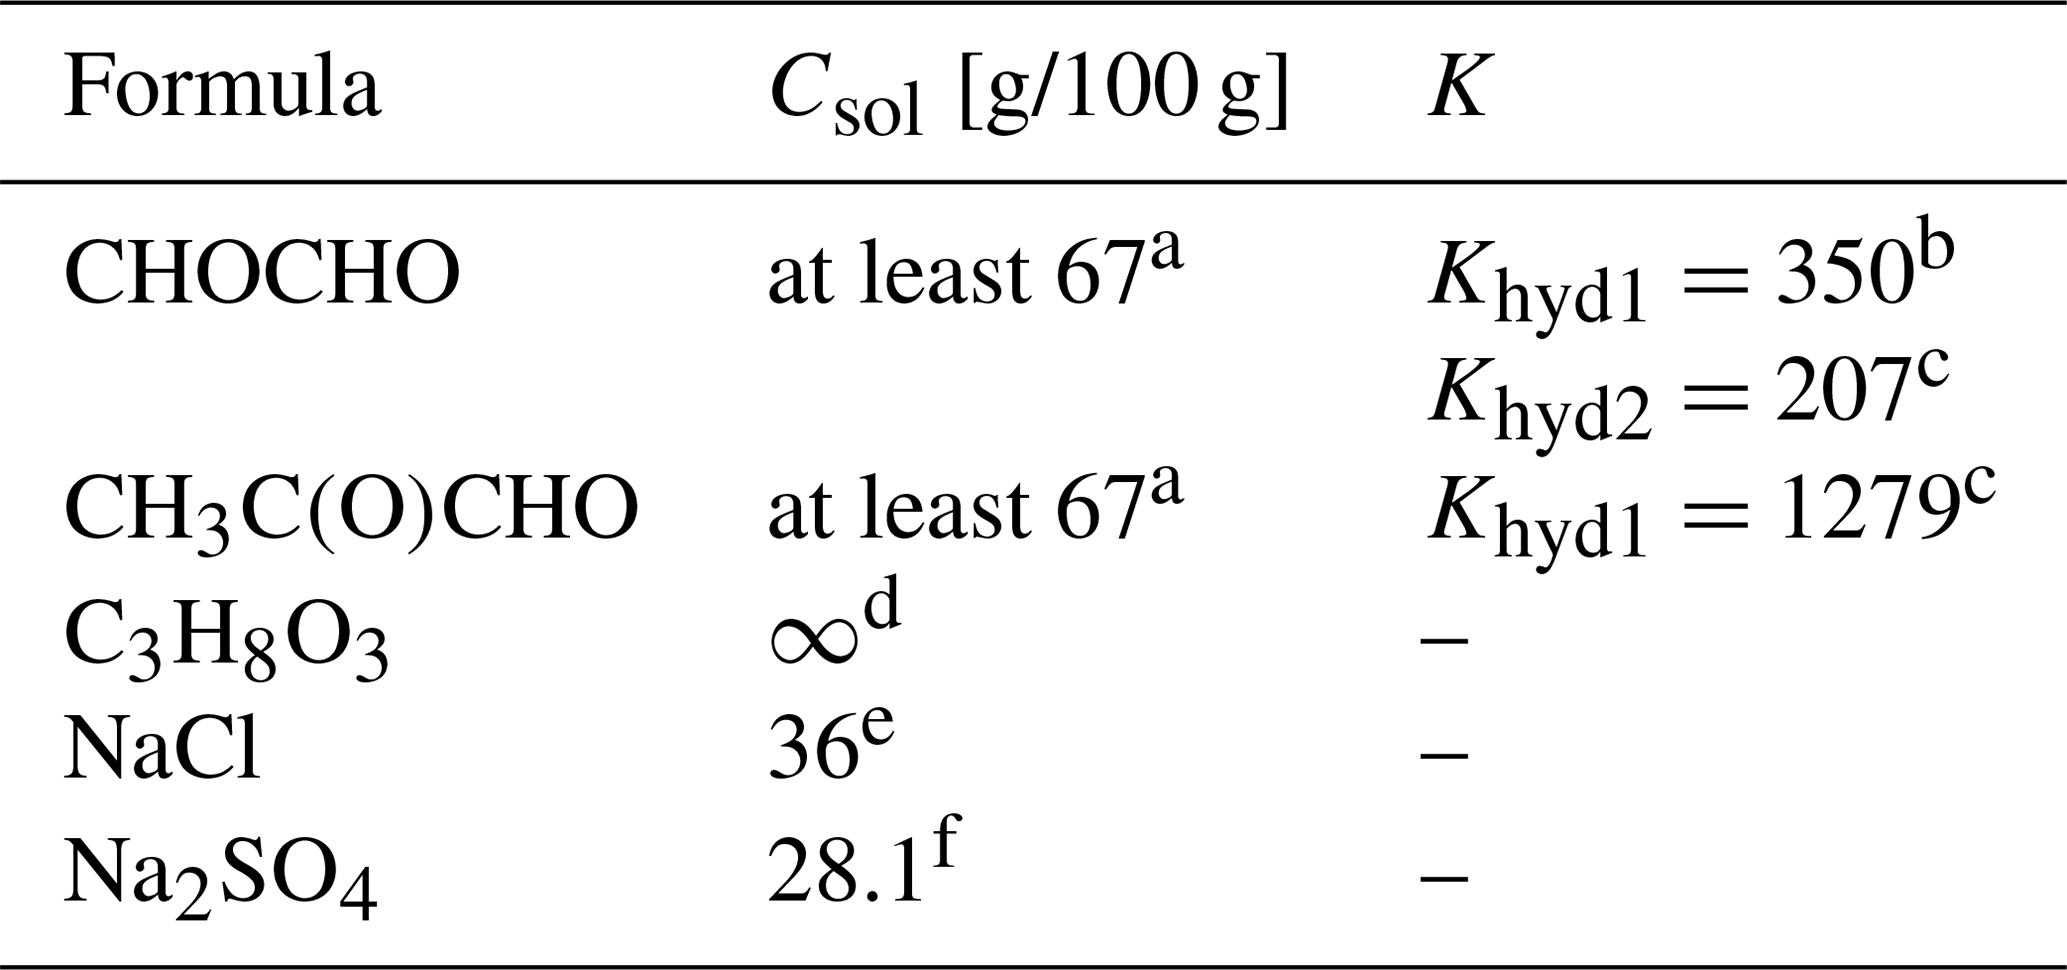
a Saxena and Hildemann (1996). b Ervens and Volkamer (2010). c Montoya and Mellado (1994). d Perry et al. (1997). e Lide (2004). f Haynes (2014).
In this work, we have used synchrotron radiation (SR) based soft X-ray absorption spectroscopy (XAS) combined with quantum chemical calculations to study hydrate formation of glyoxal and methylglyoxal in aqueous solutions, and their aqueous-phase interactions with various salts commonly found in atmospheric aerosols. Recently, XAS has been used to study both solute–solute and solute–solvent interactions, including, e.g., the investigation of structure of methanol–water mixtures based on C and O K-edge XAS (Nagasaka et al., 2014), the quantification of sulfuric acid–water interaction using O K-shell and S L-edge XAS (Niskanen et al., 2015), and studies of ion–water interactions (Waluyo et al., 2014; Nagasaka et al., 2017). The high brightness and element selectivity, in terms of core-level excitation energy and energy resolution makes SR a convenient tool to study molecular-level interactions in the aqueous phase using absorption spectroscopy.
2.1 Sample preparation
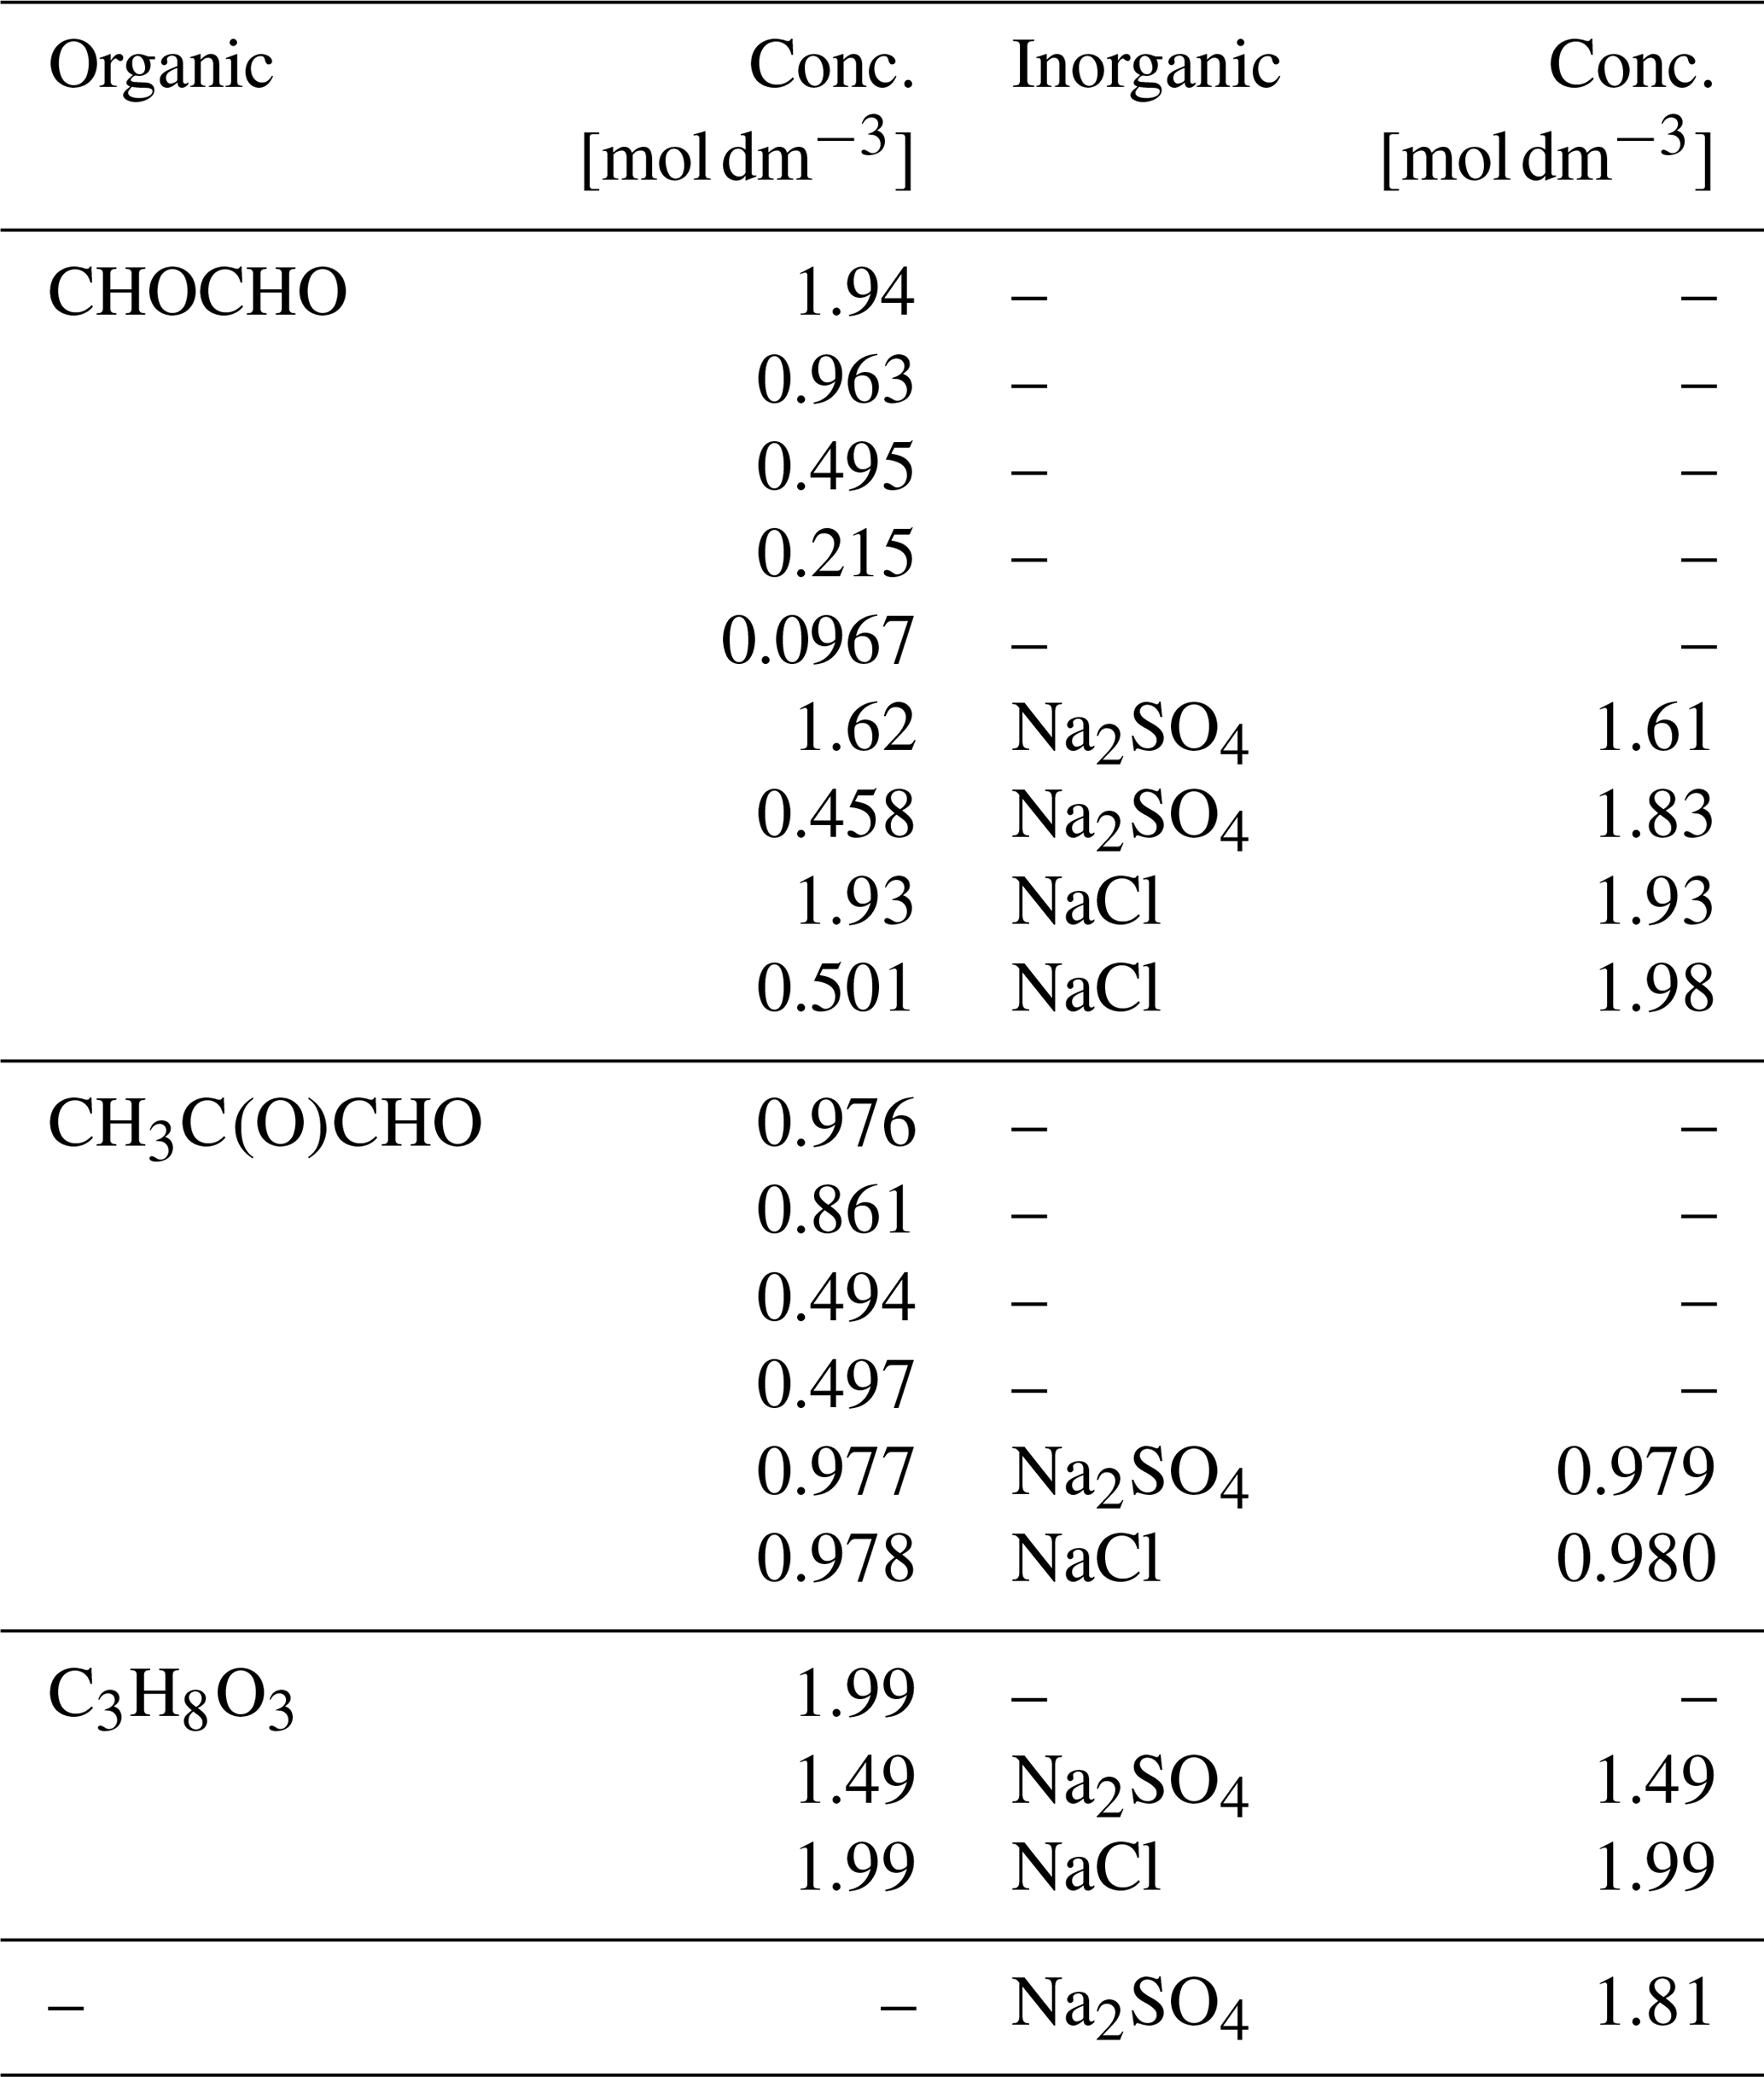
Aqueous solutions of each of the organic compounds, glyoxal, methylglyoxal and glycerol (C3H8O3), were prepared freshly before each experiment. Glycerol solution is used for comparison with the glyoxal and methylglyoxal solutions because it has a similar structure to their hydrated forms. The aqueous solutions were prepared using water purified by a Sartorius Arium® pro UV system (18.2 MΩ). Methylglyoxal was purchased from Sigma-Aldrich and all the other chemicals from Wako. All chemicals were used without further treatment. Glyoxal and methylglyoxal were delivered as 40 wt % aqueous solutions. The stated acidity of the aqueous glyoxal (glyoxylic acid, CHOCOOH) has a maximum of 2 %. Glycerol was a viscous liquid of 99.5 % purity. The organic concentrations of the prepared aqueous solutions ranged from about 0.1 to 2 M. Ternary solutions of the organic compounds, water and inorganic salt (sodium chloride (NaCl, 99.5 %) or sodium sulfate (Na2SO4, 99.0 %)), and an aqueous Na2SO4 solution were also prepared. Salts were added to yield inorganic concentrations between 1 to 2 M, and different mixing ratios with respect to the organics. All samples were well-mixed before use, yielding homogeneous aqueous solutions. Details of the studied compounds are given in Table 1, and details of the samples are given in Table 2.
Table 2Sample compositions, with aqueous concentrations of each solute.
2.2 Liquid cell experiments
XAS measurements of liquid samples were performed at the BL3U beamline (Hatsui et al., 2004) of the UVSOR-III Synchrotron Facility, Okazaki, Japan. The 750 MeV storage ring was operated in a top-up mode with 300 mA current. The end station with the liquid flow cell system connected to the beamline has been described extensively by Nagasaka et al. (2018). Briefly, the liquid cell consists of two Si3N4 membranes (area: 2 × 2 mm2, thickness: 100 nm) in a chamber which is separated from the soft X-ray beamline under ultrahigh vacuum conditions ( Pa) by using one Si3N4 membrane (0.2 × 0.2 mm2). The chamber is filled with flowing helium (He) at atmospheric pressure which can be varied by using the outlet valve of the He flow line. The liquid sample thickness was optimized for better transmission signal by changing the helium flow rate and, therefore, the pressure exerted on the walls of the cell. The liquid sample can be pumped through the liquid cell with an adjustable flow rate (Cole-Parmer Masterflex L/S pump system). Here, the samples were pumped in the liquid cell with a flow rate of 5 mL min−1.
XAS spectra in transmission mode can be obtained based on the Lambert formula: , where I0 is the intensity of the incident radiation, I is the transmitted intensity and x is the thickness of the sample. The absorption intensity depends on the material linear attenuation coefficient μ (Stöhr, 1992). During each measurement the incident radiation I0 was monitored with a gold mesh placed before the liquid cell, so that the flux variations (<1 %) due to the top-up mode were removed. The transmitted radiation I is detected by a photodiode (IRD AXUV100) placed right after the liquid cell. The transmission signal was also measured without the sample, using a blank cell, to normalize the absorption of the membranes and possible contamination. The thickness of the liquid layer (x) was not precisely determined, and thus we give the intensities of the X-ray absorption spectra in arbitrary units (arb. units). Here, we concentrate on the shape of the spectrum and the energies of resonances rather than absolute absorption coefficients.
Carbon and oxygen K-edge (1s core level) absorption spectra are recorded by scanning photon energies between 282–305 and 525–550 eV, respectively. The energy range can be changed from the control system of the beamline, by changing the angle of a varied-line-spacing plane grating monochromator. Photon energy resolutions were approximately 0.2 eV for C and 0.4 eV for O K edges. Reproducibility of the recorded spectra was verified by recording a few low-statistics cases several times. No significant changes were observed in the peak positions and the intensities of our spectra between the scans. During the experiment, we regularly recorded carbon and oxygen K-edge absorption spectra of pure water. The spectra were used for the inspection of possible contamination in the system and as a reference for the characterization of the spectra of the aqueous solutions.
2.3 Data treatment
The C K-edge spectra of pure water were subtracted from the C K-edge spectra of the samples to remove any undesired absorptions arising from, e.g., the absorption of water in the solution, that of Si3N4 membranes and that of carbon contamination in the beamline optics.
For the energy calibration of the C K-edge XAS spectra, we used XAS spectra of polymer films proLINE (Moxtek) scanned for energies from 284.5 to 288.5 eV with steps of 0.02 and 0.05 eV. After interpolation of the energy values with step of the data points approximately 0.05 eV, the treated data were calibrated by the absorption peak of the polymer films at 285.07 eV (Nagasaka et al., 2018).
In the C K-edge spectra of glyoxal, there were no pre-edge absorption peaks and the absorption edge was identified by fitting a sigmoid in the step of the spectra and by identifying the mean energy value from the inflection point. For the fitting of the spectra of methylglyoxal, we used the SPANCF (SPectral ANalysis by Curve Fitting) curve-fitting macro package (Kukk et al., 2001, 2005) which gives the energy and intensity of the absorption peaks. The shape of the curves was an asymmetric Voigt shape and the ionization thresholds were modeled by an arctangent function.
The oxygen signal of the O K-edge spectra is overwhelmed by the signal from the water. Therefore, the signal of water was not subtracted from the O K-edge spectra, unlike the case of the C K-edge spectra. The data were calibrated by the first peak of the polymer films at 530.88 eV (Nagasaka et al., 2018). For comparison, we also measured the oxygen K edge of glycerol (C3H8O3) in pure water and aqueous mixtures with the inorganic salts, as it contains similar functional groups as the expected hydrated forms of glyoxal and methylglyoxal (three hydroxyl groups bonded to three carbons and single C–H bonds), while excluding the possibility of reversible water addition or removal.
2.4 Quantum chemical calculations
The core ionization and excitation energies were evaluated within the ΔSCF (self-consistent field) method by using the GSCF3 code (Kosugi and Kuroda, 1980). Geometries of free glyoxal, methylglyoxal, hydroxides and enol forms were optimized by ground-state calculations within the second-order Møller–Plesset perturbation theory using the 6-311G* basis set (Frisch et al., 2004). According to our established method (Kosugi et al., 1992), core ionized states of these molecules were obtained by SCF calculations of their single core hole states with an extended basis set plus polarization basis functions (31111/21/3112/1*) for carbon and oxygen atoms and a double zeta basis set (42) for hydrogen (Huzinaga et al., 1984); then, by freezing the resultant core hole orbitals, singlet core excited states of these molecules were obtained by SCF calculations of their single core-to-valence excitations. No diffuse functions to describe Rydberg states are included assuming there is no strong Rydberg–valence mixing and Rydberg states are negligible.
Here we present results in terms of recorded XAS spectra for each sample of glyoxal, methylglyoxal and their mixtures with inorganic salts. The carbon K-edge spectra are presented together with calculations for unhydrated and hydrated forms of glyoxal and methylglyoxal for better interpretation of the spectra. We also present oxygen K-edge spectra of aqueous solutions with glycerol and their ternary solutions containing inorganic salts.
3.1 Carbon K edge
3.1.1 Quantum chemical calculations
We calculated ionization potentials (IP) and C 1s-π* bound-state excitation energies for unhydrated and hydrated species of glyoxal and methylglyoxal in the gas phase. It is extremely difficult for quantum chemical calculations to be accurate for complex systems (e.g., liquids) due to computational limitations. Gas-phase calculations can be used instead to describe the electronic excitations. Typically, the core-to-valence excitation energies of molecules in the gas phase show only small shifts compared to the excitation energies of these molecules in liquid phase or as a part of a cluster. However, the IP of the molecule is higher in the gas phase compared to condensed phases. The Rydberg series converging to the ionization threshold are shifted to higher energies for the lower Rydberg and shifted to lower energies or quenched for the higher Rydberg by the surroundings (Flesch et al., 2004). The results of the quantum chemical calculations are presented in Table 3. In the case of glyoxal, we observe that the excitation energies of C=O bonds of the unhydrated and monohydrated form differ by approximately 0.5 eV. The IP of the C=O moieties (295.4 for the unhydrated form and 295.15 eV for the monohydrated form) are higher than those of the C–OH moieties by 0.54 and 0.29 eV, respectively.
Table 3Calculated C 1s ionization potentials (IPs) and C 1s-π* bound-state excitation energies (Eπ*) below IP in eV with oscillator strengths (f) of moieties present in hydrated forms of glyoxal and methylglyoxal, shown in Figs. 1 and 2. For moieties with more than one carbon atom, we denote with bold (C) the carbon atom that is related to the calculated value. For dihydrated methylglyoxal, our calculations did not identify any C 1s-π* excitations in the energy range of the recorded spectra and only the calculated IPs are presented below.
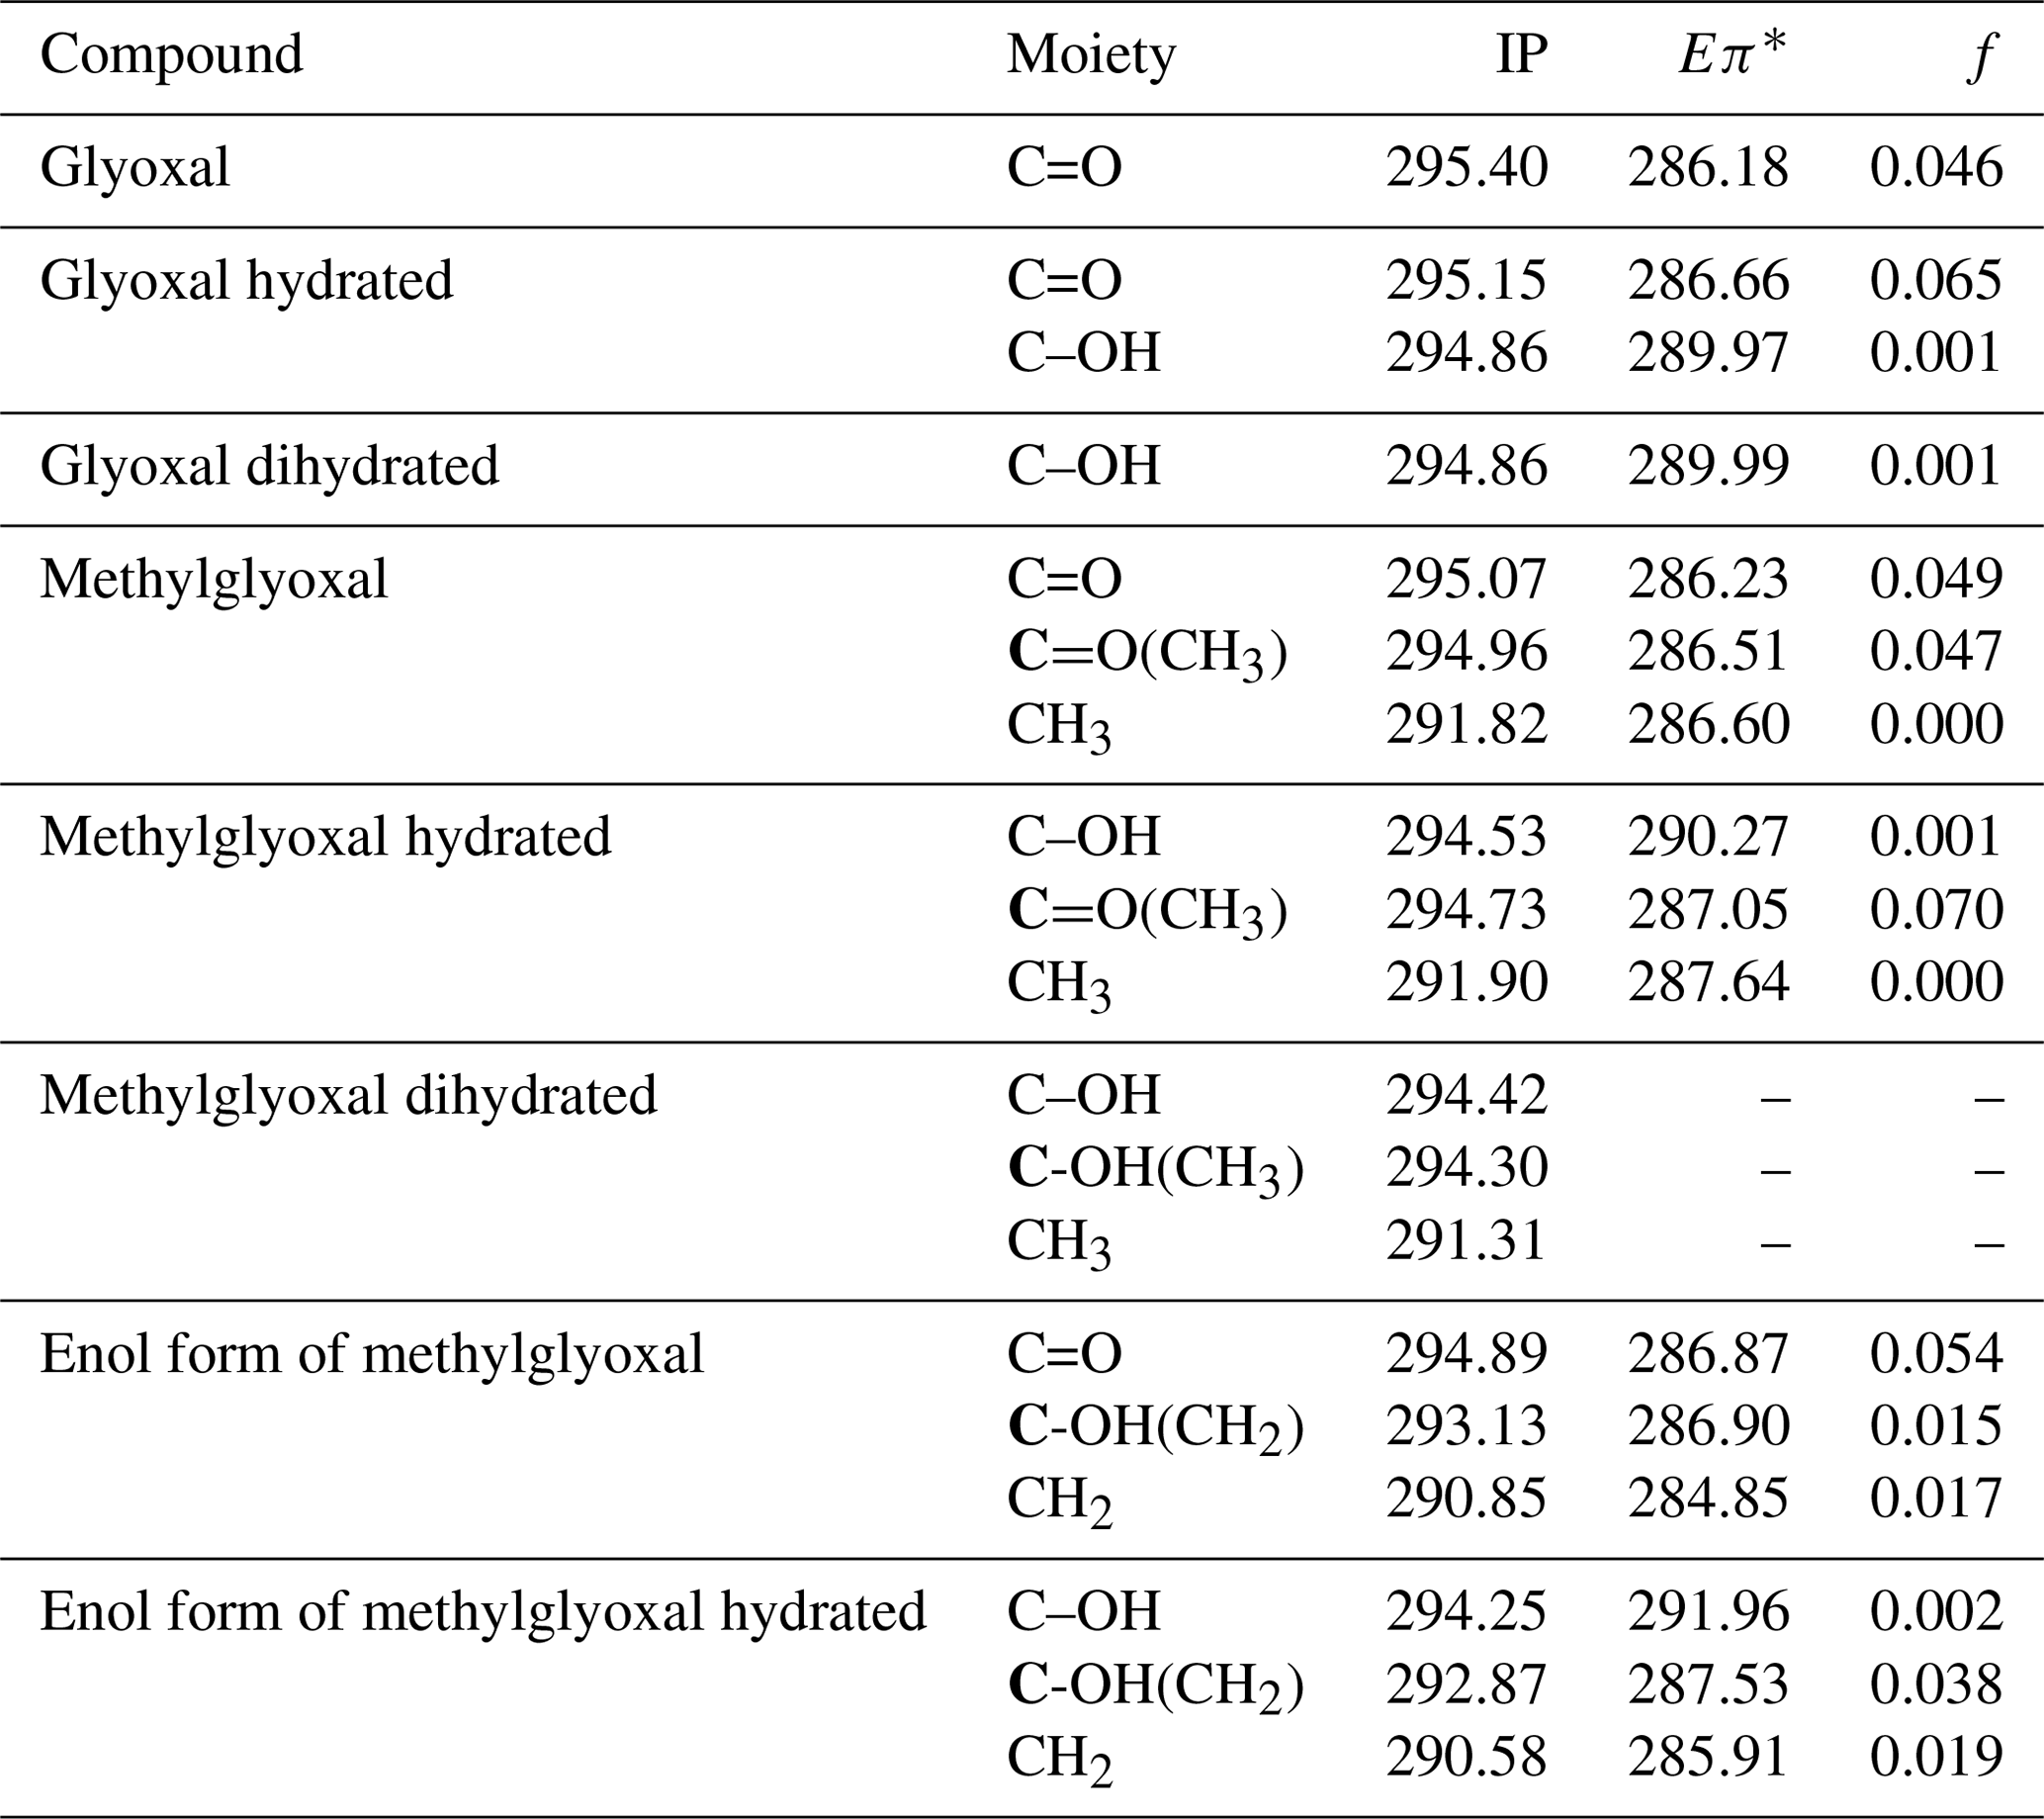
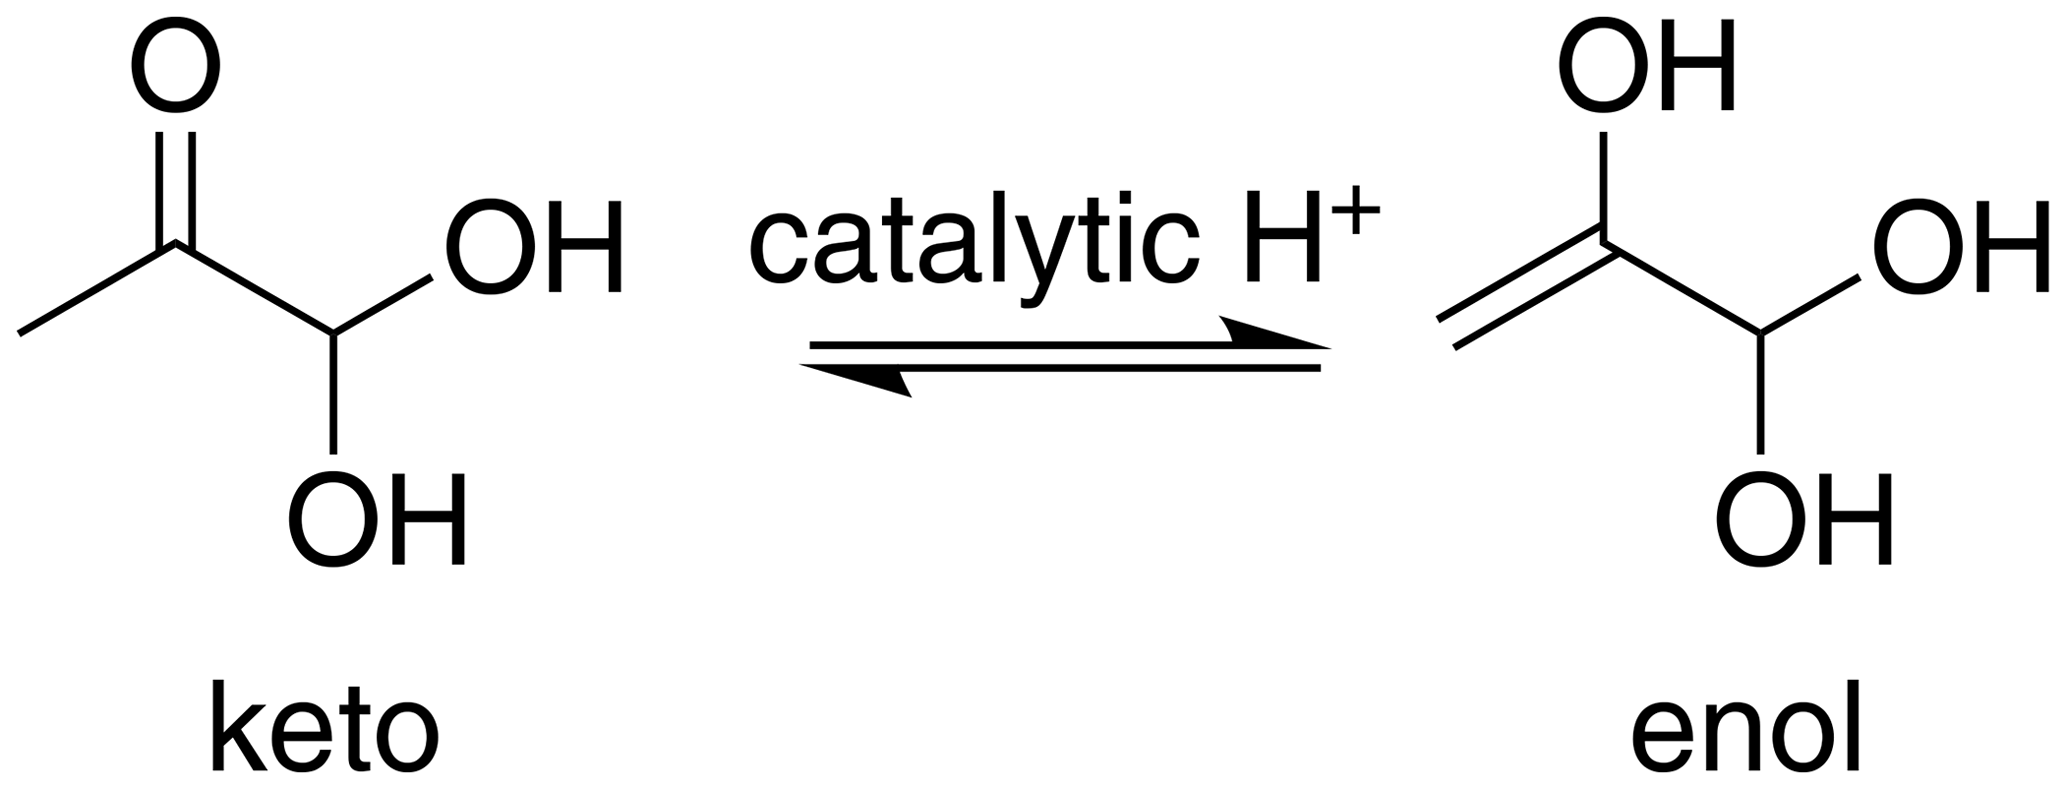
For methylglyoxal, the C 1s-π* excitation energies were calculated for the unhydrated, monohydrated and dihydrated forms. We also calculated energies of enol forms of methylglyoxal and hydrated methylglyoxal because they have been identified as possible structures in aqueous methylglyoxal solutions by Krizner et al. (2009). They applied density functional theory (DFT) calculations to study the hydration of 1 M of methylglyoxal at 298 K and showed that the formation of enol structures and aldol condensation products, which have in their chemical structure a C=C bond, are the thermodynamically most stable species in the methylglyoxal system. This is a very favorable chemical path when methylglyoxal is hydrated and thus taken into account in our calculations as well. Figure 2 shows the transition from the monohydrated methylglyoxal to the enol formation which is the intermediate step for the aldol condensation products.
The excitation energies of C=O moieties at 286.23–287.05 eV were lower than those of C–OH(CH2) moieties, formed by keto–enol tautomerism of the monohydrated methylglyoxal, but higher than the excitation energies of the CH2 moieties, at 284.85–285.91 eV. The IP of the C=O moieties (294.73–295.07 eV) are higher by approximately 0.7 eV than the C–OH and C–OH(CH3) moieties (294.25–294.53 eV) but much higher than the C–OH(CH2) moieties of the enol structure at 293.13 and 292.87 eV. This indicates that the hydration and keto-enol tautomerism lower the C 1s ionization threshold.
In Table 3 we also present the calculated oscillator strengths (f).
3.1.2 Glyoxal
Figure 3 presents the recorded spectra for the C 1s absorption edge of binary glyoxal–water and ternary solutions formed by the addition of either NaCl or Na2SO4 together with the excitation energies of our quantum chemical calculations. The results of the quantum calculations are presented with colored lines that correspond to hydrated and unhydrated molecules in the gas phase, and the length of the lines is scaled in respect with the calculated oscillator strengths. Apart from the absorption probability of a molecule, the absorption intensity of the presented spectra is also related to the relative amount of the species in the solution and the interactions that take place in the liquid phase, and thus we cannot directly use oscillator strengths as expected intensity ratios in the experimental spectra.
The spectra with and without the addition of inorganic salts only have a single feature at around 289.6 eV. The location of the absorption edge of aqueous solutions of pure glyoxal was at 289.6±0.1 eV (0.5 M) and 289.5±0.1 eV (1 and 2 M), and upon the addition of inorganic salts, the absorption edge energy systematically increased by 0.1 eV in all cases. All values are, however, close to the experimental accuracy. All absorption edge energies can be found in the Supplement (Table S1). Based on our calculations (Table 3), the absorption edge energies are close to the C–OH excitation energies of the monohydrated and dihydrated form, calculated at 289.97 and 289.99 eV, respectively. Photon energies above 291 eV exceed the C 1s binding energy and ionization starts. We do not observe any peaks at the calculated C=O energies of the unhydrated and monohydrated glyoxal at 286.18 and 286.66 eV, respectively. This indicates that the dihydrated form of glyoxal overwhelmingly dominates in our liquid solution samples. According to the calculations, a change in hydration state upon the addition of salts towards the mono- or dihydrated form of glyoxal would have shown up as new spectral features around 286–287 eV, which are not observed.
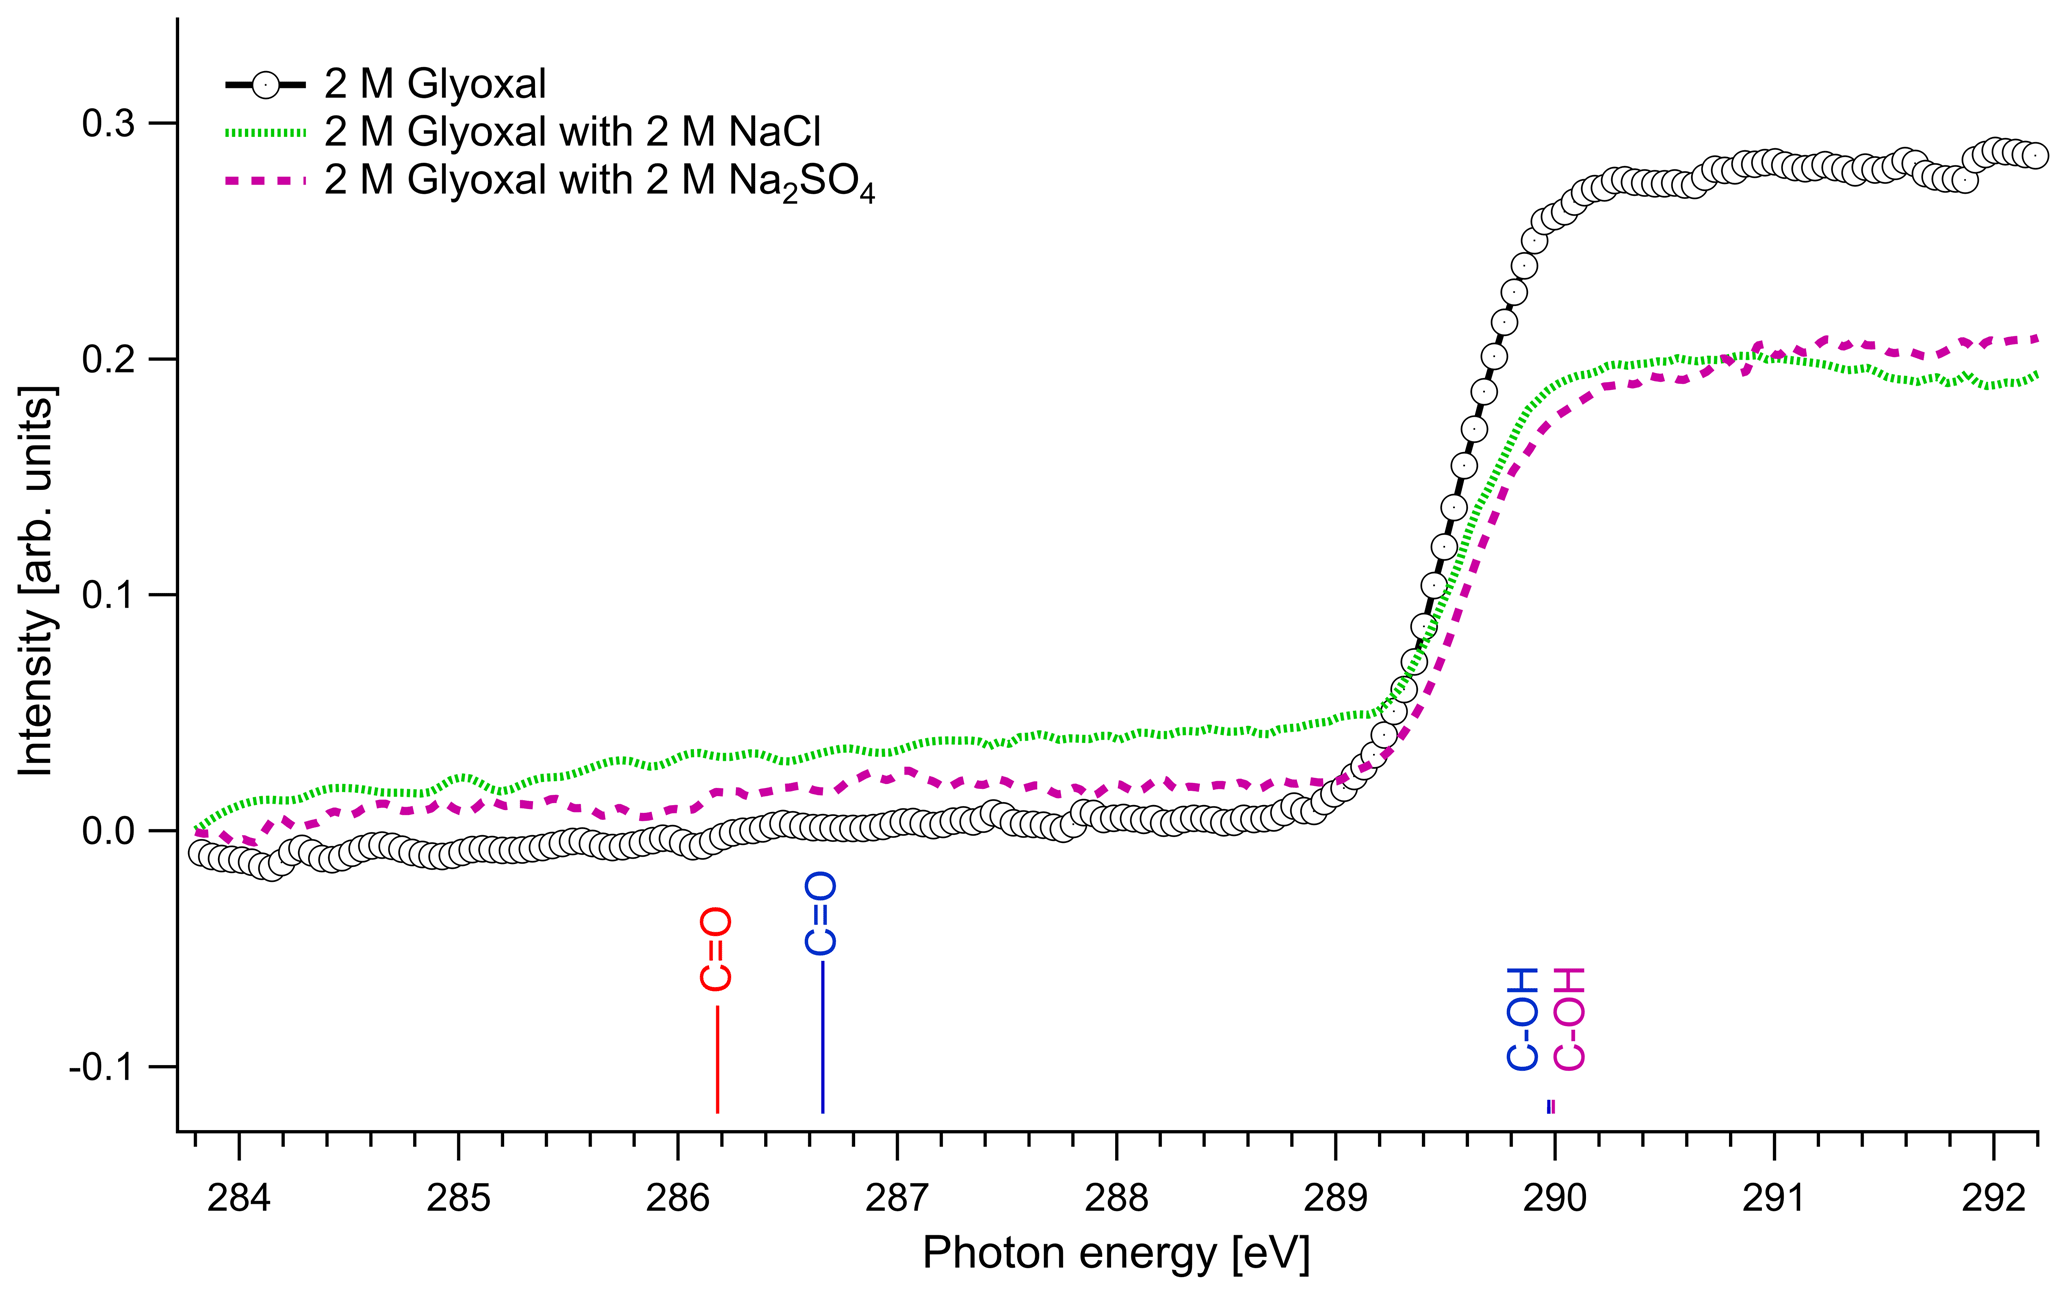
Figure 3C K-edge spectra of glyoxal–water (2 M) binary solution and 1 : 1 molar mixtures with NaCl and Na2SO4. The lines present the calculated C 1s → π∗ excitation energies. The color of the lines corresponds to different hydrated species: red: unhydrated glyoxal; blue: monohydrated glyoxal; purple: dihydrated glyoxal. The calculated vertical lines have been scaled according to the calculated oscillator strengths.
The dominance of hydrated species in aqueous glyoxal has been reported before. Measurements of near-UV molar absorptivities of aqueous solutions at 25 ∘C have shown that 98 % of glyoxal is in dihydrated form and the rest is in monohydrated form (Malik and Joens, 2000). Kua et al. (2008) applied DFT calculations to find the favorable hydration paths of glyoxal and of the subsequent products of hydration and used the Poisson–Boltzmann (PB) continuum approximation to describe the interaction with water. Their results show that the hydrated species are the most thermodynamically favorable, and they can subsequently be involved in reactions to form oligomers. Yu et al. (2011) studied aqueous solutions with 1 M glyoxal with nuclear magnetic resonance (NMR) spectroscopy. In agreement with our study, they did not detect unhydrated glyoxal and concluded that the glyoxal in the solution is mainly in dihydrated form and contains oligomers. Kua et al. (2008) and Yu et al. (2011) identified potential oligomers containing acetal groups in aqueous glyoxal. Here, we did not calculate absorption energies of oligomers, but based on the C 1s absorption energies of similar O–C–OH functional groups found in saccharides (Gainar et al., 2015), we estimate that in oligomers acetal moieties would have higher absorption energies compared to C–OH moieties. Their contribution would therefore be embedded in the broad continuum part of the XAS spectrum. The observed increase in absorption edge energy with decreasing concentration of glyoxal and the addition of salts could be related to changes in the degree of oligomerization. This is in line with the study of Yu et al. (2011), who observed deoligomerization with the addition of Na2SO4 and NaCl.
3.1.3 Methylglyoxal
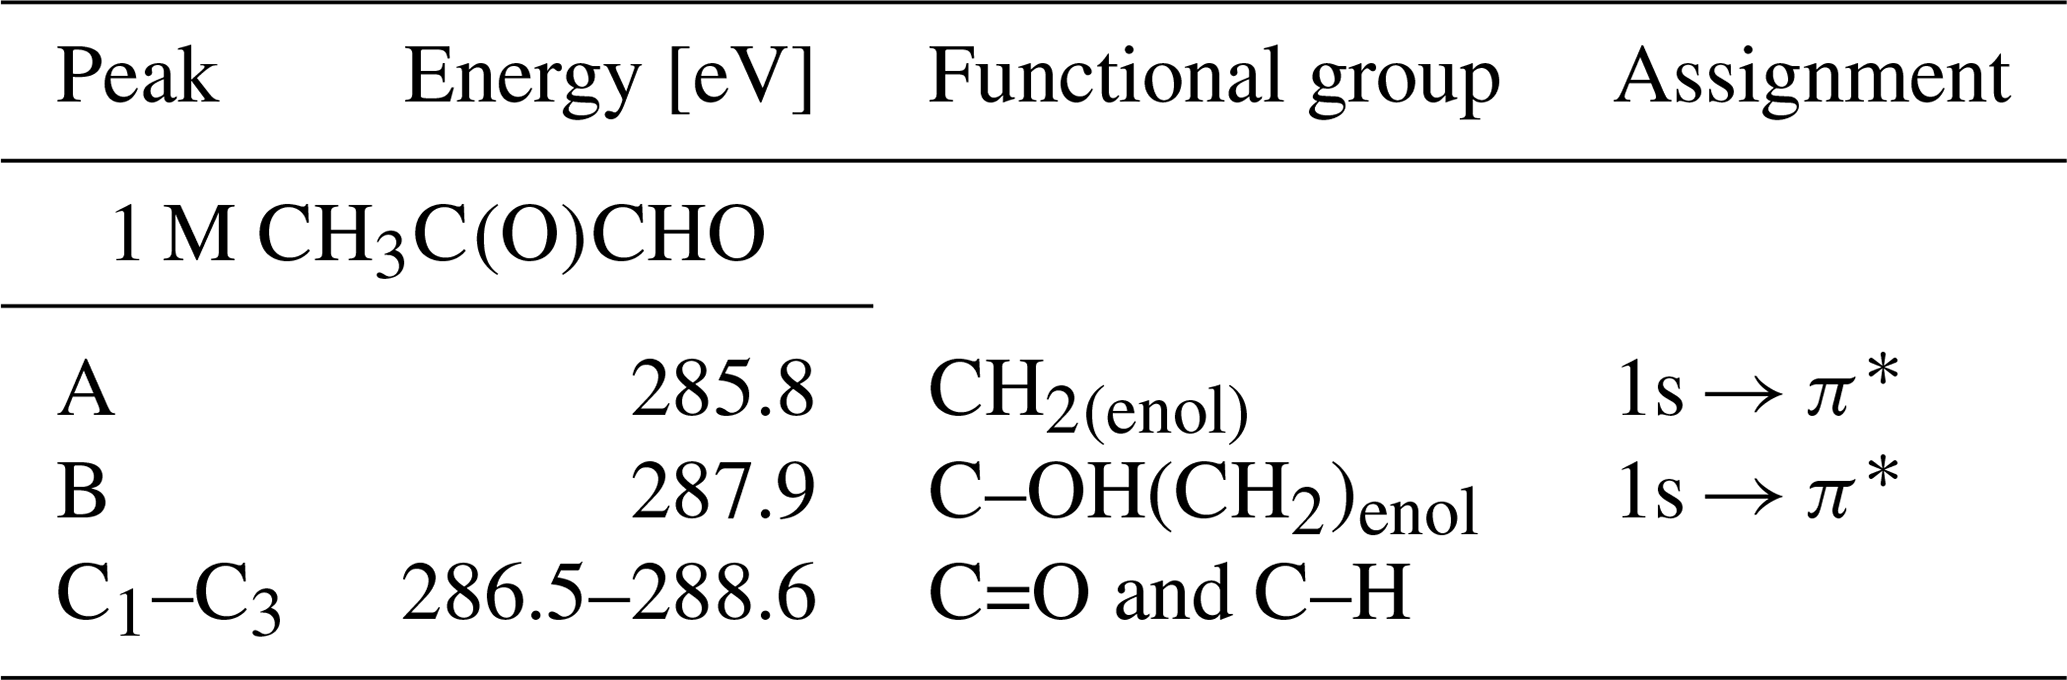
In Fig. 4 we present the spectra of C 1s of methylglyoxal in aqueous mixtures. We observe three distinct absorption features at 285.8, 287.9 and approximately 290 eV. Figure 5 shows five peaks, denoted as A, B, C1, C2 and C3, that were identified during the fitting process of the spectrum of methylglyoxal in the aqueous phase. We correlate these peaks with the absorption energies of functional groups presented in our solutions (Table 4). We also present the excitation energies and ionization potentials of our quantum chemical calculations.
Table 4Summary of the identified peaks of carbon K edge and the absorption energies for methylglyoxal in this study.
Peak A
The first peak, designated as A (Fig. 5), is found at 285.8 eV. We assign this peak to the CH2 moiety of the enol form of the monohydrated methylglyoxal, in good agreement with the predicted C=C excitation energy of 285.91 eV. Usually, the C=C peaks are found at 285 eV, but an increase in the energy of C=C transitions has been observed before in organic compounds with similar structure. Phenols and quinones in solid phase were studied by Solomon et al. (2009), using scanning transmission X-ray microscopy (STXM) under a He atmosphere. These compounds have the same characteristic moiety, and excitations between 286.05 and 286.35 eV were attributed to C 1s → . C=C bonds can also result from radiation damage of the sample. However, consecutive scans of the solutions did not show any significant changes in the spectra, and thus radiation damage is considered to be small in our experiments.
Peak B
The next strong peak in Fig. 4 at 287.9 eV (peak B in Fig. 5) can be assigned to the C–OH(CH2) transitions in the enol form of monohydrated methylglyoxal. The calculated energy of this transition is at 287.53 eV (lower by 0.4 eV).
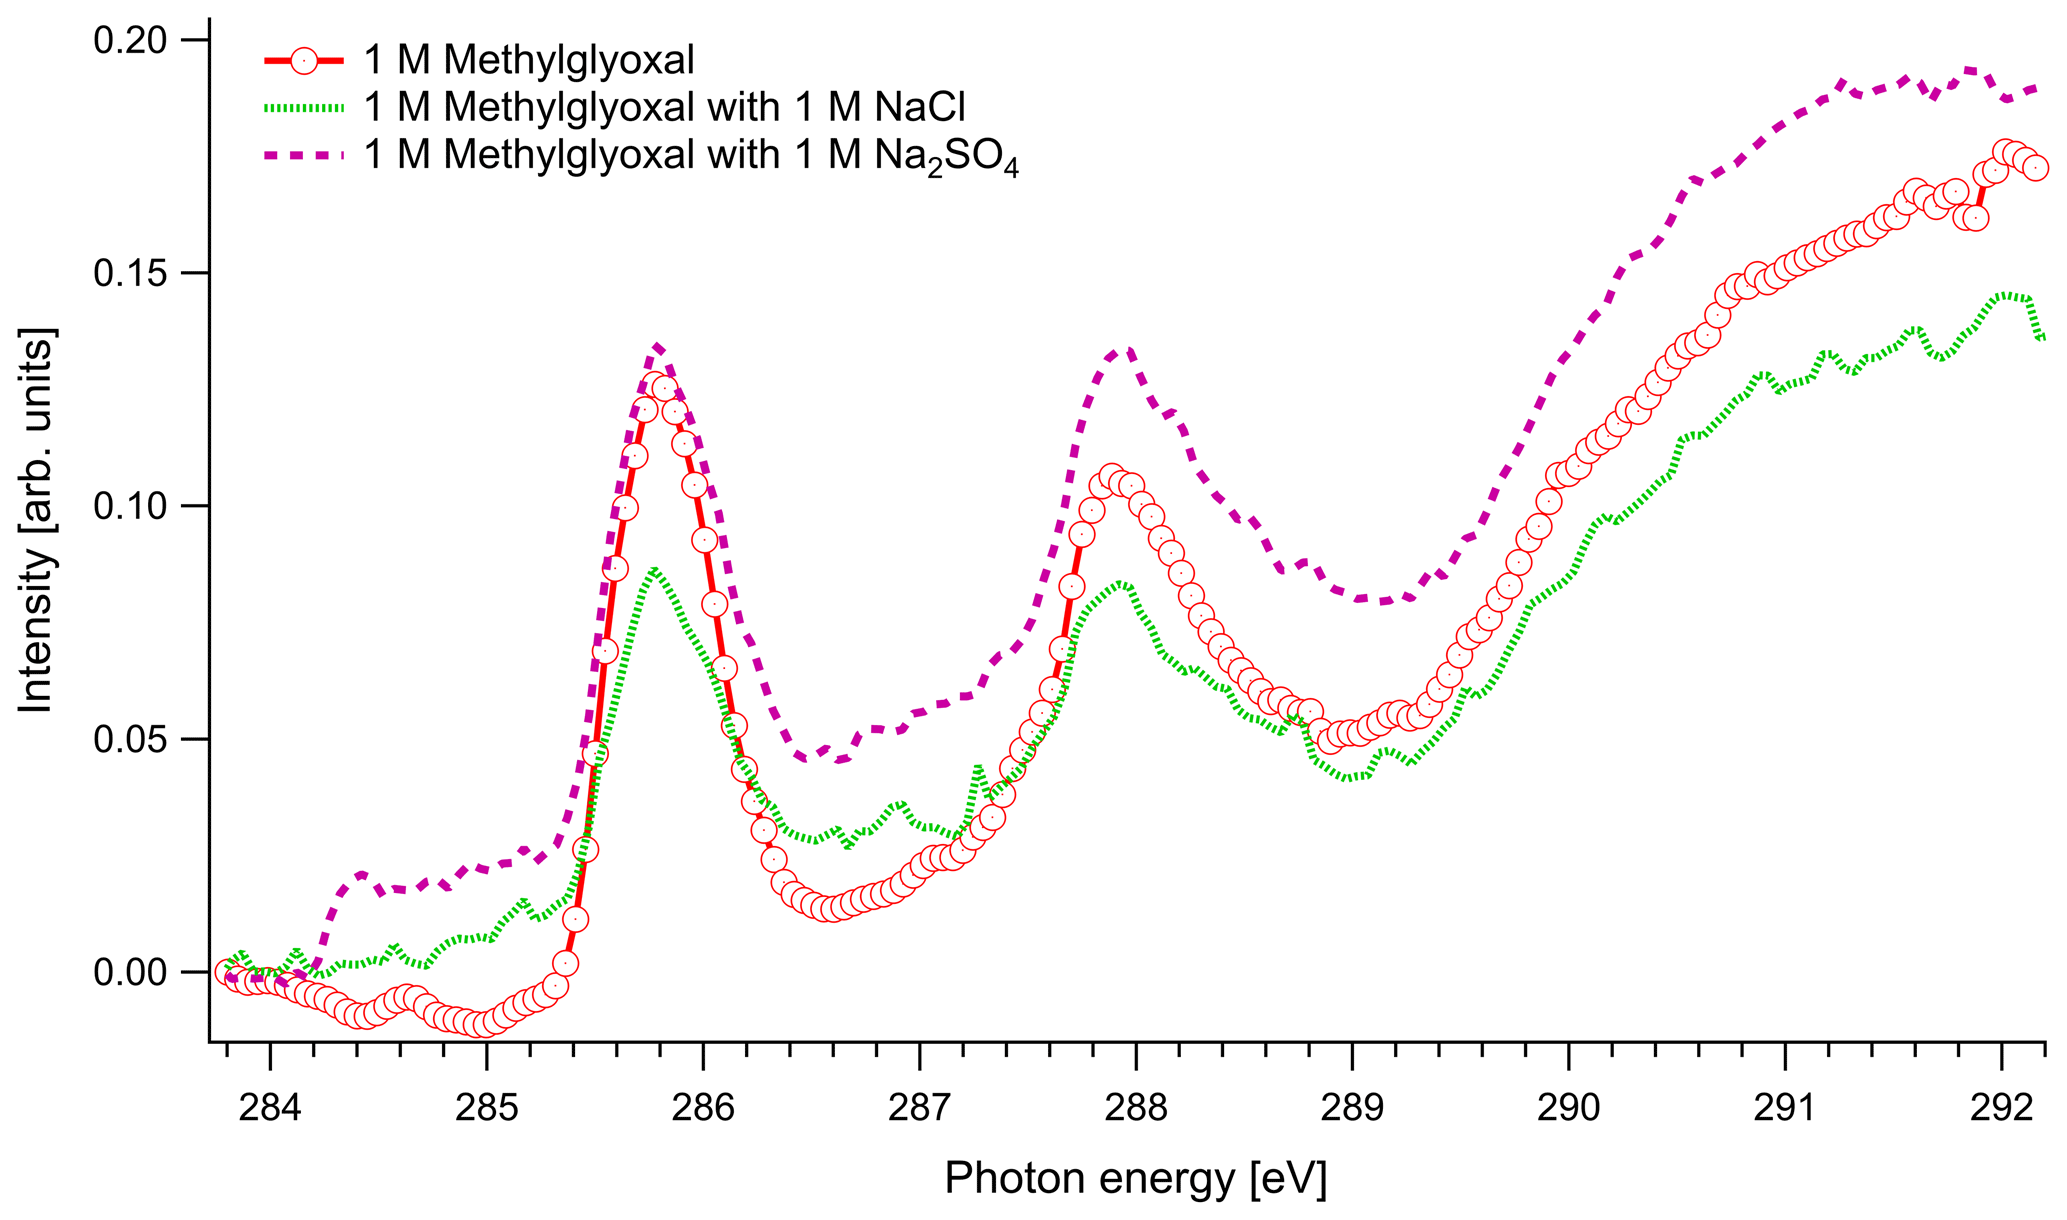
Figure 4C K-edge spectra of 1 M aqueous solution of methylglyoxal together with ternary mixtures with 1 M of NaCl and 1 M of Na2SO4.
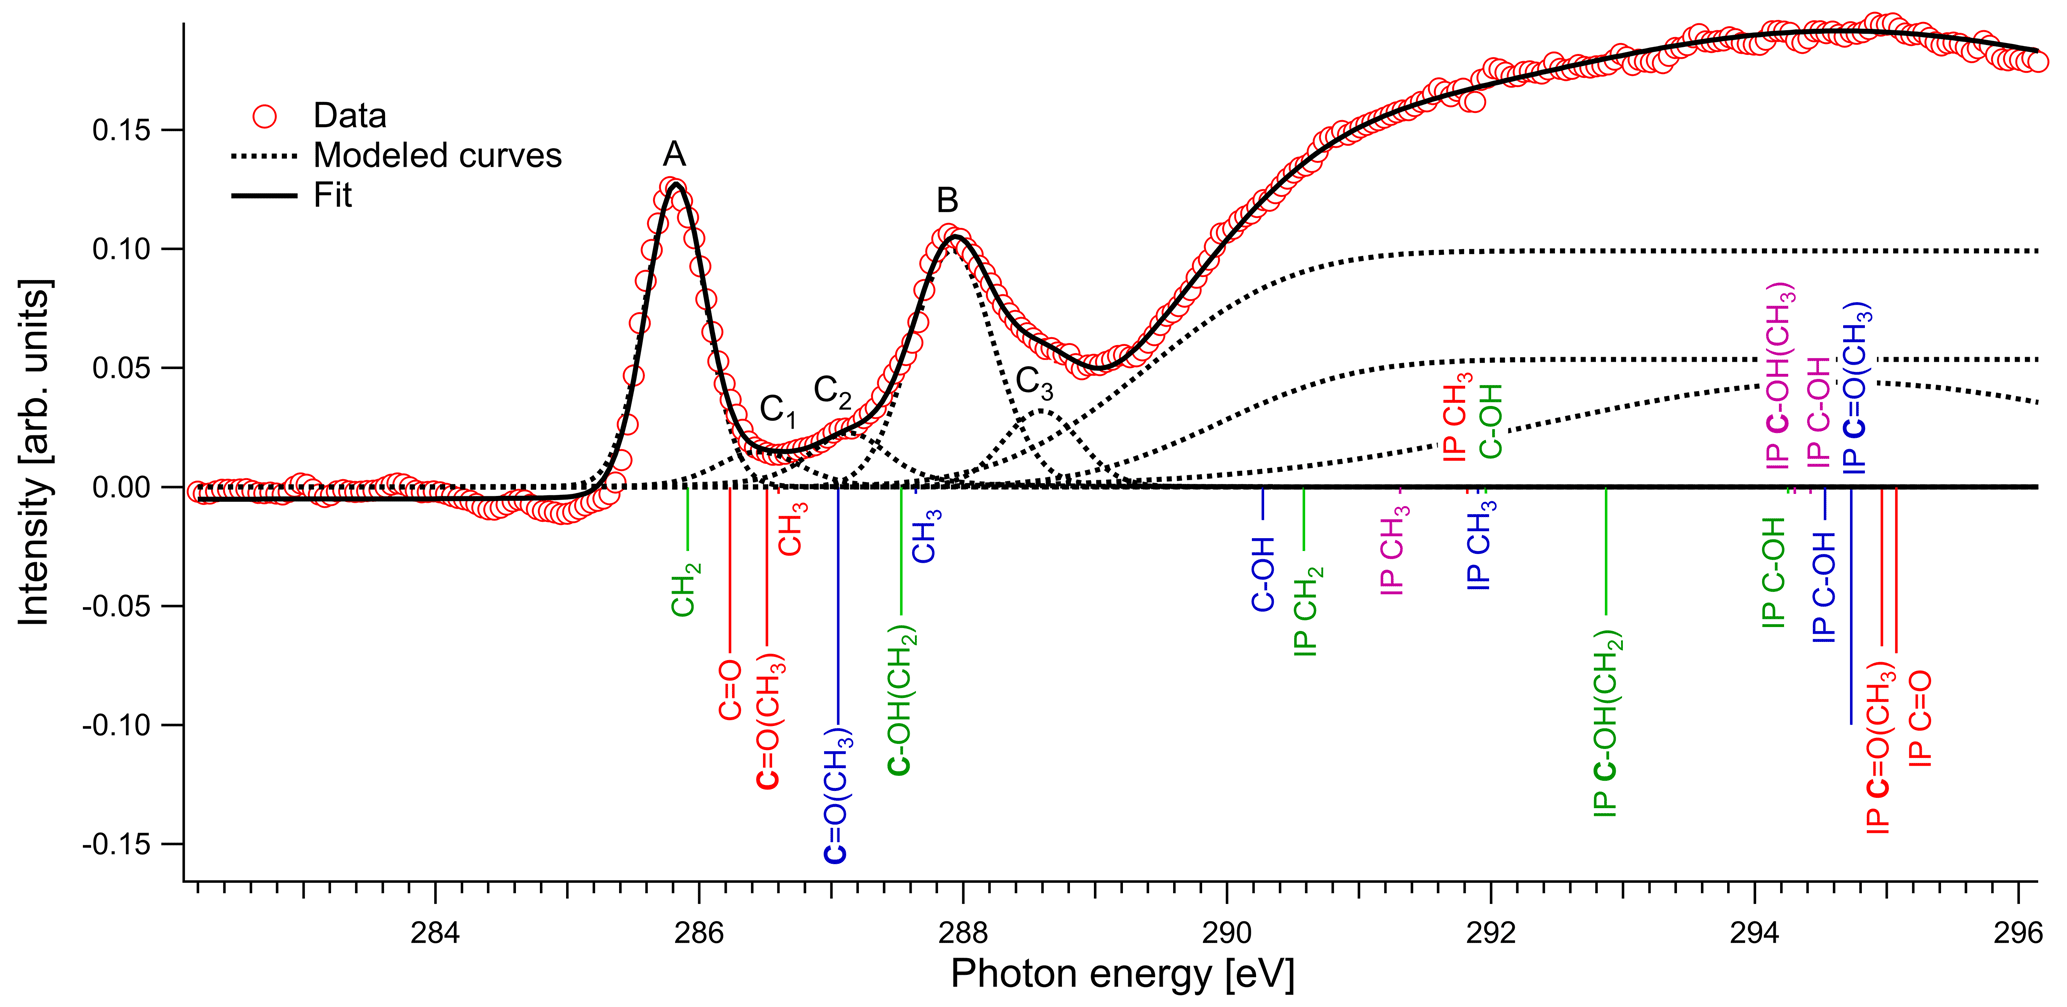
Figure 5Normalized spectrum of 1 M methylglyoxal with the identified and calculated peaks and ionization steps. The calculated values are presented with red color for the unhydrated methylglyoxal, blue color for the monohydrated methylglyoxal, purple color for the dihydrated methylglyoxal and green color for the enol form. The calculated vertical lines have been scaled according to the calculated oscillator strengths.
Peaks C1–C3
The asymmetrical shape of our spectra suggests underlying peaks. We fit three peaks, according to the observed shoulders on the two main peaks, at 286.5 eV (peak C1), 287.1 eV (peak C2) and 288.6 eV (peak C3). The predicted C=O absorption energies are at 286.51 and 287.05 eV for the unhydrated and monohydrated methylglyoxal in the gas phase, respectively. Latham et al. (2017) studied solid organic compounds in ultrahigh vacuum conditions, applying XAS in the near-edge region, and has also assigned the C=O transitions at 286.5 eV. Russell et al. (2002) applied soft X-ray spectromicroscopy at atmospheric pressure, and Tivanski et al. (2007) used STXM with XAS at 0.5 atm to characterize functional groups of dry particles, and they both correlated the C=O transitions with absorption energies at around 286.7 eV. The calculated and reported values for C=O transitions are lower than the respective peak at 288.3 eV in the gas-phase spectrum (presented in Fig. S1 of the Supplement). The calculated C 1s-π* excitation energies of the C–H moieties are at 286.6 and 287.64 eV for the unhydrated and monohydrated form, respectively. C–H Rydberg states have not been calculated but could be mixed with the calculated states and could interact with surrounding water molecules in aqueous solutions. C–H transitions have been assigned by Latham et al. (2017) at 287.3 eV and at the energy range from 287 to 288.4 eV by Russell et al. (2002). In conclusion, in this energy range we expect peaks related to C=O excitations associated with the unhydrated methylglyoxal, C=O(CH3) excitations of the monohydrated methylglyoxal and also C–H excitations of the hydrated species. Based on previous studies, we expect to have mainly monohydrated and dihydrated forms of the compound and a negligible fraction of unhydrated methylglyoxal (Nemet et al., 2004; Krizner et al., 2009). C=O and C–H excitations from hydrated species that contain enol structures and originate from monohydrated methylglyoxal should also be considered as they can co-exist in the solutions. Due to the variety of possible species containing C=O and C–H bonds in the aqueous solutions, we suggest an energy range from 286.5 to 288.6 eV for the transitions of C=O and C–H groups.
Feature at 290 eV
The wide feature at around 290 eV in Figs. 4 and 5 is related to C–OH transitions and ionization of C 1s electrons. The calculated C–OH absorption energy of the monohydrated form at 290.27 eV matches well with the energy from where the broad structure starts. The IP are expected to be shifted by some eVs compared to the calculated, depending on the surroundings where the nearest neighbor is dominant.
In the case of methylglyoxal, the addition of salts did not introduce observable shifts to absorption energies. Due to the presence of overlapping peaks in the spectra of the salt-free systems, we cannot estimate the absolute concentrations of unhydrated and hydrated methylglyoxal and, thus, we cannot observe how the addition of salts affects the concentration of the hydrates. Changes in the relative ratios of unhydrated and hydrated forms would be expected due to changes in the molecular interactions (water–methylglyoxal, water–water) when ions co-exist in the solution. Such phenomena have been reported in previous experimental (Waxman et al., 2015) and computational (Toivola et al., 2017) studies, which have shown a decrease in the co-solubility of methylglyoxal in aqueous solutions with the addition of NaCl and Na2SO4 (salting-out effect). Here we observe a small change in the relative intensities between the peaks A and B in pure methylglyoxal solutions, compared to solutions containing Na2SO4 and NaCl. In salt-containing solutions, the relative intensity for peak A (CH2(enol)) becomes slightly smaller than for peak B (C–OH(CH2)enol) or the absorption edge (∼291 eV). Considering that other hydrated forms of methylglyoxal contribute to the spectra in the energy range of peak B, this can indicate smaller abundance of the enol form compared to other hydrated forms in salt solutions. However, the addition of salts changes the shape of the background due to close-lying ionization continua of the Cl and S L shells (Yeh and Lindau, 1985), and thus these changes remain inconclusive.
3.2 Oxygen K edge
Figures 6, 7 and 8 show the O K-edge absorption spectra of organic–water binary solutions and a comparison of these when Na2SO4 or NaCl is added. The spectra have been normalized to the background preceding the water pre-peak. The two structures can be characterized as a pre-peak and a main peak.
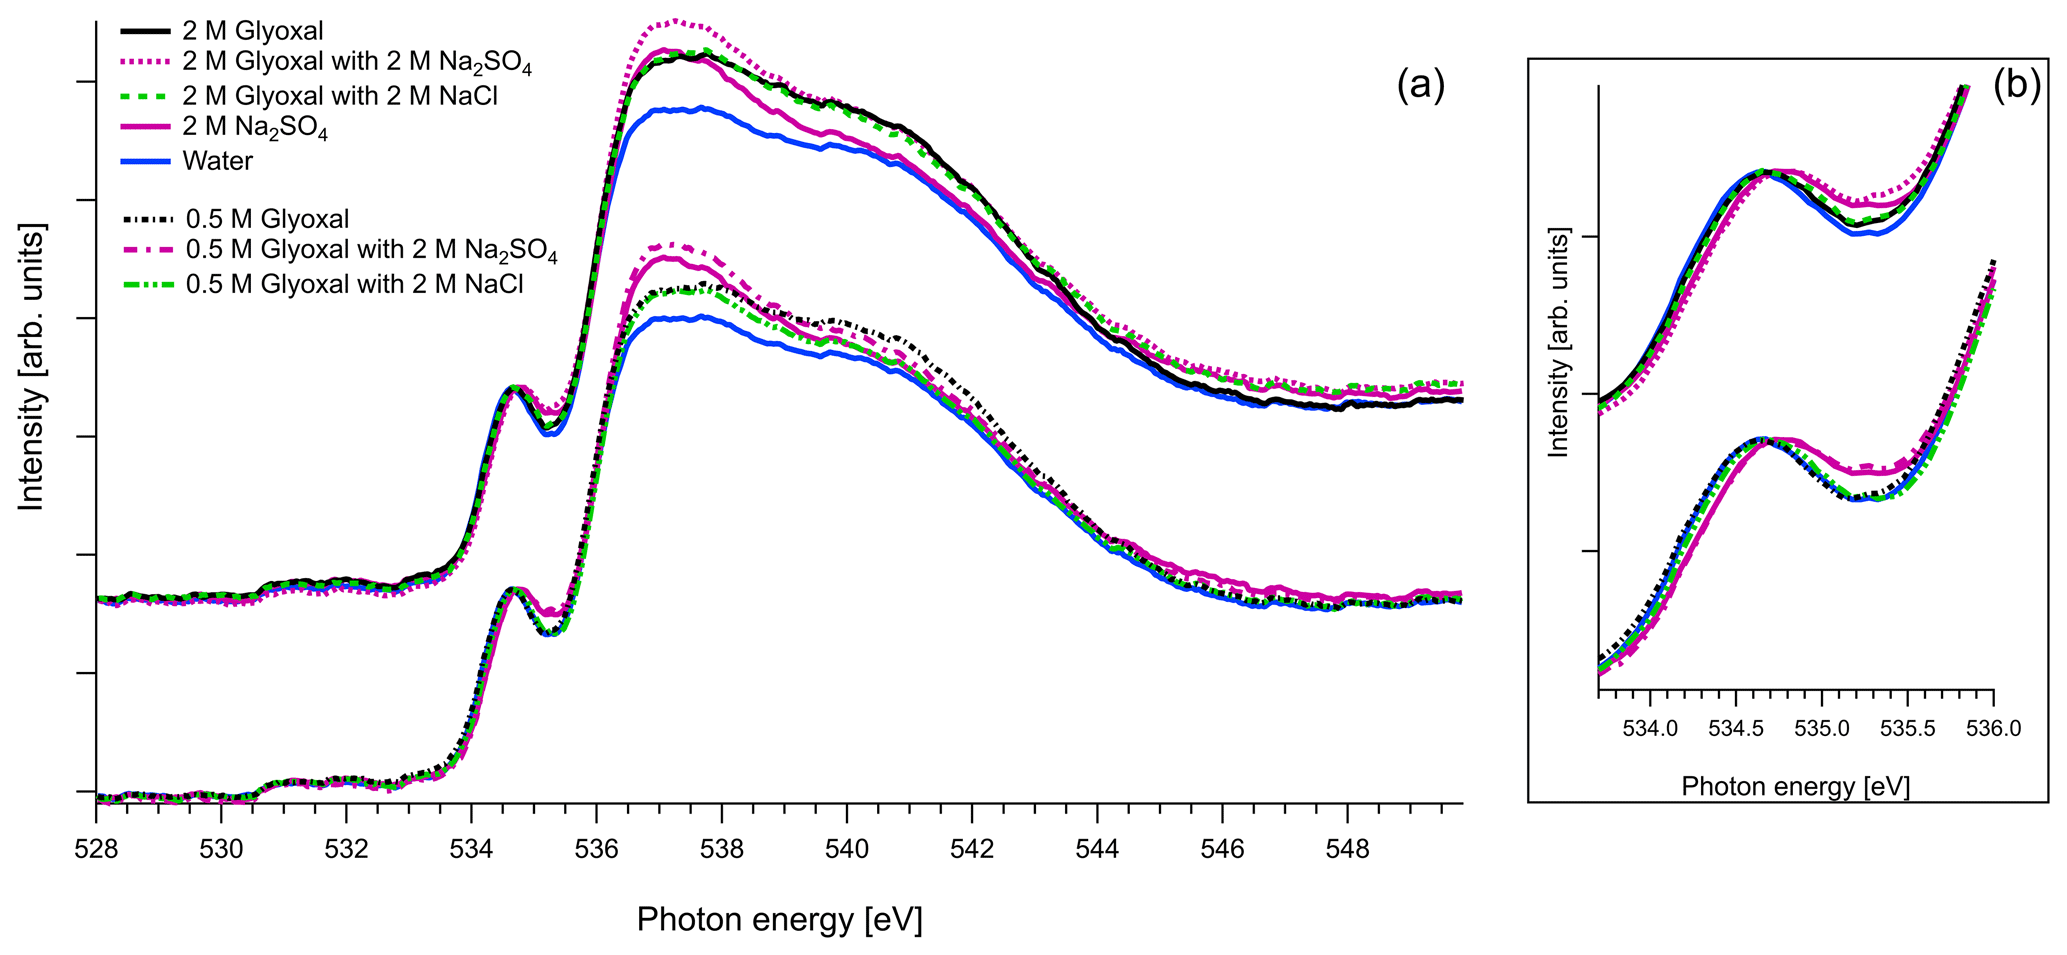
Figure 6(a) O K-edge spectra of aqueous solutions of glyoxal together with ternary mixtures with 2 M of Na2SO4 and 2 M of NaCl, normalized to the pre-peak at 535 eV. For comparison we also present the O K-edge spectrum of pure water and of aqueous solution with 2 M of Na2SO4. (b) Zoom on the pre-peak of the spectrum.

Figure 7(a) O K-edge spectra of binary aqueous solutions of methylglyoxal and ternary aqueous solutions containing 1 M of methylglyoxal with 1 M of Na2SO4 or 1 M of NaCl. We also present the recorded spectra of pure water and binary water–2 M Na2SO4 solution. All the spectra are normalized to the pre-peak at 535 eV. (b) Zoom on the pre-peak of the spectrum.
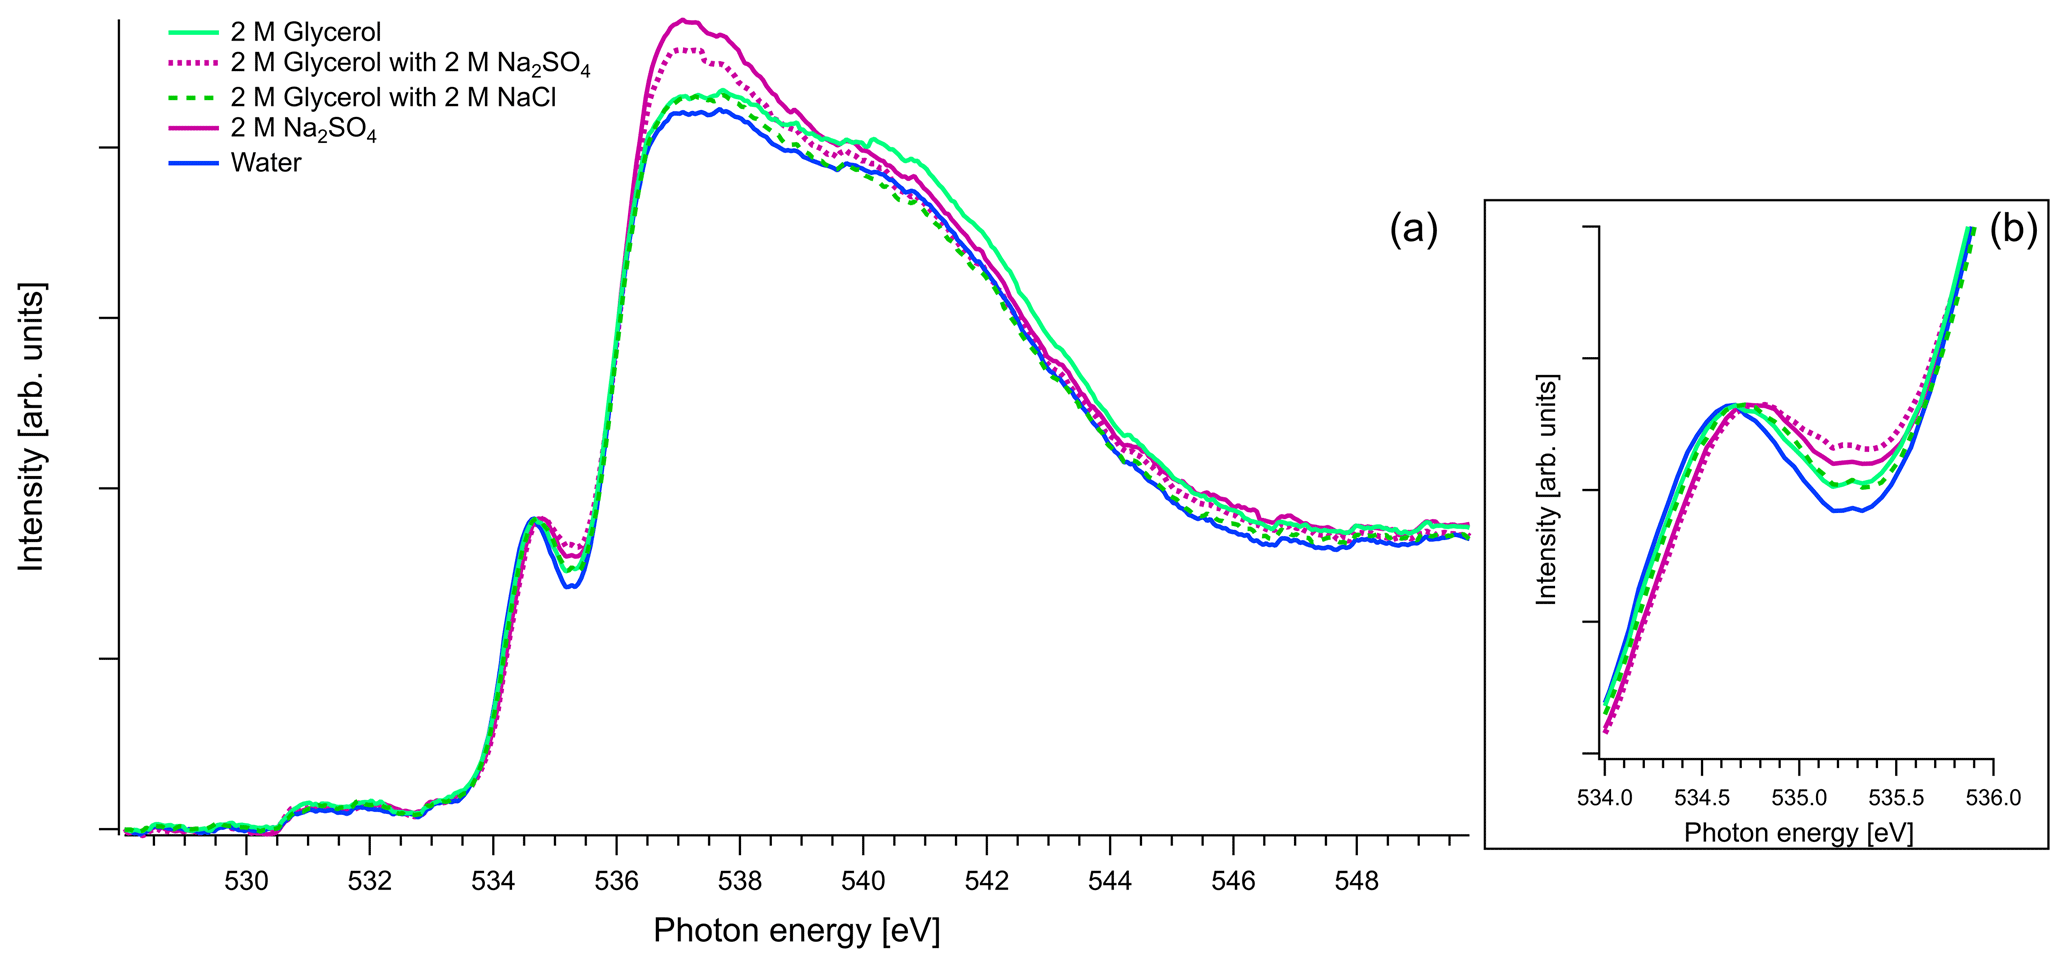
Figure 8(a) Recorded spectra of aqueous solutions of glycerol, in oxygen K edge. Comparison of aqueous solution of 2 M of glycerol and 1 : 1 molar mixtures with Na2SO4 and NaCl. The spectra of binary water–2 M Na2SO4 solution and pure water are also presented for comparison reasons. All the spectra are normalized to the pre-peak at 535 eV. (b) Zoom on the pre-peak of the spectrum.
As mentioned in Sect. 2.3, in the case of oxygen, the water background has not been subtracted. Due to the abundance of water in the solutions, the spectra are similar to that of water. The pre-edge peak at 535 eV is related to the transition to an orbital with the 4a1 character in a water molecule, and the main edge is related to the transition to the continuum threshold of bulk water (Sellberg et al., 2014; Pylkkänen et al., 2010). Changes of the pre-edge peak can be related to changes in the hydrogen bond network (Nilsson et al., 2010; Velasco-Velez et al., 2014; Bluhm et al., 2002). We observe that for all the organic compounds (Figs. 6, 7 and 8), the ratio of the pre-peak feature to main peak is smaller than in water. This is most likely due to oxygen from solute molecules contributing mainly to the absorption above 536 eV, but for 2 M solutions of glyoxal and glycerol, there is also a small increase in the intensity after the pre-peak. In ternary solutions with Na2SO4 the ratio of the main edge region (537–540 eV) to post edge (540–544 eV) differs from all the other solutions. This has been previously described by Niskanen et al. (2015) to be related to the tetrahedral geometry of the system. In solutions with Na2SO4 we also observe that the pre-edge peaks are blue-shifted similarly to the Na2SO4 aqueous solution. The energy difference between the pre-edge peaks of pure water and the ternary solutions with Na2SO4 is approximately 0.1 eV for the solutions of glyoxal containing 2 M of Na2SO4 and 0.05 eV for the solution of methylglyoxal containing 1 M of Na2SO4. This shift is plausible considering that Na+ ions can have strong interactions with the oxygen of water (Nagasaka et al., 2015, 2017) and that SO tends to form hydrogen bonds with water molecules (Niskanen et al., 2015).
Figure 8 presents O K-edge spectra of 2 M aqueous glycerol and its mixture with NaCl and Na2SO4. Similarly to glyoxal and methylglyoxal spectra, the shape of the pure solution and the one containing NaCl are very close to pure water. Again, when Na2SO4 is added, the pre-peak shifts to higher energies (by 0.1 eV) and the ratio of the main and post-edge features changes, thus getting closer to the shape of pure Na2SO4 solution.
In conclusion, the addition of organics and NaCl do not modify the overall structure of the measured O 1s XAS spectra. However, the presence of strongly hydrated SO anions leads to an observable effect on both the pre-peak and main peak regions. The effect on the shape was the same regardless of the identity of the organic compound in the solution, and we were not able to confirm any Na2SO4–organic interaction in the present study.
3.3 Atmospheric implications
Both glyoxal and methylglyoxal are volatile organic compounds (Kielhorn et al., 2004; Liggio et al., 2005; Kalberer et al., 2004) and thus expected to be significantly present in the gas phase in the atmosphere. Nevertheless, both contribute significantly to atmospheric SOA (Volkamer et al., 2006; Fu et al., 2008). Here, we confirm experimentally that glyoxal, to the sensitivity of our measurements, exists strongly in its fully hydrated form in aqueous solution, in agreement with previous studies (Yu et al., 2011; Malik and Joens, 2000; Kua et al., 2008). The studied concentrations of glyoxal, methylglyoxal and inorganic salts are higher than their typical concentrations in cloud water, which have been estimated to be about 5 or more orders of magnitude lower (Igawa et al., 1989; Munger et al., 1995; Matsumoto et al., 2005; van Pinxteren et al., 2016; Lee et al., 2013). Droplet evaporation, however, can lead to highly concentrated and supersaturated solutions, altering the chemical and optical properties of aerosol particles (Lee et al., 2013). Our study shows that hydrated methylglyoxal furthermore takes part in enol formation and aldol condensation reactions, which contributes further to shifting the gas–particle-phase partitioning towards the aqueous particle phase. Both reactions can therefore lead to significant SOA formation.
The presence of organic solute, such as glyoxal or methylglyoxal, in the aqueous solution decreases the equilibrium water vapor pressure p over the solution compared to the equilibrium vapor pressure of a water solution (solute effect). According to Köhler theory (Köhler, 1936), increased uptake of SOA to the aqueous phase promotes hygroscopic growth, as well as atmospheric cloud formation by lowering the humidity threshold for droplet activation (e.g., Prisle et al., 2010; Hansen et al., 2015).
We applied carbon and oxygen K-edge XAS using synchrotron radiation to study aqueous solutions of atmospheric highly oxygenated organics, glyoxal and methylglyoxal. We recorded absorption spectra for the carbon and oxygen K edges and we measured as a reference also the oxygen K-edge spectrum of aqueous glycerol.
Glyoxal, to the sensitivity of our measurements, was found to be fully hydrated in aqueous solutions, as no peaks related to transitions in the C=O group were identified in our spectra. C 1s XAS of methylglyoxal had two well-defined peaks before the broad absorption continuum. Based on quantum chemical calculations, these peaks were assigned to C=C and C–OH(CH2) moieties of the enol form of monohydrated methylglyoxal. Transitions in C=O and C–H functional groups contributed to the C 1s XAS as broad shoulders in the energy range from 286.5–288.6 eV. They are found in the unhydrated and monohydrated forms of the compound and also in products of keto–enol tautomerism followed by aldol condensation reactions.
In the carbon K-edge spectra we did not observe significant changes with the addition of salts. Our observation excludes any significant organic–inorganic interactions that would change the abundances of different hydrated forms and does not reveal the appearance of new species from such interactions. However, XAS might not be sufficiently sensitive to see additional changes to the hydrate formation equilibrium, as, e.g., demonstrated computationally by Kurtén et al. (2014). As a rough estimate of the sensitivity, even at the highest concentration of 2 M, we were not able to identify any forms of glyoxal containing aldehyde groups, even if abundances up to 2 % have previously been reported (Malik and Joens, 2000).
The oxygen K-edge spectra for aqueous solutions were similar to those of pure water. Organic and inorganic solutes did not remarkably modify the water network at the studied concentrations, except in the case of Na2SO4: a small shift of the pre-peak to higher absorption energies and an increase in intensity of the first feature after the main absorption edge at 538 eV due to strong interactions of Na+ and SO ions with the atoms of water. The change in the shape of the spectra does not depend on the organic component. Thus, based on our study, the salting effects in water solutions of glyoxal and methylglyoxal upon the addition of Na2SO4 would originate from changes in the structure of water by SO anions, rather than interactions with the organic.
Our study presents the first experimental verification that methylglyoxal in water solution contains not only monohydrated and dihydrated forms of the compound but also other chemical species with enol structures. The results contribute to explain the relatively high contribution of glyoxal and methylglyoxal to atmospheric SOA, despite their high saturation vapor pressures.
The data of this study have been deposited in the open-access repository Zenodo and can be accessed at https://doi.org/10.5281/zenodo.4307925 (Michailoudi et al., 2020).
The supplement related to this article is available online at: https://doi.org/10.5194/acp-21-2881-2021-supplement.
NLP conceived, planned and supervised the project and secured beam time and funding. GM, HY, MP, NLP and MH carried out the experiments on liquid samples. MN performed the gas-phase measurements of glyoxal and methylglyoxal. NK performed the quantum chemical calculations. GM analyzed the experimental data with supervision and assistance of MP. All the authors contributed to discussions on the results. GM wrote the paper with assistance of JJL and contributions from all co-authors.
The authors declare that they have no conflict of interest.
We thank the staff of BL3U beamline of the UVSOR-III for their support in conducting experiments.
This project has received funding from the European Research Council (ERC) under the European Union's Horizon 2020 research and innovation program (project SURFACE, grant agreement no. 717022). Nønne L. Prisle, Jack J. Lin, Minna Patanen and Marko Huttula gratefully acknowledge funding from the Academy of Finland (grant nos. 308238, 314175, 331532 and 296338). This project has received funding from the European Union's Horizon 2020 research and innovation program under the Marie Skłodowska-Curie (grant agreement no. 713606).
This paper was edited by Frank Keutsch and reviewed by four anonymous referees.
Bluhm, H., Ogletree, D. F., Fadley, C. S., Hussain, Z., and Salmeron, M.: The premelting of ice studied with photoelectron spectroscopy, J. Phys. Condens. Matter, 14, L227, https://doi.org/10.1088/0953-8984/14/8/108, 2002. a
Chen, Y., Wang, W., and Zhu, L.: Wavelength-Dependent Photolysis of Methylglyoxal in the 290–440 nm Region, J. Phys.Chem. A, 104, 11126–11131, https://doi.org/10.1021/jp002262t, 2000. a
De Haan, D. O., Corrigan, A. L., Smith, K. W., Stroik, D. R., Turley, J. J., Lee, F. E., Tolbert, M. A., Jimenez, J. L., Cordova, K. E., and Ferrell, G. R.: Secondary Organic Aerosol-Forming Reactions of Glyoxal with Amino Acids, Environ. Sci. Technol., 43, 2818–2824, https://doi.org/10.1021/es803534f, 2009a. a
De Haan, D. O., Tolbert, M. A., and Jimenez, J. L.: Atmospheric Condensed-Phase Reactions of Glyoxal with Methylamine, Geophys. Res. Lett., 36, L11819, https://doi.org/10.1029/2009GL037441, 2009b. a
Ervens, B. and Volkamer, R.: Glyoxal processing by aerosol multiphase chemistry: towards a kinetic modeling framework of secondary organic aerosol formation in aqueous particles, Atmos. Chem. Phys., 10, 8219–8244, https://doi.org/10.5194/acp-10-8219-2010, 2010. a, b, c
Flesch, R., Kosugi, N., Bradeanu, I., Neville, J., and Rühl, E.: Cluster size effects in core excitons of 1s-excited nitrogen, J. Chem. Phys., 121, 8343–8350, https://doi.org/10.1063/1.1804180, 2004. a
Frisch, M. J., Trucks, G. W., Schlegel, H. B., Scuseria, G. E., Robb, M. A., Cheeseman, J. R., Montgomery Jr., J. A., Vreven, T., Kudin, K. N., Burant, J. C., Millam, J. M., Iyengar, S. S., Tomasi, J., Barone, V., Mennucci, B., Cossi, M., Scalmani, G., Rega, N., Petersson, G. A., Nakatsuji, H., Hada, M., Ehara, M., Toyota, K., Fukuda, R., Hasegawa, J., Ishida, M., Nakajima, T., Honda, Y., Kitao, O., Nakai, H., Klene, M., Li, X., Knox, J. E., Hratchian, H. P., Cross, J. B., Bakken, V., Adamo, C., Jaramillo, J., Gomperts, R., Stratmann, R. E., Yazyev, O., Austin, A. J., Cammi, R., Pomelli, C., Ochterski, J. W., Ayala, P. Y., Morokuma, K., Voth, G. A., Salvador, P., Dannenberg, J. J., Zakrzewski, V. G., Dapprich, S., Daniels, A. D., Strain, M. C., Farkas, O., Malick, D. K., Rabuck, A. D., Raghavachari, K., Foresman, J. B., Ortiz, J. V., Cui, Q., Baboul, A. G., Clifford, S., Cioslowski, J., Stefanov, B. B., Liu, G., Liashenko, A., Piskorz, P., Komaromi, I., Martin, R. L., Fox, D. J., Keith, T., Al-Laham, M. A., Peng, C. Y., Nanayakkara, A., Challacombe, M., Gill, P. M. W., Johnson, B., Chen, W., Wong, M. W., Gonzalez, C., and Pople, J. A.: Gaussian 03, Gaussian, Inc., Wallingford, CT, 2004. a
Fu, T.-M., Jacob, D. J., Wittrock, F., Burrows, J. P., Vrekoussis, M., and Henze, D. K.: Global budgets of atmospheric glyoxal and methylglyoxal, and implications for formation of secondary organic aerosols, J. Geophys. Res.-Atmos., 113, D15303, https://doi.org/10.1029/2007JD009505, 2008. a, b
Gainar, A., Stevens, J. S., Jaye, C., Fischer, D. A., and Schroeder, S. L. M.: NEXAFS sensitivity to bond lengths in complex molecular materials: a study of crystalline saccharides, J. Phys. Chem. B, 119, 14373–14381, 2015. a
Galloway, M. M., Chhabra, P. S., Chan, A. W. H., Surratt, J. D., Flagan, R. C., Seinfeld, J. H., and Keutsch, F. N.: Glyoxal uptake on ammonium sulphate seed aerosol: reaction products and reversibility of uptake under dark and irradiated conditions, Atmos. Chem. Phys., 9, 3331–3345, https://doi.org/10.5194/acp-9-3331-2009, 2009. a, b
Hansen, A. M. K., Hong, J., Raatikainen, T., Kristensen, K., Ylisirniö, A., Virtanen, A., Petäjä, T., Glasius, M., and Prisle, N. L.: Hygroscopic properties and cloud condensation nuclei activation of limonene-derived organosulfates and their mixtures with ammonium sulfate, Atmos. Chem. Phys., 15, 14071–14089, https://doi.org/10.5194/acp-15-14071-2015, 2015. a, b
Hatsui, T., Shigemasa, E., and Kosugi, N.: Design of a Transmission Grating Spectrometer and an Undulator Beamline for Soft X-ray Emission Studies, AIP Conf. Proc., 705, 921–924, https://doi.org/10.1063/1.1757946, 2004. a
Haynes, W. M.: CRC Handbook of Chemistry and Physics, 95th Edition, CRC Handbook of Chemistry and Physics, Taylor & Francis, Boca Raton, FL, 2014. a
Huzinaga, S., Andzelm, J., Radzio-Andzelm, E., Sakai, Y., Tatewaki, H., and Klobukowsk, M.: Gaussian Basis Sets for Molecular Calculations, Elsevier, Amsterdam, 1984. a
Igawa, M., Munger, J. W., and Hoffmann, M. R.: Analysis of aldehydes in cloud- and fogwater samples by HPLC with a postcolumn reaction detector, Environ. Sci. Technol., 23, 556–561, https://doi.org/10.1021/es00063a007, 1989. a
IPCC: Climate Change 2013: The Physical Science Basis. Contribution of Working Group I to the Fifth Assessment Report of the Intergovernmental Panel on Climate Change, Cambridge University Press, Cambridge, United Kingdom and New York, NY, USA, https://doi.org/10.1017/CBO9781107415324, 2013. a
Kalberer, M., Paulsen, D., Sax, M., Steinbacher, M., Dommen, J., Prevot, A. S. H., Fisseha, R., Weingartner, E., Frankevich, V., Zenobi, R., and Baltensperger, U.: Identification of Polymers as Major Components of Atmospheric Organic Aerosols, Science, 303, 1659–1662, https://doi.org/10.1126/science.1092185, 2004. a
Kielhorn, J., Pohlenz-Michel, C., Schmidt, S., and Mangelsdorf, I.: Glyoxal, Concise Int. Chem. Assess. Doc. 57, World Health Organization, Geneva, Switzerland, 2004. a
Kliegman, J. and Barnes, R.: Glyoxal derivatives – I: Conjugated aliphatic diimines from glyoxal and aliphatic primary amines, Tetrahedron, 26, 2555–2560, https://doi.org/10.1016/S0040-4020(01)92830-3, 1970. a
Köhler, H.: The Nucleus in and the Growth of Hygroscopic Droplets, T. Faraday Soc., 32, 1152–1161, https://doi.org/10.1039/TF9363201152, 1936. a
Kosugi, N. and Kuroda, H.: Efficient methods for solving the open-shell scf problem and for obtaining an initial guess. The “one-hamiltonian” and the “partial scf” methods, Chem. Phys. Lett., 74, 490–493, https://doi.org/10.1016/0009-2614(80)85259-6, 1980. a
Kosugi, N., Shigemasa, E., and Yagishita, A.: High-resolution and symmetry-resolved oxygen K-edge spectra of O2, Chem. Phys. Lett., 190, 481–488, https://doi.org/10.1016/0009-2614(92)85177-C, 1992. a
Krizner, H. E., De Haan, D. O., and Kua, J.: Thermodynamics and Kinetics of Methylglyoxal Dimer Formation: A Computational Study, J. Phys. Chem. A, 113, 6994–7001, https://doi.org/10.1021/jp903213k, 2009. a, b, c, d
Kroll, J. A., Hansen, A. S., Møller, K. H., Axson, J. L., Kjaergaard, H. G., and Vaida, V.: Ultraviolet Spectroscopy of the Gas Phase Hydration of Methylglyoxal, ACS Earth Space Chem., 1, 345–352, https://doi.org/10.1021/acsearthspacechem.7b00054, 2017. a
Kroll, J. H., Ng, N. L., Murphy, S. M., Varutbangkul, V., Flagan, R. C., and Seinfeld, J. H.: Chamber Studies of Secondary Organic Aerosol Growth by Reactive Uptake of Simple Carbonyl Compounds, J. Geophys. Res., 100, D23207, https://doi.org/10.1029/2005JD006004, 2005. a
Kua, J., Hanley, S. W., and De Haan, D. O.: Thermodynamics and Kinetics of Glyoxal Dimer Formation: A Computational Study, J. Phys. Chem. A, 112, 66–72, https://doi.org/10.1021/jp076573g, 2008. a, b, c, d
Kukk, E., Snell, G., Bozek, J. D., Cheng, W.-T., and Berrah, N.: Vibrational structure and partial rates of resonant Auger decay of the N 1s→2π core excitations in nitric oxide, Phys. Rev. A, 63, 062702, https://doi.org/10.1103/PhysRevA.63.062702, 2001. a
Kukk, E., Ueda, K., Hergenhahn, U., Liu, X.-J., Prümper, G., Yoshida, H., Tamenori, Y., Makochekanwa, C., Tanaka, T., Kitajima, M., and Tanaka, H.: Violation of the Franck-Condon principle due to recoil effects in high energy molecular core-level photoionization, Phys. Rev. Lett., 95, 133001, https://doi.org/10.1103/PhysRevLett.95.133001, 2005. a
Kurtén, T., Elm, J., Prisle, N. L., Mikkelsen, K. V., Kampf, C. J., Waxman, E. M., and Volkamer, R.: Computational Study of the Effect of Glyoxal–Sulfate Clustering on the Henry's Law Coefficient of Glyoxal, J. Phys. Chem. A, 119, 4509–4514, https://doi.org/10.1021/jp510304c, 2014. a, b
Latham, K. G., Simone, M. I., Dose, W. M., Allen, J. A., and Donne, S. W.: Synchrotron based NEXAFS study on nitrogen doped hydrothermal carbon: Insights into surface functionalities and formation mechanisms, Carbon, 114, 566–578, https://doi.org/10.1016/j.carbon.2016.12.057, 2017. a, b
Lee, A. K. Y., Zhao, R., Li, R., Liggio, J., Li, S.-M., and Abbatt, J. P. D.: Formation of Light Absorbing Organo-Nitrogen Species from Evaporation of Droplets Containing Glyoxal and Ammonium Sulfate, Environ. Sci. Technol., 47, 12819–12826, https://doi.org/10.1021/es402687w,, 2013. a, b
Lide, D. R.: CRC Handbook of Chemistry and Physics, 85th Edition, CRC Handbook of Chemistry and Physics, CRC Press, Boca Raton, FL, 2004. a
Liggio, J., Li, S.-M., and McLaren, R.: Reactive uptake of glyoxal by particulate matter, J. Geophys. Res.-Atmos., 110, D10304, https://doi.org/10.1029/2004JD005113, 2005. a
Liggo, J., Li, S.-M., and McLaren, R.: Heterogeneous Reactions of Glyoxal on Particulate Matter: Identification of Acetals and Sulfate Esters, Environ. Sci. Technol., 39, 1532–1541, https://doi.org/10.1021/es048375y, 2005. a
Malik, M. and Joens, J. A.: Temperature dependent near-UV molar absorptivities of glyoxal and gluteraldehyde in aqueous solution, Spectrochim. Acta, A, 56, 2653–2658, https://doi.org/10.1016/S1386-1425(00)00311-5, 2000. a, b, c, d
Matsumoto, K., Kawai, S., and Igawa, M.: Dominant factors controlling concentrations of aldehydes in rain, fog, dew water, and in the gas phase, Atmos. Environ., 39, 7321–7329, 2005. a
Michailoudi, G., Lin, J. J., Yuzawa, H., Nagasaka, M., Huttula, M., Kosugi, N., Kurtén, T., Patanen, M., and Prisle, N. L.: Supplementary data for the manuscript “Aqueous phase behavior of glyoxal and methylglyoxal observed with carbon and oxygen K-edge X-ray absorption spectroscopy” [Data set], Zenodo, https://doi.org/10.5281/zenodo.4307925, 2020. a
Montoya, M. and Mellado, J.: Use of convolutive potential sweep voltammetry in the calculation of hydration equilibrium constants of α-dicarbonyl compounds, J. Electroanal. Chem., 370, 183–187, https://doi.org/10.1016/0022-0728(93)03203-2, 1994. a
Munger, J. W., Jacob, D. J., Daube, B. C., Horowitz, L., Keene, W., and Heikes, B. G.: Formaldehyde, glyoxal, and methylglyoxal in air and cloudwater at a rural mountain site in central Virginia, J. Geophys. Res.-Atmos., 100, 9325–9333, 1995. a
Nagasaka, M., Mochizuki, K., Leloup, V., and Kosugi, N.: Local structures of methanol–water binary solutions studied by soft X-ray absorption spectroscopy, J. Phys. Chem. B, 118, 4388–4396, 2014. a
Nagasaka, M., Yuzawa, H., and Kosugi, N.: Development and application of in situ/operando soft X-ray transmission cells to aqueous solutions and catalytic and electrochemical reactions, J. Electron Spectrosc., 200, 293–310, https://doi.org/10.1016/j.elspec.2015.05.012, 2015. a
Nagasaka, M., Yuzawa, H., and Kosugi, N.: Interaction between water and alkali metal ions and its temperature dependence revealed by oxygen K-edge x-ray absorption spectroscopy, J. Phys. Chem. B, 121, 10957–10964, https://doi.org/10.1021/acs.jpcb.7b09789, 2017. a, b
Nagasaka, M., Yuzawa, H., Horigome, T., and Kosugi, N.: Reliable absorbance measurement of liquid samples in soft X-ray absorption spectroscopy in transmission mode, J. Electron Spectrosc., 224, 93–99, https://doi.org/10.1016/j.elspec.2017.05.004, 2018. a, b, c
Nemet, I., Vikić-Topić, D., and Varga-Defterdarović, L.: Spectroscopic studies of methylglyoxal in water and dimethylsulfoxide, Bioorg. Chem., 32, 560–570, https://doi.org/10.1016/j.bioorg.2004.05.008, 2004. a, b, c
Nilsson, A., Nordlund, D., Waluyo, I., Huang, N., Ogasawara, H., Kaya, S., Bergmann, U., Näslund, L.-Å., Öström, H., Wernet, P., Andersson, K. J., Schiros, T., and Pettersson, L. G. M.: X-ray absorption spectroscopy and X-ray Raman scattering of water and ice; an experimental view, J. Electron Spectrosc., 177, 99–129, https://doi.org/10.1016/j.elspec.2010.02.005, 2010. a
Niskanen, J., Sahle, C. J., Juurinen, I., Koskelo, J., Lehtola, S., Verbeni, R., Müller, H., Hakala, M., and Huotari, S.: Protonation Dynamics and Hydrogen Bonding in Aqueous Sulfuric Acid, J. Phys. Chem. B, 119, 11732–11739, https://doi.org/10.1021/acs.jpcb.5b04371, 2015. a, b, c
Nozière, B., Dziedzic, P., and Córdova, A.: Products and Kinetics of the Liquid-Phase Reaction of Glyoxal Catalyzed by Ammonium Ions (NH), J. Phys. Chem. A, 113, 231–237, https://doi.org/10.1021/jp8078293, 2009. a
Perry, R., Green, D., and Maloney, J.: Perry's Chemical Engineers' Handbook, no. τ. 1-3 in International student edition, McGraw-Hill, New York, 1997. a
Prisle, N. L., Raatikainen, T., Laaksonen, A., and Bilde, M.: Surfactants in cloud droplet activation: mixed organic-inorganic particles, Atmos. Chem. Phys., 10, 5663–5683, https://doi.org/10.5194/acp-10-5663-2010, 2010. a
Pylkkänen, T., Giordano, V. M., Chervin, J.-C., Sakko, A., Hakala, M., Soininen, J. A., Hämäläinen, K., Monaco, G., and Huotari, S.: Role of Non-Hydrogen-Bonded Molecules in the Oxygen K-Edge Spectrum of Ice, J. Phys. Chem. B, 114, 3804–3808, https://doi.org/10.1021/jp912208v, 2010. a
Russell, L. M., Maria, S. F., and Myneni, S. C. B.: Mapping organic coatings on atmospheric particles, Geophys. Res. Lett., 29, 26–1–26–4, https://doi.org/10.1029/2002GL014874, 2002. a, b
Saxena, P. and Hildemann, L.: Water-Soluble Organics in Atmospheric Particles: A Critical Review of the Literature and Application of Thermodynamics to Identify Candidate Compounds, J. Atmos. Chem., 24, 57–109, https://doi.org/10.1007/BF00053823, 1996. a
Sellberg, J. A., Kaya, S., Segtnan, V. H., Chen, C., Tyliszczak, T., Ogasawara, H., Nordlund, D., Pettersson, L. G. M., and Nilsson, A.: Comparison of x-ray absorption spectra between water and ice: New ice data with low pre-edge absorption cross-section, J. Chem. Phys., 141, 034507–034513, https://doi.org/10.1063/1.4890035, 2014. a
Solomon, D., Lehmann, J., Kinyangi, J., Liang, B., Heymann, K., Dathe, L., Hanley, K., Wirick, S., and Jacobsen, C.: Carbon (1s) NEXAFS spectroscopy of biogeochemically relevant reference organic compounds, Soil Sci. Soc. Am. J., 73, 1817–1830, https://doi.org/10.2136/sssaj2008.0228, 2009. a
Stavrakou, T., Müller, J.-F., De Smedt, I., Van Roozendael, M., Kanakidou, M., Vrekoussis, M., Wittrock, F., Richter, A., and Burrows, J. P.: The continental source of glyoxal estimated by the synergistic use of spaceborne measurements and inverse modelling, Atmos. Chem. Phys., 9, 8431–8446, https://doi.org/10.5194/acp-9-8431-2009, 2009. a, b
Stöhr, J.: NEXAFS spectroscopy,Springer, Berlin, Heidelberg, https://doi.org/10.1007/978-3-662-02853-7, 1992. a
Surratt, J. D., Kroll, J. H., Kleindienst, T. E., Edney, E. O., Claeys, M., Sorooshian, A., Ng, N. L., Offenberg, J. H., Lewandowski, M., Jaoui, M., Flagan, R. C., and Seinfeld, J. H.: Evidence for Organosulfates in Secondary Organic Aerosol, Environ. Sci. Technol., 41, 517–527, https://doi.org/10.1021/es062081q, 2007. a
Tivanski, A. V., Hopkins, R. J., Tyliszczak, T., and Gilles, M. K.: Oxygenated Interface on Biomass Burn Tar Balls Determined by Single Particle Scanning Transmission X-ray Microscopy, J. Phys. Chem. A, 111, 5448–5458, https://doi.org/10.1021/jp070155u, 2007. a
Toivola, M., Prisle, N. L., Elm, J., Waxman, E. M., Volkamer, R., and Kurtén, T.: Can COSMOTherm Predict a Salting in Effect?, J. Phys. Chem. A, 121, 6288–6295, https://doi.org/10.1021/acs.jpca.7b04847, 2017. a
Tyndall, G. S., Staffelbach, T. A., Orlando, J. J., and Calvert, J. G.: Rate coefficients for the reactions of OH radicals with Methylglyoxal and Acetaldehyde, Int. J. Chem. Kinet., 27, 1009–1020, https://doi.org/10.1002/kin.550271006, 1995. a
van Pinxteren, D., Fomba, K. W., Mertes, S., Müller, K., Spindler, G., Schneider, J., Lee, T., Collett, J. L., and Herrmann, H.: Cloud water composition during HCCT-2010: Scavenging efficiencies, solute concentrations, and droplet size dependence of inorganic ions and dissolved organic carbon, Atmos. Chem. Phys., 16, 3185–3205, https://doi.org/10.5194/acp-16-3185-2016, 2016. a
Velasco-Velez, J.-J., Wu, C. H., Pascal, T. A., Wan, L. F., Guo, J., Prendergast, D., and Salmeron, M.: The structure of interfacial water on gold electrodes studied by x-ray absorption spectroscopy, Science, 346, 831–834, https://doi.org/10.1126/science.1259437, 2014. a
Volkamer, R., Jimenez, J. L., San Martini, F., Dzepina, K., Zhang, Q., Salcedo, D., Molina, L. T., Worsnop, D. R., and Molina, M. J.: Secondary organic aerosol formation from anthropogenic air pollution: Rapid and higher than expected, Geophys. Res. Lett., 33, L17811, https://doi.org/10.1029/2006GL026899, 2006. a
Waluyo, I., Nordlund, D., Bergmann, U., Schlesinger, D., Pettersson, L. G., and Nilsson, A.: A different view of structure-making and structure-breaking in alkali halide aqueous solutions through x-ray absorption spectroscopy, J. Chem. Phys., 140, 244506, https://doi.org/10.1063/1.4881600, 2014. a
Wang, L., Khalizov, A. F., Zheng, J., Xu, W., Ma, Y., Lal, V., and Zhang, R. Y.: Atmospheric Nanoparticles Formed from Heterogeneous Reactions of Organics., Nat. Geosci., 3, 238–242, https://doi.org/10.1038/ngeo778, 2010. a
Wasa, T. and Musha, S.: Polarographic Behavior of Glyoxal and Its Related Compounds, Bull. Univ. Osaka Prefect. Ser. A, 19, 169–180, 1970. a
Waxman, E. M., Elm, J., Kurtén, T., Mikkelsen, K. V., Ziemann, P. J., and Volkamer, R.: Glyoxal and Methylglyoxal Setschenow Salting Constants in Sulfate, Nitrate, and Chloride Solutions: Measurements and Gibbs Energies, Environ. Sci. Technol., 49, 11500–11508, https://doi.org/10.1021/acs.est.5b02782, 2015. a
Yeh, J. and Lindau, I.: Atomic subshell photoionization cross sections and asymmetry parameters: , At. Data Nucl. Data Tables, 32, 1–155, 1985. a
Yu, G., Bayer, A. R., Galloway, M. M., Korshavn, K. J., Fry, C. G., and Keutsch, F. N.: Glyoxal in Aqueous Ammonium Sulfate Solutions: Products, Kinetics and Hydration Effects, Environ. Sci. Technol., 45, 6336–6342, https://doi.org/10.1021/es200989n, 2011. a, b, c, d