the Creative Commons Attribution 4.0 License.
the Creative Commons Attribution 4.0 License.
 | 22 Feb 2021
Measurement report: Hydrolyzed amino acids in fine and coarse atmospheric aerosol in Nanchang, China: concentrations, compositions, sources and possible bacterial degradation state
Ren-Guo Zhu
Hua-Yun Xiao
Li Luo
Hongwei Xiao
Zequn Wen
Yuwen Zhu
Xiaozheng Fang
Yuanyuan Pan
Zhenping Chen
Amino acids (AAs) are relevant for nitrogen cycles, climate change and public health. Their size distribution may help to uncover the source, transformation and fate of protein in the atmosphere. This paper explores the use of compound-specific δ15N patterns of hydrolyzed amino acid (HAA), δ15N values of total hydrolyzed amino acid (δ15NTHAA), degradation index (DI) and the variance within trophic AAs (∑V) as markers to examine the sources and processing history of different sizes of particle in the atmosphere. Two weeks of daily aerosol samples from five sampling sites in the Nanchang area (Jiangxi Province, China) and samples of main emission sources of AAs in aerosols (biomass burning, soil and plants) were collected (Zhu et al., 2020). Here, we measured the concentrations and δ15N values of each HAA in two size-segregated aerosol particles (> 2.5 µm and PM2.5). Our results showed that the average concentrations of THAA in fine particles was nearly 6 times higher than that in coarse particles (p < 0.01) and composition profiles of fine and coarse particles were quite different from each other. The δ15N values of hydrolyzed glycine and THAA in both fine and coarse particles were typically in the range of those from biomass burning, soil and plant sources. Moreover, the average difference in the δ15NTHAA value between fine and coarse particles was smaller than 1.5 ‰. These results suggested that the sources of atmospheric HAAs for fine and coarse particles might be similar. Meanwhile, compared to fine particles, significantly lower DI values (p < 0.05), “scattered” δ15N distribution in trophic AA and higher ∑V values (p < 0.05) were observed in coarse particles. But the difference in δ15N values of source AA (glycine, serine, phenylalanine and lysine) and THAA between coarse particles and fine particles was relatively small. It is likely that AAs in coarse particles have advanced bacterial degradation states compared to fine particles. Besides that, the significant increase in DI values and a decrease in ∑V values for coarse particles were observed on days on which precipitation fell (p < 0.05). This implies that “fresh” AAs in coarse particles were likely released following the precipitation.
- Article
(2707 KB) - Full-text XML
-
Supplement
(432 KB) - BibTeX
- EndNote


Recently, an increasing number of researchers highlight the importance of amino acids (AAs) in the atmosphere because AA is considered to be one of the most important organic nitrogen compounds in atmosphere (Zhang et al., 2002; Matos et al., 2016). Moreover, AAs are bioavailable and can be directly utilized by plant and soil communities (Wedyan and Preston, 2008; Song et al., 2017). Its key role in atmosphere–biosphere nutrient cycling and the global nitrogen cycle has aroused great concern (Samy et al., 2013; Zhang and Anastasio, 2003). Besides that, AAs and proteins are important constituents of allergenic bioaerosol (Miguel et al., 1999; Huffman et al., 2013). The distribution of AAs and proteins in different particle sizes will determine whether these compounds can reach the pulmonary alveoli and the allergenicity of aerosols (Di Filippo et al., 2014). And the distribution of AAs associated with different particle sizes can help to trace the sources and transformation of atmospheric aerosols (Barbaro et al., 2019; Feltracco et al., 2019; Di Filippo et al., 2014).
The sources of atmospheric proteinaceous matter are very complex. Primary biological aerosol particles (e.g, plants, soil, pollen, bacteria, fungi, spores and debris of living things), biomass burning, and agricultural activities are generally suggested to be the main contributing sources of atmospheric AAs (Matos et al., 2016; Mace et al., 2003). It is still unclear whether the fine and coarse particles of AAs are influenced by different sources.
Compound-specific nitrogen isotope analysis of individual amino acids provides an opportunity to offer the key information on widely varied photochemical processes and origins of proteinaceous matter in the atmosphere. Nitrogen source information and any possible nitrogen isotopic fractionation caused by transformation processes could be held by the δ15N-AA pattern (McCarthy et al., 2007; Bol et al., 2002). At the same time, the δ15N value of total hydrolysable AA (δ15NAvg-THAA), calculated as the average molar-weighted δ15N value of individual AA, has been used as a proxy for total protein δ15N value (McCarthy et al., 2013). However, to our knowledge, no study has used the δ15N-AA pattern and δ15NAvg-THAA values to identify the sources of AAs distributed in different particle sizes.
It is generally accepted that AAs in aerosols are mainly controlled by abiotic photochemical ageing processes. On the contrary, the biological degradation of AAs in aerosols are neglected. This can be attributed to two factors. First, the sources and transformation pathways of protein matter and AAs in aerosols are highly complex (Wang et al., 2019; Zhu et al., 2020). Second, the residence time of protein matter in aerosols is relatively short (Papastefanou, 2006). Admittedly, bacteria and fungi are ubiquitous and can be observed in all PM samples where people look for them, and this has been done routinely for many decades (Bauer et al., 2002; Bowers et al., 2013; Huffman et al., 2013; Wei et al., 2016; Wei et al., 2019). In situ bacterial degradation processes occurred in the aerosols, and the cloud water was also observed (Amato et al., 2007; Husárová et al., 2011). Unfortunately, bacterial degradation of atmospheric AAs is limited. For example, see two studies on marine aerosols by Wedyan and Preston (2008) and Kuznetsova et al. (2005) and one study on precipitation by Yan et al. (2015). The degradation index (DI) proposed by Dauwe and Middelburg (1998) has been widely used to assess the degradation state of organic materials (OMs) in terrestrial, aquatic and marine environments (Dauwe and Middelburg, 1998; Wang et al., 2018; Dauwe et al., 1999). This value is based on the molar percentage (Mol %) of the amino acid pool, and higher DI values denote a more “fresh” state of protein matter. However, DI values of AAs in aerosol particles and whether bacterial degradation plays a role in the levels and compositions of AAs in different particle sizes are still unknown.
A consensus has recently been reached on whether selective use of the 15N depleted or enriched trophic AAs during bacterial heterotrophy processes can lead to large nitrogen isotopic fractionation in trophic AAs (McCarthy et al., 2004). Thus, substantial δ15N pattern shifts of trophic AAs can index bacterial heterotrophy processes. ∑V, defined as the average deviation in the δ15N values of the trophic AA, has therefore been established to track the degree of bacterial degradation of AAs in marine and terrestrial environments (McCarthy et al., 2007; Philben et al., 2018; Yamaguchi et al., 2017).
In the present work, we sought to improve our understanding of AAs distributed in different particle sizes. We measured the concentrations and δ15N values of each hydrolyzed amino acid in two size-segregated aerosol particles (> 2.5 µm and PM2.5) in aerosols collected in the Nanchang area (southeastern China). Furthermore, δ15N values of Gly and THAA in fine and coarse particles were compared with those in the main emission sources (biomass burning, soil and plant sources) to identify the potential sources of fine and coarse particles. In addition, the DI, ∑V value and δ15N value patterns of hydrolyzed AA in fine and coarse particles were analysed to explore the possible bacterial degradation of HAAs in fine and coarse particles.
2.1 Sample collection
Aerosol samples were collected at the five locations including urban, town, suburban, agricultural area and forest locations in the Nanchang area (southern China) from 30 April to 13 May 2019, using a high-volume air sampler (KC-1000, Qingdao Laoshan Electronic Instrument company, China) at a flow rate of 1.05 ± 0.03 m3 min−1. The characteristics of the five sampling area are defined in Table S1. The sampler allows particles of different aerodynamic diameters to be separated in two stages: with diameter (D) above 2.5 µm (coarse particles) and D≤ 2.5 µm (fine particles). Quartz fibre filters were used, and filters were heated at 450∘ for 10 h to remove any organics before sampling. Aerosol sampling was conducted at the rooftop of the building in each site, about 10 m above the ground except for the agricultural area where the sampler was placed in a clear spot about 1000 m away from the runway. The sampling time for each sample was from 17:00 to 16:30 LT (local time) of the next day. More details on the sample collection are provided in Zhu et al. (2020).
Forest soil samples were collected at the top 10 cm of the evergreen broad-leaved forest soil in the Nanchang area (28.8∘ N, 115.8∘ E). Paddy soil samples were collected from the topmost 10 cm layer of rice cultivation soil (28.2∘ N. 115.1∘ E). Road soil was collected from highway topsoil (28.7∘ N, 115.8∘ E). For each type of soil sample, triplicate representative soil samples (approximately 100 g) were collected.
Masson pine (Pinus massoniana (Lamb.)) and camphor (Cinnamomum camphora), common vegetation in the study area (28.8∘ N, 115.8∘ E), were collected during May 2019. Approximately 4–6 g of pine needles or camphor leaves were collected from the outer branches in the east, south, north and west directions (about 10 m above the ground). We collected five to six representative samples for each kind of leaf. All fresh samples were placed in plastic bags, labelled and stored in a chilled box immediately. In the laboratory, all plant and soil samples were freeze-dried. Then, freeze-dried samples were stored at −80 ∘C until further use.
Aerosols from straw burning were sampled by pumping into a high-volume air sampler (KC-1000, Qingdao Laoshan Electronic Instrument Company, China) from the funnel on the combustion furnace during July 2017. The combustion furnace is a domestic furnace widely used by local residents.
2.2 Analyses of the concentration and δ15N value of individual hydrolyzed amino acid (HAA)
For hydrolyzed AA analysis, samples were prepared using a modified version of Wang et al. (2019) and Ren et al. (2018). In total, of each fine-aerosol filter (∼ 80 m3 of air) or of each coarse-aerosol filter (∼ 366 m3 of air) was broken into small pieces and placed in a glass hydrolysis tube. Prior to the hydrolysis, 25 µL of ascorbic acid at a concentration of 20 µg µL−1 (500 µg absolute) was added to each filter sample. Then, 10 mL and 6 M of hydrochloric acid (HCl) was used to convert all of the combined AAs to free AAs. To avoid oxidation of AAs, the hydrolysis tube was flushed with nitrogen and tightly sealed before hydrolysis. The mixture was later placed in an oven at 110 ∘ C for 24 h.
For plant and soil samples, approximately 30–40 mg of plant or 500–600 mg of soil was ground separately in liquid nitrogen into fine powders using a mortar and pestle. Then, well ground and homogenized soil and plant power were hydrolyzed in the same way as the aerosol samples.
After cooling to room temperature, the hydrolyzed solution was dried with a stream of nitrogen and HCl was removed. The dried solution was then redissolved in 0.1 M HCl and purified by a cation exchange column (Dowex 50 W X 8H+, 200–400 mesh; Sigma-Aldrich, St Louis, MO, USA). Later, tert-butyldimethylsilyl (tBDMS) derivatives of HAAs were prepared following the method described by our previous study (Zhu et al., 2018).
The concentrations of HAAs were analysed using a gas chromatograph–mass spectrometer (GC-MS). The GC-MS instrument was composed of a Thermo Scientific TRACE GC (Thermo Scientific, Bremen, Germany) connected into a Thermo Scientific ISQ QD single quadrupole MS. The single quadrupole MS was operated in electron impact ionization (70 eV electron energy) and full scan mode. The temperatures of the transfer line and ion source were 250 and 200 ∘C, respectively. More details on quality assurance and control (recoveries, linearity, detection limits, quantitation limits and corresponding effective limits in the aerosol samples of AAs) are provided in Zhu et al. (2020). δ15N values of AA-tBDMS derivatives were analysed using a Thermo Trace GC (Thermo Scientific, Bremen, Germany) and a conflo IV interface (Thermo Scientific, Bremen, Germany) interfaced with a Thermo Delta V IRMS (Thermo Scientific, Bremen, Germany). The analytical precision (SD, n= 3) of δ15N was better than ±1.4 ‰. Moreover, α-aminobutyric acid (AABA) with known δ15N value (−8.17 ‰ ± 0.03 ‰) was added in each sample to check the accuracy of the isotope measurements. The analytical run was accepted when the differences of δ15N values of AABA between GC-IRMS and EA-IRMS values were at most ±1.5 ‰. Each reported value is a mean of at least three δ15N determinations. For more details of the analyses of HAA δ15N values refer to our previous publication (Zhu et al., 2018).
The concentrations and δ15N value of Cys, Trp, Asn and Gln in HAAs could not be determined using this method because, under strongly acidic conditions, Cys and Trp are destroyed, and Asn and Gln are converted to Asp and Glu, respectively. The concentration and δ15N value of hydrolysable Asp represents the sum of Asp and Asn; the concentration and δ15N value of hydrolysable Glu represents the sum of Glu and Gln.
2.3 DI index
The degradation process could significantly modify the mole composition of protein amino acids (Dauwe et al., 1999). Accordingly, a quantitative DI has been developed based on the mole composition of a hydrolyzed amino acid pool. The DI was calculated using the formula Eq. (1) originally proposed by Dauwe et al. (1999):
where DI is the degradation index; Var is the Mol % of each individual HAA; Avgi and SDi are the average Mol % and standard deviation of each HAA in our data set, respectively; and PC1 is the loading of the amino acid i obtained from principal-component analysis (Table S2).
2.4 δ15N values
The natural abundance of 15N was calculated as δ15N values in per mille (‰), using atmospheric N2 as the international standard:
where R is the ratio of mass 29 to mass 28.
A derivatized mixture of 20 amino acid standards (Ala, Gaba, Arg, Asn, Asp, Gln, Glu, Gly, His, Ile, Leu, Lys, Met, Phe, Pro, Ser, Thr, Trp, Tyr and Val) and several international amino acid standards (Ala, Gly3, Gly4, Phe, USGS40, USGS41a and Val) with known δ15N values (−26.35 ‰ to +47.55 ‰) was prepared to assess the isotope measurement reproducibility and normalize the δ15N values of the amino acids in the samples (Zhu et al., 2018).
2.5 ∑V parameter
The ∑V parameter is defined as the average absolute deviation in the δ15N values of the trophic AA (including Ala, Asp, Glu, Ile, Leu and Pro) (McCarthy et al., 2007). This parameter has been used as a proxy for the degree of heterotrophic resynthesis and calculated by Eq. (3):
where χAA is defined as the deviation of the δ15N of each trophic amino acid from the δ15N of the mean of trophic amino acids (δ15N AA − average δ15N of Ala, Asp, Glu, Ile, Leu and Pro), and n is the total number of trophic amino acids used in the calculation.
2.6 δ15NTHAA values
The δ15N values of total hydrolysable amino acids (δ15NTHAA) are calculated as the mole percent weighted sum of the δ15N values of each individual HAA, following Eq. (4):
where Mol %HAA is the mole contribution of each HAA, and δ15NTHAA is the δ15N value of individual HAA.
2.7 Statistics
All statistical analyses were performed using SPSS 16.0 (SPSS Science, USA). Graphs were generated using OriginPro 2018 (OriginLab Corporation, USA) and Sigmaplot 12.5 software (SPSS Science, USA). We performed a two-way analysis of variance (ANOVA) for the concentration of THAA, the DI index, δ15NTHAA values and ∑V values, testing the effect of aerosol sizes, location and their interaction. Tukey's honestly significant difference (Tukey-HSD) test was used to evaluate which combinations of location and aerosol size were significantly different. Two-way ANOVA was also conducted for DI values, examining the effect of aerosol sizes, coefficients (obtained by using the first-principal-component score or previous reported coefficients) and their interaction. The differences in δ15NGly values for fine particles between the five sampling locations were examined using the one-way ANOVA procedure and compared using the Tukey-HSD test.
The exponential regression was analysed to evaluate changes in the DI index as a function of the concentration of THAA.
To test for changes in the concentration of THAA, DI index and ∑V values following the rain events, a two-way ANOVA was performed, testing for effects of precipitation, aerosol sizes and their interactions. Tukey-HSD test was conducted to compare the significant difference. Changes in mole percentage of each HAA's concentrations following precipitation were tested for significance by using an ANOVA procedure followed by a Tukey-HSD test to compare significant differences. For all tests, statistically significant differences were considered at p < 0.05.
3.1 Concentrations and mole-percentage composition profile of HAA in size-segregated aerosol
A total of 14 hydrolyzed amino acids (Ala, Val, Leu, Ile, Pro, Gly, Ser, Thr, Phe, Asp, Glu, Lys, His and Tyr) were found in fine and coarse aerosol samples collected in Nanchang areas during spring 2019 (Fig. 1). The average concentrations of THAA in fine and coarse particles were 2542 ± 1820 pmol m−3 and 434 ± 722 pmol m−3, respectively. The mean concentration of THAA for fine particles was nearly 6 times higher than that for coarse particles (p < 0.01) (Fig. S1).
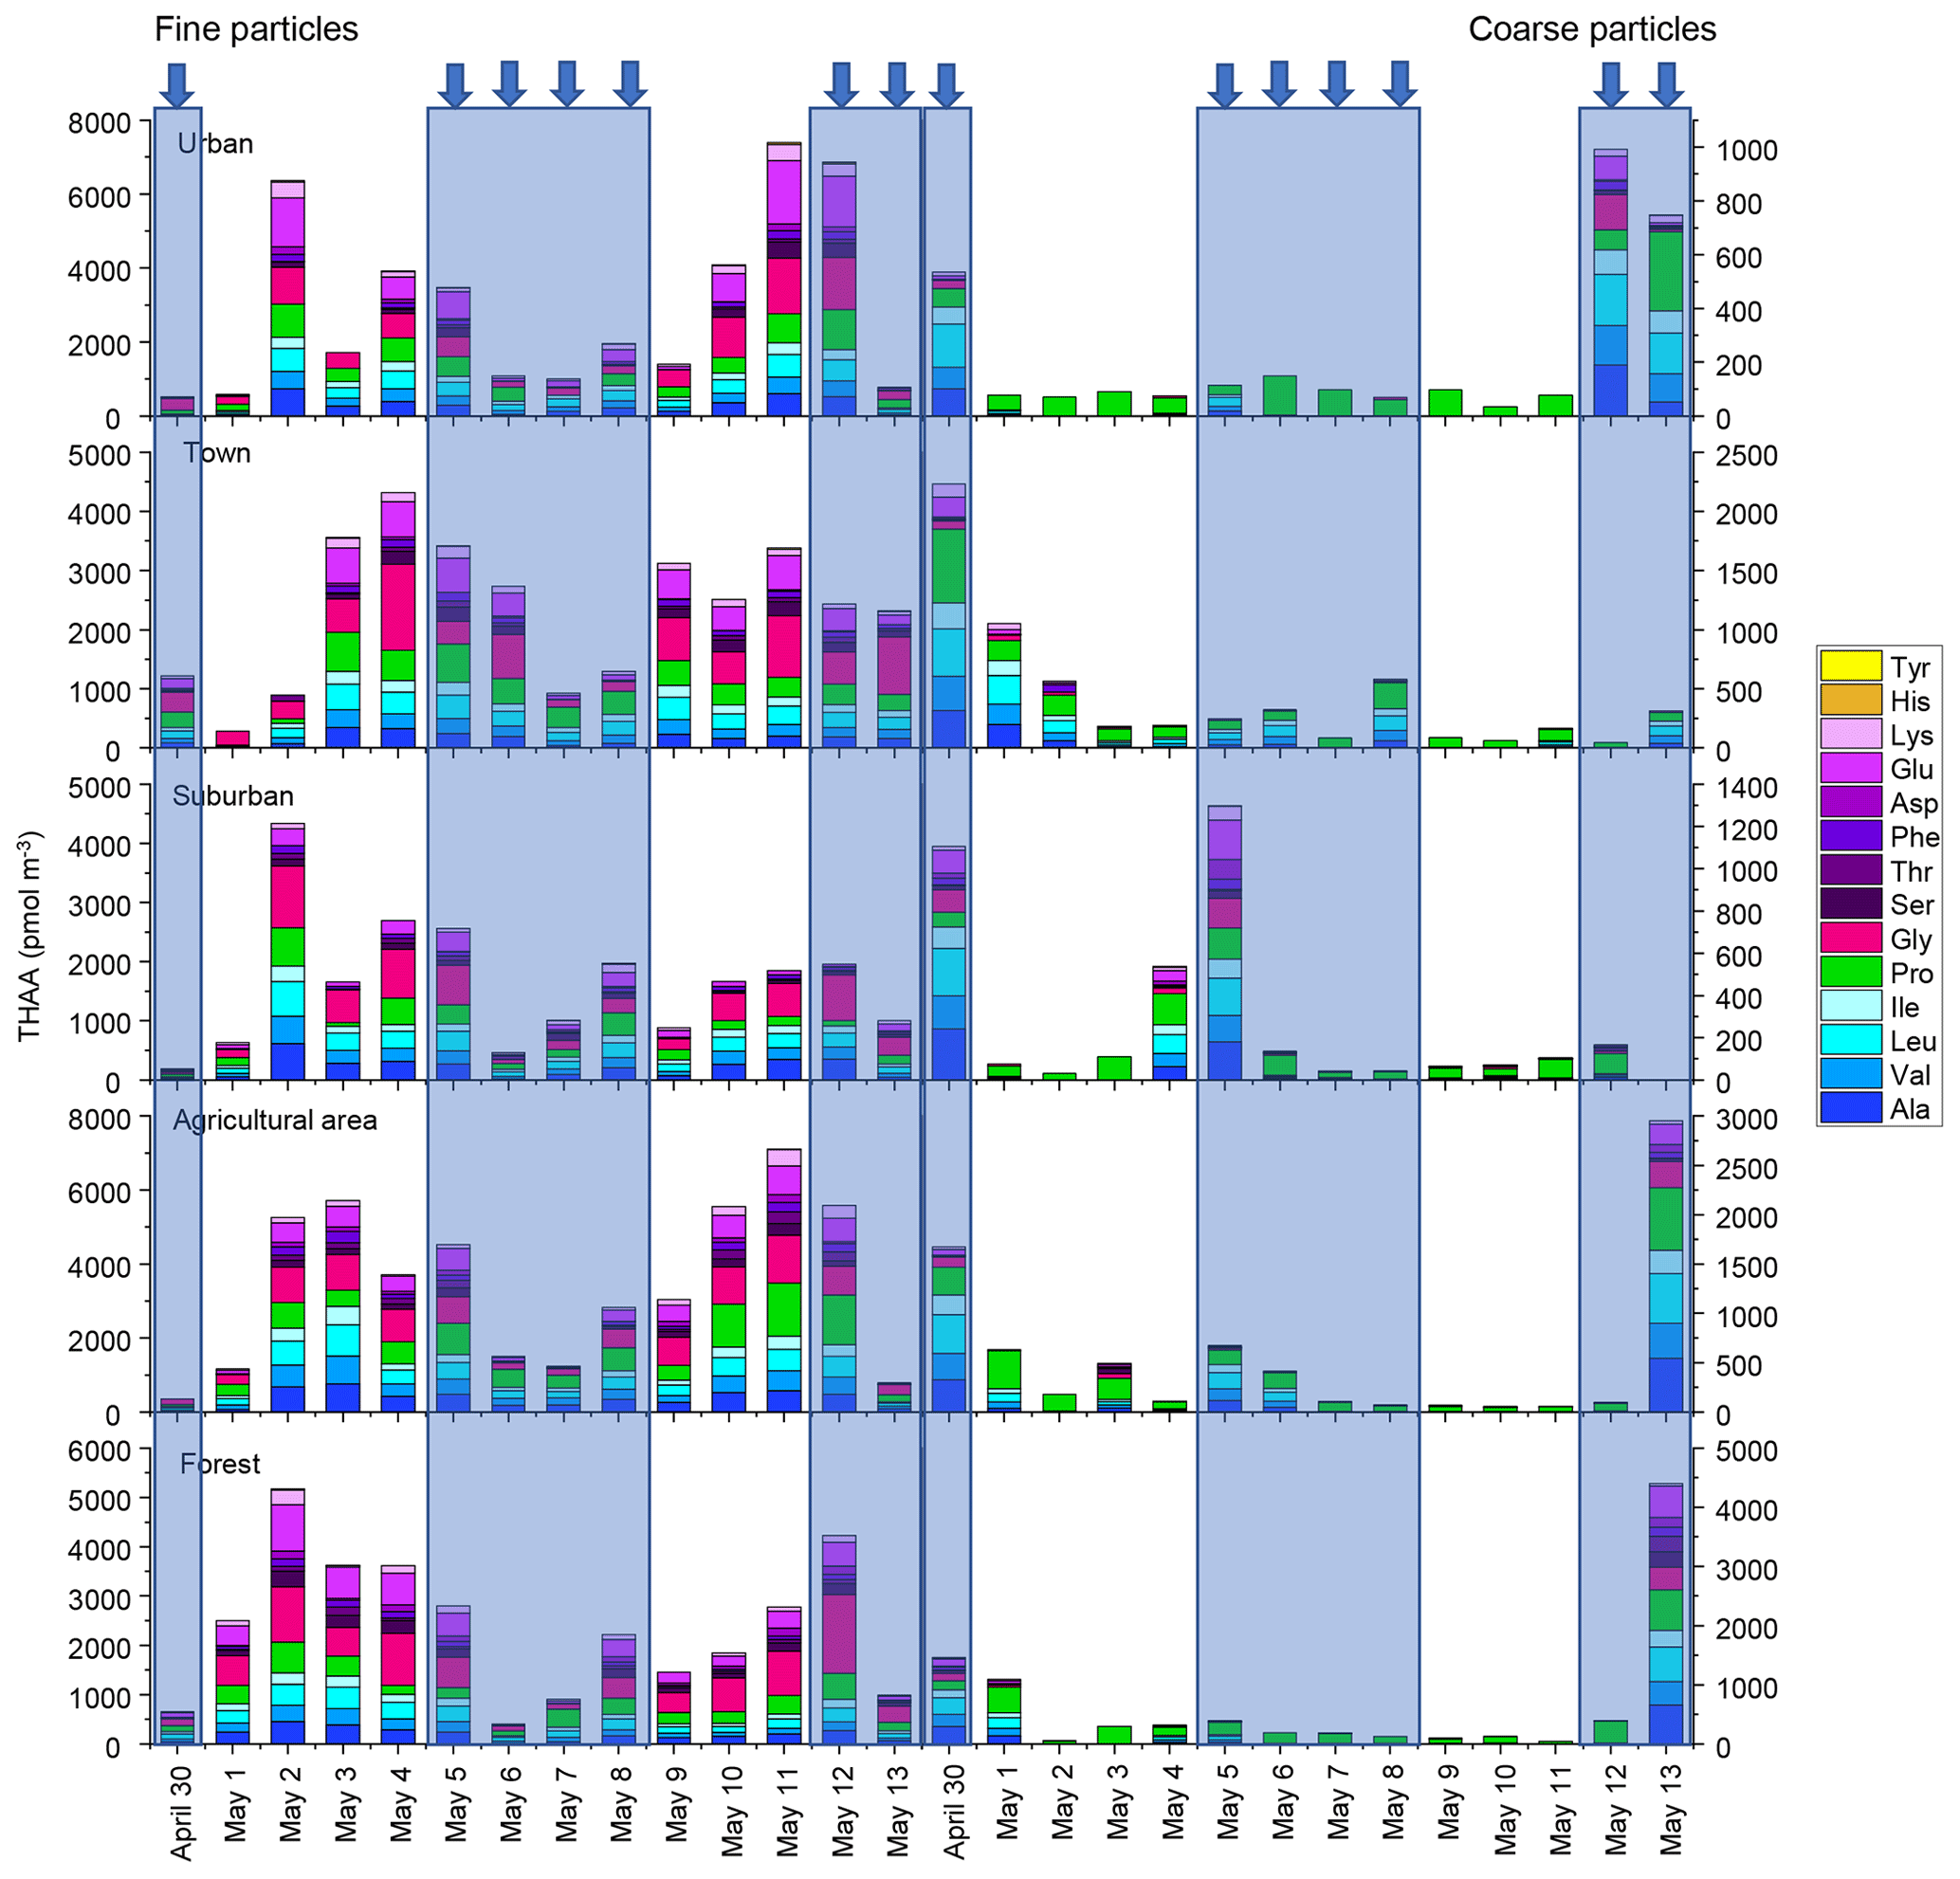
Figure 1Concentrations of hydrolyzed amino acids for fine and coarse particles in urban, town, suburban, agricultural and forest sites during 14 consecutive sampling days. The concentrations of HAAs for each sample were normalized for the total volume of air sampled. The blue arrow and shallow represent precipitation.
For fine particles, the average concentrations of THAA in the five sampling sites were significantly different (p < 0.05), with the highest mean concentration of THAA in agricultural areas (3455 ± 2203 pmol m−3), followed by those in urban (2941 ± 2443 pmol m−3), forest (2730 ± 1435 pmol m−3) and town (2314 ± 1211 pmol m−3) areas. The lowest THAA concentration occurred at a suburban site (1633 ± 1087 pmol m−3) (Fig. S1).
However, for coarse particles, the differences in THAA concentrations between the five sampling sites were not significant (p > 0.05) (Fig. S1). The mean concentration of THAA in agricultural, urban, forest, town and suburban locations was 540 ± 821, 230 ± 300, 654 ± 1152, 437 ± 583 and 291 ± 426 pmol m−3, respectively. The highest concentration of atmospheric AAs in the agricultural area would be ascribed to the enhanced agricultural activities and natural source emission (e.g. pollen grain) in spring (Xu et al., 2019).
The composition profiles of HAA in fine and coarse particles during the whole campaign are shown in Fig. 2. The composition profiles of HAA in fine particles are quite different from those in coarse particles (Fig. 2). For fine particles, Gly, Pro, Leu and Glu were the four most abundant compounds, accounting for an average of 25 ± 12 %, 17 ± 8 %, 12 ± 3 % and 11 ± 6 %, respectively, of the THAA pool.
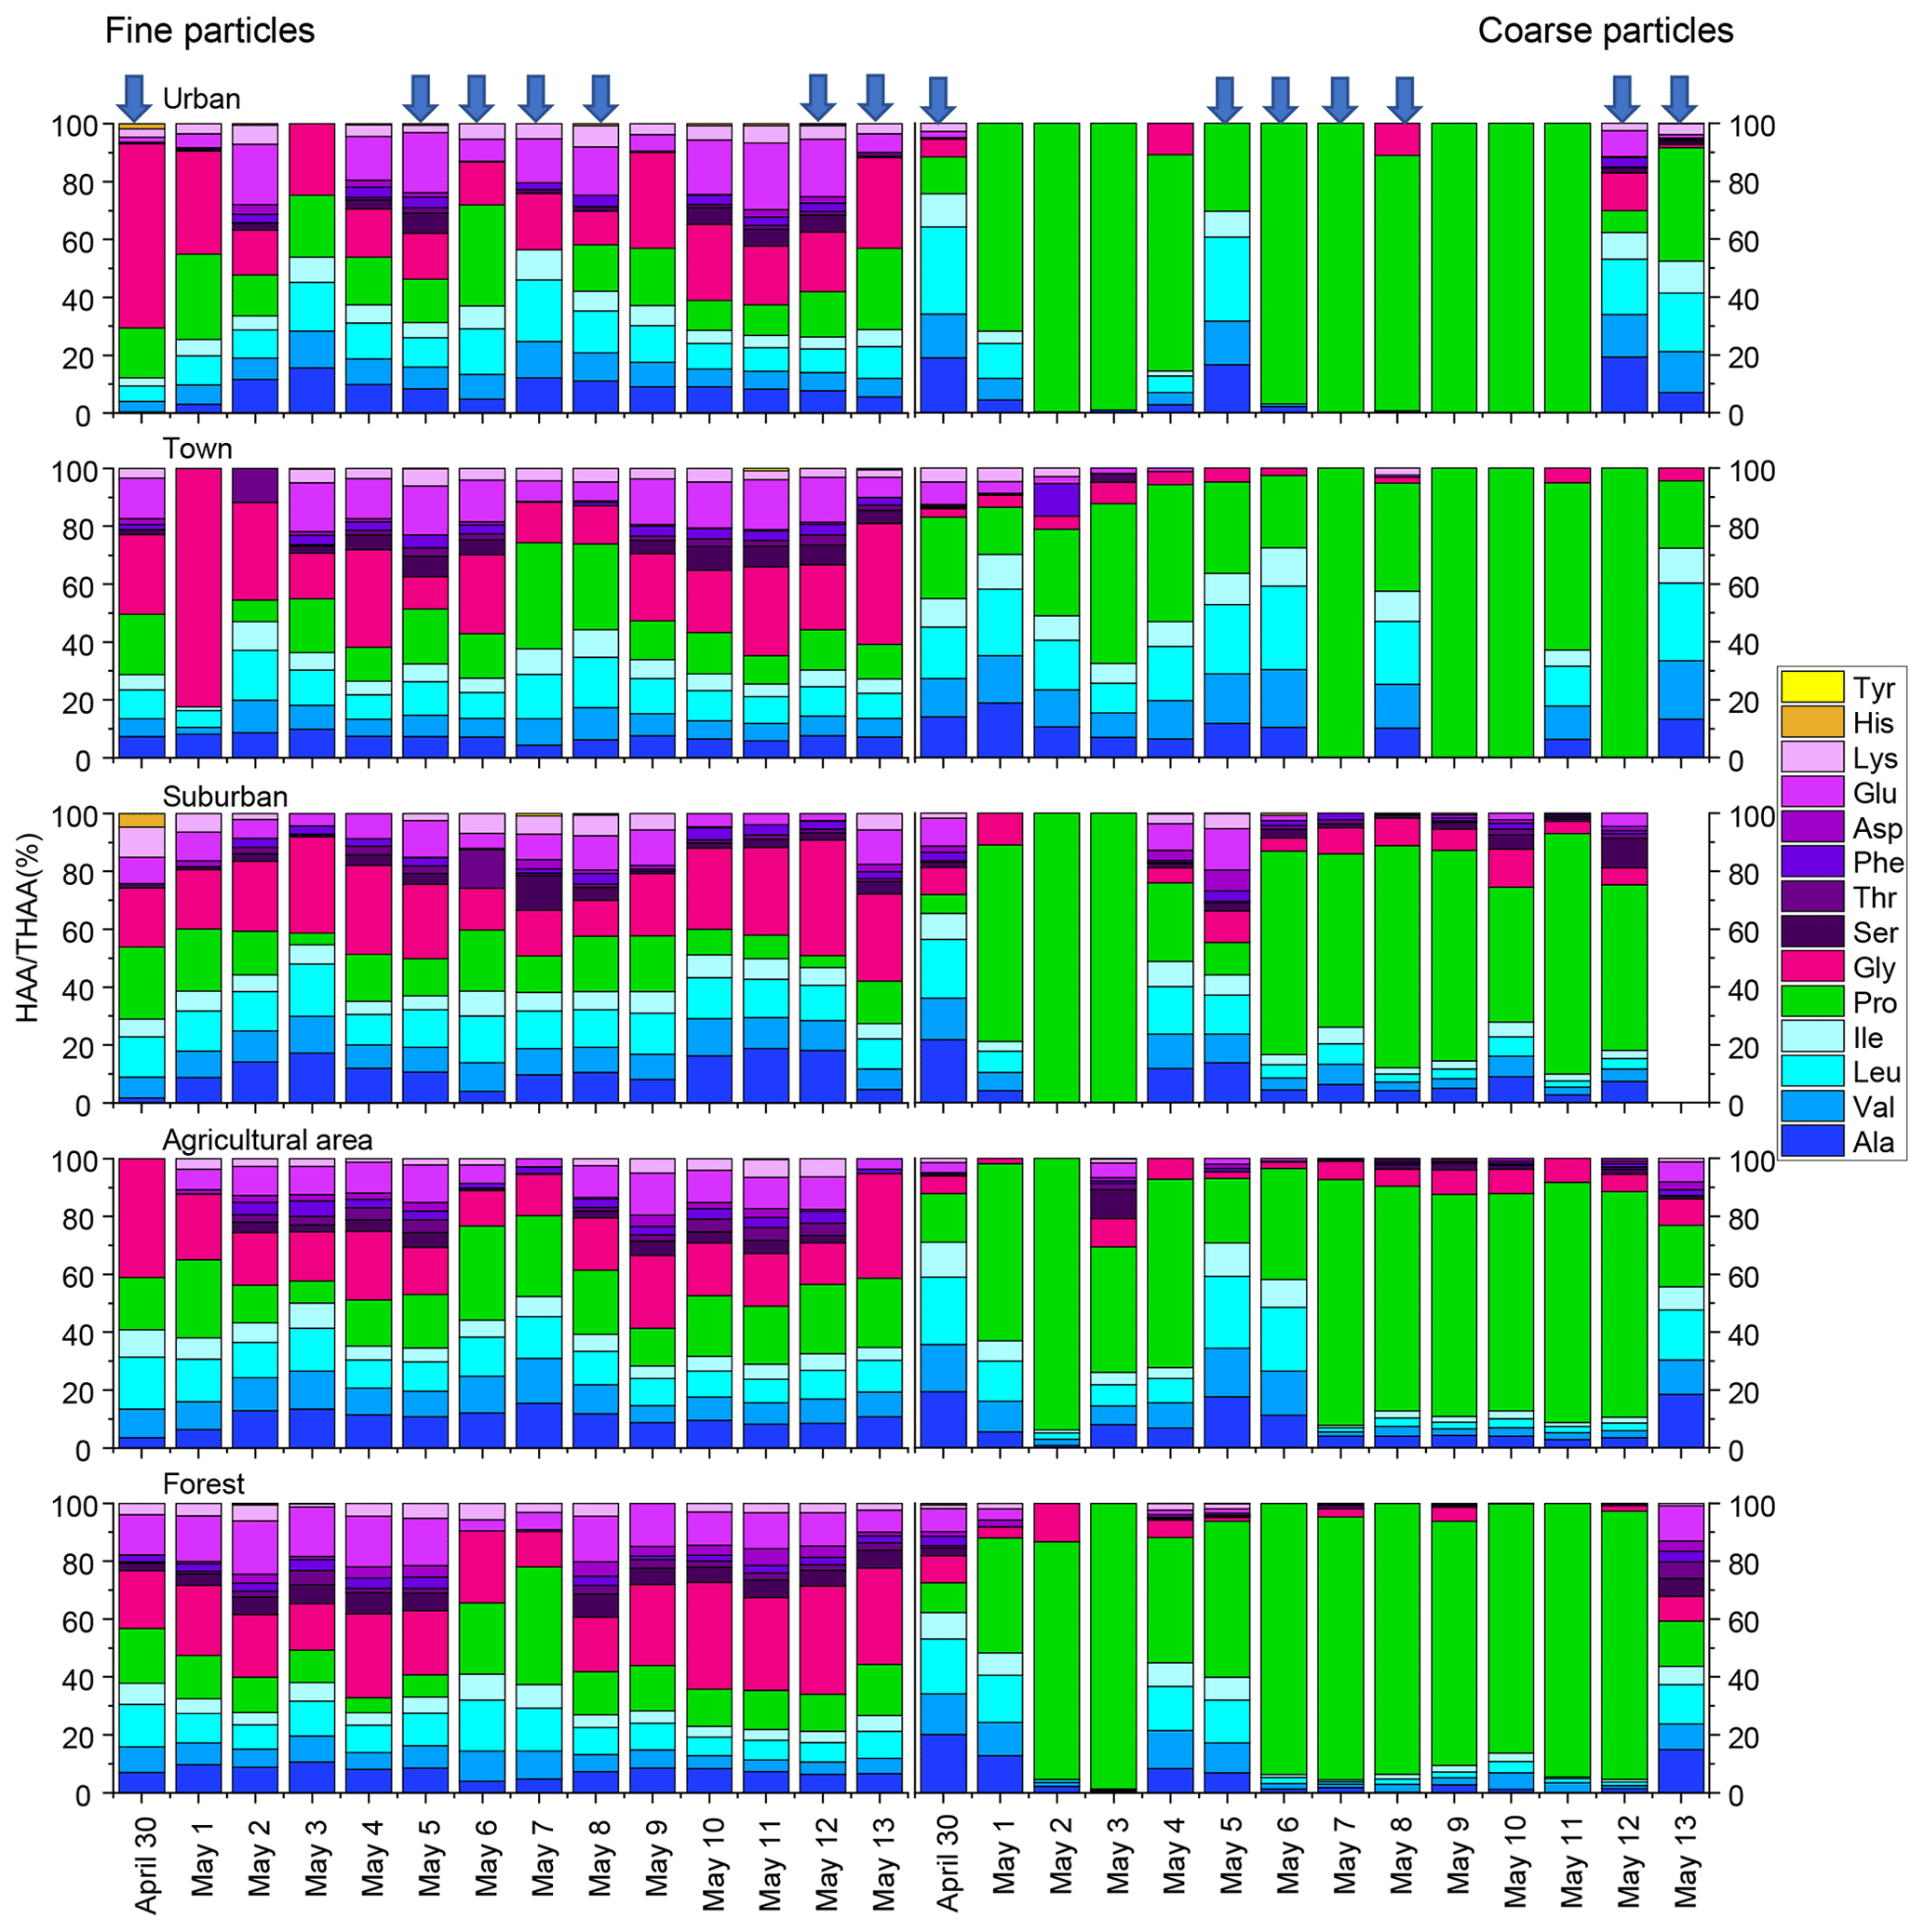
Figure 2Percentage composition of each hydrolyzed amino acid (% of THAA) for fine and coarse aerosol particles in urban, town, suburban, agricultural and forest sites during 14 consecutive sampling days. The blue arrow represent precipitation.
For coarse particles, Pro was the most abundant THAA species, with an average contribution of 63 ± 31% to the THAA pool. Leu, Ala and Val were the next most abundant species, each accounting for 7 %–9 % of the THAA pool, while other individual HAAs were only minor components in coarse particles (Fig. 2). The HAA distribution among the different sampling locations for both fine and coarse particles appeared similar (Fig. 2).
3.2 Similar contribution sources of fine and coarse particles
The detailed size-resolved investigation for the sources of atmospheric AAs is limited. Di Filippo et al. (2014) obtained very variable results for the size-segregated concentrations of atmospheric combined amino acids in the city of Rome. In the warm season, the highest concentration of CAAs was distributed in the fine fraction, whereas, in the colder season, the increased distribution of CAAs in the coarse fractions was observed. Feltracco et al. (2019) demonstrated that free and combined amino acids in Arctic aerosols were mainly distributed in the fine fraction, which could be affected by several sources, including biological primary production and biomass burning. These results could not provide conclusive evidence to define the origin of atmospheric AAs in the different particle sizes.
With the development of stable N isotope technology, δ15N values and δ15N patterns have become effective tools to trace the sources of nitrogen compounds. Our previous study found that the δ15N value of Gly in PM2.5 can be used to trace the potential emission sources for aerosol AAs because the N isotope fractionation associated with Gly transformation in aerosols is relatively small (Zhu et al., 2020). To trace the sources of fine and coarse particles, we measured the nitrogen isotopic compositions of hydrolyzed Gly and THAA sampled from the main emission sources in the study areas, including biomass burning, soil and local plants (Fig. 3). The average δ15N value for hydrolyzed Gly from the biomass burning, soil and plant sources was +15.6 ± 4.3 ‰, +3.0 ± 4.4 ‰ and −11.9 ± 1.4 ‰, respectively, and the mean δ15NTHAA value was +15.8 ± 4.5 ‰, +5.5 ± 2.2 ‰ and −0.0 ± 1.8 ‰, respectively.
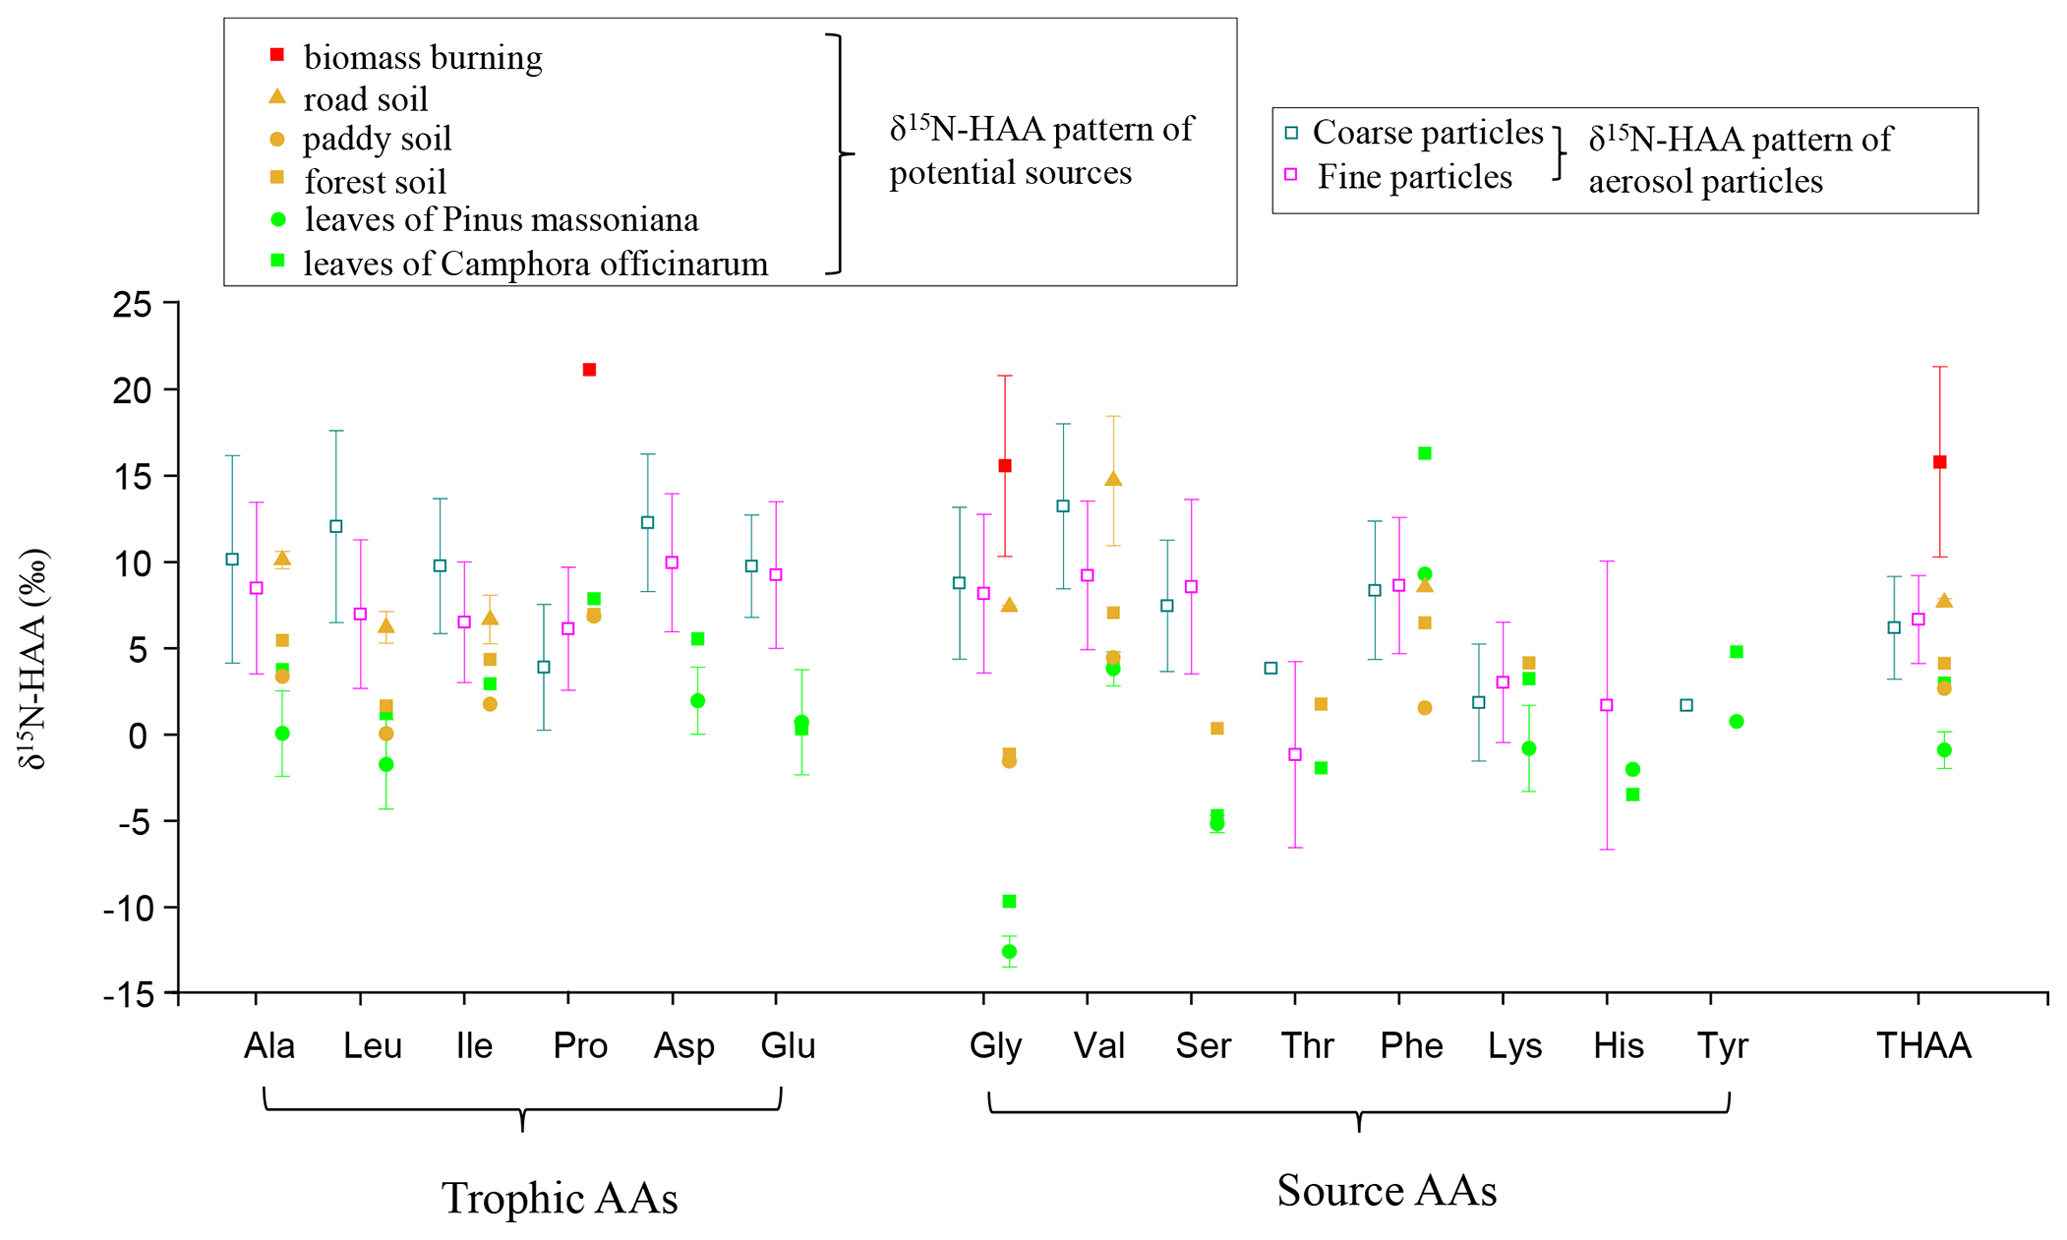
Figure 3Comparison of δ15N-HAA patterns of fine and coarse aerosol particles with those of potential local sources.
In this study, the δ15N values of hydrolyzed Gly in fine and coarse particles exhibited wide ranges: −1.0 ‰ to +20.3 ‰ and −0.8 ‰ to +15.7 ‰, which fall within the ranges of biomass burning, soil and plants sources (Fig. 3). The δ15N of protein AA (δ15NTHAA) has been also used as a proxy for indicating the nutrient N in marine sediments (Batista et al., 2014). To test δ15NTHAA values of aerosol particles could also be used to trace the sources of aerosol particles, δ15NTHAA values were compared with the δ15NGly values. Since the concentration of hydrolyzed Gly is very low in coarse particles, a few of the δ15NGly values could be measured in coarse aerosol samples. Thus, only the δ15NTHAA values of fine particles were compared with the δ15NGly values of fine particles in the same sampling sites.
A remarkably consistent spatially related trend was observed in δ15NTHAA values and the δ15N values of hydrolyzed Gly (Fig. 4b and c). Both the δ15NGly and the δ15NTHAA values of fine particles in the urban and town locations were shown to be more positive than those in suburban, agricultural area and forest locations (p < 0.05). Furthermore, the mean δ15NTHAA value was not significantly different from the average δ15N value of hydrolyzed Gly in the five sampling locations (p > 0.05), supporting the idea that δ15NTHAA values of aerosols may also imprint the sources of atmospheric AAs. Similarly, according to the δ15N inventories of THAA in potential emission sources of atmospheric protein AA, both fine (+0.7 ‰ to +13.3 ‰) and coarse particles (−2.3 ‰ to +10.0 ‰) also had δ15NTHAA values typically in the range of these three main emission sources (Fig. 3). Therefore, it is likely that the main sources of atmospheric AAs for both fine and coarse particles were mainly biomass burning, soil and plants.
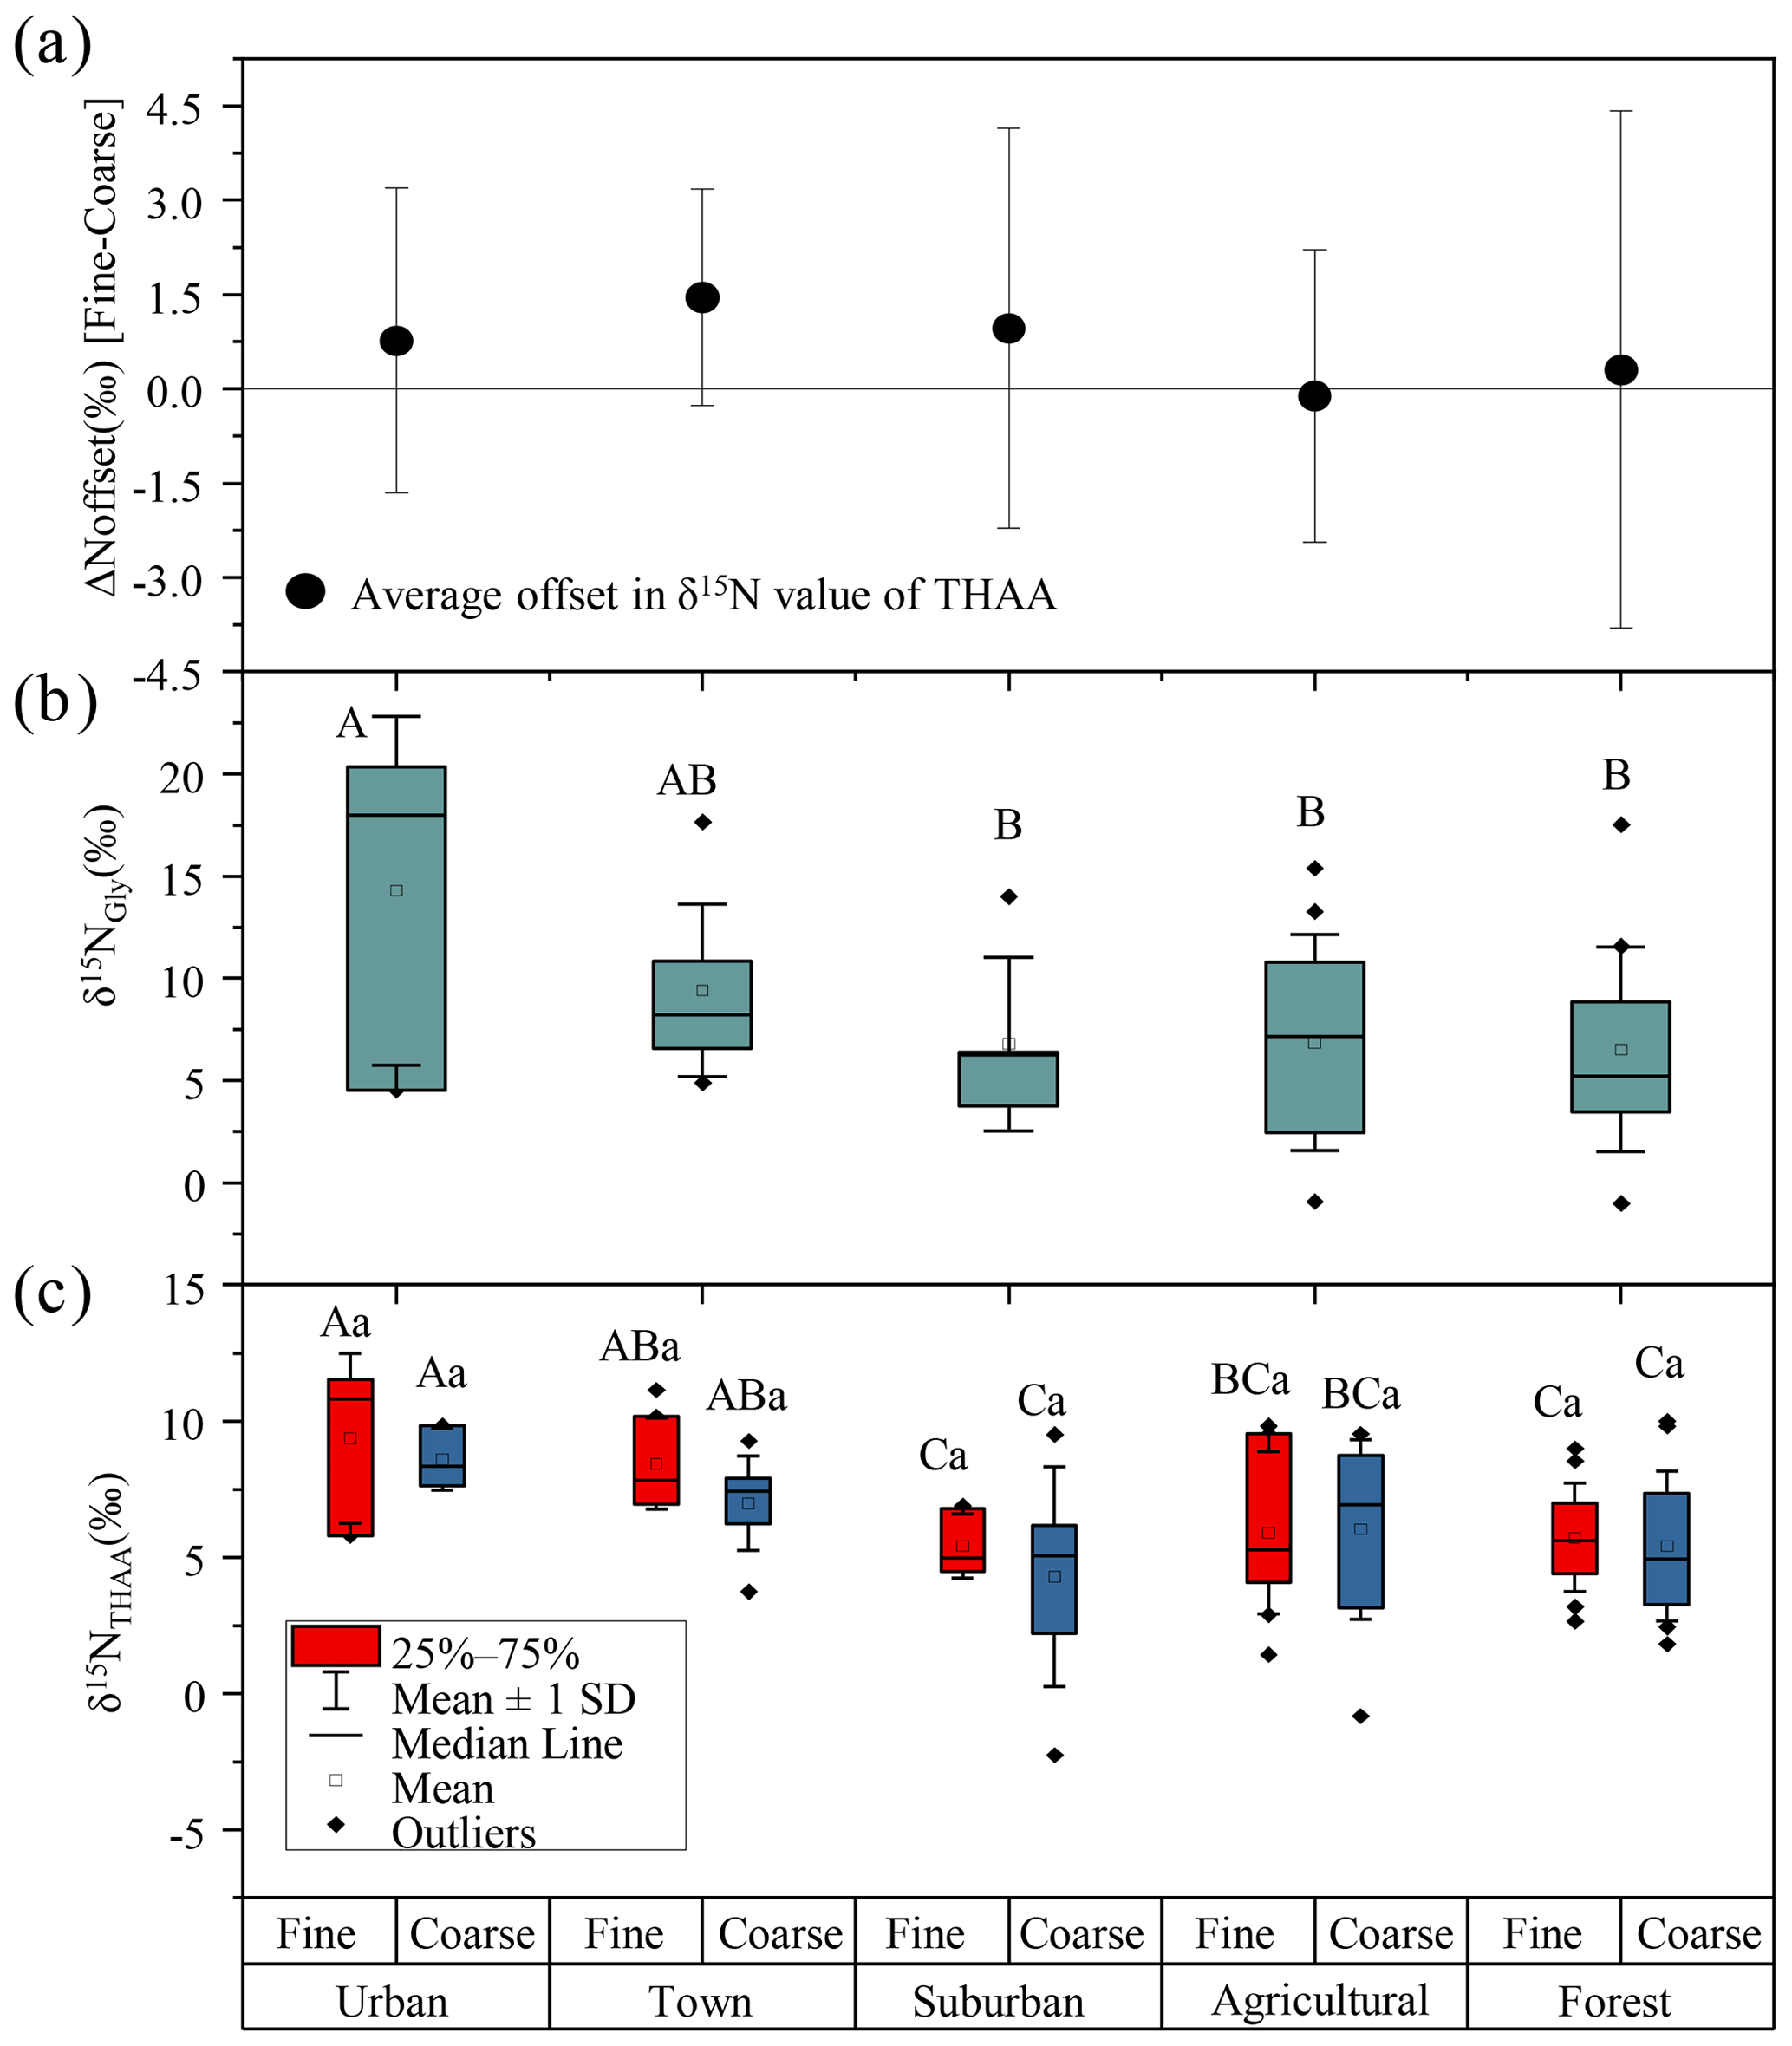
Figure 4(a) The offset of δ15NTHAA values between fine and coarse particles. (b) The δ15NGly values of fine particles. (c) The δ15NTHAA values of fine and coarse particles in urban, town, suburban, agricultural and forest sites. Different uppercase letters denote means found to be statistically different (Tukey-HSD test) between sites. Different lower case letters denote a significant difference between fine and coarse particles. The error bars in (a) indicate the standard deviation.
However, there is no significant difference in the δ15NTHAA value between fine and coarse particles in each sampling site (p > 0.05) (Fig. 4c), and the average offset of δ15NTHAA value between fine and coarse particles was lower than 1.5 ± 1.7 ‰ at the five sampling sites (Fig. 4a).Thus, it is suggested that the main sources of AAs in fine and coarse particles might be similar, all of which were influenced by biomass burning, soil and plant sources.
In addition, as one of the main components of primary biological aerosol particles (PBAPs), AAs are proved to be ejected from ocean water by bursting bubbles (Leck and Bigg, 2005a, b; Bigg, 2007; Bigg and Leck, 2008). Marine sources may also contribute to atmospheric AAs for both fine and coarse particles observed here. However, the sampling sites are located in an inland city. Considering the 2 d back trajectory during sampling periods (Fig. S2), we can observe that the aerosol collected flowed principally from the mainland, and air mass from marine sources only accounted for 16 %. Moreover, during the long-range transport, PBAPs may be removed by dry and wet deposition (Després et al., 2012). Therefore, in this study, compared to land origins, the contribution of marine sources to aerosol AAs observed here may be relatively small. Unfortunately, we do not have δ15N-HAA data for marine aerosols. Pooling δ15NGly values from literature data, we found that the δ15NGly values in ocean high-molecular-weight dissolved organic matter (DOM), cyanobacteria and plankton ranged from −16.6 ‰ to +7.7 ‰ (McCarthy et al., 2007; Mcclelland and Montoya, 2002; Chikaraishi et al., 2009; Calleja et al., 2013), which was close to the range of the natural sources including plant (range: −13.2 ‰ to −9.7 ‰) and soil (range: −1.6 ‰ to +7.4 ‰) sources. Conclusively, the contribution from soil and plant sources mentioned in this study may include a very small amount of marine contribution.
3.3 Sources of HAA in aerosol at different locations
The δ15NGly values of fine particles was significantly different at the five sampling sites (p < 0.05). The average δ15NGly values of fine particles in urban (average = 14.3 ± 8.5 ‰) and town (average = 9.4 ± 4.2 ‰) sites were more positive than those in suburban (average = 6.7 ± 4.3 ‰), agricultural (average = 6.9 ± 5.3 ‰) and forest sites (average=6.5 ± 5.0 ‰) (Fig. 4b). The significantly higher δ15NGly values observed in the urban and town locations suggested an increased contribution from biomass burning sources to Gly in fine particles at these two locations.
A similar spatial variation trend in δ15NTHAA values of fine and coarse particles among the five sampling sites was found. For fine particles, the highest δ15NTHAA values of fine particles were observed in urban (average = 9.4 ± 2.5 ‰), town (average = 8.4 ± 1.5 ‰), suburban (average = 5.4 ± 1.1 ‰), agricultural (average = 5.9 ± 2.8 ‰) and forest (average = 5.7 ± 1.9 ‰) sites. For coarse particles, the most positive δ15NTHAA values were also recorded in urban (average = 8.6 ± 0.9 ‰), town (average = 7.0 ± 1.6 ‰), suburban (average = 4.3 ± 3.4 ‰), agricultural (average = 6.0 ± 3.1 ‰) and forest (average = 5.4 ± 2.6 ‰) sites (Fig. 4c). The more positive δ15NTHAA values occurred in urban and town locations compared to other sampling sites for both fine and coarse particles (p < 0.05), indicating that atmospheric AAs for both fine and coarse particles in urban and town sites were more influenced by biomass burning.
3.4 Different degradation state of AAs between fine and coarse aerosol particles
In this study, a huge difference was observed in the concentrations and mole-percentage compositions of THAAs between fine and coarse particles (Figs. 1 and 3). As we discussed above, the sources of AAs in fine and coarse particles are similar; therefore this larger difference may be attributed to protein matter in fine and coarse particles undergoing different degrees of oxidation, nitration and oligomerization in the atmosphere (Liu et al., 2017; Wang et al., 2019; Song et al., 2017; Haan et al., 2009). Another possibility is that biologically relevant degradation of AAs may contribute to this variation observed between fine and coarse particles. To investigate whether AAs in fine and coarse particles may be degraded by bacteria to different degrees, degradation marker (DI) and bacterial heterotrophy indicators (δ15N-AA distribution and ∑V) were used.
Proteins as major components in all source organisms are sensitive to all stages of degradation (Cowie and Hedges, 1992). Moreover, compared to the alteration of the degradation, the dissimilarity in amino acid composition of protein in the source organisms is minor (Dauwe and Middelburg, 1998). Therefore, the degradation index (DI) was developed, which are based on protein amino acid composition and factor coefficients based on the first axis of the PCA analysis (Eq. 1). Since AAs concentrated in cell walls are preferentially accumulated during decomposition, whereas amino acids that are concentrated in cell plasma tend to be depleted during degradation (Dauwe et al., 1999), the compositional changes of amino acids associated with degradation can be traced by the DI value. The higher DI values indicate the protein is relatively “fresh” (Yan et al., 2015), and changes tracked by DI are proposed to be driven in large part by enrichment of AAs concentrated in cell walls (McCarthy et al., 2007).
For the calculation of DI values for fine and coarse particles, the first-principal-component score from principal-component analysis (PCA) was applied to our own data (including Ala, Gly, Val, Leu, Ile, Pro, Ser, Thr, Phe, Asp, Glu, Lys, His and Tyr), following the method described by Dauwe et al. (1999). The first principal component explained 38 % of the variability, and the second principal component explained 21 % (Table S2). Figure 5a shows plots of the scores of the first and second principal components of fine and coarse particles in the five sites. Components of fine and coarse particles could be roughly separated. The plots of the fine particles tended to cluster in the upper middle and right areas (approximately −1.7 to +2.0 and −0.4 to 1.4 at first and second-principal-component scores, respectively). In contrast, the plots of the coarse particles tended to be located in the lower and left areas (approximately −1.9 to 1.4 and −2.8 to +0.5 at first- and second-principal-component scores, respectively). Fine and coarse particles were clearly distinguished by first-principal-component scores, suggesting that the first-principal-component score may also be designed as a degradation index of THAA in aerosols.

Figure 5(a) Cross plot of the first and second component scores of PCA based on percentage composition (Mol %) of hydrolyzed amino acid for fine and coarse particles. (b) Cross plot of factor coefficients of the first and second principal components of PCA. The lines enclosing each group of amino acid are arbitrarily drawn.
This is the first report of the DI values for aerosol particles. We compared DI values obtained by our calculating method with those calculated by using the coefficients given in previous references (Dauwe et al., 1999; Yamashita and Tanoue, 2003). There is no significant difference between the DI values calculated using the first-principal-component score and the DI values calculated using the coefficients given in the previous reference (Dauwe et al., 1999;Yamashita and Tanoue, 2003) (p > 0.05) (Fig. S3), confirming our calculation method is reliable.
A plot of factor coefficients of each individual amino acid in the first and second principal components was examined to clarify the reasons for variation of the scores of fine and coarse particles (Fig. 5b). Based on this cross plot, 14 HAA species were divided into 4 groups. In Fig. 5b, Group 1 is located in the lower right portion of the plot and includes Val, Leu, Ile and Ala. Group 2, in the upper right of the plot, includes Lys, Glu, Asp, Phe, Thr, Ser and Gly. Group 3, in the middle, includes Tyr and His. Group 4, in the left of the plot, includes Pro. The principal-component scores of atmospheric particles were affected by the relative abundance and the factor coefficient of each individual amino acid. The relatively high principal-component scores of fine particles in PC1 and PC2 were more affected by the high relative abundances of amino acids which have a high factor coefficient (Group 1 and Group 2). In contrast, the relatively low principal-component scores of coarse particles in PC1 and PC2 were more affected by the low relative abundances of amino acids which have a low factor coefficient (Group 1 and Group 4).
Furthermore, DI values for fine particles showed a positive correlation with the percentage of HAA species in Group1 (e.g. Lys, Glu, Asp, Phe, Thr and Ser), but DI values for coarse particles were positively correlated to the percentage of HAA species in Group 2 (e.g. Ala, Val, Leu and Ile) (Fig. S4), indicating the difference in composition profiles of HAA between fine and coarse particles may be affected by the degradation process. Plots of DI as a function of THAA concentration in both fine and coarse particles showed an exponential relationship (y = 1067.4e−1.0x; r= 0.6, p < 0.01); i.e. at higher values of DI, concentrations of THAA were higher, and vice versa (Fig. S5). The coarse particles had significantly lower THAA concentrations compared to fine particles (Fig. S1). Clearly, both composition profiles of HAA and concentrations of THAAs in aerosols may be related to degradation processes.
DI values from literature data, where possible, and DI values for fine and coarse aerosol particles are shown in Fig. 6a and Fig. 7. Fine particles had significantly higher DI values than coarse particles (p < 0.05) (Fig. 6a). The DI values for fine and coarse particles ranged from −0.3 to 1.4 (average = 0.6 ± 0.4) and −1.8 to 1.4 (average = −0.6 ± 1.0), respectively (Fig. 7). The DI values of fine particles were close to those of “fresh” material, for instance, source materials (e.g. plankton, bacteria and sediment trap material). On the contrary, the DI values of coarse particles were comparable to those of surface soil, particle organic matter (POM) in coastal sediments and DOM in coastal areas, which were proved to be more degraded materials (Fig. 7). In marine environments, high DI values (> 0.5) indicate the better preservation of more fresh organic matter from marine primary production (Jiang et al., 2014). On the contrary, low DI values ( < 0.5) indicate the presence of relatively degraded organic matter (Burdige, 2007; Wang et al., 2018). In this study, the lower DI values are observed in coarse particles, implying that AAs in coarse particles may undergo more degradation than those in fine particles. Our result is also comparable to that observed in precipitation at Uljin and Seoul (Yan et al., 2015). The DI values measured in coarse particles are closer to those observed in Seoul, which is believed to have more advanced degradation than Uljin, further supporting the idea that the degradation degree of amino acids in coarse particles is higher than that in fine particles.
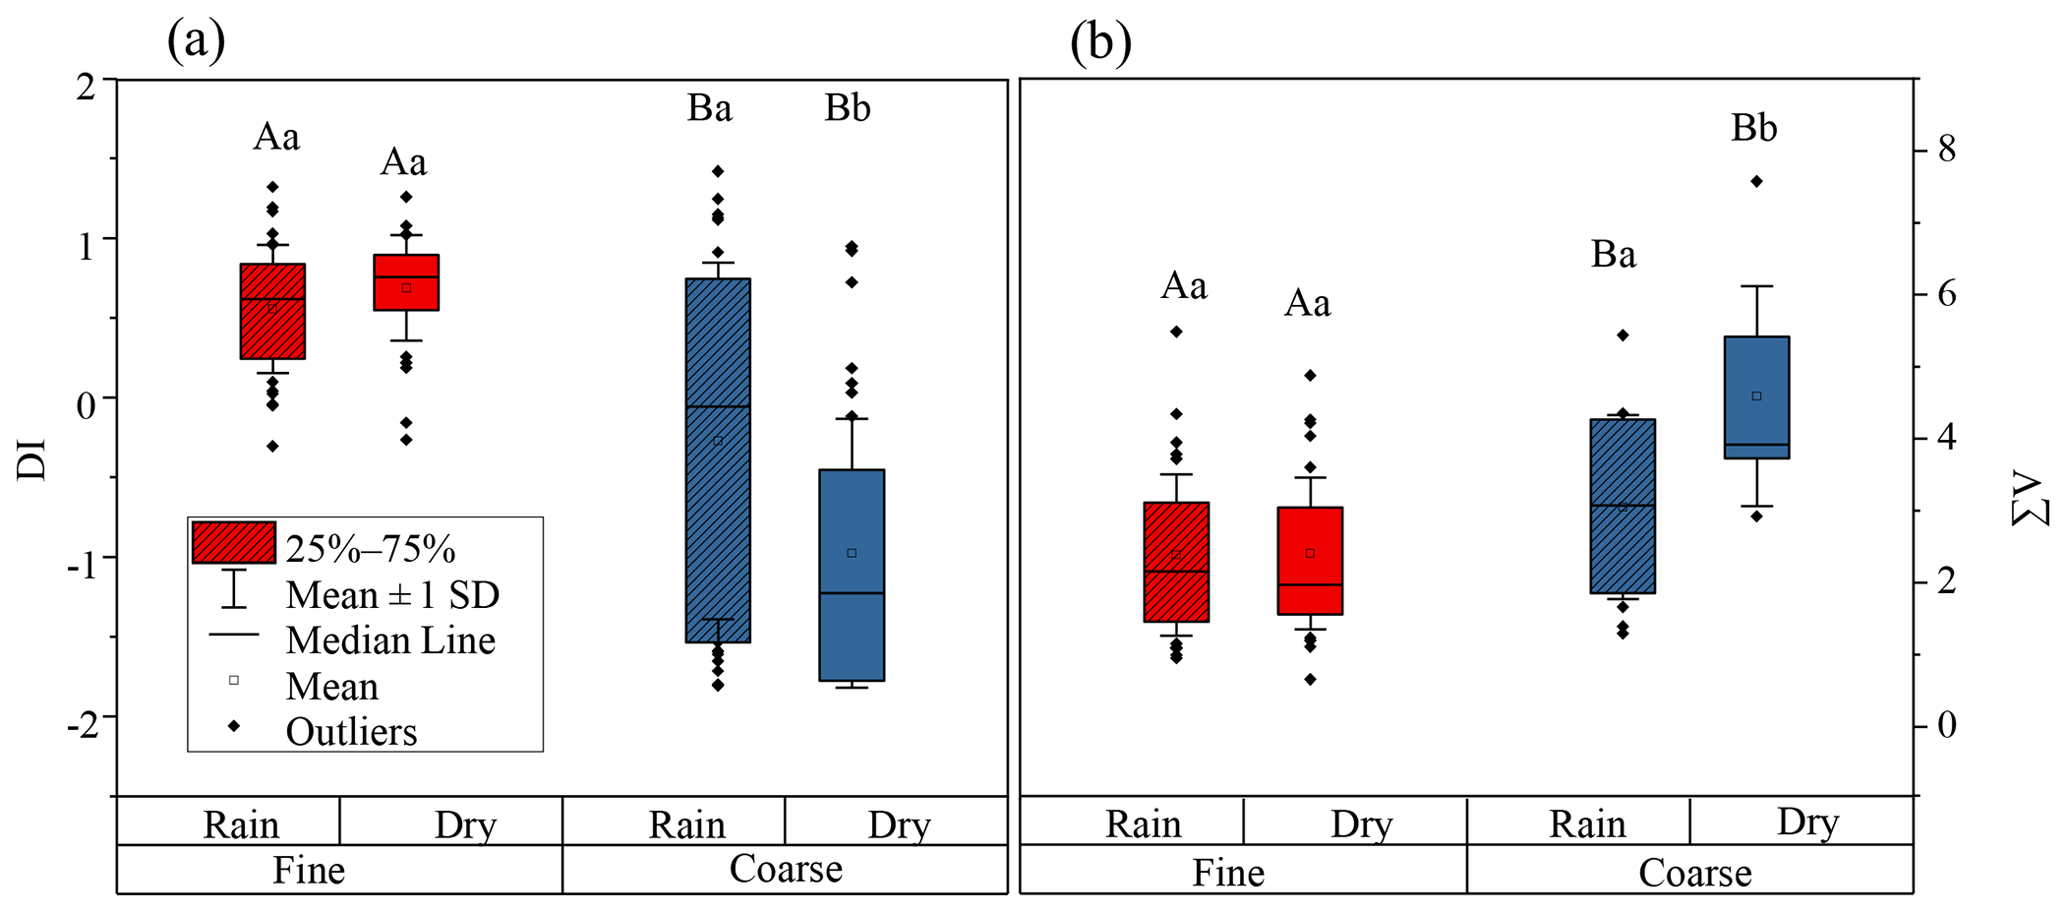
Figure 6DI values (a) and (b) ∑V for fine (red box) and coarse (blue box) particles. The box encloses 50 % of the data, the whisker is standard deviation of the data, the horizontal bar is the median, the solid circles are outliers. The differences in means were statistically significant (two-way ANOVA, p < 0.05). Different uppercase letters denote means found to be statistically different (Tukey-HSD test) between fine and coarse particles. Different lower case letters denote means found to be statistically different (Tukey-HSD test) between rainy and dry days.
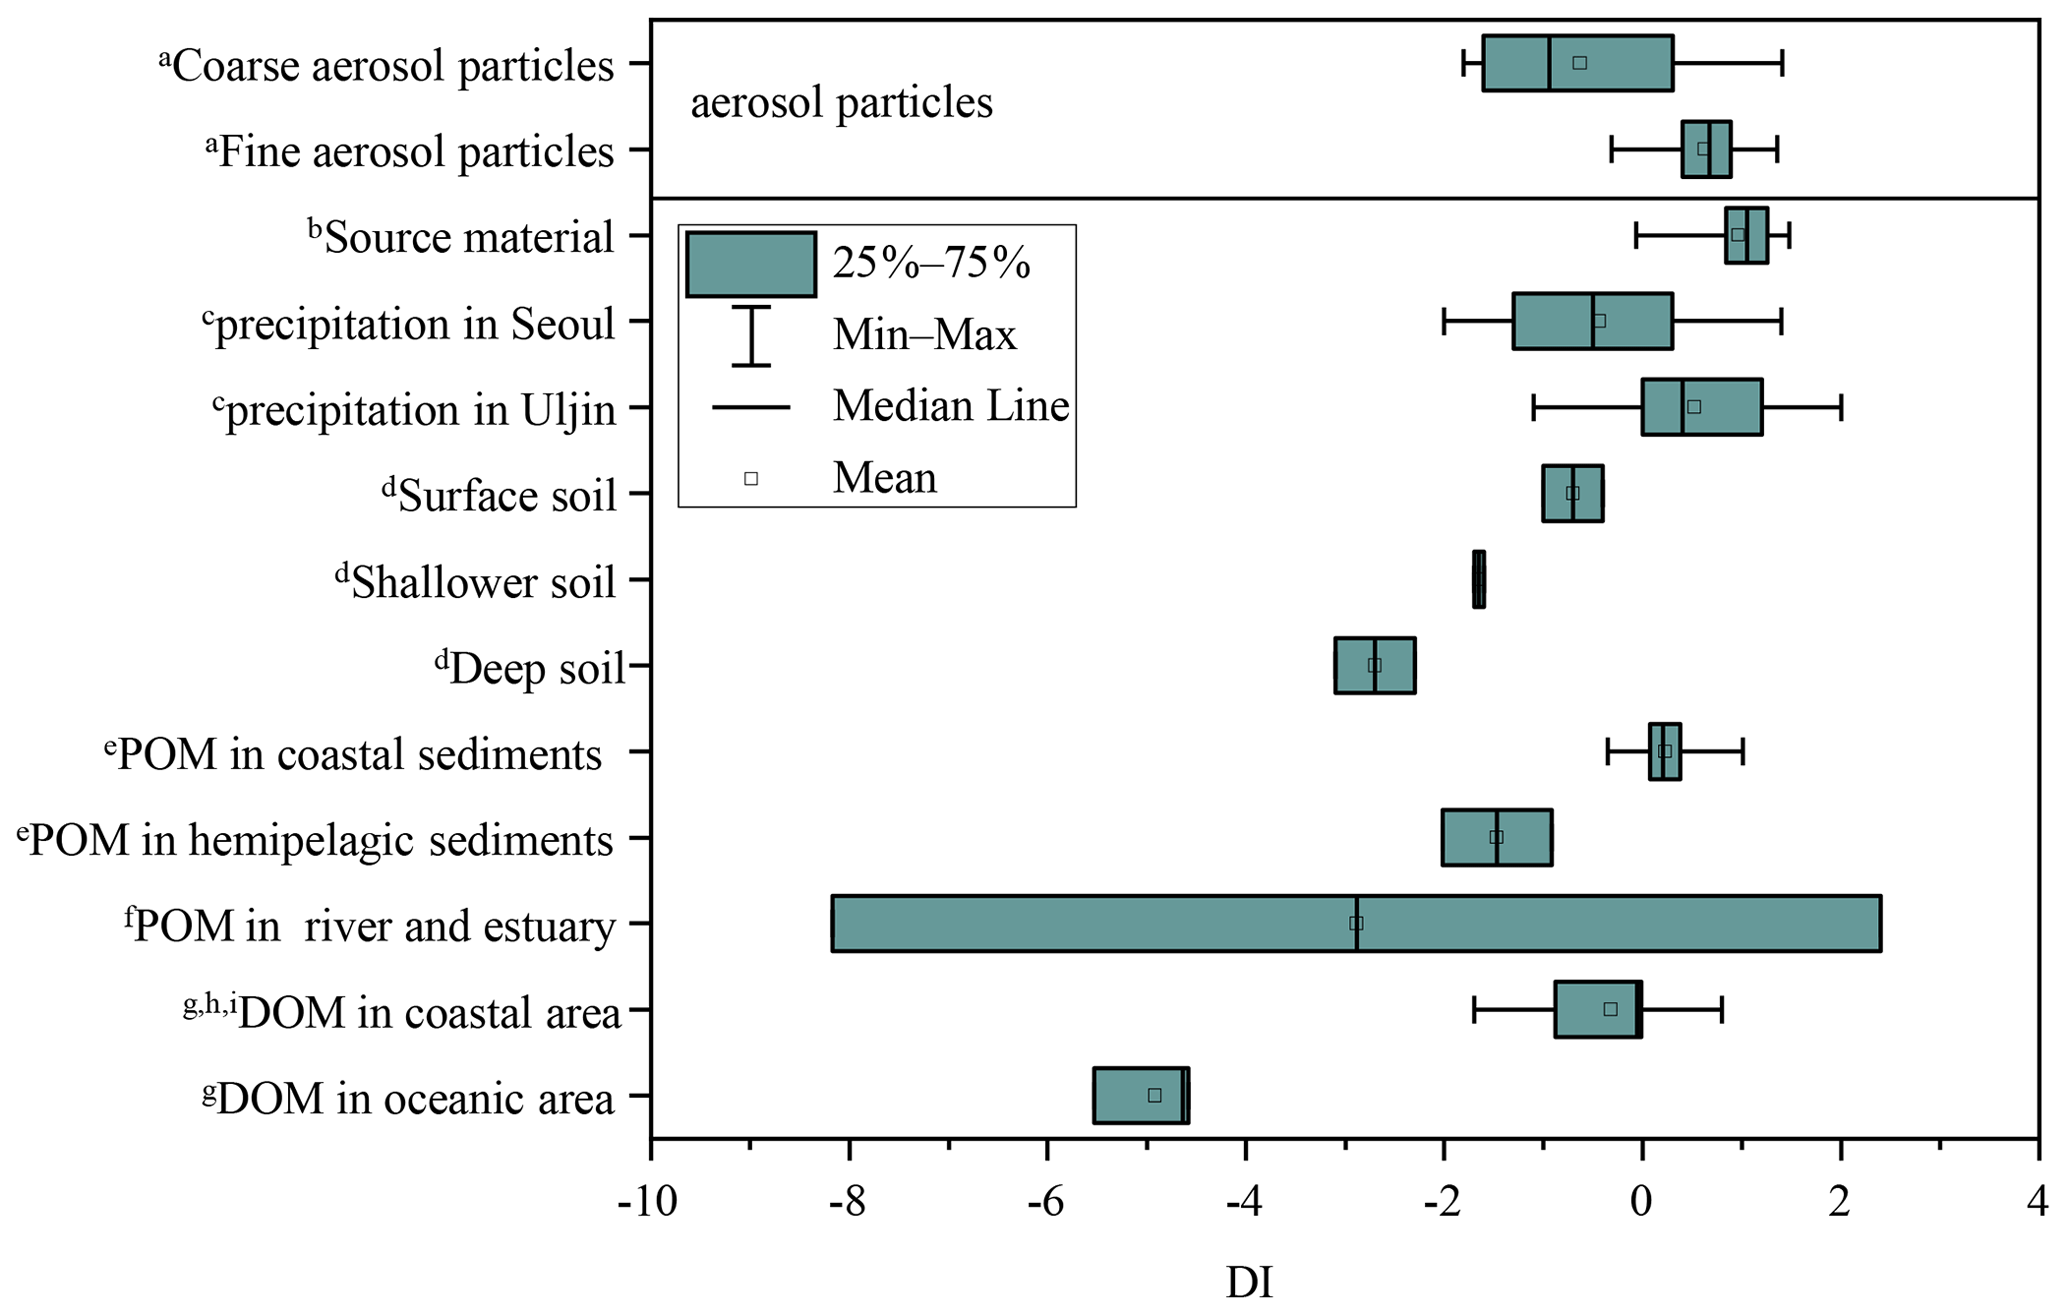
Figure 7DI values of fine and coarse particles in comparison to other studies. a This study. b Source materials including phytoplankton, bacteria, zooplankton and sediment trap material from Dauwe et al., 1999. c Yan et al. (2015). d Philben et al. (2018). e particle organic matter from McCarthy et al. (2007). f Wang et al. (2018). g Yamashita and Tanoue (2003). h Chen et al. (2016). i Ji et al. (2019).
However, the differences in DI values were not significant among the five sampling sites for both fine and coarse particles (p > 0.05) (Fig. S6). For fine particles, the average DI values in agricultural, urban, forest, town and suburban locations were 0.6 ± 0.4, 0.5 ± 0.5, 0.7 ± 0.3, 0.6 ± 0.3 and 0.7 ± 0.2, respectively. For coarse particles, the mean DI values in agricultural area, urban, forest, town and suburban location was −0.5 ± 0.9, −1.0 ± 1.1, −0.8 ± 1.1, −0.3 ± 1.1 and −0.5 ± 1.1, respectively. As we discussed above, the sources of atmospheric HAA were different among the five sampling sites. This result suggested that the degradation process of amino acids in the atmosphere is less affected by their emission sources.
3.5 Bacterial signature in aerosol AAs
The existence of microorganisms in aerosol particles has been documented. However, whether bacterial degradation processes play a role in atmospheric protein degradation is not well understood. The negative correlation of the DI with the concentration of free γ-aminobutyric acid (GABA) and its mole percentage are depicted in Fig. S7. Since bacteria are known to produce free GABA from their protein precursors (Cowie and Hedges, 1994; Koolman and Röhm, 2005), the concentrations and mole percentage of free GABA may tend to increase during the biodegradation process. Therefore, the negative relationship between the DI values and GABA in aerosols suggested that the degradation of atmospheric protein is probably induced by bacteria. Dauwe et al. (1999) have also reported the negative correlation of the DI with the mole percentage of the GABA and β-alanine (BALA) in marine particulate matter samples, and they attributed the correlation of the DI with the variation of GABA mole percentage to the stimulation of degradation by the activity of microorganism.
Moreover, it is interesting to note that a substantial δ15N-AA shift in the trophic-AA group was observed between fine and coarse particles among the five sampling sites. Ala, Leu, Ile and Asp were 15N-enriched in coarse particles compared to fine particles, whereas Pro in coarse particles was more 15N-depleted than that in fine particles (Fig. 8). Clearly, there is no uni-directional 15N depletion or enrichment of trophic AA observed between fine and coarse particle samples. The δ15N-AA distribution in the trophic-AA group is more “scattered” in coarse particles than that in fine particles (Fig. 8). However, the difference in δ15N values of source AA between coarse particles and fine particles was relatively small except for Val. δ15N values of Gly, Ser, Phe and Lys measured in coarse particles are close to those measured in fine particles. Recent work on δ15N signatures of individual AA has suggested that bacterial heterotrophy often results in strong fractionation in some specific AAs, which are tied directly to specific microbial biochemical pathways. Among those specific AAs, both Ala and Leu are commonly observed to show strong δ15N shifts with the processes of bacterial heterotrophy (McCarthy et al., 2004). Hence, 15N-enriched Ala and Ile found in coarse particles compared to fine particles suggested more bacterial heterotrophy took place in coarse particles.
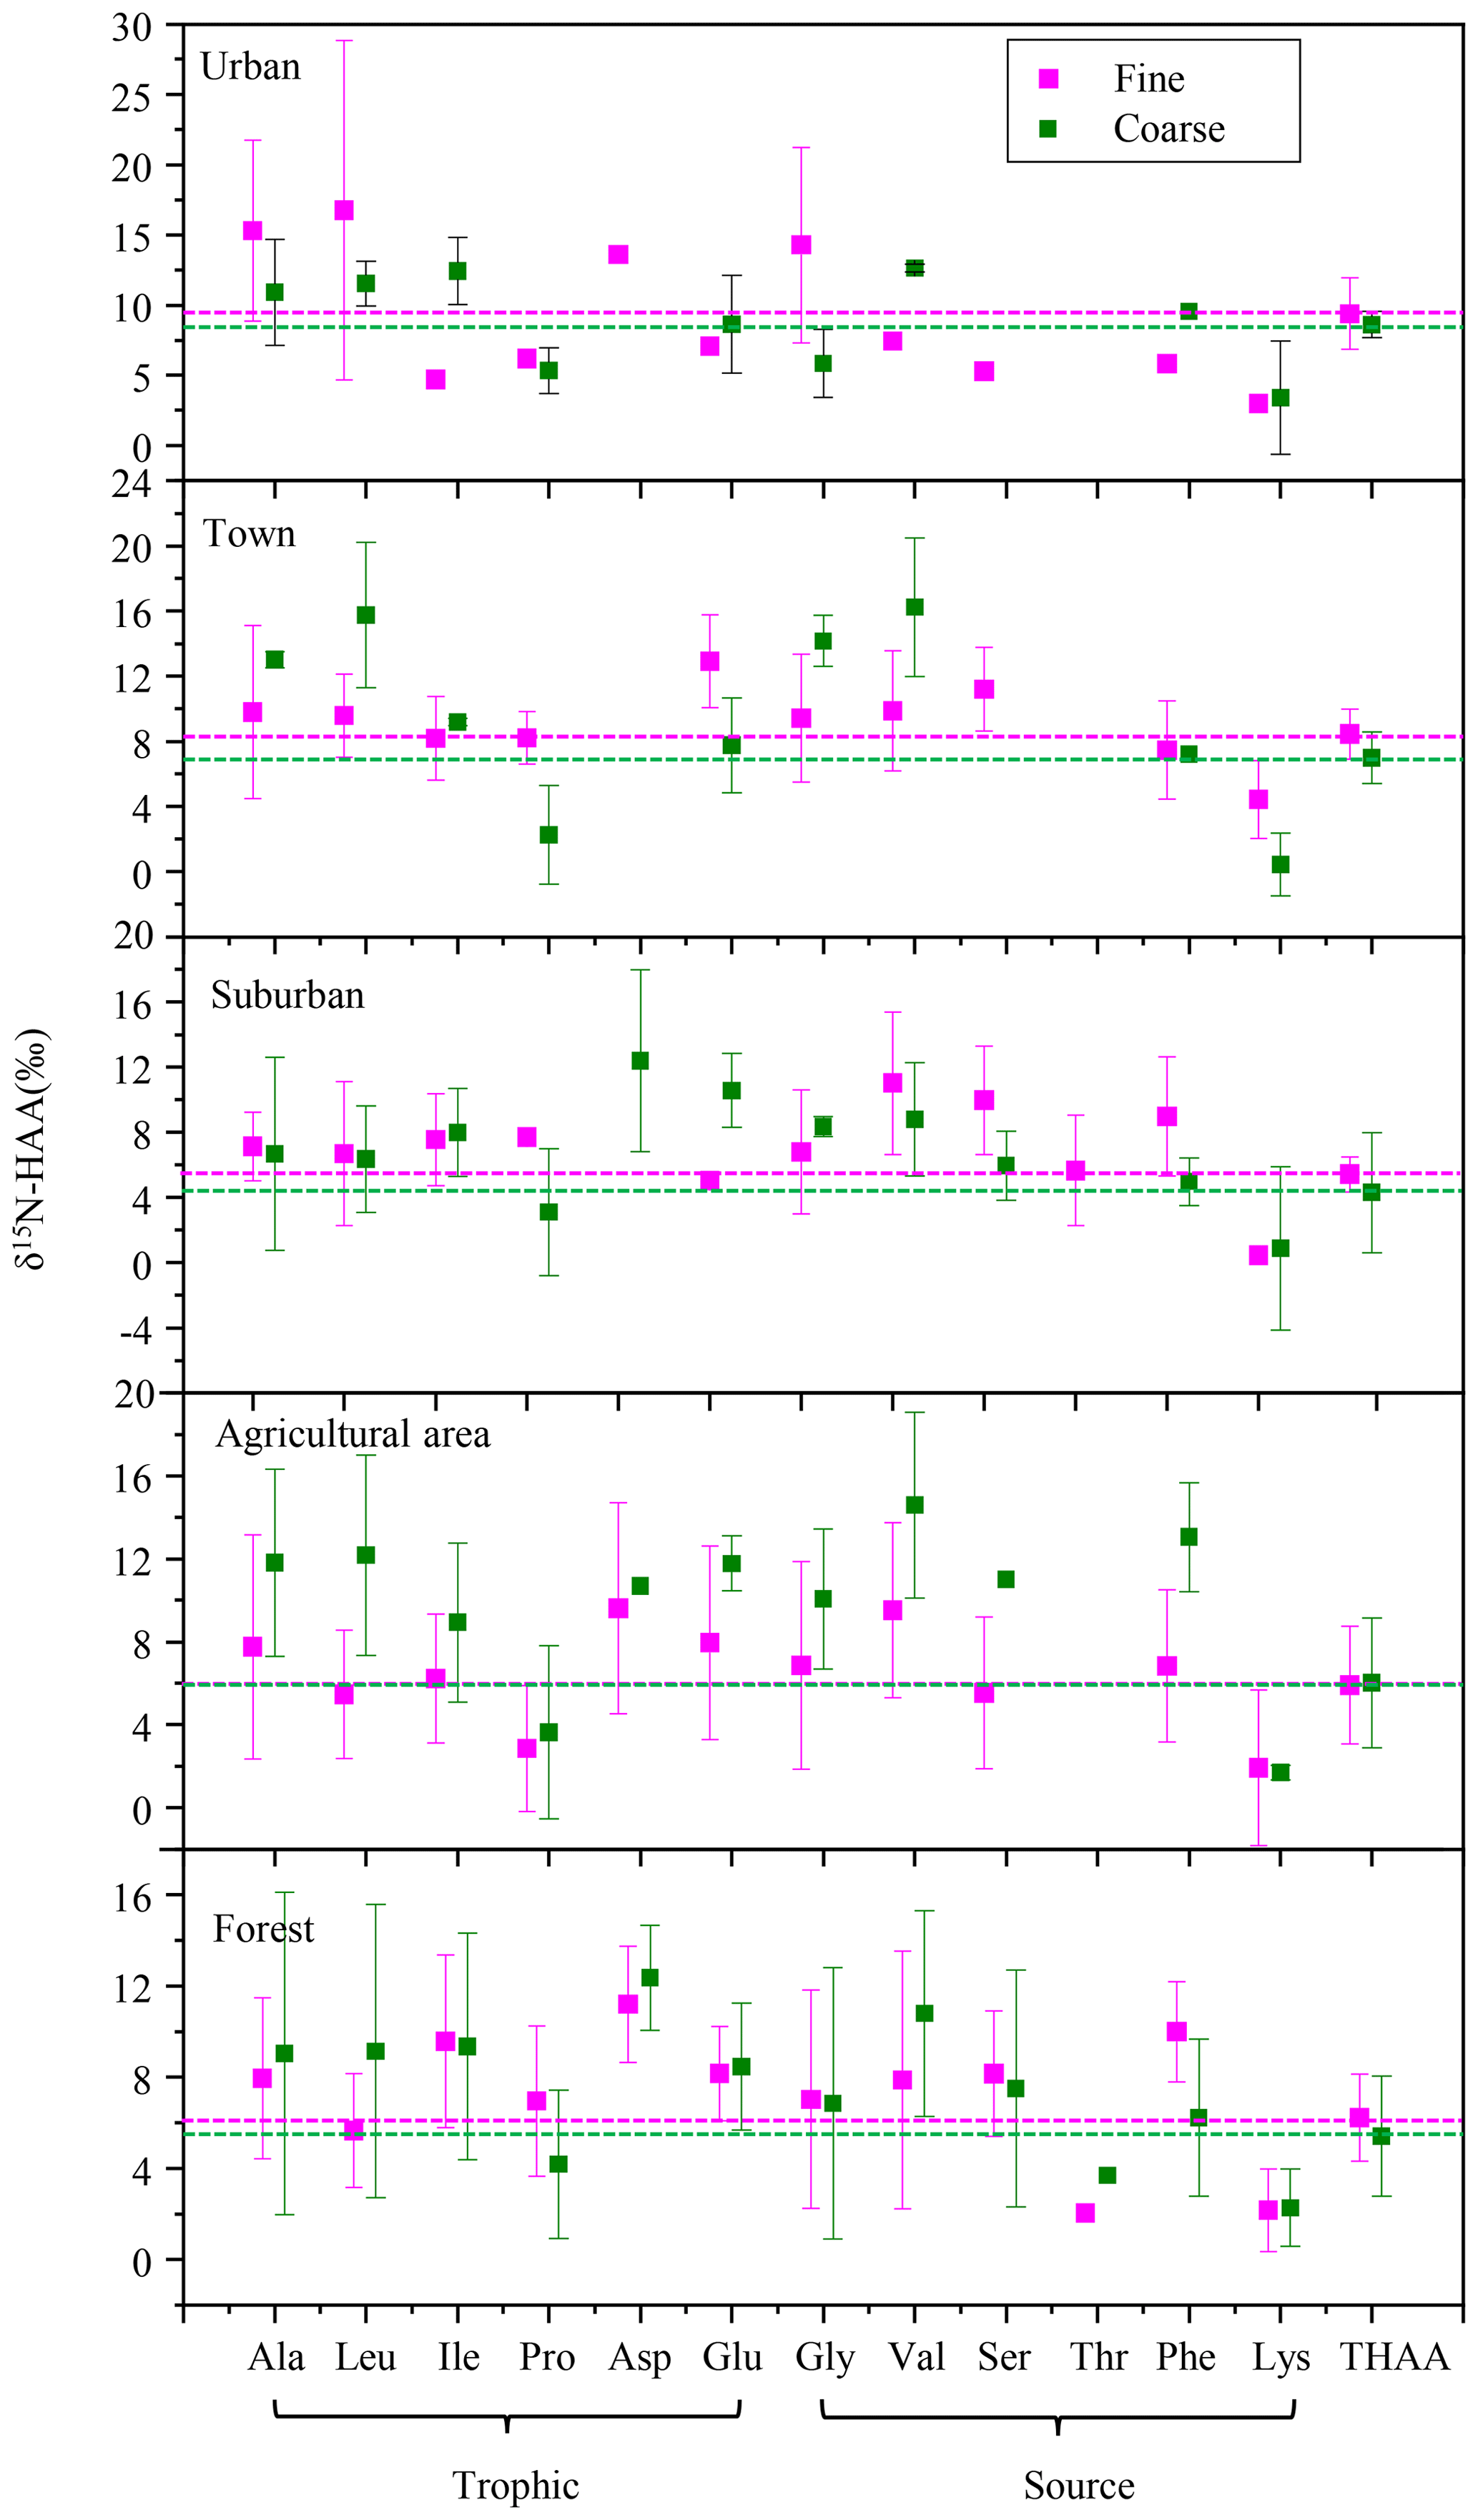
Figure 8δ15N-HAA patterns of fine and coarse aerosol particles in urban, town, suburban, agricultural and forest sites.
Heterotrophic reworking of proteins encompasses a series of processes, including hydrolysis, uptake and de novo synthesis, and salvages AA incorporation into new protein. Therefore, new proteins reworked by heterotrophically processes represent a mixture of resynthesized AAs and AAs that have never been hydrolyzed (salvaged AAs). McCarthy et al. (2007) hypothesized that the process of incorporating the salvage AAs into new protein should not alter original δ15N values of salvaged AAs. The substantial δ15N-AA shifts in only selected AA indicates the N of an assimilated AA has been replaced through a de novo heterotrophic AA resynthesis pathway with N isotope fractionation. Therefore, the substantial δ15N-AA shifts in the trophic-AA group could be observed when bacterial heterotrophy has occurred and those new resynthesized proteins have become an important part of protein material measured (McCarthy et al., 2007). Fogel and Tuross (1999) first observed that δ15N-AA patterns of degraded material was highly scattered, and the N isotope fractionation between degraded material and fresh protein was up to 15 ‰. Moreover, obviously changes for the δ15N values of several AAs were found in high-molecular-weight dissolved organic carbon after bacterial reworking (Calleja et al., 2013). Similarly, the scattered characteristics of δ15N-AA distribution in the trophic-AA group of coarse particles may be due to the nitrogen fractionation occurred in microbial consumers selectively using trophic AA.
∑V is defined as the average deviation in six trophic AAs and has been proposed to reflect the extent of protein resynthesis during microbial degradation processes (McCarthy et al., 2007). Figure 9 shows the ∑V values measured in fine particles, coarse particles and local natural sources, as well as ∑V values reported in previous references. ∑V values for the main natural sources collected around the sampling sites were calculated. ∑V values for local plants (needles of Pinus massoniana (Lamb.) and leaves of Camphora officinarum) ranged from 1.0 ‰ to 2.1 ‰, with a mean of 1.7 ± 0.4 ‰ (Fig. 9). ∑V values in local soil (paddy soil, road soil and forest soil) ranged from 1.4 ‰ to 2.1 ‰, with a mean of 1.7 ± 0.3 ‰. Overall, coarse particles had higher ∑V values (average = 3.6 ± 1.5 ‰) than those of fine particles (p < 0.05) (Fig. 9). The mean ∑V value of fine particles in the five sampling sites (average = 2.4 ± 1.1 ‰) was similar to or slightly higher than that of plants and soil collected around sampling sites; phytoplankton (1.0 ‰) and zooplankton (1.5 ‰) in marine sources (McCarthy et al., 2007); needle (average = 1.5 ± 0.1 ‰), moss (average = 1.1 ± 0.02 ‰) and soil (average = 1.4 ± 0.1 ‰) samples measured in a balsam fir forest (Philben et al., 2018); and marine POM (average = 2.3 ± 0.7 ‰) (Batista et al., 2014; McCarthy et al., 2007). In contrast, ∑V values of coarse particles were equal to or even higher than those of more degraded materials, such as marine DOM reworked by bacterial heterotrophy (average = 3.0 ± 0.5 ‰) (Batista et al., 2014).
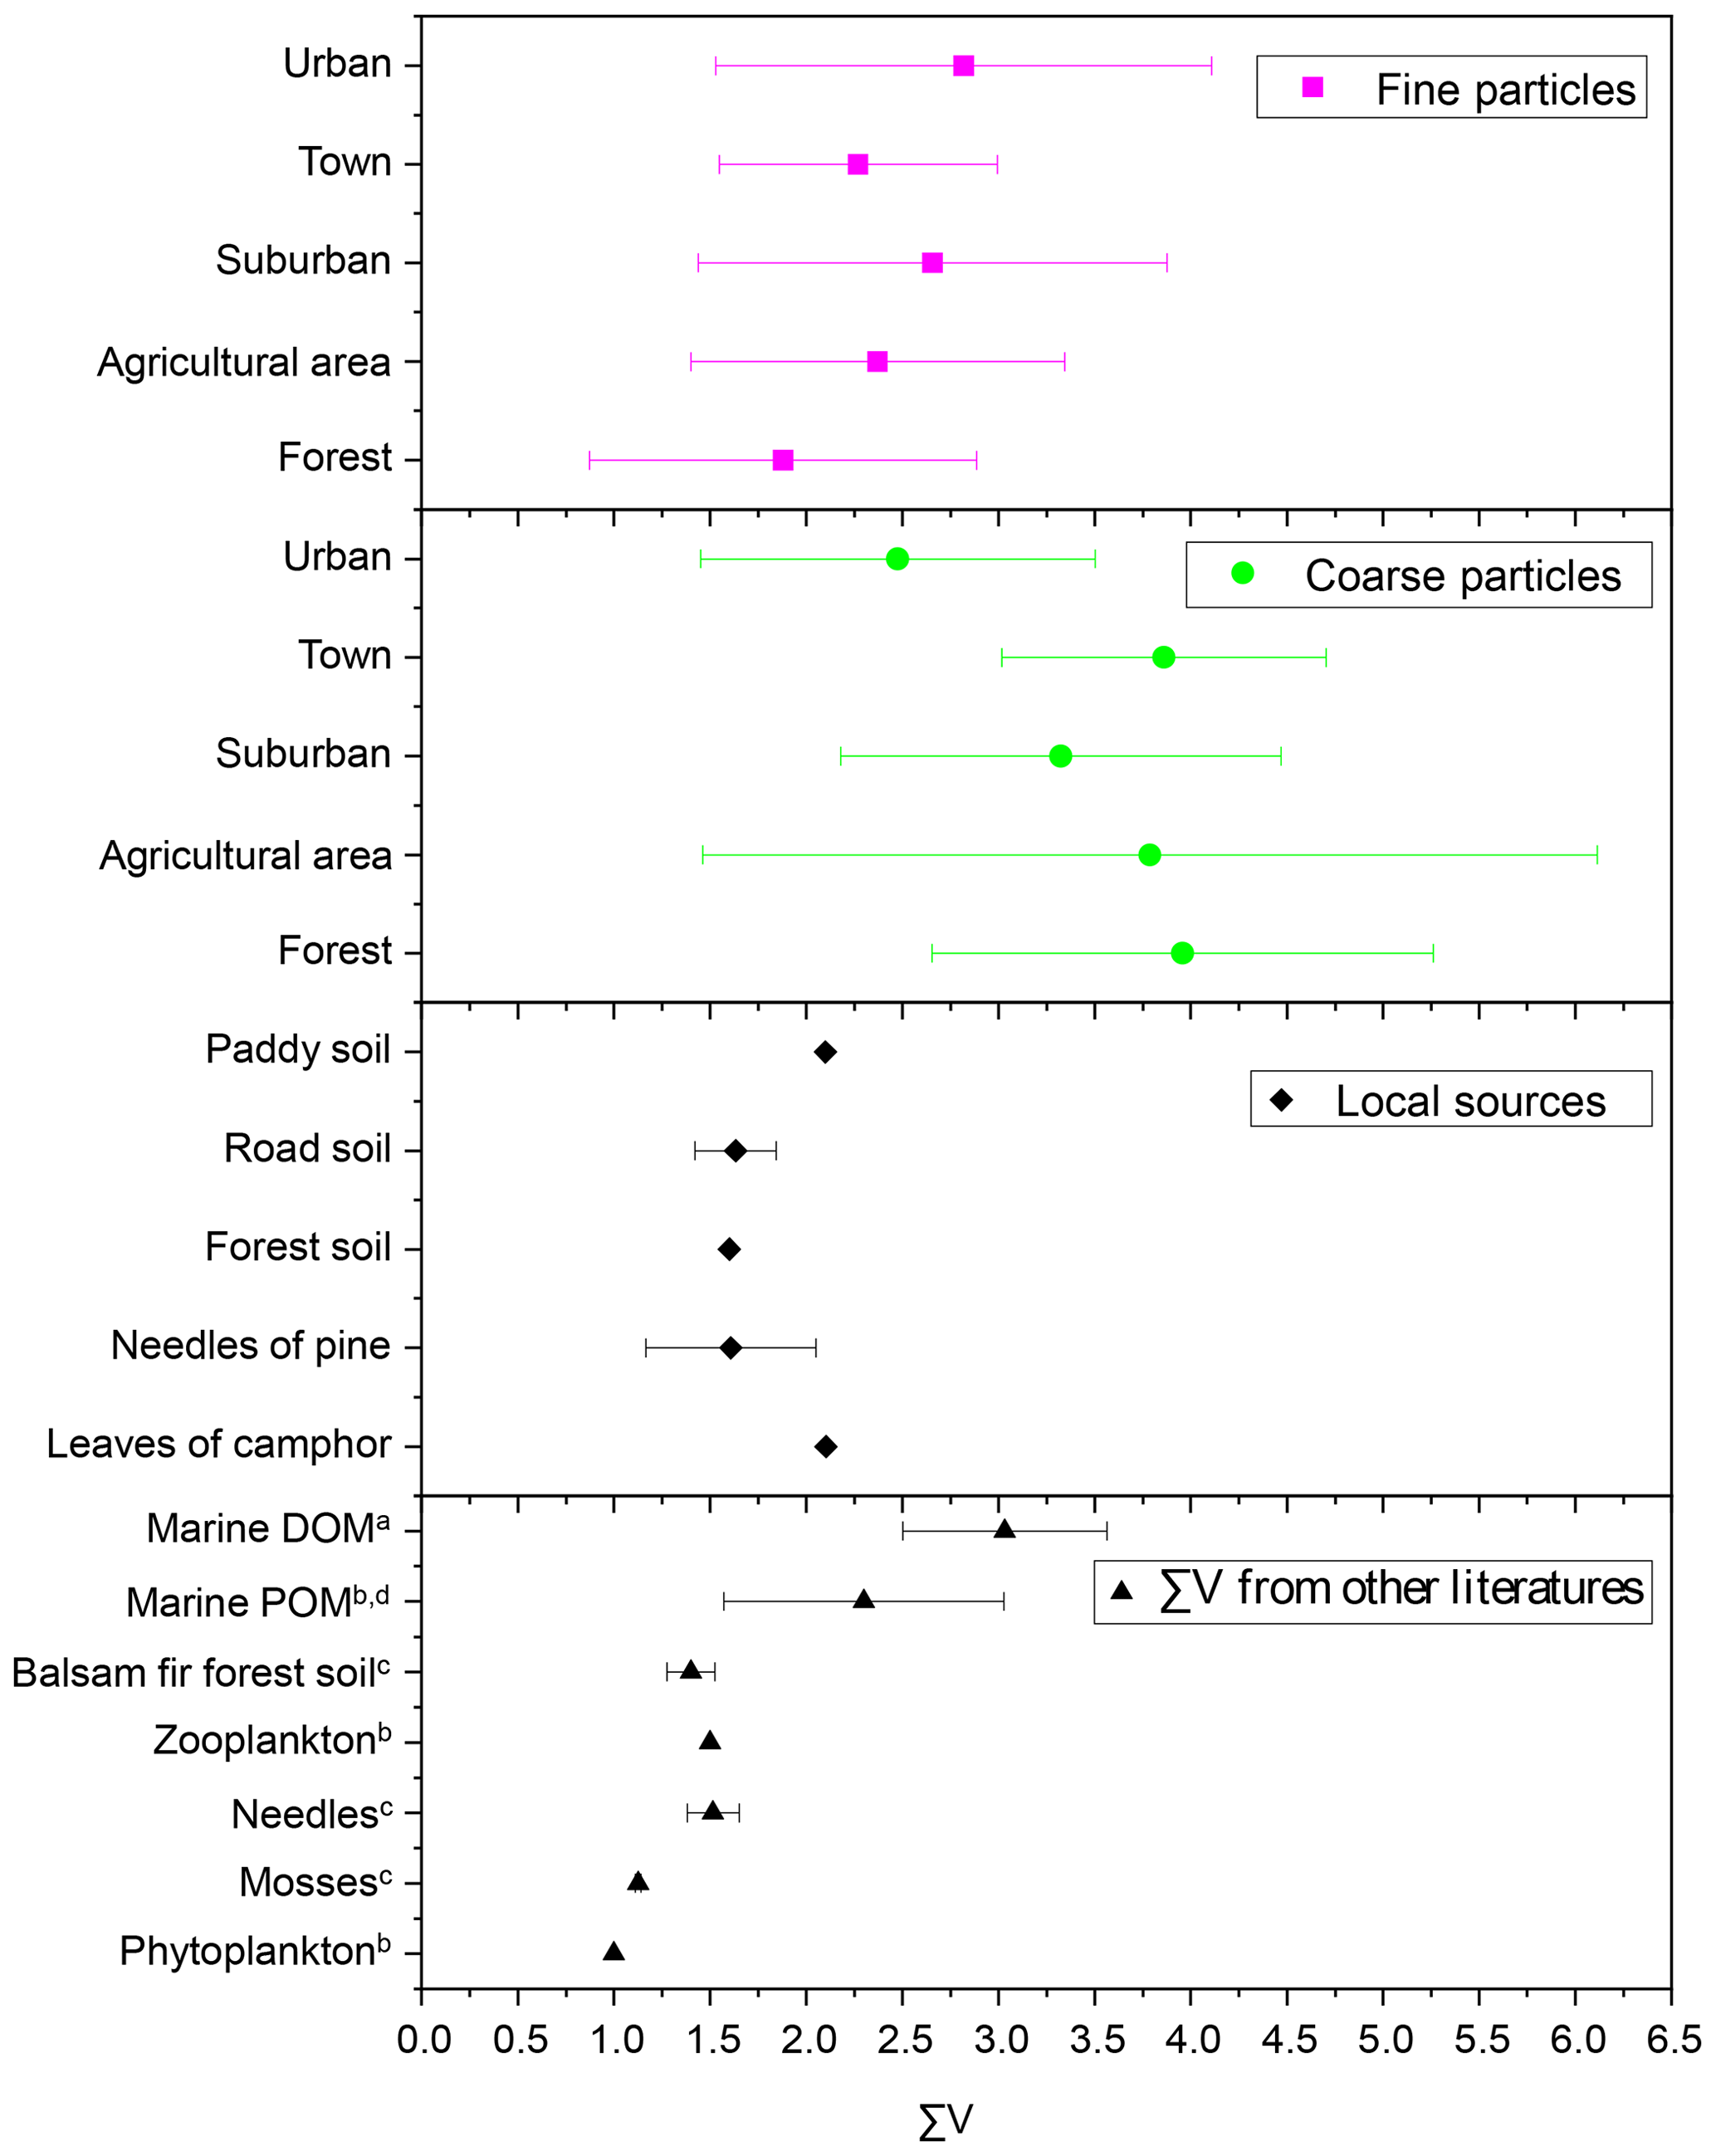
Figure 9∑V values for fine and coarse particles in comparison to local natural sources and other studies. a Calleja et al. (2013). b McCarthy et al. (2007). c Philben et al. (2018). d Batista et al. (2014).
∑V could reflect the increasing trend of “scattering” δ15N-trophic AA patterns related to more intensive bacterial resynthesis (Batista et al., 2014; Calleja et al., 2013; Yamaguchi et al., 2017). In this study, significantly higher values of ∑V were measured in coarse particles than in fine particles (p < 0.05) (Fig. 6). Moreover, the mean ∑V value of fine particles was similar to or slightly higher than that measured in “fresh” materials (McCarthy et al., 2007; Philben et al., 2018; Batista et al., 2014), while ∑V values of coarse particles were equal to or even higher than those of more degraded materials (Fig. 9). These corroborate that more bacterial heterotrophic resynthesis occurred in coarse particles compared to fine particles.
Despite the uncertainties surrounding oxidation, nitration and oligomerization of AAs in the atmosphere, the main observations remain that the difference in δ15N values of source AA (Gly, Ser, Phe and Lys) and total hydrolysable amino acids (δ15NTHAA) between coarse particles and fine particles was relatively small (Fig. 3). The average offset of δ15NTHAA values between fine and coarse particles was lower than 1.5 ‰ (Fig. 4a). These results appear to contrast with what one might expect for AAs in either particle size undergoing particularly more photochemical transformation than the other. Therefore, significantly lower DI values, scattered characteristics of δ15N distribution in trophic AA and higher ∑V values observed in coarse particles in this study provide evidence that the difference in the THAA concentration and mole-percentage composition distribution between fine and coarse particles may be related to AAs in coarse particles having a stronger bacterial degradation state than those in fine particles.
3.6 Release of coarse “fresh” bioparticles during the rainfall
A close relationship between atmospheric bioaerosols and precipitation has been found by previous studies (Huffman et al., 2013; Yue et al., 2016). Since biological sources contain a large abundance of AAs (Ren et al., 2018), HAAs in aerosols can be used as tracer compounds to indicate the release of biological sources during precipitation. However, detailed size-resolved and time-resolved observations for the release of bioparticles initiated by precipitation are spare, and the degradation state of different sizes of bioparticles has never been examined.
In this study, precipitation was observed to exert different impacts on the concentrations of the THAA in fine and coarse particles. The average concentration of THAA in fine particles on rainfall days (1948 ± 1546 pmol m−3) was significantly lower than that measured on dry days (3137 ± 1898 pmol m−3) (p < 0.05), whereas the average concentrations of THAA in coarse particles displayed no significant changes between rainy and dry days (p > 0.05) (Figs. 1 and S1). For coarse particles, the average concentrations of THAA on rainy and dry days were 660 ± 947 and 212 ± 266 pmol m−3, respectively. It is expected that the concentrations of individual AAs in aerosol were assumed to decrease on days on which precipitation fell because of the high scavenging ratio of AAs in aerosols (Gorzelska and Galloway, 1990). In this study, from rainy to dry days, the concentrations of THAA for fine particles decreased (p < 0.05) (Fig. S1), but the concentration of THAAs for coarse particles displayed no significant change (p > 0.05) (Fig. S1). Similar variation trends of different sizes of particles following the precipitation were also observed by Huffman et al. (2013). They also found a steep increase in coarse particles while low concentrations of fluorescent bioparticles and total aerosol particles were found in fine particles during the precipitation, suggesting the newly released AAs during the precipitation are mainly distributed in coarse particles.
It is worth noting that the influence of precipitation on the mole composition profile of HAA is different for the coarse and fine particles (Fig. 2). For fine particles, only the percentage of Pro significantly increased from 14 ± 6 % on dry days to 20 ± 9 % on rainfall days (p < 0.05). There was no apparent trend in the percentage of other individual HAAs for fine particles following the precipitation.
For coarse aerosol, the percentage composition of HAA on dry days is quite different from that on rainy days for coarse particles (Fig. 2). From dry days to rainfall days, the percentage of Pro in coarse particles significantly decreased from 74 ± 25 % to 53 ± 34 % (p < 0.05); meanwhile the percentage of Ala, Val, Leu, Ile and Glu in coarse particles significantly increased (p < 0.05). These HAA species together accounted for 39 % of the total THAA pool on dry days, while on rainfall days, this proportion was only 20 %. Besides that, compared to fine particles, the large variation in mole composition of THAA for coarse particles was observed on rainfall days (Fig. 2). From dry days to rainfall days, the percentage change of Pro for coarse particles (21 %) was roughly 4 times greater than that for fine particles (6 %). Similarly, from dry days to rainy days, the increase in the percentage of Ala, Val, Leu, Ile and Glu in coarse particles was significantly greater than that in fine particles. For example, following the precipitation, Val in coarse particles increased by 4 %, whereas Val in fine particles only increased by 0.3 %. These large variations in the percentage of some HAA species (e.g. Pro, Ala, Val, Leu, Ile and Glu) were observed in coarse particles on rainy days, which imply the states of coarse particles measured on rainfall days were different from the ones measured on dry days (Fig. 2).
This conclusion also supported by the variation of DI and ∑V values for coarse particles on days which on precipitation fell. As exhibited in Fig. 6a, DI values of coarse aerosol particles were influenced by precipitation. For coarse aerosol particles, a significant increase in DI value was found from dry (average = −1.0 ± 0.8) to rainy days (average = −0.3 ± 1.1) (p < 0.05), whereas the DI values of fine particles on dry (average = 0.7 ± 0.3) and rainy days (average = 0.6 ± 0.4) were not significantly different (p > 0.05). Figure 6b shows the ∑V values of fine and coarse particles on dry and rainy days. The ∑V values of coarse aerosol particles were also significantly affected by precipitation. From dry to rainy days, ∑V values of coarse aerosol particles decreased from 4.5 ± 1.5 ‰ to 3.0 ± 1.3 ‰ (p < 0.05). In contrast, the average ∑V value of fine particles on dry and rainy days was identical (2.4 ± 1.1 ‰). From dry to rainy days, DI values in coarse aerosol particles were significant increased (p < 0.05) but the ∑V value was significantly decreased (p < 0.05), suggesting more fresh AAs in coarse particles were released on days on which precipitation fell, whereas on dry days AAs in coarse particles were more degraded.
Furthermore, we observed an obviously temporal variation of the concentration and mole-percentage composition of HAA for coarse particles during the precipitation. The higher concentration of THAAs in coarse particles occurred on 30 April and 5, 6 and 13 May when the daily precipitation amount was above 1mm and the hourly rainfall amount was above 0.2 mm (Fig. 1 and Table S4). Previous studies demonstrated that droplets splashing on a porous medium can deliver fresh biological aerosols in the porous medium to the aerosol, and this mechanism is closely related to the amounts and intensity of the rainfall events (Joung and Buie, 2015; Huffman et al., 2013; Yue et al., 2016). Thus, the temporal variation trend of HAA concentration for coarse particles in this study can be attributed to the active release of biological aerosols caused by droplets, and it highly depends on the amounts and intensity of the rainfall. Moreover, the mole-percentage composition of HAA in coarse particles measured on days with higher daily precipitation amount and hourly rainfall amount was significantly different from that observed on days with lower precipitation amount and intensity. Specifically, a steep decrease in the percentage of Pro and increase in other HAAs in coarse particles mainly occurred on days with a daily precipitation amount above 1 mm and hourly rainfall amount above 0.2 mm, whereas the mole-percentage composition of HAA on days with a lower daily and hourly precipitation amount were similar to those observed on dry days (Fig. 2). As we discussed above, AAs in coarse particles on dry days were more degraded. Therefore, we conclude that those “fresh” protein matters in coarse particles are likely prone to be released by droplets, and the amount and intensity of the rainfall are the key factors controlling this mechanism.
This size distribution of AAs can help understand its transformation and fate in the atmosphere. Therefore, verification of the different types, concentrations, origin and atmospheric processes of AAs distribution along the different air particle sizes is important and meaningful.
This study presents the first isotopic evidence that the sources of AAs for fine and coarse aerosol particles may be similar, all of which were influenced by biomass burning, soil and plant sources. It is therefore that the huge difference in the concentrations and mole-percentage compositions of THAAs between fine and coarse particles observed in this study is closely relevant to the degradation processes of AAs in aerosols.
Although the oxidation, nitrification and oligomerization processes of protein substances in the atmosphere have been widely reported, these abiotic photochemical ageing processes that occur between fine particles and coarse particles have not been compared. In this study, the difference in δ15N values of source AA (Gly, Ser, Phe and Lys) and total hydrolysable amino acids (δ15NTHAA) between coarse particles and fine particles was relatively small. The average offset of δ15NTHAA value between fine and coarse particles was lower than 1.5 ‰. These results appear to contrast with what one might expect for AAs of either particle size undergoing particularly more photochemical transformation than the other.
On the contrary, the degradation of atmospheric AAs in aerosols is rarely investigated. This is the first report of using a degradation marker (DI) to investigate the degradation state of aerosol particles. Both composition profiles of HAA and concentrations of THAAs in aerosols are shown to be closely related to DI. And fine particles had significantly higher DI values than that of coarse particles (p < 0.05), suggesting the degradation degree of amino acids in coarse particles is higher than that in fine particles. Combining a new compound-specific nitrogen isotope tool (δ15N-HAA) and effective bacterial heterotrophy indicator (∑V), scattered characteristics of δ15N distribution in trophic AA and higher ∑V values were observed in coarse particles in this study, which firstly provide evidence that the stronger degradation state the found in coarse particles are coupled with more bacterial heterotrophic resynthesis occurring in coarse particles.
This study suggests the potentially significant role of bacterial degradation processes in the concentration and composition of protein distribution in size-segregated aerosol particles. Since the degradation state of airborne protein distribution along size-segregated particles is closely linked to its biological availability, ecological processes and plant nutrition after deposition, further studies of quantitative assessments of this biological related process in aerosols should be conducted.
The code can be made available by request to the corresponding author Hua-Yun Xiao (xiaohuayun@ecut.edu.cn).
Temperature (T) and relative humidity (RH) data during the sampling period are publicly available from the Global Weather and Climate Information Network: http://www.weatherandclimate.info/weather.php?id=58606&bday=1&fday=31&amonth=5&ayear=2019 (Pogoda i Klimat, 2021). Other data are available upon request from Hua-Yun Xiao (xiaohuayun@ecut.edu.cn).
The supplement related to this article is available online at: https://doi.org/10.5194/acp-21-2585-2021-supplement.
RGZ, ZW and YZ designed the experiments, performed analyses and analysed the data. HYX was the principal investigator of the project that supported this work. All the authors have helped in the discussion of the results and collaborated in writing this article.
The authors declare that they have no conflict of interest.
This work was supported by the National Natural Science Foundation of China (grant nos. 41425014 and 41463007), Key Laboratory Project of Jiangxi Province (20171BCD40010) and Two 1000 Talents Plan Project of Jiangxi Province (S2018CQKJ0755). We are thankful to the Global Weather and Climate Information Network (http://www.weatherandclimate.info/, last access: 10 February 2021) for providing meteorological parameters include temperature (T) and relative humidity (RH), during the sampling period.
This research has been supported by the National Natural Science Foundation of China (grant nos. 41425014 and 41463007), the Key Laboratory Project of Jiangxi Province (grant no. 20171BCD40010), and the Two 1000 Talents Plan Project of Jiangxi Province (grant no. S2018CQKJ0755).
This paper was edited by Alex Huffman and reviewed by three anonymous referees.
Amato, P., Demeer, F., Melaouhi, A., Fontanella, S., Martin-Biesse, A.-S., Sancelme, M., Laj, P., and Delort, A.-M.: A fate for organic acids, formaldehyde and methanol in cloud water: their biotransformation by micro-organisms, Atmos. Chem. Phys., 7, 4159–4169, https://doi.org/10.5194/acp-7-4159-2007, 2007.
Barbaro, E., Feltracco, M., Cesari, D., Padoan, S., Zangrando, R., Contini, D., Barbante, C., and Gambaro, A.: Characterization of the water soluble fraction in ultrafine, fine, and coarse atmospheric aerosol, Sci. Total Environ., 658, 1423–1439, https://doi.org/10.1016/j.scitotenv.2018.12.298, 2019.
Batista, F. C., Ravelo, A. C., Crusius, J., Casso, M. A., and McCarthy, M. D.: Compound specific amino acid δ15N in marine sediments: A new approach for studies of the marine nitrogen cycle, Geochim. Cosmochim. Ac., 142, 553–569, https://doi.org/10.1016/j.gca.2014.08.002, 2014.
Bauer, H., Kasper-Giebl, A., Löflund, M., Giebl, H., Hitzenberger, R., Zibuschka, F., and Puxbaum, H.: The contribution of bacteria and fungal spores to the organic carbon content of cloud water, precipitation and aerosols, Atmos. Res., 64, 109–119, https://doi.org/10.1016/S0169-8095(02)00084-4, 2002.
Bigg, E. K.: Sources, nature and influence on climate of marine airborne particles, Environ. Chem., 4, 155–161, https://doi.org/10.1071/EN07001, 2007.
Bol, R., Ostle, N. J., and Petzke, K. J.: Compound specific plant amino acid δ15N values differ with functional plant strategies in temperate grassland, J. Plant Nutr. Soil Sci., 165, 661–667, https://doi.org/10.1002/jpln.200290000, 2002.
Bowers, R. M., Clements, N., Emerson, J. B., Wiedinmyer, C., Hannigan, M. P., and Fierer, N.: Seasonal Variability in Bacterial and Fungal Diversity of the Near-Surface Atmosphere, Environ. Sci. Technol., 47, 12097–12106, https://doi.org/10.1021/es402970s, 2013.
Burdige, D. J.: Preservation of Organic Matter in Marine Sediments: Controls, Mechanisms, and an Imbalance in Sediment Organic Carbon Budgets?, Chem. Rev., 107, 467–485, https://doi.org/10.1021/cr050347q, 2007.
Calleja, M. L., Batista, F., Peacock, M., Kudela, R., and McCarthy, M. D.: Changes in compound specific δ15N amino acid signatures and d l ratios in marine dissolved organic matter induced by heterotrophic bacterial reworking, Mar. Chem., 149, 32–44, https://doi.org/10.1016/j.marchem.2012.12.001, 2013.
Chen, Y., Yang, G. P., Liu, L., Zhang, P. Y., and Leng, W. S.: Sources, behaviors and degradation of dissolved organic matter in the East China Sea, J. Mar. Syst., 155, 84–97, https://doi.org/10.1016/j.jmarsys.2015.11.005, 2016.
Chikaraishi, Y., Ogawa, N. O., Kashiyama, Y., Takano, Y., Suga, H., Tomitani, A., Miyashita, H., Kitazato, H., and Ohkouchi, N.: Determination of aquatic food-web structure based on compound-specific nitrogen isotopic composition of amino acids, Limnol. Oceanogr. Meth., 7, 740–750, https://doi.org/10.4319/lom.2009.7.740, 2009.
Cowie, G. L. and Hedges, J. I.: Sources and reactivities of amino acids in a coastal marine environment, Limnol. Oceanogr., 37, 703–724, https://doi.org/10.4319/lo.1992.37.4.0703, 1992.
Cowie, G. L. and Hedges, J. I.: Biochemical indicators of diagenetic alteration in natural organic matter mixtures, Nature, 369, 304–307, https://doi.org/10.1038/369304a0, 1994.
Dauwe, B. and Middelburg, J. J.: Amino Acids and Hexosamines as Indicators of Organic Matter Degradation State in North Sea Sediments, Limnol. Oceanogr., 43, 782–798, https://doi.org/10.4319/lo.1998.43.5.0782, 1998.
Dauwe, B., Middelburg, J. J., Herman, P. M. J., and Heip, C. H. R.: Linking DiageneticAlteration of Amino Acids and Bulk Organic Matter Reactivity, Limnol. Oceanogr., 44, 1809–1814, https://doi.org/10.4319/lo.1999.44.7.1809, 1999.
Després, V., Huffman, J. A., Burrows, S. M., Hoose, C., Safatov, A., Buryak, G., Fröhlich-Nowoisky, J., Elbert, W., Andreae, M., Pöschl, U., and Jaenicke, R.: Primary biological aerosol particles in the atmosphere: a review, Tellus B, 64, 15598, https://doi.org/10.3402/tellusb.v64i0.15598, 2012.
Di Filippo, P. D., Pomata, D., Riccardi, C., Buiarelli, F., Gallo, V., and Quaranta, A.: Free and combined amino acids in size-segregated atmospheric aerosol samples, Atmos. Environ., 98, 179–189, https://doi.org/10.1016/j.atmosenv.2014.08.069, 2014.
Feltracco, M., Barbaro, E., Kirchgeorg, T., Spolaor, A., Turetta, C., Zangrando, R., Barbante, C., and Gambaro, A.: Free and combined L-and D-amino acids in Arctic aerosol, Chemosphere, 220, 412–421, https://doi.org/10.1016/j.chemosphere.2018.12.147, 2019.
Fogel, M. L. and Tuross, N.: Transformation of plant biochemicals to geological macromolecules during early diagenesis, Oecologia, 120, 336–346, https://doi.org/10.1007/s004420050867, 1999.
Gorzelska, K. and Galloway, J. N.: Amine nitrogen in the atmospheric environment over the North Atlantic Ocean, Global Biogeochem. Cy., 4, 309–333, https://doi.org/10.1029/GB004i003p00309, 1990.
Haan, D. O. D., Corrigan, A. L., Smith, K. W., Stroik, D. R., Turley, J. J., Lee, F. E., Tolbert, M. A., Jimenez, J. L., Cordova, K. E., and Ferrell, G. R.: Secondary Organic Aerosol-Forming Reactions of Glyoxal with Amino Acids, Environ. Sci. Technol., 43, 2818–2824, https://doi.org/10.1021/es803534f, 2009.
Huffman, J. A., Prenni, A. J., DeMott, P. J., Pöhlker, C., Mason, R. H., Robinson, N. H., Fröhlich-Nowoisky, J., Tobo, Y., Després, V. R., Garcia, E., Gochis, D. J., Harris, E., Müller-Germann, I., Ruzene, C., Schmer, B., Sinha, B., Day, D. A., Andreae, M. O., Jimenez, J. L., Gallagher, M., Kreidenweis, S. M., Bertram, A. K., and Pöschl, U.: High concentrations of biological aerosol particles and ice nuclei during and after rain, Atmos. Chem. Phys., 13, 6151–6164, https://doi.org/10.5194/acp-13-6151-2013, 2013.
Husárová, S., Vaïtilingom, M., Deguillaume, L., Traikia, M., Vinatier, V., Sancelme, M., Amato, P., Matulová, M., and Delort, A.-M.: Biotransformation of methanol and formaldehyde by bacteria isolated from clouds. Comparison with radical chemistry, Atmos. Environ., 45, 6093–6102, https://doi.org/10.1016/j.atmosenv.2011.06.035, 2011.
Ji, C. X., Yang, G. P., Chen, Y., and Zhang, P. Y.: Distribution, degradation and bioavailability of dissolved organic matter in the East China Sea, Biogeochemistry, 142, 189–207, https://doi.org/10.1007/s10533-018-0529-8, 2019.
Jiang, Z., Liu, J., Chen, J., Chen, Q., Yan, X., Xuan, J., and Zeng, J.: Responses of summer phytoplankton community to drastic environmental changes in the Changjiang (Yangtze River) estuary during the past 50 years, Water Res., 54, 1–11, https://doi.org/10.1016/j.watres.2014.01.032, 2014.
Joung, Y. S. and Buie, C. R.: Aerosol generation by raindrop impact on soil, Nat. Commun., 6, 6083–6083, https://doi.org/10.1038/ncomms7083, 2015.
Koolman, J., and Röhm, K.-H.: Color atlas of biochemistry, second edition, Thieme Stuttgart, 480 pp., New York, ISBN 1588902471, 2005.
Kuznetsova, M., Lee, C., and Aller, J.: Characterization of the proteinaceous matter in marine aerosols, Mar. Chem., 96, 359–377, https://doi.org/10.1016/j.marchem.2005.03.007, 2005.
Leck, C. and Bigg, E. K.: Source and evolution of the marine aerosol – A new perspective, Geophys. Res. Lett., 32, L19803, https://doi.org/10.1029/2005gl023651, 2005a.
Leck, C. and Bigg, E. K.: Biogenic particles in the surface microlayer and overlaying atmosphere in the central Arctic Ocean during summer, Tellus B, 57, 305–316, https://doi.org/10.3402/tellusb.v57i4.16546, 2005b.
Leck, C. and Keith Bigg, E.: Comparison of sources and nature of the tropical aerosol with the summer high Arctic aerosol, Tellus B, 60, 118–126, https://doi.org/10.1111/j.1600-0889.2007.00315.x, 2008.
Liu, F., Lai, S., Tong, H., Lakey, P. S. J., Shiraiwa, M., Weller, M. G., Pöschl, U., and Kampf, C. J.: Release of free amino acids upon oxidation of peptides and proteins by hydroxyl radicals, Anal. Bioanal. Chem., 409, 2411–2420, https://doi.org/10.1007/s00216-017-0188-y, 2017.
Mace, K. A., Artaxo, P., and Duce, R. A.: Water-soluble organic nitrogen in Amazon Basin aerosols during the dry (biomass burning) and wet seasons, J. Geophys. Res.-Atmos, 108, 4512, https://doi.org/10.1029/2003JD003557, 2003.
Matos, J. T. V., Duarte, R. M. B. O., and Duarte, A. C.: Challenges in the identification and characterization of free amino acids and proteinaceous compounds in atmospheric aerosols: A critical review, Trends Analyt. Chem., 75, 97–107, https://doi.org/10.1016/j.trac.2015.08.004, 2016.
Mcclelland, J. W. and Montoya, J. P.: Trophic relationships and the nitrogen isotopic composition of amino acids in plankton, Ecol., 83, 2173–2180, https://doi.org/10.2307/3072049, 2002.
McCarthy, M. D., Benner, R., Lee, C., Hedges, J. I., and Fogel, M. L.: Amino acid carbon isotopic fractionation patterns in oceanic dissolved organic matter: an unaltered photoautotrophic source for dissolved organic nitrogen in the ocean?, Mar. Chem., 92, 123–134, https://doi.org/10.1016/j.marchem.2004.06.021, 2004.
McCarthy, M. D., Benner, R., Lee, C., and Fogel, M. L.: Amino acid nitrogen isotopic fractionation patterns as indicators of heterotrophy in plankton, particulate, and dissolved organic matter, Geochim. Cosmochim. Ac., 71, 4727–4744, https://doi.org/10.1016/j.gca.2007.06.061, 2007.
McCarthy, M. D., Lehman, J., and Kudela, R.: Compound-specific amino acid δ15N patterns in marine algae: Tracer potential for cyanobacterial vs. eukaryotic organic nitrogen sources in the ocean, Geochim. Cosmochim. Ac., 103, 104–120, https://doi.org/10.1016/j.gca.2012.10.037 2013.
Miguel, A. G., Cass, G. R., Glovsky, M. M., and Weiss, J.: Allergens in Paved Road Dust and Airborne Particles, Environ. Sci. Technol., 33, 4159–4168, https://doi.org/10.1021/es9904890, 1999.
Papastefanou, C.: Residence time of tropospheric aerosols in association with radioactive nuclides, Appl. Radiat. Isot., 64, 93–100, https://doi.org/10.1016/j.apradiso.2005.07.006, 2006.
Philben, M., Billings, S. A., Edwards, K. A., Podrebarac, F. A., van Biesen, G., and Ziegler, S. E.: Amino acid δ15N indicates lack of N isotope fractionation during soil organic nitrogen decomposition, Biogeochemistry, 138, 69–83, https://doi.org/10.1007/s10533-018-0429-y, 2018.
Pogoda i Klimat: Weather and Climate, http://www.weatherandclimate.info/weather.php?id=58606&bday=1&fday=31&amonth=5&ayear=2019, 10 February 2021.
Ren, L., Bai, H., Yu, X., Wu, F., Yue, S., Ren, H., Li, L., Lai, S., Sun, Y., and Wang, Z.: Molecular composition and seasonal variation of amino acids in urban aerosols from Beijing, China, Atmos. Res., 203, 28–35, https://doi.org/10.1016/j.atmosres.2017.11.032, 2018.
Samy, S., Robinson, J., Rumsey, I. C., Walker, J. T., Hays, M. D., Robinson, J., Rumsey, I. C., and Hays, M. D.: Speciation and trends of organic nitrogen in southeastern U.S. fine particulate matter (PM2.5), J. Geophys. Res.-Atmos, 118, 1996–2006, https://doi.org/10.1029/2012JD017868, 2013.
Song, T., Wang, S., Zhang, Y., Song, J., Liu, F., Fu, P., Shiraiwa, M., Xie, Z., Yue, D., Zhong, L., Zheng, J., and Lai, S.: Proteins and Amino Acids in Fine Particulate Matter in Rural Guangzhou, Southern China: Seasonal Cycles, Sources, and Atmospheric Processes, Environ. Sci. Technol., 51, 6773–6781, https://doi.org/10.1021/acs.est.7b00987, 2017.
Wang, K., Chen, J. F., Jin, H. Y., Li, H. L., and Zhang, W. Y.: Organic matter degradation in surface sediments of the Changjiang estuary: Evidence from amino acids, Sci. Total Environ., 637, 1004–1013, https://doi.org/10.1016/j.scitotenv.2018.04.242, 2018.
Wang, S., Song, T., Shiraiwa, M., Song, J., Ren, H., Ren, L., Wei, L., Sun, Y., Zhang, Y., Fu, P., and Lai, S.: Occurrence of Aerosol Proteinaceous Matter in Urban Beijing: An Investigation on Composition, Sources, and Atmospheric Processes During the “APEC Blue” Period, Environ. Sci. Technol., 53, 7380–7390, https://doi.org/10.1021/acs.est.9b00726, 2019.
Wedyan, M. A. and Preston, M. R.: The coupling of surface seawater organic nitrogen and the marine aerosol as inferred from enantiomer-specific amino acid analysis, Atmos. Environ., 42, 8698–8705, https://doi.org/10.1016/j.atmosenv.2008.04.038, 2008.
Wei, K., Zou, Z., Zheng, Y., Li, J., Shen, F., Wu, C.-y., Wu, Y., Hu, M., and Yao, M.: Ambient bioaerosol particle dynamics observed during haze and sunny days in Beijing, Sci. Total Environ., 550, 751–759, https://doi.org/10.1016/j.scitotenv.2016.01.137, 2016.
Wei, M., Xu, C., Xu, X., Zhu, C., Li, J., and Lv, G.: Characteristics of atmospheric bacterial and fungal communities in PM2.5 following biomass burning disturbance in a rural area of North China Plain, Sci. Total Environ., 651, 2727–2739, https://doi.org/10.1016/j.scitotenv.2018.09.399, 2019.
Xu, Y., Wu, D., Xiao, H., and Zhou, J.: Dissolved hydrolyzed amino acids in precipitation in suburban Guiyang, southwestern China: Seasonal variations and potential atmospheric processes, Atmos. Environ., 211, 247–255, https://doi.org/10.1016/j.atmosenv.2019.05.011, 2019.
Yamaguchi, Y. T., Chikaraishi, Y., Takano, Y., Ogawa, N. O., Imachi, H., Yokoyama, Y., and Ohkouchi, N.: Fractionation of nitrogen isotopes during amino acid metabolism in heterotrophic and chemolithoautotrophic microbes across Eukarya, Bacteria, and Archaea: Effects of nitrogen sources and metabolic pathways, Org. Geochem., 111, 101–112, https://doi.org/10.1016/j.orggeochem.2017.04.004, 2017.
Yamashita, Y. and Tanoue, E.: Distribution and alteration of amino acids in bulk DOM along a transect from bay to oceanic waters, Mar. Chem., 82, 145–160, https://doi.org/10.1016/S0304-4203(03)00049-5, 2003.
Yan, G., Kim, G., Kim, J., Jeong, Y.-S., and Kim, Y. I.: Dissolved total hydrolyzable enantiomeric amino acids in precipitation: Implications on bacterial contributions to atmospheric organic matter, Geochim. Cosmochim. Ac., 153, 1–14, https://doi.org/10.1016/j.gca.2015.01.005, 2015.
Yue, S., Ren, H., Fan, S., Sun, Y., Wang, Z., and Fu, P.: Springtime precipitation effects on the abundance of fluorescent biological aerosol particles and HULIS in Beijing, J. Sci. Res., 6, 29618, https://doi.org/10.1038/srep29618, 2016.
Zhang, Q., Anastasio, C., and Jimenez-Cruz, M.: Water-soluble organic nitrogen in atmospheric fine particles (PM2.5) from northern California, J. Geophys. Res.-Atmos, 107, AAC 3-1–AAC 3-9, https://doi.org/10.1029/2001JD000870, 2002.
Zhang, Q. and Anastasio, C.: Free and combined amino compounds in atmospheric fine particles (PM2.5) and fog waters from Northern California, Atmos. Environ., 37, 2247–2258, https://doi.org/10.1016/S1352-2310(03)00127-4, 2003.
Zhu, R.-G., Xiao, H.-Y., Zhang, Z., and Lai, Y.: Compound-specific δ15N composition of free amino acids in moss as indicators of atmospheric nitrogen sources, J. Sci. Res., 8, 14347, https://doi.org/10.1038/s41598-018-32531-x, 2018.
Zhu, R.-G., Xiao, H.-Y., Zhu, Y., Wen, Z., Fang, X., and Pan, Y.: Sources and Transformation Processes of Proteinaceous Matter and Free Amino Acids in PM2.5, J. Geophys. Res.-Atmos, 125, e2020JD032375, https://doi.org/10.1029/2020jd032375, 2020.