the Creative Commons Attribution 4.0 License.
the Creative Commons Attribution 4.0 License.
 | 22 Feb 2021
Measurement report: Distinct emissions and volatility distribution of intermediate-volatility organic compounds from on-road Chinese gasoline vehicles: implication of high secondary organic aerosol formation potential
Rongzhi Tang
Quanyang Lu
Hui Wang
Kai Song
Ying Yu
Rui Tan
Kefan Liu
Ruizhe Shen
Shiyi Chen
Limin Zeng
Spiro D. Jorga
Zhou Zhang
Wenbin Zhang
Shijin Shuai
In the present work, we performed chassis dynamometer experiments to investigate the emissions and secondary organic aerosol (SOA) formation potential of intermediate-volatility organic compounds (IVOCs) from an on-road Chinese gasoline vehicle. High IVOC emission factors (EFs) and distinct volatility distribution were recognized. The IVOC EFs for the China V vehicle ranged from 12.1 to 226.3 mg per kilogram fuel, with a median value of 83.7 mg per kilogram fuel, which was higher than that from US vehicles. Besides, a large discrepancy in volatility distribution and chemical composition of IVOCs from Chinese gasoline vehicle exhaust was discovered, with larger contributions of B14–B16 compounds (retention time bins corresponding to C14-C16 n-alkanes) and a higher percentage of n-alkanes. Further we investigated the possible reasons that influence the IVOC EFs and volatility distribution and found that fuel type, starting mode, operating cycles and acceleration rates did have an impact on the IVOC EF. When using E10 (ethanol volume ratio of 10 %, ) as fuel, the IVOC EF of the tested vehicle was lower than that using commercial China standard V fuel. The average IVOC-to-THC (total hydrocarbon) ratios for gasoline-fueled and E10-fueled gasoline vehicles were 0.07±0.01 and 0.11±0.02, respectively. Cold-start operation had higher IVOC EFs than hot-start operation. The China Light-Duty Vehicle Test Cycle (CLTC) produced 70 % higher IVOCs than those from the Worldwide Harmonized Light Vehicles Test Cycle (WLTC). We found that the tested vehicle emitted more IVOCs at lower acceleration rates, which leads to high EFs under CLTC. The only factor that may influence the volatility distribution and compound composition is the engine aftertreatment system, which has compound and volatility selectivity in exhaust purification. These distinct characteristics in EFs and volatility may result in higher SOA formation potential in China. Using published yield data and a surrogate equivalent method, we estimated SOA formation under different OA (organic aerosol) loading and NOx conditions. Results showed that under low- and high-NOx conditions at different OA loadings, IVOCs contributed more than 80 % of the predicted SOA. Furthermore, we built up a parameterization method to simply estimate the vehicular SOA based on our bottom-up measurement of VOCs (volatile organic compounds) and IVOCs, which would provide another dimension of information when considering the vehicular contribution to the ambient OA. Our results indicate that vehicular IVOCs contribute significantly to SOA, implying the importance of reducing IVOCs when making air pollution controlling policies in urban areas of China.
- Article
(1817 KB) - Full-text XML
-
Supplement
(1545 KB) - BibTeX
- EndNote


Atmospheric fine particulate matter has great impacts on human health, regional air pollution and global climate (Hallquist et al., 2009; Guo et al., 2014b). Organic aerosols are a major component of fine particulate matter. Secondary organic aerosol (SOA), formed from multiple generations of oxidation of thousands of organic gases and vapors, contributes 30 % or more of organic aerosols in different areas of the world (Zhang et al., 2007). It has a great impact on various other atmospheric processes, e.g., new particle formation and growth and black carbon aging (Guo et al., 2020; Peng et al., 2016; Guo et al., 2016). Due to its complexity in sources and photochemical processes, SOA formation remains uncertain (Tang et al., 2019; Wang et al., 2020; Guo et al., 2014a).
A large discrepancy remains between modeled and measured SOA. One possible reason is missing SOA precursors. Apart from traditional SOA precursors, i.e., volatile organic compounds (VOCs), Robinson et al. (2007) proposed intermediate-volatility organic compounds (IVOCs) as important contributors to SOA formation. IVOCs are less volatile than VOCs with effective saturation concentrations in the range of 103 to 106 µg m−3 (Donahue et al., 2006), roughly corresponding to the volatility range of C12-C22 n-alkanes. IVOCs exist mainly in the gas phase under typical atmospheric conditions. Previous studies demonstrate that IVOCs may be important SOA precursors both in ambient air and in typical source emissions, i.e., emissions from gasoline vehicles, diesel vehicles and ships (Huang et al., 2018; Zhao et al., 2016, 2015, 2014; Yu et al., 2021). Recent model studies have shown that adding IVOC emissions into different models will greatly improve the SOA simulation results. For example, Giani et al. (2019) found a considerable OA (organic aerosol) enhancement in Po Valley (northern Italy) when applying new SVOC (semi-volatility organic compound) and IVOC emission estimates and the new volatility distributions into CAMx (Comprehensive Air Quality Model with Extensions), in which the improvement in SOA was mainly due to the revised IVOC emissions. Huang et al. (2020) found a similar enhancement in SOA simulations for the Yangtze River Delta (southeastern China) region when adding IVOC emissions into CAMx. They also show the importance of volatility distribution and emission parameterization for the model simulation. Therefore, understanding and characterizing IVOC emissions, as well as their volatility distributions, is crucial for improving numerical models that aim to predict OA.
China is in a high-growth stage with a rapidly increasing number of on-road vehicles (∼26-fold increase in 25 years). This growth has created a substantial burden on air quality and human health (Hallquist et al., 2016; Hu et al., 2015). Anthropogenic emissions have become the major contributors to both primary and secondary particles in megacities of China (Tang et al., 2018; Guo et al., 2012). During the past few years, many researchers have studied the gas and particulate matter emissions from Chinese vehicles (Cao et al., 2016; Huang et al., 2015). However, none of these studies have reported data on IVOC emissions from Chinese gasoline vehicles. Although Zhao et al. (2016) characterized IVOC emissions in gasoline vehicles in the United States, the results may not be applicable to China given differences in vehicle technologies, operating conditions and fuel quality. Therefore, understanding and characterizing the IVOC emissions, as well as their volatility distributions from Chinese vehicles, is of vital importance to understand the contribution of IVOCs to SOA formation in China.
In this study, IVOC emissions were measured from a China V gasoline vehicle equipped with a gasoline direct injection (GDI) engine during chassis dynamometer testing. The test matrix considered the influence of fuel type and operating conditions on the total IVOC emission factors, including a newly designed cycle designed to simulate Chinese driving conditions. All of the measurements were performed with the same gasoline vehicle in order to consistently evaluate the effects of these different factors on IVOC emissions. The emission factors (EFs), volatility and chemical speciation of IVOC emissions from different conditions were investigated, and the SOA formation potential was estimated.
2.1 Testing vehicles, fuels and test cycles
In this study, all measurements were performed on a vehicle chassis dynamometer (Peng et al., 2017) using an in-use light-duty gasoline direct inject (GDI) engine vehicle meeting the China V standard (similar to Euro 5). Tests were conducted with two fuels: commercial China standard V gasoline and E10 fuel (10 % ethanol by volume). The test cycles included the Worldwide Harmonized Light Vehicles Test Cycle (WLTC) and the China Light-Duty Vehicle Test Cycle (CLTC). Furthermore, different typical acceleration rates were also tested. A detailed description and speed profiles of WLTC and CLTC are in Fig. S1 in the Supplement. CLTC was specifically designed to simulate the driving patterns in Chinese cities, while WLTC referred to the Euro 6 standard and adopted it as the China VI testing protocol. Prior to tests, the tested vehicle was preconditioned with an overnight soak, without an evaporative canister purge. Different acceleration rates were selected based on their frequency in both CLTC and WLTC, i.e., 1.2, 3.6 and 6.0 (written as ACR1.2, ACR3.6 and ACR6.0), to investigate the effects of acceleration rates on IVOC emissions. All three acceleration “cycles” last for 600 s with a maximum velocity of 70 km h−1. The acceleration driving cycles were set according to the criteria of an identical cycle period and maximum velocity, and hence the mean velocity for each acceleration cycle is the same (Fig. S2). We also measured IVOC emission factors (EFs) when the test vehicle was idling.
2.2 Sampling and chemical analysis
Tailpipe emissions were introduced to a constant-volume sampler (CVS) that diluted the exhaust by a factor of 20 to 40. For WLTC and CLTC tests, IVOCs emissions were collected by sampling the diluted exhaust through a quartz filter followed by two tandem Tenax TA-filled glass tubes (Gerstel 6 mm o.d. and 4.5 mm i.d. glass tube filled with ∼180 mg Tenax TA). Sampling tubes and transfer lines from the CVS were kept at a constant temperature (27±2 ∘C). The flow rate for the quartz filter was 10.0 L min−1, and the flow rate for the Tenax tube was set as 0.5 L min−1. Dynamic blanks were also collected when the CVS was operated with only dilution air (no exhaust) to estimate the contribution of background organic vapors. Prior to sampling, the quartz filters were preheated to 550 ∘C in air for 6 h in clean aluminum foil using a muffle furnace to remove contaminations. Tenax tubes were preconditioned by using a tube conditioner (BCT700, BCT Technology LTD) at 300 ∘C for 3 h in pure nitrogen with a constant flow rate of 100 mL min−1. All samples were sealed after sampling and stored in a freezer at −20 ∘C.
Quartz filters and Tenax tubes were analyzed using a gas chromatography–mass spectrometer (Agilent 6890GC/5975MS) equipped with a capillary column (Agilent HP-5MS, 30 m×0.25 mm) coupled to a thermal desorption system (Gerstel, Baltimore, Maryland, USA). The detailed method was described by Zhao et al. (2014). Prior to analysis, 5 µL of the internal standards (d10-acenaphthene, d12-chrysene, d4-1,4-dichlorobenzene, d8-naphthalene, d12-perylene, d10-phenanthrene and seven deuterated n-alkanes) were injected into each adsorbent tube to track the IVOC recovery.
For each test, particulate matter samples were also collected using independent Teflon and quartz filters. The Teflon filters were weighted using a microbalance (Toledo AX105DR, USA) after equilibration for 24 h in an environmentally controlled room (temperature of 20±1 ∘C and relative humidity of 40±3 %) (Guo et al., 2010). A punch (1.45 cm2) from each quartz filter was analyzed for organic carbon (OC) and elemental carbon (EC) via a thermal–optical method using a Sunset Laboratory-based instrument (National Institute for Occupational Safety and Health, NIOSH, protocol thermal optical transmittance, TOT) (Guo et al., 2013). VOCs were sampled in SUMMA® polished stainless-steel canisters and analyzed using GC-MS (gas chromatography–mass spectrometry) with a flame ionization detector. Total hydrocarbon (THC), nitrogen oxide, CO and CO2 emissions under operation scenarios were measured using a HORIBA OBS 2200 portable emission system.
2.3 Quantification of IVOCs
A total of 20 IVOC compounds were quantified using authentic standards (Table S1). However, the majority of the IVOC mass appears as a broad hump of co-eluting hydrocarbons and oxygenated organics. These compounds could not be resolved at the molecular level and were therefore classified as an unresolved complex mixture (UCM) and grouped based on their volatilities.
The total mass of IVOCs was determined following the method of Zhao et al. (2014) (Supplement). In short, the TIC (total ion current) of each sample was divided in to 11 retention time bins corresponding to C12-C22 n-alkanes. The total mass in each bin was estimated using the instrument response to the n-alkane in that bin. UCM was determined as the difference between total IVOCs and speciated IVOCs in each bin. UCM was then further classified into unspeciated branched alkanes (b-alkanes) and unspeciated cyclic compounds following the approach of Zhao et al. (2016) (Supplement). The uncertainty of the IVOCs could be ascribed to both sampling and analysis. The sampling uncertainty was assumed as 10 % (Huang et al., 2019). The uncertainty of using n-alkanes as surrogate standards for the total IVOC mass was estimated to be less than 6.0 % for alkanes and 30.6 % for polycyclic aromatic hydrocarbons (PAHs) based on the analysis of a suite of standard compounds (Supplement). Therefore, combined with the above uncertainty, we consider a maximum IVOCs mass uncertainty of 32.2 % (Supplement).
Fuel-based IVOC emission factors (EFs, mg per kilogram fuel) were calculated using the carbon mass balance method as follows:
where [ΔIVOC] represents the background-corrected mass concentration of IVOCs, [ΔCO2] is the background-corrected CO2 concentration in the CVS expressed in units of carbon mass and fc is the measured mass fraction of carbon in the gasoline (0.82).
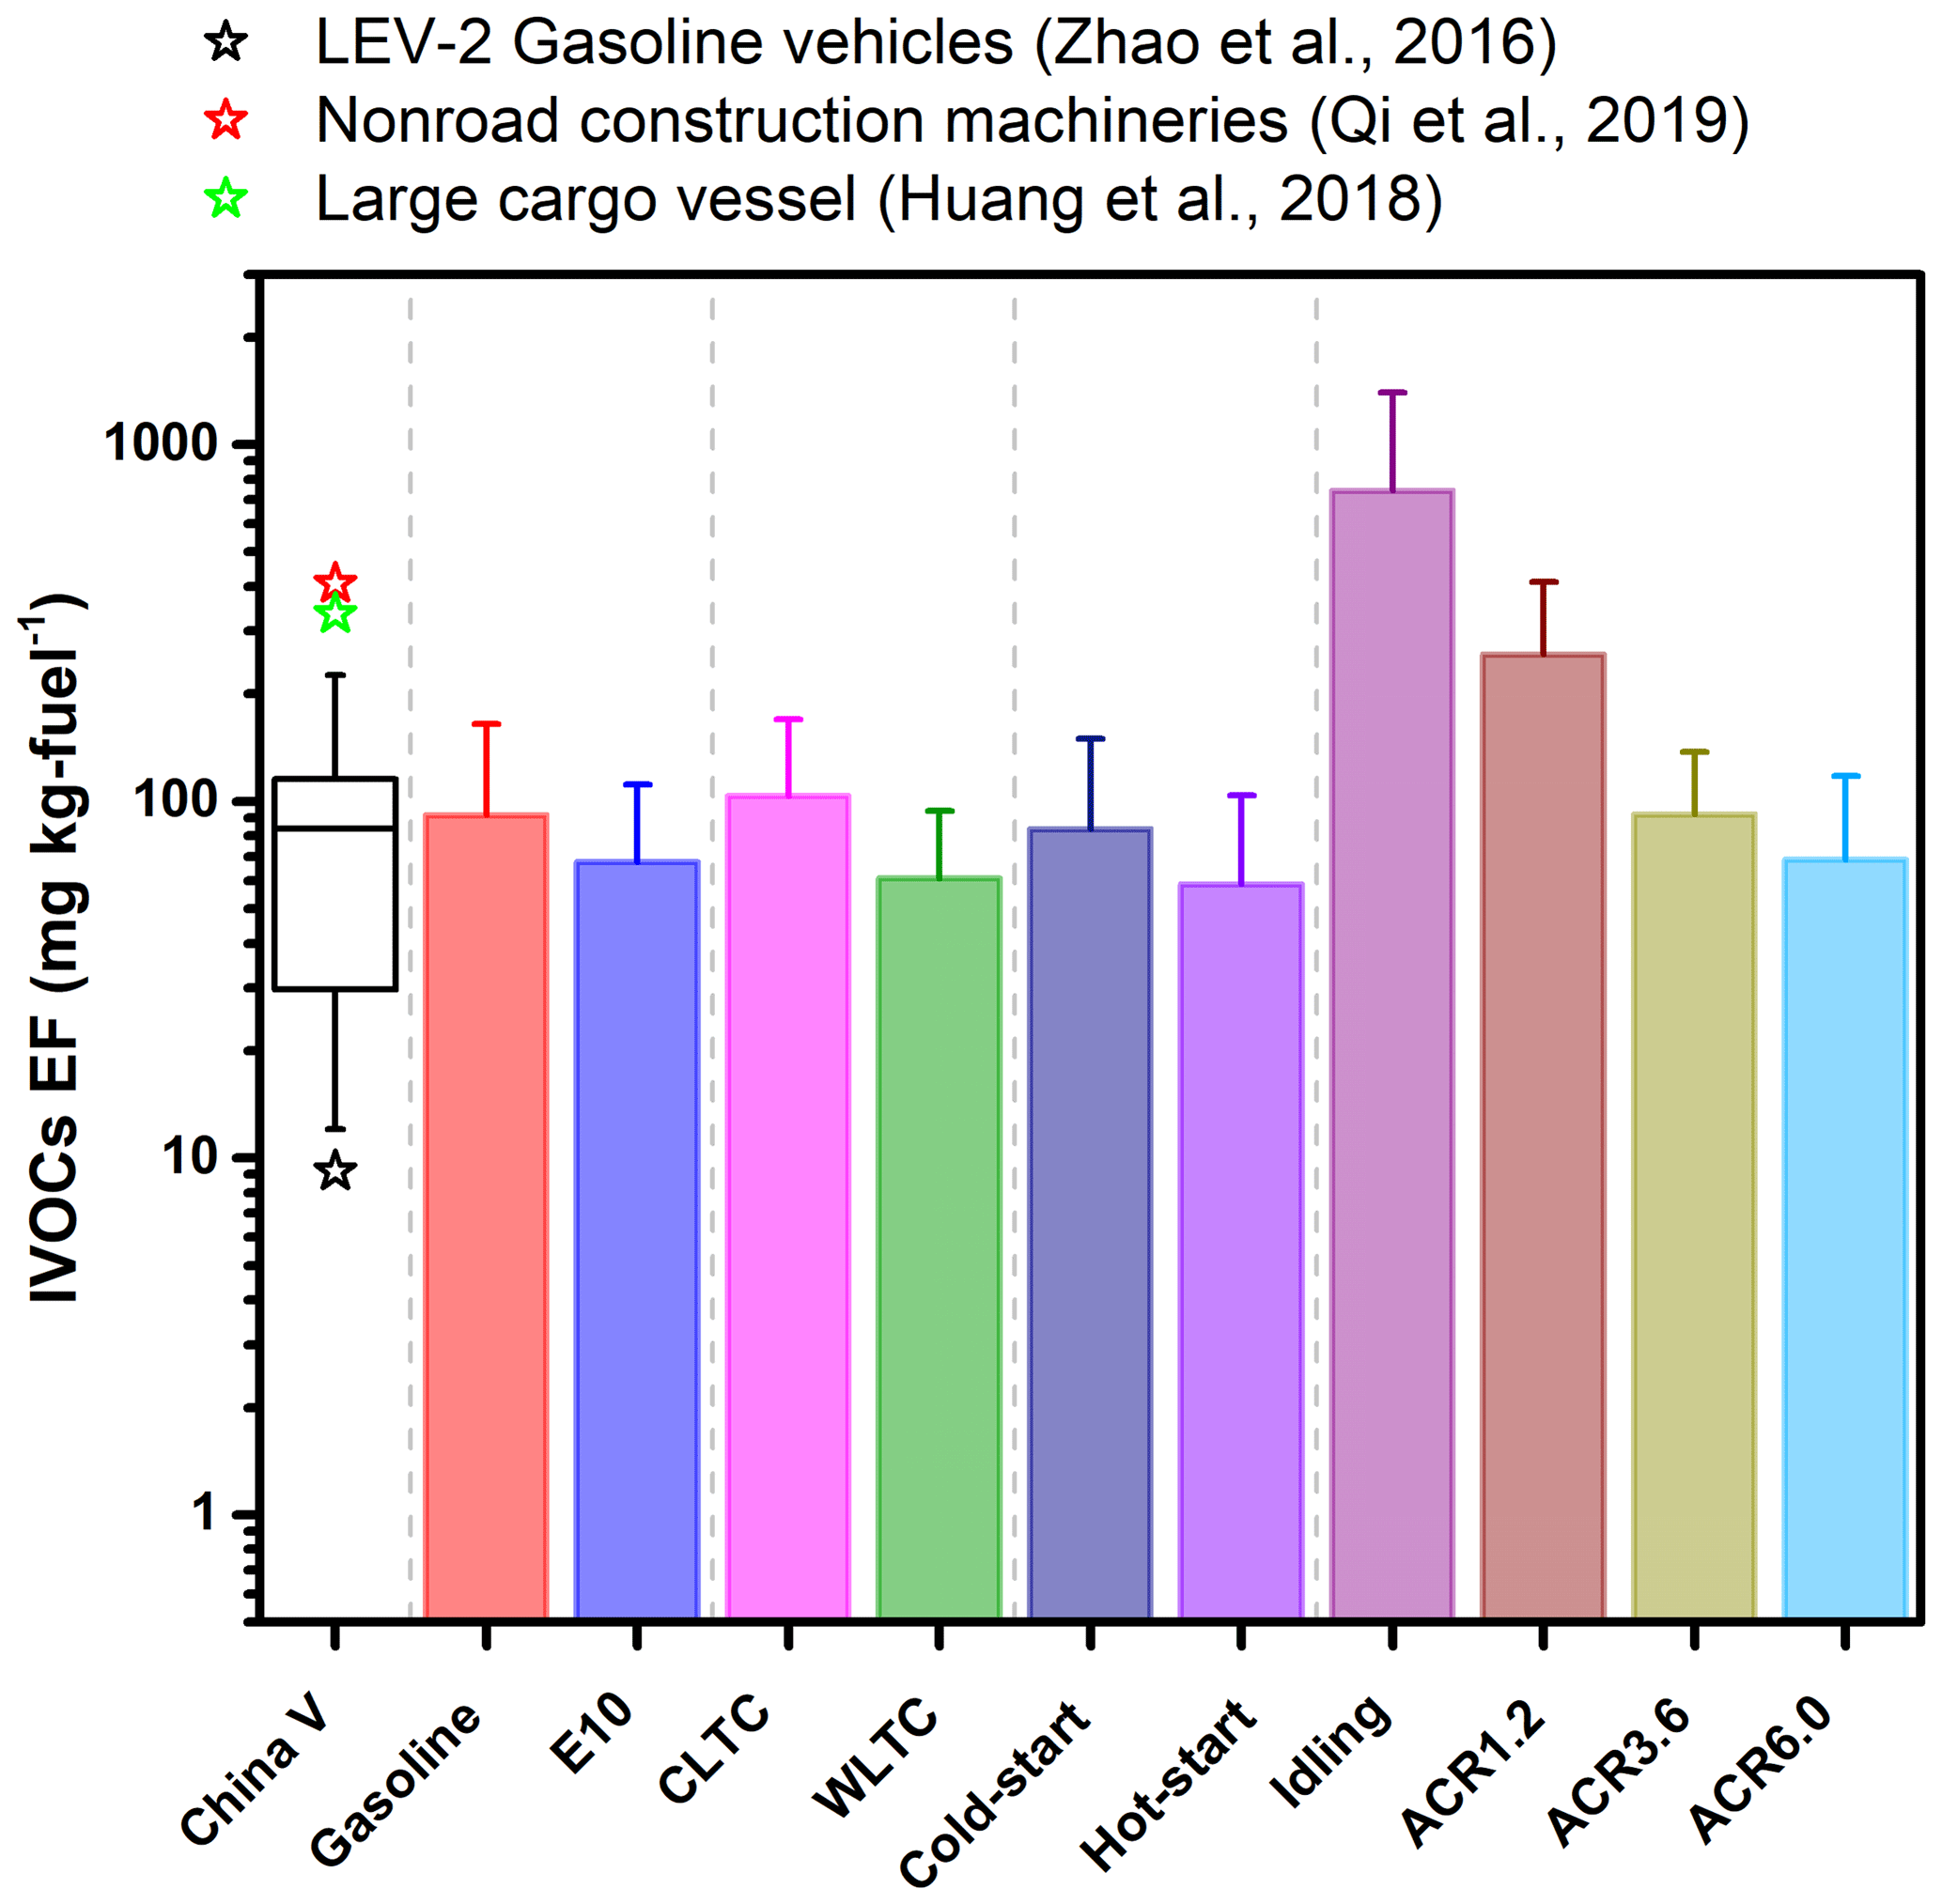
Figure 1IVOC emission factors measured under different conditions, i.e., different fuel type (gasoline and E10), test cycles (China Light-Duty Vehicle Test Cycle, CLTC, and Worldwide Harmonized Light Vehicles Test Cycle, WLTC), starting mode (hot-start and cold-start operation) and acceleration rates (acceleration rates of 1.2, 3.6 and 6.0 ). Stars indicate the EF data are from the US, i.e., median US LEV-2 gasoline vehicles (vehicles manufactured in 2004–2012), nonroad construction machinery and a large cargo vessel (Qi et al., 2019; Huang et al., 2018; Zhao et al., 2016). The first category “China V” is the compilation of all the EF results from all of the CLTC and WLTC tests. The boxes indicate the median value, with error bars representing 1 standard deviation.
3.1 Influence of fuel, starting mode and operating cycles on IVOC emission factors
Figure 1 depicts IVOC EFs of the tested China V gasoline vehicle and compares them with previous studies. The IVOC EFs ranged from 12.1 to 226.3 mg per kilogram fuel, with a median value of 83.7 mg per kilogram fuel. The median IVOC value was ∼3 times higher than that of the US LEV-2 (low-emission vehicle) gasoline vehicles (21.9 mg per kilogram fuel) and 1 order of magnitude lower than diesel-fueled nonroad construction machinery and a diesel-fueled large cargo vessel (971.1 and 800 mg per kilogram fuel, respectively) (Qi et al., 2019; Huang et al., 2018).
Figure 1 summarizes the influences of fuel type, starting mode, operating cycles and acceleration rates on the total IVOC EFs. Various operating conditions may cause different IVOC emissions and fuel consumption. In order to get a relatively reliable comparison, what we show here is all described in IVOC EFs which consider both IVOC mass and the fuel consumption. Among all of the factors, acceleration rate has the largest influence on the IVOC EFs. The fuel consumption at a high acceleration rate (6.0 ) would be higher than that at a low acceleration rate (idling). Although not emitted in IVOCs, the high consumption of the fuel would exist as other types of carbon, e.g., VOCs and CO2 which may also have great effects on the atmosphere. Therefore, the usage of IVOC EFs can moderately balance the effects of the IVOC emissions and fuel consumption and get a comprehensive comparison among different acceleration rates. As the acceleration rate increases, the IVOC EF decreases, with the median IVOC EF of ACR6.0 being 1 order of magnitude lower than that at idling. Qi et al. (2019) and Zhao et al. (2016) report similar results for nonroad construction machinery and on-road diesel vehicles, where idling conditions emitted significantly higher IVOCs than those under higher-speed cycles. They proposed that the higher IVOC EFs at idling were the result of less efficient fuel combustion. An additional factor in these tests may be the efficiency of the catalytic converter varying with operating conditions (i.e., lower efficiency at idle operations).
When using commercial China standard V gasoline, the median IVOC EF was 1.4 times greater than that using Ethanol gasoline, i.e., E10 (10 % ethanol, ), with median values of 91.5 and 67.6 mg per kilogram fuel, respectively. The median THC EFs for gasoline and E10 were 485 and 589 mg per kilogram fuel, respectively, showing no significant difference.
As expected, the IVOC EFs for cold-start tests were higher (83.7 mg per kilogram fuel) than those for hot-start tests (58.7 mg per kilogram fuel). This reflects the reduced efficiency of the catalytic converter during cold-start operation. The cold-start-to-hot-start IVOC emission ratio is about 1.4, which is similar to the previous study (Zhao et al., 2016). The median THC EFs for cold-start and hot-start tests are 556.2 and 507.8 mg per kilogram fuel, respectively. Previous studies also show that cold-start operation has higher THC EFs than hot-start operation, but cold-to-hot ratios can span a wide range due to differences in operating conditions and model years (Jaworski et al., 2018; Drozd et al., 2016). The ratio is generally larger for more modern, heavily controlled vehicles (Saliba et al., 2017; May et al., 2014).
The median IVOC EF for CLTC was about 1.7 times of that for WLTC (103.5 versus 60.9 mg per kilogram fuel). Similar results were also found for THC emission, with median THC EFs for CLTC and WLTC of 617.3 and 420.3 mg per kilogram fuel, respectively. Previous studies also show test cycles influence THC EFs. For example, Suarez-Bertoa et al. (2015) and Marotta et al. (2015) found that the New European Driving Cycle (NEDC) has higher THC EFs than WLTP (Worldwide Harmonized Light Duty Test Procedure) or WLTC. One possible explanation for the differences between the CLTC and WLTC IVOC EFs is the differences in acceleration rates. A histogram of acceleration rates of the two cycles (Fig. S3) shows that CLTC has a frequent low-acceleration process compared to WLTC; 76.9 % of CLTC has acceleration rates ranging from −1.5 to 1.5 versus 69.6 % for WLTC. CLTC has no acceleration rate higher than 4 , suggesting that the gasoline vehicles frequently drive in congested conditions in China.
The results from the acceleration rate cycles suggest that the frequent low acceleration rate in CLTC is responsible for the differences of the IVOC EF between CLTC and WLTC. The effect of acceleration on IVOC EFs is probably especially important in urban areas in China, which frequently have substantial traffic congestion. These results underscore the importance of developing cycles that simulate real-world Chinese driving conditions, e.g., CLTC, instead of using WLTC or other cycles to get relevant emission data.
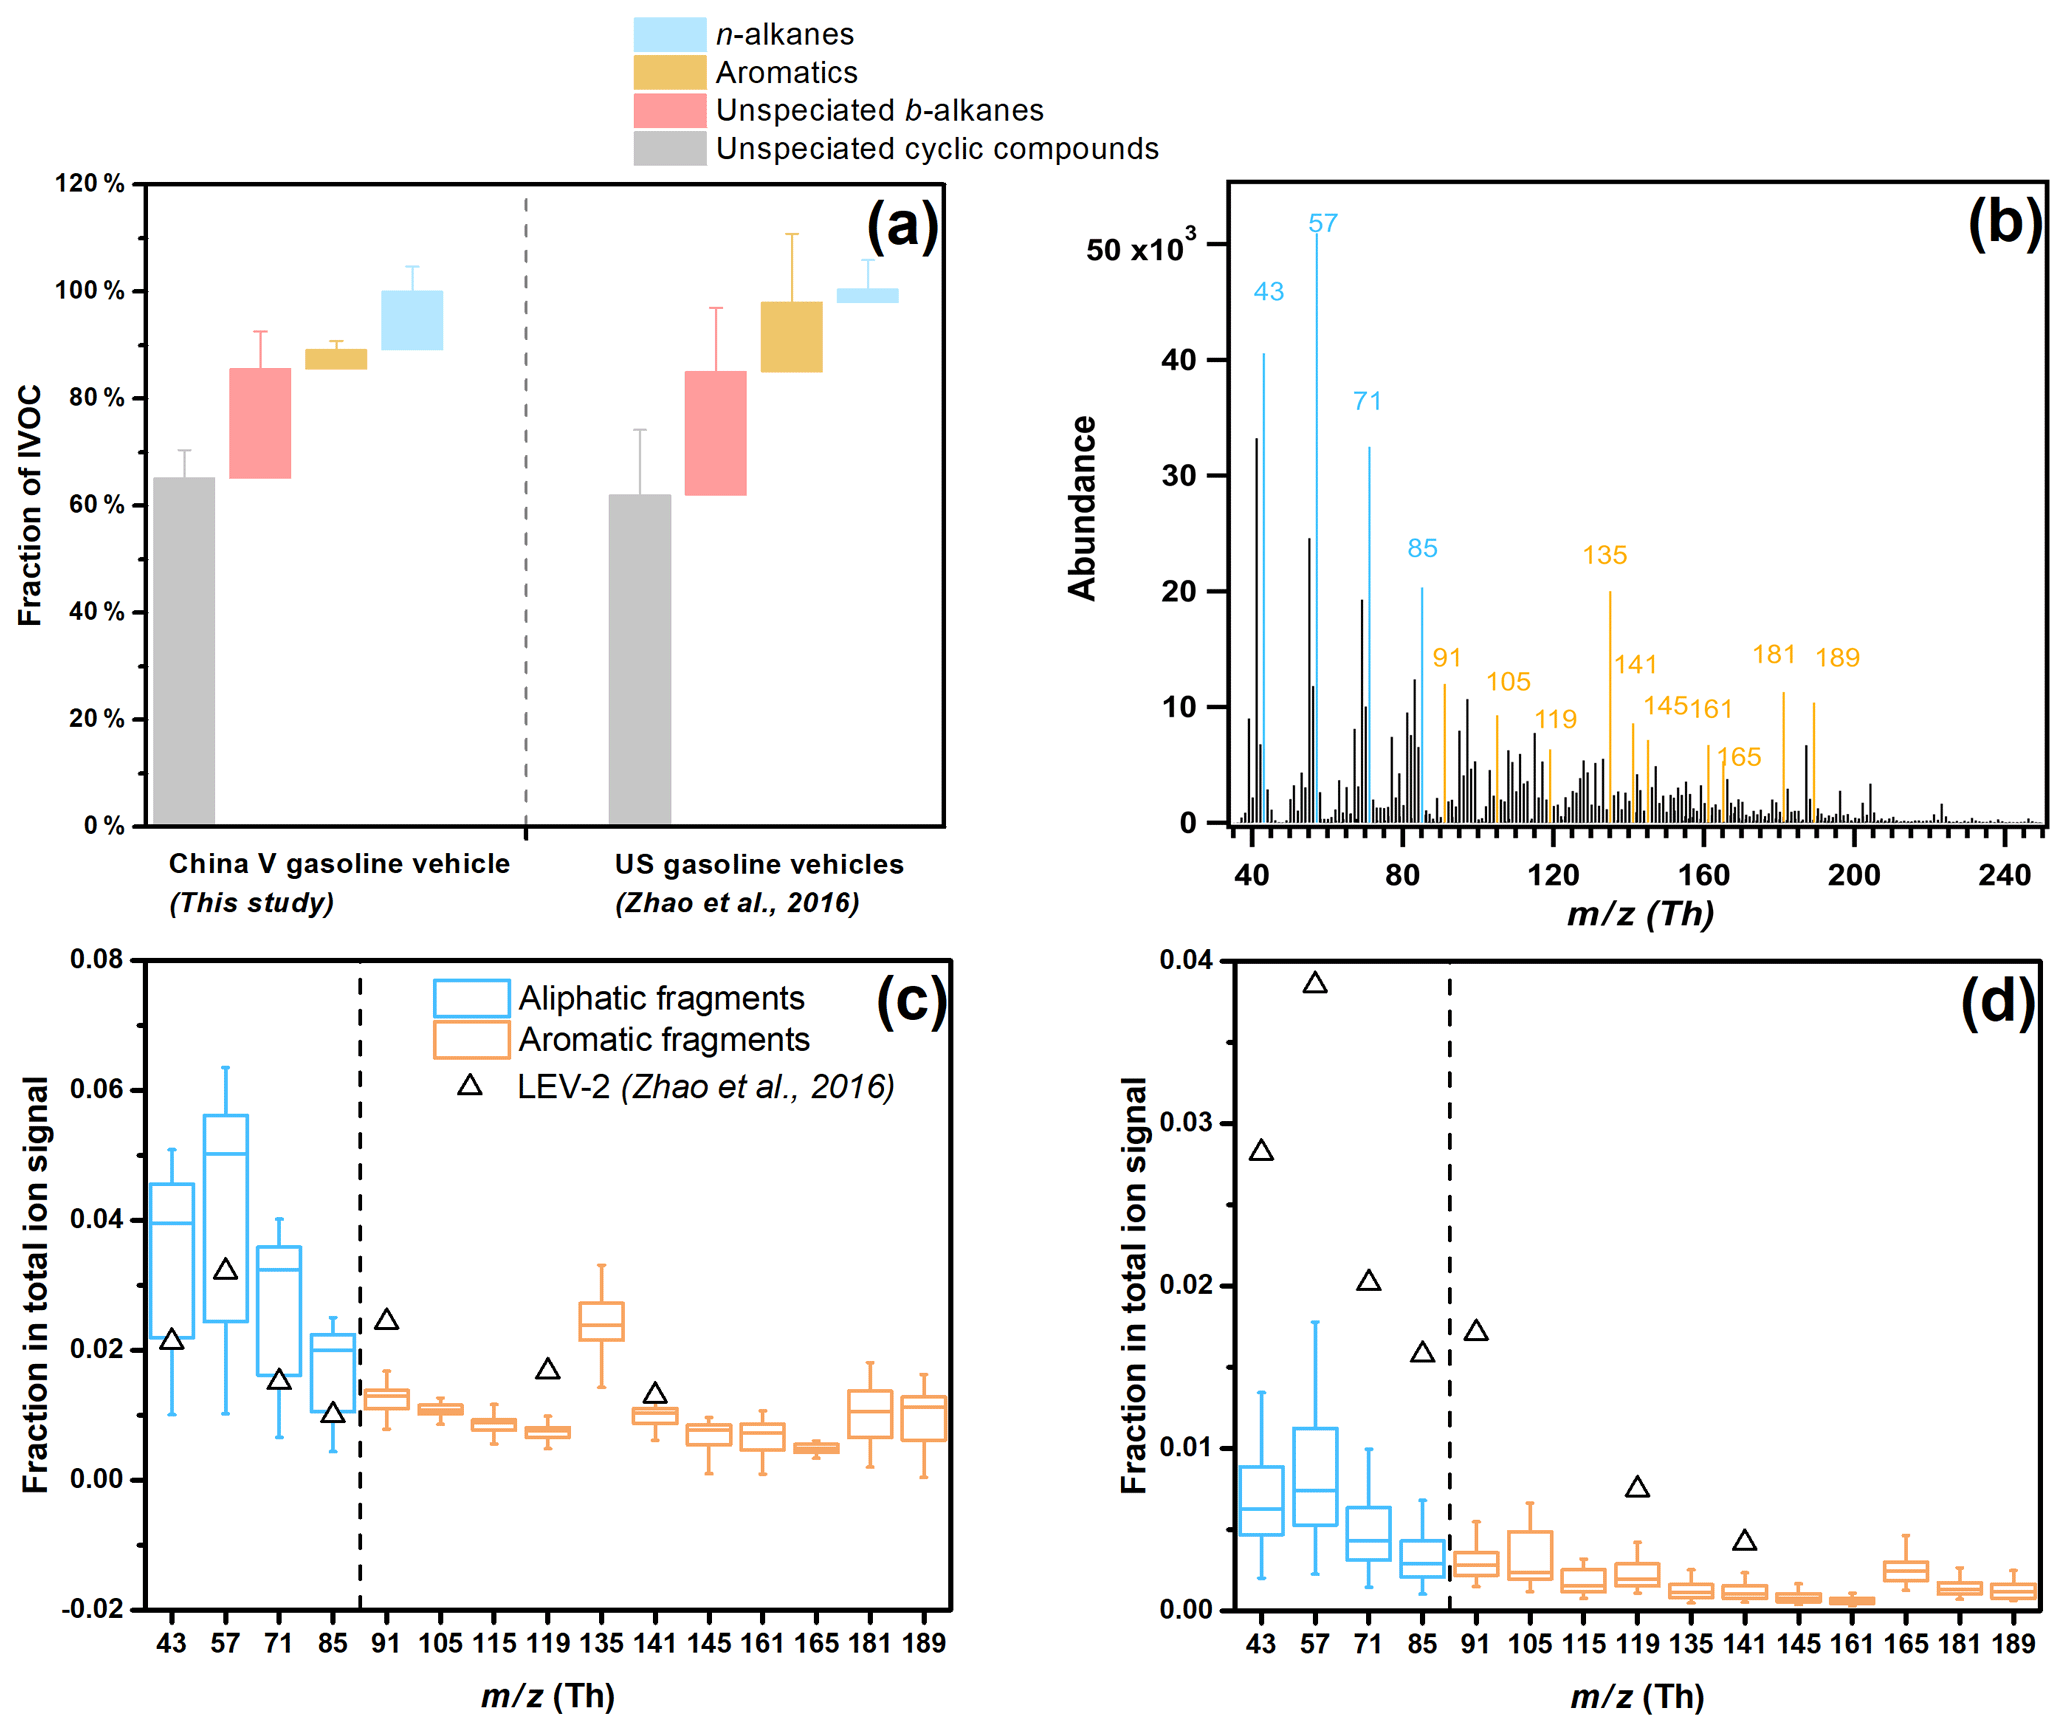
Figure 2(a) Comparison of average chemical speciation of IVOC emissions from China V vehicles and US vehicles (Zhao et al., 2016). (b) Average mass spectrum of IVOCs during a typical E10-fueled cold-start CLTC test. (c–d) Box-whisker plots of the fractional contribution of selected fragments to the total IVOC signal for the tested China V vehicle: (c) B12–B16 bins and (d) B17–B22 bins. The boxes represent the 25th and 75th percentiles with the centerline being the median. The whiskers are the 10th and 90th percentiles. Black hollow triangles represent median LEV-2 data from Zhao et al. (2016). LEV-2 represents vehicles manufactured from 2004 to 2012. Fragments colored in blue represent aliphatic compounds, while those colored in orange are associated with aromatic compounds.
3.2 Chemical speciation of Chinese vehicle IVOCs and the relationships between total IVOCs, POA and THC
Figures 2 and S4 compare the chemical composition of IVOC emissions from the tested China V vehicle under different operating conditions. In general, IVOC chemical composition was similar across all the tests. Unspeciated IVOCs (UCM) dominate the total IVOCs mass (85.6±4.9 %), including 65.2±5.2 % for unspeciated cyclic compounds and 20.4±0.7 % for unspeciated b-alkanes. n-Alkanes and speciated aromatics contribute 10.9±4.7 % and 3.5±1.7 % of the total IVOC mass, respectively. These results are similar to previous studies. For example, Zhao et al. (2016) found the consistent composition of IVOC emissions across a wide set of vehicles.
Since the majority of the IVOC mass appears as UCM, the average mass spectra provide additional insight into its composition. A similar distribution of mass fragments was observed across all tests. Figure 2b shows the average IVOC mass spectrum collected during an E10 CLTC test. Mass fragments associated with aliphatic hydrocarbons ( 43, 57, 71 and 85) are the most abundant followed by those associated with aromatics ( 91, 105 and 119 for alkylbenzenes (Pretsch et al., 2013) and 115, 165 and 189 for polyaromatic species) (Dall'Osto et al., 2009; Spencer et al., 2006).
Figure 2c and d exhibit the contribution of selected mass fragments in low- and high-volatility ranges, i.e., B12–B16 and B17–B22. Aliphatic fragments are higher than aromatic fragments in both B12–B16 and B17–B22 bins. Compared to the higher-volatility (B12–B16) bins, the ratio of selected aromatic to aliphatic fragments is lower in the lower-volatility (B17–B22) bins (0.8 versus 1.7), which suggests a different weighting of compounds in a different volatility range. Therefore, unspeciated IVOC UCM in B12–B16 is predominantly aromatic, while B17–B22 are more abundant in cyclic alkanes.

Figure 3Comparison of IVOC volatility distributions of Chinese gasoline vehicle exhaust, US gasoline vehicle exhaust and Chinese E10 fuel. The boxplot represents the Chinese gasoline vehicle exhaust. The boxes represent the 25th and 75th percentiles with the centerline being the median. The whiskers are the 10th and 90th percentiles. Red solid circles represent IVOC fractions of US vehicle exhaust (Zhao et al., 2016). Blue hollow triangles represent the IVOC volatility distribution of Chinese E10 fuel. All the studies performed in the US used commercial US gasoline as fuel, which contained 10 % ethanol, i.e., E10 fuel. Therefore, we compare the Chinese E10 with US fuel to get a consistent comparison. Also, we should note that Zhao et al. (2016) and Lu et al. (2018) found that for a consistent distribution of US fuel and exhaust, as in this figure, the US gasoline vehicle exhaust can represent the volatility distribution of its unburned fuel distribution as well.
Figures 3 and S5 show the volatility distribution of IVOC emissions over the 11 retention time bins (B12–B22). IVOC emissions are more heavily weighted towards the more volatile end of the distribution, with more than 50 % of the emissions in B12–B14 bins. After B14, the IVOC emission decreases significantly.
Although the IVOC EFs varied by an order of magnitude across the set of tests (Fig. 1), the volatility distributions of the emissions were largely the same. When the vehicle is fueled by gasoline, the median IVOC fractions in the B12–B14 bins are slightly higher than when fueled by E10 (Fig. S5a). Cold-start operation has a higher median percentage of IVOC in B12–B14 bins compared to hot-start operation (Fig. S5b). There are no distinct differences in volatility differences between CLTC and WLTC (Fig. S5c). Compared with idling conditions, acceleration cycles have a higher median percentage of IVOC in lower-volatility bins (B17–B22) (Fig. S5d), similar to previous studies (Qi et al., 2019; Cross et al., 2015). The modest variations of volatility distributions of the IVOC emissions may be due to differences in combustion efficiency and/or catalytic converter efficiency as a function of volatility.
Considering the similarity of volatility distribution for different conditions and the importance of the volatility distribution in model input for SOA simulation, Fig. S6 and Table S3 present the volatility distribution of SVOC and IVOC emissions from the tested China V gasoline vehicle, using effective saturation concentration (C*) as a classification: IVOCs (–3×10⁶ µg m−3) and SVOCs (–300 µg m−3). IVOCs are the dominant part of the low-volatility organics (IVOCs + SVOCs), with a median contribution of ∼95 %.
Previous studies have used different scaling approaches to estimate IVOC emissions using other primary emission data, e.g., POA (primary organic aerosol) and NMHC (non-methane hydrocarbon) (Murphy et al., 2017; Woody et al., 2016; Koo et al., 2014). However, these ratios depend on fuel, engine technology and operating conditions (Lu et al., 2018). Therefore, it is important to quantify the relationships between IVOCs and other pollutants using data collected from Chinese vehicles. Our results show that the IVOC-to-THC ratio does depend on fuel composition. The average IVOC-to-THC ratios for the gasoline-fueled and E10-fueled gasoline vehicle are 0.07±0.01 (R2=0.87) and 0.11±0.02 (R2=0.78), respectively (Fig. S7). The IVOC-to-THC ratios in this study are higher than US vehicles (IVOC-to-NMHC ratio of 0.04) (Zhao et al., 2016) but much lower than diesel-fueled vehicles (IVOC-to-THC ratio of 0.67) (Huang et al., 2018). The IVOC-to-POA ratio was 5.12±1.30 across all tests but with only a modest correlation (R2 of 0.66 for gasoline-fueled vehicle and 0.43 for E10-fueled vehicle). This ratio is similar to US data for gasoline vehicles. The correlation of IVOC to THC or POA in our dataset is lower than that of the on-road gasoline and diesel vehicles measured in the US. This may be because the US data are from a large fleet of vehicles, while our data are from a single vehicle operated over a range of conditions.
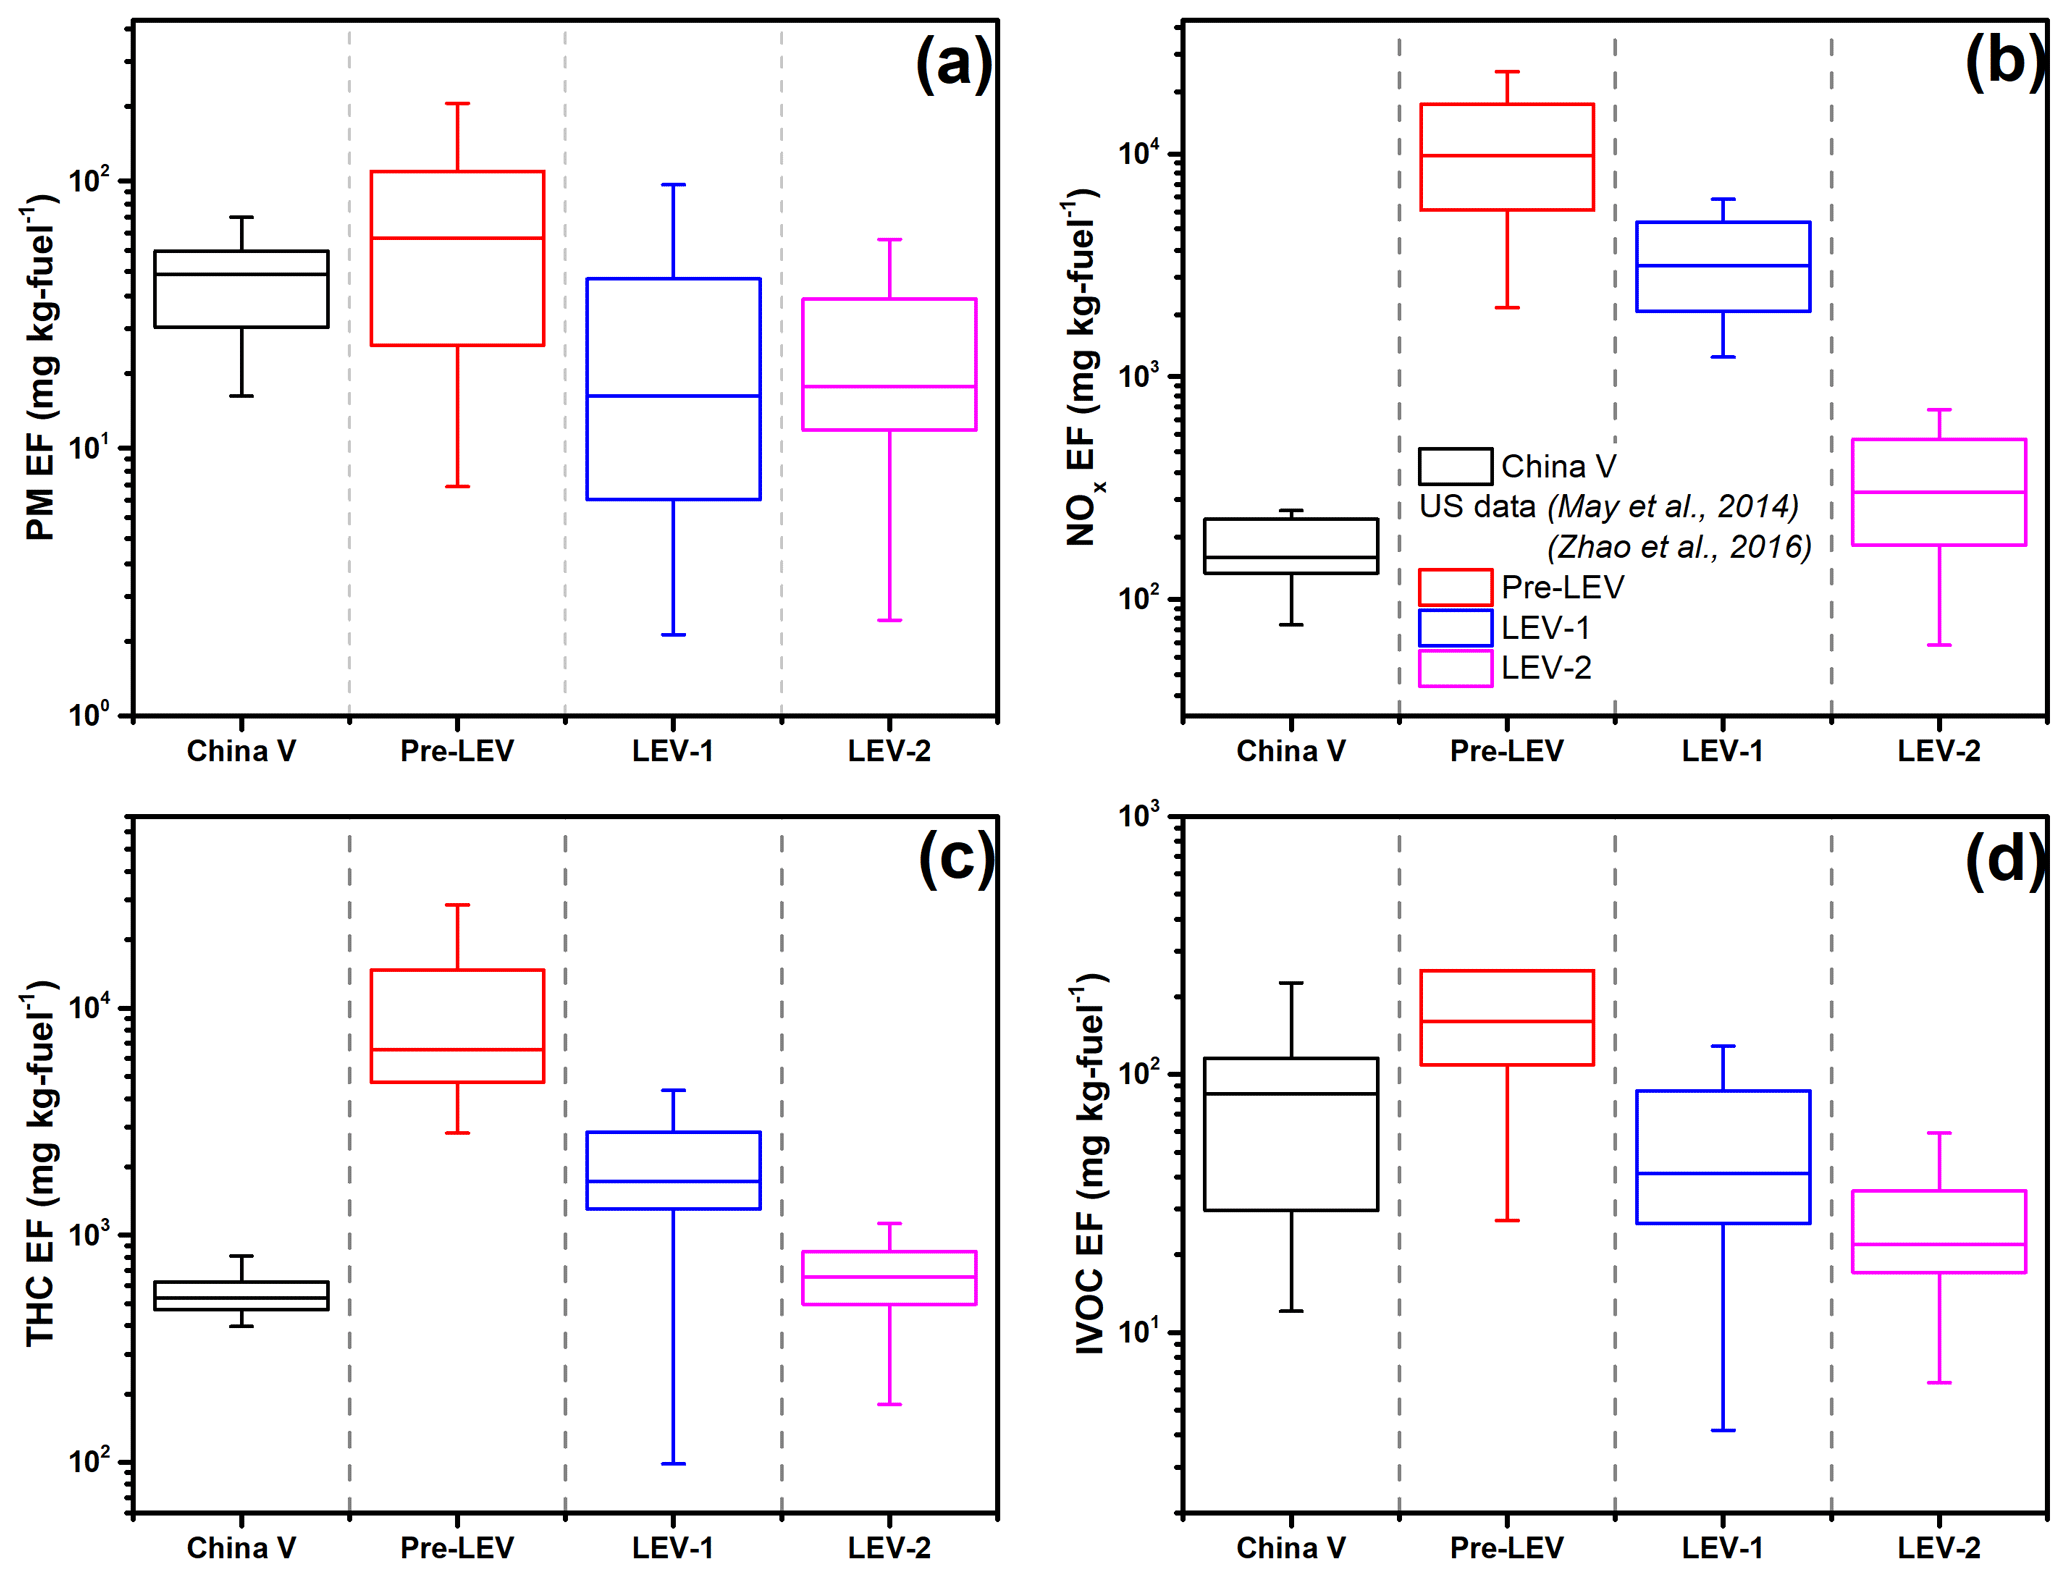
Figure 4Comparison of emission factors of (a) PM (particulate matter), (b) NOx, (c) THC and (d) IVOC between Chinese and US on-road gasoline vehicles (Zhao et al., 2016; May et al., 2014). The boxes present the 75th and 25th percentiles with the centerline being the median. The US vehicles are grouped by the model year; i.e., pre-LEV refers to vehicles manufactured prior to 1994; LEV-1 represents vehicles from 1994 to 2003; and LEV-2 is vehicles manufactured from 2004 to 2012.
3.3 High emission factors and distinct volatility distributions of IVOCs from Chinese gasoline vehicles
Figure 4 presents PM, NOx, THC and IVOC EFs of the tested gasoline vehicle (China V) and compares them to US vehicles tested by Zhao et al. (2016) and May et al. (2014). For this comparison, we combined all of the CLTC and WLTC data together. The US vehicles are grouped by model year, where pre-LEV refers to vehicles manufactured prior to 1994, LEV-1 represents vehicles manufactured between 1994 and 2003, and LEV-2 indicates vehicles manufactured between 2004 and 2012.
The emissions of NOx and THC from the tested vehicle are comparable with those from the newer (LEV-2) US vehicles tested by Zhao et al. (2016) and May et al. (2014). However, the PM EF (44.8 mg per kilogram fuel) of the tested vehicle is higher than the LEV-2 vehicles tested (17.0 mg per kilogram fuel). It is comparable to a pre-LEV vehicle (61.0 mg per kilogram fuel). In addition, we compared our results with those from European vehicles and found that the NOx and THC EFs for the tested vehicle were lower than a Euro 5 gasoline vehicle, while the PM EF was higher (Fontaras et al., 2014). This suggests that compared with US and European vehicles, the stringent emission standards implemented by the Chinese government have been effective at controlling NOx and THC but might be inefficient for PM emissions. For the past 30 years, the Chinese government has adopted a series of emission control policies and measures for light-duty vehicles, including implementation of emission standards for new vehicles for the promotion of sustainable transportation and alternative fuel vehicles and traffic management programs (Wu et al., 2017; Zhang et al., 2014). Wu et al. (2017) summarizes the implementation of the vehicle control policies in China, which shows that control for the vehicular pollutants is becoming stricter step by step. For example, the NOx emission standard changed from 0.15 to 0.035 g km−1 while the standard changed from China III to China VI. Different from NOx and THC, which have been controlled since China III, only in 2017, when the China V standard was first introduced did the control of PM come into the emission control scope. Yang et al. (2020) investigated the effects of the gasoline upgrade policy on migrating the PM pollution in China and found that there is not much space for significantly reducing the PM concentration by simply improving the gasoline quality. Therefore, for PM control, more policies, i.e., developing cleaner alternatives to fossil fuels, replacing traditional vehicles with new energy and building developed public transport system, should be implemented.
The IVOC EFs for the tested China V vehicle are between the US Pre-LEV and LEV-1 vehicle. Therefore, Chinese regulations may also appear to be ineffective at controlling IVOC emissions. The IVOC-to-THC ratio measured here (0.07 for gasoline and 0.11 for E10) is higher than US vehicles (0.04), which means that IVOCs contribute a larger fraction of the THC emissions from China V vehicles than from the US vehicles. A detailed comparison of the individual VOC emissions between China V and US LEV-2 vehicles is in the Supplement (Fig. S9).
UCM accounts for large fraction of IVOCs for both China V and US gasoline vehicles. However, the speciated compounds exhibit different characteristics. The China V exhaust has less speciated IVOC aromatic compounds (3.5 %) and more alkanes (10.9 %) compared to US exhaust (12.9 % and 2.5 %, respectively). This is also reflected by the IVOC mass spectrum, where Chinese vehicle exhaust has higher signals at 43, 57, 71 and 85. In addition, the specific aromatic mass fragments were not the same for China V and US IVOC emissions. For example, the dominant aromatic fragments in US gasoline exhaust are 128, 119, 105 and 133 versus 135, 91, 181 and 189 for China V (Fig. 2c and d).
Figure 3 compares the volatility distribution of the IVOC emissions from the China V and US vehicles. There are significant differences of volatility distribution between China V and US vehicles. Both distributions decrease with the increase of the retention time, but the IVOC volatility distribution of US vehicle exhaust exhibits heavier weight of the lower-volatility bin, i.e., B12 bin compared to the China V vehicle. In US exhaust the B12 fraction is more than double that of the B13 fraction. However, the contributions of B12–B14 bin volatility bins are comparable for Chinese vehicle exhaust. US vehicle exhaust has a similar IVOC volatility distribution as the unburned gasoline, indicating that the evaporate of IVOCs from fuel is non-neglectable.
The differences between the IVOC volatility distribution between the Chinese vehicle exhaust and unburned gasoline were further investigated. The higher emission factor and broader distribution of IVOCs in exhaust from China V compared with US vehicles may be due to differences in fuel composition, operating conditions, and engines and aftertreatment technology, as the tests of US vehicles were all performed using California commercial fuel, which is, in fact, E10 fuel. Therefore, in this study, the US (unburned) fuel or US gasoline means E10. Lu et al. (2018) demonstrated that IVOC emissions depend strongly on fuel composition. In our study, IVOCs contributed ∼2.0 wt % (2.1 wt % for gasoline and 1.9 wt % for E10) of the total fuel mass, which is ∼60 % higher than the California fuel (1.2 wt % for E10) (Gentner et al., 2012). Therefore, the higher IVOC fractions in China V exhaust (e.g., IVOC-to-THC ratio of 0.07 and 0.11 versus 0.04 in US exhaust) may lead to higher amounts of IVOCs in China V gasoline. When considering volatility distribution, Zhao et al. (2016) and Lu et al. (2018) reported similar distributions of IVOC between gasoline vehicle exhaust and unburned fuel, which demonstrates the significant influence of unburned fuel on exhaust volatility distribution. As a result, in Fig. 3, we use US gasoline vehicle exhaust to both represent the exhaust and the unburned (E10) fuel and compare the Chinese E10 fuel with US fuel to get a comparative study. However, the volatility distribution of the China V gasoline vehicle exhaust are different from that of the unburned fuel (Fig. 3). The difference might be related to the operating conditions and engine aftertreatment system.
Although operating conditions strongly influence the total IVOC EFs (Fig. 1), Fig. 3 indicates the volatility distribution of the IVOC emissions were largely consistent across the set of test conditions. Therefore, operating conditions cannot explain the difference in the IVOC volatility distribution between the China V vehicle, unburned gasoline and the US vehicles.
The engine aftertreatment system also influences IVOC emissions (Drozd et al., 2019; Alam et al., 2019; Zhao et al., 2018; Saliba et al., 2017). In order to investigate the efficiency of the aftertreatment system, we normalized the IVOC distributions of the fuel and exhaust to the sum of C8-C10 n-alkanes. It is believed that the C8-C10 n-alkanes can serve as the indicators for VOCs in fuel (Lu et al., 2018). For both US and the China V vehicles, IVOCs are enriched in the exhaust relative to the fuel. However, the enrichment factor is much smaller in Chinese exhaust with a median value of 4.0 than that for US vehicles (median value of 8.5) (Lu et al., 2018). The enrichment factor also varies with different compounds, with the enrichment factors following the order of n-alkanes (9.3) > b-alkanes (6.6) > unspeciated cyclic compounds (3.1) > aromatics (0.4). These results are consistent with previous studies stating that the aftertreatment devices have different removal efficiency towards different compounds (Ma et al., 2019; Hasan et al., 2018; Hasan et al., 2016; Alam and Harrison, 2016). Our results suggest that the Chinese three-way catalytic (TWC) converter has compound-dependent efficiency (better removal of aromatics compared to alkanes), which might explain the difference in compound composition between Chinese and US vehicle exhaust. Furthermore, Fig. S10 shows that the catalytic converter has different removal capacity towards different volatility bins, in which B14–B16 works much worse compared to other volatility bins, i.e., B12. Consequently, the SOA formation would be relatively high. In sum, the compound-dependent capacity and lower B14–B16 removal efficiency of the Chinese TWC converter is responsible for the volatility distribution differences between China V and US vehicles shown in Fig. 3.
After considering all the factors above, we can draw the conclusion that fuel type, starting mode and operating conditions can all affect the IVOC EFs. The only factor that impacts the volatility distribution is the engine aftertreatment system.
3.4 Estimation of SOA production from Chinese vehicle emissions
With the measured IVOC and VOC emissions, we estimated the SOA formation potential by using the yield method as follows (Yuan et al., 2013):
in which is the emission ratio of SOA precursor i (mg per kilogram fuel); kOH,i is the OH reaction rate constant of precursor i at 298 K (cm3 per molecule s−1); kCO is the OH reaction constant of CO at 298 K ( cm3 per molecule s−1); [OH] is the OH mixing ratio, which is assumed to be 1.5×10⁶ molecules cm−3 (Lu et al., 2019); Δt is photochemical age (h); and Yi is the SOA yield determined from chamber studies. Previous studies have shown that the SOA yield of individual hydrocarbons can be influenced by NOx level, due to the competition reactions among RO2 radicals, NO and HO2 radicals. Usually SOA yields under low-NOx conditions are independent on the OA loading. However, under high-NOx conditions, SOA yields highly depend on OA mass concentration, which can be described using two-product or multi-product models (Presto et al., 2010; Chan et al., 2009; Ng et al., 2007). In this study, we estimated SOA formation under low- and high-NOx conditions with OA concentrations of 10, 20 and 80 µg m−3 to represent the influence of NOx level and OA loading on SOA formation.
In this estimation, we include speciated C6-C9 single-ring aromatics (SRAs) as typical VOCs for SOA precursors, and the corresponding kOH and SOA yields are extrapolated according to two-product relationships from chamber studies (see Supplement) (Ng et al., 2007). The SOA yields under low- and high-NOx conditions and the OH reaction rates of speciated IVOCs and SRAs are from the previous studies (see Supplement) (Presto et al., 2010; Lim and Ziemann, 2009; Chan et al., 2009). In brief, surrogate species were used to represent the unspeciated b-alkanes and cyclic compounds in each of the volatility bins.
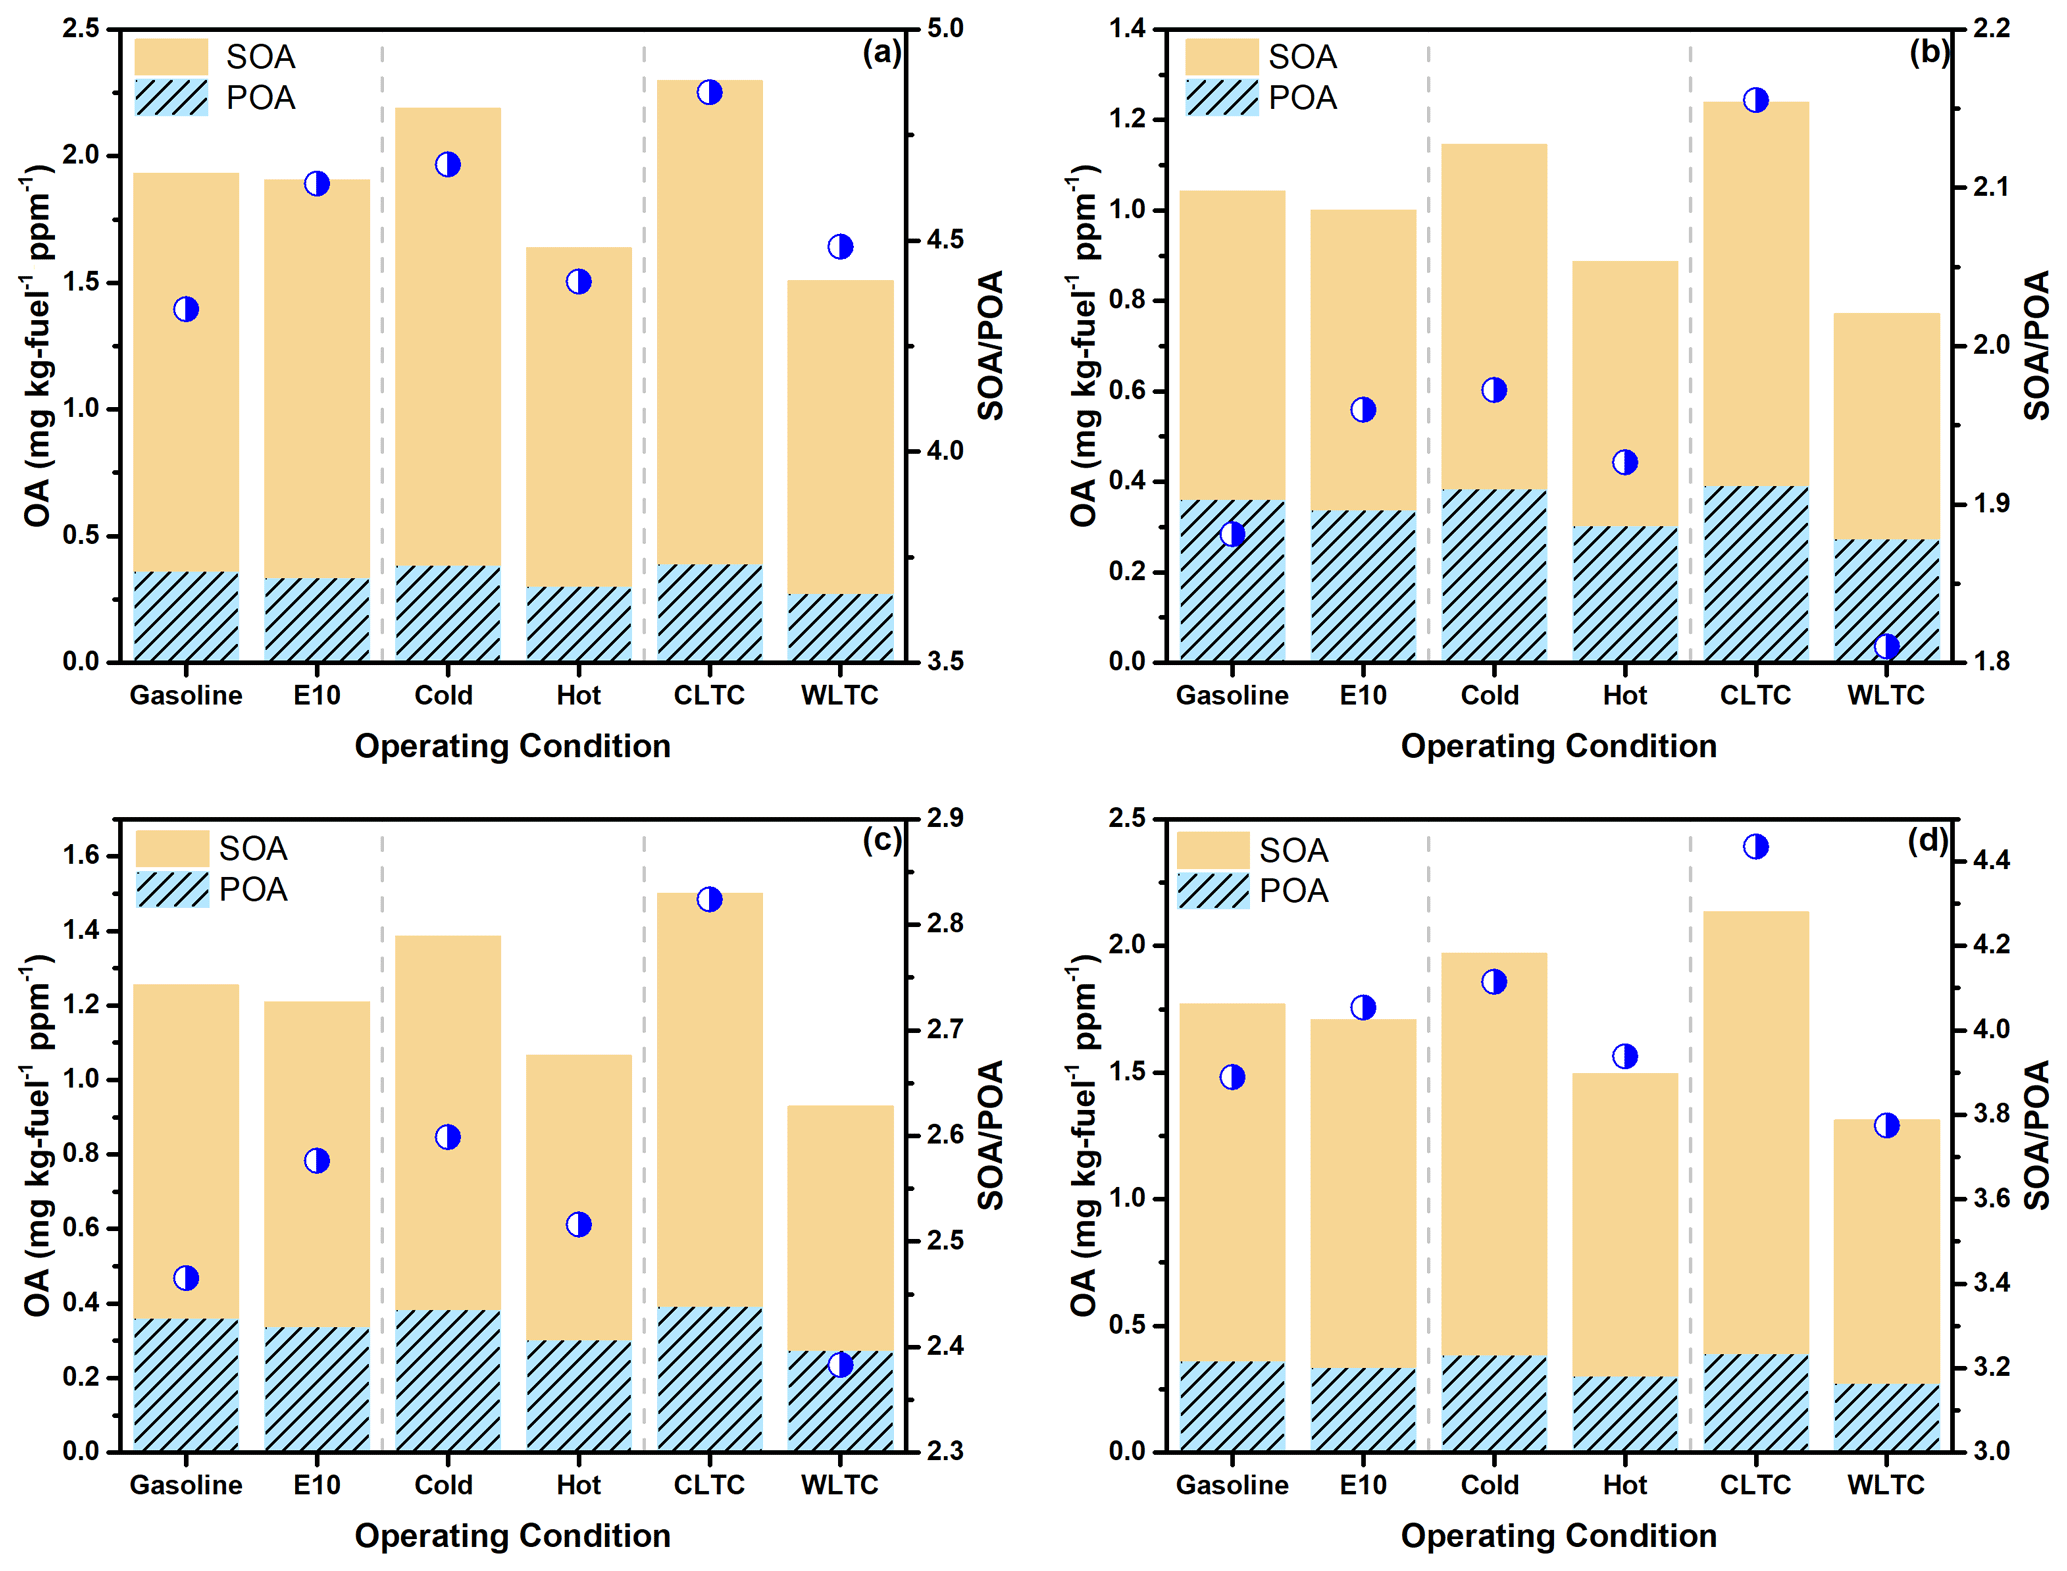
Figure 5Comparison of POA and estimated SOA production after 48 h of photo-oxidation (a) under low-NOx conditions, (b) at an OA loading of 10 µg m−3 under high-NOx conditions, (c) at an OA loading of 20 µg m−3 under high-NOx conditions and (d) at an OA loading of 80 µg m−3 under high-NOx conditions. The blue circles represent the SOA-to-POA ratio after 48 h of photo-oxidation (right axis).
Figure 5 shows the POA emission and estimated SOA production under different operating conditions and NOx level after 48 h of photo-oxidation. The estimated ratio is between 4.0 to 5.0 under low-NOx conditions, and the SOA-to-POA ratios ranged from 1.8–2.2 to 3.8–4.4 when the OA loading increased from 10 to 80 µg m−3 under high-NOx conditions. The OA enhancement under low-NOx conditions is similar to that under high-NOx conditions with the OA loading of 80 µg m−3. Considering the high POA concentration and SOA formation capacity of Chinese gasoline vehicles, the ratios at 80 µg m−3 are considered as a lower estimation. Compared with OA enhancement from US studies (∼3.6) (Zhao et al., 2016), our results showed higher SOA formation potential both under low- and high-NOx conditions for Chinese gasoline vehicles.
Scenario-based analysis shows a similar tendency of SOA formation potential at different OA loading under low- and high-NOx conditions. Though the POA emission for the gasoline-fueled vehicle was higher than that fueled by E10, comparable SOA formation is estimated using gasoline and E10 as fuel. That means that the OA enhancement factor for E10 is higher than that for gasoline. This suggests that although the ongoing policy of ethanol gasoline will not exacerbate the POA emission in China, the SOA formation of E10 could not be neglected due to its high SOA enhancement capacity. Therefore, more research should be done to evaluate the effectiveness of using E10 as a surrogate to reduce the air pollution in China.
Cold-start operation has higher SOA potential with a higher OA enhancement factor than hot-start operation, due to the higher precursors EFs caused by the reduced catalytic converter effectiveness below its light-off temperature (Drozd et al., 2019). The IVOC EFs, the estimated SOA production and ratio of CLTC are all higher than those of WLTC, which further demonstrates the higher SOA formation potential of Chinese gasoline vehicles under typical driving conditions in China.
Figure S11 presents the contribution of different classes of precursors on the SOA production after 48 h of photo-oxidation under different OA loading and NOx conditions. The relative contributions of different chemical classes were similar across the different conditions, with the largest contribution from unspeciated cyclic IVOCs. This is different from the US gasoline vehicle SOA (Zhao et al., 2016), in which single-ring aromatics contributes the most.
3.5 Establishing the estimation method of SOA formation from Chinese gasoline vehicles
In this section, we tried to establish parameterization methods to provide simple estimations of gasoline vehicle SOA based on our measurements of VOCs and IVOCs.
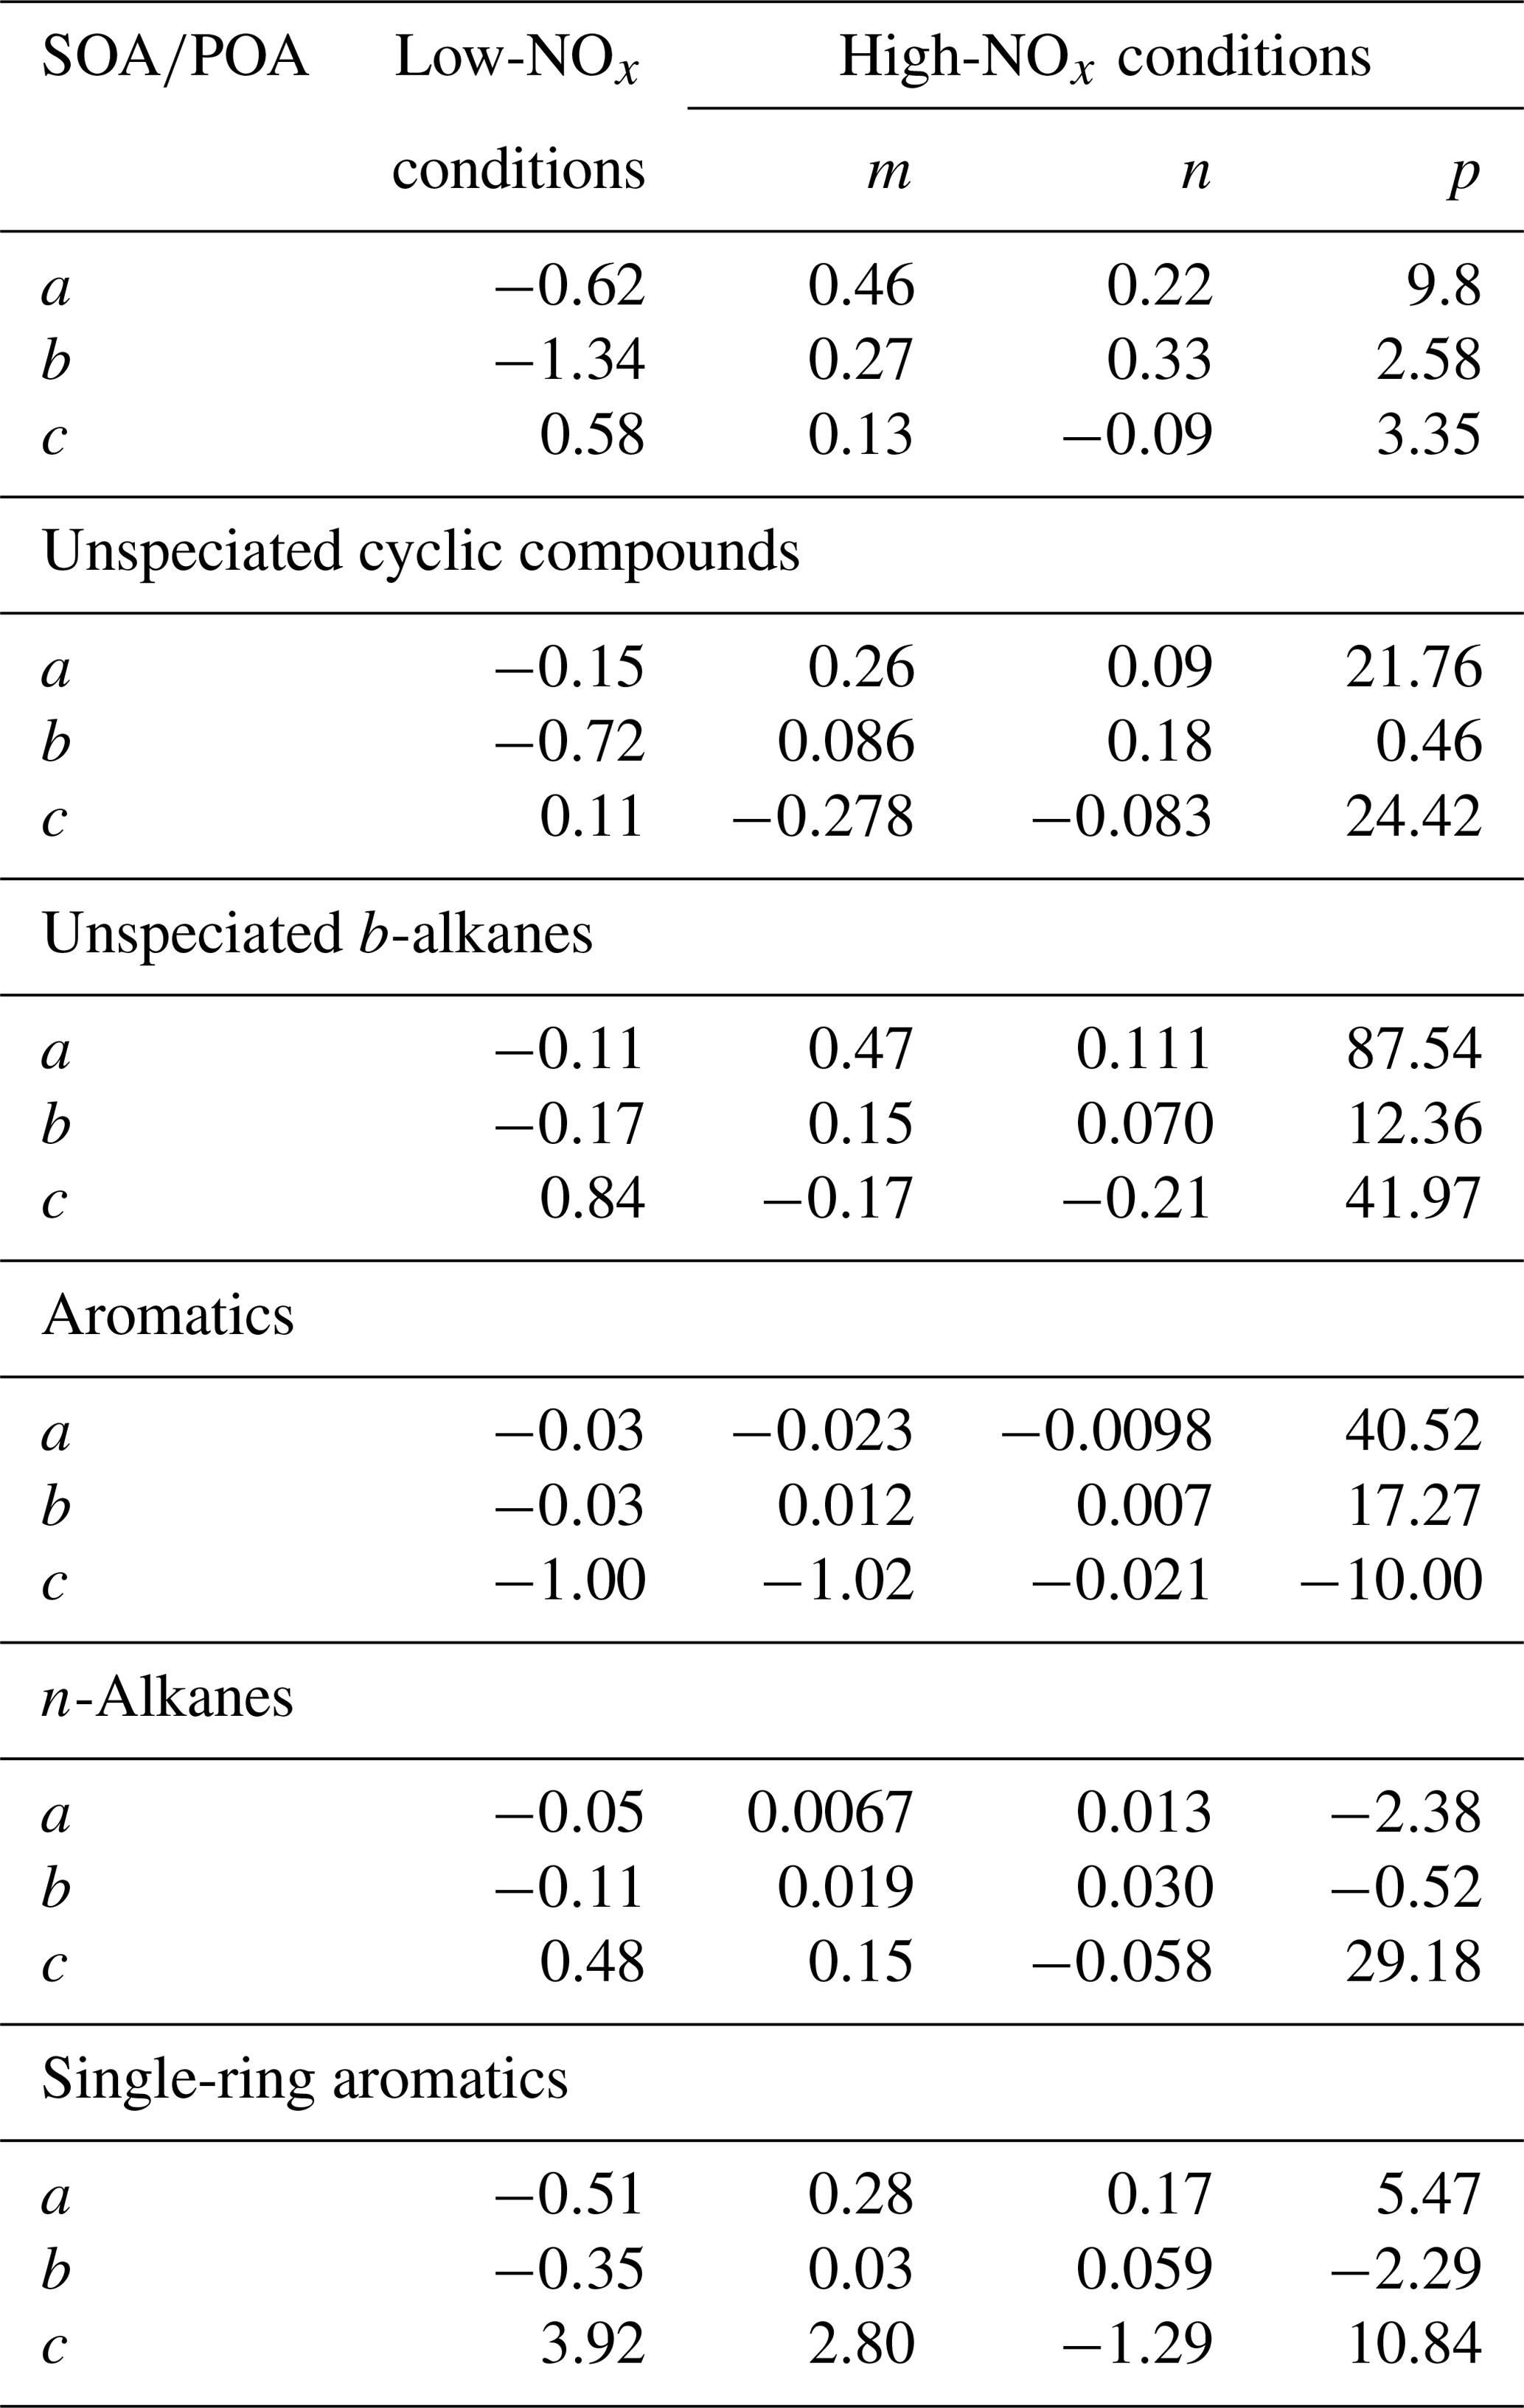
Figure S12 shows the average predicted SOA-to-POA ratio as the function of photo-oxidation time under different OA loading and NOx conditions. In general, SOA exceeds POA after first a few hours of oxidation and then levels off after 30 h. The ratio is influenced by OA concentration, NOx level and the photochemical age (OH exposure). At a certain OA loading and OH exposure, the ratio can be estimated and then used to quantify the contributions of gasoline vehicle SOA to the ambient OA. Therefore, we parameterized the variation under different OA and NOx conditions using a three-parameter-based logarithm equation: , in which t represents the equivalent photochemical age (assume that the OH concentration is 1.5×10⁶ molecules cm−3) and a, b and c can be described using a three-parameter logarithm equation, . Table 1 shows the parameterization results of compound-based variation under the different OA and NOx conditions. The fit quality could be found in Fig. S13.
Table 1Coefficient of parameterization between and photochemical age.
The above photochemical-based parameterization method provides a conservative way to quantify the evolution of SOA from Chinese gasoline vehicle VOC and IVOC oxidation. However, there are still some uncertainties which may lead to discrepancies between predicted and measured SOA. In general, the positive or negative artifacts of quartz filters, n-alkane equivalent method in estimating the IVOC concentration, uncertainty in SOA yield, surrogate method to substitute SOA yield and kOH for UCM, and lack of semi-volatile organic compounds will exert influence on the SOA prediction.
We measured the VOCs, IVOCs and POA emitted from a China V light-duty gasoline vehicle across a wide range of operating conditions. Compared with US LEV-2 gasoline vehicles, the China V vehicle emits 3 times more IVOCs. Besides, the IVOC emissions from the China V vehicle have a much broader volatility distribution than that from US vehicles. These characteristics imply that IVOCs could act as more important SOA precursors in China than those in the US. For Chinese gasoline vehicles, although the magnitude of the emission of IVOCs and VOCs can vary, their relative contribution to SOA production is similar across the set of operating conditions examined here due to the similar volatility distributions. As a result, the key to control SOA formation of gasoline vehicles is to reduce the total IVOC EFs by upgrading emission controls. In addition, reducing congestion and other low-speed operating modes would also be effective at reducing emissions (Figs. 1 and 5).
Based on our results, we roughly estimate the vehicle IVOC emissions in China. By the end of 2018, the total vehicle population in China reached 0.327 billion, with automobiles comprising 61 % (0.24 billion). Of all the automobiles, gasoline-fueled car were dominant (88.1 %). The HC (hydrocarbon) emission of gasoline vehicles in China was 0.23 Mt, accounting for more than 70 % of the total vehicle emissions. Using an IVOC-to-THC ratio of 0.09 that is obtained in our work, we estimate that the vehicle IVOC emissions in China are 0.03 Mt (30 Gg), of which 20 Gg is attributed to gasoline vehicles. One should note that this estimation is a conservative value, since we consider that all vehicles are gasoline vehicles and meet the China V standard. According to the statistics from the Ministry of Ecology and Environment, only 30.9 % of the vehicles in 2018 met the standards of China V. Indeed, a higher percentage of pre-China V, e.g., China I–IV, standard cars will cause more IVOC emissions. In addition, the IVOC-to-NMHC ratio of diesel vehicles could be much higher than that of the gasoline vehicles (Zhao et al., 2016, 2015). This may also lead to an underestimation.
Our results show that using a Chinese real-world test protocol, CLTC, will result in substantially higher IVOC emissions compared with WLTC, which might have close relationship with frequent idling and low-acceleration conditions. Therefore, when driving in typical Chinese conditions, where traffic congestion frequently occurs, the IVOC emissions from Chinese gasoline vehicles would be much higher than the current limited emission inventory. Our results indicate simply controlling the THC, NOx and primary PM emissions may be insufficient in the aspect of controlling particle pollution. Reducing IVOC emissions should also be taken into consideration due to their high contribution to SOA formation, which is more important than primary organic aerosol. Suggested controlling methods include upgrading the fuel quality and engine aftertreatment system and reducing the traffic congestion.
Though we have discussed the influences of different operating conditions on IVOC emissions and SOA formation for the tested China V gasoline vehicle, due to the singular vehicle tests of our study, more research, i.e., vehicles meeting different emission standards with different engines, should be performed both to verify the accuracy of our research and to get a full understanding of the IVOC emission inventory for Chinese gasoline vehicles. Furthermore, advanced measurement techniques, e.g., GC × GC-MS and chemical ionization mass spectrometry (CIMS), should be used to obtain a comprehensive molecular-level picture of the total organics so as to reduce the uncertainties associated with the measurements and models.
The data used in this publication are available on https://doi.org/10.5281/zenodo.4543210 (Tang et al., 2021), and they can be accessed by request to the corresponding author (songguo@pku.edu.cn) of Peking University.
The supplement related to this article is available online at: https://doi.org/10.5194/acp-21-2569-2021-supplement.
SG, RoT and HW designed the study. RoT and KS collected the samples. RoT and QL analyzed the samples and processed the data. ALR constructed the paper, and RoT wrote the paper, with contributions from all the coauthors.
The authors declare that they have no conflict of interest.
This paper has not been formally reviewed by the Environmental Protection Agency. The views expressed in this document are solely those of authors and do not necessarily reflect those of the EPA. The EPA does not endorse any products or commercial services mentioned in this publication.
This research is supported by the National Key Research and Development Program of China (grant no. 2016YFC0202000), the National Natural Science Foundation of China (grant nos. 51636003, 41977179, 21677002 and 91844301), the Beijing Municipal Science and Technology Commission (grant no. Z201100008220011), the Natural Science Foundation of Beijing (grant no. 8192022), and the Open Research Fund of State Key Laboratory of Multi-phase Complex Systems (MPCS-2019-D-09). Allen L. Robinson and Quanyang Lu received financial support from the Center for Air, Climate, and Energy Solutions (CACES), which was funded by an Assistance Agreement (no. RD83587301) awarded by the US Environmental Protection Agency.
This research has been supported by the National Natural Science Foundation of China as a Key Program (grant nos. 41977179, 51636003, 21677002 and 91844301); the Open Research Fund of State Key Laboratory of Multi-phase Complex Systems (grant no. MPCS-2019-D-09); and the Center for Air, Climate, and Energy Solutions (grant no. RD83587301).
This paper was edited by Radovan Krejci and reviewed by two anonymous referees.
Alam, M. S. and Harrison, R. M.: Recent advances in the application of 2-dimensional gas chromatography with soft and hard ionisation time-of-flight mass spectrometry in environmental analysis, Chem. Sci., 7, 3968–3977, https://doi.org/10.1039/c6sc00465b, 2016.
Alam, M. S., Zeraati-Rezaei, S., Xu, H., and Harrison, R. M.: Characterization of Gas and Particulate Phase Organic Emissions (C9–C37) from a Diesel Engine and the Effect of Abatement Devices, Environ. Sci. Technol., 53, 11345–11352, https://doi.org/10.1021/acs.est.9b03053, 2019.
Cao, X., Yao, Z., Shen, X., Ye, Y., and Jiang, X.: On-road emission characteristics of VOCs from light-duty gasoline vehicles in Beijing, China, Atmos. Environ., 124, 146–155, https://doi.org/10.1016/j.atmosenv.2015.06.019, 2016.
Chan, A. W. H., Kautzman, K. E., Chhabra, P. S., Surratt, J. D., Chan, M. N., Crounse, J. D., Kürten, A., Wennberg, P. O., Flagan, R. C., and Seinfeld, J. H.: Secondary organic aerosol formation from photooxidation of naphthalene and alkylnaphthalenes: implications for oxidation of intermediate volatility organic compounds (IVOCs), Atmos. Chem. Phys., 9, 3049–3060, https://doi.org/10.5194/acp-9-3049-2009, 2009.
Cross, E. S., Sappok, A. G., Wong, V. W., and Kroll, J. H.: Load-Dependent Emission Factors and Chemical Characteristics of IVOCs from a Medium-Duty Diesel Engine, Environ. Sci. Technol., 49, 13483–13491, https://doi.org/10.1021/acs.est.5b03954, 2015.
Dall'Osto, M., Harrison, R. M., Coe, H., and Williams, P.: Real-time secondary aerosol formation during a fog event in London, Atmos. Chem. Phys., 9, 2459–2469, https://doi.org/10.5194/acp-9-2459-2009, 2009.
Donahue, N. M., Robinson, A. L., Stanier, C. O., and Pandis, S. N.: Coupled partitioning, dilution, and chemical aging of semivolatile organics, Environ. Sci. Technol., 40, 2635–2643, https://doi.org/10.1021/Es052297c, 2006.
Drozd, G. T., Zhao, Y., Saliba, G., Frodin, B., Maddox, C., Weber, R. J., Chang, M. C. O., Maldonado, H., Sardar, S., Robinson, A. L., and Goldstein, A. H.: Time Resolved Measurements of Speciated Tailpipe Emissions from Motor Vehicles: Trends with Emission Control Technology, Cold Start Effects, and Speciation, Environ. Sci. Technol., 50, 13592–13599, https://doi.org/10.1021/acs.est.6b04513, 2016.
Drozd, G. T., Zhao, Y., Saliba, G., Frodin, B., Maddox, C., Chang, M. C. O., Maldonado, H., Sardar, S., Weber, R. J., Robinson, A. L., and Goldstein, A. H.: Detailed speciation of intermediate volatility and semivolatile organic compound emissions from gasoline vehicles: effects of cold starts and implications for secondary organic aerosol formation, Environ. Sci. Technol., 53, 1706–1714, https://doi.org/10.1021/acs.est.8b05600, 2019.
Fontaras, G., Franco, V., Dilara, P., Martini, G., and Manfredi, U.: Development and review of Euro 5 passenger car emission factors based on experimental results over various driving cycles, Sci. Total Environ., 468–469, 1034–1042, https://doi.org/10.1016/j.scitotenv.2013.09.043, 2014.
Gentner, D. R., Isaacman, G., Worton, D. R., Chan, A. W. H., Dallmann, T. R., Davis, L., Liu, S., Day, D. A., Russell, L. M., Wilson, K. R., Weber, R., Guha, A., Harley, R. A., and Goldstein, A. H.: Elucidating secondary organic aerosol from diesel and gasoline vehicles through detailed characterization of organic carbon emissions, P. Natl. Acad. Sci. USA, 109, 18318–18323, https://doi.org/10.1073/pnas.1212272109, 2012.
Giani, P., Balzarini, A., Pirovano, G., Gilardoni, S., Paglione, M., Colombi, C., Gianelle, V. L., Belis, C. A., Poluzzi, V., and Lonati, G.: Influence of semi- and intermediate-volatile organic compounds (S/IVOC) parameterizations, volatility distributions and aging schemes on organic aerosol modelling in winter conditions, Atmos. Environ., 213, 11–24, https://doi.org/10.1016/j.atmosenv.2019.05.061, 2019.
Guo, S., Hu, M., Wang, Z. B., Slanina, J., and Zhao, Y. L.: Size-resolved aerosol water-soluble ionic compositions in the summer of Beijing: implication of regional secondary formation, Atmos. Chem. Phys., 10, 947–959, https://doi.org/10.5194/acp-10-947-2010, 2010.
Guo, S., Hu, M., Guo, Q. F., Zhang, X., Zheng, M., Zheng, J., Chang, C. C., Schauer, J. J., and Zhang, R. Y.: Primary Sources and Secondary Formation of Organic Aerosols in Beijing, China, Environ. Sci. Technol., 46, 9846–9853, https://doi.org/10.1021/es2042564, 2012.
Guo, S., Hu, M., Guo, Q., Zhang, X., Schauer, J. J., and Zhang, R.: Quantitative evaluation of emission controls on primary and secondary organic aerosol sources during Beijing 2008 Olympics, Atmos. Chem. Phys., 13, 8303–8314, https://doi.org/10.5194/acp-13-8303-2013, 2013.
Guo, S., Hu, M., Shang, D. J., Guo, Q. F., and Hu, W. W.: Research on Secondary Organic Aerosols Basing on Field Measurement, Acta Chim. Sinica, 72, 145–157, https://doi.org/10.6023/A13111169, 2014a.
Guo, S., Hu, M., Zamora, M. L., Peng, J. F., Shang, D. J., Zheng, J., Du, Z. F., Wu, Z., Shao, M., Zeng, L. M., Molina, M. J., and Zhang, R. Y.: Elucidating severe urban haze formation in China, P. Natl. Acad. Sci. USA, 111, 17373–17378, https://doi.org/10.1073/pnas.1419604111, 2014b.
Guo, S., Hu, M., Lin, Y., Gomez-Hernandez, M., Zamora, M. L., Peng, J. F., Collins, D. R., and Zhang, R. Y.: OH-Initiated Oxidation of m-Xylene on Black Carbon Aging, Environ. Sci. Technol., 50, 8605–8612, https://doi.org/10.1021/acs.est.6b01272, 2016.
Guo, S., Hu, M., Peng, J., Wu, Z., Zamora, M. L., Shang, D., Du, Z., Zheng, J., Fang, X., Tang, R., Wu, Y., Zeng, L., Shuai, S., Zhang, W., Wang, Y., Ji, Y., Li, Y., Zhang, A. L., Wang, W., Zhang, F., Zhao, J., Gong, X., Wang, C., Molina, M. J., and Zhang, R.: Remarkable nucleation and growth of ultrafine particles from vehicular exhaust, P. Natl. Acad. Sci. USA, 117, 3427–3432, https://doi.org/10.1073/pnas.1916366117, 2020.
Hallquist, M., Wenger, J. C., Baltensperger, U., Rudich, Y., Simpson, D., Claeys, M., Dommen, J., Donahue, N. M., George, C., Goldstein, A. H., Hamilton, J. F., Herrmann, H., Hoffmann, T., Iinuma, Y., Jang, M., Jenkin, M. E., Jimenez, J. L., Kiendler-Scharr, A., Maenhaut, W., McFiggans, G., Mentel, Th. F., Monod, A., Prévôt, A. S. H., Seinfeld, J. H., Surratt, J. D., Szmigielski, R., and Wildt, J.: The formation, properties and impact of secondary organic aerosol: current and emerging issues, Atmos. Chem. Phys., 9, 5155–5236, https://doi.org/10.5194/acp-9-5155-2009, 2009.
Hallquist, M., Munthe, J., Hu, M., Wang, T., Chan, C. K., Gao, J., Boman, J., Guo, S., Hallquist, A. M., and Mellqvist, J.: Photochemical smog in China: scientific challenges and implications for air-quality policies, Natl. Sci. Rev., 3, 401–403, https://doi.org/10.1093/nsr/nww080, 2016.
Hasan, A. O., Abu-jrai, A., Al-Muhtaseb, A. a. H., Tsolakis, A., and Xu, H.: Formaldehyde, acetaldehyde and other aldehyde emissions from HCCI/SI gasoline engine equipped with prototype catalyst, Fuel, 175, 249–256, https://doi.org/10.1016/j.fuel.2016.02.005, 2016.
Hasan, A. O., Elghawi, U. M., Al-Muhtaseb, A. A. H., Abu-jrai, A., Al-Rawashdeh, H., and Tsolakis, A.: Influence of composite after-treatment catalyst on particle-bound polycyclic aromatic hydrocarbons–vapor-phase emitted from modern advanced GDI engines, Fuel, 222, 424–433, https://doi.org/10.1016/j.fuel.2018.02.114, 2018.
Hu, M., Guo, S., Peng, J., and Wu, Z.: Insight into characteristics and sources of PM2.5 in the Beijing–Tianjin–Hebei region, China, Natl. Sci. Rev., 2, 257–258, https://doi.org/10.1093/nsr/nwv003, 2015.
Huang, C., Wang, H. L., Li, L., Wang, Q., Lu, Q., de Gouw, J. A., Zhou, M., Jing, S. A., Lu, J., and Chen, C. H.: VOC species and emission inventory from vehicles and their SOA formation potentials estimation in Shanghai, China, Atmos. Chem. Phys., 15, 11081–11096, https://doi.org/10.5194/acp-15-11081-2015, 2015.
Huang, C., Hu, Q., Li, Y., Tian, J., Ma, Y., Zhao, Y., Feng, J., An, J., Qiao, L., Wang, H., Jing, S. A., Huang, D., Lou, S., Zhou, M., Zhu, S., Tao, S., and Li, L.: Intermediate Volatility Organic Compound Emissions from a Large Cargo Vessel Operated under Real-world Conditions, Environ. Sci. Technol., 52, 12934–12942, https://doi.org/10.1021/acs.est.8b04418, 2018.
Huang, G., Liu, Y., Shao, M., Li, Y., Chen, Q., Zheng, Y., Wu, Z., Liu, Y., Wu, Y., and Hu, M.: Potentially Important Contribution of Gas-Phase Oxidation of Naphthalene and Methylnaphthalene to Secondary Organic Aerosol during Haze Events in Beijing, Environ. Sci. Technol., 53, 1235–1244, https://doi.org/10.1021/acs.est.8b04523, 2019.
Huang, L., Wang, Q., Wang, Y., Emery, C., Zhu, A., Zhu, Y., Yin, S., Yarwood, G., Zhang, K., and Li, L.: Simulation of secondary organic aerosol over the Yangtze River Delta region: The impacts from the emissions of intermediate volatility organic compounds and the SOA modeling framework, Atmos. Environ., 246, 118079, https://doi.org/10.1016/j.atmosenv.2020.118079, 2020.
Jaworski, A., Kuszewski, H., Ustrzycki, A., Balawender, K., Lejda, K., and Woś, P.: Analysis of the repeatability of the exhaust pollutants emission research results for cold and hot starts under controlled driving cycle conditions, Environ. Sci. Pollut. Res., 25, 17862–17877, https://doi.org/10.1007/s11356-018-1983-5, 2018.
Koo, B., Knipping, E., and Yarwood, G.: 1.5-Dimensional volatility basis set approach for modeling organic aerosol in CAMx and CMAQ, Atmospheric Environment, 95, 158–164, https://doi.org/10.1016/j.atmosenv.2014.06.031, 2014.
Lim, Y. B. and Ziemann, P. J.: Effects of molecular structure on aerosol yields from OH radical-initiated reactions of linear, branched, and cyclic alkanes in the presence of NOx, Environ. Sci. Technol., 43, 2328–2334, https://doi.org/10.1021/es803389s, 2009.
Lu, K., Guo, S., Tan, Z., Wang, H., Shang, D., Liu, Y., Li, X., Wu, Z., Hu, M., and Zhang, Y.: Exploring atmospheric free-radical chemistry in China: the self-cleansing capacity and the formation of secondary air pollution, Natl. Sci. Rev., 6, 579–594, https://doi.org/10.1093/nsr/nwy073, 2019.
Lu, Q., Zhao, Y., and Robinson, A. L.: Comprehensive organic emission profiles for gasoline, diesel, and gas-turbine engines including intermediate and semi-volatile organic compound emissions, Atmos. Chem. Phys., 18, 17637–17654, https://doi.org/10.5194/acp-18-17637-2018, 2018.
Ma, R., He, X., Zheng, Y., Zhou, B., Lu, S., and Wu, Y.: Real-world driving cycles and energy consumption informed by large-sized vehicle trajectory data, J. Clean. Prod., 223, 564–574, https://doi.org/10.1016/j.jclepro.2019.03.002, 2019.
Marotta, A., Pavlovic, J., Ciuffo, B., Serra, S., and Fontaras, G.: Gaseous Emissions from Light-Duty Vehicles: Moving from NEDC to the New WLTP Test Procedure, Environ. Sci. Technol., 49, 8315–8322, https://doi.org/10.1021/acs.est.5b01364, 2015.
May, A. A., Nguyen, N. T., Presto, A. A., Gordon, T. D., Lipsky, E. M., Karve, M., Gutierrez, A., Robertson, W. H., Zhang, M., Brandow, C., Chang, O., Chen, S. Y., Cicero-Fernandez, P., Dinkins, L., Fuentes, M., Huang, S. M., Ling, R., Long, J., Maddox, C., Massetti, J., McCauley, E., Miguel, A., Na, K., Ong, R., Pang, Y. B., Rieger, P., Sax, T., Truong, T., Vo, T., Chattopadhyay, S., Maldonado, H., Maricq, M. M., and Robinson, A. L.: Gas- and particle-phase primary emissions from in-use, on-road gasoline and diesel vehicles, Atmos. Environ., 88, 247–260, https://doi.org/10.1016/j.atmosenv.2014.01.046, 2014.
Murphy, B. N., Woody, M. C., Jimenez, J. L., Carlton, A. M. G., Hayes, P. L., Liu, S., Ng, N. L., Russell, L. M., Setyan, A., Xu, L., Young, J., Zaveri, R. A., Zhang, Q., and Pye, H. O. T.: Semivolatile POA and parameterized total combustion SOA in CMAQv5.2: impacts on source strength and partitioning, Atmos. Chem. Phys., 17, 11107–11133, https://doi.org/10.5194/acp-17-11107-2017, 2017.
Ng, N. L., Kroll, J. H., Chan, A. W. H., Chhabra, P. S., Flagan, R. C., and Seinfeld, J. H.: Secondary organic aerosol formation from m-xylene, toluene, and benzene, Atmos. Chem. Phys., 7, 3909–3922, https://doi.org/10.5194/acp-7-3909-2007, 2007.
Peng, J., Hu, M., Du, Z., Wang, Y., Zheng, J., Zhang, W., Yang, Y., Qin, Y., Zheng, R., Xiao, Y., Wu, Y., Lu, S., Wu, Z., Guo, S., Mao, H., and Shuai, S.: Gasoline aromatics: a critical determinant of urban secondary organic aerosol formation, Atmos. Chem. Phys., 17, 10743–10752, https://doi.org/10.5194/acp-17-10743-2017, 2017.
Peng, J. F., Hu, M., Guo, S., Du, Z. F., Zheng, J., Shang, D. J., Zamora, M. L., Zeng, L. M., Shao, M., Wu, Y. S., Zheng, J., Wang, Y., Glen, C. R., Collins, D. R., Molina, M. J., and Zhang, R. Y.: Markedly enhanced absorption and direct radiative forcing of black carbon under polluted urban environments, P. Natl. Acad. Sci. USA, 113, 4266–4271, https://doi.org/10.1073/pnas.1602310113, 2016.
Presto, A. A., Miracolo, M. A., Donahue, N. M., and Robinson, A. L.: Secondary organic aerosol formation from high-NOx photo-oxidation of low volatility precursors: n-alkanes, Environ. Sci. Technol., 44, 2029–2034, https://doi.org/10.1021/es903712r, 2010.
Pretsch, E., Clerc, T., Seibl, J., and Simon, W.: Tables of spectral data for structure determination of organic compounds, Springer Science & Business Media, Berlin, Germany, 2013.
Qi, L., Liu, H., Shen, X. E., Fu, M., Huang, F., Man, H., Deng, F., Shaikh, A. A., Wang, X., Dong, R., Song, C., and He, K.: Intermediate-Volatility Organic Compound Emissions from Nonroad Construction Machinery under Different Operation Modes, Environ. Sci. Technol., 53, 13832–13840, https://doi.org/10.1021/acs.est.9b01316, 2019.
Robinson, A. L., Donahue, N. M., Shrivastava, M. K., Weitkamp, E. A., Sage, A. M., Grieshop, A. P., Lane, T. E., Pierce, J. R., and Pandis, S. N.: Rethinking Organic Aerosols: Semivolatile Emissions and Photochemical Aging, Science, 315, 1259–1262, https://doi.org/10.1126/science.1133061, 2007.
Saliba, G., Saleh, R., Zhao, Y., Presto, A. A., Larnbe, A. T., Frodin, B., Sardar, S., Maldonado, H., Maddox, C., May, A. A., Drozd, G. T., Goldstein, A. H., Russell, L. M., Hagen, F., and Robinson, A. L.: Comparison of Gasoline Direct-Injection (GDI) and Port Fuel Injection (PFI) Vehicle Emissions: Emission Certification Standards, Cold-Start, Secondary Organic Aerosol Formation Potential, and Potential Climate Impacts, Environ. Sci. Technol., 51, 6542–6552, https://doi.org/10.1021/acs.est.6b06509, 2017.
Spencer, M. T., Shields, L. G., Sodeman, D. A., Toner, S. M., and Prather, K. A.: Comparison of oil and fuel particle chemical signatures with particle emissions from heavy and light duty vehicles, Atmos. Environ., 40, 5224–5235, https://doi.org/10.1016/j.atmosenv.2006.04.011, 2006.
Suarez-Bertoa, R., Zardini, A. A., Keuken, H., and Astorga, C.: Impact of ethanol containing gasoline blends on emissions from a flex-fuel vehicle tested over the Worldwide Harmonized Light duty Test Cycle (WLTC), Fuel, 143, 173–182, https://doi.org/10.1016/j.fuel.2014.10.076, 2015.
Tang, R., Wang, H., Liu, Y., and Guo, S.: Constituents of Atmospheric Semi-Volatile and Intermediate Volatility Organic Compounds and Their Contribution to Organic Aerosol, Prog. Chem., 31, 180–190, https://doi.org/10.7536/PC180431, 2019.
Tang, R., Wu, Z., Li, X., Wang, Y., Shang, D., Xiao, Y., Li, M., Zeng, L., Wu, Z., Hallquist, M., Hu, M., and Guo, S.: Primary and secondary organic aerosols in summer 2016 in Beijing, Atmos. Chem. Phys., 18, 4055–4068, https://doi.org/10.5194/acp-18-4055-2018, 2018.
Tang, R., Lu, Q., Guo, S., Wang, H., Song, K., Yu, Y., Tan, R., Liu, K., Shen, R., Chen, S., Zeng, L., Jorga, S. D., Zhang, Z., Zhang, W., Shuai, S., and Robinson, A. L.: Distinct Emissions and Volatility Distribution of Intermediate Volatility Organic Compounds from on-road Chinese Gasoline Vehicle: Implication of High Secondary Organic Aerosol Formation Potential, Zenodo, https://doi.org/10.5281/zenodo.4543210, 2021.
Wang, H., Yu, Y., Tang, R., and Guo, S.: Research on Formation and Aging of Secondary Organic Aerosol Based on Simulation Methods, Acta Chim. Sinica, 78, 516–527, https://doi.org/10.6023/A20020036, 2020.
Woody, M. C., Wong, H. W., West, J. J., and Arunachalam, S.: Multiscale predictions of aviation-attributable PM2.5 for US airports modeled using CMAQ with plume-in-grid and an aircraft-specific 1-D emission model, Atmos. Environ., 147, 384–394, https://doi.org/10.1016/j.atmosenv.2016.10.016, 2016.
Wu, Y., Zhang, S., Hao, J., Liu, H., Wu, X., Hu, J., Walsh, M. P., Wallington, T. J., Zhang, K. M., and Stevanovic, S.: On-road vehicle emissions and their control in China: A review and outlook, Sci. Total Environ., 574, 332–349, https://doi.org/10.1016/j.scitotenv.2016.09.040, 2017.
Yang, G., Zhang, Y., and Li, X.: Impact of gasoline upgrade policy on particulate matter pollution in China, J. Clean. Prod., 262, 121336, https://doi.org/10.1016/j.jclepro.2020.121336, 2020.
Yu, Y., Wang, H., Wang, T., Song, K., Tan, T., Wan, Z., Gao, Y., Dong, H., Chen, S., Zeng, L., Hu, M., Wang, H., Lou, S., Zhu, W., and Guo, S.: Elucidating the importance of semi-volatile organic compounds to secondary organic aerosol formation at a regional site during the EXPLORE-YRD campaign, Atmos. Environ., 246, 118043, https://doi.org/10.1016/j.atmosenv.2020.118043, 2021.
Yuan, B., Hu, W. W., Shao, M., Wang, M., Chen, W. T., Lu, S. H., Zeng, L. M., and Hu, M.: VOC emissions, evolutions and contributions to SOA formation at a receptor site in eastern China, Atmos. Chem. Phys., 13, 8815–8832, https://doi.org/10.5194/acp-13-8815-2013, 2013.
Zhang, Q., Jimenez, J., Canagaratna, M., Allan, J., Coe, H., Ulbrich, I., Alfarra, M., Takami, A., Middlebrook, A., and Sun, Y.: Ubiquity and dominance of oxygenated species in organic aerosols in anthropogenically-influenced Northern Hemisphere midlatitudes, Geophys. Res. Lett., 34, L13801, https://doi.org/10.1029/2007GL029979, 2007.
Zhang, S., Wu, Y., Wu, X., Li, M., Ge, Y., Liang, B., Xu, Y., Zhou, Y., Liu, H., Fu, L., and Hao, J.: Historic and future trends of vehicle emissions in Beijing, 1998–2020: A policy assessment for the most stringent vehicle emission control program in China, Atmos. Environ., 89, 216–229, https://doi.org/10.1016/j.atmosenv.2013.12.002, 2014.
Zhao, Y., Hennigan, C. J., May, A. A., Tkacik, D. S., de Gouw, J. A., Gilman, J. B., Kuster, W. C., Borbon, A., and Robinson, A. L.: Intermediate-Volatility Organic Compounds: A Large Source of Secondary Organic Aerosol, Environ. Sci. Technol., 48, 13743–13750, https://doi.org/10.1021/es5035188, 2014.
Zhao, Y., Nguyen, N. T., Presto, A. A., Hennigan, C. J., May, A. A., and Robinson, A. L.: Intermediate Volatility Organic Compound Emissions from On-Road Diesel Vehicles: Chemical Composition, Emission Factors, and Estimated Secondary Organic Aerosol Production, Environ. Sci. Technol., 49, 11516–11526, https://doi.org/10.1021/acs.est.5b02841, 2015.
Zhao, Y., Nguyen, N. T., Presto, A. A., Hennigan, C. J., May, A. A., and Robinson, A. L.: Intermediate Volatility Organic Compound Emissions from On-Road Gasoline Vehicles and Small Off-Road Gasoline Engines, Environ. Sci. Technol., 50, 4554–4563, https://doi.org/10.1021/acs.est.5b06247, 2016.
Zhao, Y., Lambe, A. T., Saleh, R., Saliba, G., and Robinson, A. L.: Secondary organic aerosol production from gasoline vehicle exhaust: Effects of engine technology, cold start, and emission certification standard, Environ. Sci. Technol., 52, 1253–1261, https://doi.org/10.1021/acs.est.7b05045, 2018.