the Creative Commons Attribution 4.0 License.
the Creative Commons Attribution 4.0 License.
 | 19 Feb 2021
Exploratory experiments on pre-activated freezing nucleation on mercuric iodide
Gabor Vali
Pre-activation of freezing nucleation (PFN) with mercuric iodide was first reported by Edwards, Evans, and Zipper (Edwards et al., 1970). They found that freezing, followed by melting just a few degrees Celsius above the melting point, leads to subsequent freezing of the sample more than 10 ∘C above the temperature of the initial nucleation temperature. Results presented in this paper are from laboratory experiments that followed the procedure designed by Edwards, Evans, and Zipper (1970) but employed multiple sample drops and many repetitions of the pre-activation cycle. The results obtained confirm the basic findings of the earlier work and refine them. It is shown that the pre-activation effect is lost gradually as the sample is heated above the melting point and that some effect is still seen with heating above +5 ∘C. Instrumental limitation in these experiments precluded detection of pre-activated freezing above −2 ∘C, but that possibility is not excluded. Some PFN was noted down to at least −6 ∘C. By also drawing on the results of Seeley and Seidler (2001), PFN is analyzed in search of constraints that help define the process responsible for it. No firm conclusions are reached, but the accumulated evidence points quite clearly to the role of surface sites in leading to PFN. Thus, sites are seen to play the same role as they do in heterogeneous freezing nucleation in general. PFN differs from pore condensation and freezing described by Marcolli (2020) and David et al. (2020), in that PFN is observed in liquid water while that process takes place in the vapor phase. Further explorations of the process leading to PFN can help in understanding ice nucleation and its practical manifestations at a basic level. The results call attention to an ice nucleation pathway hitherto barely explored that can be expected to have consequences in how ice nucleation occurs in atmospheric clouds and in other systems. PFN is also a potential tool for deliberate initiation of freezing in clouds and other systems.
- Article
(6338 KB) - Full-text XML
- BibTeX
- EndNote


The phenomenon that is to be examined here consists of observations of freezing nucleation by suspended particles just a few degrees below the melting point that follows prior freezing of the sample and heating to just a few degrees above the melting point. This specific cycle was first reported by Edwards, Evans, and Zipper (Edwards et al., 1970; EEZ70 in the following). The phenomenon is referred to in the following as “pre-activated freezing nucleation” (PFN)1.
Other manifestations of nucleation depending on the prior history of the sample are known, variously named enhancement or memory effect in the literature. PFN is perhaps the most neutral expression to use, in that it does not imply a specific process. “Enhancement” seems to imply that a given ice-nucleating particle (INP) or nucleating site is responsible for nucleation both in the normal mode and in previously exposed cases. In contrast, “memory effect” puts emphasis on the fact that prior freezing is a precondition for the observed high freezing temperatures. To retain some flexibility of description and as a reminder that different interpretations of the results are possible, while PFN will be used most frequently in this paper, other terms will also occasionally be employed.
Because ice nucleation is so inaccessible to direct observation, concepts of the process rely on empirical evidence bounding the conditions for it. PFN is of interest from the point of view of broadening or restricting those concepts. PFN provides additional evidence to be incorporated into the known set of constraints about how to view the process of freezing nucleation. Much recent work focused on pore condensation and freezing (PCF) that takes place in the vapor phase. Both processes are relevant to atmospheric conditions, with the difference that pore condensation is expected to play a role in the upper troposphere while PFN is more likely to have a role in low and mid-tropospheric clouds.
EEZ70 reported experiments with mercuric iodide, HgI2, and other substances. HgI2 is a moderately effective ice-nucleating substance. Observed activity is comparable to what was seen with some minerals in similar experiments: nucleation temperatures of −8 ∘C and lower. However, HgI2 is one of very few substances for which pre-activation is known to be possible.
In the EEZ70 experiments, a single drop of water containing some HgI2 was suspended in a pressure cell and surrounded by an inert fluid. The cell was then subjected to a prescribed sequence of temperatures. The principal finding of EEZ70 is that ice nucleation at some Tf, followed by continued cooling to T<TC, and further followed by warming to a temperature Tw such that 0 ∘C leads to nucleation on subsequent cooling at barely below the melting point of ice2 If warmed to above TD, subsequent nucleation takes place at . In addition to HgI2, EEZ70 report on similar experiments with other substances, at different pressures, and with salt solutions. The results are interpreted, following the results of Evans (1967), in terms of the formation of a two-dimensional ice-like monolayer on the substrate that facilitates nucleation of bulk ice unless destroyed by heating above TD. Prior cooling below TC is necessary for the monolayer to change from disordered to ordered form. Fig. 1 is a schematic representation of this process. Two cooling and freezing cycles are shown. The first one with Tw<TD leads to PFN at , while the second one with Tw>TD does not.
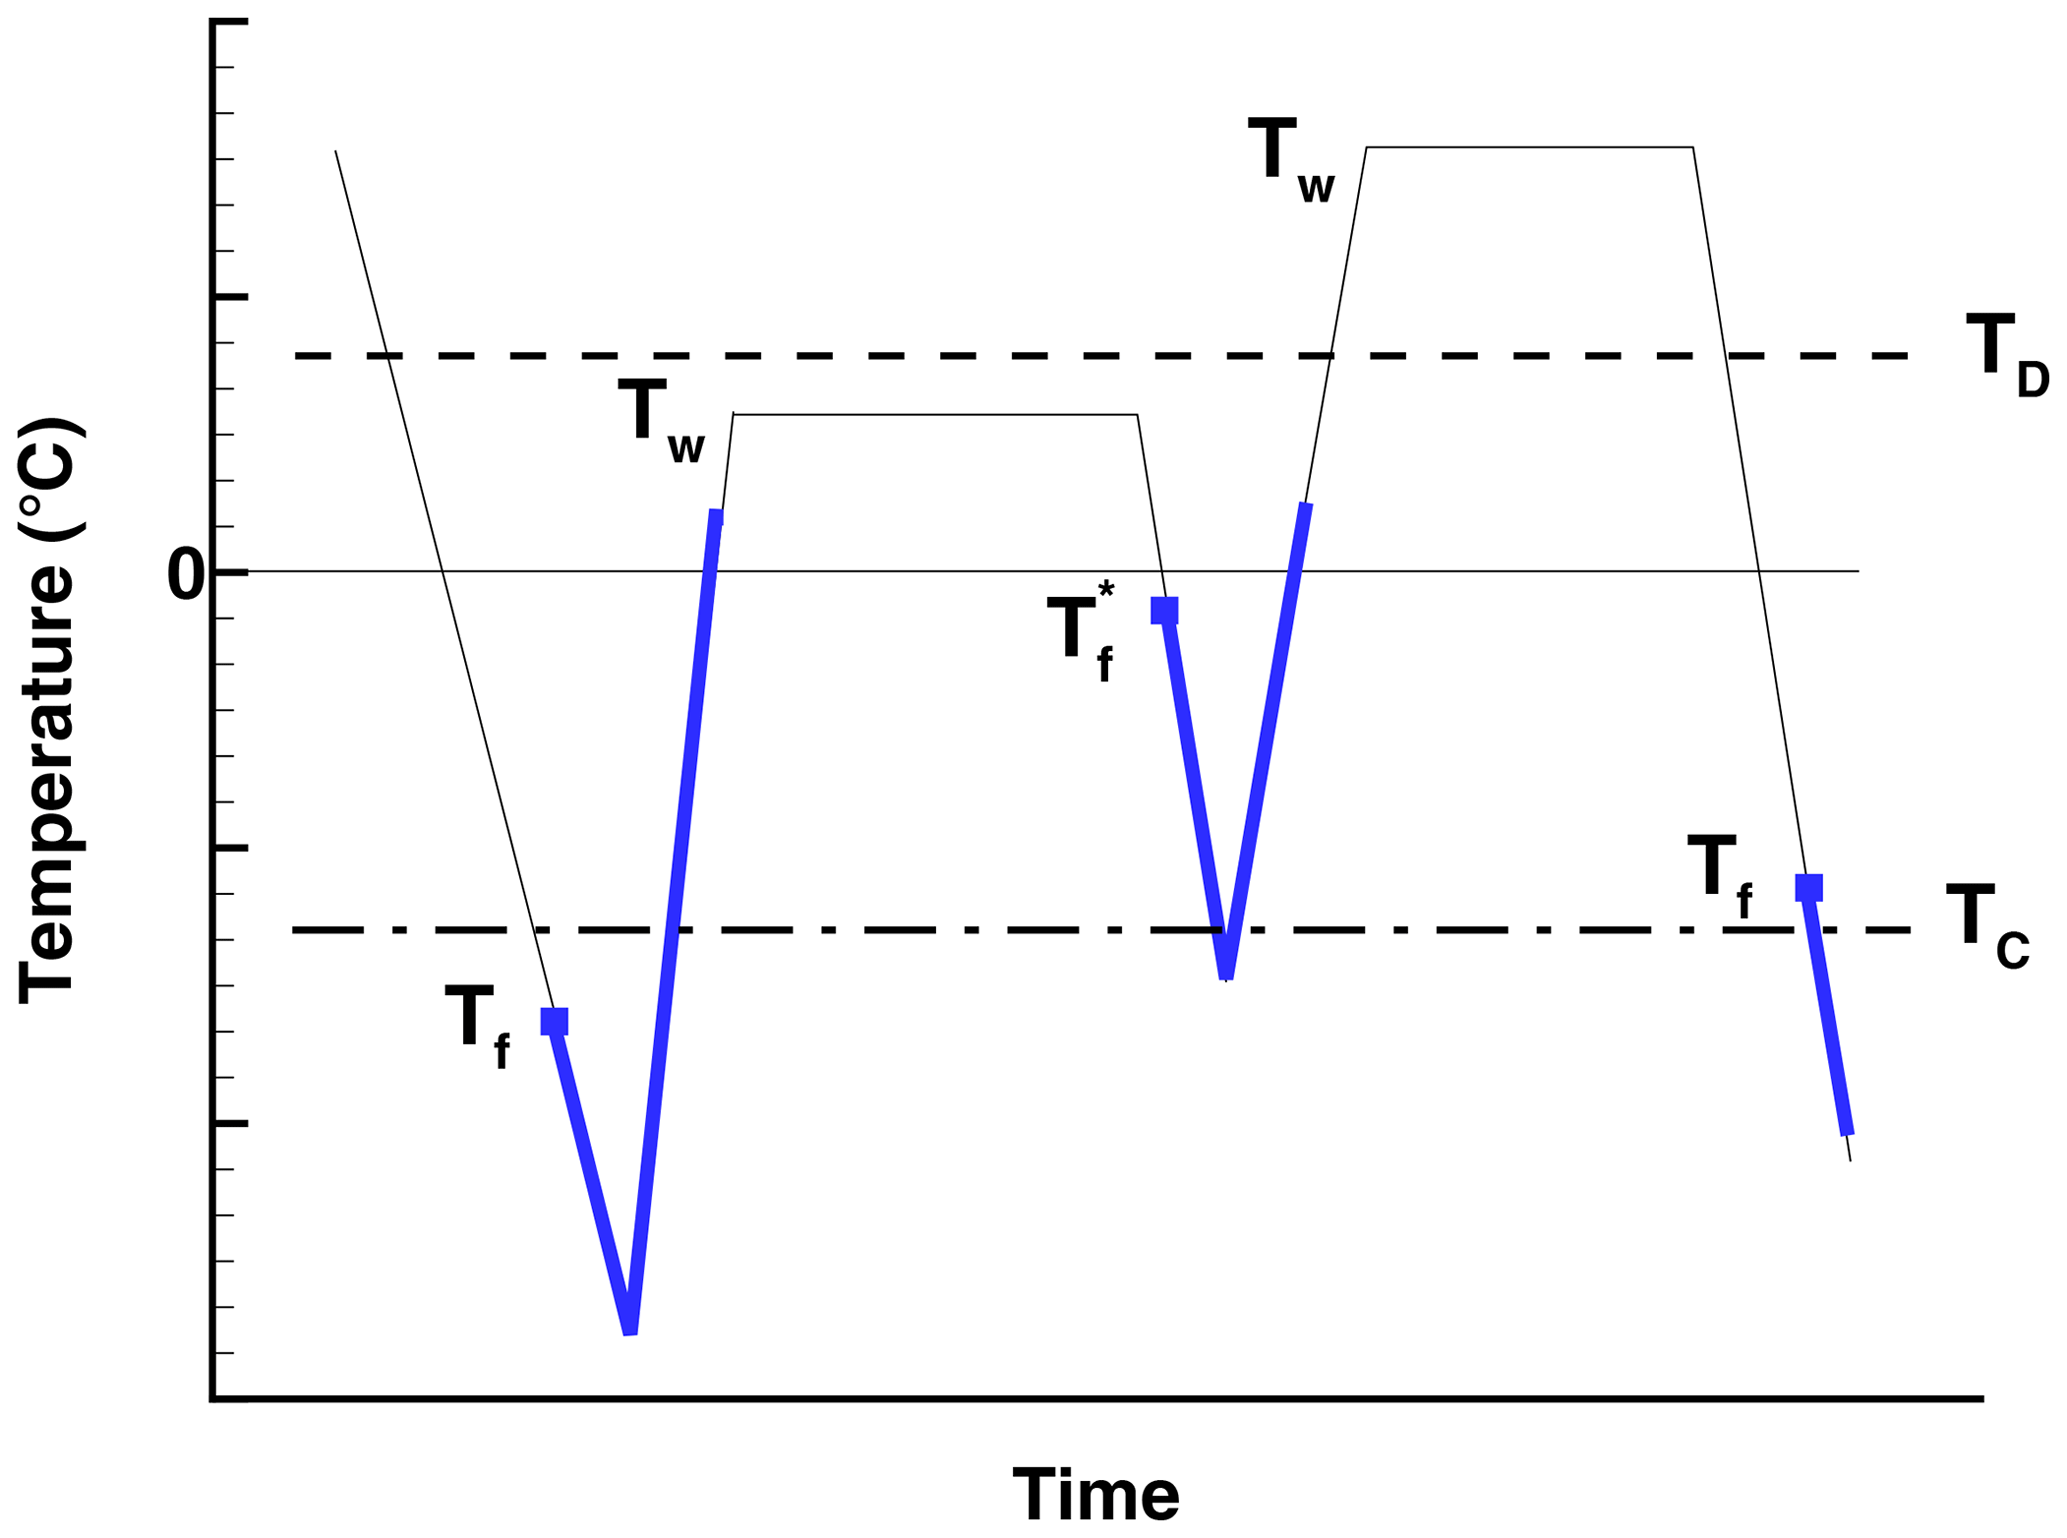
Figure 1Schematic representation of the findings of EEZ70 defining the notation used in this paper. The blue lines represent ice, and the blue squares represent points of nucleation.
The basic features of the pre-activation described above were shown by Seeley and Seidler (2001; abbreviated as SS01) to be also exhibited with aliphatic alcohols as ice nucleators. Their experiments were performed at 105 Pa using a single drop coated with the nucleating Langmuir film of the aliphatic alcohol and placed on a cooling stage. Many hundreds of cycles of cooling and heating were performed varying the warm limit Tw in stepwise fashion. Three different alcohols were used, giving different TD values but all leading to similar values of between −6 and −10 ∘C. In SS01, there is some gradual lowering of the freezing temperature as Tw is raised, and there is an abrupt shift to lower values at TD. There is no further lowering of the freezing temperatures beyond that. No results are given regarding TC; apparently cooling below a given limit was not a necessary condition for pre-activation in their experiments. An important aspect of the results in SS01 is that for any given Tw, the freezing temperatures vary over a range of approximately 4 ∘C in random fashion over the many cycles of the experiments. They showed the same variations of nucleation temperatures for the aliphatic alcohols without pre-activation. In all cases, the frequency of freezing as a function of temperature, R(T) in their notation, is interpreted in SS01 in terms of classical nucleation theory (CNT).
SS01 considered their results to be in accord with the monolayer explanation of EEZ70. A strong dependence of R(T) on the exponential factor of the CNT equation is claimed to be consistent with a monolayer being responsible for the pre-activation and not any “dimensional” change such as a rare defect in the Langmuir layer. This, in effect, reduces emphasis on the nucleating substrate or nucleating sites on it and focuses attention on changes in the water structure near the substrate. SS01 point to the findings of Majewski et al. (1994) for evidence of the ordering of a monolayer on the aliphatic alcohols and suggest experiments to examine how the changes in the monolayer relate to the dependence of pre-activation on TD.
The findings of EEZ70 and of SS01 are about pre-activation of freezing nucleation. Pre-activation was shown to also exist for deposition nucleation by Fournier d'Albe (1949), Mason and Maybank (1958), Higuchi and Fukuta (1966), and Roberts and Hallett (1968). In addition to the potential for an ice layer to be retained on the surface, the possibility that liquid water or ice in cavities, pores, or crevices of a substrate can exist outside the normal boundaries of phase changes for the bulk phases has also been proposed for explaining pre-activation. More recently, pore condensation and freezing received strong empirical evidence and theoretical support (Marcolli, 2014, 2020; Wagner et al., 2016; David et al., 2019, 2020); this process, if coupled with nucleation sites within the pore, lead to ice formation at low supersaturations. The process has not been linked to pre-activation in the liquid.
The current work confirms the main findings of EEZ70, and has some parallels with the results of SS01. A detailed comparison with these works will be given in Sect. 5 after the presentation of the experimental method for this work in Sect. 3 and the data obtained in Sect. 4. The experiments were performed in the early 1970s with much simpler equipment than is now available at many research institutions. However, the paucity of information on PFN gives relevance to the data obtained in those earlier studies. A preliminary summary of the experiments was given in Vali (1992).
3.1 Sample preparation
All experiments here described were performed with the same batch of the mercuric iodide, HgI2, supplied by Mollinckrodt Chemicals (St. Louis, MI, USA; Lot WYLS, 99 % purity). It is described as a soft material. Mercuric iodide is only slightly soluble in water ( g mL−1); the solute effect on the depression of the melting point is ignored in this work. Weighed amounts of the red HgI2 powder, as received, were added to 100 mL of distilled water to reach concentrations of 0.02 and 0.04 g mL−1. Supernatant was drawn into a sterile syringe for dispensing drops of 0.01 cm3 volume onto the cold stage. In most experiments, 121 drops were tested simultaneously.
Mercuric iodide is listed as being light-sensitive. The suspended particles were illuminated during the freezing tests. This may account for some of the variations that were observed over the durations of the experiments. No attempt was made to quantitate this.
The goal of these experiments was to examine the memory effect, with no emphasis on characterizing the activity of HgI2 per se. This meant that no special effort was made to achieve close control of the sample preparation. No rigid protocol was set, partly because control of many aspects of the sample preparation was unachievable with the available means. As a result, no data are available on particle size distributions in the drops. Variations in sample preparation and handling and the spread of the experiments over a period of a year led to variations in the activity observed in the samples. Perhaps most importantly, the time that lapsed between mixing the powder into water and the freezing tests was not held to a constant. However, the data of interest here derived from repeated cycles of freezing with given sets of drops, and those observations are independent of the sample-to-sample variations. Additionally, even a given set of drops cannot be taken to be perfectly identical, due to possible settling of particles and the need to refill the syringe various times for the production of a set of drops for a run. These factors add to the random distribution of INPs in the powder to give the appearance of overall randomness in the observed freezing events. Separation of the various factors of importance is attempted in this paper but is only possible to a limited extent.
In spite of the practical difficulties referred to above, the number of particles of HgI2 was undoubtedly high enough to make variations relatively unimportant. Assuming a mean particle diameter of 0.1 µm, the number of particles per drop was on the order of 1011, an ample number to consider each drop to have the same chance to contain an INP. The experiments detected the INP with the highest freezing temperature in a drop, making that event unique.
3.2 Freezing experiments
The experiments were carried out in the same manner as those described by Vali (2008). They were performed intermittently over a period of about a year (1972–1973) when the drop-freezing apparatus was available. Briefly, the apparatus consisted of a cold stage of a 1 cm thick copper block of 10 × 10 cm dimensions. The block was covered with aluminum foil using a heat-conducting cream beneath the foil to reduce temperature variations. A thin silicone varnish was applied on the foil to provide a hydrophobic surface. Cooling of the cold stage was via Peltier elements and a circulating liquid heat exchanger, controlled to be at −1 ∘C min−1. Temperature measurement was obtained with a calibrated thermocouple. A digital temperature display and the drop array were photographed at intervals of 15 s. Illumination was optimized to have the cold stage be nearly completely dark, thus enabling freezing to be detected by reflection by the ice within the drops. After all drops were frozen the stage was heated at roughly 1 ∘C min−1 to a maximum preset value of Tw. Temperature overshoot at Tw was held to < 0.2 ∘C.
The photographic records were evaluated by experienced technicians. The images were projected onto a table one frame at a time, stepping from frame to frame on a manual command (push button) by the technician after a thorough visual scan of the image. It was possible to move backward and forward to compare adjacent images. When a change in opacity was discerned for a drop, the temperature reading from that frame was written over the image of the drop. These records were subsequently entered into spreadsheets for computer analysis. Detection of freezing from the change in drop opacity was rather critical in these experiments because many of the freezing events were at just a few degrees below the 0 ∘C. The processing of the photographic film (16 mm) was tailored to achieve good but not excessive contrast and to be reproducible. To control for the unavoidable uncertainty in the detection of freezing events due to human subjectivity, some of the readings of the film records were repeated by two individuals. Differences were <0.5 ∘C for the majority of cases at few degrees below 0 ∘C and less than that at lower temperatures. In all, freezing events were reliably detected at ∘C and for this work that is viewed as the detection limit.
Measurement errors of the stage temperature and non-uniformities across the stage were smaller than the uncertainty resulting from determination of the moment of freezing. Therefore, the overall accuracy of data here reported is taken as 0.5 ∘C, but occasional larger errors cannot be ruled out.
3.3 Types of experiments
In order to explore different aspects of the memory effect, experiments of various types were performed, falling into two major groups. One group was aimed at determining the limits of heating above 0 ∘C that still produces some enhanced nucleation. In this group are the following experiments: (i) gradual increase of the warm limit Tw from one run to the next (Exp. A, B), (ii) gradual decrease of the warm limit (Exp. C), (iii) alternating high and low warm limits (Exp. G, H). The other group of experiments was performed to examine the reproducibility of the memory effect and the influence of time with (iv) varying lengths of time at the warm limit (Exp. D) and (v) repeats of the same warm limit (Exp. I).
In all experiments, the initial run was performed right after placing the drops on the cold stage. These runs started at room temperature, which was not controlled but was 20 ± 2 ∘C. Cooling was continued until all drops were frozen.
With warming of the drops to only a few degrees above 0 ∘C and only over a short time, a valid concern arises about the possibility of some ice being retained in the drops. All evidence points to this not having been the case. In general terms, some supercooling was required for all drops to freeze, as indicated by sudden changes in opacity at the moment of nucleation. Gradual freezing that started at 0 ∘C would have led to gradual darkening of the drop images. Results to be presented in a later section with varying length of time above 0 ∘C provide further proof for the absence of bulk ice when repeat freezing cycles are started.
The number of sample drops varied from experiment to experiment because in most cases two or more different dilutions of the suspension were tested simultaneously. Results are reported only for the dilutions exhibiting clear PFN. One or two rows of drops of distilled water were also included for control.
4.1 Nucleus spectra
The HgI2 suspensions used in these experiments (after initial tests to arrive at a particle concentration in the working range of the experiments) exhibited moderate activity. The differential concentration of INPs is shown in Fig. 2 for the various experiments to be described in this paper. Data displayed here are from the initial run of each experimental series when the drop array was first cooled from room temperatures. The differential INP concentration plotted in Fig. 2 is defined in Vali (1971, 2014) and is computed as
where V=0.01 cm3 is the volume of the drops, T is the temperature in ∘C, nuf(T) is the number of drops remaining unfrozen at T, and Δnuf is the number freezing upon cooling from T to (T−ΔT). Here ΔT=0.25 ∘C.

Figure 2Differential nucleus spectra, K(T) for the HgI2 suspensions used in the various experiments.
There is considerable variation among the experiments due to variations in the degree of dispersion of the HgI2 powder and the degree of settling that took place before the supernatant was withdrawn for producing the sample drops. This variation was not of particular concern for this work and no special effort was made to reduce the variability. The main concern was to have, in each experiment, freezing temperatures spread over the range −5 to −20 ∘C.
4.2 Determining the “warm limit” above 0 ∘C for PFN to occur
Three series of experiments were performed to define the upper limit of temperature that allows PFN to occur. In two experiments the warm limit Tw was increased gradually from one run to the next with the same set of drops. In one series the warm limit was gradually decreased. In all experiments the stage was held at Tw for 5 min between runs.
In experiment A, after the initial run, 10 more runs were performed with values of Tw=1.5, 2.0, 2.5, 3.0, 3.5, 4.0, 4.5, 5.0, 6.0, and 10.0 ∘C. In Exp. B a shorter series was performed with Tw=10.0, 1.5, 2.0, 3.0, 4.0, and 5.0 ∘C. A series of runs with gradually decreasing warm limits was executed in Experiment C, with Tw=10.0, 8.0, 8.0, 5.0, 4.0, and 3.0 ∘C. The number of drops tested simultaneously was 77 for Exp. A and 33 for Exp. B and Exp. C.
Table 1Average freezing temperatures, (∘C), observed in the three series of experiments with gradually increasing and gradually decreasing warm limits, Tw (∘C).
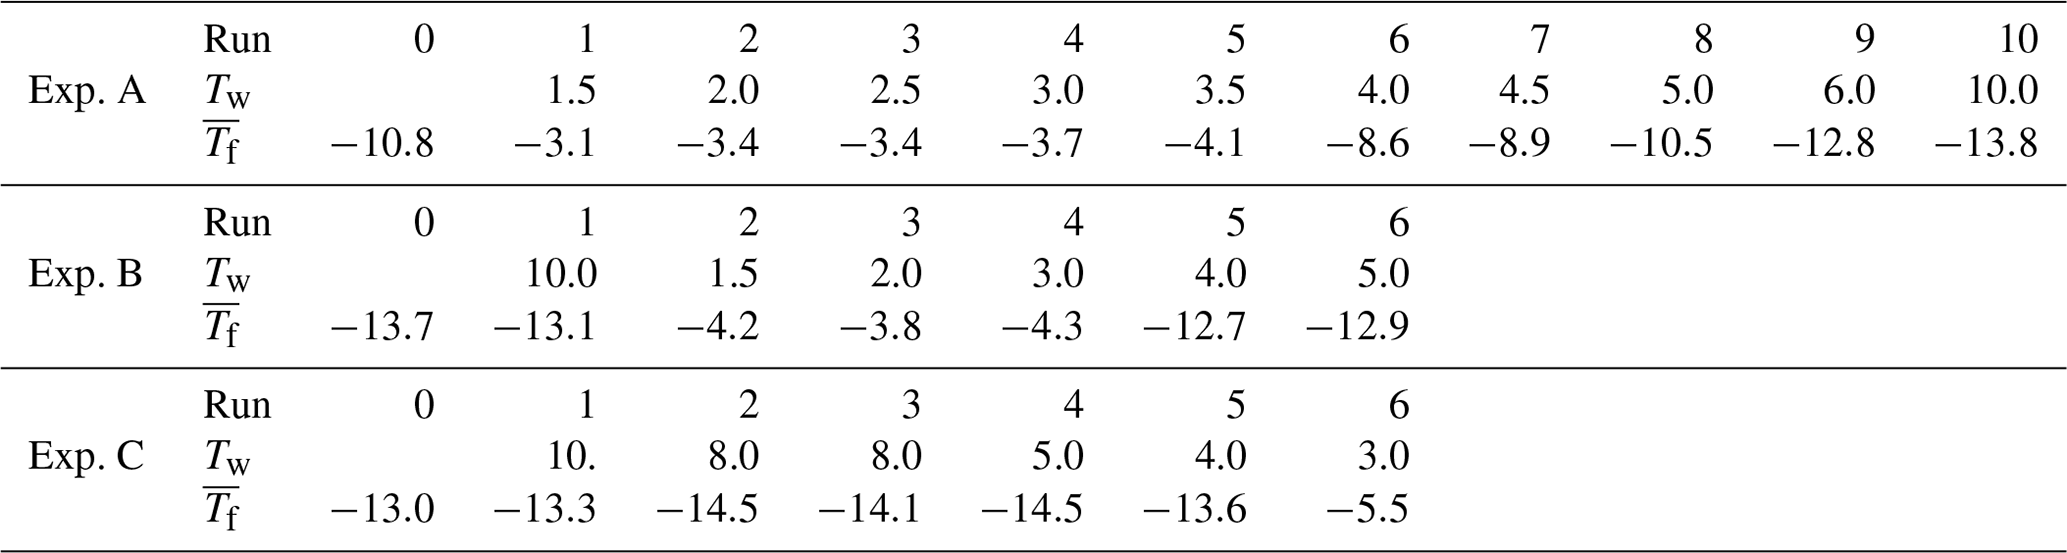
A summary of the results for these series of runs in given in Table 1 and in Figs. 3, 4, and 5. All three series indicate a pronounced change between Tw=3 ∘C and Tw=4 ∘C independent of the direction of the change from increasing or decreasing warm limits. This is the main finding, bracketing the value of TD. The detection limit for freezing of the sample drops is another factor limiting a fully clear delineation of the magnitude of the PFN effect observed. When taking into account the range of freezing temperatures indicated by the vertical bars in the figures it may be noted that there is some overlap between the events on either side of the major jump.
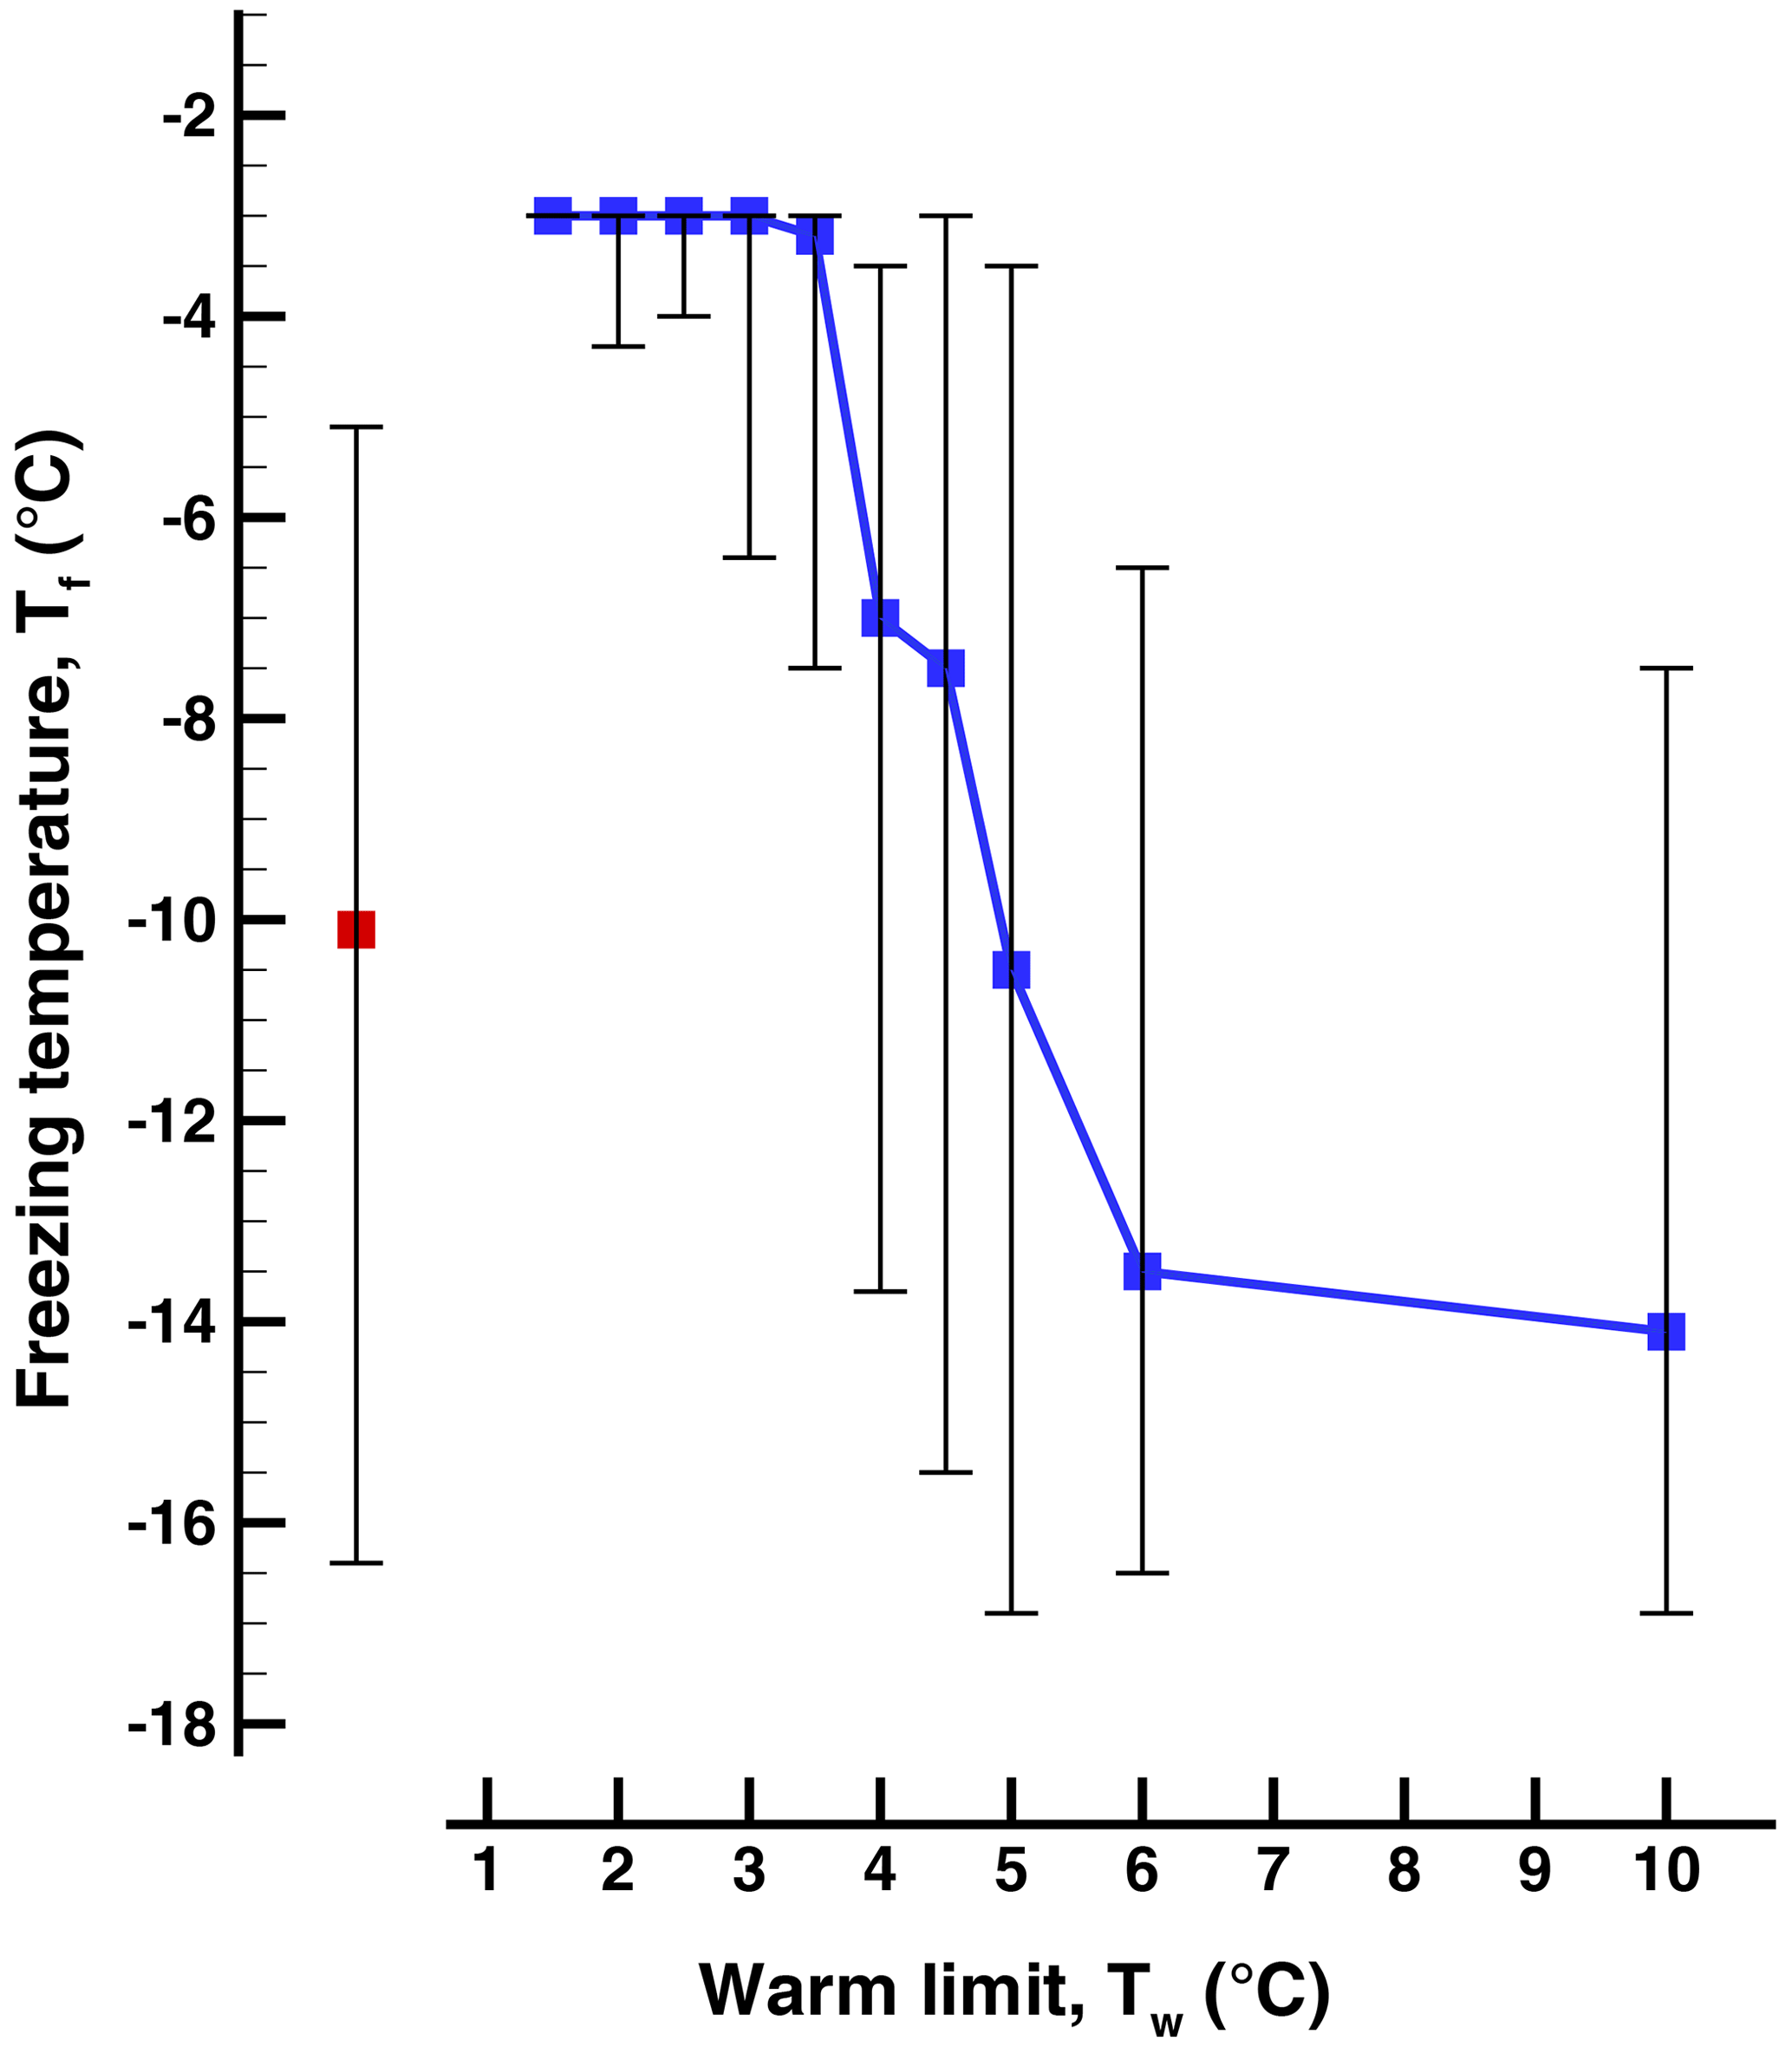
Figure 3Freezing temperatures in the sequence of runs (Exp. A) with increasing warm limit, Tw. The first bar on the left is for the initial run started at room temperature. The 50th percentile is indicated by the square symbols, and the vertical lines show the 5th- and 95th-percentile values.

Figure 4Freezing temperatures in a sequence of runs (Exp. B) with increasing warm limit, Tw, after run 1 with ∘C. Run 0 was started at room temperature. The 50 % value is indicated by the square symbols, and the vertical lines show the 5th- and 95th-percentile values.
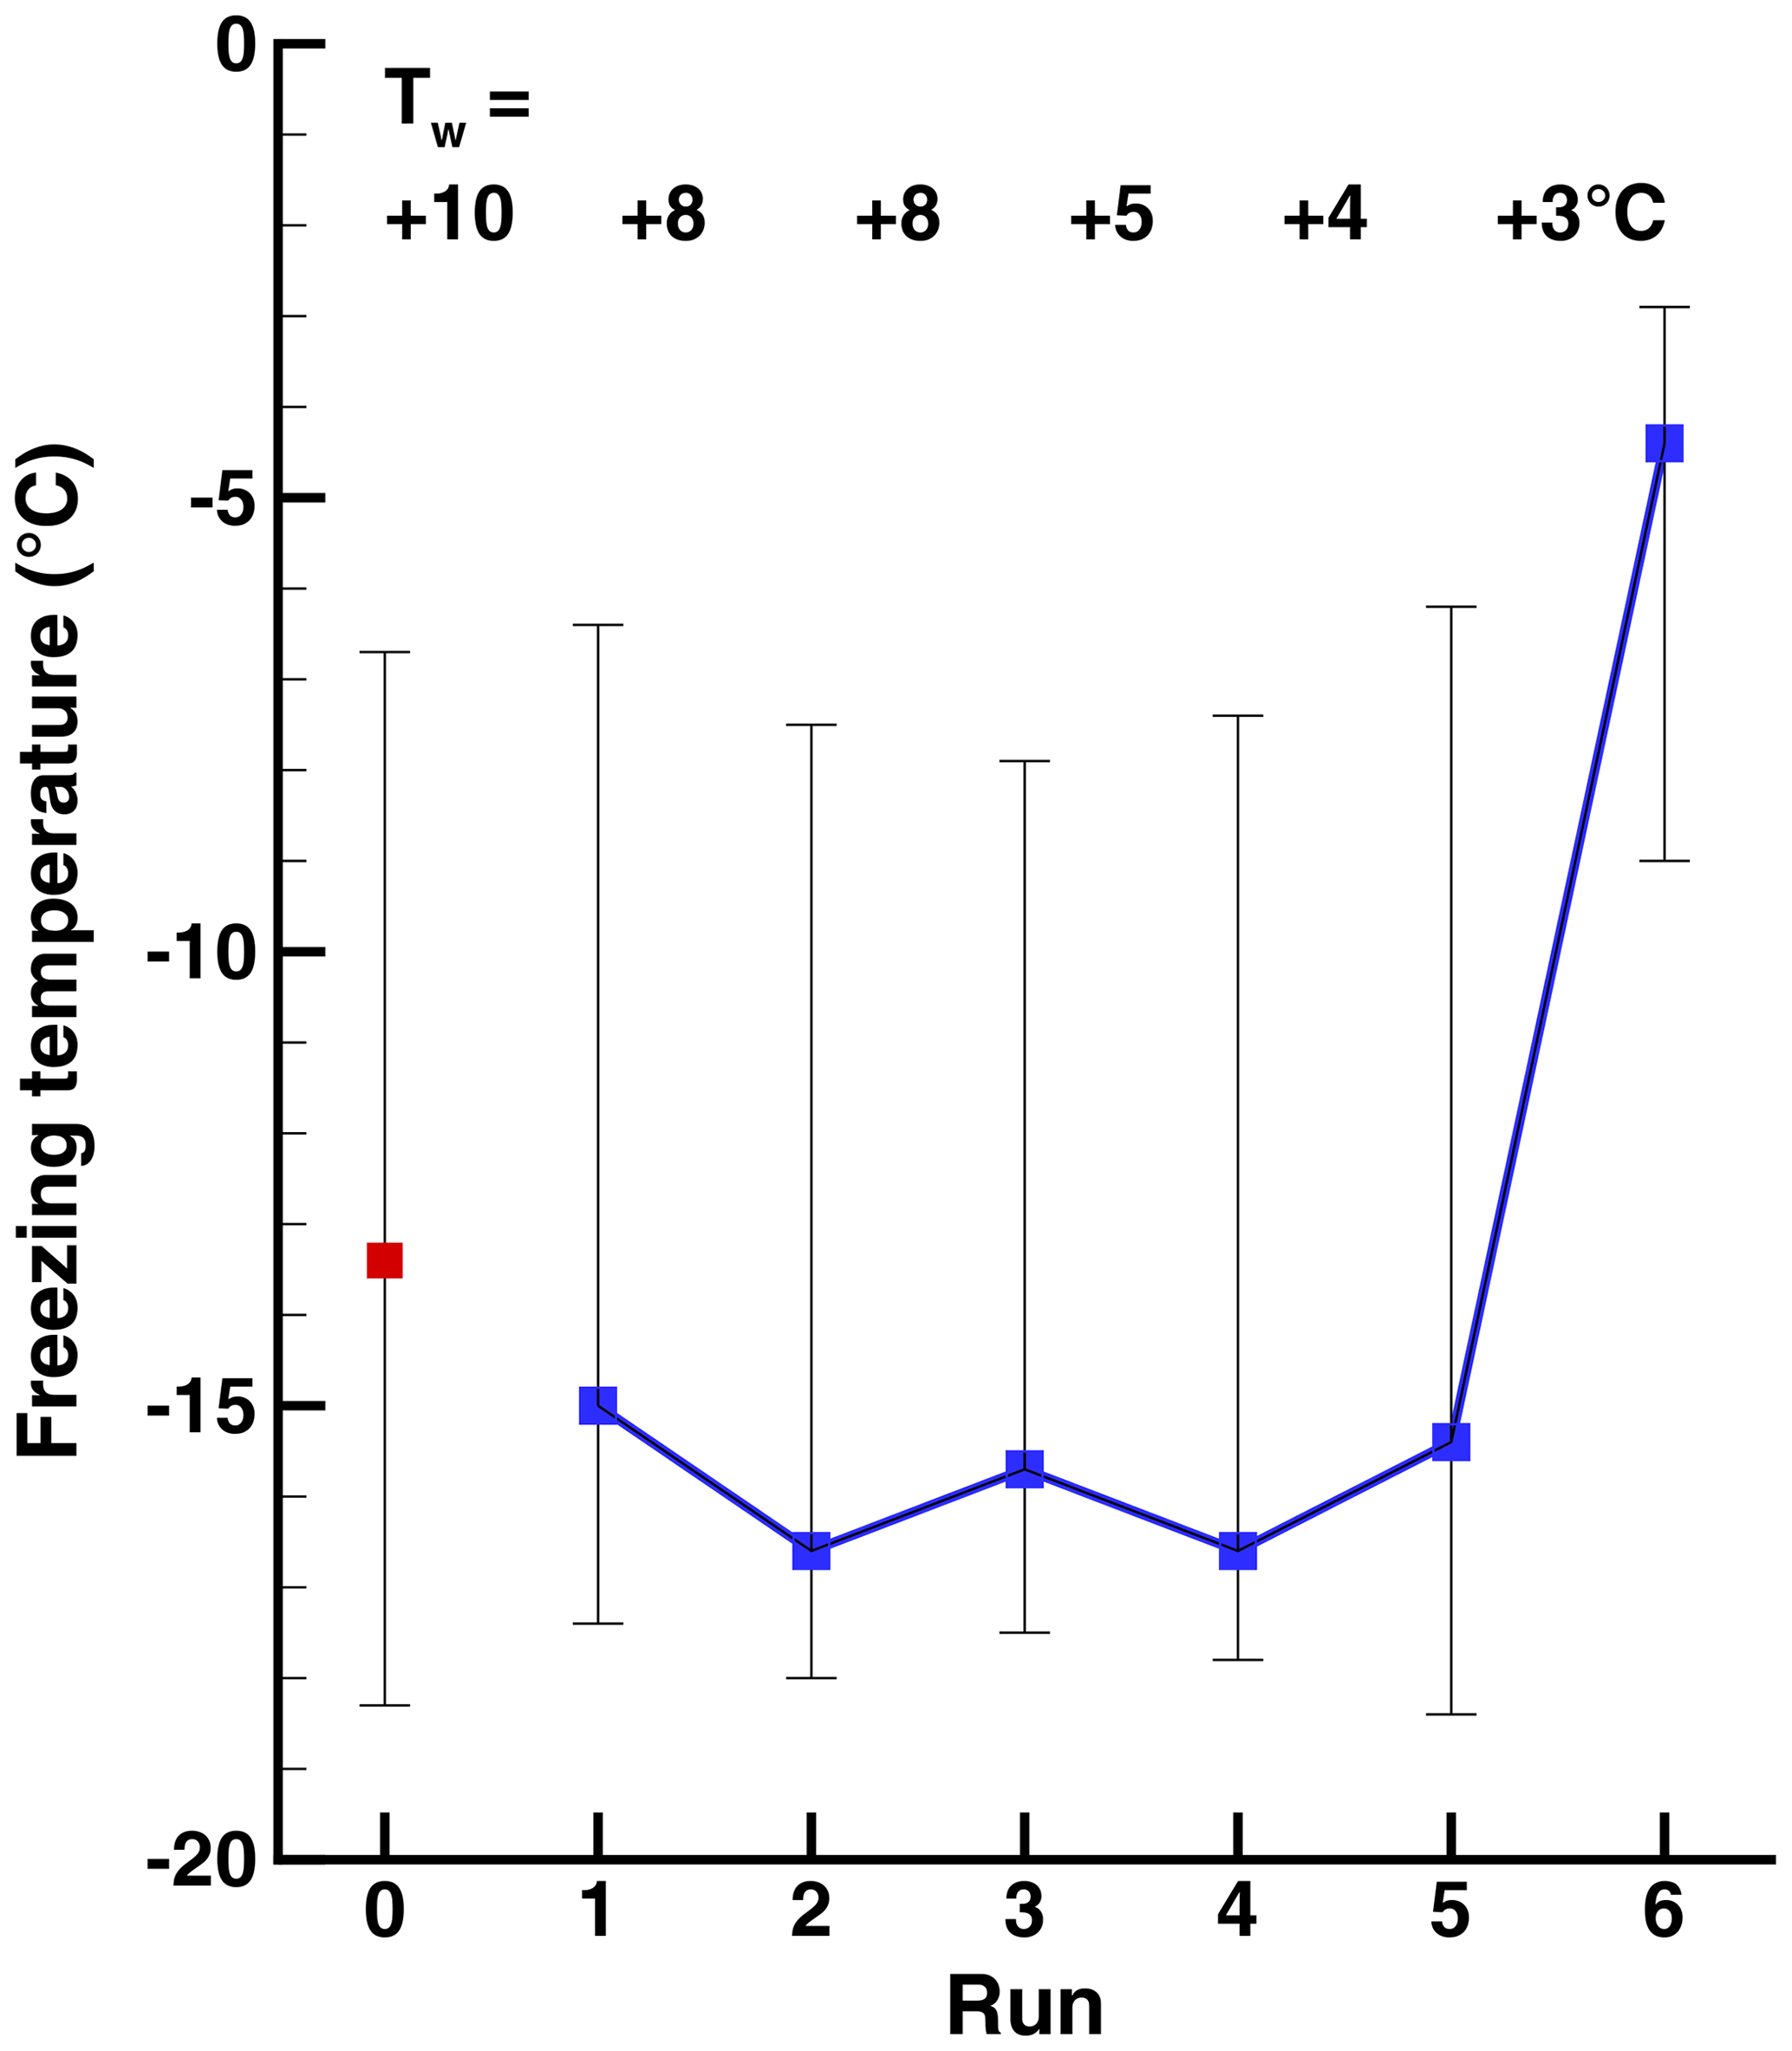
Figure 5Freezing temperatures in a sequence of runs (Exp. C) with decreasing warm limit, Tw. The 50 % is indicated by the square symbols, and the vertical lines show the 10th- and 90th-percentile values.
Table 2Percentage of drops with ∘C in Exp. A and ∘C in Exps. B and C after melting at different warm limits. There are large decreases in the percentages frozen for ∘C, but non-zero values extend to warm limits well above that value.
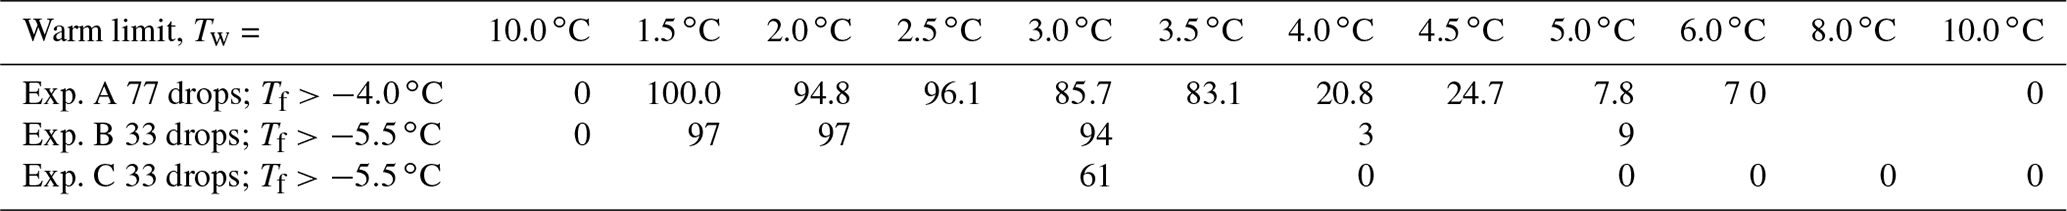
Another way to illustrate the impact of raising the warm limit past TD is to look at the fraction of drops showing significantly elevated freezing temperatures, given as the fraction of drops freezing above some “cutoff” value. The cutoff values used to generate the table varied somewhat in order to have adequate sample sizes. The results are shown in Table 2. A large jump near ∘C in the percentage of drops freezing above the cutoff is evident in all three experiments. However, it is important to note that some PFN can be seen even at ∘C and ∘C. That these are not artifacts is reinforced by the 0 values for the initial run and for runs with ∘C.
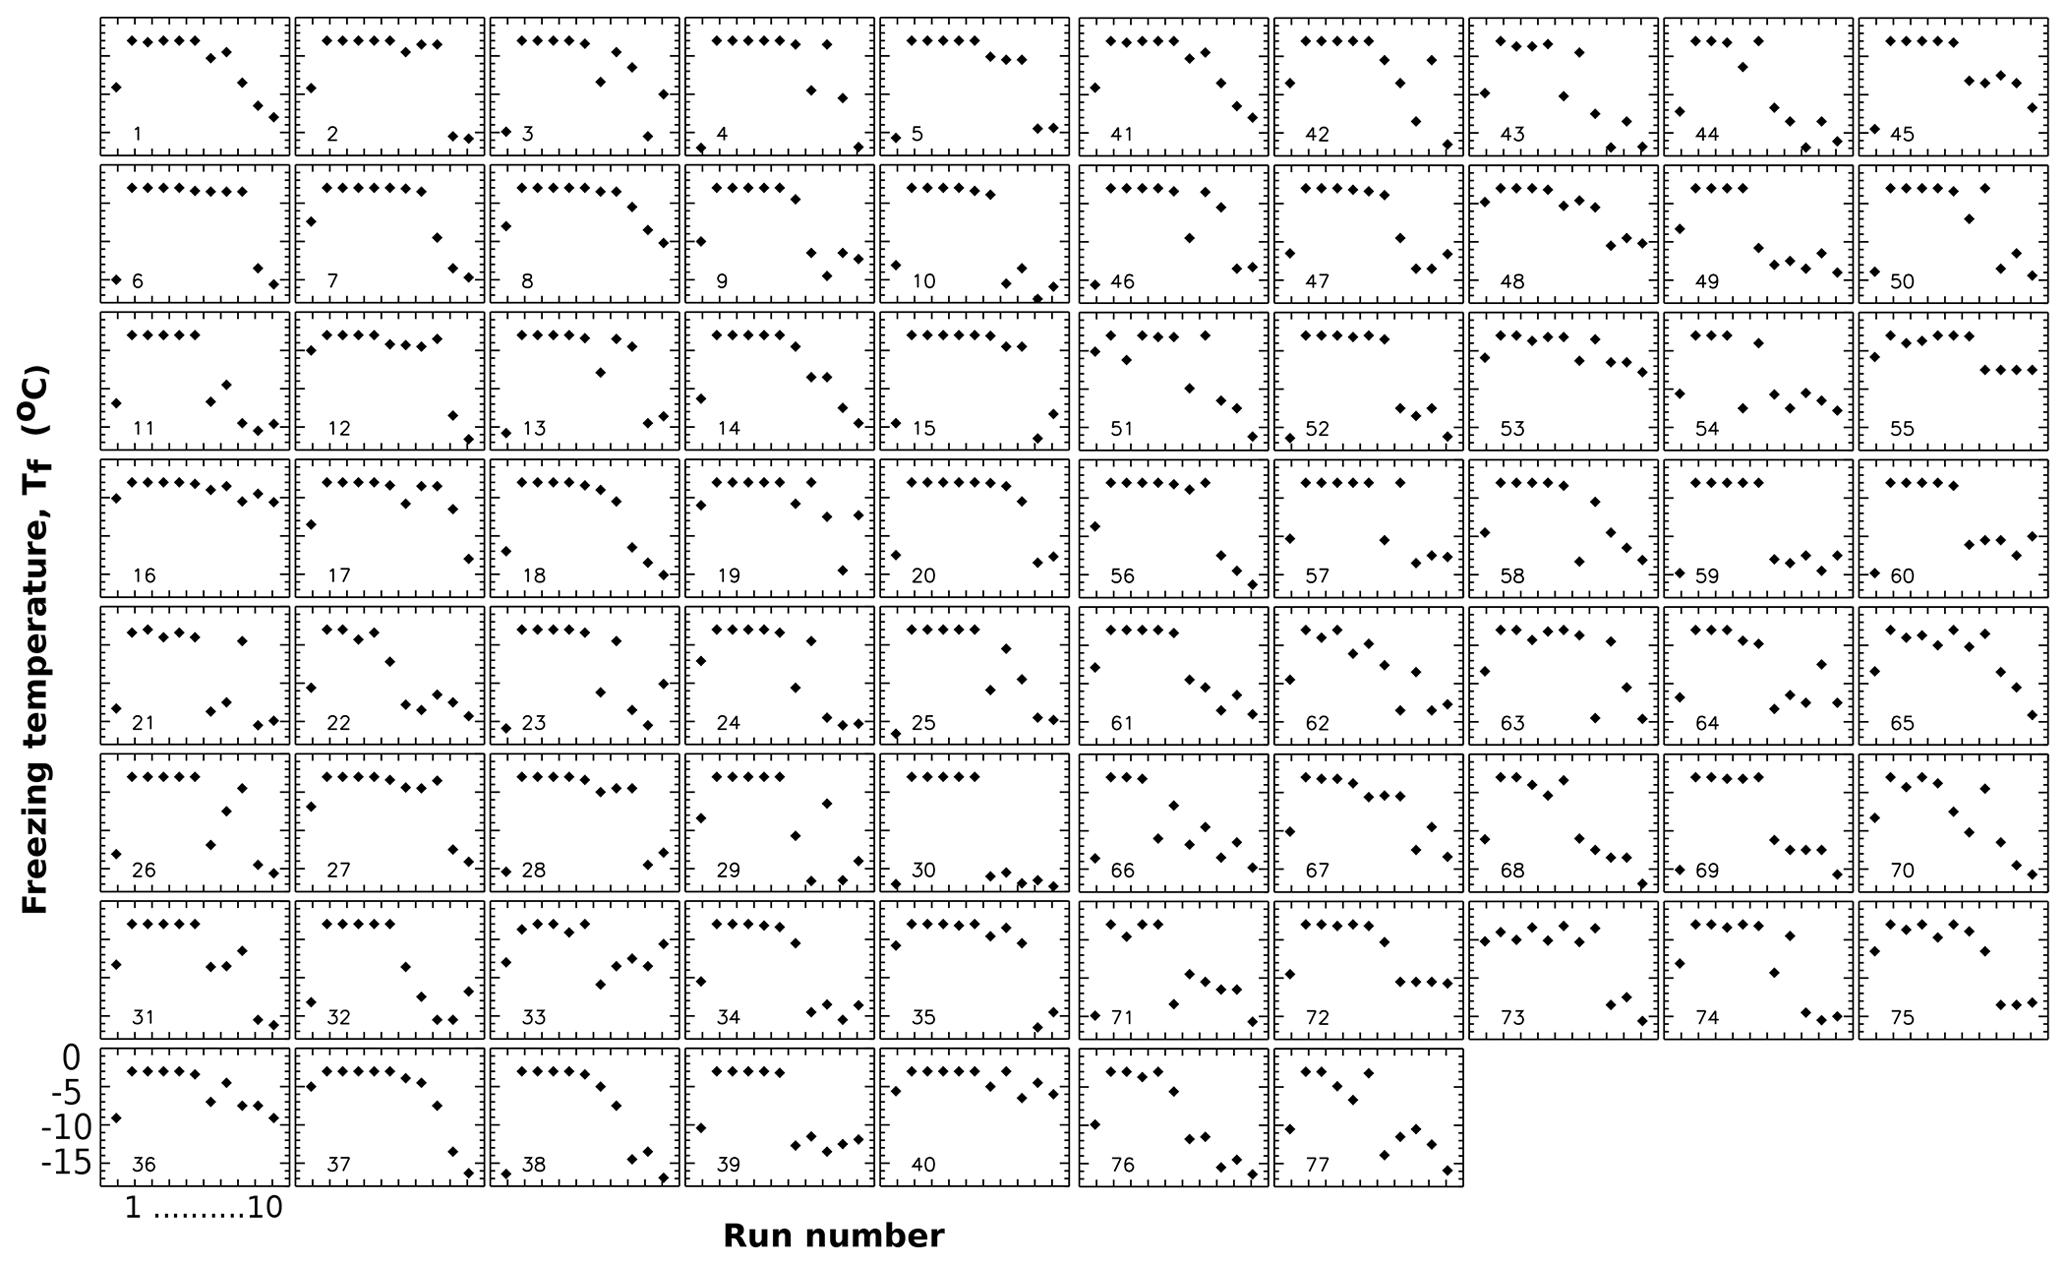
Figure 6Freezing temperatures in Exp. A for run 0 and runs 1 to 10 for individual drops. Run 0 is the initial run, and runs 1 to 10 are runs with controlled Tw values as shown in Table 1.
The description given above in terms of ensemble parameters can be put into better perspective by elaborating on the variations encountered when examining individual sample drops. To this end, the temperature histories of individual drops are displayed for Exp. A in Fig. 6. Apart from the steady Tf values in runs 2–4 where the detection limit restricts variations, a number of different patterns can be distinguished. For example, drops 2, 35, 56, and many others retained ∘C even to run 8 that followed ∘C. On the other hand, drops 1, 21, 39, 80, and others exhibit sharp decreases in Tf after run 6 following ∘C. There are other patterns as well, i.e., gradual shifts, sudden changes up or down, or no systematic changes. These variations complicate the definition of TD and have to be kept in mind when discussing the significance of that as a threshold value.
4.3 The effect of time duration samples are held at the warm limit
Data in the preceding section were produced with a 5 min holding period at the warm limit. Clearly it was of interest to test how shorter or longer exposures to temperatures above the melting point would effect the degree of PFN. This factor was tested with the time at +1.5 ∘C altered between 1 and 5 min, although this was only done in one experiment (Exp. D). Two sequences were tested with an overnight gap between them.
In a sense, the 1 min holding time was also a test of whether incomplete melting may have led to subsequent freezing right at 0 ∘C. Because of this, extra care was taken in the data reduction in this experiment to detect freezing of the drops as early as possible. Events were recorded starting at −2 ∘C. No difference was found in that threshold between the 1 and 5 min holding times. Results for the sequence of runs are shown in Fig. 7. The two repetitions are shown as one series.
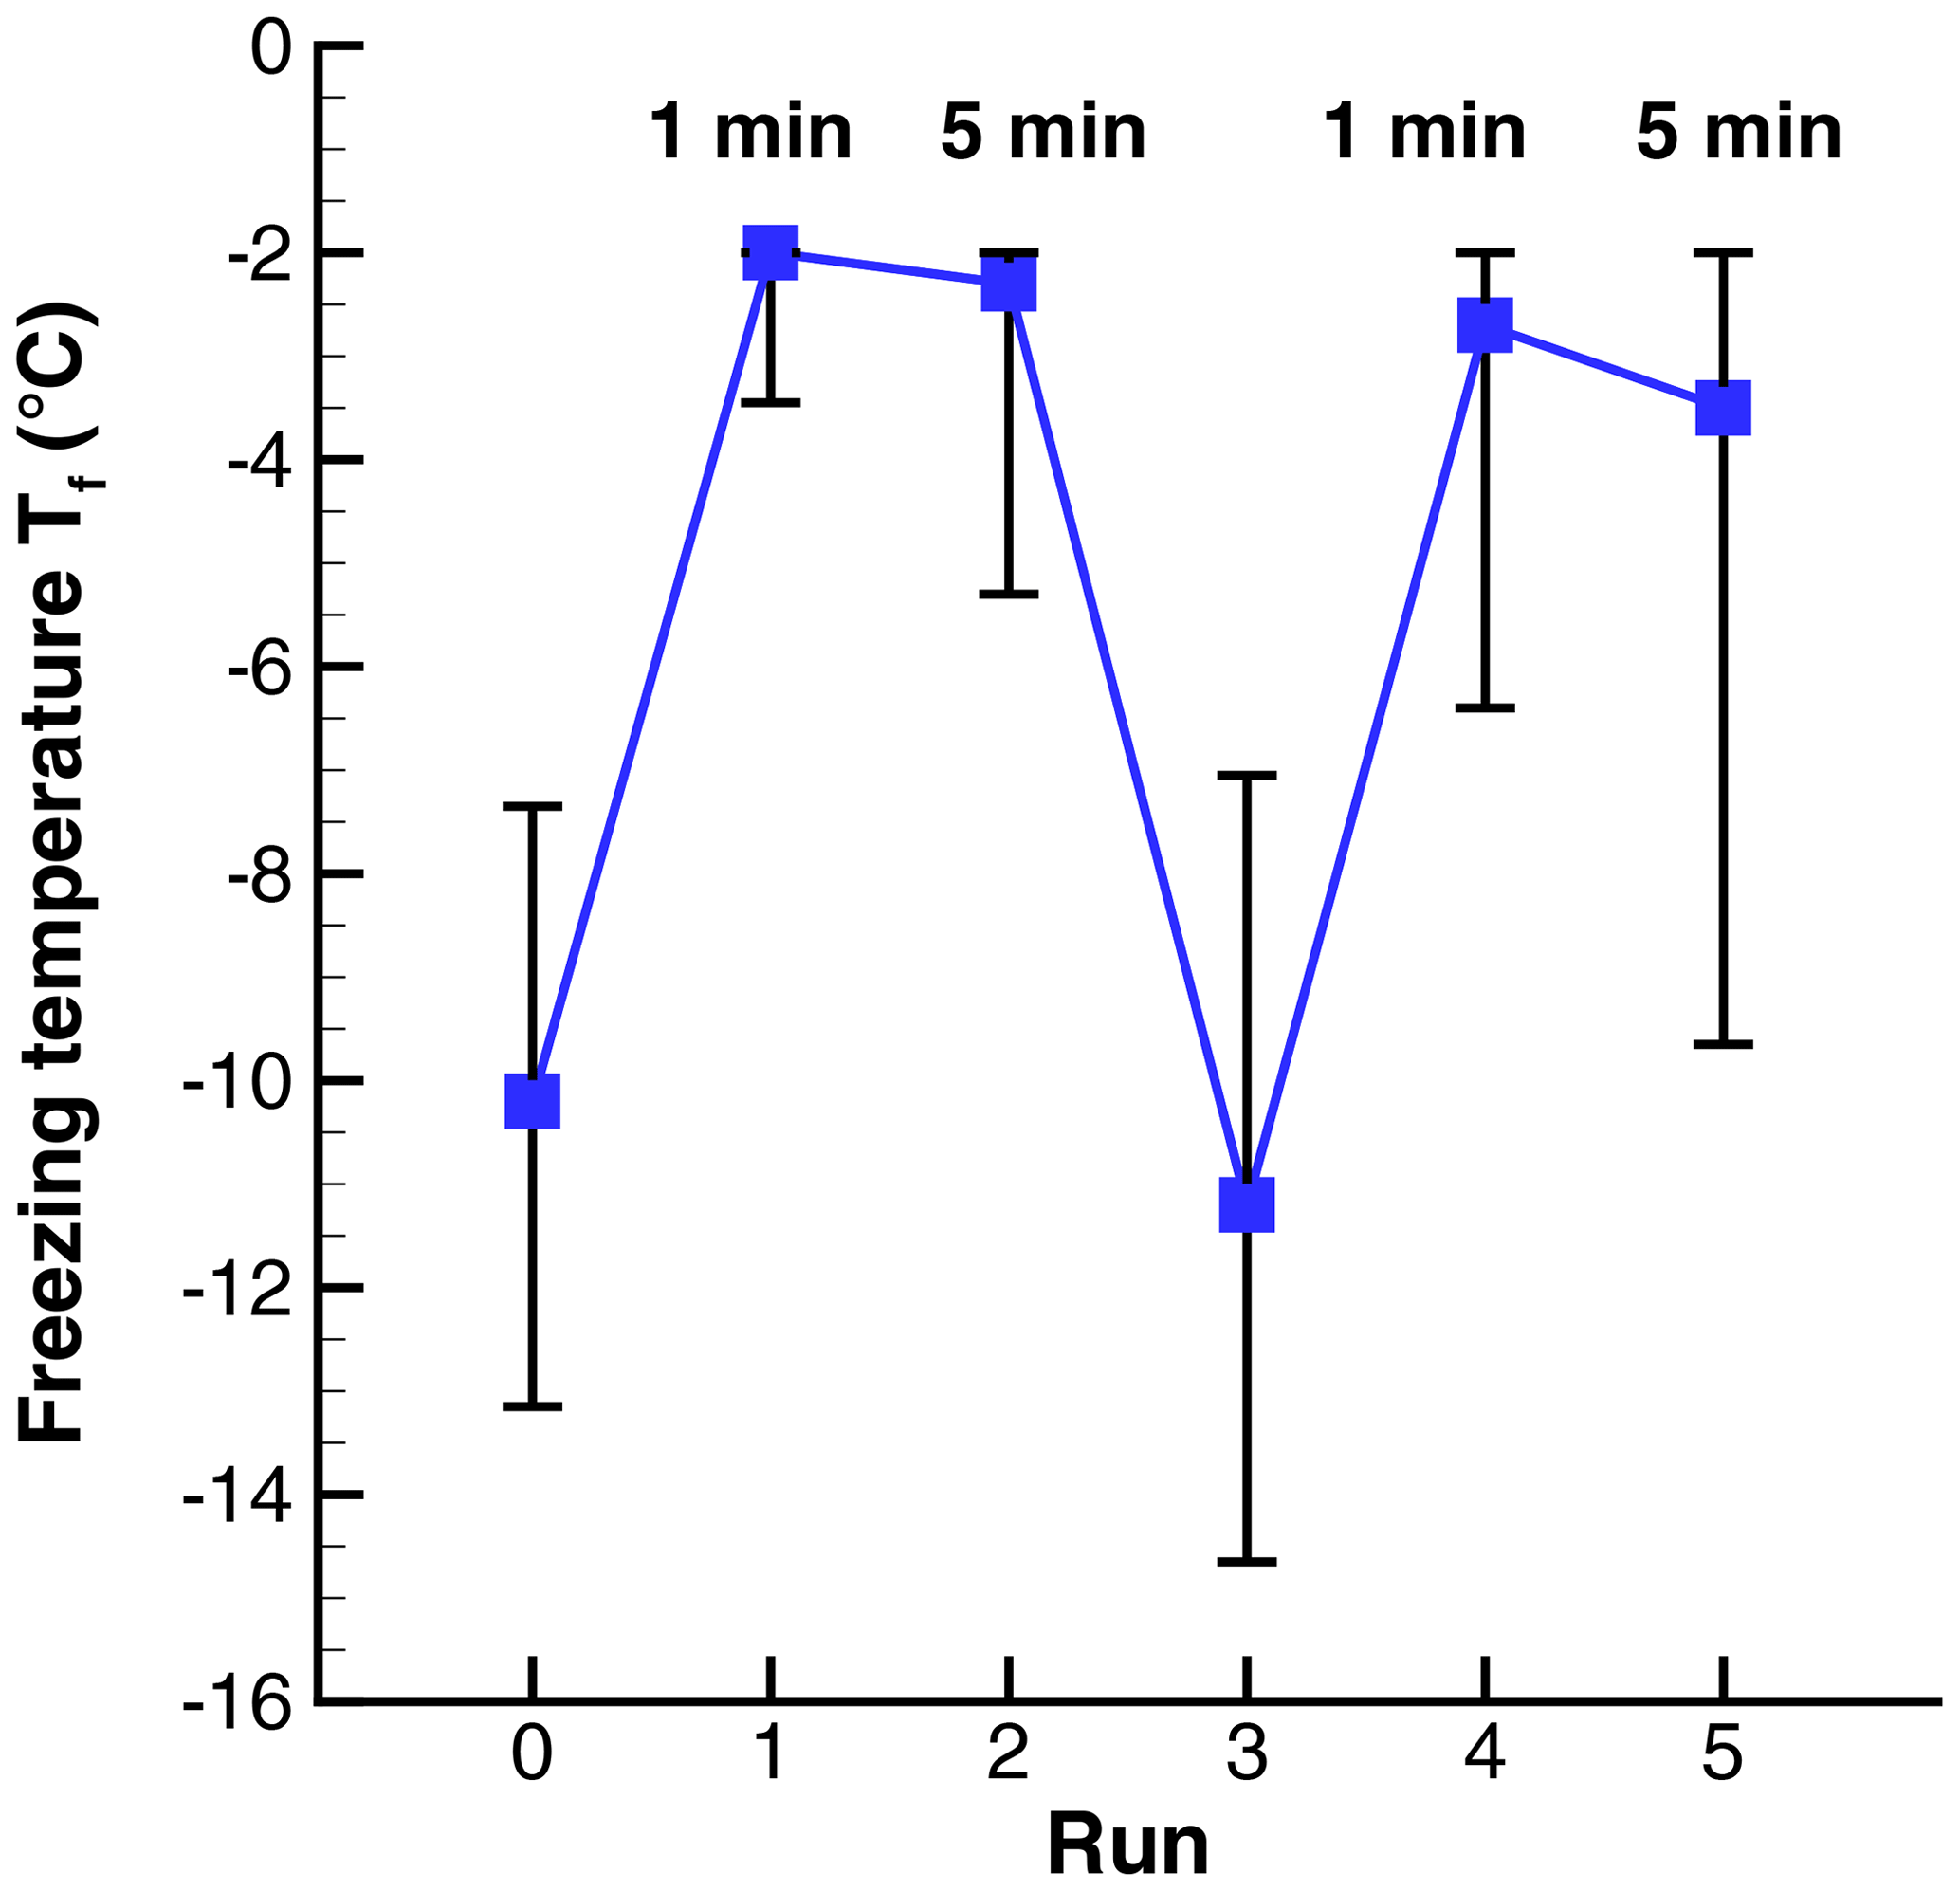
Figure 7Freezing temperatures in a sequence of runs with 1 and 5 min holding times at ∘C. The 50th percentile is indicated by symbols, and the vertical lines show the 5th- and 95th-percentile values.
Mean temperatures for the six runs were −10.2, −2.3, −2.8, −11.1, −3.3, and −4.4∘C. The large changes from room temperature to ∘C (runs 0 to 1 and runs 3 to 4) show a strong PFN effect. The difference between runs with 1 or 5 min at the warm limit is 0.5 ∘C for the first pair and 1.1 ∘C for the second pair. Small as these differences are, a test of the difference of means (Blank, 1980; Sect. 20.4) show that they are statistically significant to better than 0.01 %. This result shows that longer time in the liquid state, at Tw, tends to lower , but within the small range of times tested PFN is exhibited nearly equally.
A better appreciation of the change with time exposure can be gained from looking at the frequency distributions of the changes in Tf, as shown in Fig. 8. Most of the changes are small in the first pair of runs (1 to 2) but are larger for the second set (4 to 5). There are positive and negative changes, the positive ones indicating a higher Tf after 5 min than after 1 min at the warm limit. The 90 % ranges were 0.6 to −2.5 ∘C in the first pair and +1.45 to −6.0 ∘C for the second pair. This type of scatter in the way Tf changes for individual drops is seen in all runs and will be examined further in the next section.
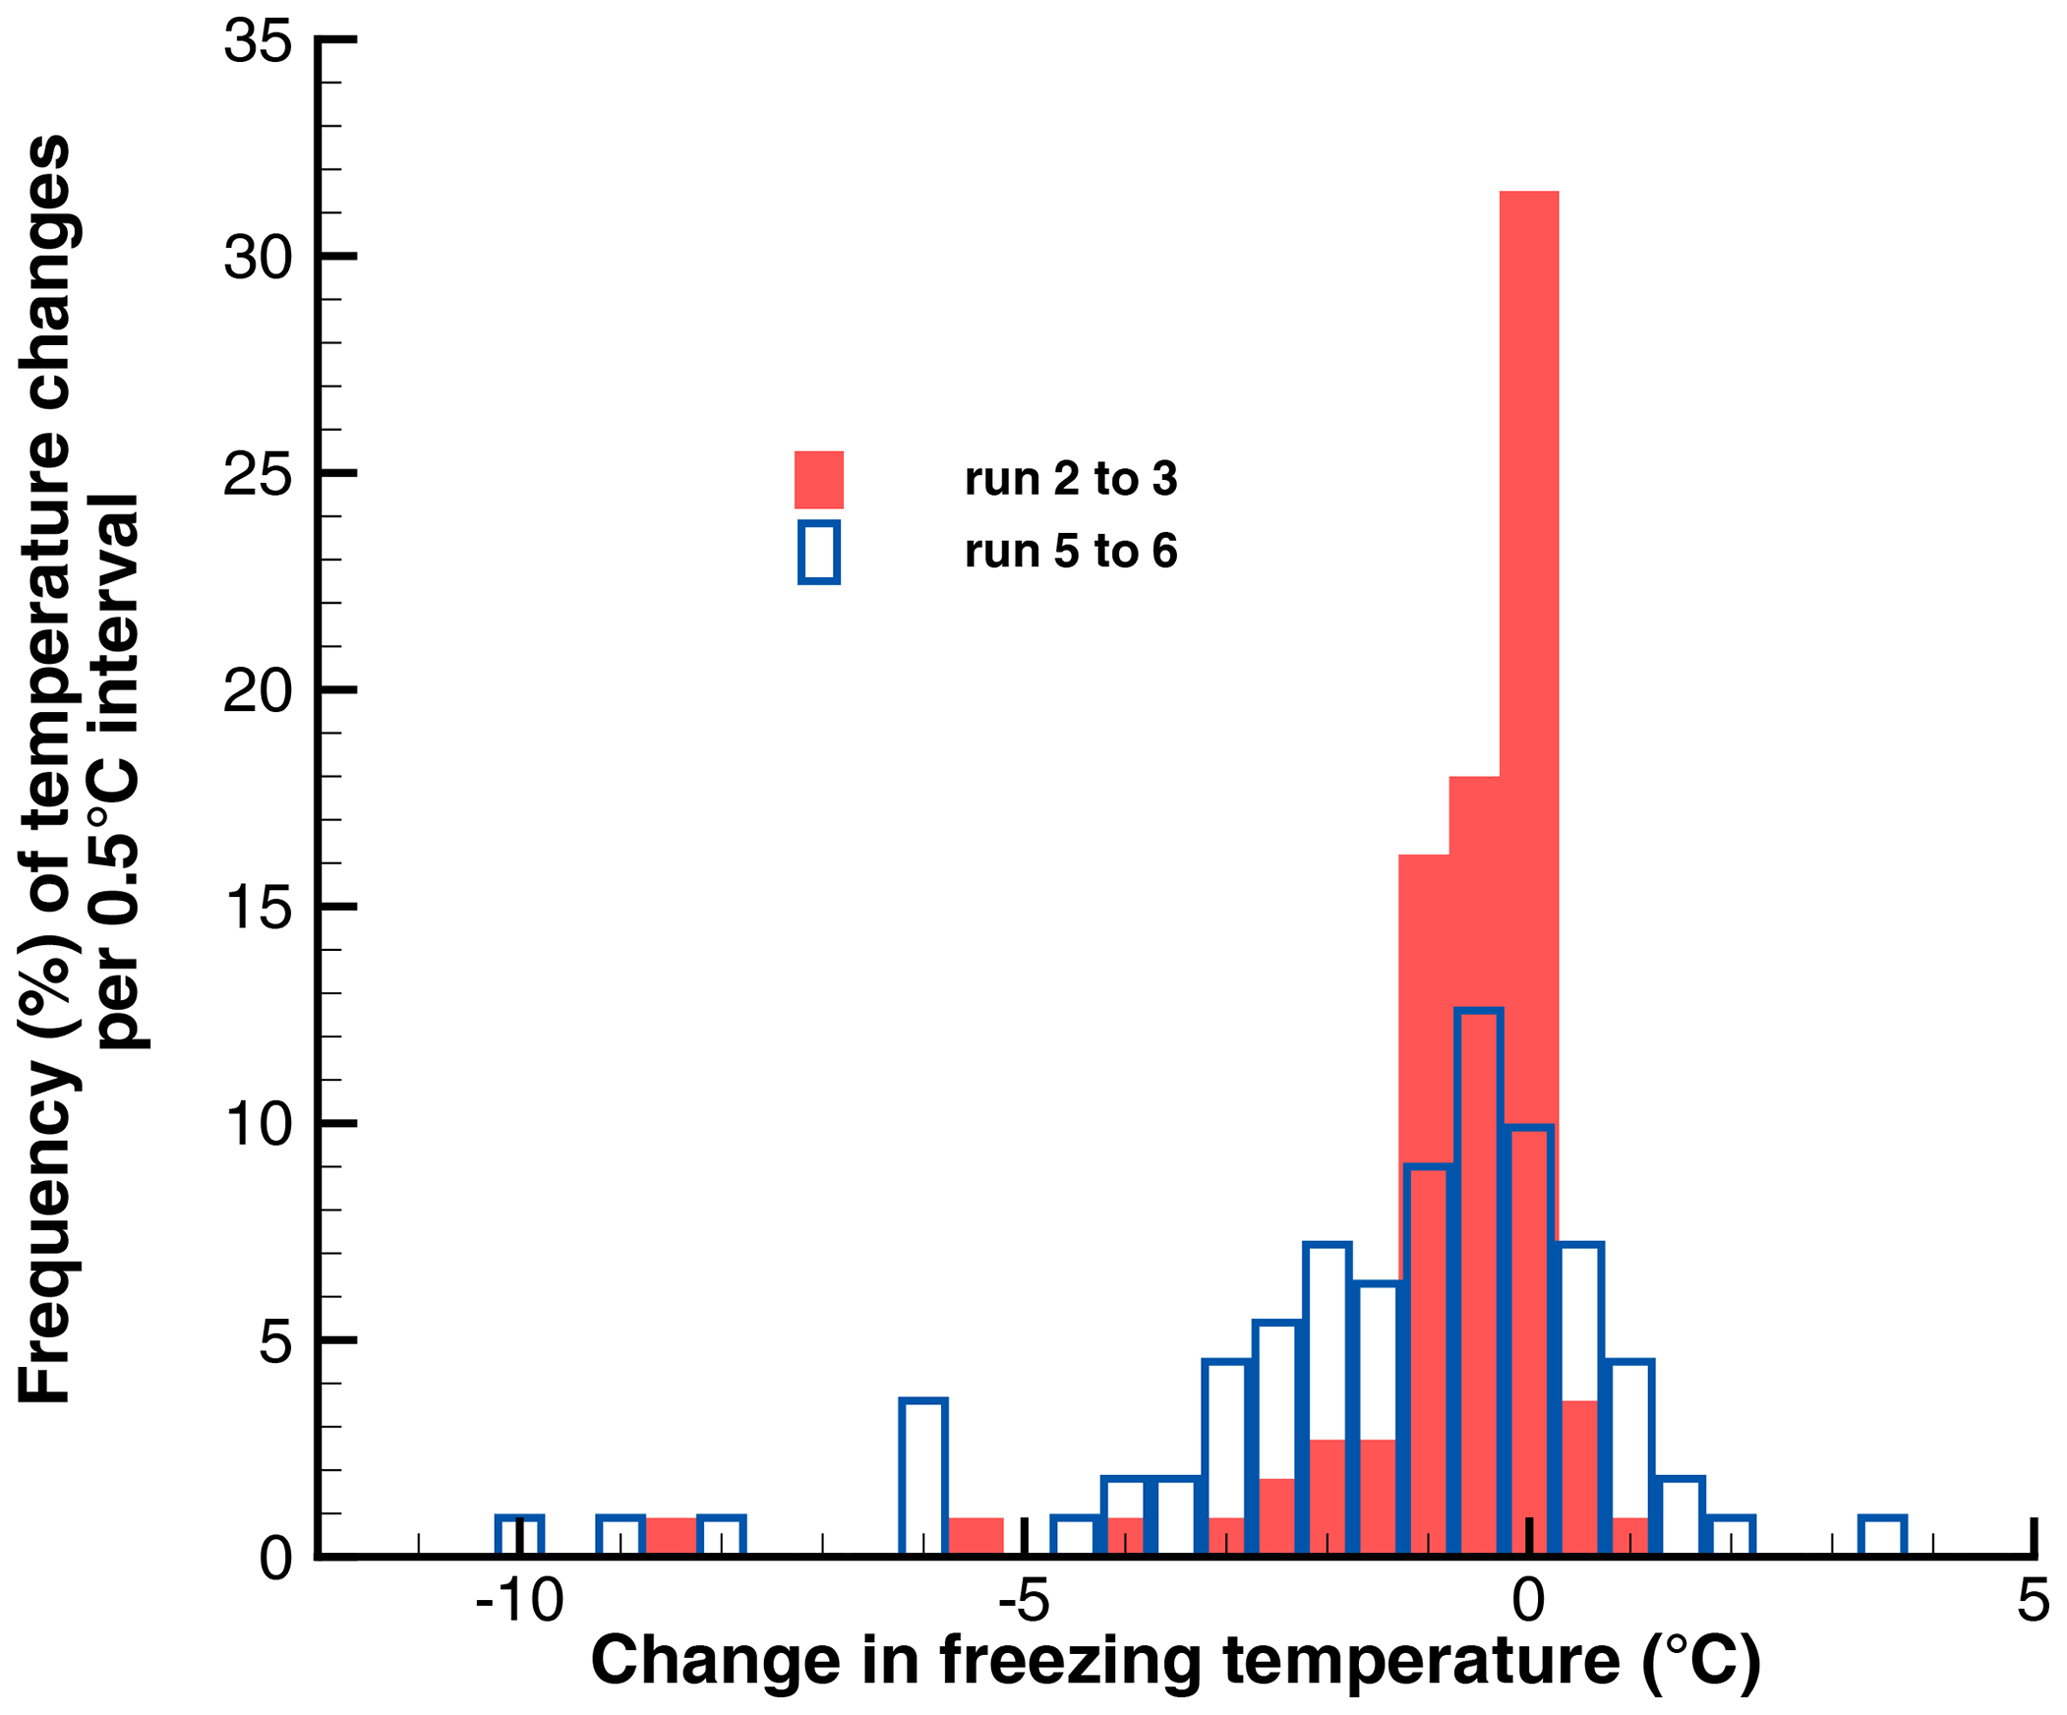
Figure 8Histograms of the changes in the freezing temperatures of drops between runs with 1 and 5 min at ∘C.
4.4 Variability and repeatability of nucleation temperatures with HgI2
It has already been noted that there is considerable variation among drops in how they respond to the various sequences of PFN tests. Since that variability is a potential indication of what the underlying process is for the PFN phenomenon, some of the manifestations of that variability are illustrated in the following, with a focus on the sequences of for individual drops. As detailed in Sect. 3.1, each drop was certain to contain a large number of particles of HgI2, assuring good statistical equivalence from that point of view. Even so, there are considerable differences in freezing temperatures among drops. This makes it clear that the nucleation events in each drop are linked to rare particles or parts thereof.
In all of the following, repeatability refers to multiple nucleation events of a drop within a range of ≈1 to 2 ∘C. Such repeatability is, of course, significant only when it is in contrast with a much larger range of freezing temperatures for the full sample set of drops.
4.4.1 Run-to-run correlations
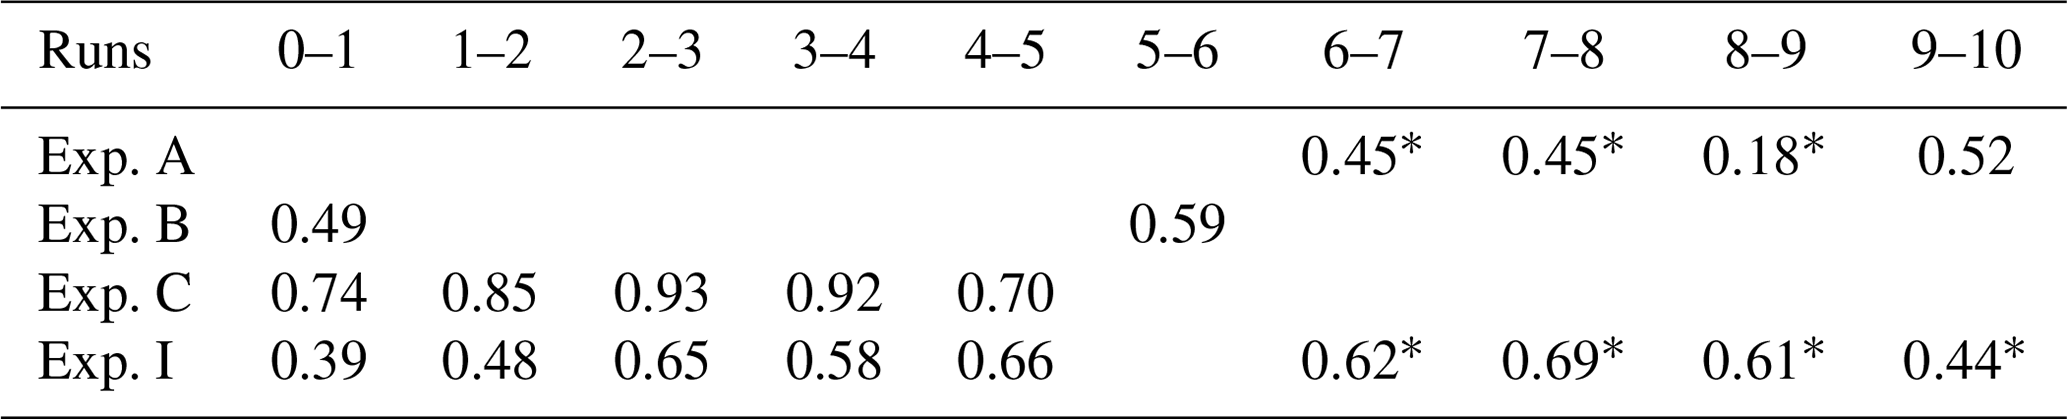
In the current experiments, run-to-run correlations of freezing temperatures can not be meaningfully evaluated for experiments with strong PFN, and hence a small range of values, since the range of freezing temperatures in these runs is only about twice the precision of the temperature data. Only for runs with higher warm limits or with reasonably large spreads in freezing temperatures is this analysis possible. For selected pairs of runs, correlation coefficients are given in Table 3. These correlation are generally weak. The highest values are for Exp. C, probably because of the relatively flat spectrum for this experiment (see Fig. 2). Exp. I (to be described in Sect. 4.4.2) is included in this table for completeness; runs 0 to 5 were with Tw=10 ∘C, and runs 6 to 10 were with Tw=1.5 ∘C.
Table 3Correlation coefficients for selected pairs of runs. Values with an asterisk are for runs involving PFN.
In addition to the correlations, individual drop histories are a revealing way to examine the variability or repeatability of freezing temperatures. The “spiderweb” diagram in Fig. 9 shows sequences of freezing temperatures for individual drops in Exp. A. The spread of Tf values in the initial run is also represented in the spectra shown in Fig. 2. The rise in after ∘C brings all drops to a narrow range. That range starts to spread, with smaller and larger excursions, in subsequent runs. Beyond ∘C large positive and large negative changes are evident. In the region between and +6 ∘C, some drops retain freezing temperatures near the highest values while others drop to lower values. Some of these latter values return to high Tf in subsequent runs.
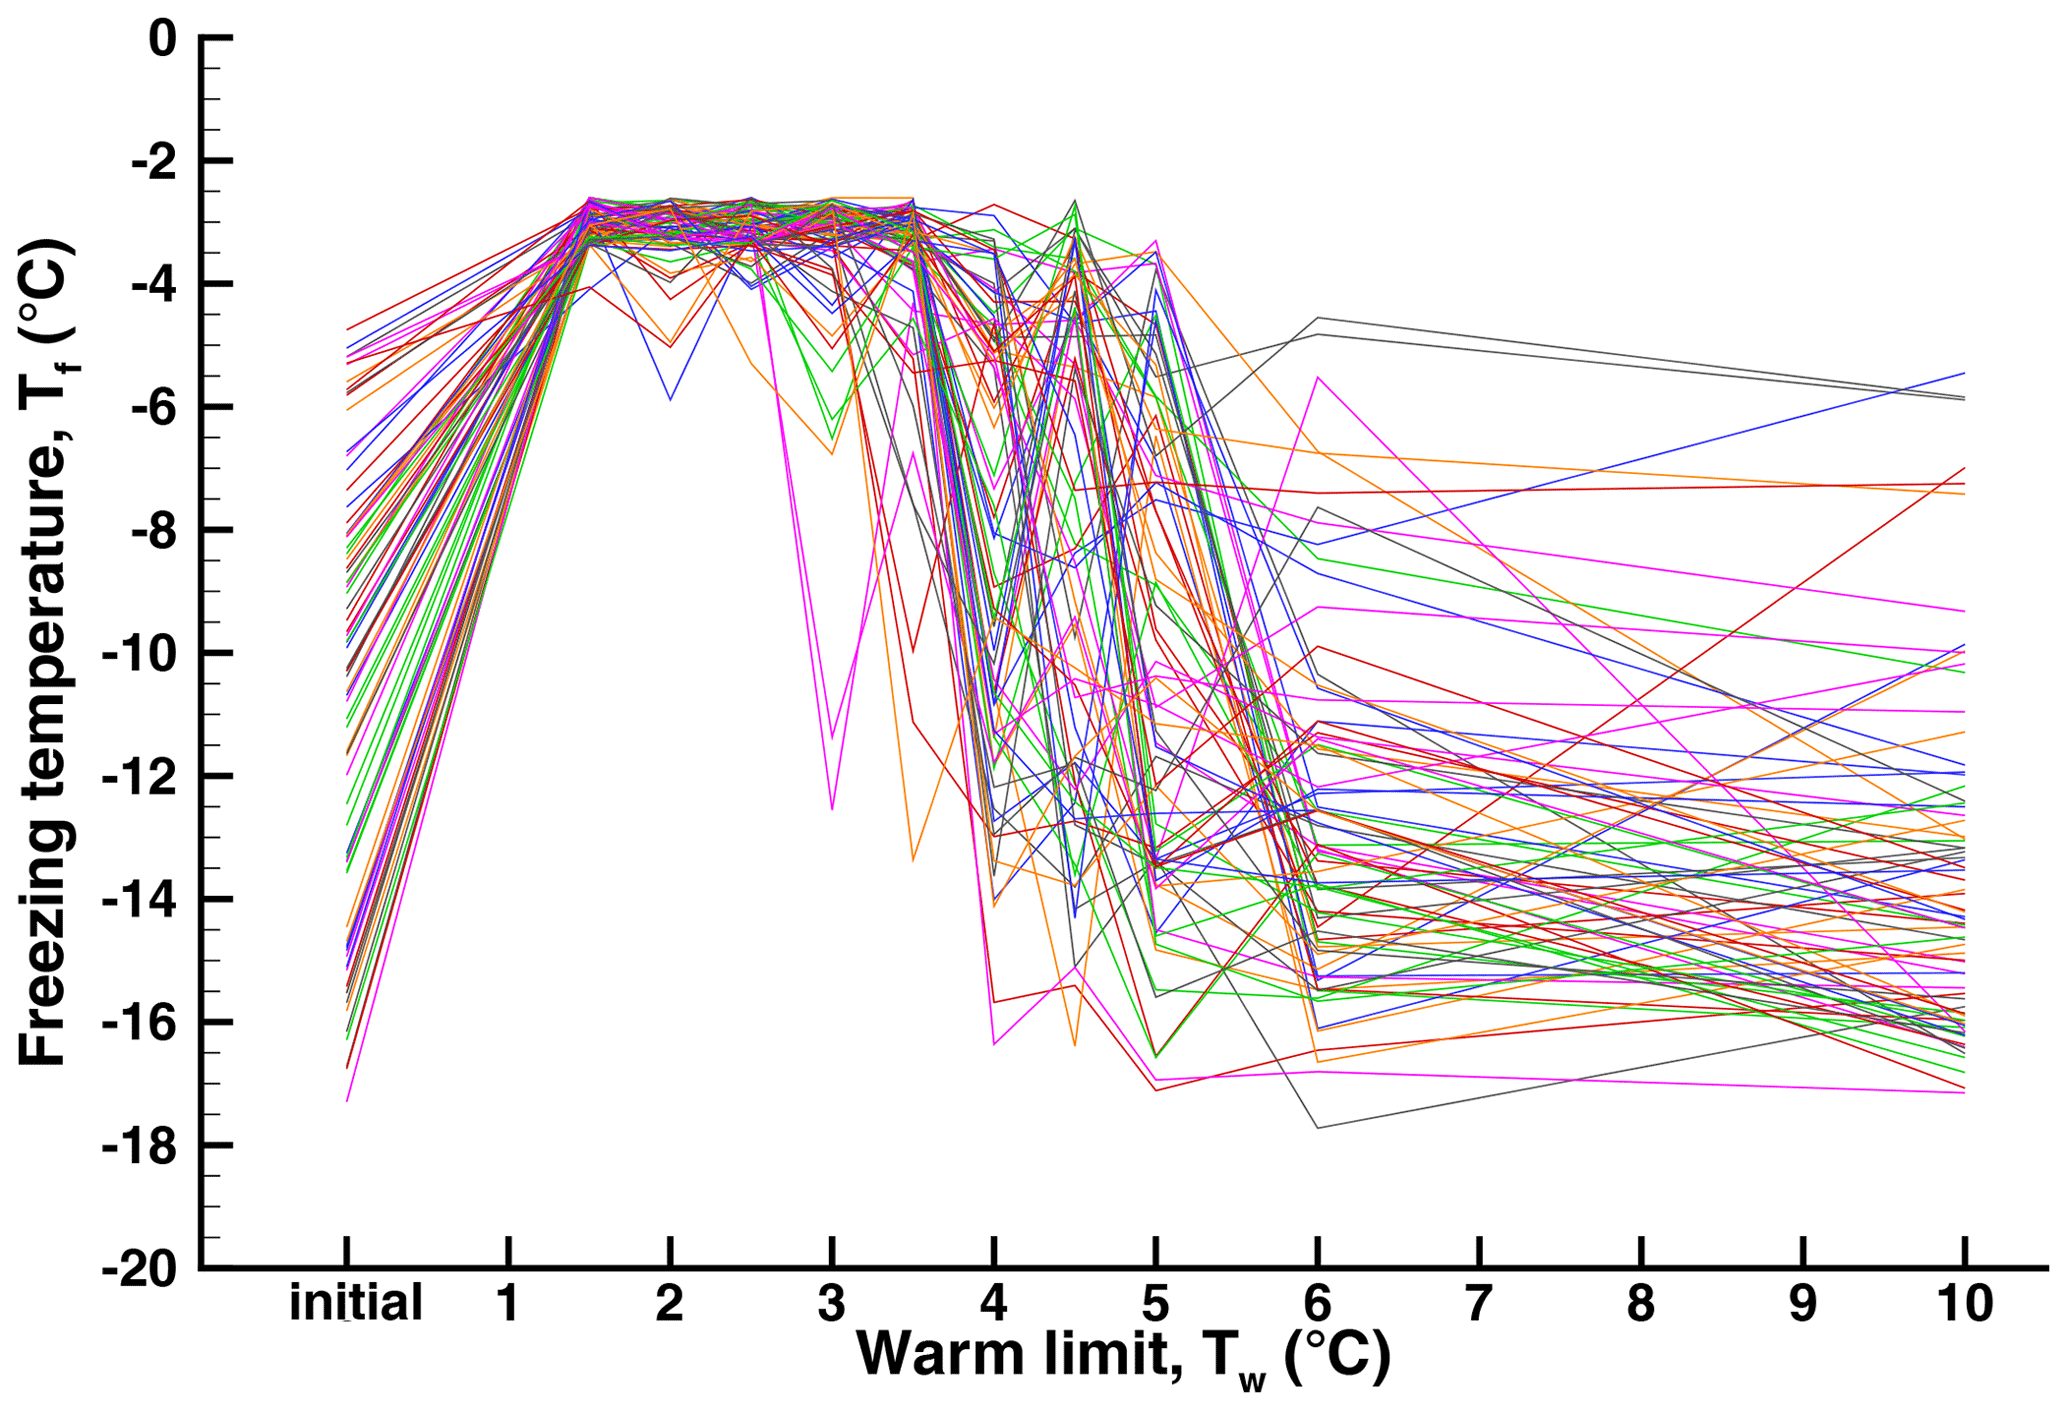
Figure 9Spiderweb diagram of individual drop histories for the sequence of runs with increasing warm limits in Exp. A. A statistical representation of these observations is given in Fig. 3.
To illustrate the degree of variation in the changes in freezing temperatures, frequency distributions of these changes are shown in Fig. 10 for the four runs where the relaxation of PFN begins. Changes of the mean temperatures were −0.42, −0.27, −3.9, and −0.13 ∘C. Gradually increasing spread is seen in addition to a shift to negative values for the pair to +4.0 ∘C. This histogram reflects the significant losses in pre-activation for the increase in Tw. Changes remain centered on 0 for the last pair, to +4.5 ∘C, but with changes of up to ±10 ∘C in magnitude.

Figure 10Histograms of the changes in freezing temperatures between successive pairs of runs in Exp. A.
Spiderweb diagrams are shown in Figs. 11 and 12 for Exp. B and Exp. C. The overall pattern of high PFN is evident for ∘C in both cases. The large variability in freezing temperatures from run to run for given drops is also evident in both cases. An extreme example is seen in Fig. 11 (Exp. B) with one drop falling to a low Tf for and +3 ∘C. There is a similar, smaller magnitude event for two drops at ∘C in Fig. 9 but with the high PFN regained after a low freezing temperature. The evidence points to the possibility that PFN may be regained after a new cycle of freezing and heating to above 0 ∘C even after a previous cycle in which there was less or no enhancement.
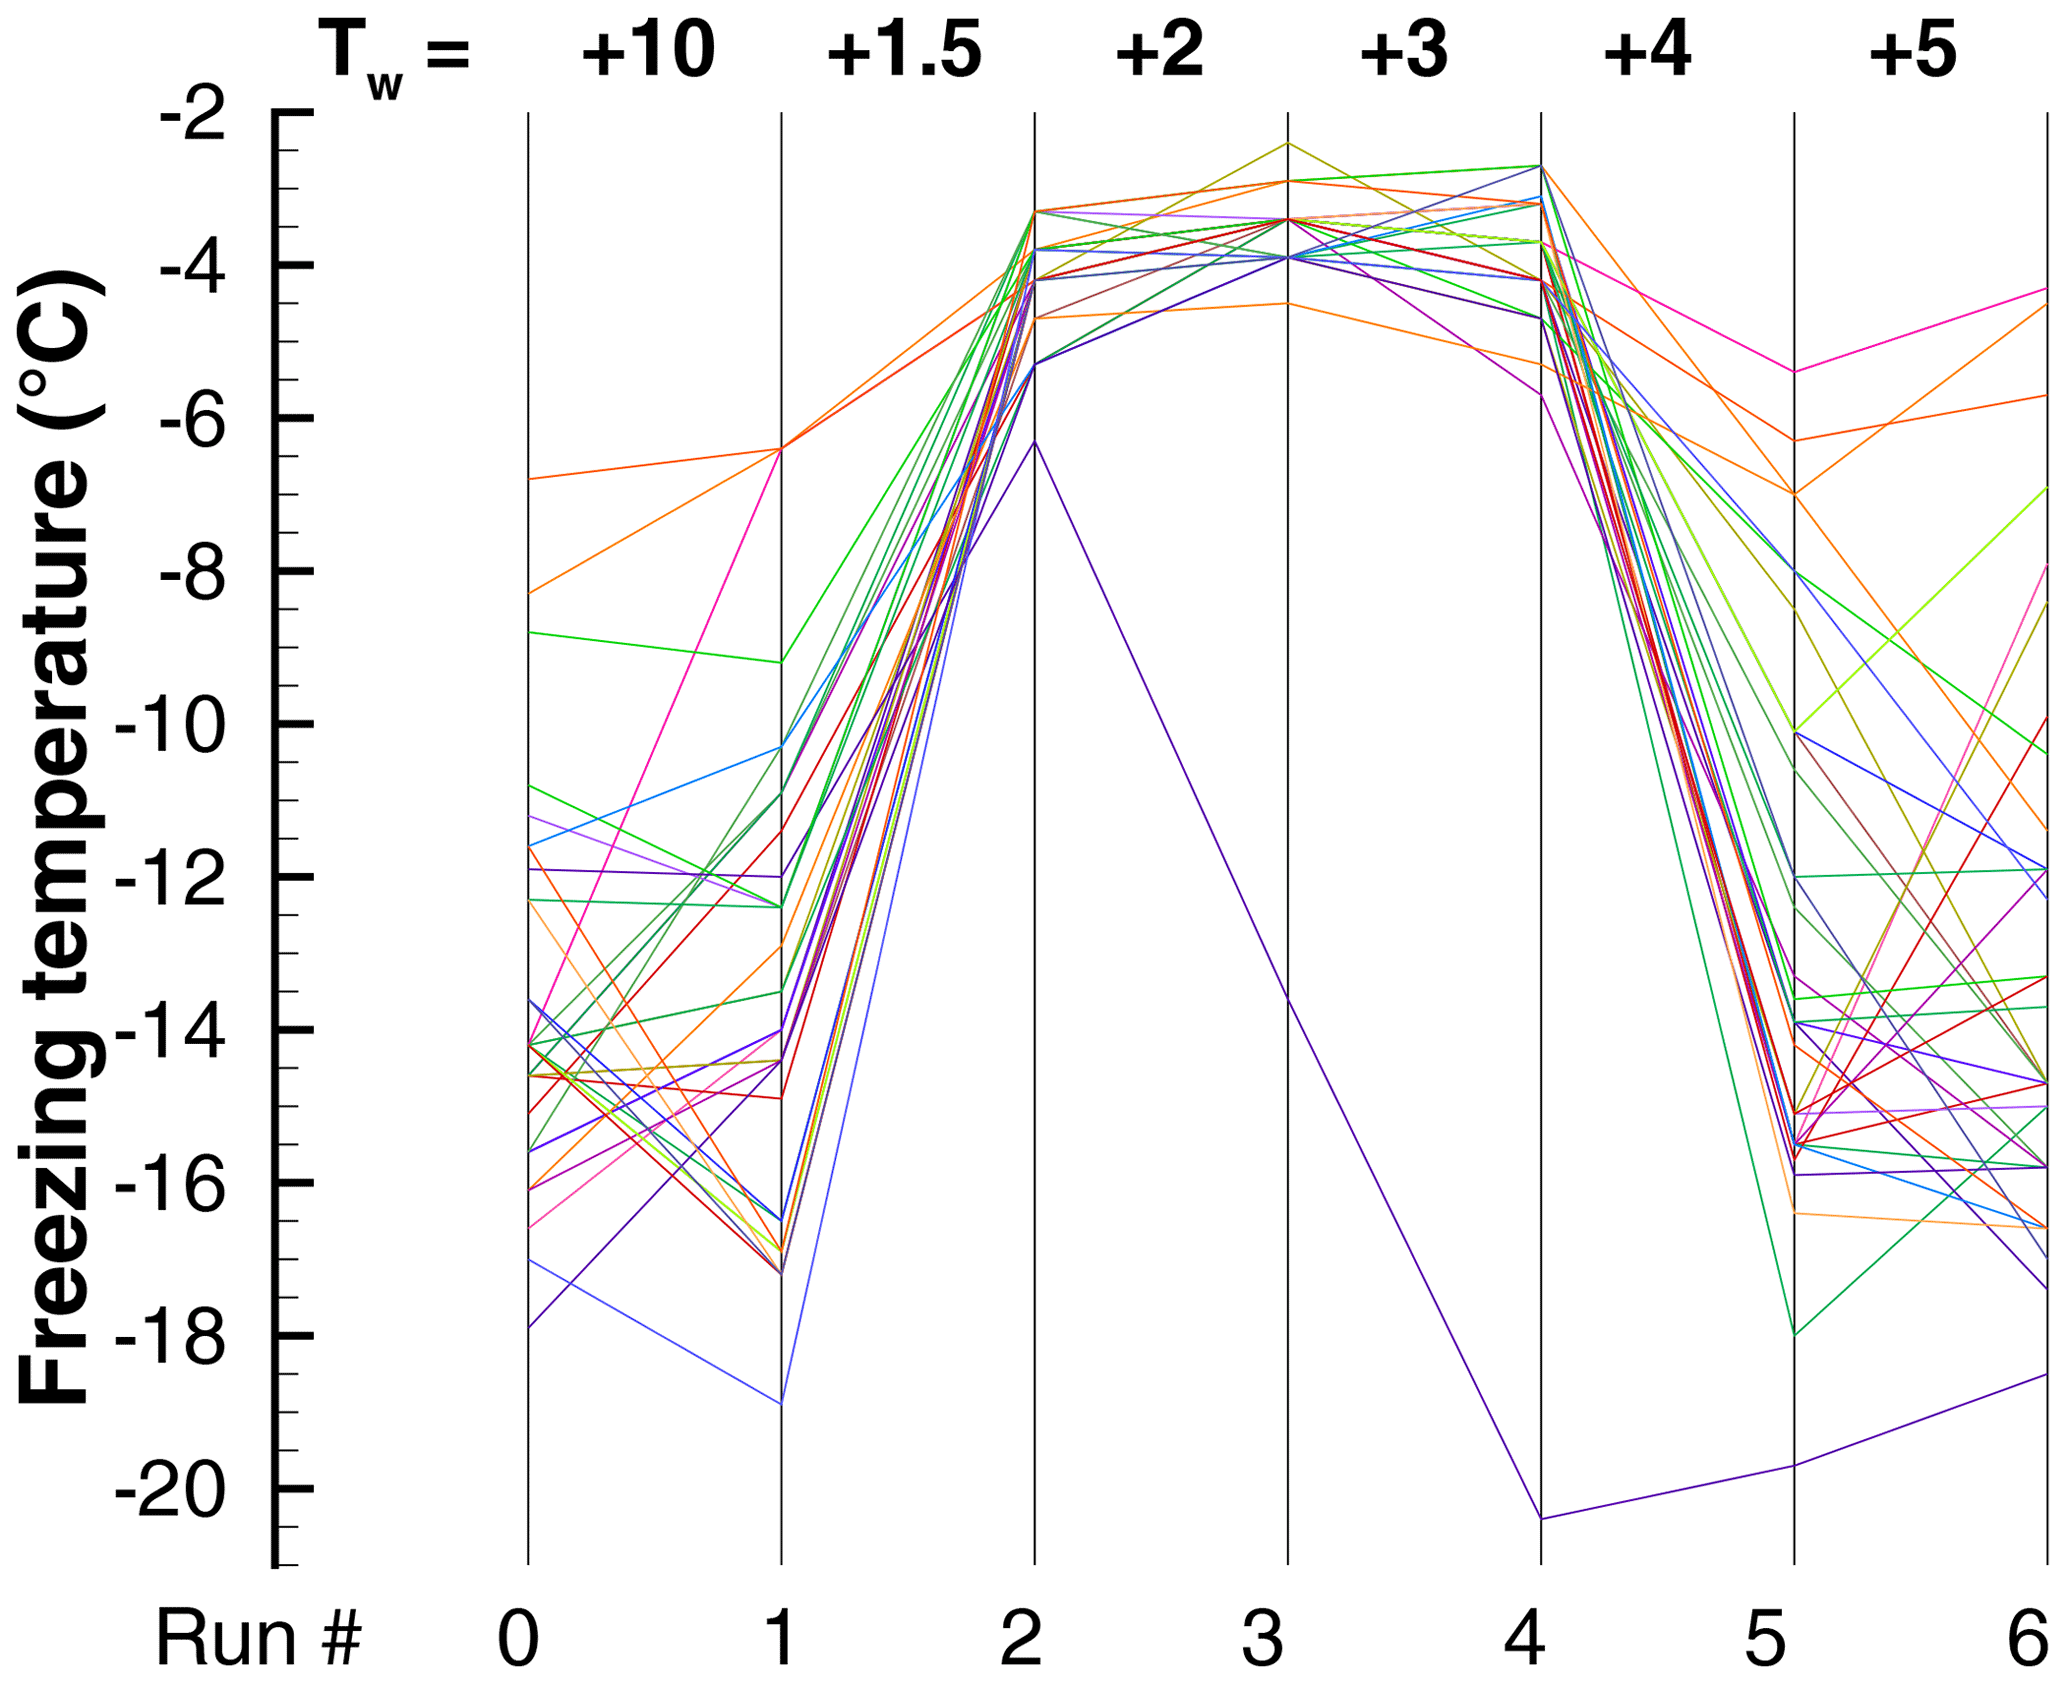
Figure 11Spiderweb diagram of individual drop histories for the sequence of runs with increasing warm limits in Exp. B. A statistical representation of these observations is given in Fig. 4.

Figure 12Spiderweb diagram of individual drop histories for the sequence of runs with decreasing warm limits in Exp. C. A statistical representation of these observations is given in Fig. 5.
4.4.2 Sequence of runs with high and low values of the warm limit
Perhaps the best data set for examining the repeatability of the nucleation events are the series of runs (Exp. I) in which a warm limit well above the transition value, ∘C, was repeated for five runs, followed by five runs with ∘C. The observed ranges of freezing temperatures are shown in Fig. 13 in the format used for other experiments.
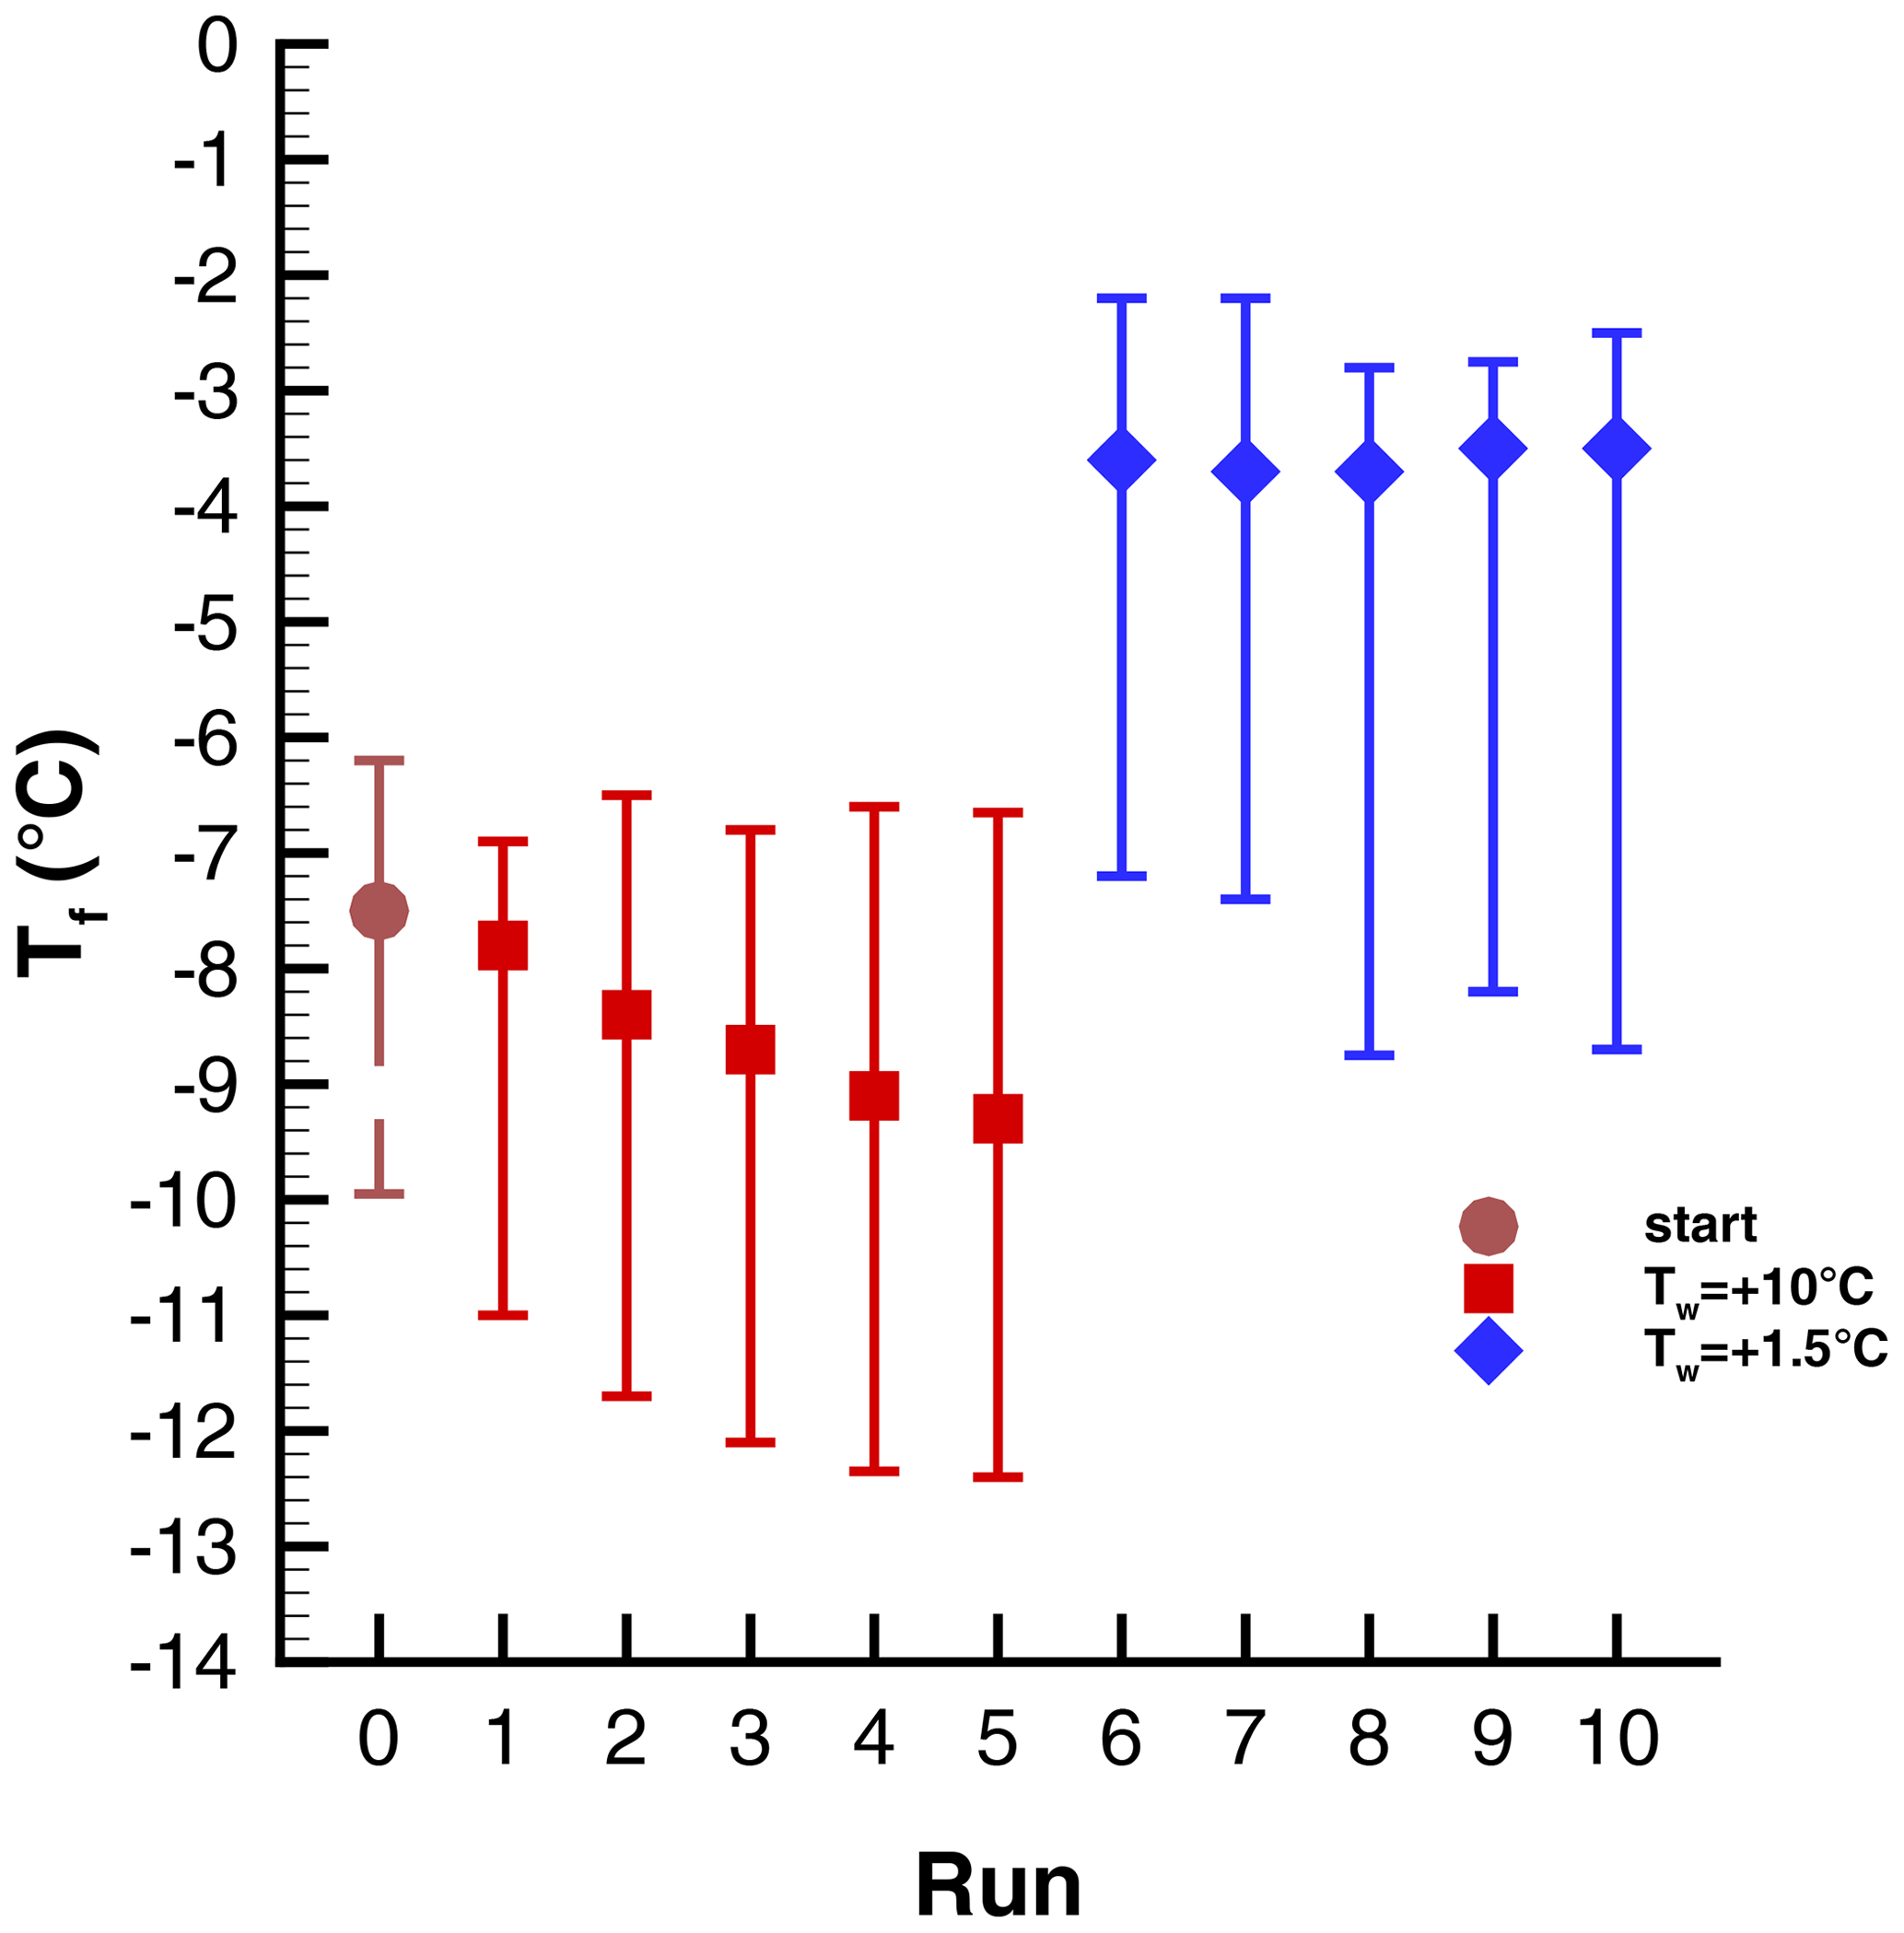
Figure 13Range of freezing temperatures in Exp. I consisting of a sequence of runs with high and low warm limits. The 50th percentile is indicated by symbols and the vertical lines show the 10th- and 90th-percentile values.
The difference between the two halves of the experiment stands out quite clearly. The difference for the two different warm limits is ∘C. This increase with PFN is less than the corresponding change of 10.5 ∘C in Exp. A (Sect. 4.2), probably because the initial activity was already higher than in that experiment (see Fig. 2).
Gradual decreases with time are evident in the mean freezing temperatures. For the first five runs this is −0.3 ∘C per run, and for the last five runs it is −0.08 ∘C per run. Decreases for individual drops have considerable spreads: the 10th- to 90th-percentile values for the run-to-run changes are −2.3 and +1.7 ∘C for the runs with ∘C and −2.0 and +1.9 for the runs following ∘C.
Data from this experiment lend themselves well to examining the correlation between pairs of runs because there is a reasonably large spread in for the ∘C runs. Correlation coefficients for successive pairs of the these runs are 0.62, 0.69, 0.61, and 0.44. The values for ∘C are 0.48, 0.65, 0.58, and 0.66. These latter values are comparable to those observed in Exp. A and B but are lower than those seen in Exp. C (see Table 3).

Figure 14Freezing temperatures of 68 drops in Exp. I. The first five points (square symbols) in each panel are for runs 1…5 with ∘C, and the last five points (diamond symbols) are for runs 6…10 with ∘C.
A full appreciation of the great variety in the way freezing temperatures of different drops change from run to run is best gained from a display of freezing temperatures for each drop in Fig. 14. As a first observation, it can be noted that in spite of the large difference in between the two halves of the sequence, some drops show very little discernible PFN. Examples of this are drops 1, 36, 43, and 66. On the other hand, 36 out of the 68 drops have ∘C for ∘C, while there are none for the runs with the higher Tw.
A considerable variety of patterns can be discerned in the sequences. Many sequences contain irregular jumps, but in many more some regular patterns can be seen. Monotonic increases and decreases exist over three or four runs, perhaps with gaps. Some sequences appear to be arcs. The lack of a uniform response for all drops poses a major quandary for explaining the results. Quantitating these patterns and distinguishing between random variations and perceived patterns are evidently not easy and, due to the small number of runs, one can expect the strength of any test be limited. Nonetheless, these signatures, and similar ones seen in all other experiments, are the only available indicators of the stability of nucleating sites (or lack thereof). The following analyses are directed to this aim.
The meaning of run-to-run correlations (see Table 3) with r values near 0.6 for this experiment is somewhat ambiguous in itself. A stronger signal emerges in comparison with randomized freezing temperatures. Randomization tests were performed by re-ordering the observed freezing temperatures of drops according to a sequence created by placing random numbers in an increasing order. For Exp. I, the Tf values were scrambled for runs 2, 3, 4, and 5 from the first group and for runs 7, 8, 9, and 10 from the second group (see Fig. 13) for comparisons with runs 1 and 6, respectively. The correlation coefficients using these scrambled runs dropped to between −0.2 and +0.1 for both the +10 and +1.5 ∘C runs. On this basis, the actual correlation coefficients near r=0.6 acquire significance as indications of repeatability. This seems to hold for freezing with or without PFN.
Another characterization of the individual drop sequences was made by fitting linear equations to the five points corresponding to each of the two warm limits. The means of the slopes of the these lines are −0.33 and −0.13 for the two groups but with considerable scatter about the mean; standard deviations are 0.64 and 0.65 for the two groups. As a measure of the degree of scatter in Tf, the mean of the absolute deviations (“absdev” for short) from the fitted lines was determined for each warm limit and each drop. The mean values of these parameters are ∘C and ∘C. The values for ∘C have clear temperature dependence ranging from 0.35 for drops with ∘C to 1.4 for drops with ∘C.
The means and standard deviations of absdev for the two groups are 0.74 and 0.39 and 0.68 and 0.61, respectively. After randomization, these values became 1.13 and 0.56 and 1.14 and 0.6, respectively. Lesser scatter for the actual data than in the randomized runs reinforces the indication of non-random patterns in Tf.
4.4.3 Alternately high and low warm limits
Data in the preceding section provide some evidence that freezing temperatures of some drops remain fairly constant in repeated cycles with ∘C. In addition, some drops showed a return to high after a much lower value in an intermediate run (see Sect. 4.2). To further examine this, two experiments (Exp. G and H) were carried out with alternate cycles of ∘C and ∘C. Observed ranges of freezing temperatures for four repetitions of the cycle are shown for Exp. H in Fig. 15. The results for Exp. G were similar.
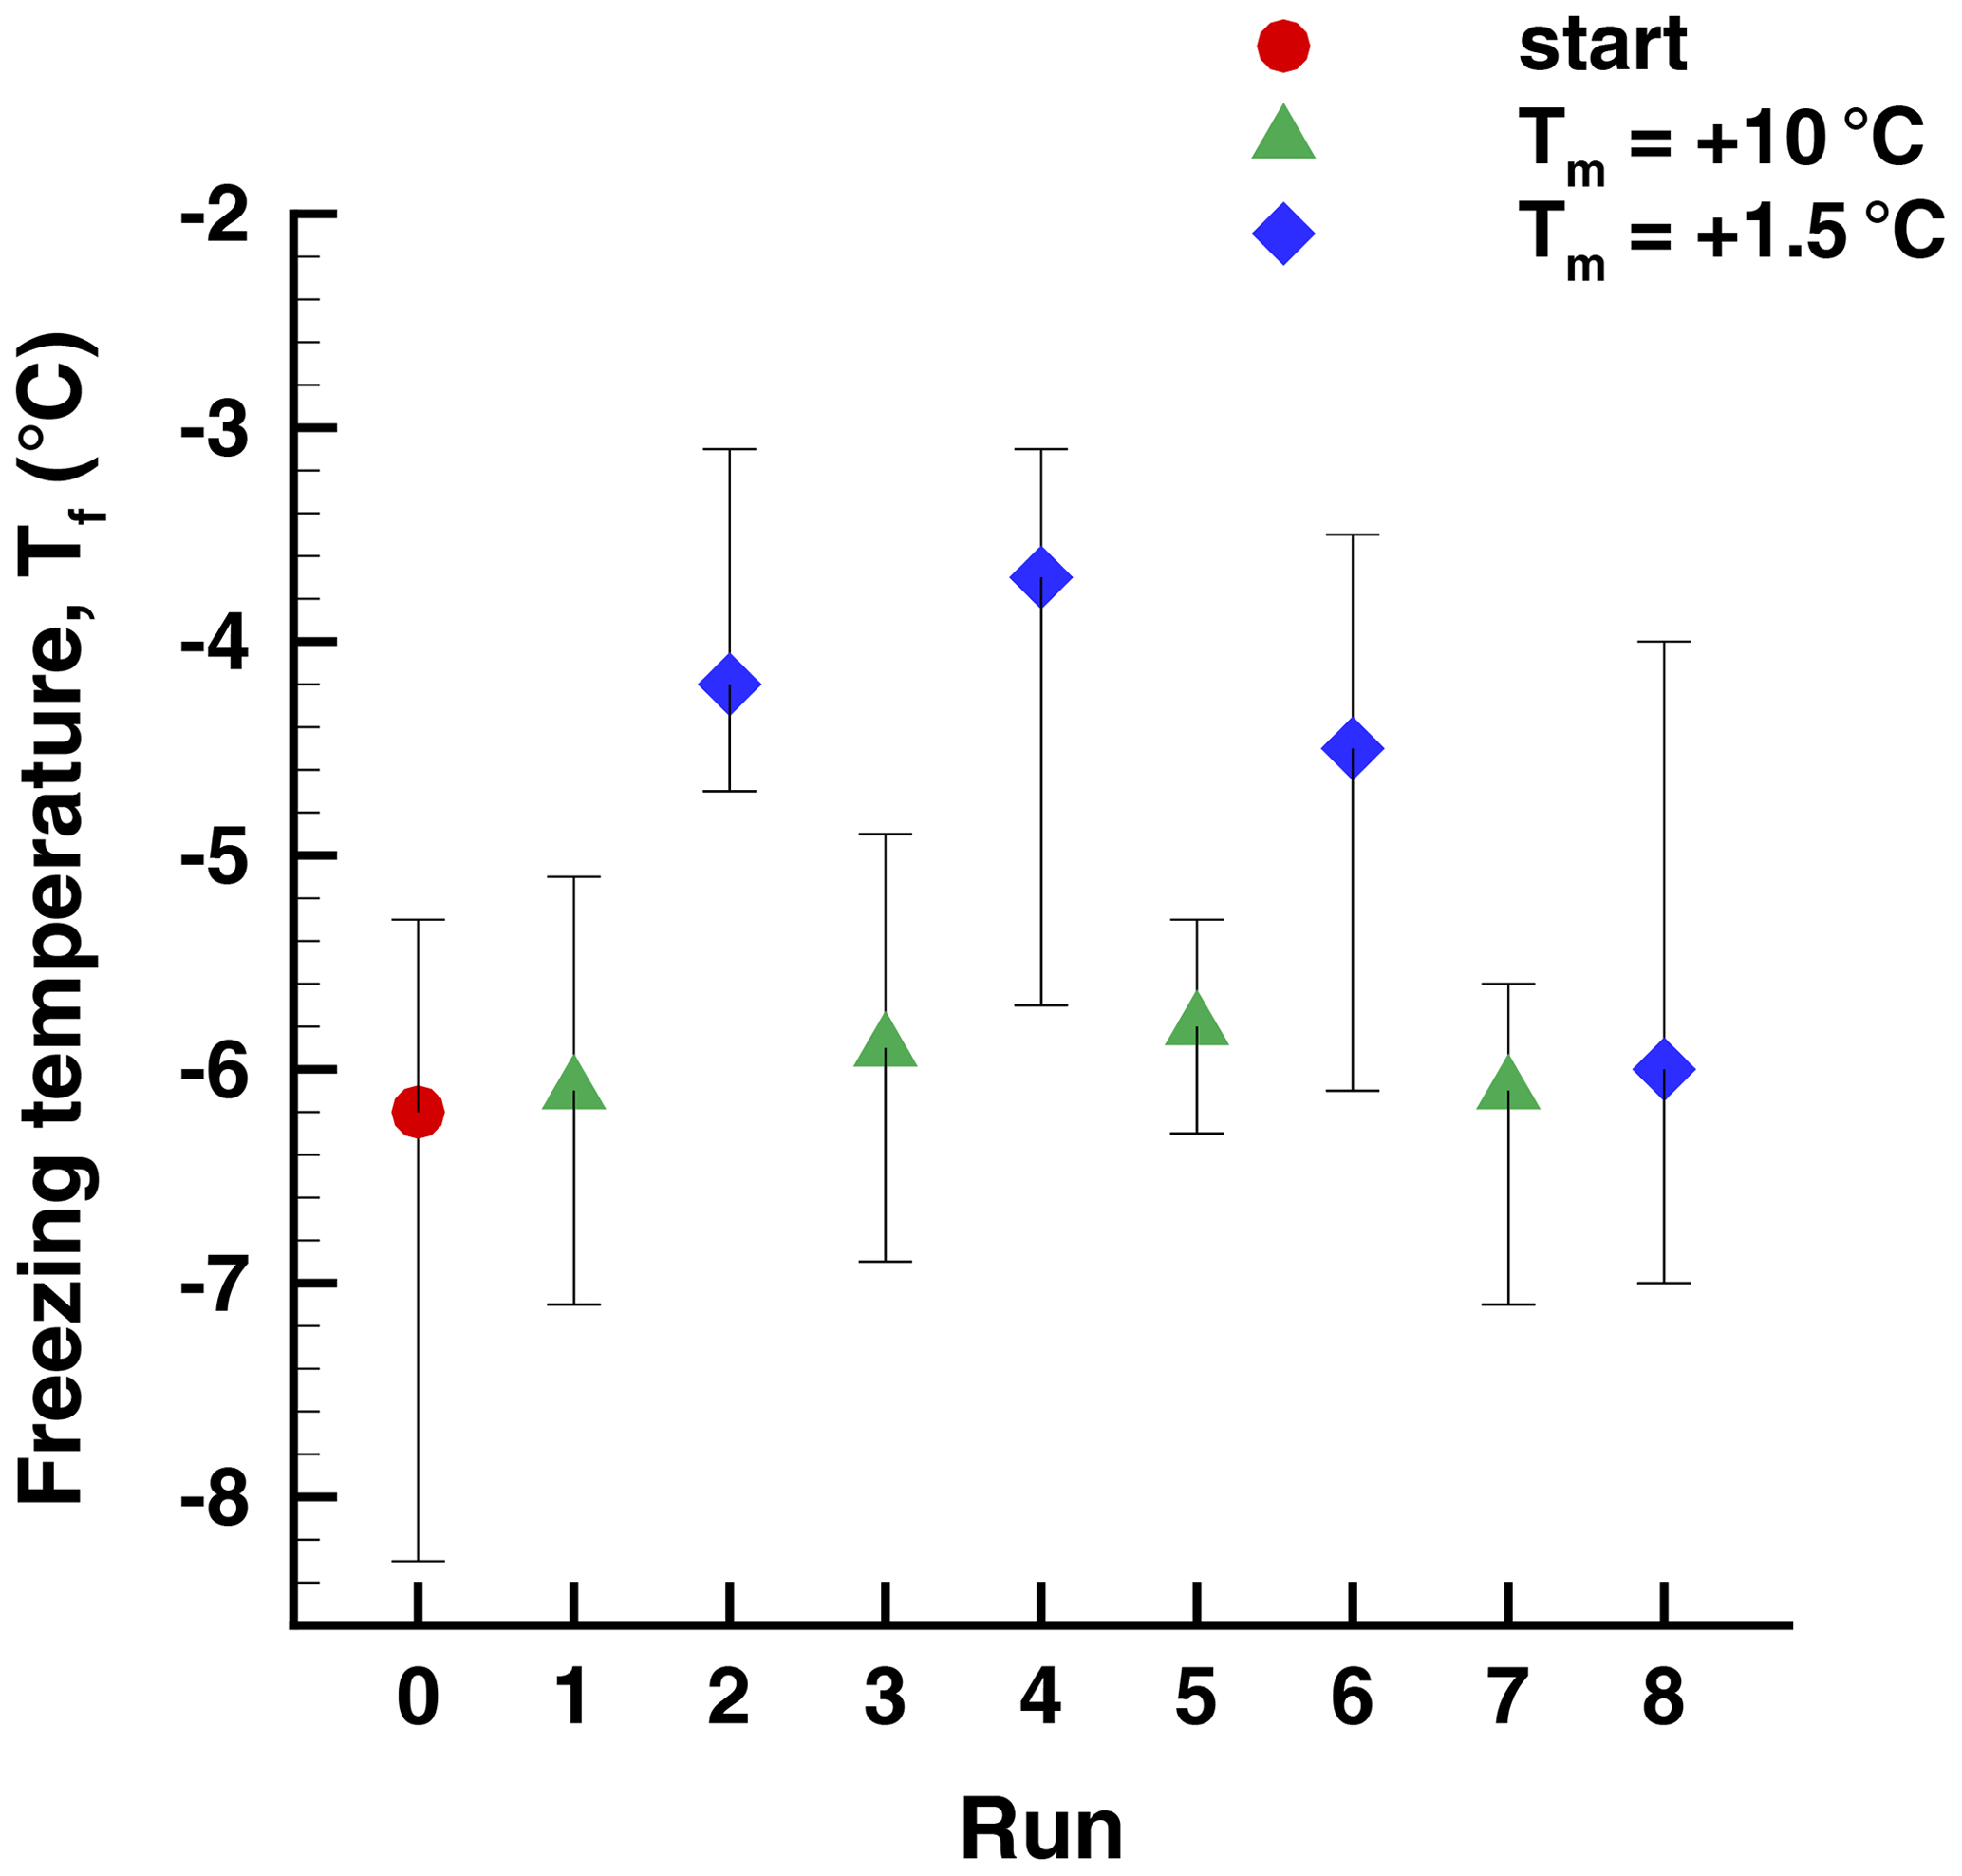
Figure 15Freezing temperatures in a sequence of runs (Exp. H) with alternating high and low warm limits, Tw. The 50th percentile is indicated by the symbols, and the vertical lines show the 5th- and 95th-percentile values.
The average difference for all four pairs of +10 and +1.5 runs in Exp. H is only 1.4 ∘C. The difference is statistically meaningful to better than a 1 % significance level according to a test of differences of means (Blank, 1980; Sect. 20.4). The largest difference of means is 2.0 ∘C for the second pair of runs. These are clear but smaller signatures of PFN than seen in other experiments. For individual drops, the 90 % range of changes is −0.40 to +3.15 ∘C; 90 % of the drops showed positive changes. Changes in between one run and the next with the same ∘C are spread over a range of ±7.3 ∘C. This large variability is different from the comparable value of ±2 ∘C for Exp. I (Sect. 4.4.2).
The large variability notwithstanding, even this series has some examples of patterns of repetition for individual drops as shown for six cases in Fig. 16. There are indications for freezing temperatures to repeat or to change in systematic ways. It is noteworthy that the patterns of changes for the two sets of Tw appear to be independent of one another. A set of traces for drops from Exp. G are shown in Fig. 17. Similar patterns of changes are seen here, again showing persistence in in spite of intermediate cycles with a Tw above the value for retaining PFN.
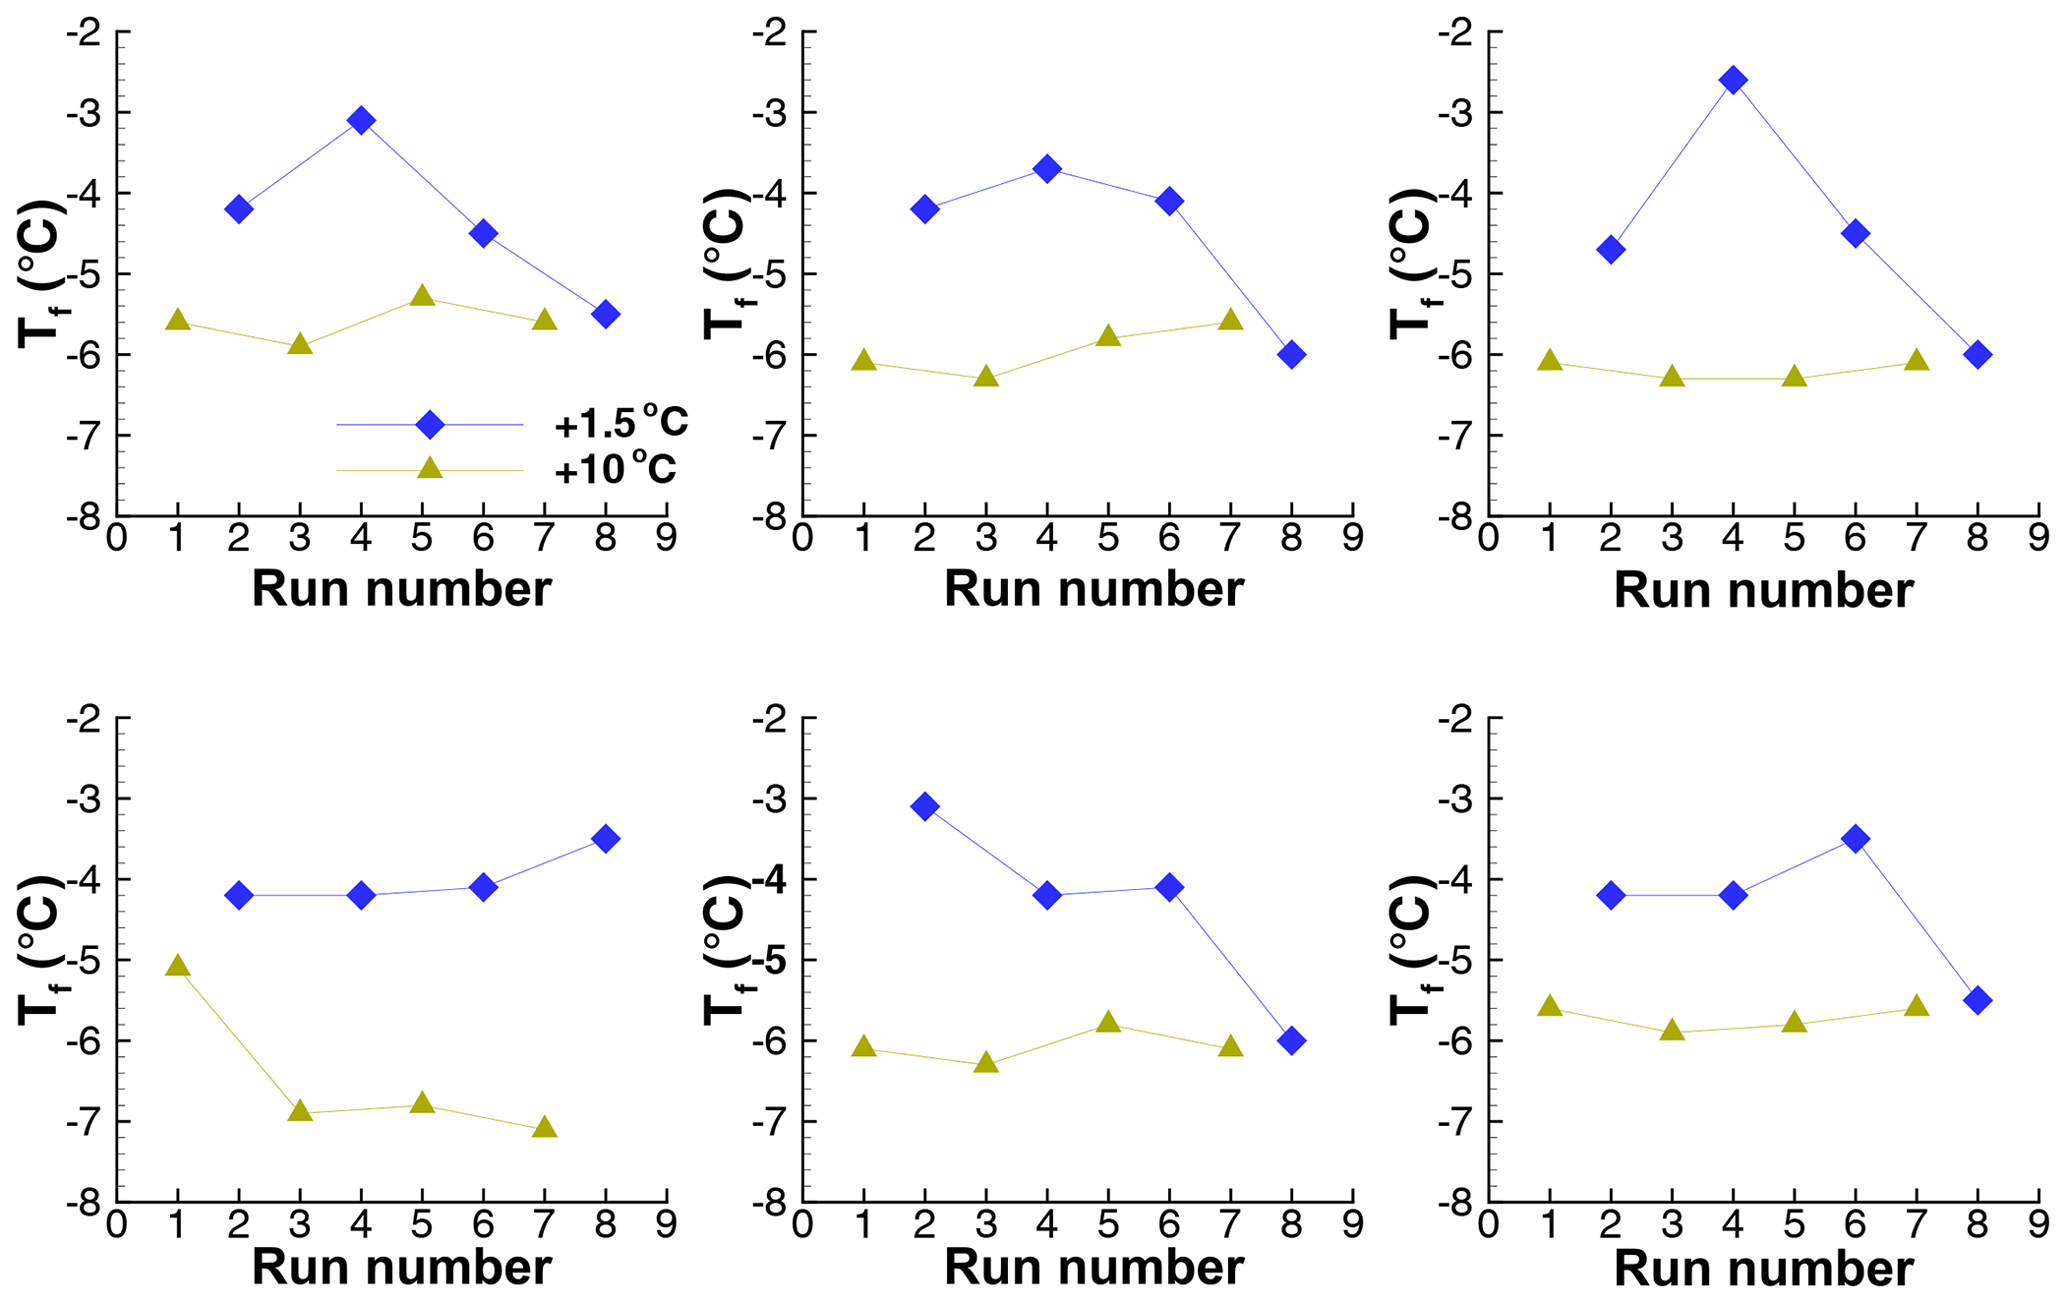
Figure 16Sequences of freezing temperatures for drop numbers 67, 68, 73, 77, 90, and 96 in Exp. H.
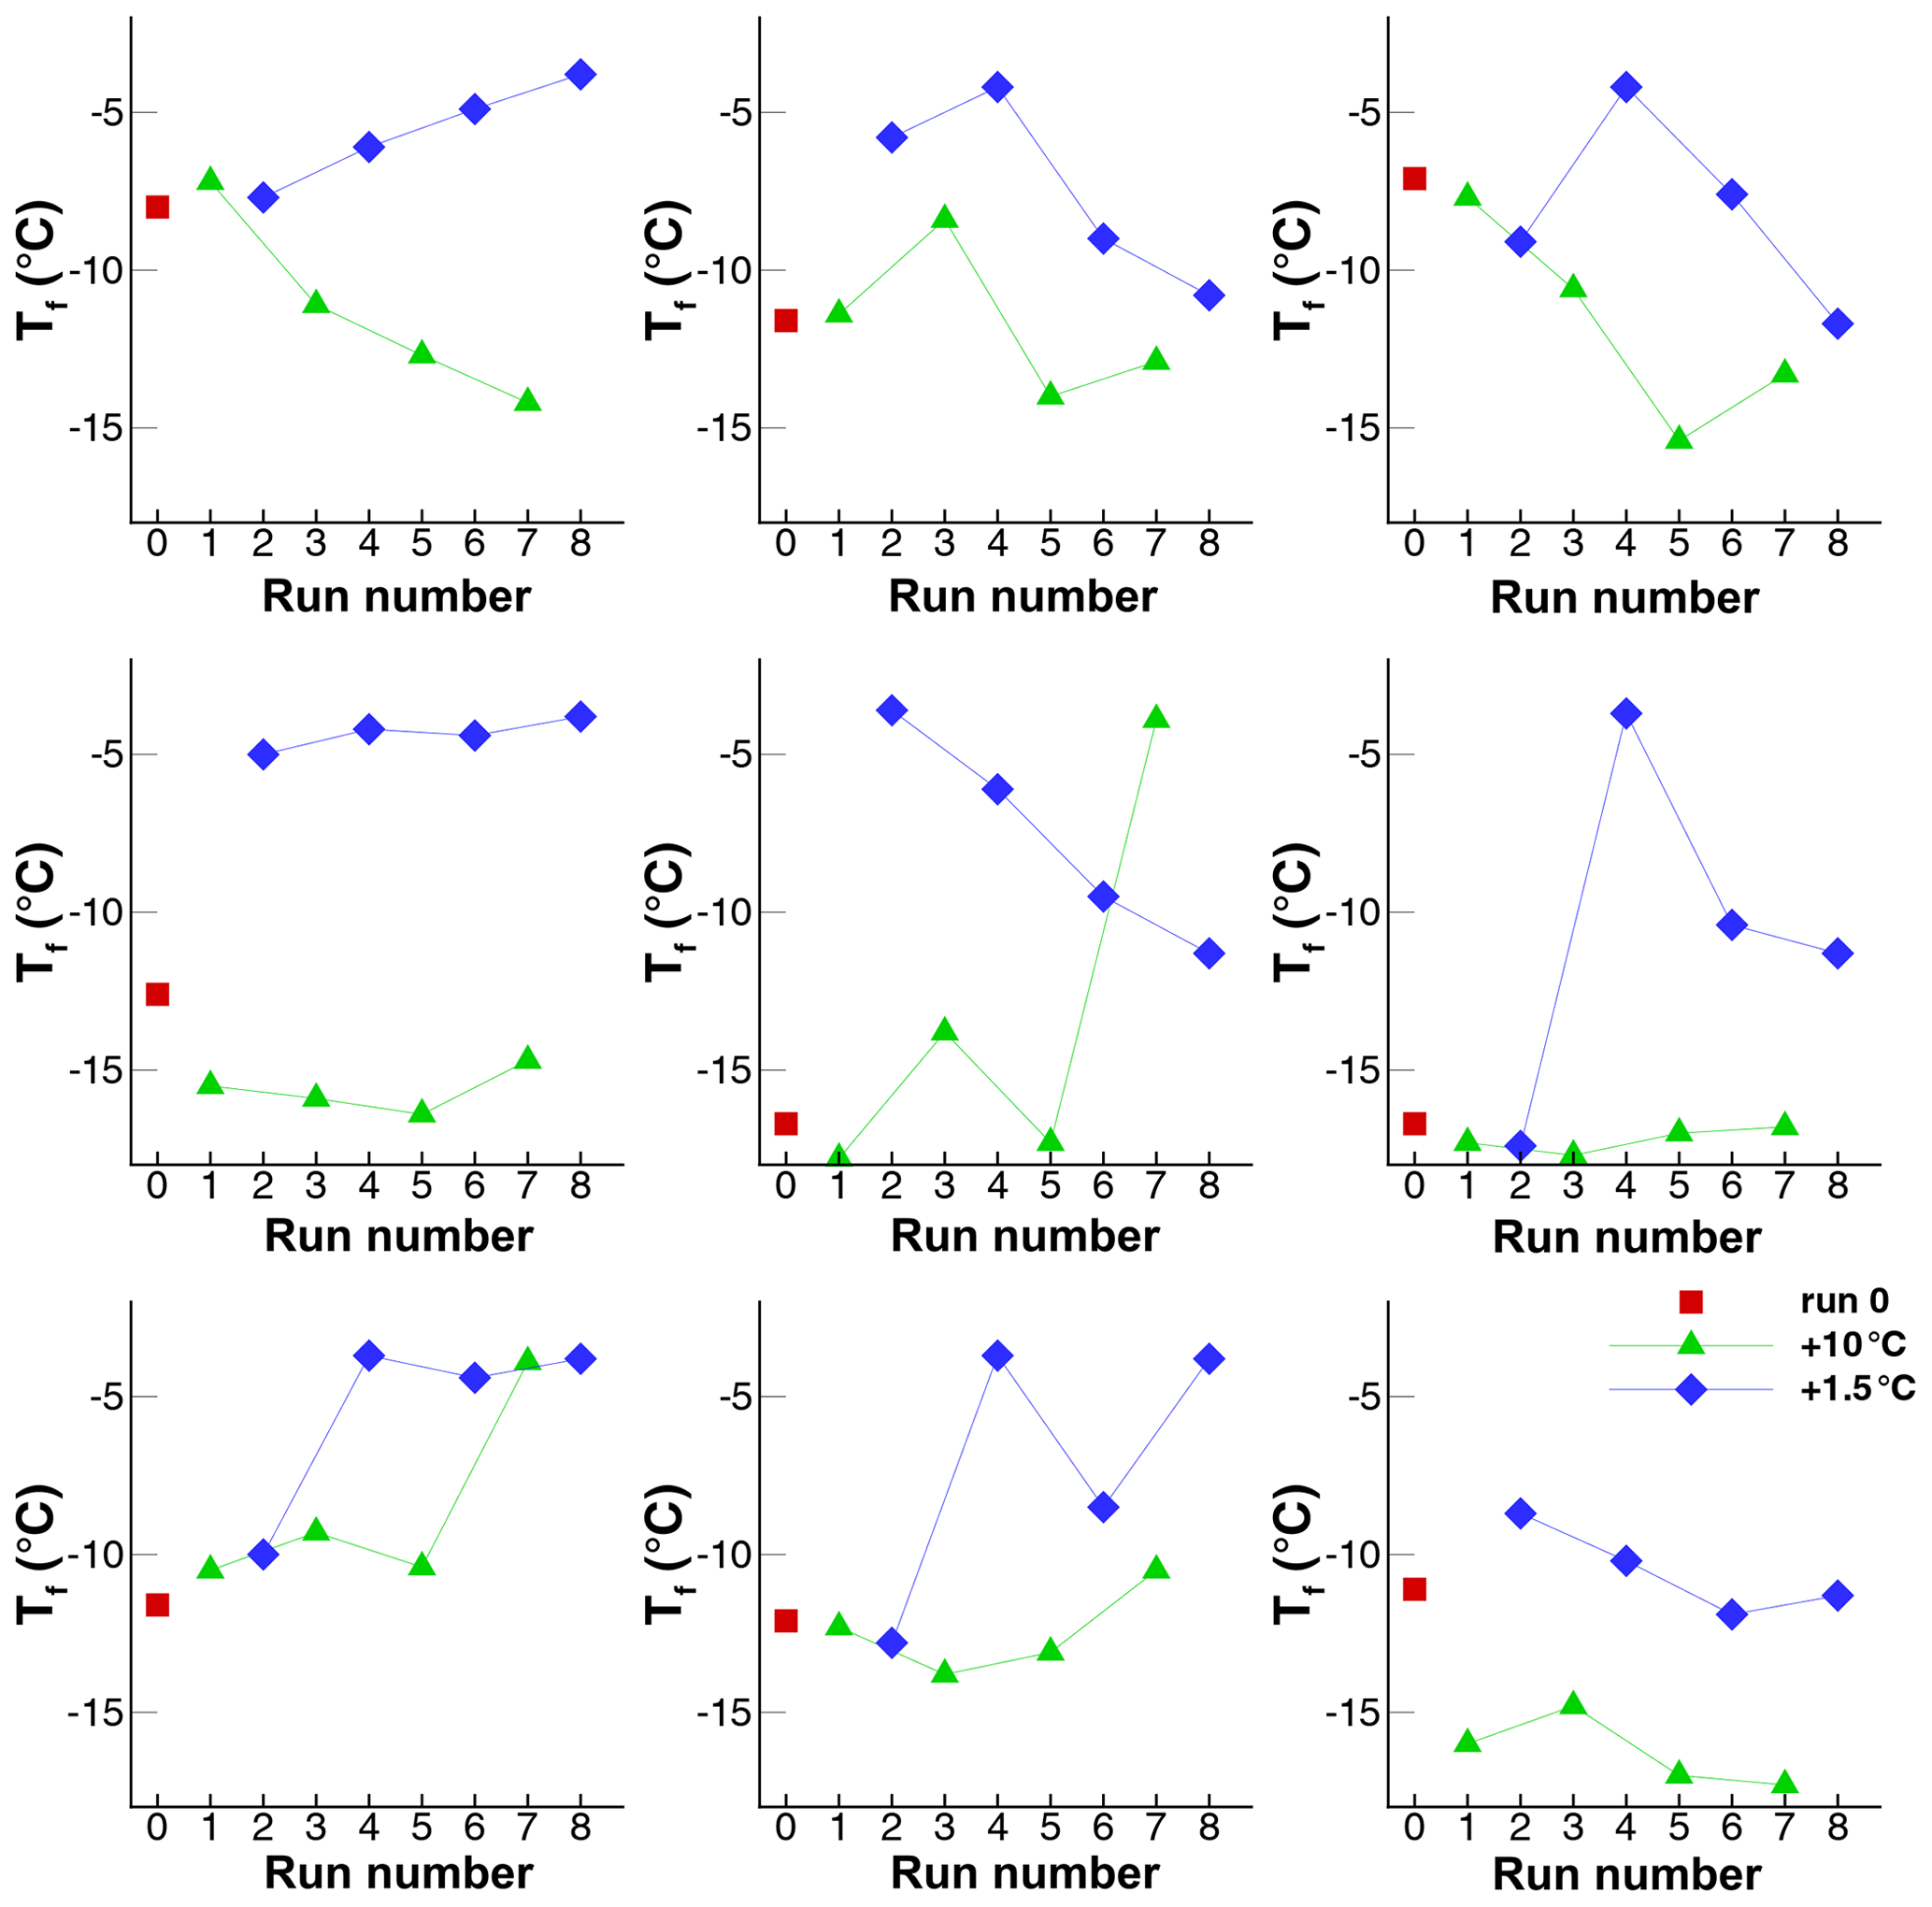
Figure 17Sequences of freezing temperatures for drop numbers 44, 48, 53, 55, 58, 65, 66, 69, and 81 in Exp. G.
4.4.4 Other tests of repeatability
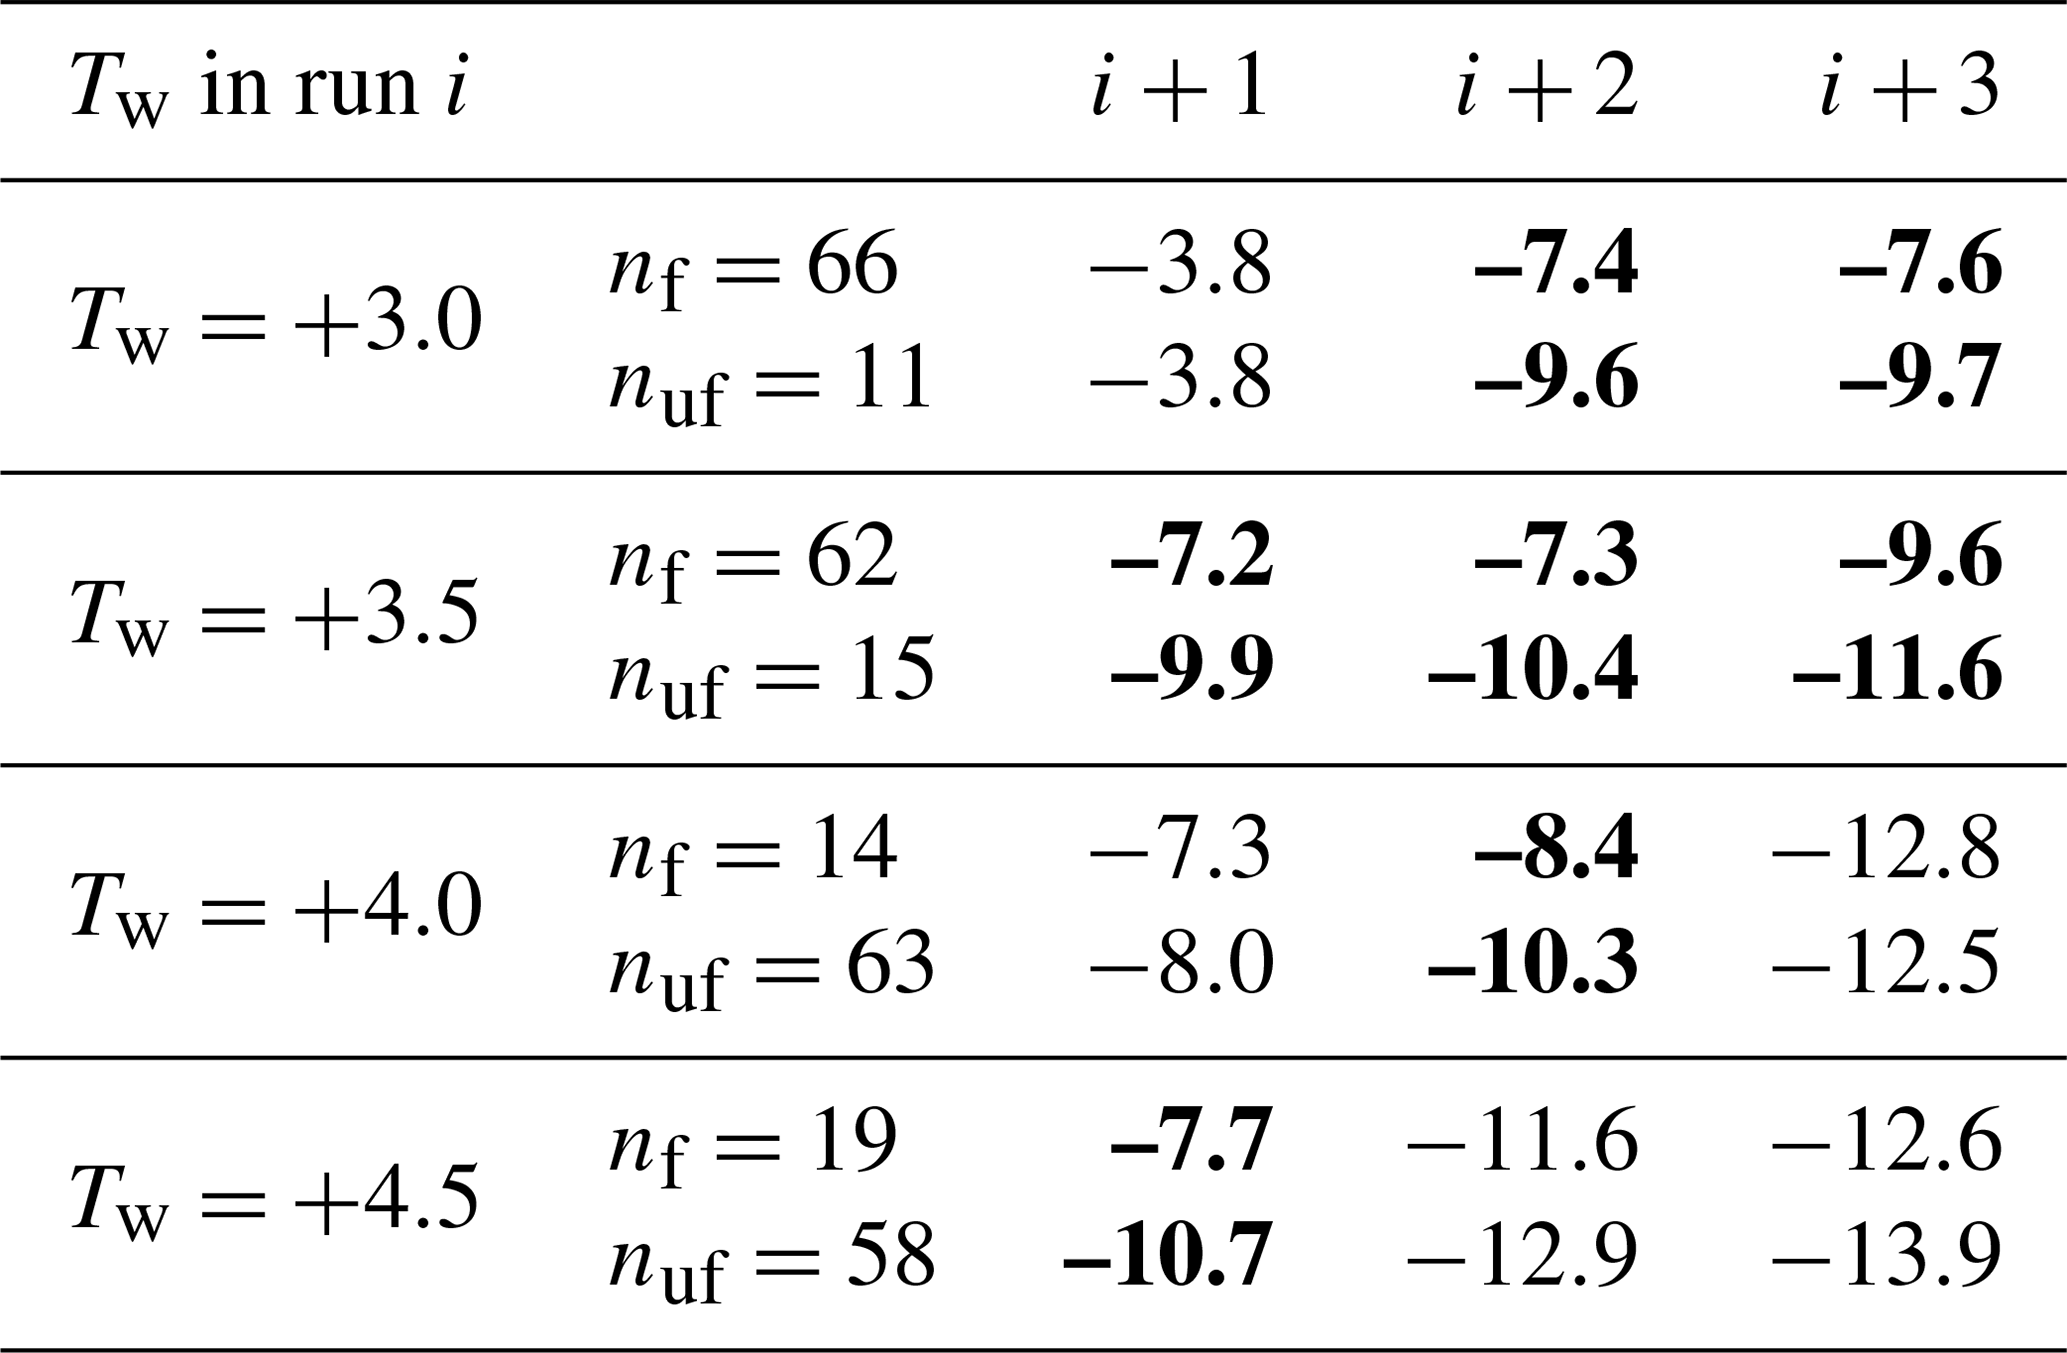
In the search for evidence of repeatability, a test was developed that provided a measure of how subsequent Tf values for drops with ∘C in a given run compared to those with ∘C. The results for Exp. A (gradually increasing warm limits) are shown in Table 4. It is seen that drops frozen with ∘C in any of the runs had higher freezing temperatures in subsequent runs. This holds for all but one of the pairs of runs. Examples of the more pronounced differences are shown in bold font in the table. With this test having sufficiently large numbers of drops in each category, the test results are good indications of real differences. The level of significance of the differences was not evaluated because the differences are quite emphatic and point in the same direction as the other tests of repeatability. The pattern holds even as Tw is raised. Furthermore, the difference persists at least for two subsequent runs.
Table 4Comparison of the average freezing temperatures in runs i+1, i+2, i+3 for the nf drops frozen with ∘C in run i against the nuf drops that froze below that limit. The comparison is given for four different values of Tw. Bold font indicates differences exceeding 2∘C.
As mentioned in Sect. 4.4.3, there appears to be no clear relationship between the nucleation temperature with or without pre-activation. This finding is further examined for runs 5 to 6 in Exp. I (Sect. 4.4.2) and for averages of the two groups of runs in the same experiment. For both of these, the correlation coefficient is 0.3, and the corresponding scattergrams reveal that a few outliers have a strong effect. Random mixing of the values of the second of the pairs of runs leads to smaller r values. It takes about 50 re-randomizations of the second run to get one of them to yield an r value near the observed one. These tests confirm the lack of correspondence between Tf and for any given drop.
The same point can be made by looking at the magnitude of the () difference drop by drop. While the mean value of the change from ∘C to ∘C is 4.6 ∘C, the 90 % range for individual drops is ∘C. The change from the last +10 ∘C run to the first +1.5 ∘C run ranges from 0.1 to 9.3 ∘C. In this case, the large variation is not entirely due to the bunching of freezing temperatures at the lower warm limit, as seen in Fig. 13 with the vertical bars.
To reiterate the title of the paper, it is emphasized that the data presented are exploratory and thus not firm. Two reasons contribute to this. One relates to the methodology of the experiments: lack of knowledge of the amount of HgI2 remaining in suspension, no information of the size distribution of the particles in the sample drops, and the absence of a fixed time frame between sample preparation and testing. The other is the surprising complexity of the results obtained. It may be that the latter is a consequence of the former, but the evidence points to that not being the main reason. Bearing these points in mind, the discussion to follow, as with the experiments themselves, is focused on two aspects: defining basic characteristics of the PFN phenomenon and providing some constraints for potential explanations. The experimental evidence is first compared with the results of EEZ70, then the results obtained with the multiplicity of samples and diverse set of experiments are summarized. Finally, the implications of the results are explored in view of various theories.
5.1 INP derived from HgI2
In the current experiments, the HgI2 suspensions were tested in identical fashion to other materials in previous work (e.g., Vali, 2008); thus, the initial runs in each series are directly comparable to what has been found for other INPs. Similarly to other materials, the activity of INPs exhibits a spread over a range of temperatures, with the number of INPs generally increasing with decreasing temperature. This is expressed quantitatively with the nucleus spectra shown in Fig. 2. The HgI2 concentration of 20 or 40 g L−1 was selected to yield freezing events at temperatures ∘C. The spectra exhibit some minor peaks but are not consistent for all the experiments. The general trend of the spectra, as expressed by the slope of the logarithm of the cumulative concentration, is in the range ω=0.3…0.5. This is comparable with the range of values in Fig. 2b and Table 1 of Vali (2014). From this perspective there is nothing unusual regarding the INP activity of HgI2. Somewhat unexpectedly, the magnitude of the variation in INP concentration seen in this graph exceeds what would result from the factor of 2 variation in the amount of HgI2 added. It is unknown to what extent this was due to alterations of the stored powder or variations in sample preparation. Light sensitivity, different degrees of clumping, and different degrees of settling in the water are potential factors. Since the samples proved to be stable on the timescale of the tests (after the suspension was dispersed as drops) and the main focus was on the sequences of runs not on comparisons among runs, the sample variability was not very important. The only evidence contrary to stability of INP activity in the sample drops is the gradual loss over the first six runs in Fig. 13.
It is likely that the variability of HgI2 as INPs is related in some way to the relatively low run-to-run correlations (Sect. 4.4.1) and to drop-to-drop variations in PFN. No hints were found in this work as to what the underlying cause might be.
5.2 Limiting conditions for PFN
Our findings regarding the upper temperature limit that PFN can survive are close to those of EEZ703 but indicate that the notion can be broadened. EEZ70 concluded that there is a definite upper limit at ∘C (shown in Fig. 1). Data here presented show that the maximum temperature above the melting point permitting PFN to remain possible is not sharp. As described in Sect. 4.2, a major loss of PFN is found near ∘C, but some PFN can be found even after heating to ∘C. This change from a fixed value to a gradual limit indicates that the upper temperature limit is not like a melting point, as argued in EEZ70, but is dependent on specific configurations of critical factors in either the substrate or in bound molecular clusters.
The fraction of sample drops exhibiting PFN as the warm limit is increased is given in Table 2. The transition from 100 % to 10 % for Exp. A extends from to near +5 ∘C. An important distinction regarding what to consider the limit for PFN is that variations within a temperature range of several degrees are not limited to drop-to-drop differences that might be associated with the variations in the size or number of HgI2 particles in different drops. Some fluctuations are also exhibited on repeated freezing cycles by single drops with fixed INP content. This is quite clearly seen in the many lines crossing back and forth in the transition region in Figs. 9, 11, and 12 and in Fig. 6.
The second point demonstrated by the data is that the duration of exposure to Tw has an impact. Longer times reduce the degree of PFN observed. This finding cannot be compared with the EEZ70 results as no timescale was specified in their paper.
The third point to emphasize concerns the dependence of PFN on the degree of prior cooling necessary. EEZ70 quotes a minimum of ∘C for PFN to occur. The experiments described here did not specifically test this assertion, but a contradiction is evidenced in that the lowest temperature reached in some tests was considerably higher. In Exp. D (Fig. 7), Exp. I (Fig. 13), and Exp. H (Fig. 15) cooling proceeded to only about −16 ∘C, and PFN was nonetheless observed. In addition, many drops were already frozen at a much higher temperature than the final values in a run, and thus later changes in water structure near the INP surface were precluded. This observation rules out the formation of a 2-D ice layer at some specific temperature as hypothesized in EEZ70.
Finally, how close to 0 ∘C PFN will take place was not well defined in this work because the detection limit for freezing events was near −2 ∘C. However, the data presented here contradict EEZ70 in that PFN does not always occur close to 0 ∘C. In these data, there is a large range of temperatures over which PFN is exhibited. If we take the temperature at which <5 % of the samples were frozen in the initial run and at which 95 % was frozen after activation to define the lower limit for PFN, the values obtained are −5 ∘C in Exp. A (Fig. 3), near −8 ∘C for Exp. B. (Fig. 4), and near −7 ∘C for Exp. I (Fig. 13). It is clear from these graphs that as Tw increases, a greater degree of supercooling is required for subsequent . Based on this, it is fair to consider ∘C as a lower limit for PFN on HgI2 INPs in these experiments. This lower limit for what to consider PFN is not a measure of the general range of effectiveness of PFN, but is due to the presence of nucleating sites effective below that temperature even without pre-activation.
Based on the information above, the approximate boundaries for PFN in these experiments fell between −2 and −6 ∘C. However, the variability of the upper boundary is clearly seen in the bar diagrams of Figs. 3, 4, and 5. In addition, the lower boundary, the separation between what is PFN and what is due to unaffected INPs, is somewhat arbitrary as described in the preceding paragraph.
The experiments of SS01 with aliphatic alcohol layers as ice nucleators cannot be directly compared with those for HgI2. However, there are qualitative agreements on all aspects of pre-activation. Their results confirm the existence of a warm temperature limit for PFN to occur: they give the warm limit ∘C, and for pentacosanol (C25) they give ∘C. The tolerances attached to the values reflect the fact that the loss of PFN is gradual near TD. This is in accord with the findings presented. There is no mention in SS01 of the need to reach TC, and they also show a large spread in . Results in SS01 show an even stronger difference from the EEZ70 claim for freezing near 0 ∘C after pre-activation. For the most active aliphatic alcohol nucleants, SS01 report no freezing events with ∘C and mean values near ∘C.
5.3 Repeatability of PFN
Repeatability or stability of observed freezing temperatures under various conditions is a useful means for considering which possible mechanisms are responsible for the PFN and to examine the potential roles of nucleation sites.
One reasonably firm result from these experiments is that for single drops there is no relationship between the freezing temperature Tf on first freezing or any run with ∘C and the subsequent with pre-activation. This suggests that the pre-activation observed in these experiments is not an enhancement of the ability of a given site to nucleate ice but that different sites are responsible for the nucleation with or without pre-activation.
The correlation coefficients shown in Table 3 provide one measure of the stability of sites. The majority of the correlation coefficients are in the range r=0.5…0.9. These values are lower than the values reported in Vali (2008) for soil suspensions and for distilled water. However, the randomization tests in Sect. 4.4 showed that the observed r values are significantly larger than would be expected for random rearrangement of the INPs among the drops.
A more focused discussion about repeatability relies on examinations of the sequences of freezing temperatures of individual drops taken from the same sample and exposed to the same temperature histories. As mentioned in Sect. 3.1 there was no control over the number of HgI2 particles per drop, but the number was almost certainly large enough (≈1011) to consider any observed freezing event to be unique (beyond particle number effects) and the repeatability of freezing events in subsequent cycles to be indicative of the stability of the INP responsible for the event.
Figures 14, 16, and 17 and the spiderweb diagrams in Figs. 9, 11, and 12 are graphical representations of the drop histories. These diagrams show complex patterns. The presence of horizontal segments in the figures, limited as they are, can be taken as an indication for repeatability. These steady segments fall within range of 1 to 2 ∘C. The presence of sudden changes or drifts can be interpreted as variations superimposed on permanence. The sample sizes available here demonstrate how varied drop histories can be, but much larger sample sizes would be needed to make statistical analyses of the various patterns.
Results shown in SS01 for many repetitions of the freeze cycle for a single drop indicate an approximately 4 ∘C random spread of over 140 repetitions. Roughly the same spread was associated with each Tw and even for Tw>TD. The spread was also about the same for the three different aliphatic alcohols.
The question of repeatability and stability of nucleation sites is a question beyond the pre-activation phenomenon. The relative frequency of near-constant freezing temperatures versus variable ones and pre-determined versus random events lies at the heart of the debate about nucleating sites. A thorough discussion of the matter is beyond the scope of this paper. Just two comments follow.
To put the current data in perspective, a spiderweb is included for a soil sample in Fig. 18. Other data for this sample have been given in Vali (2008). The prevalence of roughly horizontal trend lines in this diagram is an indication of a fair degree of repeatability, greater than is seen for HgI2 with or without PFN. The median correlation coefficient for pairs taken from these 20 runs is 0.92; the 90 % range is . Sudden changes and minor ups and downs are also evident in this spiderweb.
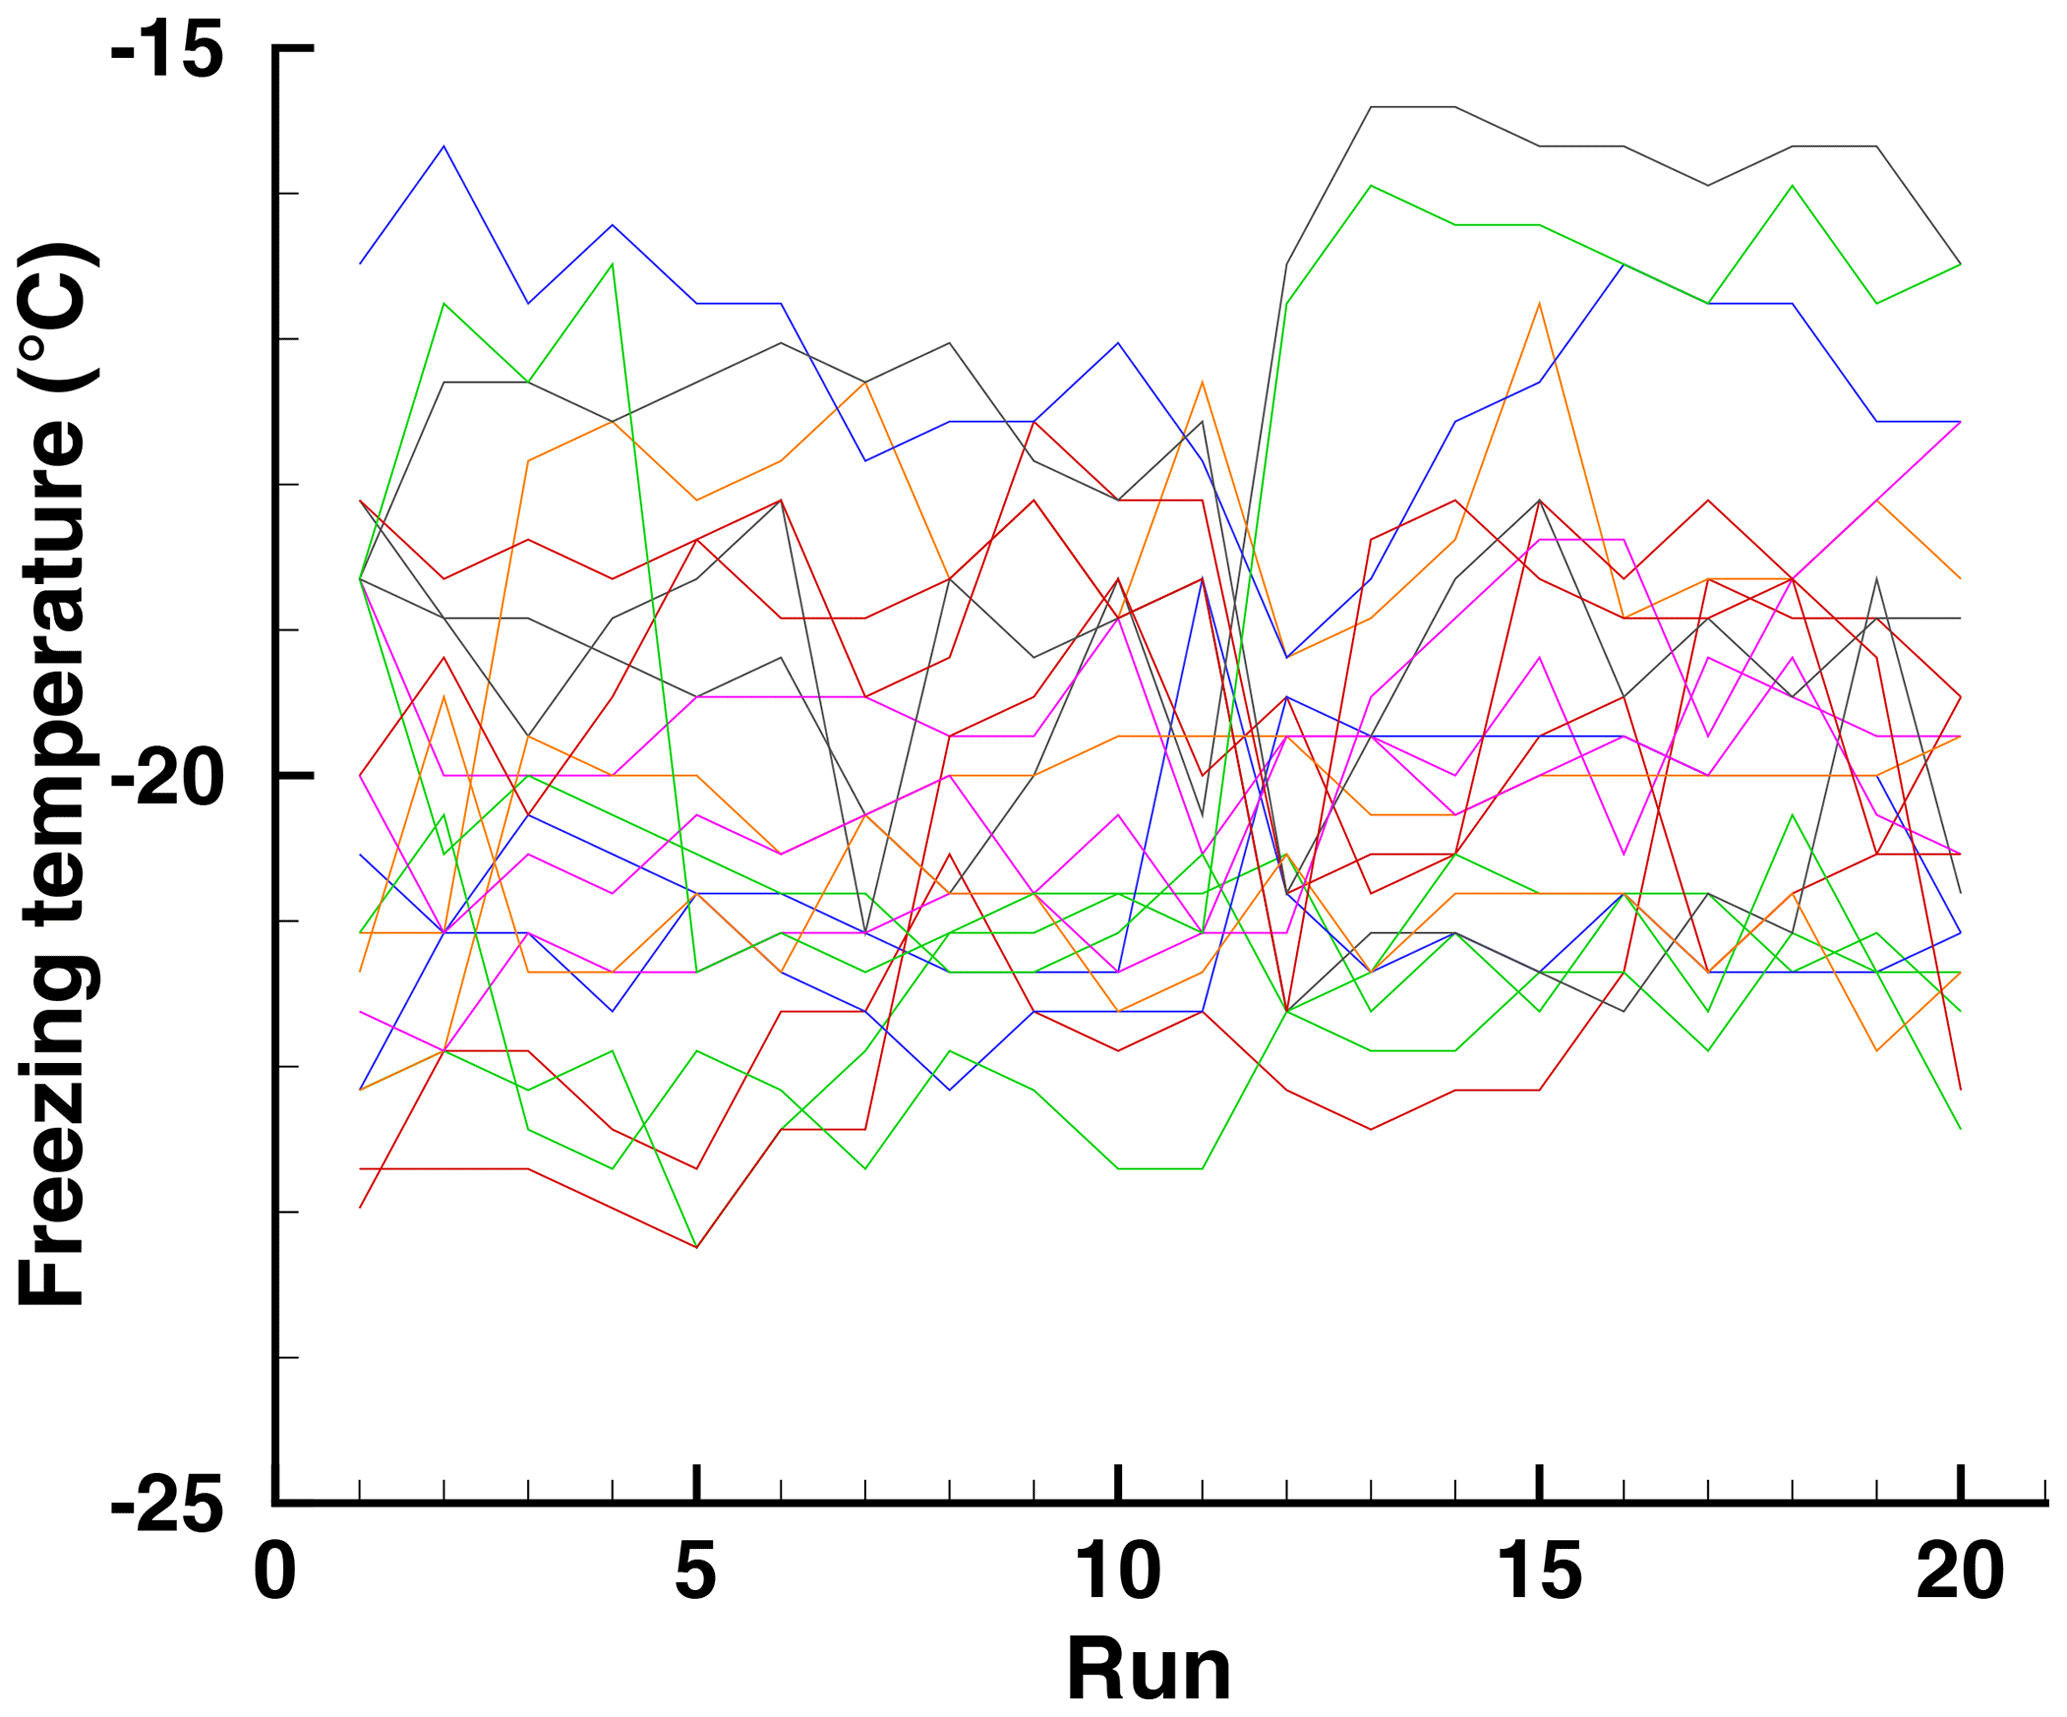
Figure 18Spiderweb diagram of freezing temperatures of 20 drops of a soil suspension in 20 runs from a subset of data in Vali (2008).
Kaufmann et al. (2017) performed refreeze experiments with single drops in a differential scanning calorimeter. The observed sequences of freezing temperatures show a mixture of steady values, sudden changes, and gradual drifts, appearing similar overall to those found in this work and in Vali (2008). They focused on interpretations of the relatively steady repetitions in terms of CNT, implicitly acknowledging that these segments evidence a degree of stability of sites. Interpretation as random sites on uniform surfaces is discarded. Alterations of the sites are seen as the cause of the non-steady segments of the sequences.
From these comparisons, it seems warranted to focus on the role of sites in PFN in much the same way as for freezing nucleation in general. Sites may be thought of in a general sense as specific features on the substrate surface, with higher or lower permanence depending on their particular configuration.
5.4 Explanations of PFN
A summary of the empirical evidence for PFN and other pre-activation effects, as well as some of the explanations offered for them in the past, has been given in Sect. 2. Explanations, in general and for PFN in particular, center on two broad alternatives: special surface features or ice-like layers at the particle–water interface. For PFN, special features on the substrate such a cavities and cracks are considered to retain some of the solid phase past the bulk melting point (Turnbull, 1950). Arguments supporting the role of cavities are based on examinations of the thermodynamic conditions for phase stability of confined water or ice. This notion has been considerably elaborated for pore condensation and freezing (PCF) by Marcolli (2020). Alternatively, PFN is considered to arise via the formation of an adsorbed ice-like layer, enabling PFN to take place past a greatly reduced energy barrier (e.g., Mason, 1950, 1956; Mason and Maybank, 1958). A solid 2-D ice layer was suggested by EEZ70. Support for the role of ice-like layers was found by EEZ70 in the independence of TD of pressure or of the presence of dissolved salts. SS01 found support for the ice-like layer explanation in the shift to lower freezing temperatures with increasing chain length of the alcohol layer without much change in the range of values.
The results presented here offer some input for weighing possible theoretical explanations. The 2-D phase transformation explanation of EEZ70 is discounted by the arguments given in Sect. 5.2. To reconcile the repeatability described here with the adsorbed ice-like layer explanation, that theory would have to be altered to include the possibility of variations of some characteristics of the layer from one INP to the other. In an abstract sense, this could be occurring via variations in the thickness, size, or completeness of the ice-like layer. For example, it could be assumed that the layer is more like a patch than an extended layer. The size of the patch then can be assumed to be influenced by some underlying feature of the substrate. In this way, the patch becomes an extension of a site, thus melding the points of view. Furthermore, the explanation has to be confronted with the evidence that there is no relationship between the initial nucleation temperature of a site and the pre-activated nucleation temperature, as shown in Sect. 5.3. In answer to that, it is not difficult to imagine that ice-like patches would form on different surface features than the ones leading to nucleation without pre-activation. The difference between temperatures Tf and is in itself an indication that different sizes of ice-binding locations are involved. The spread in observed upper limits TD could also be a consequence of different size patches melting at different temperatures. This is clearly a heuristic solution and is given here as an example of the type of model that would have to be developed to account for the known characteristics of PFN with ice-like layers playing a role.
While finding support for the ice-like layer model, SS01 also raise the possibility of pre-activation arising via changes in the Langmuir layer of the aliphatic alcohol. They describe this as “... a metastable conformation of the alcohol layer itself ... the freezing process induces a phase transition of the alcohol film”. Furthermore, “... based on the known chain length dependence of two-dimensional melting temperatures for fatty acid monolayers, it is not unreasonable that the increase which we observe in TD with chain length could in fact be related to a structural change of the Langmuir film”. However, as argued in the preceding paragraph, the modification of the alcohol film would also have to be thought of as having different “patch sizes” or other characteristics differing from drop to drop and having some degree of stability.
The idea expressed in the paragraph above can perhaps be extended to thinking about PFN on HgI2 as some modification of the substrate surface as well. The fact that HgI2 is said to be a soft substance helps such thinking. More directly, the weaker correlations found for HgI2 for runs without pre-activation in comparison with mineral nucleants are also indicate some “softness” or malleability of the substrate on the scale of ice embryos. The large changes observed from one cycle to the next, both with and without pre-activation, further encourage thinking about changes on the substrate itself between cycles. Most importantly, since PFN follows a prior freezing event, it is quite conceivable that some favorable site is created on the surface by the mechanical and thermal stresses associated with freezing.
In reality, the line is blurred between considering surface sites or ice-like patches of specific character to explain PFN. SS01 also came to the conclusion that a “... complete explanation of the pre-activation mechanism will treat the monolayer and the vicinal water as a strongly interacting system.” Monolayer in this quote refers to the alcohol covering of the drop that serves as the nucleant.
It is also important to consider the reverse of repeatability, namely the degree of variability observed in much of the data. First of all, molecular fluctuation of water molecules associated with embryo formation are an inescapable part of nucleation and this leads to some random variability of the nucleation temperature. Additional factors relate to the fragility of the structures making up the sites. For PFN, it is clear that the structure may have undergone some change by the previous formation of ice on it, and this modified structure is likely to be less rigid than what are normally considered potential sites. The fragility of PFN structures on HgI2 is perhaps pre-conditioned by the relatively weak permanence of sites on the HgI2 surface in comparison with other materials. The low values of the correlation coefficients given in Table 3 for runs without PFN underscore this possibility.
5.5 Broader context
The results presented here will hopefully be re-examined in future tests. The two conflicting aspects – the evidence for sites and their paucity and fragility – are challenging aspects to study. The range of warm limit conditions that lead to only partial PFN (not all drops freeze at the same temperature) may be an especially fruitful situation to study. Experiments with other materials exhibiting PFN would be useful.
The abundance of mercuric iodide in the atmosphere is not known. Atmospheric concentrations of mercury, its compounds and the reactions connecting these, and its surface sources and removal processes have been subjects of study for decades. Schroeder and Munthe (1998) and Lyman et al. (2020) present overviews of the physical, chemical, and toxicological properties of mercury in various forms. No mention is made of mercuric iodide in these papers, indicating that it has no known importance in atmospheric processes. There has also been no mention of this in the numerous physical and chemical analyses of atmospheric ice nucleating particles (INPs) over the years that reveal mercuric iodide to be a significant component.
In addition to mercuric iodide, PFN was observed by EEZ70 for lead iodide, gypsum, cadmium iodide, muscovite, L-asparagine, L-aspartic acid, and p-benzyl phenol. The absence of PFN was reported for graphite, chlorite, silica gel, and a number of other inorganic materials. Evans (1967) reported PFN on phloroglucinol dihydrate. These findings were not stated to be the results of any exhaustive search for materials that would exhibit PFN, and thus it is reasonable to assume that further research will reveal PFN associated with yet more substances. The detailed character of PFN for the substances listed above and for others yet to be identified will have to be determined in future research. On the basis that the general features identified for PFN on mercuric iodide are in concert with other evidence for ice nucleation in the immersion mode, it is reasonable to think that similar results will eventually be found for most other substances.
Since pre-activation is a sequence of exposures to different temperatures, atmospheric impact of the process will also depend on the occurrence of such sequences in clouds. Vertical circulation of parcels in clouds is well known to occur in deep convection and in extended layer clouds. For the PFN activity observed in these tests, circulations would have to extend over a kilometer or more in the vertical. In any event, the initiation of freezing at temperatures slightly below the melting point is of great importance for clouds and for many biological and environmental systems. It is also of great interest for artificial snow making, tissue preservation, and more. In those controlled situations, pre-activation may be a method for greatly increasing the efficacy of INPs. Overall, PFN may have to be considered as a potential pathway for natural and induced freezing at minimal supercooling.
From the point of view of nucleation basics, the results presented in this paper underscore the need for a more fundamental understanding of what surface structures constitute nucleation sites; how stable they are; and what influences are exerted by time, temperature, and other factors. In that sense, PFN is an aspect of ice nucleation that presents further options to characterize the process.
As already indicated in the title of this paper, instrumental and procedural limitations cause the work described here to be considered exploratory. While the conclusions given below are consistent with the data presented, and are supported by comparisons with previous work in EEZ70 and SS01, various caveats had to be attached to them.
-
Pre-activated ice nucleation (PFN) on HgI2, as reported in EEZ70 and as schematically depicted in Fig. 1, was confirmed. PFN leads to freezing at temperatures much higher than would otherwise occur with the same substance.
-
PFN was observed in these experiments at ∘C. The possibility of PFN at smaller degrees of supercooling, 0 ∘C ∘C, is not ruled out. PFN is exhibited over a temperature range extending at least to −6 ∘C. Under the conditions of these experiments, below that temperature freezing due to PFN became indistinguishable from nucleation without pre-activation .
-
PFN can be detected after a limited degree of warming above the melting point. Raising the degree of heating leads to a gradual lowering of the subsequent nucleation temperatures . Significant lowering of was found at approximately +3.5 ∘C, but PFN is still clearly evident after heating to +5 ∘C and above. This gradual loss of PFN effectiveness is contrary to the total loss at a fixed temperature that was reported in EEZ70. Superimposed onto the general pattern of loss of PFN activity, considerable variation was found for individual INPs contained in separate drops.
-
There is no support in these experiments for the existence of a minimum temperature to which a sample has to be cooled for PFN to be exhibited. Freezing and limited warming are sufficient conditions.
-
No relationship was found between the initial nucleation temperature Tf of a given drop and its nucleation temperature after pre-activation. This raises the possibility that different particles or different parts of particle surfaces are involved in the two cases.
-
Repeatability, as defined at the beginning of Sect. 4, is supported to a limited degree. Much of the data show a lack of repeatability of PFN, but the cases that do show repeatability are unequivocal in pointing to the role of definite structures (sites) in promoting nucleation. Overall, indications point to the role of definable features as sites for nucleation but that these features are fragile, easily modified, or fully destroyed by the freezing event itself or in the liquid during the subsequent cycle of heating and cooling.
-
HgI2 is a relatively poor source of INPs and some unexplained variations were found in INP concentration per unit mass during the course of these experiments. These variations had negligible impact on the results regarding PFN but may be related to the lower degree of stability of sites than is observed for some other materials.
-
Results similar to those reported here have been reported in the literature for a number of other materials. PFN may thus be assumed to be possible with a wider range of materials than has hitherto been known. PFN may have important, yet unknown, contributions to atmospheric and other processes. PFN may have applications in the deliberate initiation of freezing in clouds, in tissue and food preservation, and other situations.
| CNT | Classical nucleation theory |
| INP | Ice-nucleating particle, as defined in Vali et al. (2015) |
| PFN | Pre-activated freezing nucleation |
| k(T) | Differential concentration of INPs (cm−3 ∘C−1) |
| nuf | Number of unfrozen drops during a cooling cycle |
| ω | Slope of freezing rate, as defined in Eq. (7) in Vali (2014): |
| r | Correlation coefficient |
| T | Temperature (∘C) |
| Tf | Observed temperature of freezing of a drop or a general reference to nucleation temperature (∘C) |
| Observed freezing temperature of a drop with pre-activation (∘C) | |
| Tw | Temperature to which the sample is heated between runs, the “warm limit” (∘C) |
| Tw,i | Temperature to which the sample is heated before run i (∘C) |
| TC | Defined in EEZ70 as the temperature to which a sample has to be cooled for PFN to be manifested (∘C) |
| TD | Limiting value for Tw for retaining PFN(∘C) |
| V | Drop volume (= 0.01 cm3 in the experiments here described) |
Raw data can be made available by the author. Data are also located in the following depository: https://doi.org/10.15786/20.500.11919/7165 (Vali, 2020).
The author declares that there are no conflicts of interest.
Thanks are due to Donald L. Veal for supporting this research in many ways. The contributions of laboratory assistants in carrying out the experiments and in data reduction are much appreciated.
The laboratory work in 1972–1973 was supported by the Division of Atmospheric Water Resources Management, Bureau of Reclamation under contract 14-06D-6801. Data analyses and the writing of this paper had no financial support.
This paper was edited by Hinrich Grothe and reviewed by Thomas Leisner and one anonymous referee.
Blank, L.: Statistical procedures for engineering, management, and science, McGraw-Hill Book Company, New York, USA, ISBN 0-07-005851-2, 649 pp., 1980.
David, R. O., Marcolli, C., Fahrni, J., Qiu, Y. Q., Sirkin, Y. A. P., Molinero, V., Mahrt, F., Bruhwiler, D., Lohmann, U., and Kanji, Z. A.: Pore condensation and freezing is responsible for ice formation below water saturation for porous particles, P. Natl. Acad. Sci. USA, 116, 8184–8189, https://doi.org/10.1073/pnas.1813647116, 2019.
David, R. O., Fahrni, J., Marcolli, C., Mahrt, F., Brühwiler, D., and Kanji, Z. A.: The role of contact angle and pore width on pore condensation and freezing, Atmos. Chem. Phys., 20, 9419–9440, https://doi.org/10.5194/acp-20-9419-2020, 2020.
Edwards, G. R., Evans, L. F., and Zipper, A. F.: Two-dimensionsal phase changes in water adsorbed on ice- nucleating substrates, T. Faraday Soc., 66, 220–234, 1970.
Evans, L. F.: Ice Nucleation Under Pressure and in Salt Solution, T. Faraday Soc., 540, 1–12, 1967.
Fournier d'Albe, E. M.: Some experiments on the condensation of water vapour at temperatures below 0 ∘C, Q. J. Roy. Meteor. Soc., 75, 1–16, https://doi.org/10.1002/qj.49707532302, 1949.
Fukuta, N.: Activation of Atmospheric Particles as Ice Nuclei in Cold and Dry Air, Journal de Recherches Atmospheriques, 2, 359–362, 1966.
Higuchi, K. and Fukuta, N.: Ice in the capillaries of solid particles and its effect on their nucleating ability, J. Atmos. Sci., 23, 187–190, 1966.
Kaufmann, L., Marcolli, C., Luo, B., and Peter, T.: Refreeze experiments with water droplets containing different types of ice nuclei interpreted by classical nucleation theory, Atmos. Chem. Phys., 17, 3525–3552, https://doi.org/10.5194/acp-17-3525-2017, 2017.
Lyman, S. N., Cheng, I., Gratz, L. E., Weiss-Penzias, P., and Zhang, L.: An updated review of atmospheric mercury, Sci. Total Environ., 707, 135575, https://doi.org/10.1016/j.scitotenv.2019.135575, 2020.
Majewski, J., Popovitzbiro, R., Kjaer, K., Alsnielsen, J., Lahav, M., and Leiserowitz, L.: Toward a determination of the critical size of ice nuclei – a demonstration by grazing incidence x-ray diffraction of epitaxial growth of ice under the C31H63OH alcohol monolayer, J. Phys. Chem.-US, 98, 4087–4093, 1994.
Marcolli, C.: Deposition nucleation viewed as homogeneous or immersion freezing in pores and cavities, Atmos. Chem. Phys., 14, 2071–2104, https://doi.org/10.5194/acp-14-2071-2014, 2014.
Marcolli, C.: Technical note: Fundamental aspects of ice nucleation via pore condensation and freezing including Laplace pressure and growth into macroscopic ice, Atmos. Chem. Phys., 20, 3209–3230, https://doi.org/10.5194/acp-20-3209-2020, 2020.
Mason, B. J.: The nature of ice forming nuclei in the atmosphere, Q. J. Roy. Meteor. Soc., 76, 59–74, 1950.
Mason, B. J.: The nucleation of supercooled water clouds, Sci. Progress-UK, 175, 479–499, 1956.
Mason, B. J. and Maybank, J.: Ice-nucleating properties of some natural mineral dusts, Q. J. Roy. Meteor. Soc., 84, 235–241, https://doi.org/10.1002/qj.49708436104, 1958.
Roberts, P. and Hallett, J.: A laboratory study of the ice nucleating properties of some mineral particulates, Q. J. Roy. Meteor. Soc., 94, 25–34, https://doi.org/10.1002/qj.49709439904, 1968.
Schroeder, W. H. and Munthe, J.: Atmospheric mercury – An overview, Atmos. Environ., 32, 809–822, https://doi.org/10.1016/S1352-2310(97)00293-8, 1998.
Seeley, L. H. and Seidler, G. T.: Preactivation in the nucleation of ice by Langmuir films of aliphatic alcohols, J. Chem. Phys., 114, 10464–10470, https://doi.org/10.1063/1.1375151, 2001.
Turnbull, D.: Kinetics of heterogeneous nucleation, J. Chem. Phys., 18, 198–203, 1950.
Vali, G.: Quantitative evaluation of experimental results on the heterogeneous freezing nucleation of supercooled liquids, J. Atmos. Sci., 28, 402–409, 1971.
Vali, G.: Memory effect in the nucleation of ice on mercuric iodide, Conference paper summary, in: Nucleation and Atmospheric Aerosols, edited by: Fukuta, N. and Wagner, P. E., Deepak Publishing, Hampton, Virginia, USA, 259–262, 1992.
Vali, G.: Repeatability and randomness in heterogeneous freezing nucleation, Atmos. Chem. Phys., 8, 5017–5031, https://doi.org/10.5194/acp-8-5017-2008, 2008.
Vali, G.: Interpretation of freezing nucleation experiments: singular and stochastic; sites and surfaces, Atmos. Chem. Phys., 14, 5271–5294, https://doi.org/10.5194/acp-14-5271-2014, 2014.
Vali, G., DeMott, P. J., Möhler, O., and Whale, T. F.: Technical Note: A proposal for ice nucleation terminology, Atmos. Chem. Phys., 15, 10263–10270, https://doi.org/10.5194/acp-15-10263-2015, 2015.
Vali, G.: MERCIODPREACT, UW Research Data, University of Wyoming, https://doi.org/10.15786/20.500.11919/7165, 2020.
Wagner, R., Kiselev, A., Möhler, O., Saathoff, H., and Steinke, I.: Pre-activation of ice-nucleating particles by the pore condensation and freezing mechanism, Atmos. Chem. Phys., 16, 2025–2042, https://doi.org/10.5194/acp-16-2025-2016, 2016.