the Creative Commons Attribution 4.0 License.
the Creative Commons Attribution 4.0 License.
 | 19 Feb 2021
Dominant synoptic patterns associated with the decay process of PM2.5 pollution episodes around Beijing
Renhe Zhang
Yanke Tan
Wei Yu
The variation in the concentrations of ambient PM2.5 (particles with an aerodynamic diameter less than 2.5 µm) generally forms a continuous sawtooth cycle with a recurring smooth increase followed by a sharp decrease. The episode of abrupt decay of pollution is mostly meteorological in origin and is controlled by the passage of synoptic systems. One affordable and effective measure for quickly reducing PM2.5 concentrations in northern China is to wait for a strong wind to arrive. However, it is still unclear how strong the wind needs to be and exactly what kind of synoptic system most effectively results in the rapid decay of air pollution episodes. PM2.5 variations over the 28 pollution channel cities of the Beijing region are investigated to determine the mechanisms by which synoptic patterns affect the decay processes of pollution episodes. This work shows more obvious day-to-day variations in PM2.5 concentration in winter than in summer, which implies that wintertime PM2.5 variations are more sensitive to meteorological factors. There were 365 decay processes from January 2014 to March 2020, and 97 of them were related to the effective wet deposition. In total, 26 %–43 % of PM2.5 pollutant is removed by the wet deposition in different seasons. Two dominant circulation patterns are identified in summer. All the other three seasons have three circulation types (CTs), respectively. The three CTs in spring show the same patterns as those in autumn and winter. The circulation patterns beneficial to the decay processes all exhibit a higher-than-normal surface wind speed, a negative relative humidity anomaly and net outflow of PM2.5 from the domain. In addition, CT1 in spring, autumn and winter is controlled by northeasterly wind and features the most significant horizontal net outflow of air pollutants and effective upward spread of air pollutants to the free atmosphere. CT2 is the most frequent CT in autumn and winter, with the highest wind speed from the northwest, highest boundary layer height (BLH) and lowest relative humidity among the three CTs, all of which are favorable for the reduction of PM2.5 concentrations. In CT3, strong vertical wind shear within the boundary layer enhances the mixing of surface air pollutants, which is the extra cleaning mechanism besides dry and clean air mass inflow. PM2.5 concentrations show significant decreases of more than 37 %, 41 % and 27 % after the passage of CT1, CT2 and CT3, respectively. A dry airflow with a positive BLH anomaly and the effective horizontal outflow of air pollutants are the main reasons for the abrupt decay phase in summer. PM2.5 concentrations after the decay process show a significant decreasing trend from 2014 to 2020, reflecting successful emission mitigation. Emission reductions have led to a 4.3–5.7 decrease in PM2.5 concentrations in the 28 pollution channel cities of the Beijing region.
- Article
(9386 KB) - Full-text XML
-
Supplement
(3945 KB) - BibTeX
- EndNote


PM2.5 (particles with an aerodynamic diameter less than 2.5 µm) pollution has become a severe threat and challenge in China, especially in the Beijing–Tianjin–Hebei (BTH) region, and has attracted significant concern regarding how to improve regional air quality (Che et al., 2019; Wang et al., 2015, 2019a; Xia et al., 2016; Zhang et al., 2018a; Mu and Zhang, 2014; Cai et al., 2017). To avoid the severe negative impacts of air pollution on public health, the Chinese government has issued a number of policies to improve the atmospheric environment (Ding et al., 2019; Chen and Wang, 2015; Zhao et al., 2019; Li et al., 2018b). For example, in September 2013, the State Council issued the Air Pollution Prevention and Control Action Plan (referred to as Clean Air Action), which required the BTH region to reduce its PM2.5 concentrations by 25 % within 5 years (China's State Council, 2013). With the extensive research on the prevention and control of air pollution, the regional effects of air pollution from cities in the pollution transmission channel in the BTH region have been highlighted (China Daily, 2017). Therefore, the Work Plan for Air Pollution Prevention and Control in Beijing, Tianjin, and Hebei and Surrounding Areas was released in March 2017 (China's State Council, 2018). Much stricter, more comprehensive, and more detailed prevention and control measurements were taken in the “2+26” cities, including Beijing; Tianjin; and 26 other cities in the provinces of Hebei, Shandong, Henan and Shanxi. Due to the persistent efforts towards emission mitigation, the air quality has shown significant improvement in these 28 pollution channel cities in recent years (Zhang et al., 2019a, b; Zheng et al., 2018; Wang et al., 2019d; Gui et al., 2020).
Meteorological conditions are considered as one of the important factors for the variation in ambient PM2.5 pollution, especially for the temporal evolution of each air pollution episode (Zhang et al., 2014; Ma and Zhang, 2020; Wang et al., 2019c). Even under the conditions of a significant decrease in air pollutant emissions, similar to the COVID-19 lockdown period, PM2.5 pollution events still occur frequently in the 28 pollution channel cities due to the unfavorable meteorological background (Shi and Brasseur, 2020; Le et al., 2020; Huang et al., 2020b; Wang et al., 2020b; Wang and Zhang, 2020b). Many studies have been conducted and have suggested that multiple meteorological factors influence the emission of primary pollutants; the formation of secondary particles; and the processes of transport, accumulation and deposition of particles (Zhao et al., 2020a; Huang et al., 2020c; Chen et al., 2019; Gong and Liao, 2019). High temperatures result in greater emissions of PM2.5 precursors and secondary pollutants and promote photochemical reactions, causing an increase in local PM2.5 concentrations (Zhang, 2017; Zhao et al., 2018b; Chen et al., 2020). Humidity strongly affects PM2.5 concentrations in China, especially during severe pollution episodes (Zhao et al., 2018a; Li et al., 2018a; Huang et al., 2020a). Higher humidity is beneficial for the hygroscopic increase in aerosols and facilitates the formation of secondary particles (Wang et al., 2019b; Zhao et al., 2017; Cheng et al., 2015; Xin et al., 2016). The cross-regional transport and horizontal diffusion of pollutants are strongly determined by the wind field. Southerly winds bring higher concentrations of air pollutants and more moisture, which enhances the local air pollution in Beijing and the surrounding regions (He et al., 2020; Zhao et al., 2020b). In addition to individual meteorological variables, synoptic circulation characteristics control the formation and development of air pollution events (Wang et al., 2020a; Miao et al., 2020; Wang and Zhang, 2020a; Liu et al., 2019). Monsoonal flows and cold frontal passages are the dominant meteorological modes controlling the day-to-day variations in PM2.5 concentrations in the northern China (Li et al., 2016; Wu et al., 2017; Zhang et al., 1996; Leung et al., 2018). Circulation of a strong Siberian high to the north and cold anomalies in the low-level troposphere with a strong east Asian trough is found to be favorable for the clear winter in Beijing and the surrounding region (Pei and Yan, 2018). Weak synoptic patterns with high-pressure or persistent low-pressure systems favor the accumulation of pollutants, while strong synoptic patterns with large pressure gradients encourage the diffusion of pollutants (Cai et al., 2020; Zhang et al., 2017, 2020; Li et al., 2019). Severe haze events in the BTH region are always accompanied by stagnant air conditions, stable stratification, weak surface wind, low boundary layer height (BLH), and high relative humidity (Ma et al., 2020; Bi et al., 2014; Wang et al., 2020c; Tang et al., 2016a; Quan et al., 2020; Pei et al., 2020; Guo et al., 2019).
Most of the aforementioned studies focused on the synoptic pattern characteristics favorable for the initiation and development of air pollution episodes in the BTH region. During the developing phase of each PM2.5 pollution episode, the comprehensive effects of secondary aerosol formation, hygroscopic increase and accumulation of particles lead to an increase in local PM2.5 concentrations, which usually takes several days from a clean situation to the outbreak of a heavy haze (Sun et al., 2014; Wang et al., 2016; Pei et al., 2018). Both atmospheric chemistry and physics processes play important roles in the developing phase of air pollution events (Gu et al., 2020; Yao et al., 2018; Wang et al., 2010, 2018; Li et al., 2017; Gao et al., 2017). However, compared to the developing phase, which typically features a smooth increase in air pollutant concentrations due to the regional transport, local accumulation and secondary formation, the decay phase of each pollution episode shows a sharp decrease in PM2.5 concentrations, often in a few hours. Pollutants on hazy days show mass concentration 2–3 times higher than that on clear days (Li et al., 2010). The abrupt decrease in PM2.5 concentrations is purely meteorological in origin and is controlled by the passage of synoptic systems, especially cold fronts, which terminate a severe air pollution episode in the BTH region by strong winds (Zhu et al., 2016; Jia et al., 2008; Ji et al., 2012; Xin et al., 2012). Many studies took the smooth increase period of PM2.5 concentrations and abrupt decrease stage following it as a complete air pollution episode and investigated its development mechanism (Tang et al., 2016b; Zhang et al., 2018b; Sun et al., 2014; Zheng et al., 2015). However, it is still unclear how strong the wind needs to be, exactly what kind of synoptic systems can effectively terminate air pollution episodes in the BTH region, and what mechanism is responsible for the rapid reduction in PM2.5 concentrations in a few hours. The clarification of these issues will contribute to improving local air quality predictions. The variation in air quality is generally consistent in the 28 pollution channel cities, especially in the decay phase of pollution episodes, which indicates that the same synoptic system usually affects the whole region. This study will focus on the region covering these 28 pollution channel cities and reveal the synoptic circulation pattern that dominates the decay process of PM2.5 pollution events.
2.1 Dataset
The daily mean observed PM2.5 concentrations in the 28 pollution channel cities from January 2014 to March 2020 were obtained from the Ministry of Ecology and Environment of the People's Republic of China (https://www.aqistudy.cn/historydata/, last access: 12 February 2021). Figure 1 shows the location of the 28 pollution channel cities and their annual mean PM2.5 concentrations from 2014 to 2019. The 4-times-daily dataset of the fifth-generation European Centre for Medium-Range Weather Forecasts (ECMWF ERA5) atmospheric reanalysis dataset with a resolution of 0.5∘ (https://cds.climate.copernicus.eu/cdsapp#!/dataset/10.24381/cds.bd0915c6?tab=form, last access: 12 February 2021) was used to describe the meteorological characteristics and synoptic circulation classification. Daily accumulated precipitation amount is the total amount of 24 h values.
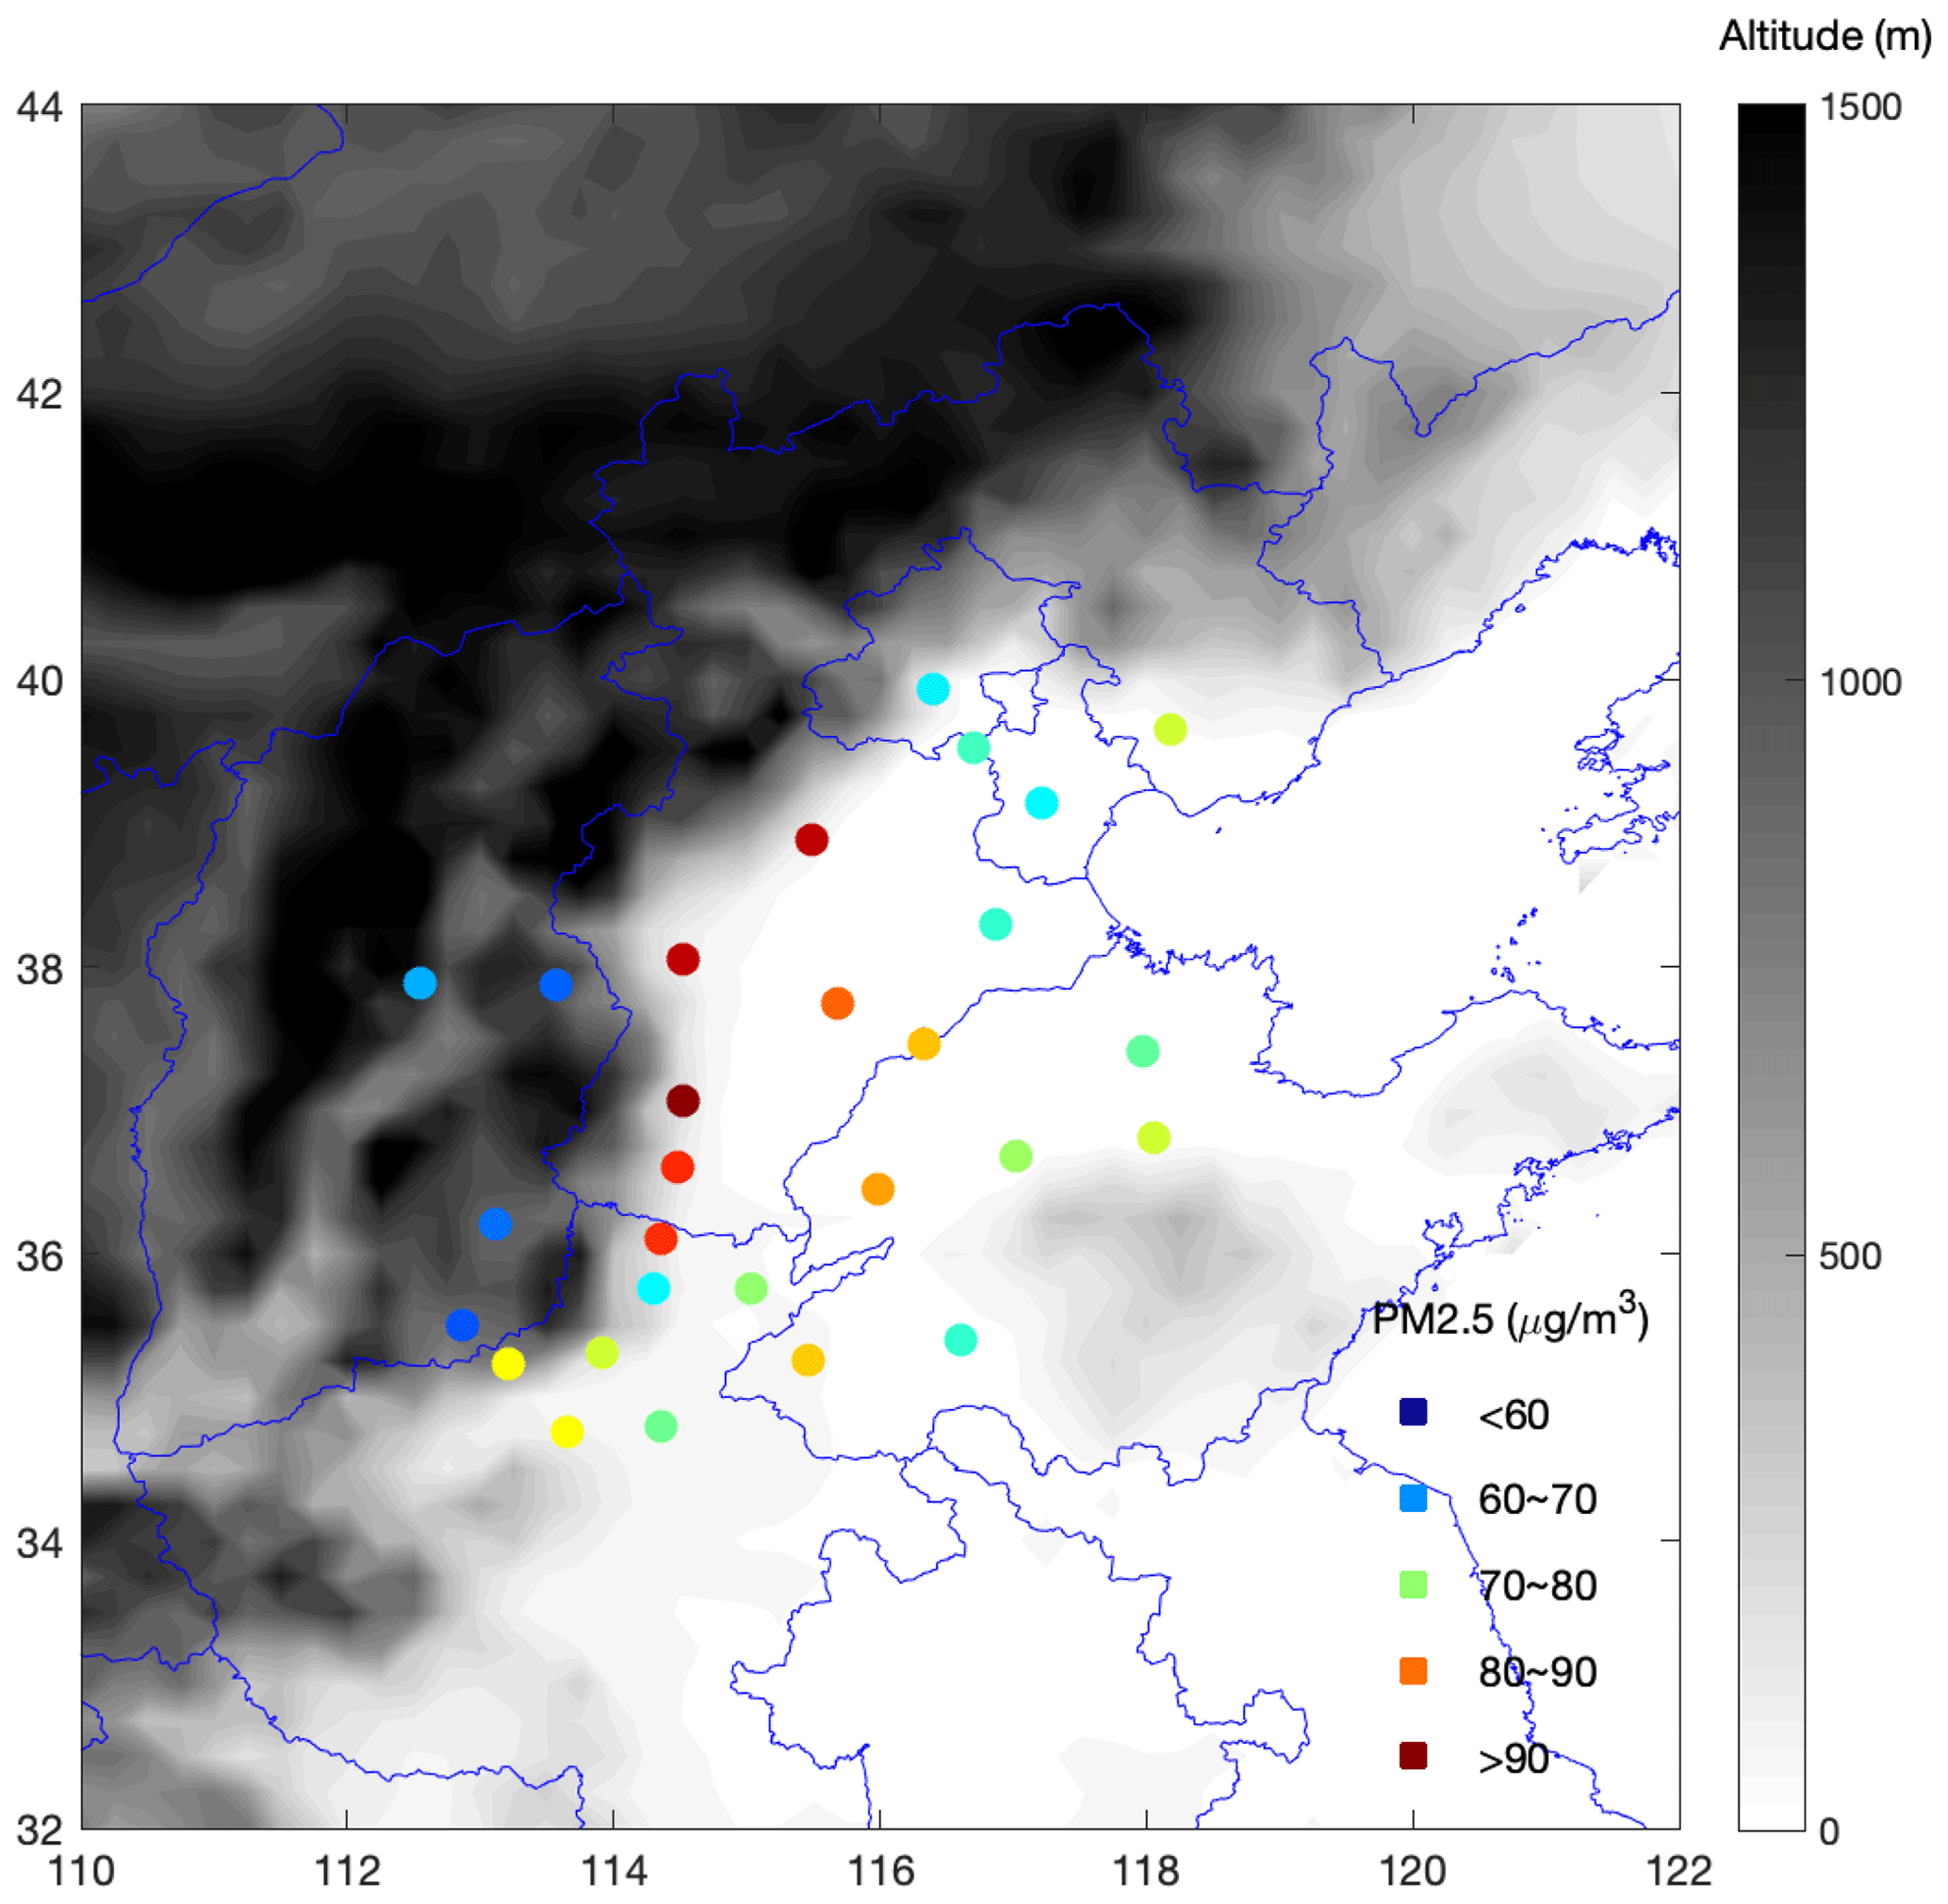
Figure 1Distribution of annual mean PM2.5 concentrations in the 28 cities by altitude. The PM2.5 concentration is the annual mean value from 2014 to 2019 (units: µg m−3). The elevation over the domain was obtained from a global digital elevation model with a resolution of .
The divergence of local PM2.5 flux can be taken as a metric for the PM2.5 budget in a specific region, with positive divergence indicating net outflow of air pollutants from the domain region, and vice versa. The daily mean divergence of the PM2.5 flux over the region of 34–40∘ N and 112–118∘ E is calculated according to Eq. (1):
where DZ and Dm are the zonal and meridional components of the net divergence of PM2.5 flux for the specific region. The parameters n and m indicate the meridional and zonal grid numbers of the domain. The subscripts E and W mark the variables at the longitudes of the eastern and western boundaries of the domain. Similarly, the subscripts S and N represent the values at the latitudes of the southern and northern boundaries. UEi (units in m s−1) indicates the 10 m zonal wind in the ith grid of the eastern boundary of the domain. QNj (units in µg m−3) is the spatially interpolated PM2.5 concentration in the jth grid at the latitude of the northern boundary. ΔX and ΔY represent the zonal and meridional distance of each grid (units in m). Due to the limited information on the vertical distribution of PM2.5 and the horizontal winds being closely related with PM2.5 concentration, as revealed by previous studies, the horizontal divergence of PM2.5 flux is used to evaluate the net inflow and outflow of local air pollutants in this study.
2.2 Thresholds for the decay process of air pollution episodes
Figure 2 shows the daily PM2.5 concentration variations of the 28 pollution channel cities from January to March 2019. PM2.5 concentrations exhibit a recurring smooth increase followed by a sharp decrease, which is known as a sawtooth cycle (Jia et al., 2008). During the developing phase of each pollution episode, the PM2.5 concentrations show the same smoothly increasing trend with slight differences in the increase rate in the 28 pollution channel cities (i.e., an average increase trend of 10.37±42.2 µg m−3 d−1 during January to March 2019). The inhomogeneity of the PM2.5 concentration increase in the 28 cities, indicated by the large standard deviation of increase trends (approximate 4 times the magnitude of the increase trend), may be due to the complicated physiochemical processes of haze formation. By contrast, as shown by dotted lines in Fig. 2, regional synchronous decreases in PM2.5 concentrations occur in the decay phase of pollution episodes with an average trend of . Most of the consistent improvements in air quality in the decay phase can be attributed to the effects of the synoptic system. Therefore, in this study, if more than 40 % of the 28 pollution channel cities with the day-to-day PM2.5 concentrations decreased by 30 % (relative to the value of the previous day) or more than 60 % of the channel cities with PM2.5 concentrations decreased by 30 % in two successive days, it can be defined as the occurrence of the decay phase of pollution episodes. If two consecutive days were defined as the decay phase, only the first day was selected as valid and retained. In total, 365 d are identified as the decay phase of pollution episodes from January 2015 to March 2020 (see Fig. 4) and are used for the synoptic pattern classification.
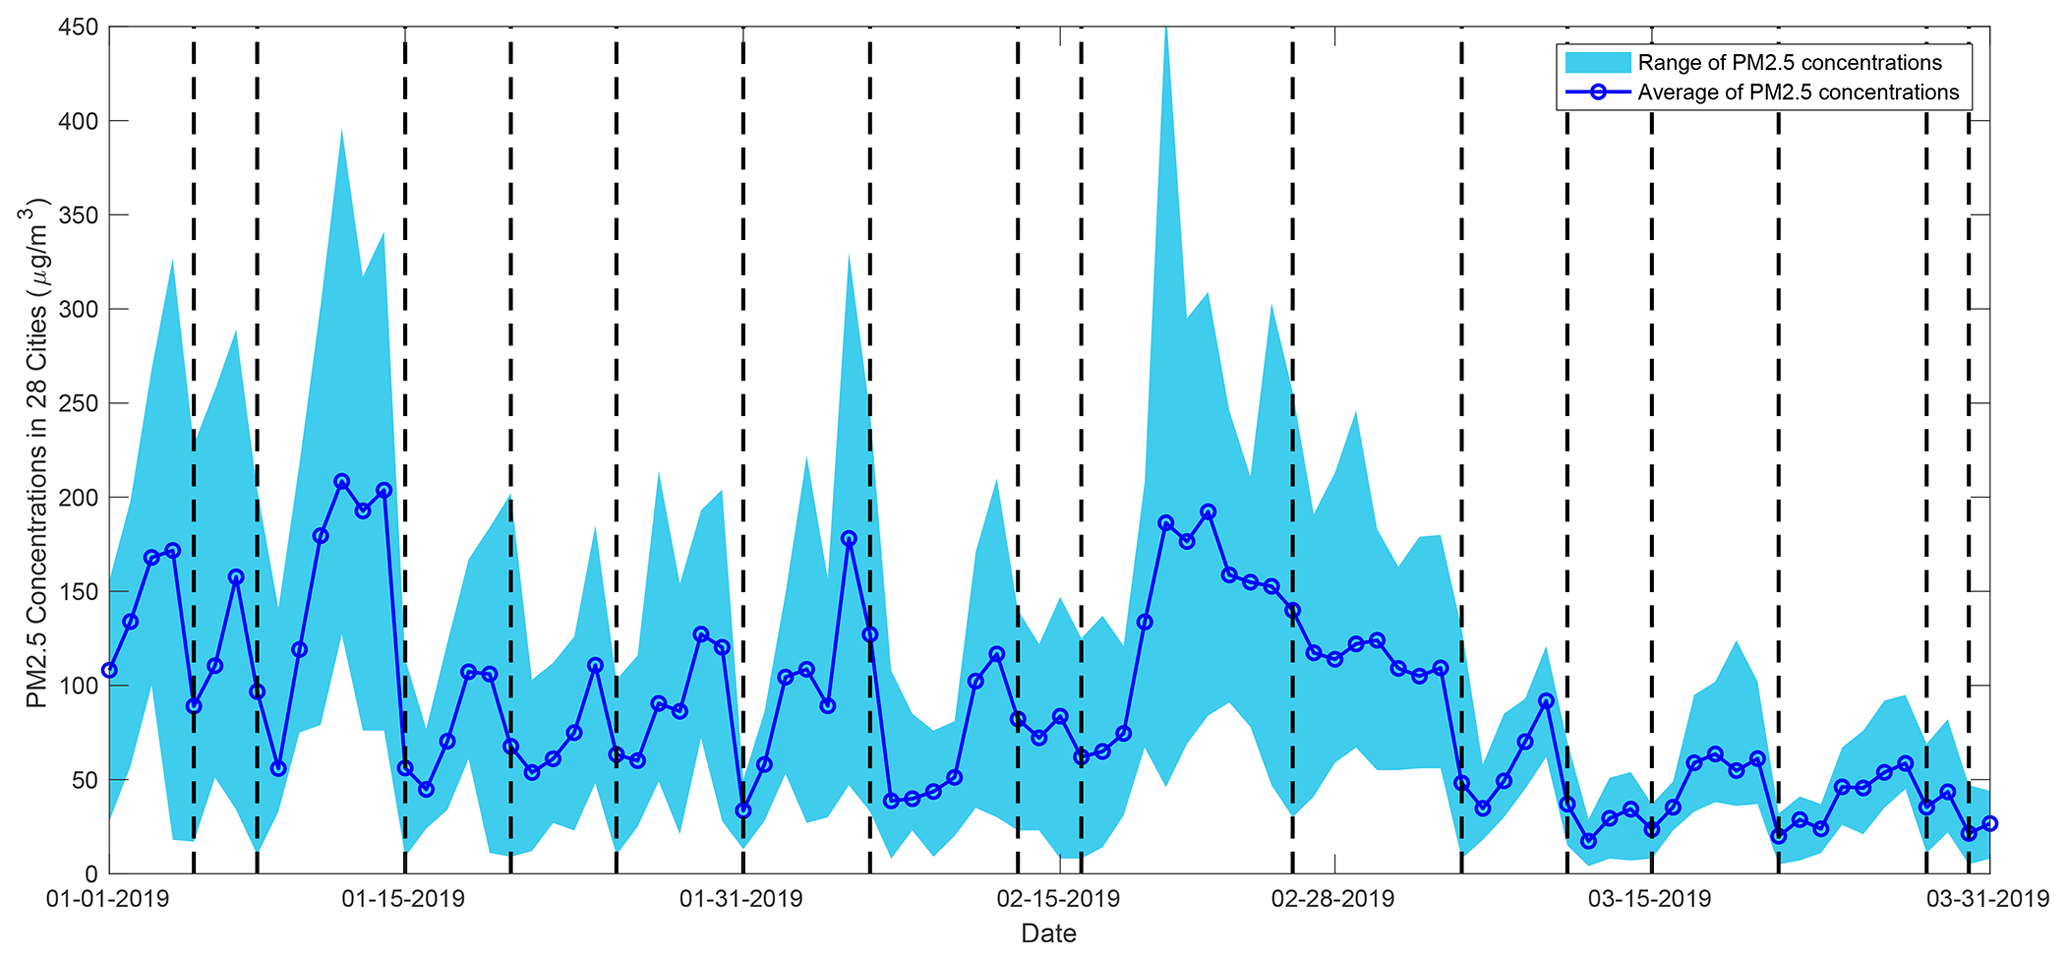
Figure 2Time series of daily mean PM2.5 concentrations in the 28 pollution channel cities from January to March 2019 (units: µg m−3).
2.3 Method of synoptic circulation classification
The T-mode principal component analysis (PCA) method was used to objectively classify the type of synoptic system dominating the decay phase of pollution episodes, as this method has an outstanding performance in terms of the reproduction of predefined types and temporal–spatial stabilities (Huth et al., 2008; Cavazos, 2000; Tie et al., 2015; Valverde et al., 2015; Xu et al., 2016). The T-mode PCA has been widely used to investigate the general circulation patterns, climate change and air quality and has been incorporated into the European Cooperation in Science and Technology (COST) plan 733 toolbox (COST733Class: https://projects.met.no/cost733/, last access: 12 February 2021) (Philipp et al., 2014). The daily mean geopotential height (Z), U and V components at 925 hPa on the 365 decay phase days are used for synoptic pattern classification. To exclude the effects of seasonal variation on atmospheric circulation and to ensure that different synoptic patterns in the same season are comparable, the T-mode PCA method is applied to the four seasons respectively. The target region is 32–44∘ N and 110–122∘ E, as shown in Fig. 1. For each season, the three input data matrixes (U, V and Z) have temporal and spatial dimensions, with spatial grids and time series represented by rows and columns, respectively. To speed up computations of the T-mode PCA in the COST733 toolbox, each matrix is first divided into 10 subsets. Then, the principal components (PCs) are determined using the singular value decomposition for each subset, and an oblique rotation is applied to the PCs to achieve better classification effects. The 10 classifications based on the subsets are evaluated by the chi-square test, and the subset with the highest sum is selected and assigned to a type.
The Lamb–Jenkinson–Collison (JCT) type classification is also a widely adopted method to identify synoptic circulation pattern, by describing the location of cyclonic/anticyclonic centers and the direction of the geostrophic flow (Li et al., 2020; Fan et al., 2015; Jiang et al., 2020; Chen, 2000; Jenkinson and Collison, 1977). In order to verify the robustness of circulation classification results of PCA method, the JCT method is also involved based on daily mean gridded sea level pressure at 16 points centered at 37∘ N and 117∘ E as shown in SI. Figs. S1 and S3 in the Supplement show that the PCA and JCT methods have a similar circulation pattern, indicating the consistency of the two classification methods. Because the JCT method is specialized in classifying daily mean sea level pressure patterns, which will ignore the thresholds of some other meteorological variables to some extent (Philipp et al., 2014), we only focus on the results of PCA hereafter.
3.1 Identification of the occurrence of the decay process of air pollution episodes
The magnitude of the day-to-day variation in PM2.5 concentrations is an important metric for recognizing the occurrence of the decay phase of air pollution. Figure 3 shows the frequency of the relative day-to-day PM2.5 concentration differences in the 28 pollution channel cities during the period of January 2014 to March 2020. Table 1 summarizes the occurrence frequency of the day-to-day PM2.5 differences in the specific segment. It shows that a fatter-tailed probability distribution exists in winter than in summer; thus, winter features a lower probability of weak PM2.5 variations and a higher probability of strong PM2.5 variations, indicating greater day-to-day variability in PM2.5 concentrations. In winter, 8.6 % of PM2.5 concentrations decreased by over 60 %, and 14.9 % increased by more than 80 %, whereas, in summer, the values were only 2.4 % and 6.6 %. A total of 38.3 % of the cases show day-to-day PM2.5 variations within the range of −20 % to 40 % in winter, but a total of 55.6 % is observed in summer. The PM2.5 variations in spring and autumn exhibit almost the same distribution patterns, with a relatively higher frequency of strong PM2.5 variations in autumn. Generally, the probability distributions in spring and autumn are between those of summer and winter. The stronger day-to-day decreases in PM2.5 concentrations, particularly the sharp wintertime reductions, may be attributable to the passage of a cold-front synoptic system, and the results suggest that the winter PM2.5 variations are the most sensitive to synoptic patterns.
Table 1Frequency of the relative day-to-day PM2.5 difference within the specific range.
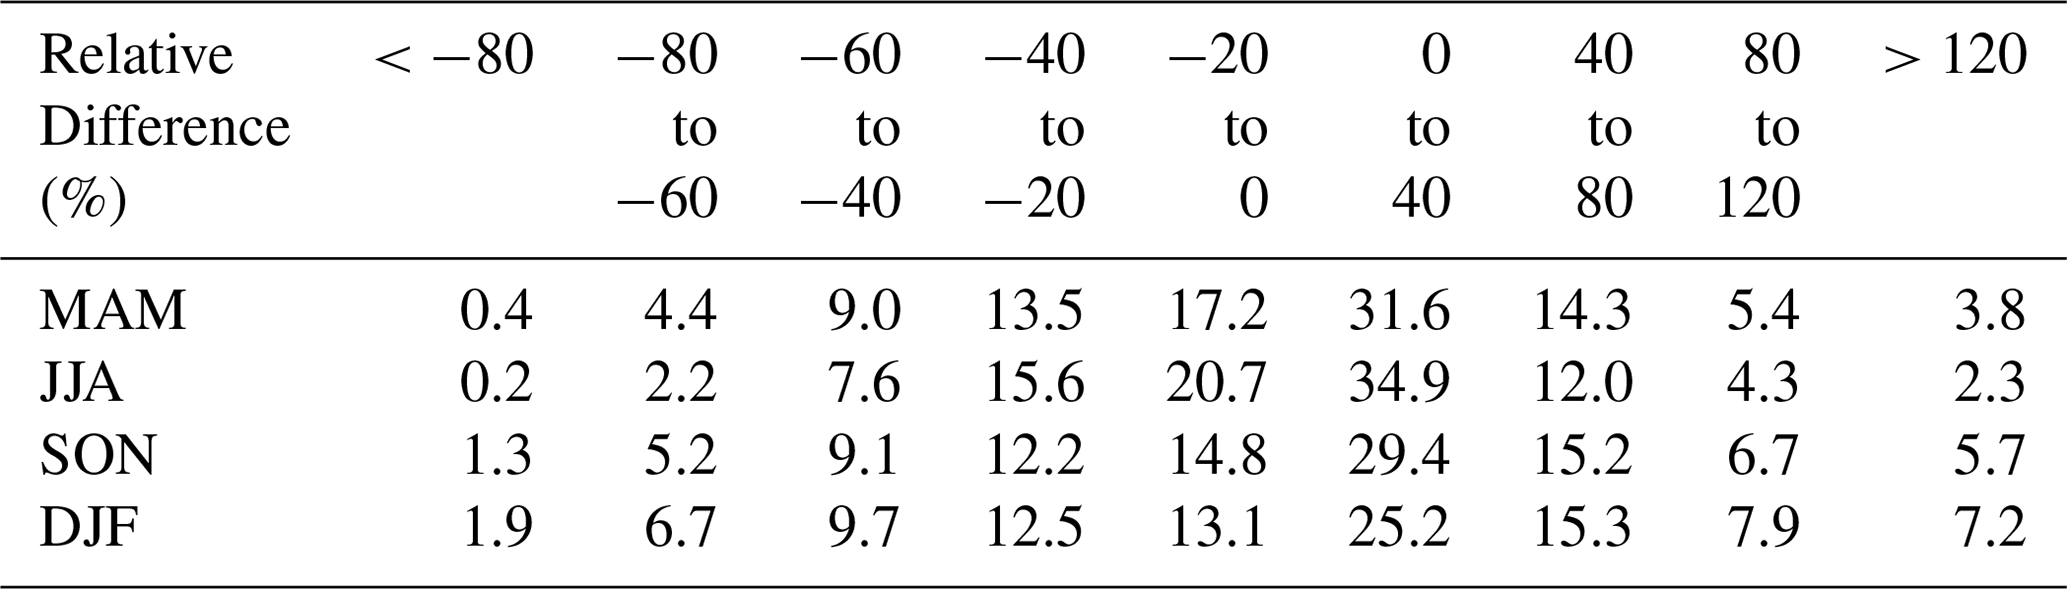
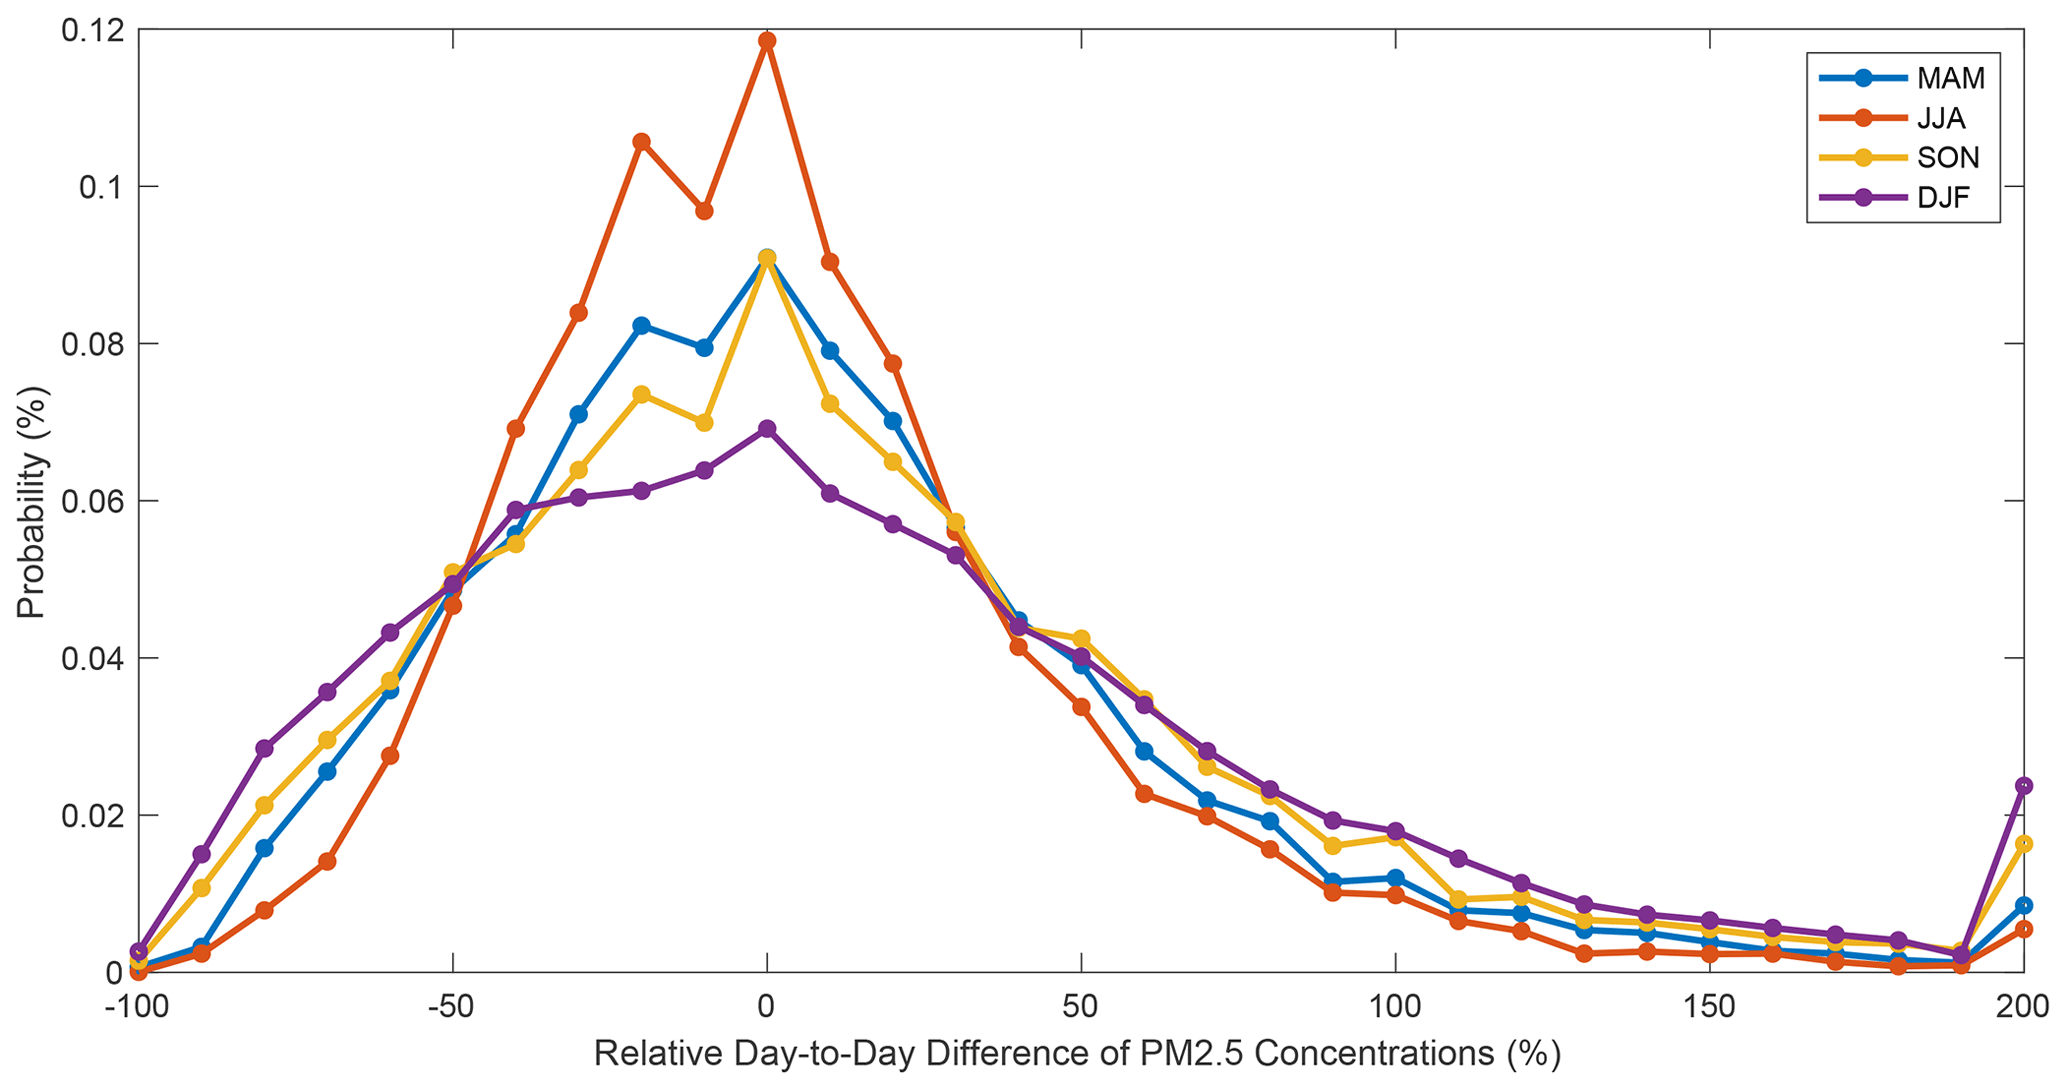
Figure 3Probability distribution of the relative day-to-day difference of PM2.5 concentrations. The relative difference is based on the PM2.5 concentration on the previous day. The distributions in spring and autumn are combined in the upper panel, and cases in winter and summer are shown at the bottom.
According to the occurrence of day-to-day PM2.5 differences in the 28 pollution channel cities, i.e., thresholds for the decay phase of air pollution episodes in Sect. 2.2, 365 decay processes have been recognized from January 2014 to March 2020. If the daily mean accumulated precipitation amount is more than 1 mm for all the grid cells in the region of 36–42∘ N and 113–117.5∘ E (covering the 28 cities), the specific day is defined as a rainy day with effective wet deposition. Out of 365 decay phases, 97 are defined as rainy days, in which case the abrupt decrease in ambient PM2.5 concentrations are assumed to be related to wet deposition. Only the decay processes on dry days are involved in the synoptic pattern classification in the following work. Figure 4 shows the annual cycle of the decay process frequencies in a specific year. In most years, the figure shows a two-peak annual cycle of the decay phase frequency with a valley in summer, and the valley becomes deeper after removing the rainy cases. There are 105 (105), 62 (21), 86 (56) and 112 (109) decay process days in spring, summer, autumn and winter for all (dry-day) cases, respectively. Approximately 70 % of the regional sharp reduction in summer can be attributed to the effect of wet deposition.
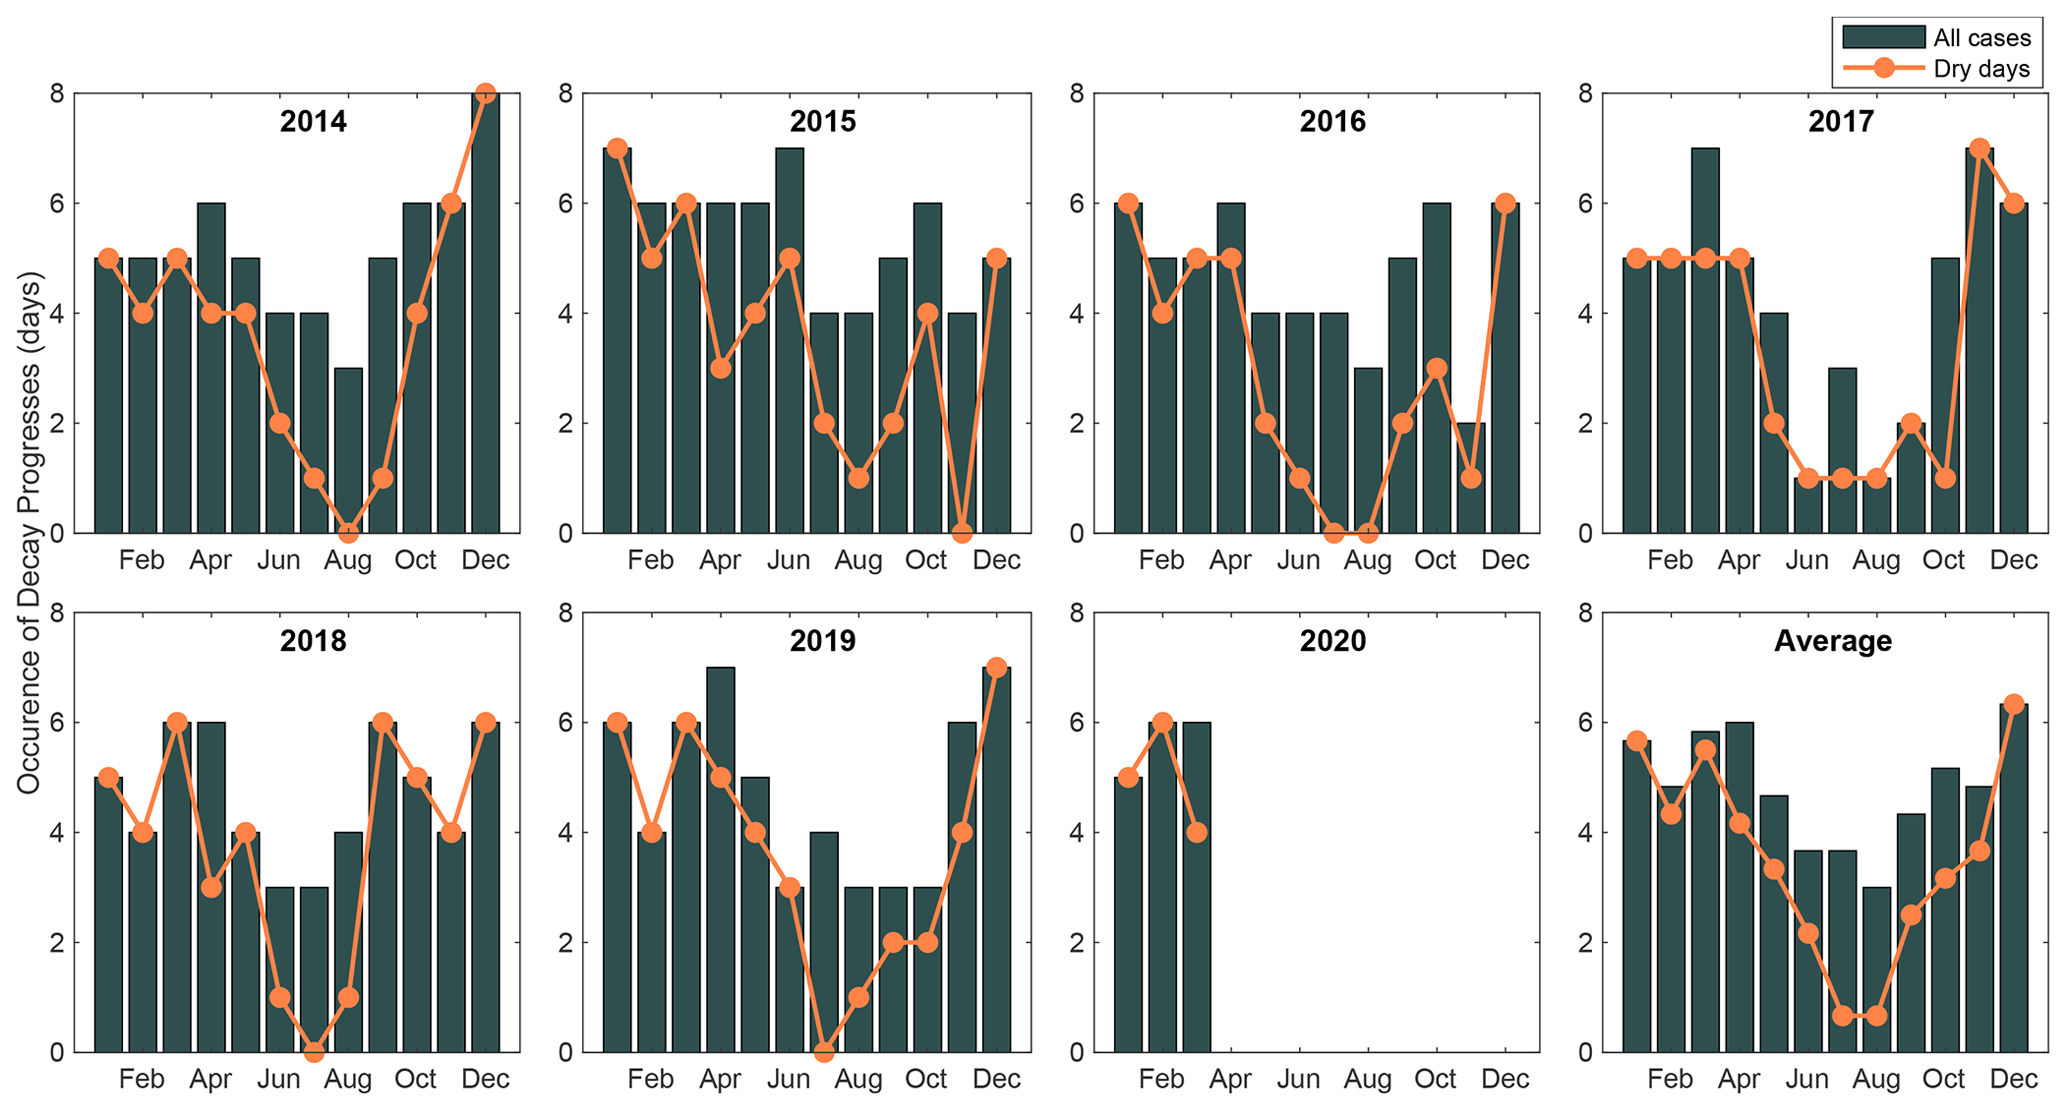
Figure 4Monthly cumulative occurrence of the decay processes of pollution episodes. The orange curve indicates the decay process occurrences on dry days. In total, 365 decay processes are identified from January 2014 to March 2020, and 97 of them are associated with precipitation levels greater than 10 mm d−1.
3.2 Classification of the synoptic circulation dominating the decay processes of air pollution episodes
T-mode PCA circulation classification has been applied to the dry-day decay process in individual seasons. Figures S1 and 5 show the original and anomalous circulation patterns at 925 hPa under each circulation type (CT) condition. Two dominant CTs are identified in summer. Three CTs are identified for each of the other seasons, respectively. The three dominant CTs in spring show almost the same pattern as those of autumn and winter, and only the occurrence frequency of the CTs differ among the seasons. The strong prevailing northwesterly wind in the CT2 condition is the commonly accepted synoptic circulation favorable for the rapid decay of pollution episodes in the BTH region, and CT2 is also the most frequent CT for the decay phase in autumn and winter. A large-scale high-pressure system covers the region of central-western Mongolia, northern Xinjiang, Inner Mongolia and Shaanxi Province in China. Deep low pressure is situated in northeastern China and northern Japan. The BTH region is located between the east of the anticyclone and west of the cyclone and is dominated by strong northwesterly surface winds with speeds of 2.98–3.88 m s−1 in different seasons. The northwesterly wind corresponds to the significant northerly wind anomaly, which is beneficial for the transport of cold, clean and dry air masses southward. Although it shows downward motion due to the upper westerly wind passing the leeward side (see Fig. 6), the other meteorological variables summarized in Fig. 7 reveal that the highest wind speed, the highest BLH and the lowest relative humidity occur under CT2 conditions, all of which are favorable for the reduction of PM2.5 concentrations. Figures 8 and S4 exhibits the distribution of PM2.5 flux divergence over the region of 34–40∘ N and 112–118∘ E, and its zonal and meridional components, with positive divergence indicating net horizontal outflow of air pollutants from the BTH region, and negative divergence indicating the opposite. The PM2.5 flux divergence is found to have significantly positive values in most of the CTs, indicating that the local ambient PM2.5 concentrations decrease with the horizontal removal of the polluted air mass or the replacement by clean air. As shown in Fig. S4, the positive divergence of the PM2.5 flux in CT2 is mainly contributed by the significant outflow of air pollutants from eastern and southern edges. Clean, dry and strong northwesterly winds in the CT2 condition are the major drivers of the decay process of air pollution episodes.
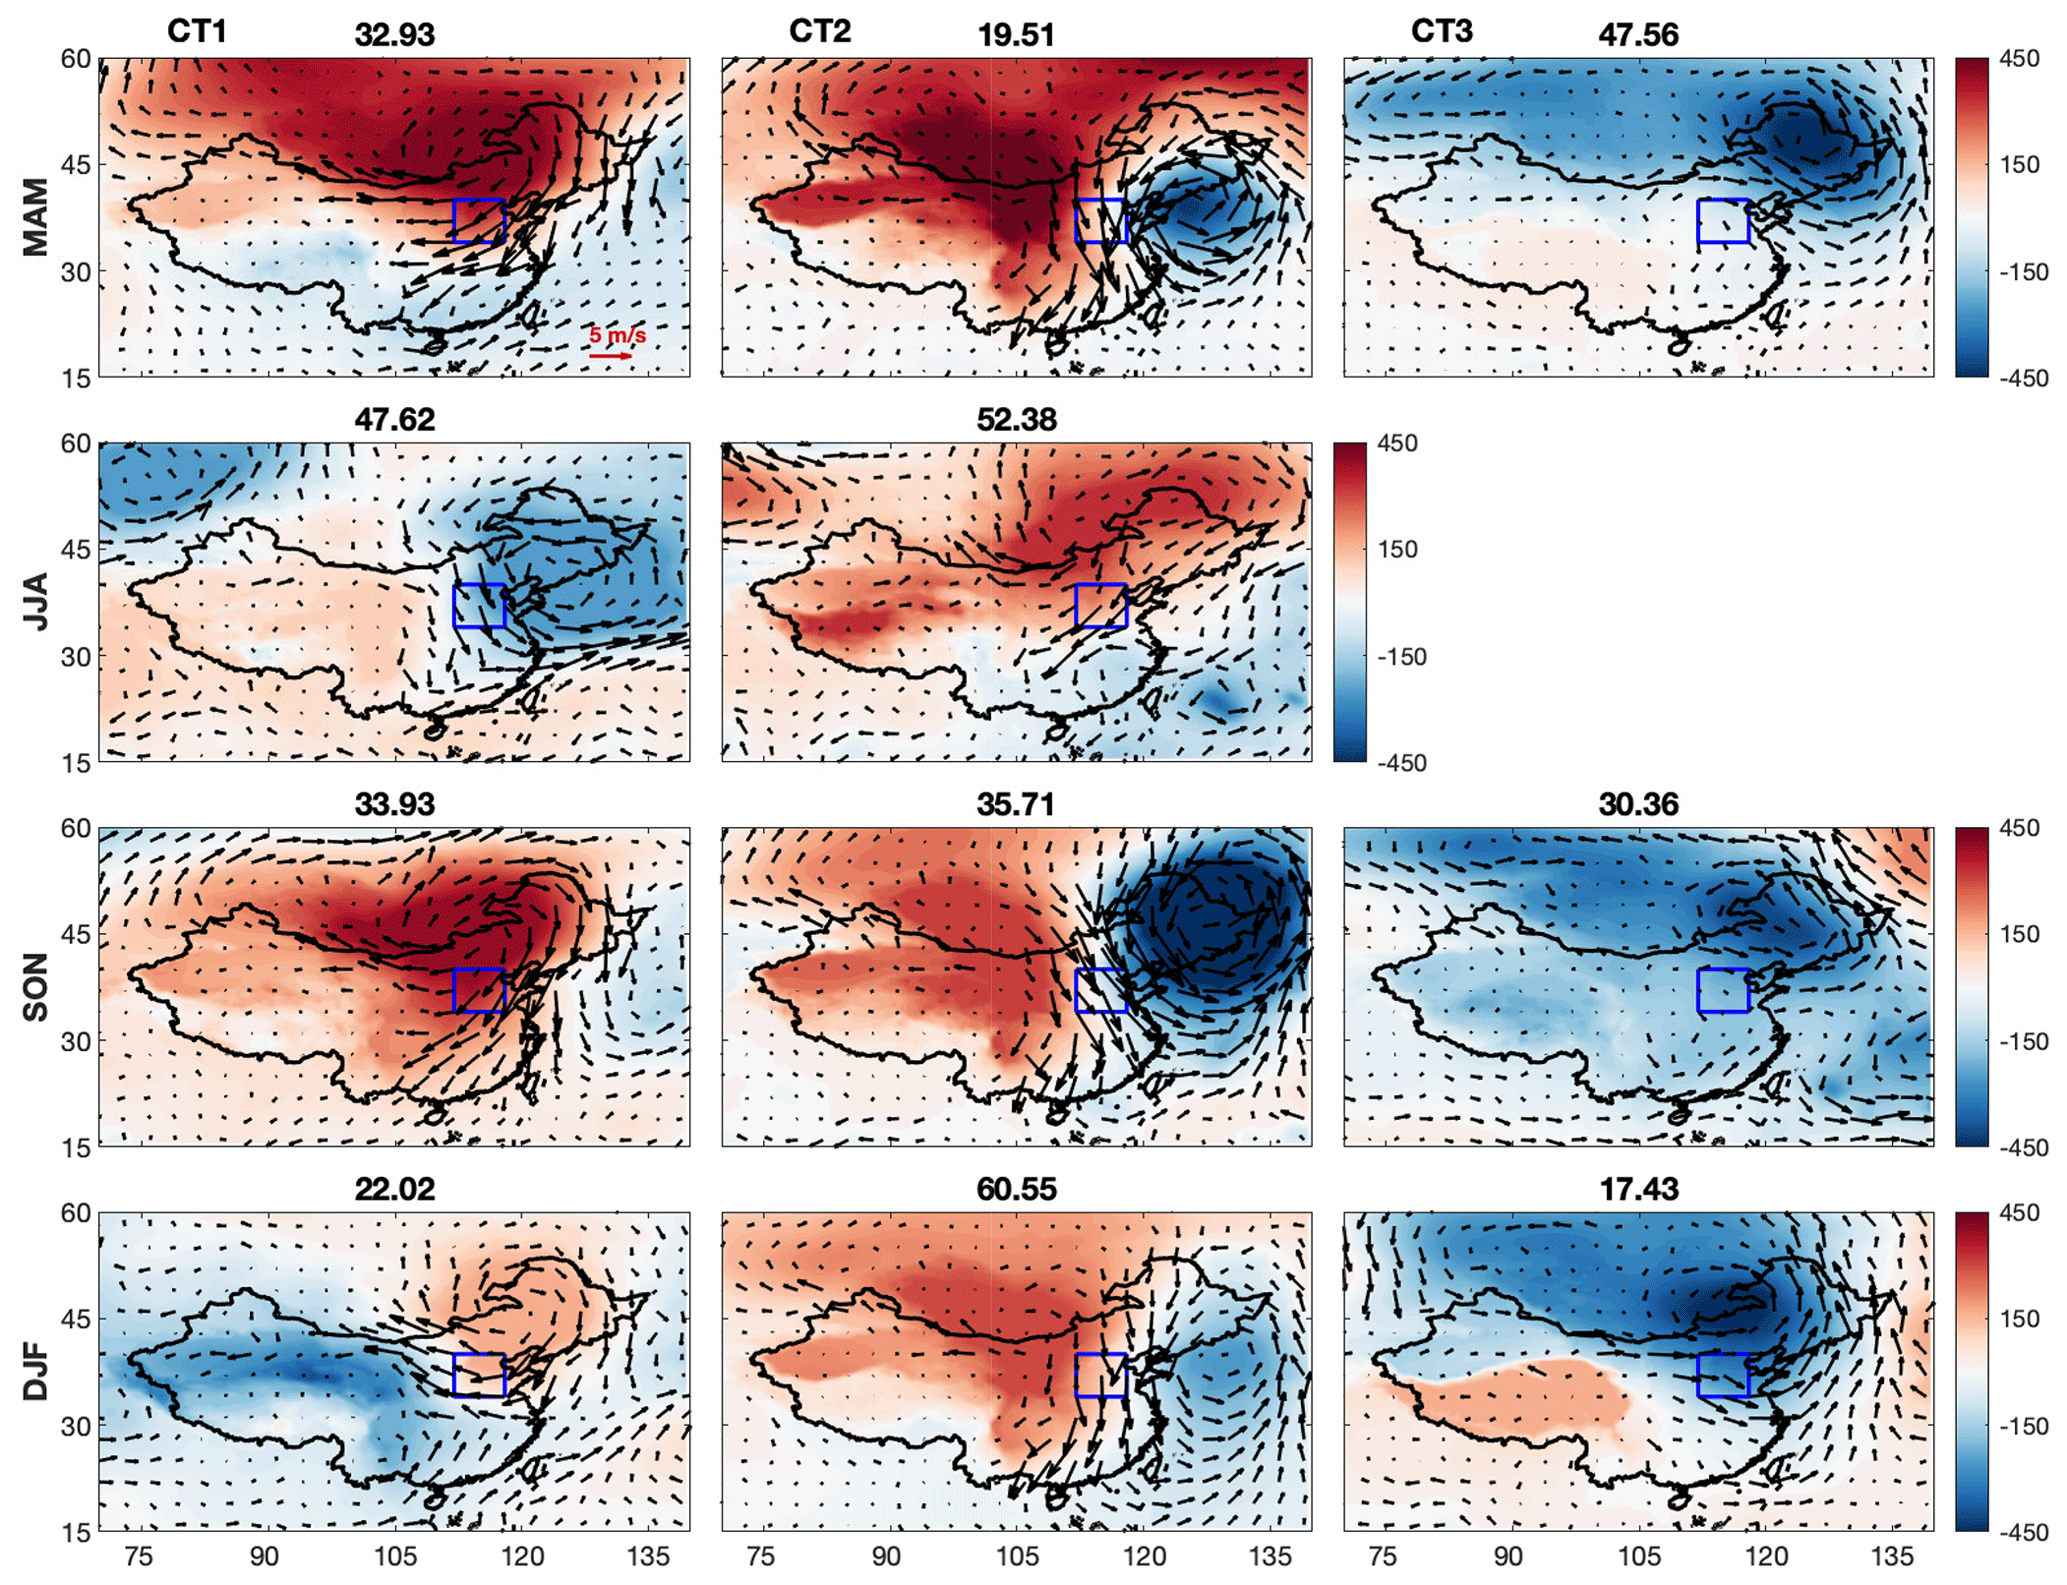
Figure 5Distribution of the geopotential height anomalies (shaded, unit: m2 s−2) and wind field anomalies at 925 hPa for each circulation type. The number over each subplot indicates the occurrence frequency of the specific circulation type. The solid blue box is the location of the domain region covering the 28 pollution channel cities.
For CT1 in spring, autumn and winter, a surface high-pressure system initiates from the Siberian region and slants forward to central Inner Mongolia and the BTH region, resulting in a position that is more northeastward than the anticyclonic circulation in CT2 (Fig. S1). Most areas in China are controlled by a high-pressure system. The BTH region is located on the southeastern edge of the anomalous anticyclone and dominated by a remarkable northeasterly wind anomaly. The average surface wind speed is 2.63–3.02 m s−1, which is higher than the seasonal mean but not as high as that under CT2 conditions. Although all the surface wind speed, BLH and relative humidity show favorable patterns for air pollutant diffusion under CT1 conditions, the magnitudes of the above anomalies are not as significant as those under CT2 conditions. Therefore, there must be other mechanisms responsible for the decay process of pollution episodes that are distinct from those of CT2, as is generally believed. The northeasterly wind anomaly brings clean and dry air masses to the BTH region and increases the outward and southward transport of local air pollutants in the meantime, which results in the negative relative humidity anomaly shown in Fig. 7. The net divergence of air pollutants (i.e., positive divergence of the PM2.5 flux in Fig. 8) is the most significant under CT1 conditions, indicating the contribution of horizontal transport to the rapid decay of pollution episodes. The net outflow of pollutants is attributed to the significant positive divergence of PM2.5 flux in the southern edge (Fig. S4). In terms of vertical anomalous circulation, the BTH region is located under the east of a high-level ridge and west of a high-level trough (Fig. S5 in the Supplement), where there is often upper-level convergence that causes the surface high-pressure anomaly to get higher (see Fig. 5). The upper-level convergence leads to the vertical sinking in the east of the BTH region, which also delivers upper dry and clean air to the surface. In addition, as shown in Fig. 6, the significant clean vertical sinking airflow in the east of the BTH region combined with the surface easterly wind anomaly results in air movement westward across the domain and climbs up along the western mountain region. The upward flow carries the near-surface air pollutants to the upper level of the boundary layer, where the pollution quickly spreads to the free atmosphere due to the effective entrainment caused by the strong wind shear at the top of the boundary layer (see Fig. 6). In general, the remarkable horizontal net outflow of air pollutants, negative humidity anomaly and effective outward spread of air pollutants to the free atmosphere promote the abrupt reduction of local PM2.5 concentrations.
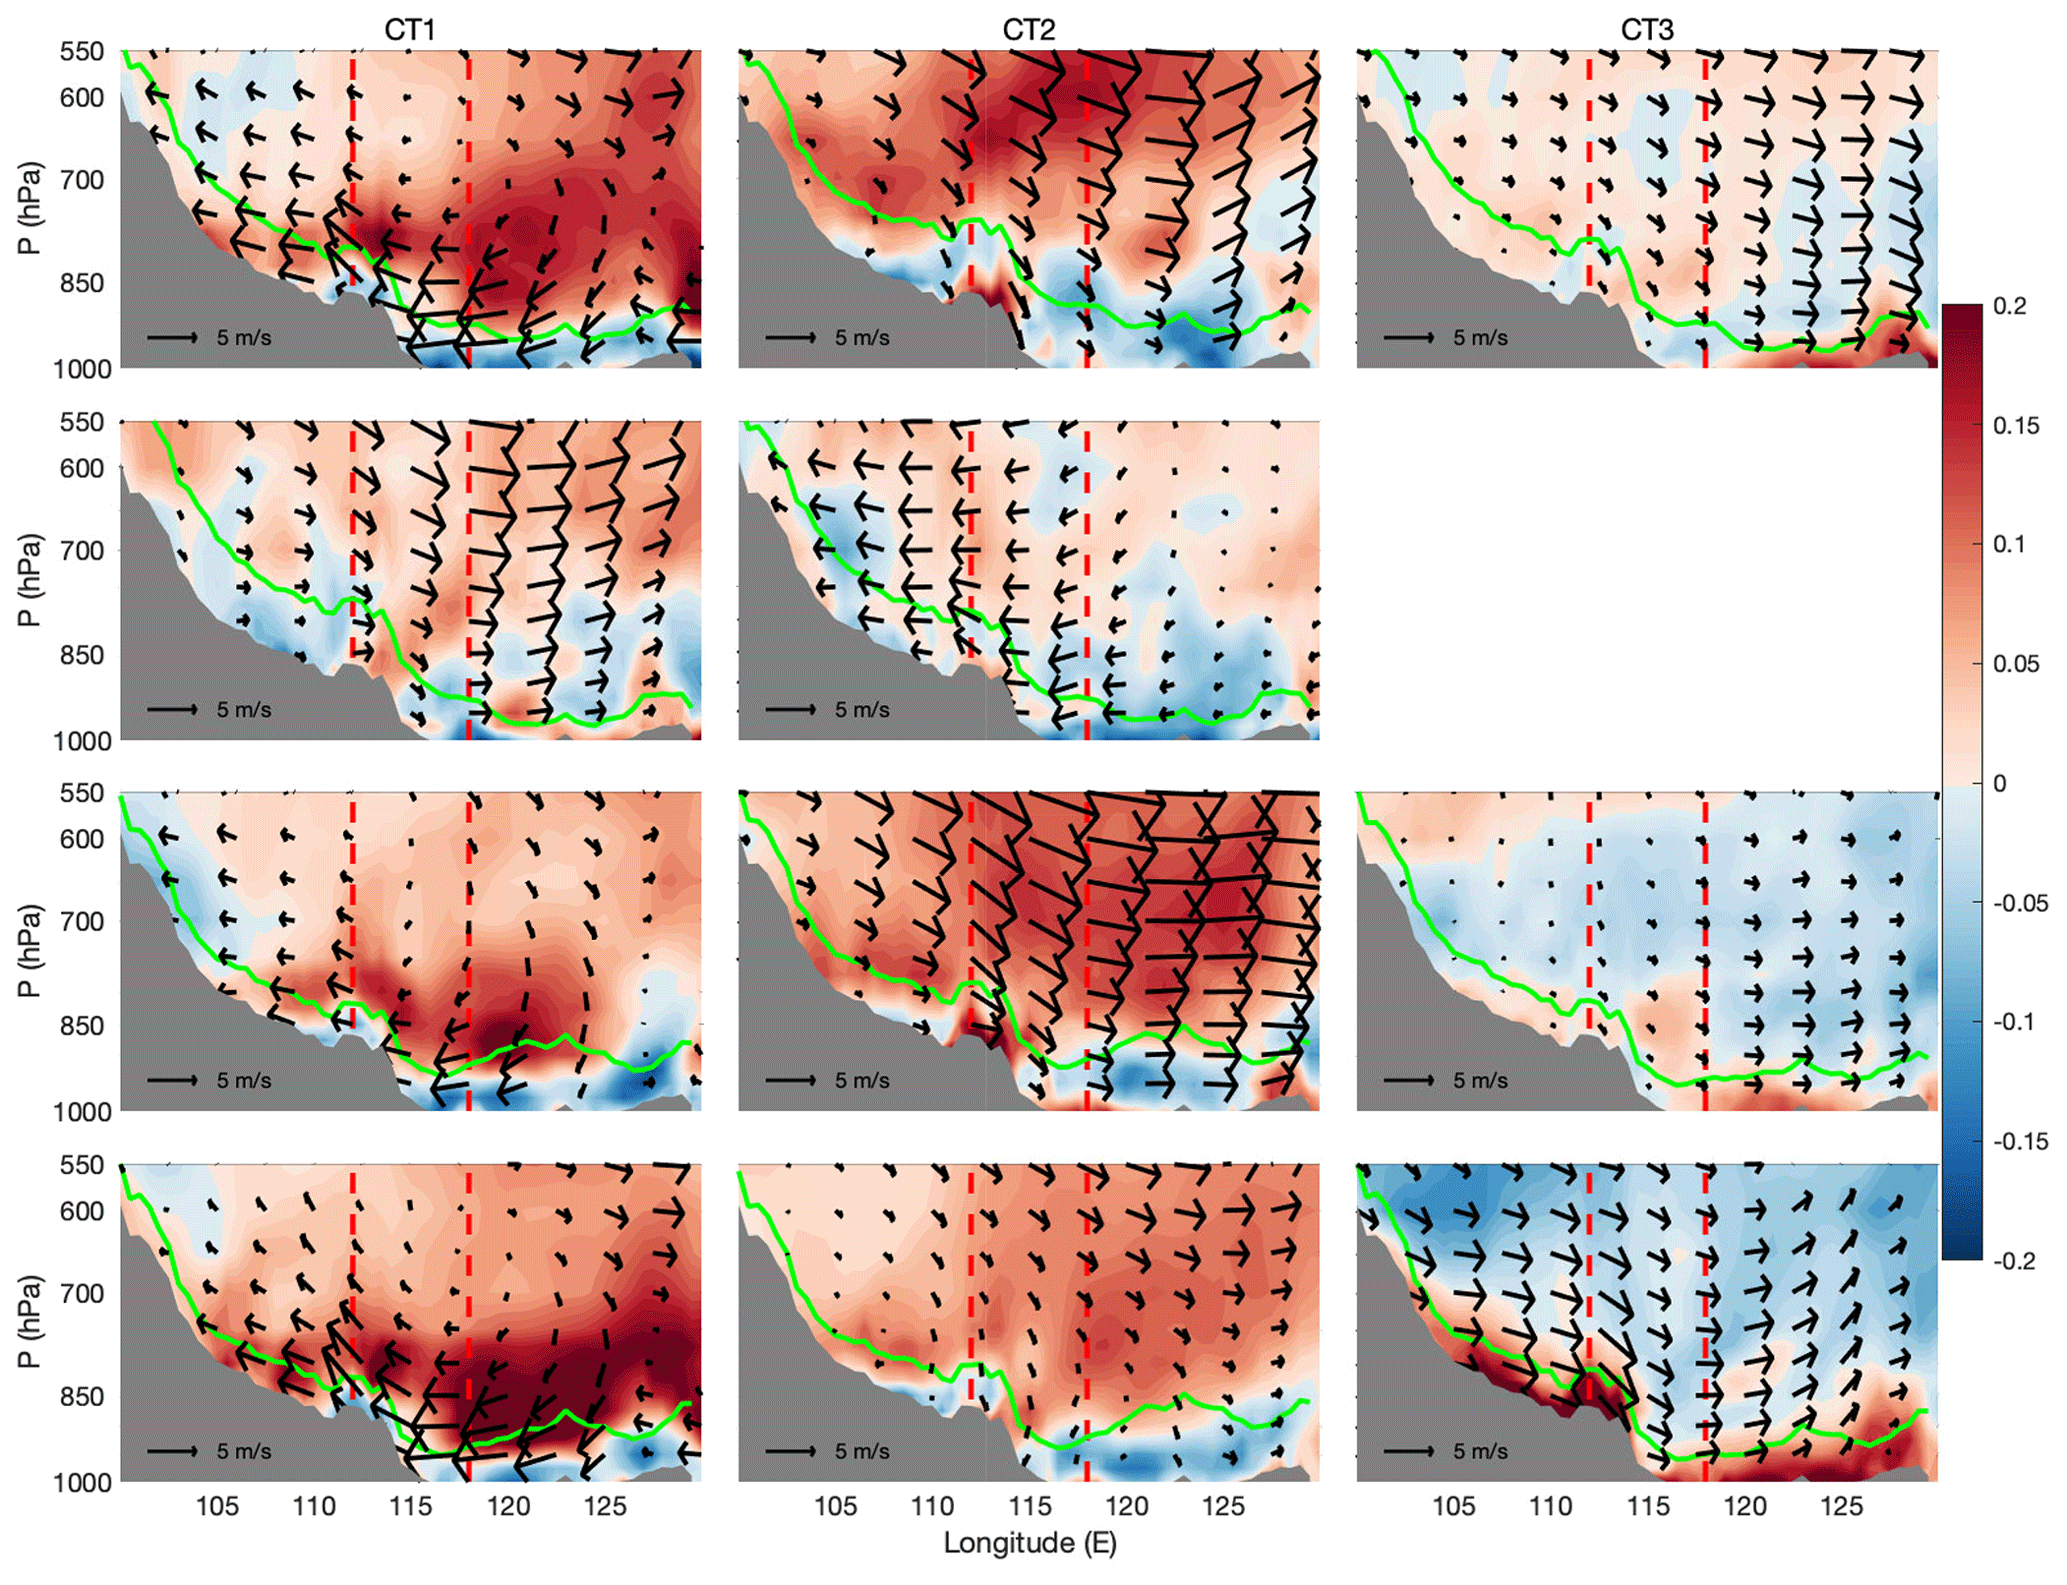
Figure 6Zonal averaged profile of the distribution of vertical wind shear anomalies in the domain region (shaded, units: ) and the vertical and zonal circulation anomalies. The green line indicates the average location of the top of the boundary layer. Zonal wind shear, circulation and boundary layer height are the average values between 34–40∘ N. The two dashed lines are the eastern and western boundaries of the domain (112–118∘ E). The grey region indicates the average altitude between 34–40∘ N.
CT3 is the dominant synoptic pattern for the decay process in spring, with the highest frequency of 47 %, compared with frequencies of 30 % and 17 % in autumn and winter. In this kind of circulation pattern, there is only a closed low-pressure system located over the northeastern China, with large pressure gradients around the cyclone and weak gradients over most parts of China (Fig. S1). The BTH region borders the cyclone system to the northeast, which leads to a prevailing westerly wind with speeds of 2.29–3.07 m s−1. The low-pressure and westerly wind features are more significant based on the anomalous circulation in Fig. 5, especially in winter. As shown in Fig. S5, a deep trough persists in the northern BTH region in 500 hPa, bringing cold air masses from the northwest. According to the distribution of 24 h backward trajectories of Beijing in Fig. S6 in the Supplement, the northwesterly cold and dry air masses are taking to the domain, benefiting the decay of local pollution episodes. Similar to CT1 and CT2, negative relative humidity anomalies and positive surface wind speed anomalies are also favorable for the decay of pollution episodes. Given the distribution of the BLH, there is no significant positive anomaly signal in CT3, unlike in CT1 and CT2. Although a moderate BLH is observed under CT3 conditions, strong vertical wind shear occurs near the surface, as shown in Fig. 6, which results in more uniform vertical distribution of air pollutants in the boundary layer. Moreover, obvious horizontal PM2.5 divergence also provides a possibility for the decay of air pollution episodes. To be more precise, the zonal divergence of the PM2.5 flux dominates the net divergence of the whole region, rather than the meridional component as in the other two circulation patterns (Fig. 8 and Fig. S2 in the Supplement). The inflow of clean and dry air masses combined with the good performance of boundary layer mixing are the main reasons for the immediate improvement of air quality when CT3 occurs.
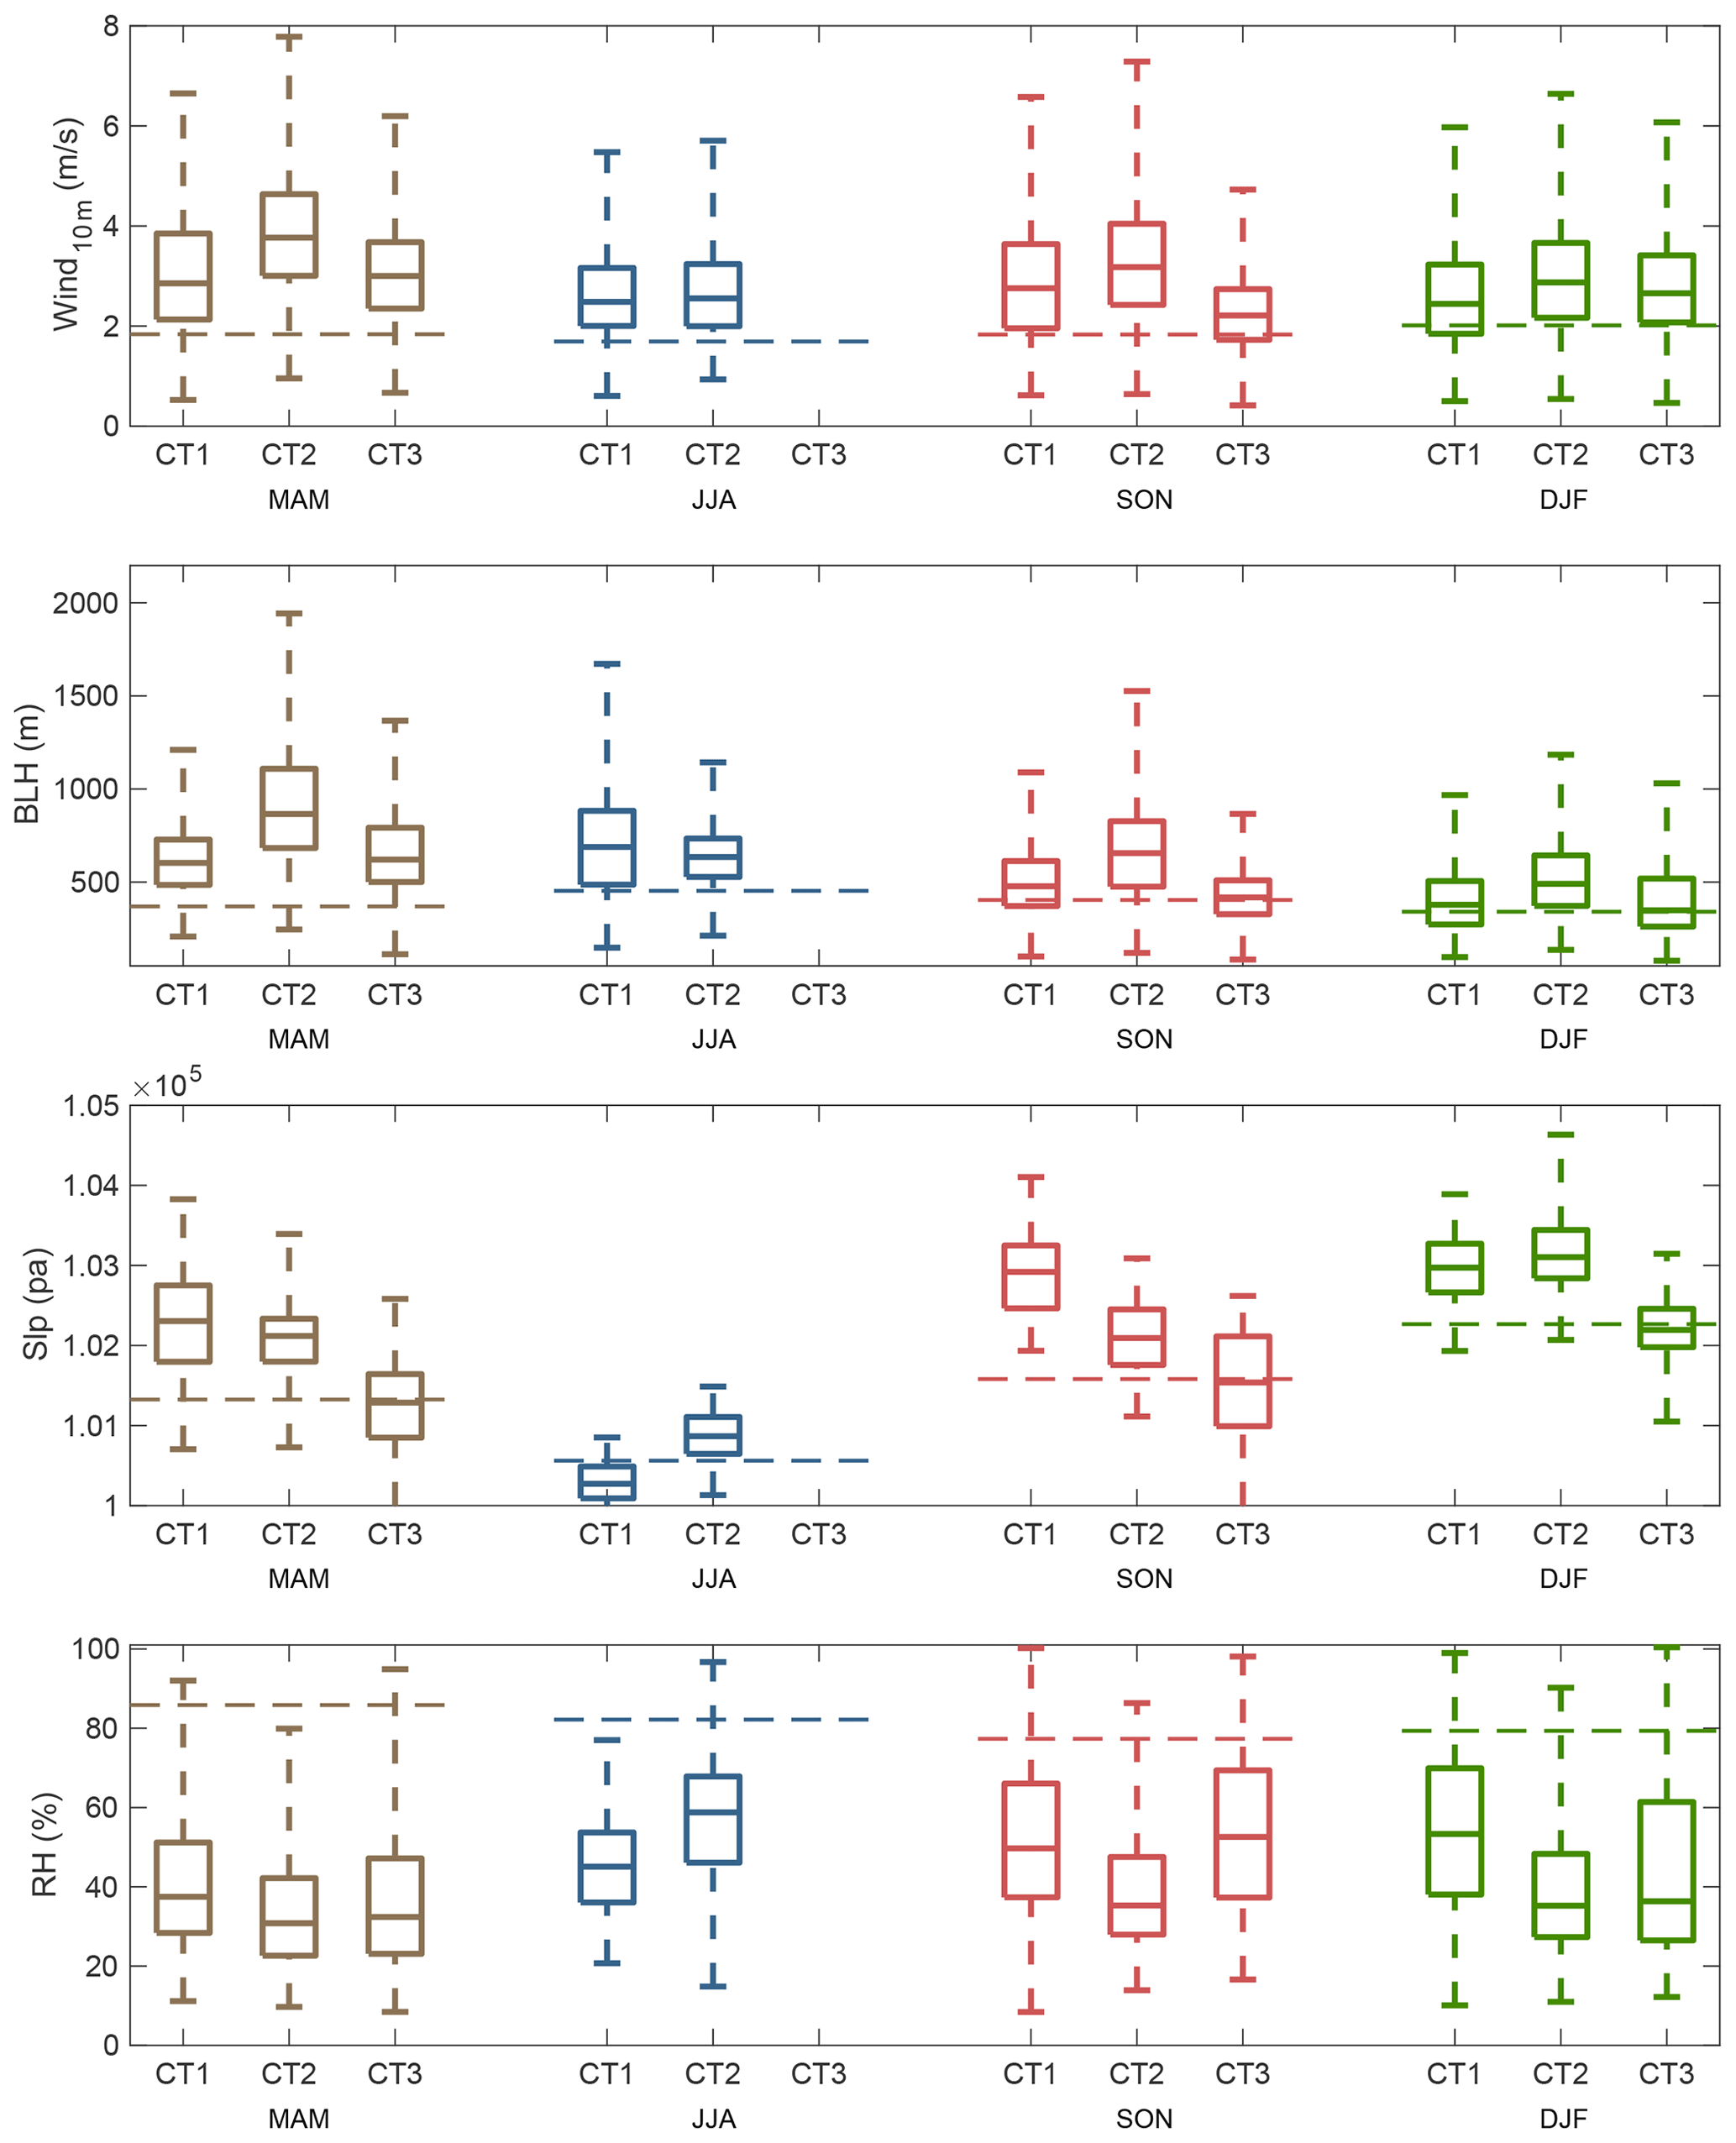
Figure 7Boxplot of surface wind speed, boundary layer height (BLH), sea level pressure (slp) and relative humidity (RH) for each circulation type. The dashed line indicates the seasonal mean of the specific variables. The mean values of all of the meteorological variables in each CT are significantly different with their seasonal mean based on a two-tailed Student's t test at a significance level of 0.01.
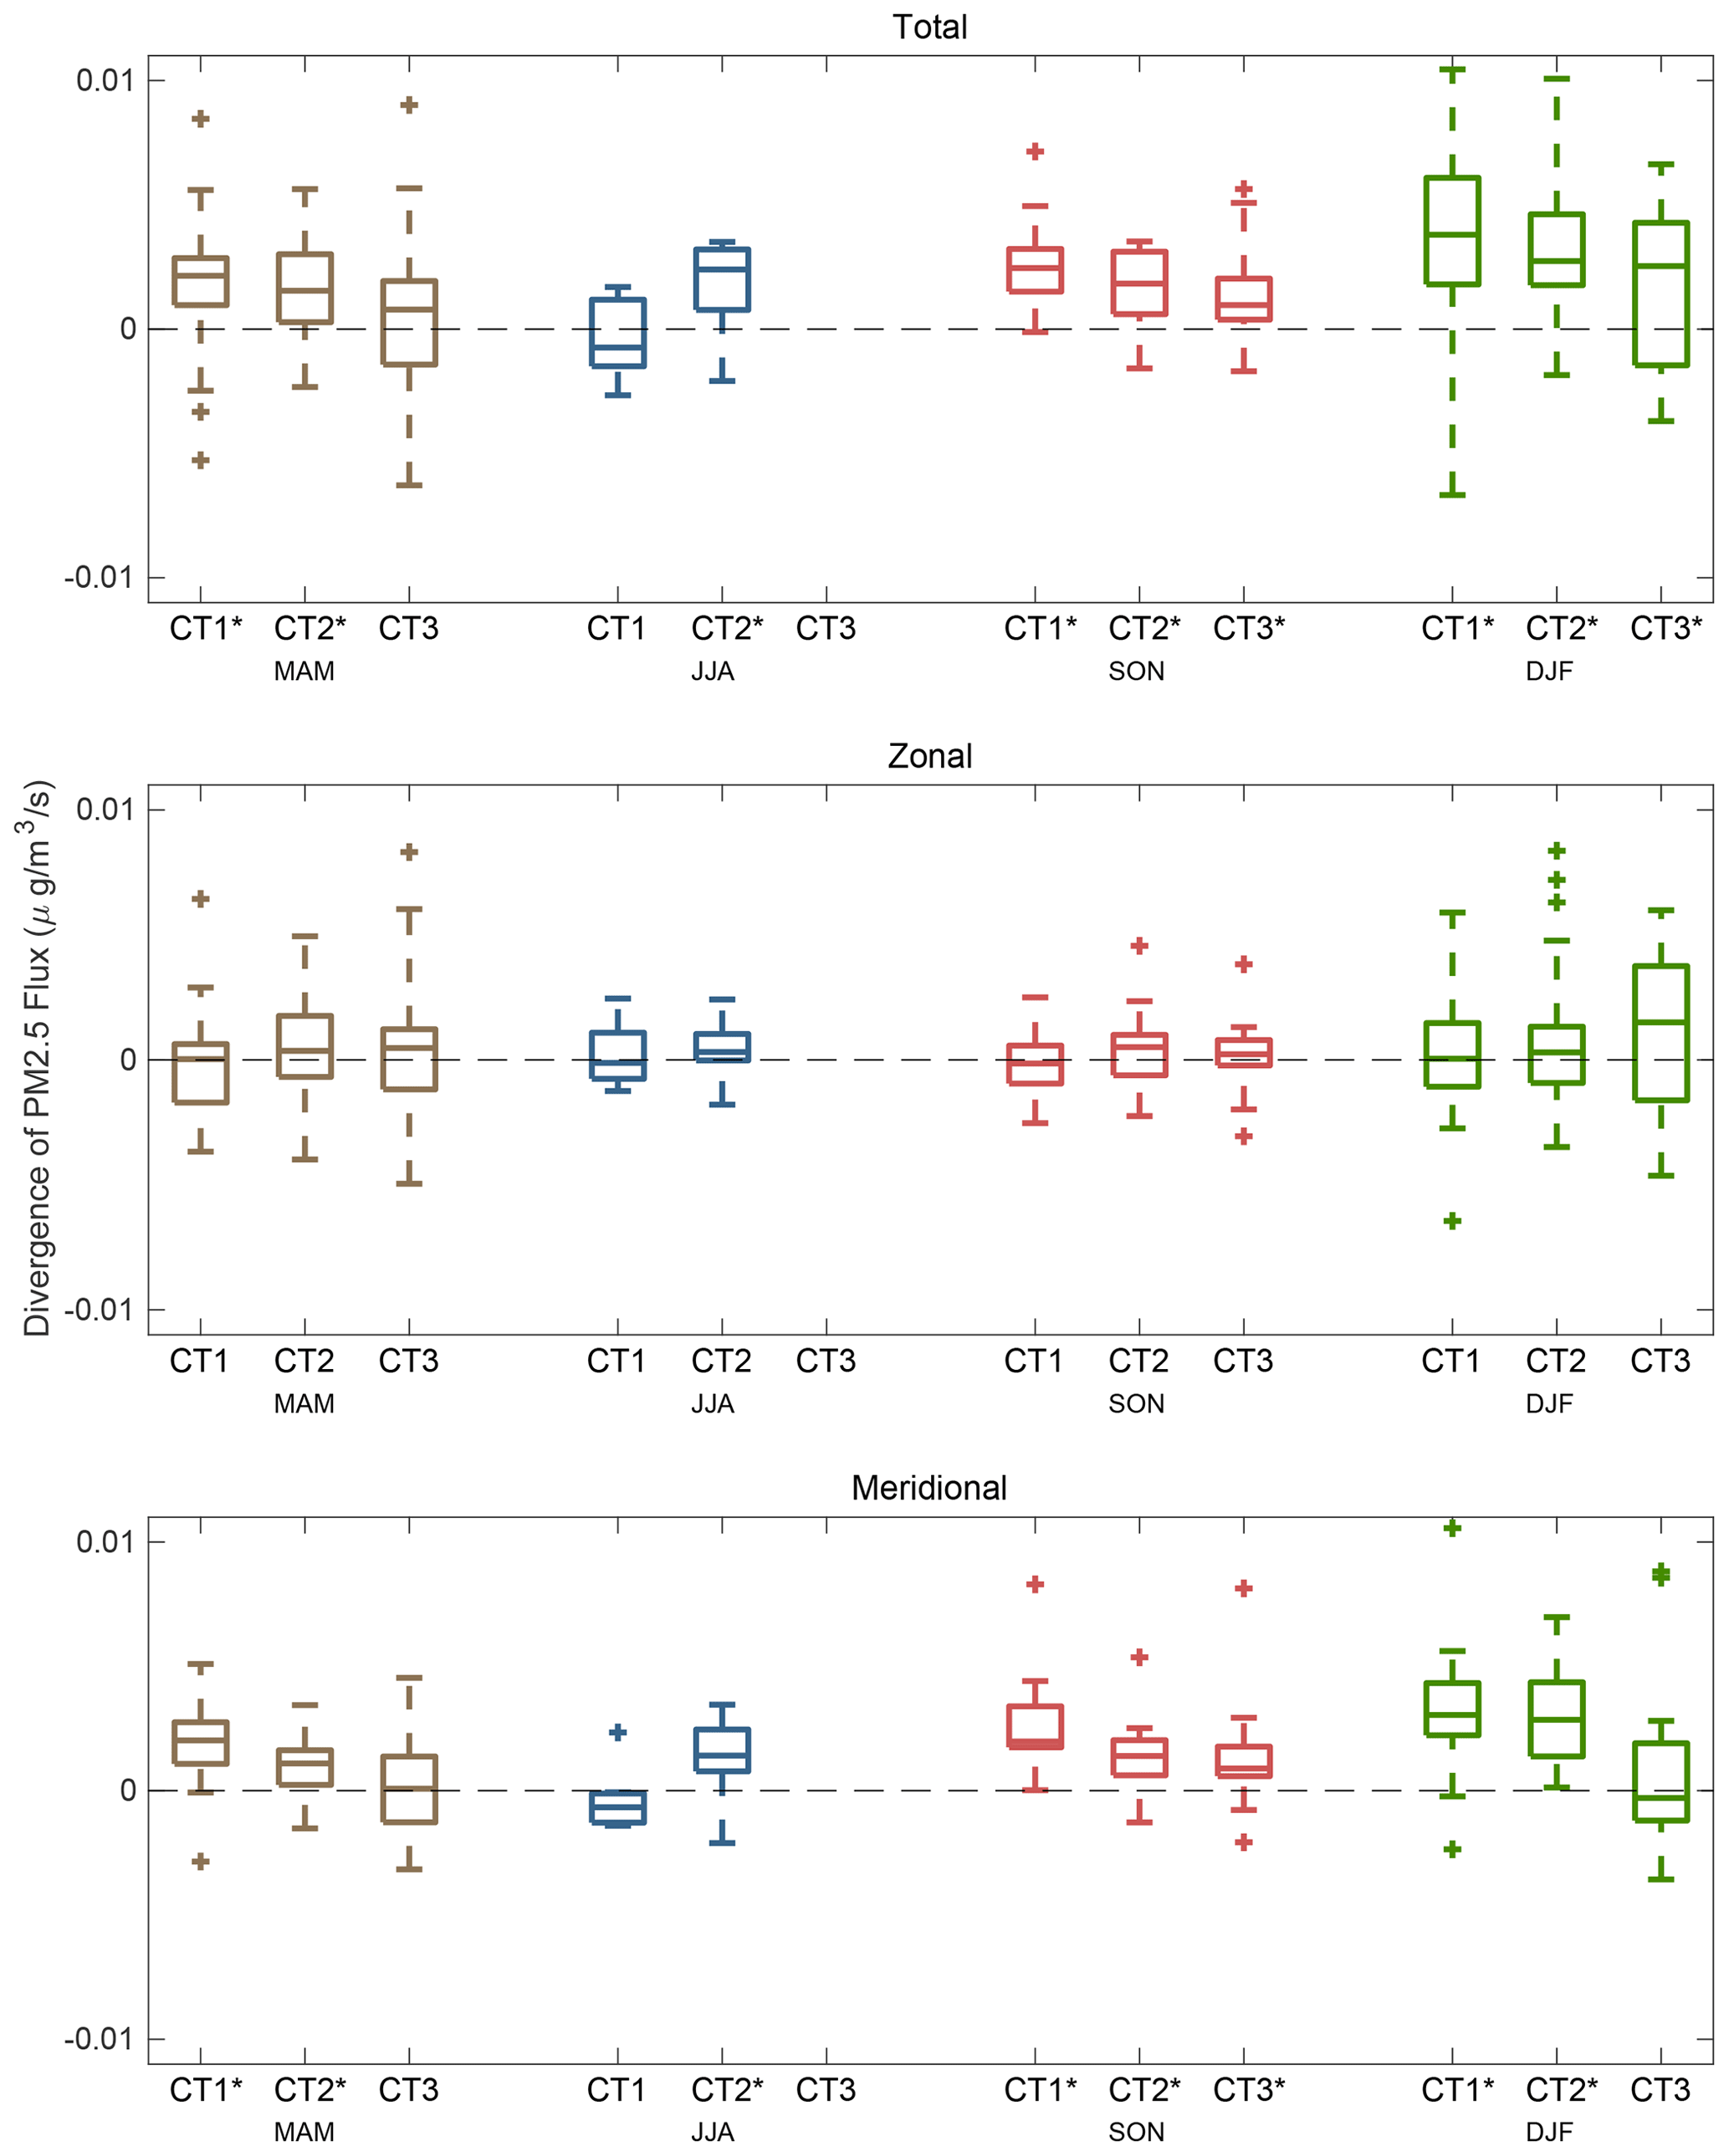
Figure 8Boxplot of the divergence of PM2.5 flux over the region of 34–40∘ N and 112–118∘ E. The daily divergence is calculated based on the Eq. (1). Zonal and meridional components are the first and second terms of the formula. An asterisk (*) on the x axis marks the divergence in a specific CT being significantly different with zero based on a two-tailed Student's t test at a significance level of 0.01.
In terms of the synoptic patterns in summer, two CTs are classified excluding the effects of wet deposition. According to the circulation anomaly in Fig. 5, the synoptic pattern of CT1 in summer is similar to that of CT3 at 925 hPa in other seasons, which is dominated by a northeastern cyclonic circulation. Dry northwesterly wind occurs in the BTH region, reducing the local relative humidity. As shown in Fig. 7, the BLH is higher than the seasonal average, indicating an increase in vertical diffusion space. The zonal positive divergence of the PM2.5 flux is offset by the negative value in the meridional direction. The effect of horizontal transport of air pollutants can be ignored in this situation. Therefore, the decay process of the air pollution episode in the CT1 condition can be attributed to the dry air mass and higher than normal BLH.
In the anomaly pattern of the CT2 condition in summer, the BTH region is located between the southern portion of a high-pressure system and the northern portion of a low-pressure system and is affected by the prevailing northeasterly surface wind. Clean air masses are transported to the BTH region along with the northeasterly wind, which can be confirmed by the positive divergence in the PM2.5 flux in both zonal and meridional directions. Both the negative relative humidity and positive BLH anomalies in CT2 are beneficial for the reduction of surface PM2.5 concentrations, but the magnitude of the anomaly is not as high as those of the CT1 condition. There is no favorable signal for the diffusion of surface PM2.5 in terms of the vertical motion in the two synoptic patterns in summer. It is the effective horizontal outflow that promotes the decay process of pollution episodes.
3.3 Synoptic circulation effects on the PM2.5 pollution
Section 3.2 shows different physical mechanisms for the rapid decay of air pollution episodes in the region covering the 28 pollution channel cities. Figure 9 exhibits the relative difference in PM2.5 concentrations between the day before and after the occurrence of the specific synoptic CTs. The average PM2.5 differences in the 28 pollution channel cities are summarized in Table 2. Unsurprisingly, a remarkable decrease in PM2.5 concentrations is seen when all the circulation patterns dominate the decay process, but it is worth noting that the magnitudes of the decline vary according to the synoptic patterns. For the case of spring, autumn and winter, CT2 conditions demonstrate the most significant effects on the abrupt reduction in PM2.5 concentrations, with a day-to-day decrease of more than 40 % in PM2.5 concentrations in the 28 pollution channel cities in all three seasons. CT1 conditions are second in terms of the circulation influence in the decay process of PM2.5 pollution episodes. The PM2.5 concentrations decrease quickly by 37.2 %, 40.1 % and 36.9 % when CT1 conditions occur in spring, autumn and winter, respectively. The CT3 conditions, which are dominated by westerly winds, show a relatively weak ability to control the decay process of PM2.5 pollution episodes. Air quality improves by approximately 26 %–29 % compared with the previous day due to the occurrence of CT3 conditions. In summer, PM2.5 concentrations decrease more significantly with the occurrence of CT1 conditions than with the occurrence of CT2 conditions, indicating more effective diffusion under northwesterly winds than under northeasterly airflow. Wet scavenging is an effective method for the rapid decay of air pollution episodes, especially in wintertime. PM2.5 concentrations drop sharply after the occurrence of precipitation, with decreases of more than 35 % in spring, autumn and winter. In total, 26.2 % of PM2.5 pollution is removed by the wet deposition in summer, which is the lowest rate among the four seasons. The relatively clean background may account for the weak wet deposition effects in summer.
Table 2The average relative difference of PM2.5 concentrations before and after the occurrence of decay processes (i.e., , where PMt is the daily mean PM2.5 concentration on the decay phase day).
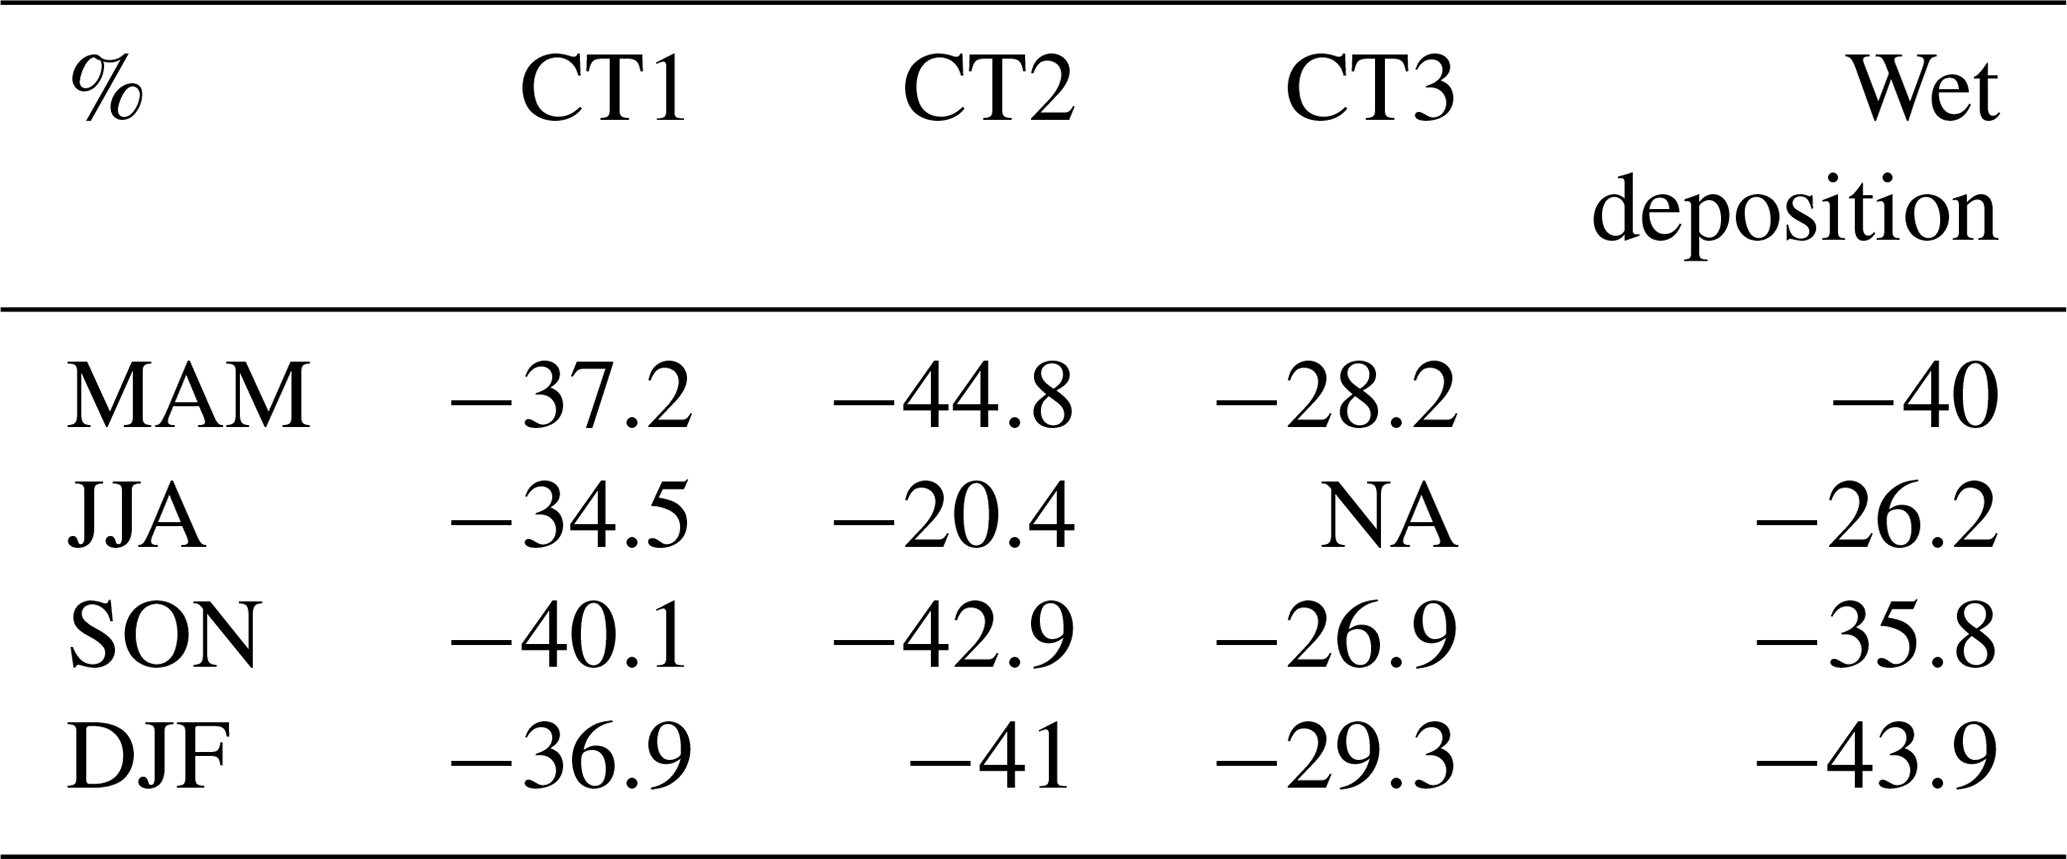
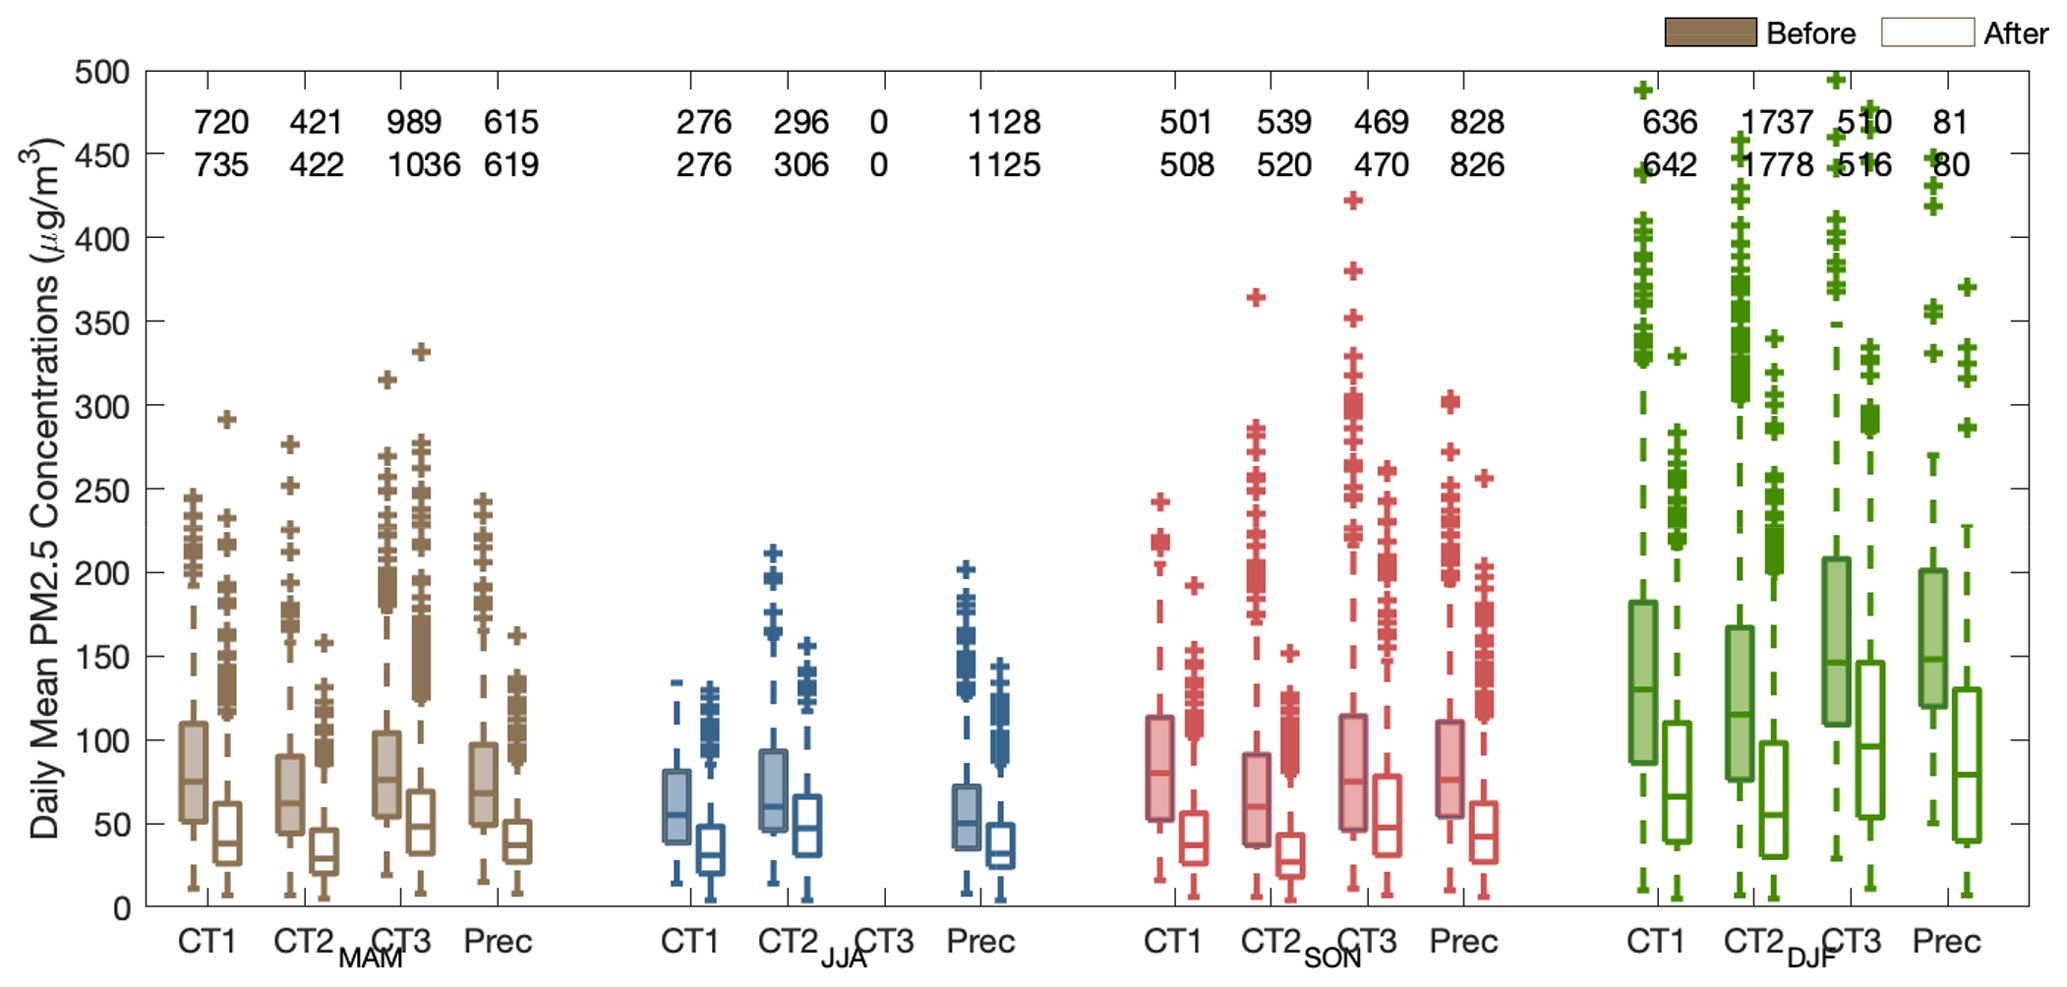
Figure 9Distribution of the daily mean PM2.5 concentrations before and after the occurrence of decay processes of pollution episodes in the 28 pollution channel cities. The hollow box indicates the concentration on the decay phase day, and the solid box is the value on the previous day. The relative differences in the PM2.5 concentrations after the occurrence of a decay process are summarized in Table 2. The number at the top of each box indicates the sample size used for the boxplot. The number in the first line is the sample size of the “before” case, and the second line is for the “after” case.
Figure 2 shows the sawtooth cycle variation in PM2.5 concentrations with a smooth increase followed by an abrupt decrease. However, the PM2.5 concentrations do not always increase gradually before the decay of the pollution episode. Here, the sawtooth cycle is divided into developing and decay phases, and the interval stage between two decay phases is defined as the developing phase of a specific pollution episode. As shown in Fig. 10, when the duration of the developing phase is less than 3 d, air pollutants accumulate gradually to a maximum until the occurrence of a decay process. However, if the developing phase is longer than 3 d, the highest PM2.5 concentrations occur 1–3 d before the passage of a favorable synoptic system, which indicates that the developing mature stage of pollution episodes (with high-level concentrations) usually persists for several days.
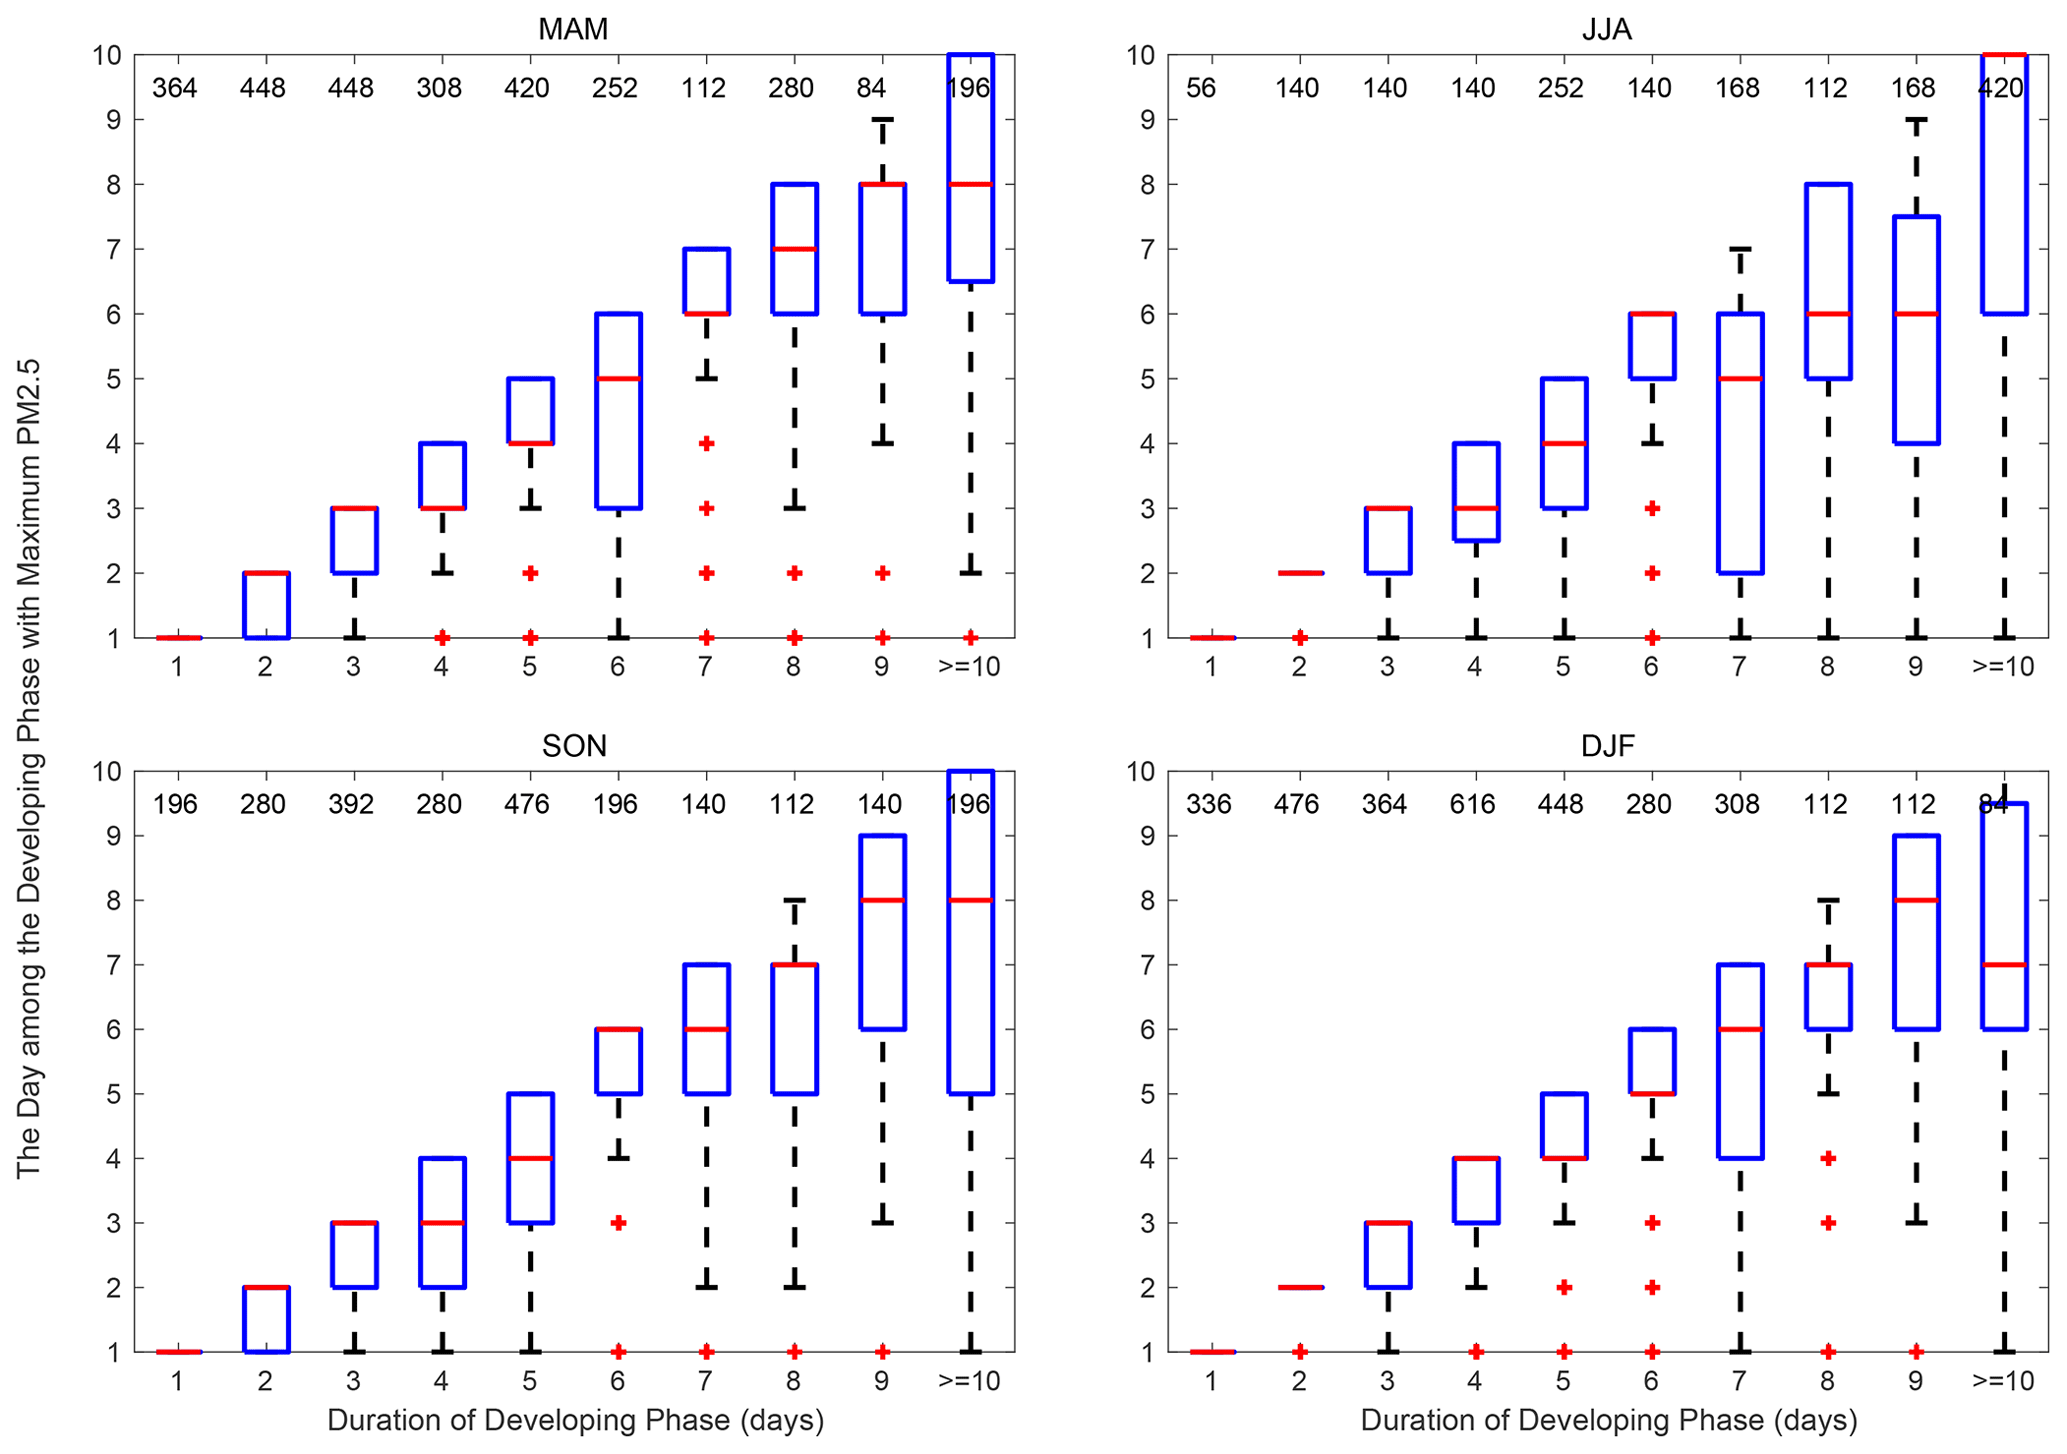
Figure 10The day of the maximum PM2.5 concentration during each pollution episode varies with the duration of the developing phase.
The duration of the developing phase not only changes the shape of the sawtooth cycle but also affects the maximum PM2.5 concentrations during the pollution episode, as shown in Fig. 11. Most of the developing phases are concentrated in periods of less than 5 d in spring, autumn and winter, with average durations of 5.53, 5.86 and 5.36 d, respectively. As the main wave system affecting the synoptic circulation in the mid-latitude region, the Rossby wave has about a 1-week cycle length, which dominates the average duration of two adjacent decay phases. Typically, for the cases in spring and autumn, when the durations are less than 5 days, the maximum PM2.5 concentrations during the specific air pollution episode increase with an increase in the developing phase durations; but the concentrations remain unchanged if the duration is longer than 5 d. In winter, the maximum PM2.5 concentrations in a specific sawtooth cycle continue to increase with increases in the interval between two decay processes. Wintertime air pollution can be exacerbated by the long-term absence of an effective decay process. The frequency of favorable circulation patterns is relatively lower in summer, which leads to an effective decay process occurring every 7.45 d. The maximum PM2.5 concentrations display an upward tendency with increases in the developing stage durations, but there are some small fluctuations in the mean value of the highest PM2.5 concentration due to the limited samples in summer.
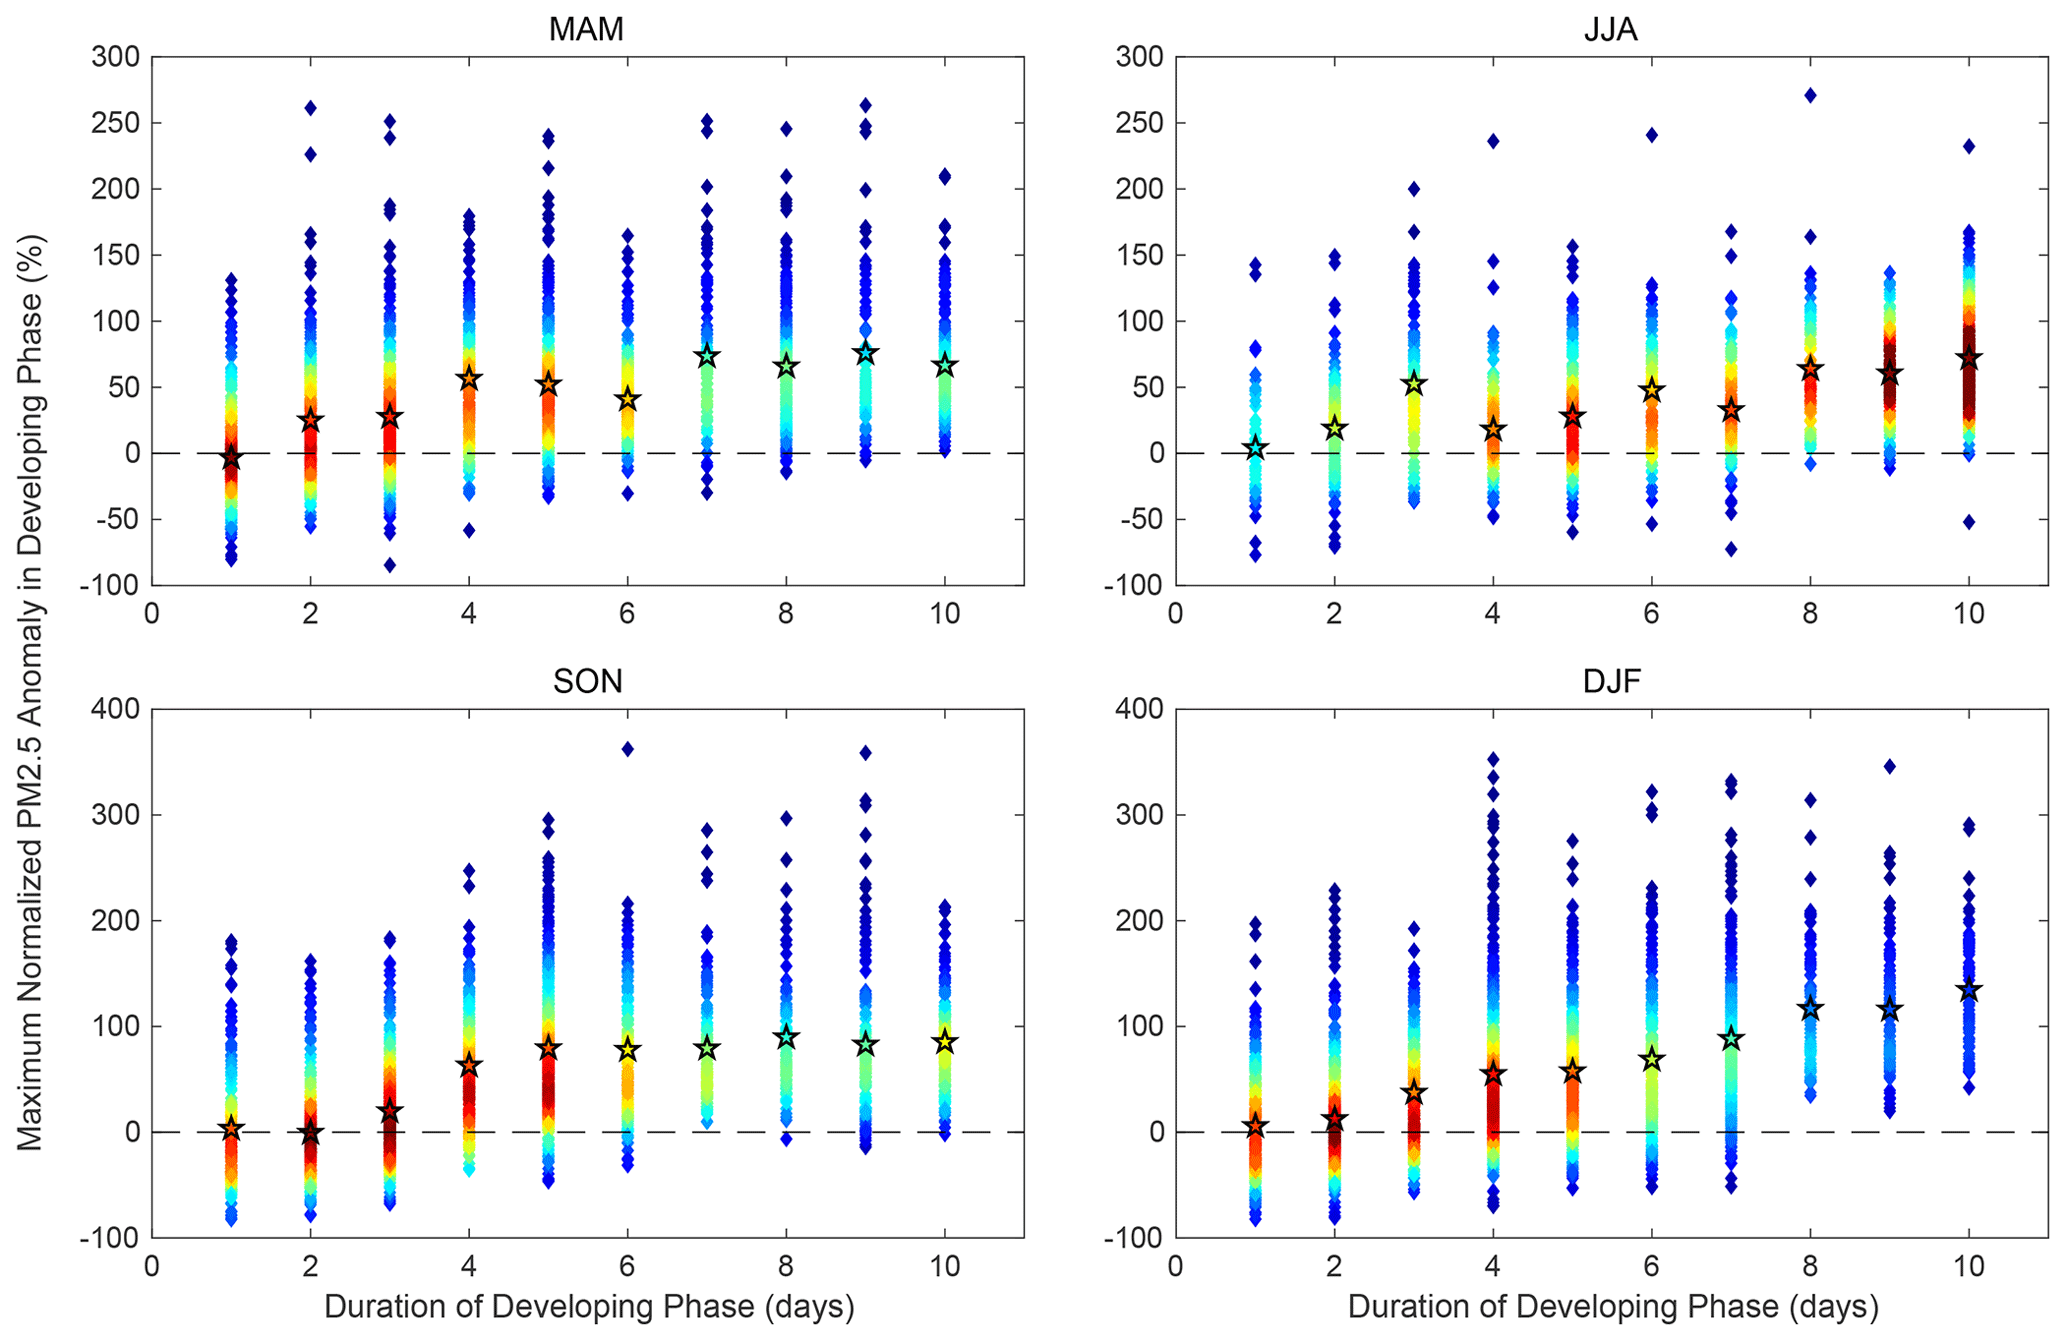
Figure 11The density plot of the maximum PM2.5 concentration according to the duration of the developing phase of pollution episodes. Daily PM2.5 concentrations are normalized by their monthly mean value to exclude the effects of seasonal and interannual variations in air quality. A warmer color indicates a higher density of scatter. Stars mark the average maximum PM2.5 concentration for the specific duration period.
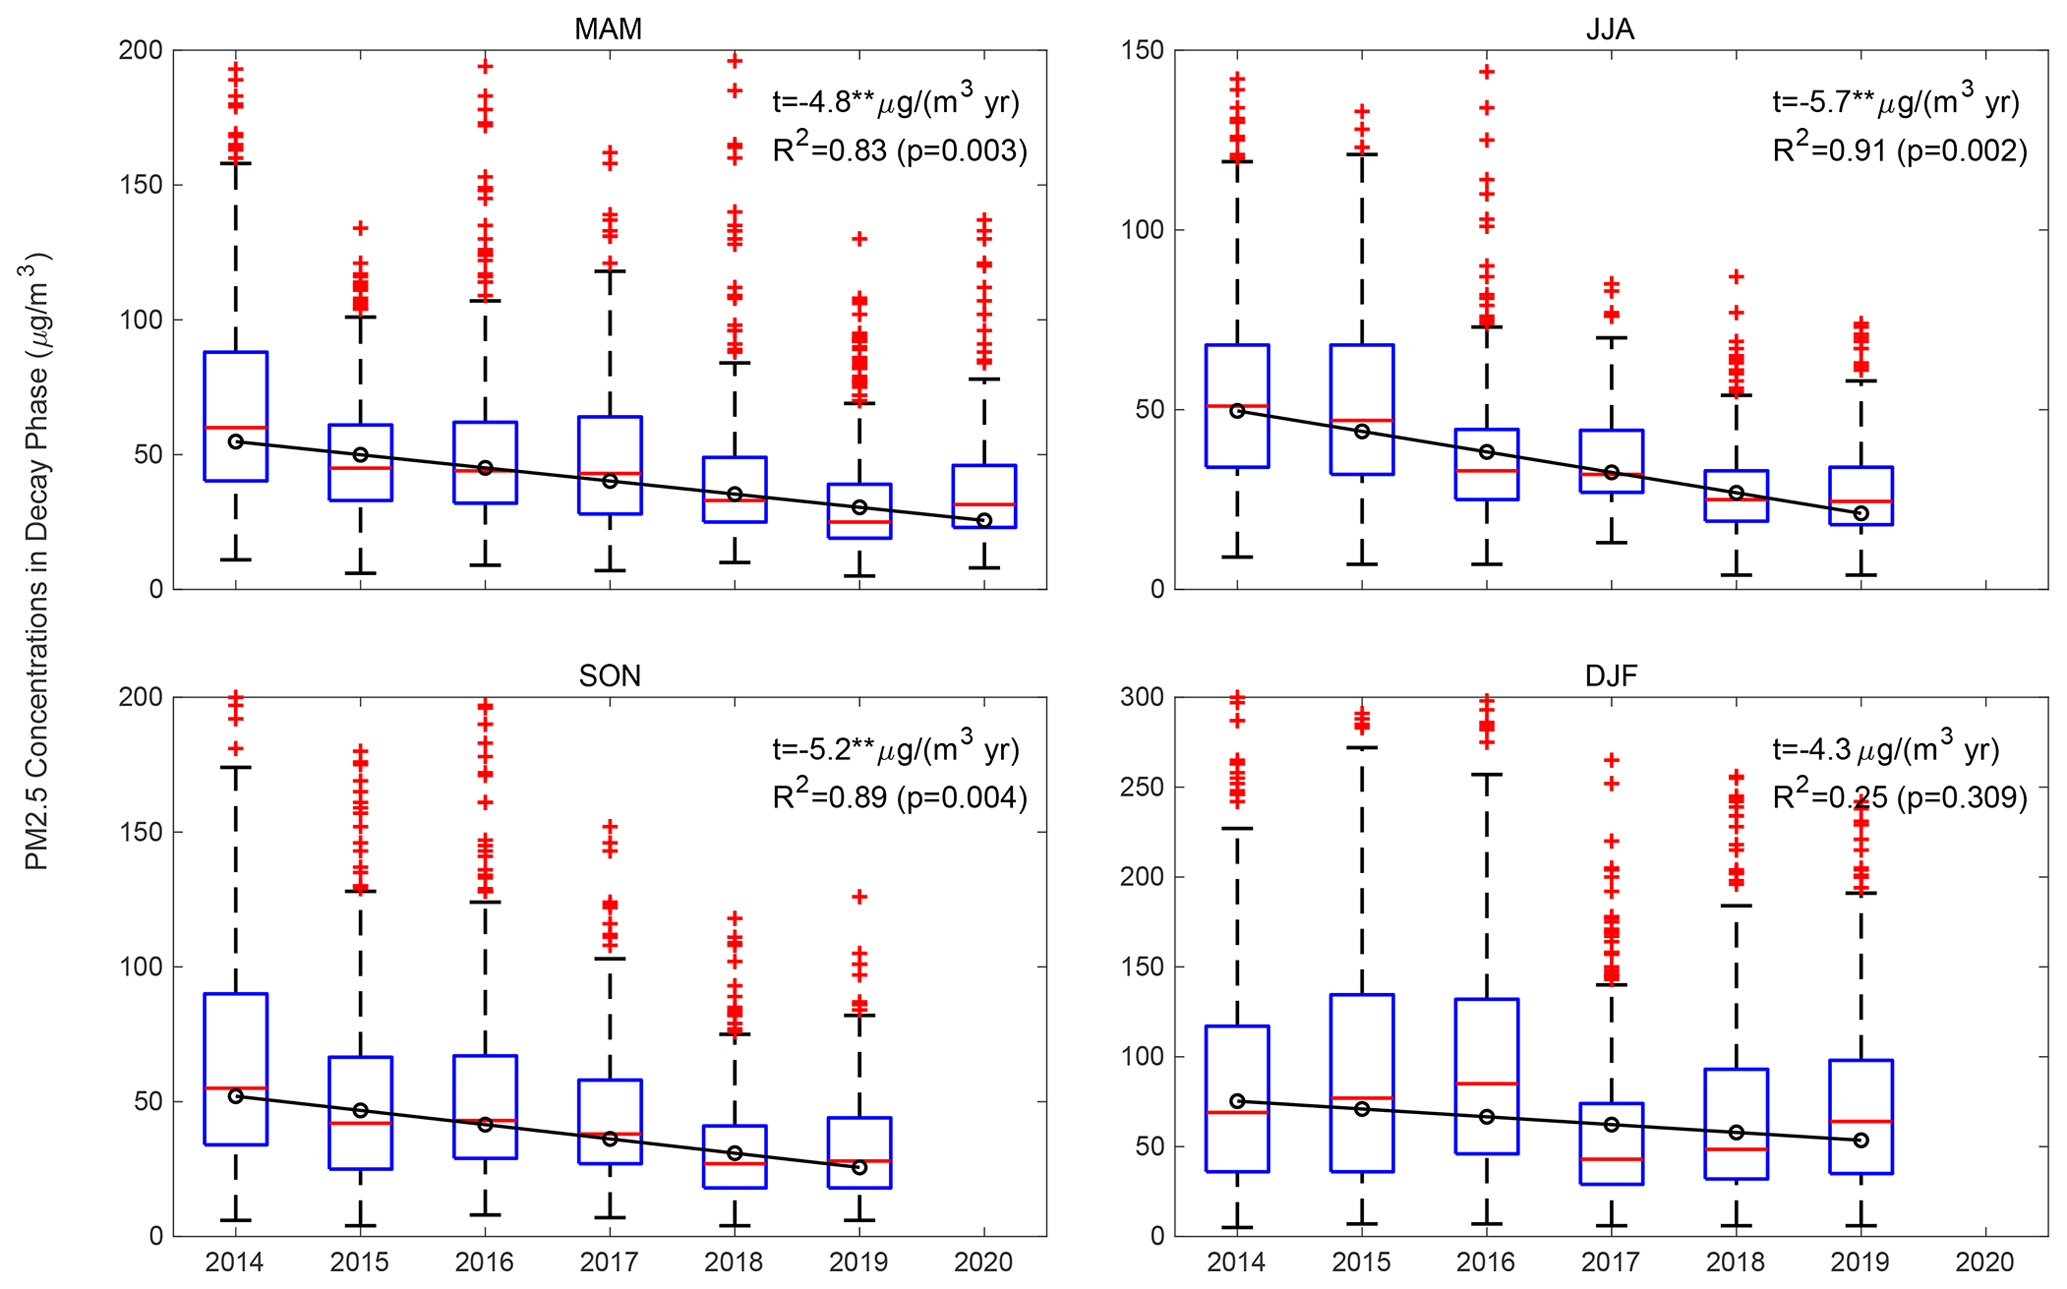
Figure 12Variations in the average PM2.5 concentration on all the decay phase days from 2014 to 2020. The black hollow circles indicate the mean PM2.5 concentration in each year. The black line is the fitting line based on the seasonal median value. The number in the subplot is the linear trend (t), R2 and p value of the least-squares regression model. Two asterisks () after a linear trend indicate the linear regression model is significant with a p value <0.01.
Emission and meteorological elements are taken as the two most important factors controlling the variation in PM2.5. Many efforts have been made to mitigate the air pollutant emissions in the 28 pollution channel cities, which have achieved remarkable improvements in air quality in recent years. However, because obvious interannual differences in the meteorological conditions are observed, there is uncertainty in the evaluation of emission reductions based on the observed PM2.5 concentrations. The quantitative evaluation of the effects of emission reduction measures on the PM2.5 concentration variation has been a challenge for policy makers and stakeholders. Here, only the PM2.5 concentrations observed on the days of decay processes are compared, which excludes the different effects of meteorological conditions and evaluates the pure effects of emission reduction from a certain perspective. Figure 12 shows a significant decline in seasonal mean PM2.5 concentrations from 2014 to 2020 in the 28 pollution channel cities. This figure shows almost the same rates of decrease in all four seasons, with relatively smaller decreases of 4.8 and 4.3 in spring and winter and greater decreases of 5.7 and 5.2 in summer and autumn, respectively. The slight difference in the seasonal decreasing tendency is possibly due to seasonal differences in the main sources of air pollutant emissions.
The variation in ambient air pollutant concentrations generally represents a continuous sawtooth cycle with a recurring smooth increase followed by a sharp decrease. The combined effects of emissions, secondary formation of particles and unfavorable meteorological conditions trigger the initiation and development of a specific PM2.5 pollution episode over several days. In contrast, the abrupt decay of a pollution episode is mostly due to the passage of favorable synoptic patterns, and it usually takes a few hours to transition from hazy to clean air conditions. The detailed atmospheric circulation features and the mechanisms through which they affect the decay processes of pollution episodes are discussed in this work. A total of 365 decay processes were recognized from January 2014 to March 2020 based on the regional variation in the day-to-day PM2.5 concentration difference. Out of the 365 decay phases, 97 were related to the effective wet deposition, and most of them occurred in summer. For the dry-day decay processes, 105, 21, 56 and 109 cases occurred in spring, summer, autumn and winter, respectively. The intervals between two continuous decay processes are 5.53, 7.45, 5.86 and 5.36 d from spring to winter, respectively, which may be controlled by the cycle length of Rossby waves in the mid-latitude region.
All the CTs are common in positive wind speed anomalies, negative relative humidity anomalies and effective outflow of PM2.5 from the domain. Although the magnitude and significance of the anomalies are different in the specific CT, all the above variables indicate favorable atmospheric diffusion conditions, which is beneficial for the decay of pollution episodes. There are also some prominent features for each CT. In CT1, the most significant horizontal outflow of air pollutants combining with the upward transport of airflow to the free atmosphere are the two extra drivers for the decay processes. The removal efficiency of CT1 is 35 %–40 %, which is moderate among the three CTs. In terms of CT2, it is the most frequent CT in autumn and winter. The circulation with the heaviest wind speed from the northwest, the highest BLH and the lowest relative humidity jointly results in the quick decrease in PM2.5 concentration in a few hours, which is the commonly accepted circulation feature to terminate the severe pollution episodes. Due to the significantly favorable meteorological conditions, CT2 has the strongest cleaning abilities of 41 %–45 % in different seasons. For CT3, the synergy effects of enhanced vertical mixing within the boundary layer and moderate beneficial background of wind speed, relative humidity and horizontal divergence of PM2.5 are the main cleaning mechanisms of CT3 conditions. After the passage of CT3, 26 %–29 % of local air pollutants are typically removed. The two dry-day circulation patterns in summer are similar to the synoptic patterns of CT1 and CT3 in the other three seasons. A dry air mass with a positive BLH anomaly and the effective horizontal outflow of air pollutants are the main reasons for the abrupt decay phases in summer. The average PM2.5 concentrations on decay process days show a significant decreasing trend from 2014 to 2020, which indicates the success of emission mitigation efforts. Emission reductions have led to a 4.3–5.7 decrease in PM2.5 concentrations in the 28 pollution channel cities.
Due to the limitation of datasets about PM2.5 vertical distribution, only the horizontal divergence of PM2.5 flux is used in this study. Although it shows positive divergence for all of the CTs, indicating the remarkable contribution of the net outflow of air pollutants at the surface to the quick decrease in PM2.5 concentrations, the effects of horizontal PM2.5 flux above the surface or the vertical diffusion cannot be neglected, which may have a great contribution in a specific event, and need to be further studied. PM2.5 concentrations sharply decrease after the passage of CT2, but a relatively weak drop in air pollutant concentrations is shown when CT3 occurs, which can be attributed to the moderate strength of its anomaly circulation pattern. Therefore, the scavenging effects of each CT should also be taken into account when predicting the air quality based on synoptic circulation variation.
Daily PM2.5 concentration observations at the 28 channel cities were obtained from the website of the Ministry of Ecology and Environment of the People's Republic of China (http://106.37.208.233:20035; MEEPRC, 2021). The daily mean PM2.5 concentrations during 2014 to 2020 can be downloaded from https://doi.org/10.5281/zenodo.4415029 (Wang, 2021). The 4-times-daily ECMWF ERA5 dataset during 2014 to 2020 was downloaded from https://www.ecmwf.int/en/forecasts/datasets/reanalysis-datasets/era5 (ECMWF, 2021). Atmospheric circulation classification was conducted using European Cooperation in Science & Technology (COST) plan 733 (cost733class software), which can be downloaded at http://cost733.met.no (COST733, 2021).
The supplement related to this article is available online at: https://doi.org/10.5194/acp-21-2491-2021-supplement.
XW and RZ designed research. XW, YT and WY performed the analyses and wrote the paper. All authors contributed to the final version of the paper.
The authors declare that they have no conflict of interest.
We thank the support of Fudan University-Tibet University Joint Laboratory For Biodiversity and Global Change. This research has been funded by the National Natural Science Foundation of China (grant nos. 41805117, 42075058, 41790472 and 41975075).
This research has been supported by the National Natural Science Foundation of China (grant nos. 41805117, 42075058, 41790472 and 41975075).
This paper was edited by Jianping Huang and reviewed by two anonymous referees.
Air pollution targeted in 28 cities, available at: http://www.chinadaily.com.cn/china/2017-08/26/content_31131288.htm (last access: 4 August 2020), 2017.
Bi, J., Huang, J., Hu, Z., Holben, B., and Guo, Z.: Investigating the aerosol optical and radiative characteristics of heavy haze episodes in Beijing during January of 2013, J. Geophys. Res.-Atmos., 119, 9884–9900, 2014.
Cai, W., Li, K., Liao, H., Wang, H., and Wu, L.: Weather conditions conducive to Beijing severe haze more frequent under climate change, Nat. Clim. Change, 7, 257–262, 2017.
Cai, W., Xu, X., Cheng, X., Wei, F., Qiu, X., and Zhu, W.: Impact of “blocking” structure in the troposphere on the wintertime persistent heavy air pollution in northern China, Sci. Total Environ., 741, 140325, https://doi.org/10.1016/j.scitotenv.2020.140325, 2020.
Cavazos, T.: Using self-organizing maps to investigate extreme climate events: An application to wintertime precipitation in the Balkans, J. Clim., 13, 1718–1732, 2000.
Che, H., Xia, X., Zhao, H., Dubovik, O., Holben, B. N., Goloub, P., Cuevas-Agulló, E., Estelles, V., Wang, Y., Zhu, J., Qi, B., Gong, W., Yang, H., Zhang, R., Yang, L., Chen, J., Wang, H., Zheng, Y., Gui, K., Zhang, X., and Zhang, X.: Spatial distribution of aerosol microphysical and optical properties and direct radiative effect from the China Aerosol Remote Sensing Network, Atmos. Chem. Phys., 19, 11843–11864, https://doi.org/10.5194/acp-19-11843-2019, 2019.
Chen, D.: A monthly circulation climatology for Sweden and its application to a winter temperature case study, Int. J. Climatol., 20, 1067–1076, 2000.
Chen, H. and Wang, H.: Haze days in North China and the associated atmospheric circulations based on daily visibility data from 1960 to 2012, J. Geophys. Res.-Atmos., 120, 5895–5909, 2015.
Chen, S., Zhang, X., Lin, J., Huang, J., Zhao, D., Yuan, T., Huang, K., Luo, Y., Jia, Z., and Zang, Z.: Fugitive road dust PM2.5 emissions and their potential health impacts, Environ. Sci. Technol., 53, 8455–8465, 2019.
Chen, Z., Chen, D., Zhao, C., Kwan, M.-p., Cai, J., Zhuang, Y., Zhao, B., Wang, X., Chen, B., and Yang, J.: Influence of meteorological conditions on PM2.5 concentrations across China: A review of methodology and mechanism, Environ. Int., 139, 105558, https://doi.org/10.1016/j.envint.2020.105558, 2020.
Cheng, Y., He, K.-b., Du, Z.-y., Zheng, M., Duan, F.-k., and Ma, Y.-l.: Humidity plays an important role in the PM2.5 pollution in Beijing, Environ. Pollut., 197, 68–75, 2015.
COST Action 733 (COST733): http://cost733.met.no, last access: 12 February 2021.
Ding, A., Huang, X., Nie, W., Chi, X., Xu, Z., Zheng, L., Xu, Z., Xie, Y., Qi, X., Shen, Y., Sun, P., Wang, J., Wang, L., Sun, J., Yang, X.-Q., Qin, W., Zhang, X., Cheng, W., Liu, W., Pan, L., and Fu, C.: Significant reduction of PM2.5 in eastern China due to regional-scale emission control: evidence from SORPES in 2011–2018, Atmos. Chem. Phys., 19, 11791–11801, https://doi.org/10.5194/acp-19-11791-2019, 2019.
European Centre for Medium-Range Weather Forecasts (ECMWF): Reanalysis datasets/ERA5, available at: https://www.ecmwf.int/en/forecasts/datasets/reanalysis-datasets/era5, last access: 12 February 2021.
Fan, L., Yan, Z., Chen, D., and Fu, C.: Comparison between two statistical downscaling methods for summer daily rainfall in Chongqing, China, Int. J. Climatol., 35, 3781–3797, 2015.
Gao, M., Carmichael, G. R., Wang, Y., Saide, P. E., Liu, Z., Xin, J., Shan, Y., and Wang, Z.: Chemical and Meteorological Feedbacks in the Formation of Intense Haze Events, in: Air Pollution in Eastern Asia: An Integrated Perspective, Springer, Cham, 437–452, 2017.
Gong, C. and Liao, H.: A typical weather pattern for ozone pollution events in North China, Atmos. Chem. Phys., 19, 13725–13740, https://doi.org/10.5194/acp-19-13725-2019, 2019.
Gu, Y., Huang, R.-J., Li, Y., Duan, J., Chen, Q., Hu, W., Zheng, Y., Lin, C., Ni, H., and Dai, W.: Chemical nature and sources of fine particles in urban Beijing: Seasonality and formation mechanisms, Environ. Int., 140, 105732, https://doi.org/10.1016/j.envint.2020.105732, 2020.
Gui, K., Che, H., Zeng, Z., Wang, Y., Zhai, S., Wang, Z., Luo, M., Zhang, L., Liao, T., and Zhao, H.: Construction of a virtual PM2.5 observation network in China based on high-density surface meteorological observations using the Extreme Gradient Boosting model, Environ. Int., 141, 105801, https://doi.org/10.1016/j.envint.2020.105801, 2020.
Guo, J., Li, Y., Cohen, J. B., Li, J., Chen, D., Xu, H., Liu, L., Yin, J., Hu, K., and Zhai, P.: Shift in the temporal trend of boundary layer height in China using long-term (1979–2016) radiosonde data, Geophys. Res. Lett., 46, 6080–6089, 2019.
He, J., Zhang, L., Yao, Z., Che, H., Gong, S., Wang, M., Zhao, M., and Jing, B.: Source apportionment of particulate matter based on numerical simulation during a severe pollution period in Tangshan, North China, Environ. Pollut., 266, 115133, https://doi.org/10.1016/j.envpol.2020.115133, 2020.
Huang, R.-J., He, Y., Duan, J., Li, Y., Chen, Q., Zheng, Y., Chen, Y., Hu, W., Lin, C., Ni, H., Dai, W., Cao, J., Wu, Y., Zhang, R., Xu, W., Ovadnevaite, J., Ceburnis, D., Hoffmann, T., and O'Dowd, C. D.: Contrasting sources and processes of particulate species in haze days with low and high relative humidity in wintertime Beijing, Atmos. Chem. Phys., 20, 9101–9114, https://doi.org/10.5194/acp-20-9101-2020, 2020a.
Huang, X., Ding, A., Gao, J., Zheng, B., Zhou, D., Qi, X., Tang, R., Wang, J., Ren, C., and Nie, W.: Enhanced secondary pollution offset reduction of primary emissions during COVID-19 lockdown in China, Natl. Sci. Rev., 8, nwaa137, https://doi.org/10.1093/nsr/nwaa137, 2020b.
Huang, X., Ding, A., Wang, Z., Ding, K., Gao, J., Chai, F., and Fu, C.: Amplified transboundary transport of haze by aerosol–boundary layer interaction in China, Nat. Geosci., 13, 1–7, 2020c.
Huth, R., Beck, C., Philipp, A., Demuzere, M., Ustrnul, Z., Cahynová, M., Kyselý, J., and Tveito, O. E.: Classifications of atmospheric circulation patterns: recent advances and applications, Ann. NY Acad. Sci., 1146, 105–152, 2008.
Jenkinson, A. and Collison, F.: An initial climatology of gales over the North Synoptic climatology. Branch Memorandum 62, UK Met. Office, Bracknell, 18, 1977.
Ji, D., Wang, Y., Wang, L., Chen, L., Hu, B., Tang, G., Xin, J., Song, T., Wen, T., and Sun, Y.: Analysis of heavy pollution episodes in selected cities of northern China, Atmos. Environ., 50, 338–348, 2012.
Jia, Y., Rahn, K. A., He, K., Wen, T., and Wang, Y.: A novel technique for quantifying the regional component of urban aerosol solely from its sawtooth cycles, J. Geophys. Res.-Atmos., 113, D21309, https://doi.org/10.1029/2008JD010389, 2008.
Jiang, Y., Xin, J., Wang, Y., Tang, G., Zhao, Y., Jia, D., Zhao, D., Wang, M., Dai, L., Wang, L., Wen, T., and Wu, F.: The dynamic-thermal structures of the planetary boundary layer dominated by synoptic circulations and the regular effect on air pollution in Beijing, Atmos. Chem. Phys. Discuss. [preprint], https://doi.org/10.5194/acp-2020-1123, in review, 2020.
Le, T., Wang, Y., Liu, L., Yang, J., Yung, Y. L., Li, G., and Seinfeld, J. H.: Unexpected air pollution with marked emission reductions during the COVID-19 outbreak in China, Science, 369, 702–706, 2020.
Leung, D. M., Tai, A. P. K., Mickley, L. J., Moch, J. M., van Donkelaar, A., Shen, L., and Martin, R. V.: Synoptic meteorological modes of variability for fine particulate matter (PM2.5) air quality in major metropolitan regions of China, Atmos. Chem. Phys., 18, 6733–6748, https://doi.org/10.5194/acp-18-6733-2018, 2018.
Li, W. J., Shao, L. Y., and Buseck, P. R.: Haze types in Beijing and the influence of agricultural biomass burning, Atmos. Chem. Phys., 10, 8119–8130, https://doi.org/10.5194/acp-10-8119-2010, 2010.
Li, Q., Zhang, R., and Wang, Y.: Interannual variation of the wintertime fog–haze days across central and eastern China and its relation with East Asian winter monsoon, Int. J. Climatol., 36, 346–354, 2016.
Li, H., Zhang, Q., Zhang, Q., Chen, C., Wang, L., Wei, Z., Zhou, S., Parworth, C., Zheng, B., Canonaco, F., Prévôt, A. S. H., Chen, P., Zhang, H., Wallington, T. J., and He, K.: Wintertime aerosol chemistry and haze evolution in an extremely polluted city of the North China Plain: significant contribution from coal and biomass combustion, Atmos. Chem. Phys., 17, 4751–4768, https://doi.org/10.5194/acp-17-4751-2017, 2017.
Li, J., Li, C., and Zhao, C.: Different trends in extreme and median surface aerosol extinction coefficients over China inferred from quality-controlled visibility data, Atmos. Chem. Phys., 18, 3289–3298, https://doi.org/10.5194/acp-18-3289-2018, 2018a.
Li, J., Lv, Q., Jian, B., Zhang, M., Zhao, C., Fu, Q., Kawamoto, K., and Zhang, H.: The impact of atmospheric stability and wind shear on vertical cloud overlap over the Tibetan Plateau, Atmos. Chem. Phys., 18, 7329–7343, https://doi.org/10.5194/acp-18-7329-2018, 2018b.
Li, J., Liao, H., Hu, J., and Li, N.: Severe particulate pollution days in China during 2013–2018 and the associated typical weather patterns in Beijing-Tianjin-Hebei and the Yangtze River Delta regions, Environ. Pollut., 248, 74–81, 2019.
Li, M., Wang, L., Liu, J., Gao, W., Song, T., Sun, Y., Li, L., Li, X., Wang, Y., and Liu, L.: Exploring the regional pollution characteristics and meteorological formation mechanism of PM2.5 in North China during 2013–2017, Environ. Int., 134, 105283, https://doi.org/10.1016/j.envint.2019.105283, 2020.
Liu, C., Zhang, F., Miao, L., Lei, Y., and Yang, Q.: Future haze events in Beijing, China: When climate warms by 1.5 and 2.0 ∘C, Int. J. Climatol., 40, 3689–3700, 2019.
Ma, J. and Zhang, R.: Opposite interdecadal variations of wintertime haze occurrence over North China Plain and Yangtze River Delta regions in 1980–2013, Sci. Total Environ., 732, 139240, https://doi.org/10.1016/j.scitotenv.2020.139240, 2020.
Ma, Y., Ye, J., Xin, J., Zhang, W., Vilà-Guerau de Arellano, J., Wang, S., Zhao, D., Dai, L., Ma, Y., and Wu, X.: The stove, dome, and umbrella effects of atmospheric aerosol on the development of the planetary boundary layer in hazy regions, Geophys. Res. Lett., 47, e2020GL087373, https://doi.org/10.1029/2020GL087373, 2020.
Miao, Y., Che, H., Zhang, X., and Liu, S.: Integrated impacts of synoptic forcing and aerosol radiative effect on boundary layer and pollution in the Beijing–Tianjin–Hebei region, China, Atmos. Chem. Phys., 20, 5899–5909, https://doi.org/10.5194/acp-20-5899-2020, 2020.
Ministry of Ecology and Environment of the People's Republic of China (MEEPRC), http://106.37.208.233:20035, last access: 12 February 2021.
Mu, M., and Zhang, R.: Addressing the issue of fog and haze: A promising perspective from meteorological science and technology, Sci. China Earth Sci., 57, 1–2, 2014.
Notice of the General Office of the State Council on Issuing the Air Pollution Prevention and Control Action Plan, available at: http://www.gov.cn/zwgk/2013-09/12/content_2486773.htm (last access: 4 August 2020), 2013.
Pei, L. and Yan, Z.: Diminishing clear winter skies in Beijing towards a possible future, Environ. Res. Lett., 13, 124029, https://doi.org/10.1088/1748-9326/aaf032, 2018.
Pei, L., Yan, Z., Sun, Z., Miao, S., and Yao, Y.: Increasing persistent haze in Beijing: potential impacts of weakening East Asian winter monsoons associated with northwestern Pacific sea surface temperature trends, Atmos. Chem. Phys., 18, 3173–3183, https://doi.org/10.5194/acp-18-3173-2018, 2018.
Pei, L., Yan, Z., Chen, D., and Miao, S.: Climate variability or anthropogenic emissions: which caused Beijing Haze?, Environ. Res. Lett., 15, 034004, https://doi.org/10.1088/1748-9326/ab6f11, 2020.
Philipp, A., Beck, C., Esteban, P., Kreienkamp, F., Krennert, T., Lochbihler, K., Lykoudis, S. P., Pianko-Kluczynska, K., Post, P., and Alvarez, D. R.: cost733class-1.2 User guide, University of Augsburg, Augsburg, Germany, 10–21, 2014.
Quan, J., Dou, Y., Zhao, X., Liu, Q., Sun, Z., Pan, Y., Jia, X., Cheng, Z., Ma, P., and Su, J.: Regional atmospheric pollutant transport mechanisms over the North China Plain driven by topography and planetary boundary layer processes, Atmos. Environ., 221, 117098, https://doi.org/10.1016/j.atmosenv.2019.117098, 2020.
Shi, X. and Brasseur, G. P.: The Response in Air Quality to the Reduction of Chinese Economic Activities during the COVID-19 Outbreak, Geophys. Res. Lett., 47, e2020GL088070, https://doi.org/10.1029/2020GL088070, 2020.
Sun, Y., Jiang, Q., Wang, Z., Fu, P., Li, J., Yang, T., and Yin, Y.: Investigation of the sources and evolution processes of severe haze pollution in Beijing in January 2013, J. Geophys. Res.-Atmos., 119, 4380–4398, 2014.
Tang, G., Zhang, J., Zhu, X., Song, T., Münkel, C., Hu, B., Schäfer, K., Liu, Z., Zhang, J., Wang, L., Xin, J., Suppan, P., and Wang, Y.: Mixing layer height and its implications for air pollution over Beijing, China, Atmos. Chem. Phys., 16, 2459–2475, https://doi.org/10.5194/acp-16-2459-2016, 2016a.
Tang, L., Yu, H., Ding, A., Zhang, Y., Qin, W., Wang, Z., Chen, W., Hua, Y., and Yang, X.: Regional contribution to PM1 pollution during winter haze in Yangtze River Delta, China, Sci. Total Environ., 541, 161–166, 2016b.
The State Council rolls out a three-year action plan for clean air, available at: http://www.gov.cn/zhengce/content/2018-07/03/content_5303158.htm (last access: 4 August 2020), 2018.
Tie, X., Zhang, Q., He, H., Cao, J., Han, S., Gao, Y., Li, X., and Jia, X. C.: A budget analysis of the formation of haze in Beijing, Atmos. Environ., 100, 25–36, 2015.
Valverde, V., Pay, M. T., and Baldasano, J. M.: Circulation-type classification derived on a climatic basis to study air quality dynamics over the Iberian Peninsula, Int. J. Climatol., 35, 2877–2897, 2015.
Wang, X.: Dataset for the decay process of PM2.5 pollution episodes around Beijing (Version 1) [Data set]. ACP. Zenodo, https://doi.org/10.5281/zenodo.4415029, 2021.
Wang, X. and Zhang, R.: Effects of atmospheric circulations on the interannual variation in PM2.5 concentrations over the Beijing–Tianjin–Hebei region in 2013–2018, Atmos. Chem. Phys., 20, 7667–7682, https://doi.org/10.5194/acp-20-7667-2020, 2020a.
Wang, X. and Zhang, R.: How Did Air Pollution Change during COVID-19 Outbreak in China?, B. Am. Meteorol. Soc., 101, E1645–E1652, 2020b.
Wang, T., Nie, W., Gao, J., Xue, L. K., Gao, X. M., Wang, X. F., Qiu, J., Poon, C. N., Meinardi, S., Blake, D., Wang, S. L., Ding, A. J., Chai, F. H., Zhang, Q. Z., and Wang, W. X.: Air quality during the 2008 Beijing Olympics: secondary pollutants and regional impact, Atmos. Chem. Phys., 10, 7603–7615, https://doi.org/10.5194/acp-10-7603-2010, 2010.
Wang, H., Chen, H., and Liu, J.: Arctic sea ice decline intensified haze pollution in eastern China, Atmos. Oceanic Sci. Lett., 8, 1–9, 2015.
Wang, X., Wang, K., and Su, L.: Contribution of atmospheric diffusion conditions to the recent improvement in air quality in China, Sci. Rep., 6, 36404, https://doi.org/10.1038/srep36404, 2016.
Wang, X., Dickinson, R. E., Su, L., Zhou, C., and Wang, K.: PM2.5 pollution in China and how it has been exacerbated by terrain and meteorological conditions, B. Am. Meteorol. Soc., 99, 105–119, 2018.
Wang, X., Wei, H., Liu, J., Xu, B., Wang, M., Ji, M., and Jin, H.: Quantifying the light absorption and source attribution of insoluble light-absorbing particles on Tibetan Plateau glaciers between 2013 and 2015, The Cryosphere, 13, 309–324, https://doi.org/10.5194/tc-13-309-2019, 2019a.
Wang, X., Zhang, R., and Yu, W.: The effects of PM2.5 concentrations and relative humidity on atmospheric visibility in Beijing, J. Geophys. Res.-Atmos., 124, 2235–2259, 2019b.
Wang, Y., Duan, J., Xie, X., He, Q., Cheng, T., Mu, H., Gao, W., and Li, X.: Climatic factors and their availability in estimating long-term variations of fine particle distributions over East China, J. Geophys. Res.-Atmos., 124, 3319–3334, 2019c.
Wang, Y., Li, W., Gao, W., Liu, Z., Tian, S., Shen, R., Ji, D., Wang, S., Wang, L., and Tang, G.: Trends in particulate matter and its chemical compositions in China from 2013–2017, Sci. China Earth Sci., 62, 1857–1871, 2019d.
Wang, J., Liu, Y., and Ding, Y.: On the connection between interannual variations of winter haze frequency over Beijing and different ENSO flavors, Sci. Total Environ., 740, 140109, https://doi.org/10.1016/j.scitotenv.2020.140109, 2020a.
Wang, P., Chen, K., Zhu, S., Wang, P., and Zhang, H.: Severe air pollution events not avoided by reduced anthropogenic activities during COVID-19 outbreak, Resour. Conserv. Recycl., 158, 104814, https://doi.org/10.1016/j.resconrec.2020.104814, 2020b.
Wang, Y., Yu, M., Wang, Y., Tang, G., Song, T., Zhou, P., Liu, Z., Hu, B., Ji, D., Wang, L., Zhu, X., Yan, C., Ehn, M., Gao, W., Pan, Y., Xin, J., Sun, Y., Kerminen, V.-M., Kulmala, M., and Petäjä, T.: Rapid formation of intense haze episodes via aerosol–boundary layer feedback in Beijing, Atmos. Chem. Phys., 20, 45–53, https://doi.org/10.5194/acp-20-45-2020, 2020c.
Wu, P., Ding, Y., and Liu, Y.: Atmospheric circulation and dynamic mechanism for persistent haze events in the Beijing–Tianjin–Hebei region, Adv. Atmos. Sci., 34, 429–440, 2017.
Xia, X., Che, H., Zhu, J., Chen, H., Cong, Z., Deng, X., Fan, X., Fu, Y., Goloub, P., and Jiang, H.: Ground-based remote sensing of aerosol climatology in China: Aerosol optical properties, direct radiative effect and its parameterization, Atmos. Environ., 124, 243–251, 2016.
Xin, J., Wang, Y., Wang, L., Tang, G., Sun, Y., Pan, Y., and Ji, D.: Reductions of PM2.5 in Beijing-Tianjin-Hebei urban agglomerations during the 2008 Olympic Games, Adv. Atmos. Sci., 29, 1330–1342, 2012.
Xin, J., Gong, C., Wang, S., and Wang, Y.: Aerosol direct radiative forcing in desert and semi-desert regions of northwestern China, Atmos. Res., 171, 56–65, 2016.
Xu, J., Chang, L., Qu, Y., Yan, F., Wang, F., and Fu, Q.: The meteorological modulation on PM2.5 interannual oscillation during 2013 to 2015 in Shanghai, China, Sci. Total Environ., 572, 1138–1149, 2016.
Yao, L., Garmash, O., Bianchi, F., Zheng, J., Yan, C., Kontkanen, J., Junninen, H., Mazon, S. B., Ehn, M., and Paasonen, P.: Atmospheric new particle formation from sulfuric acid and amines in a Chinese megacity, Science, 361, 278–281, 2018.
Zhang, R.: Warming boosts air pollution, Nat. Clim. Change, 7, 238–239, 2017.
Zhang, R., Sumi, A., and Kimoto, M.: Impact of El Niño on the east Asian monsoon: A diagnostic study of the '86–87 and '91–92 events, J. Meteorol. Soc. Japan, 74, 49–62, 1996.
Zhang, R., Li, Q., and Zhang, R.: Meteorological conditions for the persistent severe fog and haze event over eastern China in January 2013, Sci. China Earth Sci., 57, 26–35, 2014.
Zhang, Z., Gong, D., Mao, R., Kim, S.-J., Xu, J., Zhao, X., and Ma, Z.: Cause and predictability for the severe haze pollution in downtown Beijing in November–December 2015, Sci. Total Environ., 592, 627–638, 2017.
Zhang, K., Ma, Y., Xin, J., Liu, Z., Ma, Y., Gao, D., Wu, J., Zhang, W., Wang, Y., and Shen, P.: The aerosol optical properties and PM2.5 components over the world's largest industrial zone in Tangshan, North China, Atmos. Res., 201, 226–234, 2018a.
Zhang, X., Zhong, J., Wang, J., Wang, Y., and Liu, Y.: The interdecadal worsening of weather conditions affecting aerosol pollution in the Beijing area in relation to climate warming, Atmos. Chem. Phys., 18, 5991–5999, https://doi.org/10.5194/acp-18-5991-2018, 2018b.
Zhang, Q., Zheng, Y., Tong, D., Shao, M., Wang, S., Zhang, Y., Xu, X., Wang, J., He, H., and Liu, W.: Drivers of improved PM2.5 air quality in China from 2013 to 2017, P. Natl. Acad. Sci. USA, 116, 24463–24469, 2019a.
Zhang, X., Xu, X., Ding, Y., Liu, Y., Zhang, H., Wang, Y., and Zhong, J.: The impact of meteorological changes from 2013 to 2017 on PM2.5 mass reduction in key regions in China, Sci. China Earth Sci., 62, 1885–1902, 2019b.
Zhang, F., Wang, Y., Peng, J., Chen, L., Sun, Y., Duan, L., Ge, X., Li, Y., Zhao, J., and Liu, C.: An unexpected catalyst dominates formation and radiative forcing of regional haze, P. Natl. Acad. Sci. USA, 117, 3960–3966, 2020.
Zhao, G., Zhao, C., Kuang, Y., Tao, J., Tan, W., Bian, Y., Li, J., and Li, C.: Impact of aerosol hygroscopic growth on retrieving aerosol extinction coefficient profiles from elastic-backscatter lidar signals, Atmos. Chem. Phys., 17, 12133–12143, https://doi.org/10.5194/acp-17-12133-2017, 2017.
Zhao, C., Li, Y., Zhang, F., Sun, Y., and Wang, P.: Growth rates of fine aerosol particles at a site near Beijing in June 2013, Adv. Atmos. Sci., 35, 209–217, 2018a.
Zhao, D., Schmitt, S. H., Wang, M., Acir, I.-H., Tillmann, R., Tan, Z., Novelli, A., Fuchs, H., Pullinen, I., Wegener, R., Rohrer, F., Wildt, J., Kiendler-Scharr, A., Wahner, A., and Mentel, T. F.: Effects of NOx and SO2 on the secondary organic aerosol formation from photooxidation of α-pinene and limonene, Atmos. Chem. Phys., 18, 1611–1628, https://doi.org/10.5194/acp-18-1611-2018, 2018b.
Zhao, C., Wang, Y., Shi, X., Zhang, D., Wang, C., Jiang, J. H., Zhang, Q., and Fan, H.: Estimating the contribution of local primary emissions to particulate pollution using high-density station observations, J. Geophys. Res.-Atmos., 124, 1648–1661, 2019.
Zhao, C., Yang, Y., Fan, H., Huang, J., Fu, Y., Zhang, X., Kang, S., Cong, Z., Letu, H., and Menenti, M.: Aerosol characteristics and impacts on weather and climate over the Tibetan Plateau, Natl. Sci. Rev., 7, 492–495, 2020a.
Zhao, H., Che, H., Zhang, L., Gui, K., Ma, Y., Wang, Y., Wang, H., Zheng, Y., and Zhang, X.: How aerosol transport from the North China plain contributes to air quality in northeast China, Sci. Total Environ., 738, 139555, https://doi.org/10.1016/j.scitotenv.2020.139555, 2020b.
Zheng, G. J., Duan, F. K., Su, H., Ma, Y. L., Cheng, Y., Zheng, B., Zhang, Q., Huang, T., Kimoto, T., Chang, D., Pöschl, U., Cheng, Y. F., and He, K. B.: Exploring the severe winter haze in Beijing: the impact of synoptic weather, regional transport and heterogeneous reactions, Atmos. Chem. Phys., 15, 2969–2983, https://doi.org/10.5194/acp-15-2969-2015, 2015.
Zheng, B., Tong, D., Li, M., Liu, F., Hong, C., Geng, G., Li, H., Li, X., Peng, L., Qi, J., Yan, L., Zhang, Y., Zhao, H., Zheng, Y., He, K., and Zhang, Q.: Trends in China's anthropogenic emissions since 2010 as the consequence of clean air actions, Atmos. Chem. Phys., 18, 14095–14111, https://doi.org/10.5194/acp-18-14095-2018, 2018.
Zhu, X., Tang, G., Hu, B., Wang, L., Xin, J., Zhang, J., Liu, Z., Münkel, C., and Wang, Y.: Regional pollution and its formation mechanism over North China Plain: A case study with ceilometer observations and model simulations, J. Geophys. Res.-Atmos., 121, 14574–14588, 2016.