the Creative Commons Attribution 4.0 License.
the Creative Commons Attribution 4.0 License.
 | 18 Feb 2021
Emissions of intermediate-volatility and semi-volatile organic compounds from domestic fuels used in Delhi, India
Gareth J. Stewart
Beth S. Nelson
W. Joe F. Acton
Adam R. Vaughan
Naomi J. Farren
James R. Hopkins
Martyn W. Ward
Stefan J. Swift
Rahul Arya
Arnab Mondal
Ritu Jangirh
Sakshi Ahlawat
Lokesh Yadav
Sudhir K. Sharma
Siti S. M. Yunus
C. Nicholas Hewitt
Eiko Nemitz
Neil Mullinger
Ranu Gadi
Lokesh K. Sahu
Nidhi Tripathi
Andrew R. Rickard
James D. Lee
Tuhin K. Mandal
Jacqueline F. Hamilton
Biomass burning emits significant quantities of intermediate-volatility and semi-volatile organic compounds (I/SVOCs) in a complex mixture, probably containing many thousands of chemical species. These components are significantly more toxic and have poorly understood chemistry compared to volatile organic compounds routinely quantified in ambient air; however, analysis of I/SVOCs presents a difficult analytical challenge.
The gases and particles emitted during the test combustion of a range of domestic solid fuels collected from across Delhi were sampled and analysed. Organic aerosol was collected onto Teflon (PTFE) filters, and residual low-volatility gases were adsorbed to the surface of solid-phase extraction (SPE) discs. A new method relying on accelerated solvent extraction (ASE) coupled to comprehensive two-dimensional gas chromatography with time-of-flight mass spectrometry (GC × GC–ToF-MS) was developed. This highly sensitive and powerful analytical technique enabled over 3000 peaks from I/SVOC species with unique mass spectra to be detected. A total of 15 %–100 % of gas-phase emissions and 7 %–100 % of particle-phase emissions were characterised. The method was analysed for suitability to make quantitative measurements of I/SVOCs using SPE discs. Analysis of SPE discs indicated phenolic and furanic compounds were important for gas-phase I/SVOC emissions and levoglucosan to the aerosol phase. Gas- and particle-phase emission factors for 21 polycyclic aromatic hydrocarbons (PAHs) were derived, including 16 compounds listed by the US EPA as priority pollutants. Gas-phase emissions were dominated by smaller PAHs. The new emission factors were measured (mg kg−1) for PAHs from combustion of cow dung cake (615), municipal solid waste (1022), crop residue (747), sawdust (1236), fuelwood (247), charcoal (151) and liquefied petroleum gas (56).
The results of this study indicate that cow dung cake and municipal solid waste burning are likely to be significant PAH sources, and further study is required to quantify their impact alongside emissions from fuelwood burning.
- Article
(5503 KB) - Full-text XML
- Companion paper
-
Supplement
(3829 KB) - BibTeX
- EndNote


Biomass burning is one of the most important global sources of trace gases and particles to the atmosphere (Simoneit, 2002; Chen et al., 2017; Andreae, 2019), with residential solid-fuel combustion and wildfires emitting significant quantities of organic matter (Streets et al., 2003; Barboni et al., 2010; Chen et al., 2017; Liu et al., 2017; Kiely et al., 2019). Emissions of volatile organic compounds (VOCs) and particulate matter (PM) from biomass burning are of interest due to their detrimental impact on air quality. VOCs react to form ozone and secondary organic aerosol (SOA). Intermediate-volatility and semi-volatile organic compounds (I/SVOCs) are also a significant emission from biomass burning (Stockwell et al., 2015; Koss et al., 2018). I/SVOCs are an important class of air pollutant due to their contribution to aerosol formation (Bruns et al., 2016; Lu et al., 2018). I/SVOC emissions are poorly, if at all, represented in regional inventories and chemical transport models. Consequently, their impacts to air quality in developing regions, where solid-fuel combustion is a dominant fuel source, are not well understood. Recent studies have shown that the inclusion of I/SVOCs leads to better agreement between modelled and measured values (Ots et al., 2016; Woody et al., 2016; Jathar et al., 2017; Murphy et al., 2017). Global I/SVOC emissions to the atmosphere from biomass burning were estimated to be ∼ 54 Tg yr−1 from 2005–2008 (Hodzic et al., 2016), with I/SVOCs contributing in the range 8–15.5 Tg yr−1 to SOA (Cubison et al., 2011; Hodzic et al., 2016).
SOA formation from biomass burning emissions is poorly understood globally. Important factors include the formation of less volatile products from the oxidation of non-methane volatile organic compounds (NMVOCs) which partition into the aerosol phase, heterogeneous oxidation of aerosol phase organics, and plume dilution followed by evaporation and further gas-phase oxidation (Lim et al., 2019). Ahern et al. (2019) showed that for burning of biomass needles, biogenic VOCs were the dominant class of SOA precursor. This study also found that for wire grass, furans were the most important SOA precursor. Bruns et al. (2016) showed that SOA formation from combustion of beech fuelwood was dominated by 22 compounds, with phenol, naphthalene and benzene contributing up to 80 % of the observed SOA. SOA formation from biomass burning has been shown to be significant in laboratory studies, with SOA yields from the burning of western US fuels reported to be 24 ± 4 % after 6 h and 56 ± 9 % after 4 d (Lim et al., 2019). However, the effect of atmospheric ageing on I/SVOCs still remains poorly understood (Liu et al., 2017; Decker et al., 2019; Sengupta et al., 2020).
Better understanding of the quantity and composition of I/SVOCs from biomass burning is needed to evaluate their impact on the atmosphere. This is a difficult analytical task, which is not well suited to conventional analysis with gas chromatography coupled to mass spectrometry (GC–MS). The reason for this is because of the exponential growth of potential isomers with carbon number, which results in a large number of coeluting peaks (Goldstein and Galbally, 2007). The high resolution of two-dimensional gas chromatography (GC × GC) has been demonstrated as an ideal technique to overcome this issue when analysing complex organic samples in both gas (Lewis et al., 2000; Stewart et al., 2021a) and particle phases (Hamilton et al., 2004; Lyu et al., 2019). The application of GC × GC to biomass burning emissions has shown hundreds of gaseous I/SVOCs using adsorption–thermal-desorption cartridges (Hatch et al., 2015) or solid-phase extraction (SPE) discs (Hatch et al., 2018). GC × GC has also been used to analyse the particle phase with samples collected onto PTFE or quartz filters (Hatch et al., 2018; Jen et al., 2019), with the latter study quantifying 149 organic compounds which accounted for 4 %–37 % of the total mass of organic carbon. The process used by Hatch et al. (2018) demonstrated high recoveries of non-polar species from PTFE filters, with lower recoveries from SPE discs. This study highlighted the need for further evaluation of samples collected onto PTFE filters and SPE discs, ideally improving the method to remove undesirable steps such as trimethylsilylation derivatisation, the use of pyridine and centrifuging, which led to high evaporative losses. The need to develop improved sampling and measurement techniques for I/SVOCs has also been highlighted. This is because these species often do not transmit quantitatively through the inlet and tubing when measured using online gas-phase techniques (Pagonis et al., 2017).
Residential combustion, agricultural crop residue burning and open municipal solid waste burning in the developing world are large, poorly characterised pollution sources with the potential to have a significant impact on local and regional air quality, impacting human health (Venkataraman et al., 2005; Jain et al., 2014; Wiedinmyer et al., 2014). Hazardous indoor air pollution from combustion of solid fuels has been shown to be the most important factor from a range of 67 environmental and lifestyle risk factors causing disease in South Asia (Lim et al., 2012). Despite this, nearly 76 % of rural Indian households depend on solid biomass for their cooking needs (Gordon et al., 2018), using biofuels such as fuelwood, cow dung cake and crop residue. Combustion often takes place indoors, without efficient emission controls, which significantly increases the mean household concentration of pollutants, particularly particulate matter with a diameter less than 2.5 µm (PM2.5). The health effects from this are significant, with an estimated 3.8 million premature deaths globally due to inefficient indoor combustion from cooking (WHO, 2018).
Few detailed studies examining the composition of I/SVOC emissions from solid-fuel combustion sources from South Asia have been conducted. Sheesley et al. (2003) used solvent extraction followed by GC–MS to produce emission factors and examine molecular markers from combustion of coconut leaves, rice straw, cow dung cake, biomass briquettes and jackfruit branches collected from Bangladesh. A more recent study extracted PM2.5 samples followed by analysis with GC–MS from motorcycles, diesel generators, gasoline generators, agricultural pumps, municipal solid waste burning, cooking fires using fuelwood, cooking fires using cow dung cake, crop residue burning, and brick kilns in Nepal (Jayarathne et al., 2018). Lack of knowledge regarding major pollution sources hinders our ability to predict air quality but also the development of effective mitigation strategies for air pollution which leads to health impacts ranging from respiratory illness to premature death (Brunekreef and Holgate, 2002). This results in many people living with high levels of air pollution (Cohen et al., 2005; Lelieveld et al., 2015) and 13 Indian cities ranking amongst the top 20 cities in the world with the highest levels of ambient PM2.5 pollution, based on available data (Gordon et al., 2018).
In this study we develop a more efficient extraction step for the SPE/PTFE technique developed by Hatch et al. (2018), using accelerated solvent extraction into ethyl acetate, which showed high recoveries of non-polar I/SVOCs. Domestic fuels characteristic to northern India were gathered and organic I/SVOC samples collected onto SPE discs and PTFE filters from controlled laboratory combustion experiments of a variety of fuelwood types, cow dung cakes, municipal solid waste samples, crop residues, charcoal and liquefied petroleum gas (LPG). The samples were extracted using this new technique and analysed with GC × GC coupled to time-of-flight mass spectrometry (GC × GC–ToF-MS). Molecular markers were examined from different fuels and the limitations for quantification of the extremely complex samples using a mass spectrometer were examined.
2.1 Fuel collection and burning facility
The state of Delhi was gridded (0.05 × 0.05), and a diverse range of fuel types were collected from across the state (see Fig. 1). Fuels were stored in a manner akin to local practices prior to combustion, to ensure that the moisture content of fuels was similar to those burnt across the state. A range of solid biomass fuels were collected which included 17 fuelwood species, cow dung cake, charcoal and sawdust (see Table 1). Three crop residue fuel types were collected and consisted of dried stems from vegetable plants such as cabbage (Brassica spp.) and aubergines (Solanum melongena) as well as coconut husk (Cocos nucifera). Municipal solid waste was collected from Bhalaswa, Ghazipur and Okhla landfill sites. A low-cost LPG stove was also purchased to allow for direct comparison to other combustion sources.
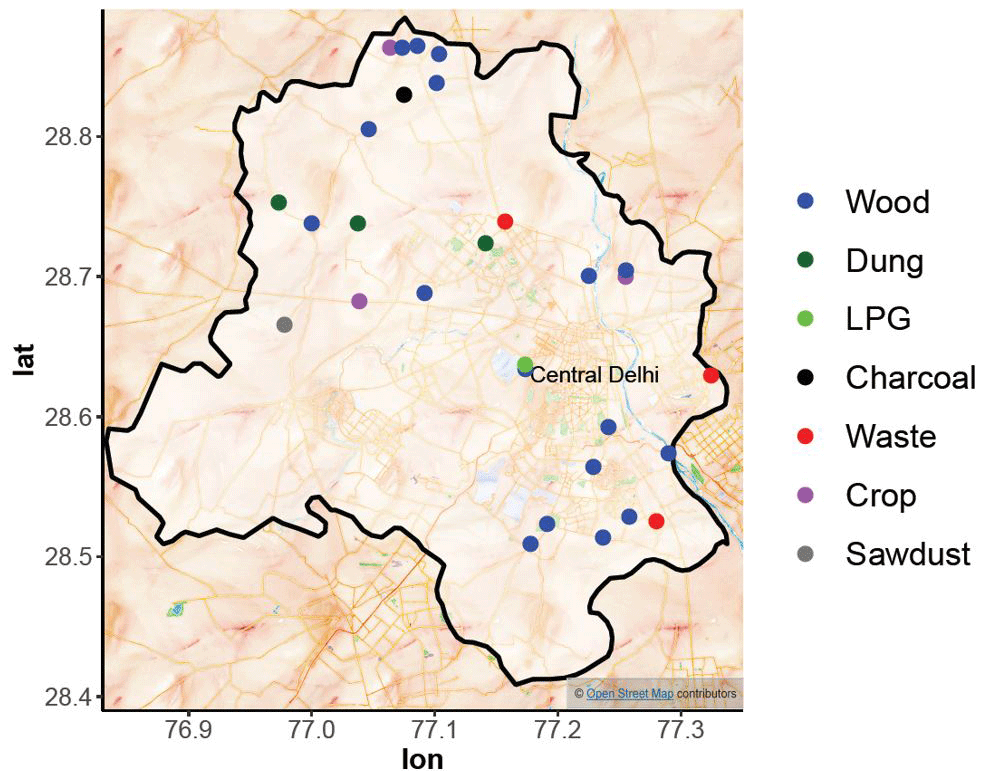
Figure 1Locations across Delhi used for the local surveys of fuel usage and collection. Map tiles by Stamen Design. Data by © OpenStreetMap contributors 2020. Distributed under a Creative Commons BY-SA License.
Table 1Types of fuel sampled where n represents the number of burns of a specific fuel type, and SPE and PTFE represent the number of blank corrected peaks detected on SPE discs and PTFE filters, respectively.
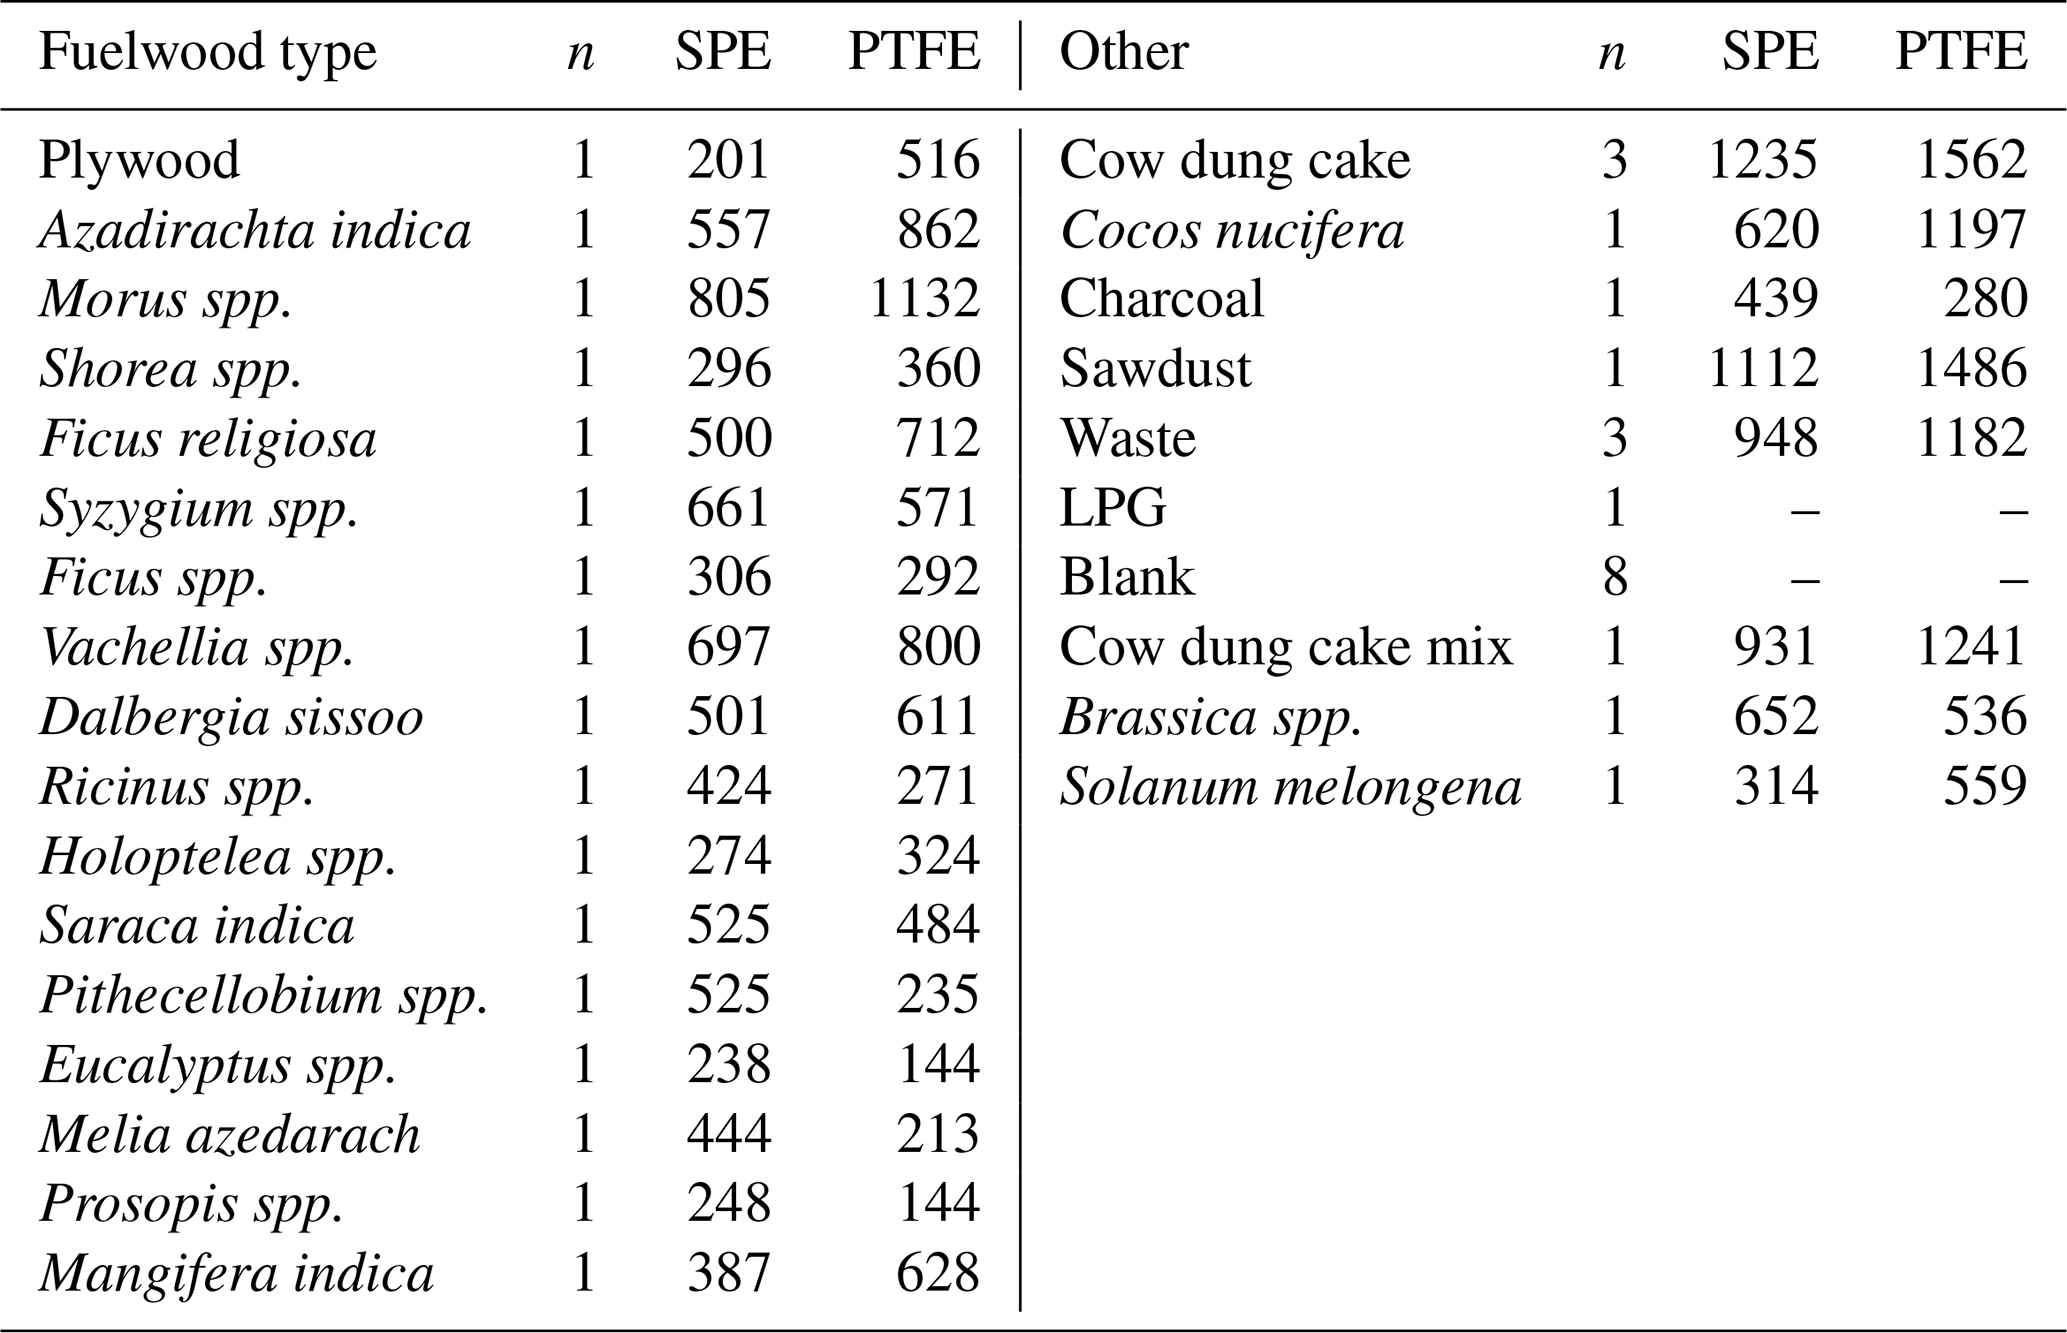
Fuels were burnt at the CSIR-National Physical Laboratory (NPL), New Delhi, under controlled conditions using a combustion–dilution chamber that has been well described previously (Venkataraman et al., 2002; Saud et al., 2011, 2012; Singh et al., 2013). In summary, 200 g of dry fuel was rapidly heated to spontaneous ignition with emissions driven into a hood and up a flue by convection to allow enough dilution, cooling and residence time to achieve the quenching of typical indoor environments. This process was designed to replicate the immediate condensational processes that occur in smoke particles approximately 5–20 min after emission yet prior to photochemistry which may change composition (Akagi et al., 2011). An example of this setup is given in the video supplement. A low-volume sampler (Vayubodhan Pvt. Ltd) was used to collect particulates and low-volatility gases passing from the top of the flue through a chamber with a flow rate of 46.7 L min−1. As detailed in Table 1, samples were collected from 30 fuels alongside eight blank measurements (see Sect. S1 in the Supplement for an example burn and filter sample). Prior to sample collection, SPE discs (Resprep, C18, 47 mm) were prewashed with 2 × 5 mL acetone (Fisher Scientific analytical reagent grade) and 1 × 5 mL methanol (Sigma-Aldrich HPLC grade), then packed in foil and sealed in airtight bags. Samples were collected onto a PTFE filter (Cole-Parmer, 47 mm, 1.2 µm pore size), directly placed on top of an SPE disc in a filter holder (Cole-Parmer, 47 mm, PFA) for 30 min at a flow rate of 6 L min−1, maintained by a mass flow controller (Alicat 0–20 L min−1) connected to a pump. Samples were removed from the filter holder immediately after the experiment, wrapped in foil, placed into an airtight bag and stored at −20 ∘C. Samples were transported to the UK for analysis using an insulated container containing dry ice via air freight and stored at −20 ∘C for around 2 months prior to analysis.
2.2 Extraction
SPE discs and PTFE filters were spiked with an internal standard (50 µL at 20 µg mL−1) containing six deuterated polycyclic aromatic hydrocarbons (PAHs) (1,4-dichlorobenzene-d4, naphthalene-d8, acenaphthene-d10, phenanthrene-d10, chrysene-d12, perylene-d12; EPA 8270 Semivolatile Internal Standard Mix, 2000 µg mL−1 in DCM, dichloromethane) to result in a final internal standard concentration of 1 µg mL−1 in solution. The solvent from the internal standard was allowed to evaporate, and then SPE discs and PTFE filters were cut and extracted into ethyl acetate (EtOAc) using accelerated solvent extraction (ASE 350, Dionex, Thermo Fisher Scientific). Extractions were performed at 80 ∘C and 1500 psi (1 psi = 6.9 kPa) for three 5 min cycles. After each cycle, the cell was purged for 60 s into a sample collection vial. Samples were then reduced from 15 to 0.90 mL over a low flow of N2 in an ice bath over a period of 6–8 h (Farren et al., 2015). Samples were then pipetted (glass, Pasteur) to sample vials (Sigma-Aldrich, amber glass, 1.5 mL), with ASE vials rinsed with 2 × 50 µL washes of EtOAc, then added to the sample vial and sealed (Agilent 12 mm cap, PTFE/silicone/PTFE). The mass of the sample vial and cap for each sample was measured before and after to determine the exact volume of solvent in each sample. Extracts were frozen prior to analysis to reduce evaporative losses.
2.3 Organic composition analysis
For GC × GC–ToF-MS, PTFE samples were analysed using GC × GC–ToF-MS (Leco Pegasus BT 4D) using a splitless injection (1 µL injection, 4 mm taper focus liner, SHG 560302). The primary dimension column was a RXI-5SilMS (Restek, 30 m × 0.25 µm × 0.25 mm) connected to a second column of RXI-17SilMS (Restek, 0.25 µm × 0.25 mm, 0.17 m primary GC oven, 0.1 m modulator, 1.42 m secondary oven, 0.31 m transfer line) with a He flow of 1.4 mL min−1. The primary oven was held at 40 ∘C for 1 min then ramped at 3 ∘C min−1 to 322 ∘C where it was held for 3 min. The secondary oven was held at 62 ∘C for 1 min then ramped at 3.2 ∘C min−1 to 190 ∘C after which it was ramped at 3.6 ∘C min−1 to 325 ∘C and held for 19.5 min. The inlet was held at 280 ∘C and the transfer line at 340 ∘C. A 5 s cryogenic modulation was used with a 1.5 s hot pulse and 1 s cool time between stages. Using two separate wash vials, the syringe (10 µL Gerstel) was cleaned prior to injection with two cycles of 3 × 5 µL washes in EtOAc and rinsed post injection with two cycles of 2 × 5 µL washes in EtOAc. Samples with high concentrations of levoglucosan were reanalysed using a faster method, injected split (75:1 and 125:1) with the primary oven held at 40 ∘C for 1 min, then ramped at 10 ∘C min−1 to 220 ∘C. The secondary oven was held at 62 ∘C for 1 min and then ramped at 10 ∘C min−1 to 245 ∘C.
SPE samples were injected split (10 : 1) and analysed with a shorter analysis time with the primary oven held at 40 ∘C for 1 min then ramped at 3 ∘C min−1 to 202 ∘C where it was held for 4 s. The secondary oven was held at 62 ∘C for 1 min then ramped at 3.2 ∘C min−1 to 235 ∘C. A 75 : 1 split injection was used for quantitation of concentrations outside of the detector response range for furanics, phenolics, benzaldehydes, naphthalenes and benzonitrile. Peaks were assigned through comparison of retention times with known standards and comparison with the National Institute of Standards and Technology (NIST) mass spectral library. Peaks with no genuine standard available were tentatively identified if the NIST library similarity was > 700. This provides an indication of how similar the obtained mass spectra were to the database mass spectra for the peak, with more details given in Stein (2011). Peaks with a hit > 900 reflect an excellent match, 800–900 a good match and 700–800 a fair match (Stein, 2011). The uncertainty in this approach has been shown to be low for peaks of hits > 800, with the probability of incorrect identification being around 30 % for hits between 800–900 and 14 % for matches above 900 (Worton et al., 2017). Integration was carried out within the ChromaTOF 5.0 software package (Leco, 2019). Calibration was performed using a six-point calibration using either a linear or second-order polynomial fit covering the ranges 0.1–2.5 µg mL−1 (splitless), 0.5–15 µg mL−1 (10 : 1 split), 15–400 µg mL−1 (75 : 1 split) and 400–800 µg mL−1 (125 : 1 split). Eight blank measurements were made at the beginning and end of the day by passing air from the chamber (6 L min−1 for 30 min) through the filter holder containing PTFE filters and SPE discs (see Sect. S2 for examples of blank chromatograms). Blank corrections were applied by calculating the average blank value for each compound with blank samples collected using the same sample collection parameters as real samples before and after the relevant burning experiments.
Online measurements of naphthalene, methylnaphthalenes and dimethylnaphthalenes were made using a proton-transfer-reaction time-of-flight mass spectrometer (PTR-ToF-MS) (PTR 8000; Ionicon Analytik, Innsbruck) and assigned as masses 129.058, 143.08 and 157.097, respectively. Additional details of the PTR-ToF-MS from the Physical Research Laboratory (PRL), Ahmedabad, used in this study are given in previous papers (Sahu and Saxena, 2015; Sahu et al., 2016). A in. o.d. PFA (perfluoroalkoxy alkane) sample line ran from the top of the flue to the instrument which was housed in an air-conditioned laboratory with a sample flow rate of 4.3 L min−1. The sample air was diluted either 5 or 6.25 times into zero air, generated by passing ambient air (1 L min−1) through a heated platinum filament at 550 ∘C, before entering the instrument with an inlet flow of 250 mL min−1. The instrument was operated with a reduced electric field strength (, where N is the buffer gas density and E is the electric field strength) of 120 Td. The drift tube temperature was 60 ∘C with a pressure of 2.3 mbar and 560 V applied across it.
Calibrations of the PTR-ToF-MS were performed twice a week using a gas calibration unit (Ionicon Analytik, Innsbruck). The calibration gas (Apel-Riemer Environmental Inc., Miami) contained 18 compounds: methanol, acetonitrile, acetaldehyde, acetone, dimethyl sulfide, isoprene, methacrolein, methyl vinyl ketone, 2-butanol, benzene, toluene, 2-hexanone, m-xylene, heptanal, α-pinene, 3-octanone and 3-octanol at 1000 ppb (±5 %), and β-caryophyllene at 500 ppb (±5 %). This standard was dynamically diluted into zero air to provide a six-point calibration. The normalized counts per second (ncps) per ppbv of the NMVOC (ncps/ppbv) was then determined for each mass using a transmission curve (Taipale et al., 2008).
Mass calibration and peak fitting of the PTR-ToF-MS data were performed using PTRwid software (Holzinger, 2015). Count rates per second (cps) of each mass spectral peak were normalised to the primary ion (H3O+), and water cluster (H3O ⋅ H2O)+ peaks and mixing ratios were then determined for each mass using the normalised sensitivity (ncps). Where compounds known to fragment in the PTR-ToF-MS were identified, the mixing ratio of these species was calculated by summing parent ion and fragment ion mixing ratios. Before each burning study, ambient air was sampled to provide a background for the measurement.
2.4 Quantification of recovery and breakthrough
Standards were used for 136 species (see Sect. S3) including two commercially available standard mixes containing 33 alkanes (C7–C40 saturated alkane standard, certified 1000 µg m−1 in hexane, Sigma-Aldrich 49452-U) and 64 semi-volatiles (EPA CLP Semivolatile Calibration Mix, 1000 µg mL−1 in DCM : benzene 3 : 1, Sigma-Aldrich 506508). Further standards were produced in-house, by dissolving high-quality standards (> 99 % purity), for a range of additional species also found in samples including nitrogen-containing VOCs, furanics, alkyl-substituted monoaromatics, oxygenated aromatics, ketones, aldehydes, methoxy phenols, aromatic acids, PAHs and levoglucosan. Stock solutions of around 1000 µg mL−1 were prepared by dissolving 0.01 g into 10 mL EtOAc. Polar components, such as levoglucosan, were dissolved into methanol (MeOH) for stock solutions, and those not soluble at room temperature were heated and pipetted using hot pipette tips to make quantitative dilutions.
Six separate PTFE filters and SPE discs were spiked with the standard solution containing 136 compounds (50 µL at 20 µg mL−1), extracted and analysed. Recovery levels were calculated by comparing the signal to direct injection of the diluted standards to the GC × GC–ToF-MS. The recoveries are shown in Sect. S3. SPE discs showed poor recoveries (Srec) of n-nonane to n-tridecane and C2-substituted monoaromatics, likely due to volatilisation of these more volatile components. Poorer recoveries were also observed of nitroanilines and levoglucosan. Non-polar species showed good recoveries, with high recoveries of C14–C20 alkanes, furanics, phenolics, chlorobenzenes and PAHs. PTFE filters demonstrated high recoveries (Prec) of PAHs with more than three rings in their structure (81.6 %–100 %). Recoveries were low or zero for volatile components with boiling points < 200 ∘C, indicating no retention, which is consistent with the method being well suited to target the aerosol phase. The recoveries of non-polar species into EtOAc from SPE discs were higher than those reported into MeOH (Hatch et al., 2018).
To quantify the additional effect of breakthrough during sampling, tests were conducted for SPE discs to examine the retention of components adsorbed to their surface when subject to an air flow equivalent to the sample volume. SPE discs were spiked with the calibration mixture containing 96 compounds of interest (50 µL at 20 µg mL−1, n = 4) and subject to a purified air flow of 6 L min−1 for 30 min. The samples were extracted and analysed, and the signal was compared with 4 × 50 µL spikes directly into 0.95 mL EtOAc. Figure 2 shows the relative enhancement of unpurged over purged samples. For more volatile components, a value greater than zero was observed (Fig. 2), which indicated breakthrough of the most volatile components and indicated good retention of components with a boiling point of around 225 ∘C (see Sect. S4 for breakthrough tests). Concentrations measured for n-alkanes on SPE discs were also compared with concurrent measurements made during burning experiments using online thermal-desorption two-dimensional gas chromatography coupled to a flame ionisation detector. The measured concentrations for n-alkanes from n-nonane to n-dodecane were compared using both techniques, with measured concentrations similar for n-undecane/n-dodecane (boiling point bp = 216 ∘C; see Sect. S5) but not the smaller alkanes. This was interpreted to indicate little breakthrough for components less volatile than n-dodecane. These findings are in line with the US EPA certified methods for Resprep SPE discs (525.1, 506, 550.1 and 549.1), when used to quantitatively analyse drinking water, which show their suitability for quantitative measurement of species with a molecular weight of around naphthalene/acenaphthylene (bp = 218–280 ∘C). These results indicate that for more volatile species with boiling points below 250 ∘C, SPE discs can only be used to make qualitative measurements at these sample times and flow rates. Such qualitative information is highly complementary to quantitative measurements using other, less specific techniques, such as PTR-ToF-MS, where it can assist in identification of the contributors to ions.

Figure 2Relative reduction of purged over unpurged samples, presented as a percentage decrease of purged to unpurged signal. The standard deviation of replicate measurements is indicated by the error bars.
3.1 Chromatography
Figure 3 shows chromatograms from I/SVOCs in the gas and particle phase from burning a cow dung cake sample collected from SPE discs and PTFE filters during a whole 30 min burn, after passing through a dilution and cooling chamber. The saturation concentration at 298 K is provided as an alternative x axis and has been calculated for each n-alkane, i, using
where Mi represents molecular weight of VOC i (g mol−1), ζi represents activity coefficient of VOC i in the condensed phase (assumed to be 1), represents liquid vapour pressure of VOC i in torr, R represents the gas constant (8.206 × 10⁻⁵ m3 atm mol−1 K−1) and T represents temperature in kelvin (Lu et al., 2018). The constant 760 Torr has been used to convert between units of standard atmosphere (atm) and torr (Torr) where 1 atm = 760 Torr. values have been calculated from the EPA Estimation Programme Interface Suite data at 298 K (EPA, 2012).
The SPE discs showed 1297 peaks with unique mass spectra and captured gaseous VOCs and I/VOCs with C∗ ∼ 1 × 10⁸–5 × 10² µg m−3 at 298 K. The largest peaks were from alkanes, 1-alkenes, limonene, phenolics, substituted naphthalenes, furanics and substituted pyridines. The PTFE filters captured 1617 I/SVOCs and low and extremely low volatility VOCs (L/ELVOC) with unique mass spectra present in the aerosol phase from C∗ ∼ 5 × 10⁶–1 × 10⁻⁵ µg m−3 at 298 K. A transition can be seen in the two chromatograms from the gas to the aerosol phase. Species with a saturation vapour concentration less than 5 × 10⁴ µg m−3 at 298 K were predominantly in the aerosol phase after passing though the dilution chamber. A large region of more polar components was present in the I/SVOC region from C∗ 5 × 10⁴–5 × 100 µg m−3 at 298 K and contained sugar pyrolysis products and highly substituted aromatics such as those with ketone, ether, and di- and tri-substituted phenol substituents. Many alkanes, from n-octadecane to n-tritriacontane, were present, mainly in the SVOC region. The LVOC region was dominated by a series of sterols and stanols. GC × GC provided extremely high resolution to allow for deconvolution of complex samples. The insert in Fig. 3 shows how the complexity of the SPE chromatogram can be further resolved by looking at a single ion chromatogram, e.g. = 57, which highlighted aliphatic non-polar peaks, with large peaks for alkanes from n-nonane to n-nonadecane.
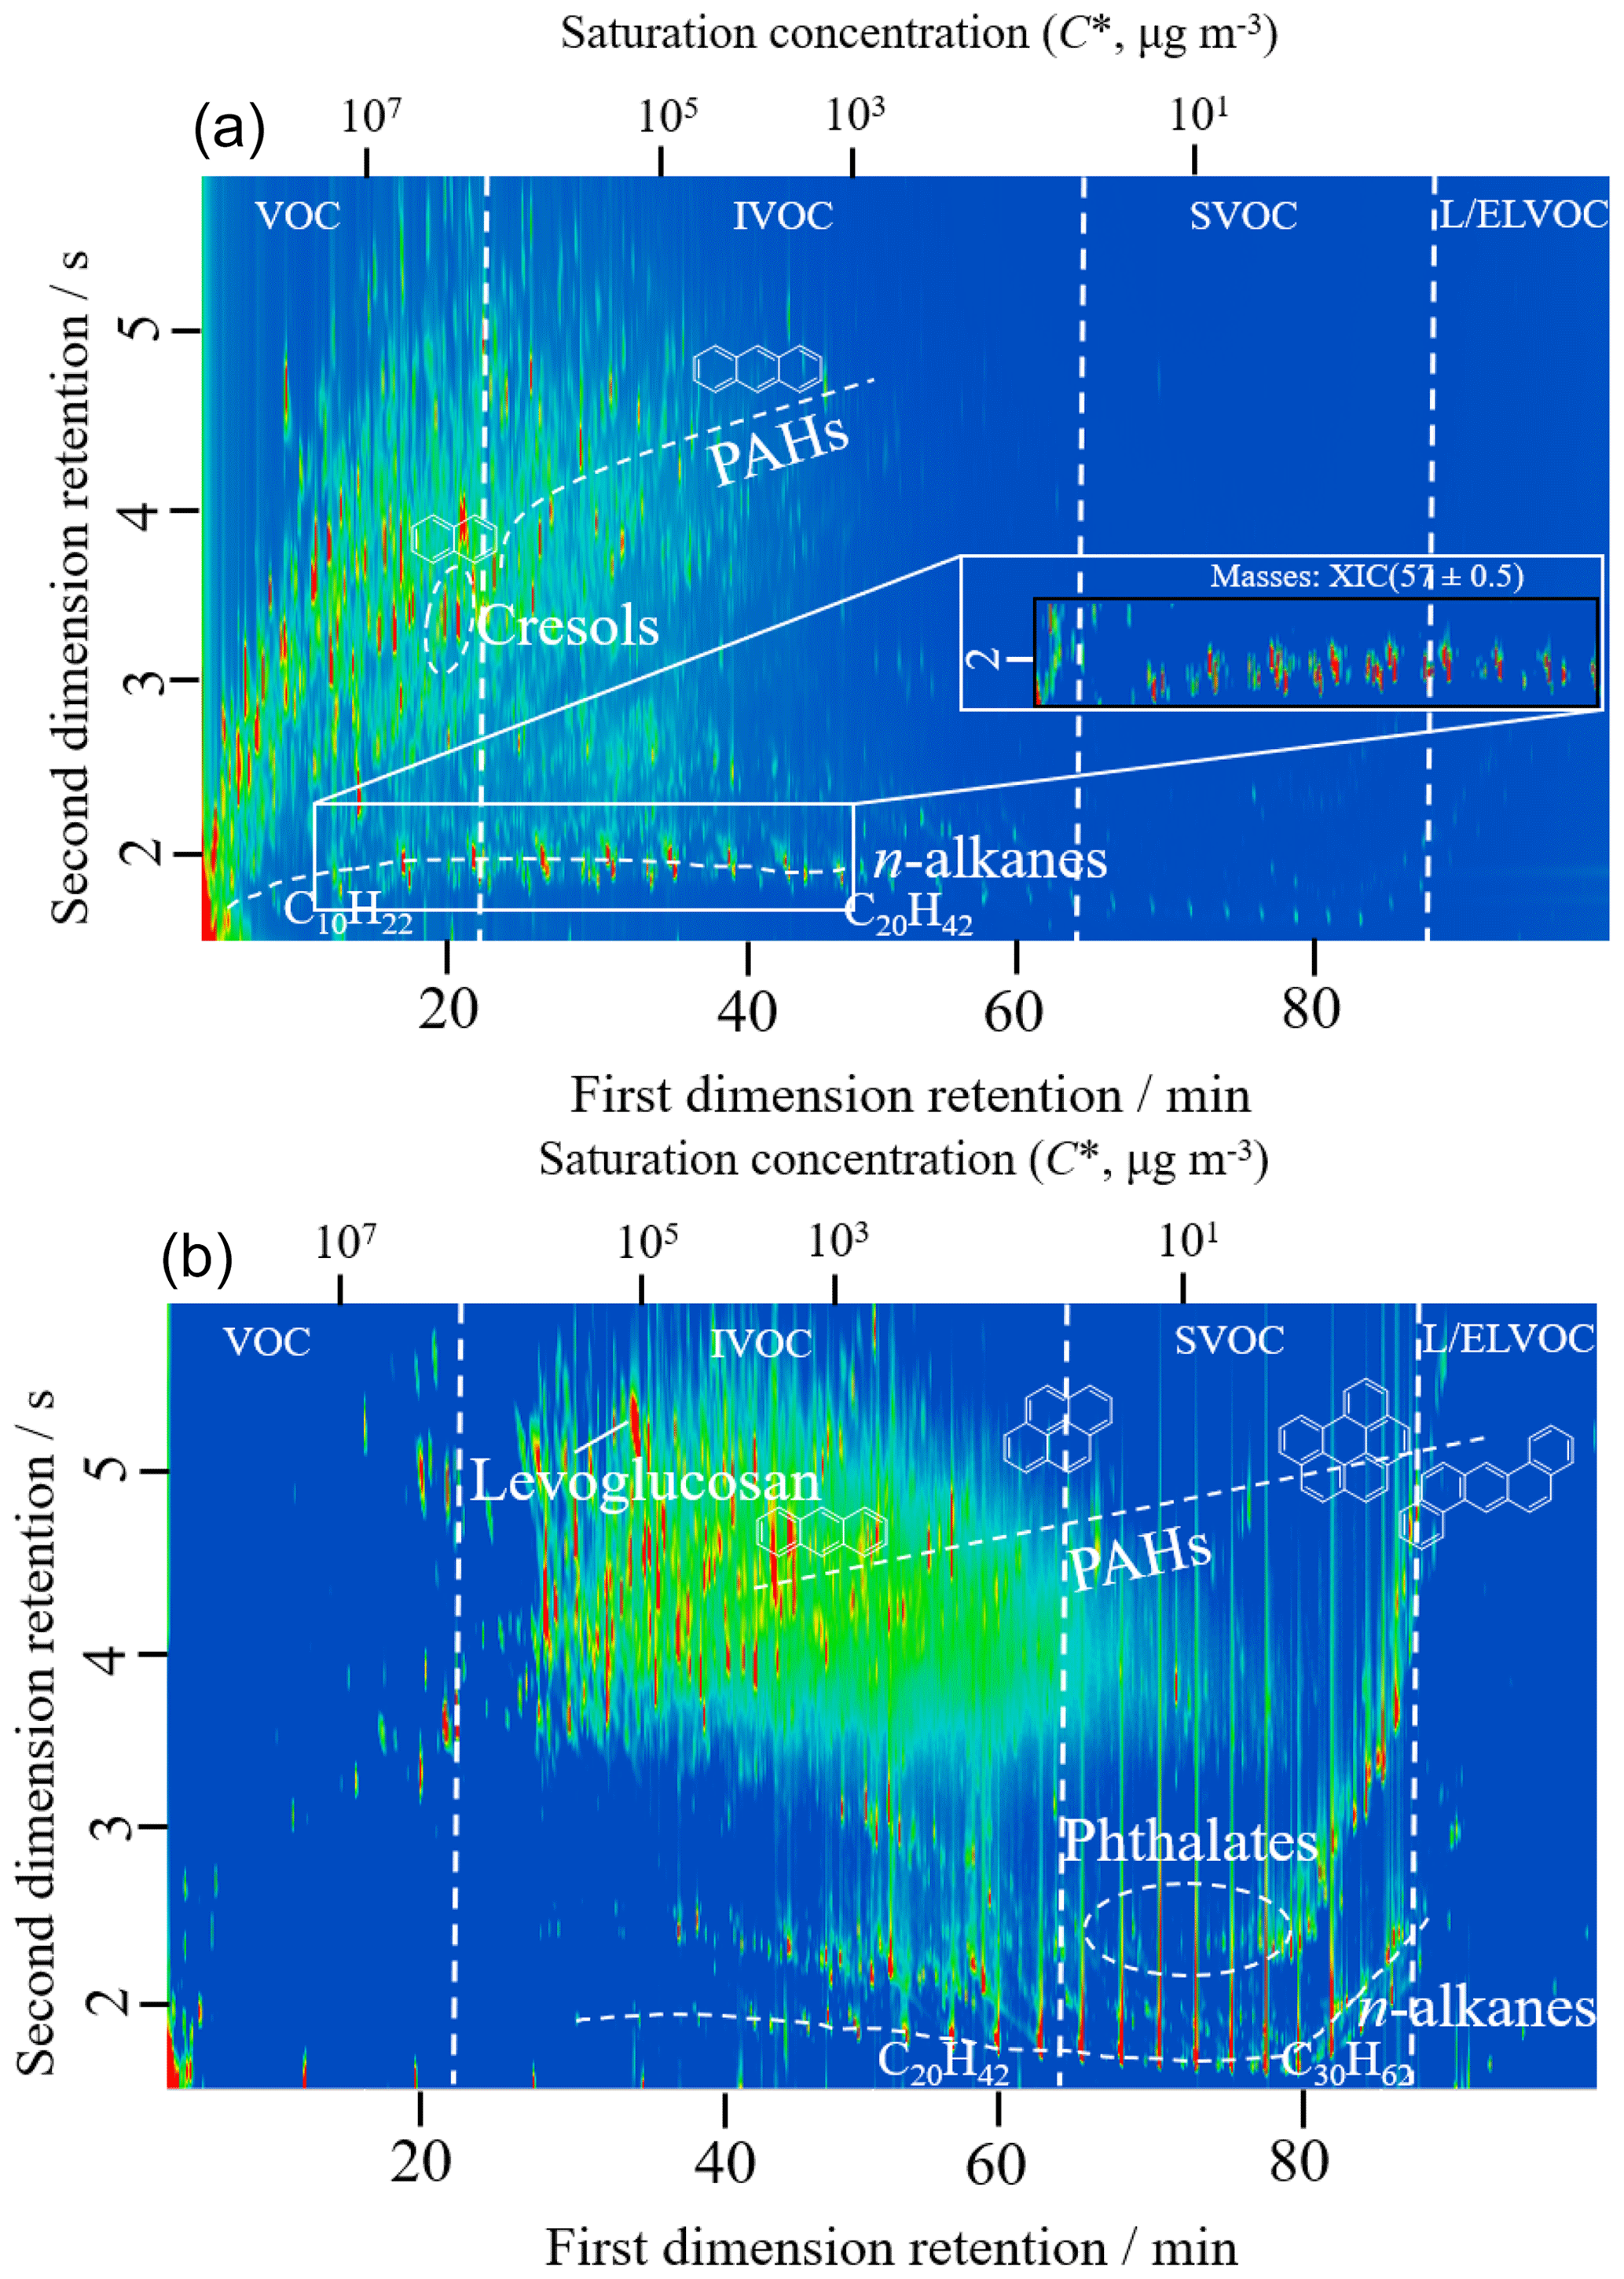
Figure 3Chromatogram of SPE (a) and PTFE (b) extracted samples from the entire burn of cow dung cake. n-Alkane and PAH series are marked on the chromatograms. The saturation concentration scale matches the n-alkane series. See Sect. S6 for a detailed compositional breakdown by functionality and phase.
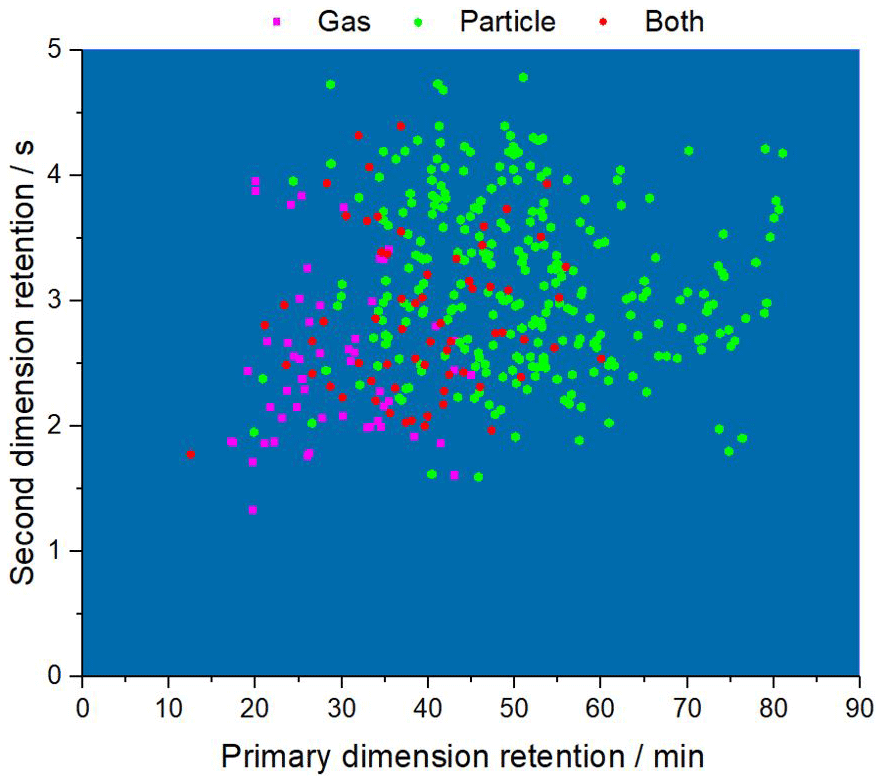
Figure 4 shows that the complexity of emissions was vast, with almost 400 PAHs forming a group towards the top centre to right part of the chromatogram. The most abundant calibrated PAH in the gas phase was naphthalene, followed by methyl and dimethyl naphthalene isomers. A range of methyl, dimethyl, tri- and tetramethyl naphthalenes as well as ethyl, propyl, butyl and methyl propyl isomers was detected. Naphthalene isomers substituted with aldehydes, carboxylic acids and nitriles were also released. Biphenyl and a range of methyl, dimethyl and ethyl biphenyls were also released. Other PAHs such as acenaphthylene, fluorene, azulene, quinoline, chamazulene, benzophenone, stilbene and benzofurans along with their alkyl substituted isomers were also in the gas phase. A large amount of highly substituted, larger PAHs with more than three aromatic rings in their structure were present in the aerosol phase.
Other peaks present on SPE discs and PTFE filters (SPE/PTFE) included alkenes (84/43), mostly towards the bottom of the chromatogram, along with a row of non-cyclic aliphatic (23/35) and cyclic aliphatic species (25/6) (see Sect. S6 for a figure containing all peaks). Above was a row of substituted aromatics (103/35), carboxylic acids (68/118) and sterols/stanols (1/63) as well as oxygenated hydrocarbons containing a range of ether, alcohol and aldehyde functionalities (229/234). Peaks were also present from oxygenated aromatics (106/145), phenolics (54/122), substituted benzoic acids (15/27), furanic species (72/42), monoterpenes (2/1) and sulfur-containing species (13/4).
Nitrogen-containing VOCs were present in the cow dung cake samples, with peaks on SPE discs and PTFE filters (SPE/PTFE) from pyridines and pyrazines (43/35), amines (47/28), amides (38/37), nitriles (42/31), six-membered heterocycles (13/14), five-membered heterocycles including aromatics such as pyrroles as well as pyrazolines and pyrrolidines (50/45), four-membered heterocycles (3/3), three-membered heterocycles (4/1), nitrogen-containing PAHs (14/24), imidazoles (9/12), imines (3/1), and azoles (23/10). The nitrogen-containing VOCs were likely formed from the volatilisation and decomposition of nitrogen-containing compounds within the cow dung cake, such as free amino acids, pyrroline, pyridine and chlorophyll (Leppalahti and Koljonen, 1995; Burling et al., 2010; Ren and Zhao, 2015). Nitrogen-containing VOCs are of concern because they can be extremely toxic (Ramírez et al., 2014; Farren et al., 2015) and amines in particular can change the hydrological cycle by leading to the creation of new particles (Smith et al., 2008; Kirkby et al., 2011; Yu and Luo, 2014), which act as cloud condensation nuclei (Kerminen et al., 2005; Laaksonen et al., 2005; Sotiropoulou et al., 2006).
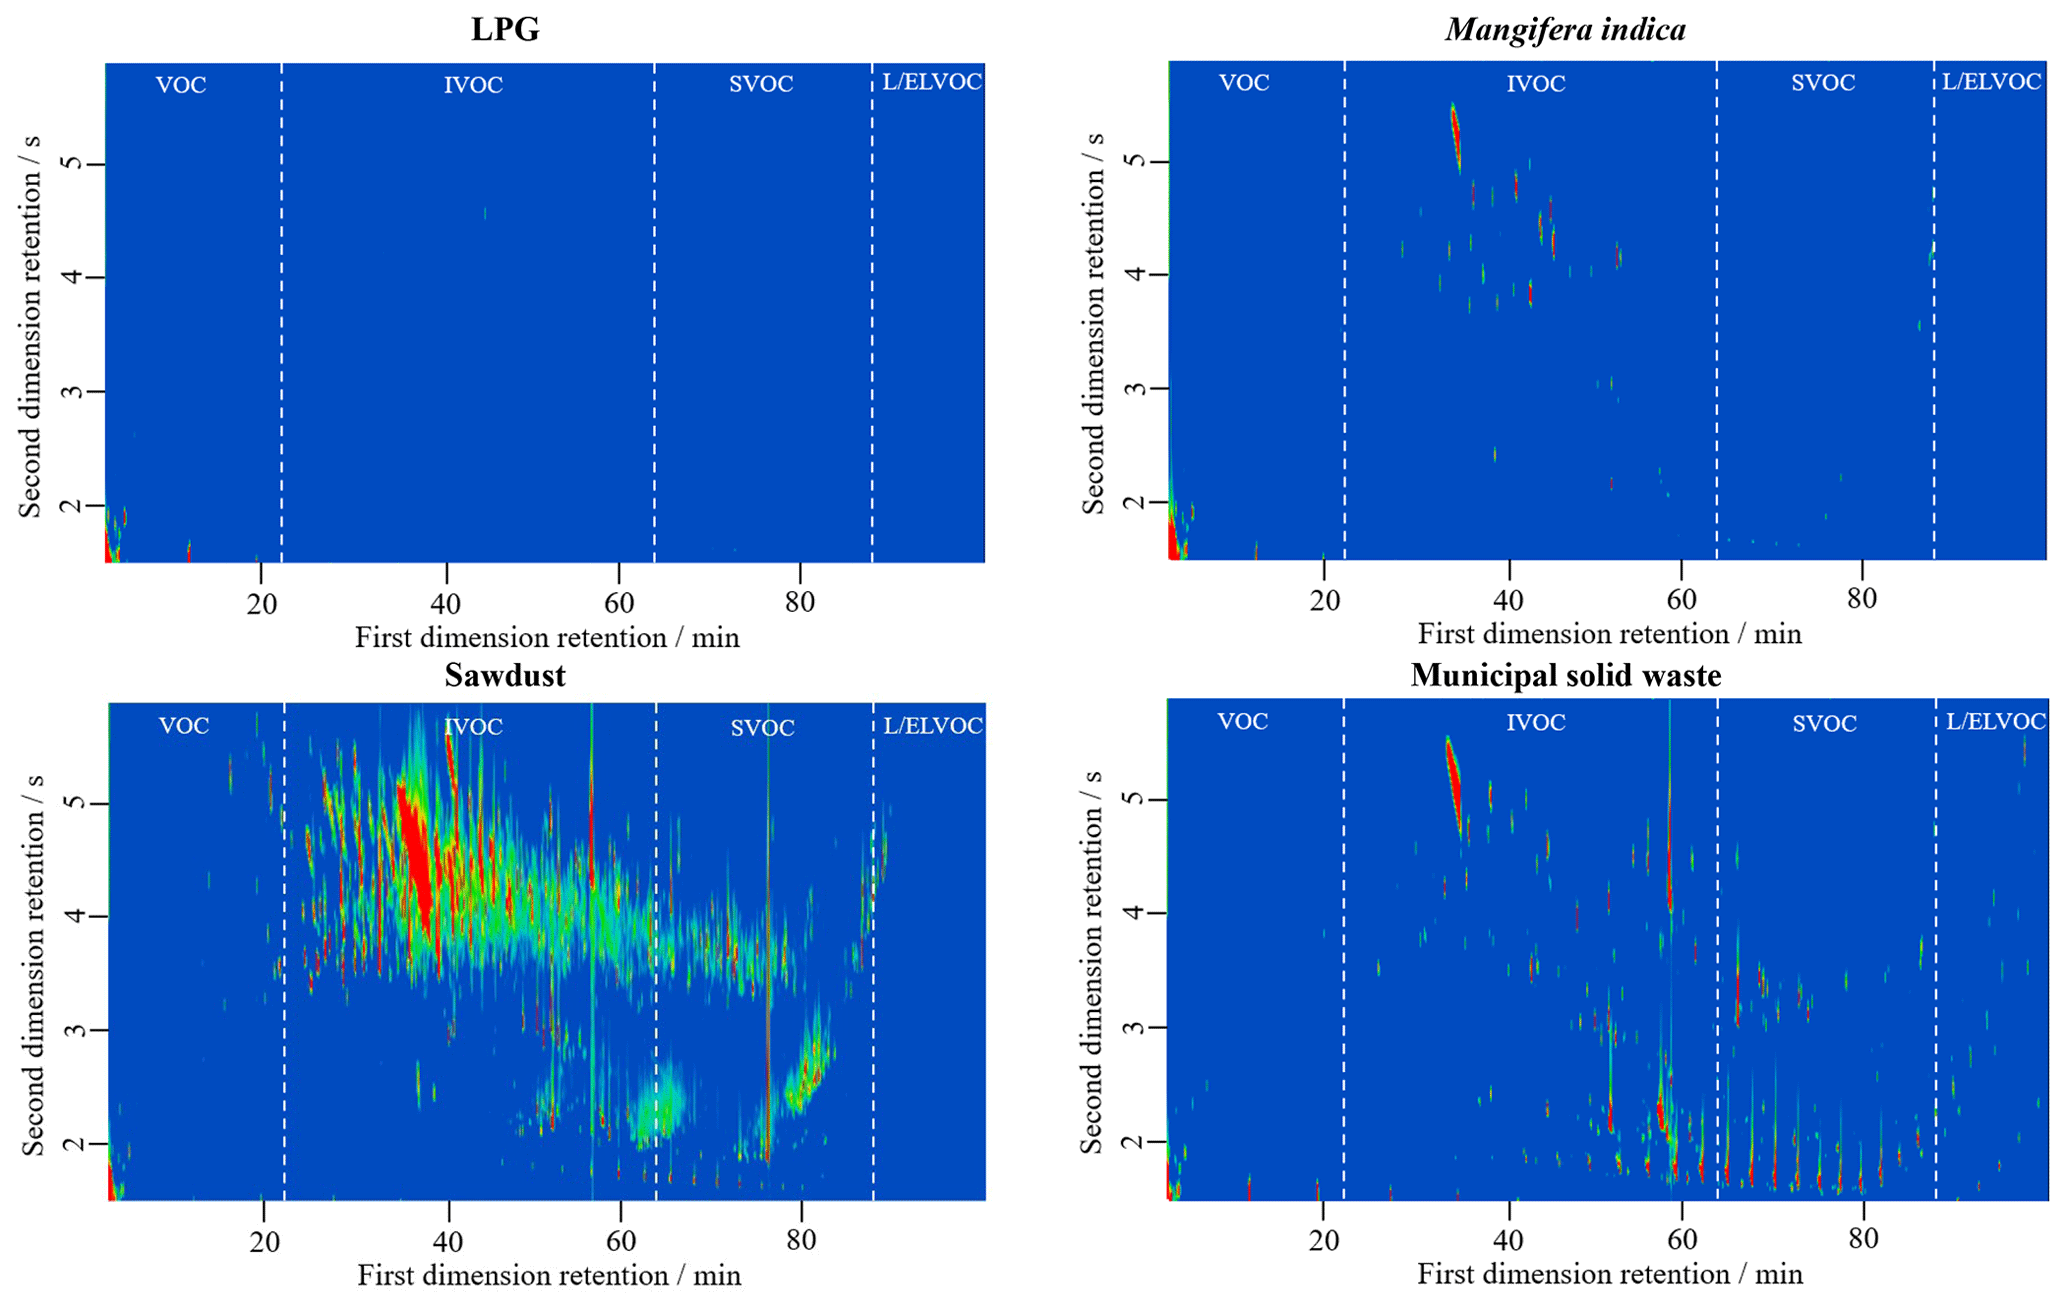
Figure 5Measurements of organic aerosol from a range of different fuel types, with the contrast at the same scale.
Figure 5 shows a comparison of organic aerosol composition observed from different fuel types (LPG, fuelwood, sawdust and municipal solid waste). The measured emissions had very different compositions, reflecting the variability of organic components produced from different fuel types (see Sects. S7 and S8 for species observed from different sample types on SPE discs and PTFE filters). Sawdust, municipal solid waste and cow dung cake (shown in Fig. 3) emitted a wide range and complexity of species. Particle-phase emissions from LPG burning were minimal, with most peaks from the internal standard or contaminants in the solvent. Fuelwood combustion released more organic components into the aerosol phase, with the majority being IVOCs with C∗ ∼ 1.2 × 10⁵–7 × 101 µg m−3 at 298 K. The largest peak belonged to levoglucosan, with other peaks from monoaromatics with several polar substituents such as ethers and phenolics, e.g. dimethoxyhydrotoluene and syringyl acetone. These were likely from the depolymerisation of lignin (Simoneit et al., 1993; Sekimoto et al., 2018), an amorphous polymer constituting about 25 % of fuelwood (Sjöström, 1993) and formed of randomly linked, high-molecular-weight phenolic compounds (Shafizadeh, 1982).
Sawdust, although not a widely used fuel source, released many I/S/L/ELVOC components in the aerosol phase over a much wider range (C∗ ∼ 5.8 × 10⁵–1 × 10⁻³ µg m−3 at 298 K). The largest peak was from levoglucosan, with another large peak from squalene. Many peaks were from polar substituted aromatics as well as many PAHs and their substituents, such as 2-methyl-9,10-anthracenedione. The largest peak from municipal solid waste burning was also levoglucosan, but this fuel type released fewer of the polar substituted monoaromatics than other fuels. Municipal solid waste released alkanes and SVOC species such as terphenyls, alkanes and many PAHs.
3.2 Molecular markers for domestic fuels
Cow dung cake combustion emitted a range of sterols/stanols, which have been reported previously. Sheesley et al. (2003) suggested that 5β-stigmastanol, coprostanol and cholestanol could be used as tracers for emissions from cow dung cake burning. This is because in higher animals, anaerobic microbial reduction of sitosterol and cholesterol forms the distinctive β configuration of the C-5 proton of 5β-stigmastanol and coprostanol. This contrasts with the α C-5 proton caused by aerobic digestion in aquatic environments. Jayarathne et al. (2018) reported 5β-stigmastanol emissions from hardwood, and Fine et al. (2001) reported 5α-stigmastanol emissions from hardwood. Four fuelwood combustion experiments in our study showed emissions of an isomer of stigmastanol, a result similar to Jayarathne et al. (2018) that 5β-stigmastanol was not unique to cow dung cake burning, or the MS measurement method used was unable to distinguish between 5α- and 5β-stigmastanol. Cholestanol and coprostanol were found uniquely during cow dung cake combustion in our study, and this suggested that they can be used as unique tracers for cow dung cake burning.
Fuelwood combustion generally released fewer organic components into the aerosol phase than fuels such as cow dung cake, municipal solid waste (MSW) and sawdust. Levoglucosan has been traditionally suggested as a tracer for biomass burning emissions; however, emissions of levoglucosan from a range of sources mean that this is of limited use as a unique tracer of woodsmoke emissions in regions with multiple burning sources. This could potentially be resolved in future studies by examining the ratio of levoglucosan to other sugars in different source types. This may differentiate different biomass burning sources as the chemical composition of different sources should determine the emission ratio of levoglucosan to other sugar pyrolysis products (Sheesley et al., 2003).
The presence of a wide range of terphenyls from municipal solid waste combustion in this study was not unique. Jayarathne et al. (2018) suggested that triphenyl benzene was a unique tracer of waste burning emissions. Whilst this study found triphenyl benzene present in one cow dung cake sample and in municipal solid waste samples, the waste combustion emitted on average 19 terphenyls, many more than from cow dung cake combustion (2). Terphenyls have been previously reported from incineration of waste (Tong et al., 1984), and our study suggests that these compounds are good indicators of municipal solid waste burning.
3.3 Total identification
Figure 6a and b show a comparison of the relative abundance of peaks identified, defined here as the sum of peak areas identified and calibrated using genuine standards for compounds present in the SPE and PTFE samples compared to the total observed peak area (using the blank subtracted total ion current, TIC).
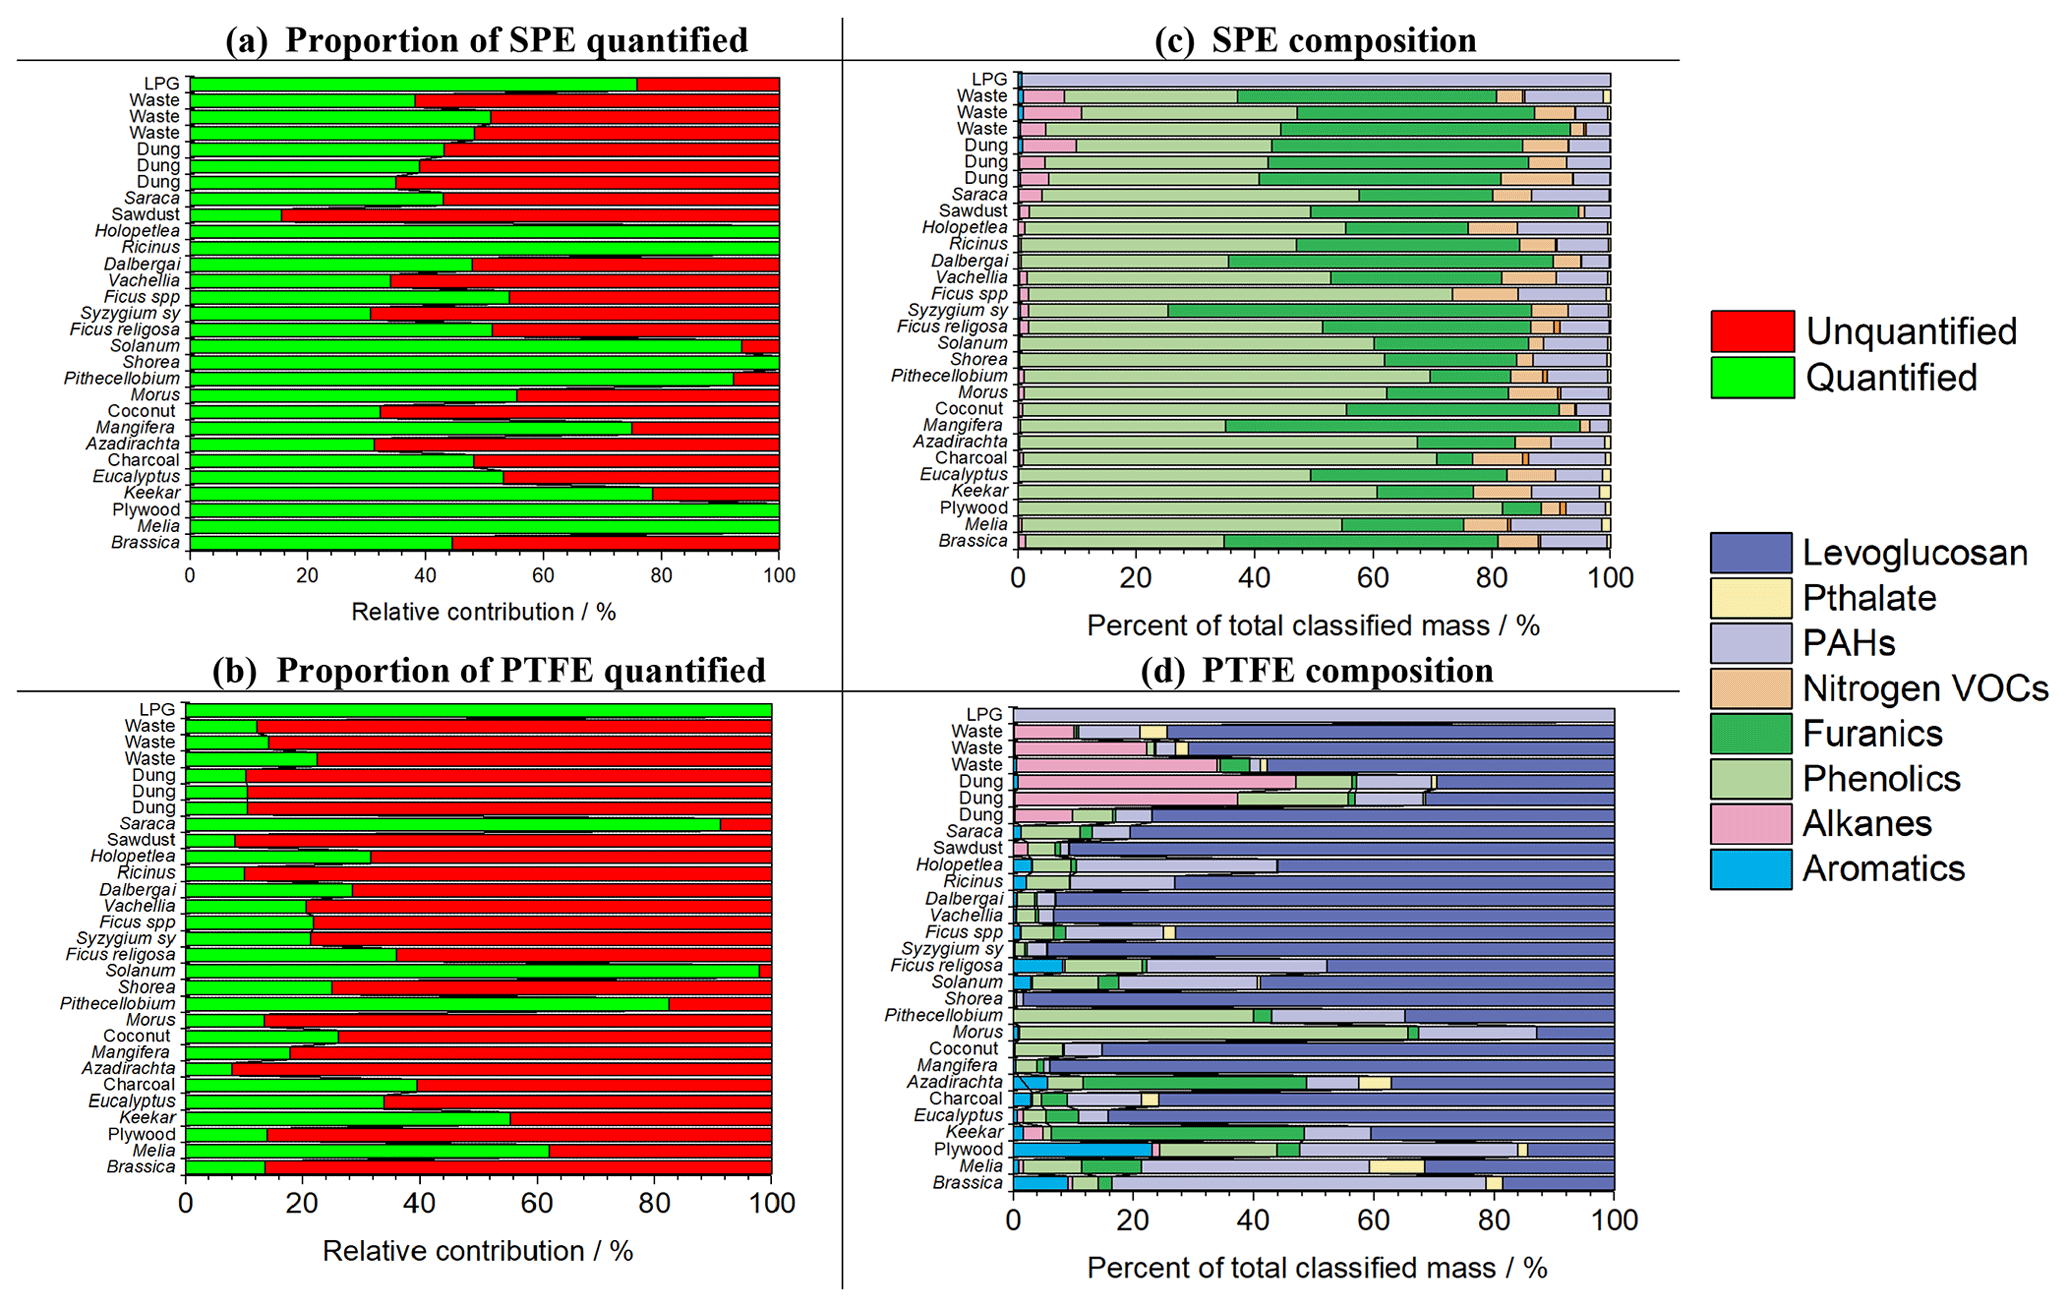
Figure 6Area of organic matter quantified with genuine standards, as a fraction of total ion current (TIC) (a, b). Semi-quantitative/quantitative analysis of SPE/PTFE fraction (c, d).
Figure 6a shows that between 15 % and 100 % of the peak area of the TIC in the SPE chromatogram could be identified. The highest proportion of species that could be identified was from fuelwood (67 %), followed by crop residue (57 %), charcoal (48 %), municipal solid waste (46 %), cow dung cake (39 %) and sawdust (16 %). Lower total identification in samples such as cow dung cake was due to increased complexity of emissions, which were not covered by the standards used.
Figure 6b shows that between 7 %–100 % of the organic composition of aerosol released from burning was identified and could be quantified with genuine standards. Generally, a much lower proportion of organic matter within aerosol samples was identified due to a lack of genuine standards available, particularly in complex samples. The lowest mean relative contribution identified from samples was sawdust (9 %), followed by cow dung cake (11 %) and municipal solid waste (16 %). A larger relative contribution was identified from fuelwood (34 %) and charcoal (39 %) due to less complex emissions. A large relative contribution of some fuelwood was identified from Saraca indica (91 %) and Pithecellobium spp. (82 %) due to a low amount of organic matter released from these samples. This also influenced the percentage identification from crop residue which achieved 46 % identification, due to only three samples with 98 % identification from Solanum melongena but only 26 % from Cocos nucifera and 13 % from Brassica spp.. One-hundred percent of the aerosol released from LPG was quantified due to little being released into the aerosol phase, and this was principally composed of PAHs.
These low levels of identification of organic aerosol were in line with those reported by Jen et al. (2019), where unknown chemical species represented 35 %–90 % of the observed organic aerosol mass from biomass burning samples. The percentage identification in this study should not be influenced by the filter sampling media and was low in complex samples due to a lack of genuine standards to allow for quantitative detector-response curves for individual analytes.
3.4 Composition
Figure 6c provides an indication of I/SVOC composition on SPE discs by mass of quantified species, assuming no compound breakthrough. Phenolic and furanic compounds were the most abundant I/SVOC species released from all fuel types, except for LPG. As a proportion of the total mass of species quantified with genuine standards on SPE discs, phenolics released from fuelwood (22 %–80 %) represented the largest range, with large amounts released from municipal solid waste (24 %–37 %), cow dung cake (32 %–36 %), crop residue (32 %–57 %) and sawdust (46 %). High emissions of phenolic compounds were of significance, because phenolics contribute significantly to SOA production from biomass burning emissions (Yee et al., 2013; Lauraguais et al., 2014; Gilman et al., 2015; Finewax et al., 2018). A recent study found that oxygenated aromatic compounds, which included phenols and methoxyphenols, were responsible for just under 60 % of the SOA formed from western US fuels (Akherati et al., 2020).
Large emissions of furanic species were measured from fuelwood (6 %–59 %), municipal solid waste (35 %–45 %), cow dung cake (39 %–42 %), crop residue (25 %–44 %) and sawdust (43 %). These were important as furans can be toxic and mutagenic (Ravindranath et al., 1984; Peterson, 2006; Monien et al., 2011; WHO, 2016) and have been shown to be species with some of the highest OH reactivity from biomass burning emissions (Hartikainen et al., 2018; Coggon et al., 2019). Furans have also been shown to result in SOA production (Gómez Alvarez et al., 2009; Strollo and Ziemann, 2013) with 8 %–15 % of the SOA produced from combustion of black spruce, cut grass, Indonesian peat and ponderosa pine estimated to originate from furans and 28 %–50 % of the SOA from rice straw and wire grass (Hatch et al., 2015). Akherati et al. (2020) found that heterocyclic compounds, which included furans, were responsible for approximately 20 % of the SOA from biomass burning emissions from fuels from the western US. SOA formation from furanic species remains poorly understood, with a recent study showing an SOA yield of 1.6 %–2.4 % during the oxidation of 3-methylfuran with the nitrate radical (Joo et al., 2019). Furans from biomass burning emissions are thought to come from low-temperature depolymerisation of hemi-cellulose (Sekimoto et al., 2018) and from large alcohols and enols in high-temperature regions of hydrocarbon flames (Johansson et al., 2016).
Emissions of alkanes were most important from combustion of cow dung cake and municipal solid waste (4 %–9 %), with only small quantities released from combustion of various fuelwood types (< 2 %) and crop residues (< 1 %). This reinforced previous studies which found emissions of C12–C39 n-alkanes from municipal waste incinerators (Karasek and Tong, 1985). PAH emissions represented (3 %–15 %) of the total quantified emission by mass for fuel types other than LPG and have carcinogenic and mutagenic properties (IARC, 1983, 1984; Nisbet and LaGoy, 1992; Lewtas, 2007; Zhang and Tao, 2009; Jia et al., 2011). They can damage cells through the formation of adducts with DNA in many organs such as the kidneys, liver and lungs (Vineis and Husgafvel-Pursiainen, 2005; Xue and Warshawsky, 2005).
Figure 6d shows that the quantified aerosol mass was largely dominated by levoglucosan, with a particularly significant contribution in the fuelwood samples (13 %–98 %). This was similar to a previous study of fuelwood samples from Bangladesh, where levoglucosan was the largest contributor to aerosol mass (Sheesley et al., 2003). Levoglucosan emissions were also large from cow dung cake (30 %–58 %), which contrasted with the findings of Sheesley et al. (2003). This could be due to differences in the feeding of cows, leading to differences in residual undigested organic matter in cow dung cake fuel as well as differences in preparation between samples collected in Bangladesh and those in this study, which had additional dried biogenic material, such as straw, mixed into samples. Levoglucosan emissions were also high from sawdust (91 %), crop residue (19 %–85 %) and municipal solid waste (58 %–75 %), with municipal solid waste emissions likely from cellulosic material collected with the fuel.
Levoglucosan emissions from charcoal (76 %) were significant as a proportion of emissions. Emissions from charcoal were low, which meant that a small emission of levoglucosan represented a large proportion of total emissions. It was likely that the fuel collected here may have contained cellulosic organic matter that led to the emission of levoglucosan.
Emissions of alkanes in the gas and particle phases were similar by source type, with particulate alkanes emitted principally during combustion of cow dung cake and municipal solid waste fuels. Emissions of particulate phenolics were large as a proportion of total quantified mass with genuine standards when the total emission of other components was low. For example, phenolics represented a large proportion of emissions from the fuelwood species Morus spp. and Pithecellobium spp. with the mass principally from dimethoxyphenols. Emissions from LPG were mainly PAHs and very low.
Whilst SPE samples for these compounds remained semi-quantitative, due to breakthrough, the detection of high emissions of phenolics and furanics in the gas phase from burning was in line with recently published studies (Hatch et al., 2015; Stockwell et al., 2015; Koss et al., 2018). Relatively low levels of total quantified material within the aerosol phase was in line with current literature (Jen et al., 2019), but meant that this analysis was not entirely reflective of the organic fraction for complex samples. It was likely that this study overemphasised the contribution of levoglucosan in complex aerosol samples relative to other components present at lower levels (Sheesley et al., 2003; Jen et al., 2019). Future instrument development could allow for better quantification of complex burning and ambient samples by splitting the eluent between an MS and an FID. This study suggests that future research should use lower sample volumes and thicker SPE discs and investigate the adsorption characteristics of VOCs onto SPE discs.
3.5 Development of emission factors
Emission factors have been developed for PAHs (see Fig. 7 and Sect. S9 for table of emission factors by individual fuel type) by calculating the total volume of air convectively drawn up the flue and relating this to the mass of fuel burnt (see Sect. S10 for details of calculation). Emission factors for sawdust (1240 mg kg−1), municipal solid waste (1020 mg kg−1), crop residue (747 mg kg−1) and cow dung cake (615 mg kg−1) were generally larger than for fuelwood (247 mg kg−1), charcoal (151 mg kg−1) and LPG (56 mg kg−1). The measurement of higher emission factors for cow dung cake than fuelwood was consistent with that observed in other studies (Bhargava et al., 2004; Gadi et al., 2012). Quantitative emission factors of other VOC classes are given in Stewart et al. (2021c). Analysis of the volatility distribution of total measured organic emissions, OH reactivity and SOA production potential of the fuels studied here is provided elsewhere (Stewart et al., 2021b).

A wide range of emission factors were measured from combustion of fuelwood from 50 mg kg−1 for Prosopis spp. to 907 mg kg−1 for Ficus religiosa. Figure 8 shows that there was large sample-to-sample variability in emission factors for different fuelwood samples, for which only one sample was taken. For this reason, emission factors have been generalised for use in budget estimates to the type of fuel. Mean emission factors are provided for measurements from samples of 17 fuelwood types, 3 crop residues, 3 cow dung cakes and 3 different collections of municipal solid waste. Despite this, for LPG and charcoal samples only one sample was measured, and this significantly increased the uncertainty in the PAH emission factors from these fuel sources.
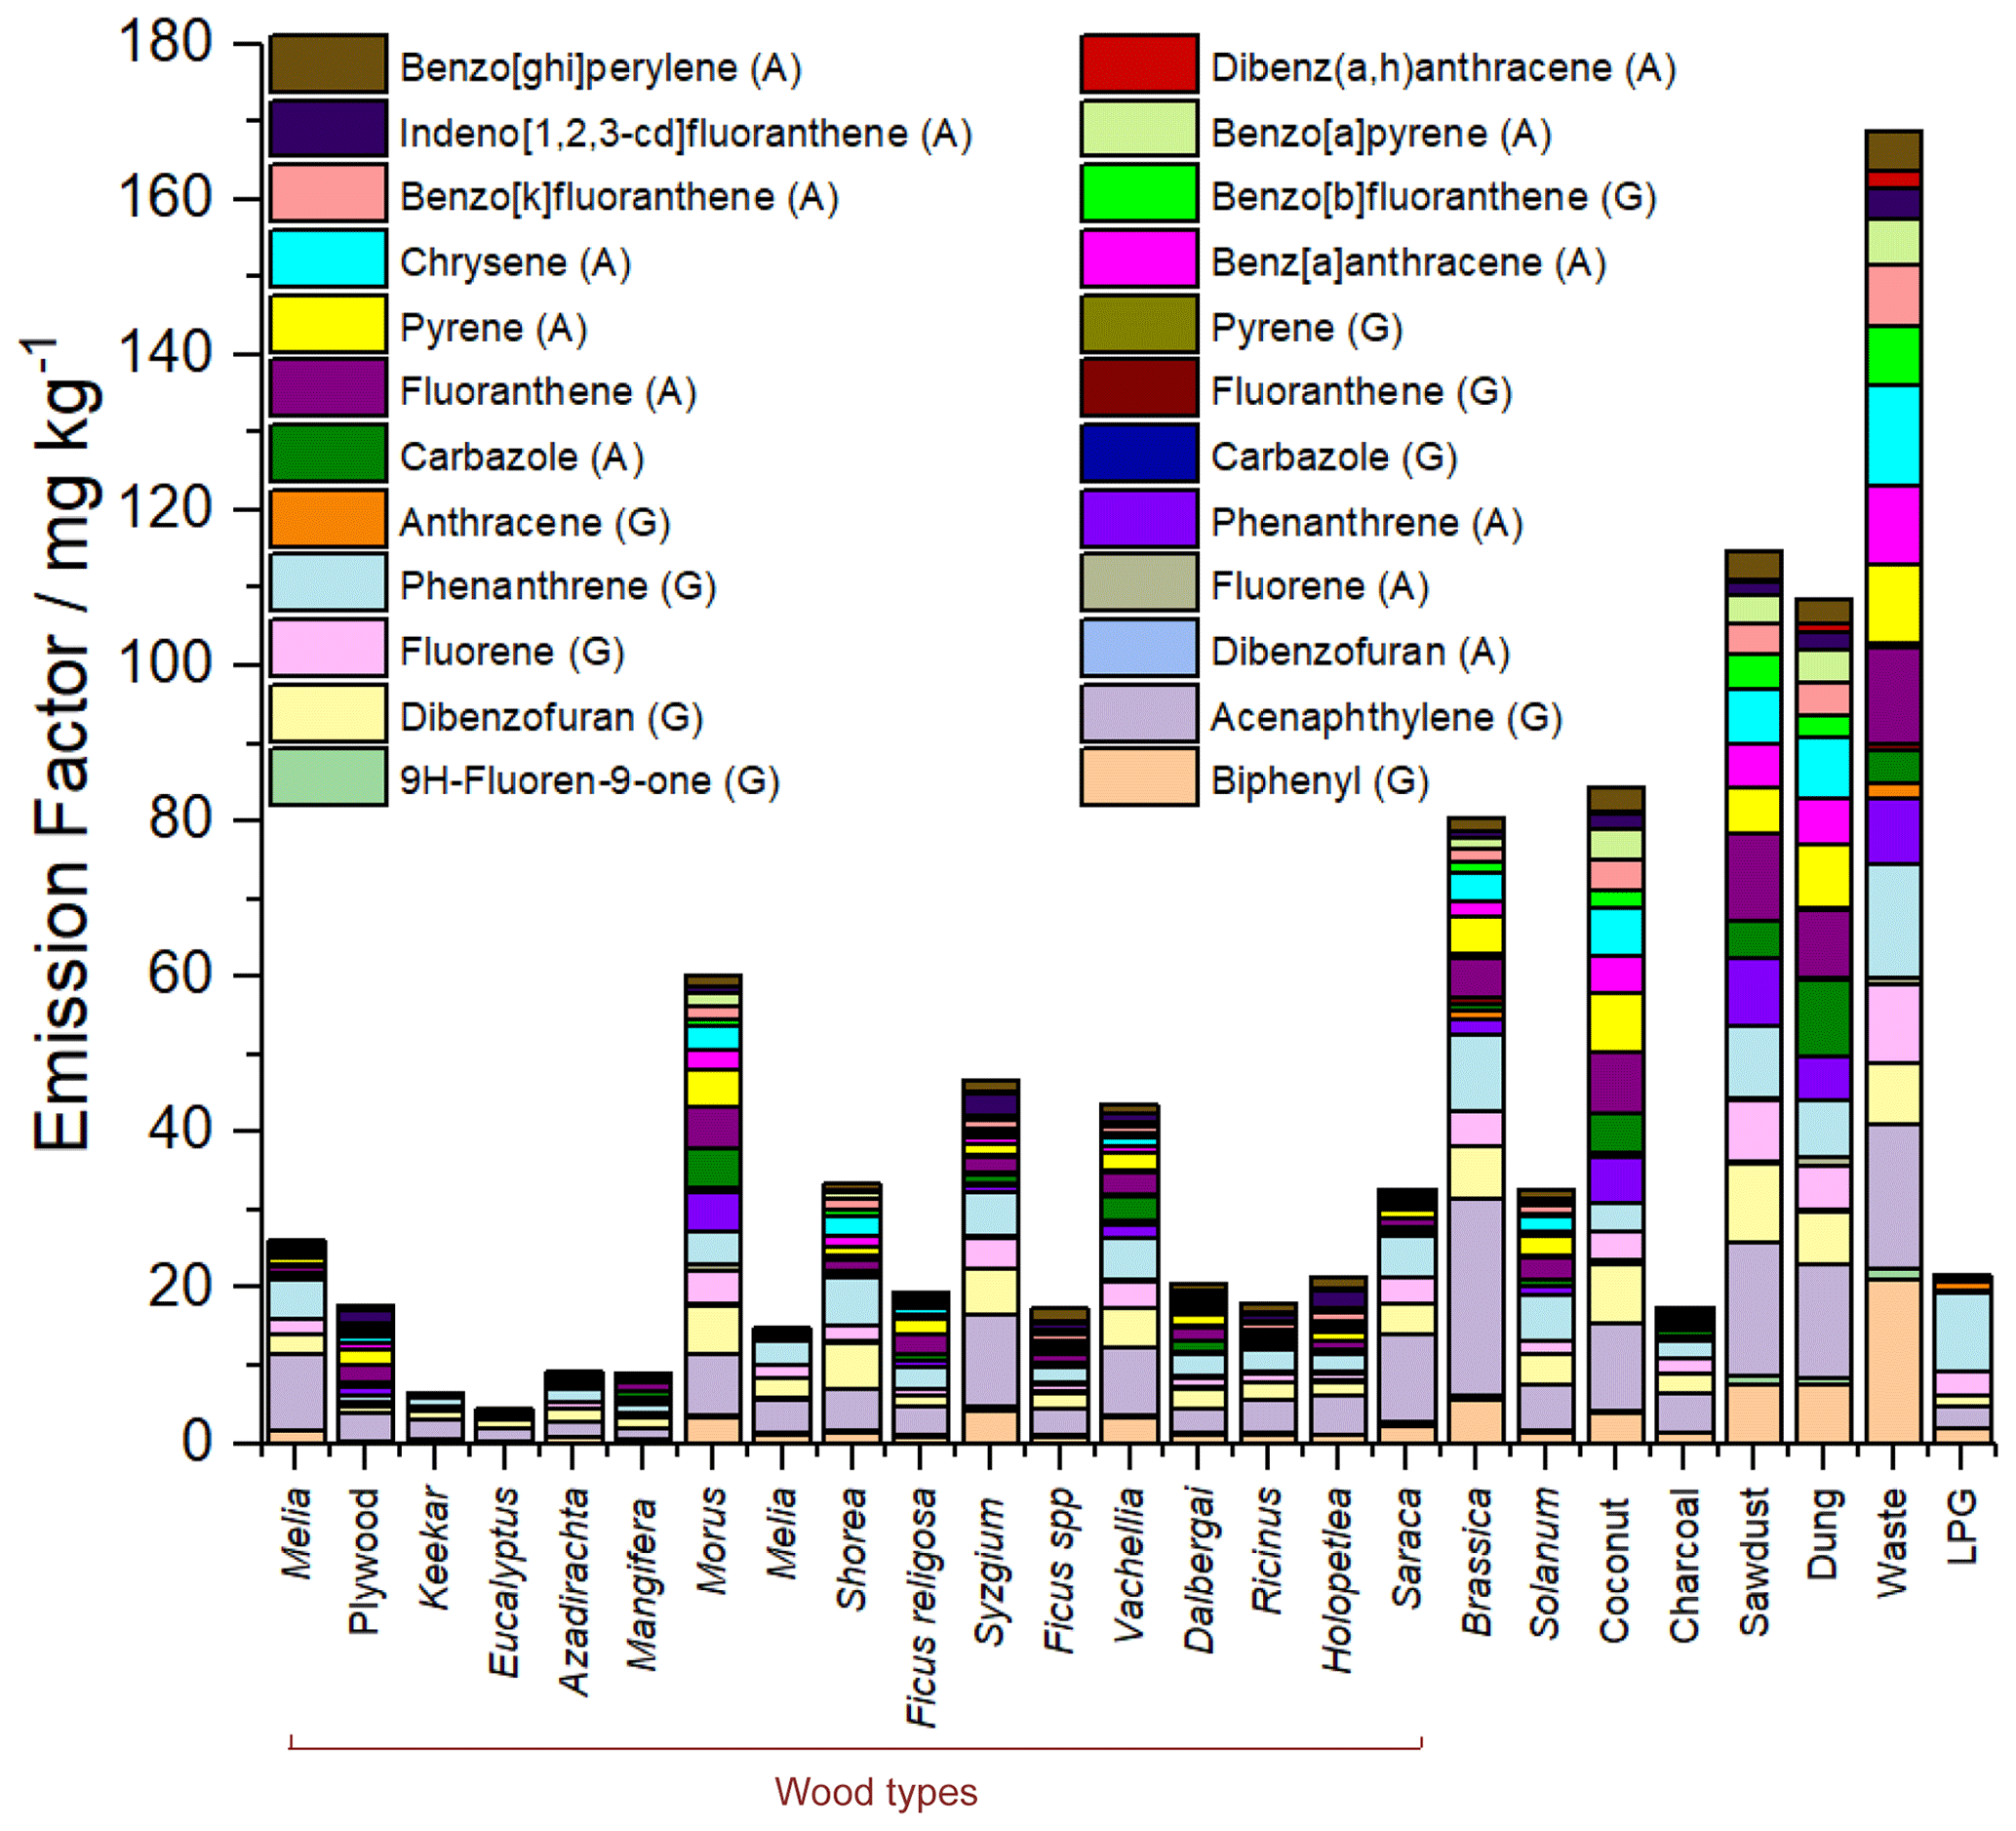
Figure 8Emission factors of PAHs measured from SPE/PTFE where “(G)” and “(A)” represent gas- and aerosol-phase samples, respectively, excluding naphthalene as well as naphthalenes with C1 and C2 substituents.
For most fuel types, PAH emissions in the gas phase were dominated by naphthalene, methylnaphthalenes and dimethylnaphthalenes, with gas-phase PAHs observed up to pyrene. For fuelwood, crop residue, municipal solid waste and cow dung cake, the percentages of PAHs in the gas phase decreased from 97 %, 96 %, 91 % to 89 %. PAHs from LPG showed the largest fraction in the gas phase (99.9 %) compared to the aerosol phase (0.1 %). Figure 8 shows gas- and particle-phase PAH emissions by individual fuel type, excluding naphthalene as well as C1- and C2-substituted naphthalenes. PAHs were present in the aerosol phase from dibenzofuran (C12H8O) to benzo[ghi]perylene (C22H12).
Table 2PAH emission factors measured in our study compared to values from literature for similar fuel types.

Table 2 shows a comparison of the mean emission factors measured in our study with previous studies. The mean fuelwood total PAH emission factor measured in our study (247 mg kg−1) was a factor of 4.7–5.6 larger than those measured by Gadi et al. (2012) and Singh et al. (2013) of 44 and 53 mg kg−1, respectively, for similar fuelwood types collected across Delhi and the Indo-Gangetic Plain. The PAH emission factor measured for cow dung cake (615 mg kg−1) was around a factor of 10 larger than those previously measured (60 mg kg−1). The larger total emission factors for fuelwood and cow dung cake was a result of high emissions of gas-phase PAHs measured using PTR-ToF-MS (51–896 mg kg−1 for fuelwood and 446–660 mg kg−1 for cow dung cake) compared with previous measurements made using polyurethane foam (PUF) plugs (7 mg kg−1). This indicated that either the PTR-ToF-MS was able to better detect and characterise gas-phase emissions than previous methods and suggested either breakthrough or off gassing of smaller gas-phase PAHs from PUF plugs or measurement of significant quantities of other C10H8 isomers on the PTR-ToF-MS. This may highlight an underestimation of two-ring gas-phase PAH emissions in previous burning studies. Gadi et al. (2012) measured PAH emissions in the particle phase, with the mean emission for fuelwood (44 mg kg−1) greater than our study (9 mg kg−1). Particulate-phase emissions of PAHs measured by Singh et al. (2013) from fuelwood (45 mg kg−1) were also larger than our study. By contrast, particle-phase PAH emissions from cow dung cake in our study (66 mg kg−1) were comparable to those measured previously (57–60 mg kg−1) (Gadi et al., 2012; Singh et al., 2013). Variability in emission of particulate-phase PAHs in our study compared to literature was likely to be highly influenced by the efficiency of combustion of different fuel types. This may also be explained by measuring only once for many of the fuel types, due to significant burn-to-burn differences in emissions. Although not measured in our study, differences in moisture content between fuel types in our study and literature were likely a large influence on the total amount of PAHs emitted, and this may explain the differences in particle-phase emissions.
This study was conducted under controlled laboratory conditions. For some sample types, such as municipal solid waste, the laboratory measurement may not be entirely reflective of real-world conditions. Municipal solid waste combustion may occur under both flaming and smouldering conditions at landfill sites and in backyards, as well as in high-temperature incinerators in more developed countries. All of these are likely to have quite different combustion chemistry and consequently lead to varying levels of emission.
The particulate-phase PAH emission factors from municipal solid waste combustion in our study (14–181 mg kg−1) were much smaller than those of previous studies (1910–8486 mg kg−1), but the number of samples was limited. Emissions from coconut shell have not been well studied, making comparisons difficult (Gulyurtlu et al., 2003). The emission of particulate-phase PAHs from sawdust in our study (62 mg kg−1) was less than that previously reported (259 mg kg−1), but our study found large gas-phase PAH emissions (1175 mg kg−1). Particulate PAH emissions from the crop residues burnt in our study (13–53 mg kg−1) fell within the range reported by Kim Oanh et al. (2015) of 0.34–34 mg kg−1 for rice straw. Those reported by Wiriya et al. (2016) were smaller (0.47 mg kg−1) but were from fuel dried in an oven at 80 ∘C for 24 h and ignited by an LPG burner, and they were likely to represent more complete combustion conditions. Emissions of PAHs from charcoal in our study (151 mg kg−1) were larger than those measured for South Asian fuels (25 mg kg−1), which was principally caused by a greater measurement of gas-phase species by PTR-ToF-MS. Both our study and that of Kim Oanh et al. (1999) showed charcoal released the least amount of PAH per kilogram burnt for biofuels. LPG combustion released less particulate PAHs (0.1 mg kg−1) than previous studies (0.8 mg kg−1) but also included a small gas-phase emission (56 mg kg−1). Differences in the distribution of PAHs found in the gas and aerosol phases between our study and literature were also likely to be influenced by the different sample dilutions and gas-to-aerosol partitioning prior to measurement.
This paper demonstrated an extraction technique for analysis of I/SVOCs collected onto SPE discs and PTFE filters from combustion of biofuels, which was well suited to the analysis of non-polar species. A range of fuels relevant to burning in India were combusted with organic components collected and analysed, which showed large differences in the composition of organic matter released. The separation power of GC × GC was used to identify an extensive range of I/SVOCs in both gas and particle phases, with 15 %–100 % of gas-phase emissions and 7 %–100 % of particle-phase emissions characterised.
The ability to quantify species on SPE discs was assessed and scope for future studies which should assess the adsorption characteristics of IVOCs onto SPE discs was provided. It is recommended that breakthrough of IVOCs collected onto SPE discs at lower sample volumes should be evaluated, and better methods for quantification of complex samples should be developed. Further characterisation of fuel types from a wider range of sources would enable a better understanding of the drivers of poor air quality in the developing world. This study found that cholestanol and coprostanol were unique to cow dung cake burning samples, and these species were therefore suggested as tracers for emissions from cow dung cake burning. Similarly, municipal solid waste burning released many terphenyls, which could act as good indicators of this source. This study found that phenolic and furanic species were the most important gas-phase emissions by mass of I/SVOCs from domestic solid-fuel combustion samples collected from the Delhi area of India. New emission factors were developed for US EPA criteria PAHs present in gas and aerosol phases from a large range of fuel types. This suggested that many sources important for air quality in the developing world are larger sources of PAHs than conventional fuelwood burning.
Peaks measured in this study with NIST library hits > 700 are given in Sects. S7 and S8 in the Supplement. Quantitative VOC emission factors measured using PTR-ToF-MS and gas chromatography from the fuel types studied are given in Stewart et al. (2021c).
An illustrative example of the importance of this study is provided in the video supplement at https://doi.org/10.5446/50203 (Stewart, 2020).
The supplement related to this article is available online at: https://doi.org/10.5194/acp-21-2407-2021-supplement.
GJS developed the ASE and GC methods, collected samples, organised logistics, extracted and analysed samples, and led the paper. BSN collected samples and assisted with logistics. WJFA measured VOCs by PTR-ToF-MS, supported by CNH, LKS and NT. ARV assisted with running and organising of experiments. NJF, JRH and MWW assisted with the GC × GC–ToF-MS method development. SJS assisted with the ASE method development. RA, AM, RJ, SA and LY collected fuels, carried out the burning experiments and measured gas volumes up the flue. SSMY aided complex sample analysis. EN, NM, RG, SKS, ARR and JDL contributed to logistics and data interpretation. TKM and JFH provided overall guidance with setup, conducting, running and interpreting experiments. All authors contributed to the discussion, writing and editing of the article.
The authors declare that they have no conflict of interest.
The paper does not discuss policy issues, and the conclusions drawn in the paper are based on interpretation of results by the authors and in no way reflect the viewpoint of the funding agencies.
This work was supported by the Newton-Bhabha fund administered by the UK Natural Environment Research Council, through the DelhiFlux project of the Atmospheric Pollution and Human Health in an Indian Megacity (APHH-India) programme. The authors gratefully acknowledge the financial support provided by the UK Natural Environment Research Council and the Earth System Science Organization, Ministry of Earth Sciences, Government of India, under the Indo-UK Joint Collaboration (grant nos. NE/P016502/1 and MoES/16/19/2017/APHH) (DelhiFlux). Gareth J. Stewart and Beth S. Nelson acknowledge the NERC SPHERES doctoral training programme for studentships. Rahul Arya, Arnab Mondal, Ritu Jangirh, Sakshi Ahlawat, Lokesh Yadav, Sudhir K. Sharma and Tuhin K. Mandal are thankful to the Director's Office, CSIR-National Physical Laboratory, New Delhi, for allowing them to carry out this work. Lokesh K. Sahu acknowledges the Physical Research Laboratory (PRL), Ahmedabad, India, for the support and permission to deploy PTR-ToF-MS during the experimental campaign.
This research has been supported by the Natural Environment Research Council (grant no. NE/P016502/1) and the Ministry of Earth Sciences (grant no. MoES/16/19/2017/APHH, DelhiFlux).
This paper was edited by Drew Gentner and reviewed by two anonymous referees.
Ahern, A. T., Robinson, E. S., Tkacik, D. S., Saleh, R., Hatch, L. E., Barsanti, K. C., Stockwell, C. E., Yokelson, R. J., Presto, A. A., Robinson, A. L., Sullivan, R. C., and Donahue, N. M.: Production of Secondary Organic Aerosol During Aging of Biomass Burning Smoke From Fresh Fuels and Its Relationship to VOC Precursors, J. Geophys. Res.-Atmos., 124, 3583–3606, https://doi.org/10.1029/2018jd029068, 2019.
Akagi, S. K., Yokelson, R. J., Wiedinmyer, C., Alvarado, M. J., Reid, J. S., Karl, T., Crounse, J. D., and Wennberg, P. O.: Emission factors for open and domestic biomass burning for use in atmospheric models, Atmos. Chem. Phys., 11, 4039–4072, https://doi.org/10.5194/acp-11-4039-2011, 2011.
Akherati, A., He, Y., Coggon, M. M., Koss, A. R., Hodshire, A. L., Sekimoto, K., Warneke, C., de Gouw, J., Yee, L., Seinfeld, J. H., Onasch, T. B., Herndon, S. C., Knighton, W. B., Cappa, C. D., Kleeman, M. J., Lim, C. Y., Kroll, J. H., Pierce, J. R., and Jathar, S. H.: Oxygenated Aromatic Compounds are Important Precursors of Secondary Organic Aerosol in Biomass-Burning Emissions, Environ. Sci. Technol., 54, 8568–8579, https://doi.org/10.1021/acs.est.0c01345, 2020.
Andreae, M. O.: Emission of trace gases and aerosols from biomass burning – an updated assessment, Atmos. Chem. Phys., 19, 8523–8546, https://doi.org/10.5194/acp-19-8523-2019, 2019.
Barboni, T., Cannac, M., Pasqualini, V., Simeoni, A., Leoni, E., and Chiaramonti, N.: Volatile and semi-volatile organic compounds in smoke exposure of firefighters during prescribed burning in the Mediterranean region, Int. J. Wildland Fire, 19, 606–612, https://doi.org/10.1071/WF08121, 2010.
Bhargava, A., Khanna, R. N., Bhargava, S. K., and Kumar, S.: Exposure risk to carcinogenic PAHs in indoor-air during biomass combustion whilst cooking in rural India, Atmos. Environ., 38, 4761–4767, https://doi.org/10.1016/j.atmosenv.2004.05.012, 2004.
Brunekreef, B. and Holgate, S. T.: Air pollution and health, Lancet, 360, 1233–1242, https://doi.org/10.1016/S0140-6736(02)11274-8, 2002.
Bruns, E. A., El Haddad, I., Slowik, J. G., Kilic, D., Klein, F., Baltensperger, U., and Prévôt, A. S. H.: Identification of significant precursor gases of secondary organic aerosols from residential wood combustion, Sci. Rep., 6, 27881, https://doi.org/10.1038/srep27881, 2016.
Burling, I. R., Yokelson, R. J., Griffith, D. W. T., Johnson, T. J., Veres, P., Roberts, J. M., Warneke, C., Urbanski, S. P., Reardon, J., Weise, D. R., Hao, W. M., and de Gouw, J.: Laboratory measurements of trace gas emissions from biomass burning of fuel types from the southeastern and southwestern United States, Atmos. Chem. Phys., 10, 11115–11130, https://doi.org/10.5194/acp-10-11115-2010, 2010.
Chen, J., Li, C., Ristovski, Z., Milic, A., Gu, Y., Islam, M. S., Wang, S., Hao, J., Zhang, H., He, C., Guo, H., Fu, H., Miljevic, B., Morawska, L., Thai, P., Lam, Y. F., Pereira, G., Ding, A., Huang, X., and Dumka, U. C.: A review of biomass burning: Emissions and impacts on air quality, health and climate in China, Sci. Total Environ., 579, 1000–1034, https://doi.org/10.1016/j.scitotenv.2016.11.025, 2017.
Coggon, M. M., Lim, C. Y., Koss, A. R., Sekimoto, K., Yuan, B., Gilman, J. B., Hagan, D. H., Selimovic, V., Zarzana, K. J., Brown, S. S., Roberts, J. M., Müller, M., Yokelson, R., Wisthaler, A., Krechmer, J. E., Jimenez, J. L., Cappa, C., Kroll, J. H., de Gouw, J., and Warneke, C.: OH chemistry of non-methane organic gases (NMOGs) emitted from laboratory and ambient biomass burning smoke: evaluating the influence of furans and oxygenated aromatics on ozone and secondary NMOG formation, Atmos. Chem. Phys., 19, 14875–14899, https://doi.org/10.5194/acp-19-14875-2019, 2019.
Cohen, A. J., Ross Anderson, H., Ostro, B., Pandey, K. D., Krzyzanowski, M., Künzli, N., Gutschmidt, K., Pope, A., Romieu, I., Samet, J. M., and Smith, K.: The Global Burden of Disease Due to Outdoor Air Pollution, J. Toxicol. Env. Health, 68, 1301–1307, https://doi.org/10.1080/15287390590936166, 2005.
Cubison, M. J., Ortega, A. M., Hayes, P. L., Farmer, D. K., Day, D., Lechner, M. J., Brune, W. H., Apel, E., Diskin, G. S., Fisher, J. A., Fuelberg, H. E., Hecobian, A., Knapp, D. J., Mikoviny, T., Riemer, D., Sachse, G. W., Sessions, W., Weber, R. J., Weinheimer, A. J., Wisthaler, A., and Jimenez, J. L.: Effects of aging on organic aerosol from open biomass burning smoke in aircraft and laboratory studies, Atmos. Chem. Phys., 11, 12049–12064, https://doi.org/10.5194/acp-11-12049-2011, 2011.
Decker, Z. C. J., Zarzana, K. J., Coggon, M., Min, K.-E., Pollack, I., Ryerson, T. B., Peischl, J., Edwards, P., Dubé, W. P., Markovic, M. Z., Roberts, J. M., Veres, P. R., Graus, M., Warneke, C., de Gouw, J., Hatch, L. E., Barsanti, K. C., and Brown, S. S.: Nighttime Chemical Transformation in Biomass Burning Plumes: A Box Model Analysis Initialized with Aircraft Observations, Environ. Sci. Technol., 53, 2529–2538, https://doi.org/10.1021/acs.est.8b05359, 2019.
EPA: Estimation Programs Interface Suite™ for Microsoft® Windows v 4.11, available at: https://www.epa.gov/tsca-screening-tools/epi-suitetm-estimation-program-interface (last access: 4 March 2020), 2012.
Farren, N. J., Ramírez, N., Lee, J. D., Finessi, E., Lewis, A. C., and Hamilton, J. F.: Estimated Exposure Risks from Carcinogenic Nitrosamines in Urban Airborne Particulate Matter, Environ. Sci. Technol., 49, 9648–9656, https://doi.org/10.1021/acs.est.5b01620, 2015.
Fine, P. M., Cass, G. R., and Simoneit, B. R. T.: Chemical Characterization of Fine Particle Emissions from Fireplace Combustion of Woods Grown in the Northeastern United States, Environ. Sci. Technol., 35, 2665–2675, https://doi.org/10.1021/es001466k, 2001.
Finewax, Z., de Gouw, J. A., and Ziemann, P. J.: Identification and Quantification of 4-Nitrocatechol Formed from OH and NO3 Radical-Initiated Reactions of Catechol in Air in the Presence of NOx: Implications for Secondary Organic Aerosol Formation from Biomass Burning, Environ. Sci. Technol., 52, 1981–1989, https://doi.org/10.1021/acs.est.7b05864, 2018.
Gadi, R., Singh, D. P., Saud, T., Mandal, T. K., and Saxena, M.: Emission Estimates of Particulate PAHs from Biomass Fuels Used in Delhi, India, Hum. Ecol. Risk Assess., 18, 871–887, https://doi.org/10.1080/10807039.2012.688714, 2012.
Geng, C., Chen, J., Yang, X., Ren, L., Yin, B., Liu, X., and Bai, Z.: Emission factors of polycyclic aromatic hydrocarbons from domestic coal combustion in China, J. Environ. Sci., 26, 160–166, https://doi.org/10.1016/S1001-0742(13)60393-9, 2014.
Gilman, J. B., Lerner, B. M., Kuster, W. C., Goldan, P. D., Warneke, C., Veres, P. R., Roberts, J. M., de Gouw, J. A., Burling, I. R., and Yokelson, R. J.: Biomass burning emissions and potential air quality impacts of volatile organic compounds and other trace gases from fuels common in the US, Atmos. Chem. Phys., 15, 13915–13938, https://doi.org/10.5194/acp-15-13915-2015, 2015.
Goldstein, A. H., and Galbally, I. E.: Known and Unexplored Organic Constituents in the Earth's Atmosphere, Environ. Sci. Technol., 41, 1514–1521, https://doi.org/10.1021/es072476p, 2007.
Gómez Alvarez, E., Borrás, E., Viidanoja, J., and Hjorth, J.: Unsaturated dicarbonyl products from the OH-initiated photo-oxidation of furan, 2-methylfuran and 3-methylfuran, Atmos. Environ., 43, 1603–1612, https://doi.org/10.1016/j.atmosenv.2008.12.019, 2009.
Gordon, T., Balakrishnan, K., Dey, S., Rajagopalan, S., Thornburg, J., Thurston, G., Agrawal, A., Collman, G., Guleria, R., Limaye, S., Salvi, S., Kilaru, V., and Nadadur, S.: Air pollution health research priorities for India: Perspectives of the Indo-US Communities of Researchers, Environ. Int., 119, 100–108, https://doi.org/10.1016/j.envint.2018.06.013, 2018.
Gulyurtlu, I., Karunaratne, D. G. G. P., and Cabrita, I.: The study of the effect of operating parameters on the PAH formation during the combustion of coconut shell in a fluidised bed, Fuel, 82, 215–223, https://doi.org/10.1016/S0016-2361(02)00224-7, 2003.
Hamilton, J. F., Webb, P. J., Lewis, A. C., Hopkins, J. R., Smith, S., and Davy, P.: Partially oxidised organic components in urban aerosol using GCXGC-TOF/MS, Atmos. Chem. Phys., 4, 1279–1290, https://doi.org/10.5194/acp-4-1279-2004, 2004.
Hartikainen, A., Yli-Pirilä, P., Tiitta, P., Leskinen, A., Kortelainen, M., Orasche, J., Schnelle-Kreis, J., Lehtinen, K. E. J., Zimmermann, R., Jokiniemi, J., and Sippula, O.: Volatile Organic Compounds from Logwood Combustion: Emissions and Transformation under Dark and Photochemical Aging Conditions in a Smog Chamber, Environ. Sci. Technol., 52, 4979–4988, https://doi.org/10.1021/acs.est.7b06269, 2018.
Hatch, L. E., Luo, W., Pankow, J. F., Yokelson, R. J., Stockwell, C. E., and Barsanti, K. C.: Identification and quantification of gaseous organic compounds emitted from biomass burning using two-dimensional gas chromatography–time-of-flight mass spectrometry, Atmos. Chem. Phys., 15, 1865–1899, https://doi.org/10.5194/acp-15-1865-2015, 2015.
Hatch, L. E., Rivas-Ubach, A., Jen, C. N., Lipton, M., Goldstein, A. H., and Barsanti, K. C.: Measurements of I/SVOCs in biomass-burning smoke using solid-phase extraction disks and two-dimensional gas chromatography, Atmos. Chem. Phys., 18, 17801–17817, https://doi.org/10.5194/acp-18-17801-2018, 2018.
Hodzic, A., Kasibhatla, P. S., Jo, D. S., Cappa, C. D., Jimenez, J. L., Madronich, S., and Park, R. J.: Rethinking the global secondary organic aerosol (SOA) budget: stronger production, faster removal, shorter lifetime, Atmos. Chem. Phys., 16, 7917–7941, https://doi.org/10.5194/acp-16-7917-2016, 2016.
Holzinger, R.: PTRwid: A new widget tool for processing PTR-TOF-MS data, Atmos. Meas. Tech., 8, 3903–3922, https://doi.org/10.5194/amt-8-3903-2015, 2015.
Hosseini, S., Urbanski, S. P., Dixit, P., Qi, L., Burling, I. R., Yokelson, R. J., Johnson, T. J., Shrivastava, M., Jung, H. S., Weise, D. R., Miller, J. W., and Cocker Iii, D. R.: Laboratory characterization of PM emissions from combustion of wildland biomass fuels, J. Geophys. Res.-Atmos., 118, 9914–9929, https://doi.org/10.1002/jgrd.50481, 2013.
IARC: Polynuclear aromatic compounds, part 1: chemical, environmental, and experimental data, Monographs on the Evaluation of the Carcinogenic Risk of Chemicals to Humans, International Agency for Research on Cancer, Lyon, France, 1983.
IARC: Polynuclear aromatic compounds, part 2: carbon blacks, mineral oils, and some nitroarenes, Monographs on the Evaluation of the Carcinogenic Risk of Chemicals to Humans, International Agency for Research on Cancer, Lyon, France, 1984.
Jain, N., Bhatia, A., and Pathak, H.: Emission of Air Pollutants from Crop Residue Burning in India, Aerosol Air Qual. Res., 14, 422–430, https://doi.org/10.4209/aaqr.2013.01.0031, 2014.
Jathar, S. H., Woody, M., Pye, H. O. T., Baker, K. R., and Robinson, A. L.: Chemical transport model simulations of organic aerosol in southern California: model evaluation and gasoline and diesel source contributions, Atmos. Chem. Phys., 17, 4305–4318, https://doi.org/10.5194/acp-17-4305-2017, 2017.
Jayarathne, T., Stockwell, C. E., Bhave, P. V., Praveen, P. S., Rathnayake, C. M., Islam, Md. R., Panday, A. K., Adhikari, S., Maharjan, R., Goetz, J. D., DeCarlo, P. F., Saikawa, E., Yokelson, R. J., and Stone, E. A.: Nepal Ambient Monitoring and Source Testing Experiment (NAMaSTE): emissions of particulate matter from wood- and dung-fueled cooking fires, garbage and crop residue burning, brick kilns, and other sources, Atmos. Chem. Phys., 18, 2259–2286, https://doi.org/10.5194/acp-18-2259-2018, 2018.
Jen, C. N., Hatch, L. E., Selimovic, V., Yokelson, R. J., Weber, R., Fernandez, A. E., Kreisberg, N. M., Barsanti, K. C., and Goldstein, A. H.: Speciated and total emission factors of particulate organics from burning western US wildland fuels and their dependence on combustion efficiency, Atmos. Chem. Phys., 19, 1013–1026, https://doi.org/10.5194/acp-19-1013-2019, 2019.
Jenkins, B. M., Jones, A. D., Turn, S. Q., and Williams, R. B.: Emission Factors for Polycyclic Aromatic Hydrocarbons from Biomass Burning, Environ. Sci. Technol., 30, 2462–2469, https://doi.org/10.1021/es950699m, 1996.
Jia, Y. L., Stone, D., Wang, W. T., Schrlau, J., Tao, S., and Simonich, S. L. M.: Estimated Reduction in Cancer Risk due to PAH Exposures If Source Control Measures during the 2008 Beijing Olympics Were Sustained, Environ. Health Persp., 119, 815–820, https://doi.org/10.1289/ehp.1003100, 2011.
Johansson, K. O., Dillstrom, T., Monti, M., El Gabaly, F., Campbell, M. F., Schrader, P. E., Popolan-Vaida, D. M., Richards-Henderson, N. K., Wilson, K. R., Violi, A., and Michelsen, H. A.: Formation and emission of large furans and oxygenated hydrocarbons from flames, P. Natl. Acad. Sci., 113, 8374–8379, https://doi.org/10.1073/pnas.1604772113, 2016.
Joo, T., Rivera-Rios, J. C., Takeuchi, M., Alvarado, M. J., and Ng, N. L.: Secondary Organic Aerosol Formation from Reaction of 3-Methylfuran with Nitrate Radicals, ACS Earth and Space Chemistry, 3, 922–934, https://doi.org/10.1021/acsearthspacechem.9b00068, 2019.
Kakareka, S. V., Kukharchyk, T. I., and Khomich, V. S.: Study of PAH emission from the solid fuels combustion in residential furnaces, Environ. Pollut., 133, 383–387, https://doi.org/10.1016/j.envpol.2004.01.009, 2005.
Karasek, F. W. and Tong, H. Y.: Semi-preparative high-performance liquid chromatographic analysis of complex organic mixtures, J. Chromatogr., 332, 169–179, https://doi.org/10.1016/S0021-9673(01)83294-5, 1985.
Kerminen, V.-M., Lihavainen, H., Komppula, M., Viisanen, Y., and Kulmala, M.: Direct observational evidence linking atmospheric aerosol formation and cloud droplet activation, Geophys. Res. Lett., 32, L14803, https://doi.org/10.1029/2005gl023130, 2005.
Kiely, L., Spracklen, D. V., Wiedinmyer, C., Conibear, L., Reddington, C. L., Archer-Nicholls, S., Lowe, D., Arnold, S. R., Knote, C., Khan, M. F., Latif, M. T., Kuwata, M., Budisulistiorini, S. H., and Syaufina, L.: New estimate of particulate emissions from Indonesian peat fires in 2015, Atmos. Chem. Phys., 19, 11105–11121, https://doi.org/10.5194/acp-19-11105-2019, 2019.
Kim Oanh, N. T., Bætz Reutergårdh, L., and Dung, N. T.: Emission of Polycyclic Aromatic Hydrocarbons and Particulate Matter from Domestic Combustion of Selected Fuels, Environ. Sci. Technol., 33, 2703–2709, https://doi.org/10.1021/es980853f, 1999.
Kim Oanh, N. T., Nghiem, L. H., and Phyu, Y. L.: Emission of Polycyclic Aromatic Hydrocarbons, Toxicity, and Mutagenicity from Domestic Cooking Using Sawdust Briquettes, Wood, and Kerosene, Environ. Sci. Technol., 36, 833–839, https://doi.org/10.1021/es011060n, 2002.
Kim Oanh, N. T., Albina, D. O., Ping, L., and Wang, X.: Emission of particulate matter and polycyclic aromatic hydrocarbons from select cookstove-fuel systems in Asia, Biomass Bioenerg., 28, 579–590, https://doi.org/10.1016/j.biombioe.2005.01.003, 2005.
Kim Oanh, N. T., Tipayarom, A., Bich, T. L., Tipayarom, D., Simpson, C. D., Hardie, D., and Sally Liu, L. J.: Characterization of gaseous and semi-volatile organic compounds emitted from field burning of rice straw, Atmos. Environ., 119, 182–191, https://doi.org/10.1016/j.atmosenv.2015.08.005, 2015.
Kirkby, J., Curtius, J., Almeida, J., Dunne, E., Duplissy, J., Ehrhart, S., Franchin, A., Gagne, S., Ickes, L., Kurten, A., Kupc, A., Metzger, A., Riccobono, F., Rondo, L., Schobesberger, S., Tsagkogeorgas, G., Wimmer, D., Amorim, A., Bianchi, F., Breitenlechner, M., David, A., Dommen, J., Downard, A., Ehn, M., Flagan, R. C., Haider, S., Hansel, A., Hauser, D., Jud, W., Junninen, H., Kreissl, F., Kvashin, A., Laaksonen, A., Lehtipalo, K., Lima, J., Lovejoy, E. R., Makhmutov, V., Mathot, S., Mikkila, J., Minginette, P., Mogo, S., Nieminen, T., Onnela, A., Pereira, P., Petaja, T., Schnitzhofer, R., Seinfeld, J. H., Sipila, M., Stozhkov, Y., Stratmann, F., Tome, A., Vanhanen, J., Viisanen, Y., Vrtala, A., Wagner, P. E., Walther, H., Weingartner, E., Wex, H., Winkler, P. M., Carslaw, K. S., Worsnop, D. R., Baltensperger, U., and Kulmala, M.: Role of sulphuric acid, ammonia and galactic cosmic rays in atmospheric aerosol nucleation, Nature, 476, 429–477, https://doi.org/10.1038/nature10343, 2011.
Koss, A. R., Sekimoto, K., Gilman, J. B., Selimovic, V., Coggon, M. M., Zarzana, K. J., Yuan, B., Lerner, B. M., Brown, S. S., Jimenez, J. L., Krechmer, J., Roberts, J. M., Warneke, C., Yokelson, R. J., and de Gouw, J.: Non-methane organic gas emissions from biomass burning: identification, quantification, and emission factors from PTR-ToF during the FIREX 2016 laboratory experiment, Atmos. Chem. Phys., 18, 3299–3319, https://doi.org/10.5194/acp-18-3299-2018, 2018.
Laaksonen, A., Hamed, A., Joutsensaari, J., Hiltunen, L., Cavalli, F., Junkermann, W., Asmi, A., Fuzzi, S., and Facchini, M. C.: Cloud condensation nucleus production from nucleation events at a highly polluted region, Geophys. Res. Lett., 32, L06812, https://doi.org/10.1029/2004gl022092, 2005.
Lauraguais, A., Coeur, C., Cassez, A., Deboudt, K., Fourmentin, M., and Choël, M.: Atmospheric reactivity of hydroxyl radicals with guaiacol (2-methoxyphenol), a biomass burning emitted compound: Secondary organic aerosol formation and gas-phase oxidation products, Atmos. Environ., 86, 155–163, https://doi.org/10.1016/j.atmosenv.2013.11.074, 2014.
Lee, R. G. M., Coleman, P., Jones, J. L., Jones, K. C., and Lohmann, R.: Emission Factors and Importance of PCDD/Fs, PCBs, PCNs, PAHs and PM10 from the Domestic Burning of Coal and Wood in the UK, Environ. Sci. Technol., 39, 1436–1447, https://doi.org/10.1021/es048745i, 2005.
Leco: ChromaTOF 5.0, available at: https://www.leco.com/product/chromatof-software (last access: 10 August 2020), 2019.
Lelieveld, J., Evans, J. S., Fnais, M., Giannadaki, D., and Pozzer, A.: The contribution of outdoor air pollution sources to premature mortality on a global scale, Nature, 525, 367, https://doi.org/10.1038/nature15371, 2015.
Leppalahti, J. and Koljonen, T.: Nitrogen evolution from coal, peat and wood during gasification – literature review, Fuel Process. Technol., 43, 1–45, https://doi.org/10.1016/0378-3820(94)00123-b, 1995.
Lewis, A. C., Carslaw, N., Marriott, P. J., Kinghorn, R. M., Morrison, P., Lee, A. L., Bartle, K. D., and Pilling, M. J.: A larger pool of ozone-forming carbon compounds in urban atmospheres, Nature, 405, 778–781, https://doi.org/10.1038/35015540, 2000.
Lewtas, J.: Air pollution combustion emissions: Characterization of causative agents and mechanisms associated with cancer, reproductive, and cardiovascular effects, Mutat. Res., 636, 95–133, https://doi.org/10.1016/j.mrrev.2007.08.003, 2007.
Lim, C. Y., Hagan, D. H., Coggon, M. M., Koss, A. R., Sekimoto, K., de Gouw, J., Warneke, C., Cappa, C. D., and Kroll, J. H.: Secondary organic aerosol formation from the laboratory oxidation of biomass burning emissions, Atmos. Chem. Phys., 19, 12797–12809, https://doi.org/10.5194/acp-19-12797-2019, 2019.
Lim, S. S., Vos, T., Flaxman, A. D., Danaei, G., Shibuya, K., Adair-Rohani, H., AlMazroa, M. A., Amann, M., Anderson, H. R., Andrews, K. G., Aryee, M., Atkinson, C., Bacchus, L. J., Bahalim, A. N., Balakrishnan, K., Balmes, J., Barker-Collo, S., Baxter, A., Bell, M. L., Blore, J. D., Blyth, F., Bonner, C., Borges, G., Bourne, R., Boussinesq, M., Brauer, M., Brooks, P., Bruce, N. G., Brunekreef, B., Bryan-Hancock, C., Bucello, C., Buchbinder, R., Bull, F., Burnett, R. T., Byers, T. E., Calabria, B., Carapetis, J., Carnahan, E., Chafe, Z., Charlson, F., Chen, H., Chen, J. S., Cheng, A. T.-A., Child, J. C., Cohen, A., Colson, K. E., Cowie, B. C., Darby, S., Darling, S., Davis, A., Degenhardt, L., Dentener, F., Des Jarlais, D. C., Devries, K., Dherani, M., Ding, E. L., Dorsey, E. R., Driscoll, T., Edmond, K., Ali, S. E., Engell, R. E., Erwin, P. J., Fahimi, S., Falder, G., Farzadfar, F., Ferrari, A., Finucane, M. M., Flaxman, S., Fowkes, F. G. R., Freedman, G., Freeman, M. K., Gakidou, E., Ghosh, S., Giovannucci, E., Gmel, G., Graham, K., Grainger, R., Grant, B., Gunnell, D., Gutierrez, H. R., Hall, W., Hoek, H. W., Hogan, A., Hosgood, H. D., Hoy, D., Hu, H., Hubbell, B. J., Hutchings, S. J., Ibeanusi, S. E., Jacklyn, G. L., Jasrasaria, R., Jonas, J. B., Kan, H., Kanis, J. A., Kassebaum, N., Kawakami, N., Khang, Y.-H., Khatibzadeh, S., Khoo, J.-P., Kok, C., Laden, F., Lalloo, R., Lan, Q., Lathlean, T., Leasher, J. L., Leigh, J., Li, Y., Lin, J. K., Lipshultz, S. E., London, S., Lozano, R., Lu, Y., Mak, J., Malekzadeh, R., Mallinger, L., Marcenes, W., March, L., Marks, R., Martin, R., McGale, P., McGrath, J., Mehta, S., Memish, Z. A., Mensah, G. A., Merriman, T. R., Micha, R., Michaud, C., Mishra, V., Hanafiah, K. M., Mokdad, A. A., Morawska, L., Mozaffarian, D., Murphy, T., Naghavi, M., Neal, B., Nelson, P. K., Nolla, J. M., Norman, R., Olives, C., Omer, S. B., Orchard, J., Osborne, R., Ostro, B., Page, A., Pandey, K. D., Parry, C. D. H., Passmore, E., Patra, J., Pearce, N., Pelizzari, P. M., Petzold, M., Phillips, M. R., Pope, D., Pope, C. A., Powles, J., Rao, M., Razavi, H., Rehfuess, E. A., Rehm, J. T., Ritz, B., Rivara, F. P., Roberts, T., Robinson, C., Rodriguez-Portales, J. A., Romieu, I., Room, R., Rosenfeld, L. C., Roy, A., Rushton, L., Salomon, J. A., Sampson, U., Sanchez-Riera, L., Sanman, E., Sapkota, A., Seedat, S., Shi, P., Shield, K., Shivakoti, R., Singh, G. M., Sleet, D. A., Smith, E., Smith, K. R., Stapelberg, N. J. C., Steenland, K., Stöckl, H., Stovner, L. J., Straif, K., Straney, L., Thurston, G. D., Tran, J. H., Van Dingenen, R., van Donkelaar, A., Veerman, J. L., Vijayakumar, L., Weintraub, R., Weissman, M. M., White, R. A., Whiteford, H., Wiersma, S. T., Wilkinson, J. D., Williams, H. C., Williams, W., Wilson, N., Woolf, A. D., Yip, P., Zielinski, J. M., Lopez, A. D., Murray, C. J. L., and Ezzati, M.: A comparative risk assessment of burden of disease and injury attributable to 67 risk factors and risk factor clusters in 21 regions, 1990–2010: a systematic analysis for the Global Burden of Disease Study 2010, Lancet, 380, 2224–2260, https://doi.org/10.1016/S0140-6736(12)61766-8, 2012.
Liu, X., Huey, L. G., Yokelson, R. J., Selimovic, V., Simpson, I. J., Müller, M., Jimenez, J. L., Campuzano-Jost, P., Beyersdorf, A. J., Blake, D. R., Butterfield, Z., Choi, Y., Crounse, J. D., Day, D. A., Diskin, G. S., Dubey, M. K., Fortner, E., Hanisco, T. F., Hu, W., King, L. E., Kleinman, L., Meinardi, S., Mikoviny, T., Onasch, T. B., Palm, B. B., Peischl, J., Pollack, I. B., Ryerson, T. B., Sachse, G. W., Sedlacek, A. J., Shilling, J. E., Springston, S., St. Clair, J. M., Tanner, D. J., Teng, A. P., Wennberg, P. O., Wisthaler, A., and Wolfe, G. M.: Airborne measurements of western US wildfire emissions: Comparison with prescribed burning and air quality implications, J. Geophys. Res.-Atmos., 122, 6108–6129, https://doi.org/10.1002/2016jd026315, 2017.
Lu, H., Zhu, L., and Zhu, N.: Polycyclic aromatic hydrocarbon emission from straw burning and the influence of combustion parameters, Atmos. Environ., 43, 978–983, https://doi.org/10.1016/j.atmosenv.2008.10.022, 2009.
Lu, Q., Zhao, Y., and Robinson, A. L.: Comprehensive organic emission profiles for gasoline, diesel, and gas-turbine engines including intermediate and semi-volatile organic compound emissions, Atmos. Chem. Phys., 18, 17637–17654, https://doi.org/10.5194/acp-18-17637-2018, 2018.
Lyu, R., Shi, Z., Alam, M. S., Wu, X., Liu, D., Vu, T. V., Stark, C., Xu, R., Fu, P., Feng, Y., and Harrison, R. M.: Alkanes and aliphatic carbonyl compounds in wintertime PM2.5 in Beijing, China, Atmos. Environ., 202, 244–255, https://doi.org/10.1016/j.atmosenv.2019.01.023, 2019.
Monien, B. H., Herrmann, K., Florian, S., and Glatt, H.: Metabolic activation of furfuryl alcohol: formation of 2-methylfuranyl DNA adducts in Salmonella typhimurium strains expressing human sulfotransferase 1A1 and in FVB/N mice, Carcinogenesis, 32, 1533–1539, https://doi.org/10.1093/carcin/bgr126, 2011.
Murphy, B. N., Woody, M. C., Jimenez, J. L., Carlton, A. M. G., Hayes, P. L., Liu, S., Ng, N. L., Russell, L. M., Setyan, A., Xu, L., Young, J., Zaveri, R. A., Zhang, Q., and Pye, H. O. T.: Semivolatile POA and parameterized total combustion SOA in CMAQv5.2: impacts on source strength and partitioning, Atmos. Chem. Phys., 17, 11107–11133, https://doi.org/10.5194/acp-17-11107-2017, 2017.
Nisbet, I. C. T. and LaGoy, P. K.: Toxic equivalency factors (TEFs) for polycyclic aromatic hydrocarbons (PAHs), Regul. Toxicol. Pharm., 16, 290–300, https://doi.org/10.1016/0273-2300(92)90009-X, 1992.
Ots, R., Young, D. E., Vieno, M., Xu, L., Dunmore, R. E., Allan, J. D., Coe, H., Williams, L. R., Herndon, S. C., Ng, N. L., Hamilton, J. F., Bergström, R., Di Marco, C., Nemitz, E., Mackenzie, I. A., Kuenen, J. J. P., Green, D. C., Reis, S., and Heal, M. R.: Simulating secondary organic aerosol from missing diesel-related intermediate-volatility organic compound emissions during the Clean Air for London (ClearfLo) campaign, Atmos. Chem. Phys., 16, 6453–6473, https://doi.org/10.5194/acp-16-6453-2016, 2016.
Pagonis, D., Krechmer, J. E., de Gouw, J., Jimenez, J. L., and Ziemann, P. J.: Effects of gas–wall partitioning in Teflon tubing and instrumentation on time-resolved measurements of gas-phase organic compounds, Atmos. Meas. Tech., 10, 4687–4696, https://doi.org/10.5194/amt-10-4687-2017, 2017.
Peterson, L. A.: Electrophilic Intermediates Produced by Bioactivation of Furan, Drug Metab. Rev., 38, 615–626, https://doi.org/10.1080/03602530600959417, 2006.
Ramírez, N., Özel, M. Z., Lewis, A. C., Marcé, R. M., Borrull, F., and Hamilton, J. F.: Exposure to nitrosamines in thirdhand tobacco smoke increases cancer risk in non-smokers, Environ. Int., 71, 139–147, https://doi.org/10.1016/j.envint.2014.06.012, 2014.
Ravindranath, V., Boyd, M. R., and Burka, L. T.: Reactive metabolites from the bioactivation of toxic methylfurans, Science, 224, 884–886, https://doi.org/10.1126/science.6719117, 1984.
Ren, Q. Q. and Zhao, C. S.: Evolution of fuel-N in gas phase during biomass pyrolysis, Renew. Sust. Energ. Rev., 50, 408–418, https://doi.org/10.1016/j.rser.2015.05.043, 2015.
Sahu, L. K. and Saxena, P.: High time and mass resolved PTR-TOF-MS measurements of VOCs at an urban site of India during winter: Role of anthropogenic, biomass burning, biogenic and photochemical sources, Atmos. Res., 164/165, 84–94, https://doi.org/10.1016/j.atmosres.2015.04.021, 2015.
Sahu, L. K., Yadav, R., and Pal, D.: Source identification of VOCs at an urban site of western India: Effect of marathon events and anthropogenic emissions, J. Geophys. Res,-Atmos., 121, 2416–2433, https://doi.org/10.1002/2015jd024454, 2016.
Saud, T., Mandal, T. K., Gadi, R., Singh, D. P., Sharma, S. K., Saxena, M., and Mukherjee, A.: Emission estimates of particulate matter (PM) and trace gases (SO2, NO and NO2) from biomass fuels used in rural sector of Indo-Gangetic Plain, India, Atmos. Environ., 45, 5913–5923, https://doi.org/10.1016/j.atmosenv.2011.06.031, 2011.
Saud, T., Gautam, R., Mandal, T. K., Gadi, R., Singh, D. P., Sharma, S. K., Dahiya, M., and Saxena, M.: Emission estimates of organic and elemental carbon from household biomass fuel used over the Indo-Gangetic Plain (IGP), India, Atmos. Environ., 61, 212–220, https://doi.org/10.1016/j.atmosenv.2012.07.030, 2012.
Sekimoto, K., Koss, A. R., Gilman, J. B., Selimovic, V., Coggon, M. M., Zarzana, K. J., Yuan, B., Lerner, B. M., Brown, S. S., Warneke, C., Yokelson, R. J., Roberts, J. M., and de Gouw, J.: High- and low-temperature pyrolysis profiles describe volatile organic compound emissions from western US wildfire fuels, Atmos. Chem. Phys., 18, 9263–9281, https://doi.org/10.5194/acp-18-9263-2018, 2018.
Sengupta, D., Samburova, V., Bhattarai, C., Watts, A. C., Moosmüller, H., and Khlystov, A. Y.: Polar semivolatile organic compounds in biomass-burning emissions and their chemical transformations during aging in an oxidation flow reactor, Atmos. Chem. Phys., 20, 8227–8250, https://doi.org/10.5194/acp-20-8227-2020, 2020.
Shafizadeh, F.: Introduction to pyrolysis of biomass, J. Anal. Appl. Pyrol., 3, 283–305, https://doi.org/10.1016/0165-2370(82)80017-X, 1982.
Sheesley, R. J., Schauer, J. J., Chowdhury, Z., Cass, G. R., and Simoneit, B. R. T.: Characterization of organic aerosols emitted from the combustion of biomass indigenous to South Asia, J. Geophys. Res.-Atmos., 108, 4285, https://doi.org/10.1029/2002jd002981, 2003.
Simoneit, B. R. T.: Biomass burning – a review of organic tracers for smoke from incomplete combustion, Appl. Geochem., 17, 129–162, https://doi.org/10.1016/S0883-2927(01)00061-0, 2002.
Simoneit, B. R. T., Rogge, W. F., Mazurek, M. A., Standley, L. J., Hildemann, L. M., and Cass, G. R.: Lignin pyrolysis products, lignans, and resin acids as specific tracers of plant classes in emissions from biomass combustion, Environ. Sci. Technol., 27, 2533–2541, https://doi.org/10.1021/es00048a034, 1993.
Singh, D. P., Gadi, R., Mandal, T. K., Saud, T., Saxena, M., and Sharma, S. K.: Emissions estimates of PAH from biomass fuels used in rural sector of Indo-Gangetic Plains of India, Atmos. Environ., 68, 120–126, https://doi.org/10.1016/j.atmosenv.2012.11.042, 2013.
Sjöström, E.: Wood Chemistry: Fundamentals and Applications, 2nd edition, Academic Press, San Diego, USA, 1993.
Smith, J. N., Dunn, M. J., VanReken, T. M., Iida, K., Stolzenburg, M. R., McMurry, P. H., and Huey, L. G.: Chemical composition of atmospheric nanoparticles formed from nucleation in Tecamac, Mexico: Evidence for an important role for organic species in nanoparticle growth, Geophys. Res. Lett., 35, L04808, https://doi.org/10.1029/2007gl032523, 2008.
Sotiropoulou, R. E. P., Tagaris, E., Pilinis, C., Anttila, T., and Kulmala, M.: Modeling New Particle Formation During Air Pollution Episodes: Impacts on Aerosol and Cloud Condensation Nuclei, Aerosol Sci. Tech., 40, 557–572, https://doi.org/10.1080/02786820600714346, 2006.
Stein, S. E.: National Institute and Standards and Technology (NIST), Mass Spectral Search Program, Version 2.0g, available at: https://www.nist.gov/system/files/documents/srd/Ver20Man.pdf (last access: 16 Febuary 2021), 2011.
Stewart, G. J.: Non-methane volatile organic compound measurements from domestic biomass burning by PTR-TOF-MS, TIB AV-Portal, https://doi.org/10.5446/50203, 2020.
Stewart, G. J., Nelson, B. S., Drysdale, W. S., Acton, W. J. F., Vaughan, A. R., Hopkins, J. R., Dunmore, R. E., Hewitt, C. N., Nemitz, E. G., Mullinger, N., Langford, B., Shivani Villegas, E. R., Gadi, R., Rickard, A. R., Lee, J. D., and Hamilton, J. F.: Sources of non-methane hydrocarbons in surface air in Delhi, India, Faraday Discuss., https://doi.org/10.1039/D0FD00087F, online first, 2021a.
Stewart, G. J., Nelson, B. S., Acton, W. J. F., Vaughan, A. R., Hopkins, J. R., Yunus, S. S. M., Hewitt, C. N., Nemitz, E., Mullinger, N., Gadi, R., Rickard, A. R., Lee, J. D., Mandal, T. K., and Hamilton, J. F.: Comprehensive organic emission profiles, secondary organic aerosol production potential, and OH reactivity of domestic fuel combustion in Delhi, India, Environ. Sci.: Atmos., https://doi.org/10.1039/D0EA00009D, online first, 2021b.
Stewart, G. J., Acton, W. J. F., Nelson, B. S., Vaughan, A. R., Hopkins, J. R., Arya, R., Mondal, A., Jangirh, R., Ahlawat, S., Yadav, L., Sharma, S. K., Dunmore, R. E., Yunus, S. S. M., Hewitt, C. N., Nemitz, E., Mullinger, N., Gadi, R., Sahu, L. K., Tripathi, N., Rickard, A. R., Lee, J. D., Mandal, T. K., and Hamilton, J. F.: Emissions of non-methane volatile organic compounds from combustion of domestic fuels in Delhi, India, India, Atmos. Chem. Phys., 21, 2383–2406, https://doi.org/10.5194/acp-21-2383-2021, 2021c.
Stockwell, C. E., Veres, P. R., Williams, J., and Yokelson, R. J.: Characterization of biomass burning emissions from cooking fires, peat, crop residue, and other fuels with high-resolution proton-transfer-reaction time-of-flight mass spectrometry, Atmos. Chem. Phys., 15, 845–865, https://doi.org/10.5194/acp-15-845-2015, 2015.
Streets, D. G., Bond, T. C., Carmichael, G. R., Fernandes, S. D., Fu, Q., He, D., Klimont, Z., Nelson, S. M., Tsai, N. Y., Wang, M. Q., Woo, J. H., and Yarber, K. F.: An inventory of gaseous and primary aerosol emissions in Asia in the year 2000, J. Geophys. Res.-Atmos., 108, 8809, https://doi.org/10.1029/2002JD003093, 2003.
Strollo, C. M. and Ziemann, P. J.: Products and mechanism of secondary organic aerosol formation from the reaction of 3-methylfuran with OH radicals in the presence of NOx, Atmos. Environ., 77, 534–543, https://doi.org/10.1016/j.atmosenv.2013.05.033, 2013.
Taipale, R., Ruuskanen, T. M., Rinne, J., Kajos, M. K., Hakola, H., Pohja, T., and Kulmala, M.: Technical Note: Quantitative long-term measurements of VOC concentrations by PTR-MS – measurement, calibration, and volume mixing ratio calculation methods, Atmos. Chem. Phys., 8, 6681–6698, https://doi.org/10.5194/acp-8-6681-2008, 2008.
Tong, H. Y., Shore, D. L., Karasek, F. W., Helland, P., and Jellum, E.: Identification of organic compounds obtained from incineration of municipal waste by high-performance liquid chromatographic fractionation and gas chromatography-mass spectrometry, J. Chromatogr., 285, 423–441, https://doi.org/10.1016/S0021-9673(01)87784-0, 1984.
Venkataraman, C., Negi, G., Brata Sardar, S., and Rastogi, R.: Size distributions of polycyclic aromatic hydrocarbons in aerosol emissions from biofuel combustion, J. Aerosol Sci., 33, 503–518, https://doi.org/10.1016/S0021-8502(01)00185-9, 2002.
Venkataraman, C., Habib, G., Eiguren-Fernandez, A., Miguel, A. H., and Friedlander, S. K.: Residential biofuels in south Asia: Carbonaceous aerosol emissions and climate impacts, Science, 307, 1454–1456, https://doi.org/10.1126/science.1104359, 2005.
Vineis, P. and Husgafvel-Pursiainen, K.: Air pollution and cancer: biomarker studies in human populations, Carcinogenesis, 26, 1846–1855, https://doi.org/10.1093/carcin/bgi216, 2005.
Wei, S. Y., Shen, G. F., Zhang, Y. Y., Xue, M., Xie, H., Lin, P. C., Chen, Y. C., Wang, X. L., and Tao, S.: Field measurement on the emissions of PM, OC, EC and PAHs from indoor crop straw burning in rural China, Environ. Pollut., 184, 18–24, https://doi.org/10.1016/j.envpol.2013.07.036, 2014.
WHO: IARC monographs on the evaluation of carcinogenic risks to humans, Internal report 14/002, World Health Organization, Lyon, France, 2016.
WHO: Household air pollution and health, available at: https://www.who.int/news-room/fact-sheets/detail/household-air-pollution-and-health (last access: 5 August 2020), 2018.
Wiedinmyer, C., Yokelson, R. J., and Gullett, B. K.: Global Emissions of Trace Gases, Particulate Matter, and Hazardous Air Pollutants from Open Burning of Domestic Waste, Environ. Sci. Technol., 48, 9523–9530, https://doi.org/10.1021/es502250z, 2014.
Wiriya, W., Chantara, S., Sillapapiromsuk, S., and Lin, N. H.: Emission Profiles of PM10-Bound Polycyclic Aromatic Hydrocarbons from Biomass Burning Determined in Chamber for Assessment of Air Pollutants from Open Burning, Aerosol Air Qual. Res., 16, 2716–2727, https://doi.org/10.4209/aaqr.2015.04.0278, 2016.
Woody, M. C., Baker, K. R., Hayes, P. L., Jimenez, J. L., Koo, B., and Pye, H. O. T.: Understanding sources of organic aerosol during CalNex-2010 using the CMAQ-VBS, Atmos. Chem. Phys., 16, 4081–4100, https://doi.org/10.5194/acp-16-4081-2016, 2016.
Worton, D. R., Decker, M., Isaacman-VanWertz, G., Chan, A. W. H., Wilson, K. R., and Goldstein, A. H.: Improved molecular level identification of organic compounds using comprehensive two-dimensional chromatography, dual ionization energies and high resolution mass spectrometry, Analyst, 142, 2395–2403, https://doi.org/10.1039/c7an00625j, 2017.
Xue, W. L. and Warshawsky, D.: Metabolic activation of polycyclic and heterocyclic aromatic hydrocarbons and DNA damage: A review, Toxicol. Appl. Pharm., 206, 73–93, https://doi.org/10.1016/j.taap.2004.11.006, 2005.
Yee, L. D., Kautzman, K. E., Loza, C. L., Schilling, K. A., Coggon, M. M., Chhabra, P. S., Chan, M. N., Chan, A. W. H., Hersey, S. P., Crounse, J. D., Wennberg, P. O., Flagan, R. C., and Seinfeld, J. H.: Secondary organic aerosol formation from biomass burning intermediates: phenol and methoxyphenols, Atmos. Chem. Phys., 13, 8019–8043, https://doi.org/10.5194/acp-13-8019-2013, 2013.
Young Koo, Y. K., Kim, W., and Jo, Y. M.: Release of Harmful Air Pollutants from Open Burning of Domestic Municipal Solid Wastes in a Metropolitan Area of Korea, Aerosol Air Qual. Res., 13, 1365–1372, https://doi.org/10.4209/aaqr.2012.10.0272, 2013.
Yu, F. and Luo, G.: Modeling of gaseous methylamines in the global atmosphere: impacts of oxidation and aerosol uptake, Atmos. Chem. Phys., 14, 12455–12464, https://doi.org/10.5194/acp-14-12455-2014, 2014.
Zhang, Y. and Tao, S.: Global atmospheric emission inventory of polycyclic aromatic hydrocarbons (PAHs) for 2004, Atmos. Environ., 43, 812–819, https://doi.org/10.1016/j.atmosenv.2008.10.050, 2009.