the Creative Commons Attribution 4.0 License.
the Creative Commons Attribution 4.0 License.
 | 18 Feb 2021
Impacts of cloud microphysics parameterizations on simulated aerosol–cloud interactions for deep convective clouds over Houston
Yuwei Zhang
Zhanqing Li
Daniel Rosenfeld
Aerosol–cloud interactions remain largely uncertain with respect to predicting their impacts on weather and climate. Cloud microphysics parameterization is one of the factors leading to large uncertainty. Here, we investigate the impacts of anthropogenic aerosols on the convective intensity and precipitation of a thunderstorm occurring on 19 June 2013 over Houston with the Chemistry version of Weather Research and Forecast model (WRF-Chem) using the Morrison two-moment bulk scheme and spectral bin microphysics (SBM) scheme. We find that the SBM predicts a deep convective cloud that shows better agreement with observations in terms of reflectivity and precipitation compared with the Morrison bulk scheme that has been used in many weather and climate models. With the SBM scheme, we see a significant invigoration effect on convective intensity and precipitation by anthropogenic aerosols, mainly through enhanced condensation latent heating. Such an effect is absent with the Morrison two-moment bulk microphysics, mainly because the saturation adjustment approach for droplet condensation and evaporation calculation limits the enhancement by aerosols in (1) condensation latent heat by removing the dependence of condensation on droplets and aerosols and (2) ice-related processes because the approach leads to stronger warm rain and weaker ice processes than the explicit supersaturation approach.
- Article
(10501 KB) - Full-text XML
-
Supplement
(2879 KB) - BibTeX
- EndNote


Deep convective clouds (DCCs) produce copious precipitation and play important roles in the hydrological and energy cycle as well as regional and global circulation (e.g., Arakawa, 2004; Houze, 2014). DCCs and associated precipitation are determined by water vapor, vertical motion of air, and cloud microphysics that could be affected by aerosols through aerosol–radiation interactions (ARI), aerosol–cloud interactions (ACI), or both. The cloud-mediated aerosol effects are recognized by the Intergovernmental Panel on Climate Change (IPCC) as one of the key sources of uncertainty in our knowledge of Earth's energy budget and anthropogenic climate forcing (e.g., Arakawa, 2004; Andreae et al., 2005; Haywood and Boucher, 2000; Lohmann and Feichter, 2005).
Precipitation, latent heat, and cloud radiative forcing associated with DCCs are strongly associated with cloud microphysical processes, which can be modulated by aerosols via their role as cloud condensation nuclei (CCN) and ice nuclei (IN). For aerosol–DCC interactions, a well-known theory is that increasing aerosol concentrations can suppress warm rain as a result of increased droplet numbers but reduced droplet size. This allows more cloud droplets to be lifted to altitudes above the freezing level, inducing stronger ice microphysical processes (e.g., droplet freezing, riming, and deposition) which release larger latent heating, thereby invigorating convective updrafts (referred to as “cold-phase invigoration”; Khain et al., 2005; Rosenfeld et al., 2008). It is significant in the situations of warm-cloud bases (> 15 ∘C; Fan et al., 2012b; Li et al., 2011; Rosenfeld et al., 2014; Tao and Li, 2016) and weak wind shear (Fan et al., 2009, 2012b, 2013; Li et al., 2008; Lebo et al., 2012). Grabowski and Morrison (2016, 2020) argued that this invigoration does not exist because the increase in the buoyancy by freezing is completely offset by the buoyancy for carrying the extra cloud water across the freezing level. However, Rosenfeld et al. (2008) showed that the buoyancy restores and increases after the precipitation of the ice hydrometeors that form upon freezing of the high supercooled liquid water content into large graupel and hail.
Another theory is that increasing aerosols enhances droplet nucleation, particularly secondary nucleation, after warm rain initiates, which promotes condensation because of the larger integrated droplet surface area associated with a higher number of small droplets (Fan et al., 2007, 2013, 2018; Koren at al., 2014; Lebo, 2018; Sheffield et al., 2015; Chen et al., 2020). This is so-called “warm-phase invigoration”, which is manifested in a warm, humid, and clean environment under which the addition of a large number of ultrafine aerosol particles from urban pollution leads to stronger invigoration than the cold-phase invigoration (Fan et al., 2018). Grabowski and Morrison (2020) proposed a different interpretation of warm-phase invigoration from the literature listed above. They argued that condensation rates only depend on updraft velocity with the quasi-steady assumption (i.e., the true supersaturation is approximated with the equilibrium supersaturation). Therefore, they interpreted that it is the lower equilibrium supersaturation in polluted conditions compared with clean conditions that leads to a larger buoyancy and, thus, enhanced updraft speeds and condensation. Several studies have shown that the quasi-steady assumption is invalid in low droplet concentration conditions (Politovich and Cooper, 1988; Korolev and Mazin, 2003) or conditions with an acceleration of vertical velocity (Pinsky et al., 2013).
Many factors can affect whether aerosols invigorate or suppress convective intensity through ACI, such as environmental wind shear (Fan et al., 2009; Lebo et al., 2012), relative humidity (Fan et al., 2007; Khain et al., 2008), and convective available potential energy (Lebo et al., 2012; Morrison, 2012; Storer et al., 2010). Meteorological buffering effects were also found for aerosol effects on convective clouds over a large region and over long time periods of more than a few days or weeks (Stevens and Feingold, 2009; van den Heever et al., 2011). Dagan et al. (2018) showed that the lifetimes of cloud systems are mostly much shorter than that and rarely reach this buffering state. For DCCs with complicated dynamics, thermodynamics, and microphysics, aerosol impacts are extremely complex and remain poorly known. Confidently isolating and quantifying an aerosol deep convective invigoration effect from observations requires very long-term measurements: 10 years of data are still not enough over the Southern Great Plains due to the large variability in meteorological conditions (Varble, 2018).
Modeling of ACI is quite dependent on cloud microphysics parameterization schemes (e.g., Fan et al., 2012a; Khain and Lynn, 2009; Khain et al., 2009, 2015; Lebo and Seinfeld, 2011; Lee et al., 2018; Loftus and Cotton, 2014; Wang et al., 2013). Two-moment bulk and bin schemes have been widely used in ACI studies (e.g., Chen et al., 2011; Fan et al., 2013; Khain et al., 2010). In two-moment bulk schemes, hydrometeor size distributions are diagnosed from the predicted number and mass with an assumed spectral shape (e.g., gamma function). The saturation adjustment approach is often used for calculating condensation and evaporation, meaning supersaturation and undersaturation with respect to water are removed in the cloud within a time step. Some bulk schemes take the explicit supersaturation approach to allow supersaturation to evolve (e.g., Morrison and Grabowski, 2007, 2008). In bin schemes, the size distributions of hydrometeors are discretized by a number of size bins and predicted, which represents some aerosol–cloud interaction processes more physically compared with bulk schemes (Fan et al., 2016; Khain et al., 2015). Supersaturation is generally predicted in bin schemes.
Many studies have shown that bulk schemes are limited in representing certain important microphysical processes such as aerosol activation, condensation, deposition, sedimentation, and rain evaporation (Ekman et al., 2011; Khain et al., 2009; Lee et al., 2018; Li et al., 2009; Milbrandt and Yau, 2005; Morrison, 2012; Wang et al., 2013). Though bin cloud microphysics can provide a more rigorous numerical solution and a more robust cloud microphysics representation than typical bulk microphysics, it is often applied in simulations for process understanding but rarely in operational applications due to the high computation cost. So as not to introduce further computation cost, bin schemes are also often run with a prescribed aerosol spectrum, assuming a fixed composition and a simple aerosol budget treatment without coupling with chemistry and aerosol calculations. As a result, many aerosol life cycle processes such as aerosol nucleation, growth, aqueous chemistry, aerosol resuspension, and below-cloud wet removal are missing or crudely parameterized. Therefore, it is difficult to simulate the spatial and temporal variabilities in the aerosol chemical composition and size distribution. In Gao et al. (2016), we coupled a spectral bin microphysics scheme (SBM; Fan et al., 2012a; Khain et al., 2004) with the Chemistry version of the Weather Research and Forecast model (WRF-Chem; Grell et al., 2005; Skamarock et al., 2008), called WRF-Chem-SBM, to address the abovementioned limitations. In this new model, the SBM was coupled with the Model for Simulating Aerosol Interactions and Chemistry (MOSAIC; Fast et al., 2006; Zaveri et al., 2008). The newly coupled system was initially evaluated for warm marine stratocumulus clouds and showed a remarkably improved simulation of cloud droplet number concentration and liquid water content compared with the default Morrison two-moment bulk scheme (Gao et al., 2016).
The Houston area in summer, where isolated convective clouds with very warm cloud bases often occur in the afternoon (Yuan et al., 2008), offers (a) a combination of polluted aerosols from the urban and industrial areas of Houston and significantly low background aerosol concentrations surrounding Houston, (b) aerosol sources that are not correlated with meteorology, and (c) weak synoptic forcing along with strong local triggering in the form of land–sea contrasts and sea breeze fronts. This combination allows the manifestation of potentially large aerosol effects. In this study, we choose a sea-breeze-induced DCC case occurring from 19 to 20 June 2013 near Houston to (1) evaluate the performance of WRF-Chem-SBM in simulating DCCs and (2) gain a better understanding of the differences in aerosol effects predicted by SBM and the Morrison two-moment bulk scheme as well as the major factors and processes responsible for the differences. Considering that the convective clouds over the Houston area are mainly impacted by the aerosols produced from anthropogenic activities, we focus on the anthropogenic aerosol effect in this study. The simulated storm case is the same as the case for the Aerosol–Cloud–Precipitation–Climate (ACPC) model intercomparison project (Rosenfeld et al., 2014; http://www.acpcinitiative.org/, last access: 29 January 2021).
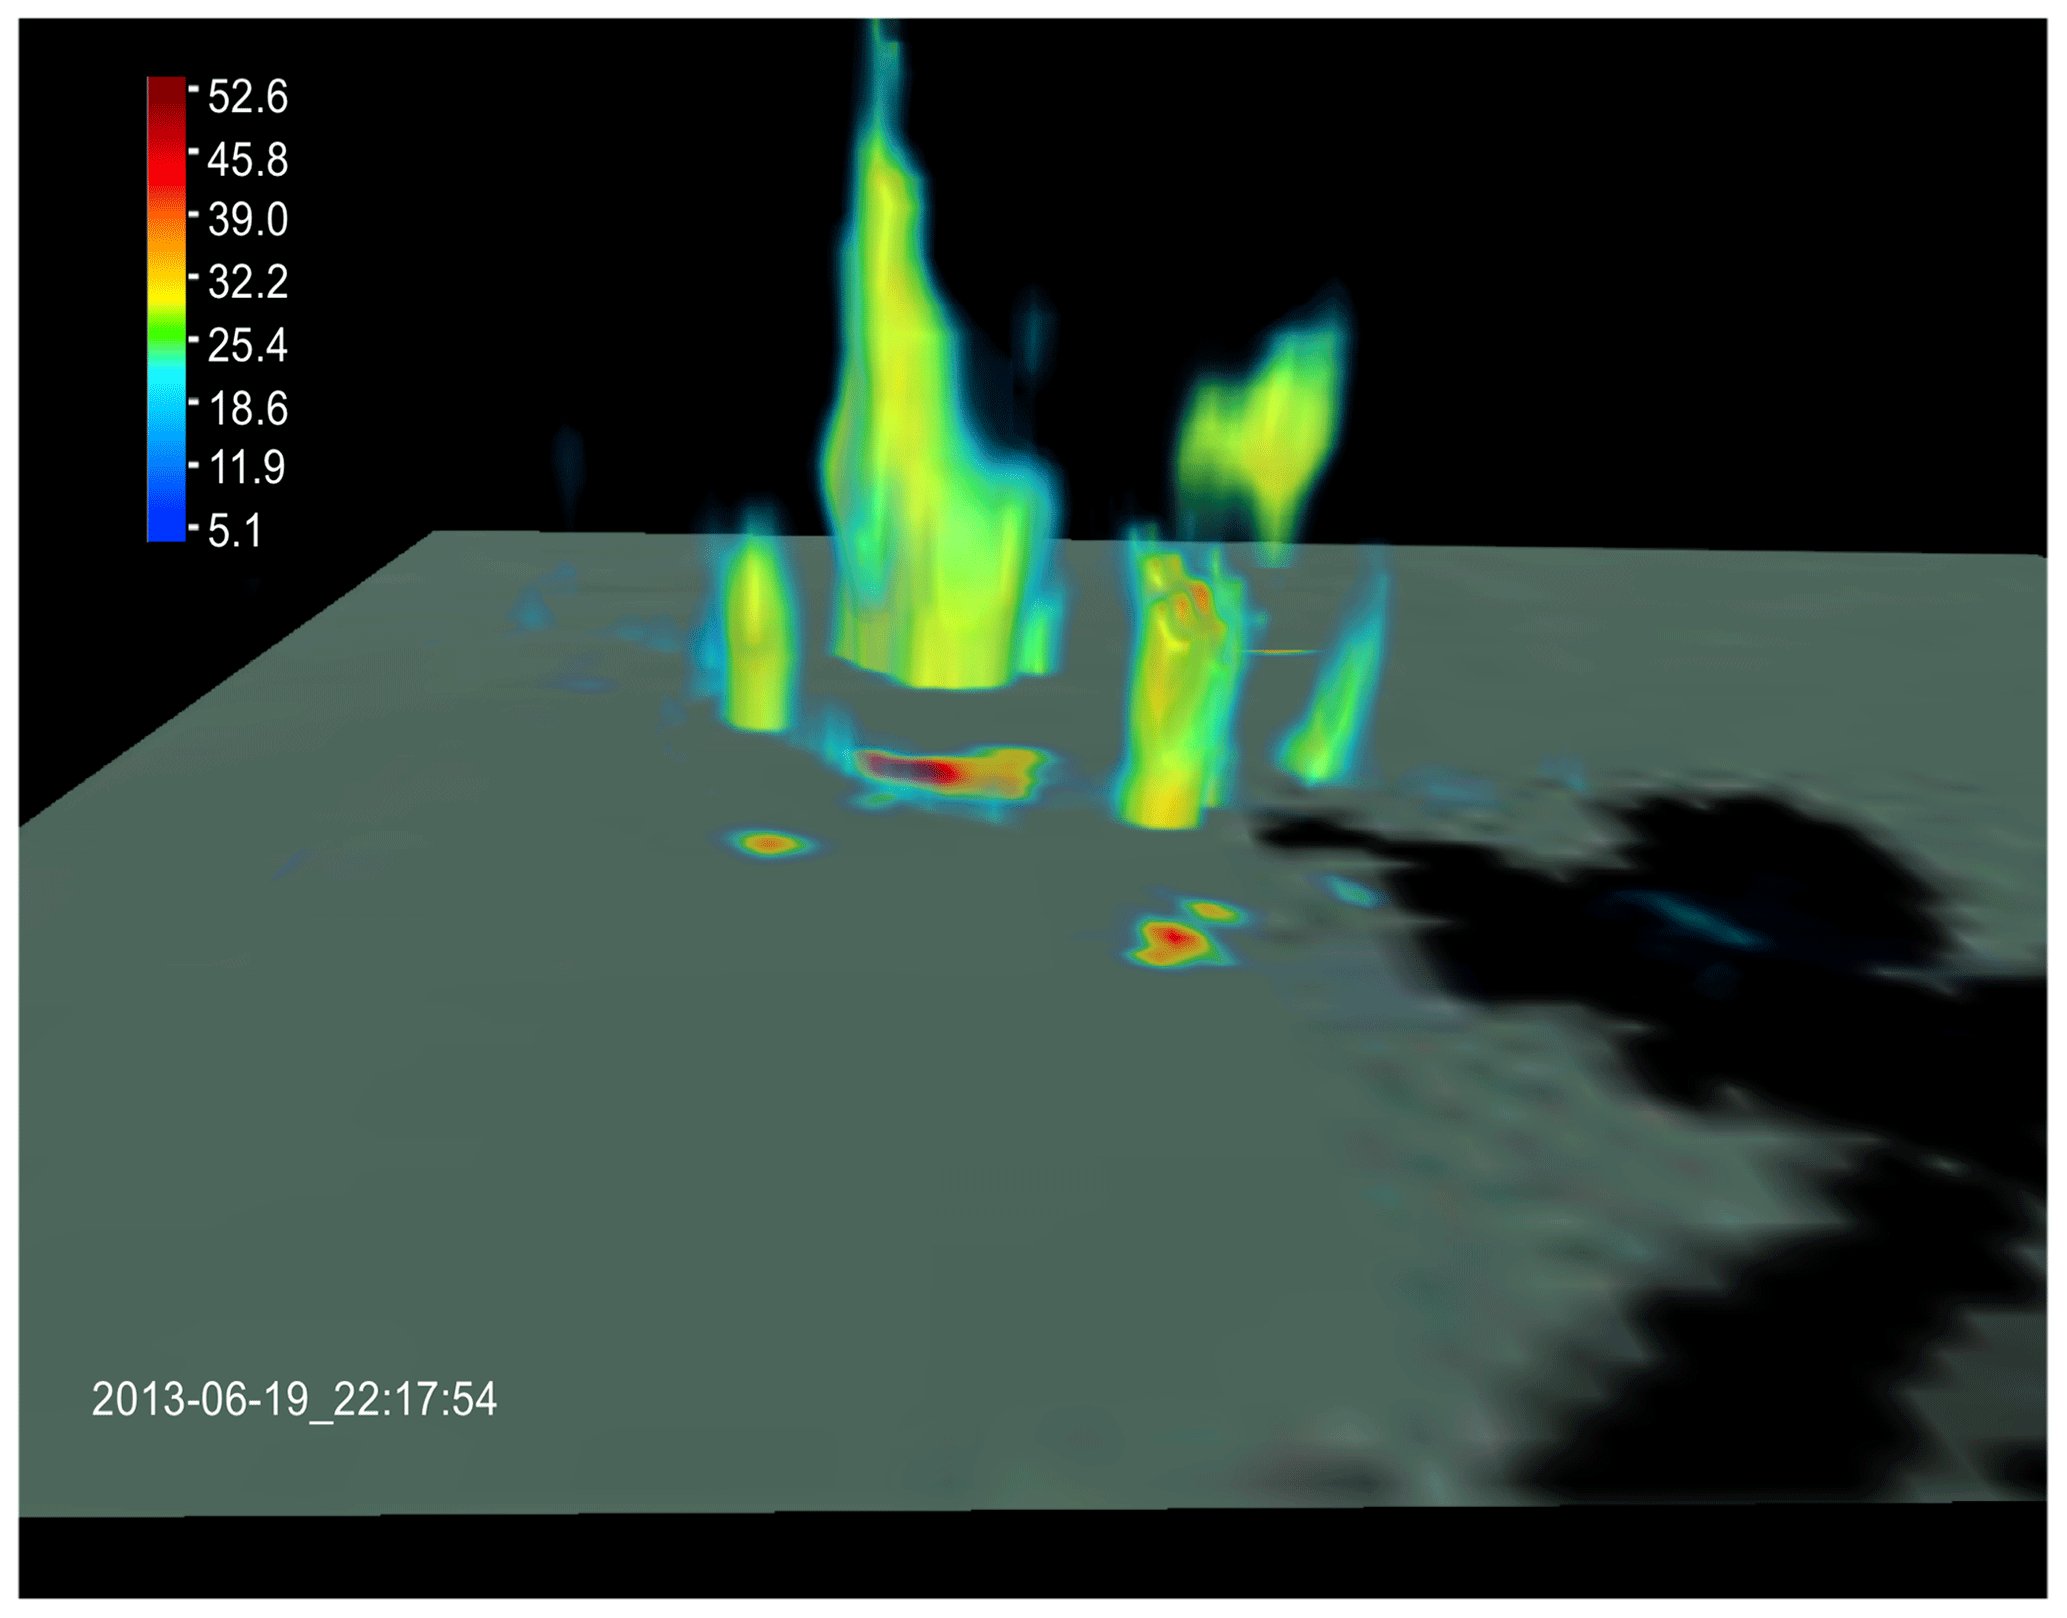
Figure 1A 3D structure snapshot of radar reflectivity (unit: dBZ) from NEXRAD, overlaid with the composite reflectivity shown on the surface at the time when the maximum reflectivity is observed (22:17 UTC). The dark shade shows the water body, and the largest cell is in Houston.
The deep convective cloud event that we simulate in this study occurred on 19–20 June 2013 near Houston, Texas. The isolated relatively weak convective clouds started in the late morning because of a trailing front. With increased solar radiation in the early afternoon and strengthening of a sea breeze circulation that transports warm and humid air from the Gulf of Mexico to the Houston urban area, deep convective cells over Houston and Galveston Bay areas developed (Fig. 1). The strong convective cell observed near the Houston city was initiated around 21:45 UTC (local time 16:45) and developed to its peak precipitation at 22:17 UTC based on radar observations (Fig. 1). The maximum reflectivity was more than 55 dBZ. This storm cell lasted for about 1.5 h.
We used the following observational data for model evaluation. PM2.5 (particulate matter with a diameter less than 2.5 µm) data provided by the Texas Commission of Environmental Quality (TCEQ) at https://www.tceq.texas.gov/agency/data/pm25.html (last access: 29 January 2021) are used to evaluate the simulated aerosols near the surface. The data for evaluating cloud base heights and CCN number concentration at cloud base are obtained from the Visible Infrared Imaging Radiometer Suite (VIIRS) retrievals based on the method of Rosenfeld et al. (2016). The 2 m temperature and 10 m winds are from the North American Land Data Assimilation System (NLDAS) at https://climatedataguide.ucar.edu/climate-data/nldas-north-american-land-data-assimilation-system (last access: 29 January 2021) and have a 0.125∘ resolution. The observed radar reflectivity is used to evaluate the simulated convective system. The radar reflectivity is obtained from the Next Generation Weather Radar (NEXRAD) network at https://www.ncdc.noaa.gov/data-access/radar-data/nexrad-products (last access: 29 January 2021), with a temporal frequency of every ∼ 5 min and a 1 km horizontal spatial resolution.
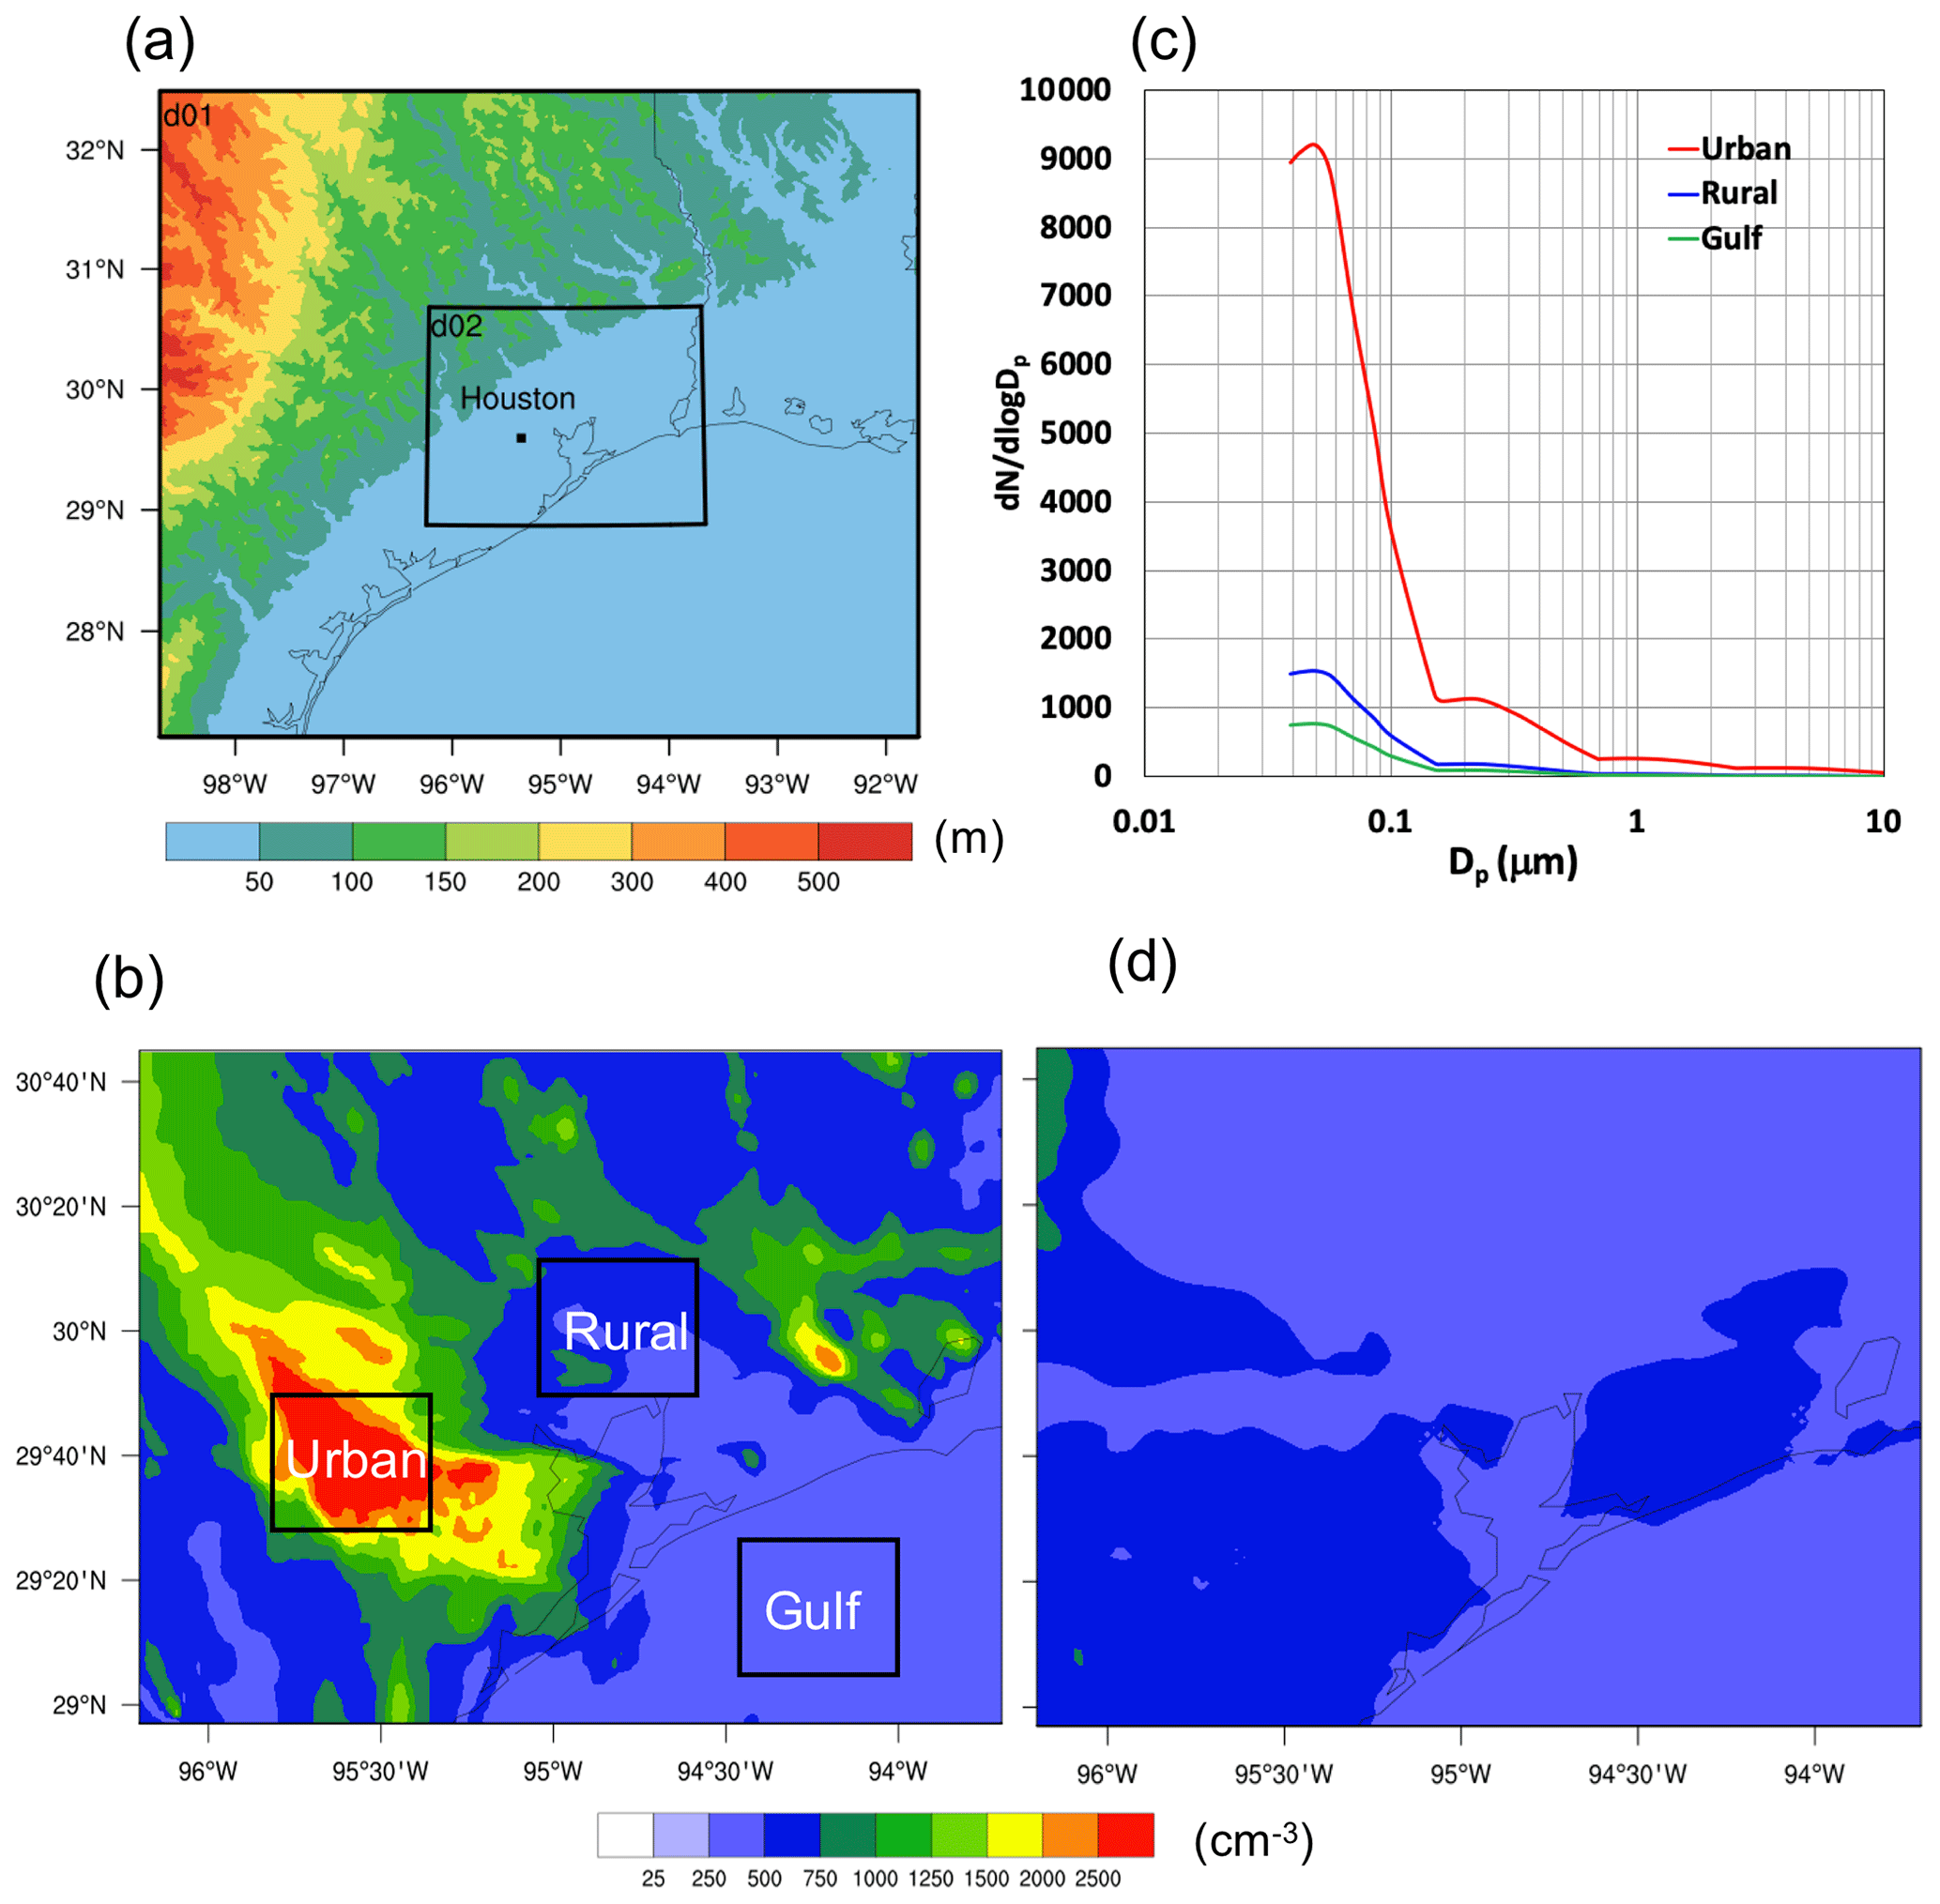
Figure 2(a) Simulation domains with the terrain heights (unit: m). (b) Aerosol number concentration (unit: cm−3) from D1_MOR_anth. (c) Aerosol size distributions over the urban areas, rural areas, and the Gulf of Mexico as marked by the three black boxes in Fig. 2b at 12:00 UTC on 19 June 2013 (6 h before the convection initiation). (d) The same as Fig. 2b but for D1_MOR_noanth in which the anthropogenic aerosols are excluded.
We conducted model simulations using the version of WRF-Chem based on Gao et al. (2016) that is coupled with the Morrison two-moment scheme (Morrison et al., 2005, 2009; Morrison and Milbrandt, 2011) and SBM (Khain et al., 2004; Fan et al., 2012a). The version of SBM employed in this study is a fast version of the Hebrew University Cloud Model (HUCM) described by Khain et al. (2004) with improvements from Fan et al. (2012a, 2017). The considered hydrometer size distributions are droplets, raindrops, cloud ice, snow, and graupel. The graupel version is used because it is more appropriate for simulating the convective storm over the Houston area than the hail version. SBM is currently coupled with the four-sector version of MOSAIC (0.039–0.156, 0.156–0.624, 0.624–2.5, and 2.5–10.0 µm). As detailed in Gao et al. (2016), the aerosol processes, including aerosol activation, resuspension, and in-cloud wet removal, are also improved. Theoretically, both aerosol and cloud processes can be more realistically simulated, particularly under complicated aerosol composition and aerosol spatial heterogeneity conditions, compared with the original WRF-Chem model. The dynamic core of WRF-Chem-SBM is the Advanced Research WRF model that is fully compressible and non-hydrostatic with a terrain-following hydrostatic pressure vertical coordinate (Skamarock et al., 2008). The grid staggering is the Arakawa C-grid. The model uses the Runge–Kutta third-order time integration schemes, and the third- and fifth-order advection schemes are selected for the vertical and horizontal directions, respectively. The positive-definite option is employed for the advection of moist and scalar variables.
Two nested domains with horizontal grid spacings of 2 and 0.5 km and horizontal grid points of 450 × 350 and 500 × 400 for Domain 1 and Domain 2, respectively, are used (Fig. 2a), with 51 vertical levels up to 50 hPa; this allows about 50–100 m grid spacings below 2 km altitude and ∼ 500 m above it. The simulations for Domain 1 and Domain 2 are run separately, and the Domain 1 simulations serve to provide the chemical and aerosol lateral boundary and initial conditions for Domain 2. The chemical and aerosol lateral boundary and initial conditions for Domain 1 simulations were from a quasi-global WRF-Chem simulation at 1∘ grid spacing, and meteorological lateral boundary and initial conditions were created from Modern-Era Retrospective Analysis for Research and Applications, Version 2 (MERRA-2), at 0.5∘ × 0.625∘ grid spacing (Gelaro et al., 2017). Two simulations were run over Domain 1 with anthropogenic emissions turned on and off, respectively, to provide two different aerosol scenarios for the initial and boundary chemical and aerosol conditions for Domain 2 simulations: (1) a polluted aerosol scenario with anthropogenic aerosols accounted for, which is for the real situation; (2) an assumptive clean scenario without anthropogenic aerosols. Domain 2 is run with initial and lateral boundary chemical and aerosols fields from Domain 1 outputs and initial and lateral boundary meteorological conditions from MERRA-2. Note that we use the meteorology from MERRA-2 as the initial and lateral boundary conditions for Domain 2 instead of Domain 1 outputs, because we want to keep the initial and lateral boundary meteorological conditions the same for all the sensitivity tests with different microphysics and aerosol setups (meteorology is different between the two simulations over Domain 1).
The simulations in Domain 1 were initiated at 00:00 UTC on 14 June and ended at 12:00 UTC on 20 June with about 5 d for the chemistry spin-up. The meteorological fields were re-initialized every 36 h to prevent the model from drifting. The dynamic time step was 6 s for Domain 1 and 3 s for Domain 2. The anthropogenic emissions were from the 2011 National Emissions Inventory (NEI-2011). The biogenic emission came from the Model of Emissions of Gases and Aerosols from Nature (MEGAN) product (Guenther et al., 2006). The biomass burning emissions were from the Fire Inventory from NCAR (FINN) model (Wiedinmyer et al., 2011). We used the Carbon Bond Mechanism Z (CBMZ) gas-phase chemistry (Zaveri and Peters, 1999) and MOSAIC aerosol model with four bins (Zaveri et al., 2008). The physics schemes other than microphysics applied in the simulation are the Unified Noah land surface scheme (Chen and Dudhia, 2001), the Mellor–Yamada–Janjić planetary boundary layer scheme (Janjić et al., 1994), the multilayer Building Environment Parameterization (BEP) urban physics scheme (Salamanca and Martilli, 2010), and the Rapid Radiative Transfer Model (RRTMG) longwave and shortwave radiation schemes (Iacono et al., 2008).
The main purpose of the simulations in Domain 1 is to provide initial and boundary chemical and aerosol conditions for the simulations in Domain 2. To minimize computational cost, WRF-Chem coupled with the Morrison two-moment bulk microphysics scheme (Morrison et al., 2005) is used for the simulations in Domain 1. Two simulations run for Domain 1 are referred to as D1_MOR_anth in which the anthropogenic emissions are turned on and D1_MOR_noanth in which the anthropogenic emissions are turned off. Four major experiments are then carried out to simulate the convective event near Houston over Domain 2 with two cloud microphysics schemes and two aerosol scenarios, respectively. We refer to the simulation in which SBM is used and the anthropogenic emissions are included using the initial and boundary chemicals and aerosols from D1_MOR_anth, as our baseline simulation (referred to as “SBM_anth”). SBM_noanth is based on SBM_anth but uses initial and boundary chemicals and aerosols from D1_MOR_noanth and turns off the anthropogenic emissions, meaning that anthropogenic aerosols are not taken into account. MOR_anth and MOR_noanth are the two corresponding simulations to SBM_anth and SBM_noanth, respectively, using the Morrison two-moment bulk microphysics scheme.
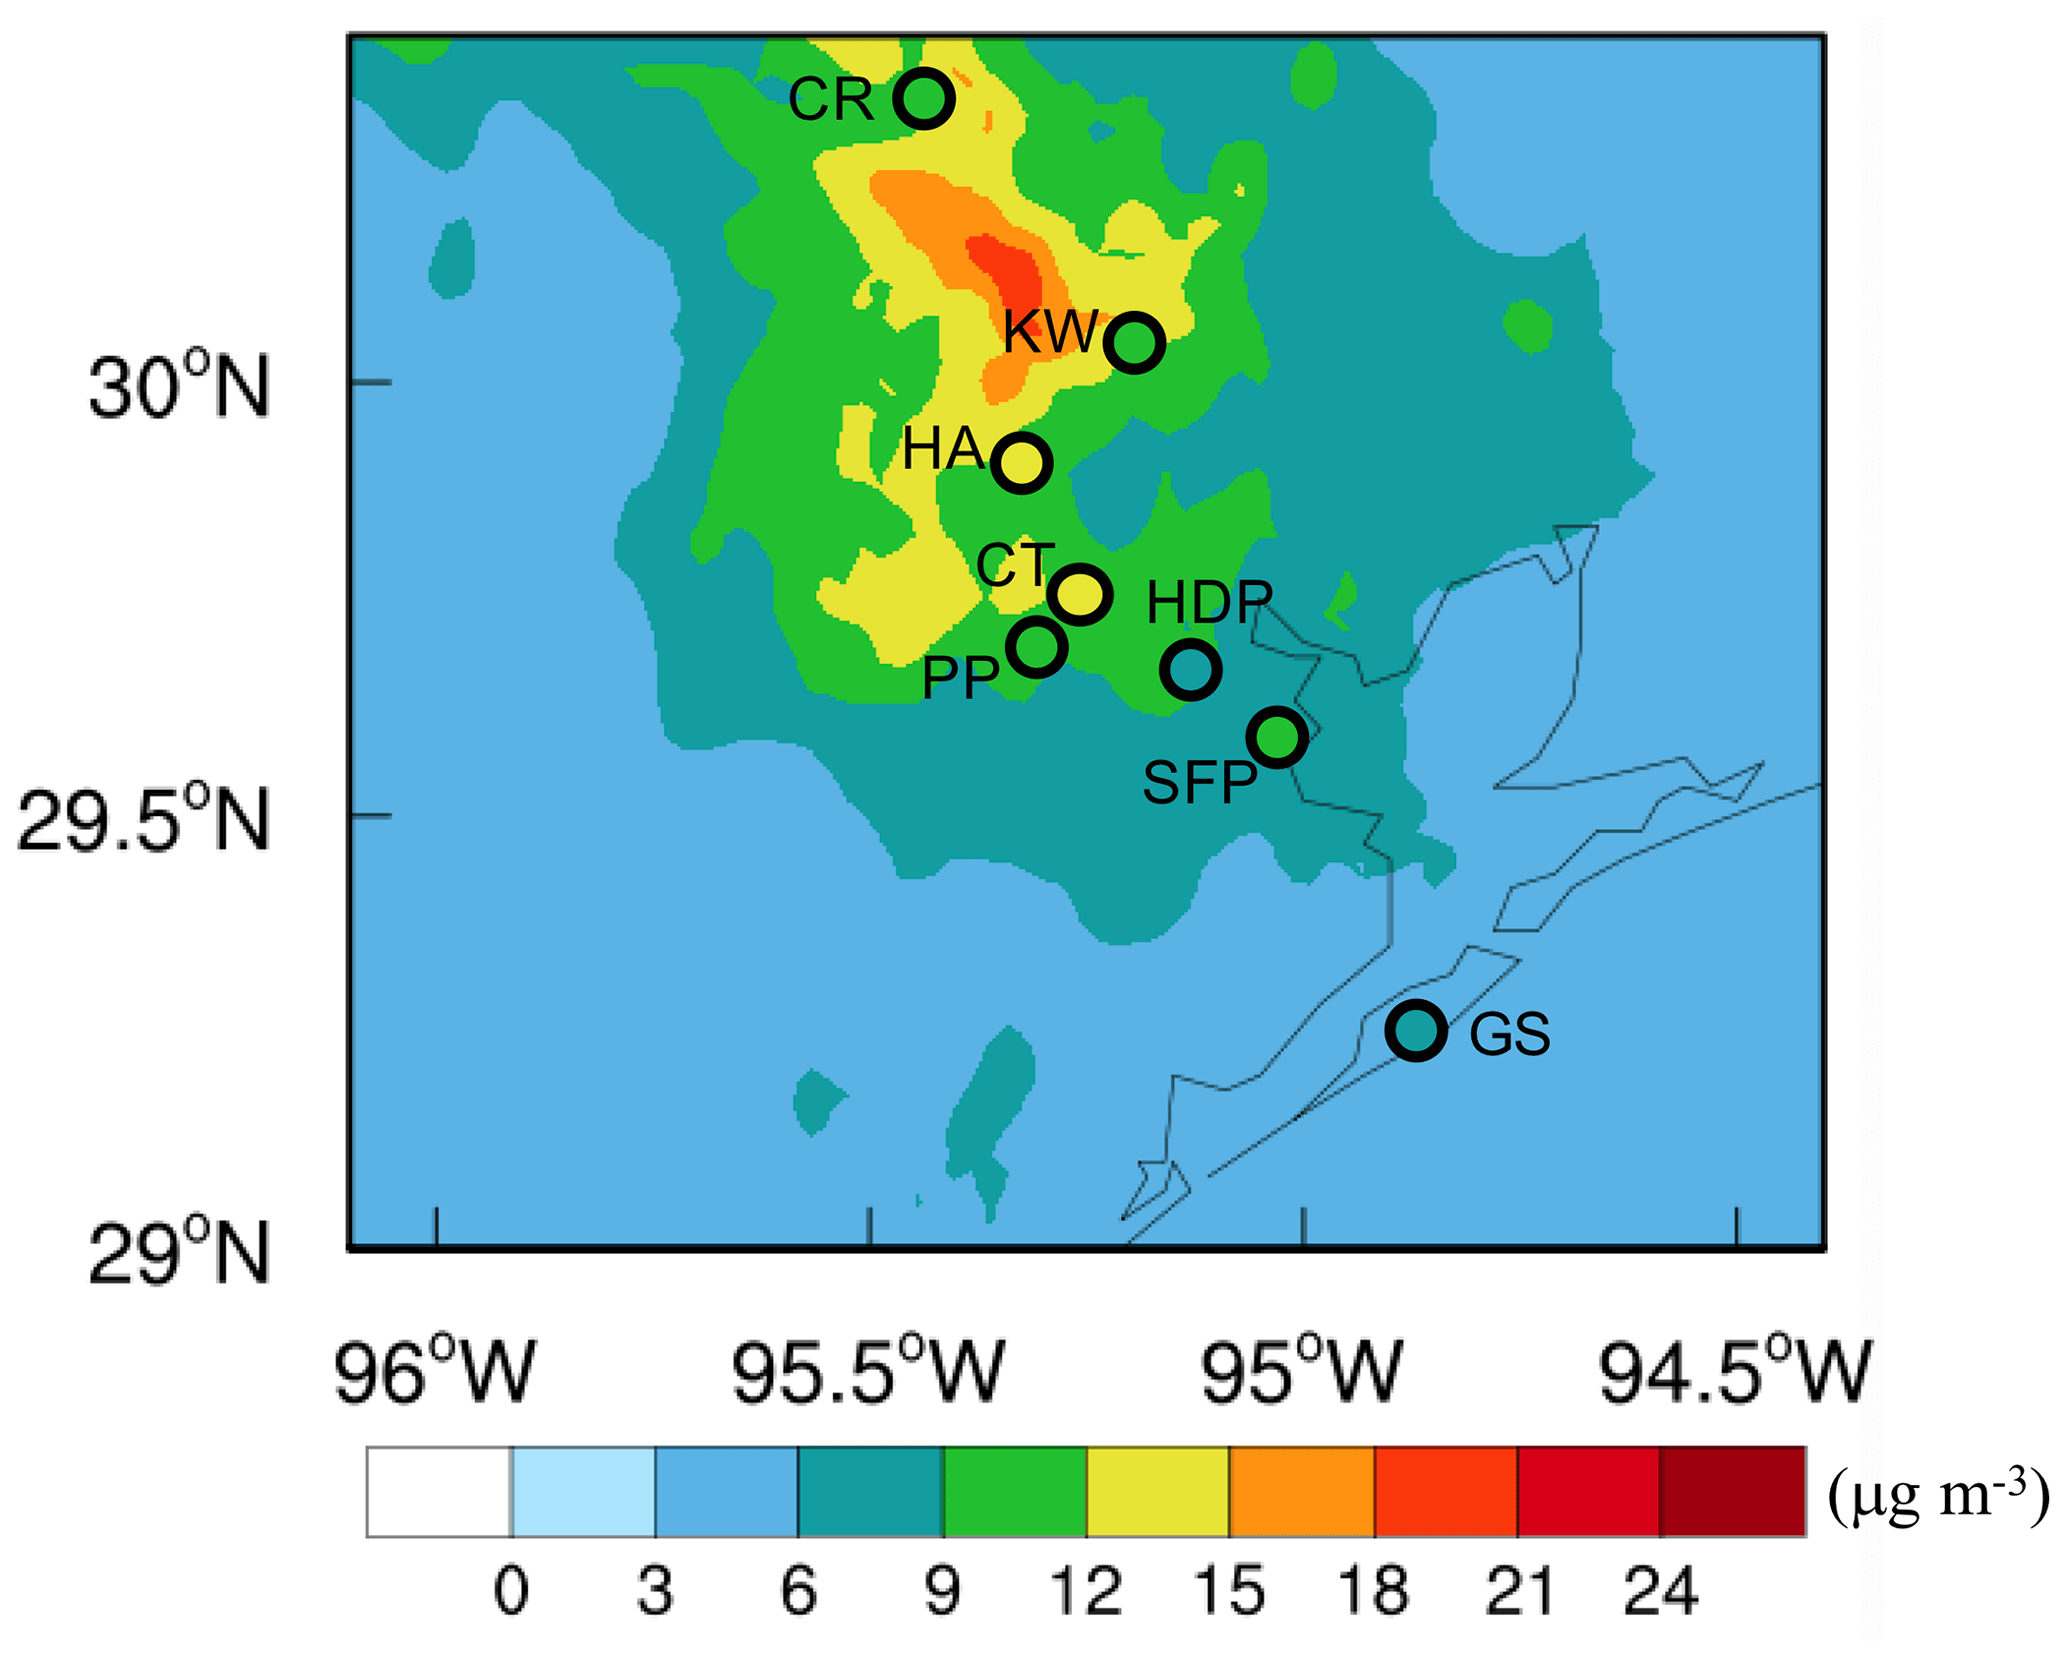
Figure 3Comparisons of 24 h averaged PM2.5 mass concentrations (unit: µg m−3) between the model simulation D1_MOR_anth (contoured) and the site observations from TCEQ (colored circles) from 18:00 UTC on 18 June 2013 to 18:00 UTC on 19 June 2013 (1 d before the convection initiation). The site names and other information are shown in Table 1.
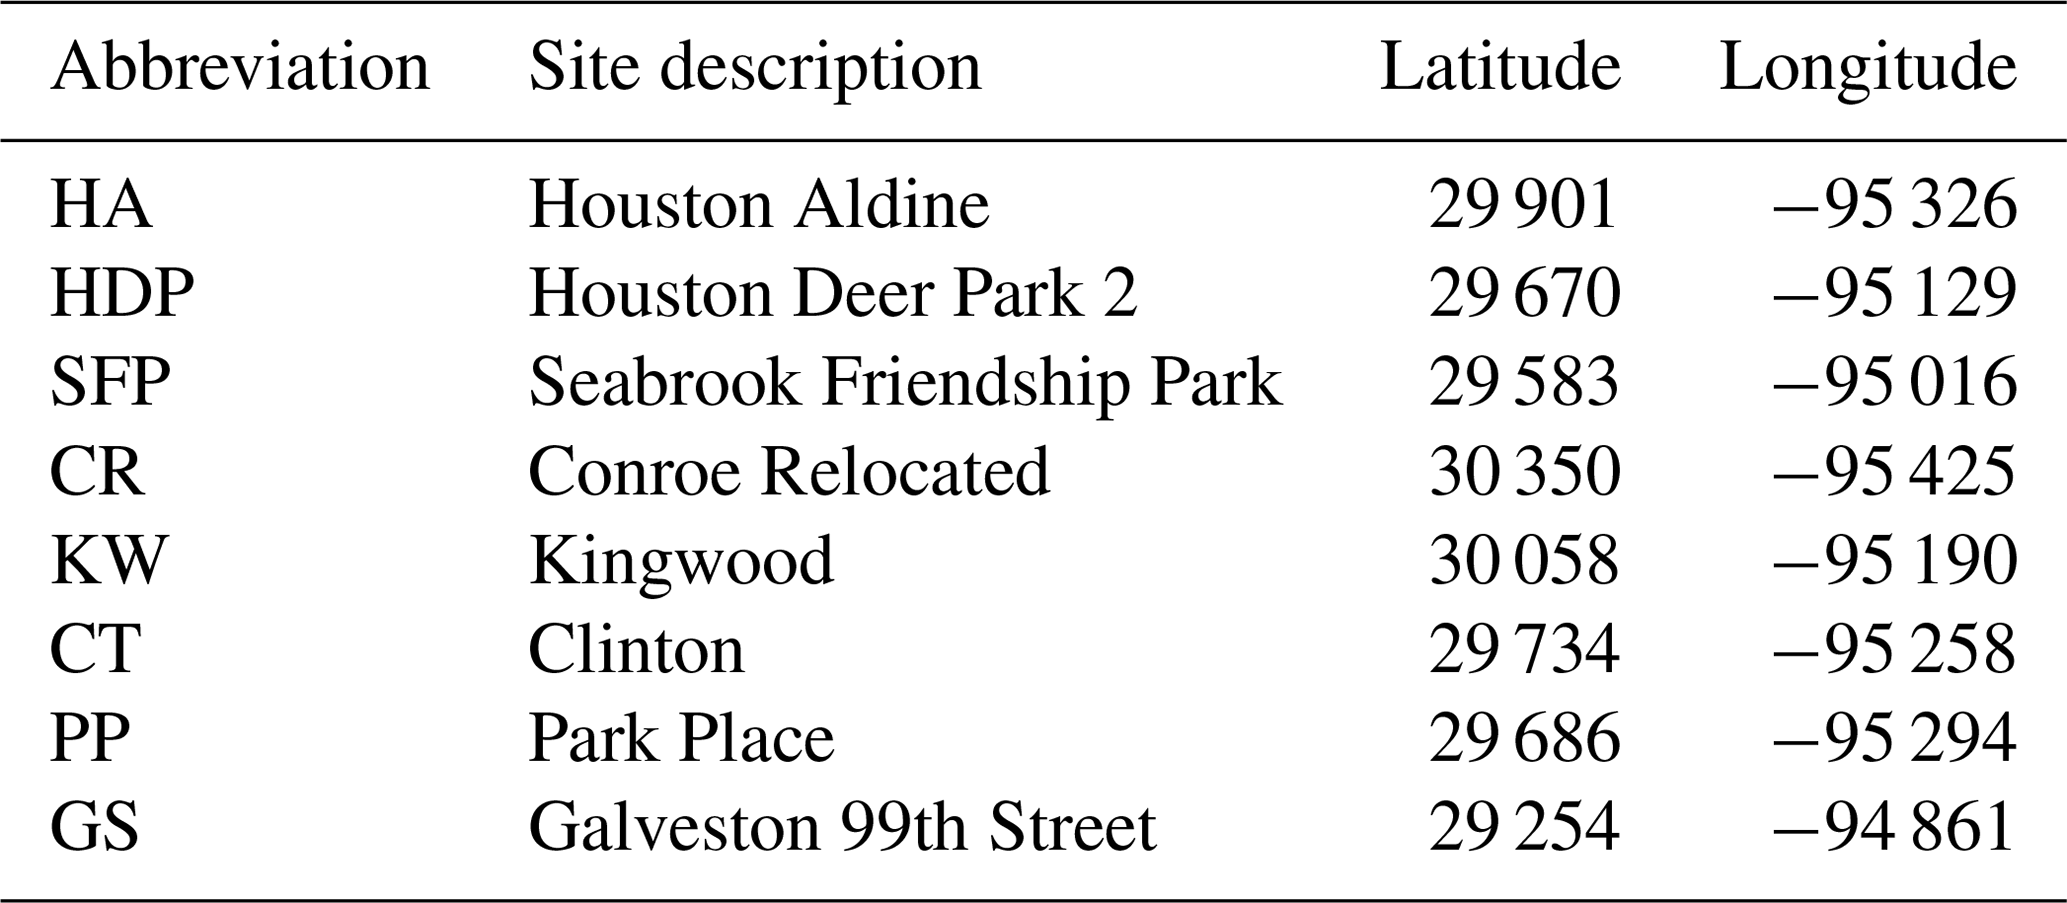
Table 1Descriptions of the PM2.5 monitoring sites over the Houston area from TCEQ.
The SBM and Morrison schemes are two completely different representations of cloud microphysics; thus, they are different in many aspects including major microphysical processes, such as aerosol activation, condensation, evaporation, collisions, and ice nucleation and ice growth through riming and aggregation. Details are read from Khain et al. (2004, 2015), Morrsion et al. (2005), and Gao et al. (2016). The calculations of aerosol activation, condensation, and evaporation in the SBM scheme are based on the Köhler theory and diffusional growth equations in light of particle size and supersaturation, respectively. In contrast, in WRF-Chem with the Morrison scheme, the Abdul-Razzak and Ghan (2002) parameterization is used for aerosol activation and the saturation adjustment method is applied for condensation and evaporation calculation. To examine the contribution of the saturation adjustment approach for condensation and evaporation to the simulated aerosol effects with the Morrison scheme, we further conducted two sensitivity tests, based on MOR_anth and MOR_noanth, by replacing the saturation adjustment approach in the Morrison scheme with the condensation and evaporation calculation based on an explicit representation of supersaturation over a time step, as described in Lebo et al. (2012). That is, the supersaturation is solved semi-analytically based on both the forcing from advection and the microphysics processes. Note in both SBM and this modified Morrison scheme, the supersaturation for condensation and evaporation is calculated after the advection. These two simulations are referred to as MOR_SS_anth and MOR_SS_noanth, respectively. To present more robust results, we carry out a small number of ensembles (three) for each case over Domain 2 (we do not have computer time to do more ensemble runs). The three ensemble runs are only different in the initialization time: 00:00, 06:00, and 12:00 UTC on 19 June. All of the simulations end at 12:00 UTC on 20 June. The analysis results for Domain 2 simulations in this study are based on the mean values of three ensemble runs, and the ensemble spread is shown as the shaded area in all profile figures.
We evaluate the aerosol and CCN properties simulated by D1_MOR_anth to ensure realistic aerosol fields, which are used for the Domain 2 simulations with anthropogenic aerosols considered. These evaluations are included in Sect. 4.1.
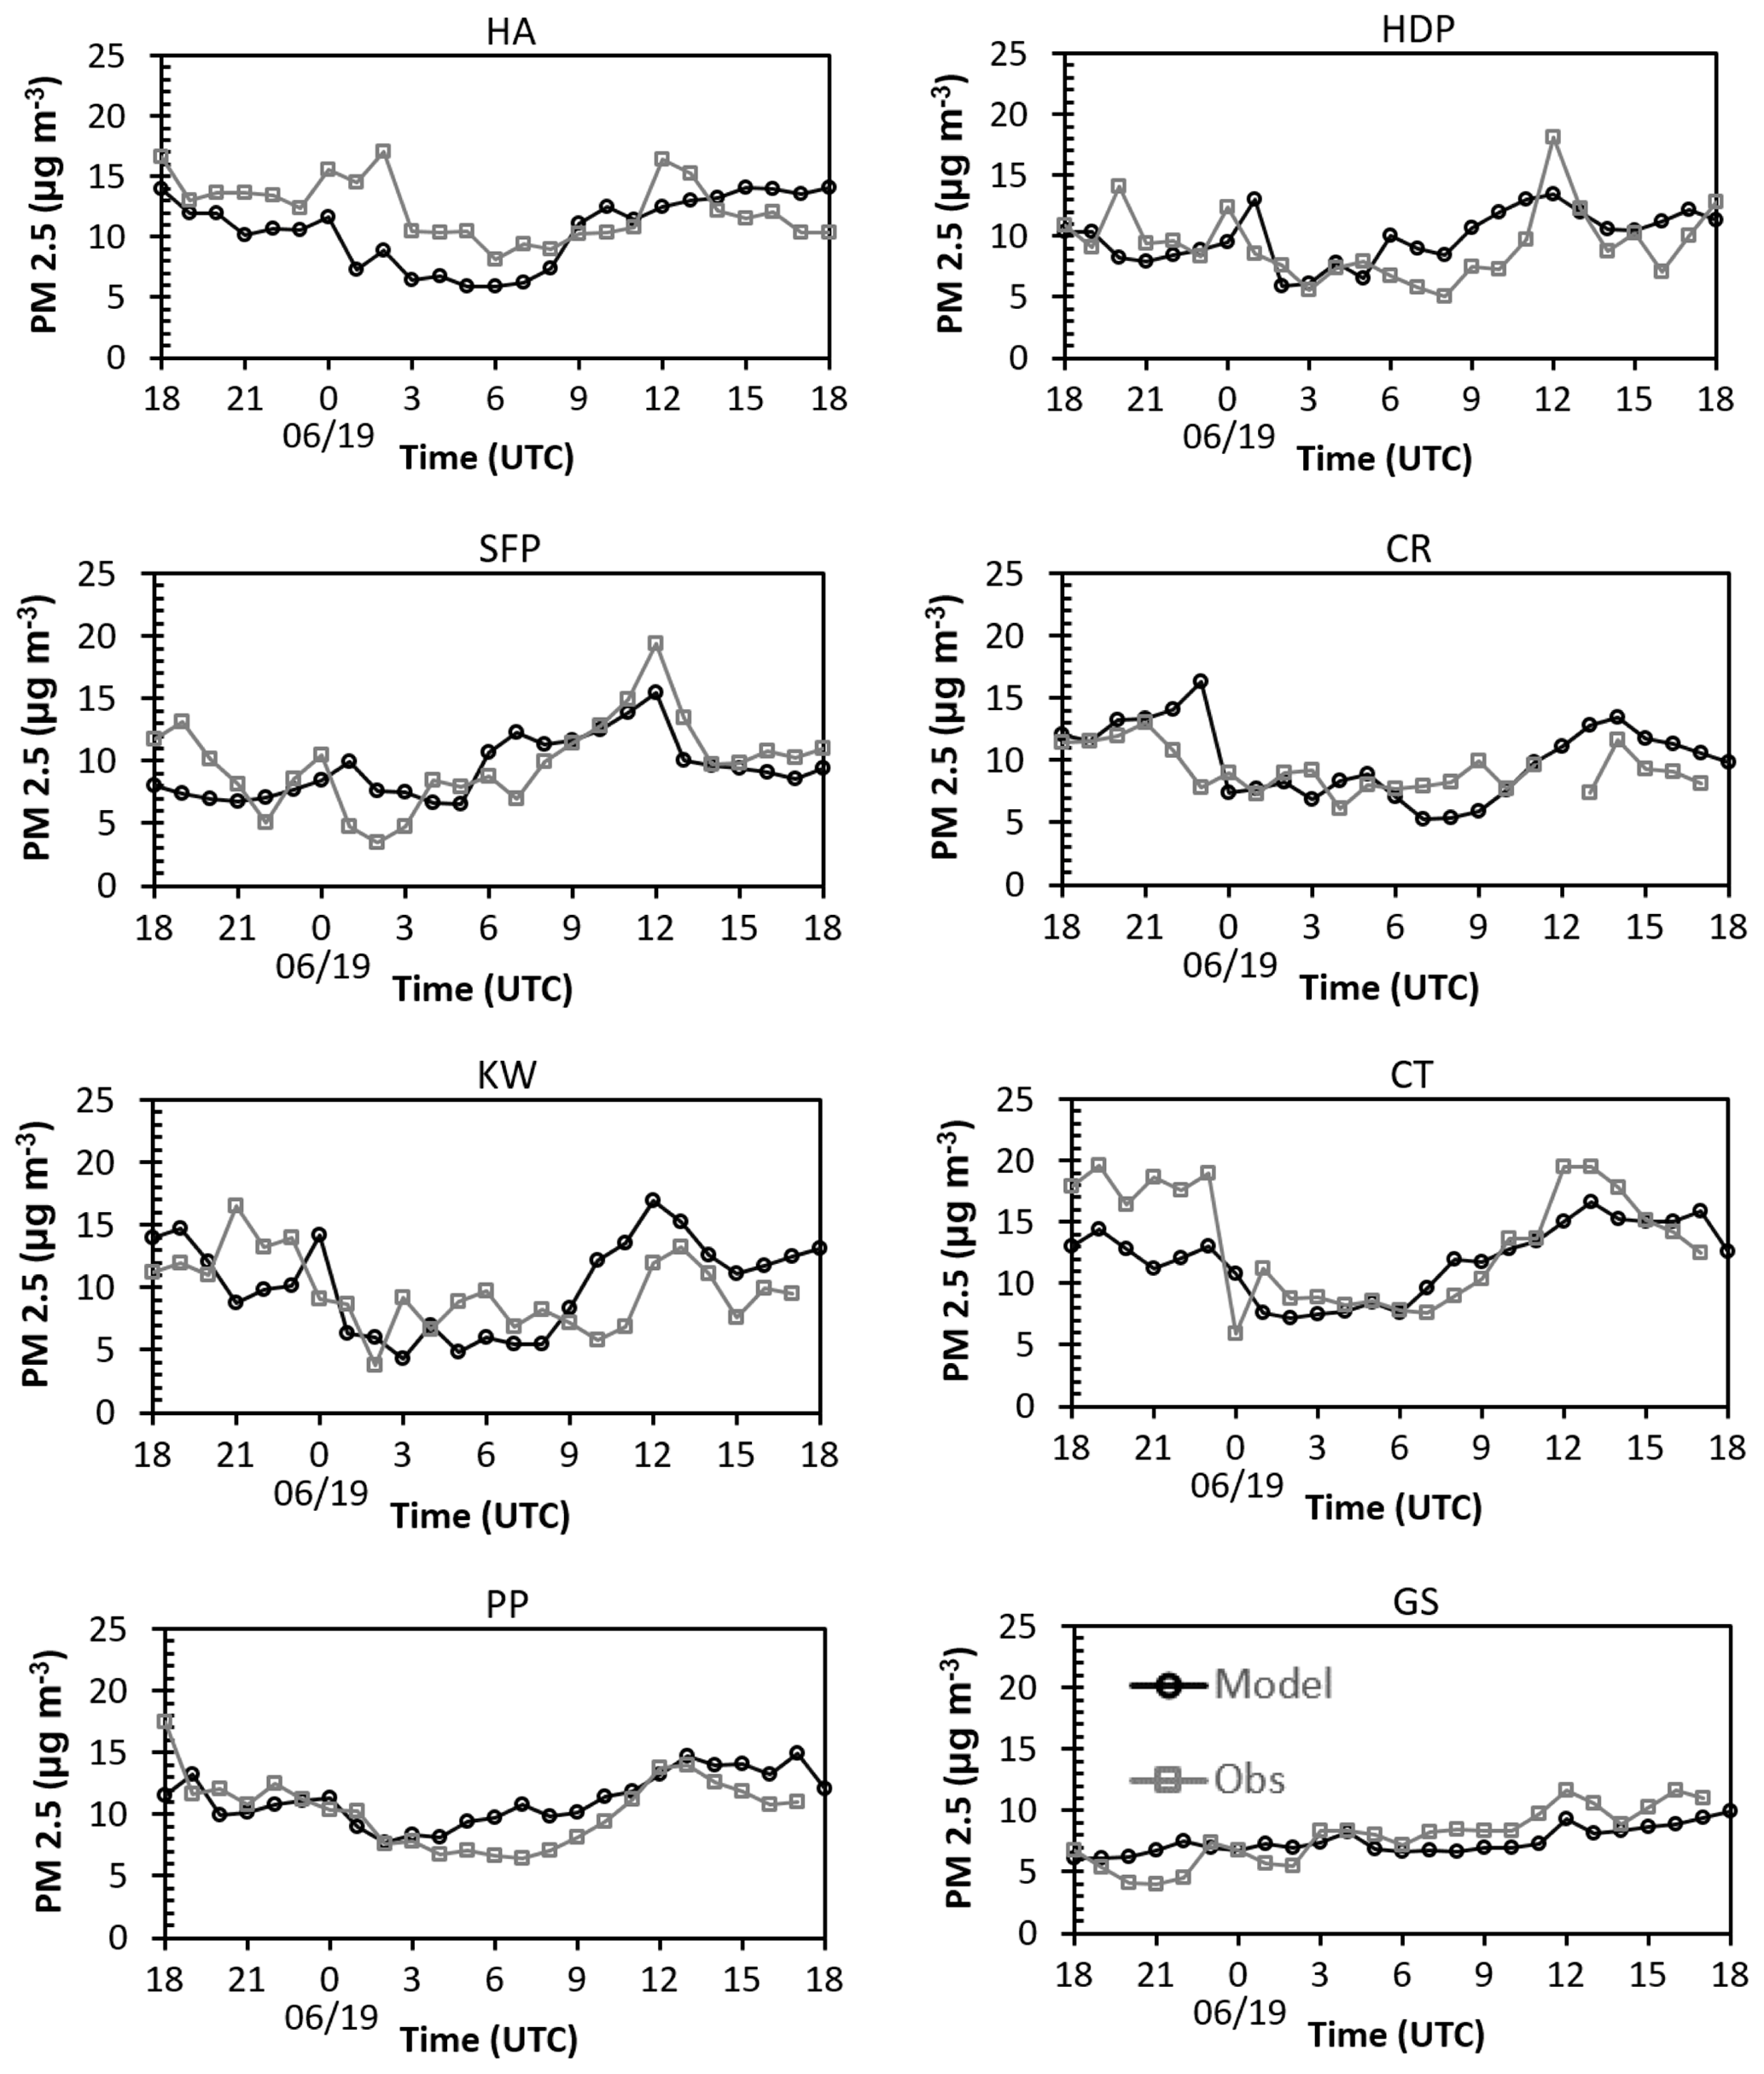
Figure 4Site-by-site comparisons of hourly PM2.5 mass concentrations (unit: µg m−3) from D1_MOR_anth and the TCEQ site observations over 24 h from 18:00 UTC on 18 June 2013 to 18:00 UTC on 19 June 2013 (1 d before the convection initiation).
From D1_MOR_anth, we see a very large spatial variability in aerosol number concentrations (Fig. 2b). There are three regions with significantly different aerosol loadings over the domain, as shown by the black boxes in Fig. 2b: (a) the Houston urban area, (b) the rural area about 100 km northeast of Houston, and (c) the Gulf of Mexico. Aerosols over the Houston urban area are mainly contributed by organic aerosols, which are highly related to industrial and ship channel emissions. The rural area aerosols are mainly from sulfate, and sea salt aerosol is the major contributor over the Gulf of Mexico. This suggests that aerosol properties are extremely heterogeneous in this region. The aerosols over Houston urban area are generally about 5 and 10 times higher than the rural and Gulf of Mexico areas, respectively (Fig. 2c). The size distributions show a three-mode distribution with the largest differences from the Aitken mode (peaks at 50 nm; Fig. 2c). These ultrafine aerosol particles are mainly contributed by anthropogenic activities (Fig. 2b, d). With the anthropogenic emissions turned off, the simulated aerosols are much lower and have much less spatial variability (Fig. 2d).
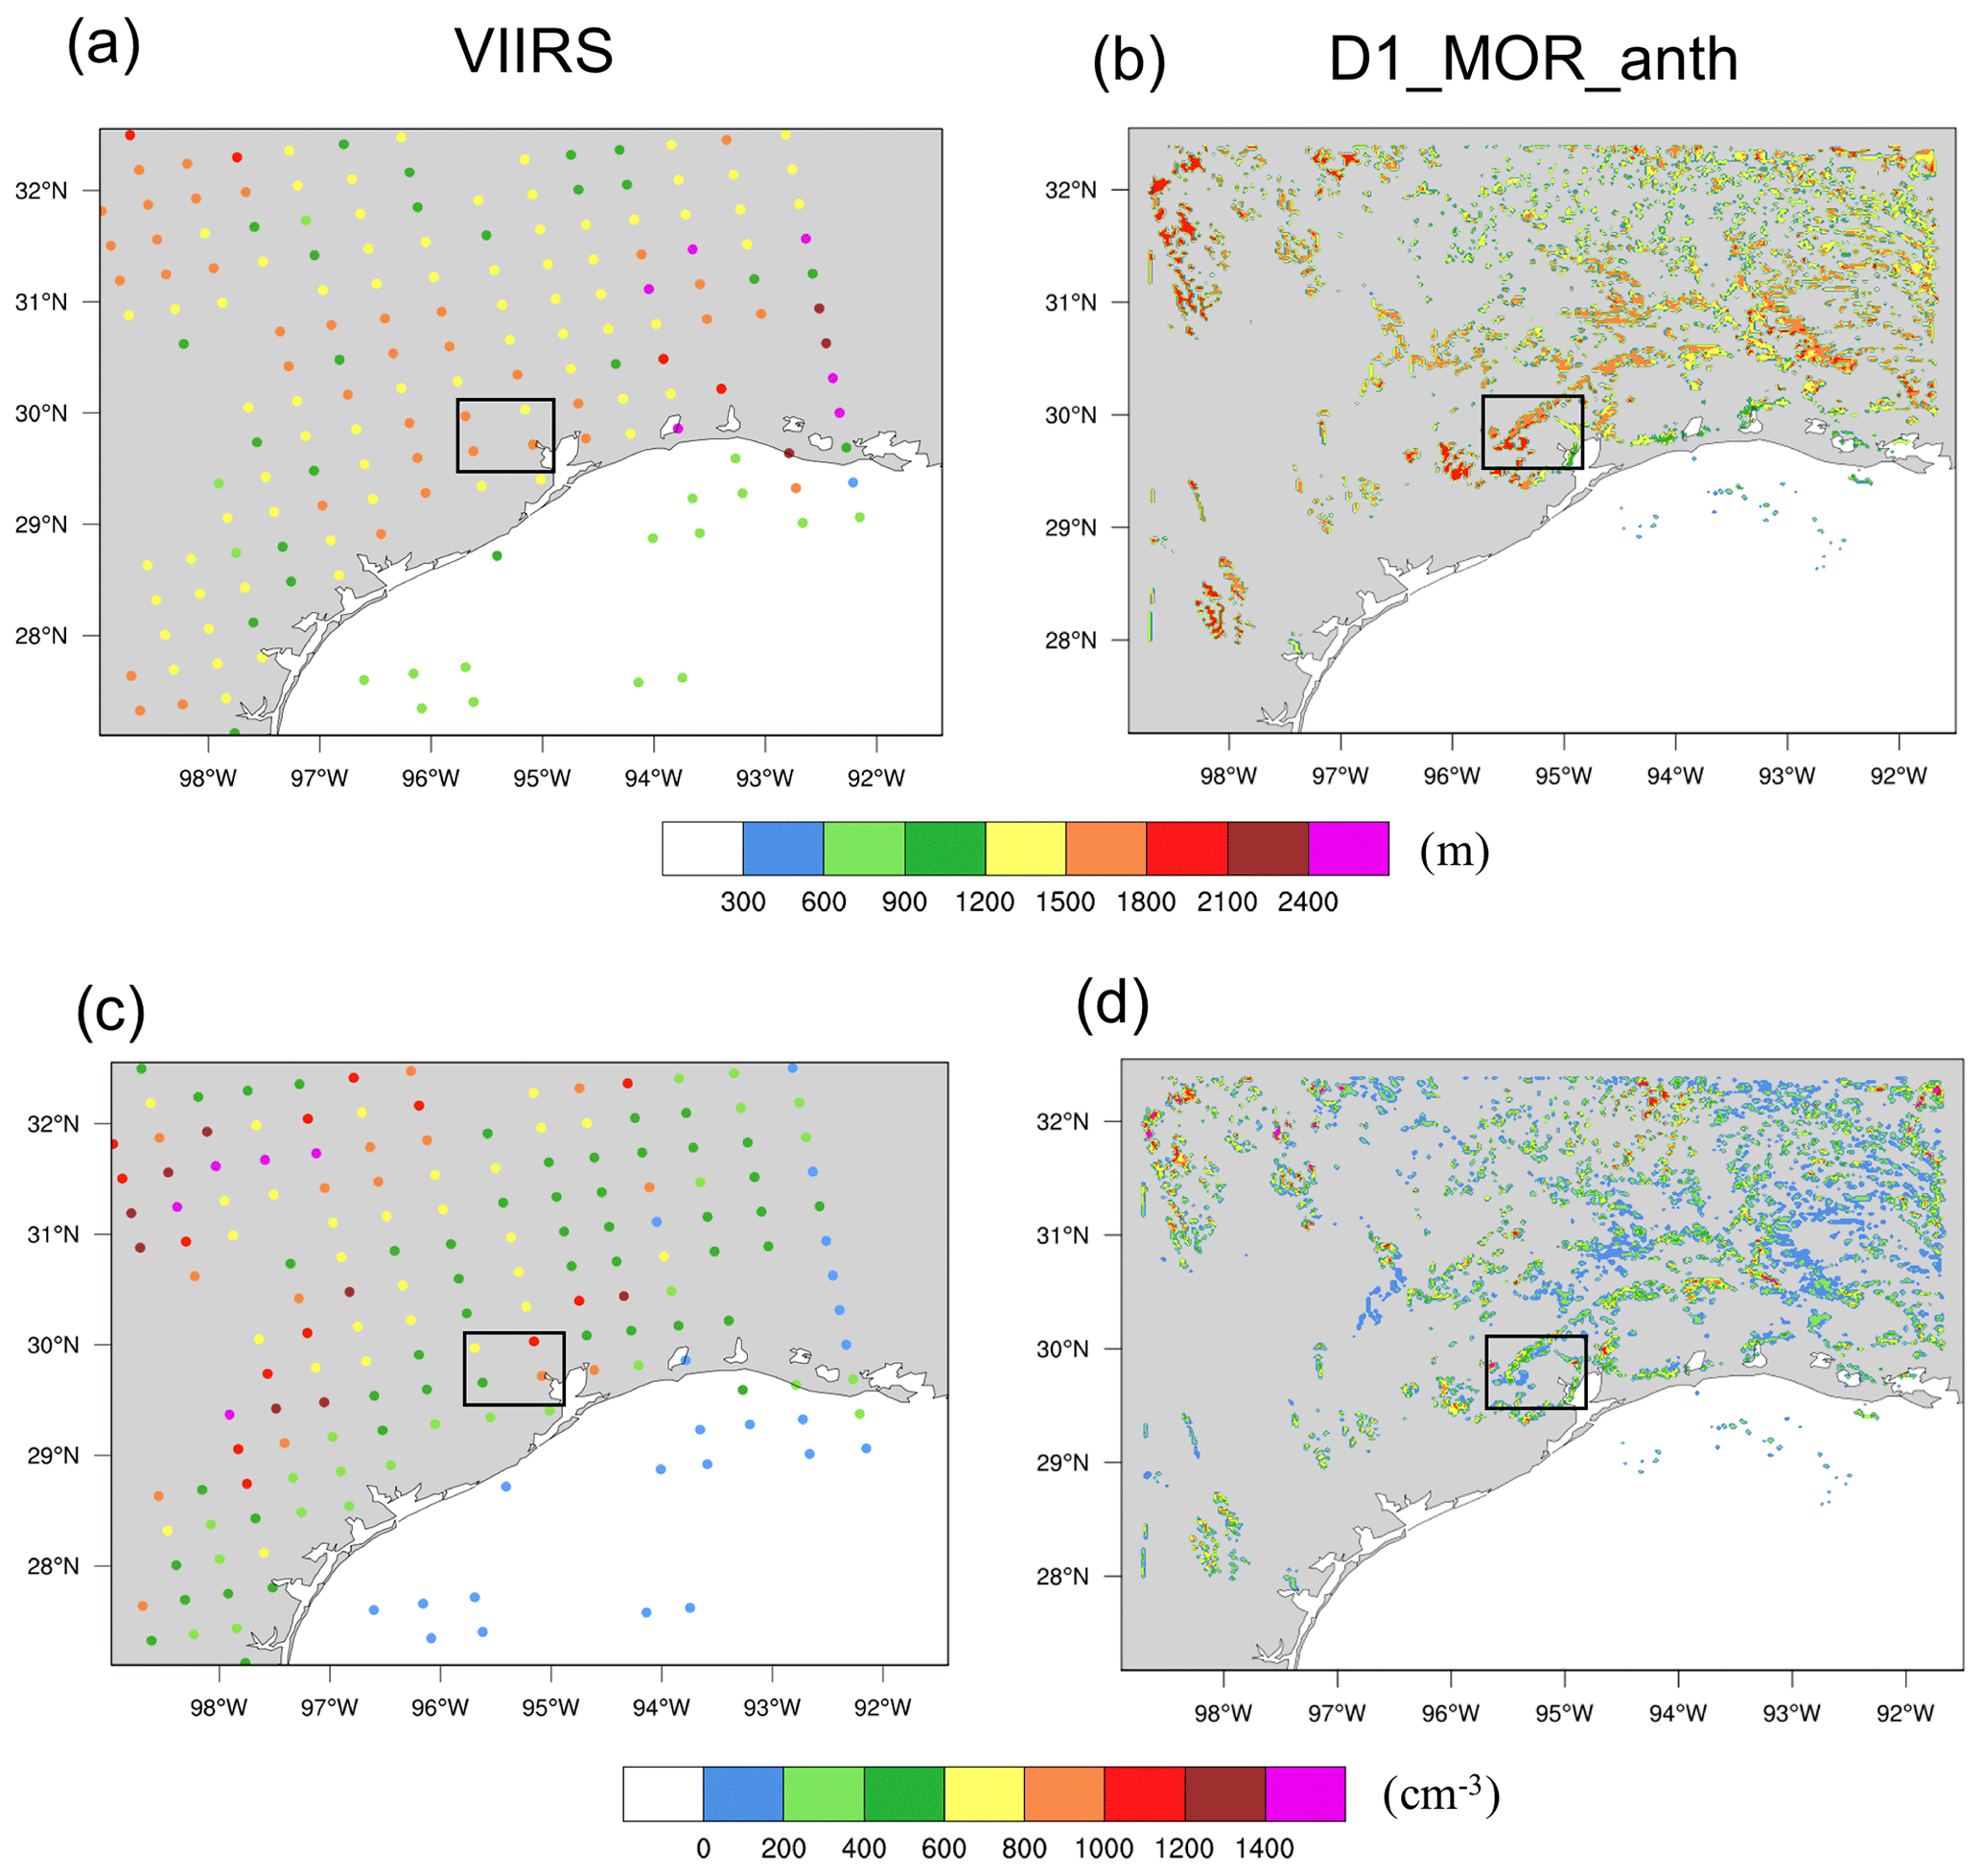
Figure 5Evaluation of (a, b) cloud base heights (unit: m) and the (c, d) CCN number concentration at cloud base (unit: cm−3) from the VIIRS satellite (a, c) retrieved at 19:43 UTC (Rosenfeld et al., 2016) and model simulation D1_MOR_anth (b, d) at 20:00 UTC on 19 June 2013. The Houston area is marked using the black box. The satellite-retrieved cloud base height was calculated from the difference between reanalysis surface air temperature (from reanalysis data) and VIIRS-measured cloud base temperature (warmest cloudy pixel) divided by the dry adiabatic lapse rate, whereas modeled cloud base height was determined by the lowest cloud layer with a cloud mass mixing ratio greater than 10−5 kg kg−1.
4.1 Model evaluation
We first show the evaluation of the aerosol and CCN properties simulated by D1_MOR_anth; this simulation runs over Domain 1, which is much larger than Domain 2. As described in Table 1, there are eight PM monitoring sites from TCEQ around the Houston area. Surface PM2.5 shows high concentrations in Houston and its downwind regions (Fig. 3). D1_MOR_anth shows a similar spatial pattern to the observations in terms of the surface PM2.5 averaged over 24 h (the day before the convection near Houston), although it has difficulty reproducing the values for some sites. The hourly variations in ground-level PM2.5 concentrations from both observations and D1_MOR_anth for these sites on the day before the convective initiation are depicted in Fig. 4. Generally, the simulated hourly pattern agrees with the observations for eight stations. D1_MOR_anth reproduces the diurnal variations, especially the increasing trend from 12:00 to 18:00 UTC on 19 June prior to the initiation of deep convective cells over the Houston and Galveston Bay areas.
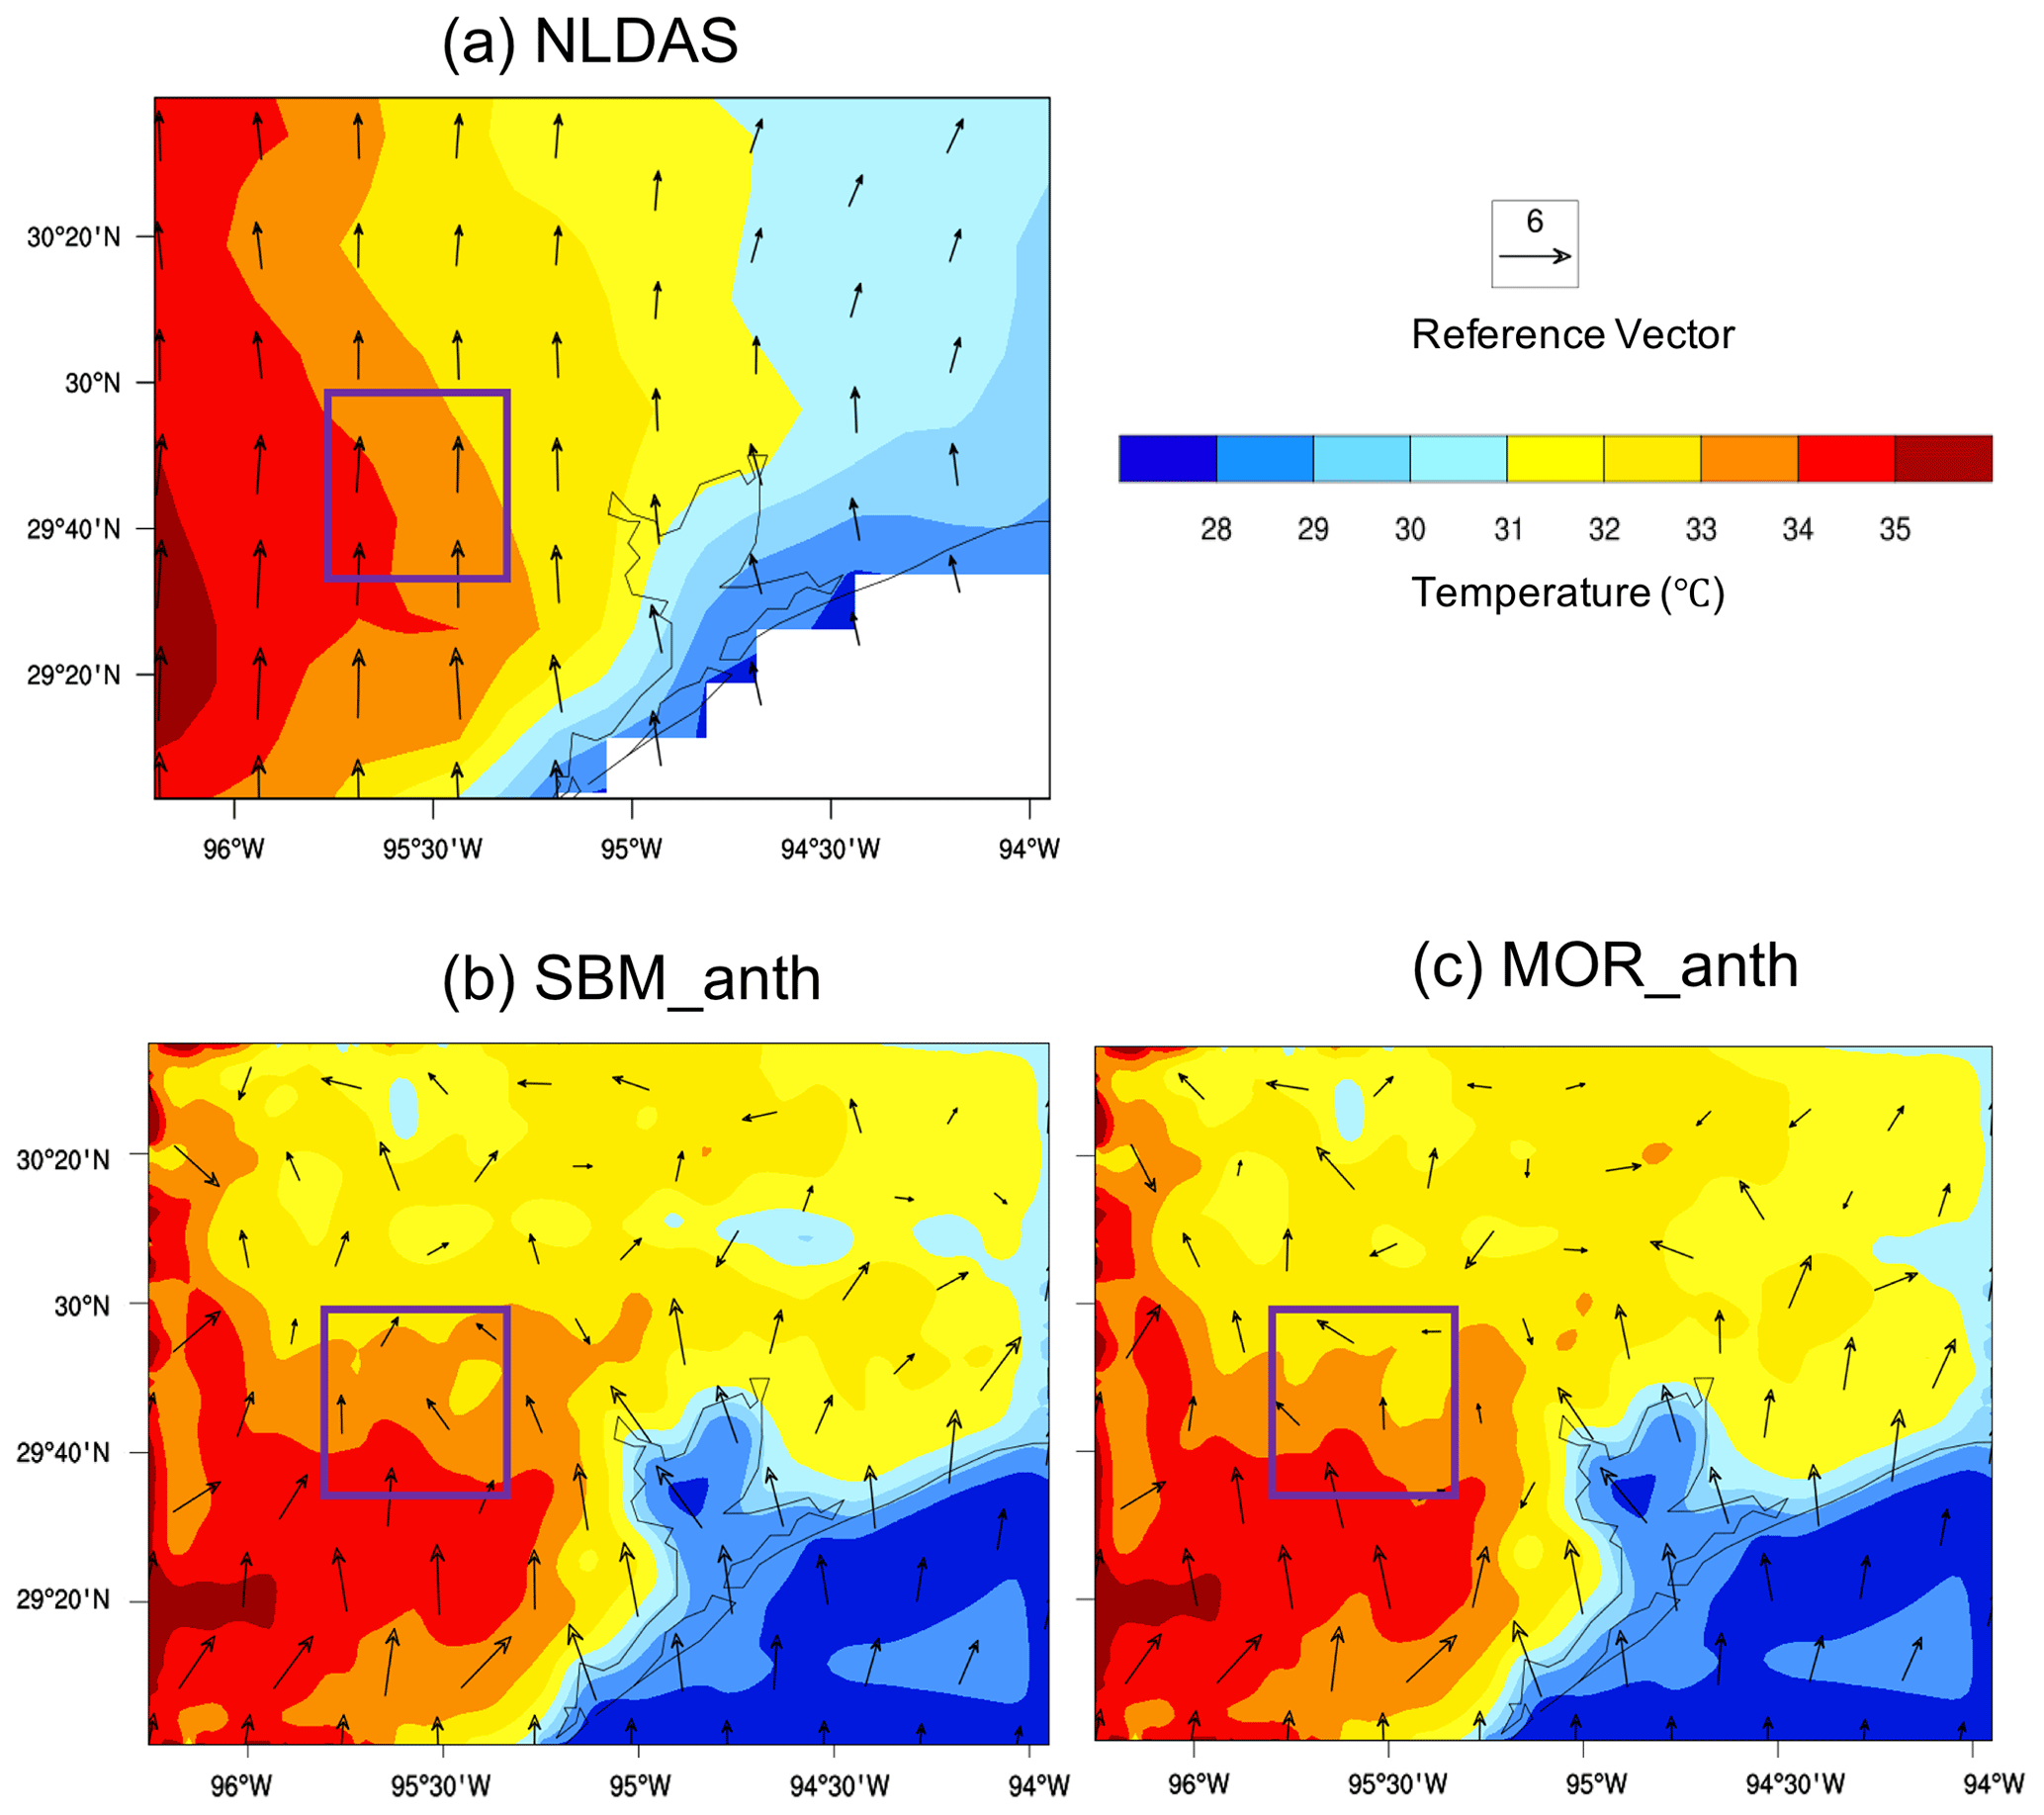
Figure 6The 2 m Temperature (shaded; unit: ∘) and 10 m winds (vectors; unit: m s−1) from (a) NLDAS, (b) SBM_anth, and (c) MOR_anth at 18:00 UTC on 19 June 2013. The purple box denotes the Houston area.
The evaluation of the cloud base heights and CCN at cloud bases at the warm cloud stage before transitioning to deep clouds (20:00 UTC) is shown in Fig. 5. Over Houston and its surrounding area (black box in Fig. 5), the simulated cloud base heights are about 1.5–2 km and are in agreement with the retrieved values from VIIRS satellite data, which are around 1.2–1.8 km (Fig. 5a, b). The retrieved CCN concentrations at cloud bases vary significantly over the domain, and this spatial variability is generally captured by the model (Fig. 5c, d). For example, D1_MOR_anth simulates some high CCN concentrations (400–800 cm−3 with some above 1000 cm−3) over Houston and around the bay area, relatively low CCN values in the rural areas (about 200–600 cm−3), and very low values over the Gulf of Mexico (less than 200 cm−3), as shown in Fig. 5d. This is consistent with the spatial variability from the retrievals (Fig. 5c). The evaluation of aerosol properties before the initiation of Houston convective cells and CCN at the warm cloud stage before transitioning to deep clouds provides us with confidence with respect to using the chemical and aerosol fields from Domain 1 outputs to feed Domain 2 simulations.
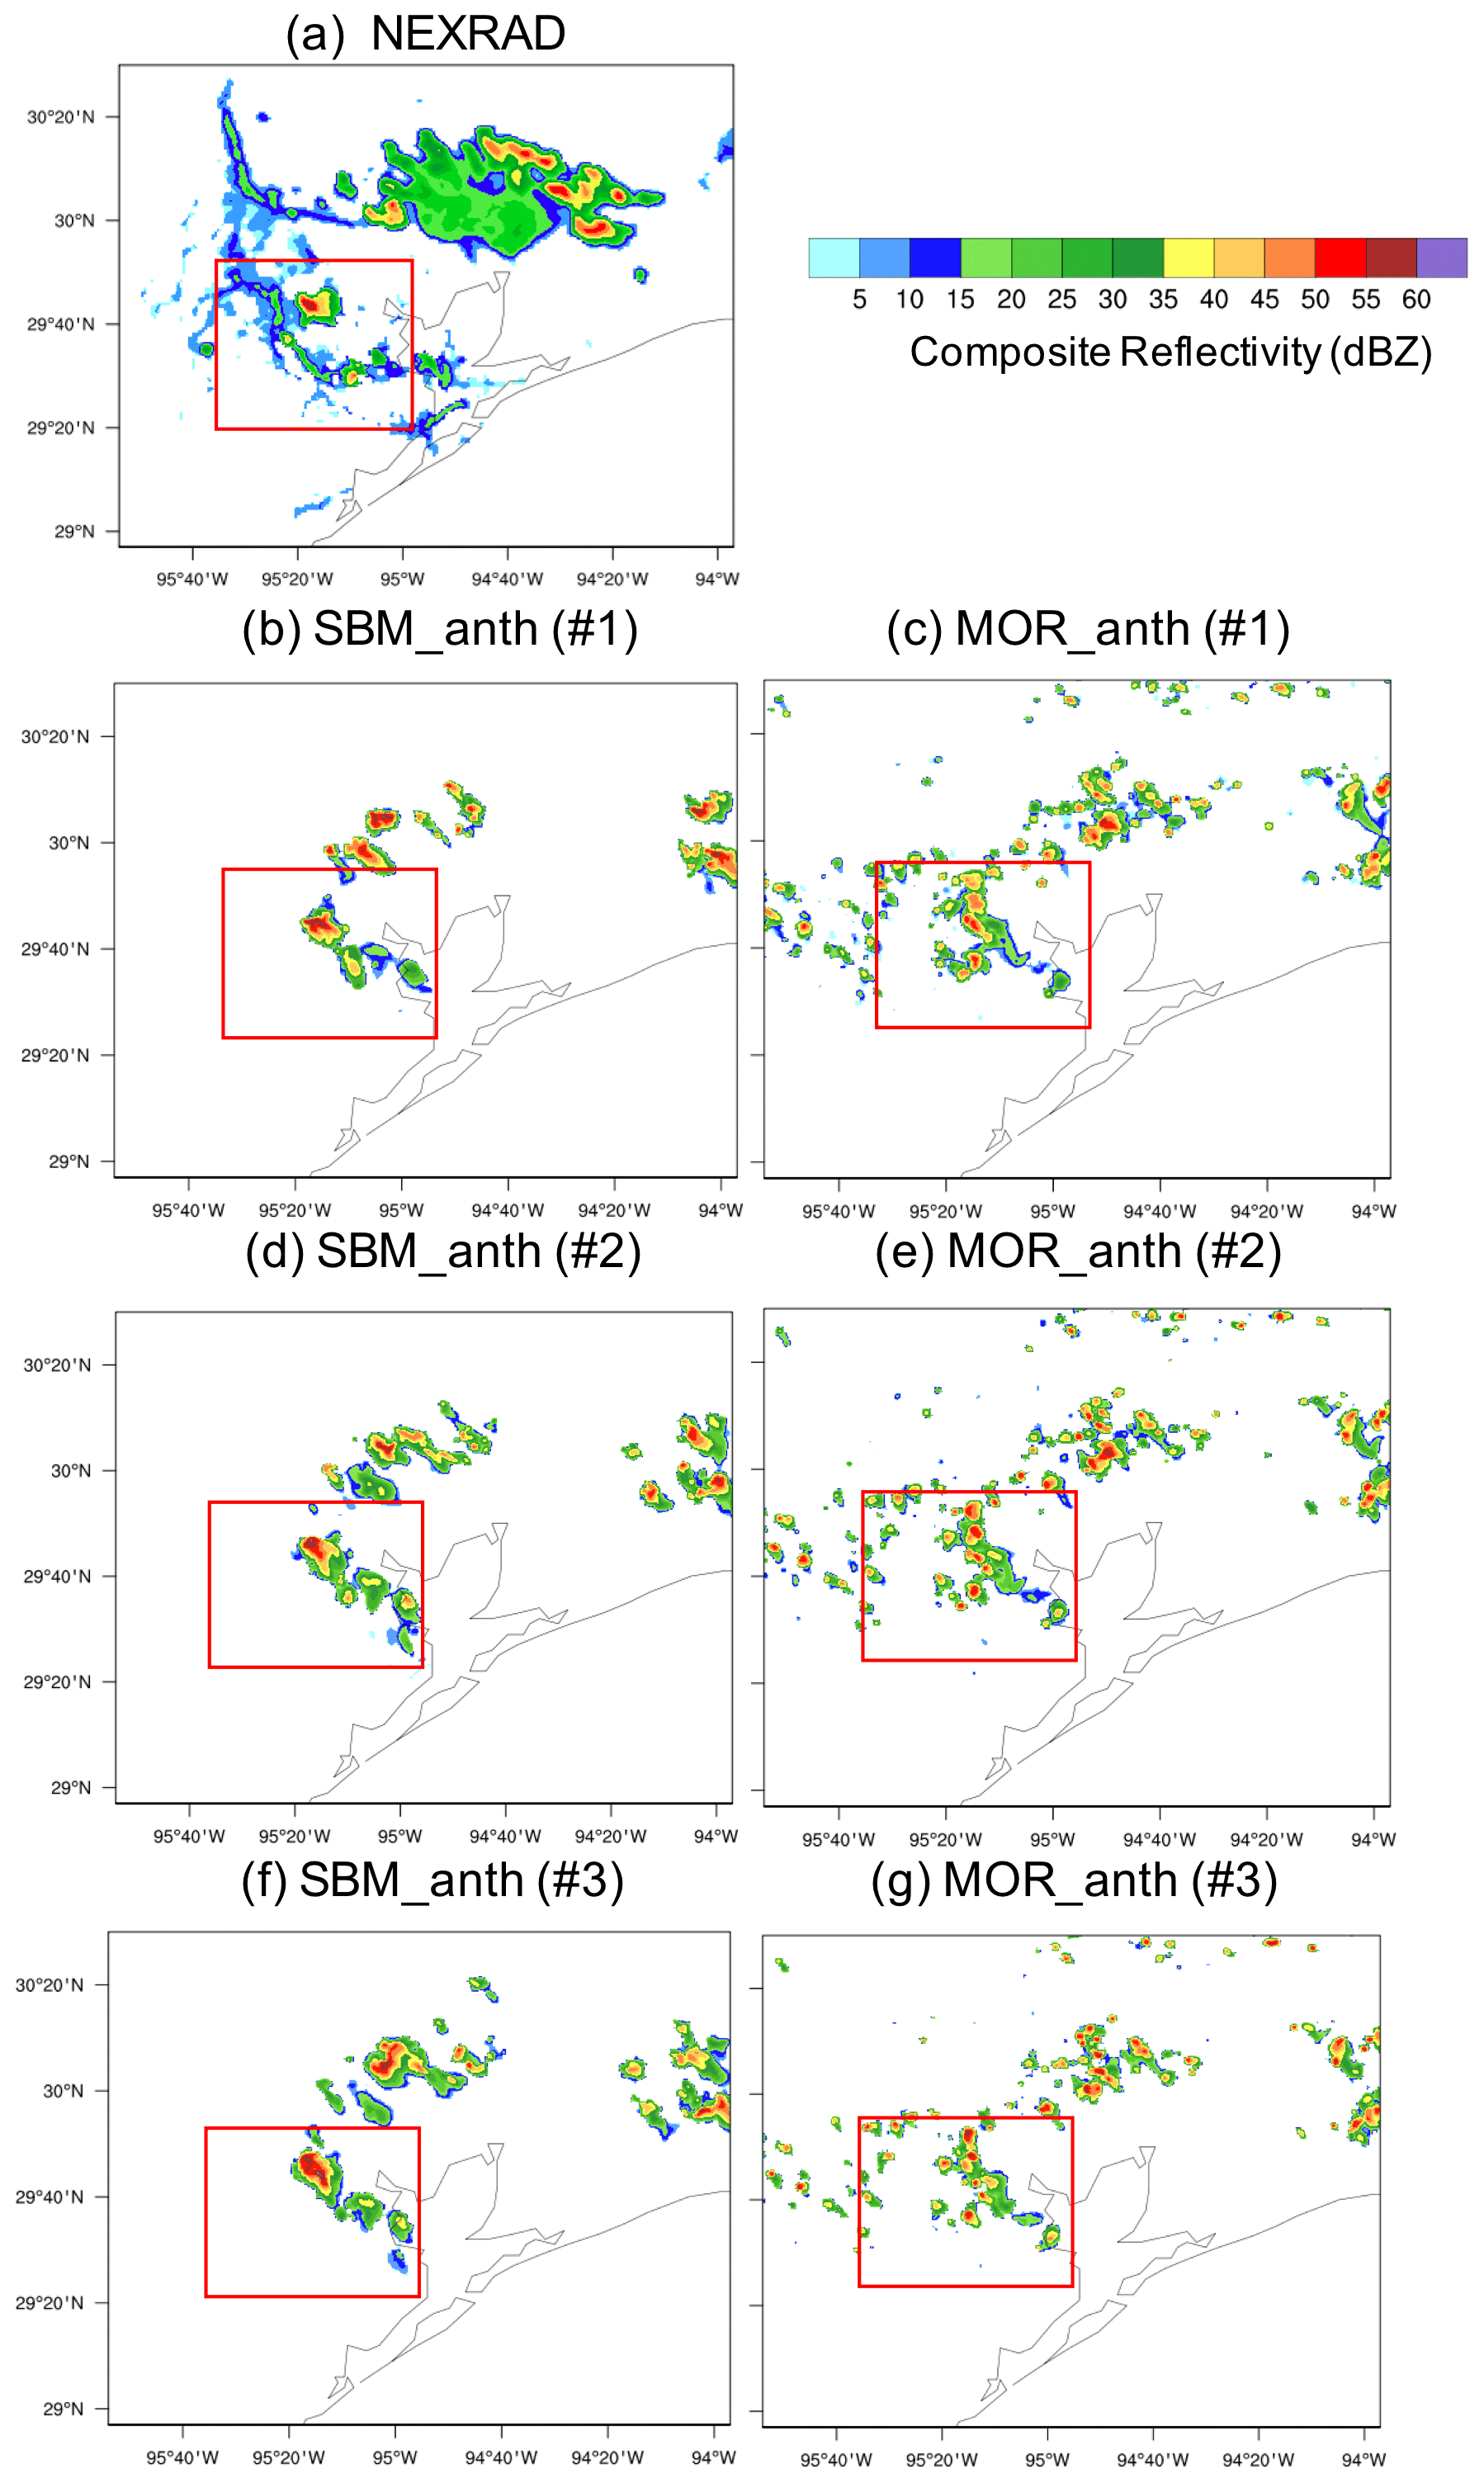
Figure 7Composite reflectivity (unit: dBZ) from (a) NEXRAD (22:17 UTC), (b, d, f) three ensemble runs for SBM_anth (21:40 UTC), and (c, e, g) three ensemble runs for MOR_anth (21:25 UTC) when maximum reflectivity in Houston is observed on 19 June 2013. The red box is the study area for convection cells near Houston.
Next, we evaluate the near-surface temperature and winds, reflectivity, and precipitation simulated by SBM_anth and MOR_anth. Figure 6 shows the comparisons for 2 m temperature and 10 m winds at 18:00 UTC (before the convective initiation). Compared with the coarse-resolution NLDAS data, both SBM_anth and MOR_anth capture the general temperature pattern with a small overestimation in the northeastern part of the domain (mainly rural area). The modeled southerly winds do not reach further north than the NLDAS data, possibly because of the feedback of the small-scale features that are simulated with the high-resolution to mesoscale circulations. However, the simulation of temperature over Houston and sea breezes from the Gulf of Mexico to Houston is the most important factor in this case. SBM_anth predicts a slightly higher temperature than MOR_anth in the northern part of the Houston region (purple box in Fig. 6), which shows better agreement with NLDAS. SBM_anth gets similar southerly winds from the Gulf of Mexico to Houston, as shown in NLDAS, whereas the southerly winds from the Gulf of Mexico become very weak or disappear prior to reaching Houston in MOR_anth.
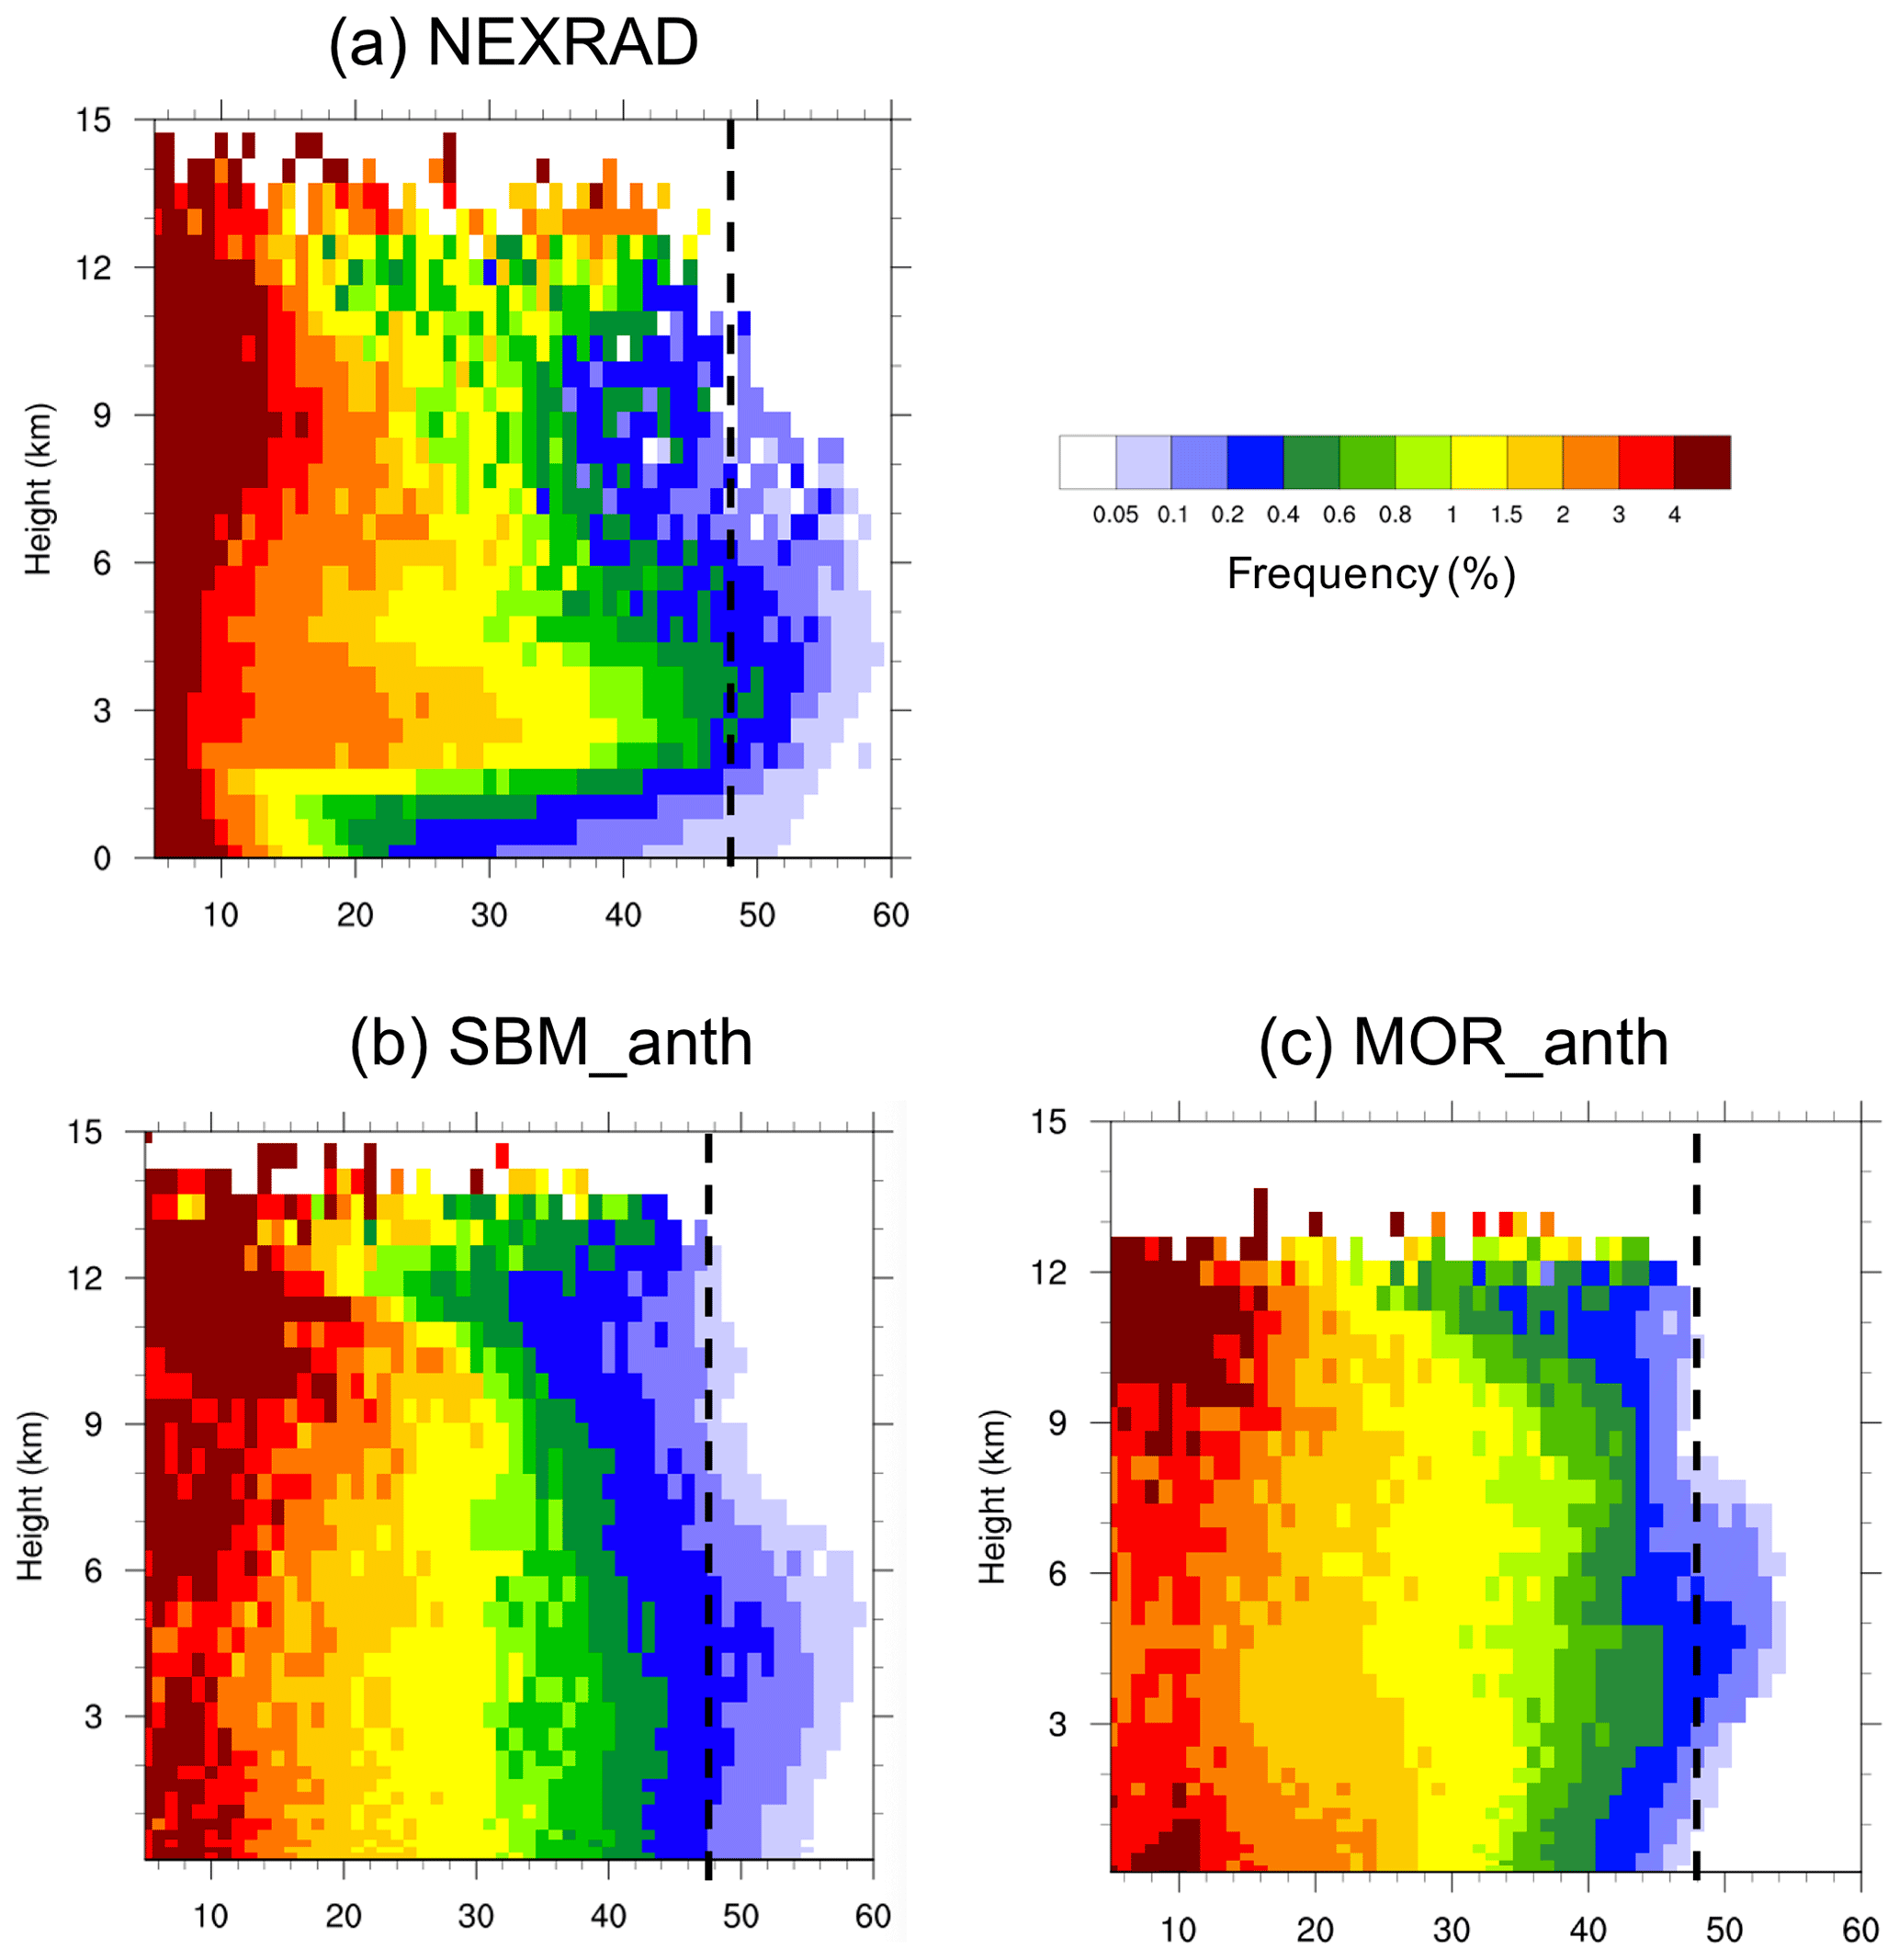
Figure 8The CFAD of reflectivity (unit: dBZ) for values larger than 0 dBZ from (a) NEXRAD, (b) SBM_anth, and (c) MOR_anth over the study area (red box in Fig. 7) from 18:00 UTC on 19 June to 00:00 UTC on 20 June 2013. The black solid lines denote the reflectivity with a value of 48 dBZ. The results are the three ensemble means.

Figure 9(a) Time series of the averaged surface rain rate (unit: mm h−1) and (b) probability density functions (PDFs) of the rain rate for values larger than 0.25 mm h−1 over the study area (red box in Fig. 7) from observations (gray), from SBM_anth and SBM_noanth (red), and from MOR_anth and MOR_noanth (blue) from 18:00 UTC on 19 June 2013 to 00:00 UTC on 20 June 2013. The observed precipitation rate is obtained by the NEXRAD-retrieved rain rate. Both observational and model data are at a frequency of every 5 min. The results are the three ensemble means. The shaded areas mark the spread of the ensemble members.
Regarding the Houston convective cell that we focused on (red box in Fig. 7a), SBM_anth simulates it well at the locations with high reflectivity values (greater than 50 dBZ) in agreement with the NEXRAD observations (Fig. 7a, b, d, f). The simulated composite reflectivities (i.e., the column maximum) are up to 55–60 dBZ from all three ensemble members, which is consistent with NEXRAD. With the Morrison scheme, MOR_anth simulates several small convective cells near Houston with a maximum reflectivity of 55 dBZ or less (Fig. 7c, e, g). All three ensemble members consistently show smaller but more scattered convective cells with the Morrison scheme compared with SBM. The contoured frequency by altitude diagram (CFAD) plots for the entire storm period show that SBM_anth is in better agreement with observations than MOR_anth, especially for the vertical structure of the high-reflectivity range (greater than 48 dBZ, black dashed lines in Fig. 8) and echo top heights, which can reach up to 14–15 km (Fig. 8a, b). MOR_anth overestimates the occurrence frequencies of the 35–45 dBZ range and underestimates those of the low- and high-reflectivity ranges (less than 15 dBZ or larger than 50 dBZ) as well as the echo top heights (1–2 km lower than SBM_anth; Fig. 8c).
For the precipitation rates averaged over the study area (red box in Fig. 7), the observations show two peaks, which are captured by both SBM_anth and MOR_anth (Fig. 9a). However, the timing for the first peak is about 30 and 60 min earlier in SBM_anth and MOR_anth, respectively, than in the observations. Moreover, SBM_anth predicts rain rate intensities at the two peak times that are more consistent with the observations, whereas MOR_anth underestimates the rain rate intensity at the second peak time (Fig. 9a). The large precipitation rates (greater than 15 mm h−1) in SBM_anth has a ∼ 1.5 times larger occurrence probability than those in MOR_anth, showing a better agreement with the observations (Fig. 9b). The observed accumulated rain over the time period shown in Fig. 9a is about 3.8 mm, and both SBM_anth (∼ 4.5 mm) and MOR_anth (∼ 4.2 mm) overestimate the accumulated precipitation due to the longer rain period compared with the observations. Overall, based on comparison with the observations, the performance of SBM_anth is superior to MOR_anth in simulating the location and intensity of the convective storm and associated precipitation.
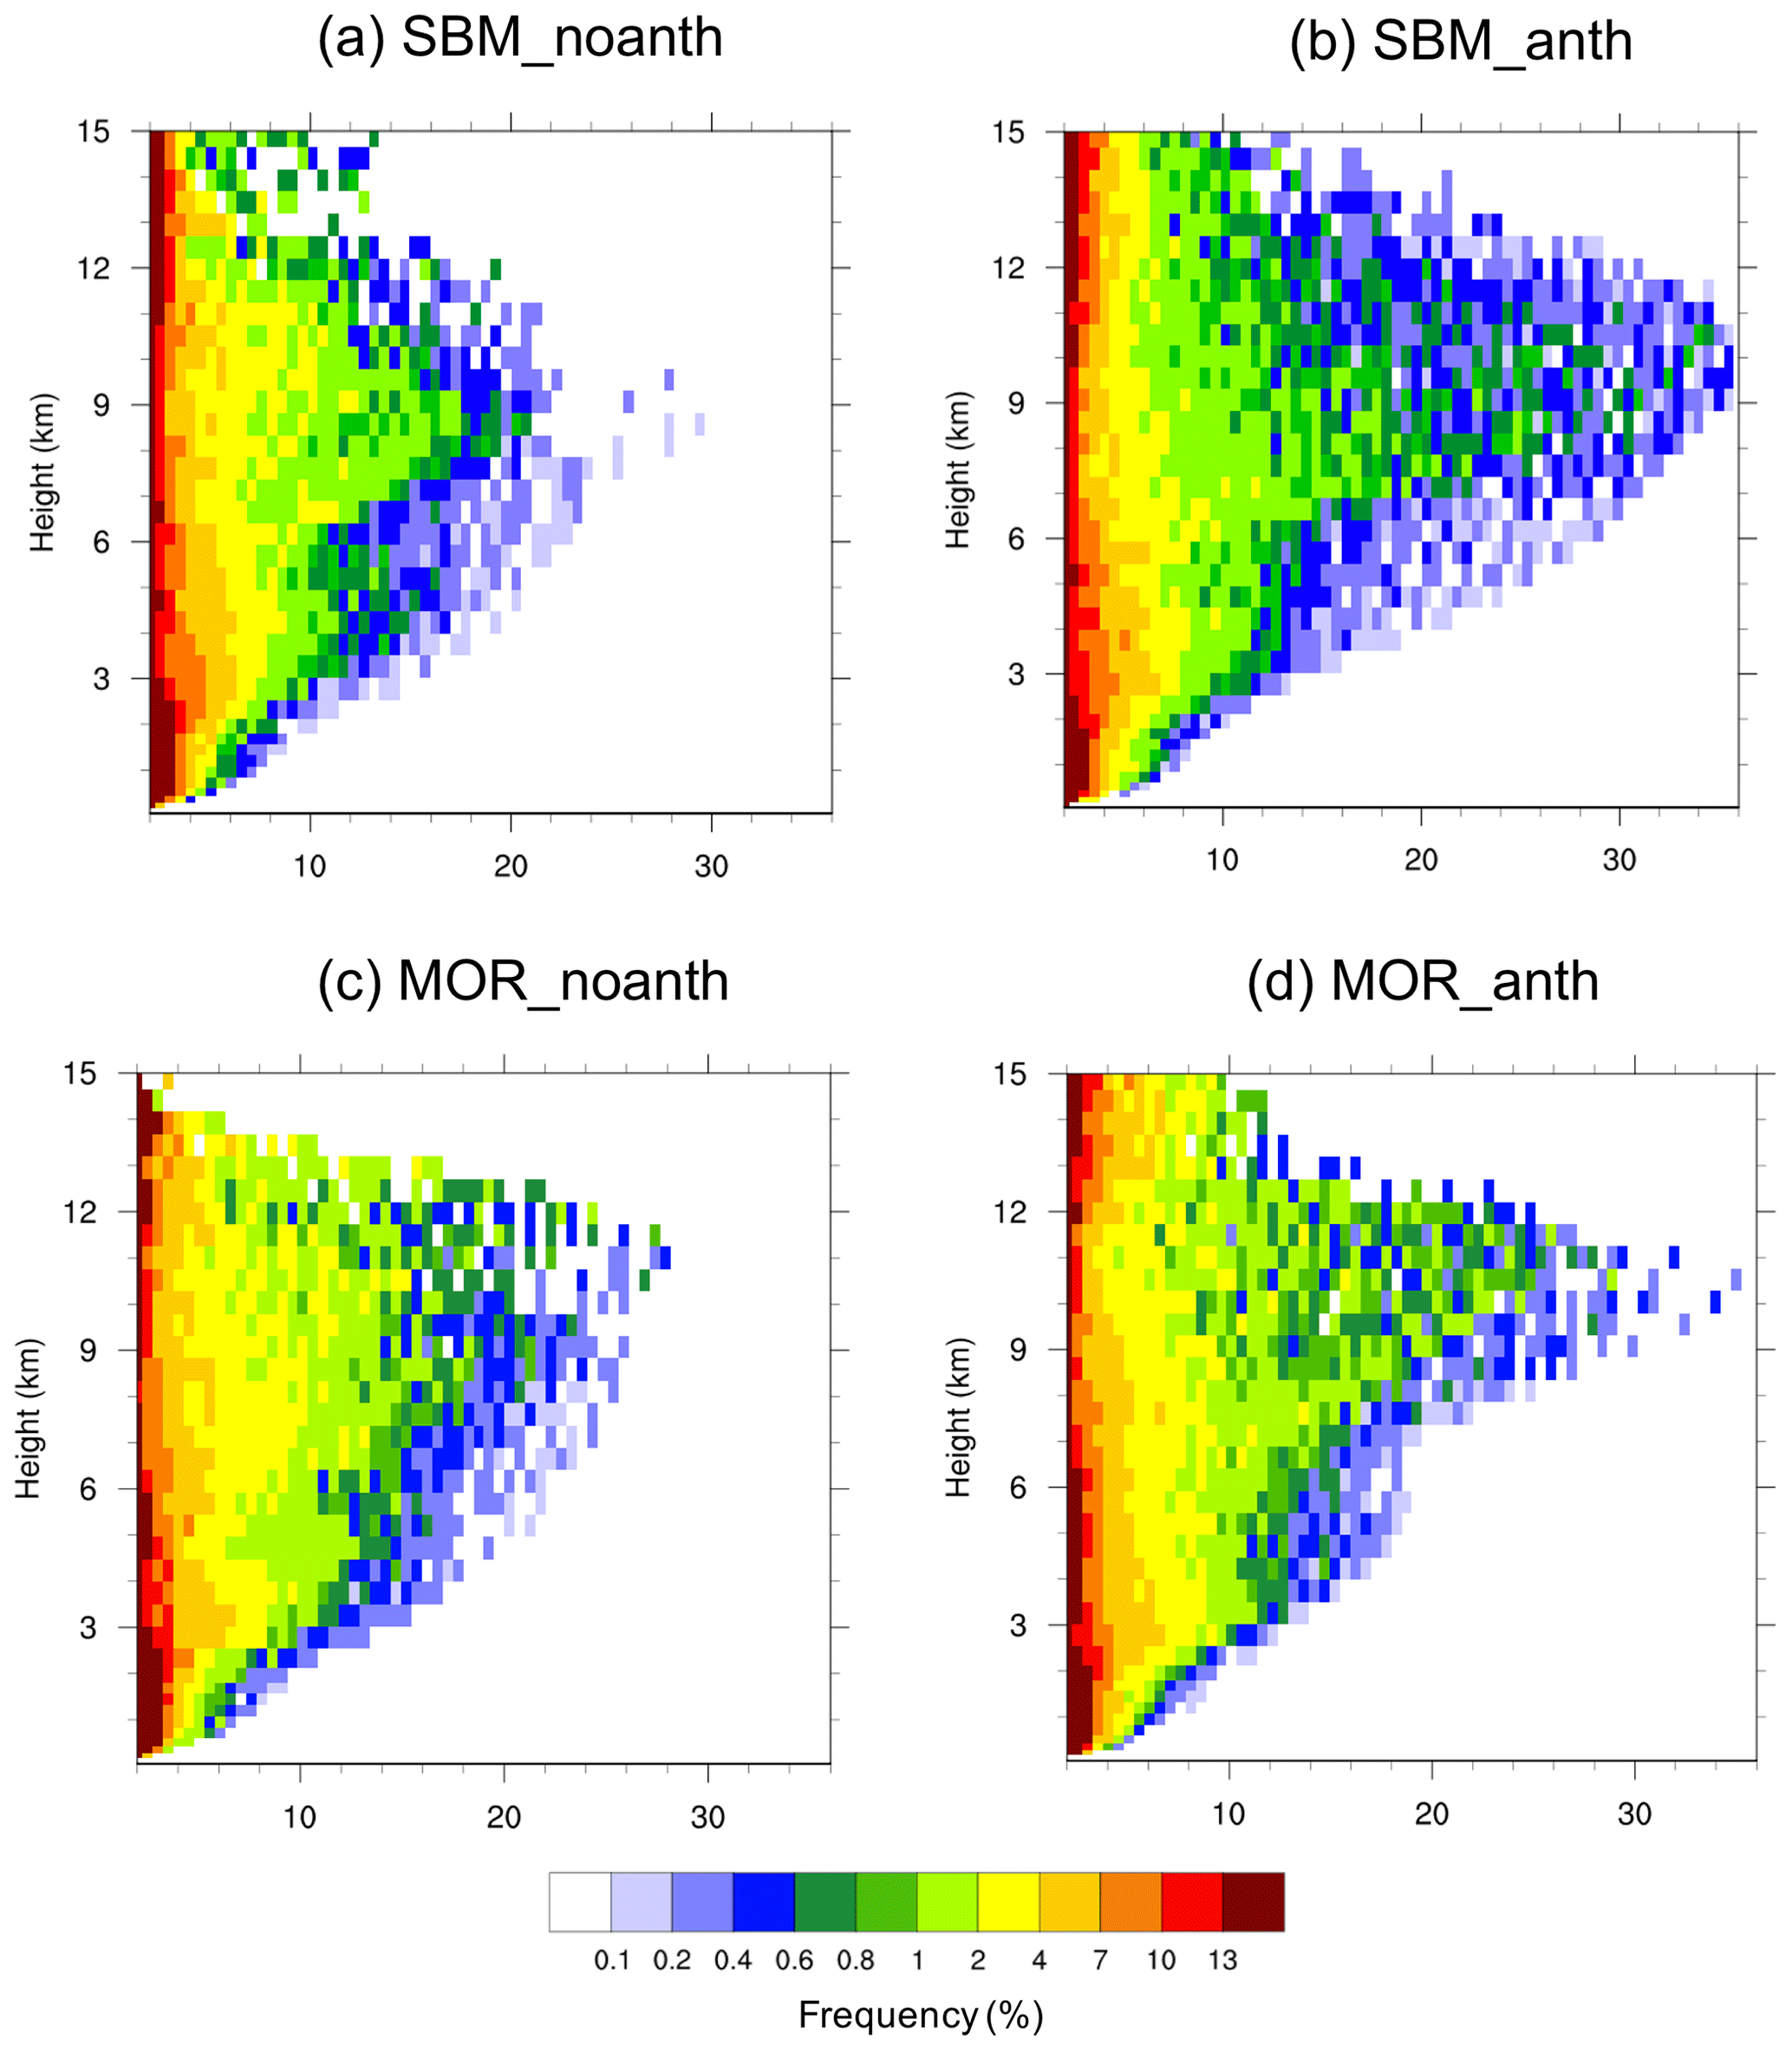
Figure 10CFADs of updraft velocity (unit: m s−1) for values larger than 2 m s−1 from (a) SBM_noanth, (b) SBM_anth, (c) MOR_noanth, and (d) MOR_anth over the study area (red box in Fig. 7) during the strong convection period (20:00–23:00 UTC on 19 June 2013). The results are the three ensemble means.
4.2 Simulated aerosol effects on cloud and precipitation
Now we look at the effects of anthropogenic aerosols on the deep convective storm simulated with the SBM and Morrison microphysics schemes. Figure 9a shows that with the SBM scheme, anthropogenic aerosols remarkably increase the mean surface rain rates (by ∼ 30 %; from SBM_noanth to SBM_anth), mainly because of the increased occurrence frequency (nearly doubled) of relatively large rain rates (i.e., 10–15 and > 15 mm h−1) in Fig. 9b. With the Morrison scheme, the changes in mean precipitation and the PDF from MOR_noanth to MOR_anth are relatively small, showing a very limited aerosol effect on precipitation. Both the SBM and Morrison schemes show higher occurrences of large precipitation rates (> 10 mm h−1) and lower occurrences of small precipitation rates (< 10 mm h−1) due to anthropogenic aerosols (Fig. 9b), but the effect is larger with SBM. For the accumulated precipitation, the anthropogenic aerosols lead to a ∼ 0.5 mm increase over the storm period with the SBM scheme, whereas only a ∼ 0.2 mm increase is seen with the Morrison scheme. Note that Fig. 9a shows that anthropogenic aerosols lead to an earlier start for the precipitation with both the SBM and Morrison schemes, which reflects the faster transition from warm rain to mixed-phase precipitation. We do see the delay of warm rain by aerosols but only by about 5 min (probably due to the humid condition of the case), which is difficult to show in Fig. 9a as the averaged rain rate for the analysis box is ∼ 0.02 mm h−1 and the time period is very short (∼ 10 min).

Figure 11Vertical profiles of (a, b) updraft velocity (unit: m s−1), (c, d) buoyancy (unit: m s−2), and (e, f) the total latent heating rate (unit: K h−1) averaged over the top 25 percentiles (i.e., from the 75th to the 100th percentile) of the updrafts with velocity greater than 2 m s−1 from the simulations SBM_anth and SBM_noanth (red), MOR_anth and MOR_noanth (blue), and MOR_SS_anth and MOR_SS_noanth (orange) over the study area (red box in Fig. 7) during the strong convection period (20:00–23:00 UTC on 19 June 2013). The results are the three ensemble means. The shaded areas mark the spread of the ensemble members.
With the SBM scheme, the increase in the updraft speeds due to anthropogenic aerosols is even more notable than the precipitation (Fig. 10a, b). Above 5 km altitude, the occurrence frequencies of updraft speeds greater than 0.4 % extend to much larger values, with 36 m s−1 at the upper levels in SBM_anth and only ∼ 20 m s−1 in SBM_noanth. With the Morrison scheme, the changes due to anthropogenic aerosols are not significant (MOR_noanth vs. MOR_anth in Fig. 10c, d). From MOR_noanth to MOR_anth, there is a slight increase in updraft speed at an altitude of around 9–11 km but a slight decrease at an altitude of 6–8 km. The significant invigoration of convective intensity by anthropogenic aerosols with the SBM scheme explains the much larger occurrences of relatively large rain rates and overall more surface precipitation due to the anthropogenic aerosol effect (Fig. 9).
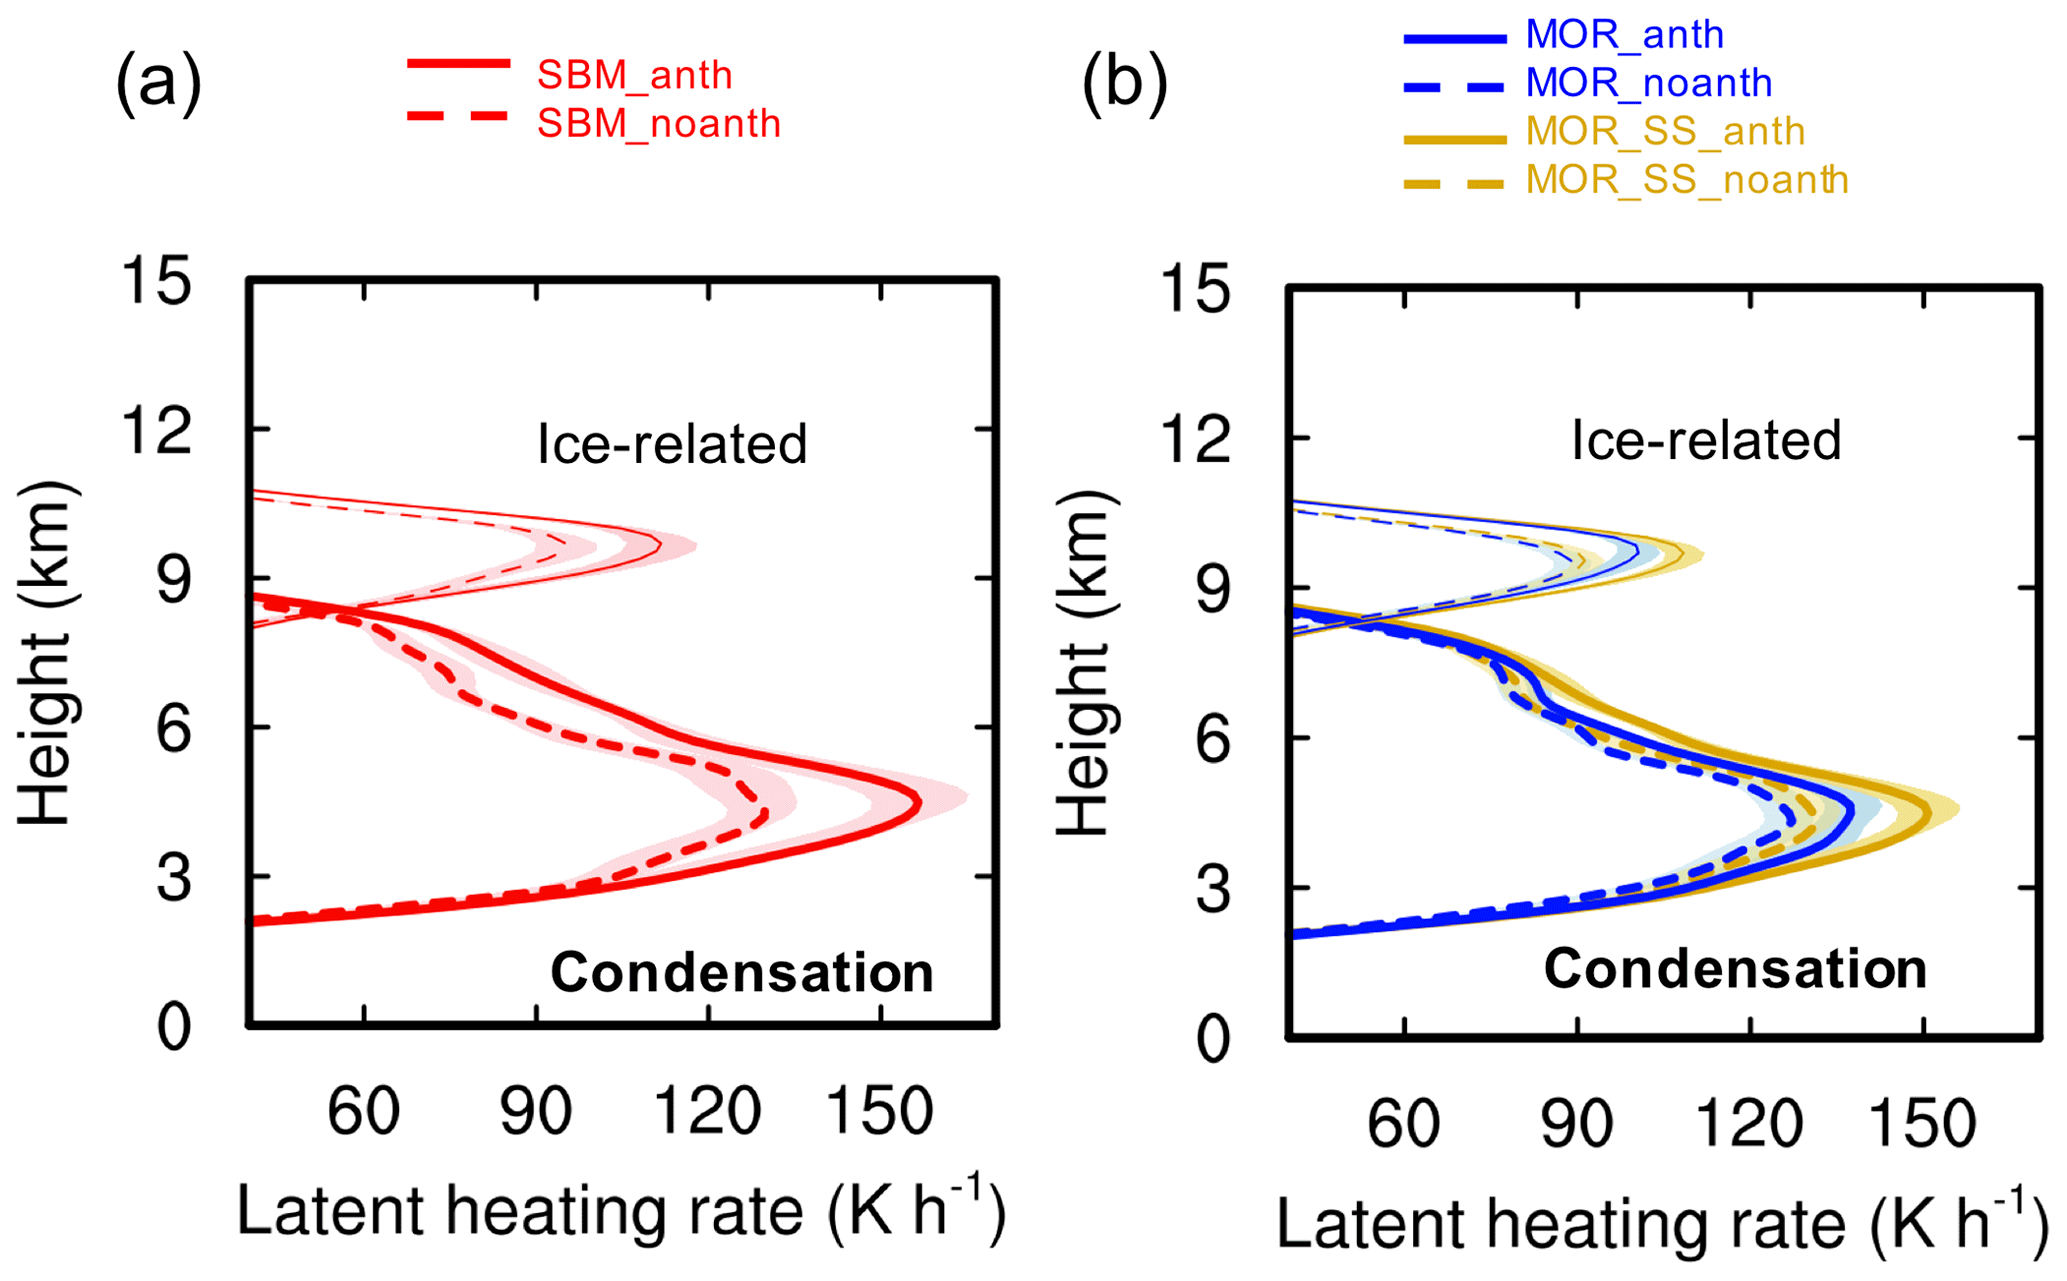
Figure 12Vertical profiles of the condensation heating rate (thick lines below 9 km; unit: K h−1) and the ice-related latent heating rate (thin lines above 9 km; unit: K h−1) averaged over the top 25 percentiles (i.e., from the 75th to the 100th percentile) of the updrafts with a velocity greater than 2 m s−1 from the simulations (a) SBM_anth and SBM_noanth (red), (b) MOR_anth and MOR_noanth (blue), and MOR_SS_anth and MOR_ SS_noanth (orange) over the study area (red box in Fig. 7) during the strong convection period (20:00–23:00 UTC on 19 June 2013). Data are processed in the same way as for Fig. 11.
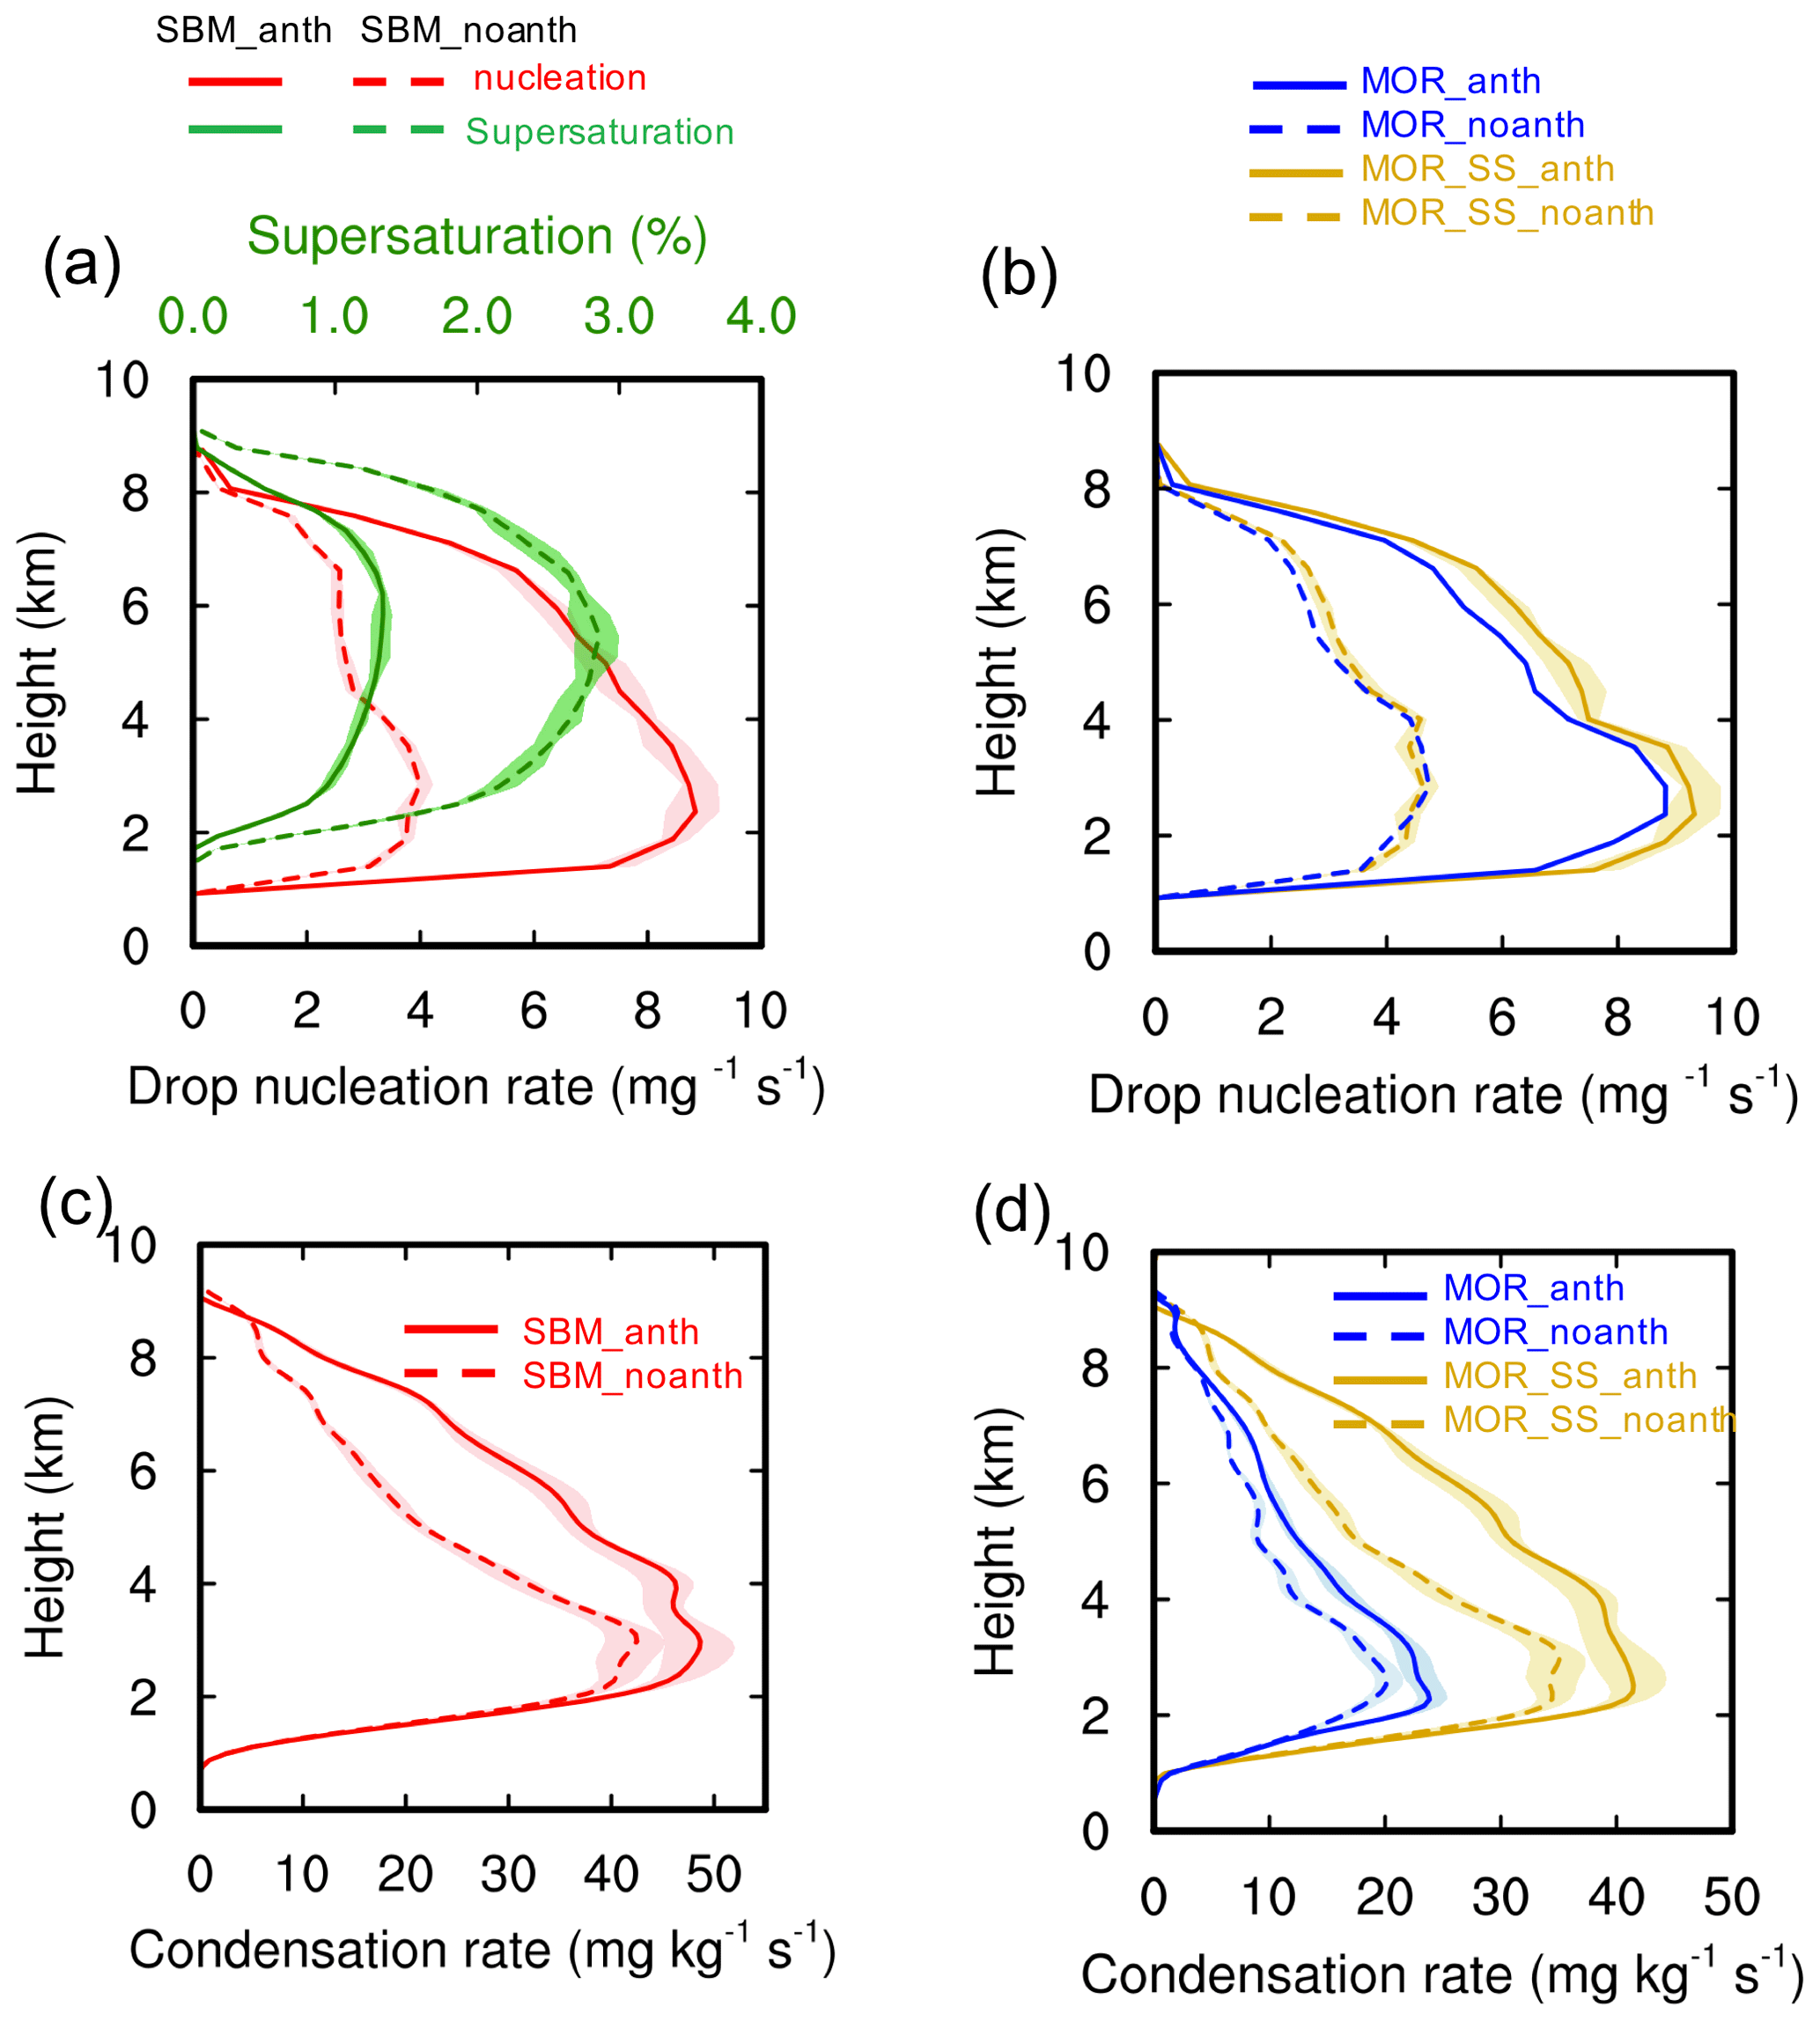
Figure 13Vertical profiles of (a, b) drop nucleation rate (red; unit: mg−1 s−1) and supersaturation with respect to water (green; unit: %) from SBM_anth and SBM_noanth; (b) drop nucleation rate (unit: mg−1 s−1) from MOR_anth and MOR_noanth (blue) and from MOR_SS_anth and MOR_ SS_noanth (orange); (c) condensation rate (unit: mg kg−1 s−1) from SBM_ anth and SBM_noanth (red); and (d) condensation rate (unit: mg kg−1 s−1) from MOR_anth and MOR_noanth (blue) and from MOR_SS_anth and MOR_SS_noanth (orange). All the values are the mean of the top 25 percentiles (i.e., from the 75th to the 100th percentile) of the updrafts with velocity greater than 2 m s−1 over the study area (red box in Fig. 7) during the strong convection period (20:00–23:00 UTC on 19 June 2013). Data are processed in the same way as for Fig. 11.
Now we examine why the anthropogenic aerosols enhance the convective intensity of the storm with the SBM scheme, whereas the effect is very small with the Morrison scheme. Figure 11 shows the vertical profiles of mean updraft velocity, buoyancy, and total latent heating rate of the top 25th percentile of updrafts with a value greater than 2 m s−1 during the deep convective cloud stage. Both SBM and the Morrison scheme show similar vertical structures of convective intensity, but the convective intensity with the Morrison scheme is weaker than SBM in the case with anthropogenic aerosols considered, especially at high altitudes. With the SBM microphysics scheme, the increased convective intensity due to the anthropogenic aerosol effect corresponds to the increased buoyancy (∼ 30 %) from SBM_noanth to SBM_anth (Fig. 11a, c). The increased buoyancy can be explained by the increased total latent heating (Fig. 11e). From SBM_noanth to SBM_anth, the increase in latent heating from both condensation and ice-related microphysical processes (including deposition, drop freezing, and riming) is significant, with the increase from condensation latent heating being relatively larger (about 60 % more, as shown in Fig. 12a). As shown in Fan et al. (2018), the increase in lower-level condensation latent heating has a much larger effect on intensifying updraft intensity compared with the same amount of increase in high-level latent heating from ice-related microphysical processes. Thus, the convective invigoration due to anthropogenic aerosols with the SBM scheme is via both warm-phase invigoration and cold-phase invigoration, with the former playing a more important role. Compared with the Morrison scheme, the increase in total latent heating due to anthropogenic aerosols is almost doubled with the SBM scheme, explaining the more remarkable enhancement in buoyancy and, thus, the convective intensity (red lines vs. blue lines in Fig. 11). From MOR_noanth to MOR_anth, there is a small increase in both the condensation latent heating and high-level latent heating associated with ice-related processes (blue lines in Fig. 12b). As shown in Fig. 12, the difference in the increase in latent heating due to anthropogenic aerosols between SBM and Morrison schemes comes from both condensation latent heating (with a ∼ 20 % increase with SBM but only ∼ 8 % with Morrison) and latent heating from ice-related processes (with a ∼ 13 % increase with SBM and ∼ 10 % with Morrison), with the major differences from condensation latent heating. The small increase in condensation latent heating limits convective invigoration by aerosols with the Morrison scheme.
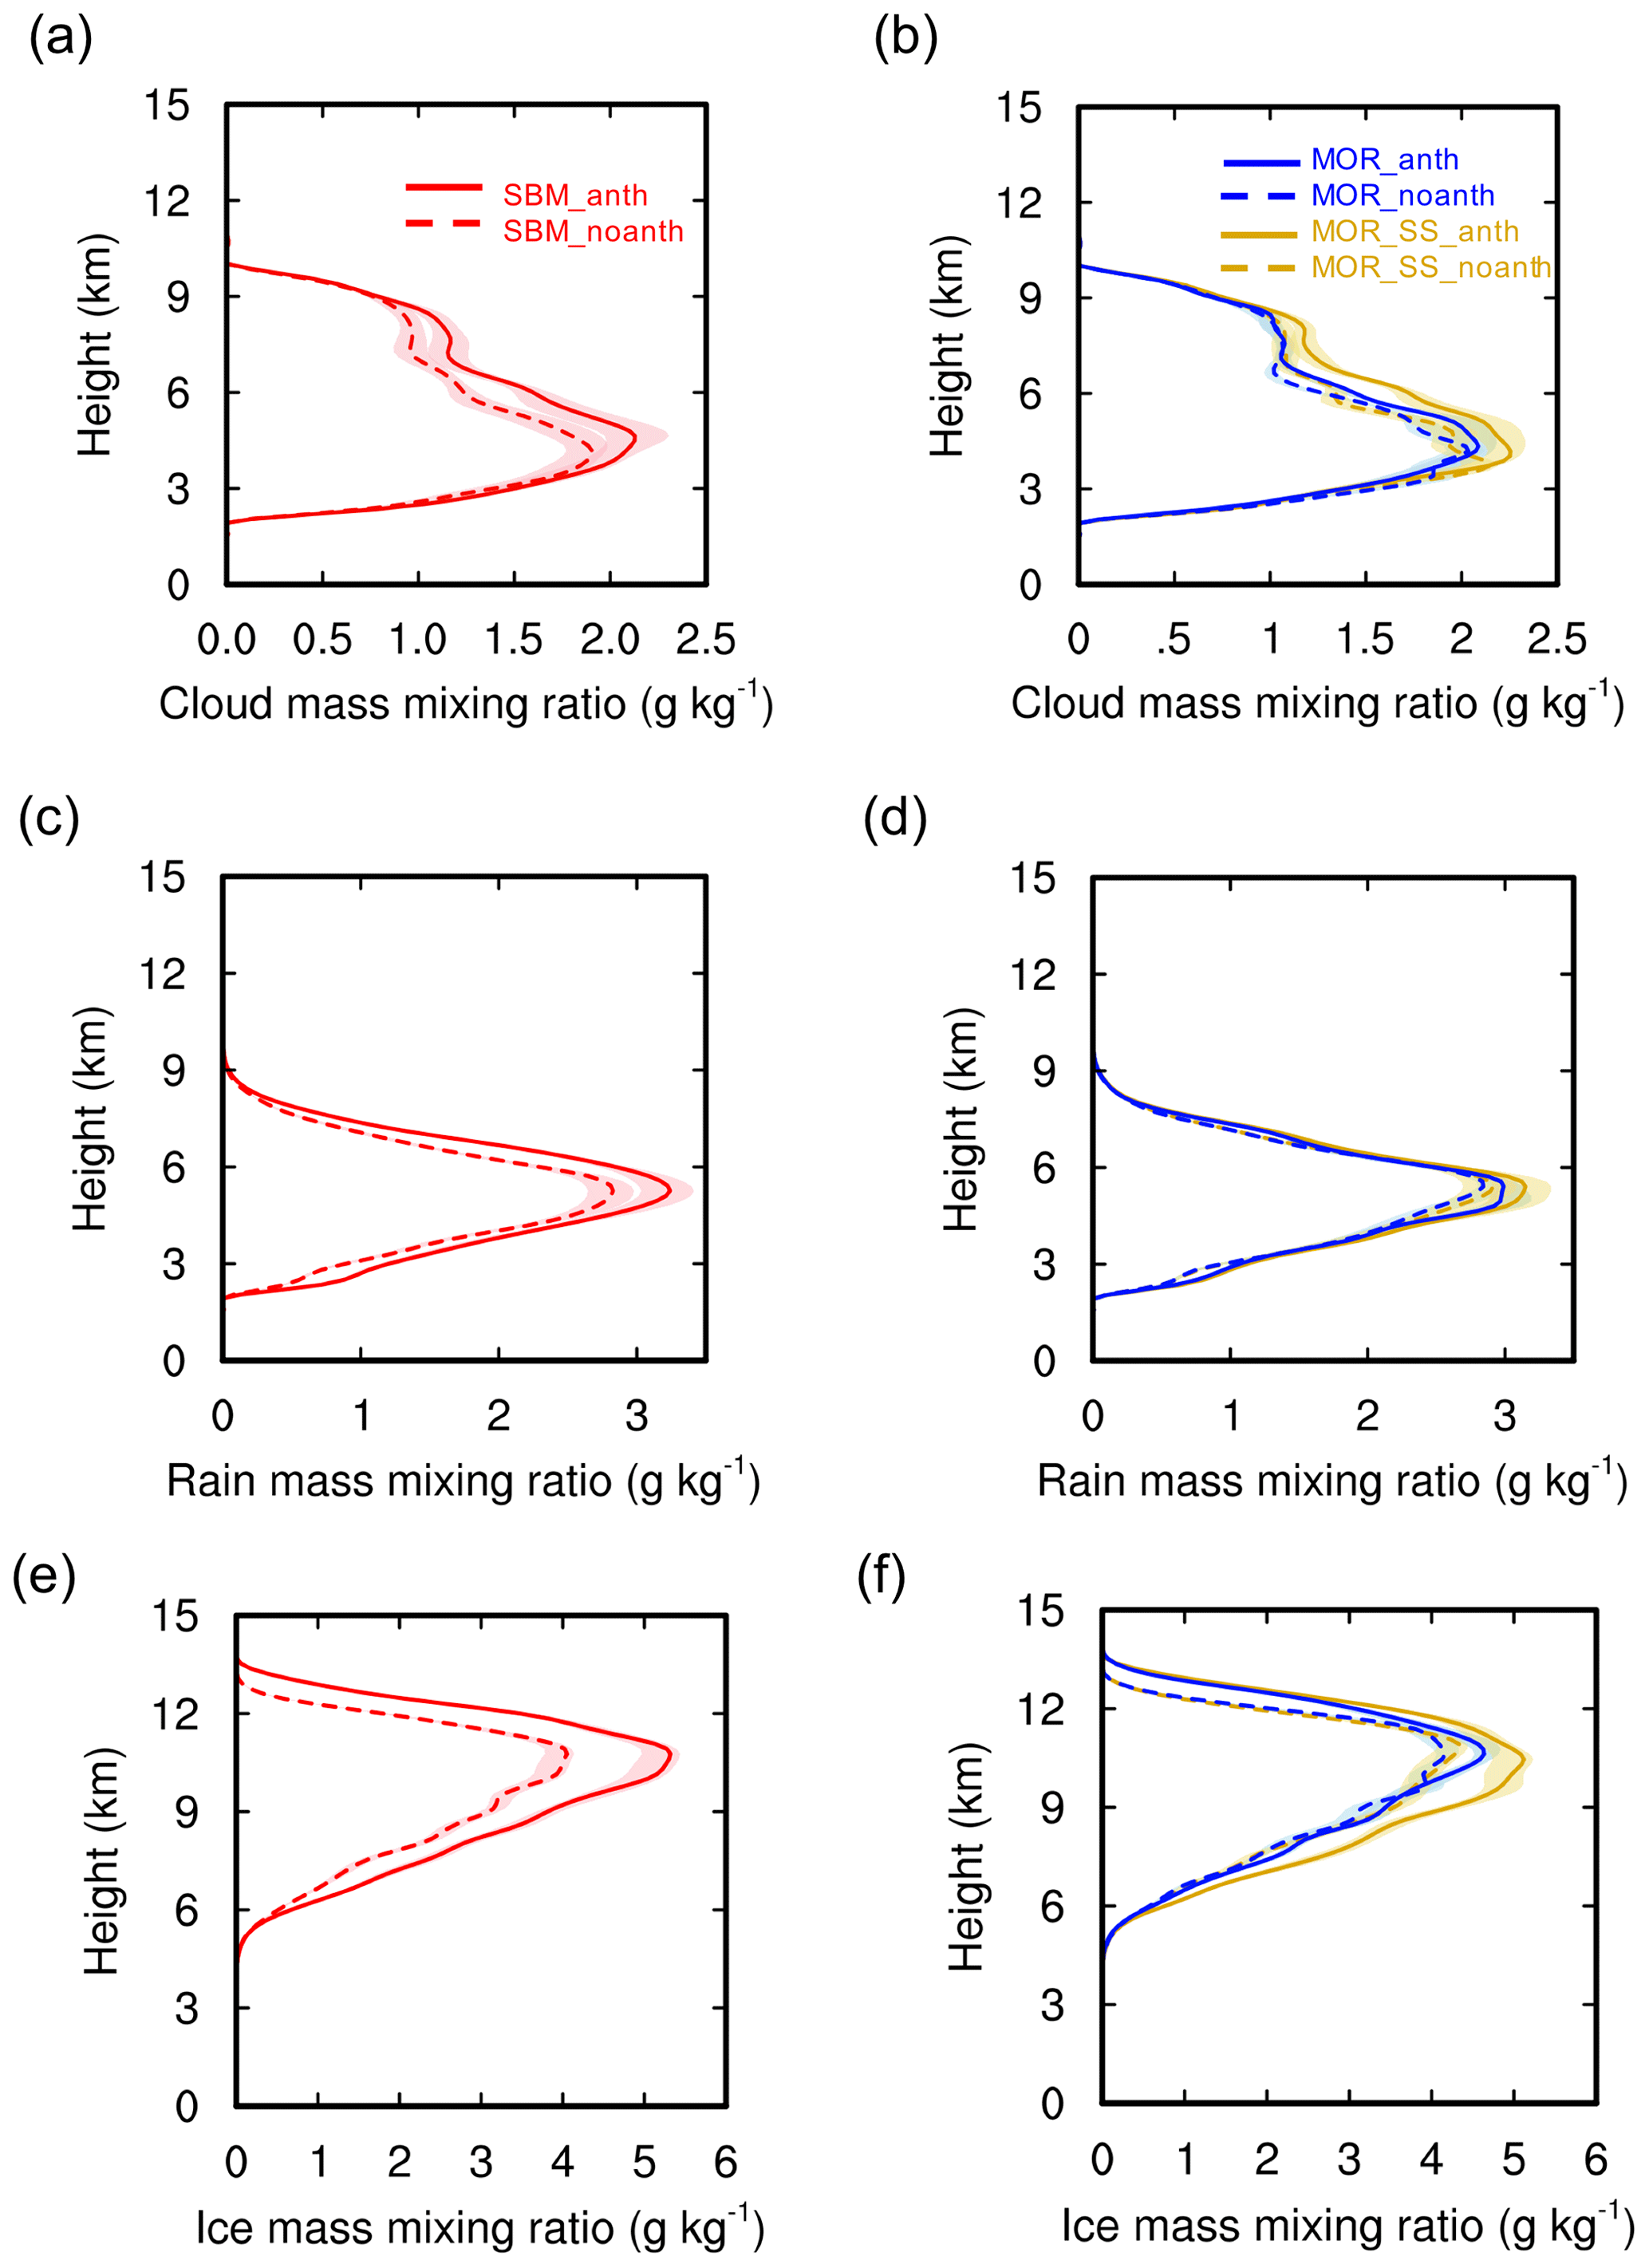
Figure 14Vertical profiles of (a, b) cloud droplet, (c, d) raindrop, and (e, f) ice particle (including ice, snow, and graupel) mass mixing ratios (unit: g kg−1) averaged over the top 25 percentiles (i.e., from the 75th to the 100th percentile) of the updrafts with a value greater than 2 m s−1 from the simulations SBM_anth and SBM_noanth (red), MOR_anth and MOR_noanth (blue), and MOR_SS_anth and MOR_SS_noanth (orange) over the study area (red box in Fig. 7) during the strong convection period (20:00–23:00 UTC on 19 June 2013). Data are processed in the same way as for Fig. 11.
To understand why the responses of condensation to the anthropogenic aerosols are different between the SBM and Morrison schemes, we look into the process rates of drop nucleation and condensation (Fig. 13). With the SBM scheme, the anthropogenic aerosols increase the drop nucleation rates by a few times over the profile (red lines in Fig. 13a), and the condensation rates (i.e., the rate of gain in cloud water due to water vapor condensation) are also drastically increased (doubled between altitudes of 4 and 6 km, as shown in Fig. 13c). The enhanced condensation rate due to anthropogenic aerosols is because many more aerosols are activated to form a larger number of small droplets, increasing the integrated droplet surface area for condensation, as documented in Fan et al. (2018). As a result, supersaturation is drastically lower in SBM_anth than in SBM_noanth (green lines in Fig. 13a). With the Morrison scheme, similarly to SBM, a large increase in the droplet nucleation rate is seen (Fig. 13b). However, the condensation rates are barely increased (blue solid vs. dashed lines in Fig. 13d). We hypothesize that the lack of response of condensation to the increased aerosol activation with the Morrison scheme is mainly because of the saturation adjustment calculation of the condensation and evaporation process. The approach does not allow supersaturation in the cloud, and the calculation of condensation does not depend on supersaturation and droplet properties and, thus, removes the sensitivity to the anthropogenic aerosols.
To verify our hypothesis and examine how much the saturation adjustment method is responsible for the weak responses of condensation latent heating and convection to the added anthropogenic aerosols, we conducted two additional sensitivity tests by replacing the saturation adjustment approach in the Morrison scheme with the condensation and evaporation calculation based on an explicit representation of supersaturation over a time step, as described in Sect. 3. The result shows that the modified Morrison scheme with the explicit supersaturation leads to (1) larger condensation rates and latent heating (Figs. 12b, 13d) and (2) a larger anthropogenic aerosol effect on condensation and ice-related processes, compared with the saturation adjustment approach.
First, we explain why the explicit supersaturation approach leads to larger condensation rates and latent heating than the saturation adjustment approach. The time evolution of latent heating, updraft, and hydrometeor properties is examined (Fig. S1). At the warm cloud stage at 17:00 UTC, saturation adjustment produces more condensation latent heating which leads to larger buoyancy and stronger updraft intensity compared with the explicit supersaturation approach, due to the removal of supersaturation (Fig. S1, left, blue vs. orange). However, by 19:00 UTC, when the clouds have developed into mixed-phase clouds, the saturation adjustment approach produces smaller condensational heating and weaker convection than the explicit supersaturation approach (Fig. S1, middle). The results remain similar later during the deep cloud stage at 21:00 UTC (Fig. S1, right). How does this change occur from 17:00 to 19:00 UTC? At the warm cloud stage (17:00 UTC), saturation adjustment produces droplets with larger sizes (up to 100 % larger for the mean radius) than explicit supersaturation because more cloud water is produced as a result of zeroing-out supersaturation at each time step (droplet formation is similar between the two cases, as shown in Fig. 13). The abovementioned process results in much faster and larger warm rain with the saturation adjustment approach, whereas with the explicit supersaturation approach, rain number and mass are absent at 17:00 UTC (as shown in Figs. S2d and S3d). As a result, when evolving into the mixed-phase stage (19:00 UTC), remarkably fewer cloud droplets are transported to the levels above the freezing level (Figs. S2b, S3b). In contrast, with explicit supersaturation, because of the delayed and suppressed warm rain and smaller droplets (the mean radius is decreased from 8 to 6 µm at 3 km), many more cloud droplets are lifted to the higher levels. Correspondingly, a few times higher total ice particle number and mass are seen compared with the saturation adjustment approach (Figs. S2g, S3g) because more droplets above the freezing level induce stronger ice processes (droplet freezing, riming, and deposition). This leads to more latent heat release (Fig. S1e), which increases the buoyancy and convective intensity. When convection is stronger, more condensation occurs; thus, a larger condensation latent heating is seen with the explicit supersaturation method.
We now explain why the explicit supersaturation approach leads to a larger aerosol effect on convective intensity compared with the saturation adjustment method. First, the enhancement of condensational heating by aerosols is larger with the explicit supersaturation method (Fig. S1a, b, c), mainly because the condensation depends on supersaturation and droplet properties, whereas the saturation adjustment approach removes the dependence of condensation on droplet properties. Second, increasing aerosols with the explicit supersaturation approach leads to a larger enhancement of ice-related processes (Fig. S1b, c) due to a larger reduction in droplet size (up to 1 µm more in the mean radius) than the saturation adjustment method. The enhanced convective intensity would further lead to a larger enhancement in condensational heating. Therefore, we see a much larger aerosol effect with the explicit supersaturation method than with the saturation adjustment approach because of more enhanced condensation latent heating and ice-related latent heating. The increase in condensation latent heating and ice-related latent heating due to anthropogenic aerosols with explicit supersaturation is comparable to SBM (orange lines vs. red lines in Fig. 12), resulting in a similarly large increase in buoyancy and, thus, convective intensity (orange lines vs. red lines in Fig. 11). The increase in precipitation due to aerosols is also similar to that with the SBM scheme (not shown).
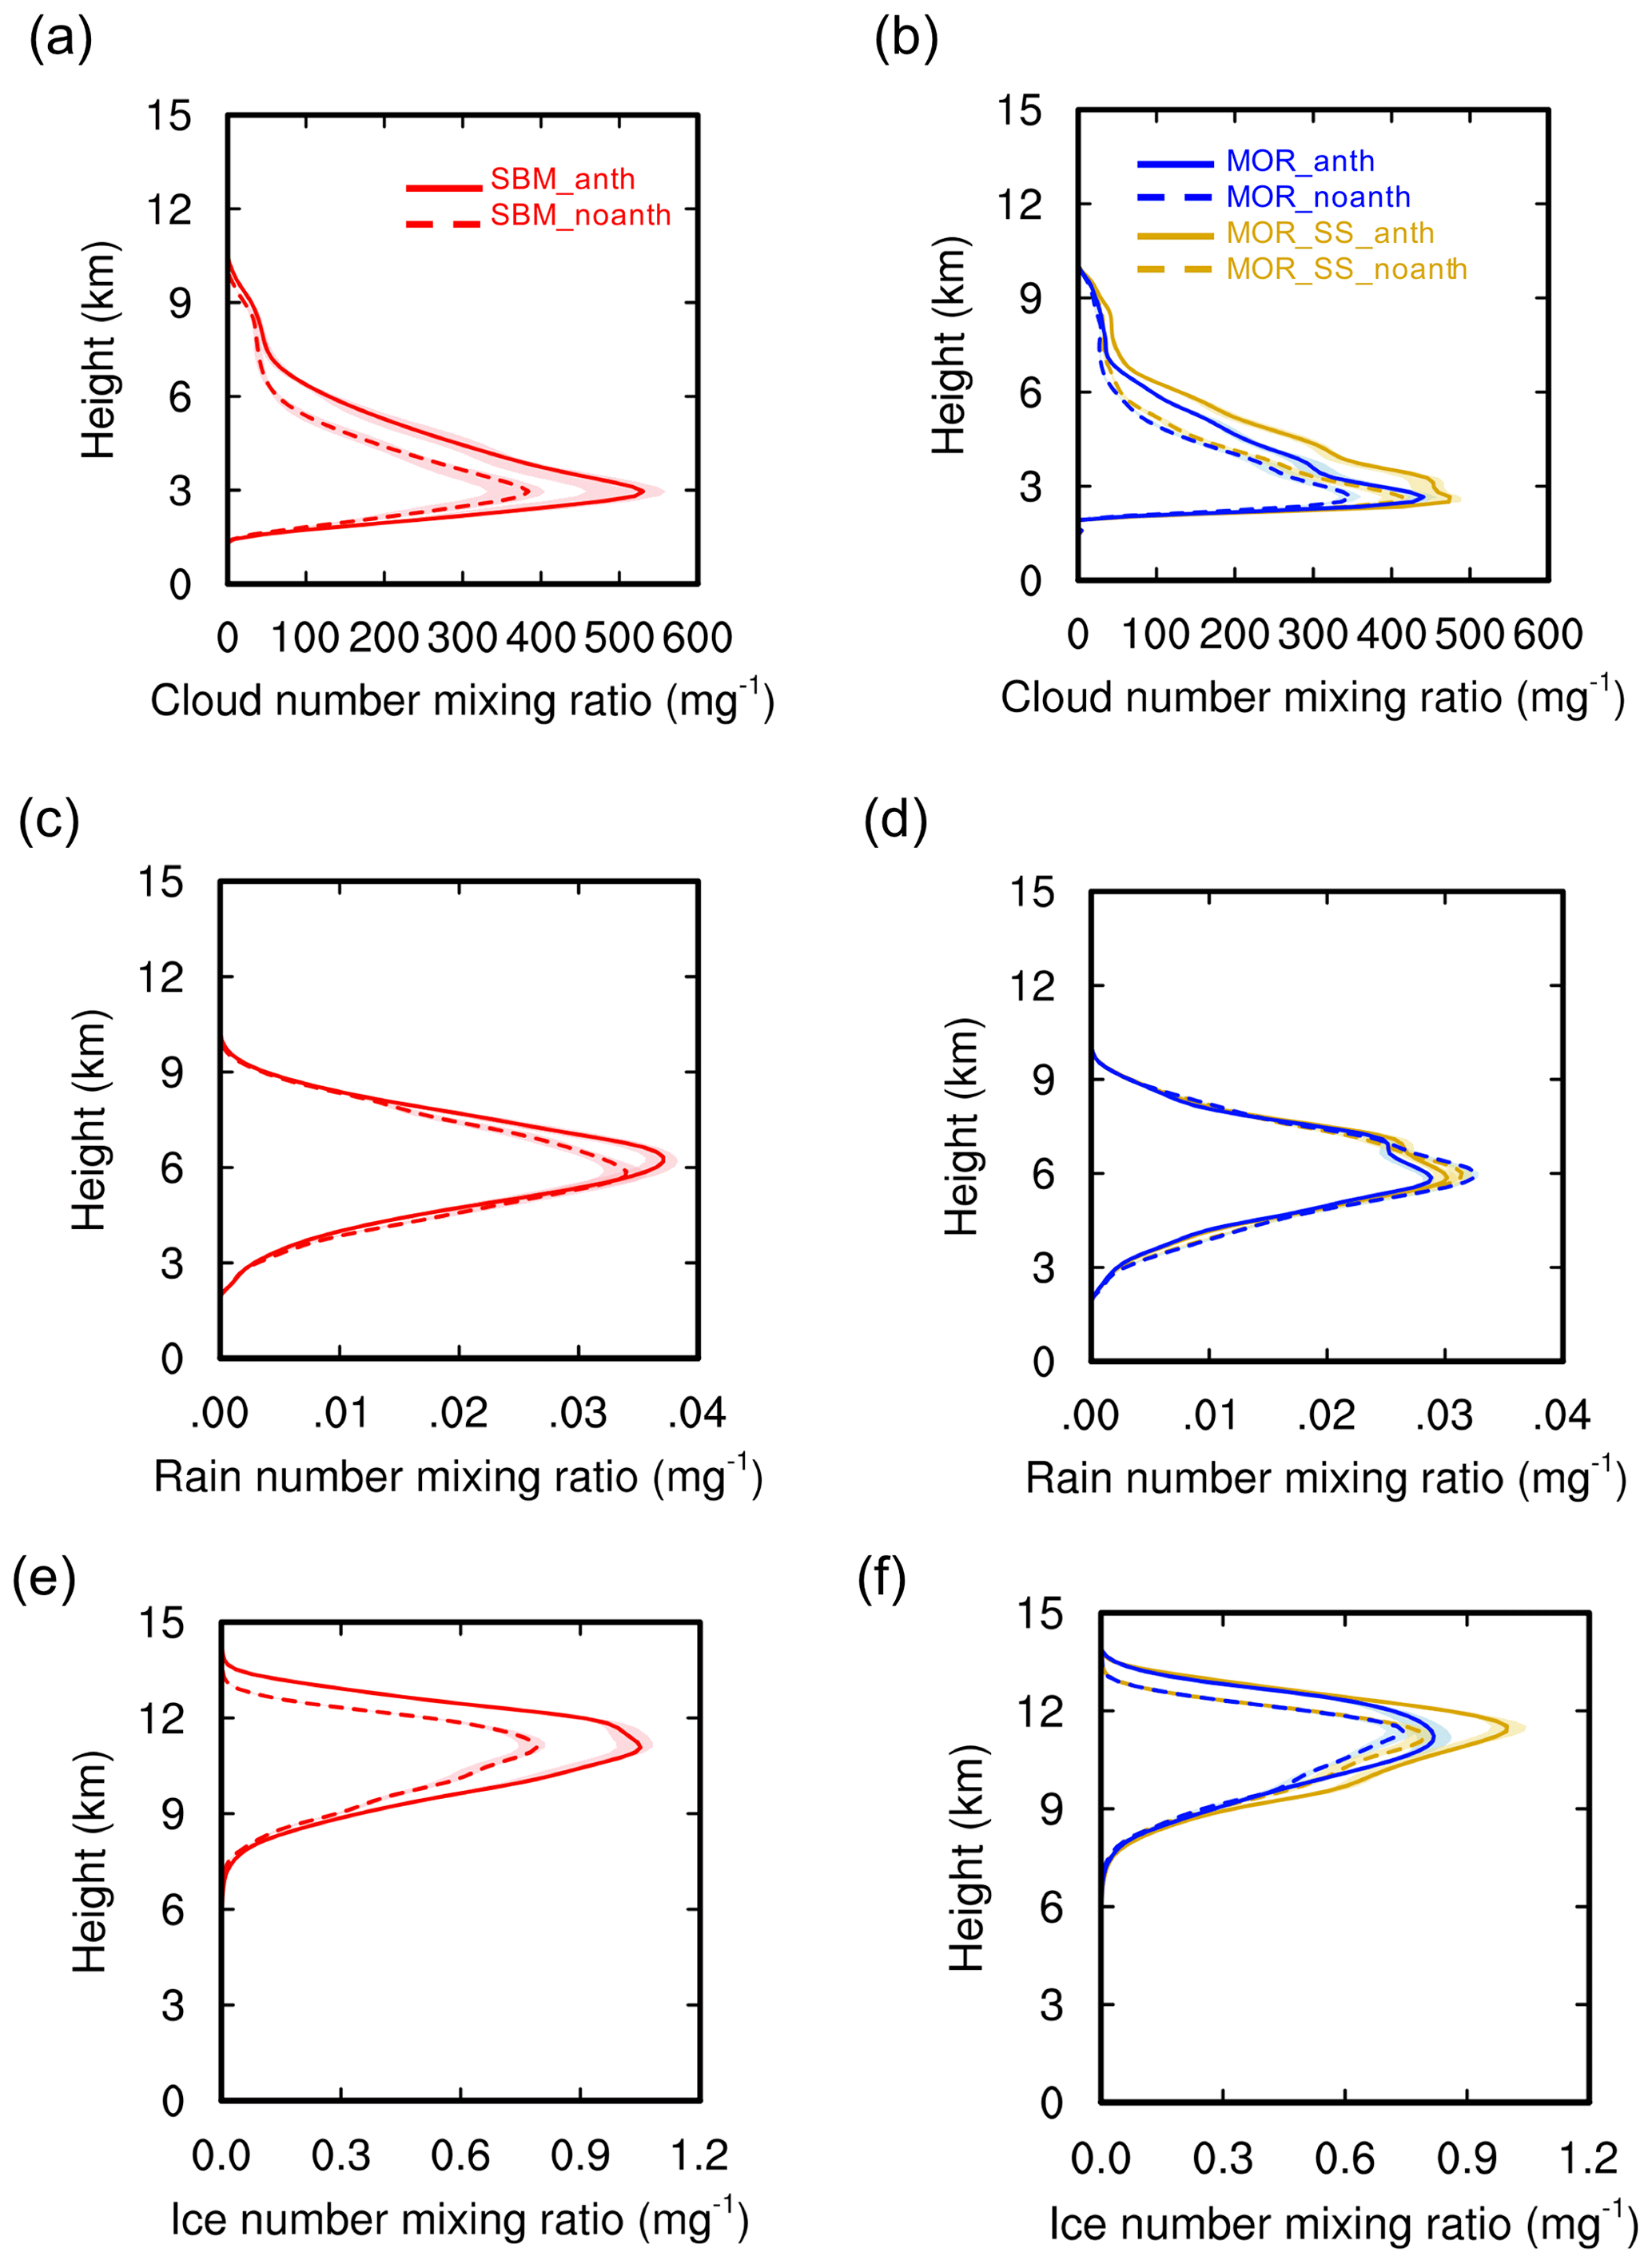
With enhanced convection by anthropogenic aerosols, the responses of hydrometeor mass and number are significant. With the SBM scheme, the increases in mass and number of cloud droplets, raindrops, and total ice particles (ice, snow, and graupel) due to anthropogenic aerosols are very significant (Fig. 14–15, panels a, c, and e, red lines). The increases in the total ice mass and number are particularly significant (∼ 35 % in mass and ∼ 30 % in number). The mass increase in frozen hydrometeors is mainly contributed by graupel (Fig. S4, left, red lines), whereas the number increase mainly comes from cloud ice (Fig. S5, red lines). This suggests a large effect of enhanced convective intensity on frozen hydrometeors and, thus, precipitation. With the Morrison scheme, little change is seen (Figs. 14–15, panels b, d, and f, and S4–S5, right, blue lines). By replacing the saturation adjustment method with the explicit supersaturation approach for condensation and evaporation, the increases in those hydrometeor masses and numbers become consistent with the SBM scheme (Figs. 14–15 and S4–S5, orange lines and red lines).
These results verify that the saturation adjustment approach for parameterizing condensation and evaporation is the main reason for the limited aerosol effects on convective intensity and precipitation with the original Morrison scheme. Past studies have also shown the limitations of the saturation adjustment approach in simulating aerosol impacts on deep convective clouds (e.g., Fan et al., 2016; Lebo et al., 2012; Lee et al., 2018; Wang et al., 2013).
We have conducted model simulations of a deep convective cloud case occurring on 19 June 2013 over the Houston area with WRF-Chem coupled with the SBM and Morrison microphysics schemes to (1) evaluate the performance of WRF-Chem-SBM in simulating the deep convective clouds, and (2) explore the differences in aerosol effects on the deep convective clouds produced by the SBM and Morrison schemes and the major factors responsible for the differences.
We have evaluated the simulated aerosols, CCN, cloud base heights, reflectivity, and precipitation. The model simulates the large spatial variability of aerosols and CCN from the Gulf of Mexico, rural areas, and urban Houston city areas. Regarding the bulk magnitudes, the model captures the surface PM2.5, cloud base height, and CCN at cloud bases near Houston reasonably well. These realistically simulated aerosol fields were fed to higher-resolution simulations (0.5 km) using the SBM and Morrison schemes. With the SBM scheme, the model simulates a deep convective cloud over Houston that is in better agreement with the observed radar reflectivity and precipitation, compared with using the Morrison scheme. Indeed, both schemes show similar vertical structures of convective intensity and hydrometeor properties, with a weaker updraft intensity with the Morrison scheme at high altitudes in the case with anthropogenic aerosols considered.
Replacing the saturation adjustment method for the condensation and evaporation calculation with an explicit supersaturation approach leads to an increase in updraft intensity, leading to similar results to SBM for the case with anthropogenic aerosols considered. This is because droplet sizes are smaller in the warm cloud stage with the explicit supersaturation approach than with the saturation adjustment approach, as the latter approach removes supersaturation within one time step. The less efficient conversion of cloud droplets to rain allows more cloud droplets to be transported to altitudes above the freezing level at the mixed-phase and deep cloud stages, inducing stronger ice microphysical processes (freezing, riming, and deposition) and invigorating convection. Lebo et al. (2012) showed a similar feature: that the saturation adjustment method has a larger total condensate mass at the beginning but less at the later stage compared with the explicit supersaturation approach, particularly in total ice mass. In addition, Grabowski and Morrison (2017) showed that saturation adjustment affected ice processes in another way by producing larger ice particles with larger falling velocities compared with the explicit supersaturation approach, leading to the reduction of anvil clouds.
Regarding the anthropogenic aerosol effects, with the SBM scheme, anthropogenic aerosols notably increase the convective intensity, enhance the peak precipitation rate over the Houston area (by ∼ 30 %), and double the frequencies of relatively large rain rates (> 10 mm h−1). The enhanced convective intensity due to anthropogenic aerosols causes better agreement between the simulated storm and the observed storm, which is mainly attributed to the increased condensation and ice-related latent heating, with the former being more significant. In contrast, with the Morrison scheme, there is no significant anthropogenic aerosol effect on the convective intensity and total precipitation. However, the Morrison scheme shows qualitatively consistent results with SBM regarding aerosol effects on the PDF of rain rates: higher occurrences of large precipitation rates (> 10 mm h−1) and lower occurrences of small precipitation rates (< 10 mm h−1).
By replacing the saturation adjustment method with an explicit supersaturation approach for the condensation and evaporation calculation, the modified Morrison shows much larger anthropogenic aerosol effects on convective intensity, hydrometeor properties, and precipitation than the original Morrison scheme, and those aerosol effects are similar to the SBM scheme. Therefore, the saturation adjustment method for the condensation and evaporation calculation is mainly responsible for the limited aerosol effects with the Morrison scheme. This is mainly because the saturation adjustment approach limits the enhancement in (1) condensation latent heat by removing the dependence of condensation on droplets and aerosols and (2) the ice-related processes, as the approach leads to stronger warm rain and weaker ice processes than the explicit supersaturation approach. Therefore, the explicit supersaturation method enhances aerosol effects through enhanced condensation and cold-phase processes, but enhanced condensation should play a more important role. This study suggests, when the computational resource is not sufficient or in other situations such as the application of SBM is not available, the Morrison scheme modified with the condensation and evaporation calculation based on a simple representation of supersaturation can be applied to study aerosol effects on convective clouds, especially for warm and humid cloud cases in which the response of condensation to aerosols is particularly important.
Following Fan et al. (2018), who showed that the warm-phase invigoration mechanism was manifested by ultrafine aerosol particles in the Amazon (warm and humid environment with extremely low background aerosol particles), we we showed that anthropogenic aerosols over the Houston area in summer may also enhance the thunderstorm intensity and precipitation via the same mechanism by secondary nucleation of numerous ultrafine aerosol particles from the anthropogenic sources. However, the magnitude of the effect is not as substantial as in the Amazonian environment. Possible reasons include the fact that background aerosols are much higher over the Houston area and the air is not as humid as in the Amazon.
The code used for this study is modified with the WRF-Chem, which is available at https://www2.mmm.ucar.edu/wrf/users/downloads.html (last access: 30 January 2021). The modified code will be available upon request.
The model data can be accessed at https://portal.nersc.gov/project/m2977/zhangetal2020 (last access: 30 January 2021).
The supplement related to this article is available online at: https://doi.org/10.5194/acp-21-2363-2021-supplement.
JF designed and supervised the research. YZ carried out the experiments and analysis and wrote the first draft of the paper. All authors contributed to writing the article.
The authors declare that they have no conflict of interest.
Pacific Northwest National Laboratory (PNNL) is operated by Battelle Memorial Institute for the U.S. Department of Energy (DOE) under contract no. DE-AC05-76RL01830. This research used resources from PNNL Institutional Computing (PIC) and the National Energy Research Scientific Computing Center (NERSC; a U.S. Department of Energy Office of Science User Facility operated under contract no DE-AC02-05CH11231). We thank Chun Zhao at the China University of Science and Technology for providing the quasi-global WRF-Chem simulation data and Hugh Morrison at the National Center for Atmospheric Research for the Morrison code with the supersaturation-forced condensation and evaporation calculation.
This research has been supported by the U.S. Department of Energy Office of Science Early Career Research Program (grant no. 70017) and the U.S. National Science Foundation (grant no. AGS1837811).
This paper was edited by Fangqun Yu and reviewed by two anonymous referees.
Abdul-Razzak, H. and Ghan, S. J.: A parameterization of aerosol activation – 3. Sectional representation, J. Geophys. Res.-Atmos., 107, 4026, https://doi.org/10.1029/2001jd000483, 2002.
Andreae, M. O., Jones, C. D., and Cox, P. M.: Strong present-day aerosol cooling implies a hot future, Nature, 435, 1187-1190, https://doi.org/10.1038/nature03671, 2005.
Arakawa, A.: The cumulus parameterization problem: Past, present, and future, J. Climate, 17, 2493–2525, https://doi.org/10.1175/1520-0442(2004)017<2493:Ratcpp>2.0.Co;2, 2004.
Chen, F. and Dudhia, J.: Coupling an advanced land surface-hydrology model with the Penn State-NCAR MM5 modeling system. Part I: Model implementation and sensitivity, Mon. Weather Rev., 129, 569–585, https://doi.org/10.1175/1520-0493(2001)129<0569:Caalsh>2.0.Co;2, 2001.
Chen, Q., Fan, J., Yin, Y., and Han, B.: Aerosol impacts on mesoscale convective systems forming under different vertical wind shear conditions, J. Geophys. Res.-Atmos., 125, e2018JD030027, https://doi.org/10.1029/2018JD030027, 2020.
Chen, Y.-C., Xue, L., Lebo, Z. J., Wang, H., Rasmussen, R. M., and Seinfeld, J. H.: A comprehensive numerical study of aerosol-cloud-precipitation interactions in marine stratocumulus, Atmos. Chem. Phys., 11, 9749–9769, https://doi.org/10.5194/acp-11-9749-2011, 2011.
Dagan, G., Koren, I., Altaratz, O., and Lehahn, Y.: Shallow convective cloud field lifetime as a key factor for evaluating aerosol effects, iScience, 10, 192–202, 2018.
Ekman, A. M. L., Engstrom, A., and Soderberg, A.: Impact of Two-Way Aerosol-Cloud Interaction and Changes in Aerosol Size Distribution on Simulated Aerosol-Induced Deep Convective Cloud Sensitivity, J. Atmos. Sci., 68, 685–698, https://doi.org/10.1175/2010jas3651.1, 2011.
Fan, J. W., Zhang, R. Y., Li, G. H., and Tao, W. K.: Effects of aerosols and relative humidity on cumulus clouds, J. Geophys. Res.-Atmos., 112, D14204, https://doi.org/10.1029/2006jd008136, 2007.
Fan, J. W., Yuan, T. L., Comstock, J. M., Ghan, S., Khain, A., Leung, L. R., Li, Z. Q., Martins, V. J., and Ovchinnikov, M.: Dominant role by vertical wind shear in regulating aerosol effects on deep convective clouds, J. Geophys. Res.-Atmos., 114, D22206, https://doi.org/10.1029/2009jd012352, 2009.
Fan, J. W., Leung, L. R., Li, Z. Q., Morrison, H., Chen, H. B., Zhou, Y. Q., Qian, Y., and Wang, Y.: Aerosol impacts on clouds and precipitation in eastern China: Results from bin and bulk microphysics, J. Geophys. Res.-Atmos., 117, D00k36, https://doi.org/10.1029/2011jd016537, 2012a.
Fan, J. W., Rosenfeld, D., Ding, Y. N., Leung, L. R., and Li, Z. Q.: Potential aerosol indirect effects on atmospheric circulation and radiative forcing through deep convection, Geophys. Res. Lett., 39, L09806, https://doi.org/10.1029/2012gl051851, 2012b.
Fan, J. W., Leung, L. R., Rosenfeld, D., Chen, Q., Li, Z. Q., Zhang, J. Q., and Yan, H. R.: Microphysical effects determine macrophysical response for aerosol impacts on deep convective clouds, P. Natl. Acad. Sci. USA, 110, 4581–4590, https://doi.org/10.1073/pnas.1316830110, 2013.
Fan, J. W., Wang, Y., Rosenfeld, D., and Liu, X. H.: Review of Aerosol-Cloud Interactions: Mechanisms, Significance, and Challenges, J. Atmos. Sci., 73, 4221-4252, https://doi.org/10.1175/Jas-D-16-0037.1, 2016.
Fan, J. W., Han, B., Varble, A., Morrison, H., North, K., Kollias, P., Chen, B. J., Dong, X. Q., Giangrande, S. E., Khain, A., Lin, Y., Mansell, E., Milbrandt, J. A., Stenz, R., Thompson, G., and Wang, Y.: Cloud-resolving model intercomparison of an MC3E squall line case: Part I – Convective updrafts, J. Geophys. Res.-Atmos., 122, 9351–9378, https://doi.org/10.1002/2017jd026622, 2017.
Fan, J. W., Rosenfeld, D., Zhang, Y. W., Giangrande, S. E., Li, Z. Q., Machado, L. A. T., Martin, S. T., Yang, Y., Wang, J., Artaxo, P., Barbosa, H. M. J., Braga, R. C., Comstock, J. M., Feng, Z., Gao, W. H., Gomes, H. B., Mei, F., Pohlker, C., Pohlker, M. L., Poschl, U., and de Souza, R. A. F.: Substantial convection and precipitation enhancements by ultrafine aerosol particles, Science, 359, 411–418, https://doi.org/10.1126/science.aan8461, 2018.
Fast, J. D., Gustafson, W. I., Easter, R. C., Zaveri, R. A., Barnard, J. C., Chapman, E. G., Grell, G. A., and Peckham, S. E.: Evolution of ozone, particulates, and aerosol direct radiative forcing in the vicinity of Houston using a fully coupled meteorology-chemistry-aerosol model, J. Geophys. Res.-Atmos., 111, D21305, https://doi.org/10.1029/2005jd006721, 2006.
Gao, W. H., Fan, J. W., Easter, R. C., Yang, Q., Zhao, C., and Ghan, S. J.: Coupling spectral-bin cloud microphysics with the MOSAIC aerosol model in WRF-Chem: Methodology and results for marine stratocumulus clouds, J. Adv. Model. Earth Sy., 8, 1289–1309, https://doi.org/10.1002/2016ms000676, 2016.
Gelaro, R., McCarty, W., Suarez, M. J., Todling, R., Molod, A., Takacs, L., Randles, C. A., Darmenov, A., Bosilovich, M. G., Reichle, R., Wargan, K., Coy, L., Cullather, R., Draper, C., Akella, S., Buchard, V., Conaty, A., da Silva, A. M., Gu, W., Kim, G. K., Koster, R., Lucchesi, R., Merkova, D., Nielsen, J. E., Partyka, G., Pawson, S., Putman, W., Rienecker, M., Schubert, S. D., Sienkiewicz, M., and Zhao, B.: The Modern-Era Retrospective Analysis for Research and Applications, Version 2 (MERRA-2), J. Climate, 30, 5419–5454, https://doi.org/10.1175/Jcli-D-16-0758.1, 2017.
Grabowski, W. W. and Morrison, H.: Untangling microphysical impacts on deep convection applying a novel modeling methodology. Part II: Double-moment microphysics. J. Atmos. Sci., 73, 3749–3770, 2016.
Grabowski, W. W. and Morrison, H.: Modeling condensation in deep convection, J. Atmos. Sci., 74, 2247–2267, https://doi.org/10.1175/JAS-D-16-0255.1, 2017.
Grabowski, W. W. and Morrison, H.: Do ultrafine cloud condensation nuclei invigorate deep convection?, J. Atmos. Sci., 77, 2567–2583, https://doi.org/10.1175/JAS-D-20-0012.1, 2020.
Grell, G. A., Peckham, S. E., Schmitz, R., McKeen, S. A., Frost, G., Skamarock, W. C., and Eder, B.: Fully coupled “online” chemistry within the WRF model, Atmos. Environ., 39, 6957–6975, https://doi.org/10.1016/j.atmosenv.2005.04.027, 2005.
Guenther, A., Karl, T., Harley, P., Wiedinmyer, C., Palmer, P. I., and Geron, C.: Estimates of global terrestrial isoprene emissions using MEGAN (Model of Emissions of Gases and Aerosols from Nature), Atmos. Chem. Phys., 6, 3181–3210, https://doi.org/10.5194/acp-6-3181-2006, 2006.
Haywood, J. and Boucher, O.: Estimates of the direct and indirect radiative forcing due to tropospheric aerosols: A review, Rev. Geophys., 38, 513–543, https://doi.org/10.1029/1999rg000078, 2000.
Houze, R. A.: Cloud dynamics, 2. edn., Elsevier Academic Press, Amsterdam, The Netherlands, 2014.
Iacono, M. J., Delamere, J. S., Mlawer, E. J., Shephard, M. W., Clough, S. A., and Collins, W. D.: Radiative forcing by long-lived greenhouse gases: Calculations with the AER radiative transfer models, J. Geophys. Res.-Atmos., 113, D13103, https://doi.org/10.1029/2008jd009944, 2008.
Janjić, Z. I.: The Step-Mountain Eta Coordinate Model – Further Developments of the Convection, Viscous Sublayer, and Turbulence Closure Schemes, Mon. Weather Rev., 122, 927–945, https://doi.org/10.1175/1520-0493(1994)122<0927:Tsmecm>2.0.Co;2, 1994.
Khain, A. and Lynn, B.: Simulation of a supercell storm in clean and dirty atmosphere using weather research and forecast model with spectral bin microphysics, J. Geophys. Res.-Atmos., 114, D19209, https://doi.org/10.1029/2009jd011827, 2009.
Khain, A., Pokrovsky, A., Pinsky, M., Seifert, A., and Phillips, V.: Simulation of effects of atmospheric aerosols on deep turbulent convective clouds using a spectral microphysics mixed-phase cumulus cloud model. Part I: Model description and possible applications, J. Atmos. Sci., 61, 2963–2982, https://doi.org/10.1175/Jas-3350.1, 2004.
Khain, A., Rosenfeld, D., and Pokrovsky, A.: Aerosol impact on the dynamics and microphysics of deep convective clouds, Q. J. Roy. Meteor. Soc., 131, 2639–2663, https://doi.org/10.1256/qj.04.62, 2005.
Khain, A., Lynn, B., and Dudhia, J.: Aerosol Effects on Intensity of Landfalling Hurricanes as Seen from Simulations with the WRF Model with Spectral Bin Microphysics, J. Atmos. Sci., 67, 365–384, https://doi.org/10.1175/2009jas3210.1, 2010.
Khain, A. P., BenMoshe, N., and Pokrovsky, A.: Factors determining the impact of aerosols on surface precipitation from clouds: An attempt at classification, J. Atmos. Sci., 65, 1721–1748, https://doi.org/10.1175/2007jas2515.1, 2008.
Khain, A. P., Leung, L. R., Lynn, B., and Ghan, S.: Effects of aerosols on the dynamics and microphysics of squall lines simulated by spectral bin and bulk parameterization schemes, J. Geophys. Res.-Atmos., 114, D22203, https://doi.org/10.1029/2009jd011902, 2009.
Khain, A. P., Beheng, K. D., Heymsfield, A., Korolev, A., Krichak, S. O., Levin, Z., Pinsky, M., Phillips, V., Prabhakaran, T., Teller, A., van den Heever, S. C., and Yano, J. I.: Representation of microphysical processes in cloud-resolving models: Spectral (bin) microphysics versus bulk parameterization, Rev. Geophys., 53, 247–322, https://doi.org/10.1002/2014rg000468, 2015.
Koren, I., Dagan, G., and Altaratz, O.: From aerosol-limited to invigoration of warm convective clouds, Science, 344, 1143–1146, https://doi.org/10.1126/science.1252595, 2014.
Korolev, A., and Mazin, I.: Supersaturation of water vapor in clouds, J. Atmos. Sci., 60, 2957–2974, 2003.
Lebo, Z.: A Numerical Investigation of the Potential Effects of Aerosol-Induced Warming and Updraft Width and Slope on Updraft Intensity in Deep Convective Clouds, J. Atmos. Sci., 75, 535–554, https://doi.org/10.1175/Jas-D-16-0368.1, 2018.
Lebo, Z. J. and Seinfeld, J. H.: Theoretical basis for convective invigoration due to increased aerosol concentration, Atmos. Chem. Phys., 11, 5407–5429, https://doi.org/10.5194/acp-11-5407-2011, 2011.
Lebo, Z. J., Morrison, H., and Seinfeld, J. H.: Are simulated aerosol-induced effects on deep convective clouds strongly dependent on saturation adjustment?, Atmos. Chem. Phys., 12, 9941–9964, https://doi.org/10.5194/acp-12-9941-2012, 2012.
Lee, S. S., Li, Z., Zhang, Y., Yoo, H., Kim, S., Kim, B.-G., Choi, Y.-S., Mok, J., Um, J., Choi, K. O., and Dong, D.: Effects of model resolution and parameterizations on the simulations of clouds, precipitation, and their interactions with aerosols, Atmos. Chem. Phys., 18, 13–29, https://doi.org/10.5194/acp-18-13-2018, 2018.
Li, G. H., Wang, Y., and Zhang, R. Y.: Implementation of a two-moment bulk microphysics scheme to the WRF model to investigate aerosol-cloud interaction, J. Geophys. Res.-Atmos., 113, D15211, https://doi.org/10.1029/2007jd009361, 2008.
Li, X. W., Tao, W. K., Khain, A. P., Simpson, J., and Johnson, D. E.: Sensitivity of a Cloud-Resolving Model to Bulk and Explicit Bin Microphysical Schemes. Part I: Comparisons, J. Atmos. Sci., 66, 3–21, https://doi.org/10.1175/2008jas2646.1, 2009.
Li, Z. Q., Niu, F., Fan, J. W., Liu, Y. G., Rosenfeld, D., and Ding, Y. N.: Long-term impacts of aerosols on the vertical development of clouds and precipitation, Nat. Geosci., 4, 888–894, https://doi.org/10.1038/Ngeo1313, 2011.
Loftus, A. M. and Cotton, W. R.: Examination of CCN impacts on hail in a simulated supercell storm with triple-moment hail bulk microphysics, Atmos. Res., 147, 183–204, https://doi.org/10.1016/j.atmosres.2014.04.017, 2014.
Lohmann, U. and Feichter, J.: Global indirect aerosol effects: a review, Atmos. Chem. Phys., 5, 715–737, https://doi.org/10.5194/acp-5-715-2005, 2005.
Milbrandt, J. A. and Yau, M. K.: A multimoment bulk microphysics parameterization. Part II: A proposed three-moment closure and scheme description, J. Atmos. Sci., 62, 3065–3081, https://doi.org/10.1175/Jas3535.1, 2005.
Morrison, H.: On the robustness of aerosol effects on an idealized supercell storm simulated with a cloud system-resolving model, Atmos. Chem. Phys., 12, 7689–7705, https://doi.org/10.5194/acp-12-7689-2012, 2012.
Morrison, H. and Grabowski, W. W.: Comparison of bulk and bin warm-rain microphysics models using a kinematic framework, J. Atmos. Sci., 64, 2839–2861, 2007.
Morrison, H. and Grabowski, W. W.: Modeling supersaturation and subgrid-scale mixing with two-moment bulk warm microphysics, J. Atmos. Sci., 65, 792–812, https://doi.org/10.1175/2007JAS2374.1, 2008.
Morrison, H., and Milbrandt, J.: Comparison of Two-Moment Bulk Microphysics Schemes in Idealized Supercell Thunderstorm Simulations, Mon. Weather Rev., 139, 1103–1130, https://doi.org/10.1175/2010mwr3433.1, 2011.
Morrison, H., Curry, J. A., and Khvorostyanov, V. I.: A new double-moment microphysics parameterization for application in cloud and climate models. Part I: Description, J. Atmos. Sci., 62, 1665–1677, https://doi.org/10.1175/Jas3446.1, 2005.
Morrison, H., Thompson, G., and Tatarskii, V.: Impact of Cloud Microphysics on the Development of Trailing Stratiform Precipitation in a Simulated Squall Line: Comparison of One- and Two-Moment Schemes, Mon. Weather Rev., 137, 991–1007, https://doi.org/10.1175/2008mwr2556.1, 2009.
Pinsky, M., Mazin, I. P., Korolev, A., and Khain, A. P.: Supersaturation and diffusional droplet growth in liquid clouds, J. Atmos. Sci., 70, 2778–2793, 2013.
Politovich, M. K. and Cooper, W. A.: Variability of the supersaturation in cumulus clouds, J. Atmos. Sci., 45, 1651–1664, https://doi.org/10.1175/1520-0469(1988)045,1651:VOTSIC.2.0.CO;2, 1988.
Rosenfeld, D., Lohmann, U., Raga, G. B., O'Dowd, C. D., Kulmala, M., Fuzzi, S., Reissell, A., and Andreae, M. O.: Flood or drought: How do aerosols affect precipitation?, Science, 321, 1309–1313, https://doi.org/10.1126/science.1160606, 2008.
Rosenfeld, D., Andreae, M. O., Asmi, A., Chin, M., de Leeuw, G., Donovan, D. P., Kahn, R., Kinne, S., Kivekas, N., Kulmala, M., Lau, W., Schmidt, K. S., Suni, T., Wagner, T., Wild, M., and Quaas, J.: Global observations of aerosol-cloud-precipitation-climate interactions, Rev. Geophys., 52, 750–808, https://doi.org/10.1002/2013rg000441, 2014.
Rosenfeld, D., Zheng, Y. T., Hashimshoni, E., Pohlker, M. L., Jefferson, A., Pohlker, C., Yu, X., Zhu, Y. N., Liu, G. H., Yue, Z. G., Fischman, B., Li, Z. Q., Giguzin, D., Goren, T., Artaxo, P., Barbosa, H. M. J., Poschl, U., and Andreae, M. O.: Satellite retrieval of cloud condensation nuclei concentrations by using clouds as CCN chambers, P. Natl. Acad. Sci. USA, 113, 5828–5834, https://doi.org/10.1073/pnas.1514044113, 2016.
Salamanca, F. and Martilli, A.: A new Building Energy Model coupled with an Urban Canopy Parameterization for urban climate simulations-part II. Validation with one dimension off-line simulations, Theor. Appl. Climatol., 99, 345–356, https://doi.org/10.1007/s00704-009-0143-8, 2010.
Sheffield, A. M., Saleeby, S. M., and van den Heever, S. C.: Aerosol-induced mechanisms for cumulus congestus growth, J. Geophys. Res.-Atmos., 120, 8941–8952, https://doi.org/10.1002/2015jd023743, 2015.
Skamarock, W. C., Klemp, J. B., Dudhia, J., Gill, D. O., Barker, D. M., Duda, M., Huang, X. Y., Wang, W., and Powers, J. G.: A description of the advanced research WRF version 3, NCAR, Tech. Note, Mesoscale and Microscale Meteorology Division, National Center for Atmospheric Research, Boulder, Colorado, USA, 2008.
Stevens, B. and Feingold, G.: Untangling aerosol effects on clouds and precipitation in a buffered system, Nature, 461, 607–613, 2009.
Storer, R. L., van den Heever, S. C., and Stephens, G. L.: Modeling Aerosol Impacts on Convective Storms in Different Environments, J. Atmos. Sci., 67, 3904–3915, https://doi.org/10.1175/2010jas3363.1, 2010.
Tao, W. and Li, X.: The relationship between latent heating, vertical velocity, and precipitation processes: The impact of aerosols on precipitation in organized deep convective systems, J. Geophys. Res.-Atmos., 121, 6299–6320, 2016.
van den Heever, S. C., Stephens, G. L., and Wood, N. B.: Aerosol indirect effects on tropical convection characteristics under conditions of radiative-convective equilibrium, J. Atmos. Sci., 68, 699–718, 2011.
Varble, A.: Erroneous attribution of deep convective invigoration to aerosol concentration, J. Atmos. Sci., 75, 1351–1368, 2018.
Wang, Y., Fan, J. W., Zhang, R. Y., Leung, L. R., and Franklin, C.: Improving bulk microphysics parameterizations in simulations of aerosol effects, J. Geophys. Res.-Atmos., 118, 5361–5379, https://doi.org/10.1002/jgrd.50432, 2013.
Wiedinmyer, C., Akagi, S. K., Yokelson, R. J., Emmons, L. K., Al-Saadi, J. A., Orlando, J. J., and Soja, A. J.: The Fire INventory from NCAR (FINN): a high resolution global model to estimate the emissions from open burning, Geosci. Model Dev., 4, 625–641, https://doi.org/10.5194/gmd-4-625-2011, 2011.
Yuan, T. L., Li, Z. Q., Zhang, R. Y., and Fan, J. W.: Increase of cloud droplet size with aerosol optical depth: An observation and modeling study, J. Geophys. Res.-Atmos., 113, D04201, https://doi.org/10.1029/2007jd008632, 2008.
Zaveri, R. A., and Peters, L. K.: A new lumped structure photochemical mechanism for large‐scale applications, J. Geophys. Res., 104, 30387–30415, https://doi.org/10.1029/1999JD900876, 1999.
Zaveri, R. A., Easter, R. C., Fast, J. D., and Peters, L. K.: Model for Simulating Aerosol Interactions and Chemistry (MOSAIC), J. Geophys. Res.-Atmos., 113, D13204, https://doi.org/10.1029/2007jd008782, 2008.