the Creative Commons Attribution 4.0 License.
the Creative Commons Attribution 4.0 License.
 | 10 Feb 2021
Emission inventory of air pollutants and chemical speciation for specific anthropogenic sources based on local measurements in the Yangtze River Delta region, China
Jingyu An
Yiwei Huang
Xin Wang
Rusha Yan
Qian Wang
Hongli Wang
Sheng'ao Jing
Yan Zhang
Yiming Liu
Yuan Chen
Chang Xu
Liping Qiao
Min Zhou
Shuhui Zhu
Qingyao Hu
Jun Lu
Changhong Chen
A high-resolution air pollutant emission inventory for the Yangtze River Delta (YRD) region was updated for 2017 using emission factors and chemical speciation based mainly on local measurements in this study. The inventory included 424 non-methane volatile organic compounds (NMVOCs) and 43 fine particulate matter (PM2.5) species from 259 specific sources. The total emissions of SO2, NOx, CO, NMVOCs, PM10, PM2.5, and NH3 in the YRD region in 2017 were 1552, 3235, 38 507, 4875, 3770, 1597, and 2467 Gg, respectively. SO2 and CO emissions were mainly from boilers, accounting for 49 % and 73 % of the total. Mobile sources dominated NOx emissions, contributing 57 % of the total. NMVOC emissions, mainly from industrial sources, made up 61 % of the total. Dust sources accounted for 55 % and 28 % of PM10 and PM2.5 emissions, respectively. Agricultural sources accounted for 91 % of NH3 emissions. Major PM2.5 species were OC, Ca, Si, PSO4, and EC, accounting for 9.0 %, 7.0 %, 6.4 %, 4.6 %, and 4.3 % of total PM2.5 emissions, respectively. The main species of NMVOCs were aromatic hydrocarbons, making up 25.3 % of the total. Oxygenated volatile organic compounds (OVOCs) contributed 21.9 % of the total NMVOC emissions. Toluene had the highest comprehensive contribution to ozone (O3) and secondary organic aerosol (SOA) formation potentials, while other NMVOCs included 1,2,4-trimethylbenzene, m,p-xylene, propylene, ethene, o-xylene, and ethylbenzene. Industrial process and solvent-use sources were the main sources of O3 and SOA formation potential, followed by motor vehicles. Among industrial sources, chemical manufacturing, rubber and plastic manufacturing, appliance manufacturing, and textiles made significant contributions. This emission inventory should provide scientific guidance for future control of air pollutants in the YRD region of China.
- Article
(5295 KB) - Full-text XML
-
Supplement
(1245 KB) - BibTeX
- EndNote


Air pollutant emissions from anthropogenic sources have attracted considerable attention due to their adverse impact on air quality (Monks et al., 2009), human health (Guan et al., 2016; Requia et al., 2018), and climate change (Fiore et al., 2012). Air pollutants include gaseous compounds such as sulfur dioxide (SO2), nitrogen oxides (NOx), carbon monoxide (CO), non-methane volatile organic compounds (NMVOCs), ammonia (NH3), and particulate matter (PM) defined by diameters that are generally less than 10 µm, e.g., PM10 and PM2.5 µm. NMVOCs are a large and diverse group of organic compounds, such as alkanes, alkenes, aromatic hydrocarbons, and oxygenated volatile organic compounds (OVOCs). They are key precursors of ozone (O3) and secondary organic aerosols (SOAs). PM2.5 are complex aggregates composed of, e.g., sulfate (SO), nitrate (NO), ammonium (NH), organic carbon (OC), elemental carbon (EC), and various elements. They can degrade atmospheric visibility and adversely affect human health (Qiao et al., 2014; Liang et al., 2016).
The emission inventory (EI) is an important tool for air pollution source apportionment, air quality forecasting, and decision-making in air pollution control. In the last 2 decades, EIs have improved on both global and regional scales. According to a recent EI, anthropogenic emissions have shown increasing trends on a global scale (Janssens-Maenhout et al., 2015; Klimont et al., 2017; Crippa et al., 2018; Hoesly et al., 2018). China's air pollutant EI was at a higher level compared with the rest of the world due to increasing energy consumption, urbanization, and vehicle population. However, China's emissions are undergoing dramatic changes, especially in key regions such as the Jing-Jin-Ji, Yangtze River Delta (YRD), and Pearl River Delta, which have seen the introduction of air pollution prevention and control measures in recent years (Cai et al., 2018; Zheng et al., 2018). Consequently, updating the national EI has become an important requirement.
The YRD region in eastern China, which includes the areas of Jiangsu, Zhejiang, Anhui, and Shanghai, accounts for a significant proportion of China's population and gross domestic product (GDP). A rapidly growing economy and increased urbanization have resulted in the highest emission levels in China for this region. Data recently released by the multi-resolution EI for China (MEIC; http://meicmodel.org/, last access: 15 January 2020) showed that emissions of SO2, NOx, NMVOCs, PM2.5, and NH3 per unit area in the YRD region were 2.3, 4.5, 5.2, 3.4, and 3.0 times, respectively, that of the national average. To understand the emission levels for the YRD region, Huang et al. (2011) established an EI for the core cities in 2007; Fu et al. (2013) updated the EI for Jiangsu, Zhejiang, and Shanghai in 2010 and refined the inventory of PM2.5 and NMVOC speciation. In the last 5 years, only individual provinces (Zhou et al., 2017) and some sources were updated with the progress of method and data. Fan et al. (2016) established a highly resolved ship emission inventory for 2010 based on automatic identification system (AIS) data over the YRD region and the East China Sea. Huang et al. (2018a) developed a non-road machinery emission inventory for 2014 based on local surveys in the cities of YRD. Zhang et al. (2020) further developed a “grid-based” (30×30 m) inventory of agricultural machinery with daily emissions for 2015 by combining satellite data, land, and soil information and in-house investigation. R. N. Wang et al. (2018) established an emission inventory of civil aviation for landing takeoff (LTO) cycles for 2017. Yang and Zhao (2019) estimated air pollutant emissions from open biomass burning for 2005–2015 using three (traditional bottom-up, fire radiative power, FRP, and constraining) approaches. Zhao et al. (2020) developed a NH3 emission inventory for 2014 based on dynamic emission factors (EFs) and activity data integrating the local information of soil, meteorology, and agricultural processes. These studies provided novel methods for emission estimation and expanded our understanding of the emissions over the YRD region. However, with the implementation of air pollution prevention and control measures, PM2.5 pollution in the YRD region has improved significantly in recent years as the region's energy, industry, and vehicle infrastructures have been modified accordingly (Zheng et al., 2016; Wang et al., 2017; S. J. Zhang et al., 2017). A comprehensive update of activity levels and sources in the YRD region could assist with accurate air quality simulations and emission reduction measures.
In addition to activity levels, speciation profiles of PM2.5 and NMVOC emissions are required to improve the performance of chemical transport models (CTMs) that simulate O3 mixing ratios and PM2.5 concentrations. Source profiles from the US EPA (Environmental Protection Agency) repository of organic gas and PM speciation profiles of air pollution sources (SPECIATE) have been commonly used for source apportionment and to create speciated EI for air quality modeling since the 1990s (Simon et al., 2010). However, the emission characteristics of anthropogenic sources can vary considerably between different regions. Differences in fuel properties, operating conditions, raw materials, and after-treatment techniques can result in inconsistent speciation profiles for PM2.5 and NMVOCs. A previous study indicated that use of speciation profiles from the SPECIATE database had relatively poor model performance for trace elements at an urban site in Beijing, China (Ying et al., 2018). The emission estimates for individual NMVOC species varied by 1 to 3 orders of magnitude for some species when different sets of speciation profiles were used, which could result in significant deviations in the outputs of O3 and SOA simulations (Li et al., 2014; Zhao et al., 2017; Stroud et al., 2018; P. Wang et al., 2018). Consequently, detailed and observation-based emissions of individual speciated PM2.5 and NMVOCs have become essential for an accurate CTM.
In this study, we updated an anthropogenic air pollutant EI for the 2017 YRD region using EFs and PM2.5 and NMVOC speciation profiles mainly derived from local measurements. The pollutants included SO2, NOx, CO, NMVOCs, PM10, PM2.5, and NH3; the NMVOC comprised 424 individual species such as alkanes, alkenes, aromatic hydrocarbons, haloalkanes, and OVOCs; and 43 PM2.5 species contained organic carbon (OC), elemental carbon (EC), ions, and elements. To obtain detailed emissions sources, the EI was refined into four categories, broadly based on fuel types, industrial sectors, equipment types, and emission levels, to give a total of 259 specific emission sources. Finally, the EI was validated using the Community Multiscale Air Quality (CMAQ) modeling system and observations from 2017 in the YRD region.
2.1 Study domain
The YRD region in this study covers the three provinces of Jiangsu, Zhejiang, and Anhui, as well as the Shanghai municipality. The region has a land area of approximately 350 400 km2, accounting for 3.7 % of the whole of China. The GDP for the region was USD 2893 billion in 2017, i.e., ∼24 % of the total national GDP in that year, and has been growing at a rate of ∼9.3 % per year in the last decade (NBSC, 2018). Correspondingly, the region consumed 717.8 million coal equivalent tons of energy, which was ∼17 % of the national total in 2017. Coal is the main energy type in the YRD, contributing ∼60 % of the total energy consumption (NBSC, 2018). The automobile population reached 40.9 million in 2017, accounting for 19.6 % of the total in China. The region also has a high concentration of traditional industries, producing 13.9 %, 11.3 %, 9.0 %, 18.2 %, and 19.1 % of the total production of gasoline, diesel, coke, cement, and crude steel, respectively, in China in 2017 (NBSC, 2018). Figure 1 shows the domain of the YRD region in this study. The coastal waters within the dashed line on the expanded image of the region are China's ship emission control areas. The ship emissions used in this study were a combination of emissions from this region and the inland waters of the YRD region.

Figure 1The domain of the YRD region in this study. Coastal waters within the dashed line on the expanded image represent ship emission control areas.
2.2 Sources classification
The EI was separated into four main categories. The first category was subdivided into nine major sources, including stationary combustion, industrial process, industrial solvent use, mobile, dust, oil storage and transportation, residential, waste treatment and disposal, and agricultural. The second category comprised 36 source types mainly based on combustion facilities and the industrial, transportation, residential, and agriculture sectors. The third category comprised 127 sources classified mainly by fuel, product, and material types. The fourth category included sources by combustion types, emission segments, and control levels. The detailed classification is shown in Table S1 in the Supplement.
2.3 Emission estimation methods
The emissions of SO2, PM10, and PM2.5 from stationary combustion sources were calculated using the mass balance method according to Eqs. (1) and (2). Other pollutant emissions were calculated using the EF method, given by Eq. (3).
where and EPM represent the emissions of SO2 and PM10 or PM2.5 (t), S and A represent fuel sulfur content and ash in fuel (%), F is the fuel consumption (t), CS and CA are the conversion efficiencies from sulfur and ash to SO2 and PM (%), Pratio is the mass percentage of PM10 or PM2.5 in total PM, and ηPM represent the removal efficiency of SO2 and PM10 or PM2.5, Ei,j represents the emissions of pollutant i from source j (t), ALj is the activity data of source j, such as fuel consumption, product output, and raw material consumption, EFi,j is the EF of pollutant i from source j (kg per activity data), and Hi,j is the removal efficiency of pollutant i from source j.
Emissions from the industrial process sources were calculated using the EF method shown in Eq. (3). For large point sources, we established a segment-based emission estimation method based on local surveys. For example, we subdivided the ferrous metal manufacturing industry into raw material yard, iron making (including sintering, pelletizing, and blast furnace), steel making (including converter and electric furnace), casing steel, rolling steel, and ferroalloy production. The petroleum refining industry was subdivided into eight segments including process devices, equipment leak, storage tank, bulk loading, flare, wastewater treatment, cooling tower, and petrochemical furnace. The activity data and EFs of each segment were both derived from on-site surveys and measurements. Emissions from industrial solvent-use sources were calculated using the mass balance method based on the consumption and NMVOC content of solvents, such as paints, coatings, inks, adhesives, thinners, etc. Small amounts of NMVOC remaining in products, wastewater, and waste were not considered in this calculation. The solvent consumption and their volatile organic compound (VOC) content of large point sources were mainly from field surveys and then extended to similar industries and solvent varieties.
For motor vehicles, the International Vehicle Emissions (IVE) model was used to calculate the emissions. However, the EFs and activity data for driving conditions, fleet composition, vehicle mileage traveled (VMT), and meteorological parameters in the model were restricted to real-world measurements and surveys. Non-road machinery emissions were estimated from the NONROAD model (USEPA, 2010), which was based on fuel consumption and fuel-based EFs. Fuel consumption was calculated from the population, working hours, and fuel consumption rate per hour derived from local surveys in typical cities like Shanghai and Hangzhou. The method was introduced in our previous study (Huang et al., 2018a). Limited by the data source, we have not achieved a daily resolved emission estimation of agricultural machinery introduced by Zhang et al. (2020), which may cause higher uncertainty on its total amount and temporal and spatial distribution. Ship emissions were estimated according to the method of Fan et al. (2016) using an approach based on the AIS data. The civil aviation aircraft source included emissions defined by the International Civil Aviation Organization (ICAO) for LTO cycles, which included approach, taxi, takeoff, and climb. SO2 emissions from the civil aviation aircraft source were estimated using the mass balance method. The sulfur content in aviation fuel of 0.068 % was the default value provided in a previous study (Wayson et al., 2009). NOx, CO, and NMVOC emissions were estimated using the EF method as the product of fuel consumption rate and EFs. PM emissions were calculated using the first-order approximation (FOA3.0) method (Wayson et al., 2009). The rated thrust and working hours of the aircraft in each LTO cycle were referenced from the parameters recommended by ICAO. The climbing mode specified by ICAO referred to an altitude of ∼1 km from the end of takeoff to the top of the atmospheric boundary layer. However, since the height of the boundary layer was dependent on meteorological conditions, the Weather Research and Forecasting (WRF) model (version 3.9.1) was used to simulate the boundary layer height and correct the duration of the climbing mode. A detailed description of the method used for aviation emission estimation is provided in our previous study (R. N. Wang et al., 2018).
Emissions from other sources (dust, oil storage and transportation, residential, waste treatment and disposal, and agricultural) were all calculated using the EF method.
The emission estimation method of this study has been improved on the basis of our previous study (the latest version was for 2014) (Li et al., 2019; Ni et al., 2020). Table 1 shows the differences between the methods and data sources of this study and the previous one. First, the source category has been refined from the third-level 135 categories to the fourth-level 2812 categories. Among them, large point sources such as iron and steel and petroleum refining sectors were further subdivided into different emission segments. Secondly, in addition to the environmental statistics data, the activity data have been refined through local investigations on the removal technologies and efficiencies, operating hours, and working conditions of industrial and mobile sources including motor vehicles and non-road machinery; emissions from ships and aircraft, which were not considered in our previous study, were estimated based on dynamic activity data like AIS provided by local department. In terms of the EFs, most of them were corrected based on local measurements.
Table 1Comparison of the methods and data sources in this study with our previous study.

2.4 Activity data sources
Activity data related to the industrial sources (e.g., stationary combustion sources, industrial process and solvent-use sources) were mainly from the 2017 Environmental Statistics Database which contained information on fuel consumption, product output, raw material consumption, and removal technology and efficiencies. There were ∼ 30 000 major point sources for the YRD region in the database. However, the database did not include all the information like the technologies of NMVOC removal and their efficiencies, especially for the median and small-size factories. To obtain more detailed information, we have conducted more on-site investigations on the removal technologies and efficiencies of industrial sources in typical cities including Shanghai, Hangzhou, Suzhou, etc. According to the investigations, we classified the proportions of removal technologies and efficiencies to different industrial sectors and then extended them to the entire region. As environmental statistics do not include all industrial sources, we derived an area source using the difference between the total fuel consumption and product output in the statistical yearbook and the sum of environmental statistics for each city. To improve the accuracy of mobile source emissions, several local activity surveys (e.g., population, vehicle or machine type, fuel type, and emission standard) were conducted for motor vehicles, non-road machinery, and civil aviation aircraft. The activity data of ships were obtained from the AIS data for the East China Sea in 2017. The activity data of area sources were derived from the statistical yearbooks of cities in the YRD region. Sources of activity data not recorded in the statistical yearbooks (e.g., the number of construction sites, civil solvent usage, catering, biomass burning) were estimated from statistical data, such as population, building area, and crop yields. The biomass burning emissions in this study only included the emissions from household biomass-fueled stoves. Their activity data were estimated based on the crop yields and grain–straw ratios combined with the proportions of household burning in each city. The crop yields were obtained from the statistical yearbooks; the grain straw ratios and the proportions of household burning were derived from the surveys from the agricultural department. In 2017, the average household burning ratio of various types of straw was about 12 % (3 %–16 %) and 3 % in developed cities such as Shanghai; the highest ratios (16 %) were in the cities of Anhui Province, and the ratios in other cities were about 12 %. Table S2 summarizes the emission estimation methods, activity data sources, and their data reliability.
2.5 Determination of EFs
The EFs of each specific emission source were determined by local measurements (or surveys) in the YRD region, i.e., the domestic EI guidebook of China (MEP, 2014), and those given in the US EPA Compilation of Air Pollutant Emissions Factors (AP-42; USEPA, 2002) and the joint European Monitoring and Evaluation Programme (EMP) and European Environment Agency (EEA) datasets (EEA, 2013). To minimize uncertainty in the EI, this study localized the EFs from 80 source categories. This included the majority of anthropogenic emission sources, such as coal-fired power plants and boilers (Yao et al., 2009; Zhao et al., 2010; Wang et al., 2011; Lou, 2014; Sun, 2015; Xu et al., 2018), petroleum refining and ferrous metal manufacturing (Guo et al., 2017), gasoline and diesel vehicles (Huang et al., 2016, 2017, 2018b, c), non-road machinery (Fu et al., 2012, 2013; Ge et al., 2013; Qu et al., 2015; Li et al., 2016), emissions from cooking (H. L. Wang et al., 2018; Gao et al., 2019), livestock and poultry breeding (Chen, 2017; Zhou, 2019), N fertilizer application (Chen et al., 2017; Xia et al., 2018), and biomass burning (Tang et al., 2014). NMVOC EFs for some evaporation loss sources, such as industrial and residential solvent use, and oil storage and transportation, were estimated from the results of field surveys of typical sources in the YRD region. For sources that could not be measured or investigated, the EFs were obtained in the following order of preference: EI guidebook of China (MEP, 2014) > US EPA AP-42 (USEPA, 2002) > EMEP/EEA datasets (EEA, 2013). The EFs for each source and their references are provided in Table S1.
2.6 PM2.5 and NMVOC speciation
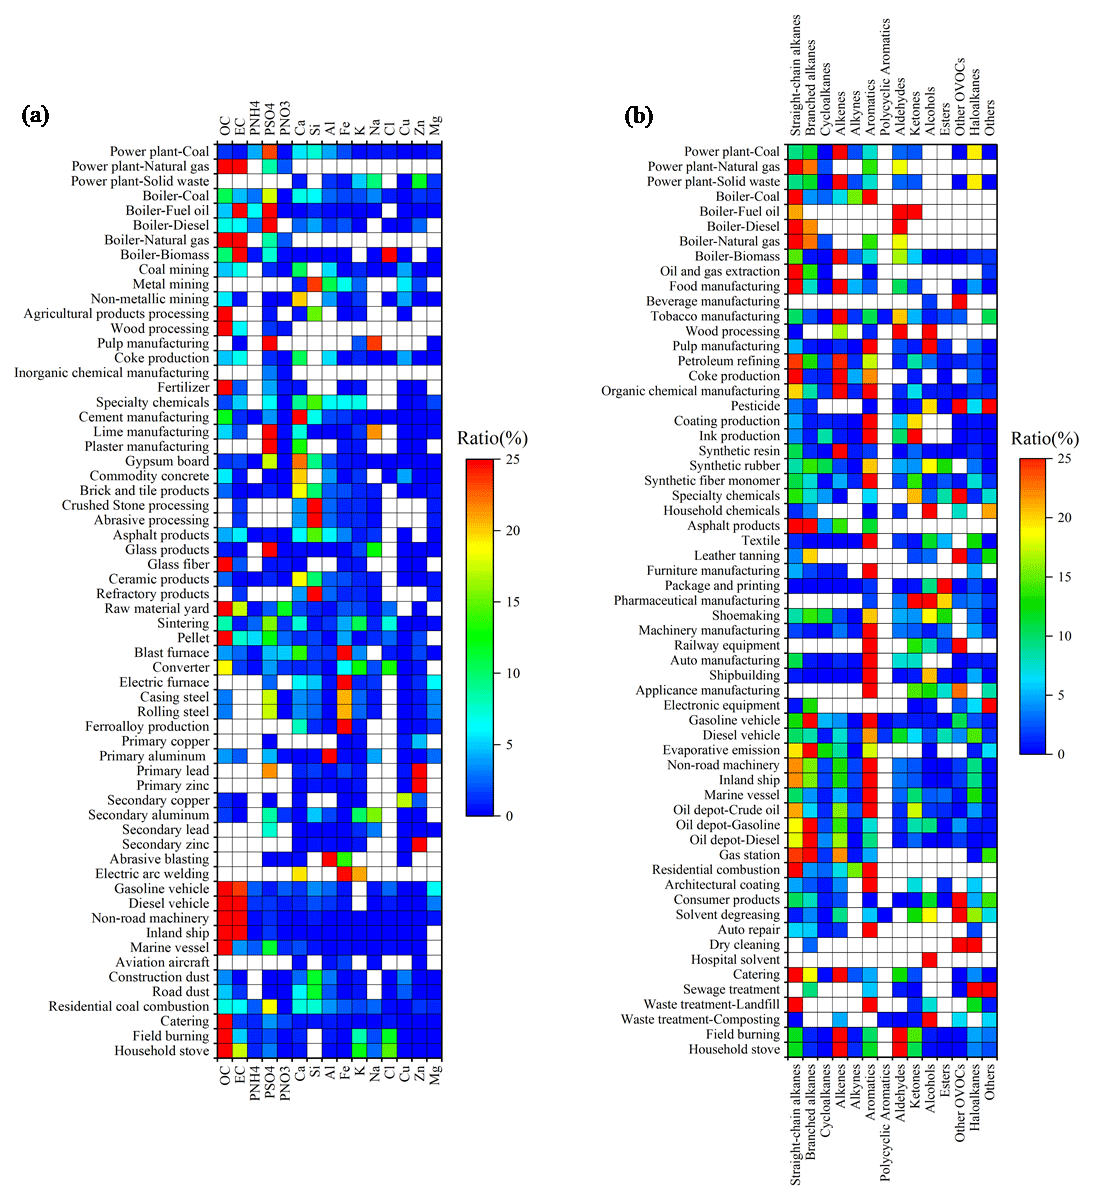
PM2.5 and NMVOC emissions were converted into profiles of individual species to simulate PM2.5 chemical components and O3 mixing ratios in the atmosphere. The profile for PM2.5 comprised 43 chemical species, including OC, EC, particulate sulfate (PSO4), nitrate (PNO3), and ammonium (PNH4), and 36 elemental components such as Na, Mg, K, Ca, Al, Si, etc. Additional species, such as particulate H2O, non-carbon organic matter, metal-bound oxygen, and other unspeciated PM2.5, were calculated according to the method of Reff et al. (2009). The profile for NMVOC included 96 alkanes, 45 alkenes and alkynes, 44 aromatic hydrocarbons, 164 OVOCs, 43 haloalkanes, and 32 other organic compounds.
The method used to determine the PM2.5 and NMVOC source profiles followed that used for the EFs, and data were preferentially selected as follows: local measurements > measurements from previous domestic studies > US EPA SPECIATE 4.4 database (Hsu et al., 2014). To improve the representativeness of source profiles in the inventory, the PM2.5 chemical compositions from 34 sources and the NMVOC chemical compositions from 64 sources were localized according to the measurements in the YRD region. Source categories used for the localized PM2.5 profiles included power plants, coal-fired boilers, ferrous metal manufacturing, gasoline and diesel vehicles, non-road machinery, ships, catering, and biomass burning (Zheng et al., 2013; Tang et al., 2014; Huang et al., 2016; Xu et al., 2018). The source categories used for the localized NMVOC profiles included coal combustion, gasoline and diesel vehicles, ships, catering, biomass burning, and the majority of industrial processes and solvent-use sources, such as petroleum refining, coke production, chemical manufacturing, textiles, furniture manufacturing, package and printing, auto manufacturing, shipbuilding, and architectural coating (Wang et al., 2014a, b, 2016, 2017a, b; Huang et al., 2018d; Gao et al., 2019). Detailed information concerning references, samples, and sampling and analytical methods for the sources are given in Table S3. For those species which could not be determined by analytical methods, the mass fraction data were supplemented with those obtained from the SPECIATE database. Figure 2 shows the PM2.5 and NMVOC speciation profiles for the major emission sources in the YRD region.
2.7 Spatial distributions
Emissions from industrial sources, e.g., power plants, boilers, industrial processes, and solvent-use sources, were allocated from the Environmental Statistics Database based on their geographical coordinates. Vehicle emissions were calculated from the mileage distributions of various vehicle categories on different types of road. The composition of traffic flow on different types of road was obtained from previous surveys in Shanghai and Hangzhou (Huang et al., 2015; Yang et al., 2017). The approach of spatial allocation for road dust was consistent with that used for vehicle emissions. The spatial distribution of emissions from non-road machinery varied depending on the type of machinery. The emissions from construction and agricultural machinery were allocated according to urban and farmland areas given in the 2015 land use data released by the European Space Agency (ESA) (https://www.esa-landcover-cci.org/, last access: 15 September 2019). Emissions from port and factory machinery and airport ground support equipment were assigned according to their geographical coordinates. Emissions from residential sources were assigned from population distribution data with a 1 km resolution. Emissions from agricultural sources were allocated from farmland areas in the land use data (ibid.).
2.8 Uncertainty analysis
Uncertainty was mainly derived from the activity data and EFs. The coefficients of variation in the activity data and EFs for each source were classified into seven grades in the range of 2 %–100 % using expert judgment. The coefficient of variation for the activity data was determined according to the data source. Environmental statistical data with specific source information were assigned the lowest coefficient of uncertainty (2 %), while activity data estimated from the statistical yearbooks, such as biomass burning, were assigned the highest uncertainty value (98 %). The coefficients of uncertainty for other activity data sources were assigned to be 18 %, 34 %, 50 %, 66 %, and 82 % in turn. The principle for assignments of the coefficients of variation for EFs was the same as the activity level. EFs derived from local measurements in the YRD region with large samples were assigned the lower coefficients of uncertainty (18 %), while those from the US EPA or the EMEP/EEA datasets were assigned higher coefficients (98 %). Then the uncertainty of each pollutant from each emission source can be combined by Eqs. (3)–(5). A detailed description of the analytical methods used can be found in our previous study (Huang et al., 2011).
where CV is the coefficient of variation of the emission rate, E is the emission rate, U is the uncertainty of the emission source, Ca is the uncertainty of activity data, Cf is the uncertainty of EF, and j and k represent pollutant and emission sources, respectively.
2.9 Model configurations
To verify the reliability of the EI, we used CMAQ (version 5.3) to simulate the concentrations of SO2, NO2, PM2.5, PM10, O3, and CO in the YRD region for January and July 2017 and compared these with the observation data for each city in the region. The meteorological field for the CMAQ model was obtained from the WRF model (version 3). The EI developed in this study was then used to produce an emission system for the YRD region, while emissions beyond the YRD were obtained from the MEIC 2016. The anthropogenic data were then combined with biogenic data obtained from the Model of Emissions of Gases and Aerosols from Nature modelling system (version 2.10) as the final input for the EI of the model. Figure S1 and Table S6 in the Supplement show the domain and settings for the model system. Detailed information is provided in Sect. S6 of the Supplement.
2.10 Estimation of O3 and SOA formation potentials
To characterize the regional O3 and SOA formation contributions of different NMVOC species and their sources, we used the O3 formation potential (OFP) and SOA formation potential (SOAP) methods of estimation. OFP and SOAP were obtained from the sum of the individual NMVOC species emissions multiplied by the maximum incremental reactivity (MIR) and SOA yield, respectively. MIR and SOA yield for individual NMVOC species were obtained from previous studies (Carter, 1994; Wu and Xie, 2018a, b). The estimation methods are shown in Eqs. (7) and (8).
where OFPi and SOAPi are the ozone formation potential and SOA formation potential of source i, respectively, Ei,j is the VOC emission of species i, MIRj is the maximum increment reactivity for the jth chemical species, and Yj is the SOA yield for the jth chemical species.
3.1 Emission and source contributions
3.1.1 Emissions and comparisons with previous studies
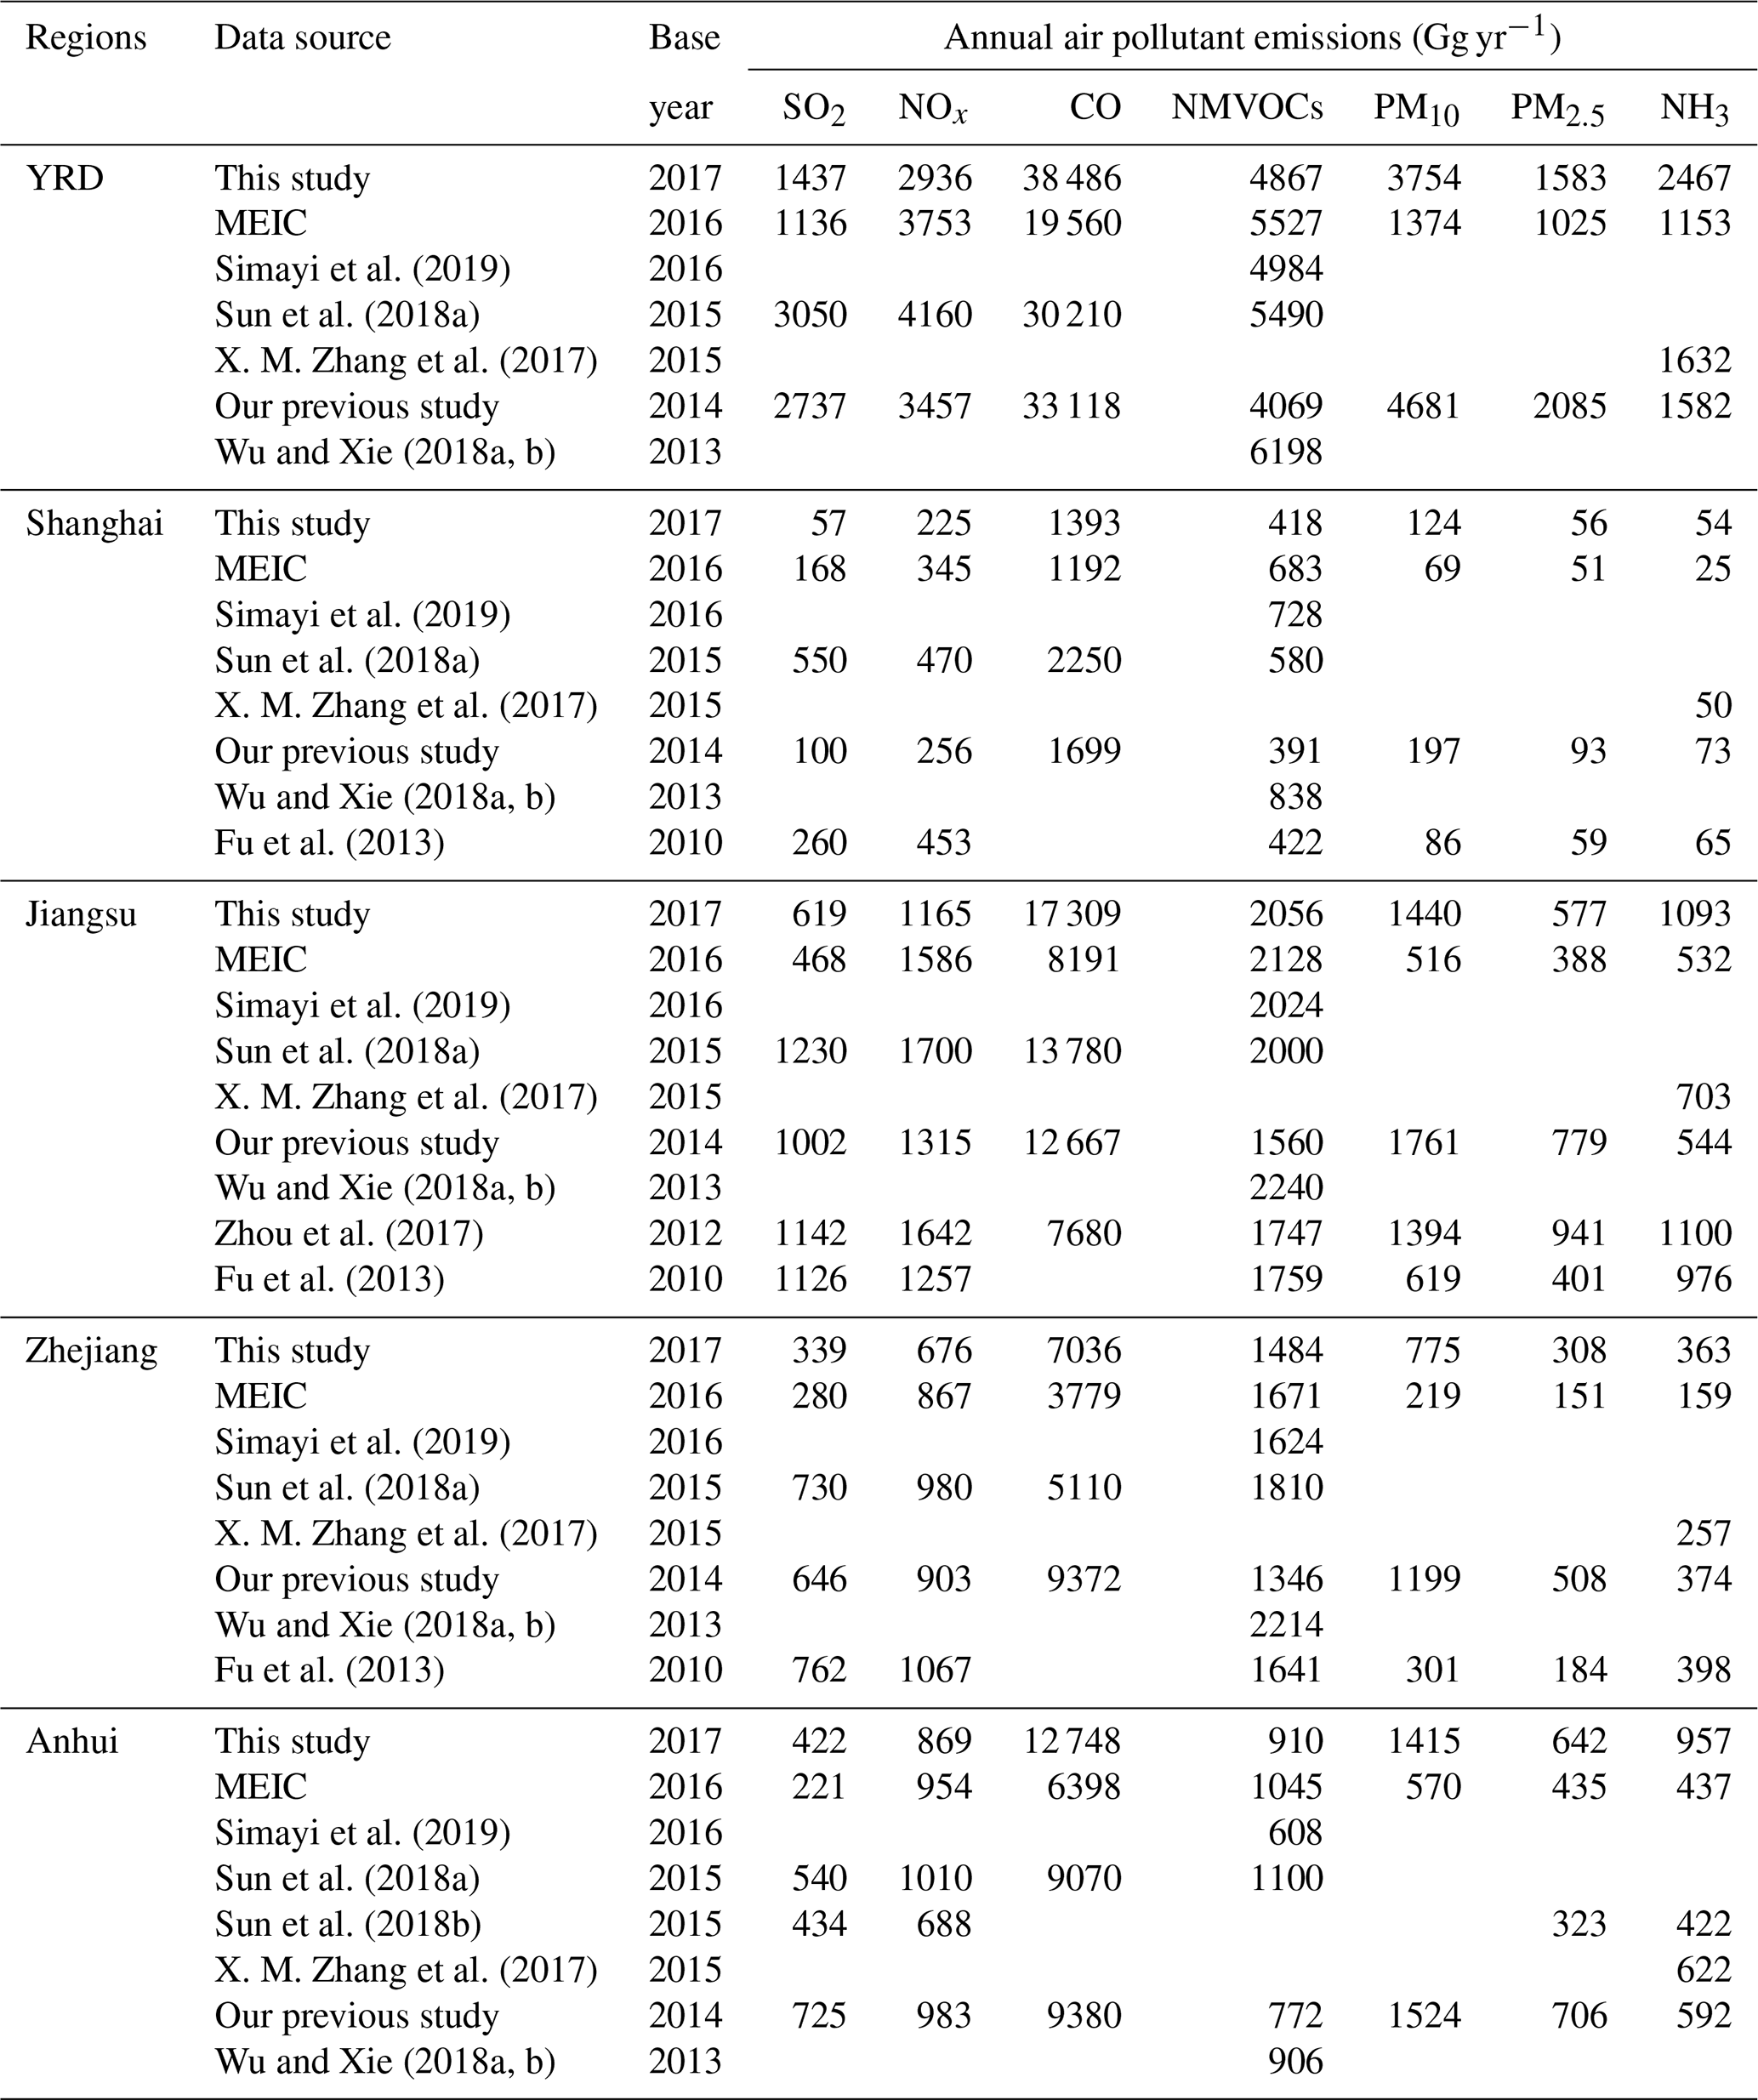
The total emissions of SO2, NOx, CO, NMVOCs, PM10, PM2.5, and NH3 in the YRD region for the year of 2017 were 1552, 3235, 38 507, 4875, 3770, 1597, and 2467 Gg, respectively. Excluding ship emissions, the air pollutant emissions were 1437, 2936, 38 486, 4867, 3754, 1583, and 2467 Gg, respectively. Detailed information of air pollutant emissions for each city is shown in Table S1.
Table 2 shows the estimated emissions for the YRD region and their comparison with previous studies. SO2 emissions were close to those from the MEIC in 2016 and much lower than those reported in 2015. Emission reductions from coal-fired facilities, including power plants and boilers, could be the main reason for the significant decline in SO2 emissions (Zheng et al., 2018). NOx emissions were generally lower than the results from previous studies. Some modeling and satellite studies verified that the NOx emissions in previous studies were overestimated partly due to improvements in NOx control measures for the power sector which were not considered at that time (Zhao et al., 2018; Sha et al., 2019). The NOx EFs for coal-fired power plants and boilers in this study were derived from local measurements which were generally lower than those in previous studies, so the NOx emissions from the power sector were 47 % lower than those from the MEIC. CO emissions were higher than the MEIC results but similar to those reported by Sun et al. (2018a). NMVOC emissions for key sources in this study were individually estimated using the “bottom-up” method, so the estimates were lower than those using the “top-down” approach. In addition, most of the EFs selected in this study were detailed into different process segments, which were generally lower than the comprehensive EFs used for whole industrial sectors in previous studies. Since dust sources were not included in the MEIC inventory, PM10 and PM2.5 emissions estimated in this study were 1.7 and 0.5 times higher, respectively. A previous study also showed that NH3 emissions in China were underestimated mainly due the application of lower emission rates from fertilizer applications and livestock and the omission of other sources (X. M. Zhang et al., 2017). Therefore, we used locally measured NH3 EFs for fertilizer application and some of the livestock breeding sources in the YRD region. NH3 emissions from the transportation sector were also higher (by a factor of 2.8) than those from the MEIC due to the localized NH3 EFs from light-duty gasoline vehicles (Huang et al., 2018c) used in this study. In addition, NH3 slip from selective catalyst reduction devices in the power sector (not included in previous studies) was also considered in this study.
Compared with our previous inventory for 2014 (Li et al., 2019; Ni et al., 2020), SO2, NOx, PM10, and PM2.5 emissions in the YRD region have decreased by 47 %, 15 %, 20 %, and 24 %, respectively, which are consistent with the trends of regional air quality improvement (SO2 44 %, NO2 5%, PM10 22 %, PM2.5 27 %). However, it should be noted that the approach of emission estimation in this study has made a number of localized corrections in terms of emission factors and activity data. For example, CO, NMVOC, and NH3 emissions have increased significantly compared to 2014, which is mainly because more point sources were included in this study, and more localized EFs, which were generally higher than those in previous studies, were applied to estimate NOx, CO, NMVOC, and NH3 emissions from solvent-use, motor vehicle, non-road machinery, and agricultural sources. Next, it is necessary to estimate the emission inventories by the same approach for different years to evaluate the changes in air pollutant emissions in recent years.
Table 2Air pollutant emissions in the YRD region and their comparison with other studies.
3.1.2 Source contributions
Figure 3 shows the emission contributions of the major air pollutants in the YRD region from the main category sources (a), industrial sector sources (b), and mobile sources (c). Further detailed information of emissions from each source is provided in Table S5. SO2 and CO emissions were mainly from boilers, accounting for 49 % and 73 % of the total emissions, respectively. Notably, emission contributions from power plants were significantly lower than those from previous inventories (MEIC, http://meicmodel.org/, last access: 15 January 2020; Zhou et al., 2017), resulting mainly from the implementation of stringent emission reduction measures in recent years (Wu et al., 2019; Zhang et al., 2019).
Mobile sources accounted for the majority (57 %) of NOx emissions in the YRD region, which was generally higher than contributions given in the MEIC and other EIs (Zhou et al., 2017; Sun et al., 2018a). Emission control measures for power plants had demonstrably reduced NOx emissions. In addition, ship emissions, which had not been included in previous studies, accounted for 16 % of NOx emissions from mobile sources in the YRD region (see Fig. 3c, “Marine”). Furthermore, NOx EFs for gasoline and diesel vehicles used in this study, derived from local measurements, were generally higher than those given by MEP (2014). Some real-world measurements based on portable emission measurement systems, on-road chasing, and tunnel experiments also indicated that the NOx emissions from vehicles in China were higher than expected probably due to deficiencies in the type-approval protocols and emission controls (Wu et al., 2012; Huang et al., 2017; Song et al., 2018; Wen et al., 2019).
Industrial sources accounted for the majority of total NMVOC emissions (61 %), of which industrial process and solvent-use sources contributed 34 % and 27 %, respectively. Mobile and residential sources contributed 20 % and 10 %, respectively. Dust sources were the main contributors to PM10 (55 %) and PM2.5 (28 %) emissions. Agricultural sources accounted for 91 % of NH3 emissions with minor contributions from residential (3 %) and mobile (1 %) sources. Although NH3 EFs from vehicles were considered in this study, their emissions were significantly lower than those from agricultural sources. However, vehicle emissions were mainly concentrated in urban areas where their contribution to NH3 emissions would be considerable.
Industrial emissions of SO2 and CO were mainly from the five major sectors of petroleum refining, coking, chemical manufacturing, non-metallic mineral manufacturing, and ferrous metal manufacturing. Non-metallic mineral manufacturing and ferrous metal manufacturing dominated the industrial NOx, PM10, and PM2.5 emissions. The top five industrial sector sources of NMVOCs emissions in the YRD region were chemical manufacturing, furniture and wood manufacturing, appliance manufacturing, rubber and plastic manufacturing, and non-metallic mineral manufacturing. These accounted for 27 %, 12 %, 9 %, 9 %, and 6 % of the total NMVOC emissions, respectively. Chemical manufacturing contributed to the majority of industrial NH3 emissions in the YRD region.
The ports and harbors of the YRD region are collectively the largest group in the world, and, as expected, emissions from the transportation of ships and heavy-duty trucks dominated the mobile source emissions. Ships accounted for 94 %, 16 %, 12 %, and 12 % of mobile source SO2, NOx, PM10, and PM2.5 emissions, respectively, while heavy-duty trucks contributed 31 %, 37 %, and 36 % to mobile source NOx, PM10, and PM2.5 emissions, respectively. Light-duty vehicles contributed significantly to CO, NMVOCs, and NH3 emissions, accounting for 61 %, 46%, and 90 %, respectively. Non-road machinery accounted for 27 %, 18 %, 12 %, 21 %, and 22 % of NOx, CO, NMVOCs, PM10, and PM2.5 emissions from mobile sources, respectively. Construction and agriculture machinery were also major contributors.
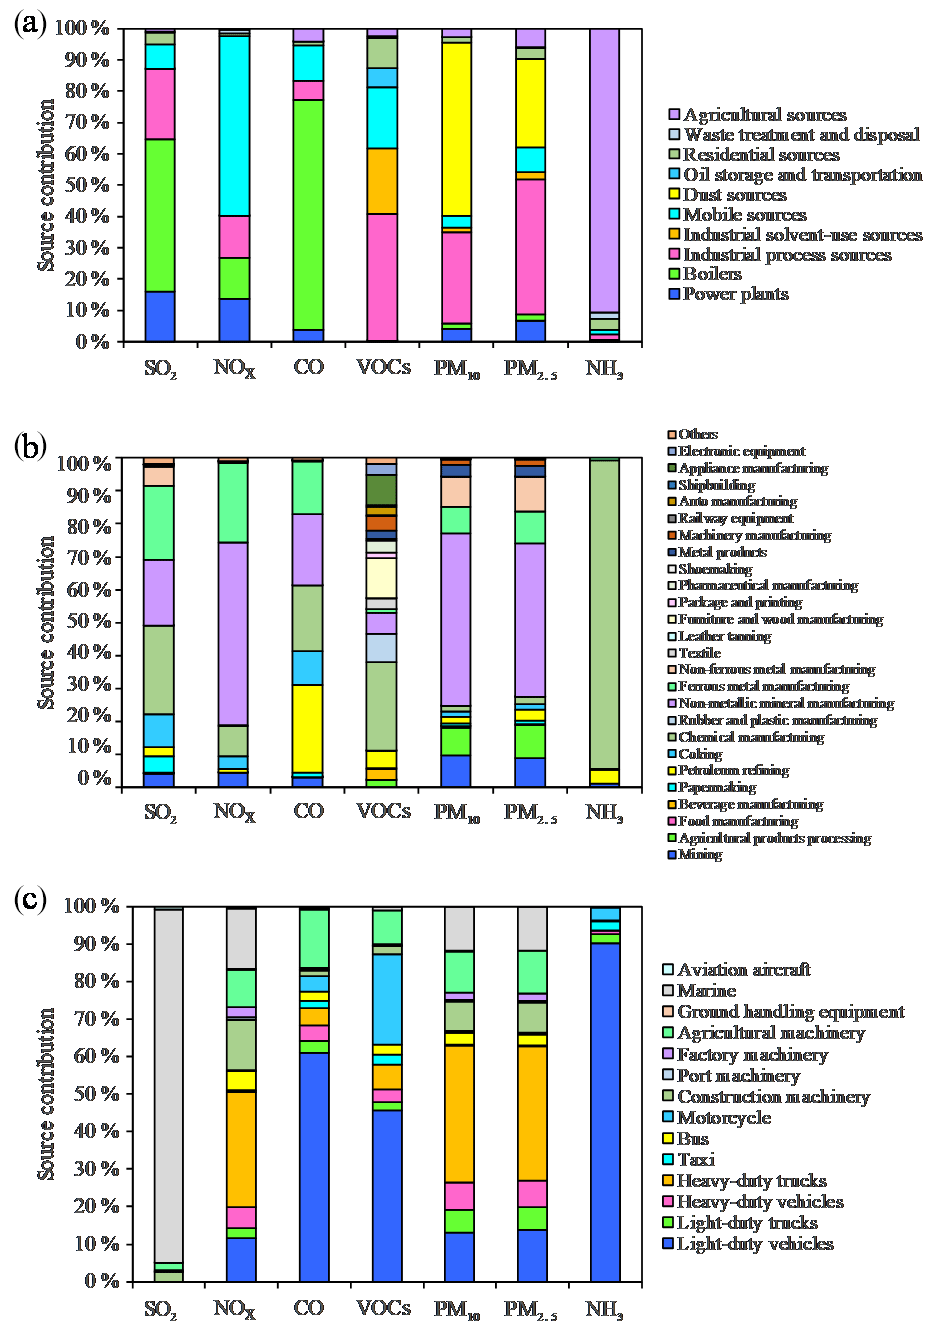
Figure 3Emission contributions of major air pollutants in the YRD region from (a) major category sources, (b) industrial sector sources, and (c) mobile sources.
3.1.3 Spatial distribution
Figure 4 shows the spatial distribution of SO2, NOx, CO, NMVOCs, PM2.5, and NH3 emissions in the YRD region. SO2 emissions were mainly concentrated in the high-density shipping regions of the Yangtze River and the East China Sea estuary. SO2 emissions from power plants and boilers along the Yangtze River and in cities of northern Anhui and Jiangsu provinces were also significant in these regions. The spatial distribution of NOx and NMVOCs was similar and mainly concentrated along the Yangtze River and Hangzhou Bay where industry and logistics were most developed. CO and PM2.5 emissions were mainly concentrated in the urban areas of cities due to intensive road traffic and construction work. NH3 emissions were relatively high in northern Anhui and Jiangsu provinces, resulting mainly from their developed agriculture. Large cities such as Shanghai presented higher NH3 emission intensities largely due to contributions from residential and mobile sources.

Figure 4Spatial distribution of major air pollutant emissions in the YRD region: panels (a)–(f) represent SO2, NOx, CO, NMVOCs, PM2.5, and NH3, respectively.
Figure 5 shows the spatial distribution of NOx and NMVOCs from the major industrial sectors in the YRD region. There were large differences in the spatial distribution of the different industrial sectors. Key sources of NOx emissions, shown in Fig. 5a–d, included power plants mainly distributed along the Yangtze River and Hangzhou Bay and the northern part of the YRD region, iron and steel manufacturing concentrated along the Yangtze River, and cement and brick manufacturing mainly distributed in the western and northern regions of the YRD. Compared with NOx emissions, the key sources of NMVOC (Fig. 5e–l) were mainly concentrated in the central and eastern regions of the YRD. These included the regions of Shanghai, Suzhou, Wuxi, Changzhou, Nanjing, Hangzhou, Ningbo, Jiaxing, and Shaoxing, which also had the highest NOx emission intensities in the YRD region. High levels of NOx and NMVOC were key factors responsible for harmful pollution by secondary PM and O3 in this region (Li et al., 2018, 2019).
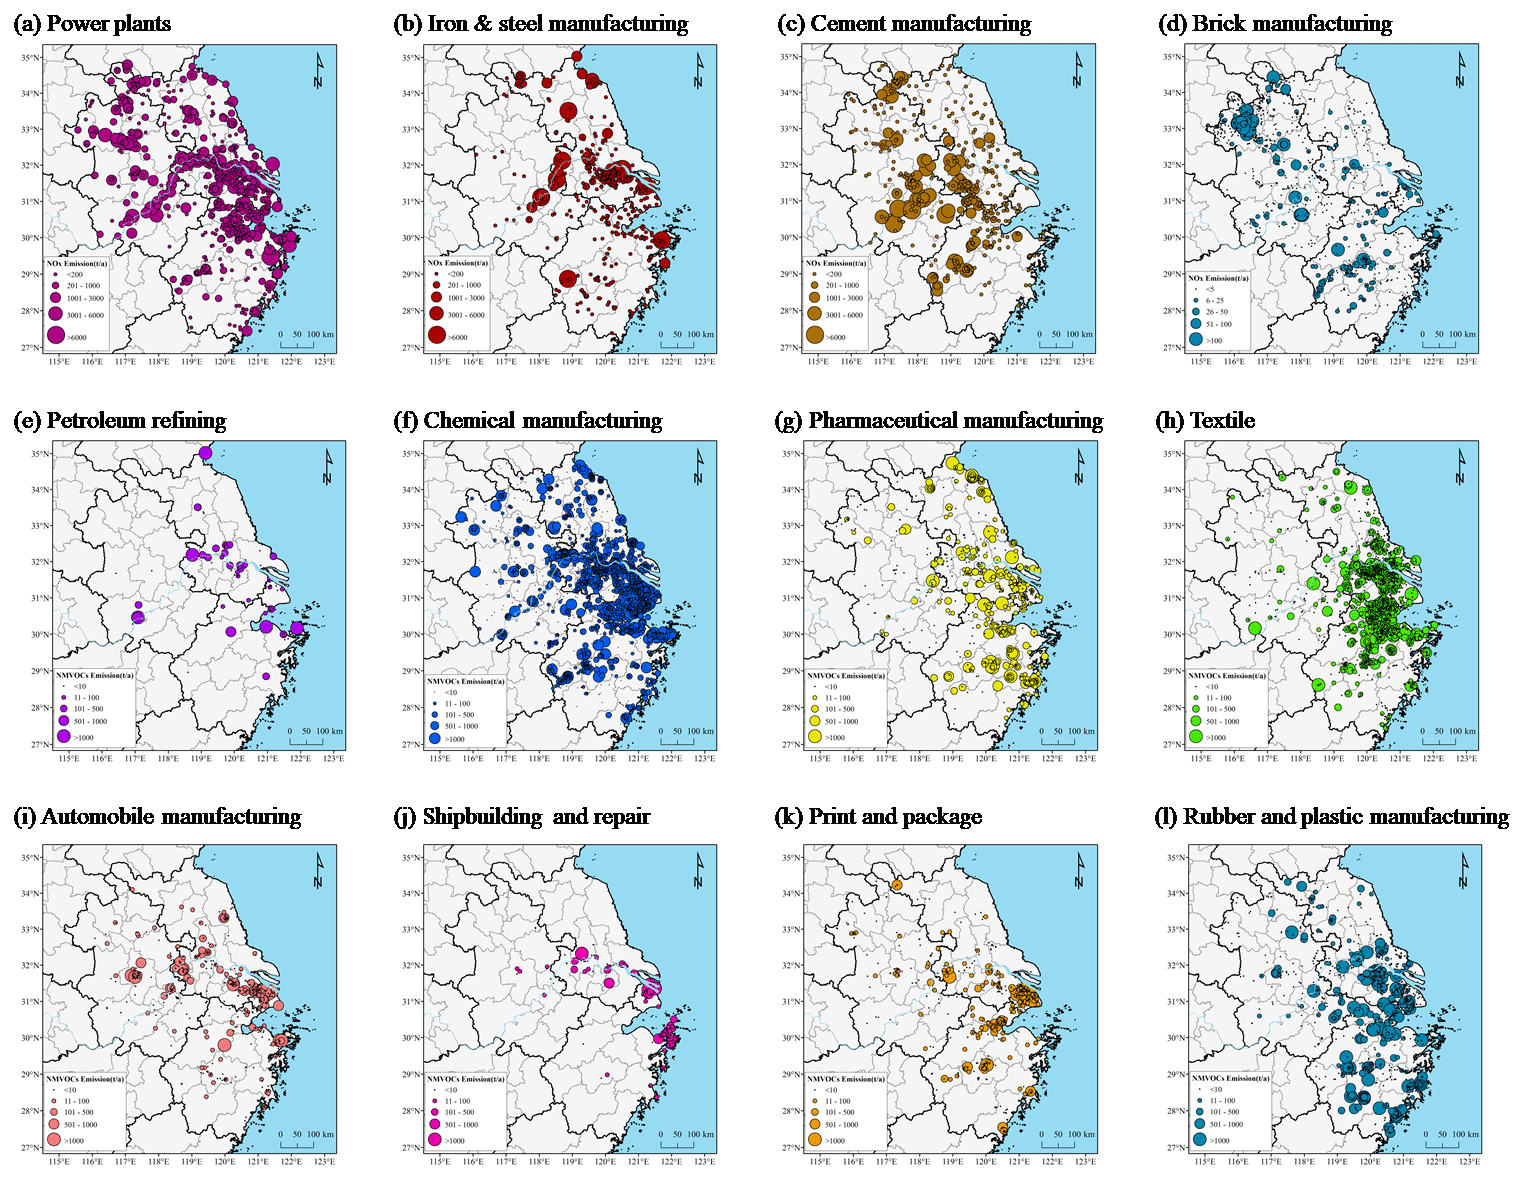
Figure 5Spatial distribution of the major NOx and NMVOC emission sources in the YRD region.
Previous studies have shown that the unit-based bottom-up approach based on local activity data can improve the spatial distribution of emission inventories (Zhao et al., 2015; Zheng et al., 2017; Zhao et al., 2018; Zheng et al., 2019). The spatial distribution of major air pollutants obtained in this study is consistent with other unit-based inventories based on local surveys. For example, the distribution of NMVOC emissions is consistent with that obtained from the on-site surveys in Jiangsu Province (Zhao et al., 2017); the distribution of NH3 emissions is also consistent with the results using dynamic emission factors and localized information (Zhao et al., 2020). Compared with the national-scale inventory like the MEIC, this study has improved the distribution along the Yangtze River and Hangzhou Bay where large point sources were denser, and it also reduced the misjudgment of NOx and NMVOC emission hotspots in the northern and southern areas, as shown in Fig. S1. The distribution of NH3 emissions was also improved in the northern areas of the region and in the city centers with more localized EFs of mobile and agricultural sources.
3.1.4 Uncertainty assessment
The EI was compiled using the bottom-up approach based on local EFs and activity data from the region. The activity data for industrial sources, including fuel consumption, sulfur content, ash content, raw material used, and control efficiency, were collected from the Environmental Statistics Database. EFs from some key sources, such as coal-fired power plants and boilers, iron and steel manufacturing, gasoline and diesel vehicles, non-road machinery, catering, and agricultural sources, were modified based on the local measurements. These measurements helped to reduce the uncertainty of the emission estimates. Table 3 shows the uncertainties of major sources at the 95 % confidence interval in this EI. The average uncertainties of emissions from the YRD region were estimated as −29 % to 36 % for SO2, −28 % to 33 % for NOx, −42 % to 75 % for CO, −44 % to 68 % for NMVOCs, −36 % to 62 % for PM10, −30 % to 46 % for PM2.5, and −58 % to 117 % for NH3. The overall uncertainties were lower compared with our previous EI for the YRD region (Huang et al., 2011).
The uncertainty assessment indicated that emissions from stationary combustion sources, such as power plants and boilers, were more reliable because the estimates were based on detailed activity data and local measurements. The uncertainties for emissions from major industrial sectors, such as ferrous metal manufacturing, non-ferrous metal manufacturing, and non-metallic mineral manufacturing, were significantly improved by the detailed emission estimation approach for the different process segments. However, large uncertainties remained for emissions from chemical manufacturing due to the many non-categorized processes and emissions for that sector. The uncertainties for emissions from vehicles and non-road machinery in this study were mainly from the activity data. Although their population could be obtained from the statistical yearbooks, VMT and working hours could not be estimated accurately. Dust emissions from construction and road dust had much higher uncertainties as their activity data lacked detail and fewer EFs were available. Most of the area sources, such as residential and agricultural, were estimated from activity data obtained from the statistical yearbooks resulting in higher uncertainties in their emission estimates. Despite these limitations, the emission estimation approach, based on refined process segments and local measurements, reduced the overall uncertainties of the EI. However, more comprehensive activity data and accurate EFs are still required to improve the quality of EIs in the future.
Table 3Uncertainty assessment for the major emission sources in the YRD region.

3.2 PM2.5 and NMVOC species emissions
3.2.1 PM2.5 species
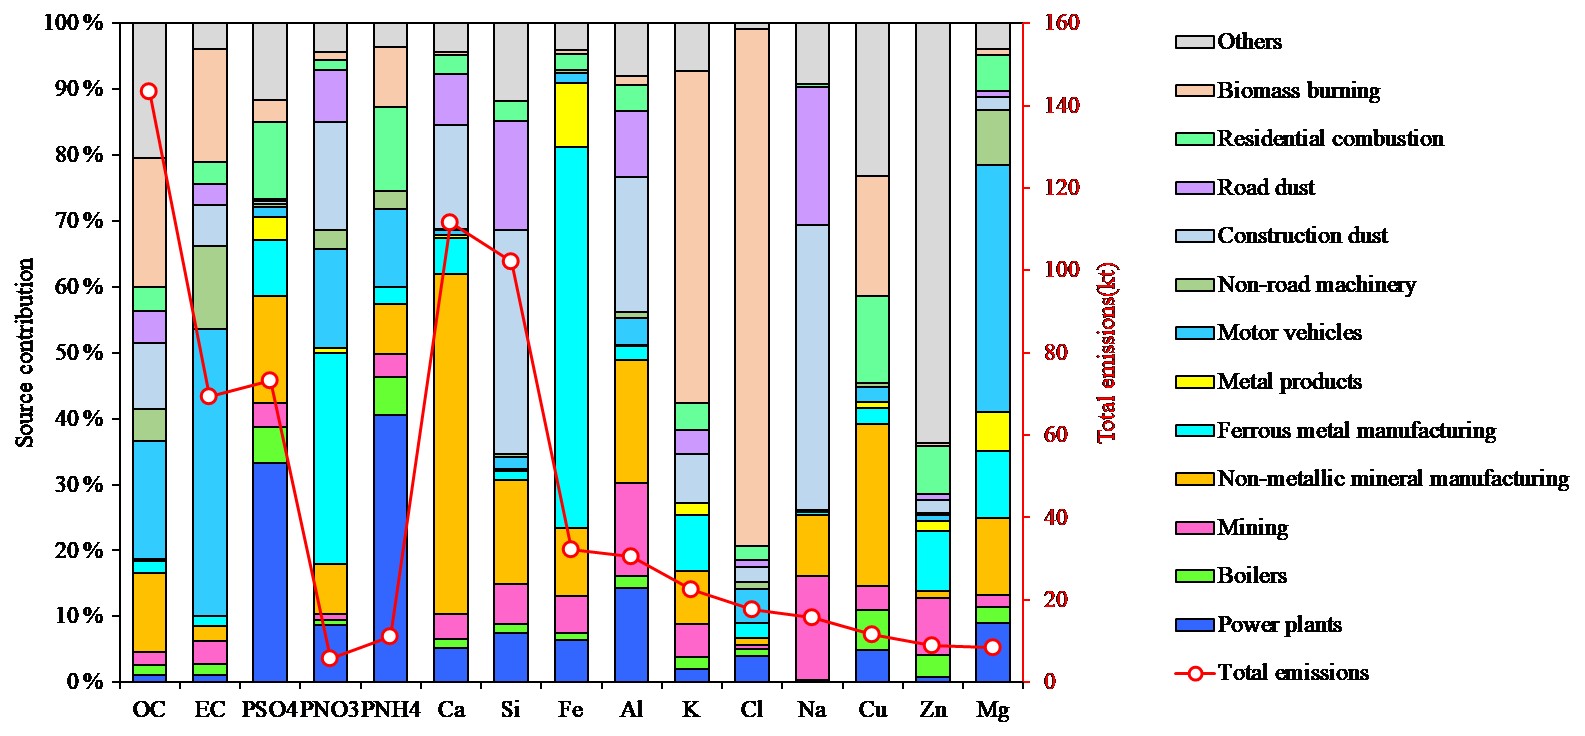
Figure 6 shows the major source contributions and species comprising PM2.5 in the EI. OC, Ca, Si, PSO4, and EC were the top five components of primary PM2.5 in the YRD region, accounting for 9.0 %, 7.0 %, 6.4 %, 4.6 %, and 4.3 % of PM2.5 emissions, respectively. There were large differences in the emission contributions for the different PM2.5 species. Among the industrial sources, the non-metallic mineral manufacturing sector made the largest contributions to Ca, Si, and Al emissions, accounting for 51.6 %, 15.9 %, and 18.8 % of these species, respectively. Ferrous metal manufacturing was the main source of Fe emissions, accounting for 57.9 %. Vehicles were major contributors to OC and EC emissions at 18.0 % and 43.5 %, respectively. K and Cl emissions mainly came from biomass burning, accounting for 50.4 % and 78.5 %, respectively. Construction dust was also an important source of PM2.5 species, accounting for 15.9 %, 34.1 %, and 20.4 % of Ca, Si, and Al emissions, respectively.
3.2.2 NMVOC species
Figure 7 shows the major source contributions for species comprising NMVOC. Aromatic hydrocarbons and alkanes were the main NMVOC species, accounting for ∼25 % each of the total NMVOC emissions in the YRD region. Among the alkanes, the linear, branched, and cycloalkanes made up 11.9 %, 9.9 %, and 2.8 % of the total, respectively. OVOCs also accounted for a considerable proportion (21.9 %) of NMVOC emissions in the YRD region. Among these, aldehydes, ketones, alcohols, and esters made up 5.0 %, 4.4 %, 9.0 %, and 3.5 % of the total, respectively. Haloalkanes accounted for 3.1 % of the total NMVOC emissions. In the previous study of NMVOC emissions in the YRD region by Wu and Xie (2018a, b), aromatic hydrocarbons were also the dominant species (40 %), and concentrations of OVOCs were similar, while the proportion of alkenes and haloalkanes were generally lower.
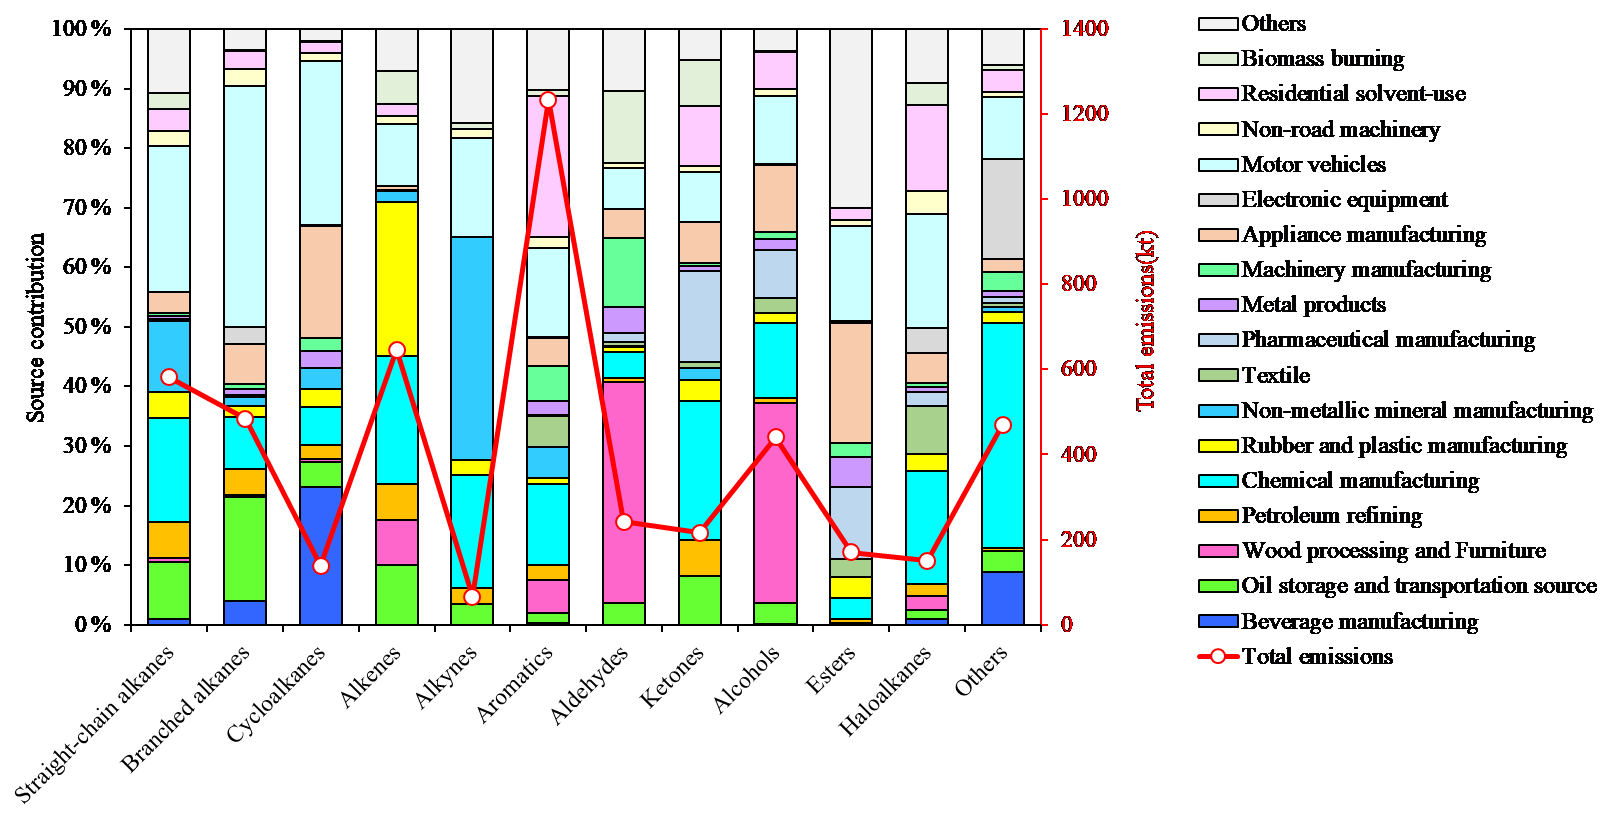
Chemical manufacturing accounted for a considerable proportion of various NMVOC species in the YRD region, accounting for 12.7 %, 21.5 %, 13.7 %, and 10.8 % of the alkane, alkene, aromatic hydrocarbon, and OVOC emissions, respectively. Industrial solvent-use sources, which included furniture and wood processing, textiles, packaging and printing, pharmaceutical manufacturing, metal products, auto manufacturing, and appliance manufacturing, were also an important source of NMVOC emissions in this region. Industrial solvent-use sources accounted for 29.3 % and 33.3 % of aromatic hydrocarbon and OVOC emissions, respectively, while residential solvent-use sources accounted for 23.7 % and 4.9 % of aromatic hydrocarbon and OVOC emissions, respectively. Motor vehicles also made a significant contribution to NMVOC species in the YRD region, making up 31.2 %, 10.4 %, 15.1 %, and 10.5 % of the total emissions of alkanes, alkenes, aromatics, and OVOC in the region, respectively. Biomass burning contributed 12.0 % of aldehyde emissions, although it accounted for only 2.5 % of the total NMVOC emissions in the region.
Overall, the refinement of the source profiles helped to assess the impact of NMVOC emissions on ambient air quality in the region. However, differences in NMVOC compositions between studies remained, and efforts should be made to improve the verification of NMVOC species in future emissions studies.
3.3 Model validation
Figure 8 shows a comparison of the simulated and observed concentrations for SO2, NO2, PM2.5, PM10, O3, and CO for cities in the YRD region in January and July 2017. The simulated concentration distribution of the different pollutants was consistent with the observed results, indicating that the updated EI generally reflected the distribution of air pollution sources in the YRD region. Comparatively, agreement between the simulated concentration distribution and the observed results for the cities in the central areas of the YRD region was stronger than cities of the northern and southern border areas. This was mainly because border areas were more susceptible to the effects of emissions from areas outside the region, which resulted in greater deviation in the simulation results. A statistical analysis of the hourly concentrations obtained from the model for the pollutants in each city can be found in Table S7. Figure 9 shows the mean fractional error (MFE) and the mean fractional bias (MFB) between the simulated and observed daily average concentrations in the cities of the region. Overall, the MFB and MFE of simulation and observation results of all the pollutants in January and July were all within the criteria (MFB ≤ ±60 %, MFE ≤ 75 %) of model performance recommended by Boylan and Russell (2006), and most of them were at the performance goals (MFB ≤ ±30 %, MFE ≤ 50 %), which indicated that the EI in this study could reflect the air pollution in winter in the YRD region. In July, the MFB and MFE of O3 and PM2.5 model performance all fell within the range of criteria. However, the simulation results of primary pollutants like SO2, NO2, PM10, and CO were somewhat underestimated. Especially for SO2 and CO, nearly half of the cities had MFBs lower than −60 %, and the cities with large deviations were mainly concentrated in peripheral areas of the YRD region (such as Huangshan, Chizhou, Xuancheng, Lishui, etc.). These cities generally had higher contributions of area emissions from residential and agricultural sources instead of large point industrial sources. The activity data of these sources usually had higher uncertainties and would easily cause the deviation in emission estimation. For example, the underestimation of the amount of residential coal combustion would undoubtedly lead to a severely low estimate of SO2 and CO emissions. However, since PM2.5 and O3 pollution were more regional, their simulation results were less affected by insufficient local activity data in these cities. Conducting more detailed on-site investigations to obtain more accurate activity data is the key to further improving the performance of EI in the future.
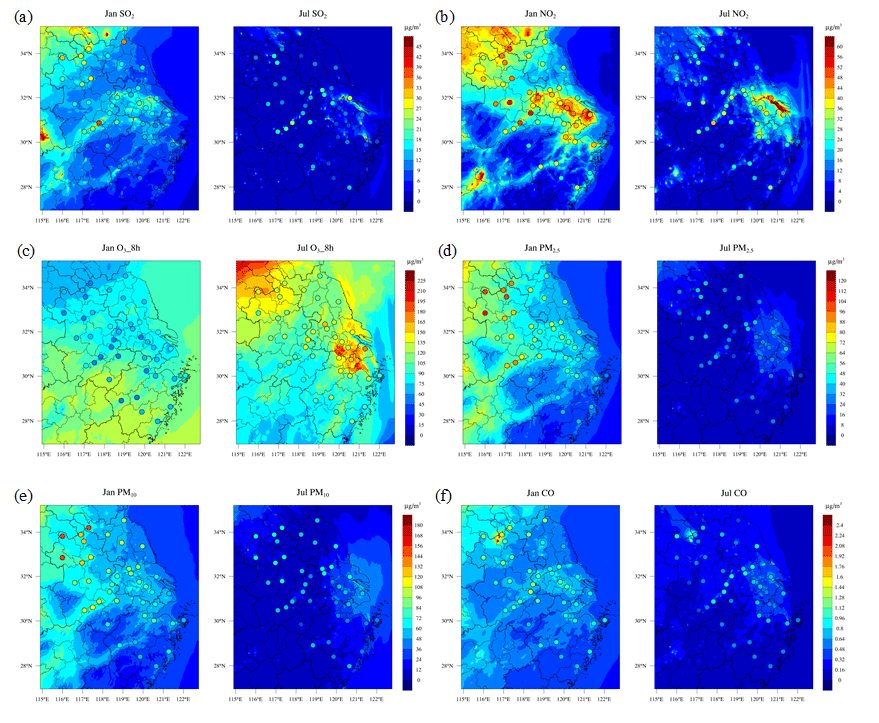
Figure 8Comparisons of simulated and observed (circles) monthly average pollutant concentrations for cities in the YRD region in January and July 2017: (a) SO2, (b) NO2, (c) daily maximum 8 h O3 (O3_8h), (d) PM2.5, (e) PM10, and (f) CO.
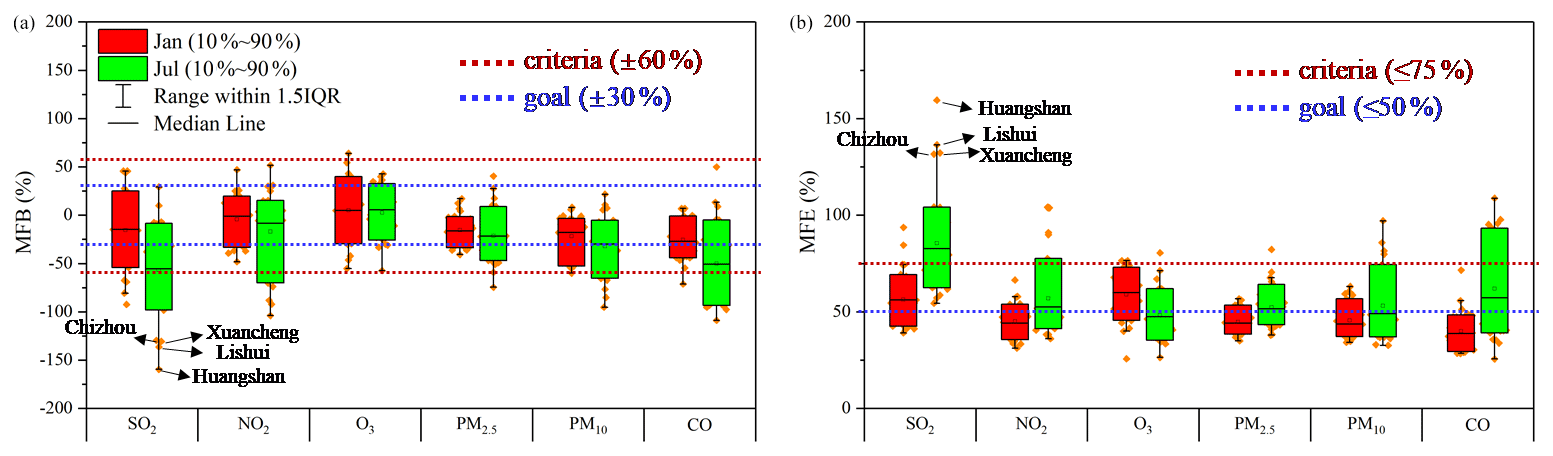
Figure 9MFB (a) and MFE (b) between the simulation and observation data for daily average concentrations of various pollutants of the cities in the YRD region in January and July 2017.
3.4 Ozone and SOA formation potentials
Figure 10 shows the OFP and SOAP contributions for major NMVOC species, emission sources, and industrial sectors in the region. Toluene was the most important NMVOC species for both OFP and SOAP and contributed 45.0 % of the total (7.5 % OFP and 37.5 % SOAP), followed by 1,2,4-trimethylbenzene which contributed 29.1 % of the total (2.1 % OFP and 27.0 % SOAP). Other NMVOC included m/p-xylene, propylene, ethene, o-xylene, and ethylbenzene which gave combined contributions to OFP and SOAP of 14.9 %, 16.6 %, 10.7 %, 5.7 %, and 2.7 %, respectively; OFP was the major contribution.
Industrial process sources had the highest OFP and SOAP in the region, contributing 44.9 % and 26.7 %, respectively. Industrial solvent-use sources followed, with OFP and SOAP contributions of 15.0 % and 33.8 %; their contribution to SOAP exceeded that of the industrial process sources. The contribution of motor vehicles to regional OFP and SOAP was 13.9 % and 13.5 %, respectively, which is close to those from residential solvent-use sources. These two sources were the major contributors to O3 and SOA formation in urban areas.
Four major industrial sectors could account for most of the OFP and SOAP in the YRD region: the chemical manufacturing sector contributed 16.4 % and 14.8 % to OFP and SOAP, respectively; the rubber and plastic manufacturing sector had a SOAP contribution rate of 11.8 % (its OFP was relatively low at 1.2 %); the appliance manufacturing and textile sectors accounted for 10.5 % and 10.4 % of OFP and SOAP contributions, respectively.
Based on the above, it was concluded that the reduction in aromatic hydrocarbon emissions from industrial and vehicular sources were of greatest importance for the YRD region. In particular, the high reactivity species, such as toluene, xylene, and trimethylbenzene, should be given priority in NMVOCs pollution control measures for the region.
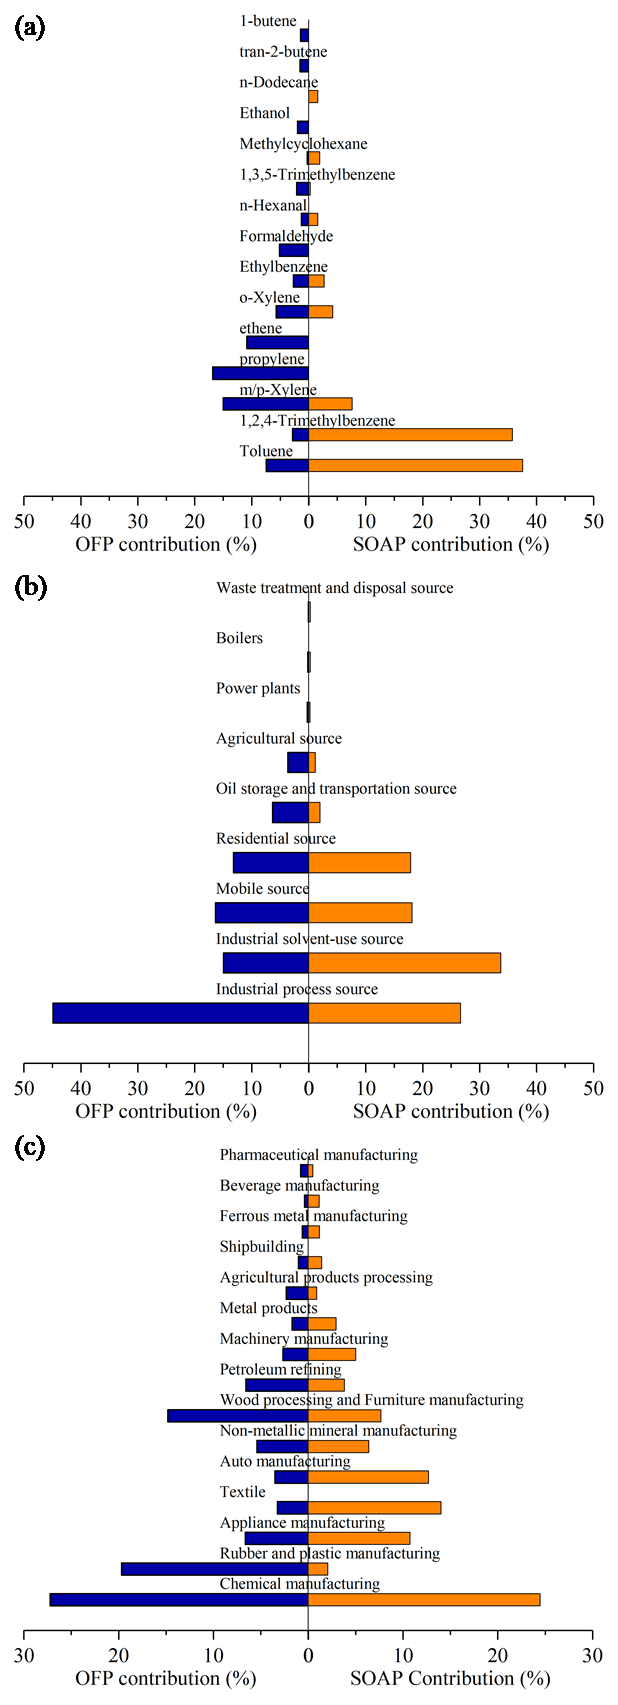
Figure 10OFP and SOAP formation potentials for different variables: (a) NMVOC species, (b) emission sources, and (c) industrial sectors.
A high-resolution air pollutant EI for the YRD region was updated using EFs derived mainly from local measurements. In addition to the conventional pollutants, 424 NMVOCs and 43 PM2.5 components were also included in the inventory. The EI was refined into four main categories comprising 259 specific sources. The results indicated that the total emissions of SO2, NOx, CO, NMVOCs, PM10, PM2.5, and NH3 in the YRD region in 2017 were 1552, 3235, 38 507, 4875, 3770, 1597, and 2467 Gg, respectively. Overall, SO2 and NOx emissions estimated in this study were lower than the previous EIs such as the MEIC. Substantial reductions in emissions from power plants and boilers in recent years were a significant factor. The NMVOC emissions were also slightly lower than the results of previous studies. This was mainly due the use of EFs refined to the specific sectors in this study, which were generally lower than the comprehensive EFs used elsewhere. PM10 and PM2.5 emissions were, respectively, 1.7 times and 0.5 times higher than the MEIC due to the inclusion of dust sources. The NH3 emissions from this study, estimated using localized EFs, were significantly higher than those of previous studies.
SO2 and CO emissions were mainly from boilers in the region, accounting for 49 % and 73 % of the total. Mobile sources dominated NOx emissions from anthropogenic sources, accounting for 57 % of the total. NMVOC emissions were mostly from industrial sources, accounting for 61 % of the total. The main contributing industrial sectors were chemical manufacturing and solvent-use sources like furniture manufacturing, appliance manufacturing, textiles, packaging and printing, and machinery manufacturing. Dust sources were responsible for 55 % and 28 % of PM10 and PM2.5, respectively. Agricultural sources accounted for 91 % of NH3 emissions.
The main PM2.5 species emitted from anthropogenic sources in the YRD region were OC, Ca, Si, PSO4, and EC, which accounted for 9.0 %, 7.0 %, 6.4 %, 4.6 %, and 4.3 % of total primary PM2.5 emissions, respectively. The main species of NMVOCs are aromatic hydrocarbons, accounting for 25.3 % of the total. OVOCs also made up a relatively high proportion of NMVOCs, accounting for 21.9 % of the total. Among these, aldehydes, ketones, alcohols, and esters accounted for 5.0 %, 4.4 %, 9.0 %, and 3.5 %, respectively. Toluene had the highest OFP and SOAP while other contributors included 1,2,4-trimethylbenzene, m,p-xylene, propylene, ethene, o-xylene, and ethylbenzene. Industrial process and solvent-use sources were the main sources of OFP and SOAP followed by motor vehicles. Among the industrial sources, chemical manufacturing, rubber and plastic manufacturing, appliance manufacturing, and textiles all made significant contributions.
In recent years, the ambient air quality in the YRD region has improved significantly. At the same time, contributions to air pollutants from emissions have changed subtly. While emissions of primary pollutants such as SO2 and NOx from power plants and boilers have decreased significantly, the contribution from mobile sources have become important. Furthermore, emissions of reactive organic compounds from industrial sources were still at a high level, resulting in elevated secondary pollution issues. The high-resolution EI established in this study should provide scientific guidance for the future control of air pollutants in the YRD region of China.
The gridded emissions of air pollutants from various sources for the YRD region developed by this study at a horizontal resolution of 4 km × 4 km and a summary table of emissions by cities and sources can be downloaded from the following website (https://doi.org/10.6084/m9.figshare.13340648; An et al., 2020). Additional related data are available upon request by contacting the corresponding author (Cheng Huang; huangc@saes.sh.cn).
The supplement related to this article is available online at: https://doi.org/10.5194/acp-21-2003-2021-supplement.
CH, HW, and CC designed the research. JA, YH, XW, RY, QW, YL, and CX performed the research. HW and SJ collected the NMVOC species data. LQ, MZ, and SZ collected the PM2.5 species data. CH, QH, and JL supported the emission factor data. JA, YH, CH, XW, HL, YZ, YC, and CC analyzed the results. JA, YH, CH, and XW wrote the paper.
The authors declare that they have no conflict of interest.
This work was supported by the Ecological Environment Department in the Yangtze River Delta region of China.
This research has been supported by the National Natural Science Foundation of China (grant nos. 21777101 and 21677038), the National Key R&D Program of China (grant no. 2018YFC0213800), and the Shanghai Municipal Bureau of Ecology and Environment Fund Project (grant no. 2019-01).
This paper was edited by Qiang Zhang and reviewed by two anonymous referees.
An, J., Huang, Y., Huang, C., Wang, X., Yan, R., Wang, Q., Zhang, Y., Xu, C., Qiao, L., Wang, H., Jing, S., Zhou, M., Zhu, S., Hu, Q., Lu, J., Chen, A. J. Y., and Chen, C.: Emission inventory of air pollutants and chemical speciation for detailed anthropogenic sources based on local measurements in the Yangtze River Delta region, China, Dataset, Figshare, https://doi.org/10.6084/m9.figshare.13340648, 2020.
Cai, S. Y., Ma, Q., Wang, S. X., Zhao, B., Brauer, M., Cohen, A., Marting, R. V., Zhang, Q. Q., Li, Q. B., Wang, Y. X., Hao, J. M., Frostad, J., Forouzanfar, M. H., and Burnettk, R. T.: Impact of air pollution control policies on future PM2.5 concentrations and their source contributions in China, J. Environ. Manage., 227, 124–133, 2018.
Carter, W. P. L.: Development of ozone reactivity scales for volatile organic compounds, J. Air Waste Manage., 44, 881–899, 1994.
Chen, Y.: Study on characteristics ammonia emission from typical large scale pig farm in Shanghai, Master Thesis, East China University of Science and Technology, Shanghai China, 73 pp., 2017.
Chen, Y., Fang, X. F., Shen, G. X., Xu, C., Qian, X. Y., Zhao, Z. G., Yu, S. F., Li, J. W., and Wang, Z. Q.: Research on ammonia emission characteristics and its influencing factors from paddy fields in Taihu Lake region, Acta Agriculturae Zhejiangensis, 29, 119–128, 2017.
Crippa, M., Guizzardi, D., Muntean, M., Schaaf, E., Dentener, F., van Aardenne, J. A., Monni, S., Doering, U., Olivier, J. G. J., Pagliari, V., and Janssens-Maenhout, G.: Gridded emissions of air pollutants for the period 1970–2012 within EDGAR v4.3.2, Earth Syst. Sci. Data, 10, 1987–2013, https://doi.org/10.5194/essd-10-1987-2018, 2018.
European Environment Agency (EEA): EMEP/EEA air pollution emission inventory guidebook, available at: http://www.eea.europa.eu/publications/emep-eea-emission-inventory-guidebook-2013 (last access: 15 January 2018), 2013.
Fan, Q. Z., Zhang, Y., Ma, W. C., Ma, H. X., Feng, J. L., Yu, Q., Yang, X., Ng, S. K. W., Fu, Q. Y., and Chen, L. M.: Spatial and seasonal dynamics of ship emissions over the Yangtze River Delta and East China Sea and their potential environmental influence, Environ. Sci. Technol., 50, 1322–1329, 2016.
Fiore, A. M., Naik, V., Spracklen, D. V., Steiner, A., Unger, N., Prather, M., Bergmann, D., Cameron-Smith, P. J., Cionni, I., Collins, W. J., Dalsøren, S., Eyring, V., Folberth, G. A., Ginoux, P., Horowitz, L. W., Josse, B., Lamarque, J., MacKenzie, I. A., Nagashima, T., O'Connor, F. M., Righi, M., Rumbold, S. T., Shindell, D. T., Skeie, R. B., Sudo, K., Szopa, S., Takemurat, T., and Zeng, G.: Global air quality and climate, Chem. Soc. Rev., 41, 6663–6683, 2012.
Fu, M. L., Ge, Y. S., Tan, J. W., Zeng, T., and Liang, B.: Characteristics of typical non-road machinery emissions in China by using portable emission measurement system, Sci. Total Environ., 437, 255–261, 2012.
Fu, M. L., Ding, Y., Yin, H., Ji, Z., Ge, Y. S., and Liang, B.: Characteristics of agricultural tractors emissions under real-world operating cycle, Transactions of the Chinese Society of Agricultural Engineering, 29, 42–48, 2013.
Fu, X., Wang, S. X., Zhao, B., Xing, J., Cheng, Z., Liu, H., and Hao, J. M.: Emission inventory of primary pollutants and chemical speciation in 2010 for the Yangtze River Delta region, China, Atmos. Environ., 70, 39–50, 2013.
Gao, Y. Q., Wang, H. L., Xu, R. Z., Jing, S. A., Liu, Y. H., and Peng, Y. R.: Characterization of volatile organic compounds from cooking emissions, Huanjing Kexue, 40, 1627–1633, 2019.
Ge, Y. S., Liu, H. K., Ding, Y., Yin, H., Fu, M. L., and Li, J. Q.: Experimental study on characteristics of emissions and fuel consumption for combines, Transactions of the Chinese Society of Agricultural Engineering, 29, 41–47, 2013.
Guan, W. J., Zheng, X. Y., Chung, K. F., and Zhong, N. S.: Impact of air pollution on the burden of chronic respiratory diseases in China: time for urgent action, Lancet, 388, 1939–1951, 2016.
Guo, Y. Y., Gao, X., Zhu, T. Y., Luo, L., and Zheng, Y.: Chemical profiles of PM emitted from the iron and steel industry in northern China, Atmos. Environ., 150, 187–197, 2017.
Hoesly, R. M., Smith, S. J., Feng, L., Klimont, Z., Janssens-Maenhout, G., Pitkanen, T., Seibert, J. J., Vu, L., Andres, R. J., Bolt, R. M., Bond, T. C., Dawidowski, L., Kholod, N., Kurokawa, J.-I., Li, M., Liu, L., Lu, Z., Moura, M. C. P., O'Rourke, P. R., and Zhang, Q.: Historical (1750–2014) anthropogenic emissions of reactive gases and aerosols from the Community Emissions Data System (CEDS), Geosci. Model Dev., 11, 369–408, https://doi.org/10.5194/gmd-11-369-2018, 2018.
Hsu, Y., Divita, F., and Dorn, J.: SPECIATE version 4.4 database development documentation, final report, US EPA, EPA/600/R-13/307, USA, 21 pp., 2014.
Huang, C., Chen, C. H., Li, L., Cheng, Z., Wang, H. L., Huang, H. Y., Streets, D. G., Wang, Y. J., Zhang, G. F., and Chen, Y. R.: Emission inventory of anthropogenic air pollutants and VOC species in the Yangtze River Delta region, China, Atmos. Chem. Phys., 11, 4105–4120, https://doi.org/10.5194/acp-11-4105-2011, 2011.
Huang, C., Wang, H. L., Li, L., Wang, Q., Lu, Q., de Gouw, J. A., Zhou, M., Jing, S. A., Lu, J., and Chen, C. H.: VOC species and emission inventory from vehicles and their SOA formation potentials estimation in Shanghai, China, Atmos. Chem. Phys., 15, 11081–11096, https://doi.org/10.5194/acp-15-11081-2015, 2015.
Huang, C., Lou, S. R., Qiao, L. P., Jing, S. A., Tao, S. K., Zhou, M., and Chen, C. H.: Physicochemical characteristics of real-world PM emissions from heavy-duty diesel buses, Res. Environ. Sci., 29, 1352–1361, 2016.
Huang, C., Tao, S. K., Lou, S. R., Hu, Q. Y., Wang, H. L., Wang, Q., Li, L., Wang, H. Y., Liu, J. G., Quan, Y. F., and Zhou, L. L.: Evaluation of emission factors for light-duty gasoline vehicles based on chassis dynamometer and tunnel studies in Shanghai, China, Atmos. Environ., 169, 193–203, 2017.
Huang, C., An, J. Y., and Lu, J.: Emission inventory and prediction of non-road machineries in the Yangtze River Delta region, China, Huanjing Kexue, 39, 3965–3975, 2018a.
Huang, C., Hu, Q. Y., and Lu, J.: Measurements of OC and EC emission factors for light-duty gasoline vehicles, Huanjing Kexue, 39, 3110–3117, 2018b.
Huang, C., Hu, Q. Y., Lou, S. R., Tian, J. J., Wang, R. N., Xu, C., An, J. Y., Ren, H. J., Ma, D., Quan, Y. F., Zhang, Y. J., and Li, L.: Ammonia emission measurements for light-duty gasoline vehicles in China and implications for emission modeling, Environ. Sci. Technol., 52, 11223–11231, 2018c.
Huang, C., Hu, Q. Y., Wang, H. Y., Qiao, L. P., Jing, S. A., Wang, H. L., Zhou, M., Zhu, S. H., Ma, Y. G., Lou, S. R., Li, L., Tao, S. K., Li, Y. J., and Lou, D. M.: Emission factors of particulate and gaseous compounds from a large cargo vessel operated under real-world conditions, Environ. Pollut., 242, 667–674, 2018d.
Janssens-Maenhout, G., Crippa, M., Guizzardi, D., Dentener, F., Muntean, M., Pouliot, G., Keating, T., Zhang, Q., Kurokawa, J., Wankmüller, R., Denier van der Gon, H., Kuenen, J. J. P., Klimont, Z., Frost, G., Darras, S., Koffi, B., and Li, M.: HTAP_v2.2: a mosaic of regional and global emission grid maps for 2008 and 2010 to study hemispheric transport of air pollution, Atmos. Chem. Phys., 15, 11411–11432, https://doi.org/10.5194/acp-15-11411-2015, 2015.
Klimont, Z., Kupiainen, K., Heyes, C., Purohit, P., Cofala, J., Rafaj, P., Borken-Kleefeld, J., and Schöpp, W.: Global anthropogenic emissions of particulate matter including black carbon, Atmos. Chem. Phys., 17, 8681–8723, https://doi.org/10.5194/acp-17-8681-2017, 2017.
Li, L., An, J. Y., Zhou, M., Qiao, L. P., Zhu, S. H., Yan, R. S., Ooi, C. G., Wang, H. L., Huang, C., Huang, L., Tao, S. K., Yu, J. Z., Chan, A., Wang, Y. J., Feng, J. L., and Chen, C. H.: An integrated source apportionment methodology and its application over the Yangtze River Delta region, China, Environ. Sci. Technol., 52, 14216–14227, 2018.
Li, L., An, J. Y., Huang, L., Yan, R. S., Huang, C., and Yarwood, G.: Ozone source apportionment over the Yangtze River Delta region, China: Investigation of regional transport, sectoral contributions and seasonal differences, Atmos. Environ., 202, 269–280, 2019.
Li, M., Zhang, Q., Streets, D. G., He, K. B., Cheng, Y. F., Emmons, L. K., Huo, H., Kang, S. C., Lu, Z., Shao, M., Su, H., Yu, X., and Zhang, Y.: Mapping Asian anthropogenic emissions of non-methane volatile organic compounds to multiple chemical mechanisms, Atmos. Chem. Phys., 14, 5617–5638, https://doi.org/10.5194/acp-14-5617-2014, 2014.
Li, Z., Zhang, K. S., Pang, K. L., and Di, B. F.: A fuel-based approach for emission factor development for highway paving construction equipment in China, J. Air Waste Manage., 66, 1214–1223, 2016.
Liang, C. S., Duan, F. Q., He, K. B., and Ma, Y. L.: Review on recent progress in observations, source identifications and countermeasures of PM2.5, Environ. Int., 86, 150–170, 2016.
Lou, S. R.: Emission characteristics of PM2.5 from medium and small capacity coal-fired boilers in service, Acta Scientiae Circumstantiae, 34, 3119–3125, 2014.
Ministry of Environmental Protection (MEP), P. R. of China: Guidebooks for compiling air pollution emission inventories, available at: http://www.mee.gov.cn/gkml/hbb/bgg/201408/t20140828_288364.htm, last access: 20 August 2014.
Monks, P. S., Granier, C., Fuzzi, S., Stohl, A., Williams, M. L., Akimoto, H., Amann, M., Baklanov, A., Baltensperger, U., Bey, I., Blake, N., Blake, R. S., Carslaw, K., Cooper, O. R., Dentener, F., Fowler, D., Fragkou, E., Frost, G. J., Generoso, S., Ginoux, P., Grewe, V., Guenther, A., Hansson, H. C., Henne, S., Hjorth, J., Hofzumahaus, A., Huntrieser, H., Isaksen, I. S. A., Jenkin, M. E., Kaiser, J., Kanakidou, M., Klimont, Z., Kulmala, M., Laj, P., Lawrence, M. G., Lee, J. D., Liousse, C., Maione, M., McFiggans, G., Metzger, A., Mieville, A., Moussiopoulos, N., Orlando, J. J., O'Dowd, C. D., Palmer, P. I., Parrish, D. D., Petzold, A., Platt, U., Pöschl, U., Prévôt, A. S. H., Reeves, C. E., Reimann, S., Rudich, Y., Sellegri, K., Steinbrecher, R., Simpson, D., ten Brink, H., Theloke, J., van der Werf, G. R., Vautard, R., Vestreng, V., Vlachokostas, C., and von Glasow, R.: Atmospheric composition change – global and regional air quality, Atmos. Environ., 43, 5268–5350, 2009.
National Bureau of Statistics of China: China Statistical Yearbook 2018, China Statistics Press, Beijing, China, 949 pp., 2018.
Ni, Z.-Z., Luo, K., Gao, Y., Gao, X., Jiang, F., Huang, C., Fan, J.-R., Fu, J. S., and Chen, C.-H.: Spatial–temporal variations and process analysis of O3 pollution in Hangzhou during the G20 summit, Atmos. Chem. Phys., 20, 5963–5976, https://doi.org/10.5194/acp-20-5963-2020, 2020.
Qiao, L. P., Cai, J., Wang, H. L., Wang, W. B., Zhou, M., Lou, S. R., Chen, R. J., Dai, H. X., Chen, C. H., and Kan, H. D.: PM2.5 constituents and hospital emergency-room visits in Shanghai, China, Environ. Sci. Technol., 48, 10406–10414, 2014.
Qu, L., He, L. Q., Hu, J. N., Jin, T. S., Zu, L., Wang, M. Y., and Song, J. H.: Characteristics of PM2.5 emissions and its carbonaceous components from construction machines under different typical driving modes, Res. Environ. Sci., 28, 1047–1052, 2015.
Reff, A., Bhave, P. V., Simon, H., Pace, T. G., Pouliot, G. A., Mobley, J. D., and Houyoux, M.: Emissions inventory of PM2.5 trace elements across the United States, Environ. Sci. Technol., 43, 5790–5796, 2009.
Requia, W. J., Adams, M. D., Arain, A., Papatheodorou, S., Koutrakis, P., and Mahmoud, M.: Global association of air pollution and cardiorespiratory diseases: a systematic review, meta-Analysis, and investigation of modifier variables, Am. J. Public Health, 108, S123–S130, 2018.
Sha, T., Ma, X. Y., Jia, H. L., van der A, R. J., Ding, J. Y., Zhang, Y. L., and Chang, Y. H.: Exploring the influence of two inventories on simulated air pollutants during winter over the Yangtze River Delta, Atmos. Environ., 206, 170–182, 2019.
Simayi, M., Hao, Y. F., Li, J., Wu, R. R., Shi, Y. Q., Xi, Z. Y., Zhou, Y., and Xie, S. D.: Establishment of county-level emission inventory for industrial NMVOCs in China and spatial-temporal characteristics for 2010–2016, Atmos. Environ., 211, 194–203, 2019.
Simon, H., Beck, L., Bhave, P. V., Divita, F., Hsu, Y., Luecken, D., Mobley, J. D., Pouliot, G. A., Reff, A., Sarwar, A., and Strum, M.: The development and uses of EPA's SPECIATE database, Atmos. Pollut. Res., 1, 196–206, 2010.
Song, C. B., Ma, C., Zhang, Y. J., Wang, T., Wu, L., Wang, P., Liu, Y., Li, Q., Zhang, J. S., Dai, Q. L., Zou, C., Sun, L. N., and Mao, H. J.: Heavy-duty diesel vehicles dominate vehicle emissions in a tunnel study in northern China, Sci. Total Environ., 637–638, 431–442, 2018.
Stroud, C. A., Makar, P. A., Zhang, J., Moran, M. D., Akingunola, A., Li, S.-M., Leithead, A., Hayden, K., and Siu, M.: Improving air quality model predictions of organic species using measurement-derived organic gaseous and particle emissions in a petrochemical-dominated region, Atmos. Chem. Phys., 18, 13531–13545, https://doi.org/10.5194/acp-18-13531-2018, 2018.
Sun, X. W., Shao, M., Granier, C., Liu, Y., Ye, C. S., and Zheng, J. Y.: Long-Term trends of anthropogenic SO2, NOx, CO, and NMVOCs emissions in China, Earth's Future, 6, 1112–1133, 2018a.
Sun, X. W., Cheng, S. Y., Lang, J. L., Ren, Z. H., and Sun, C.: Development of emissions inventory and identification of sources for priority control in the middle reaches of Yangtze River Urban Agglomerations, Sci. Total Environ., 625, 155–167, 2018b.
Sun, Y. Y.: Study on emission inventory and uncertainty assessment of multi-pollutants from coal-fired power plants, Master thesis, Zhejiang University, Hangzhou, China, 73 pp., 2015.
Tang, X. B., Huang, C., Lou, S. R., Qiao, L. P., Wang, H. L., Zhou, M., Chen, M. H., Chen, C. H., Wang, Q., Li, G. L., Li, L., Huang, H. Y., and Zhang, G. F.: Emission factors and PM chemical composition study of biomass burning in the Yangtze River Delta Region, Huanjing Kexue, 35, 1623–1632, 2014.
US Environmental Protection Agency (USEPA): Compilation of air pollutant emission Factors, AP-42, 5th Edn., available at: https://www.epa.gov/air-emissions-factors-and-quantification/ap-42-compilation-air-emissions-factors (9 February 2021), 2002.
US Environmental Protection Agency (USEPA): Exhaust and crankcase emission factors for non-road engine modeling-compression ignition, Washington DC, 26 pp., 2010.
Wang, H. L., Lou, S. R., Huang, C., Qiao, L. P., Tang, X. B., Chen, C. H., Zeng, L. M., Wang, Q., Zhou, M., Lu, S. H., and Xu, X. N.: Source profiles of volatile organic compounds from biomass burning in Yangtze River Delta, China, Aerosol Air. Qual. Res., 14, 818–828, 2014a.
Wang, H. L., Qiao, Y. Z., Chen, C. H., Lu, J., Dai, H. X., Qiao, L. P., Lou, S. R., Huang, C., Li, L., Jing, S. A., and Wu, J. P.: Source profiles and chemical reactivity of volatile organic compounds from solvent use in Shanghai, China, Aerosol Air. Qual. Res., 14, 301–310, 2014b.
Wang, H. L., Jing, S. A., Wang, Q., Huang, C., Lou, S. R., Qiao, L. P., and Li, L.: Measurement and characterization of emissions of volatile organic compounds in solvent use, Res. Environ. Sci., 29, 1433–1439, 2016.
Wang, H. L., Yang, Z. X., and Jing, S. A.: Volatile organic compounds (VOCs) source profiles of industrial processing and solvent use emissions: a review, Huanjing Kexue, 38, 2617–2628, 2017a.
Wang, H. L., Jing, S. A., Lou, S. R., Hu, Q. Y., Li, L., Tao, S. K., Huang, C., Qiao, L. P., and Chen, C. H.: Volatile organic compounds (VOCs) source profiles of on-road vehicle emissions in China, Sci. Total Environ., 607–608, 253–261, 2017b.
Wang, H. L., Jing, S. A., Lou, S. R., Tao, S. K., Qiao, L. P., Li, L., Huang, C., Lin, L., and Chen, C. H.: Estimation of fine particle (PM2.5) emission inventory from cooking: case study for Shanghai, Huanjing Kexue, 39, 1971–1977, 2018.
Wang, J. D., Zhao, B., Wang, S. X., Yang, F. M., Xing, J., Morawska, L., Ding, A. J., Kulmala, M., Kerminen, V., Kujansuu, J., Wang, Z. F., Ding, D., Zhang, X. Y., Wang, H. B., Tian, M., Petäjä, T., Jiang, J. K., and Hao, J. M.: Particulate matter pollution over China and the effects of control policies, Sci. Total Environ., 584–585, 426–447, 2017.
Wang, P., Ying, Q., Zhang, H. L., Hu, J. L., Lin, Y. C., and Mao, H. J.: Source apportionment of secondary organic aerosol in China using a regional source-oriented chemical transport model and two emission inventories, Environ. Pollut., 237, 756–766, 2018.
Wang, R. N., Huang, C., Ren, H. J., Yan, R. S., Hong, Z., Xu, C., Hu, Q. Y., An, J. Y., Dong, B. N., and Li, L.: Air pollutant emission inventory from LTO cycles of aircraft in civil aviation airports in the Yangtze River Delta region, China, Acta Scientiae Circumstantiae, 38, 4472–4479, 2018.
Wang, S., Zhu, F. H., Wang, H. M., Zuo, Y., Sun, X. L., Zhao, X. Y., Chen, H., and Liu, G.: Fine particle emission characteristics from coal-fired power plants based on field test, Acta Scientiae Circumstantiae, 31, 630–635, 2011.
Wayson, R. L., Fleming, G. G., and Lovinelli, R.: Methodology to estimate particulate matter emissions from certified commercial aircraft engines, J. Air Waste Manage., 59, 91–100, 2009.
Wen, Y. F., Wang, H., Larson, T., Kelp, M., Zhang, S. J., Wu, Y., and Marshall, J. D.: On-highway vehicle emission factors, and spatial patterns, based on mobile monitoring and absolute principal component score, Sci. Total Environ., 676, 242–251, 2019.
Wu, R. L., Liu, F., Tong, D., Zheng, Y. X., Lei, Y., Hong, C. P., Li, M., Liu, J., Zheng, B., Bo, Y., Chen, X. T., Li, X., and Zhang, Q.: Air quality and health benefits of China's emission control policies on coal-fired power plants during 2005–2020, Environ. Res. Lett., 14, 094016, https://doi.org/10.1088/1748-9326/ab3bae, 2019.
Wu, R. R. and Xie, S. D.: Spatial distribution of ozone formation in China derived from emissions of speciated volatile organic compounds, Environ. Sci. Technol., 52, 8146–8156, 2018a.
Wu, R. R. and Xie, S. D.: Spatial distribution of secondary organic aerosol formation potential in China derived from speciated anthropogenic volatile organic compound emissions, Environ. Sci. Technol., 52, 8146–8156, 2018b.
Wu, Y., Zhang, S. J., Li, M. L., Ge, Y. S., Shu, J. W., Zhou, Y., Xu, Y. Y., Hu, J. N., Liu, H., Fu, L. X., He, K. B., and Hao, J. M.: The challenge to NOx emission control for heavy-duty diesel vehicles in China, Atmos. Chem. Phys., 12, 9365–9379, https://doi.org/10.5194/acp-12-9365-2012, 2012.
Xia, Y., Yang, Q., Xu, C., Lu, B., Tang, W., Jing, B. L., Lu, Q., Huang, C., and Lu, J.: Study on high resolution NH3 emission inventory based on analysis of large data for agriculture in Hangzhou, Acta Scientiae Circumstantiae, 38, 661–668, 2018.
Xu, J., Huang, C., Li, L., Chen, Y. H., Lou, S. R., Qiao, L. P., and Wang, H. Y.: Chemical composition characteristics of PM2.5 emitted by medium and small capacity coal-fired boilers in the Yangtze River Delta Region, Huanjing Kexue, 39, 1493–1501, 2018.
Yang, Q., Huang, C., Lu, B., Jing, B. L., Xia, Y., Tang, W., Lu, Q., Lu, J., Xu, C., and Gu, Z. Y.: Air pollutant emission inventory based on local emission source surveys in Hangzhou, China, Acta Scientiae Circumstantiae, 37, 3240–3254, 2017.
Yang, Y. and Zhao, Y.: Quantification and evaluation of atmospheric pollutant emissions from open biomass burning with multiple methods: a case study for the Yangtze River Delta region, China, Atmos. Chem. Phys., 19, 327–348, https://doi.org/10.5194/acp-19-327-2019, 2019.
Yao, Z. M., Teng, Y., Li, J., Wu, X. F., and Duan, N.: NOx emission factors from medium and small layer burning boilers firing soft coal, Res. Environ. Sci., 22, 1263–1268, 2009.
Ying, Q., Feng, M., Song, D. L., Wu, L., Hu, J. L., Zhang, H. L., Kleeman, M. J., and Li, X. H.: Improve regional distribution and source apportionment of PM2.5 trace elements in China using inventory-observation constrained emission factors, Sci. Total Environ., 624, 355–365, 2018.
Zhang, J., Liu, L., Zhao, Y., Li, H., Lian, Y., Zhang, Z., Huang, C., and Du, X.: Development of a high-resolution emission inventory of agricultural machinery with a novel methodology: A case study for Yangtze River Delta region, Environ. Pollut., 266, 115075, https://doi.org/10.1016/j.envpol.2020.115075, 2020.
Zhang, S. J., Wu, Y., Zhao, B., Wu, X. M., Shu, J. W., and Hao, J. M.: City-specific vehicle emission control strategies to achieve stringent emission reduction targets in China's Yangtze River Delta region, J. Environ. Sci., 51, 75–87, 2017.
Zhang, X. M., Wu, Y. Y., Liu, X. J., Reis, S., Jin, J. X., Dragosits, U., van Damme, M., Clarisse, L., Whitburn, S., Coheur, P., and Gu, B. J.: Ammonia emissions may be substantially underestimated in China, Environ. Sci. Technol., 51, 12089–12096, 2017.
Zhang, Y., Bo, X., Zhao, Y., and Nielsen, C. P.: Benefits of current and future policies on emissions of China's coalfired power sector indicated by continuous emission monitoring, Environ. Pollut., 251, 415–424, 2019.
Zhao, Y., Wang, S. X., Nielsen, C. P., Li, X. H., and Hao, J. M.: Establishment of a database of emission factors for atmospheric pollutants from Chinese coal-fired power plants, Atmos. Environ., 44, 1515–1523, 2010.
Zhao, Y., Qiu, L. P., Xu, R. Y., Xie, F. J., Zhang, Q., Yu, Y. Y., Nielsen, C. P., Qin, H. X., Wang, H. K., Wu, X. C., Li, W. Q., and Zhang, J.: Advantages of a city-scale emission inventory for urban air quality research and policy: the case of Nanjing, a typical industrial city in the Yangtze River Delta, China, Atmos. Chem. Phys., 15, 12623–12644, https://doi.org/10.5194/acp-15-12623-2015, 2015.
Zhao, Y., Mao, P., Zhou, Y., Yang, Y., Zhang, J., Wang, S., Dong, Y., Xie, F., Yu, Y., and Li, W.: Improved provincial emission inventory and speciation profiles of anthropogenic non-methane volatile organic compounds: a case study for Jiangsu, China, Atmos. Chem. Phys., 17, 7733–7756, https://doi.org/10.5194/acp-17-7733-2017, 2017.
Zhao, Y., Xia, Y. M., Zhou, Y. D.: Assessment of a high-resolution NOx emission inventory using satellite observations: A case study of southern Jiangsu, China, Atmos. Environ., 190, 135–145, 2018.
Zhao, Y., Yuan, M., Huang, X., Chen, F., and Zhang, J.: Quantification and evaluation of atmospheric ammonia emissions with different methods: a case study for the Yangtze River Delta region, China, Atmos. Chem. Phys., 20, 4275–4294, https://doi.org/10.5194/acp-20-4275-2020, 2020.
Zheng, B., Zhang, Q., Tong, D., Chen, C., Hong, C., Li, M., Geng, G., Lei, Y., Huo, H., and He, K.: Resolution dependence of uncertainties in gridded emission inventories: a case study in Hebei, China, Atmos. Chem. Phys., 17, 921–933, https://doi.org/10.5194/acp-17-921-2017, 2017.
Zheng, B., Tong, D., Li, M., Liu, F., Hong, C., Geng, G., Li, H., Li, X., Peng, L., Qi, J., Yan, L., Zhang, Y., Zhao, H., Zheng, Y., He, K., and Zhang, Q.: Trends in China's anthropogenic emissions since 2010 as the consequence of clean air actions, Atmos. Chem. Phys., 18, 14095–14111, https://doi.org/10.5194/acp-18-14095-2018, 2018.
Zheng, H., Cai, S., Wang, S., Zhao, B., Chang, X., and Hao, J.: Development of a unit-based industrial emission inventory in the Beijing–Tianjin–Hebei region and resulting improvement in air quality modeling, Atmos. Chem. Phys., 19, 3447–3462, https://doi.org/10.5194/acp-19-3447-2019, 2019.
Zheng, J. J., Jiang, P., Qiao, W., Zhu, Y., and Kennedy, E.: Analysis of air pollution reduction and climate change mitigation in the industry sector of Yangtze River Delta in China, J. Clean. Prod., 114, 314–322, 2016.
Zheng, M., Zhang, Y. J., Yan, C. Q., Fu, H. Y., Niu, H. Y., Huang, K., Hu, M., Zeng, L. M., Liu, Q. Z., Pei, B., and Fu, Q. Y.: Establishing PM2.5 industrial source profiles in Shanghai, China Environmental Science, 33, 1354–1359, 2013.
Zhou, Y., Zhao, Y., Mao, P., Zhang, Q., Zhang, J., Qiu, L., and Yang, Y.: Development of a high-resolution emission inventory and its evaluation and application through air quality modeling for Jiangsu Province, China, Atmos. Chem. Phys., 17, 211–233, https://doi.org/10.5194/acp-17-211-2017, 2017.
Zhou, Z. Q.: Study on characteristics ammonia emission from typical large scale dairy cow farm in Shanghai, Master Thesis, East China University of Science and Technology, Shanghai, China, 76 pp., 2019.