the Creative Commons Attribution 4.0 License.
the Creative Commons Attribution 4.0 License.
 | 10 Feb 2021
Measurement report: Sulfuric acid nucleation and experimental conditions in a photolytic flow reactor
David R. Hanson
Seakh Menheer
Michael Wentzel
Joan Kunz
Nucleation rates involving sulfuric acid and water measured in a photolytic flow reactor have decreased considerably over a time period of several years. Results show that the system – flow reactor, gas supplies and lines, flow meters, valves, H2SO4 photo-oxidant sources – has reached a baseline stability that yields nucleation information such as cluster free energies. The baseline nucleation rate is punctuated by temporary bursts that in many instances are linked to cylinder changes, delineating this source of potential contaminants. Diagnostics were performed to better understand the system, including growth studies to assess H2SO4 levels, chemiluminescent NO and NOx detection to assess the HONO source, and deployment of a second particle detector to assess the nanoparticle detection system. The growth of seed particles shows trends consistent with the sizes of nucleated particles and provides an anchor for calculated H2SO4 concentrations. The chemiluminescent detector revealed that small amounts of NO are present in the HONO source, ∼ 10 % of HONO. The second condensation-type particle counter indicates that the nanoparticle mobility sizing system has a bias at low sulfuric acid levels. The measured and modeled nucleation rates represent upper limits to nucleation in the binary homogeneous system, H2SO4-H2O, as contaminants might act to enhance nucleation rates and ion-mediated nucleation may contribute. Nonetheless, the experimental nucleation rates, which have decreased by an order of magnitude or larger since our first publication, extrapolate to some of the lowest rates reported in experiments with photolytic H2SO4. Results from experiments with varying water content and with ammonia addition are also presented and have also decreased by an order of magnitude from our previous work; revised energetics of clusters in this three-component system are derived which differ from our previous energetics mainly in the five-acid and larger clusters.
- Article
(2163 KB) - Full-text XML
-
Supplement
(869 KB) - BibTeX
- EndNote


Atmospheric nucleation involving sulfuric acid, water, and ammonia is believed to have a large impact on the properties of clouds and their effects on the radiation balance of the atmosphere (Dunne et al., 2016; Coffman and Hegg, 1995). Since the influence on climate of aerosol particles is well-known to be potentially quite large (IPCC, 2013), the formation of atmospheric particles through nucleation has long been studied with a focus on sulfuric acid (McMurry et al., 2005; Kulmala et al., 2004). The chemical systems thought to have the largest global impacts on new particle formation are the binary H2SO4–H2O and ternary H2SO4–H2O–NH3 systems.
Yet over the decades there is a wide divergence in nucleation rates measured in laboratory experiments, particularly in the binary system – see Fig. 6 in Zollner et al. (2012) and Fig. 9 in Hanson et al. (2019). While many of these discrepancies may be attributable to contamination or other experimental conditions, this leaves nucleation rates for atmospheric conditions somewhat uncertain. Likewise, nucleation rates in the ternary system derived from laboratory experiments have uncertain applicability to the atmosphere due in part to effects of potential contaminant bases.
Recent nucleation results from the CLOUD experiment (Kirkby et al., 2011; Almeida et al., 2013; Ehrhart et al., 2016; Kürten et al., 2016) may best represent binary and ternary nucleation, and these results have been parameterized and used in global climate models where their climate effects were found to be significant. Yet these nucleation rates have not been corroborated in independent laboratory investigations. In fact there is disagreement with other recent work, albeit based on extrapolated data and/or theoretical treatments (see Zollner et al., 2012; Hanson et al., 2019; Kürten et al., 2016).
For the binary system, Ehrhart et al. (2016) showed that the CLOUD data at low temperatures agree well with theoretical nucleation rates from the sulfuric acid and water nucleation (SAWNUC) thermodynamics (Lovejoy et al., 2004). However, there was poor agreement at temperatures warmer than 270 K. This poor agreement has been attributed to contamination by base molecules that are enhanced at warm chamber temperatures. Certainly contamination is a concern for experimental work in the binary system (e.g., Zollner et al., 2012; Hanson et al., 2019). Here, we report more measurements in the putative binary system to gain further information on the effects of potential contaminants in our photolytic flow reactor (PFR) (Hanson et al., 2019). We present measurements of NO and HONO + NOx, growth measurements, and measurements from a second particle counter that improve knowledge of the conditions in our PFR.
For the ternary system, Kürten (2019) and Hanson et al. (2019) used cluster models to derive thermodynamic information from the CLOUD and the photolytic flow reactor (PFR) results, respectively. Both concluded that the thermodynamics derived by Hanson et al. (2017) for H2SO4–NH3 clusters from the bulk flow reactor study of Glasoe et al. (2015) are inaccurate; Hanson et al. (2019) speculated this was due to a cross-contamination by an amine in the ammonia delivery lines. We present here new ternary system measurements from the PFR and discuss the effects of potential contaminants. We compare predictions of our cluster model to the CLOUD experimental data and to those of Kürten (2019) and Yu et al. (2020). Finally, we present the effects of relative humidity (RH) on the nucleation rate in the ternary ammonia–sulfuric acid–water system.
Nucleation was studied in the PFR, a vertically mounted, 120 cm long, 5 cm inner diameter, jacketed, glass flow reactor surrounded by 4 UV (∼365 nm peak) lamps. The total flow was 2.9 slpm (273 K and 1 atm, standard liter per minute), temperature was 296 K, the main gas source was liquid nitrogen that has parts-per-million levels of oxygen present, and H2SO4 was produced from photolysis of HONO and subsequent oxidation of SO2. Typical flows were dry nitrogen, Q2, 1.33 slpm; water was introduced as a humidified N2 flow, Q3, 1.5 slpm; HONO level was set with a flow, Q4, of between 2 and 10 sccm (standard cubic centimeters per minute); the flow of the SO2 mixture (0.15 % in N2 or 1 % in 0.1 O2 0.9 N2), Q1, was 4 to 32 sccm. For the majority of the work presented here, there was no added base. For some experiments, diluted base in an N2 flow of about 35 sccm was added via a port at the top of the flow reactor, as described previously. The base mixing ratios quoted below were calculated from known flow rates and assumed fast mixing and no losses; only small portions of the flow reactor achieved those mixing ratios (note that the simulations included mixing and losses). Particles were detected with a nanoparticle mobility particle sizer (MPS) system (DEG system; Jiang et al., 2011); this and the complete apparatus are fully described in Hanson et al. (2019). The Supplement details more of the system's essentials.
A second particle detector, the ultrafine condensation particle counter (UCPC, butanol) of Zollner et al. (2012), was attached to the exit of the PFR for some experiments. A similar co-deployment of the UCPC and the DEG system in a nucleation experiment found good agreement between them (Glasoe et al., 2015). The basics of the UCPC are described in Stolzenburg and McMurry (1991), and we deployed it here with the modifications suggested by Kuang et al. (2012) where the saturator minus condenser temperature was set to 35 ∘C and the condenser and capillary flow rates were 0.45 and 0.06 L min−1, respectively. Pulse-height analysis data were collected, from which the total particle number concentrations were obtained. Size-dependent losses of nanoparticles in sampling lines and inside the UCPC were accounted for using the Gormley and Kennedy (1948) equations; losses are 20 %, 40 %, and 60 % at 8, 4, and 2.7 nm diameter, respectively. For charged NaCl particles, activation efficiency for butanol working fluid is similar to that for diethylene glycol, greater than 80 % for 2.5 nm and larger particles, determined by comparing results from Jiang et al. (2011) and Kuang et al. (2012). The UCPC sampled flow via one leg of a Swagelok in. (0.64 cm) tee usually with an additional 0.3 L min−1 transport flow (total sampling rate of 0.75 L min−1). The UCPC data were recorded with the tee placed before the DEG system charger; a limited set of early experiments in January of 2020 with the tee downstream of the charger did not show large differences in results (see the Supplement). Splitting the sample flow with tube fitting tees probably introduces an additional loss on the order of 5 %, depending on the details of the sampling tubulation (Wang et al., 2002). Since losses due to the tee are small, they were not accounted for.
The activation properties of butanol vapor onto nanoparticles composed of sulfuric acid are complicated by potential chemical reactions (O'Dowd et al., 2004; Hanson et al., 2002), and the UCPC's pulse-height analysis sizing capabilities are compromised. Thus, separating the largest particles from the total detected by the UCPC is difficult to do with sufficient certainty. So in principle the analysis of the UCPC data here will be influenced by more particles than are in the leading edge of the particle size distributions of the DEG system. A good relationship between these two data sets is expected when the size distribution has a prominent large-particle mode, the so-called leading-edge particles, which is the case for most of the UCPC results presented here.
Growth studies were performed where H2SO4–dimethylamine nanoparticles, formed in the bulk flow reactor of Glasoe et al. (2015), were introduced into the PFR where they could be exposed to H2SO4. The growth of the particles was assessed by changes in the particle size distributions upon turning on the UV lights. Specifically, the volume-weighted mean diameters of the leading edge of the size distributions are derived and plotted as a function of HONO. These studies were performed over a limited range of HONO concentrations because nucleation of new particles at high HONO levels significantly interferes with the initial size distributions.
The source of HONO is the reaction of HCl with NaONO(s) and, as discussed by Febo et al. (1995), NO can be produced by decomposition of 2 HONO molecules into H2O, NO, and NO2, possibly followed by reaction of NO2 with HONO giving NO and HNO3. A chemiluminescent NO and NOx detector (TECO 42b) was periodically used to assess the NO and the NO + NO2 + HONO levels exiting the PFR. It was calibrated with a 105 ppb NO in N2 mixture (AirGas).
The 2D model of the PFR developed in Hanson et al. (2019) was also used here. Flow was assumed to be fully developed laminar (parabolic velocity profile), and the full suite of photolytic reactions were included along with H2SO4 condensation to and evaporation from its molecular clusters. In short, the photochemistry is initiated by photolysis of HONO yielding OH and NO, and H2SO4 is formed promptly after OH reacts with SO2. HO2 is also a product, and it can react with NO, generating another OH radical. See Sects. 2.1 and S7 of Hanson et al. (2019) for the detailed photochemistry. Cluster chemistry is tracked in detail with evaporation rates determined by thermodynamics for clusters up to 10 H2SO4 molecules; clusters larger than this were not allowed to evaporate. Note that water molecules were not tracked in the clusters but were allowed to affect their size (thus kinetics) and evaporation rates (thus thermodynamics); this quasi-unary approach for simulating the binary system is similar to that of Lovejoy et al. (2004) and Yu (2005).
Note that base (ammonia or dimethylamine) molecules can be included in the simulations in a quasi-binary approach to these ternary systems. Molecular clusters up to 10 H2SO4 molecules containing up to 10 base molecules could be simulated; for most simulations presented here, only clusters up to three base molecules were needed (i.e., results were within a few percent of simulations when up to six base molecules were included). The binary (quasi-unary) free energies were allowed to significantly influence the ammoniated cluster free energies for the larger clusters (see Supplement): thus water has an effect on NH3–H2SO4 quasi-binary free energies. Further details including kinetic rates, diffusion coefficients, cluster thermodynamics, and other assumptions are presented in the Supplement.
3.1 System stability, HONO source evaluation
A long time series of data (particle number density, Np, vs. time) is shown in Fig. 1 for a set of flow rates that gives standard experimental conditions: 52 % RH, 296 K, and a putative [HONO] of 5×1011 cm−3. The previously published Np data from May and June 2018 (Hanson et al., 2019) are also included. The data after November 2018 are generally much lower than data previous to this time, which we believe is due to an improvement in the cleanliness of the system.
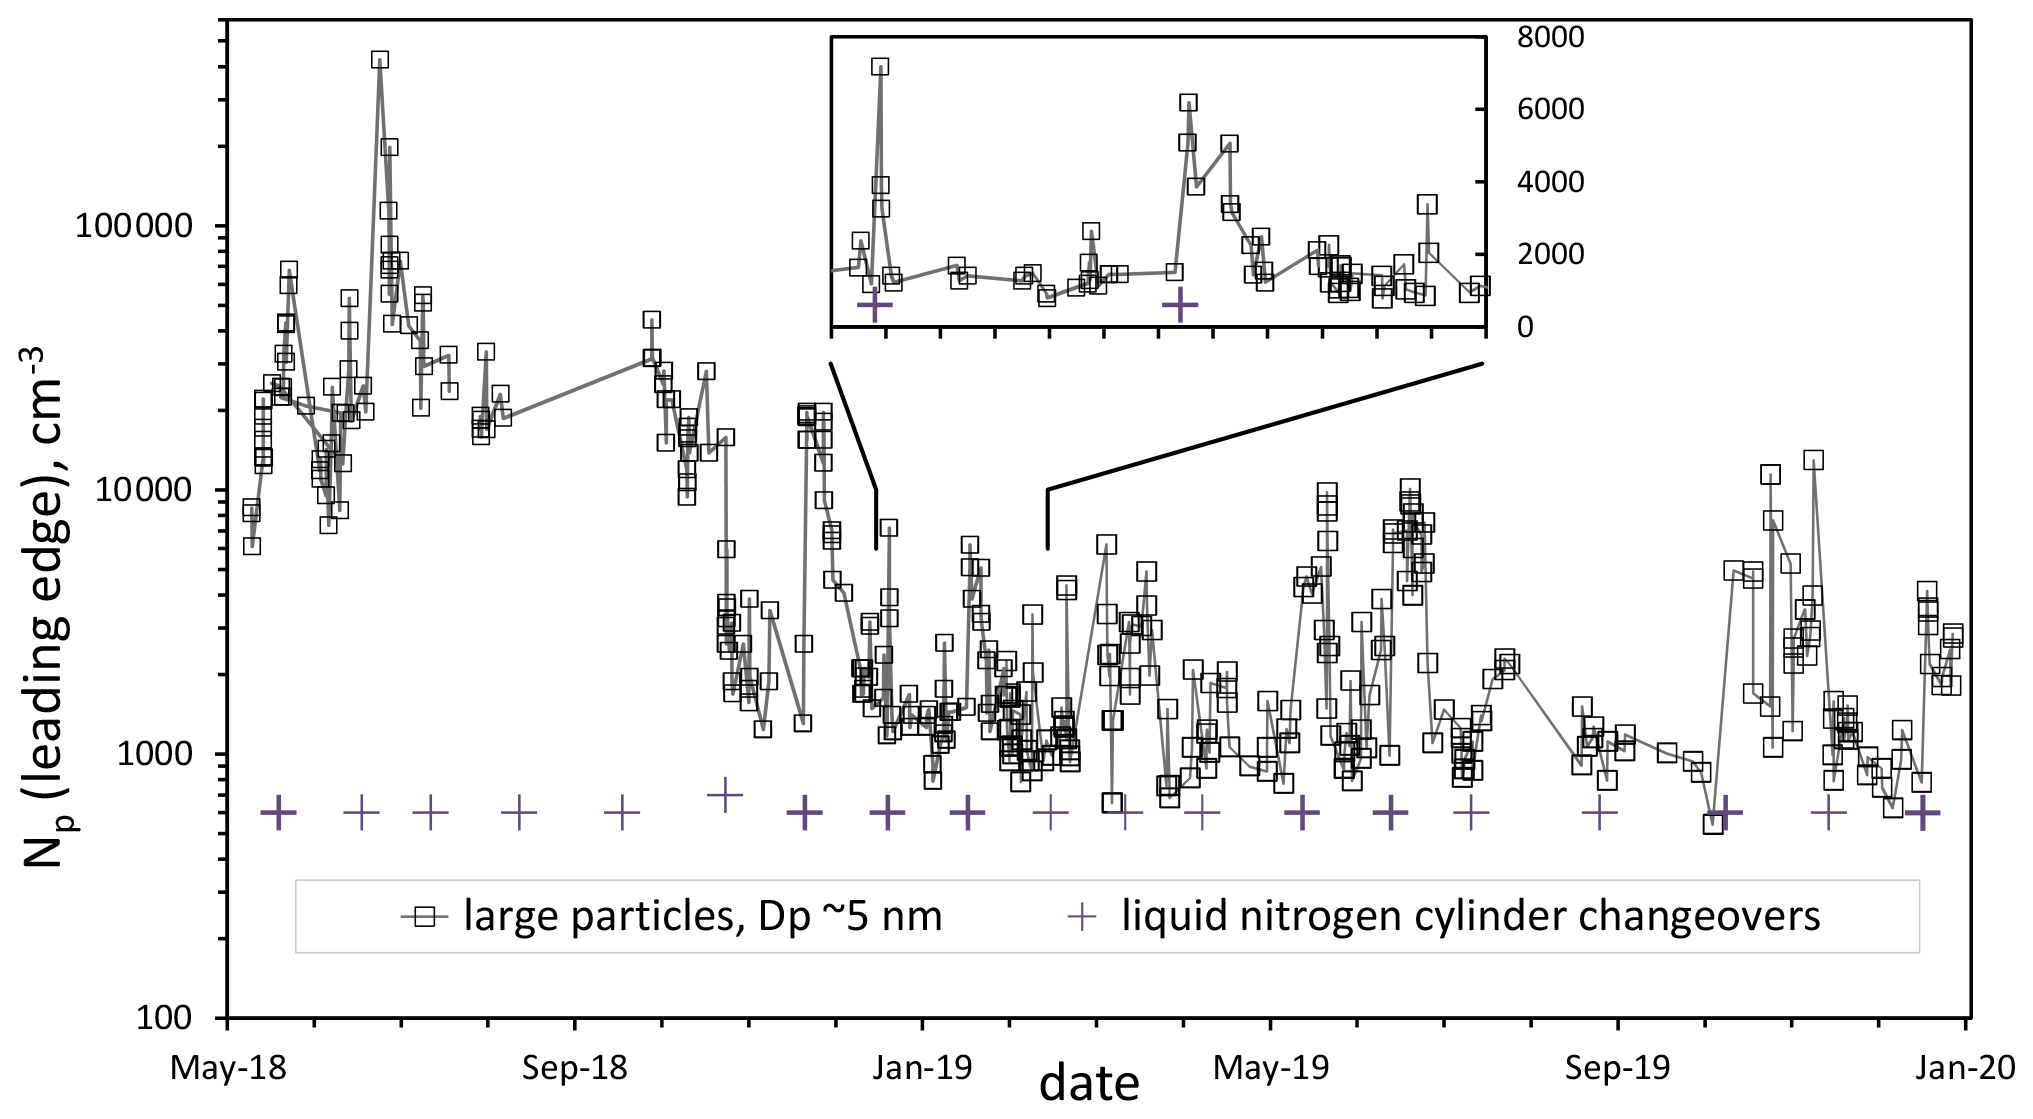
Figure 1Particle number density in the leading edge of the DEG system distribution over time for standard conditions (Q4=4.2 sccm, 52 % RH, 296 K). Leading edge refers to all particles described by a log-normal distribution of the largest particles (roughly 5 nm mode diameter for these conditions). The approximately monthly liquid nitrogen cylinder changeovers are indicated by the + symbols; bold indicates there is an associated spike in Np. The inset shows a 60 d period of data on a linear scale.
The data in Fig. 1 reveal a long-term stability of the system but with sporadic changes that might be due to contaminants: the spikes and variability in Np are often associated with cylinder changeovers (+ symbols; those in bold correlate with spikes). Despite repeated flushing of the gas-delivery lines, room air and perhaps dust may get introduced into the PFR during a changeover; degassing of the exit of the dewar's valve and the regulator port that are exposed to the atmosphere for weeks while at the supplier (AirGas) may play a role. A stainless-steel filter was installed on the flow meter manifold in late August 2019, but spikes still appeared after that. Nightmare compounds such as diamines could be responsible as they can lead to a single particle for each molecule (Jen et al., 2016): a 10−15 mol fraction could lead to spike of 104 cm−3.
Yet for all of 2019 there is a “floor” of about 1000 particles per cubic centimeter. The floor of the 2019 data is about 3 % of the average of the particle concentrations in early 2018, a significant drop that we attribute to the depletion or elimination of a source of base molecules within the flow. Extrapolating this floor in the DEG data to lower sulfuric acid, the PFR data are now more or less in agreement with the photolytic data from the CLOUD consortium but still somewhat larger than our earlier (Zollner et al., 2012) bulk flow reactor data. We present data below that indicate this floor is heavily influenced by a background level of particles in the DEG system, with the UCPC seeing much lower Np. Nonetheless, these data reveal that the stability of the system over the time periods of years is suitable for studying nucleation and growth for the binary (sulfuric acid–water) system and that the effects of contaminants can be discerned. See the Supplement for plots of Np and Dp vs. Q4 binned into four time periods.
Temporal variability in the floor is still evident, which may be influenced by variations in experimental conditions such as the oxidant source. To assess the HONO source, we measured NO and NOx in the effluent of the PFR, and small levels of NO (and also probably NO2) were present, roughly 10 % of the detected level of NOx (NO + NO2 + HONO): these data as a function of Q4, the HCl-laden flow over the NaONO(s) powder, are shown in Fig. 2.
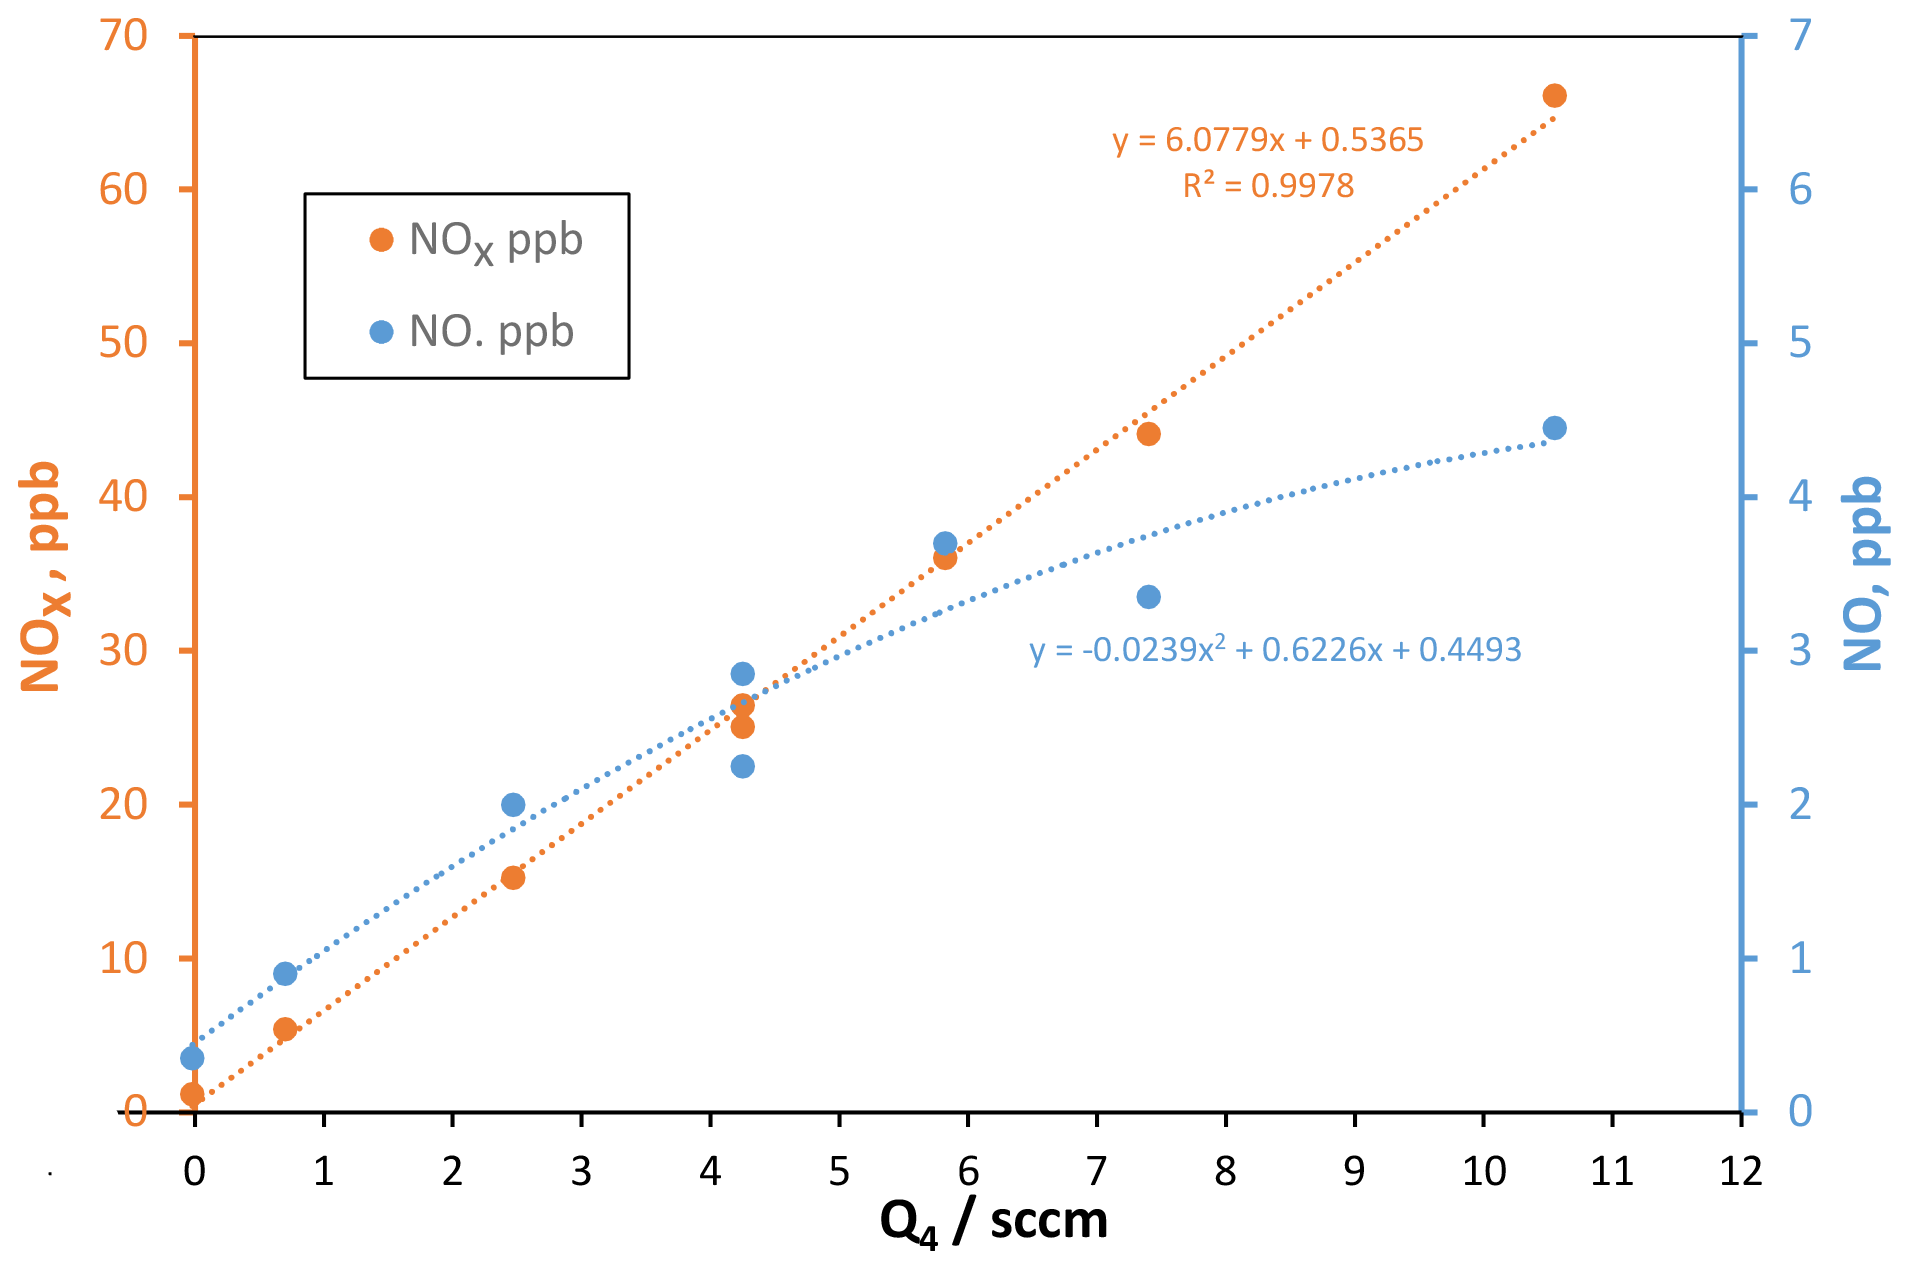
Figure 2NOx (left axis) and NO (right axis) vs. flow rate Q4 of HCl-laden flow over NaONO(s). Assuming that the NOx level is related one-to-one to HCl, the HCl mixing ratio in flow Q4 is 17.6 ppmv. sccm: standard cm3 min−1. NOx here includes HONO.
The total amount of NOx produced in the HONO source is well-represented by a linear dependence on the flow rate Q4 of the HCl-laden flow. However, NO is not linear with Q4, and it has a higher relative variability than NOx. Fluctuating NO impurity levels will affect the H2SO4 production rate (see below) and thus H2SO4 concentrations, contributing to the variability of Np. On average, the fraction of NOx that is NO ranges from 0.13 at Q4=2.5 sccm but decreases to 0.07 at Q4=10 sccm. A decreased decomposition of HONO at higher flow rates is expected as the NaONO vessel (since November 2019, a 5 mL pear-shaped glass vial) is more rapidly flushed; in fact, Febo et al. (1995) recommend flows of hundreds of milliliters per minutes to minimize the HONO decomposition rate; they used dry gas to dilute water vapor that also helped slow HONO loss. In our system for studying oxidation of organic compounds, this change was instituted, and an additional flow of 50 sccm dry air caused measured NO levels to decrease to a few percent of the NOx level (Hanson et al., 2021).
We used our model to assess how HONO decomposition affects H2SO4 levels and thus Np. Three scenarios were run where NOx was attributed to (1) 100 % HONO, (2) 80 % HONO 10 % NO 10 % NO2, or (3) 85 % HONO 10 % NO 5 % HNO3. Scenario (3) is a situation where 10 % of the HONO decomposes to 5 % NO and NO2, followed by NO2 reacting with HONO, giving an additional 5 % NO and HNO3 (HNO3 is not included in NOx; there could be a fourth scenario, 89.5 % HONO and 10.5 % NO). A revised photolysis rate of s−1 was used for HONO (see the next section).
The centerline H2SO4 is shown in Fig. 3 as a function of axial distance down the reactor for these three scenarios. Compared to the 100 % HONO simulations, those with 15 %–20 % HONO decomposition and 10 % NO lead to substantial increases in the rate of oxidation of SO2, boosting H2SO4 production by up to a factor of 2 due to OH generated in the reaction of NO with HO2. The particle sizes would also be affected, where the total exposure of a particle to H2SO4 along the length of the PFR can be approximately doubled at 10 % NO levels: the main reason that the photolysis rate for HONO deduced here is 50 % of that in our previous work (see the next section). Further discussion of the modeling and how the calculated H2SO4 from our previous work compares to the present calculations is contained in the Supplement. Not only does a small amount of NO accelerate H2SO4 production, but these simulations also reveal that calculated H2SO4 levels are sensitive to small fluctuations (6 %) in HONO levels when NO is present: average H2SO4 in scenario (3) is 20 % higher than that in scenario (2).
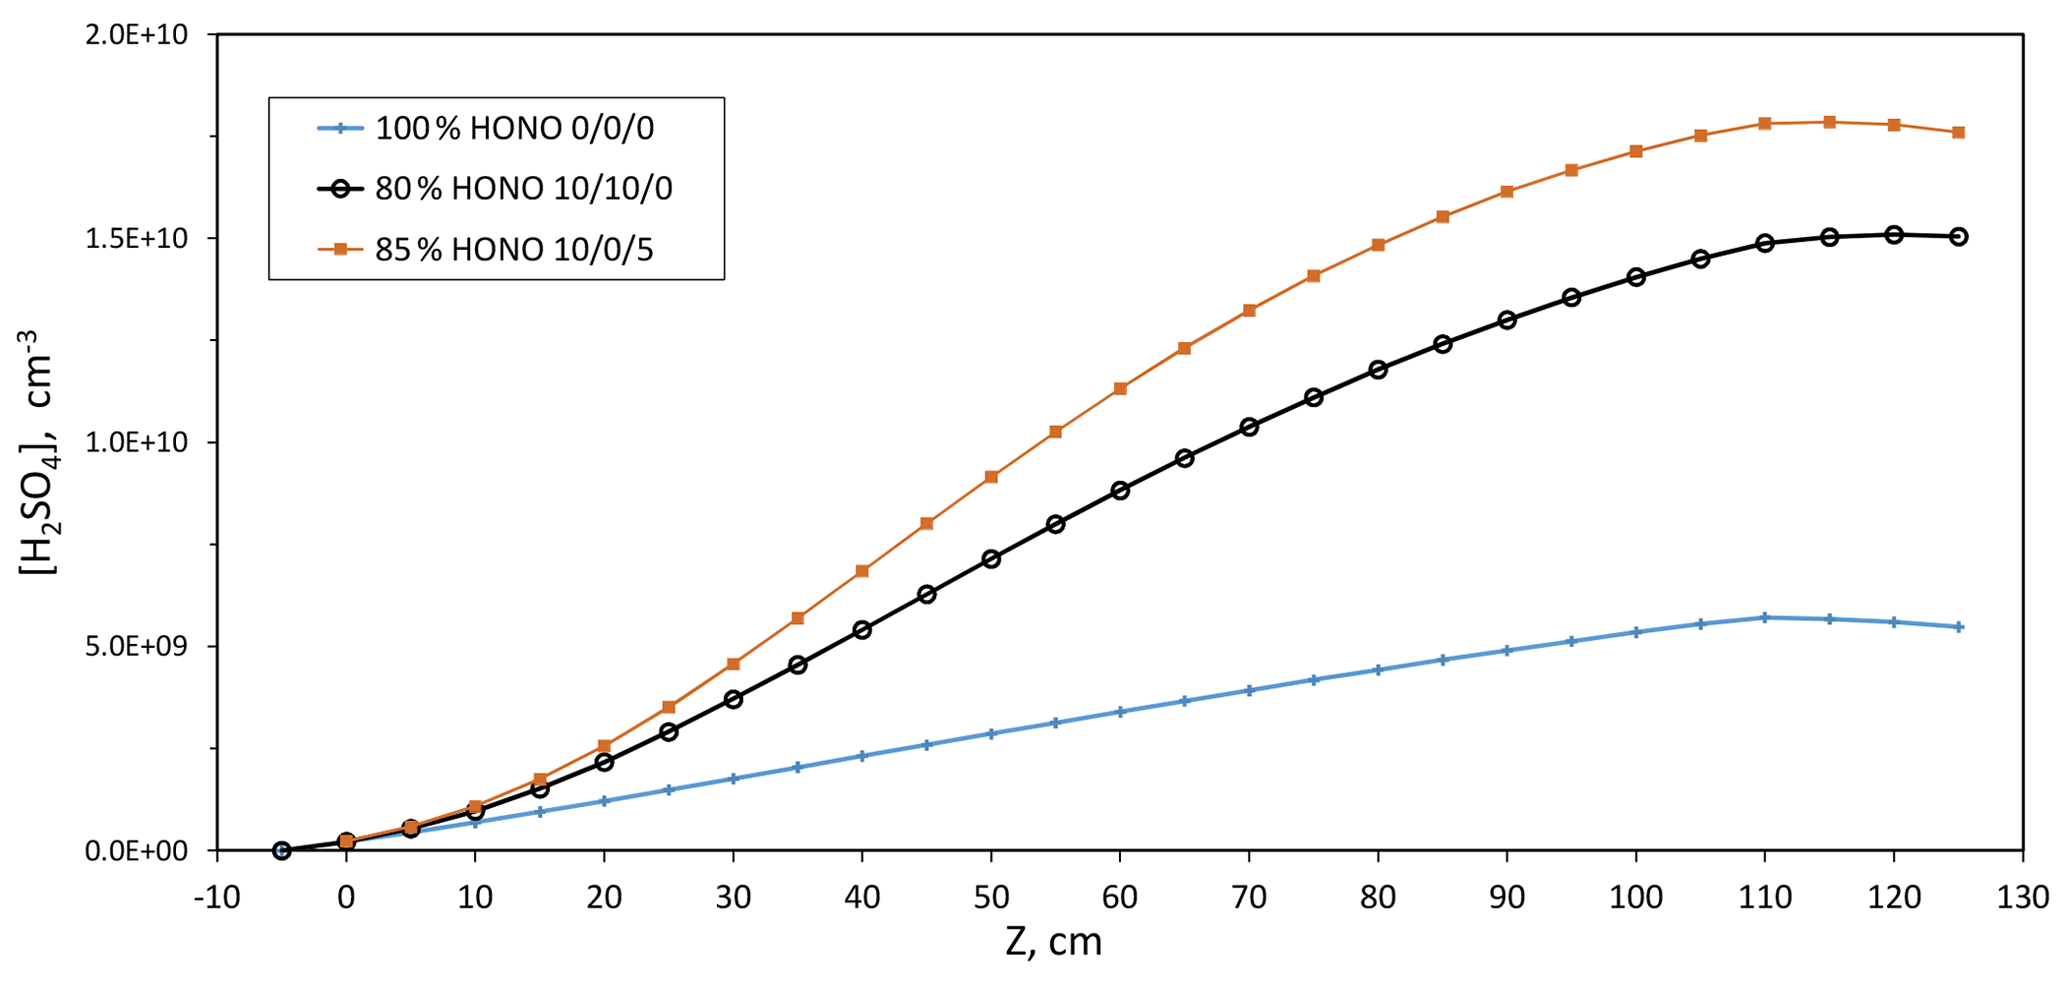
Figure 3Simulated centerline H2SO4 vs. axial distance for three different HONO decomposition scenarios where the last three numbers are the % NO, NO2, and HNO3, respectively. Parameters: HONO photolysis rate of s−1, 17 ppmv NOx (+HONO) in Q4, and no reaction between HO2 and SO2. These simulations were run for Q4=4.2 sccm. The 100 % level of HONO is a concentration of 5.79×1011 cm−3 or ∼25 ppbv.
An effect on Np due to varying SO2 mixing ratios was found in the measurements presented by Hanson et al. (2019), but this effect is now no longer experimentally present. Standard photochemistry with 100 % HONO entering the PFR predicted a small dependence, but interestingly the inclusion of a few parts per billion by volume of NO from the HONO source (Supplement and see below) increases the predicted dependence on SO2. The system's increased cleanliness (or perhaps change in the type of contaminant) and the decreased experimental dependence on SO2 level may be related. The Supplement has more discussion and presents experimental and theoretical Np as a function of SO2.
3.2 Growth of nanoparticles produced in bulk flow reactor
A series of experiments were conducted where particles generated in a bulk flow reactor (BFR; Zollner et al., 2012; Glasoe et al., 2015) were introduced into the PFR where they could be grown with photochemical H2SO4. BFR flow was 1.5 slpm, and enough dimethylamine was introduced into BFR's base addition port to induce particle number densities sufficient for the growth measurements (the no-loss amine level was typically 15 pptv). Total flow in the PFR was maintained at 2.9 slpm, and relative humidity and SO2 concentrations were controlled as before as well as HONO where Q4 was varied from 1.5 to 6 sccm. The amount of dimethylamine in the initial particles is not known, and it is assumed to have no effect on the photochemical growth of the nanoparticles. A set of size distributions from the DEG system and the results of three other growth experiments, one with ammonia swapped in for dimethylamine, are presented in the Supplement.
Two sets of growth experiments are shown in Fig. 4, a plot of the volume-mean diameter of the leading-edge particles vs. Q4, the flow of the HCl-laden flow through the NaONO(s) vessel. The diamonds are with the UV lights on, and the circles are lights off (plotted at Q4=0; HONO level did not affect the initial size of the particles from BFR). For one set of conditions the BFR particles were shut off so that the particles nucleated in the PFR could be measured without interference from the seed particles, and their sizes are shown as the orange square and green triangle. The solid red line is representative of the leading-edge diameters from our previous work with the PFR (Hanson et al., 2019).
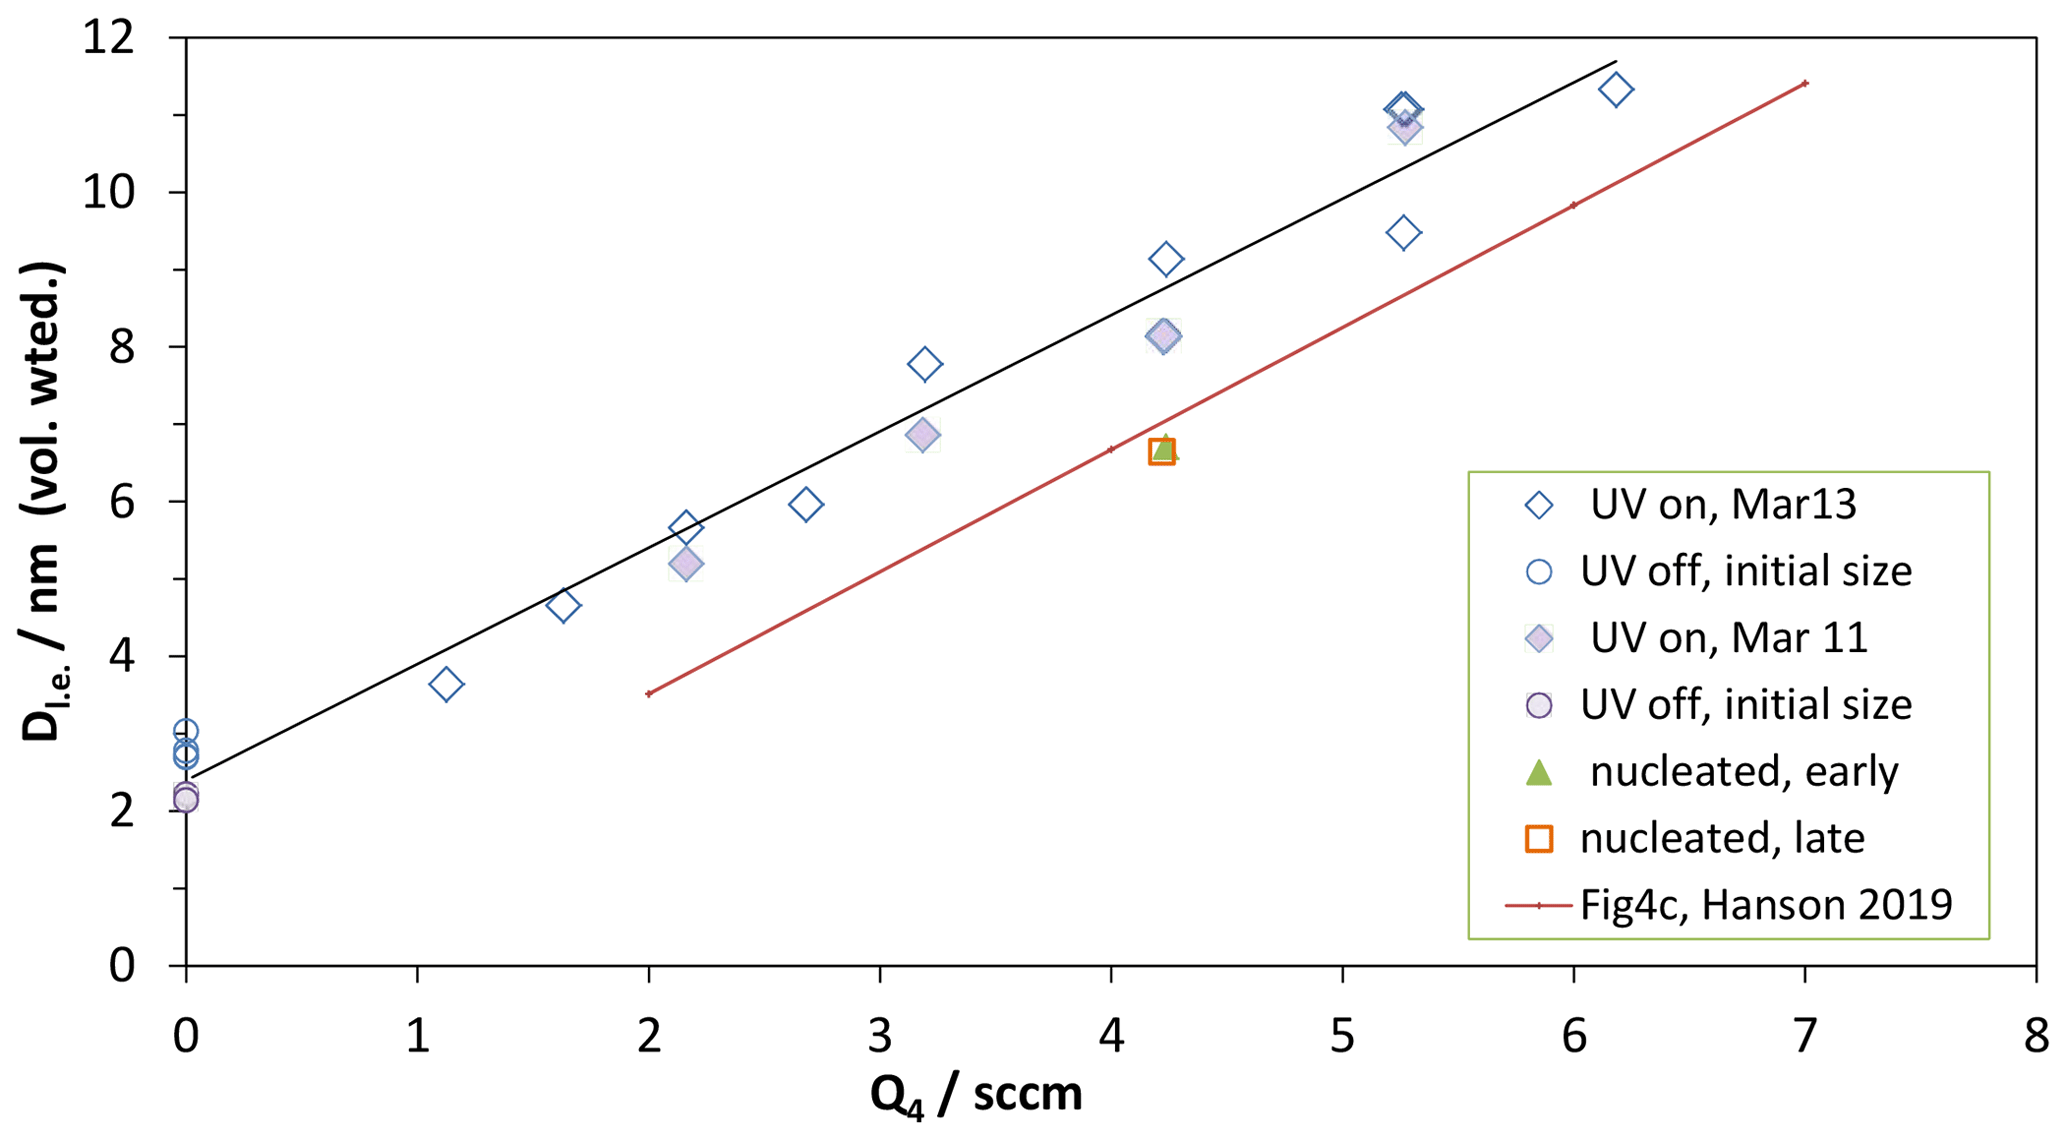
Figure 4Growth studies of externally produced nanoparticles, Dle vs. Q4. Dle is the volume-weighted diameter of the leading edge of the size distribution. The nanoparticles' initial size is indicated by the data plotted at Q4=0 sccm. The red line labeled “Fig4c” is from Hanson et al. (2019).
The increase in diameter of the external nanoparticles has roughly the same dependence on Q4 as do particles nucleated in the PFR. The size of the nucleated particles vs. Q4 has been variable but it has not changed significantly over time: the data from Hanson et al. (2019) compare well with the present nucleation results; see the Supplement. This indicates that growth conditions are similar in the PFR whether particles are pre-formed or are nucleated there (at least for those at the leading edge). The good correlations between Q4, the leading-edge size of nucleated particles, and calculated H2SO4 (Hanson et al., 2019) are supported here. Since knowledge of the photochemistry in our PFR has improved dramatically, this correlation is explored further in the next paragraph.
The increase in the size of the particles is directly linked to their exposure to H2SO4, and we analyze the data at Q4=4.2 sccm in a simplified manner to obtain an average H2SO4. Figure 4 shows a change in diameter for the initial 2–3 nm particles of 6.5 nm (±1 nm), and the total residence time along the flow reactor axis is 22.7 s (from Z=0 to 125 cm and assuming an axial flow velocity of 5.5 cm s−1 for fully developed laminar flow). In the Supplement we adapt the growth equation of Verheggen and Mozurkewich (2002) by augmenting the first term with a factor (Lehtinen and Kulmala, 2003) accounting for the size of the H2SO4 molecule with diameter dSA. This augmentation factor can be viewed as reconciling gas-kinetic molecule–cluster collision rates (e.g., McMurry, 1980) with particle–molecule collision rates (e.g., condensational growth rates of Fuchs and Sutugin, 1970). The simplification is to assume constant values for the size-dependent terms in Eq. (S4) (see Supplement for a detailed derivation). The observed growth at Q4=4.2 sccm requires an average H2SO4 concentration of 8.6×109 cm−3 for the 22.7 s the particles spend in the PFR. The Supplement includes changes in the size-dependent terms in the growth calculation, and the resulting average H2SO4 is within 5 % of this value.
3.3 HONO photolysis rate
This average H2SO4 concentration along with the measured NOx and NO was used to estimate the HONO photolysis rate: the photolysis rate was varied until the growth-increment-derived average H2SO4 concentration of 8.6×109 cm−3 was achieved. Firstly, because our earlier UV absorption measurements (Supplement of Hanson et al., 2019) showed the probable presence of NO2, we assume NO2 produced in the HONO self-reaction did not react further with HONO: the measured NOx is taken to be 80 % HONO, 10 % NO and 10 % NO2. The blue profile in Fig. 3 was calculated with a photolysis rate of s−1 and yields an average on-axis [H2SO4] of 8.6×109 cm−3. This HONO photolysis rate of s−1 is one-half of that from ( s−1) derived in our previous work. Note that the previous work assumed zero NO was entering with HONO, and a reaction between HO2 and SO2 was posited which led to a calculated average H2SO4 of 7.4×108 cm−3 for Q4=4.2 sccm, only about 14 % less than the present calculations yield. The Supplement presents a comparison of these two H2SO4 calculations as well as the potential effect of the radial gradients in H2SO4.
We have made two important assumptions regarding H2SO4 molecules colliding with particles: that the mass accommodation coefficient is unity and there is no van der Waals enhancement of the collision rate. These are reasonable assumptions but are not known with certainty; if not true the estimated photolysis rate could be significantly impacted. We note that some recent work (Stolzenburg et al., 2020) suggests that the H2SO4 collision rate with particles is affected by van der Waals forces, but we note that the uncertainty is large. In Sect. 3.8 we present some consequences on cluster free energies if there is an enhanced collision rate.
With this new knowledge (NO entering with HONO) and the new estimate for the HONO photolysis rate and assuming no enhanced van der Waals forces, the calculated H2SO4 concentration at the midpoint of the reactor (Z=60 cm, R=0 cm) is 8.8×109 cm−3 for Q4=4.2 sccm. Note that even though the fraction of NOx that is NO depends on Q4, the relationship between Q4 and H2SO4 in PFR is linear although not strictly proportional (see the Supplement for model-calculated dependencies).
3.4 UCPC vs. DEG
Shown in Fig. 5a are the results of nucleation studies in the PFR with total particle number densities, Np, measured with both the DEG system and the UCPC plotted vs. Q4, the flow through the HONO generation system. The two counters are in near agreement for large values of Q4, but at 4.2 sccm and below there is a discrepancy that grows as Q4 decreases, reaching over a factor of 10 at Q4=2.5 sccm. A potential cause is particles formed in ion-mediated processes, either with ambient ionization in the flow reactor or in the charger for the DEG system: H2SO4 vapor carried into the charger yields HSO ions that can grow larger by accumulating H2SO4 molecules, perhaps stabilized with water molecules or impurity bases. Either source of these ions could lead to significant artifact Np in the DEG system analysis because large correction factors are applied (∼100) because it is assumed that small neutral particles must be charged.
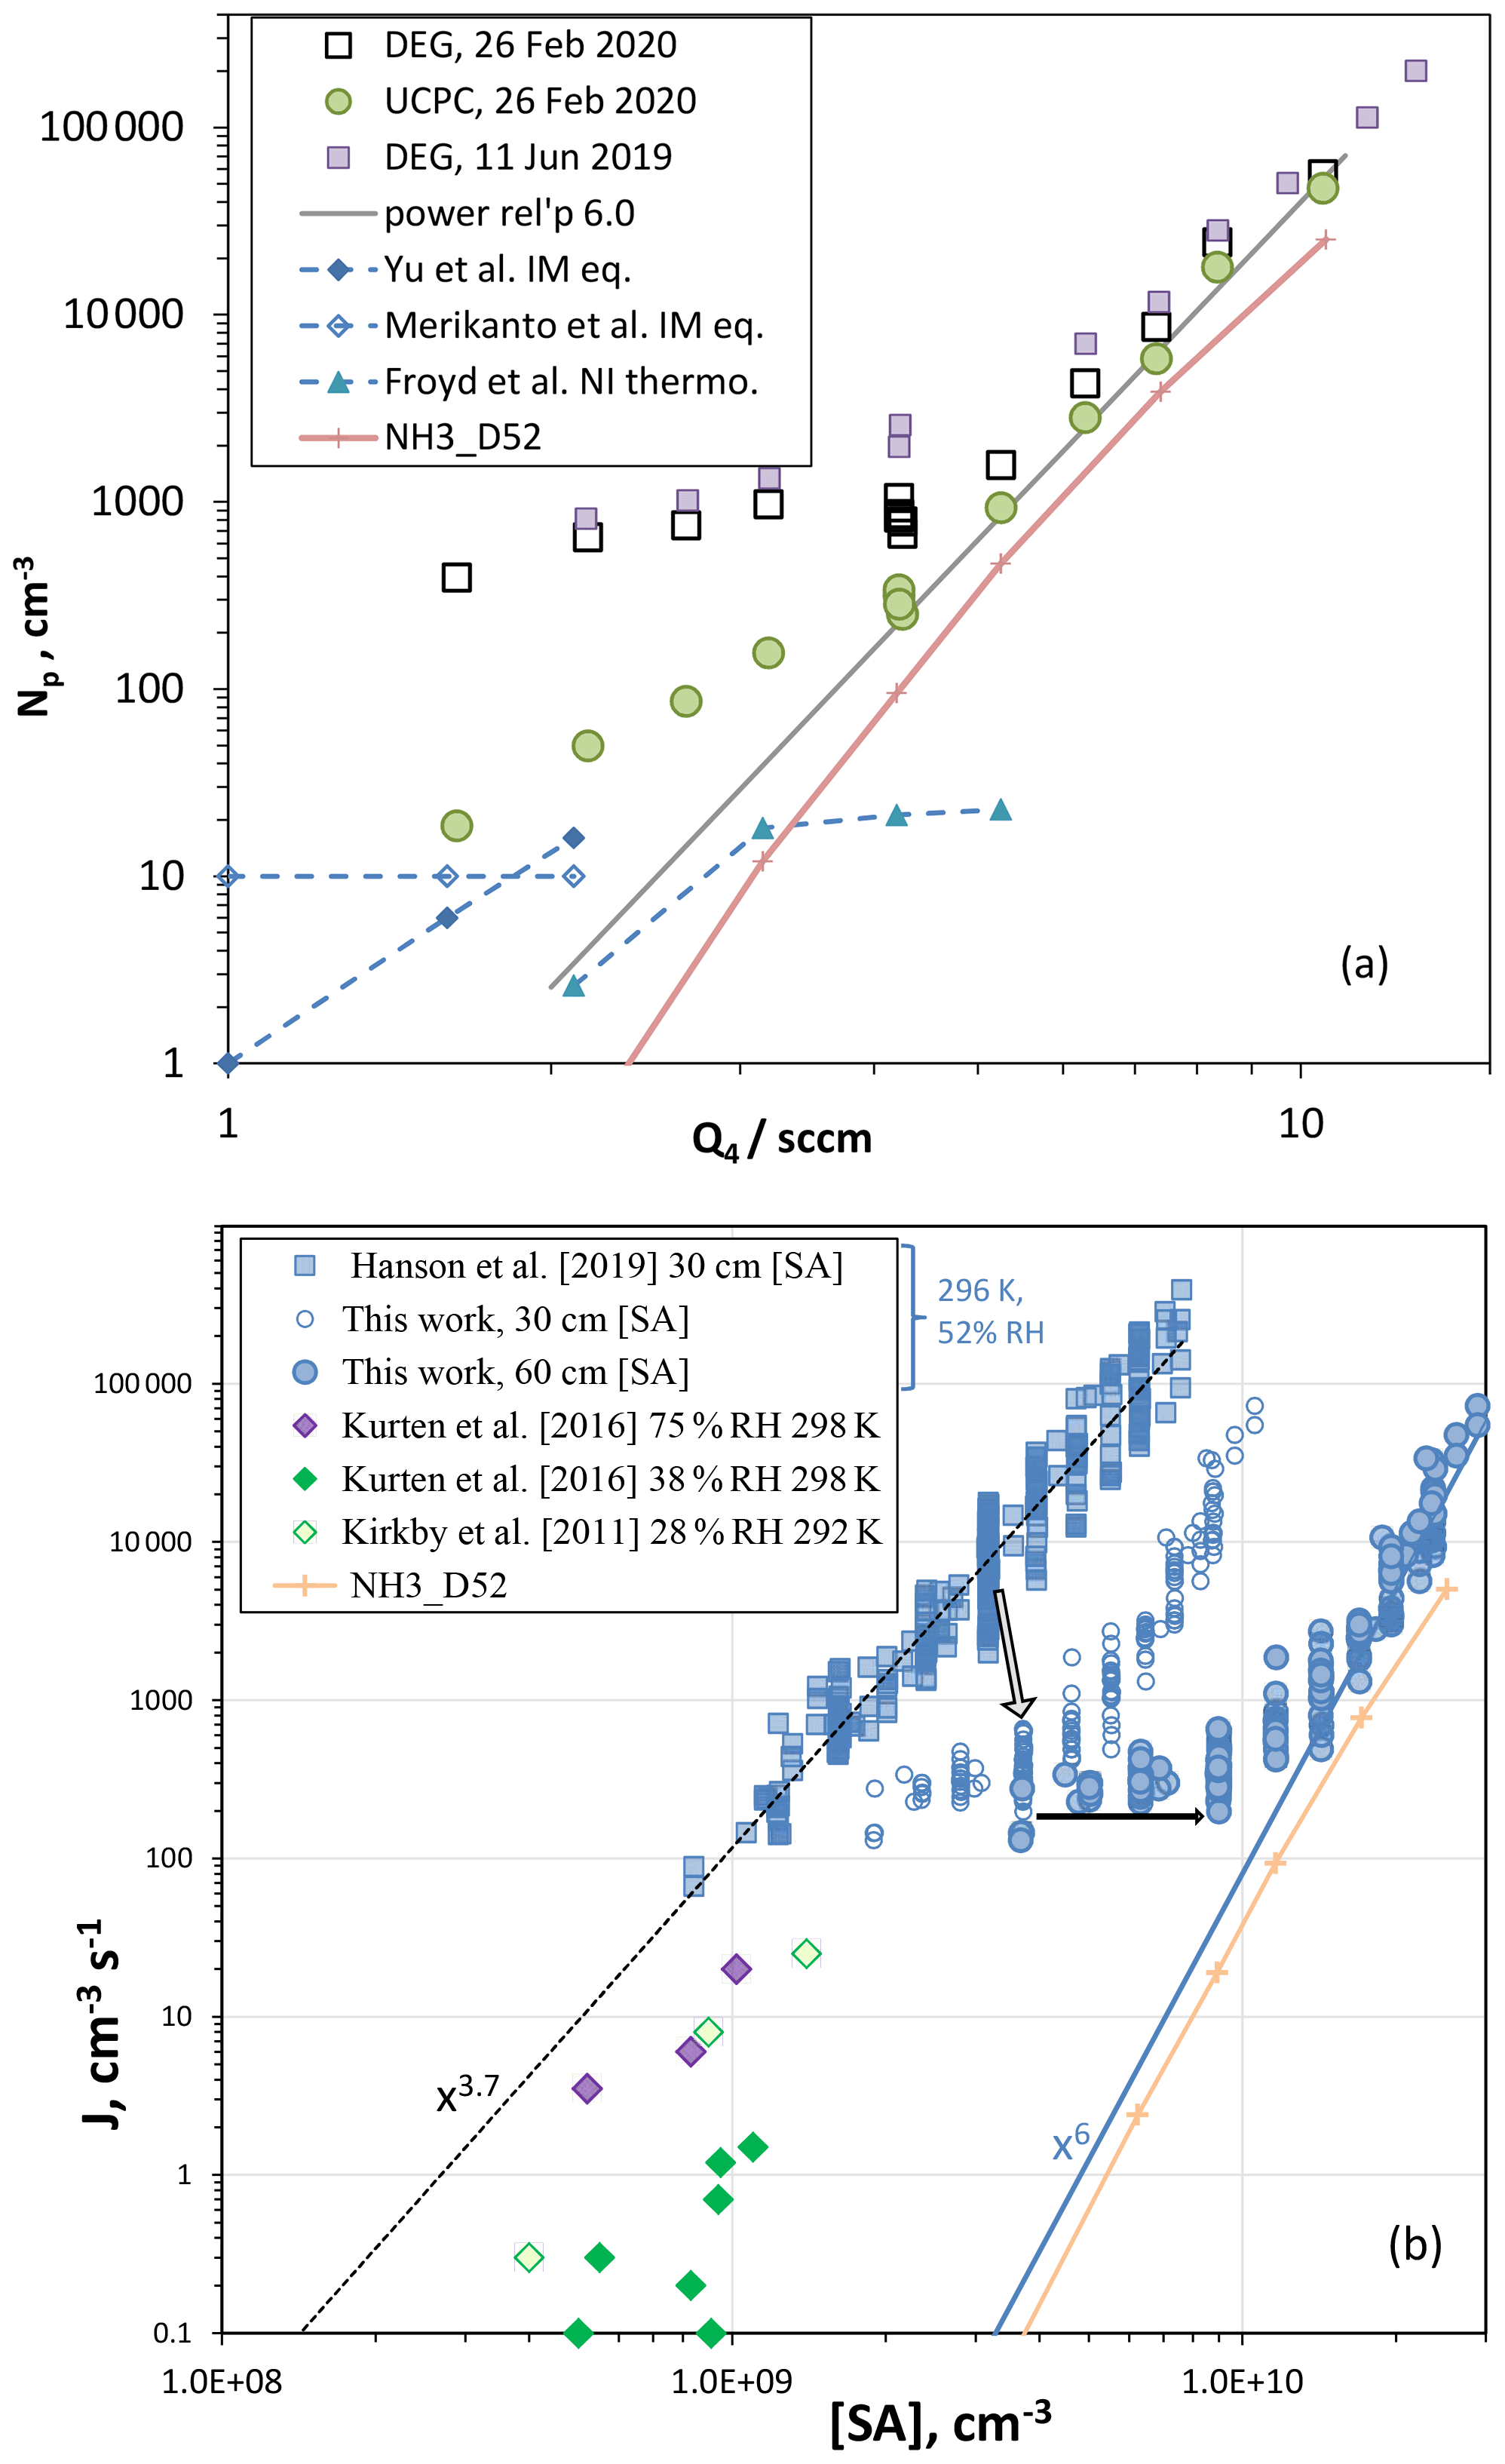
Figure 5(a) Np vs. Q4, two different particle counting systems. DEG system refers to the nano-MPS followed by a diethyleneglycol CPC (Np for the leading edge), and UCPC is a butanol-based detector. DEG system data from 2019 are also shown. Np is from ion-mediated (IM) nucleation from Yu et al. (2020) (BIMN, binary ion-mediated nucleation) and from Merikanto et al. (2016) (rates multiplied by 5 s nucleation time). Also shown is Np calculated in our 2D model for negative ions (NI, thermodynamics from Froyd and Lovejoy, 2003, blue diamonds) and for neutral nucleation using NH3_D52 thermodynamics (peach +). A power dependency of is also shown that describes the upper half of the UCPC data. (b) Nucleation rate vs. H2SO4 (SA) concentration. Nucleation rate given by total number of particles ≥2.3 nm in the DEG distribution divided by an estimated 5 s nucleation time. The [SA] concentration calculated at 30 cm was used to plot both the Hanson et al. (2019) data set and this work (open circles). The filled circles are the nucleation rates for this work but plotted at the 60 cm calculated [SA] concentration. The arrows indicate the system's evolution for results at Q4=4.25 sccm. Nucleation rates from the CLOUD experiment at 292 and 298 K for nominal binary conditions are also shown. The nucleation rate calculated using the 2D model with NH3_D52 thermodynamics is also plotted (+) at 60 cm [SA].
On the other hand, for 3 nm diameter or larger particles, the UCPC counts particles with roughly equal efficiency whether charged or not. Binary ion-mediated nucleation in our PFR under ambient ionization conditions leads to predicted Np (rate times 5 s; Yu et al., 2020, blue diamonds, and Merikanto et al., 2016, open diamonds) that suggests our UCPC data in Fig. 5a were affected by ion processes and significantly at low Q4 where the neutral nucleation rate is expected to be low. For the ion-mediated theoretical predictions (Yu et al., 2020; Merikanto et al., 2016), H2SO4 concentration was taken to be 2.2×109 cm−3 ⋅ Q4 (1 sccm). They compare favorably to the lowest UCPC Np, and it is possible that an ambient ionization rate of two ion pairs cm−3 s−1 (as used here) produced a level of 10 particles per cubic centimeter in our PFR. The peach line is Np from simulations of neutral nucleation using a quasi-unary thermodynamic scheme NH3_D52; see below. The blue triangles are the simulated Np of large negative ions (nine H2SO4 molecules plus bi-sulfate) using quasi-unary thermodynamics deduced from Froyd and Lovejoy (2003) (see Supplement). The Froyd and Lovejoy (2003) HSO(H2SO4)n thermodynamics supports a role for ion processes in our experiment, albeit a less active one than is suggested by the theoretical work of Yu et al. (2020) and Merikanto et al. (2016).
How does this affect the interpretation of the Np vs. Q4 results for the nominal binary system? Firstly, the DEG Np at low Q4 should be disregarded; in addition, the UCPC Np at low Q4 should be considered to be affected by ion-mediated nucleation. The dependence of nucleation rates on H2SO4 levels (Q4) supports these assertions. A power dependency of Np on is shown in the figure. It is representative of the high Q4 data, and extrapolation to low Q4 highlights that other nucleation processes are in effect at low Q4, even for the UCPC. This is based on the expectation that the power relationship should steepen, or at least not be weakened, as H2SO4 decreases. This is because the critical cluster must increase in size to have a decreased evaporation rate as H2SO4 decreases. Evaporation rates generally decrease as cluster size increases, as it does in the liquid drop model and in quantum chemistry calculations. Some experiments also show such behavior (e.g., Ball et al., 1999; Wyslouzil et al., 1991) as does the simulated Np labeled D52.
The bias in the low Q4 data for the UCPC could be due to a source of particles other than the ion-mediated process discussed above. For example, dimethylamine at a mole fraction of leads to simulated Np of 800 cm−3 at Q4=4.2 sccm (see Supplement). Another possibility is that the UCPC detects H2SO4 and clusters to a small degree: [H2SO4] in the 109 cm−3 range but detected at an extremely small efficiency, say 10−8, could still result in tens of hertz of count rates (thus tens of particles per cubic centimeter). Other clusters such as the dimer and trimer, although likely present at lower levels, ∼105 cm−3, might also give significant counts if efficiencies climb rapidly with size.
The UCPC Np is usually lower than the DEG Np as demonstrated in Figs. 5a and 6b and in the Supplement. Yet there was a period of time (see the Supplement) where both had elevated count rates and in fact the UCPC Np was at times greater than the DEG Np. During this time, the data in Fig. 6a for measurements with ∼650 ppt NH3 added were taken where UCPC Np is as much as a factor of 3 greater than the Np in the leading edge of the DEG system's size distribution. The reason for this behavior is not known. Further discussion of this time period is presented in the Supplement.
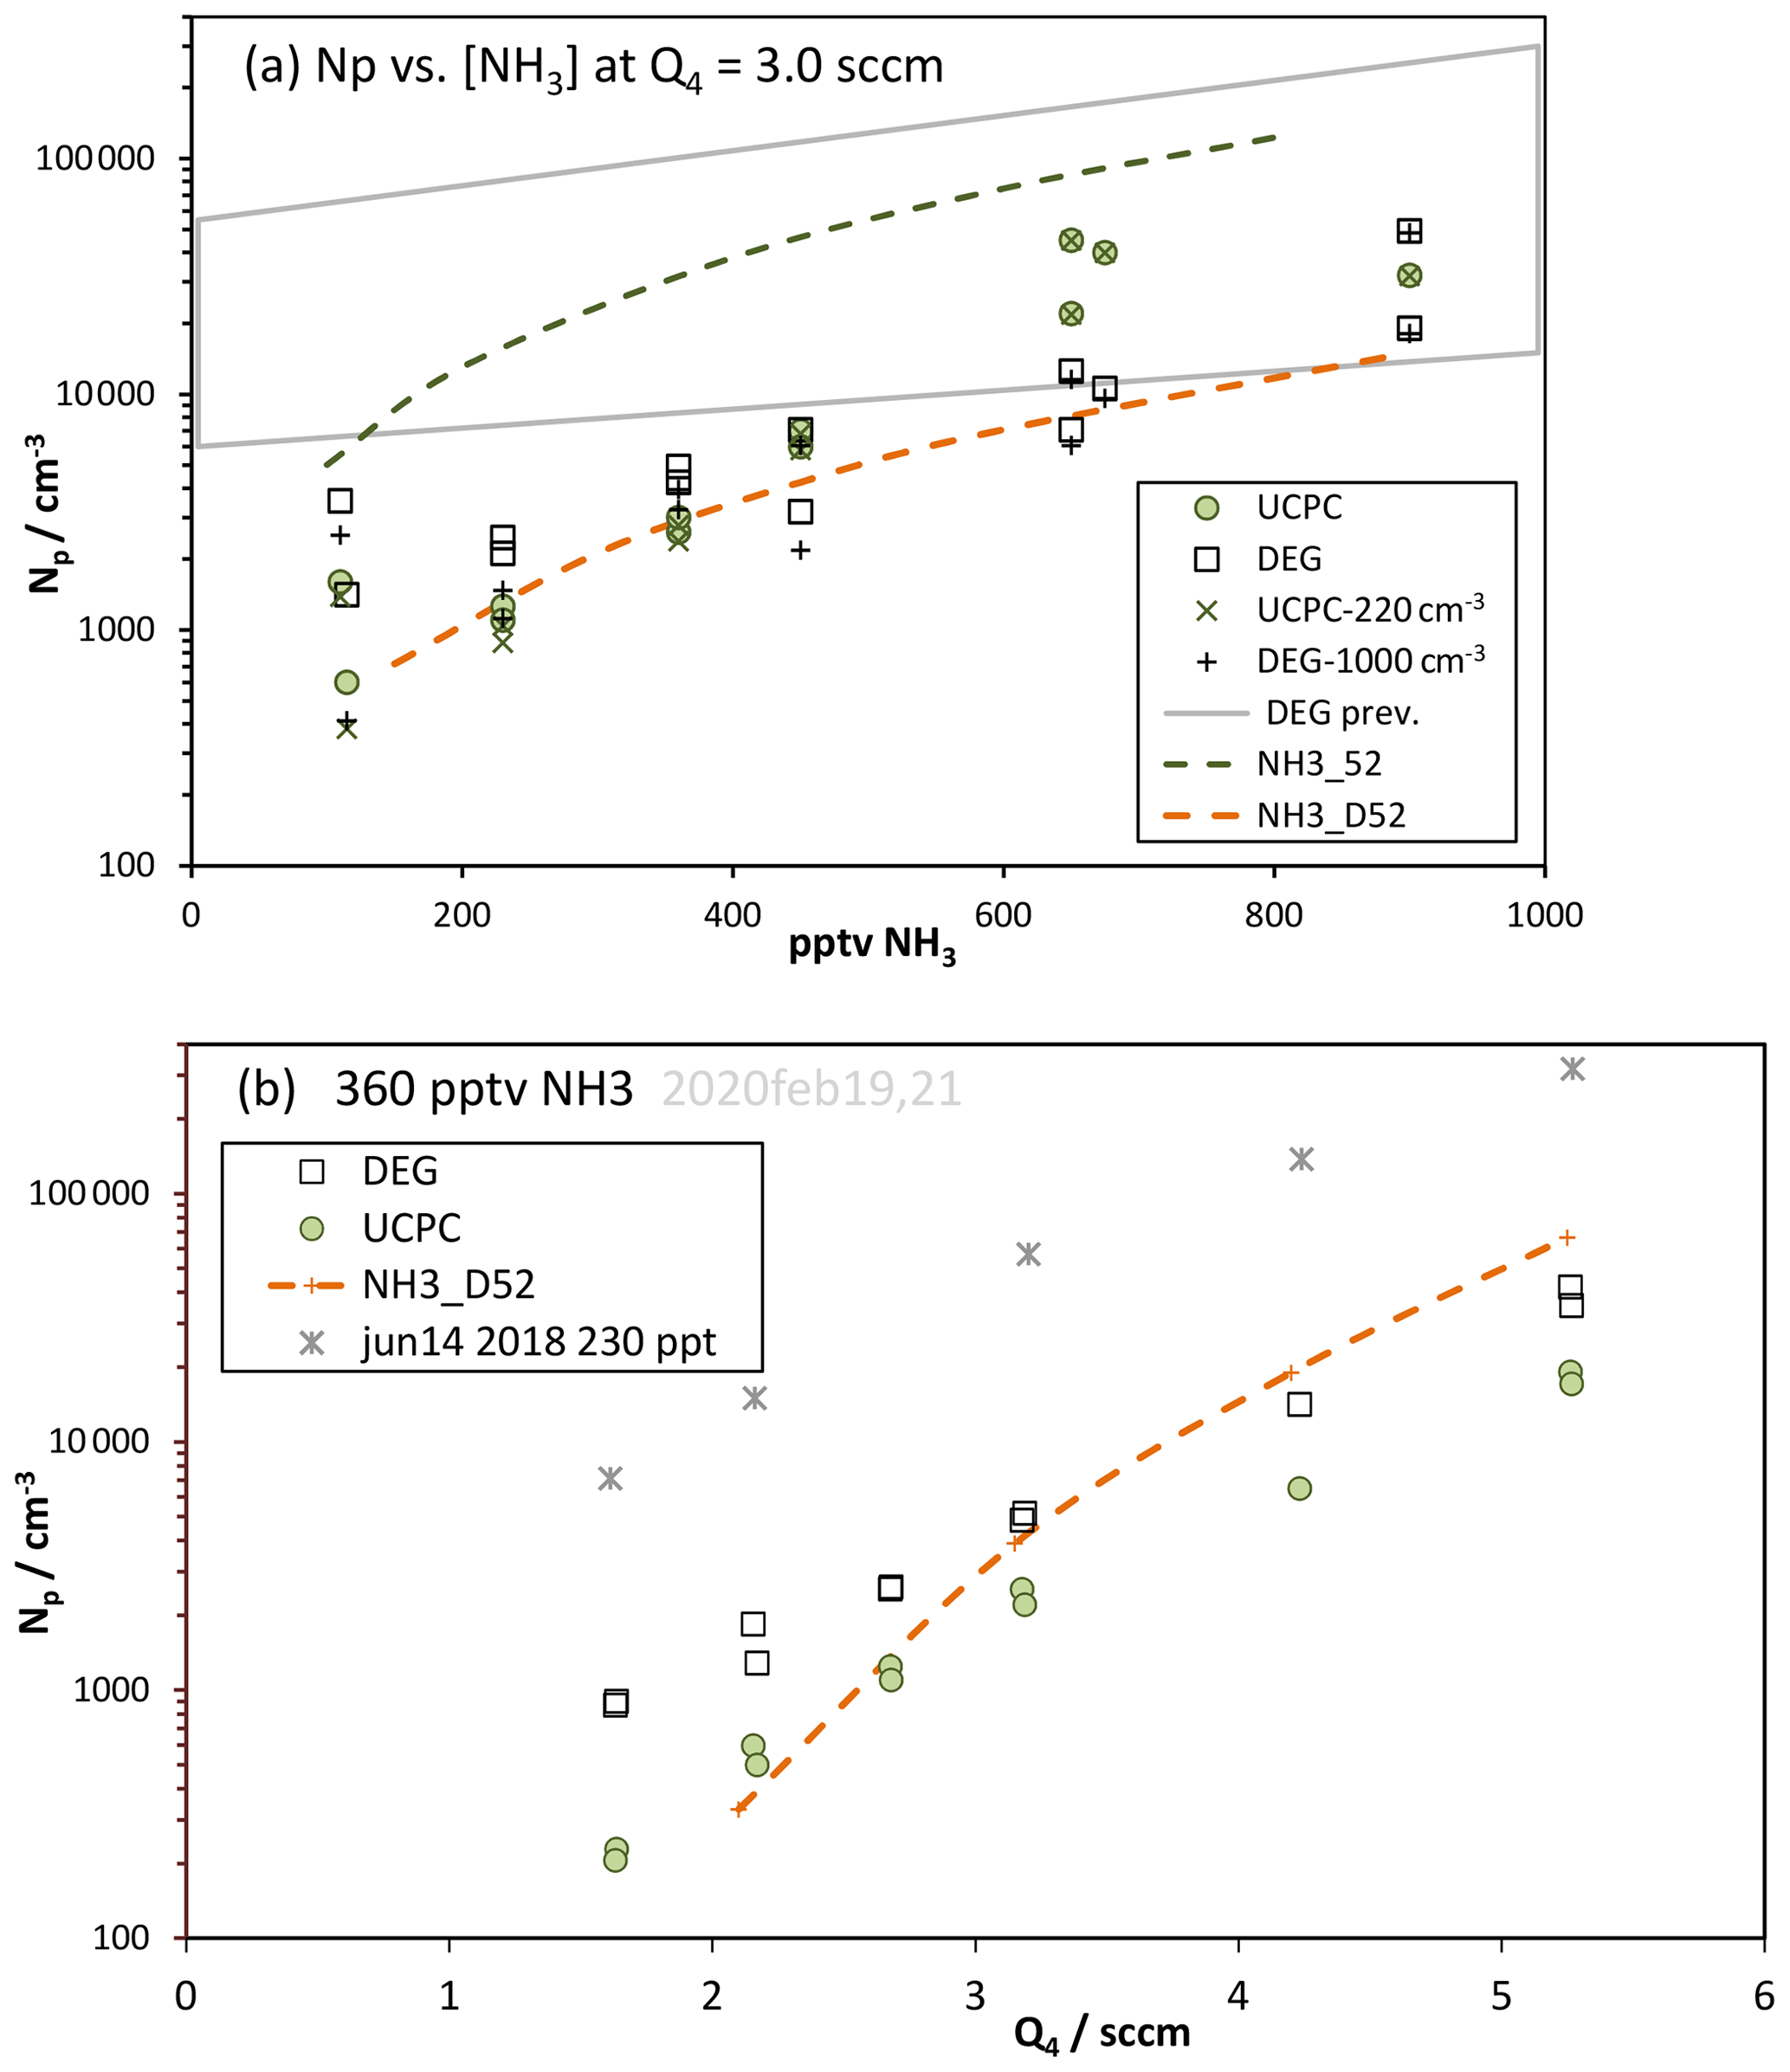
Figure 6Np vs. (a) ammonia level and (b) Q4. (a) Experimental data for the two particle detection systems, minus the zero-added base Np, are plotted as the squares (DEG) and diamonds (M1), and the gross Np is also shown. Model-predicted Np (binary Np is negligible) is shown as the green (NH3_52) and orange (NH3_D52) dashed lines. Clusters up to 10 acid molecules and either three or six ammonia molecules were simulated; runs with six ammonia molecules were within 3 % of runs with three. The Supplement has further details of the model runs. The gray quadrilateral “DEG prev.” encompasses data from Fig. 5 of Hanson et al. (2019). (b) Symbols as in (a) with NH3 present at 360 pptv. Asterisks are previous data (Hanson et al., 2019) from 14 June 2018 at 230 pptv NH3.
3.5 Nominal binary nucleation results, then and now
Assuming that the UCPC Np at Q4=4.2 sccm in Fig. 5a is indicative of the binary system, an estimate for the binary nucleation rate Jbin is 50 cm−3 s−1, converting Np to Jbin by dividing by an estimated nucleation time of 5 s, the transit time over a 30 cm length of the reactor centered at 60 cm. This assumes that the majority of the large particles are formed near the midpoint of the reactor. Particles are also likely to form downstream of this region, but they will be somewhat smaller than the leading-edge particles. Nevertheless, the sulfuric acid concentration for this Jbin we take to be the simulated value at 60 cm and on the centerline, [H2SO4] = 8.8×109 cm−3.
This so-called midpoint nucleation rate is a metric that has limited use but does serve as a crude point of comparison. A nucleation rate of 50 cm−3 s−1 at 8.8×109 cm−3 H2SO4 (52 % RH, 296 K) is lower than some recent binary system (nominal) results: the Zollner et al. (2012) bulk flow reactor result for these conditions (as extrapolated in Hanson et al., 2019) is 300 cm−3 s−1, and the SAWNUC predicted rate is 230 cm−3 s−1 (Ehrhart et al., 2016), extrapolated from Jbin=3 cm−3 s−1 at 5×109 cm−3, 292 K, and 38 % RH. See the Supplement for model-predicted Np from SAWNUC and from two 52 % binary system thermodynamics used here.
The overall changes in the DEG system measurements in our PFR are presented in Fig. 5b, a plot of experimental nucleation rates plotted as a function of sulfuric acid concentration. The previous data from the PFR (Hanson et al., 2019) are the blue squares, the present data (December 2018 to February 2019 excluding measurements just after cylinder changeovers) are plotted as the blue open and filled circles, and data from the CLOUD experiment are plotted as diamonds. A midpoint nucleation rate metric is consistent with our assertion that the reactor has gotten cleaner, as the onset of nucleation has likely moved down the reactor with increased H2SO4. Since the reference point has increased between then and now, the present measurements are plotted with both open (reference point at 30 cm, as in Hanson et al., 2019) and filled (60 cm) blue circles; the arrows in the plot illustrate the overall evolution of particle formation in the PFR. The relationship between [SA] at 60 cm and Q4 was taken from the model results (plot shown in the Supplement). These estimates reflect the changes in the experiment and illustrate that the present experimental nucleation rates are some of the lowest measured in photolytic systems, assuming extrapolations with the [H2SO4]6 relationship hold true. The 2D model results using the NH3_D52 thermodynamics (zero ammonia added yields binary nucleation) are also plotted in Fig. 5b and support such a relationship.
The early bulk studies of Wyslouzil et al. (1991), Viisanen et al. (1997), and Ball et al. (1999) report nucleation rates, extrapolated to the present conditions, that are lower than the present work; consideration of the uncertainties in the sulfuric acid concentrations mitigates these differences as discussed in Zollner et al. (2012). The Zollner et al. (2012) results for 40 % RH fall nearly on top of the X6 dependency line in Fig. 5b. Comparisons with the recent photolytic studies by Yu et al. (2017) and Tiszenkel et al. (2019) are complicated by the assumed presence of amines evidenced by high nucleation rates at very low [H2SO4]. Note that the 292 K CLOUD binary system measurements reported by Ehrhart et al. (2016) are much higher than the SAWNUC predictions; this was believed to be affected by residual ammonia and thus not considered representative of the putative binary system. We discuss the effect of ammonia on the 292 K CLOUD data below.
3.6 Addition of base
Ammonia was added to the system in a port at the top of the PFR just above the illuminated section, as described in Hanson et al. (2019). The results from both counters are shown in Fig. 6a, where Np is plotted versus the NH3 mixing ratio for Q4=3.0 sccm (interpolated data). Upon addition of ammonia to the flow reactor, nucleation increases and Np climbs at a roughly squared power dependence on ammonia. We performed simulations with NH3–H2SO4 thermodynamics for molecular clusters; two different sets of free energies were used, and results are shown as the dashed lines in Fig. 6a. To illustrate an effect of a contaminant or other particle formation process not included in our simulations, also plotted are net Np (× and + symbols), where Np for zero-added NH3 was subtracted from the data.
The model results plotted as the green dashed line use the thermodynamics that fit our 2018 data at 52 % RH (NH3_52, Hanson et al., 2019); this leads to significant over-prediction probably due to slightly over-strong binding energies. This scheme was developed from data that were influenced by an arguably higher level of contaminants in the system at that time (March to June 2018) compared to now. It may have also been affected by not including any HONO decomposition nor initial NO among other differences in the assumed photochemistry that led to calculated H2SO4 on average about 14 % lower than the present calculations yield (see Supplement). The new set of NH3–H2SO4 cluster thermodynamics for 52 % RH was developed to better model the current data. The model results using this new set (NH3_D52) are plotted as the dashed orange line; they secure the lower edge of the range of data and exhibit a similar power dependency, 1.7, on NH3 to that exhibited in the data.
Comparison to our earlier measurements (Hanson et al., 2019), encompassed by the gray quadrilateral (for Q4=2.1 to 4.2 sccm) in Fig. 6a, reveal that the measurements at the highest ammonia levels have some overlap while the low ammonia results are disparate. The previous measurements have a near-unity power dependency on NH3, which is also exhibited in many other experiments (Kirkby et al., 2011; Kürten et al., 2016; Benson et al., 2011). The current measurements have a power dependency on NH3 near 2 (for net Np), which is also exhibited in theoretical predictions (such as Kürten et al., 2016).
Another test of the NH3–H2SO4 cluster free energies is the variation in Np with H2SO4. Shown in Fig. 6b are measured Np values from the particle counters vs. Q4 with 360 pptv NH3 added. Note the large decrease in the current Np from that in June 2018 (230 pptv NH3) (Hanson et al., 2019). The modeled Np traverses the current data but shows a larger dependence on Q4 () than is exhibited in the data (). This could be due to a deficiency of these thermodynamics and/or the presence of a contaminant that more heavily influences the measurements at low Np and Q4.
A synergistic effect between amines and ammonia (Yu et al., 2012; Glasoe et al., 2015) may have affected the measurements if contaminant amine compounds were present. Although it is difficult to ascertain such an effect in our data, it might provide an explanation for the large scatter in the data in Fig. 6a that does not seem to decrease at the highest NH3. This effect would be of a different nature than the contaminant effect discussed in the previous paragraph. This tightly wound story of contaminants is speculative, considering the lack of direct knowledge of the contaminant and the little-understood synergistic effect that is just recently receiving theoretical scrutiny (Temelso et al., 2018; Wang et al., 2018; Myllys et al., 2019). The lower envelope of the Np vs. NH3 data in Fig. 6a is adequately represented by the model, and the data in Fig. 6b indicate that the effects of other processes probably affected the measurements the most at low Np, using the model results as a gauge. The high Np data may very well represent the NH3–H2SO4 system at 52 % RH. This is supported by the Glasoe et al. (2015) finding that the synergistic effect dissipates as the ammonia abundance increases beyond a few hundred parts per trillion by volume NH3.
Clearly, the thermodynamics for the binary system (H2O-H2SO4) are important for interpreting experimental results. They provide a reference for assessing whether a contaminant has significantly affected a measured nucleation rate and also for determining the effect of added base on nucleation rates. Please see the Supplement for more discussion of the binary system experiments and a comparison of free energies.
While the effects of contaminants in our PFR have decreased since our earlier measurements were published, the episodic spikes in Np (Fig. 1) indicate an intermittent appearance of something that boosts a nucleation process other than the binary process. Since we cannot ensure this other process has no effect at high Q4, the NH3_D52 thermodynamics must be considered a phenomenological description; at zero ammonia it represents a limit on the pure binary system at 52 % RH. Nonetheless, ammonia's influence on cluster energetics is similar in these two sets of NH3–H2SO4–52 % RH free energies (NH3_52 and NH3_D52). For example, the step-wise free energies for clusters of up to five acid and three ammonia molecules differ by less than 1 kcal mol In the Supplement is a comparison plot of the step-wise free energy changes for acid addition for both free energies.
We argue that the NH3_D52 free-energy landscape can be considered nearly free of the effect of a contaminant and of ion-mediated processes because these rogue processes operated most significantly at low ammonia and Q4. Then NH3_D52 free energies can be used in box model simulations to, in effect, extrapolate our data to the experimental conditions of other data sets. This was done previously (Hanson et al., 2019, Fig. 10) using the NH3_52 free energies to compare to some NH3–H2SO4 experimental results (Berndt et al., 2010; Dunne et al., 2016). Part of that plot is reproduced in Fig. 7 focusing on the [H2SO4] = 1.5×108 cm−3 data. NH3_D52 free energies result in nucleation rates about an order of magnitude below those calculated with NH3_52. Our conclusions change little from 2019: the Berndt et al. (2010) data (2 to 70 ppm NH3) and the CLOUD data at >200 pptv NH3 stand apart from all the previous work in this system and are most consistent with the present data.
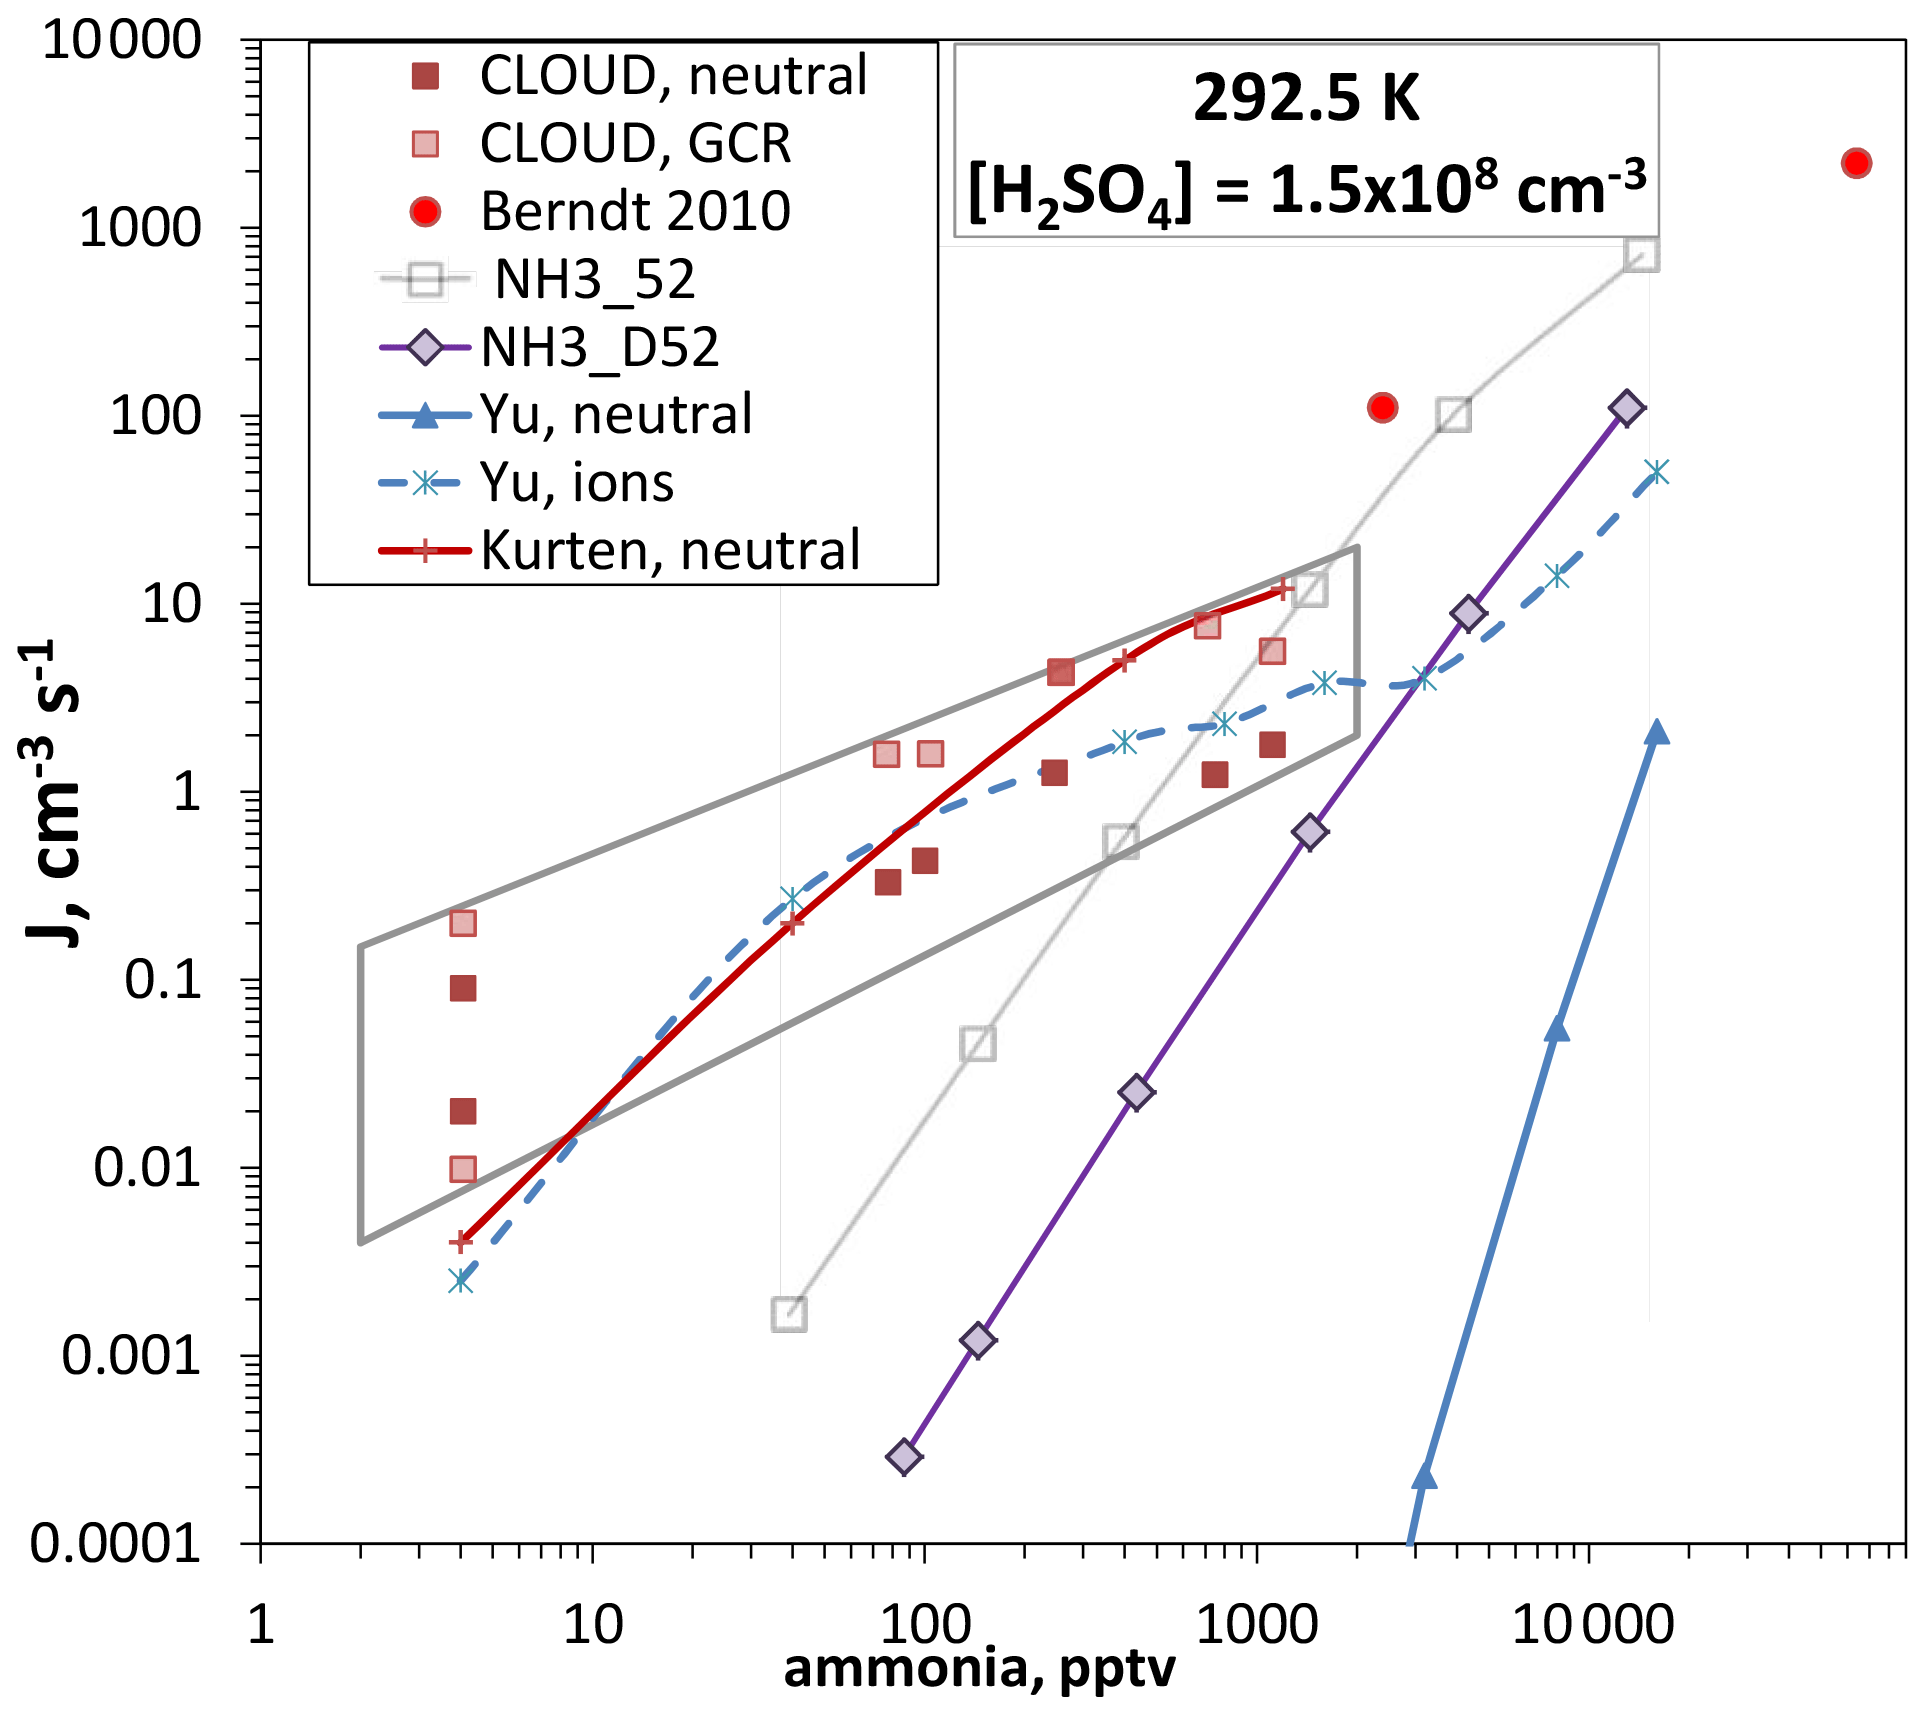
Figure 7Nucleation rate J versus ammonia level for [H2SO4] = 1.5×108 cm−3 and 292.5 K. Berndt et al. (2010) 50 % RH and CLOUD at 38 % RH (Dunne et al., 2016, also included are low ionization rate measurements, “GCR”; the data at 4 pptv NH3 were for H2SO4 up to 3×108 cm−3). Box model calculations (described in Hanson et al., 2019) using two different thermodynamic schemes for 52 % RH are also shown (NH3_D52 this work; NH3_52 presented previously; Hanson et al., 2019). Red solid line from Kürten (2019). Ammonia nucleation from Yu et al. (2020) where neutral is the ternary system (THN) equation and “ions” is the ternary system (TIMN) equation with an ion pair production rate of 2 cm−3 s−1.
The predicted ternary homogeneous nucleation rates of Yu et al. (2020), J(THN) in Fig. 7, are quite different from the current predictions (which are thought to be free of ionization effects), and both of these differ from the neutral ternary system rates predicted by Kürten (2019) (dashed red line). When ionization rates characteristic of ambient levels due to galactic cosmic rays (GCRs) are present, the Yu et al. (2020) ternary ion-mediated nucleation (TIMN) rates approximate the CLOUD data. Since Kürten (2019) derived neutral cluster free energies to explain the neutral rates measured in CLOUD, they are unsurprisingly close to the TIMN predictions of Yu et al. (2020). Yet the purported chemistries of these two schemes are quite different.
One point to add to the comparisons depicted in Fig. 7 is that the putative binary data from CLOUD, thought to be due to a 4 pptv NH3 impurity, depart significantly (many orders of magnitude) from simulated data using NH3_D52 for 4 pptv NH3. The decreasing discrepancy with NH3_D52 as ammonia increases (gray quadrilateral encompassing the CLOUD data) is reminiscent of the relationship in Fig. 6a of our earlier data to the present data. This may indicate a similar situation in the two experimental apparatus where a low-level contaminant (that is now after years of use apparently much lower in the PFR) that is relatively potent leads to particle formation rates well above what is expected. A synergistic effect may also be in play here with a strong nucleator such as dimethylamine: our box model calculation using DMA_I thermodynamics (Hanson et al., 2017, 2019) and dimethylamine at 10−3 pptv yields a nucleation rate of 10−3 cm−3 s−1 for the conditions in Fig. 7. A plausible scenario is that the synergistic effect of 4 pptv NH3 boosts this to 10−2 cm−3 s−1 and that the synergistic effect increases with NH3 level (or the exceedingly low level of dimethylamine increases slightly as NH3 is increased). By sheer abundance, NH3 could come to dominate the amino-containing moieties in the CLOUD mass spectra (e.g., Schobesberger et al., 2015; Almeida et al., 2013).
3.7 Variation in water content
Relative humidity was varied by adjusting the ratio of humidified to dry N2 flows (Q3 flow through the humidifier and Q2 dry N2 flow), maintaining a constant total flow rate of 2.9 slpm. Representative data for a constant HONO level (given by Q4=5.25 sccm) vs. Q3 are plotted in Fig. 8 along with the fit to our previous data at Q4=4.2 sccm (Hanson et al., 2019). Despite a large decrease in Np at a given RH between then and now, the variation in Np vs. humidity has a similar dependence on RH as we observed previously (Hanson et al., 2019): a power dependence of 4.75 is shown in the figure. For two sets of data, the DEG system Np (leading edge) is also shown with good agreement at high Np, while a bias looks to be present in the DEG results at low RH and Np.
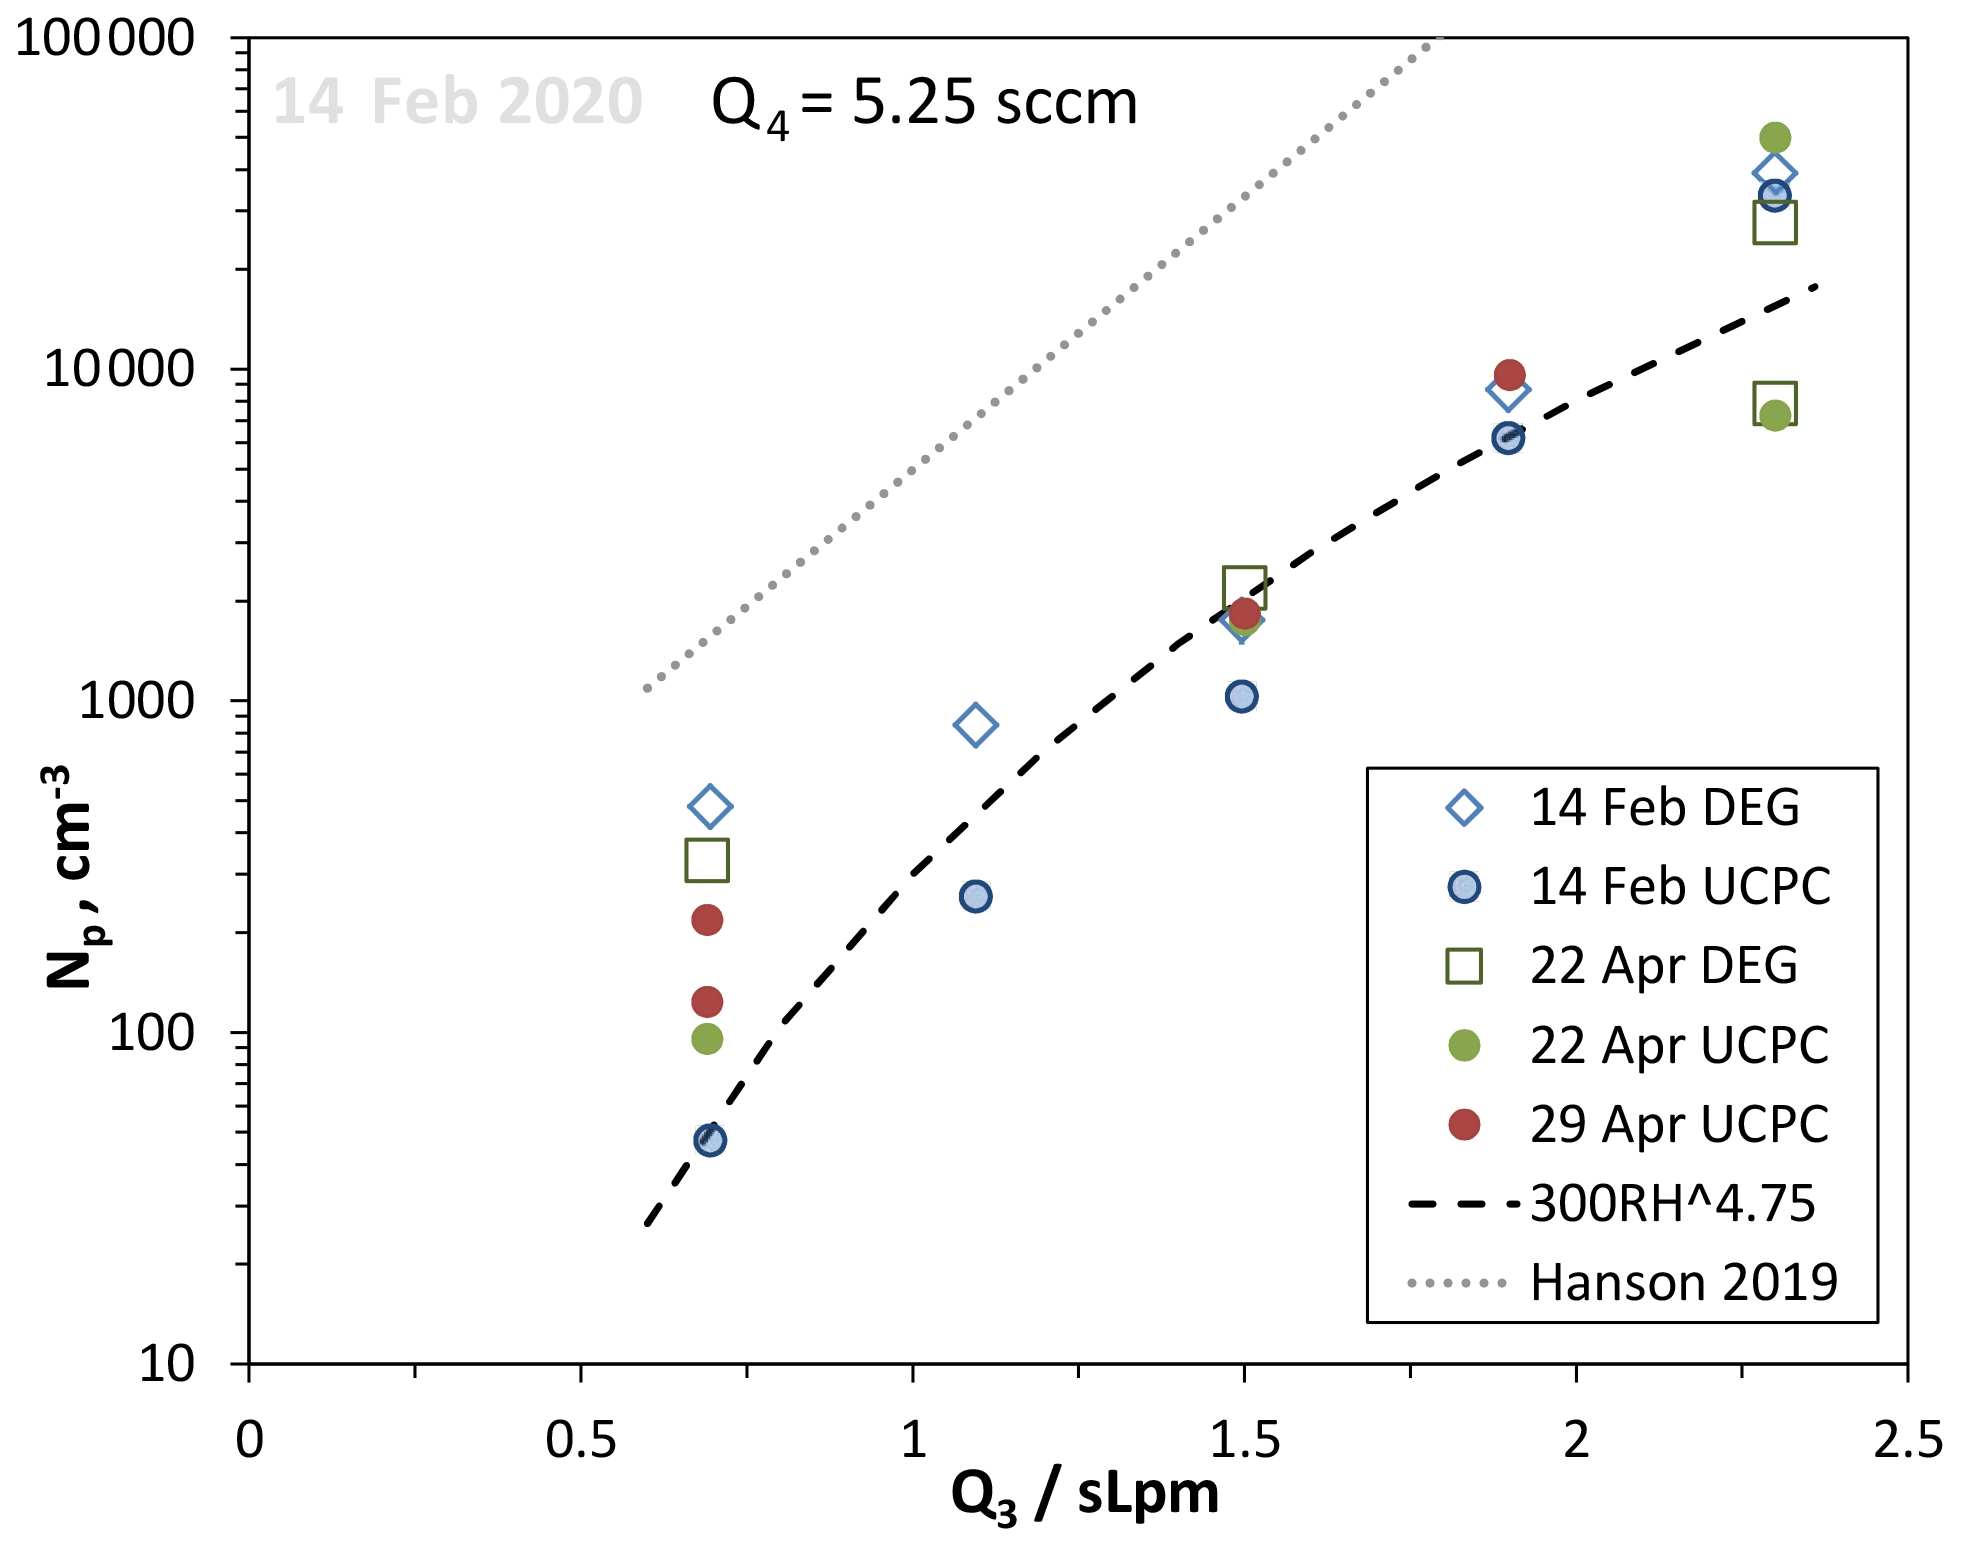
Figure 8Variation in Np with relative humidity, set by the flow through the humidifier, Q3 (dates in 2020). RH ranges from 24 % to 81 % for the range of Q3 in the figure. HONO level was kept constant, Q4=5.25 sccm. A power dependency on RH of 4.75 is shown as the dashed line. The thin dotted line is the exponential fit to the RH dependency found in Hanson et al. (2019) at Q4=4.2 sccm.
There is a considerable level of variability in the UCPC data that may reflect changes in a contaminant in our PFR. Yet there is a sensitivity to the temperature of the room (monitored on the surface of the glass cone at the top of the reactor, Tcone): on the 22 April, the Q3=2.3 slpm UCPC data had Tcone=23.6 ∘C for the 5×104 cm−3 data point and 25 ∘C for the 6×103 cm−3 data. The Supplement has a temperature sensitivity example where time series of Np and Tcone are shown. Another set of RH dependency data for Q4=4.2 sccm is also shown in the Supplement.
Over a comparable range of RH, Zollner et al. (2012) reported a dependence of Np on RH to the 5–9 power, with the higher value for RH > 50 %. There are significant differences between these two experiments that might affect RH dependencies. For example, Zollner et al. (2012) had a bulk source for H2SO4 and a heated mixing region so that the 6 slpm total flow and the H2SO4 it was carrying underwent cooling as particles nucleated. Thus the Zollner et al. (2012) H2SO4 underwent a wide range of hydration due to the 17 K cooling. This change in hydration affects its rate of diffusion and thus loss to the wall; cooling is generally 2 K or less in the present work, and there is a steadier hydration level for H2SO4. Nevertheless, the scatter in the data shown in Fig. 8 precludes putting much significance on the RH4.75 dependence and its comparison to the Zollner et al. (2012) RH dependency.
The main conclusion is that Np is much lower at all RH values compared to our previous work (Hanson et al., 2019). An ion-mediated process may play a small role that affects measurements at low RH and thus Np, but since most of the Np values are much greater than the ∼10 cm−3 expected for this process, the results are dominated by changes in water vapor. But a contaminant may have affected the present data as was postulated for the previous data (Hanson et al., 2019) where a level of 0.6 pptv methylamine was consistent with the Np vs. Q4 data. If methylamine is also present here, we estimate that its level has dropped to 0.1 pptv (using the squared power dependence on methylamine found for nucleation rate; Glasoe et al., 2015). Since the identity and the source of the contaminant are largely unknown, we can only speculate here, but we point out that a level of dimethylamine of 10−4 pptv is shown in the Supplement to be consistent with the variation in Np with SO2. In terms of RH dependencies, primary alkylamines such as methylamine may be influenced by water content while dimethylamine is not (at least at the 2 pptv level; Hanson et al., 2019).
We varied RH with added ammonia (120 pptv) to see how water influences nucleation in the NH3–H2O–H2SO4 system. These data, Np vs. Q3, are plotted in Fig. 9 (orange symbols) along with the 14 February data without ammonia added from Fig. 8. There is a significant dependence of Np on RH for the added-ammonia case. The enhancing effect of NH3 (ratio of Np with added NH3 to the nominal binary case) appears to be less at high RH: a factor of ∼4 at Q3=2 and 2.35 slpm while it is a factor of 10 at Q3=0.65 and 1.1 slpm. This may reflect the overwhelming abundance of H2O vs. NH3: clusters take what there is more of by opportunity (entropy) rather than by binding energy (enthalpy). H2SO4 cluster affinity for NH3 is greater than it is for H2O, but the stepwise free-energy difference is less than a few kcal mol−1 for clusters containing more than five H2SO4 molecules.

Figure 9Variation in Np with Q3, a proxy for RH, with and without 120 pptv NH3 added. Q4=5.25 sccm and Np from both particle counters are shown. RH varies from 23 % to 81 % over the range of Q3 investigated. The Dunne et al. (2016) ad hoc RH dependency is shown, normalized to our measurements at Q3=1.05 slpm.
Previous work showed similar behavior. Ball et al. (1999) showed a larger enhancement due to added ammonia for measurements at 5 % RH than at 15 % RH. Benson et al. (2011) also reported ammonia enhancement factors that increased with decreasing RH but were also dependent on other experimental conditions; nonetheless, for 20 ppbv NH3 and an H2SO4 concentration of 1.2×109 cm−3, the enhancement factor increased from 20 to 400 when the RH decreased from 8 % to 4 %. Although CLOUD experiments (Kürten et al., 2016; Kirkby et al., 2011; Almeida et al., 2013) did not systematically investigate an RH dependence for the ternary system, Dunne et al. (2016) explored the effect of RH on ammonia–sulfuric acid nucleation in a global climate model and saw an effect of up to 34 % in the number density of 3 nm particles at cloud height. The Dunne et al. (2016) ad hoc RH dependency is shown in Fig. 9 normalized to our measured Np at Q3=1.05 slpm (the green dashed line also brushes our model calculated Np, NH3_D52, at Q3=1.50 slpm). It describes the observed increase in particle numbers with RH fairly well but has difficulties below about 25 % RH.
3.8 Van der Waals interactions
To demonstrate the potential influence of enhanced collision rates of hydrated H2SO4 molecules with clusters, the model was run with collision rates doubled and the photolysis rates halved. These two changes would result in equivalent growth conditions for the external particles as discussed in Sect. 3.2 as H2SO4 concentrations decrease by a factor of 2, but their uptake rate onto particles is doubled. A doubling of the collision rates is consistent with the findings of Stolzenburg et al. (2020), but we note an alternate analysis that resulted in a smaller effect being put forth in the referee comments. The effects on calculated H2SO4, the six-acid cluster, and the number of particles for binary nucleation at Q4=4.2 sccm is displayed in Table 1.
Table 1Effect of doubling forward rate coefficients due to enhanced van der Waals interactions on clusters in binary homogeneous nucleation. The two thermodynamic schemes for binary conditions are plotted in the Supplement.

The first row presents results using the hard sphere collision rates and thermodynamics NH3_D52 as presented in Fig. 5a where the simulated Np is 96 cm−3. Using the same thermodynamics but halving the HONO photolysis rate while doubling all collision rates, the simulated Np drops by 95 % (second row). Therefore, at these lower sulfuric acid levels, the thermodynamics must be strengthened to increase nucleation rates. Coincidentally, using our previous thermodynamics, NH3_52 (Hanson et al., 2019) predicted Np increases to 125 cm−3. The point here is that the main effect of enhanced collision rates is that the cluster thermodynamics must be strengthened by a few kcal mol−1 (see the Supplement) to get simulation–experiment agreement. The other effect is that the midpoint nucleation rate metric must be altered: the effective H2SO4 concentration would decrease by about 50 %.
The overarching goal is to improve the accuracy of nucleation rates calculated for atmospheric conditions, which we believe we are doing – improving the measurements, identifying specific effects of contaminants, refining the thermodynamics of clusters – and then testing the results of our approach against previous work through detailed comparisons.
We have a better understanding of the chemistry within our PFR. We detected small amounts of NO produced in the source via the HONO self-reaction, which significantly affects the photochemistry. We postulated that hard-to-detect amounts (e.g., sub-10−15 mol fraction dimethylamine) of amines affected the measurements, but their influence has decreased over time. The deployment of two different types of particle detectors yielded information on nucleation processes other than the binary H2SO4–H2O and ternary NH3–H2SO4–H2O systems. With the long-term measurements from our PFR indicating the decrease in something like a contaminant, the potential role of ion-mediated nucleation processes (Yu et al., 2020; Lovejoy et al., 2004) was uncovered. We were able to show that ion-mediated nucleation can play a significant role in low nucleation rates in the binary system, whether ambient ionization in the flow reactor or potentially within the charger of the nano-MPS (DEG system).
The nucleation rates in the ammonia–sulfuric acid–water system measured in the PFR have also decreased since our 2018 results (Hanson et al., 2019), consistent with the postulated decrease in an amine-type of contaminant. The free-energy scheme for NH3–H2SO4 clusters developed here has ammonia's influence on the putative binary system about the same as in our previous work (Hanson et al., 2019) for clusters up to five H2SO4 molecules. Thus the cluster free energies with six or more sulfuric acid molecules were the most consequential. These changes in the largest clusters were sufficient to lead to agreement of simulations with experiment.
The effect of water on nucleation rates was explored and progress was made in decreasing the upper-limit nucleation rates for the binary system. The free energies for the NH3-free clusters in the NH3–D52 scheme presented here are within a few kcal mol−1 of the modified liquid drop model (SAWNUC) of Lovejoy et al. (2004). The effect of water when ammonia was present is substantial and indicates that there may be a synergistic effect involving water on the cluster's free energies (and possibly a methylamine contaminant at the 0.1 pptv level). Interestingly, the Dunne et al. (2016) ad hoc equation reasonably explains our measured relative humidity effect at 120 pptv NH3 and cm−3 H2SO4. Theoretical work on the effect of water in this ternary system is sparse, but initial reports on the effect of water on the small clusters (about three H2SO4 molecules) suggest small effects, even a decrease in nucleation as RH increases (see Fig. 9b of Henschel et al., 2016). As we have argued here, it is likely that the effect of water in this ternary system is greatest in larger clusters, those with six or more H2SO4 molecules.
The model's HONO photolysis rate was tuned to give H2SO4 concentrations that explained the results of the nanoparticle growth studies. Collision rates of SA molecules (whether hydrated or not) with clusters were assumed to be free of van der Waals interactions, and the mass accommodation coefficient α was assumed to be unity (Hanson, 2005). If van der Waals interactions are important and α is unity, then there is a lower level of SA in the flow reactor than the model was tuned to and the thermodynamics are not valid; binding energies are too small. On the other hand, if van der Waals interactions are not important and α is less than unity, then our thermodynamics have binding energies that are too strong. Future work on the growth of larger nanoparticles may shed light on this issue. Also, measurements of H2SO4 uptake efficiency onto particles smaller than the 140 nm diameter particles that Hanson (2005) studied will provide additional information on the efficacy of van der Waals interactions on collision rates.
The next steps for our PFR include measuring the particle growth of externally generated nanoparticles as a function of the initial nanoparticle size and composition. These measurements will help tease out information on whether van der Waals interactions are important for uptake of H2SO4. Coupled with new measurements of the H2SO4 uptake coefficient on sulfuric acid particles at sizes smaller than the 140 nm diameter particles used in Hanson (2005), these interactions can be further delineated. We also plan to investigate the effect on nucleation rates of adding methylamine to the PFR.
Spreadsheets for the data in the figures are available by request. The programs for the simulation of the flow reactor and the box model are written in Delphi and can be made available upon request.
The supplement related to this article is available online at: https://doi.org/10.5194/acp-21-1987-2021-supplement.
SM and DRH designed the experiments, carried them out, and analyzed the data. JK and DRH developed the model code and performed the simulations. DRH, JK, and MW evaluated the photochemistry and interpreted the nucleation results. DRH prepared the manuscript with contributions from JK and MW.
The authors declare that they have no conflict of interest.
This research has been supported by the National Science Foundation, Directorate for Geosciences (grant no. AGS-1761638).
This paper was edited by Joachim Curtius and reviewed by two anonymous referees.
Almeida, J., Schobesberger, S., Kürten, A., Ortega, I. K., Kupiainen-Määttä, O., Praplan, A. P., Adamov, A., Amorim, A., Bianchi, F., Breitenlechner, M., David, A., Dommen, J., Donahue, N. M., Downard, A., Dunne, E. M., Duplissy, J., Ehrhart, S., Flagan, R. C., Franchin, A., Guida, R., Hakala, J., Hansel, A., Heinritzi, M., Henschel, H., Jokinen, T., Junninen, H., Kajos, M., Kangasluoma, J., Keskinen, H., Kupc, A., Kurtén, T., Kvashin, A. N., Laaksonen, A., Lehtipalo, K., Leiminger, M., Leppä, J., Loukonen, V., Makhmutov, V., Mathot, S., McGrath, M. J., Nieminen, T., Olenius, T., Onnela, A., Petäjä, T., Riccobono, F., Riipinen, I., Rissanen, M., Rondo, L., Ruuskanen, T., Santos, F. D., Sarnela, N., Schallhart, S., Schnitzhofer, R., Seinfeld, J. H., Simon, M., Sipilä, M., Stozhkov, Y., Stratmann, F., Tomé, A., Tröstl, J., Tsagkogeorgas, G., Vaattovaara, P., Viisanen, Y., Virtanen, A., Vrtala, A., Wagner, P. E., Weingartner, E., Wex, H., Williamson, C., Wimmer, D., Ye, P., Yli-Juuti, T., Carslaw, K. S., Kulmala, M., Curtius, J., Baltensperger, U., Worsnop, D. R., Vehkamäki, H., and Kirkby, J.: Molecular understanding of sulphuric acid-amine particle nucleation in the atmosphere, Nature, 502, 359–363, https://doi.org/10.1038/nature12663, 2013.
Ball, S. M., Hanson, D. R., Eisele, F. L., and McMurry, P. H.: Laboratory Studies of Particle Nucleation – Initial Results for H2SO4, H2O, and NH3 Vapors, J. Geophys. Res., 104, 23709–23718, 1999.
Benson, D. R., Yu, J. H., Markovich, A., and Lee, S.-H.: Ternary homogeneous nucleation of H2SO4, NH3, and H2O under conditions relevant to the lower troposphere, Atmos. Chem. Phys., 11, 4755–4766, https://doi.org/10.5194/acp-11-4755-2011, 2011.
Berndt, T., Stratmann, F., Sipilä, M., Vanhanen, J., Petäjä, T., Mikkilä, J., Grüner, A., Spindler, G., Lee Mauldin III, R., Curtius, J., Kulmala, M., and Heintzenberg, J.: Laboratory study on new particle formation from the reaction OH + SO2: influence of experimental conditions, H2O vapour, NH3 and the amine tert-butylamine on the overall process, Atmos. Chem. Phys., 10, 7101–7116, https://doi.org/10.5194/acp-10-7101-2010, 2010.
Coffman, D. J. and Hegg, D. A.: A Preliminary Study of the Effect of Ammonia on Particle Nucleation in the Marine Boundary Layer, J. Geophys. Res.-Atmos., 100, 7147–7160, https://doi.org/10.1029/94JD03253, 1995.
Dunne, E. M., Gordon, H., Kürten, A., Almeida, J., Duplissy, J., Williamson, C., Ortega, I. K., Pringle, K. J., Adamov, A., Baltensperger, U., Barmet, P., Benduhn, F., Bianchi, F., Breitenlechner, M., Clarke, A., Curtius, J., Dommen, J., Donahue, N. M., Ehrhart, S., Flagan, R. C., Franchin, A., Guida, R., Hakala, J., Hansel, A., Heinritzi, M., Jokinen, T., Kangasluoma, J., Kirkby, J., Kulmala, M., Kupc, A., Lawler, M. J., Lehtipalo, K., Makhmutov, V., Mann, G., Mathot, S., Merikanto, J., Miettinen, P., Nenes, A., Onnela, A., Rap, A., Reddington, C. L. S., Riccobono, F., Richards, N. A. D., Rissanen, M. P., Rondo, L., Sarnela, N., Schobesberger, S., Sengupta, K., Simon, M., Sipilä, M., Smith, J. N., Stozkhov, Y., Tomé, A., Tröstl, J., Wagner, P. E., Wimmer, D., Winkler, P. M., Worsnop, D. R., and Carslaw, K. S.: Global atmospheric particle formation from CERN CLOUD measurements, Science, 354, 1119–1123, 2016.
Ehrhart, S., Ickes, L., Almeida, J., Amorim, A., Barmet, P., Bianchi, F., Dommen, J., Dunne, E. M., Duplissy, J., Franchin, A., Kangasluoma, J., Kirkby, J., Kürten, A., Kupc, A., Lehtipalo, K., Nieminen, T., Riccobono, F., Rondo, L., Schobesberger, S., Steiner, G., Tomé, A., Wimmer, D., Baltensperger, U., Wagner, P. E., and Curtius, J.: Comparison of the SAWNUC model with CLOUD measurements of sulphuric acid water nucleation, J. Geophys. Res.-Atmos., 121, 12401–12414, https://doi.org/10.1002/2015JD023723, 2016.
Febo, A., Perrino, C., Sparapani, R., and Gherardi, M.: Evaluation of a High-Purity and High-Stability Continuous Generation System for Nitrous Acid, Environ. Sci. Technol., 29, 2390–2395, 1995.
Froyd, K. D. and Lovejoy, E. R.: Experimental thermodynamics of cluster ions composed of H2SO4 and H2O: 2. Negative ions, J. Phys. Chem. A, 107, 9812–9824, 2003.
Fuchs, N. A. and Sutugin, A. G.: Highly Dispersed Aerosols, Ann Arbor Sci. Publ., Ann Arbor, Mich., 1970.
Glasoe, W. A., Volz, K., Panta, B., Freshour, N., Bachman, R., Hanson, D. R., McMurry, P. H., and Jen, C. N.: Sulfuric Acid Nucleation: An Experimental Study of the Effect of Seven Bases, J. Geophys. Res. D., 120, 1933–1950, https://doi.org/10.1002/2014JD022730, 2015.
Gormley, P. G. and Kennedy, M.: Diffusion from a Stream Flowing through a Cylindrical Tube, P. Roy. Irish Acad. A, 52, 163–169, 1948.
Hanson, D.: Mass accommodation of H2SO4 and CH3SO3H on water-sulfuric acid solutions from 6 to 97 % RH, J. Phys. Chem. A., 109, 6919–6927, https://doi.org/10.1021/jp0510443, 2005.
Hanson, D. R., Eisele, F. L., Ball, S. M., and McMurry, P. M.: Sizing small sulfuric acid particles with an ultrafine particle condensation nucleus counter, Aerosol Sci. Tech., 36, 554–559, 2002.
Hanson, D. R., Bier, I., Panta, B., Jen, C. N., and McMurry, P. H.: Computational Fluid Dynamics Studies of a Flow Reactor: Free Energies of Clusters of Sulfuric Acid with NH3 and Dimethylamine, J. Phys. Chem. A, 121, 3976–3990, https://doi.org/10.1021/acs.jpca.7b00252, 2017.
Hanson, D. R., Abdullahi, H., Menheer, S., Vences, J., Alves, M. R., and Kunz, J.: H2SO4 and particle production in a photolytic flow reactor: chemical modeling, cluster thermodynamics and contamination issues, Atmos. Chem. Phys., 19, 8999–9015, https://doi.org/10.5194/acp-19-8999-2019, 2019.
Hanson, D. R., Sawyer, A., Vences, J., Menheer, S., Kunz, J., and Wentzel, M.: Particle formation from alphapinene and myrcene in a photolytic flow reactor, in preparation, 2021.
Henschel, H., Kurten, T., and Vehkamaki, H.: Computational Study on the Effect of Hydration on New Particle Formation in the Sulfuric Acid/Ammonia and Sulfuric Acid/Dimethylamine Systems, J. Phys. Chem. A, 120, 1886–1896, https://doi.org/10.1021/acs.jpca.5b11366, 2016.
IPCC: Intergovernmental Panel on Climate Change (2013), Climate Change 2013: IPCC 5th Assessment Report (AR5), Edited, Cambridge University Press, Cambridge, United Kingdom and New York, NY, USA, 1535 pp., https://doi.org/10.1017/CBO9781107415324, 2013.
Jen, C. N., Bachman, R., Zhao, J., McMurry, P. H., and Hanson, D. R.: Diamine-sulfuric acid reactions are a potent source of new particle formation, Geophys. Res. Lett., 43, 867–873, https://doi.org/10.1002/2015GL066958, 2016.
Jiang, J., Chen, M., Kuang, C., Attoui, M., and McMurry, P. H.: Electrical Mobility Spectrometer using a Diethylene Glycol Condensation Particle Counter for Measurement of Aerosol Size Distributions Down to 1 Nm, Aerosol Sci. Tech., 45, 510–521, https://doi.org/10.1080/02786826.2010.547538, 2011.
Kirkby, J., Curtius, J., Almeida, J., Dunne, E., Duplissy, J., Ehrhart, S., Franchin, A., Gagné, S., Ickes, L., Kürten, A., Kupc, A., Metzger, A., Riccobono, F., Rondo, L., Schobesberger, S., Tsagkogeorgas, G., Wimmer, D., Amorim, A., Bianchi, F., Breitenlechner, M., David, A., Dommen, J., Downard, A., Ehn, M., Flagan, R.C., Haider, S., Hansel, A., Hauser, D., Jud, W., Junninen, H., Kreissl, F., Kvashin, A., Laaksonen, A., Lehtipalo, K., Lima, J., Lovejoy, E. R., Makhmutov, V., Mathot, S., Mikkilä, J., Minginette, P., Mogo, S., Nieminen, T., Onnela, A., Pereira, P., Petäjä, T., Schnitzhofer, R., Seinfeld, J. H., Sipilä, M., Stozhkov, Y., Stratmann, F., Tomé, A., Vanhanen, J., Viisanen, Y., Vrtala, A., Wagner, P. E., Walther, H., Weingartner, E., Wex, H., Winkler, P. M., Carslaw, K. S., Worsnop, D. R., Baltensperger, U., and Kulmala, M.: Role of sulphuric acid, ammonia and galactic cosmic rays in atmospheric aerosol nucleation, Nature, 476, 429–435, https://doi.org/10.1038/nature10343, 2011.
Kuang, C., Chen, M., McMurry, P. H., and Wang, J.: Modification of laminar flow ultrafine condensation particle counters for the enhanced detection of 1 nm condensation nuclei, Aerosol Sci. Tech., 46, 309–315, https://doi.org/10.1080/02786826.2011.626815, 2012.
Kulmala, M., Vehkamaki, H., Petaja, T., Dal Maso, M., Lauri, A., Kerminen, V.-M., Birmili, W., and McMurry, P. H.: Formation and Growth Rates of Ultrafine Atmospheric Particles: A Review of Observations, J. Aerosol Sci., 35, 143–176, https://doi.org/10.1016/j.jaerosci.2003.10.003, 2004.
Kürten, A.: New particle formation from sulfuric acid and ammonia: nucleation and growth model based on thermodynamics derived from CLOUD measurements for a wide range of conditions, Atmos. Chem. Phys., 19, 5033–5050, https://doi.org/10.5194/acp-19-5033-2019, 2019.
Kürten, A., Bianchi, F., Almeida, J., Kupiainen-Määttä, O., Dunne, E. M., Duplissy, J., Williamson, C., Barmet, P., Breitenlechner, M., Dommen, J., Donahue, N. M., Flagan, R. C., Franchin, A., Gordon, H., Hakala, J., Hansel, A., Heinritzi, M., Ickes, L., Jokinen, T., Kangasluoma, J., Kim, J., Kirkby, J., Kupc, A., Lehtipalo, K., Leiminger, M., Makhmutov, V., Onnela, A., Ortega, I. K., Petäjä, T., Praplan, A. P., Riccobono, F., Rissanen, M. P., Rondo, L., Schnitzhofer, R., Schobesberger, S., Smith, J. N., Steiner, G., Stozhkov, Y., Tomé, A., Tröstl, J., Tsagkogeorgas, G., Wagner, P. E., Wimmer, D., Ye, P., Baltensperger, U., Carslaw, K., Kulmala, M., and Curtius, J.: Experimental particle formation rates spanning tropospheric sulfuric acid and ammonia abundances, ion production rates and temperatures, J. Geophys. Res.-Atmos., 121, 12377–12400, https://doi.org/10.1002/2015JD023908, 2016.
Lehtinen, K. E. J. and Kulmala, M.: A model for particle formation and growth in the atmosphere with molecular resolution in size, Atmos. Chem. Phys., 3, 251–257, https://doi.org/10.5194/acp-3-251-2003, 2003.
Lovejoy, E. R., Curtius, J., and Froyd, K. D.: Atmospheric ion induced nucleation of sulfuric acid and water, J. Geophys. Res., 109, D08204, https://doi.org/10.1029/2003JD004460, 2004.
McMurry, P. H.: Photochemical Aerosol Formation from SO2: A Theoretical Analysis of Smog Chamber Data, J. Colloid Interf. Sci., 78, 513–527, 1980.
McMurry, P. H., Fink, M., Sakurai, H., Stolzenburg, M. R., Mauldin III, R. L., Smith, J., Eisele, F., Moore K., Sjostedt, S., Tanner, D., Huey, L. G., Nowak, J. B., Edgerton, E., and Voisin, D.: A Criterion for New Particle Formation in the Sulfur-Rich Atlanta Atmosphere, J. Geophys. Res., 110, D22S02/10, https://doi.org/10.1029/2005JD005901, 2005.
Merikanto, J., Duplissy, J., Määttänen, A., Henschel, H., Donahue, N. M., and Brus, D.: Effect of ions on sulfuric acid-water binary particle formation: 1. Theory for kinetic and nucleation-type particle formation and atmospheric implications, J. Geophys. Res., 121, 1736–1751, https://doi.org/10.1002/2015JD023539, 2016.
Myllys, N. S., Chee, T., Olenius, M., and Lawler, J.: Molecular-Level Understanding of Synergistic Effects in Sulfuric Acid–Amine–Ammonia Mixed Clusters, J. Phys. Chem. A, 123, 2420–2425, https://doi.org/10.1021/acs.jpca.9b00909, 2019.
O'Dowd, C. D., Aalto, P. P., Yoon, Y. J., and Hamerib, K.: The use of the pulse height analyser ultrafine condensation particle counter (PHA-UCPC) technique applied to sizing of nucleation mode particles of differing chemical composition, J. Aerosol Sci., 35, 205–216, 2004.
Schobesberger, S., Franchin, A., Bianchi, F., Rondo, L., Duplissy, J., Kürten, A., Ortega, I. K., Metzger, A., Schnitzhofer, R., Almeida, J., Amorim, A., Dommen, J., Dunne, E. M., Ehn, M., Gagné, S., Ickes, L., Junninen, H., Hansel, A., Kerminen, V.-M., Kirkby, J., Kupc, A., Laaksonen, A., Lehtipalo, K., Mathot, S., Onnela, A., Petäjä, T., Riccobono, F., Santos, F. D., Sipilä, M., Tomé, A., Tsagkogeorgas, G., Viisanen, Y., Wagner, P. E., Wimmer, D., Curtius, J., Donahue, N. M., Baltensperger, U., Kulmala, M., and Worsnop, D. R.: On the composition of ammonia–sulfuric-acid ion clusters during aerosol particle formation, Atmos. Chem. Phys., 15, 55–78, https://doi.org/10.5194/acp-15-55-2015, 2015.
Stolzenburg, M. R. and McMurry, P. H.: An ultrafine aerosol condensation nucleus counter, Aerosol Sci. Tech., 14, 48–65, 1991.
Stolzenburg, D., Simon, M., Ranjithkumar, A., Kürten, A., Lehtipalo, K., Gordon, H., Ehrhart, S., Finkenzeller, H., Pichelstorfer, L., Nieminen, T., He, X.-C., Brilke, S., Xiao, M., Amorim, A., Baalbaki, R., Baccarini, A., Beck, L., Bräkling, S., Caudillo Murillo, L., Chen, D., Chu, B., Dada, L., Dias, A., Dommen, J., Duplissy, J., El Haddad, I., Fischer, L., Gonzalez Carracedo, L., Heinritzi, M., Kim, C., Koenig, T. K., Kong, W., Lamkaddam, H., Lee, C. P., Leiminger, M., Li, Z., Makhmutov, V., Manninen, H. E., Marie, G., Marten, R., Müller, T., Nie, W., Partoll, E., Petäjä, T., Pfeifer, J., Philippov, M., Rissanen, M. P., Rörup, B., Schobesberger, S., Schuchmann, S., Shen, J., Sipilä, M., Steiner, G., Stozhkov, Y., Tauber, C., Tham, Y. J., Tomé, A., Vazquez-Pufleau, M., Wagner, A. C., Wang, M., Wang, Y., Weber, S. K., Wimmer, D., Wlasits, P. J., Wu, Y., Ye, Q., Zauner-Wieczorek, M., Baltensperger, U., Carslaw, K. S., Curtius, J., Donahue, N. M., Flagan, R. C., Hansel, A., Kulmala, M., Lelieveld, J., Volkamer, R., Kirkby, J., and Winkler, P. M.: Enhanced growth rate of atmospheric particles from sulfuric acid, Atmos. Chem. Phys., 20, 7359–7372, https://doi.org/10.5194/acp-20-7359-2020, 2020.
Temelso, B., Morrison, E. F., Speer, D. L., Cao, B. C., Appiah-Padi, N., Kim, G., and Shields, G. C.: Effect of Mixing Ammonia and Alkylamines on Sulfate Aerosol Formation, J. Phys. Chem. A, 122, 1612–1622, https://doi.org/10.1021/acs.jpca.7b11236, 2018.
Tiszenkel, L., Stangl, C., Krasnomowitz, J., Ouyang, Q., Yu, H., Apsokardu, M. J., Johnston, M. V., and Lee, S.-H.: Temperature effects on sulfuric acid aerosol nucleation and growth: initial results from the TANGENT study, Atmos. Chem. Phys., 19, 8915–8929, https://doi.org/10.5194/acp-19-8915-2019, 2019.
Viisanen, Y., Kulmala, M., and Laaksonen, A.: Experiments on Gas-Liquid Nucleation of Sulfuric Acid and Water, J. Chem. Phys., 107, 920–926, https://doi.org/10.1063/1.474445, 1997.
Verheggen, B. and Mozurkewich, M.: Determination of Nucleation and Growth Rates from Observation of a SO2 Induced Atmospheric Nucleation Event, J. Geophys. Res., 107, AAC 5-1–AAC 5-12, https://doi.org/10.1029/2001JD000683, 2002.
Wang, J., Flagan, R. C., and Seinfeld, J. H.: Diffusional losses in particle sampling systems containing bends and elbows, J. Aerosol. Sci., 33, 843–857, 2002.
Wang, C.-Y., Jiang, S., Liu, Y.-R., Wen, H., Wang, Z.-Q., Han, Y.-J., Huang, T., and Huang, W.: Synergistic Effect of Ammonia and Methylamine on Nucleation in the Earth's Atmosphere. A Theoretical Study, J. Phys. Chem. A, 122, 3470–3479, https://doi.org/10.1021/acs.jpca.8b00681, 2018.
Wyslouzil, B. E., Seinfeld, J. H., Flagan, R. C., and Okuyama, K.: Binary Nucleation in Acid-Water Systems. II. Sulfuric Acid-Water and a Comparison with Methanesulfonic Acid-Water, J. Chem. Phys., 94, 6842–6850, https://doi.org/10.1063/1.460262, 1991.
Yu, F.: Quasi-unary homogeneous nucleation of H2SO4-H2O, J. Chem. Phys., 122, 074501, https://doi.org/10.1063/1.1850472, 2005.
Yu, F., Nadykto, A. B., Luo, G., and Herb, J.: H2SO4–H2O binary and H2SO4–H2O–NH3 ternary homogeneous and ion-mediated nucleation: lookup tables version 1.0 for 3-D modeling application, Geosci. Model Dev., 13, 2663–2670, https://doi.org/10.5194/gmd-13-2663-2020, 2020.
Yu, H., McGraw, R., and Lee, S.-H.: Effects of Amines on Formation of Sub-3 Nm Particles and their Subsequent Growth, Geophys. Res. Lett., 39, L02807, https://doi.org/10.1029/2011GL050099, 2012.
Yu, H., Dai, L., Zhao, Y., Kanawade, V. P., Tripathi, S. N., Ge, X., Chen, M., and Lee, S.-H.: Laboratory Observations of Temperature and Humidity Dependencies of Nucleation and Growth Rates of Sub-3 nm Particles, J. Geophys. Res.-Atmos., 122, 1919–1929, https://doi.org/10.1002/2016JD025619, 2017.
Zollner, J. H., Glasoe, W. A., Panta, B., Carlson, K. K., McMurry, P. H., and Hanson, D. R.: Sulfuric acid nucleation: power dependencies, variation with relative humidity, and effect of bases, Atmos. Chem. Phys., 12, 4399–4411, https://doi.org/10.5194/acp-12-4399-2012, 2012.