the Creative Commons Attribution 4.0 License.
the Creative Commons Attribution 4.0 License.
 | 10 Feb 2021
Factors controlling marine aerosol size distributions and their climate effects over the northwest Atlantic Ocean region
Randall V. Martin
Richard H. Moore
Luke D. Ziemba
Ewan C. Crosbie
Hongyu Liu
Lynn M. Russell
Georges Saliba
Armin Wisthaler
Markus Müller
Arne Schiller
Martí Galí
Rachel Y.-W. Chang
Erin E. McDuffie
Kelsey R. Bilsback
Jeffrey R. Pierce
Aerosols over Earth's remote and spatially extensive ocean surfaces have important influences on planetary climate. However, these aerosols and their effects remain poorly understood, in part due to the remoteness and limited observations over these regions. In this study, we seek to understand factors that shape marine aerosol size distributions and composition in the northwest Atlantic Ocean region. We use the GEOS-Chem model with the TwO-Moment Aerosol Sectional (TOMAS) microphysics algorithm model to interpret measurements collected from ship and aircraft during the four seasonal campaigns of the North Atlantic Aerosols and Marine Ecosystems Study (NAAMES) conducted between 2015 and 2018. Observations from the NAAMES campaigns show enhancements in the campaign-median number of aerosols with diameters larger than 3 nm in the lower troposphere (below 6 km), most pronounced during the phytoplankton bloom maxima (May/June) below 2 km in the free troposphere. Our simulations, combined with NAAMES ship and aircraft measurements, suggest several key factors that contribute to aerosol number and size in the northwest Atlantic lower troposphere, with significant regional-mean (40–60∘ N and 20–50∘ W) cloud-albedo aerosol indirect effect (AIE) and direct radiative effect (DRE) processes during the phytoplankton bloom. These key factors and their associated simulated radiative effects in the region include the following: (1) particle formation near and above the marine boundary layer (MBL) top (AIE: −3.37 W m−2, DRE: −0.62 W m−2); (2) particle growth due to marine secondary organic aerosol (MSOA) as the nascent particles subside into the MBL, enabling them to become cloud-condensation-nuclei-sized particles (AIE: −2.27 W m−2, DRE: −0.10 W m−2); (3) particle formation and growth due to the products of dimethyl sulfide, above and within the MBL (−1.29 W m−2, DRE: −0.06 W m−2); (4) ship emissions (AIE: −0.62 W m−2, DRE: −0.05 W m−2); and (5) primary sea spray emissions (AIE: +0.04 W m−2, DRE: −0.79 W m−2). Our results suggest that a synergy of particle formation in the lower troposphere (particularly near and above the MBL top) and growth by MSOA contributes strongly to cloud-condensation-nuclei-sized particles with significant regional radiative effects in the northwest Atlantic. To gain confidence in radiative effect magnitudes, future work is needed to understand (1) the sources and temperature dependence of condensable marine vapors forming MSOA, (2) primary sea spray emissions, and (3) the species that can form new particles in the lower troposphere and grow these particles as they descend into the marine boundary layer.
- Article
(6227 KB) - Full-text XML
-
Supplement
(1614 KB) - BibTeX
- EndNote


Marine atmospheric particles have important roles in Earth's climate system. Similar to particles in other regions, marine aerosols scatter and absorb solar radiation (Charlson et al., 1992) and modify cloud properties by acting as the seeds for cloud droplet formation (Boucher and Haywood, 2000; Lohmann and Feichter, 2005). Aerosols in the atmosphere's marine boundary layer (MBL) strongly influence the highly prevalent, low-altitude marine clouds, which have key climate cooling effects due to their reflection of incoming solar radiation (Wood, 2012; Chen et al., 2014). However, there remains high uncertainty about the magnitude of these aerosol effects (IPCC, 2013), due in part to limited understanding about the processes that control aerosols over Earth's expansive and remote ocean surfaces (Willis et al., 2018). Marine aerosols are strongly influenced by natural but poorly understood sources, making a large contribution to uncertainty in aerosol–climate effects (Carslaw et al., 2010, 2013). Limited observations of aerosols and their precursors over Earth's remote marine regions contribute to these knowledge gaps. In this study, we focus on investigation of several factors controlling the seasonal cycle of aerosol size and number and their resultant climate effects over the northwest Atlantic Ocean.
Aerosol particles in the remote MBL have several seasonally varying sources (O'Dowd et al., 2004; Leck and Bigg, 2005; de Leeuw et al., 2011; Karl et al., 2012). Primary particles are emitted through wave-breaking and bubble-bursting processes that eject sea spray aerosols (SSAs) of sea salt and organic composition (Russell et al., 2010; de Leeuw et al., 2011; Ovadnevaite et al., 2011; Gantt and Meskhidze, 2013; Prather et al., 2013; Hamacher-Barth et al., 2016; Brooks and Thornton, 2018). SSAs have a not-yet-well-understood dependence on wind speed (Monahan et al., 1983; O'Dowd et al., 1997; Ovadnevaite et al., 2012; Grassian et al., 2015; Brooks and Thornton, 2018; Saliba et al., 2019) and sea surface temperature (Mårtensson et al., 2003; Jaeglé et al., 2011; Kasparian et al., 2017; Saliba et al., 2019). For the North Atlantic, observations indicate that primary SSAs make a limited (less than 30 %) contribution to cloud condensation nuclei (CCN) (Quinn et al., 2017, 2019; Zheng et al., 2018) with no direct connection between SSA emissions and plankton ecosystems, because the organic SSA appears to arise from the ocean's large pool of dissolved organic carbon (Quinn et al., 2014; Bates et al., 2020). SSA, however, could modify the CCN number that activates to form cloud droplets (Fossum et al., 2020), act as ice nuclei (Wilson et al., 2015; DeMott et al., 2016; Irish et al., 2017), and be more closely linked with biogenic activity in other regions (Ault et al., 2013; Cravigan et al., 2015; O'Dowd et al., 2015; Quinn et al., 2015, 2019; Wang et al., 2015; Schiffer et al., 2018; Christiansen et al., 2019). Recent studies have highlighted knowledge gaps related to sea spray emissions, particularly related to the submicron sizes (e.g., Bian et al., 2019; Regayre et al., 2020). Measurement and modeling studies are needed to better understand and simulate the size-resolved contribution of sea spray to the northwest Atlantic MBL.
For the North Atlantic, secondary aerosol of biogenic origin is observed to be an important seasonally varying contributor to marine particles and their growth to yield CCN (Sanchez et al., 2018). Marine secondary aerosol can arise from the condensation of a variety of marine-vapor-oxidation products, which form and grow particles (Ceburnis et al., 2008; Rinaldi et al., 2010; Decesari et al., 2011). Formation of new aerosol particles in the marine environment is observed to be favored in clean atmospheric layers just below the marine inversion and also above the MBL top (Kazil et al., 2011; Takegawa et al., 2020). Newly formed particles, including those from the free troposphere can grow to CCN sizes (diameters larger than about 50 nm) through the condensation of available organic- and sulfur-containing vapors on descent into the MBL (Korhonen et al., 2008). Once the particles reach CCN sizes, cloud processing (including aqueous-phase aerosol production and cloud droplet coagulation with other droplets and interstitial aerosols) also contributes to shaping the size distribution (Hoppel et al., 1986; Hoose et al., 2008; Pierce et al., 2015). For the North Atlantic MBL, entrainment of new growing particles formed in the relatively cleaner free troposphere is an important contributor to MBL particle number (Quinn et al., 2017; Sanchez et al., 2018; Zheng et al., 2018). In the pristine conditions of the summertime Arctic, both new particle formation (NPF) and growth (by condensation of organic- and sulfur-containing vapors) are frequently observed within the boundary layer itself (Leaitch et al., 2013; Croft et al., 2016a; Willis et al., 2016; Collins et al., 2017; Burkart et al., 2017b). In addition to sulfuric acid, other vapors including amines, methane sulfonic acid (MSA), ammonia, and iodine all contribute to NPF in marine regions (O'Dowd, 2002; Facchini et al., 2008; Allan et al., 2015, Chen et al., 2016; Croft et al., 2016a; Dall'Osto et al., 2018). Interpretation of a combination of aircraft and shipboard observations with a size-resolved aerosol microphysics model is needed to develop understanding of the relative importance of near and above MBL top NPF as a contributor to aerosol size distributions in the northwest Atlantic MBL.
Dimethyl sulfide (DMS) is one of the key contributors to secondary particle formation and growth that is released from the oceans as a result of marine biogenic activity (Lana et al., 2012a; Galí and Simó, 2015; Sanchez et al., 2018). The oxidation products of DMS include sulfuric acid and MSA (Barnes et al., 2006), which can form new particles and grow existing particles to sizes that can act as CCN (Hoffman et al., 2016; Hodshire et al., 2019). As well, hydroperoxymethyl thioformate (HPMTF) is a recently discovered DMS-oxidation product, which could also contribute to NPF and growth (Veres et al., 2020). The role of DMS in the climate system has undergone much debate since 1987 when the CLAW hypothesis proposed that DMS could act as a regulator in a warming climate (Charlson et al., 1987). For the North Atlantic and Arctic, observations have linked DMS to the formation of aerosols during the times of phytoplankton blooms (Rempillo et al., 2011; Chang et al., 2011; Park et al., 2017; Sanchez et al., 2018; Abbatt et al., 2019; Quinn et al., 2019). As well, modeling studies have supported a role for DMS, linked to phytoplankton blooms, as a contributor to CCN number concentrations in the North Atlantic and Arctic MBLs (Woodhouse et al., 2013; Zheng et al., 2018; Ghahremaninezhad et al., 2019; Mahmood et al., 2019) and Southern Ocean MBL (Korhonen et al., 2008; McCoy et al., 2015; Revell et al., 2019). However, the extent to which DMS can act as a climate regulator remains unclear (Schwinger et al., 2017; Fiddes et al., 2018), and this role has been refuted (Quinn and Bates, 2011). Analysis of in situ observations of DMS and its products across the seasonal cycle of marine biogenic activity and in various ocean regions is needed to improve understanding related to the role of DMS in Earth's climate system.
Marine secondary organic aerosol (MSOA) is another important contributor to submicron-diameter marine aerosols, but it is not well characterized (Rinaldi et al., 2010). The oceans are a source of a variety of organic vapors that could lead to SOA formation (O'Dowd and de Leeuw, 2007; Yassaa et al., 2008; Carpenter et al., 2012; Lana et al., 2012b; Hu et al., 2013; Carpenter and Nightingale, 2015; Kim et al., 2017; Rodríguez-Ros et al., 2020a). Oxygenated volatile organic compounds (OVOCs) recently linked to photochemical oxidative processes at the sea surface microlayer are possible contributors to MSOA (Mungall et al., 2017). Isoprene and monoterpenes appear to make relatively minor contributions to MSOA by mass, e.g., less than 1 % for particles with diameters smaller than 10 µm at Cape Grim (Cui et al., 2019). The global annual source of organic vapors from the oceans is highly uncertain, but current estimates are about 23 to 92 Tg C yr−1 (Brüggemann et al., 2018). Laboratory studies indicate that emissions of marine organic vapors increase with both temperature and incident radiation for temperatures up to about 26 ∘C (Meskhidze et al., 2015). Recent observations and modeling studies support a role for Arctic marine secondary organic aerosol as a contributor to particle growth to CCN sizes (Burkart et al., 2017a; Collins et al., 2017; Willis et al., 2017, 2018; Tremblay et al., 2019; Leaitch et al., 2018; Croft et al., 2019; Abbatt et al., 2019). For the North Atlantic, organics are also found to make a large contribution to particle growth to CCN sizes (Sanchez et al., 2018; Zheng et al., 2020a). The result of the above-noted processes is a large and complex pool of organic aerosol in the marine environment with sources that vary seasonally and regionally (Cavalli et al., 2004; Decesari et al., 2011; Cravigan et al., 2020; Liu et al., 2018; Leaitch et al., 2018; Lapina et al., 2011).
Anthropogenic activity is also an important source of aerosols over portions of the Earth's oceans. For the North Atlantic, several previous studies (e.g., Savoie et al., 2002; Stohl et al., 2003; Huntrieser et al., 2005; Fast et al., 2016) found a key role for synoptic-scale motions in lifting aerosols arising from North American continental emissions and transporting them in layers over the North Atlantic with intrusions into the MBL. As well, ship traffic is an important source of both particles and oxidants in the MBL (Corbett et al., 2007; Zanatta et al., 2019; Bilsback et al., 2020). Ship emissions of nitrogen oxides have a significant control on levels of oxidants such as ozone, the hydroxyl radical (OH), and NO3 in the MBL (Vinken et al., 2011; Holmes et al., 2014). In the remote MBL, both OH and NO3 are key oxidants of DMS, along with natural-source halogens such as BrO, with an important role for multiphase chemistry (Chen et al., 2018). Interpretation of aerosol observations across several seasons is needed to better understand the relative contribution of ship emissions to marine particles in the northwest Atlantic region.
In this study, as part of the Ocean Frontier Institute (http://www.oceanfrontierinstitute.com, last access: 17 December 2020), we address the knowledge gaps that were identified above, concerning several key factors shaping northwest Atlantic MBL aerosol size distributions and their seasonal cycle. We consider the role of (1) new particle formation in clean atmospheric layers near and above the MBL top, (2) particle growth by MSOA on descent into the MBL, (3) DMS contributions, (4) ship traffic emissions, and (5) primary sea spray emissions. Aerosol measurements from the North Atlantic Aerosols and Marine Ecosystems Study (NAAMES) (Behrenfeld et al., 2019) provide an excellent basis for addressing the role of these five factors in the northwest Atlantic Ocean region. The NAAMES aircraft and ship campaigns were conducted during four phases of the northwest Atlantic annual plankton cycle from 2015–2018. We interpret the NAAMES aerosol measurements using a state-of-the-art size-resolved global aerosol microphysics model, GEOS-Chem-TOMAS (http://acmg.seas.harvard.edu/geos/, last access: 17 December 2020). Our synergistic approach of bringing together NAAMES measurements and size-resolved aerosol process modeling enables a unique consideration of several key factors shaping northwest Atlantic MBL aerosol size distributions and their annual cycle. We also quantify the impact of these factors on aerosol radiative effects over the North Atlantic.
The second section provides an overview of our measurement and modeling methodology. The third section presents results using the GEOS-Chem-TOMAS model to interpret NAAMES aerosol measurements and their seasonal cycle with a focus on the roles of near-and-above-MBL-top NPF, MSOA, DMS, sea spray, and ship emissions. We also quantify the direct and cloud-albedo aerosol indirect radiative effects attributed to each of these factors during the seasonal cycle. The final section gives our summary and outlook.
2.1 Aerosol measurements during the NAAMES campaigns
NAAMES campaigns were conducted during four key periods in the annual cycle of marine biogenic activity, namely, the winter transition (November 2015), the accumulating phase (March/April 2018), the climax transition (May/June 2016), and the declining phase (August/September 2017) (Behrenfeld et al., 2019). These periods are defined by shifts in net phytoplankton growth rates and span a wide range in phytoplankton biomass, which are here estimated from chlorophyll a concentrations (Chl a). The winter transition is characterized by the annual minimum in Chl a concentrations (generally < 1 mg m−3) and a shift to favor phytoplankton growth over loss as the increasing ocean-mixed-layer depth leads to fewer encounters between phytoplankton and their grazers. The accumulation phase occurs in early springtime when increasing sunlight and decreasing ocean-mixed-layer depths promote increasing phytoplankton growth rates and concentrations (Chl a between 1 and 2 mg m−3). The climax transition is the time of the annual maximum in phytoplankton biomass (Chl a between 2 and 9 mg m−3) and marks the shift from positive to negative growth rates owing to high grazing rates and depletion of nutrients. The declining phase (Chl a between 1 and 2 mg m−3) occurs later in the summertime when the ocean-mixed-layer depth increases and incident sunlight decreases, leading to further declines in phytoplankton growth and concentrations. Behrenfeld et al. (2019) provide an overview of the four measurement campaigns and further details about Chl a during NAAMES. The R/V Atlantis cruise tracks and NASA C-130 flight paths are shown in Fig. 1. Due to aircraft mechanical problems, there were no flights in 2018 during the accumulating phase.
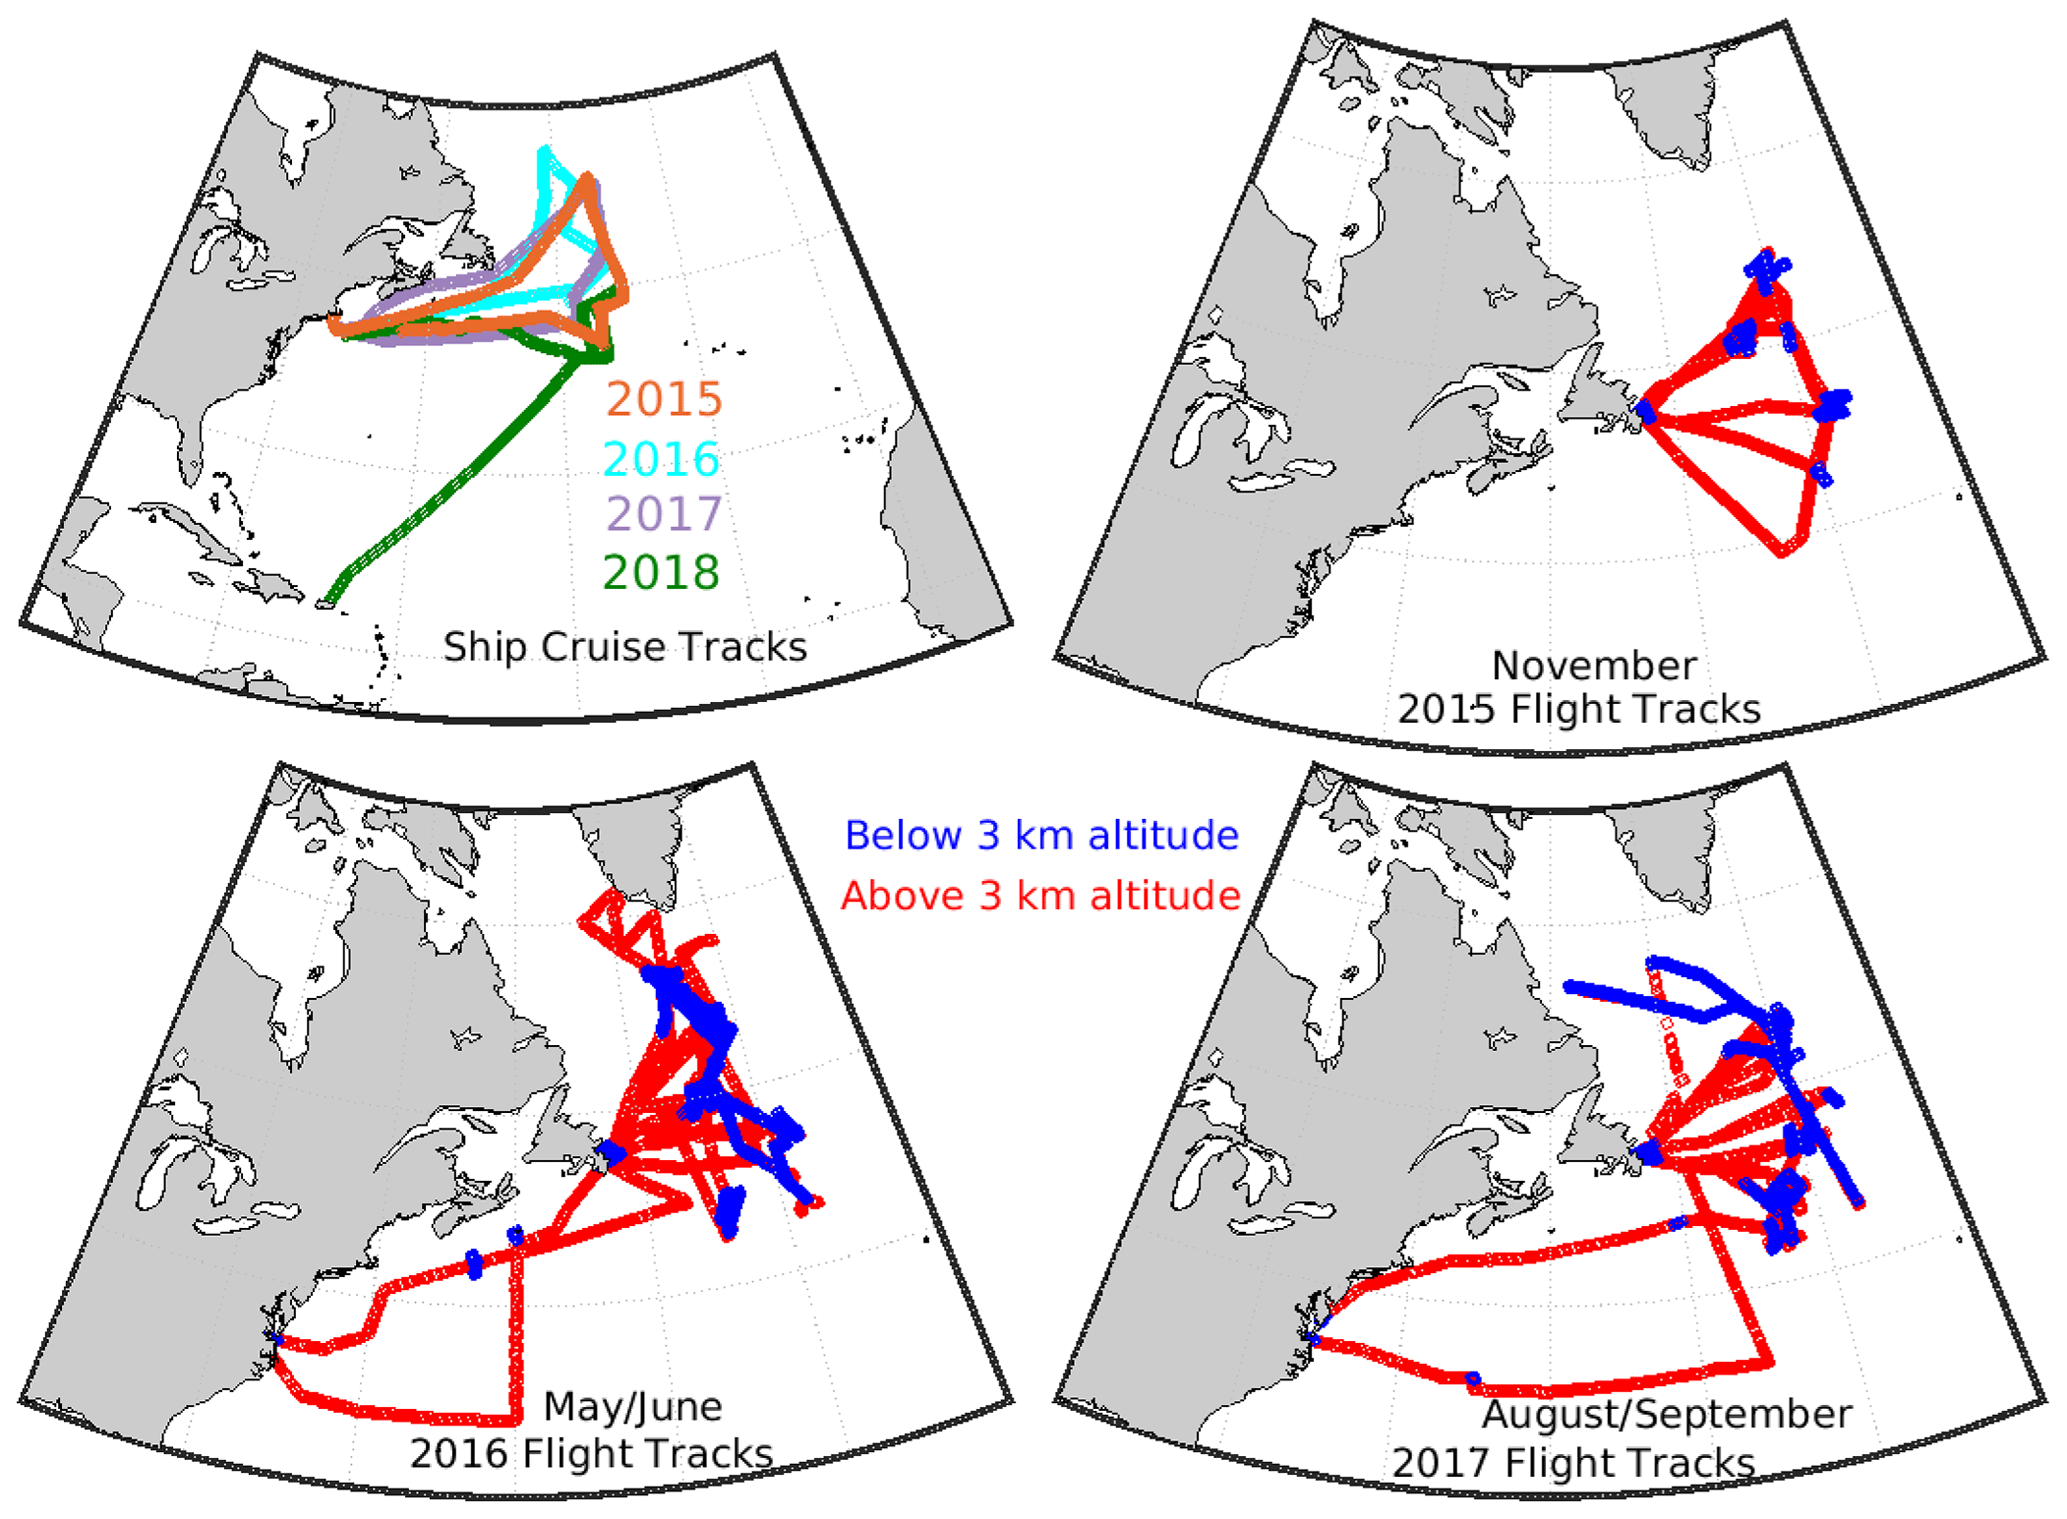
Figure 1Cruise and aircraft tracks for the 2015–2018 NAAMES campaigns. Flight altitudes below 3 km are color-coded in blue and above 3 km in red. Ship-track campaigns are color-coded for each year as shown by the legend and as follows. Orange: November 2015 winter transition (bloom minima); cyan: May/June 2016 climax transition (bloom maxima); purple: August/September 2017 declining phase; and green: March/April 2018 accumulation phase.
In this study, we examine the NAAMES size-resolved aerosol measurements (particle diameters 20 to 500 nm) from the scanning electrical mobility sizer (SEMS, model 138, 2002, BMI, Hayward, CA, USA) aboard the R/V Atlantis ship. Aerosol particles were isokinetically drawn through an inlet positioned 18 (Bates et al., 2002) and were subsequently dried below 20 % relative humidity using silica diffusion driers prior to sampling by the SEMS. Clean marine periods were identified with criteria of relative wind directions within 90∘ of the bow, condensation nuclei number concentrations less than 2000 cm−3, ammonium and organic aerosol not covarying, ammonium < 100 ng m−3, and having back-trajectories primarily over the ocean surface. We also consider aerosol size-resolved measurements (particle diameters 10 to 282 nm) from the scanning mobility particle sizer (SMPS, TSI Inc., Shoreview, MN, USA) aboard the C-130 aircraft. As well, we give attention to measurements of total particle number concentration from the condensation particle counters (CPCs) with differing nominal lower detection diameters: 3 nm for the CPC 3025 (yielding N3 measurements) and 10 nm for the CPC 3772 (TSI Inc., St. Paul, MN, USA) (yielding N10 measurements) aboard the C-130 aircraft. We also consider submicron, non-refractory sulfate () and organic mass (OM) concentrations from an Aerodyne high-resolution time-of-flight aerosol mass spectrometer (HR-ToF-AMS; DeCarlo et al., 2006) and refractory black carbon from the single particle soot photometer (SP2; Schwarz et al., 2006) aboard the aircraft. HR-ToF-AMS and SP2 measurements are restricted to accumulation-mode aerosol (60–600 and 105–600 nm diameter, respectively). All aircraft observations are made behind a forward-facing, shrouded, solid diffuser inlet that efficiently transmits particles with aerodynamic diameter less than 5.0 µm to cabin-mounted instrumentation (McNaughton et al., 2007). Cloud-contaminated aerosol observations have been removed using a combination of wing-mounted cloud probe and relative humidity measurements. This filtering may possibly obscure some NPF events in proximity to clouds and remove some cloud-processed samples from the vertical profiles. Aerosol number and mass concentrations are reported at standard temperature and pressure. A proton-transfer-reaction time-of-flight mass spectrometer (PTR-ToF-MS) (Müller et al., 2014; Schiller, 2018) was used aboard the NASA C-130 to measure volatile organic compounds including DMS and acetonitrile. Both observational and model data for periods when acetonitrile concentrations exceed 200 ppt are filtered out following Singh et al. (2012) to remove significant biomass burning contributions that are not the focus of this study.
2.2 GEOS-Chem-TOMAS model description
We use the GEOS-Chem model (v12.1.1) (http://acmg.seas.harvard.edu/geos/, last access: 17 December 2020) coupled to the TwO Moment Aerosol Sectional (TOMAS) microphysics scheme (Adams and Seinfeld, 2002; Lee and Adams, 2012; Kodros and Pierce, 2017), with 15 sections, representing particle sizes from 3 nm to 10 µm. All simulations are at a 4∘ × 5∘ resolution with 47 vertical levels extending to 0.01 hPa. The meteorological fields are from the GEOS Forward Processing offline fields (GEOS-FP; https://gmao.gsfc.nasa.gov/GMAO_products/, last access: 17 December 2020). Our size-resolved aerosol simulations parameterize the processes of particle nucleation, coagulation, and condensation, along with wet and dry deposition, and include the in-cloud aerosol coagulation scheme of Pierce et al. (2015). Sulfate, organic and black carbon, sea salt, dust, and aerosol water are simulated. TOMAS is coupled to the full tropospheric aerosol/chemistry scheme of GEOS-Chem. Wet deposition follows Liu et al. (2001), Wang et al. (2011), and Wang et al. (2014). To represent efficient wet removal by North Atlantic drizzle in October and November, we implement a fixed in-cloud removal efficiency of 0.001 s−1 in the lowest 2 km of the model atmosphere over the ice-free ocean and enable wet removal of sulfate and organic aerosol in clouds with temperatures between 237 and 258 K. In all seasons, we use the GEOS-FP cloud fraction as the precipitation fraction in the model layers where precipitation occurs for a closer connection with the meteorological fields (Croft et al., 2016b; Luo et al., 2019, 2020). Dry deposition uses the resistance in series approach of Wesley (1989). Simulated gas-phase species are also removed by dry and wet deposition as described in Amos et al. (2012).
For emissions, we use the GEOS-Chem v 12.1.1 default setup for gas-phase and primary aerosol emissions. We use emissions from the Community Emissions Data System (CEDS) for global anthropogenic sources of NOx, CO, SO2, NH3, non-methane VOCs, black carbon, and organic carbon, including from international shipping as a source of both primary and secondary particles. Primary particles are emitted with a lognormal distribution (Lee et al., 2013). The most recent CEDS emissions dataset extends to the year 2017, as described in McDuffie et al. (2020). In this work, monthly CEDS emission totals for each compound are spatially gridded by source sector, according to the 0.1∘ × 0.1∘ gridded EDGAR v4.2 emissions inventory (EC-JRC/PBL, 2012) and population, as described in Hoesly et al. (2018). To account for in-plume chemical processing of ship emissions, we use the PARANOX scheme of Holmes et al. (2014). CEDS emissions are overwritten over the United States by the National Emissions Inventory (NEI11) with updated scale factors for our simulation years (2015–2018). We calculated these factors based on emission data for these years from the United States Environmental Protection Agency. Over Canada, we use the Air Pollutant Emission Inventory (APEI). The Global Fire Emissions Database (GFED4s) is used for biomass burning emissions (van der Werf et al., 2017) for the years 2015/16, with GFED4s climatological values for 2017 and 2018 since exact-year emissions were not available when we conducted our simulations. Dust emissions are from the scheme of Zender et al. (2003).
Sea salt emissions follow Jaeglé et al. (2011). This temperature-dependent parameterization decreases global emissions relative to the Gong (2003) parameterization. A coupled parameterization for primary organic aerosol from sea spray was not available for our aerosol size-resolved GEOS-Chem-TOMAS simulations, such that some sea spray organics could be misrepresented as sea salt, since all sea spray in our simulations is considered sea salt. Such primary organic emissions are expected to have no seasonal cycle when averaged over the NAAMES region (Bates et al., 2020).
Exchange of DMS between the ocean and atmosphere is parameterized using the default GEOS-Chem parameterization, which follows Johnson (2010), largely based on Nightingale et al. (2000a, b). We use the 8 d mean satellite-retrieval seawater DMS dataset of Galí et al. (2019), developed using the methodology of Galí et al. (2018), for available years (2015 and 2016) for the region north of about 40∘ N. The Lana et al. (2011) DMS climatology is used elsewhere. Terrestrial biogenic emissions are from MEGAN2.1 as described in Guenther et al. (2012). Following Croft et al. (2019), we add a source of MSOA coupled to the simple SOA scheme described in Pai et al. (2020). Emissions of MSOA-precursor vapors have been found to increase with temperature (Meskhidze et al., 2015; Rodríguez-Ros et al., 2020a, b). Here, we use a temperature-dependent simulated source of MSOA-precursor emissions (SMSOA), SMSOA = 70T + 350 , where T is atmospheric temperature (∘C) at 2 m altitude. The values of 70 and 350 are found to yield acceptable model–measurement agreement for NAAMES campaign-median ship-track and aircraft measurements (Figs. S1–S4 and Tables S1 and S2 in the Supplement). This simulated source of condensable vapors is emitted with a split between vapors that are immediately available to form MSOA and vapors with 1 d aging prior to availability (and not susceptible to wet removal). MSOA contributes to particle growth in our simulations (in agreement with observational-based studies; e.g., Sanchez et al., 2018; Zheng et al., 2020a), along with sulfuric acid, but since the particle nucleating abilities of MSOA are unclear, it does not contribute to new particle formation.
All simulations include particle nucleation in the boundary layer that is parameterized with the ternary (H2SO4-NH3-H2O) scheme of Napari et al. (2002), which was scaled by 10−5 to better match continental boundary-layer measurements (Westervelt et al., 2013). The binary (H2SO4-H2O) scheme of Vehkamaki et al. (2002) is employed in the free troposphere at low NH3 concentrations. Growth and loss of particles smaller than 3 nm are approximated following Kerminen et al. (2004). In our simulations, as a surrogate for unparameterized processes in the lower free troposphere and near the MBL top, we also employ an activation-type nucleation parameterization from the MBL top to about 2 km altitude. This activation-type scheme parameterizes nucleation rates as a linear function of sulfuric acid concentrations, using an empirical factor (A = 2 × 10⁻⁶ s−1) (Kulmala et al., 2006; Sihto et al., 2006), and serves as a proxy representing several unknown or unparameterized mechanisms related to NPF. Pockets of very clean air with low condensation sink near MBL clouds, which favor new particle formation (Kazil et al., 2011), are not resolved by large-scale models such as ours, with grid boxes on the scale of hundreds of square kilometers. Efficient wet removal by drizzling MBL clouds contributes to these pristine conditions (Wood et al., 2017). As well, MBL clouds reflect ultraviolet (UV) radiation and create pockets of enhanced UV, which favors photochemical production of aerosol precursor vapors (Weber et al., 2001; Wehner et al., 2015), which are not resolved by our model. Additionally, the particle-nucleating capacity of MSOA is unclear and particle formation parameterizations are not yet developed to represent NPF when several gas-phase precursors interact. These precursors include (but are not limited to) MSA (Chen et al., 2016), HPMTF (Veres et al., 2020), amines (Facchini et al., 2008), iodine (Allan et al., 2015), and other extremely low volatility organic compounds (ELVOCs) (Riccobono et al., 2014). The extra nucleation in the lower troposphere with the activation-type parameterization represents particle precursors that could have the same source as sulfuric acid. This approach may not capture the timing and magnitude of the variability in NPF correctly, because the vapors participating in this nucleation are likely not just sulfuric acid. Future work is needed to better understand the nature of the nucleating species in the lower troposphere over the oceans.
We also conduct offline radiative transfer calculations using the Rapid Radiative Transfer Model for Global Climate Models (RRTMG) (Iacono et al., 2008) to assess the aerosol direct radiative effect (DRE) and cloud-albedo aerosol indirect effect (AIE). The aerosol optical properties are calculated using the Mie code of Bohren and Huffman (1983) to find the extinction efficiency, single scattering albedo, and asymmetry factor. Then, these optical properties, along with the monthly-mean cloud fraction and surface albedo from the GEOS-FP meteorology fields, are input to the RRTMG to determine the change in top-of-the-atmosphere solar flux (DRE) between two simulations (our control simulation and one of the sensitivity simulations, Sect. 2.3). Our DRE calculations follow Kodros et al. (2016), with updates to include ammonium nitrate as described in Bilsback et al. (2020). All particles except black carbon are treated as internally mixed within each size section. We also calculate the cloud-albedo AIE as described in Kodros et al. (2016), Croft et al. (2016a), and Ramnarine et al. (2019). The Abdul-Razzak and Ghan (2002) parameterization is used to calculate offline cloud droplet number concentrations (CDNCs) using the aerosol mass and number concentrations from our simulations. We assume an updraft velocity of 0.5 m s−1 and the hygroscopicity parameters used by Kodros et al. (2016) and Kodros and Pierce (2017), assuming aerosol internal mixture, including ammonium nitrate following Bilsback et al. (2020). For each model grid box, we assume cloud droplet radii of 10 µm and perturb this value with the ratio of the monthly mean CDNC between two simulations (our control simulation and one of the sensitivity simulations, Sect. 2.3), assuming constant cloud liquid water content. The RRTMG is used to calculate the change in the top-of-the-atmosphere solar flux (AIE) due to changes in cloud droplet radii.
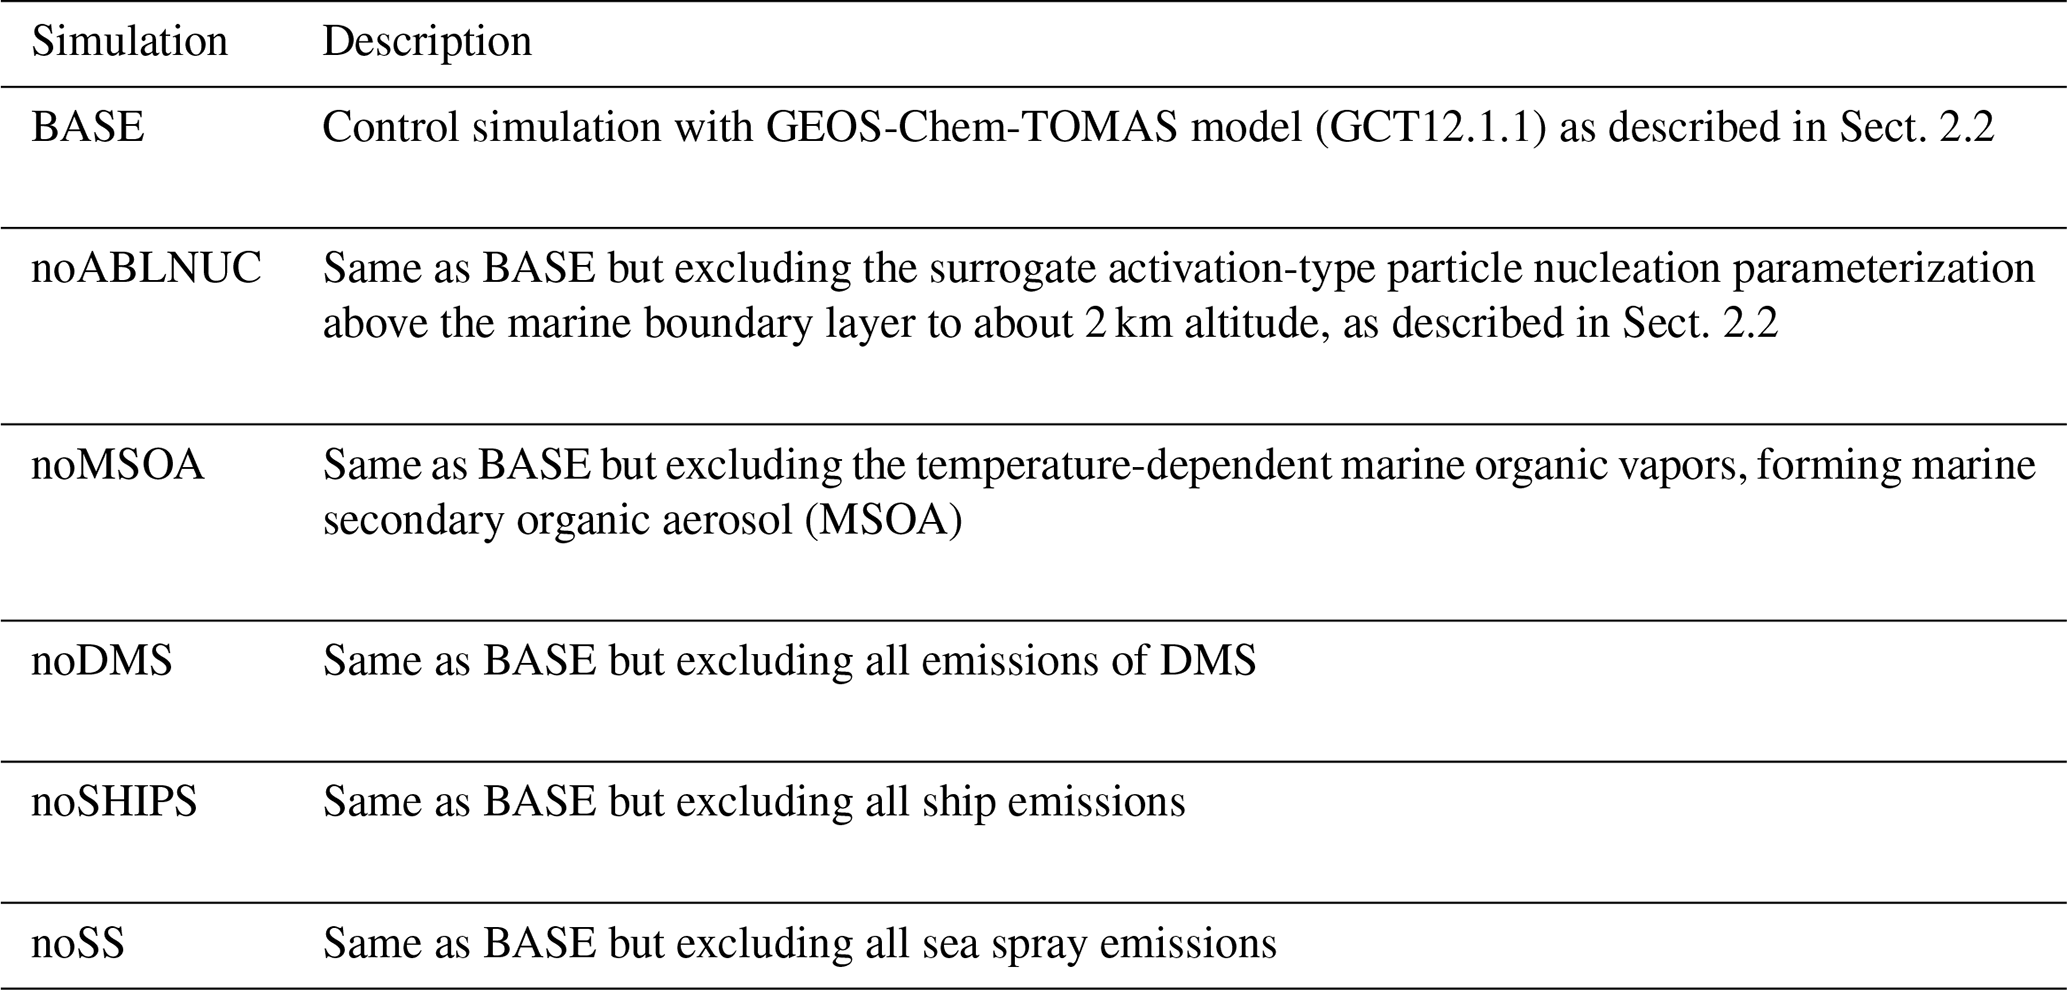
Table 1GEOS-Chem-TOMAS simulation acronyms. Simulations and methodology are described in detail in Sect. 2.2 and 2.3.
As one evaluation of simulation performance, we calculate the mean fractional error (MFE) of the zeroth to third moments between the simulated and observed MBL aerosol size distributions, following Boylan and Russell (2006) and using the same methodology as Hodshire et al. (2019) and Croft et al. (2019). The MFE is defined as a mean over the N aerosol size distribution moments,
where Cm(i) is the integrated value of the ith moment of the simulated aerosol size distribution, and Co(i) is the integrated value of the ith moment of the observed aerosol size distribution. The MFE can range from 0 to +2. We adopt the convention of Boylan and Russell (2006) to consider an MFE of 0.5 or less as acceptable.
For consideration of vertical profiles, we binned the measurement and simulation values using a 500 m height resolution, starting from the surface to 500 m as the first bin. Campaign-median values are calculated within each bin and plotted at the midpoint of the bin, starting at 250 m. During NAAMES, the lowest aircraft-flight-level altitude was around 150–200 m GPS altitude. We use a plane-flight diagnostic in the model to sample the simulation interpolated between grid-cell centers to the aircraft-flight-track position, during the times when measurement data were available for each respective instrument. We find consistent results with bin resolutions of 250, 500, and 1000 m, giving support for our selected binning resolution. The vertical profiles show measurements and model output along the aircraft flight tracks only and do not include any measurements or model output for the ship track. Vertical profile MFEs (Eq. 1) are calculated by summation over the altitude bins.
2.3 Summary of GEOS-Chem-TOMAS simulations
Table 1 summarizes the simulations conducted. Simulation BASE is our control simulation and includes all emissions and process parameterizations described above. We conduct five sensitivity simulations to examine the role of several key factors involved in shaping the aerosol distributions within the NAAMES study region. Simulation noABLNUC is the same as BASE except without the sulfuric acid-dependent activation-type surrogate nucleation parameterization, which we implemented from the MBL top to about 2 km. Simulation noMSOA is the same as BASE but without the source of temperature-dependent condensable marine organic vapors, forming MSOA. Simulation noDMS is the same as BASE but without DMS. Simulation noSHIPS is the same as BASE but without any ship emissions. Finally, simulation noSS is the same as BASE but without any primary sea spray emissions. All simulations are sampled coincidentally with the measurements using hourly output along the NAAMES aircraft and ship tracks within the respective model grid boxes, using the NAAMES campaign's 1 min resolution navigation data. To manage computational expense, the simulations are necessarily at a coarse resolution, which can bias model–measurement comparisons. However, these biases will be lower for remote marine regions such as the NAAMES study region than over land regions, which generally have greater spatial inhomogeneity. Representativeness errors were also reduced by limiting our model–measurement comparisons to campaign-median values.
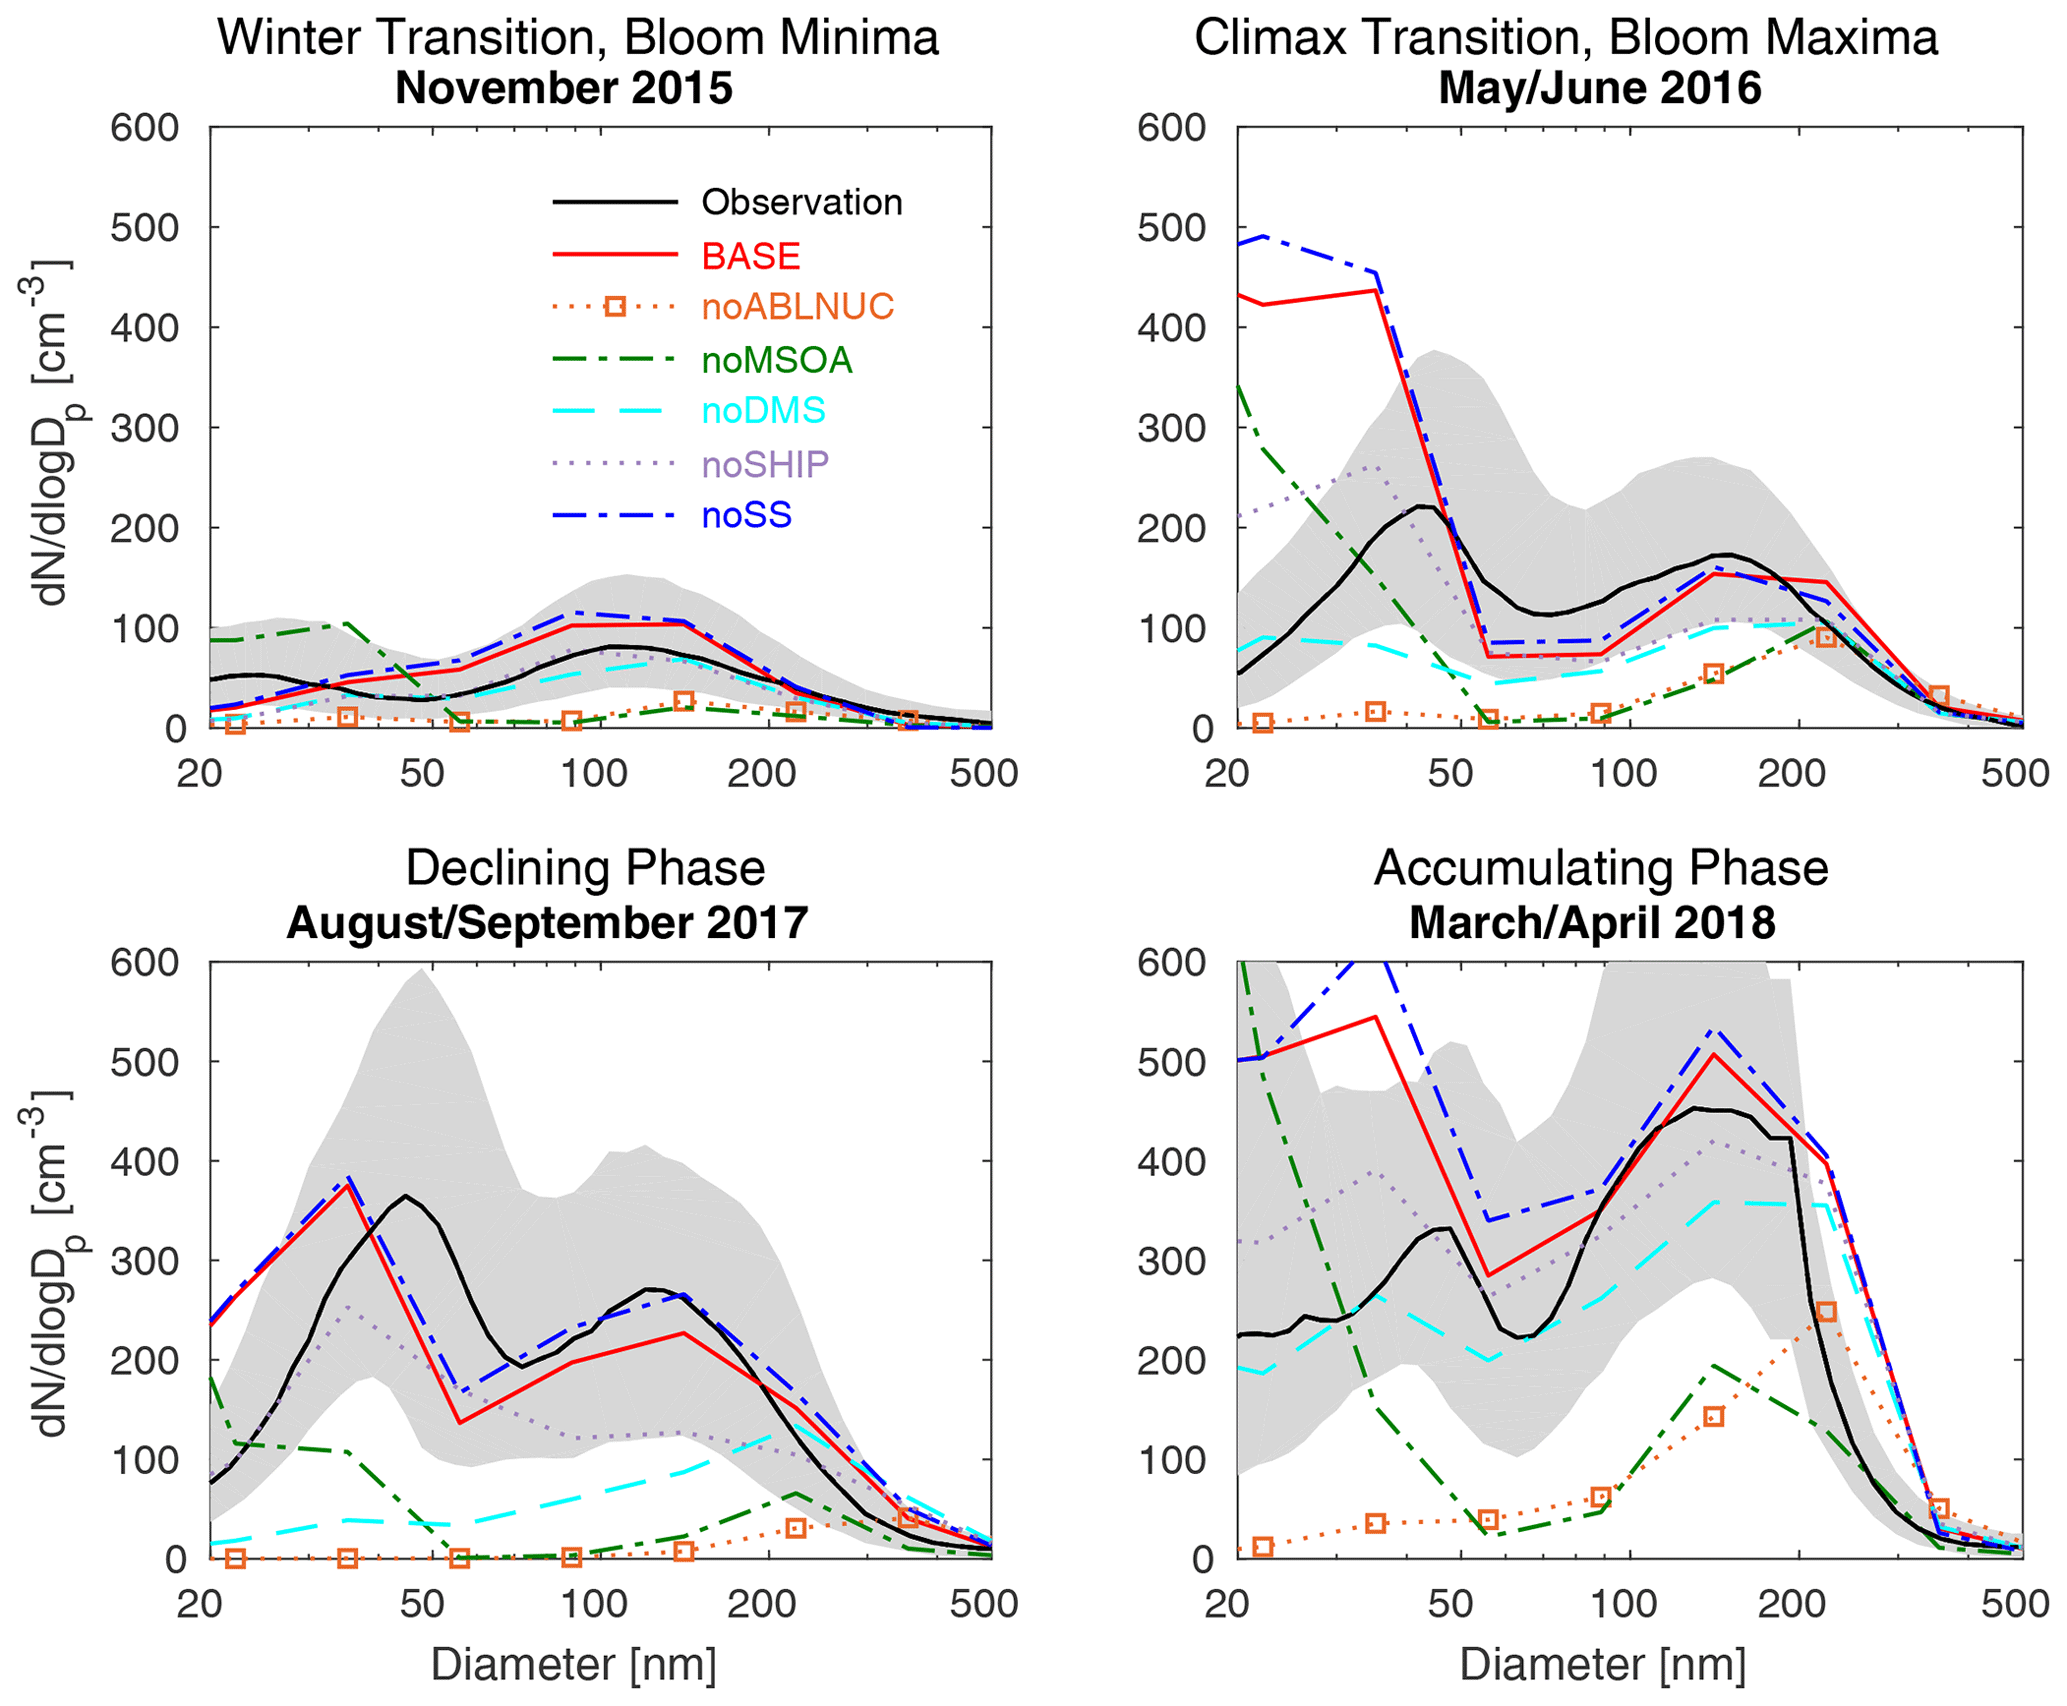
Figure 2NAAMES cruise-track campaign-median marine-boundary-layer aerosol size distributions from marine-influenced SEMS (particle diameters 20–500 nm) observations (black, with 25th to 75th percentiles in grey) and for the six GEOS-Chem-TOMAS simulations as described in Table 1 (color-coded as shown in the legend).
3.1 Key features of aerosols observed during NAAMES
Aerosol observations made during the NAAMES campaigns were in four seasons, capturing different stages of the annual cycle of northwest Atlantic marine biogenic activity (Behrenfeld et al., 2019). Figure 2 shows the campaign-median marine-influenced aerosol size distributions from SEMS (particle diameters 20–500 nm) for the four R/V Atlantis cruises. November 2015 (winter transition, bloom minima) is characterized by the lowest aerosol number concentrations. The peak of the northwest Atlantic drizzle season occurs at this time, with efficient wet removal of accumulation-sized aerosol (diameters larger than about 50 to 100 nm) (Browse et al., 2012). As well, relative to other seasons, marine biogenic emissions are low at this time of minimal phytoplankton biomass. The summertime observations during both May/June 2016 (climax transition, phytoplankton bloom maxima) and August/September 2017 (declining phase) are characterized by a weakly dominant Aitken mode (particle diameters < 100 nm). The winter transition (November 2015) and early spring accumulation phase observations (March/April 2018) are characterized by the dominance of accumulation-mode aerosols (particle diameters > 100 nm).

Figure 3Vertical profiles of NAAMES campaign-median integrated SMPS observations aboard aircraft at standard temperature and pressure (STP) for particles with diameters of 10 to 282 nm (black, with 25th–75th percentiles in grey) and for the six GEOS-Chem-TOMAS simulations described in Table 1 (color-coded as shown in the legend). All measurement and model output is binned at 500 m resolution, and campaign-median values are plotted at the midpoint of each bin starting at 250 m above the surface. Lines show linear interpolation between these values.
The vertical profiles of campaign-median integrated-SMPS (particle diameters of 10 to 282 nm) observations are shown in Fig. 3. There are several key features of the observed aerosol vertical profiles for the three NAAMES flight campaigns. These profiles exhibit several particle number maxima in the lower free troposphere below 6 km, including below 2 km during the May/June climax transition period. As shown in Fig. 3, aerosol surface area and volume are less at altitudes below about 3 km relative to altitudes above 3 km. This lower particle surface area at these altitudes favors NPF over growth of pre-existing particles as available vapors condense in these relatively cleaner atmospheric layers (Kazil et al., 2011). Transport of aerosols (in part associated with continental emissions) contributes to particles in all seasons. Fast et al. (2016) characterized summertime North Atlantic transport layers in the free troposphere associated with synoptic-scale lifting. The late fall (November 2015, Fig. 3) is characterized by the lowest aerosol number, surface, and volume concentrations, similar to the findings shown in Fig. 2.
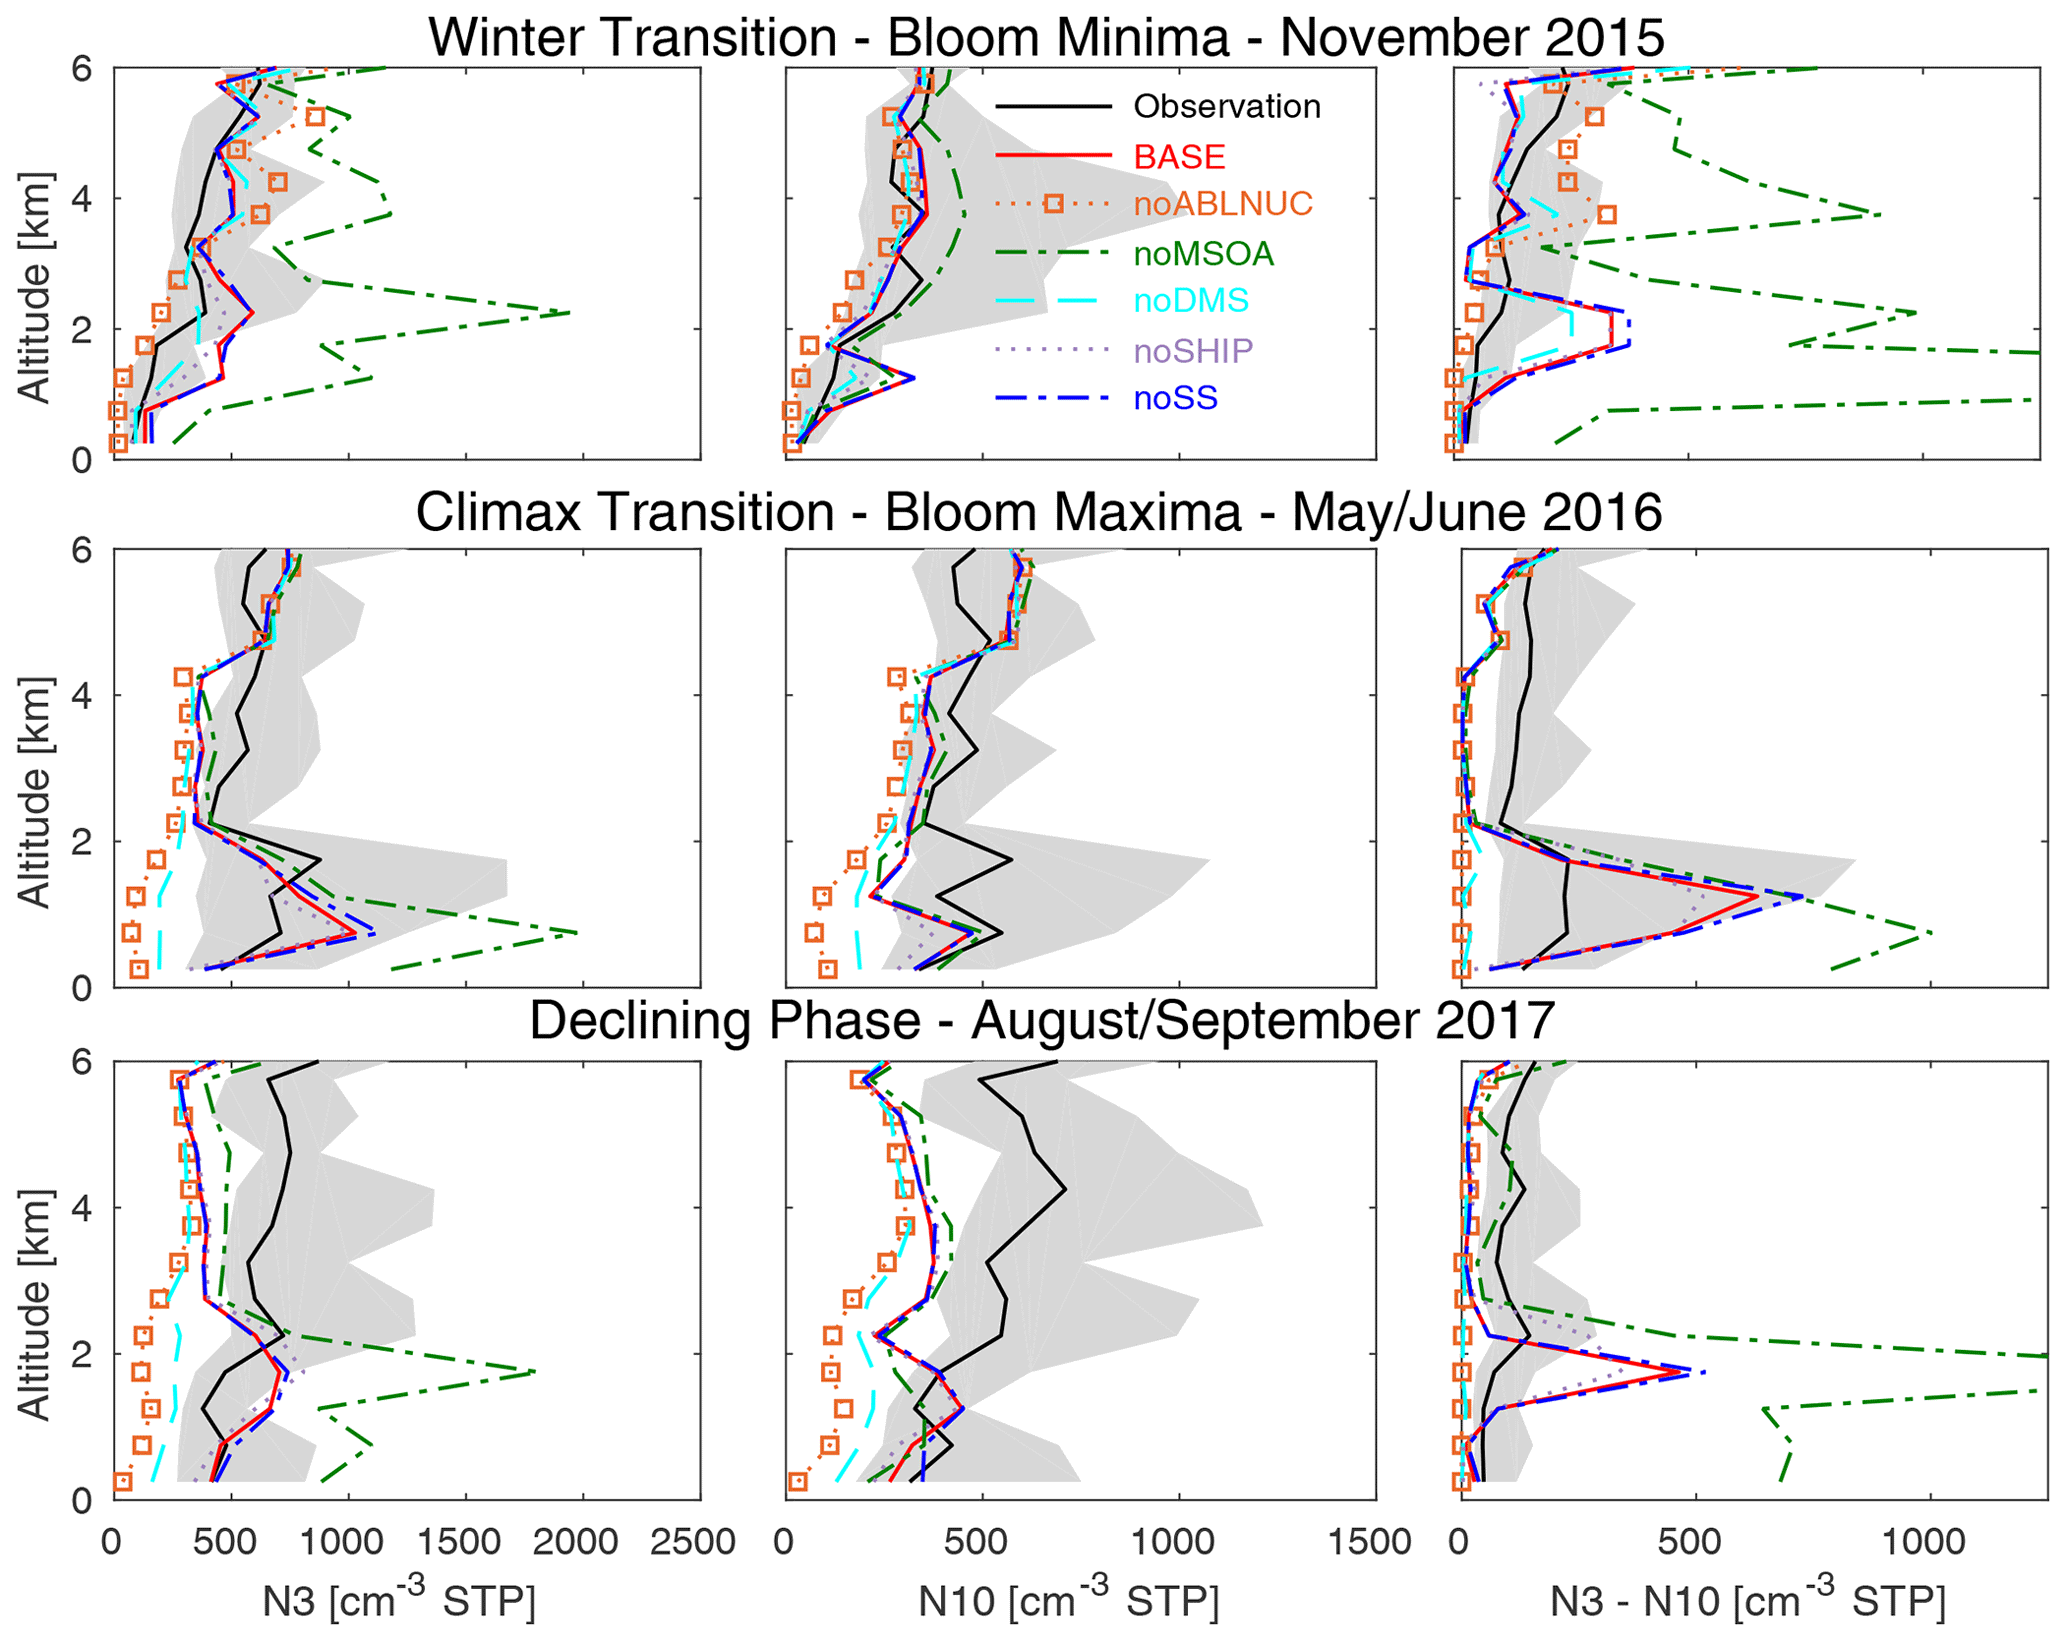
Figure 4Vertical profiles of NAAMES campaign-median total number concentrations for particles with diameters larger than 3 nm (N3), 10 nm (N10), and between 3 and 10 nm (N3–N10) from CPC observations aboard aircraft at standard temperature and pressure (STP) (black, with 25th–75th percentiles in grey) and for the six GEOS-Chem-TOMAS simulations described in Table 1 (color-coded as shown in the legend). All measurement and model output is binned at 500 m resolution, and campaign-median values are plotted at the midpoint of each bin starting at 250 m above the surface. Lines show linear interpolation between these values.
Figure 4 shows the vertical-profile campaign-median total particle number concentrations from CPCs for aerosols with diameters larger than 3 nm (N3), larger than 10 nm (N10), and the difference between the two (N3–N10). For the May/June 2016 climax transition (phytoplankton bloom maximum), there are enhancements in observed number concentration (N3, N10, and N3–N10) below about 2 km in the free troposphere, indicating NPF at these altitudes (Fig. 4). The MBL top ranged from about 0.5 to 2 km for the NAAMES cruises (Behrenfeld et al., 2019). The lower free tropospheric region near and above the MBL top is an important region for marine NPF. These altitudes above the MBL clouds are generally very clean, which favors NPF, and strongly sunlit, which favors the photochemical oxidative production of particle precursors for NPF. Previous studies based on observations from other marine regions have also found a cloud-processed ultra-clean layer with weak condensation and/or coagulation sinks at about 1 km altitude, where NPF is favored (Kazil et al., 2011; Takegawa et al., 2020). Figure 4 also shows enhancements in the observed N3 and N10 concentrations below 6 km during the declining phase and winter transition (bloom minima). However, the total number concentration enhancements below 2 km are most pronounced during the phytoplankton bloom maximum, suggesting a connection between particle number and the level of marine biogenic activity.

Figure 5Vertical profiles of NAAMES campaign-median aerosol non-refractory sulfate and organic mass concentrations at standard temperature and pressure (STP) from aerosol mass spectrometer and refractory black carbon from single particle soot photometer observations aboard aircraft (black, with 25th–75th percentiles in grey) and for the six GEOS-Chem-TOMAS simulations described in Table 1 (color-coded as shown in the legend). Simulated sulfate shown is non-sea-salt sulfate. All measurement and model output is binned at 500 m resolution, and campaign-median values are plotted at the midpoint of each bin starting at 250 m above the surface. Lines show linear interpolation between these values.
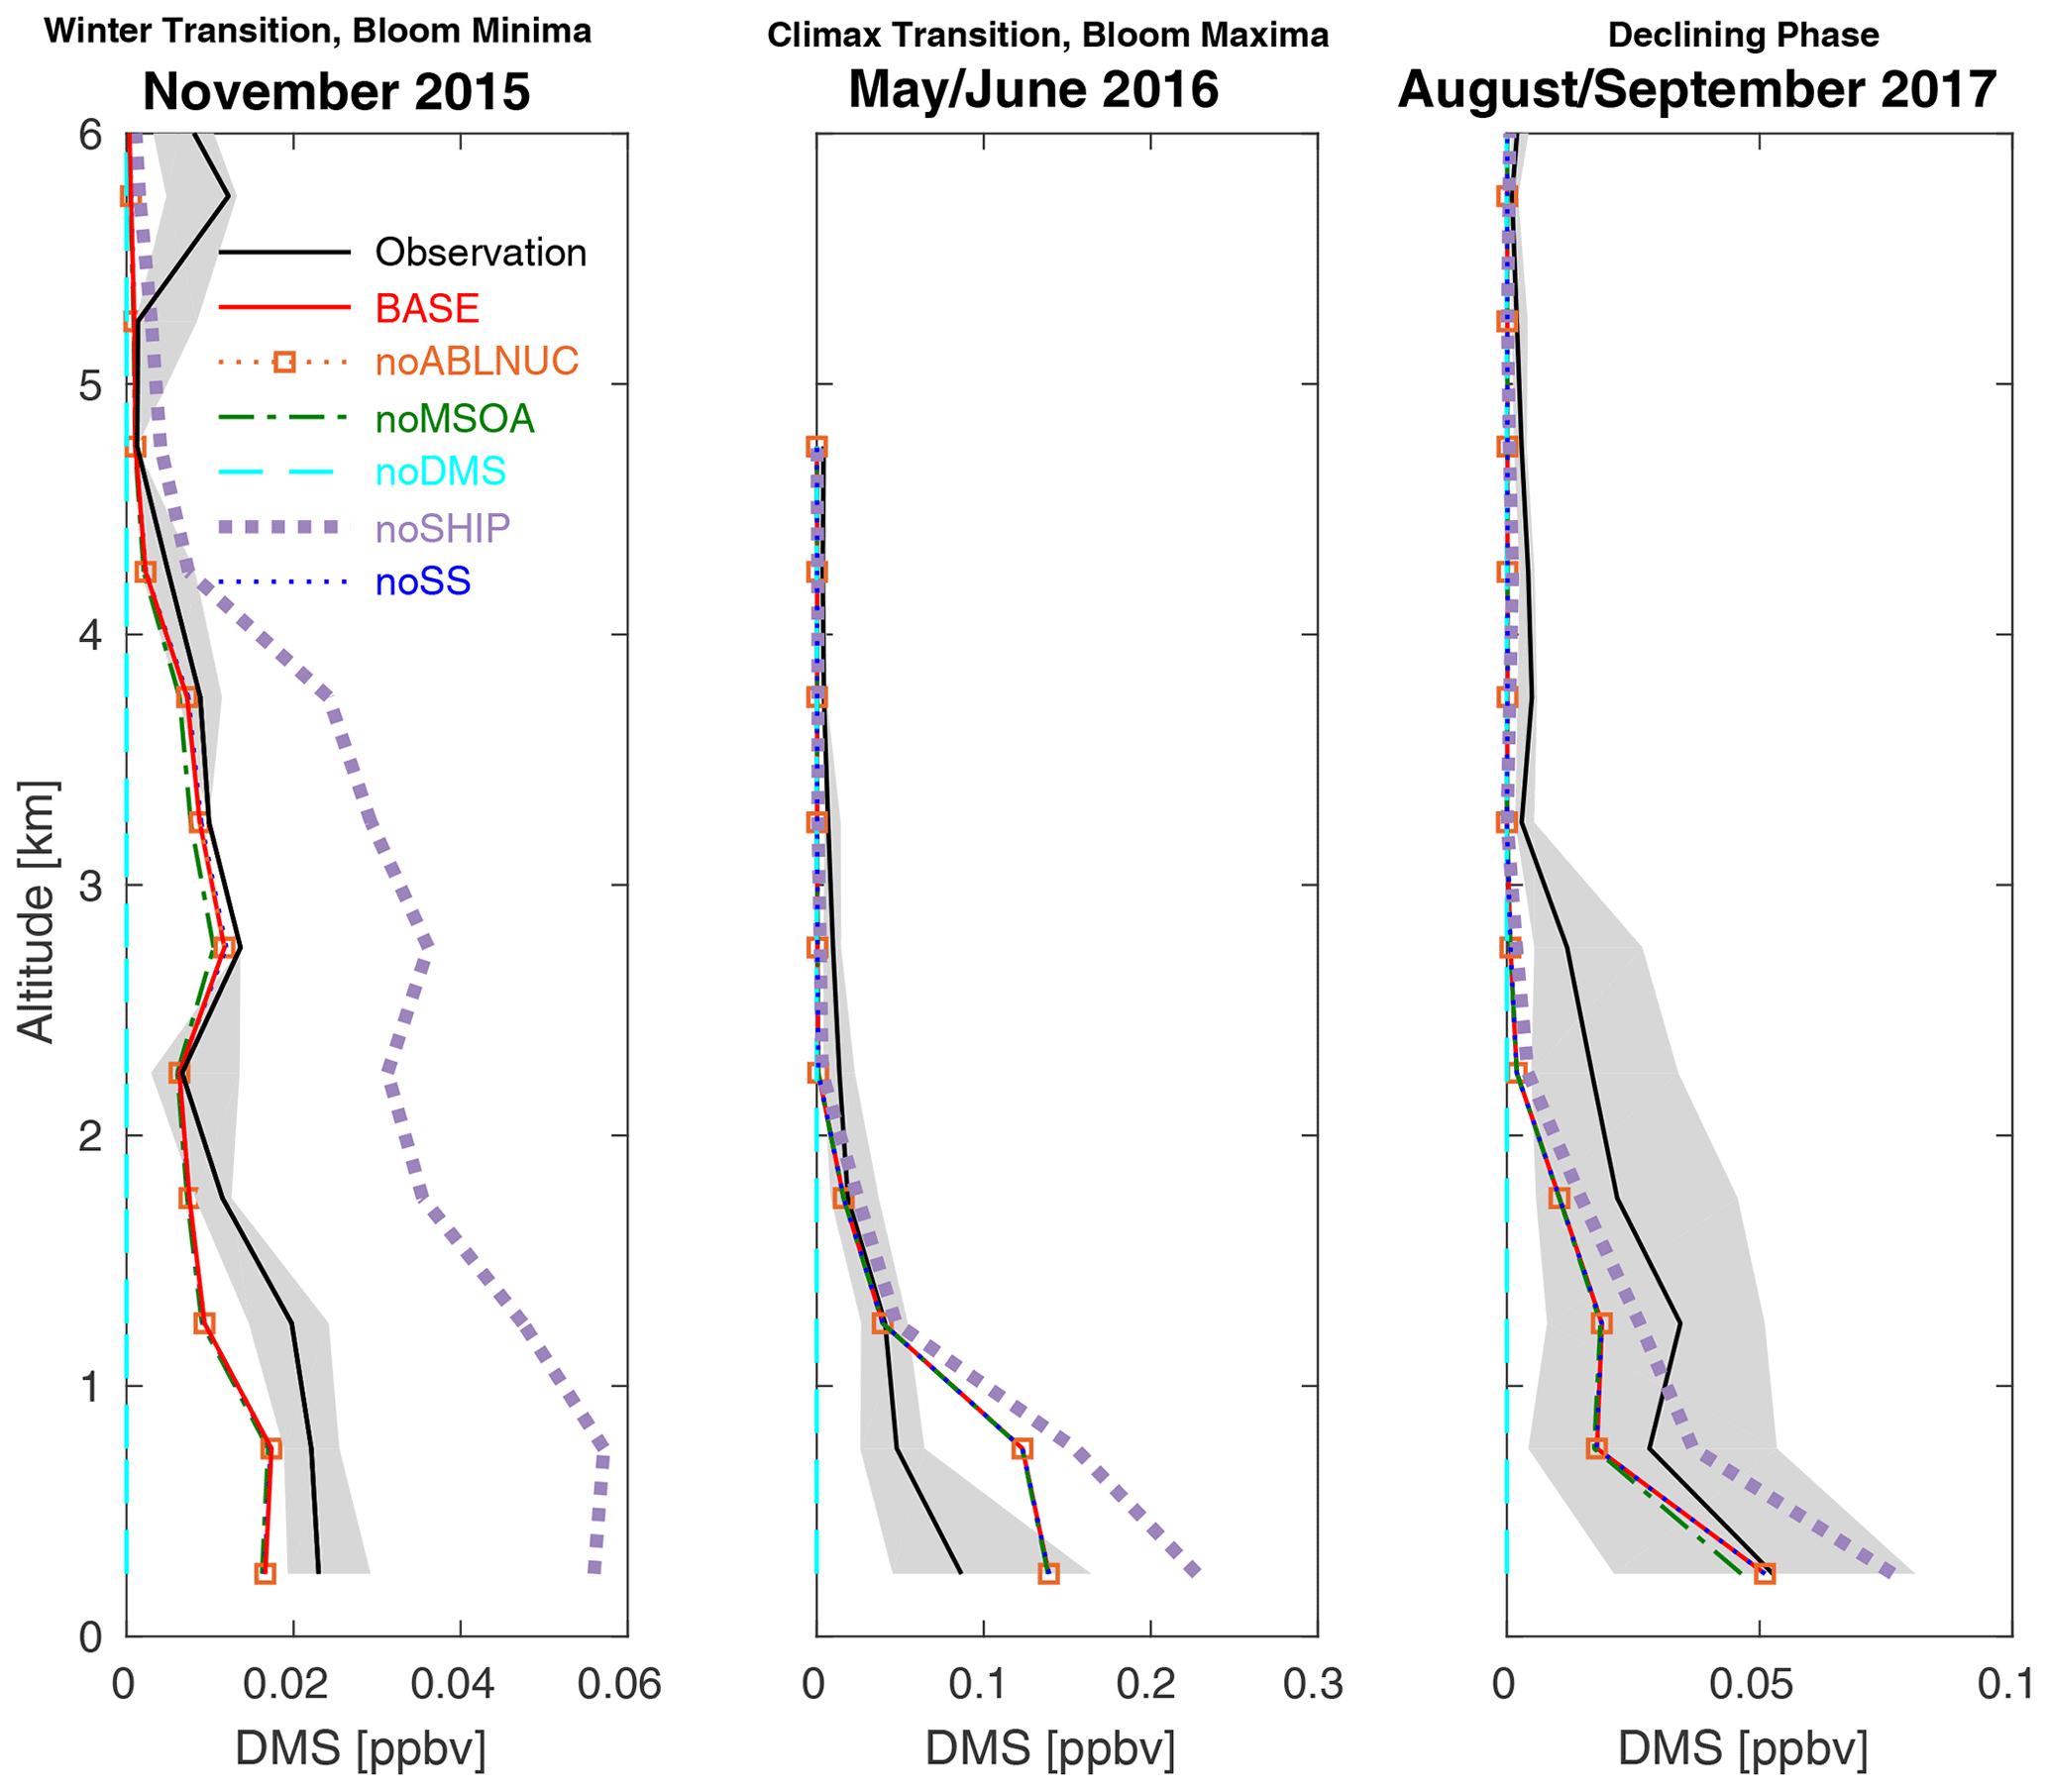
Figure 6Vertical profiles of NAAMES cruise-track campaign-median observed dimethyl sulfide (DMS) mixing ratios (black, 25th–75th percentiles in grey) from aboard aircraft and for the six GEOS-Chem-TOMAS simulations described in Table 1 (color-coded as shown in the legend). Simulations BASE, noABLNUC, noMSOA, and noSS are nearly coincident. All measurement and model output is binned at 500 m resolution, and campaign-median values are plotted at the midpoint of each bin starting at 250 m above the surface. Lines show linear interpolation between these values. Note the horizontal scale change between panels.
and OM are dominant non-refractory components of the submicron-diameter aerosols, and vertical profiles of campaign-median observations are shown in Fig. 5. During the summertime (May/June 2016 (climax transition) and August/September 2017 (declining phase)), the OM contribution exceeds that of at most altitudes up to 6 km. Non-refractory has its peak contribution during the climax transition season. This May/June phytoplankton bloom maxima period is the time of peaks observed for near-surface atmospheric DMS mixing ratios, as shown in Fig. 6. During the climax transition (bloom maxima), non-refractory concentrations increase towards the surface, suggesting a marine surface source, similar to summertime Arctic marine profile observations (Willis et al., 2017). Black carbon (BC) concentrations are also shown in Fig. 5 and have several peaks in the free troposphere in all seasons, consistent with a long-range transport source. Maximum BC concentrations are in May/June, likely associated with greater transport of anthropogenic continental pollution and biomass burning during this time relative to other seasons. Springtime has also been associated with peak BC concentrations in the Arctic due to long-range transport (Sharma et al., 2004, 2006; Fisher et al., 2010; Wang et al., 2011; Xu et al., 2017). All aerosol mass concentrations in the lowest 2 km of the atmosphere (Fig. 5) are lowest in the November 2015 winter transition, which is a time of efficient wet removal by drizzle (Browse et al., 2012; Wood et al., 2017), diminishing marine emissions due to diminishing phytoplankton biomass, and outbreaks of relatively less polluted polar air advected down the Labrador Strait (Behrenfeld et al., 2019). For the Arctic, the fall season has also been associated with a relative minimum in aerosol number concentrations (Tunved et al., 2013; Croft et al., 2016b).
The GEOS-Chem-TOMAS model (described in Sect. 2.2 and 2.3) is generally able to simulate the above-noted features of the aerosols over the northwest Atlantic. Simulation BASE captures key aspects of the MBL size distributions, including the minimum in aerosol number during the November winter transition, the weakly dominant Aitken mode during the May/June climax transition, August/September declining phase, and the maximum in number of accumulation-mode particles (diameters greater than 100 nm) during the March/April accumulation phase, despite errors such as between 20–50 nm (Fig. 2). As well, the BASE simulation captures several lower-tropospheric enhancements in particle number concentration, although the simulated altitude for the maximum is sometimes displaced and there are errors in the magnitude (Figs. 3 and 4). In the lowest 2 km of the atmosphere, , OM, and BC mass concentrations for simulation BASE are generally within the 25th to 75th measurement percentiles, except for BC and OM underpredictions in May/June 2016 and OM overprediction in November 2015. All simulated presented in this study is non-sea-salt . Simulation BASE also captures the facts that the near-surface is greatest during the May/June climax transition and the near-surface OM has its maximum value during the August/September declining phase. For each season, the mean MFE across the parameters considered in Figs. 2 to 5 (BASE vs. measurements, Table S2) is satisfactory (MFE ranges from 0.43 to 0.50). In the next four subsections, we use the GEOS-Chem-TOMAS BASE simulation, relative to a set of sensitivity simulations, to examine the potential of five key factors to shape aerosol size distributions in the northwest Atlantic during four stages of the annual cycle of marine biogenic activity.
3.2 Role of new particle formation (NPF) in the lower troposphere
Our simulations (BASE relative to noABLNUC, Fig. 4) suggest that NPF near and above the MBL has a strong control on the development of the total particle number (N3) maxima, with peak magnitude during the phytoplankton bloom maxima in layers below 2 km. Without the surrogate NPF scheme employed near and above the MBL top, the ternary NPF scheme in the MBL in simulation noABLNUC fails to simulate sufficient particle number, although vertical-profile campaign-median ammonium concentrations below 4 km altitude had acceptable agreement with observations (MFE ranges from 0.12 to 0.48, not shown). Figure 4 shows about a 1 order-of-magnitude underprediction of N3 below about 2 km for noABLNUC. noABLNUC has an unacceptable seasonal-mean model–measurement agreement across the measurement set (MFE ranges from 0.66 to 0.78, Table S2). Figure 3 also shows that NPF near and above the MBL top makes a significant contribution to simulated particle number concentrations for aerosol diameters of 10 to 282 nm in the lower troposphere, most strongly in the summertime (BASE relative to noABLNUC). There is little impact on aerosol mass concentrations for simulation noABLNUC relative to BASE (Fig. 5).
The simulated N3–N10 (Fig. 4) illustrates that representation of NPF is a challenge for models, because there are difficulties capturing the magnitude and altitudes of the N3–N10 maxima. These discrepancies reflect key knowledge gaps related to the species that can form new particles in the marine environment (e.g., Veres et al., 2020). As well, the coefficient that we used for the surrogate activation-style nucleation parameterization was derived for a continental environment. The empirical (“A”) value used by the parameterization appears to yield excessive NPF for the NAAMES marine environment. Activation-style nucleation was added in our simulations as a proxy for missing nucleation when the condensation sink is low, and conditions favor high oxidation rates. We acknowledge that this approach will miss variability in the timing and rates, because it is a surrogate and not exactly the correct mechanism. As well, in the summertime, the simulations underpredict N3–N10 concentrations above 2 km, suggesting the need for future work to better understand the NPF processes at these levels, where the binary scheme of Vehkamaki et al. (2002) does not generate sufficient NPF.
Table 2Mean fractional error (MFE) between observations and the six GEOS-Chem-TOMAS simulations described in Sect. 2.2 and Table 1 for the ship-track campaign-median aerosol size distributions shown in Fig. 2.
NPF also makes a very strong contribution to the simulated aerosol size distributions within the MBL near the ocean surface (BASE vs. noABLNUC, Fig. 2). Although our simulations do include NPF within the MBL, simulated NPF occurs more strongly near and above the MBL top and the resultant particles grow by condensation of available vapors and cloud processing while descending into the MBL. This role for NPF is in agreement with previous studies including those of Clarke et al. (2013), Quinn et al. (2017), and Williamson et al. (2019). As a result, NPF from several altitudes above the ocean surface contributes to the near-ocean-surface particles, with diameters from 20 to 200 nm. NPF does occur in the MBL. However, those levels above the MBL clouds favor oxidative chemistry that yields particle precursors, particularly from the widespread and persistent DMS sources in the marine environment (Kazil et al., 2011). Table 2 shows that for all seasons, the surrogate nucleation (simulation BASE, MFEs ranging from 0.04 to 0.33) represents an improvement over simulation noABLNUC (without this surrogate NPF parameterization, MFEs ranging from 0.50 to 0.95).
Extending the surrogate activation-style parameterization to the surface (Figs. S5–S8 and Table S3) leads to overprediction of the number of particles with diameters less than 50 nm in the MBL and yields higher MFEs (ranging from 0.20 to 0.56) than for simulation BASE, although the errors were not as large as those for noABLNUC. For the vertical profiles, this extra NPF extended into the MBL yields overprediction of N3, N10, and N3–N10 below 1 km in all seasons. Aerosol surface area and volume (in the SMPS particle-diameter size range of 10–282 nm) were also overpredicted during the August/September declining phase, when the simulated temperature-dependent MSOA source was strongest, growing these extra new particles to larger sizes. These challenges highlight the relevance of ongoing research to better understand NPF in the marine environment.
3.3 Role of particle growth by condensing marine organic vapors
Condensing marine organic vapors forming MSOA are needed in our simulations (in addition to H2SO4) for sufficient particle growth to yield satisfactory model–measurement agreement for MBL size distributions (BASE vs. noMSOA, Fig. 2). For simulation noMSOA, the model overpredicts the number of particles with diameters smaller than about 30 nm in the MBL. Due to insufficient particle growth of these sub-30 nm particles, the number of particles with diameters between about 30 and 200 nm is underpredicted by more than 50 % for simulation noMSOA.
In our simulations, MSOA enables particle growth to CCN sizes (diameters of about 50 nm or larger). After particles reach CCN sizes, cloud processing can also contribute to simulated particle growth towards accumulation-mode particles (diameters of 100–1000 nm) due to aqueous-phase aerosol production. Other cloud processes include coagulation of cloud droplets with each other and with interstitial aerosols (Hoose et al., 2008; Pierce et al., 2015). Our simulations include the latter and aqueous-phase sulfate production. As clouds evaporate, cloud processing leads to development of the “Hoppel minima” of the MBL aerosol size distributions (Hoppel et al., 1986), which is the minimum aerosol diameter that activates to form a cloud droplet (about 50–70 nm for the observations in Fig. 2). This minimum diameter is smallest in the winter transition (November 2015), suggesting that smaller particles activated under the clean condition of this season relative to the other seasons. As shown by Table 2, simulation noMSOA has an unacceptable annual-mean MFE of 0.63, larger than the MFE of 0.21 for simulation BASE, which includes particle growth due to MSOA.
The nature and flux of marine vapors forming MSOA are not well understood. As a result, we developed a simplistic MSOA parameterization for use in this study, such that the MSOA precursors vapor emissions are an increasing function of temperature. This approach yields a seasonal cycle and is in agreement with the temperature dependence trend found by previous studies, including Meskhidze et al. (2015), Rodríguez-Ros et al. (2020a), and Rodríguez-Ros et al. (2020b). We find that the simulated NAAMES cruise-track median aerosol size distributions are sensitive to the coefficients used in the parameterization (SMSOA = 70T − 350 ) (Figs. S1 and Table S1). For example, varying the temperature sensitivity between 50–100 and the intercept between 300–500 changes the simulated number concentration of particles with diameters larger than 50 nm in the MBL by up to a factor of 2, with the greatest sensitivity during the summertime (Fig. S1). For the NAAMES MBL size distributions, the annual-mean model–measurement MFEs are acceptable (ranging from 0.23–0.38, lowest for BASE) for all temperature-dependent parameterizations that we tested, except for the factor of 10 scaling up of the BASE MSOA parameterization (simulation 10 × (70T−350), Table S1, MFE of 0.75) and with the MSOA parameterization removed (simulation noMSOA, Table S1, MFE of 0.63). While this source flux is reasonably constrained for our simulations, future work is needed to better understand and parameterize this source.
The vertical profiles are also sensitive to the MSOA parameterization (Figs. S2–4). Between noMSOA and the various MSOA parameterizations that we tested, concentrations vary by up to a factor of about 2 for aerosol number (N3, N10, and N3–N10), SMPS-size-range (diameters 10–282 nm) number, surface area, volume, and also OM. Simulation noMSOA has relatively greater error in the mean across the entire measurement set for each season (MFE ranges from 0.53–0.68) relative to BASE (MFE ranges from 0.42–0.50) (Table S2).
Although the chosen MSOA parameterization reasonably represents the observations, major knowledge gaps remain regarding MSOA precursor species and their chemical lifetimes. While the nature of MSOA precursors is not well-understood, recent measurements suggest that these precursors could include a variety of chemical compounds. For example, measurements from the Arctic indicate that the organics in marine aerosols were not typical biogenic SOAs but had a long hydrocarbon chain, implying a fatty-acid-type precursor (Willis et al., 2017). In other marine regions, isoprene (Ciuraru et al., 2015) and carboxylic acids (Chiu et al., 2017) may also be important. Given the limitations of current knowledge and the indications for a variety of MSOA precursors, the improved MFEs for BASE relative to noMSOA provide support for the employed MSOA parameterization.
The near-surface campaign-median climax transition and declining phase OM concentrations are within the 25th to 75th measurement percentiles for simulation BASE and below the 25th percentile of the observations for simulation noMSOA (Fig. 5). On average over the lowest 2 km of the atmosphere during the May/June climax transition and August/September declining phase, simulation BASE relative to noMSOA indicates that MSOA contributes about 200–400 ng m−3 to simulated OM. Saliba et al. (2020) suggest that MBL measurement of non-refractory OM during NAAMES clean marine periods provides a good estimate of MSOA. Their seasonal-average non-refractory OM value of about 300–400 ng m−3 for the May/June 2016 climax transition (phytoplankton bloom maxima) and August/September 2017 declining phase is similar to our model result. This contribution is about three- to fourfold greater than the contribution upwards of 100 ng m−3 from previous studies, noted in Kim et al. (2017). The model–measurement agreement for OM for 2017 is influenced by significant biomass burning with high-altitude emission injections during this time (Zheng et al., 2020b; Saliba et al., 2020). Errors in the simulated emissions due to use of a GFED climatological-year emissions and injection-height errors could account for some of the model–measurement bias at high altitudes. As well, despite our implementation of a filter to remove measurement and model samples with strong in-plume aerosol enhancements during times of high acetonitrile concentrations, some biomass burning influence still affects the presented vertical profiles. Below 500 m altitude, condensing organic vapors yielding MSOA also increase the simulated aerosol surface area and volume by a factor of about 2–3 in all seasons (noMSOA vs. BASE, Fig. 3), to be slightly over the 75th percentile of the observations (Fig. 3). Surface area and volume results from the simulation are very sensitive to the size-distribution simulation near the 282 nm diameter cut-off that contributes to differences between these simulations.
Figure 4 demonstrates that MSOA has a feedback on NPF. With lower aerosol surface area and lower condensation sink (noMSOA), the N3 and N3–N10 sizes below 2 km altitude are strongly overpredicted, because NPF increases and a lack of growth to larger sizes impacts N3–N10. During November, the N3 and N3–N10 overprediction also occurs at altitudes above 2 km, because MSOA has a relatively greater influence on aerosol surface area at those altitudes in this season (Fig. 3). In this less-polluted late fall season, the influence of MSOA is relatively stronger at higher altitudes than in other seasons. Model–measurement agreement improves for N3 and N3–N10 with the addition of MSOA (simulation BASE relative to noMSOA, Fig. 4). Kazil et al. (2011) also found that condensing vapors generate a condensation sink that moderates the level of NPF in the marine environment. As well, recent studies from the Arctic indicate a key contribution to particles from condensing marine organic vapors (Burkart et al., 2017a; Willis et al., 2017; Croft et al., 2019). The impact of MSOA on the simulated N10 vertical profiles is small. The cloud filtering, which we applied to the model and measurement aerosol samples along the flight track, preferentially removes some of the cloud-processed samples and contributes to this result.
3.4 Role of DMS
Figure 2 shows that DMS also has a control on the simulated MBL aerosol size distributions (BASE vs. noDMS) for the four seasons of the NAAMES campaigns. The total simulated number of particles attributed to DMS is lowest during the phytoplankton bloom minima (winter, November 2015) and greater in other seasons. For example, for particle diameters at 40 nm, the DMS-related contribution to the size distribution (Fig. 2) is about 200–300 cm−3 in all seasons, except less than 50 cm−3 during the bloom minima. Sulfuric acid from the oxidation of DMS has a twofold role in both NPF and in growing particles. However, as indicated by simulations noABLNUC and noMSOA relative to BASE (Fig. 2), the DMS contribution is in concert with both (1) a source of condensable marine organic vapors and (2) NPF near and above the MBL top. The contribution of DMS to MBL particles is consistent with the findings of many previous studies, including Chang et al. (2011), Ghahremaninezhad et al. (2016), Park et al. (2018), Sanchez et al. (2018), Mahmood et al. (2019), Quinn et al. (2019), and Veres et al. (2020).
Simulation noABLNUC relative to noDMS for the marine-influenced MBL size distributions (Fig. 2) suggests that anthropogenic influences make a contribution as a source of particle-precursor vapors for NPF, in addition to DMS. This relative contribution is particularly strong during the accumulation phase (March/April 2018). In our simulations, anthropogenic SO2 is oxidized to H2SO4 and contributes to the particle precursors for NPF near and above the MBL top (in addition to DMS oxidation products), followed by particle growth on descent into the MBL. As a result, Fig. 2 shows a greater underprediction of aerosol number for simulation noABLNUC vs. noDMS.
Figure 6 indicates that the simulated DMS is generally consistent (MFEs ranging from 0.12 to 0.26, Table S2) with the observed DMS mixing ratio vertical profiles and their seasonal cycle for the NAAMES campaigns. DMS makes the strongest contribution to simulated sulfate mass concentrations in the lowest 2 km during the May/June climax transition, reducing model–measurement bias from about 40 % to 10 % (Fig. 5). Figures 3 and 4 suggest that in the lowest 2 km of the atmosphere, DMS contributes to both NPF and particle growth as there are increases in N3, N10, N3–N10, and particle surface area and volume for simulations BASE vs. noDMS. However, this behavior is co-dependent on conditions favorable to NPF near the MBL top and a source of MSOA.
3.5 Role of ship traffic emissions
Ship emissions are a source of primary and secondary particles, as well as a control on oxidants (Corbett et al., 2010; Vinken et al., 2011; Holmes et al., 2014). Our simulations suggest that ship emissions are also a control on the NAAMES-region MBL marine-influenced aerosol size distributions (Fig. 2, noSHIPS vs. BASE). For example, for the simulated summertime MBL size distribution at particle diameters at 40 nm, about 100–200 particles cm−3 are attributed to ship emissions (Fig. 2). Table 2 shows that during the phytoplankton bloom and March/April accumulating phase, the noSHIPS simulation agrees more closely with the measurements than the BASE simulation, although both are within acceptable agreement (MFE < 0.5). These simulation challenges highlight the importance of future work to better understand the role of oxidants from ship emissions on particle production in the marine environment and to understand the size distribution of primary marine emissions.
Ship emissions make up about a 50 % contribution to the simulated sulfate campaign-median near-surface mass concentration in vertical profiles over the NAAMES study region (Fig. 5). For our simulations the impact of ship emissions on particle number is mostly limited to the lowest 2 km. Simulation BASE relative to noSHIPS suggests that about 10 % of the N10 in the lowest 500 m of the atmosphere is attributed to ship emissions (Fig. 4). Figure 4 (right column) indicates that among the five factors considered by our sensitivity studies, ship emissions are among the smallest influence on the NPF. Major transatlantic ship traffic routes (Corbett et al., 2007) are included in the NAAMES study region. Enhancements in observed benzene mixing ratios in the MBL relative to other long-lived tracers of anthropogenic emissions such as acetone (not associated with ship traffic) are observational evidence that ship emissions influence the study region (Fig. S9).
Figure 6 demonstrates that atmospheric DMS mixing ratios are also sensitive to ship emissions. This effect occurs because ship emissions are a control on oxidants in the MBL and enhance OH and NO3, which are chemical sinks of DMS. As a result, simulated DMS mixing ratios increase when ship emissions are removed. As ship traffic is expected to change in future years with changes to routes and regulations (Gilgen et al., 2018; Bilsback et al., 2020), the relative importance of ship emissions in the North Atlantic MBL will likely change.
3.6 Role of sea spray
Figure 2 shows that simulated sea spray acts as a condensation sink in the MBL. Without sea spray emissions, there is an increase in the number of sub-200 nm diameter particles (simulation noSS relative to BASE). However, this relative increase in simulated number is less than that attributed to other factors considered in the previous sections. While not a strong contributor to particle number in our simulations, sea spray is the dominant contributor to aerosol mass.
The simulated campaign-median MBL sea spray mass concentrations are within the measurement range of 3–8 µg m−3 found by Saliba et al. (2019) (Fig. S10), despite the considerable uncertainties related to size-resolved sea spray emissions (e.g., Bian et al., 2019; Regayre et al., 2020). Regayre et al. (2020) found that global sea spray emissions could be underpredicted by a factor of 3 by the Gong (2003) parameterization. We conducted a simulation with a factor of 3 scaling of the sea spray emissions (Figs. S11–S14, Table S4) and found a decrease in MBL number concentrations rather than an increase. This reduction occurred because the enhanced condensation sink from the additional sea spray emissions suppressed NPF. Our simulations use the Gong (2003) parameterization with a sea-surface-temperature-based scaling as described by Jaeglé et al. (2011), so they are not directly comparable to the Regayre et al. (2020) findings. Nonetheless, these findings highlight the importance of ongoing work to improve size-resolved sea spray emission parameterizations in models. The direct radiative effect of this sea spray mass loading is examined in the following section.
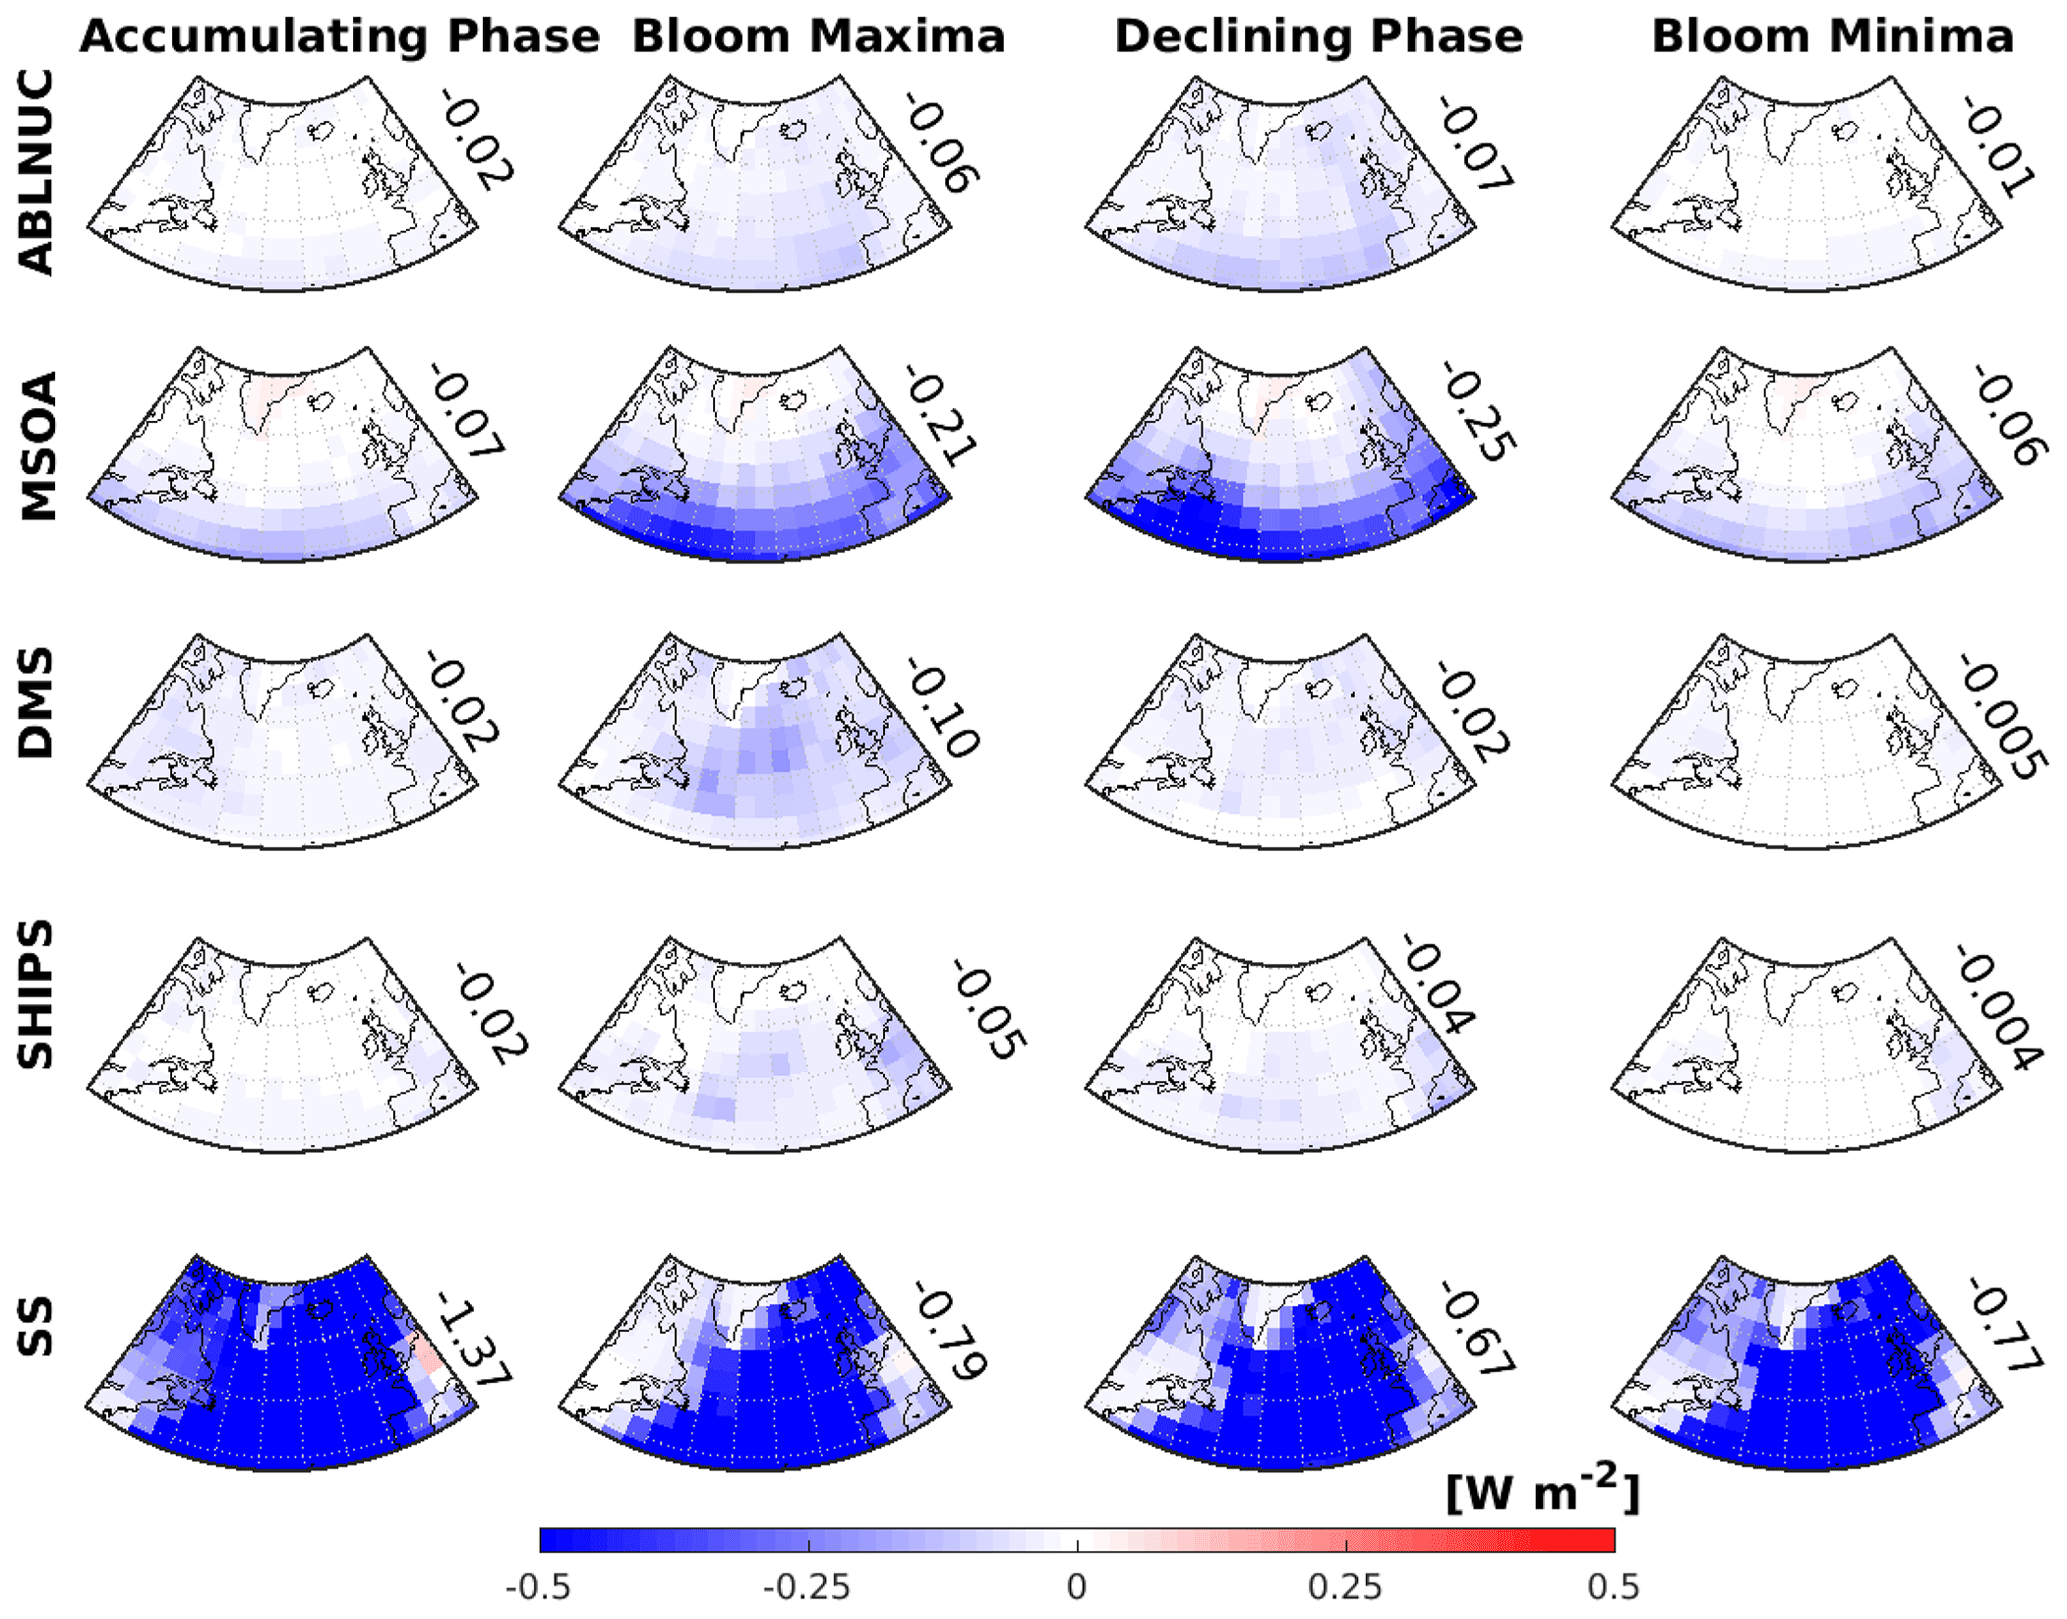
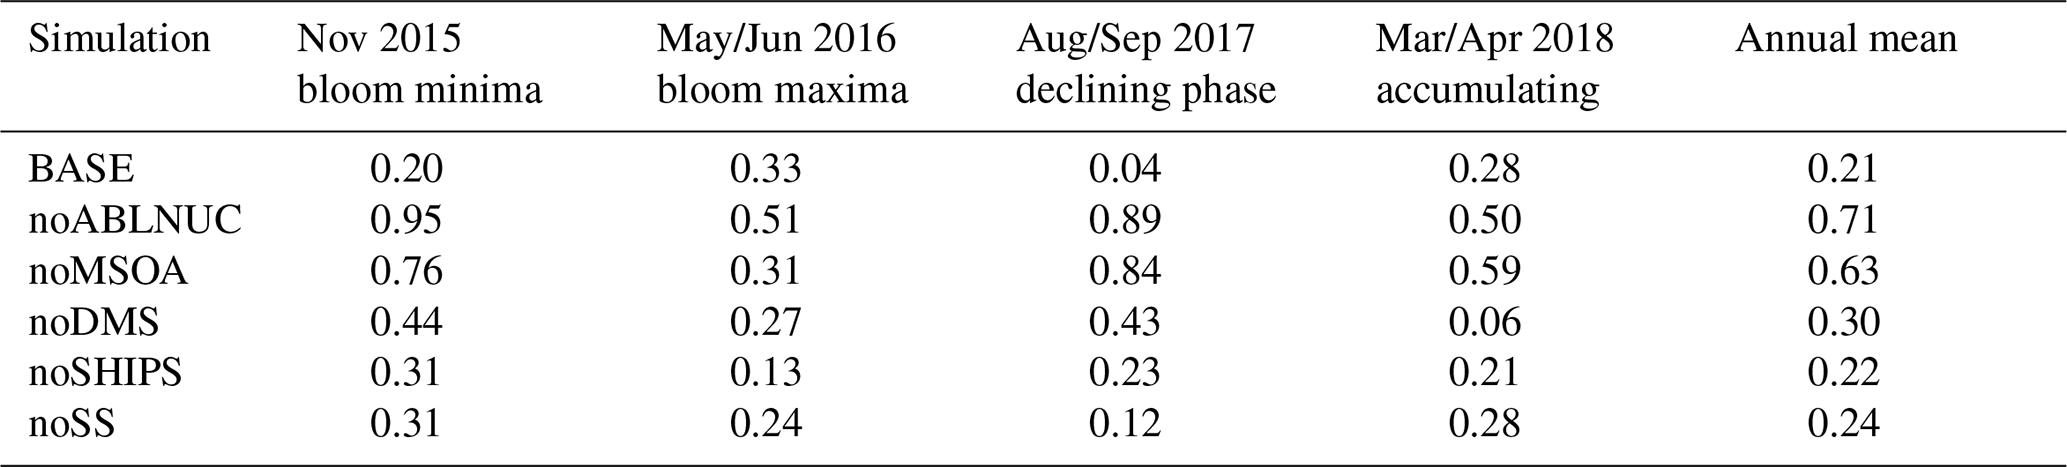
Figure 7GEOS-Chem-TOMAS-simulated 2-month-mean aerosol direct radiative effect (DRE) attributed to five key factors. Top row: above-boundary-layer particle nucleation (ABLNUC); second row: particle growth by marine secondary organic aerosol (MSOA); third row: particle formation and growth due to DMS-oxidation products (DMS); fourth row: shipping emissions contribution to particles (SHIPS); and bottom row: sea spray (SS). DREs are in columns for the following time periods, March/April 2018 (accumulating phase), May/June 2016 (climax transition, bloom maxima), August/September 2017 (declining phase), and October/November 2015 (winter transition, bloom minima). DREs for ABLNUC, MSOA, DMS, SHIPS, and SS are calculated using the differences in the top-of-the-atmosphere solar flux between simulation BASE and respective sensitivity simulations (noABLNUC, noMSOA, noDMS, noSHIPS, noSS). Values shown are area-weighted-mean DREs over the region bounded by 40–60∘ N and 20–50∘ W.
3.7 Radiative effects attributed to NPF near MBL top, MSOA, DMS, and ship emissions
Figure 7 shows the simulated 2-month mean direct radiative effect (DRE) attributed to the five factors we consider: (1) NPF near and above the MBL top, (2) MSOA, (3) DMS, (4) ship emissions, and (5) primary sea spray emissions and magnitude of the regional-mean DREs over a region of the North Atlantic (40–60∘ N and 20–50∘ W). We note that the radiative effects attributed to the separate factors are not linearly additive, because the factors impact each other nonlinearly. For example, turning off either MSOA or nucleation above the boundary layer would shutdown the majority of the production of accumulation-mode particles in the MBL (Fig. 2) since these particles require both nucleation and growth. Hence, adding the radiative effects from these two factors would result in double counting some radiative effects. Figure 7 indicates that the strongest calculated DRE is attributed to sea spray, which dominates the aerosol mass loading in the MBL. The sea spray DRE has a maximum during the March/April 2018 accumulating phase, which is a time of frequent synoptic-scale storms with strong winds. Stormy conditions prevented the R/V Atlantis from traveling north of 45∘ N during this final NAAMES campaign.
The strongest DRE values attributed to the above-boundary-layer NPF, MSOA, DMS, and ship emission factors are during the summer season (climax transition (bloom maxima) and declining phase). This result highlights the link between the level of marine biogenic activity and aerosol climate effects. The second strongest individual DRE is attributed to condensing marine organic vapors, yielding MSOA. In our simulations, MSOA contributes significantly to particle growth to diameters of about 100 to 200 nm and larger, which can then interact directly with radiation (Fig. 2). This effect is greatest in the declining phase, because we used a temperature-dependent parameterization and sea surface temperatures are warmest during the late summer. The DRE geographic distribution suggests an increasing role for MSOA towards southern latitudes, again due to the temperature-dependent parameterization. Further work is needed to examine the role of MSOA in the more southerly latitudes as we cannot explicitly test this result across the annual cycle with the NAAMES observations.
Among the factors considered, Fig. 7 shows that during the time of the May/June phytoplankton bloom, the aerosols produced and grown by the oxidation products of DMS have the third strongest impact on the DRE, greatest over the regions where the bloom is located. The DRE is −0.10 W m−2 over the region between 40–60∘ N and 20–50∘ W during the bloom maxima and diminishes to −0.005 W m−2 during the bloom minima. This simulated impact of DMS relies in part on (1) conditions favoring NPF processes near and above the MBL top and (2) growth by MSOA as the nascent DMS-related particles descend in the MBL. DMS (similar to MSOA) also contributes to the DRE over the continents as these vapors have a lifetime of about a day in our simulations and can be transported before their oxidation products are available for condensation. Once available for condensation, DMS products and MSOA contribute to growing particles (of both marine and continental origin) to sizes that can interact more strongly with radiation. Particles arising from DMS grow during transport, and some particles may only reach sizes large enough to interact with radiation when they are over the continents.
The DRE attributed to the NPF factor near and above the MBL top (Fig. 7, top row, ABLNUC) is strongest in summertime, during the May/June climax transition (bloom maxima) and August/September declining phase. Summertime is the season of the greatest photochemical production of particle precursors for NPF. In order to contribute to the DRE, this NPF factor acts in synergy with the other factors, particularly DMS as a source of particle precursors and MSOA for particle growth, such that during the May/June climax transition season the DREs for those factors dominate over the NPF factor (ABLNUC, Fig. 7).
The DREs for ship emissions have a similar geographic distribution as those for DMS. In these regions, major international ship traffic routes are coincident with regions of higher biogenic activity, enabling an interaction of biogenic and anthropogenic emissions. Ships enhance oxidant levels, which promote formation of biogenic aerosol precursors such as sulfuric acid and MSA that arise from oxidation of DMS. Condensing vapors of marine origin (such as DMS products and MSOA precursors) can also help to grow particles arising from ship emissions to sizes large enough to interact directly with radiation. As a result, the largest DRE attributed to ship emissions is during the phytoplankton bloom maxima. Figure 7 also suggests that ship emissions could contribute to the DRE over the continents. This effect occurs because ship emissions include particle precursors, oxidants, and primary particles that are transported and interact with continental pollution to form and grow particles to sizes that can interact with radiation over the continents as well as over the oceans. Figure 6 shows that there is a ship-emission-related control on atmospheric DMS mixing ratios, which increase when the ship-source oxidants are removed.
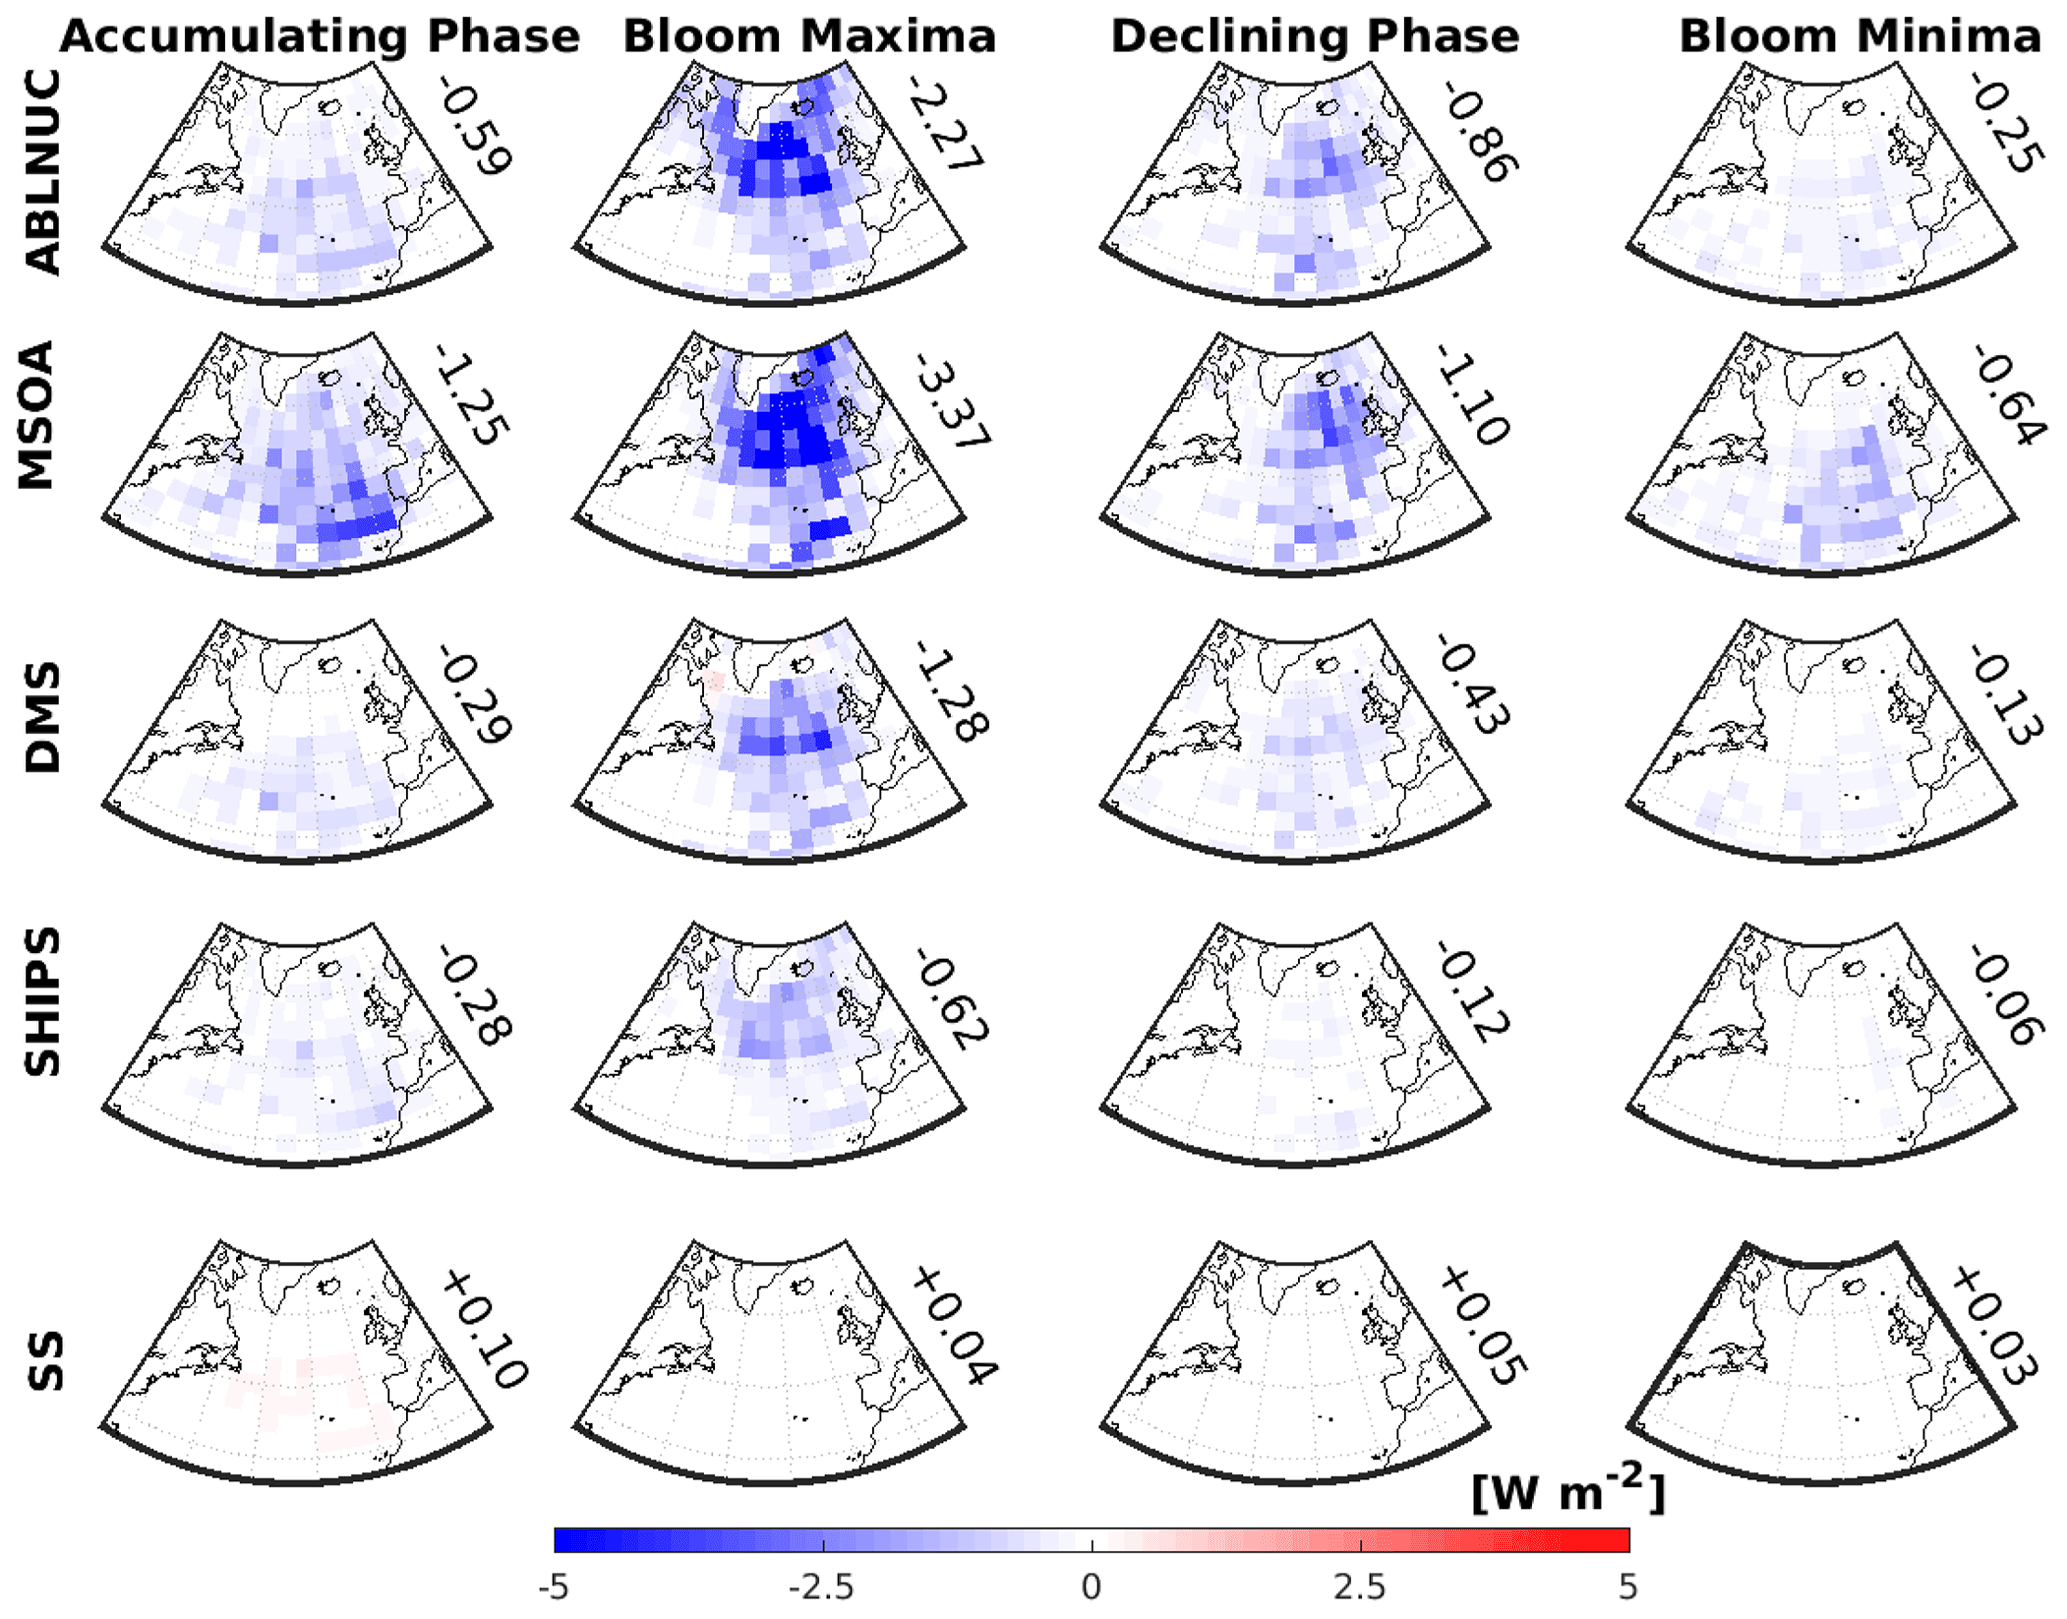
Figure 8GEOS-Chem-TOMAS-simulated 2-month-mean cloud-albedo aerosol indirect effect (AIE) attributed to five key factors. Top row: above-boundary-layer particle nucleation (ABLNUC); second row: particle growth by marine secondary organic aerosol (MSOA); third row: particle formation and growth due to DMS-oxidation products (DMS); fourth row: shipping emissions contribution to particles (SHIPS); and bottom row: sea spray (SS). AIEs are in columns for the following time periods, March/April 2018 (Accumulating Phase), May/June 2016 (Climax Transition, Bloom Maxima), August/September 2017 (Declining Phase), and October/November 2015 (Winter Transition, Bloom Minima). AIEs for ABLNUC, MSOA, DMS, SHIPS, and SS are calculated using the differences in the top-of-the-atmosphere solar flux between simulation BASE and respective sensitivity simulations (noABLNUC, noMSOA, noDMS, noSHIPS, noSS). Values shown are area-weighted-mean AIEs over the region bounded by 40–60∘ N and 20–50∘ W.
Figure 8 shows the calculated 2-month-mean cloud-albedo aerosol indirect effect (AIE) attributed to each of the same five factors that we considered for the DREs. The AIEs are about an order-of-magnitude larger than the calculated DRE for each respective factor with the exception of sea spray. The AIE is strongly controlled by changes to highly reflective MBL clouds, which are in turn very sensitive to the aerosol number concentrations (diameters larger than about 50 to 70 nm that can act as CCN), which are controlled by the MBL-related factors examined here. On the other hand, the DRE is relatively more sensitive to aerosol abundance in mid-tropospheric layers, which are less influenced by the considered processes.
The strongest simulated AIEs for all considered factors are during the May/June climax transition (Fig. 8). There is a strong synergy among all factors that reach their maxima during May/June when the effective combination of sources, photochemistry, and particle production and growth processes peak. As well, during summertime, the magnitude of the AIE for all factors is greater in the more northward regions of the North Atlantic relative to more southerly latitudes. These more northerly regions are less influenced by continental pollution and have lower CCN concentrations, coupled with persistent low cloud cover. These conditions make these regions quite sensitive to the factors controlling MBL aerosol size distributions studied here.
In all seasons, we calculated a stronger AIE related to (1) NPF near and above the MBL top (ABLNUC, top row, Fig. 8) and (2) MSOA (contributor to particle growth) than to (3) DMS (4) ship emissions or (5) sea spray emissions. In our simulations, the major source of CCN-sized particles in the North Atlantic MBL during the summer is particle nucleation near and above the MBL top with growth by MSOA. Without either of these factors, the number concentration of CCN-sized particles in the simulations drops dramatically (Fig. 2). Hence, it is unsurprising that the largest simulated AIEs are due to these two factors during the summertime (climate transition and declining phase). The stronger AIEs attributed to NPF near and above the MBL top (Fig. 8, top row, ABLNUC) relative to DMS and ship emissions indicate that NPF near and above the MBL in our simulations is controlled not only by the sulfuric acid from the oxidation of DMS or ship SO2 but also from other sources, including SO2 transported from continental sources. However, the maximum North Atlantic regional-mean AIE attributed to ship emissions (−0.62 W m−2 for the May/June climax transition) still exceeds the global mean effect of −0.155 W m−2 attributed to international shipping calculated by Jin et al. (2018), showing the strong location dependence and seasonality of this factor. Ship emissions enhance the oxidation rate of DMS, such that the largest AIE attributed to ships occurs during the phytoplankton bloom due to increased particle formation and growth during this season.
In our simulations, sea spray has a lower contribution to aerosol number concentrations, among the factors considered, and as a result has the smallest AIEs. However, recent studies have pointed out that there are knowledge gaps related to the sea spray emission parameterizations (e.g., Bian et al., 2019; Regayrre et al., 2020). Future work is needed to gain confidence in the magnitude of the AIE attributed to sea spray.
We caution that both the DRE and AIE calculations represent a relative contribution of the considered factors to climate effects in the North Atlantic. However, further work is needed to gain confidence in the absolute magnitudes. The activation-style nucleation, which we used as a proxy for the unknown nucleation mechanisms above the marine boundary layer, contributes uncertainty to the climate effects of this nucleation. There is much more work that needs to be done regarding the role of MSOA in this system. Certainly, if MSOA is contributing directly to NPF, it would increase MSOA's climatic importance. However, we have little knowledge of the MSOA precursor species, their chemical lifetimes, or their role in NPF, so we did not explore these dimensions in the study. Like the DRE estimates, the separate AIEs are not linearly additive. Other aerosol indirect effects related to changes in cloud lifetime and precipitation are the subject of future work. In summary, these calculated DREs and AIEs suggest that aerosol–climate impacts for North Atlantic regions are controlled by a combination of strong biogenic and anthropogenic influences and that the nucleation near and above the MBL top contributes to important radiative effects.
In this study, we examined aerosol size distribution and composition measurements from the NAAMES campaigns. These ship and aircraft campaigns took place over four separate stages of the annual cycle of marine biogenic activity in the northwest Atlantic during 2015–2018. We used the GEOS-Chem-TOMAS model with size-resolved aerosol microphysics to interpret these NAAMES measurements. Observations in layers of the lower troposphere below 6 km showed enhancements in the campaign-median number concentration of particles with diameters between 3–10 nm. These enhancements indicated new particle formation and were most pronounced during the May/June 2016 climax transition (phytoplankton bloom maxima) in the lowest 2 km of atmosphere, particularly near and just above the boundary-layer top. This lower tropospheric region near and above the MBL top is a key region for marine NPF. This zone above the MBL clouds is generally very clean, which favors NPF, and strongly sunlit, which favors the photochemical oxidative production of particle precursors for NPF. The November 2015 winter transition (phytoplankton bloom minima) was characterized by the lowest particle number concentrations. During the summer months, OM, followed by sulfate mass concentrations, made strong contributions to the total aerosol loading in the lowest 2 km. However, sea spray dominated the MBL aerosol mass loading. Peak near-surface sulfate concentrations occurred in May/June during the phytoplankton bloom, whereas peak near-surface OM concentrations were in August/September. Campaign-median MBL aerosol size distributions were dominated by Aitken-mode particles (diameters 10–100 nm) during the summertime (May/June climax transition and August/September declining phase). The larger accumulation-mode particles were dominant in the November winter transition and March/April accumulation phase.
Our simulations suggested that a synergy of key factors contributed to northwest Atlantic MBL aerosol size distributions, including (1) new particle formation near and above the MBL top; (2) growth of the newly formed particles by condensation of marine organic vapors, forming marine secondary organic aerosol (MSOA), which yields more abundant CCN-sized particles that descend into the MBL while continuing to grow and being subject to cloud processing (e.g., aqueous-phase aerosol production, which does not add to particle number); (3) DMS-oxidation products that contribute to particle formation and growth; (4) ship emissions, which are a source of primary and secondary particles and also contribute to atmospheric oxidants; and (5) sea spray emissions, which also provide a condensation sink that suppresses particle formation. These findings are in agreement with previous observational-based studies for the North Atlantic region (e.g., Sanchez et al., 2018; Zheng et al., 2020a).
We calculated the aerosol direct (DRE) and cloud-albedo indirect (AIE) radiative effects over the North Atlantic attributed to five key factors controlling MBL aerosols. The cooling effects were about a factor of 10 larger for the AIEs than the respective DREs except for sea spray, which dominated the DRE. The strong AIE response was attributed to the strong sensitivity of the MBL cloud reflectivity to the MBL-related factors that we examined. Mid-tropospheric aerosol (altitude of transport of continental pollution) has a strong impact on the DRE and the factors that we considered had less impact at these altitudes. The maximum regional-mean (40–60∘ N and 20–50∘ W) DRE for our simulations was −1.37 W m−2, attributed to sea spray during the March/April accumulating phase, which is a time of strong synoptic-scale storms in the northwest Atlantic, enhancing wind-generated sea spray. This strong DRE attributed to sea spray highlights the importance of work to better constrain parameterizations for models. The second strongest DRE was connected to the temperature-dependent source of MSOA, which had a key role in growing simulated particles to large enough sizes (diameters of 100–200 nm and larger) to strongly reflect incoming solar radiation. The maximum AIE was −3.37 W m−2, for the May/June climax transition phase (peak phytoplankton bloom). This AIE was related to the role of MSOA in growing new particles to CCN sizes as they descend into the MBL and are subject to further growth in clouds after their formation near the MBL top. The AIE attributed to the NPF factor was nearly as large (−2.27 W m−2) during May/June. The NPF and MSOA factors act in concert with each other and removal of either of these factors contributed to shutdown the production of cloud-condensation-nuclei-sized particles. Our study demonstrated acceptable model–measurement agreement for our base simulation, such that our simulations can be employed to examine the potential role and relative importance of the considered factors in the DRE and AIE. However, we caution that further work is needed to gain confidence in the absolute magnitudes. In particular, the activation-style nucleation, which we used as a proxy for the unknown nucleation mechanism above the marine boundary layer, adds uncertainty to the climate effects of this nucleation.
This study highlighted the importance of processes connected to both marine biogenic activity and anthropogenic activity in controlling aerosol size distributions in the northwest Atlantic MBL. We identified key factors, which could be the focus of future work. Particularly, work is needed to better understand the nature, flux, and chemistry of marine organic vapors that can form MSOA. As well, work is needed to better understand the contributors to NPF near and above the MBL top. Further work is also needed to understand the interactions of the considered factors with cloud processing of aerosols and its relative importance in particle growth. As the Earth's climate changes and shipping traffic, regulations, and routes change, work to understand the source strength of DMS, MSOA, shipping, and sea spray emissions is highly relevant. Such work will bridge the knowledge gaps related to factors controlling aerosols in the marine MBL and their climate impacts.
The NAAMES project website is at https://naames.larc.nasa.gov (NASA LaRC, 2020). The NAAMES airborne and ship datasets used in this paper are publicly available and permanently archived in the NASA Atmospheric Science Data Center (ASDC; https://doi.org/10.5067/Suborbital/NAAMES/DATA001, NASA, 2020a) and the SeaWiFS Bio-optical Archive and Storage System (SeaBASS; https://doi.org/10.5067/SeaBASS/NAAMES/DATA001, NASA, 2020b). The ship datasets generated during and analyzed for NAAMES studies are also available in the University of California San Diego Library Digital Collections repository, https://doi.org/10.6075/J04T6GJ6 (Russell et al., 2018). GEOS-Chem 12.1.1 is available for download at https://doi.org/10.5281/zenodo.2249246 (The International GEOS-Chem User Community, 2018).
The supplement related to this article is available online at: https://doi.org/10.5194/acp-21-1889-2021-supplement.
BC, RVM, and JRP designed the study. BC conducted the GEOS-Chem-TOMAS simulations, led the related analysis, and wrote the article with contributions from all coauthors. RHM, ECC, and LDZ contributed the aerosol measurements from aboard the NASA C-130 aircraft. AW, MM, and AS contributed the gas-phase measurements from aboard the NASA C-130 aircraft. LMR and GS contributed the aerosol measurements from aboard R/V Atlantis. RYWC and HL contributed to the interpretation of model–measurement comparisons. EEM contributed the CEDS dataset. KRB contributed to the offline radiative calculations, and MG contributed the satellite DMS dataset.
The authors declare that they have no conflict of interest.
This article is part of the special issue “Marine aerosols, trace gases, and clouds over the North Atlantic (ACP/AMT inter-journal SI)”. It is not associated with a conference.
Betty Croft, Randall V. Martin, and Rachel Y.-W. Chang acknowledge research funding provided by the Ocean Frontier Institute, through an award from the Canada First Research Excellence Fund. Jeffrey R. Pierce and Kelsey R. Bilsback acknowledge funding support from the Monfort Excellence Fund and the US Department of Energy's Atmospheric System Research, an Office of Science, Office of Biological and Environmental Research program, under grant DE-SC0019000. Lynn M. Russell and Georges Saliba acknowledge funding support from NASA (grant NNX15AE66G). Richard H. Moore, Ewan C. Crosbie, Luke D. Ziemba, Lynn M. Russell, and Georges Saliba acknowledge funding support from the NASA NAAMES EVS-2 project. Hongyu Liu acknowledges funding support from the NASA NAAMES mission and the National Institute of Aerospace's IRAD program. DMS measurements aboard the NASA C-130 during NAAMES were supported by the Austrian Federal Ministry for Transport, Innovation and Technology (bmvit) through the Austrian Space Applications Programme (ASAP) of the Austrian Research Promotion Agency (FFG). Markus Müller's participation in NAAMES 2016 was funded by the Tiroler Wissenschaftsfonds (grant no. UNI-0404/1895). Arne Schiller's participation in NAAMES 2017 was partly funded by the National Institute of Aerospace (task no. 80LARC18F0031). Martí Galí acknowledges funding support from the Natural Sciences and Engineering Research Council of Canada through the NETCARE project of the Climate Change and Atmospheric Research Program. Tomas Mikoviny is acknowledged for technical support; Ionicon Analytik is acknowledged for instrumental support.
This research has been supported by the Ocean Frontier Institute (Canada First Research Excellence Fund), the US Department of Energy (grant no. DE-SC0019000), the National Aeronautics and Space Administration (grant no. NNX15AE66G), the Tiroler Wissenschaftsfonds (grant no. UNI-0404/1895), the National Institute of Aerospace (task no. 80LARC18F0031), the National Aeronautics and Space Administration (NAAMES EVS-2 project), the National Institute of Aerospace (IRAD program), and the National Sciences and Engineering Research Council (NETCARE project).
This paper was edited by Veli-Matti Kerminen and reviewed by two anonymous referees.
Abbatt, J. P. D., Leaitch, W. R., Aliabadi, A. A., Bertram, A. K., Blanchet, J.-P., Boivin-Rioux, A., Bozem, H., Burkart, J., Chang, R. Y. W., Charette, J., Chaubey, J. P., Christensen, R. J., Cirisan, A., Collins, D. B., Croft, B., Dionne, J., Evans, G. J., Fletcher, C. G., Galí, M., Ghahremaninezhad, R., Girard, E., Gong, W., Gosselin, M., Gourdal, M., Hanna, S. J., Hayashida, H., Herber, A. B., Hesaraki, S., Hoor, P., Huang, L., Hussherr, R., Irish, V. E., Keita, S. A., Kodros, J. K., Köllner, F., Kolonjari, F., Kunkel, D., Ladino, L. A., Law, K., Levasseur, M., Libois, Q., Liggio, J., Lizotte, M., Macdonald, K. M., Mahmood, R., Martin, R. V., Mason, R. H., Miller, L. A., Moravek, A., Mortenson, E., Mungall, E. L., Murphy, J. G., Namazi, M., Norman, A.-L., O'Neill, N. T., Pierce, J. R., Russell, L. M., Schneider, J., Schulz, H., Sharma, S., Si, M., Staebler, R. M., Steiner, N. S., Thomas, J. L., von Salzen, K., Wentzell, J. J. B., Willis, M. D., Wentworth, G. R., Xu, J.-W., and Yakobi-Hancock, J. D.: Overview paper: New insights into aerosol and climate in the Arctic, Atmos. Chem. Phys., 19, 2527–2560, https://doi.org/10.5194/acp-19-2527-2019, 2019.
Abdul-Razzak, H. and Ghan, S. J.: A parameterization of aerosol activation 3. Sectional representation, J. Geophys. Res., 107, 4026, https://doi.org/10.1029/2001JD000483, 2002.
Adams, P. J. and Seinfeld, J. H.: Predicting global aerosol size distributions in general circulation models, J. Geophys. Res., 107, 4370, https://doi.org/10.1029/2001JD001010, 2002.
Allan, J. D., Williams, P. I., Najera, J., Whitehead, J. D., Flynn, M. J., Taylor, J. W., Liu, D., Darbyshire, E., Carpenter, L. J., Chance, R., Andrews, S. J., Hackenberg, S. C., and McFiggans, G.: Iodine observed in new particle formation events in the Arctic atmosphere during ACCACIA, Atmos. Chem. Phys., 15, 5599–5609, https://doi.org/10.5194/acp-15-5599-2015, 2015.
Amos, H. M., Jacob, D. J., Holmes, C. D., Fisher, J. A., Wang, Q., Yantosca, R. M., Corbitt, E. S., Galarneau, E., Rutter, A. P., Gustin, M. S., Steffen, A., Schauer, J. J., Graydon, J. A., Louis, V. L. St., Talbot, R. W., Edgerton, E. S., Zhang, Y., and Sunderland, E. M.: Gas-particle partitioning of atmospheric Hg(II) and its effect on global mercury deposition, Atmos. Chem. Phys., 12, 591–603, https://doi.org/10.5194/acp-12-591-2012, 2012.
Ault, A. P., Moffet, R. C., Baltrusaitis, J., Collins, D. B., Ruppel, M. J., Cuadra-Rodriguez, L. A., Zhao, D., Guasco, T. L., Ebben, C. J., Geiger, F. M., Bertram, T. H., Prather, K. A., and Grassian, V. H.: Size-Dependent Changes in Sea Spray Aerosol Composition and Properties with Different Seawater Conditions, Environ. Sci. Technol., 47, 5603–5612, https://doi.org/10.1021/es400416g, 2013.
Barnes, I., Hjorth, J., and Mihalapoulos, N.: Dimethyl sulfide and dimethyl sulfoxide and their oxidation in the atmosphere, Chem. Rev., 106, 940–975, https://doi.org/10.1021/cr020529+, 2006.
Bates, T. S., Coffman, D. J., Covert, D. S., and Quinn, P. K.: Regional marine boundary layer aerosol size distributions in the Indian, Atlantic, and Pacific Oceans: A comparison of INDOEX measurements with ACE-1, ACE-2, and Aerosols99. J. Geophys. Res.-Atmos., 107, 8026, https://doi.org/10.1029/2001JD001174, 2002.
Bates, T. S., Quinn, P. K., Coffman, D. J., Johnson, J. E., Upchurch, L., Saliba, G., and Lewis, S.: Variability in Marine Plankton Ecosystems Are Not Observed in Freshly Emitted Sea Spray Aerosol Over the North Atlantic Ocean, Geophys. Res. Lett., 47, e2019GL085938, https://doi.org/10.1029/2019GL085938, 2020.
Behrenfeld, M. J., Moore, R. H., Hostetler, C. A., Graff, J., Gaube, P., Russell, L. M., Chen, G., Doney, S. C., Giovannoni, S., Liu, H., Proctor, C., Bolaños, L. M., Baetge, N., Davie-Martin, C., Westberry, T. K., Bates, T. S., Bell, T. G., Bidle, K. D., Boss, E. S., Brooks, S. D., Cairns, B., Carlson, C., Halsey, K., Harvey, E. L., Hu, C., Karp-Boss, L., Kleb, M., Menden-Deuer, S., Morison, F., Quinn, P. K., Scarino, A. J., Anderson, B., Chowdhary, J., Crosbie, E., Ferrare, R., Hair, J. W., Hu, Y., Janz, S., Redemann, J., Saltzman, E., Shook, M., Siegel, D. A., Wisthaler, A., Martin, M. Y., and Ziemba, L.: The North Atlantic Aerosol and Marine Ecosystem Study (NAAMES): Science Motive and Mission Overview, Front. Mar. Sci., 6, 122, https://doi.org/10.3389/fmars.2019.00122, 2019.
Bian, H., Froyd, K., Murphy, D. M., Dibb, J., Darmenov, A., Chin, M., Colarco, P. R., da Silva, A., Kucsera, T. L., Schill, G., Yu, H., Bui, P., Dollner, M., Weinzierl, B., and Smirnov, A.: Observationally constrained analysis of sea salt aerosol in the marine atmosphere, Atmos. Chem. Phys., 19, 10773–10785, https://doi.org/10.5194/acp-19-10773-2019, 2019.
Bilsback, K., Kerry, D., Croft, B., Ford, B., Jathar, S. H., Carter, E., Martin, R. V., and Pierce, J. R.: Beyond SO2 reductions from shipping: Assessing the impact of NOx and carbonaceous particle controls on human health and climate, Environ. Res. Lett., 15, 124046, https://doi.org/10.1088/1748-9326/abc718, 2020.
Bohren, C. F. and Huffman, D. R.: Absorption and scattering of light by small particles, Wiley Interscience, New York, USA, 1983.
Boucher, O. and Haywood, J.: Estimates of the Direct and Indirect Radiative Forcing Due to Tropospheric Aerosols: A Review, Rev. Geophys., 34, 513–543, 2000.
Boylan, J. W. and Russell, A. G.: PM and light extinction model performance metrics, goals, and criteria for three-dimensional air quality models, Atmos. Environ., 40, 4946–4959, https://doi.org/10.1016/j.atmosenv.2005.09.087, 2006.
Brooks, S. D. and Thornton, D. C. O.: Marine Aerosols and Clouds, Annu. Rev. Mar. Sci., 10, 289–313, https://doi.org/10.1146/annurev-marine-121916-063148, 2018.
Browse, J., Carslaw, K. S., Arnold, S. R., Pringle, K., and Boucher, O.: The scavenging processes controlling the seasonal cycle in Arctic sulphate and black carbon aerosol, Atmos. Chem. Phys., 12, 6775–6798, https://doi.org/10.5194/acp-12-6775-2012, 2012.
Brüggemann, M., Hayeck, N., and George, C.: Interfacial photochemistry at the ocean surface is a global source of organic vapors and aerosols, Nat. Commun., 9, 1–8, https://doi.org/10.1038/s41467-018-04528-7, 2018.
Burkart, J., Hodshire, A. L., Mungall, E. L., Pierce, J. R., Collins, D. B., Ladino, L. A., Lee, A. K. Y., Irish, V., Wentzell, J. J. B., Liggio, J., Papakyriakou, T., Murphy, J., and Abbatt, J.: Organic Condensation and Particle Growth to CCN Sizes in the Summertime Marine Arctic Is Driven by Materials More Semivolatile Than at Continental Sites, Geophys. Res. Lett., 44, 10725–10734, https://doi.org/10.1002/2017GL075671, 2017a.
Burkart, J., Willis, M. D., Bozem, H., Thomas, J. L., Law, K., Hoor, P., Aliabadi, A. A., Köllner, F., Schneider, J., Herber, A., Abbatt, J. P. D., and Leaitch, W. R.: Summertime observations of elevated levels of ultrafine particles in the high Arctic marine boundary layer, Atmos. Chem. Phys., 17, 5515–5535, https://doi.org/10.5194/acp-17-5515-2017, 2017b.
Carpenter, L. J. and Nightingale, P. D.: Chemistry and Release of Gases from the Surface Ocean, Chem. Rev., 115, 4015–4034, https://doi.org/10.1021/cr5007123, 2015.
Carpenter, L. J., Archer, S. D., and Beale, R.: Ocean-atmosphere trace gas exchange, Chem. Soc. Rev., 41, 6473–6506, https://doi.org/10.1039/c2cs35121h, 2012.
Carslaw, K. S., Boucher, O., Spracklen, D. V., Mann, G. W., Rae, J. G. L., Woodward, S., and Kulmala, M.: A review of natural aerosol interactions and feedbacks within the Earth system, Atmos. Chem. Phys., 10, 1701–1737, https://doi.org/10.5194/acp-10-1701-2010, 2010.
Carslaw, K. S., Lee, L. A., Reddington, C. L., Pringle, K. J., Rap, A., Forster, P. M., Mann, G. W., Spracklen, D. V, Woodhouse, M. T., Regayre, L. A., and Pierce, J. R.: Large contribution of natural aerosols to uncertainty in indirect forcing, Nature, 503, 67–71, https://doi.org/10.1038/nature12674, 2013.
Cavalli, F., Facchini, M. C., Decesari, S., Mircea, M., Emblico, L., Fuzzi, S., Ceburnis, D., Yoon, Y. J., O'Dowd, C., Putaud, J. P., and Dell'Acqua, A.: Advances in characterization of size-resolved organic matter in marine aerosol over the North Atlantic, J. Geophys. Res.-Atmos., 109, 1–14, https://doi.org/10.1029/2004JD005137, 2004.
Ceburnis, D., O'Dowd, C., Jennings, G. S., Facchini, M. C., Emblico, L., Decesari, S., Fuzzi, S., and Sakalys, J.: Marine aerosol chemistry gradients: Elucidating primary and secondary processes and fluxes, Geophys. Res. Lett., 35, 1–5, https://doi.org/10.1029/2008GL033462, 2008.
Chang, R. Y. W., Sjostedt, S. J., Pierce, J. R., Papakyriakou, T. N., Scarratt, M. G., Michaud, S., Levasseur, M., Leaitch, W. R., and Abbatt, J. P. D.: Relating atmospheric and oceanic DMS levels to particle nucleation events in the Canadian Arctic, J. Geophys. Res.-Atmos., 116, 1–10, https://doi.org/10.1029/2011JD015926, 2011.
Charlson, R. J., Lovelock, J. E., Andreae, M. O., and Warren, S. G.: Oceanic phytoplankton, atmospheric sulphur, cloud albedo and climate, Nature, 326, 655–661, https://doi.org/10.1038/326655a0, 1987.
Charlson, R. J., Schwartz, S. E., Hales, J. M., Cess, R. D., Coakley, J. A., Hansen, J. E., and Hofmann, D. J.: Climate Forcing by Anthropogenic Aerosols, Science, 255, 423–430, available at: http://science.sciencemag.org/content/255/5043/423.abstract (last access: 17 December 2020), 1992.
Chen, H., Varner, M. E., Gerber, R. B., and Finlayson-Pitts, B. J.: Reactions of Methanesulfonic Acid with Amines and Ammonia as a Source of New Particles in Air, J. Phys. Chem. B, 120, 1526–1536, https://doi.org/10.1021/acs.jpcb.5b07433, 2016.
Chen, Q., Sherwen, T., Evans, M., and Alexander, B.: DMS oxidation and sulfur aerosol formation in the marine troposphere: a focus on reactive halogen and multiphase chemistry, Atmos. Chem. Phys., 18, 13617–13637, https://doi.org/10.5194/acp-18-13617-2018, 2018.
Chen, Y.-C., Christensen, M. W., Stephens, G. L., and Seinfeld, J. H.: Satellite-based estimate of global aerosol–cloud radiative forcing by marine warm clouds, Nat. Geosci., 7, 643–646, https://doi.org/10.1038/ngeo2214, 2014.
Chiu, R., Tinel, L., Gonzalez, L., Ciuraru, R., Bernard, F., George, C., and Volkamer R.: UV photochemistry of carboxylic acids at the air–sea boundary: A relevant source of glyoxal and other oxygenated VOC in the marine atmosphere, Geophys. Res. Lett., 44, 1079–1087, https://doi.org/10.1002/2016GL071240, 2017.
Christiansen, S., Salter, M. E., Gorokhova, E., Nguyen, Q. T., and Bilde M.: Sea spray aerosol formation: Results on the role of air entrainment, water temperature and phytoplankton biomass, Environ. Sci. Technol., 53, 13107–13116, 2019.
Ciuraru, R., Fine, L., van Pinxteren, M., D'Anna, B., Herrmann, H., and George, C.: Unravelling new processes at interfaces: Photochemical isoprene production at the sea surface, Environ. Sci. Technol., 49, 13199–13205, https://doi.org/10.1021/acs.est.5b02388, 2015.
Clarke, A. D., Freitag, S., Simpson, R. M. C., Hudson, J. G., Howell, S. G., Brekhovskikh, V. L., Campos, T., Kapustin, V. N., and Zhou, J.: Free troposphere as a major source of CCN for the equatorial pacific boundary layer: long-range transport and teleconnections, Atmos. Chem. Phys., 13, 7511–7529, https://doi.org/10.5194/acp-13-7511-2013, 2013.
Collins, D. B., Burkart, J., Chang, R. Y.-W., Lizotte, M., Boivin-Rioux, A., Blais, M., Mungall, E. L., Boyer, M., Irish, V. E., Massé, G., Kunkel, D., Tremblay, J.-É., Papakyriakou, T., Bertram, A. K., Bozem, H., Gosselin, M., Levasseur, M., and Abbatt, J. P. D.: Frequent ultrafine particle formation and growth in Canadian Arctic marine and coastal environments, Atmos. Chem. Phys., 17, 13119–13138, https://doi.org/10.5194/acp-17-13119-2017, 2017.
Corbett, J. J., Winebrake, J. J., Green, E. H., Kasibhatla, P., Eyring, V., and Lauer, A.: Mortality from Ship Emissions: A Global Assessment, Environ. Sci. Technol., 41, 8512–8518, https://doi.org/10.1021/es071686z, 2007.
Corbett, J. J., Lack, D. A., Winebrake, J. J., Harder, S., Silberman, J. A., and Gold, M.: Arctic shipping emissions inventories and future scenarios, Atmos. Chem. Phys., 10, 9689–9704, https://doi.org/10.5194/acp-10-9689-2010, 2010.
Cravigan, L. T., Ristovski, Z., Modini, R. L., Keywood, M. D., and Gras, J. L.: Observation of sea-salt fraction in sub-100 nm diameter particles at Cape Grim, J. Geophys. Res.-Atmos., 120, 1848–1864, https://doi.org/10.1002/2014JD022601, 2015.
Cravigan, L. T., Mallet, M. D., Vaattovaara, P., Harvey, M. J., Law, C. S., Modini, R. L., Russell, L. M., Stelcer, E., Cohen, D. D., Olsen, G., Safi, K., Burrell, T. J., and Ristovski, Z.: Sea spray aerosol organic enrichment, water uptake and surface tension effects, Atmos. Chem. Phys., 20, 7955–7977, https://doi.org/10.5194/acp-20-7955-2020, 2020.
Croft, B., Wentworth, G. R., Martin, R. V, Leaitch, W. R., Murphy, J. G., Murphy, B. N., Kodros, J. K., Abbatt, J. P. D., and Pierce, J. R.: Contribution of Arctic seabird-colony ammonia to atmospheric particles and cloud-albedo radiative effect, Nat. Commun., 7, 13444, https://doi.org/10.1038/ncomms13444, 2016a.
Croft, B., Martin, R. V., Leaitch, W. R., Tunved, P., Breider, T. J., D'Andrea, S. D., and Pierce, J. R.: Processes controlling the annual cycle of Arctic aerosol number and size distributions, Atmos. Chem. Phys., 16, 3665–3682, https://doi.org/10.5194/acp-16-3665-2016, 2016b.
Croft, B., Martin, R. V., Leaitch, W. R., Burkart, J., Chang, R. Y.-W., Collins, D. B., Hayes, P. L., Hodshire, A. L., Huang, L., Kodros, J. K., Moravek, A., Mungall, E. L., Murphy, J. G., Sharma, S., Tremblay, S., Wentworth, G. R., Willis, M. D., Abbatt, J. P. D., and Pierce, J. R.: Arctic marine secondary organic aerosol contributes significantly to summertime particle size distributions in the Canadian Arctic Archipelago, Atmos. Chem. Phys., 19, 2787–2812, https://doi.org/10.5194/acp-19-2787-2019, 2019.
Cui, T., Green, H. S., Selleck, P. W., Zhang, Z., Brien, R. E. O., Gold, A., Keywood, M., Kroll, J. H., and Surratt, J. D.: Chemical Characterization of Isoprene- and Monoterpene-Derived Secondary Organic Aerosol Tracers in Remote Marine Aerosols over a Quarter Century, ACS Earth Space Chem., 3, 935–946, https://doi.org/10.1021/acsearthspacechem.9b00061, 2019.
Dall'Osto, M., Simo, R., Harrison, R. M., Beddows, D. C. S., Saiz-Lopez, A., Lange, R., Skov, H., Nøjgaard, J. K., Nielsen, I. E., and Massling, A.: Abiotic and biotic sources influencing spring new particle formation in North East Greenland, Atmos. Environ., 190, 126–134, https://doi.org/10.1016/J.ATMOSENV.2018.07.019, 2018.
de Leeuw, G., Andreas, E. L., Anguelova, M. D., Fairall, C. W., Lewis, E. R., O'Dowd, C., Schulz, M., and Schwartz, S. E.: Production flux of sea spray aerosol, Rev. Geophys., 49, RG2001, https://doi.org/10.1029/2010RG000349, 2011.
DeCarlo, P. F., Kimmel, J. R., Trimborn, A., Northway, M. J., Jayne, J. T., Aiken, A. C., Gonin, M., Fuhrer, K., Horvath, T., Docherty, K. S., Worsnop, D. R., and Jimenez, J. L.: Field-deployable, high-resolution, time-of-flight aerosol mass spectrometer, Anal. Chem., 78, 8281–8289, 2006.
Decesari, S., Finessi, E., Rinaldi, M., Paglione, M., Fuzzi, S., Stephanou, E. G., Tziaras, T., Spyros, A., Ceburnis, D., O'Dowd, C., Osto, M. D., Harrison, R. M., Allan, J., Coe, H., and Facchini, M. C.: Primary and secondary marine organic aerosols over the North Atlantic Ocean during the MAP experiment, J. Geophys. Res., 116, D22210, https://doi.org/10.1029/2011JD016204, 2011.
DeMott, P. J., Hill, T. C. J., McCluskey, C. S., Prather, K. A., Collins, D. B., Sullivan, R. C., Ruppel, M. J., Mason, R. H., Irish, V. E., and Lee, T.: Sea spray aerosol as a unique source of ice nucleating particles, P. Natl. Acad. Sci. USA, 113, 5797–5803, available at: http://www.pnas.org/content/113/21/5797.full.pdf (last access: 17 December 2020), 2016.
EC-JRC/PBL: Emission Database for Global Atmospheric Research (EDGAR), release EDGAR v4.2 FT2012, available at: http://edgar.jrc.ec.europa.eu (last access: 15 January 2018), 2012.
Facchini, M. C., Decesari, S., Rinaldi, M., Carbone, C., Finessi, E., Mircea, M., Fuzzi, S., Moretti, F., Tagliavini, E., Ceburnis, D., and O'Dowd, C.: Important Source of Marine Secondary Organic Aerosol from Biogenic Amines, Environ. Sci. Technol., 42, 9116–9121, https://doi.org/10.1021/es8018385, 2008.
Fast, J. D., Berg, L. K., Zhang, K., Easter, R. C., Ferrare, R. A., Hair, J. W., Hostetler, C. A., Liu, Y., Ortega, I., Sedlacek III, A., Shilling, J. E., Shrivastava, M., Springston, S. T., Tomlinson, Jason, M., Rainer, V., Wilson, J., Zaveri, R. A., and Zelenyuk, A.: Model representations of aerosol layers transported from North America over the Atlantic Ocean during the Two-Column Aerosol Project, J. Geophys. Res.-Atmos., 121, 9814–9848, https://doi.org/10.1002/2016JD025248, 2016.
Fiddes, S. L., Woodhouse, M. T., Nicholls, Z., Lane, T. P., and Schofield, R.: Cloud, precipitation and radiation responses to large perturbations in global dimethyl sulfide, Atmos. Chem. Phys., 18, 10177–10198, https://doi.org/10.5194/acp-18-10177-2018, 2018.
Fisher, J. A., Jacob, D. J., Purdy, M. T., Kopacz, M., Le Sager, P., Carouge, C., Holmes, C. D., Yantosca, R. M., Batchelor, R. L., Strong, K., Diskin, G. S., Fuelberg, H. E., Holloway, J. S., Hyer, E. J., McMillan, W. W., Warner, J., Streets, D. G., Zhang, Q., Wang, Y., and Wu, S.: Source attribution and interannual variability of Arctic pollution in spring constrained by aircraft (ARCTAS, ARCPAC) and satellite (AIRS) observations of carbon monoxide, Atmos. Chem. Phys., 10, 977–996, https://doi.org/10.5194/acp-10-977-2010, 2010.
Fossum, K. N., Ovadnevaite, J., Ceburnis, D. Preißler, J., Snider, J. R., Huang, R. J., Zuend, A., and O'Dowd, C.: Sea-spray regulates sulfate cloud droplet activation over oceans, NPJ Climate and Atmospheric Science, 3, https://doi.org/10.1038/s41612-020-0116-2, 2020.
Galí, M. and Simó, R.: A meta-analysis of oceanic DMS and DMSP cycling processes: Disentangling the summer paradox, Global Biogeochem. Cy., 29, 496–515, https://doi.org/10.1002/2014GB004940, 2015.
Galí, M., Levasseur, M., Devred, E., Simó, R., and Babin, M.: Sea-surface dimethylsulfide (DMS) concentration from satellite data at global and regional scales, Biogeosciences, 15, 3497–3519, https://doi.org/10.5194/bg-15-3497-2018, 2018.
Galí, M., Devred, E., Babin, M., and Levasseur, M.: Decadal increase in Arctic dimethylsulfide emission, P. Natl. Acad. Sci. USA, 116, 19311–19317, https://doi.org/10.1073/pnas.1904378116, 2019.
Gantt, B. and Meskhidze, N.: The physical and chemical characteristics of marine primary organic aerosol: a review, Atmos. Chem. Phys., 13, 3979–3996, https://doi.org/10.5194/acp-13-3979-2013, 2013.
Ghahremaninezhad, R., Norman, A.-L., Abbatt, J. P. D., Levasseur, M., and Thomas, J. L.: Biogenic, anthropogenic and sea salt sulfate size-segregated aerosols in the Arctic summer, Atmos. Chem. Phys., 16, 5191–5202, https://doi.org/10.5194/acp-16-5191-2016, 2016.
Ghahremaninezhad, R., Gong, W., Galí, M., Norman, A.-L., Beagley, S. R., Akingunola, A., Zheng, Q., Lupu, A., Lizotte, M., Levasseur, M., and Leaitch, W. R.: Dimethyl sulfide and its role in aerosol formation and growth in the Arctic summer – a modelling study, Atmos. Chem. Phys., 19, 14455–14476, https://doi.org/10.5194/acp-19-14455-2019, 2019.
Gilgen, A., Huang, W. T. K., Ickes, L., Neubauer, D., and Lohmann, U.: How important are future marine and shipping aerosol emissions in a warming Arctic summer and autumn?, Atmos. Chem. Phys., 18, 10521–10555, https://doi.org/10.5194/acp-18-10521-2018, 2018.
Gong, S. L.: A parameterization of sea-salt aerosol source function for sub- and super-micron particles, J. Geophys. Res., 17, 1097, https://doi.org/10.1029/2003GB002079, 2003.
Grassian, V. H., Quinn, P. K., Collins, D. B., Bates, T. S., and Prather, K. A.: Chemistry and Related Properties of Freshly Emitted Sea Spray Aerosol, Chem. Rev., 115, 4383–4399, https://doi.org/10.1021/cr500713g, 2015.
Guenther, A. B., Jiang, X., Heald, C. L., Sakulyanontvittaya, T., Duhl, T., Emmons, L. K., and Wang, X.: The Model of Emissions of Gases and Aerosols from Nature version 2.1 (MEGAN2.1): an extended and updated framework for modeling biogenic emissions, Geosci. Model Dev., 5, 1471–1492, https://doi.org/10.5194/gmd-5-1471-2012, 2012.
Hamacher-Barth, E., Leck, C., and Jansson, K.: Size-resolved morphological properties of the high Arctic summer aerosol during ASCOS-2008, Atmos. Chem. Phys., 16, 6577–6593, https://doi.org/10.5194/acp-16-6577-2016, 2016.
Hodshire, A. L., Campuzano-Jost, P., Kodros, J. K., Croft, B., Nault, B. A., Schroder, J. C., Jimenez, J. L., and Pierce, J. R.: The potential role of methanesulfonic acid (MSA) in aerosol formation and growth and the associated radiative forcings, Atmos. Chem. Phys., 19, 3137–3160, https://doi.org/10.5194/acp-19-3137-2019, 2019.
Hoesly, R. M., Smith, S. J., Feng, L., Klimont, Z., Janssens-Maenhout, G., Pitkanen, T., Seibert, J. J., Vu, L., Andres, R. J., Bolt, R. M., Bond, T. C., Dawidowski, L., Kholod, N., Kurokawa, J.-I., Li, M., Liu, L., Lu, Z., Moura, M. C. P., O'Rourke, P. R., and Zhang, Q.: Historical (1750–2014) anthropogenic emissions of reactive gases and aerosols from the Community Emissions Data System (CEDS), Geosci. Model Dev., 11, 369–408, https://doi.org/10.5194/gmd-11-369-2018, 2018.
Hoffman, E. H., Tilgner, A., Schrödner, R., Bräuer, P., Wolke, R., and Herrmann, H.: An advanced modeling study on the impacts and atmospheric implications of multiphase dimethyl sulfide chemistry, P. Natl. Acad. Sci. USA, 113, 11776–11781, https://doi.org/10.1073/pnas.1606320113, 2016.
Holmes, C. D., Prather, M. J., and Vinken, G. C. M.: The climate impact of ship NOx emissions: an improved estimate accounting for plume chemistry, Atmos. Chem. Phys., 14, 6801–6812, https://doi.org/10.5194/acp-14-6801-2014, 2014.
Hoose, C., Lohmann, U., Bennartz, R., Croft, B., and Lesins, G.: Global simulations of aerosol processing in clouds, Atmos. Chem. Phys., 8, 6939–6963, https://doi.org/10.5194/acp-8-6939-2008, 2008.
Hoppel, W. A., G. M. Frick, and R. E. Larson: Effect of nonprecipitating clouds on the aerosol size distribution in the marine boundary layer, Geophys. Res. Lett., 13, 125–128, https://doi.org/10.1029/GL013i002p00125, 1986.
Hu, Q.-H., Xie, Z.-Q., Wang, X.-M., Kang, H., He, Q.-F., and Zhang, P.: Secondary organic aerosols over oceans via oxidation of isoprene and monoterpenes from Arctic to Antarctic, Sci. Rep., 3, 2280, https://doi.org/10.1038/srep02280, 2013.
Huntrieser, H., Heland, J., Schlager, H., Forster, C., Stohl, A., Aufmhoff, H., Arnold, F., Scheel, H. E., Campana, M., Gilge, S., Eixmann, R., and Cooper, O.: Intercontinental air pollution transport from North America to Europe: Experimental evidence from airborne measurements and surface observations, J. Geophys. Res., 110, D01305, https://doi.org/10.1029/2004JD005045, 2005.
Iacono, M. J., Delamere, J. S., Mlawer, E. J., Shephard, M. W., Clough, S. A., and Collins, W. D.: Radiative forcing by long-lived greenhouse gases: Calculations with the AER radiative transfer models, J. Geophys. Res.-Atmos., 113, D13103, https://doi.org/10.1029/2008JD009944, 2008.
IPCC: Climate Change 2013: The Physical Science Basis. Contribution of Working Group I to the Fifth Assessment Report of the Intergovernmental Panel on Climate Change, edited by: Stocker, T. F., Qin, D., Plattner, G.-K., Tignor, M., Allen, S. K., Boschung, J., Nauels, A., Xia, Y., Bex, V., and Midgley, P. M., Cambridge University Press, Cambridge, UK and New York, NY, USA, 1535 pp., 2013.
Irish, V. E., Elizondo, P., Chen, J., Chou, C., Charette, J., Lizotte, M., Ladino, L. A., Wilson, T. W., Gosselin, M., Murray, B. J., Polishchuk, E., Abbatt, J. P. D., Miller, L. A., and Bertram, A. K.: Ice-nucleating particles in Canadian Arctic sea-surface microlayer and bulk seawater, Atmos. Chem. Phys., 17, 10583–10595, https://doi.org/10.5194/acp-17-10583-2017, 2017.
Jaeglé, L., Quinn, P. K., Bates, T. S., Alexander, B., and Lin, J.-T.: Global distribution of sea salt aerosols: new constraints from in situ and remote sensing observations, Atmos. Chem. Phys., 11, 3137–3157, https://doi.org/10.5194/acp-11-3137-2011, 2011.
Jin, Q., Grandey, B. S., Rothenberg, D., Avramov, A., and Wang, C.: Impacts on cloud radiative effects induced by coexisting aerosols converted from international shipping and maritime DMS emissions, Atmos. Chem. Phys., 18, 16793–16808, https://doi.org/10.5194/acp-18-16793-2018, 2018.
Johnson, M. T.: A numerical scheme to calculate temperature and salinity dependent air-water transfer velocities for any gas, Ocean Sci., 6, 913–932, https://doi.org/10.5194/os-6-913-2010, 2010.
Karl, M., Leck, C., Gross, A., and Pirjola, L.: A study of new particle formation in the marine boundary layer over the central Arctic Ocean using a flexible multicomponent aerosol dynamic model, Tellus B, 64, 1–24, https://doi.org/10.3402/tellusb.v64i0.17158, 2012.
Kasparian, J., Hassler, C., Ibelings, B., Berti, N., Bigorre, S., Djambazova, V., Gascon-diez, E., Giuliani, G., Houlmann, R., Kiselev, D., Laborie, P. De, Le, A., Magouroux, T., Neri, T., Palomino, D., Pfändler, S., Ray, N., Sousa, G., Staedler, D., Tettamanti, F., Wolf, J., and Beniston, M.: Assessing the Dynamics of Organic Aerosols over the North Atlantic Ocean, Sci. Rep., 7, 45476, https://doi.org/10.1038/srep45476, 2017.
Kazil, J., Wang, H., Feingold, G., Clarke, A. D., Snider, J. R., and Bandy, A. R.: Modeling chemical and aerosol processes in the transition from closed to open cells during VOCALS-REx, Atmos. Chem. Phys., 11, 7491–7514, https://doi.org/10.5194/acp-11-7491-2011, 2011.
Kerminen, V. M., Anttila, T., Lehtinen, K. E. J., and Kulmala, M.: Parameterization for atmospheric new-particle formation: Application to a system involving sulfuric acid and condensable water-soluble organic vapors, Aerosol Sci. Technol., 38, 1001–1008, https://doi.org/10.1080/027868290519085, 2004.
Kim, M. J., Novak, G. A., Zoerb, M. C., Yang, M., Blomquist, B. W., Huebert, B. J., Cappa, C. D., and Bertram, T. H.: Air–Sea exchange of biogenic volatile organic compounds and the impact on aerosol particle size distributions, Geophys. Res. Lett., 44, 3887–3896, https://doi.org/10.1002/2017GL072975, 2017.
Kodros, J. K. and Pierce, J. R.: Important global and regional differences in aerosol cloud-albedo effect estimates between simulations with and without prognostic aerosol microphysics, J. Geophys. Res., 122, 4003–4018, https://doi.org/10.1002/2016JD025886, 2017.
Kodros, J. K., Cucinotta, R., Ridley, D. A., Wiedinmyer, C., and Pierce, J. R.: The aerosol radiative effects of uncontrolled combustion of domestic waste, Atmos. Chem. Phys., 16, 6771–6784, https://doi.org/10.5194/acp-16-6771-2016, 2016.
Korhonen, H., Carslaw, K. S., Spracklen, D. V, Mann, G. W., and Woodhouse, M. T.: Influence of oceanic dimethyl sulfide emissions on cloud condensation nuclei concentrations and seasonality over the remote Southern Hemisphere oceans: A global model study, J. Geophys. Res.-Atmos., 113, https://doi.org/10.1029/2007JD009718, 2008
Kulmala, M., Lehtinen, K. E. J., and Laaksonen, A.: Cluster activation theory as an explanation of the linear dependence between formation rate of 3nm particles and sulphuric acid concentration, Atmos. Chem. Phys., 6, 787–793, https://doi.org/10.5194/acp-6-787-2006, 2006.
Lana, A., Bell, T. G., Simó, R., Vallina, S. M., Ballabrera-Poy, J., Kettle, A. J., Dachs, J., Bopp, L., Saltzman, E. S., Stefels, J., Johnson, J. E., and Liss, P. S.: An updated climatology of surface dimethlysulfide concentrations and emission fluxes in the global ocean, Global Biogeochem. Cy., 25, 1–17, https://doi.org/10.1029/2010GB003850, 2011.
Lana, A., Simó, R., Vallina, S. M., and Dachs, J.: Re-examination of global emerging patterns of ocean DMS concentration, Biogeochemistry, 110, 173–182, https://doi.org/10.1007/s10533-011-9677-9, 2012a.
Lana, A., Simó, R., Vallina, S. M., and Dachs, J.: Potential for a biogenic influence on cloud microphysics over the ocean: a correlation study with satellite-derived data, Atmos. Chem. Phys., 12, 7977–7993, https://doi.org/10.5194/acp-12-7977-2012, 2012b.
Lapina, K., Heald, C. L., Spracklen, D. V., Arnold, S. R., Allan, J. D., Coe, H., McFiggans, G., Zorn, S. R., Drewnick, F., Bates, T. S., Hawkins, L. N., Russell, L. M., Smirnov, A., O'Dowd, C. D., and Hind, A. J.: Investigating organic aerosol loading in the remote marine environment, Atmos. Chem. Phys., 11, 8847–8860, https://doi.org/10.5194/acp-11-8847-2011, 2011.
Leaitch, W. R., Sharma, S., Huang, L., Toom-Sauntry, D., Chivulescu, A., Macdonald, A. M., von Salzen, K., Pierce, J. R., Bertram, A. K., Schroder, J. C., Shantz, N. C., Chang, R. Y.-W., and Norman, A.-L.: Dimethyl sulfide control of the clean summertime Arctic aerosol and cloud, Elem. Sci. Anthr., 1, 000017, https://doi.org/10.12952/journal.elementa.000017, 2013.
Leaitch, W. R., Russell, L. M., Liu, J., Kolonjari, F., Toom, D., Huang, L., Sharma, S., Chivulescu, A., Veber, D., and Zhang, W.: Organic functional groups in the submicron aerosol at 82.5∘ N, 62.5∘ W from 2012 to 2014, Atmos. Chem. Phys., 18, 3269–3287, https://doi.org/10.5194/acp-18-3269-2018, 2018.
Leck, C. and Bigg, E. K.: Source and evolution of the marine aerosol – A new perspective, Geophys. Res. Lett., 32, https://doi.org/10.1029/2005GL023651, 2005.
Lee, Y. H. and Adams, P. J.: A fast and efficient version of the TwO-Moment Aerosol Sectional (TOMAS) global aerosol microphysics model, Aerosol Sci. Technol., 46, 678–689, https://doi.org/10.1080/02786826.2011.643259, 2012.
Lee, Y. H., Pierce, J. R., and Adams, P. J.: Representation of nucleation mode microphysics in a global aerosol model with sectional microphysics, Geosci. Model Dev., 6, 1221–1232, https://doi.org/10.5194/gmd-6-1221-2013, 2013.
Liu, H., Jacob, D. J., Bey, I., and Yantosca, R. M.: Constraints from 210Pb and 7Be on wet deposition and transport in a global three-dimensional chemical tracer model driven by assimilated meteorological fields, J. Geophys. Res.-Atmos., 106, 12109–12128, https://doi.org/10.1029/2000JD900839, 2001.
Liu, J., Dedrick, J., Russell, L. M., Senum, G. I., Uin, J., Kuang, C., Springston, S. R., Leaitch, W. R., Aiken, A. C., and Lubin, D.: High summertime aerosol organic functional group concentrations from marine and seabird sources at Ross Island, Antarctica, during AWARE, Atmos. Chem. Phys., 18, 8571–8587, https://doi.org/10.5194/acp-18-8571-2018, 2018.
Lohmann, U. and Feichter, J.: Global indirect aerosol effects: a review, Atmos. Chem. Phys., 5, 715–737, https://doi.org/10.5194/acp-5-715-2005, 2005.
Luo, G., Yu, F., and Schwab, J.: Revised treatment of wet scavenging processes dramatically improves GEOS-Chem 12.0.0 simulations of surface nitric acid, nitrate, and ammonium over the United States, Geosci. Model Dev., 12, 3439–3447, https://doi.org/10.5194/gmd-12-3439-2019, 2019.
Luo, G., Yu, F., and Moch, J. M.: Further improvement of wet process treatments in GEOS-Chem v12.6.0: impact on global distributions of aerosols and aerosol precursors, Geosci. Model Dev., 13, 2879–2903, https://doi.org/10.5194/gmd-13-2879-2020, 2020.
Mahmood, R., von Salzen, K., Norman, A.-L., Galí, M., and Levasseur, M.: Sensitivity of Arctic sulfate aerosol and clouds to changes in future surface seawater dimethylsulfide concentrations, Atmos. Chem. Phys., 19, 6419–6435, https://doi.org/10.5194/acp-19-6419-2019, 2019.
Mårtensson, E. M., Nilsson, E. D., de Leeuw, G., Cohen, L. H., and Hansson, H.-C.: Laboratory simulations and parameterization of the primary marine aerosol production, J. Geophys. Res.-Atmos., 108, https://doi.org/10.1029/2002JD002263, 2003.
McCoy, D. T., Burrows, S. M., Wood, R., Grosvenor, D. P., Elliott, S. M., Ma, P.-L., Rasch, P. J., and Hartmann, D. L.: Natural aerosols explain seasonal and spatial patterns of Southern Ocean cloud albedo, Sci. Adv., 1, e1500157, https://doi.org/10.1126/sciadv.1500157, 2015.
McDuffie, E. E., Smith, S. J., O'Rourke, P., Tibrewal, K., Venkataraman, C., Marais, E. A., Zheng, B., Crippa, M., Brauer, M., and Martin, R. V.: A global anthropogenic emission inventory of atmospheric pollutants from sector- and fuel-specific sources (1970–2017): an application of the Community Emissions Data System (CEDS), Earth Syst. Sci. Data, 12, 3413–3442, https://doi.org/10.5194/essd-12-3413-2020, 2020.
McNaughton, C. S., Clarke, A. D., Howell, S. G., Pinkerton, M., Anderson, B., Thornhill, L., Hudgins, C., Winstead, E., Dibb, J. E., Scheuer, E., and Maring, H.: Results from the DC-8 Inlet Characterization Experiment (DICE): Airborne versus surface sampling of mineral dust and sea salt aerosols, Aerosol Sci. Tech., 41, 136–159, 2007.
Meskhidze, N., Sabolis, A., Reed, R., and Kamykowski, D.: Quantifying environmental stress-induced emissions of algal isoprene and monoterpenes using laboratory measurements, Biogeosciences, 12, 637–651, https://doi.org/10.5194/bg-12-637-2015, 2015.
Monahan, E. C., Fairall, C. W., Davidson, K. L., and Boyle, P. J.: Observed inter-relations between 10m winds, ocean whitecaps and marine aerosols, Q. J. Roy. Meteor. Soc., 109, 379–392, 1983.
Müller, M., Mikoviny, T., Feil, S., Haidacher, S., Hanel, G., Hartungen, E., Jordan, A., Märk, L., Mutschlechner, P., Schottkowsky, R., Sulzer, P., Crawford, J. H., and Wisthaler, A.: A compact PTR-ToF-MS instrument for airborne measurements of volatile organic compounds at high spatiotemporal resolution, Atmos. Meas. Tech., 7, 3763–3772, https://doi.org/10.5194/amt-7-3763-2014, 2014.
Mungall, E. L., Abbatt, J. P. D., Wentzell, J. J. B., Lee, A. K. Y., Thomas, J. L., Blais, M., Gosselin, M., Miller, L. A., Papakyriakou, T., Willis, M. D., and Liggio, J.: Microlayer source of oxygenated volatile organic compounds in the summertime marine Arctic boundary layer, P. Natl. Acad. Sci. USA, 114, 6203–6208, https://doi.org/10.1073/pnas.1620571114, 2017.
Napari, I., Noppel, M., Vehkamaki, H., and Kulmala, M.: Parametrization of ternary nucleation rates for H2SO4-NH3-H2O vapors, J. Geophys. Res.-Atmos., 107, 2–7, https://doi.org/10.1029/2002JD002132, 2002.
NASA: NAAMES, NASA Atmospheric Science Data Center (ASDC), https://doi.org/10.5067/Suborbital/NAAMES/DATA001, 2020a.
NASA: NAAMES, SeaWiFS Bio-optical Archive and Storage System (SeaBASS), https://doi.org/10.5067/SeaBASS/NAAMES/DATA001, 2020b.
NASA LaRC: North Atlantic Aerosols and Marine Ecosystems Study, available at: https://naames.larc.nasa.gov, last access: 17 December 2020.
Nightingale, P. D., Liss, P. S., and Schlosser, P.: Measurements of air–sea gas transfer during an open ocean algal bloom, Geophys. Res. Lett., 27, 2117–2120, https://doi.org/10.1029/2000GL011541, 2000a.
Nightingale, P. D., Malin, G., Law, C. S., Watson, A. J., Liss, P. S., Liddicoat, M. I., Boutin, J., and Upstill-Goddard, R. C.: In situ evaluation of air–sea gas exchange parameterizations using novel conservative and volatile tracers, Global Biogeochem. Cy., 14, 373–387, https://doi.org/10.1029/1999GB900091, 2000b.
O'Dowd, C. D.: Marine aerosol formation from biogenic iodine emissions, Nature, 417, 1–5, https://doi.org/10.1038/nature00775, 2002.
O'Dowd, C. D. and de Leeuw, G.: Marine aerosol production: a review of the current knowledge, Philos. T. R. Soc. A, 1, 1753–1774, https://doi.org/10.1098/rsta.2007.2043, 2007.
O'Dowd, C. D., Smith, M. H., Consterdine, I. E., Lowe, J. A.: Marine aerosol, sea-salt, and the marine sulphur cycle: A short review, Atmos. Environ., 31, 73–80, 1997.
O' Dowd, C. D., Facchini, M. C., Cavalli, F., Ceburnis, D., Mircea, M., Decesari, S., Fuzzi, S., Yoon, Y. J., and Putaud, J.: Biogenically driven organic contribution to marine aerosol, Nature, 431, 676–680, https://doi.org/10.1038/nature02959, 2004
O'Dowd, C. D., Ceburnis, D., Ovadnevaite, J., Bialek, J., Stengel, D. B., Zacharias, M., Nitschke, U., Connan, S., Rinaldi, M., Fuzzi, S., Decesari, S., Facchini, M. C., Marullo, S., Santoleri, R., Anno, A. D., Corinaldesi, C., Tangherlini, M., and Danovaro, R.: Connecting marine productivity to sea-spray via nanoscale biological processes: Phytoplankton Dance or Death Disco?, Sci. Rep, 5, 14883, 1–11, https://doi.org/10.1038/srep14883, 2015.
Ovadnevaite, J., Ceburnis, D., Martucci, G., Bialek, J., Monahan, C., Rinaldi, M., Facchini, M. C., Berresheim, H., Worsnop, D. R., and O'Dowd, C.: Primary marine organic aerosol: A dichotomy of low hygroscopicity and high CCN activity, Geophys. Res. Lett., 38, L21806, https://doi.org/10.1029/2011GL048869, 2011.
Ovadnevaite, J., Ceburnis, D., Canagaratna, M., Berresheim, H., Bialek, J., Martucci, G., Worsnop, D. R., and O'Dowd, C.: On the effect of wind speed on submicron sea salt mass concentrations and source fluxes, J. Geophys. Res., 117, D16201, https://doi.org/10.1029/2011JD017379, 2012.
Pai, S. J., Heald, C. L., Pierce, J. R., Farina, S. C., Marais, E. A., Jimenez, J. L., Campuzano-Jost, P., Nault, B. A., Middlebrook, A. M., Coe, H., Shilling, J. E., Bahreini, R., Dingle, J. H., and Vu, K.: An evaluation of global organic aerosol schemes using airborne observations, Atmos. Chem. Phys., 20, 2637–2665, https://doi.org/10.5194/acp-20-2637-2020, 2020.
Park, K.-T., Jang, S., Lee, K., Yoon, Y. J., Kim, M.-S., Park, K., Cho, H.-J., Kang, J.-H., Udisti, R., Lee, B.-Y., and Shin, K.-H.: Observational evidence for the formation of DMS-derived aerosols during Arctic phytoplankton blooms, Atmos. Chem. Phys., 17, 9665–9675, https://doi.org/10.5194/acp-17-9665-2017, 2017.
Park, K.-T., Lee, K., Kim, T.-W., Yoon, Y. J., Jang, E.-H., Jang, S., Lee, B.-Y., and Hermansen, O.: Atmospheric DMS in the Arctic Ocean and Its Relation to Phytoplankton Biomass, Global Biogeochem. Cy., 32, 351–359, https://doi.org/10.1002/2017GB005805, 2018.
Pierce, J. R., Croft, B., Kodros, J. K., D'Andrea, S. D., and Martin, R. V.: The importance of interstitial particle scavenging by cloud droplets in shaping the remote aerosol size distribution and global aerosol-climate effects, Atmos. Chem. Phys., 15, 6147–6158, https://doi.org/10.5194/acp-15-6147-2015, 2015.
Prather, K. A., Bertram, T. H., Grassian, V. H., Deane, G. B., Stokes, M. D., DeMott, P. J., Aluwihare, L. I., Palenik, B. P., Azam, F., Seinfeld, J. H., Moffet, R. C., Molina, M. J., Cappa, C. D., Geiger, F. M., Roberts, G. C., Russell, L. M., Ault, A. P., Baltrusaitis, J., Collins, D. B., Corrigan, C. E., Cuadra-Rodriguez, L. A., Ebben, C. J., Forestieri, S. D., Guasco, T. L., Hersey, S. P., Kim, M. J., Lambert, W. F., Modini, R. L., Mui, W., Pedler, B. E., Ruppel, M. J., Ryder, O. S., Schoepp, N. G., Sullivan, R. C., and Zhao, D.: Bringing the ocean into the laboratory to probe the chemical complexity of sea spray aerosol, P. Natl. Acad. Sci. USA, 110, 7550–7555, https://doi.org/10.1073/pnas.1300262110, 2013.
Quinn, P. K. and Bates, T. S.: The case against climate regulation via oceanic phytoplankton sulphur emissions, Nature, 480, 51–56, https://doi.org/10.1038/nature10580, 2011.
Quinn, P. K., Bates, T. S., Schulz, K. S., Coffman, D. J., Frossard, A. A., Russell, L. M., Keene, W. C., and Kieber, D. J.: Contribution of sea surface carbon pool to organic matter enrichment in sea spray aerosol, Nat. Geosci., 7, 228–232, https://doi.org/10.1038/ngeo2092, 2014.
Quinn, P. K., Collins, D. B., Grassian, V. H., Prather, K. A., and Bates, T. S.: Chemistry and Related Properties of Freshly Emitted Sea Spray Aerosol, Chem. Rev., 115, 4383–4399, https://doi.org/10.1021/cr500713g, 2015.
Quinn, P. K., Coffman, D. J., Johnson, J. E., Upchurch, L. M., and Bates, T. S.: Small fraction of marine cloud condensation nuclei made up of sea spray aerosol, Nat. Geosci., 10, 674–679, https://doi.org/10.1038/ngeo3003, 2017.
Quinn, P. K., Bates, T. S., Coffman, D. J., Upchurch, L., Johnson, J. E., Moore, R., and Ziemba, L.: Seasonal Variations in Western North Atlantic Remote Marine Aerosol Properties, J. Geophys. Res.-Atmos., 124, 14240–14261, https://doi.org/10.1029/2019JD031740, 2019.
Ramnarine, E., Kodros, J. K., Hodshire, A. L., Lonsdale, C. R., Alvarado, M. J., and Pierce, J. R.: Effects of near-source coagulation of biomass burning aerosols on global predictions of aerosol size distributions and implications for aerosol radiative effects, Atmos. Chem. Phys., 19, 6561–6577, https://doi.org/10.5194/acp-19-6561-2019, 2019.
Regayre, L. A., Schmale, J., Johnson, J. S., Tatzelt, C., Baccarini, A., Henning, S., Yoshioka, M., Stratmann, F., Gysel-Beer, M., Grosvenor, D. P., and Carslaw, K. S.: The value of remote marine aerosol measurements for constraining radiative forcing uncertainty, Atmos. Chem. Phys., 20, 10063–10072, https://doi.org/10.5194/acp-20-10063-2020, 2020.
Rempillo, O., Seguin, A. M., Norman, A.-L., Scarratt, M., Michaud, S., Chang, R., Sjostedt, S., Abbatt, J., Else, B., Papakyriakou, T., Sharma, S., Grasby, S., and Levasseur, M.: Dimethyl sulfide air–sea fluxes and biogenic sulfur as a source of new aerosols in the Arctic fall, J. Geophys. Res.-Atmos., 116, D100S04, https://doi.org/10.1029/2011JD016336, 2011.
Revell, L. E., Kremser, S., Hartery, S., Harvey, M., Mulcahy, J. P., Williams, J., Morgenstern, O., McDonald, A. J., Varma, V., Bird, L., and Schuddeboom, A.: The sensitivity of Southern Ocean aerosols and cloud microphysics to sea spray and sulfate aerosol production in the HadGEM3-GA7.1 chemistry–climate model, Atmos. Chem. Phys., 19, 15447–15466, https://doi.org/10.5194/acp-19-15447-2019, 2019.
Riccobono, F., Schobesberger, S., Scott, C. E., Dommen, J., Ortega, I. K., Rondo, L., Almeida, J., Amorim, A., Bianchi, F., Breitenlechner, M., David, A., Downard, A., Dunne, E. M., Duplissy, J., Ehrhart, S., Flagan, R. C., Franchin, A., Hansel, A., Junninen, H., Kajos, M., Keskinen, H., Kupc, A., Kupiainen, O., Kürten, A., Kurtén, T., Kvashin, A. N., Laaksonen, A., Lehtipalo, K., Makhmutov, V., Mathot, S., Nieminen, T., Olenius, T., Onnela, A., Petäjä, T., Praplan, A. P., Santos, F. D., Schallhart, S., Seinfeld, J. H., Sipilä, M., Spracklen, D. V, Stozhkov, Y., Stratmann, F., Tomé, A., Tsagkogeorgas, G., Vaattovaara, P., Vehkamäki, H., Viisanen, Y., Vrtala, A., Wagner, P. E., Weingartner, E., Wex, H., Wimmer, D., Carslaw, K. S., Curtius, J., Donahue, N. M., Kirkby, J., Kulmala, M., Worsnop, D. R., Baltensperger, U. U. ., Schobesberger, S., Scott, C. E., Dommen, J., Ortega, I. K., Rondo, L., Almeida, J., Amorim, A., Bianchi, F., Breitenlechner, M., David, A., Downard, A., Dunne, E. M., Duplissy, J., Ehrhart, S., Flagan, R. C., Franchin, A., Hansel, A., Junninen, H., Kajos, M., Keskinen, H., Kupc, A., Kürten, A., Kvashin, A. N., Laaksonen, A., Lehtipalo, K., Makhmutov, V., Mathot, S., Nieminen, T., Onnela, A., Petäjä, T., Praplan, A. P., Santos, F. D., Schallhart, S., Seinfeld, J. H., Sipilä, M., Spracklen, D. V, Stozhkov, Y., Stratmann, F., Tomé, A., Tsagkogeorgas, G., Vaattovaara, P., Viisanen, Y., Vrtala, A., Wagner, P. E., Weingartner, E., Wex, H., Wimmer, D., Carslaw, K. S., Curtius, J., Donahue, N. M., Kirkby, J., Kulmala, M., Worsnop, D. R., and Baltensperger, U.: Oxidation Products of Biogenic Emissions Contribute to Nucleation of Atmospheric Particles, Science, 344, 717–721, https://doi.org/10.1126/science.1243527, 2014.
Rinaldi, M., Decesari, S., Finessi, E., Giulianelli, L., Carbone, C., Fuzzi, S., O'Dowd, C., Ceburnis, D., and Facchini, M. C.: Primary and Secondary Organic Marine Aerosol and Oceanic Biological Activity: Recent Results and New Perspectives for Future Studies, Adv. Meteorol., 2010, 1–10, https://doi.org/10.1155/2010/310682, 2010.
Rodríguez-Ros, P., Cortés, P., Robinson, C. M., Nunes, S., Hassler, C., Royer, S., Estrada, M., and Simó, R.: Distribution and Drivers of Marine Isoprene Concentration across the Southern Ocean, Atmosphere, 11, 1–19, https://doi.org/10.3390/atmos11060556, 2020a.
Rodriguez-Ros, P., Galí, M., Cortés, P., Robinson, C. M., Antoine, D., Wohl, C., Yang, M., and Simó, R.: Remote Sensing Retrieval of Isoprene Concentrations in the Southern Ocean Geophys. Res. Lett., 47, e2020GL087888, https://doi.org/10.1029/2020GL087888, 2020b.
Russell, L. M., Hawkins, L. N., Frossard, A. A., Quinn, P. K., and Bates, T. S.: Carbohydrate-like composition of submicron atmospheric particles and their production from ocean bubble bursting, P. Natl. Acad. Sci. USA, 107, 6652–6657, https://doi.org/10.1073/pnas.0908905107, 2010.
Russell, L. M., Chen, C.-L., Betha, R., Price, D. J., and Lewis, S.: Aerosol Particle Chemical and Physical Measurements on the 2015, 2016, 2017, and 2018 North Atlantic Aerosols and Marine Ecosystems Study (NAAMES) Research Cruises, UC San Diego Library Digital Collections, https://doi.org/10.6075/J04T6GJ6, 2018.
Saliba, G., Chen, C., Lewis, S., Russell, L. M., Rivellini, L., Lee, A. K. Y., Carlson, C. A., and Behrenfeld, M. J.: Factors driving the seasonal and hourly variability of sea-spray aerosol number in the North Atlantic, P. Natl. Acad. Sci. USA, 116, 20309–20314, https://doi.org/10.1073/pnas.1907574116, 2019.
Saliba, G., Chen, C., Lewis, S., Russell, L. M., Quinn, P. K., Bates, T. S., Bell, T. G., Lawler, M. J., Saltzman, E. S., Sanchez, K. J., Moore, R., Shook, M., Rivellini, L-H., Lee, A. K. Y. Baetge, N., Carlson, C. A., and Behrenfeld, M. J.: Seasonal differences and variability of concentrations, chemical composition, and cloud condensation nuclei of marine aerosol over the North Atlantic, J. Geophys. Res.-Atmos., 125, e2020JD033145, https://doi.org/10.1029/2020JD033145, 2020.
Sanchez, K. J., Chen, C.-L., Russell, L. M., Betha, R., Liu, J., Price, D. J., Massoli, P., Ziemba, L. D., Crosbie, E. C., Moore, R. H., Müller, M., Schiller, S. A., Wisthaler, A., Lee, A. K. Y., Quinn, P. K., Bates, T. S., Porter, J., Bell, T. G., Saltzman, E. S., Vaillancourt, R. D., and Behrenfeld, M. J.: Substantial Seasonal Contribution of Observed Biogenic Sulfate Particles to Cloud Condensation Nuclei, Sci. Rep., 8, 3235, https://doi.org/10.1038/s41598-018-21590-9, 2018.
Savoie, D. L., Arimoto, R., Keene, W. C., Prospero, J. M., Duce, R. A., and Galloway, J. N.: Marine biogenic and anthropogenic contributions to non-sea-salt sulfate in the marine boundary layer over the North Atlantic Ocean, J. Geophys. Res., 107, 4356, https://doi.org/10.1029/2001JD000970, 2002
Schwarz, J. P., Gao, R. S., Fahey, D. W., Thomson, D. S., Watts, L. A., Wilson, J. C., Reeves, J. M., Darbeheshti, M., Baumgardner, D. G., Kok, G. L., Chung, S. H., Schulz, M., Hendricks, J., Lauer, A., Ka, B., and Slowik, J. G.: Single-particle measurements of midlatitude black carbon and light-scattering aerosols from the boundary layer to the lower stratosphere, J. Geophys. Res.-Atmos., 111, D216207, https://doi.org/10.1029/2006JD007076, 2006.
Schiffer, J. M., Mael, L. E., Prather, K. A., Amaro, R. E., and Grassian, V. H.: Sea Spray Aerosol: Where Marine Biology Meets Atmospheric Chemistry, ACS Cent. Sci., 4, 1617–1623 https://doi.org/10.1021/acscentsci.8b00674, 2018.
Schiller, S. A. P.: Flugzeuggestützte Messung flüchtiger organischer Verbindungen über dem Nordatlantik mittels PTR-ToF-MS, Master thesis, Universität Innsbruck, 2018 (in German).
Schwinger, J., Tjiputra, J., Goris, N., Six, K. D., Kirkevåg, A., Seland, Ø., Heinze, C., and Ilyina, T.: Amplification of global warming through pH dependence of DMS production simulated with a fully coupled Earth system model, Biogeosciences, 14, 3633–3648, https://doi.org/10.5194/bg-14-3633-2017, 2017.
Sharma, S., Lavoué, D., Cachier, H., Barrie, L. A., and Gong, S. L.: Long-term trends of the black carbon concentrations in the Canadian Arctic, J. Geophys. Res.-Atmos., 109, D15203, https://doi.org/10.1029/2003JD004331, 2004.
Sharma, S., Andrews, E., Barrie, L. A., Ogren, J. A., and Lavoué, D.: Variations and sources of the equivalent black carbon in the high Arctic revealed by long-term observations at Alert and Barrow: 1989–2003, J. Geophys. Res.-Atmos., 111, D14208, https://doi.org/10.1029/2005JD006581, 2006.
Sihto, S.-L., Kulmala, M., Kerminen, V.-M., Dal Maso, M., Petäjä, T., Riipinen, I., Korhonen, H., Arnold, F., Janson, R., Boy, M., Laaksonen, A., and Lehtinen, K. E. J.: Atmospheric sulphuric acid and aerosol formation: implications from atmospheric measurements for nucleation and early growth mechanisms, Atmos. Chem. Phys., 6, 4079–4091, https://doi.org/10.5194/acp-6-4079-2006, 2006.
Singh, H. B., Cai, C., Kaduwela, A., Weinheimer, A., and Wisthaler, A.: Interactions of fire emissions and urban pollution over California: Ozone formation and air quality simulations, Atmos. Environ., 56, 45–51, https://doi.org/10.1016/j.atmosenv.2012.03.046, 2012.
Stohl, A., Forster, C., Eckhardt, S., Spichtinger, N., Huntrieser, H., Heland, J., Schlager, H., Wilhelm, S., Arnold, F., and Cooper, O.: A backward modeling study of intercontinental pollution transport using aircraft measurements, J. Geophys. Res., 108, 4370, https://doi.org/10.1029/2002JD002862, 2003.
Takegawa, N., Seto, T., Moteki, N., Koike, M., Oshima, N., Adachi, K., Kita, K., Takami, A., and Kondo, Y.: Enhanced New Particle Formation Above the Marine Boundary Layer Over the Yellow Sea: Potential Impacts on Cloud Condensation Nuclei, J. Geophys. Res.-Atmos., 125, 1–17, https://doi.org/10.1029/2019JD031448, 2020.
The International GEOS-Chem User Community: geoschem/geoschem: GEOS-Chem 12.1.1 (Version 12.1.1), Zenodo, https://doi.org/10.5281/zenodo.2249246, 2018.
Tremblay, S., Picard, J.-C., Bachelder, J. O., Lutsch, E., Strong, K., Fogal, P., Leaitch, W. R., Sharma, S., Kolonjari, F., Cox, C. J., Chang, R. Y.-W., and Hayes, P. L.: Characterization of aerosol growth events over Ellesmere Island during the summers of 2015 and 2016, Atmos. Chem. Phys., 19, 5589–5604, https://doi.org/10.5194/acp-19-5589-2019, 2019.
Tunved, P., Ström, J., and Krejci, R.: Arctic aerosol life cycle: linking aerosol size distributions observed between 2000 and 2010 with air mass transport and precipitation at Zeppelin station, Ny-Ålesund, Svalbard, Atmos. Chem. Phys., 13, 3643–3660, https://doi.org/10.5194/acp-13-3643-2013, 2013.
van der Werf, G. R., Randerson, J. T., Giglio, L., van Leeuwen, T. T., Chen, Y., Rogers, B. M., Mu, M., van Marle, M. J. E., Morton, D. C., Collatz, G. J., Yokelson, R. J., and Kasibhatla, P. S.: Global fire emissions estimates during 1997–2016, Earth Syst. Sci. Data, 9, 697–720, https://doi.org/10.5194/essd-9-697-2017, 2017.
Vehkamäki, H., Kulmala, M., Napari, I., Lehtinen, K. E. J., Timmreck, C., Noppel, M., and Laaksonen, A.: An improved parameterization for sulfuric acid – water nucleation rates for tropospheric and stratospheric conditions, J. Geophys. Res., 107, 1–10, https://doi.org/10.1029/2002JD002184, 2002.
Veres, P. R., Neuman, J. A., Bertram, T. H., Assaf, E., and Wolfe, G. M.: Global airborne sampling reveals a previously unobserved dimethyl sulfide oxidation mechanism in the marine atmosphere, P. Natl. Acad. Sci. USA, 117, 4505–4510, https://doi.org/10.1073/pnas.1919344117, 2020.
Vinken, G. C. M., Boersma, K. F., Jacob, D. J., and Meijer, E. W.: Accounting for non-linear chemistry of ship plumes in the GEOS-Chem global chemistry transport model, Atmos. Chem. Phys., 11, 11707–11722, https://doi.org/10.5194/acp-11-11707-2011, 2011.
Wang, Q., Jacob, D. J., Fisher, J. A., Mao, J., Leibensperger, E. M., Carouge, C. C., Le Sager, P., Kondo, Y., Jimenez, J. L., Cubison, M. J., and Doherty, S. J.: Sources of carbonaceous aerosols and deposited black carbon in the Arctic in winter-spring: implications for radiative forcing, Atmos. Chem. Phys., 11, 12453–12473, https://doi.org/10.5194/acp-11-12453-2011, 2011.
Wang, Q., Jacob, D. J., Spackman, J. R., Perring, A. E., Schwarz, J. P., Moteki, N., Marais, E. A., Ge, C., Wang, J., and Barrett, S. R. H.: Global budget and radiative forcing of black carbon aerosol: Constraints from pole-to-pole (HIPPO) observations across the Pacific, J. Geophys. Res., 119, 195–206, https://doi.org/10.1002/2013JD020824, 2014.
Wang, X., Sultana, C. M., Trueblood, J., Hill, T. C. J., Malfatti, F., Lee, C., Laskina, O., Moore, K. A., Beall, C. M., McCluskey, C. S., Cornwell, G. C., Zhou, Y., Cox, J. L., Pendergraft, M. A., Santander, M. V., Bertram, T. H., Cappa, C. D., Azam, F., DeMott, P. J., Grassian, V. H., and Prather, K. A.: Microbial control of sea spray aerosol composition: A tale of two blooms, ACS Cent. Sci., 1, 124–131, https://doi.org/10.1021/acscentsci.5b00148, 2015.
Weber, R. J., Chen, G., Davis, D. D., Mauldin, R. L., Tanner, D. J., Clarke, A. D., Thornton, D. C., and Bandy, A. R.: Measurements of enhanced H2SO4 and 3–4 nm particles near a frontal cloud during the First Aerosol Characterization Experiment (ACE 1), J. Geophys. Res., 106, 24107–24117, 2001.
Wehner, B., Werner, F., Ditas, F., Shaw, R. A., Kulmala, M., and Siebert, H.: Observations of new particle formation in enhanced UV irradiance zones near cumulus clouds, Atmos. Chem. Phys., 15, 11701–11711, https://doi.org/10.5194/acp-15-11701-2015, 2015.
Wesley, M. L.: Parameterization of surface resistances to gaseous deposition in regional-scale numerical models, Atmos. Environ., 23, 1293–1304, 1989.
Westervelt, D. M., Pierce, J. R., Riipinen, I., Trivitayanurak, W., Hamed, A., Kulmala, M., Laaksonen, A., Decesari, S., and Adams, P. J.: Formation and growth of nucleated particles into cloud condensation nuclei: model–measurement comparison, Atmos. Chem. Phys., 13, 7645–7663, https://doi.org/10.5194/acp-13-7645-2013, 2013.
Williamson, C. J., Kupc, A., Axisa, D. , Bilsback, K. R., Bui, T., Campuzano-Jost, P., Dollner, M., Froyd, K. D., Hodshire, A. L., Jimenez, J. L., Kodros, J. K., Luo, G., Murphy, D. M., Nault, B. A., Ray, E. A., Weinzierl, B., Wilson, J. C., Yu, F., Yu, P., Pierce, J. R., and Brock, C. A.: A large source of cloud condensation nuclei from new particle formation in the tropics, Nature, 574, 399–403, https://doi.org/10.1038/s41586-019-1638-9, 2019.
Willis, M. D., Burkart, J., Thomas, J. L., Köllner, F., Schneider, J., Bozem, H., Hoor, P. M., Aliabadi, A. A., Schulz, H., Herber, A. B., Leaitch, W. R., and Abbatt, J. P. D.: Growth of nucleation mode particles in the summertime Arctic: a case study, Atmos. Chem. Phys., 16, 7663–7679, https://doi.org/10.5194/acp-16-7663-2016, 2016.
Willis, M. D., Köllner, F., Burkart, J., Bozem, H., Thomas, J. L., Schneider, J., Aliabadi, A. A., Hoor, P. M., Schulz, H., Herber, A. B., Leaitch, W. R., and Abbatt, J. P. D.: Evidence for marine biogenic influence on summertime Arctic aerosol, Geophys. Res. Lett., 44, 6460–6470, https://doi.org/10.1002/2017GL073359, 2017.
Willis, M. D., Leaitch, W. R., and Abbatt, J. P. D.: Processes Controlling the Composition and Abundance of Arctic Aerosol, Rev. Geophys., 56, 621–671, https://doi.org/10.1029/2018RG000602, 2018.
Wilson, T. W., Ladino, L. A., Alpert, P. A., Breckels, M. N., Brooks, I. M., Browse, J., Burrows, S. M., Carslaw, K. S., Huffman, J. A., Judd, C., Kilthau, W. P., Mason, R. H., McFiggans, G., Miller, L. A., Najera, J. J., Polishchuk, E., Rae, S., Schiller, C. L., Si, M., Temprado, J. V., Whale, T. F., Wong, J. P. S., Wurl, O., Yakobi-Hancock, J. D., Abbatt, J. P. D., Aller, J. Y., Bertram, A. K., Knopf, D. A., and Murray, B. J.: A marine biogenic source of atmospheric ice-nucleating particles, Nature, 525, 234–238, https://doi.org/10.1038/nature14986, 2015.
Wood, R.: Stratocumulus Clouds, Mon. Weather Rev., 140, 2373–2423, https://doi.org/10.1175/MWR-D-11-00121.1, 2012.
Wood, R., Stemmler, J. D., Rémillard, J., and Jefferson, A.: Low-CCN concentration air masses over the eastern North Atlantic: Seasonality, meteorology, and drivers, J. Geophys. Res.-Atmos., 122, 1203–1223, https://doi.org/10.1002/2016JD025557, 2017.
Woodhouse, M. T., Mann, G. W., Carslaw, K. S., and Boucher, O.: Sensitivity of cloud condensation nuclei to regional changes in dimethyl-sulphide emissions, Atmos. Chem. Phys., 13, 2723–2733, https://doi.org/10.5194/acp-13-2723-2013, 2013.
Xu, J.-W., Martin, R. V., Morrow, A., Sharma, S., Huang, L., Leaitch, W. R., Burkart, J., Schulz, H., Zanatta, M., Willis, M. D., Henze, D. K., Lee, C. J., Herber, A. B., and Abbatt, J. P. D.: Source attribution of Arctic black carbon constrained by aircraft and surface measurements, Atmos. Chem. Phys., 17, 11971–11989, https://doi.org/10.5194/acp-17-11971-2017, 2017.
Yassaa, N., Peeken, I., Zöllner, E., Bluhm, K., Arnold, S., Spracklan, D., and Williams, J: Evidence for marine production of monoterpenes, Environ. Chem., 5, 391–401, https://doi.org/10.1071/EN08047, 2008.
Zanatta, M., Bozem, H., Köllner, F., Schneider, J., Hoor, P., Faria, J. De, Petzold, A., Bundke, U., Staebler, R. M., Schulz, H., Herber, A. B., Zanatta, M., Bozem, H., Köllner, F., Schneider, J., Hoor, P., Faria, J. De, Petzold, A., Bundke, U., Hayden, K., Staebler, R. M., Schulz, H., and Herber, A. B..: Airborne survey of trace gases amd aerosol over the Southern Baltic Sea: from clean marine boundary layer to shipping corridor effect, Tellus B, 72, 1–24, https://doi.org/10.1080/16000889.2019.1695349, 2019.
Zender, C. S., Bian, H., and Newman, D.: Mineral Dust Entrainment and Deposition (DEAD) model: Description and 1990s dust climatology, J. Geophys. Res., 108, 4416, https://doi.org/10.1029/2002JD002775, 2003.
Zheng, G., Wang, Y., Aiken, A. C., Gallo, F., Jensen, M. P., Kollias, P., Kuang, C., Luke, E., Springston, S., Uin, J., Wood, R., and Wang, J.: Marine boundary layer aerosol in the eastern North Atlantic: seasonal variations and key controlling processes, Atmos. Chem. Phys., 18, 17615–17635, https://doi.org/10.5194/acp-18-17615-2018, 2018.
Zheng, G., Kuang, C., Uin, J., Watson, T., and Wang, J.: Large contribution of organics to condensational growth and formation of cloud condensation nuclei (CCN) in the remote marine boundary layer, Atmos. Chem. Phys., 20, 12515–12525, https://doi.org/10.5194/acp-20-12515-2020, 2020a.
Zheng, G., Sedlacek, A. J., Aiken, A. C., Feng, Y., Watson, T. B., Raveh-rubin, S., Uin, J., Lewis, E. R., and Wang, J.: Long-range transported North American wild fire aerosols observed in marine boundary layer of eastern North Atlantic, Environ. Int., 139, 105680, https://doi.org/10.1016/j.envint.2020.105680, 2020b.