the Creative Commons Attribution 4.0 License.
the Creative Commons Attribution 4.0 License.
 | 10 Feb 2021
Simulation of radon-222 with the GEOS-Chem global model: emissions, seasonality, and convective transport
James H. Crawford
Gao Chen
T. Duncan Fairlie
Scott Chambers
Chang-Hee Kang
Alastair G. Williams
Kai Zhang
David B. Considine
Melissa P. Sulprizio
Robert M. Yantosca
Radon-222 (222Rn) is a short-lived radioactive gas naturally emitted from land surfaces and has long been used to assess convective transport in atmospheric models. In this study, we simulate 222Rn using the GEOS-Chem chemical transport model to improve our understanding of 222Rn emissions and surface concentration seasonality and characterize convective transport associated with two Goddard Earth Observing System (GEOS) meteorological products, the Modern-Era Retrospective analysis for Research and Applications (MERRA) and GEOS Forward Processing (GEOS-FP). We evaluate four global 222Rn emission scenarios by comparing model results with observations at 51 surface sites. The default emission scenario in GEOS-Chem yields a moderate agreement with surface observations globally (68.9 % of data within a factor of 2) and a large underestimate of winter surface 222Rn concentrations at Northern Hemisphere midlatitudes and high latitudes due to an oversimplified formulation of 222Rn emission fluxes (1 atom cm−2 s−1 over land with a reduction by a factor of 3 under freezing conditions). We compose a new global 222Rn emission scenario based on Zhang et al. (2011) and demonstrate its potential to improve simulated surface 222Rn concentrations and seasonality. The regional components of this scenario include spatially and temporally varying emission fluxes derived from previous measurements of soil radium content and soil exhalation models, which are key factors in determining 222Rn emission flux rates. However, large model underestimates of surface 222Rn concentrations still exist in Asia, suggesting unusually high regional 222Rn emissions. We therefore propose a conservative upscaling factor of 1.2 for 222Rn emission fluxes in China, which was also constrained by observed deposition fluxes of 210Pb (a progeny of 222Rn). With this modification, the model shows better agreement with observations in Europe and North America (> 80 % of data within a factor of 2) and reasonable agreement in Asia (close to 70 %). Further constraints on 222Rn emissions would require additional concentration and emission flux observations in the central United States, Canada, Africa, and Asia. We also compare and assess convective transport in model simulations driven by MERRA and GEOS-FP using observed 222Rn vertical profiles in northern midlatitude summer and from three short-term airborne campaigns. While simulations with both GEOS products are able to capture the observed vertical gradient of 222Rn concentrations in the lower troposphere (0–4 km), neither correctly represents the level of convective detrainment, resulting in biases in the middle and upper troposphere. Compared with GEOS-FP, MERRA leads to stronger convective transport of 222Rn, which is partially compensated for by its weaker large-scale vertical advection, resulting in similar global vertical distributions of 222Rn concentrations between the two simulations. This has important implications for using chemical transport models to interpret the transport of other trace species when these GEOS products are used as driving meteorology.
- Article
(12056 KB) - Full-text XML
-
Supplement
(772 KB) - BibTeX
- EndNote


A reasonable representation of transport processes in global models is critical to properly simulate tropospheric trace gases and aerosols. However, convective transport and boundary-layer turbulent mixing occur at sub-grid scales and are usually parameterized, unavoidably introducing transport biases. Radon-222 (222Rn, half-life 3.8 d), an atmospheric radionuclide, is an excellent tracer for assessing these biases due to its relatively well-constrained sources and fairly simple sink pathway (radioactive decay) in the atmosphere (Jacob et al., 1997; Liu et al., 1984). In this work, we evaluate and improve the simulation of 222Rn in a global chemical transport model (GEOS-Chem CTM) and assess the role of convective transport in shaping its vertical distributions.
Radon-222 is an inert gas ubiquitously produced in soils and rocks by radioactive decay of radium (226Ra). Shortly after 222Rn emanates to the atmosphere, it decays to 210Pb (half-life 22.3 years). Wet and dry depositions of 222Rn are negligible due to its inert nature. The spatial distribution of 222Rn is therefore strongly affected by convective and synoptic-scale transport. Numerous studies have used 222Rn to evaluate model transport processes, such as boundary-layer structure and stability, vertical motion and mixing, and convection. For instance, Liu et al. (1984) derived seasonal vertical eddy diffusion coefficients using observed vertical profiles of tropospheric 222Rn concentrations. Allen et al. (1996) used 222Rn profile measurements to evaluate moist convection in their model and showed that deep convection from the boundary layer to the upper troposphere facilitates the formation of a “C-like” 222Rn vertical profile. Considine et al. (2005) used 222Rn and 210Pb measurements to examine the roles of convective transport in three different meteorological datasets. K. Zhang et al. (2008) tested two widely used convection schemes, Zhang–McFarlane–Hack (Hack, 1994; Zhang and McFarlane, 1995) and Tiedtke–Nordeng (Nordeng, 1994), in a global circulation model against observed 222Rn profiles. Although model results with both schemes showed similarly reasonable estimates of surface 222Rn concentrations, some discrepancies were found in the middle and upper troposphere. 222Rn has also been used as an indicator of continental influences on remote marine regions (Balkanski et al., 1992; Chambers et al., 2013, 2018). Model intercomparison of simulated 222Rn distributions has been an efficient approach to compare and contrast transport characteristics with respect to boundary-layer turbulent mixing and convection (Genthon and Armengaud, 1995; Jacob et al., 1997).
222Rn emission fluxes have been estimated based on (1) direct measurements, usually by assuming a linear increase of 222Rn in a chamber placed on soil, and (2) indirect estimates, through an integration of 222Rn profiles by assuming a local balance between 222Rn emission and decay. Using both approaches, Wilkening et al. (1972) and Wilkening and Clements (1975) derived an estimate of global mean 222Rn emission fluxes (0.75 atom cm−2 s−1 over land). Turekian et al. (1977) later suggested this global mean flux rate was likely an underestimate due to the assumption of a local steady state. By also considering one-dimensional longitudinal transport, Turekian et al. (1977) recommended a higher global mean flux of 1.2 atom cm−2 s−1, which led to a better agreement with observed 210Pb deposition fluxes across various latitudes. More recently, a mean global emission flux of 1 atom cm−2 s−1 was considered more accurate, and has been used uniformly over land as a standard configuration (Balkanski et al., 1993). 222Rn fluxes from water surface are a few orders of magnitude lower and can be neglected compared with emissions over land (Wilkening and Clements, 1975). To date, most global models have used a globally uniform 222Rn emission flux of 1 atom cm−2 s−1 with modifications in high latitudes and for freezing soil temperatures.
Quantification of regional and temporal 222Rn emission variations has been extended to broader areas and improved by new measurement techniques and modeling approaches. Observations have indicated that local 222Rn emission fluxes vary extensively with surface texture, soil moisture, radium content, ice coverage, and freezing condition (Martell, 1985; Turekian et al., 1977). The increasing availability of observational data inspired studies to quantify regional and temporal emission variations. Based on a large collection of global observations, Conen and Robertson (2002) proposed a linearly decreasing gradient in the Northern Hemisphere, from 1 atom cm−2 s−1 at 30∘ N to 0.2 atom cm−2 s−1 at 70∘ N. Regional and global 222Rn emission flux datasets at fine resolution have also been developed based on models of gas diffusion in porous media; this was facilitated by increasingly available soil parameters from meteorological models and assimilation (or reanalysis) datasets. Genthon and Armengaud (1995) introduced soil parameters into a global general circulation model (GCM) to formulate online soil–atmosphere exchange of 222Rn, which assisted in capturing rapid fluctuations of surface 222Rn concentrations over freezing surfaces. Zhuo et al. (2008) compiled radium content information from over a thousand sites in China and constructed a high spatial resolution emission map over the country. Hirao et al. (2010) constructed a decade-long global 222Rn emission record based on additional considerations about surface texture. Published 222Rn emission inventories for Europe have very fine spatial resolutions (up to 0.083∘ × 0.083∘) with monthly variability due to extensive measurements of emission fluxes and surface concentrations across the continent (Karstens et al., 2015; López-Coto et al., 2013; Szegvary et al., 2009). Such variability is missing in the current GEOS-Chem standard model, which limits the use of 222Rn as a tracer to evaluate model transport processes, not to mention that 222Rn emission and distributions directly affect the production of its progeny 210Pb, a useful tracer for testing aerosol transport and wet deposition (Liu et al., 2001; Considine et al., 2005).
GEOS-Chem is driven by assimilated meteorological datasets archived from the Goddard Earth Observing System (GEOS) of the NASA Global Modeling and Assimilation Office (GMAO). Changes in the model dynamics often occur as the GEOS model evolves, which in turn affect the characteristics of transport of chemical species in GEOS-Chem. In an evaluation with satellite-observed carbon monoxide in the upper troposphere and lower stratosphere (UTLS), Liu et al. (2013) reported that less carbon monoxide was lofted to the UTLS when GEOS-Chem was driven by the GEOS-5 assimilated data due to insufficient vertical transport compared with GEOS-4. Downward transport from the stratosphere to the troposphere was previously found to be substantially overestimated in CTMs driven by GEOS-1 compared with GEOS-4 (Liu et al., 2016). In a similar manner, evaluation of 222Rn simulations with observations will help characterize convective transport and its uncertainty in the GEOS series.
In this paper, we assess and improve the simulation of 222Rn as a model utility to test convective transport in GEOS-Chem. We incorporate recently published global 222Rn emission scenarios into the model. We conduct model simulations with varying emission configurations and provide insights into potential biases in regional and seasonal emissions through evaluations against observed surface 222Rn concentrations and vertical profiles. We also present the changes in simulated 222Rn vertical distributions as the driving meteorology switches between the Modern-Era Retrospective analysis for Research and Applications (MERRA) and GEOS Forward Processing (GEOS-FP), with a specific focus on the role of convection.
The rest of this paper is organized as follows. Section 2 describes the GEOS-Chem model, four 222Rn emission scenarios, model simulations, and observational datasets used in this work. Section 3 evaluates the four different 222Rn emission scenarios by comparing simulated 222Rn with surface measurements. Section 4 discusses potentially underestimated 222Rn emissions in Asia. Section 5 examines simulated surface 222Rn seasonality at selected sites. Section 6 assesses convective transport in the model and compares the role of convective transport in MERRA and GEOS-FP in the 222Rn vertical distribution.
2.1 GEOS-Chem
GEOS-Chem (http://www.geos-chem.org, last access: 1 August 2020) is a global 3-D CTM of atmospheric composition with aerosol–chemistry interactions in both the troposphere and stratosphere, driven by GEOS assimilated meteorological fields from the NASA GMAO (e.g., Bey et al., 2001; Park et al., 2004; Eastham et al., 2014). The model uses a flux-form semi-Lagrangian finite volume scheme, known as TPCORE, to calculate advection (Lin and Rood, 1996). The scheme uses the monotonic piecewise parabolic method under convergence conditions and a semi-Lagrangian method otherwise. Convective transport is calculated using archived convective mass fluxes (Wu et al., 2007). Boundary-layer mixing is based on the non-local scheme implemented by Lin and McElroy (2010). In this study, we use two different GEOS products (MERRA and GEOS-FP) to drive the model simulations. MERRA is a 30-year reanalysis product based on GEOS-5.2.0 (Rienecker et al., 2011). Its native resolution is 0.667∘ longitude by 0.5∘ latitude, with 72 vertical layers from the surface up to 80 km. GEOS-FP is the current operational product of GEOS-5.7 (and after) using an analysis developed jointly with NOAA's National Centers for Environmental Prediction (NCEP). It has a native resolution of 0.3125∘ longitude by 0.25∘ latitude, with the same vertical grids as MERRA. Both the MERRA and GEOS-FP fields are regridded to the resolution of 2.5∘ longitude by 2∘ latitude (with vertical layers reduced to 47 levels) to drive GEOS-Chem simulations in this study. The meteorological archives have temporal resolutions of 3 h for 3-D fields and 1 h for 2-D fields. MERRA and GEOS-FP use similar model schemes for fundamental dynamical and physical processes. They both use the modified Relaxed Arakawa–Schubert scheme for convection (Moorthi and Suarez, 1992) and a combined turbulence parameterization based on Lock et al. (2000) and Louis et al. (1981). Compared with MERRA, GEOS-FP made a few adjustments including, but not limited to, increasing re-evaporation in precipitation and adjusting the balance between local and non-local turbulent diffusion, with the former resulting in a considerable increase in water vapor in the tropical troposphere (Molod et al., 2012). MERRA-2, which is based on a newer version of GEOS-5 and shows improved climate over MERRA (Molod et al., 2015), is not used here since it was not ready to drive our model when this study was started.
GEOS-Chem (v11-01f; http://wiki.seas.harvard.edu/geos-chem/index.php/GEOS-Chem_v11-01, last access: 1 August 2020) includes a radionuclide (222Rn-210Pb-7Be) simulation option, which runs independently from the full oxidant–aerosol chemistry simulation. The radionuclide tracers have been used to evaluate chemical transport (Jacob et al., 1997; Yu et al., 2018) and wet deposition processes (Liu et al., 2001, 2004) in the model. The simulation of 222Rn includes emissions, transport (advection, convection, boundary-layer mixing), and radioactive decay. Wet and dry deposition of 222Rn are neglected in the model.
2.2 222Rn emission scenarios
The standard version of GEOS-Chem uses the 222Rn emission scenario of Jacob et al. (1997) (hereafter referred to as JA97). The World Climate Research Program (WCRP) Cambridge Workshop of 1995 (Rasch et al., 2000) previously used JA97 to compare 210Pb deposition processes in multiple atmospheric models. JA97 was developed using the estimated global mean 222Rn fluxes of Turekian et al. (1977) and only considered emission variations for a few broad latitude bands. The 222Rn emission fluxes in JA97 are uniformly set to be 1 atom cm−2 s−1 over land between 60∘ N–60∘ S, 0.005 atom cm−2 s−1 between 60–70∘ N and 60–70∘ S, and zero poleward of 70∘ N or 70∘ S. Emission fluxes over lakes and oceans are set to 0.005 atom cm−2 s−1. Emissions are reduced by a factor of 3 when surface temperature is below 0 ∘C on account of the depressed exhalation of 222Rn under freezing conditions. Such a temperature-dependent reduction can lead to underestimated emissions in winter because soils may not be totally frozen when the temperature falls below 0 ∘C for only a short period of time. The overall uncertainty of the JA97 emission scenario was estimated to be within 25 % globally (Jacob et al., 1997). Since the emission fluxes in JA97 are fairly uniform over land area, this simplistic emission scenario can be used to discern continental influence on air masses in global models and assess the effect of any changes in the model representation of convective mixing (Balkanski et al., 1992; Jacob et al., 1997).
A few 222Rn emission scenarios were published after Jacob et al. (1997). Conen and Robertson (2002) proposed a 222Rn emission scenario having a uniform 222Rn flux of 1 atom cm−2 s−1 from the continental surface in the Southern Hemisphere and tropics and a linear decreasing trend from 1 atom cm−2 s−1 at 30∘ N to 0.2 atom cm−2 s−1 at 70∘ N. This decreasing trend towards high latitudes was supported by experimental results showing a decrease of 222Rn fluxes in the local soil with a higher water table and organic portion. This proposed latitudinal gradient was found to be in a good agreement with an estimated value based on multi-year observations at a few Asian sites (Williams et al., 2009). However, this emission scenario is not used in this work because it does not include regional variations other than the linear latitudinal gradient.
Schery and Wasiolek (1998, hereafter SW98) published the first global 222Rn emission inventory that included detailed regional and seasonal variations on a monthly basis (at 1∘ longitude by 1∘ latitude resolution). The emission flux in SW98 is formulated by using a theoretical diffusion model of porous soil with controlling factors of soil radium content, soil moisture, and surface temperature. The estimated annual global average 222Rn emission flux was 1.63±0.43 atom cm−2 s−1, higher than the widely used JA97 constant value of 1 atom cm−2 s−1. Global 222Rn emissions in SW98 exhibited regional variations of a factor of 3 and seasonal variations of a factor of 2. The dominant factor in determining the regional variations in 222Rn fluxes was found to be the soil radium concentrations according to Schery and Wasiolek (1998). Emission fluxes in the United States and China feature more detailed regional variations because soil radium concentrations in these countries were incorporated. However, it was suggested that SW98 overestimated the global average 222Rn flux (Koch et al., 2006; Zhang et al., 2011). When using the SW98 emissions in a global model simulation of 210Pb, Koch et al. (2006) found it necessary to reduce the emissions by half to improve the excessive 210Pb concentrations in their model. In this study, we reduce the emission fluxes of SW98 globally by a factor of 1.6, as recommended by Zhang et al. (2011).
Zhang et al. (2011, hereafter ZK11) compiled a new global 222Rn emission inventory based on a combination of SW98 (with a global reduction factor of 1.6) and recently published 222Rn flux measurements in Europe and the United States (Szegvary et al., 2007), China (Zhuo et al., 2008), Australia (Griffiths et al., 2010), and oceanic regions (Schery and Huang, 2004). In ZK11, 222Rn emissions in Europe were derived from a demonstrated linear relationship between the terrestrial gamma dose rate and 222Rn emissions (Szegvary et al., 2007). The relationship allows for a convenient calculation of regional 222Rn emissions for places where automatic measurements of gamma dose rate have been established, e.g., in Europe (Szegvary et al., 2009). This 222Rn emission inventory for Europe has recently been updated (Karstens et al., 2015; López-Coto et al., 2013) with further detailed information on soil and surface roughness and minor modifications about handling 222Rn transport in porous media. A high-resolution (25 km × 25 km) 222Rn emission map for China was included in ZK11 based on work by Zhuo et al. (2008), who estimated the nationwide emissions according to measurements of radium content in surface soil at 1099 sites in China. The oceanic emission flux used was 0.00182 atom cm−2 s−1, derived by Schery and Huang (2004) with a gas transfer model, significantly lower than typical 222Rn emissions over land. For model surface grid boxes containing both land and water surfaces, we sum 222Rn emission fluxes weighted by their respective areas of land or water.
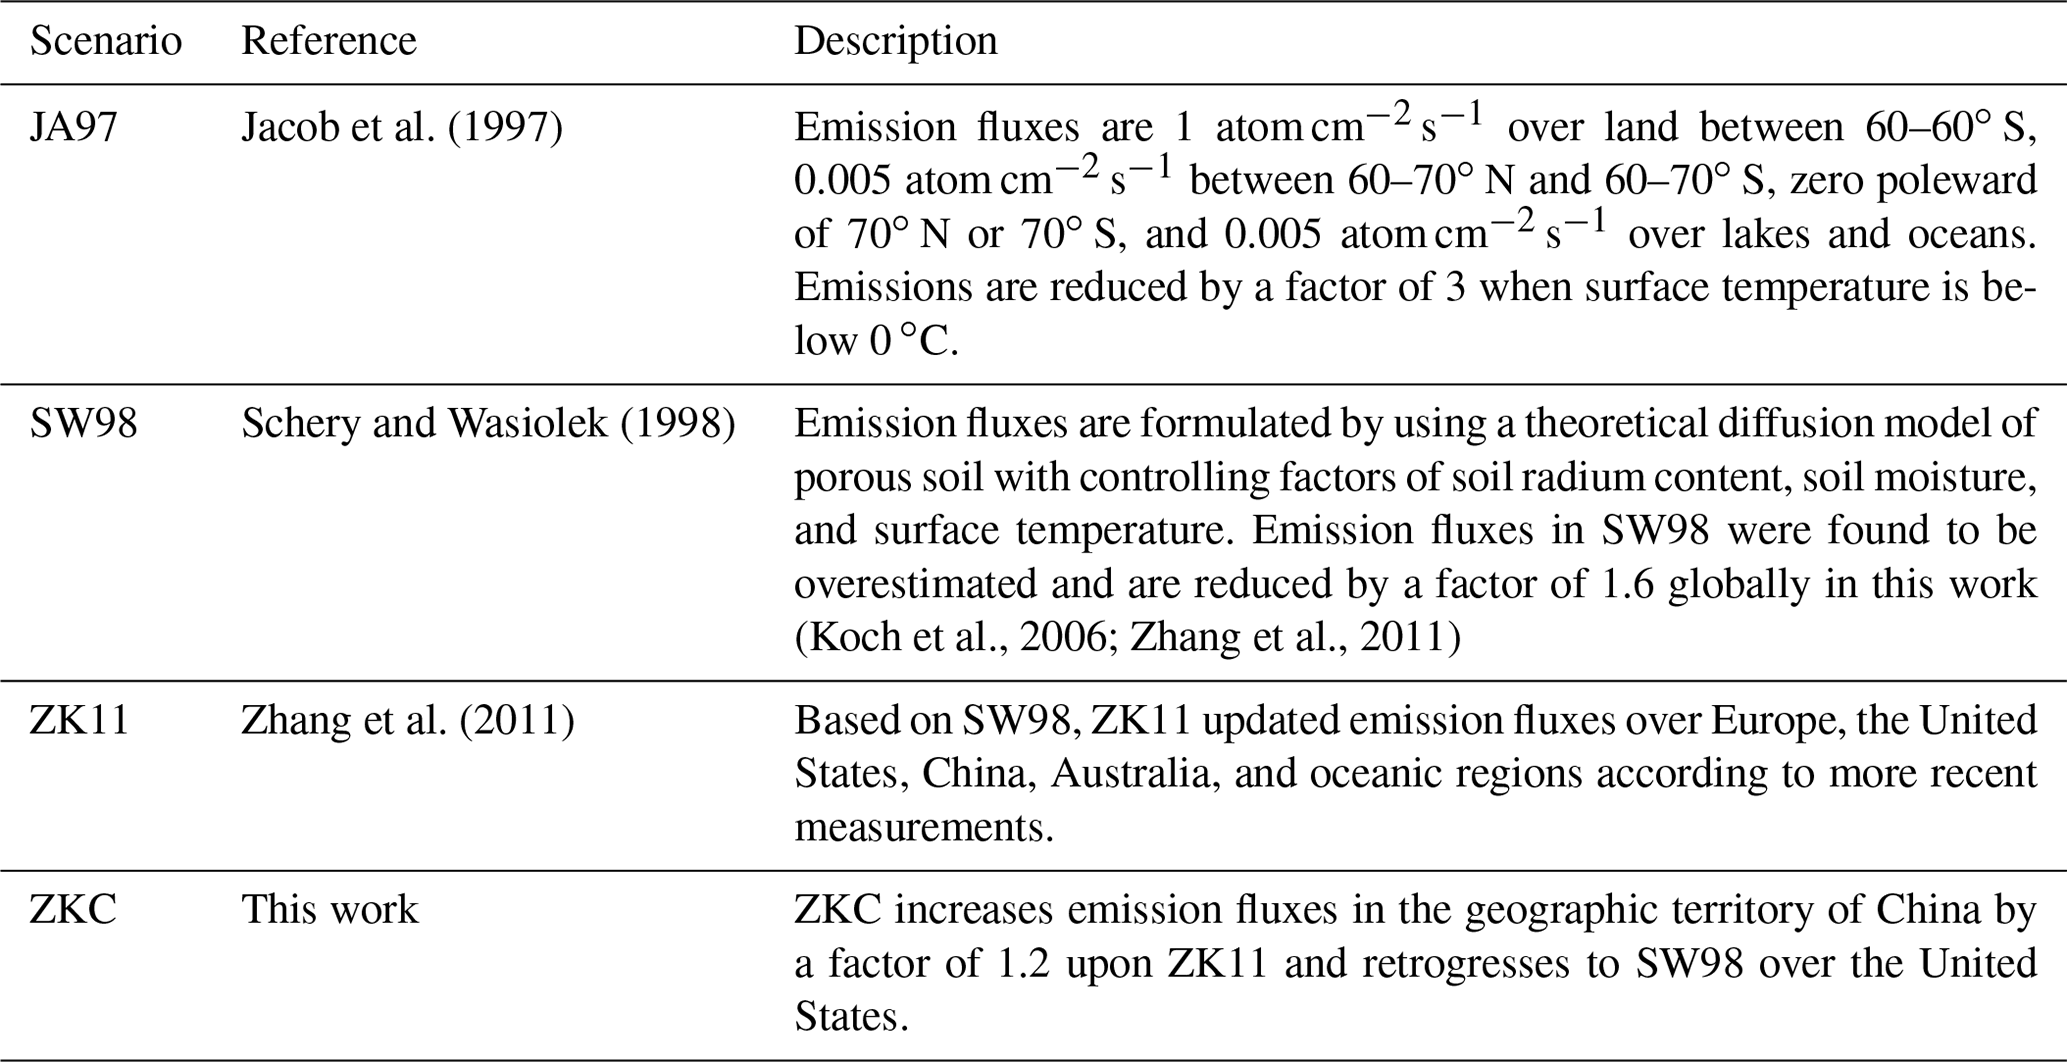
In this study, we modify ZK11 to a customized 222Rn emission scenario (hereafter referred to as ZKC) and constrain the inventory with observations of surface 222Rn concentrations. This customized emission scenario adopts ZK11 for most areas except for North America, where the SW98 emission fluxes are used with a reduction factor of 1.6, following previous model studies (Koch et al., 2006; Zhang et al., 2011). We also increase the emission over China by a factor of 1.2 all year round due to potentially underestimated 222Rn emission there, which will be discussed in detail in Sect. 3.2. The emission enhancement factor is only tentative due to very few surface 222Rn measurements available in western China and a lack of seasonality in the measurements. Since ZK11 has been tested with satisfactory agreement between modeled and observed surface concentrations in Europe (Zhang et al., 2011), the updates for emission fluxes in Europe by López-Coto et al. (2013) and Karstens et al. (2015) are not included. The largest terrestrial spatial variation of 222Rn emission rates in ZKC is a factor of 10. A description of the four emission scenarios is given in Table 1.
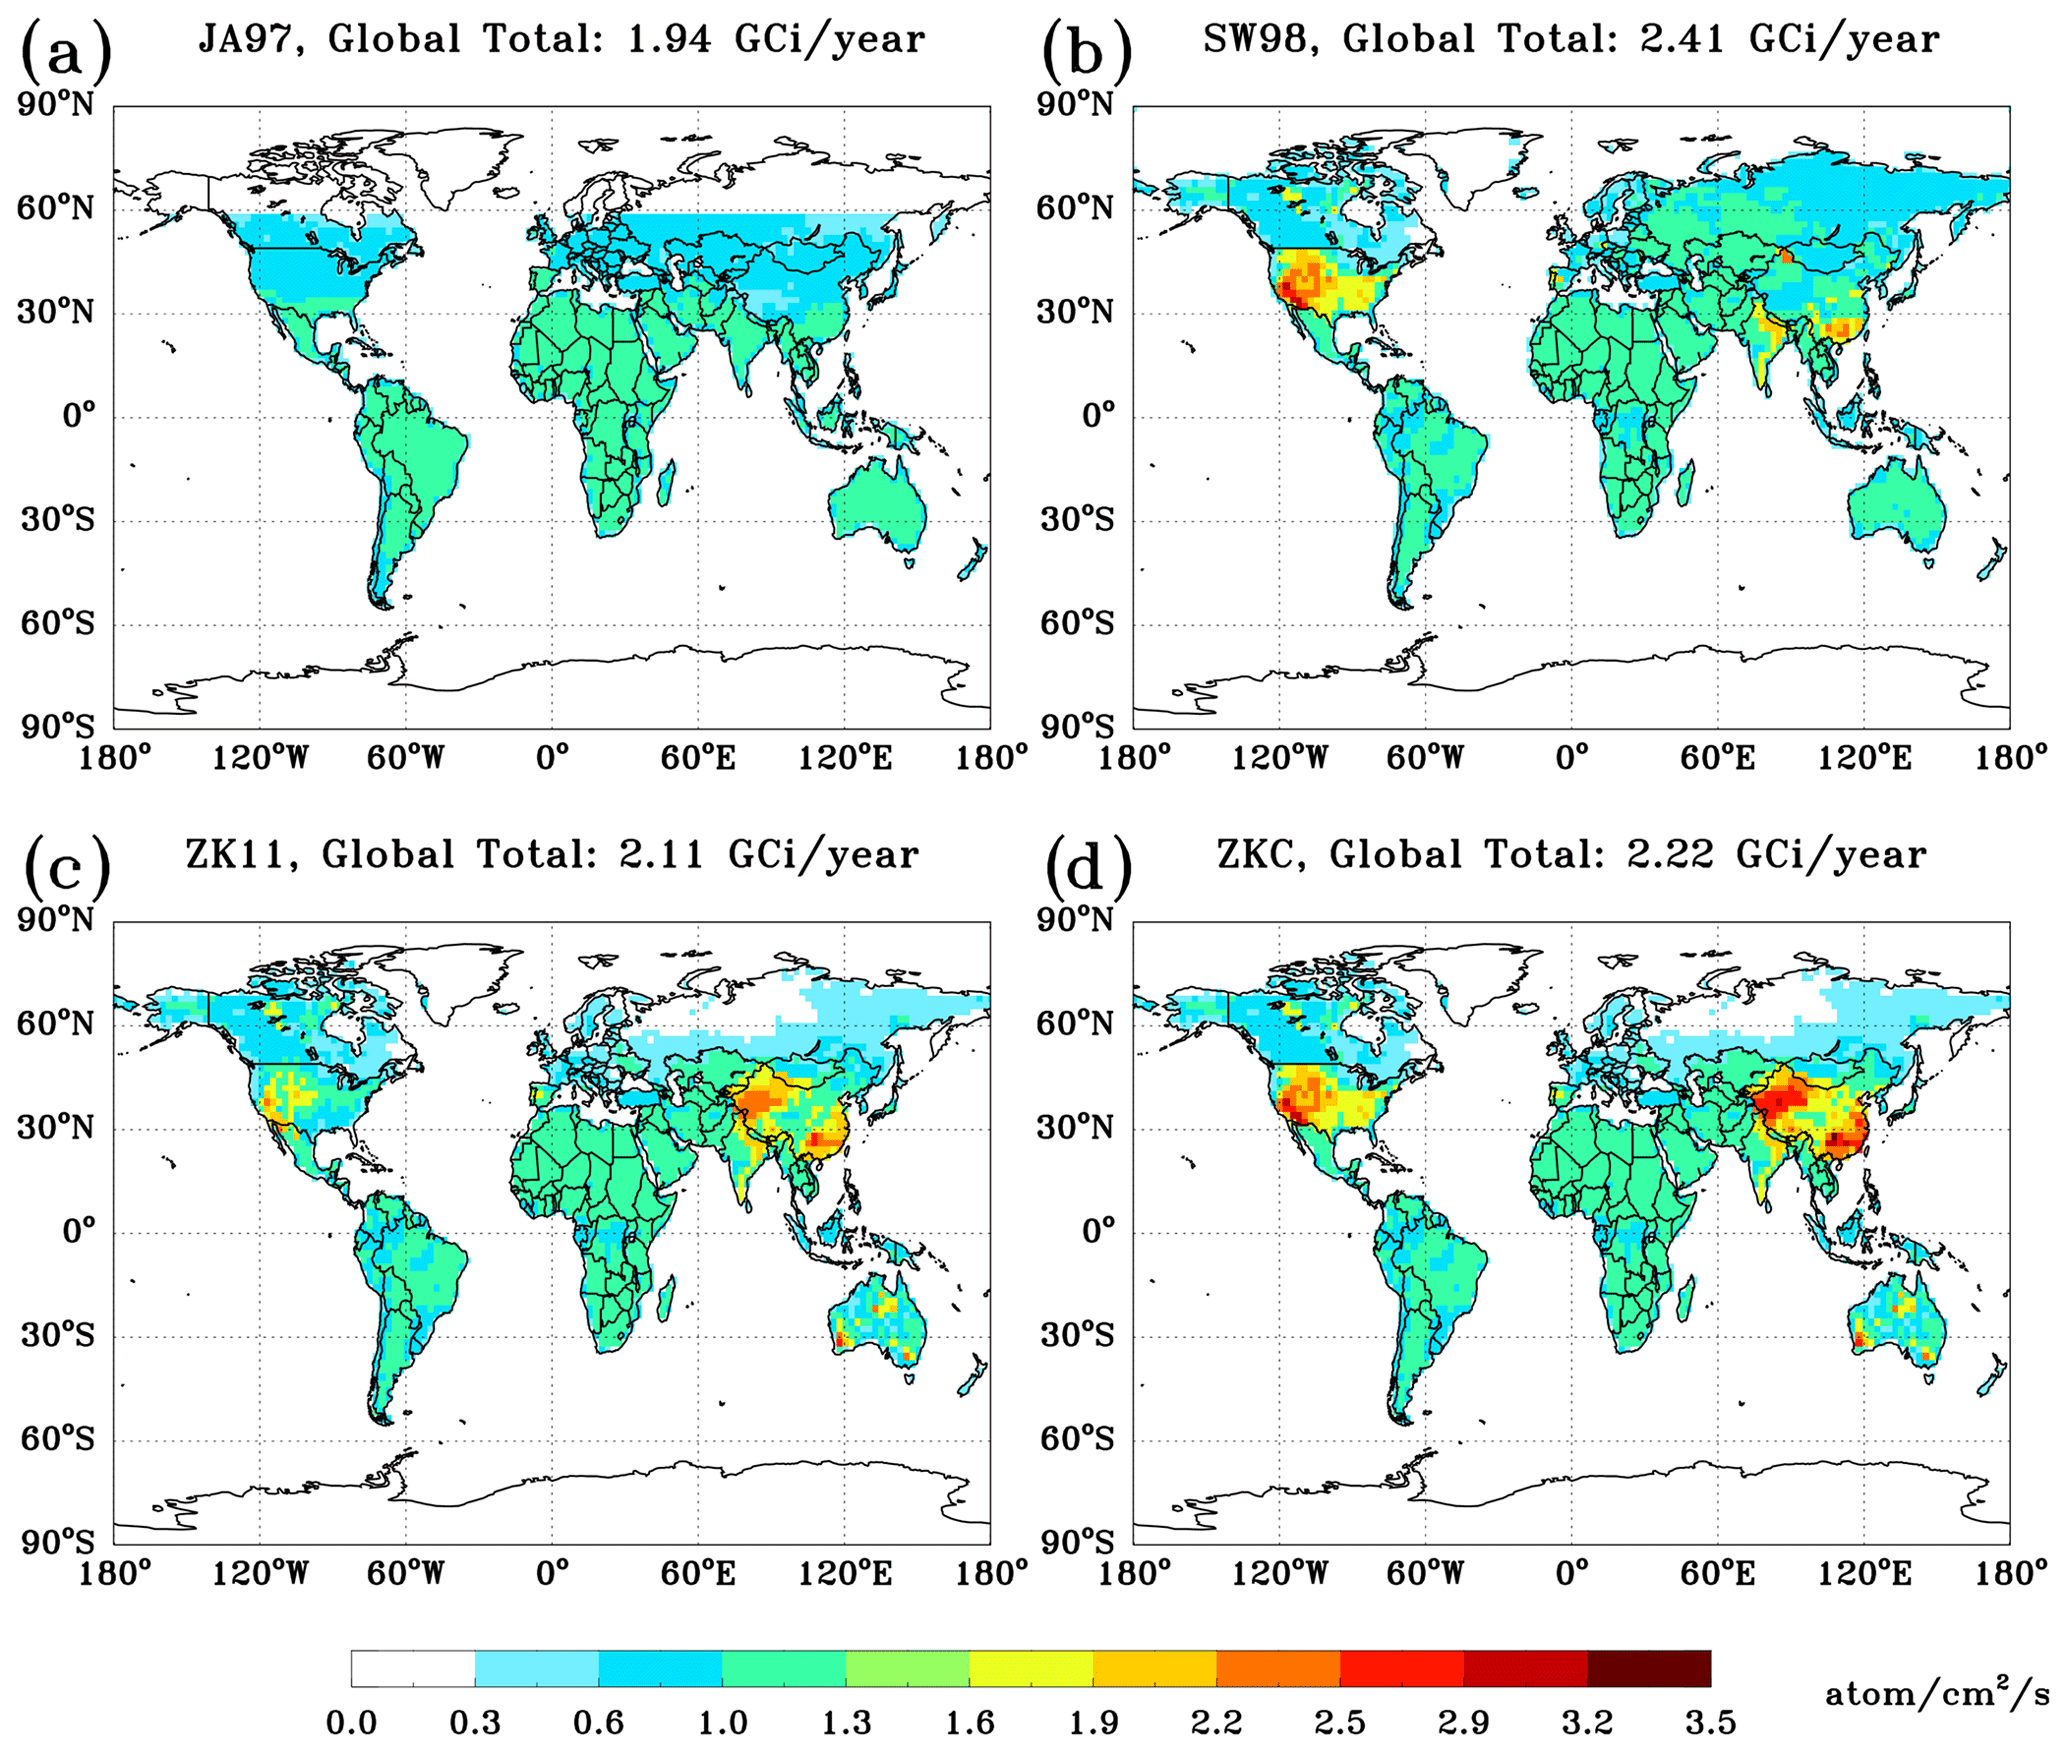
Figure 1Global annual mean surface 222Rn emission fluxes (atom cm−2 s−1) of four emission scenarios used in this study. (a) JA97, the default emission scenario in the standard version of GEOS-Chem (Jacob et al., 1997); (b) SW98, the first global 222Rn emission inventory with regional variability based on a soil emission model (Schery and Wasiolek, 1998); (c) ZK11, a recently published global 222Rn emission inventory combining SW98 and recent measurements of 222Rn fluxes (Zhang et al., 2011); and (d) ZKC, which is ZK11 with customized adjustments to better match observations (this work).
Figure 1 shows the global annual mean 222Rn emission fluxes of the four emission scenarios described above. Compared with the standard GEOS-Chem 222Rn emission scenario (JA97, Fig. 1a), the other three show evident spatial variations of varying extents due to incorporation of observations and estimates from soil exhalation models. The estimated global total 222Rn emissions for JA97, SW98, ZK11, and ZKC are 1.94, 2.41, 2.11, and 2.22 GCi yr−1 (where GCi denotes the unit gigacurie), respectively. Since there is no consensus on the global total 222Rn emission, we do not normalize the total emission amount for each scenario. Instead, the overall evaluation of the emission scenarios is based on comparisons with surface 222Rn observations. It is clearly shown in Fig. 1 that the three later 222Rn emission scenarios have substantial enhancements of 222Rn emission fluxes in North America and East Asia. SW98 exhibits more intense 222Rn emissions in North America, which have been adopted in ZKC. In the northern polar region, SW98 presents much higher 222Rn emissions over Siberia extending to higher latitudes. JA97 is overly simplified and has nearly no emissions over Siberia due to temperature-dependent reduction in the cold high-latitude regions. The ZK11 emissions in Siberia stay between those of JA97 and SW98, with somewhat higher emissions in eastern Siberia. ZK11 has much higher 222Rn emissions in China, which are further scaled up by a factor of 1.2 in ZKC.
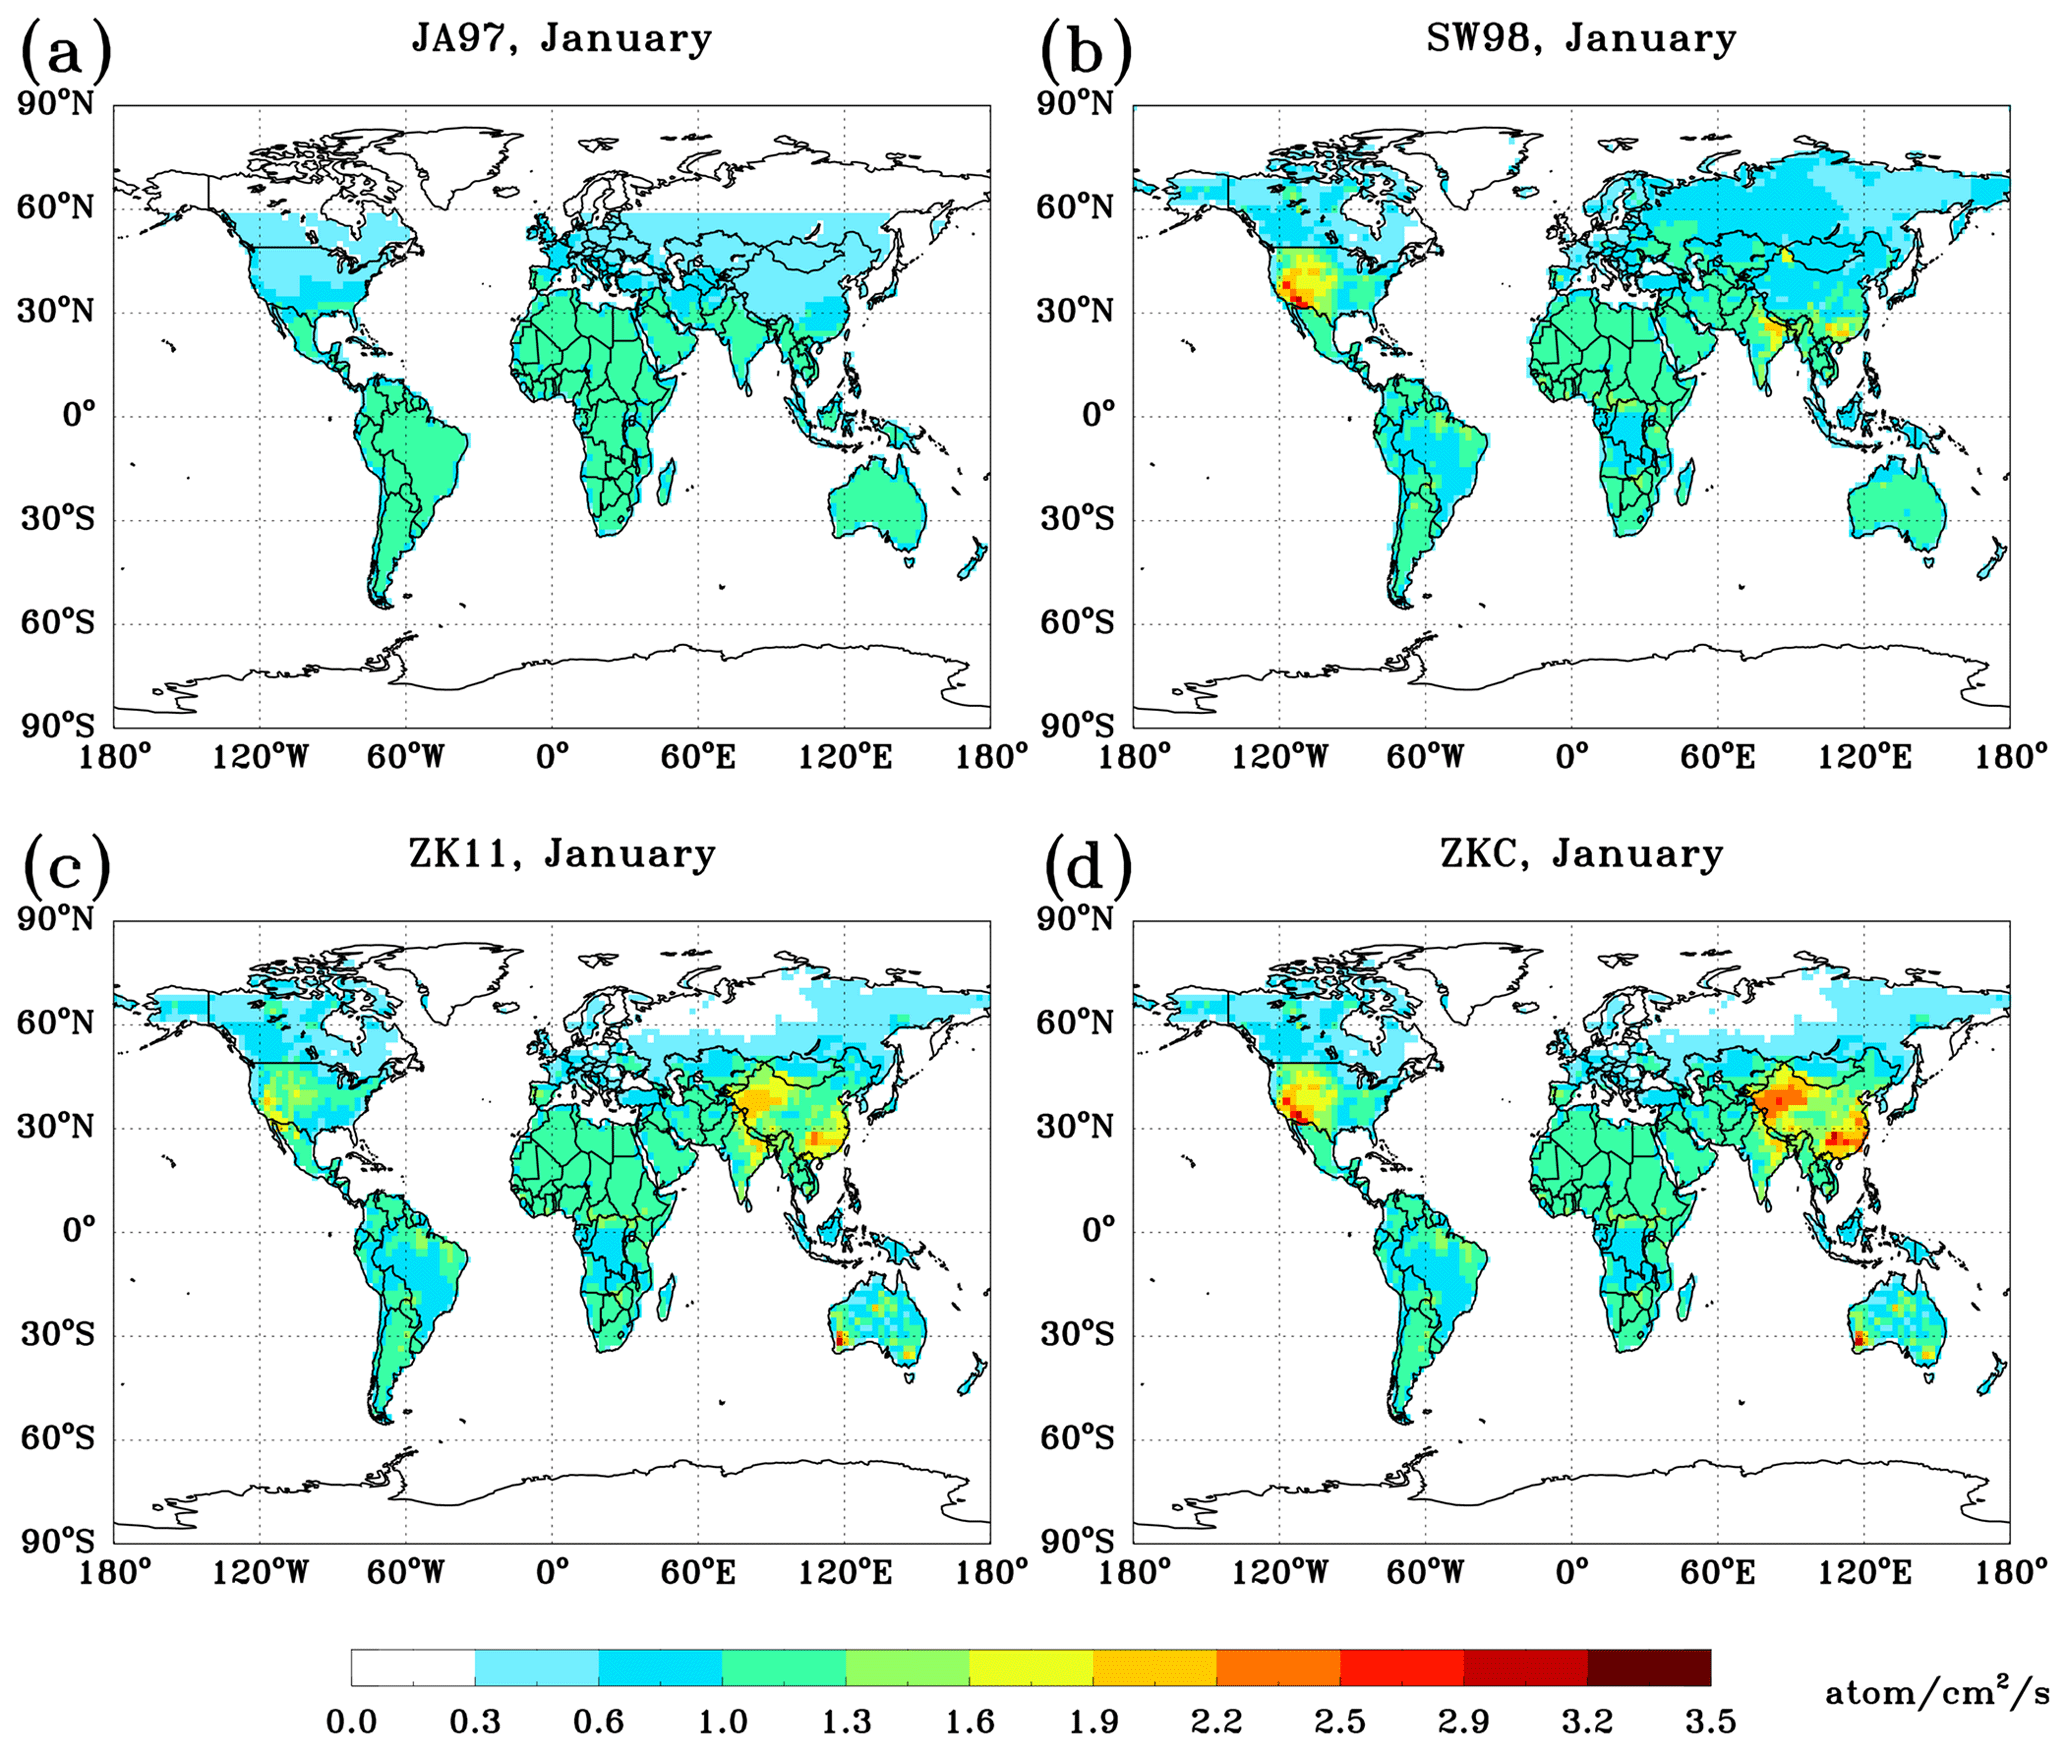
Figure 2Same as Fig. 1 but for January.

Figure 3Same as Fig. 1 but for July.
Seasonal variations of 222Rn emissions are considered in all four scenarios but with different approaches. In JA97, 222Rn emissions are reduced by a factor of 3 when surface temperature in the driving meteorological fields falls below 0 ∘C, thus resulting in seasonal variations of 222Rn emissions in high-latitude regions. In the other emission scenarios, the monthly varying 222Rn emission fluxes in each model bottom layer are prescribed based on observed and assumed soil parameters (see SW98) and do not change from year to year. Figures 2 and 3 compare monthly mean 222Rn emissions for January and July in the emission inventories. 222Rn emissions are generally the lowest in January because of the inhibition of exhalation as a result of ice cover and high moisture content. All emission scenarios exhibit increased global 222Rn emissions by a factor of 1.2 to 1.4 in July compared with January due to enhanced emissions over the Northern Hemisphere continents. The summer–winter changes of local emissions are mostly within a factor of 2. The possible underestimation of emissions for surface temperatures under 0 ∘C is revised in the later emission scenarios, leading to increased wintertime emissions in central and East Asia, North America, and southern Europe (Fig. 2a vs. d). The affected regions extend to lower latitudes in East Asia and North America compared with relatively warmer Europe.
Compared to JA97, significant emission increases occur in middle–low latitudes where land is covered by desert or mountainous texture in the later emission scenarios, e.g., the western united States and western China. Rocky and desert land types are more favorable for 222Rn emission compared with soil. Previous related literature and analyses support these emission modifications based on evaluations against existing surface observations. We speculate that some degree of emission increase would be reasonable in the Middle East and North Africa, where land is mostly covered by desert. Emissions in these areas in ZK11 and ZKC are adapted from SW98, which uses a world average surface radium content to calculate 222Rn emission. No observations of surface radium content or 222Rn concentrations exist for evaluating speculated emission modifications, but future changes are possible when measurements become available in these areas.
2.3 Model simulations and observational data
We simulated 222Rn with the model driven by MERRA using the four emission scenarios. The preferred emission scenario was then identified based on a comparison of simulated and observed surface 222Rn concentrations and seasonality. To characterize convective transport in the MERRA and GEOS-FP products, we also conducted model sensitivity experiments for which convective transport was turned off. All simulations were conducted for the year of 2013 with a 12-month spin-up, which was initialized with a climatological restart file from previous model simulations. Table 2 lists all the model experiments and their configurations.
Table 2Configurations of GEOS-Chem simulations (v11-01f, 2∘ × 2.5∘) used in this work.
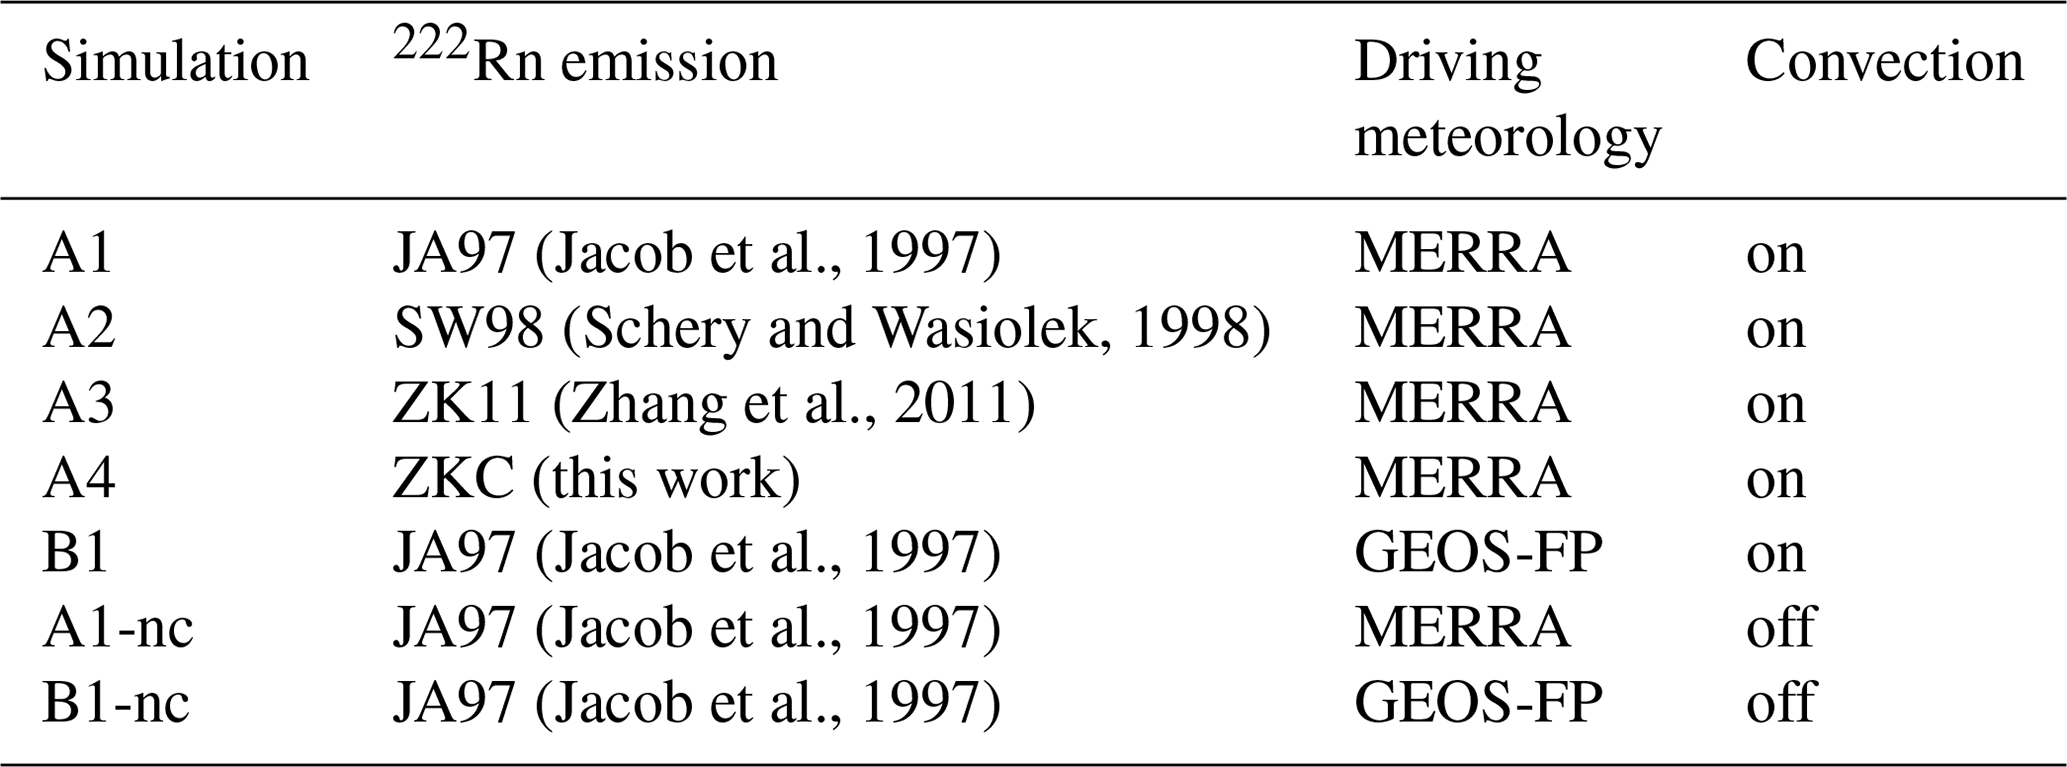
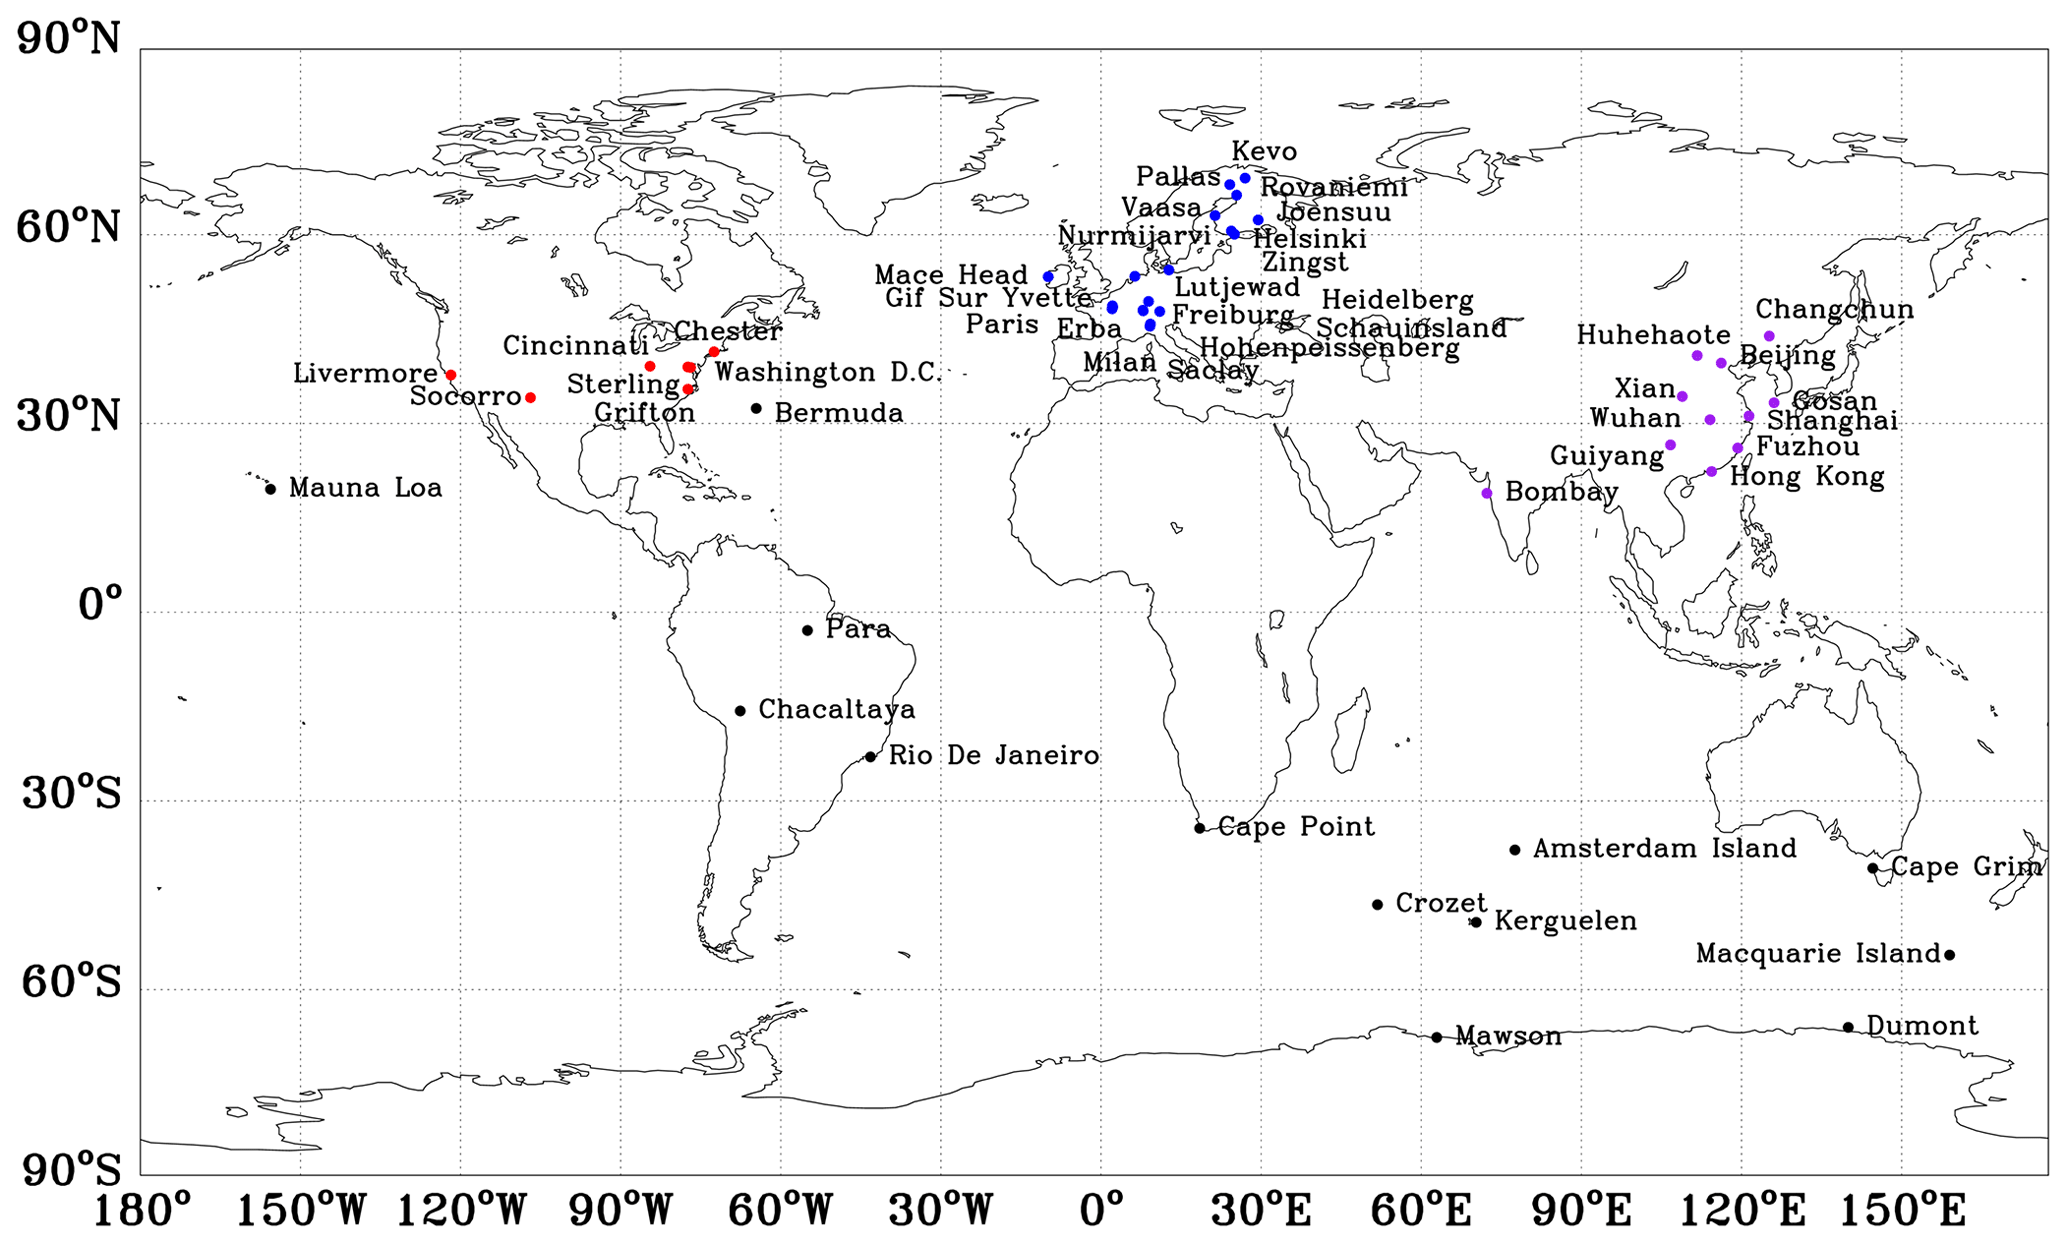
Figure 4Locations of surface 222Rn measurement sites. Sites in four distinctive regions are color-coded: Europe (blue), Asia (purple), North America (red), and remote regions (black). Refer to Table 2 of Zhang et al. (2011) for more details.
We evaluate the 2013 simulations against long-term monthly or annual 222Rn observations. We used the observed surface 222Rn concentration dataset compiled by Zhang et al. (2011), who evaluated the ZK11 emission scenario in their model. Figure 4 shows the locations of 51 surface 222Rn measurement sites. The sites are concentrated in Europe, North America, and East Asia. Fewer sites (11) are located in the Southern Hemisphere. No observations in boreal Canada and Siberia are available. The few inland sites in China only reported annual means based on measurements of 1–2 years (Jin et al., 1998). The 222Rn observations were made in multiple years, and we treat the calculated multi-year monthly means as climatological. We also include longer period observations at Mauna Loa (2004–2010; Chambers et al., 2016c) and Gosan (2001–2010; Chambers et al., 2016b) stations in addition to those compiled by Zhang et al. (2011) in our analyses below. Considering the monthly climatological surface 222Rn observations used in the comparisons, simulations driven by MERRA for alternative years do not change the conclusions of this study.
To examine simulated convective transport characteristics, we compare model results with four observational datasets of 222Rn vertical profiles (Liu et al., 1984; Zaucker et al., 1996; Kritz et al., 1998; Williams et al., 2011). The scarcity of 222Rn airborne measurements is partly due to the fact that the measurement requires an extraction and counting facility nearby in order to minimize decay and that the process of radon extraction is labor-intensive (Williams et al., 2011). Liu et al. (1984) compiled an extensive dataset of 222Rn profiles for different seasons based on airborne measurements made in the 1950s–1970s. The summertime average profile was calculated from 23 sites in the United States, Ukraine, and central Asia and mainly represents the summertime 222Rn vertical distribution over the Northern Hemisphere midlatitude continental regions. Zaucker et al. (1996) reported nine 222Rn profiles measured during flights from the east coast of Canada (Nova Scotia and New Brunswick) to the North Atlantic as part of the North Atlantic Regional Experiment (NARE; August 1993). Kritz et al. (1998) measured 222Rn vertical profiles at Moffett Field (37.4∘ N, 122.0∘ W), a coastal site in California, United States, during April to August in 1994. The Moffett profile represents summertime 222Rn vertical distribution over an offshore region. Williams et al. (2011) made aircraft measurements of 222Rn profiles up to 3.5 km altitude at Goulburn (34.8∘ S, 149.7∘ E), an inland rural site in New South Wales, Australia, during May 2006–2008 and January 2007 (Williams et al., 2011).
3.1 Model surface 222Rn
Figure 5a–b show the global surface 222Rn concentrations for January and July 2013, as simulated by GEOS-Chem with the JA97 emission scenario (simulation A1, Table 2). Surface 222Rn concentrations are much higher over land at low latitudes and midlatitudes compared with marine areas and high latitudes. Typical surface 222Rn concentrations over land range from a few hundreds to about 1.0 × 10⁴ mBq SCM−1. Surface concentrations drop sharply from land to oceanic regions due to the short lifetime of 222Rn, with values over the oceans ∼ 2–3 magnitudes lower and ranging from tens to a few hundreds of mBq SCM−1. The model simulates a noticeable outflow of 222Rn at surface level from the west coast of Africa to South America in January. Surface 222Rn concentrations are higher overall in winter due to shallower boundary layers than in summer (Fig. 5a vs. b). For example, concentrations in Europe, central and East Asia, and North Africa are lower by a few thousands of mBq SCM−1 in July (summer), while concentrations in South Africa, Argentina, and Australia are higher by similar magnitudes in July (winter). The contrasting seasonality of surface 222Rn concentrations (high in winter) compared to emission fluxes (high in summer) suggests that the accumulation effect in shallower boundary layers (weakened vertical transport and mixing; see Fig. S1 in the Supplement) dominates the seasonal changes in emission when it comes to determining the seasonality of surface 222Rn concentrations.
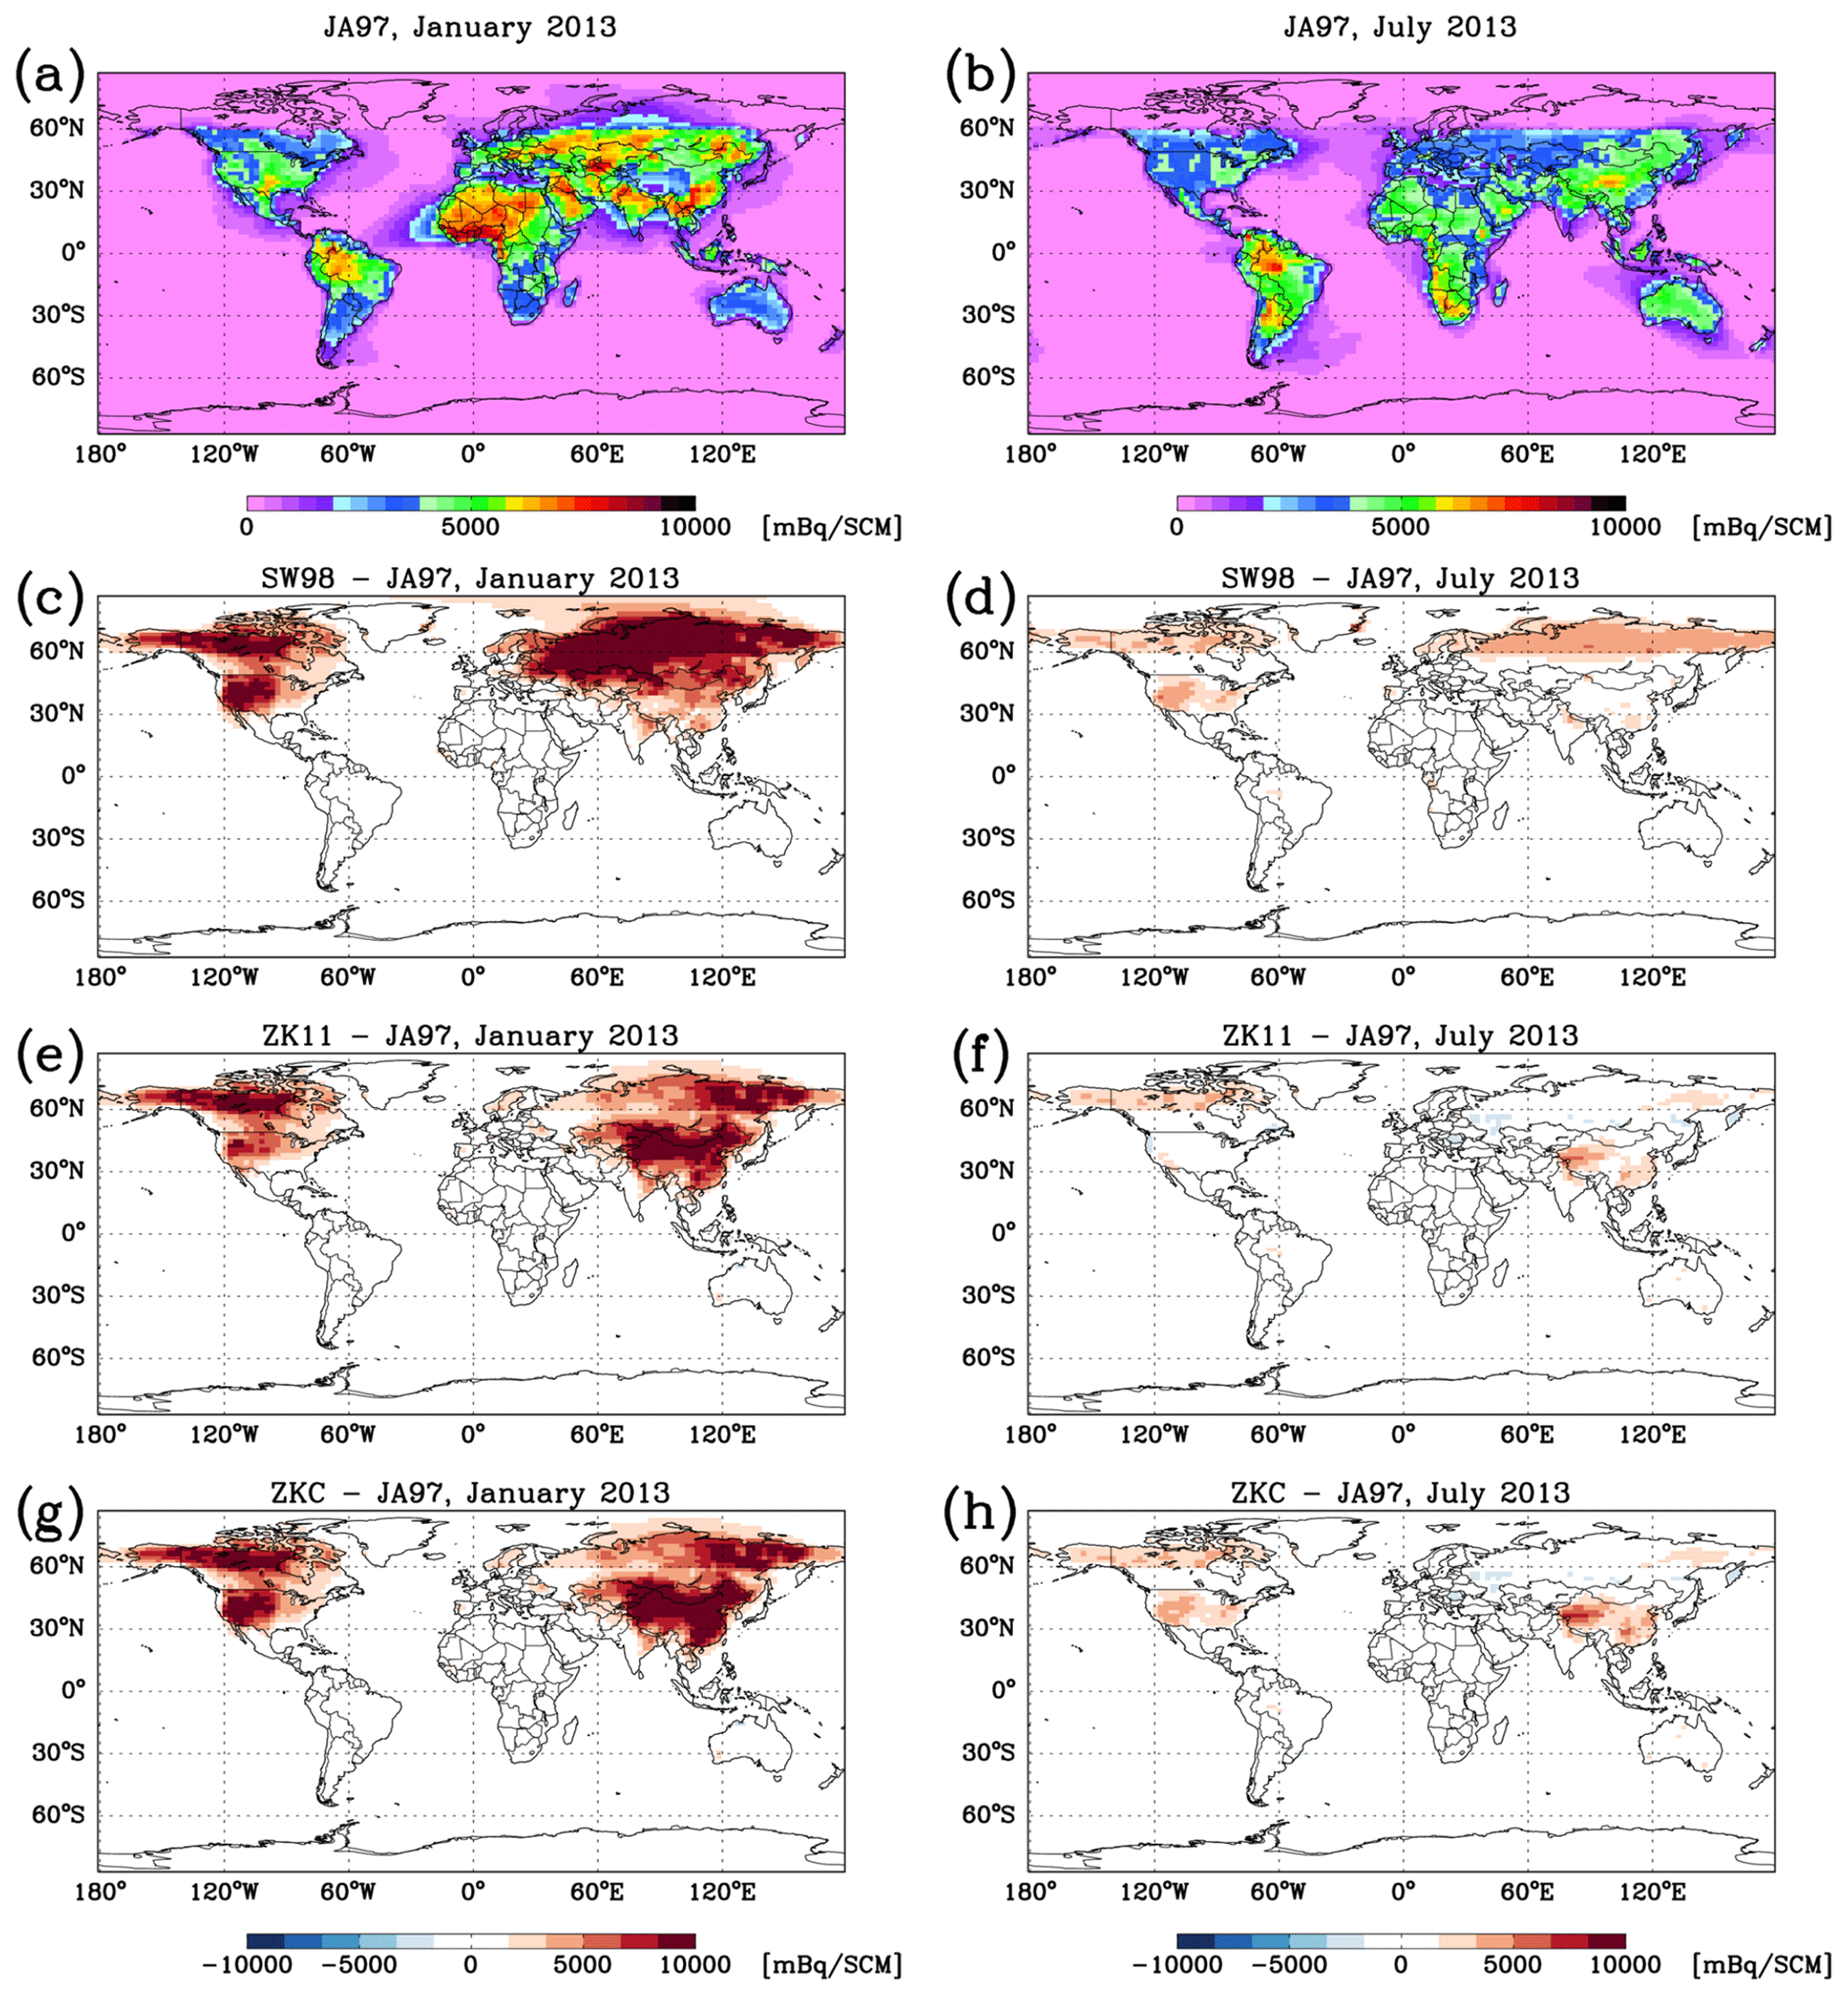
Figure 5Simulated monthly surface 222Rn concentrations (mBq/SCM) for (a) January 2013 and (b) July 2013 with the JA97 emission scenario (A1; see Table 2). Panels (c)–(h) are the same as panels (a) and (b) but show the changes in surface 222Rn concentrations when SW98 (A2), ZK11 (A3), and ZKC (A4) emissions are used in the model, respectively.
Figure 5c–h show the changes in simulated surface 222Rn concentrations when the SW98, ZK11, and ZKC emissions are used (simulation A2–A4, Table 2), relative to the standard simulation with the JA97 emissions. All three alternative 222Rn emission scenarios lead to remarkable increases in surface concentrations in midlatitude and high-latitude regions of North America and Asia. With SW98 (simulation A2, Fig. 5c), wintertime surface 222Rn concentrations increased from very low levels (< 1000 mBq SCM−1) to about 1.0 × 10⁴ mBq SCM−1 in many high-latitude regions, including the northwestern United States, Alaska, and northern Canada, as well as in the continental areas extending from eastern Europe through Siberia to the Bering Strait. These large increases are mainly due to the zero emission flux rate prescribed for high latitudes (> 60∘ N) in JA97, which is replaced in SW98 by fluxes from 0.3 to 0.6 atom cm−2 s−1(Figs. 2b and 3b). As shown later, this characteristic in JA97 overly simplifies 222Rn emission variations and causes underestimation of surface 222Rn concentrations in high-latitude regions in winter. Accumulation of 222Rn in the shallow winter boundary layer also contributes to and enhances the differences in surface 222Rn concentration caused by increased emissions. In the ZK11 simulation, similar enhancements of surface 222Rn appear in North America, China, and the far east of Siberia (Fig. 5e, f), but the overall magnitudes of enhancement are smaller than those with SW98. The largest enhancements in Asia shift to the east and are seen in eastern Siberia rather than the whole of boreal Siberia. ZK11 incorporates recent 222Rn flux measurements in Asia (K. Zhang et al., 2008) and shows some smaller changes from those of JA97 in Siberia. Since ZKC and SW98 share the same emissions for North America, the surface concentration changes are mostly identical between the two. For the same reason, the ZKC and ZK11 results look similar in Asia, except that the surface concentrations over China are more enhanced due to the upscaling in ZKC. In July (Fig. 5d, f, h), the changes in surface 222Rn concentrations are much less significant for all emission scenarios. This also reflects the strong effects of summer boundary-layer ventilation, which largely compensates for the differences caused by the seasonal emission changes.
3.2 Evaluation of emission scenarios with surface observations
Following Zhang et al. (2011), we evaluate the 222Rn emission scenarios by comparing model results with surface observations of 222Rn concentrations. We conduct the comparisons in the form of scatter plots for Europe (EU), Asia (AS), North America (NA), and over the globe (ALL), respectively (Fig. 6). For each observed monthly or annual mean, model output was sampled in the grid cell corresponding to the physical location and elevation of each site and then averaged for the corresponding observation time period. Also shown in Fig. 6 are the reduced major axis linear correlation coefficients (R; Hirsch and Gilroy, 1984) and the percentages (P) of the data points lying within a range of a factor of 2 (dashed lines).
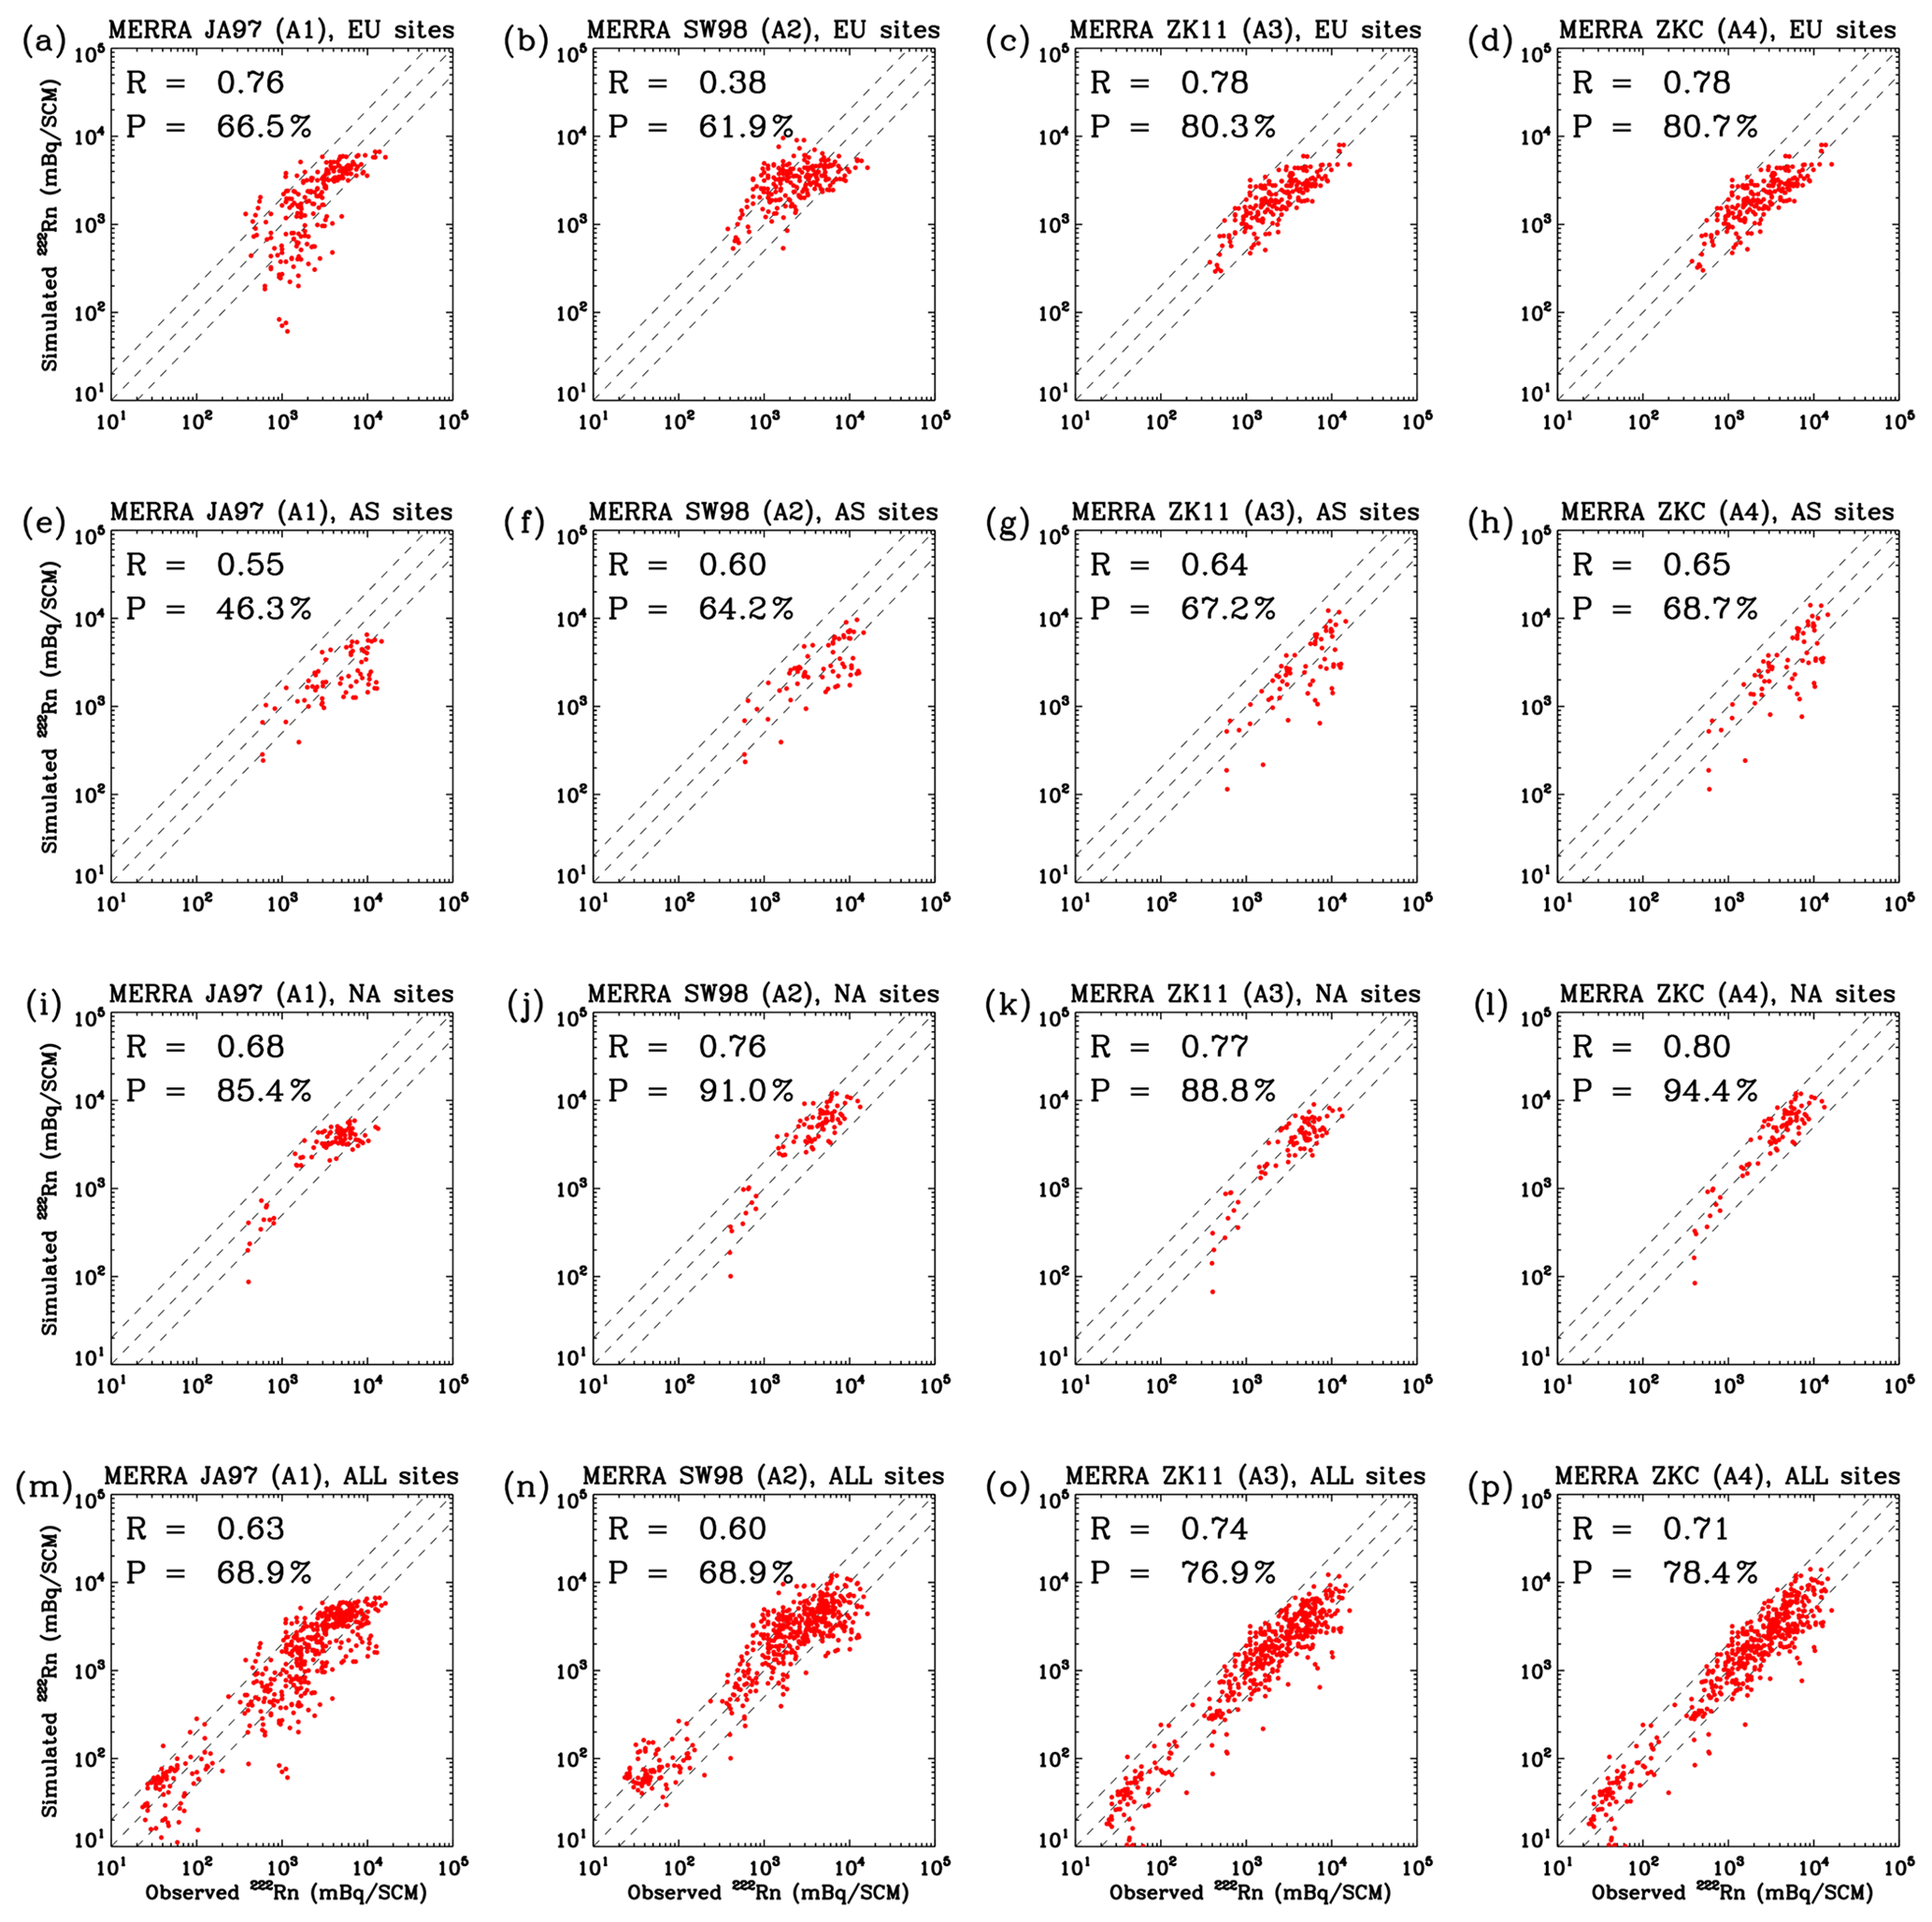
Figure 6Comparisons between simulated and observed monthly surface 222Rn concentrations (mBq/SCM) over the continents of Europe (EU, first row), Asia (AS, second row), and North America (NA, third row) and over the globe (ALL, last row), respectively. The four columns correspond to simulations (A1–A4) with the four emission inventories (JA97, SW98, ZK11, and ZKC; see Table 2). Dashed lines indicate the range within a factor of 2 of the 1-to-1 line. P is the percentage of samples within this range. R in the legends is the two-sided linear regression correlation coefficient. The lines of best fit are calculated using the reduced major axis method (Hirsch and Gilroy, 1984).
Europe is the continent where emission fluxes and transport of 222Rn have been studied most extensively. The measurements are more widely and evenly distributed across the continent (Fig. 4). The JA97 simulation (A1, Table 2) shows moderate agreement with observations (P = 66.5 %) bearing some large underestimates (Fig. 6a). The SW98 simulation has the lowest P value of 61.9 % (Fig. 6b) due to a large number of points with high biases. ZK11 and ZKC use the same 222Rn emissions in Europe, and the P values are close (80.3 % and 80.7 % in Fig. 6c and d, respectively). The better agreement when using ZK11 and ZKC substantiates the high-resolution 222Rn emission estimates derived from gamma dose rates in Europe (Szegvary et al., 2009). Schmithüsen et al. (2017) compared measured 222Rn concentrations across the European sites in terms of different instruments and measurement systems and provided suggested scaling factors for each site. Here, the same evaluation for the emission scenarios with the scaling factors is given in Fig. S2. There are only slight changes in the P values for all regional groups, and the same rank of the four emission scenarios remains.
All simulations exhibit some degree of underestimation in Asia (Fig. 6e–h). Monthly mean observations are available for 7 of the 12 Asian sites; otherwise only annual means are available. Consequently, data points are sparse in Fig. 6e–h. The JA97 simulation shows poor agreement for Asia (P = 46.3 %, Fig. 6e). Agreement for the others is better but still deficient, with P values of 64.2 %, 67.2 %, and 68.7 % for SW98, ZK11, and ZKC, respectively (Fig. 6f–h). The few underestimated data points in Fig. 6g and h are observed annual means from the inland Chinese sites. The observations in China were taken between 1 and 1.5 m above ground according to Jin et al. (1998). The model surface layer concentrations usually represent the averages in the model bottom layer (∼ 100 m high) and thus may be literally lower than the observations due to the steep concentration gradients near the surface, especially during nighttime (Chambers et al., 2011). On the other hand, there are possible low biases in the 222Rn concentrations derived from 222Rn progeny measurements (Schmithüsen et al., 2017; Grossi et al., 2020), lessening the above model underestimate due to large near-surface vertical gradients. These biases differ on a case-by-case basis and are difficult to quantify. With upscaled emission in ZKC, the improvement compared with ZK11 is minor. To better match the Asian observations, we tentatively conducted additional model simulations in which the Asian 222Rn emission fluxes are scaled up by a factor of 1.5 or 1.7 (instead of 1.2 in the recommended ZKC). The P values from those simulations are larger with some previously underestimated data moving into the factor-of-2 range; upscaling by a factor of 1.5 would increase the P value to above 70 %, but the simulated total 210Pb deposition fluxes at midlatitudes would be substantially overestimated (Zhang et al., 2021). As will be discussed in Sect. 4, a few studies reported unusually high surface concentrations and large emission fluxes at individual sites in Asia; the evidence in these studies endorsed a higher upscaling factor, which would reduce the model underestimates of surface concentrations. However, without knowing the distributions and varying extents of emission biases in Asia, applying a higher and uniform scaling factor to the whole region may worsen the global simulation of 210Pb deposition. The few annual means that lead to the low P values may not be as representative as the monthly data and can be biased. Therefore, we use a tentative scaling factor of 1.2 for emission fluxes in China (i.e., ZKC) and expect future improvements when more observations of 222Rn emission and surface concentrations become available.
All simulations reproduced the observed surface 222Rn concentrations in North America well (Fig. 6i–l). SW98 (Fig. 6j) and ZKC (Fig. 6l) share identical 222Rn emissions over North America, and simulations with both emission scenarios show excellent agreement with the observations (P ∼ 90 %, Fig. 6j, l). This suggests that SW98 is an adequate option for 222Rn emissions in North America. Interestingly, ZKC leads to slightly better agreement compared with SW98, although identical emissions were used for North America. A few overestimated data points in the simulation with SW98 are better simulated with ZKC at the United States west coast sites, as a result of the large reduction in emissions over the upwind Siberia regions (Fig. 1d). Despite the good agreement between model results and observations, the evaluation is limited to the western and eastern coastal regions of the United States. Data from Africa, the central United States, and Canada are currently lacking and would otherwise improve the model evaluation, especially over North America.
Figure 6m–p show the overall evaluation of the model results against measurements at all 51 surface sites over the globe. Both ZK11 and ZKC simulations show better agreement with observations (P = 76.9 % and 78.4 %; Fig. 6o, p), suggesting that ZK11 and ZKC are potentially better choices for replacing the JA97 emission scenario in the standard version of GEOS-Chem, although with its provisional effort to address high Asian emissions, ZKC is a step ahead of ZK11. The large biases of a few points outside the factor-of-2 range are from the Antarctic sites. None of the simulations can reasonably represent observations in Antarctica, which can be attributed to emission that is not well characterized (Chambers et al., 2018) and will be discussed later. If the two Antarctic sites (with model low biases in the lower left corner of Fig. 6o, p) were excluded, the P values for ZK11 and ZKC would increase to over 80 %.
Unusually high 222Rn emissions have been observed over mainland Asia (Iida et al., 2000; Yamanishi et al., 1991) and downwind regions (e.g., Korea; Zahorowski et al., 2005). These high 222Rn emissions, not well represented in JA97-like emission scenarios, were likely responsible for the failure of CTMs in capturing the 222Rn concentrations observed in East Asia (Jacob et al., 1997). In particular, 222Rn emissions over China have been underestimated at inland cites (Zhang et al., 2011). China and India have been identified as regions of high 222Rn emissions from soil. It was suspected that this is partially due to high soil content of radium (Schery, 2004; Zhuo et al., 2008). Schery (2004) presented global measurements of radium content in soil, which clearly indicated that the radium concentrations are higher by about a factor of 3 in the southeastern compared to the northwestern China. Consistent with this, Zahorowski et al. (2005) found that surface 222Rn concentrations were roughly 3 times higher at Hok Tsui (Hong Kong) during winter compared to Gosan, where fetch is from northern China and Mongolia. Zhuo et al. (2008) provided an estimated area-weighted annual average 222Rn emission of 29.7 mBq m−2 s−1 (∼ 1.41 atom m−2 s−1) in China. Based on 3-year wintertime 222Rn observations at Sado Island, Japan, and associated trajectory analyses, Williams et al. (2009) suggested that emission fluxes can be 1.75 times higher in the lower latitude bands over the Asian continent compared to higher latitudes. In an inverse modeling of Asian 222Rn emissions, Hirao et al. (2010) showed an area-weighted average 222Rn emission of 33.0 mBq m−2 s−1 (∼ 1.57 atom m−2 s−1) in Asia with the highest emissions found in central and southeastern Asia. These values are considered much higher than typical 222Rn emission known for Europe, where Szegvary et al. (2009) suggested half of the continent has emissions ranging from 8.33 to 14.6 mBq m−2 s−1 (0.40 to 0.70 atom m−2 s−1). Hirao et al. (2010) also found that, to better match surface observations at Hachijo Island, a volcanic island about 287 km south of Tokyo in the Philippine Sea, the emissions over East Asia would need to be increased by a factor of 1.69.
It is likely that the high 222Rn emissions in Asia are poorly estimated because of the diverse climate and geographic textures formed on the largest continent of the earth. The southern part of China is known to be covered with soils containing higher radium concentrations than the global average (Schery and Wasiolek, 1998). Central Asia is dry and sparsely covered with soils, which could facilitate 222Rn emanation. The mountainous surface in southeastern China could also be conducive to high 222Rn emissions. The 222Rn exhalation model developed by Hirao et al. (2010) took into consideration 222Rn emission enhancements caused by rough surfaces but still underestimated 222Rn concentrations in East Asia. Active crust movements along the east coast of Asia can cause more exposure of radium and extra 222Rn emissions. Intense human activities may also contribute to excessive 222Rn emissions in Asia. Moore et al. (1976) pointed out that phosphate ores contain high concentration of 238U (precursor of radium) and are widely used as phosphate fertilizers in the populous East Asia region. Due to such complexities and uncertainties, most of the 222Rn exhalation models are not well validated in Asia, and a lack of 222Rn measurements in central and western Asia adds to the difficulty.

Figure 7(a) Comparison of seasonal total 210Pb deposition fluxes (mBq cm−2 yr−1) at Shanghai (32.1∘ N, 123.4∘ E) between five model simulations (see Table 2) and observations (Du et al., 2015). (b) Correlations between simulated and observed annual mean 210Pb deposition fluxes at nine surface sites in North America (Du et al., 2015). (c) Same as panel (b) but for nine Asian sites. The dashed line is the 1-to-1 line. Colored lines are linear regression lines for the five model simulations shown in the legends. The reduced major axis regression slopes (S) and correlation coefficients (R) are given in the legends.
An alternative way to verify 222Rn emissions is to evaluate the deposition fluxes of its long-lived decay daughter, 210Pb. Since surface deposition is the primary sink of 210Pb aerosols, global 210Pb deposition fluxes should be balanced by 210Pb production or 222Rn emission fluxes (Considine et al., 2005). Regional total 210Pb deposition fluxes, however, can be affected by transport into and out of the region. Nevertheless, comparisons between simulated and observed 210Pb deposition fluxes at multiple locations in Asia offer a test of underestimated 222Rn emissions. Figure 7a compares model results with observed 210Pb total (dry and wet) deposition in Shanghai for each season averaged over an 8-year period (Du et al., 2015). All model simulations, including the simulation with upscaled emission in China (ZKC), underestimate the total deposition in all seasons. Enhanced 222Rn emissions in ZKC improve the simulated 210Pb deposition to a limited extent in all seasons and more favorably in winter. We then calculate the correlations between simulated and observed annual mean 210Pb deposition fluxes at the sites in North America (nine sites) and Asia (nine sites; Du et al., 2015). Some studied Asian sites are located in northern and inland China. Details about these sites can be found in Du et al. (2015). The reduced major axis regression slopes for North American sites are closer to 1 (Fig. 7b), indicating a generally well simulated life cycle from 222Rn emission to 210Pb deposition. By contrast, the slopes for Asian sites are much lower than 1. This large magnitude of model underestimation in 210Pb deposition fluxes can only be attributed to low 222Rn emissions in Asia. Much existing evidence suggests using a larger scaling factor, but as mentioned earlier, we choose to use a moderate scaling factor of only 1.2 for China to avoid large overestimates of total 210Pb deposition fluxes over the rest of the Northern Hemisphere.
The seasonality in surface 222Rn concentrations is mainly affected by three factors: (1) the variability in 222Rn emission flux rate due to seasonal changes in soil moisture, diffusivity, depth of the water table, and snow and ice coverage; (2) the vertical mixing processes (i.e., boundary-layer mixing and convection); and (3) advective transport of 222Rn-rich or 222Rn-poor air masses. The roles of these factors may vary by location. Here, we examine the seasonal variations of surface 222Rn concentrations at selected surface sites in Europe, Asia, and North America and discuss these impacting factors. The selection of surface sites is mainly based on the availability of multiple-year measurements, with consideration of special geographic locations indicative of regional transport patterns.
5.1 Europe
Observations in Europe were mostly obtained in Finland, Germany, France, and Italy, with about half of the sites in Finland. Figure 8a–c show the comparisons of model results with monthly mean observations at three Finland sites (Kevo, Pallas, and Joensuu). At these high-latitude sites, the highest monthly concentration does not exceed 4000 mBq SCM−1,but the seasonal variations are large, with the observed wintertime highs being up to twice the summertime lows. Such seasonal variation is mainly due to a shallower boundary layer and less convection in winter because the changes in 222Rn emissions are minor due to low temperature all year round (see Figs. 2 and 3). Szegvary et al. (2009) suggested that the 222Rn emissions in northern Europe are generally lower than the commonly used value of 1 atom cm−2 s−1. The soil water content is high because of the long snowy winter and short summer there. The content of radium is also found to be lower than average in the quaternary sand deposits. The ZK11 and ZKC emission scenarios, which adopted 222Rn emission fluxes derived from measured gamma radiation (Szegvary et al., 2009), are clearly the better options and result in better simulated seasonal variations (frequently overlapped purple and red lines in Fig. 8a–c). The SW98 emissions lead to much higher 222Rn concentrations compared with the observations, whereas JA97 tends to underestimate the emissions and results in lower concentrations.
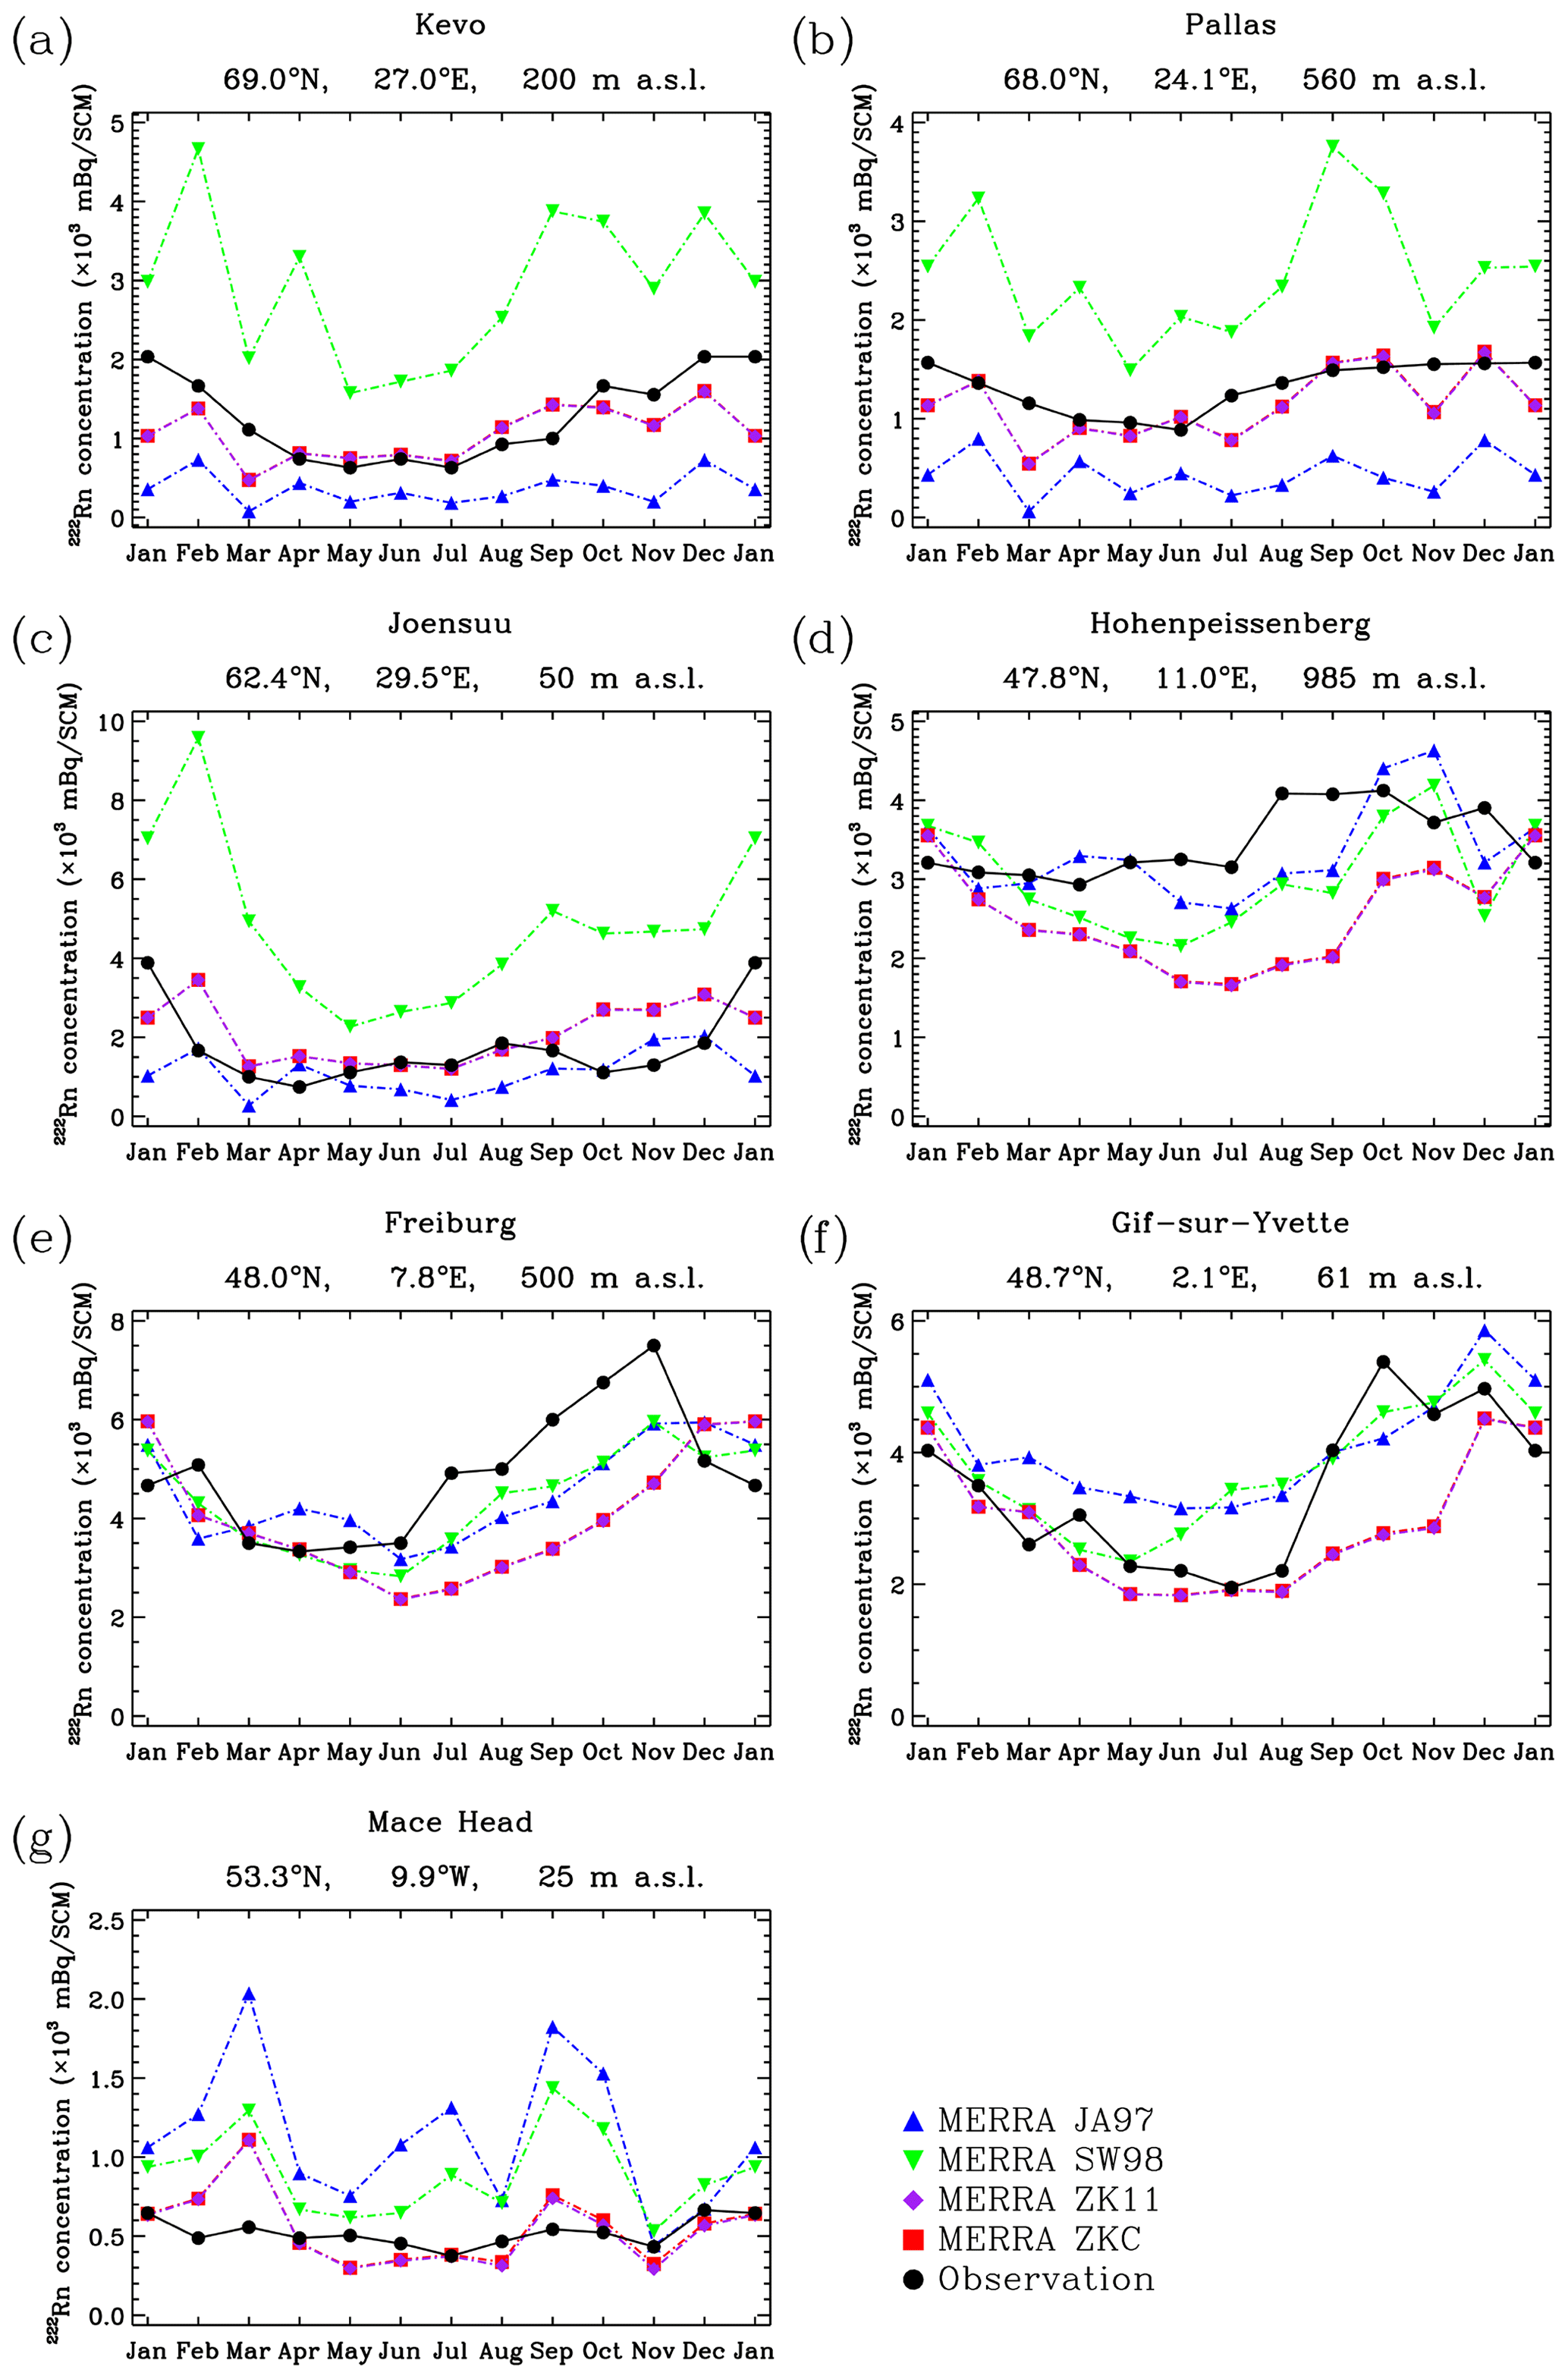
Figure 8Comparison between observed 222Rn climatological monthly means (black lines) and simulated monthly means in 2013 (colored lines) at selected surface sites in Europe. Location and elevation of each site are given above each panel. See Table 2 for the list of model simulations. Note the small difference between the simulations with ZK11 and those with ZKC because of identical 222Rn emission in Europe.
Figure 8d–f show model–observation comparisons at three sites in central mainland Europe, i.e., Hohenpeissenberg (Germany), Freiburg (Germany), and Gif-sur-Yvette (France). The observations generally show minimal surface concentrations in spring and maximums in late fall. The highs appear earlier with larger seasonal amplitudes compared with the Finland sites as a result of the combined effects of seasonal changes in emission fluxes and vertical transport. In general, the lowest 222Rn concentrations usually occur during spring and summer when convection and boundary-layer mixing are most active at inland surface sites (Wilkening, 1959; Lindeken, 1967). Higher wintertime concentrations at central European sites were also likely attributed to slow transport and long residence time over land due to air mass stagnation (Chambers et al., 2016a; Williams et al., 2016). At midlatitude sites, snow cover suppresses 222Rn exhalation and reduces emission fluxes substantially in winter; complete snowmelt and moist fluxes enhance 222Rn emissions in summer (Reithmeier and Sausen, 2002). Since strong emissions in summer partially compensate for the dilution effect of boundary-layer mixing and strong convection, the lowest 222Rn concentrations are usually observed in the springtime. All simulations capture the seasonal variations; ZK11 and ZKC emission scenarios do not lead to obviously better results than JA97 and SW98. It appears that a sharp increase in emission is missing from summer to late fall as indicated by increased observations in June–August, suggesting that further emission adjustments are needed for Europe in the model. Szegvary et al. (2009) also suggested large 222Rn emissions over the Iberian Peninsula and the northern Mediterranean coastal region due to a wide coverage by dry soil and crystalline rocks. In a more recent study using 222Rn as a tracer to classify atmospheric stability in Slovenia, an unusually large 222Rn exhalation flux from flysch and carbonate rocks at an inland site was found to cause higher 222Rn concentrations in the diurnal cycle compared to a coastal site where atmospheric synoptic conditions were considered similar but land was more dominated by sea and lake sediments (Kikaj et al., 2019).
Figure 8g shows the model–observation comparison for Mace Head, a coastal site in western Europe (Ireland). Most observations are lower than 1000 mBq SCM−1, with a weak seasonal variation. Simulations with JA97 and SW98 overestimate the observations by a factor of > 2 on average, while such large overestimates are only seen in February for ZK11 and ZKC. The coastal site is usually moist and largely affected by oceanic air; it is therefore characterized by relatively low 222Rn concentrations all year round. A regional model simulation by Chevillard et al. (2002) with a JA97-like, uniform 222Rn emission rate, showed similar overestimation with much larger discrepancies from observations. The site is located (53.3∘ N) very close to the cutoff latitude (60∘ N) in JA97, at which zero emissions are assumed northwards. The comparisons in Europe suggest that the fixed emission fluxes (with reductions under freezing conditions) in JA97 can lead to overestimation in southern Europe and underestimation in the north. A weaker latitudinal gradient towards the north as shown by ZK11 and ZKC is much favored. The comparisons with measurements applied with scaling factors suggested by Schmithüsen et al. (2017) are given in Fig. S3, which only shows slight changes.
5.2 Asia
Observations of surface 222Rn concentrations in Asia, e.g., southern China (Zahorowski et al., 2005), Japan (Chambers et al., 2009; Iida et al., 2000), and India (Debaje et al., 1996), are clearly affected by the Asian summer monsoon, with maximum concentrations observed in winter and minimums in summer (low-222Rn marine air brought by the monsoon). Figure 9 shows the model–observation comparisons at five Asian sites (Beijing, Gosan, Fuzhou, Hong Kong, and Bombay). Inland sites in China, where only annual mean observations are available, are not included in this comparison. The observations at Beijing show a moderate seasonal variation similar to the midlatitude continental European sites, with a spring minimum and an autumn maximum. The simulation with JA97 shows reasonable agreement with observations at Beijing only in spring and summer but is significantly biased low in late fall–early spring (November–March, Fig. 9a). The latter is likely due to the temperature-dependent reduction of 222Rn emissions in JA97, when surface temperature is below 0 ∘C. In reality, soil may not be frozen when temperature remains below 0 ∘C for a short period of time. At Gosan, an island site largely affected by the Asian monsoon and emissions from the major Asian continent, observations show a strong seasonal variation, with a winter maximum and a summer minimum. The large winter low bias at Gosan with JA97 is likely also due to the assumed dependency on surface temperature.

Figure 9Same as Fig. 8 but for Asia. Note that the model results used in (c) Fuzhou and (d) Hong Kong are sampled at the grid boxes to the west of the ones where the sites are located to achieve a better agreement with the observations. See text for details.
At two coastal Chinese sites, Fuzhou and Hong Kong, the model results at the corresponding grid boxes are much lower than the observations (Fig. S4). We tried sampling the model results at adjacent grid boxes and found that those for the grid box to the west are much more comparable to the observed (Fig. 9c and d). This suggests that the observations at both sites are significantly affected by local 222Rn emissions. The 222Rn observations show a minimum in summer, reflecting the intrusion of low-222Rn marine air associated with the Asian summer monsoon. Although the model successfully captures the observed seasonality, the simulation with ZKC (with enhanced emissions in China) shows a much better agreement compared to the large low bias in the simulation with JA97. On the other hand, the simulations with ZK11 and ZKC capture the observations at Bombay, India, well. These contrasting model performances suggest that 222Rn emission fluxes in southeastern China need to be better quantified with flux measurements at more surface sites.
5.3 North America
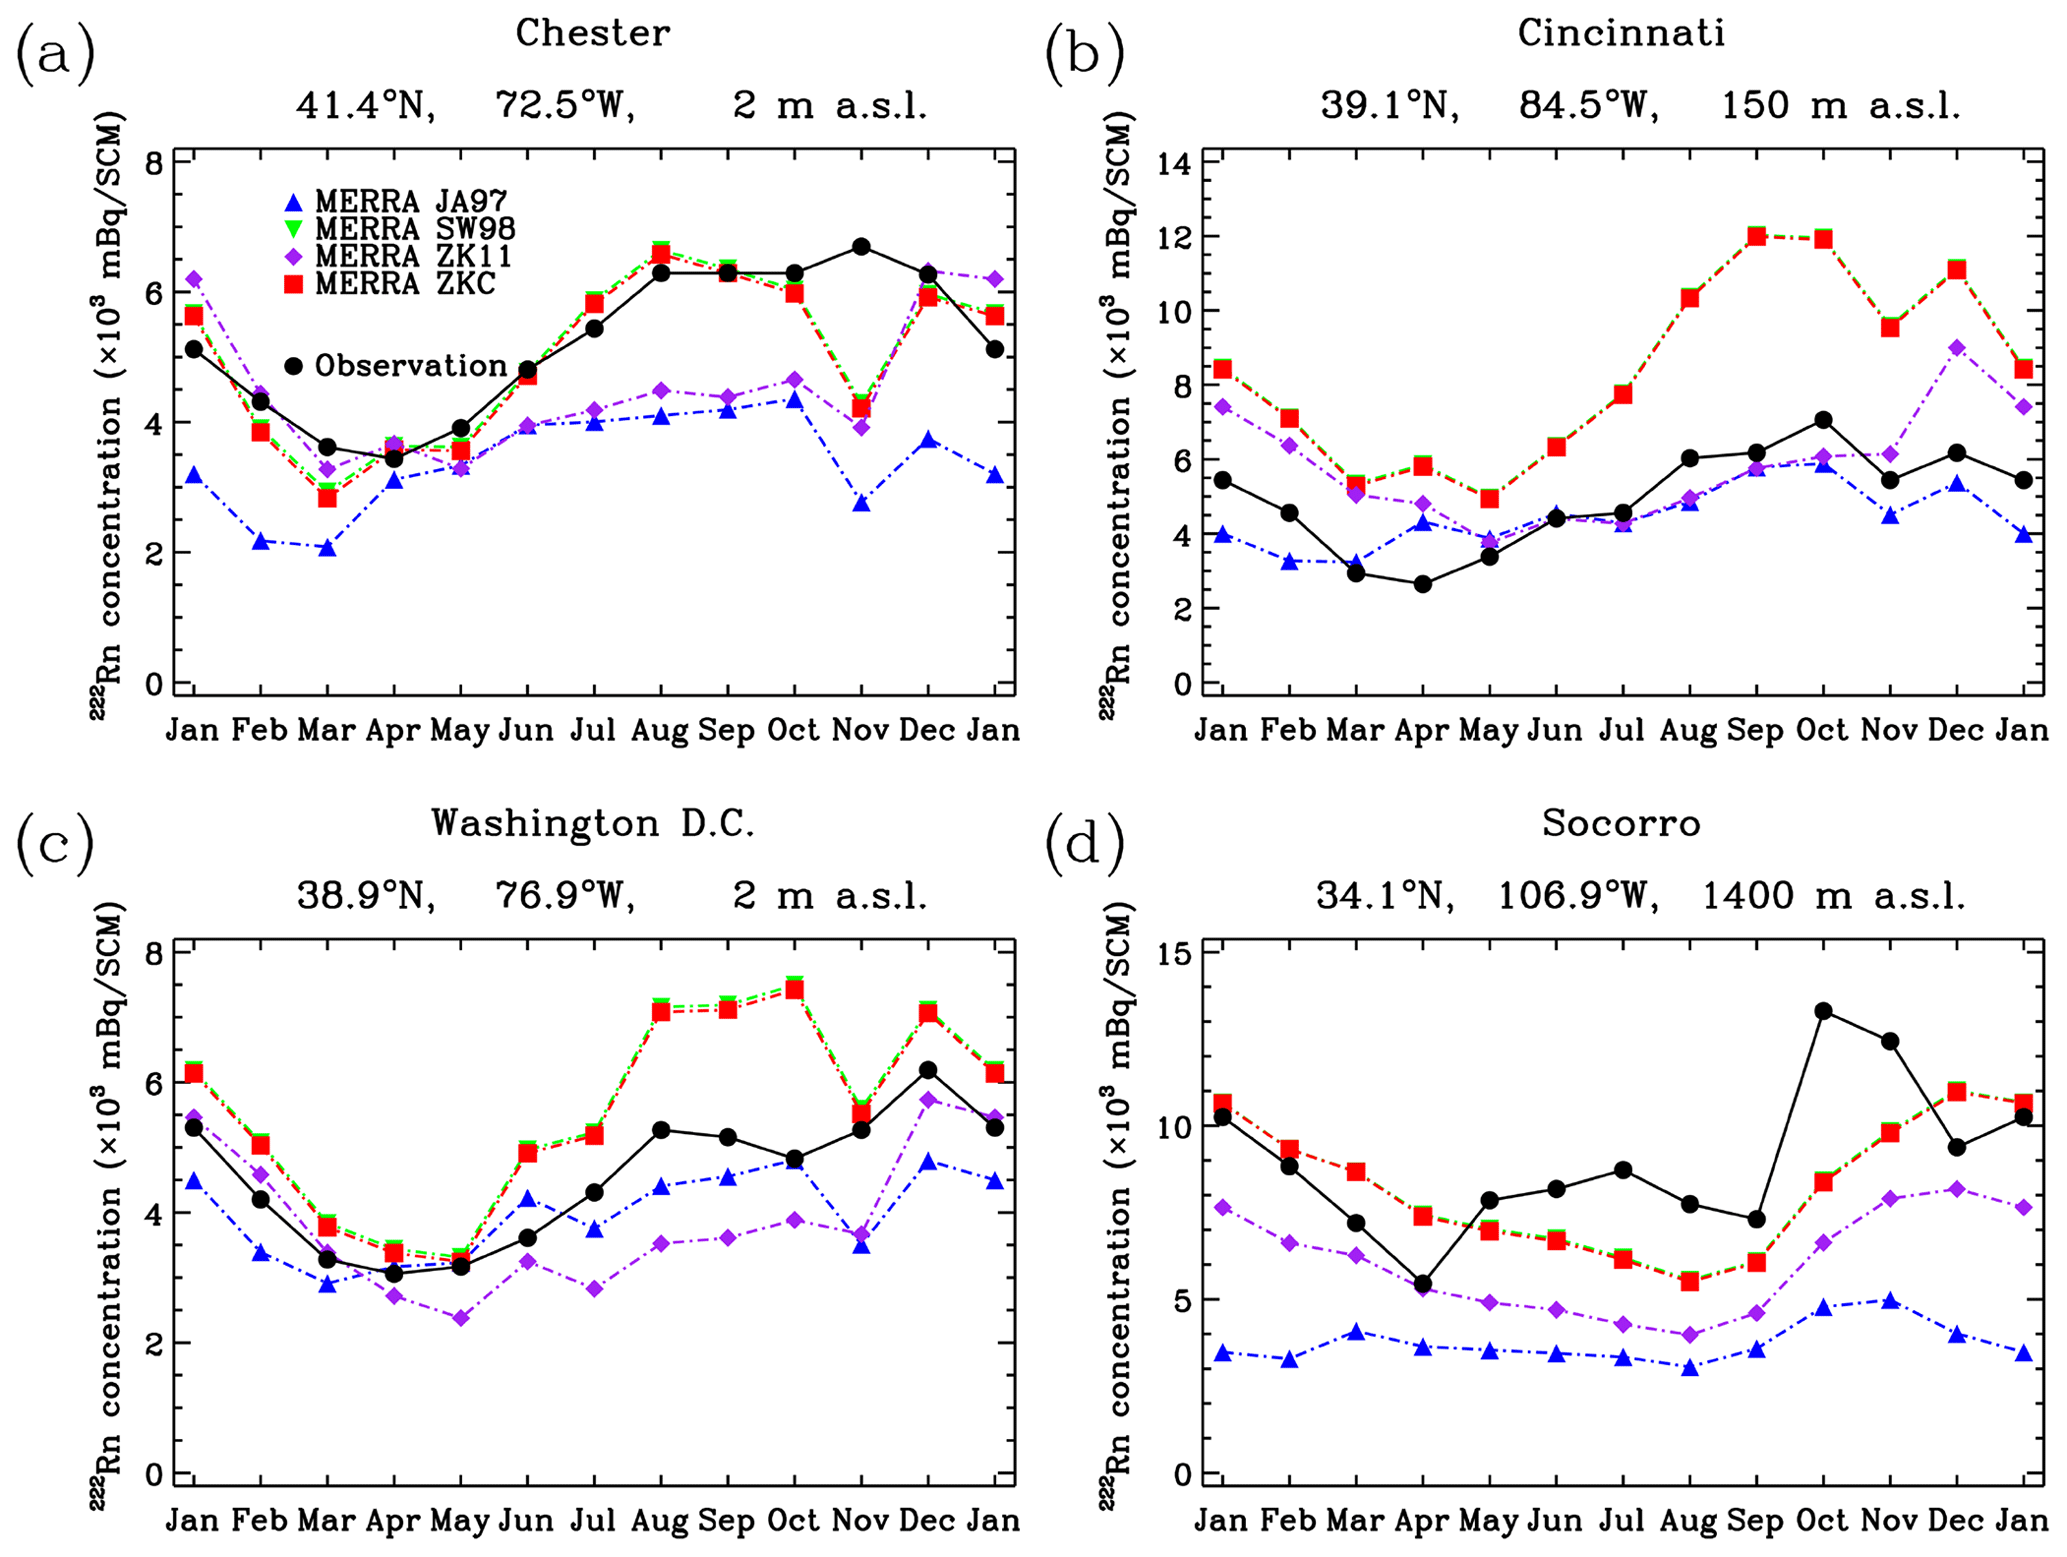
Figure 10 shows the model–observation comparisons at four US continental sites. Similar to those midlatitude surface sites in Europe and Asia, the observations at the US sites show seasonal lows in spring and highs in fall or winter. The simulations with SW98 and ZKC (identical emissions over North America) show much higher 222Rn concentrations than those with JA97 and ZK11 over the United States. The seasonality at Chester is well captured by using SW98 and ZKC. At Cincinnati, the model performs slightly better with JA97 and ZK11, while the simulations with SW98 and ZKC overestimate the autumn peaks by nearly a factor of 2. SW98 and ZKC lead to significant positive biases at Washington D.C., even though ZK11 commits negative biases of a similar magnitude. At Socorro, an elevated site (1400 m a.s.l.) in the southern United States, all simulations do not convincingly capture the seasonal variation (Fig. 10d). Socorro is located in the Rio Grande Valley, where 222Rn emissions may have larger variations due to surface textures and local meteorology (e.g., upslope air flows) that cannot be resolved by the coarse-resolution model.
5.4 Other sites
Figure 11 shows the seasonal variations of surface 222Rn concentrations at eight sites in remote areas or the Southern Hemisphere. Surface 222Rn concentrations at Bermuda show a late spring to summer minimum (May–August) due to the strengthened Azores–Bermuda High pressure system in summer which brings low-222Rn air from the central and eastern North Atlantic (Fig. 11a). At Mauna Loa, observations are in a low range of 75–150 mBq SCM−1 all year round, reflecting low 222Rn in marine free tropospheric air (Fig. 11b). The seasonality is, however, distinct, with a minimum in summer and a maximum in late winter and early spring when efficient monsoonal transport of continental air occurs (Balkanski et al., 1992; Zahorowski et al., 2005). At both remote sites, the model captures the seasonality reasonably. The seasonal amplitudes in all simulations are larger than observed, except with JA97. The simulation with JA97 better captures the observed amplitude but substantially underestimates the concentrations. It is challenging for a coarse-resolution global model (with unresolved topography and grid-averaged local emissions) to accurately simulate the low 222Rn concentrations at such a remote island.

Figure 11c–f show the 222Rn seasonality at three subtropical sites, Chacaltaya (Bolivia), Rio de Janeiro (Brazil), and Cape Point (South Africa; Botha et al., 2018), and one midlatitude site, Cape Grim (Australia) in the Southern Hemisphere. Seasonal variations are similar to the Northern Hemispheric sites, showing highs in winter and lows in summer. The model fails to reproduce the observed seasonal trend at Chacaltaya, presumably due to its high elevation (5421 m a.s.l. on the Andes) that is not well resolved. At the two Antarctic sites (Fig. 11g, h), the model does not simulate the seasonal variations well, likely due to a lack of emission measurement and oversimplified emission fluxes. With all emission scenarios except SW98, the model underestimates the observations substantially during warmer seasons (November to February), as also noted by Zhang et al. (2011). In fact, snow (ice) melting and reforming may enhance 222Rn emissions and surface concentrations in relatively warmer seasons. SW98 is the only scenario with prescribed non-zero emission fluxes in the Antarctic. It arbitrarily assigns a small and fixed value to the emission in the Antarctic region due to no measurements of soil 226Ra content, but the scenario causes model overestimates in surface 222Rn concentrations at the two sites, especially during winter. Evangelista and Pereira (2002) reported summertime 222Rn fluxes ranging between 0.21 × 10⁻² and 28 × 10−2 atom cm−2 s−1 during the summer of 1998/1999 at the Admiralty Bay area of King George Island, Antarctic Peninsula (62∘ S, 58∘ W). The work also suggested such low fluxes could not explain 222Rn concentration surges in the atmosphere. The sparse measurements at the edge of the Antarctic are not adequate for inferring emission fluxes over the remote continent. More future measurements of 222Rn emissions in Antarctic regions are thus desired.
The vertical distribution of 222Rn reflects mainly the convective transport process rather than large-scale advection due to the relatively short decay lifetime (a few days) of 222Rn. However, it is more challenging for global models to capture the convective transport of 222Rn concentrations to the middle and upper troposphere than the synoptic-scale transport (Jacob et al., 1997). In this section, we characterize the convective transport in GEOS-Chem driven by the MERRA and GEOS-FP meteorological datasets, respectively, and evaluate model simulations with observed 222Rn vertical profiles.
6.1 Simulated 222Rn profiles and comparison with observations
The most widely used 222Rn profile measurements were compiled by Liu et al. (1984) (black line, Fig. 12a). The composed profile is averaged from 222Rn observations over the United States, Ukraine, and central Asia and represents the summer 222Rn vertical distributions over northern midlatitude continental regions. The profile shows an inflection point between 3 and 4 km, reflecting the average altitude of convective entrainment (Fig. 12a). Concentrations decrease slowly as altitude increases from 4 to 7 km, indicating fast convective transport over land during summer (Liu et al., 1984; L. Zhang et al., 2008). We sample the simulated monthly mean 222Rn profiles at the provinces or states where each observed profile was measured and obtain an average profile for each simulation. As shown in Fig. 12, all simulations capture the rapid decrease of 222Rn concentrations from the surface to about 4 km well, at a rate of 1000 mBq SCM−1 km−1. The simulated concentrations then decrease faster than the observations until 6 km. This is suggested to be a consequence of overly vigorous convective transport in the model with detrainment at overly high altitudes (Considine et al., 2005). MERRA exhibits a higher and deeper convection from 5 to 10 km. As a result, a remarkable underestimation of 222Rn concentrations with MERRA is seen from 4 to 8 km, followed by overestimates above 9 km. Deep convective cloud top in MERRA has been shown biased high compared to CERES-observed clouds (Posselt et al., 2012). Stanfield et al. (2019) found that the frequency distribution of convective entrainment rates (mixing between environmental air with in-cloud air) for deep convection events in GEOS-5 has a significantly larger fraction in the higher end values compared to the rates derived from CO profiles observed by the Tropospheric Emission Spectrometer (TES) and Microwave Limb Sounder (MLS). Intensive mixing within convective updrafts undermines the upward lifting of surface air masses to the upper troposphere, possibly causing the rapidly decreasing 222Rn concentrations with height in the simulation with GEOS-FP. Due to weaker convection in GEOS-FP, the simulation underestimates in a broader altitude range (4–10 km). It seems challenging for the two GEOS products to capture the convective detrainment level. As pointed out below, weaker convection in GEOS-FP at the resolution of 2∘ × 2.5∘ is partially due to the transport errors introduced by using the archived and regridded meteorological data (Yu et al., 2018).
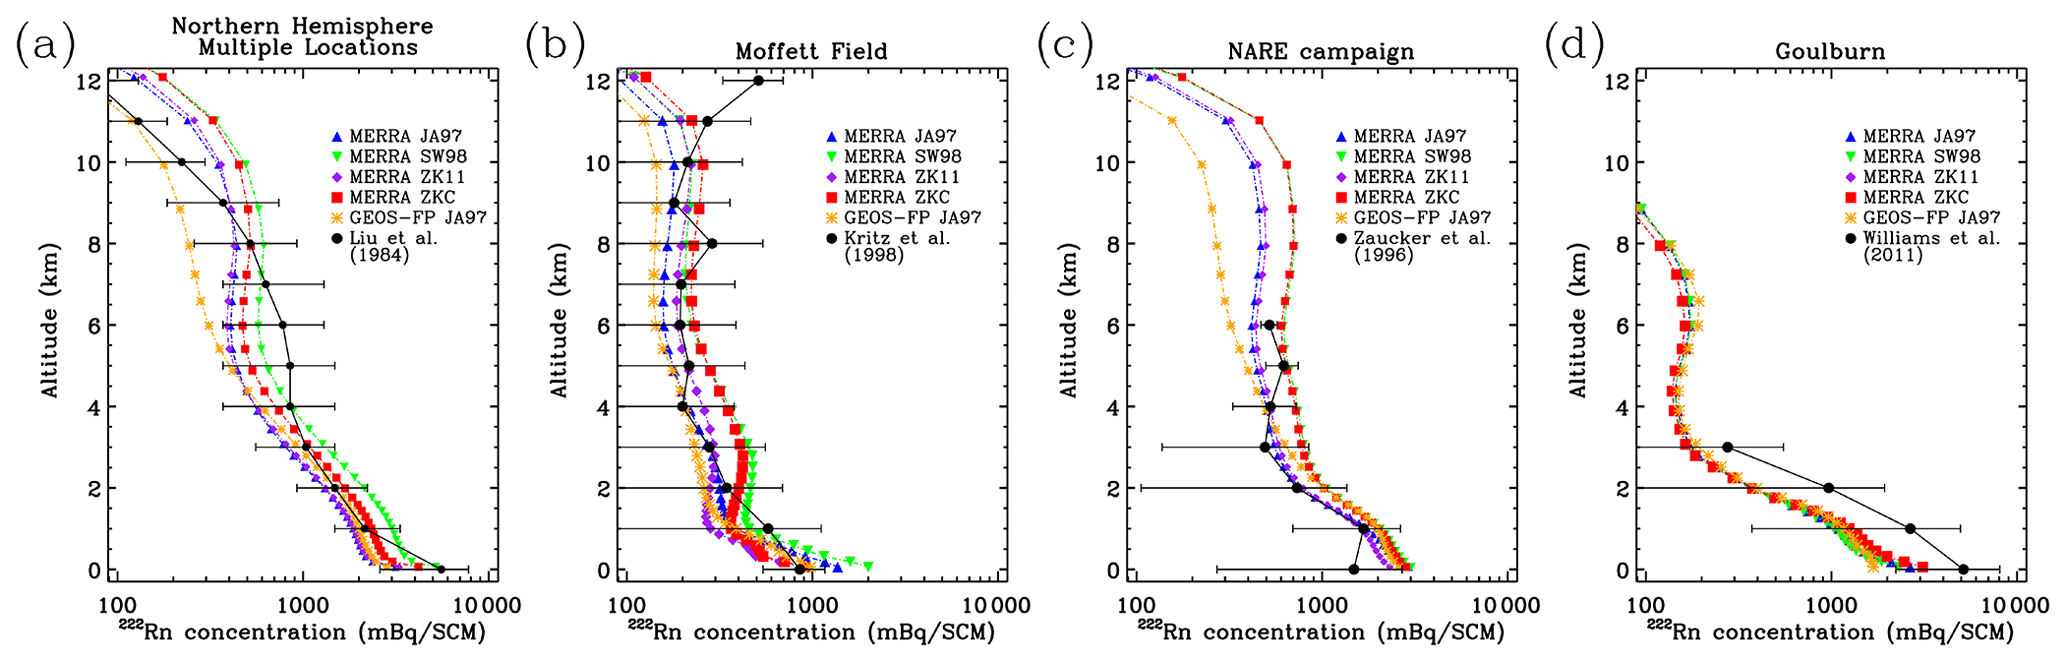
Figure 12Comparison of vertical of 222Rn profiles (mBq/SCM) simulated with four emission scenarios (simulations A1, A2, A3, and A4; see Table 2) with (a) an average profile compiled from 23 locations over the Northern Hemisphere continents (Liu et al., 1984); (b) an average summertime profile constructed from measurements at Moffett Field (37.4∘ N, 122∘ W), California (Kritz et al., 1998); (c) an average summertime profile from measurements on the east coast of Canada during the 1993 NARE campaign (Zaucker et al., 1996); and (d) an averaged profile measured in May of 2006–2008, at Goulburn (34.8∘ S, 149.7∘ E), New South Wales, Australia (Williams et al., 2011). In panel (a), more than half of the observed profiles reach up to 6–12 km. Horizontal bars indicate the standard deviations of the observed 222Rn concentrations.
Figure 12b compares model results with the 222Rn profile averaged from measurements obtained at Moffett Field, a coastal site in California, United States, during June to August in 1994 (Kritz et al., 1998). The model profiles are obtained by averaging monthly 222Rn concentrations in the grid column corresponding to the site and those in the grid column to the west as suggested by K. Zhang et al. (2008). The simulations marginally capture the “C” shape profile, a sign of strong convective transport in summer. The simulation with JA97 performs better until up to 5 km, above which those with ZKC and SW98 agree better with the observations. The large overestimation at 2 to 5 km with ZKC and SW98 is likely due to shallow convection that is too strong and/or high emission fluxes. The differences in near-surface concentrations between the simulations with ZKC and SW98 (Fig. 12b) are caused by averaging ZK11 and SW98 emission fluxes along the edges of the continent in the formulation of ZKC.
Figure 12c shows the comparison of model simulations with the profile averaged from aircraft measurements in the east coastal region of Canada during NARE in August 1993 (Zaucker et al., 1996). The model results are averages over a region of 41–46∘ N and 60–70∘ W. The simulation with JA97 reasonably reproduces the observations between 0 and 4 km, while the simulation with ZKC overestimates between 2 and 5 km. The model performance for NARE is similar to that for Moffett Field. The stronger emissions (ZKC and SW98) tend to result in overestimates in the lower free troposphere (Moffett Field and NARE) but better estimates in the upper troposphere (Moffett Field).
The vertical 222Rn profiles at Goulburn were measured up to about 3.5 km above ground level in May 2006–2008 (Fig. 12d; Williams et al., 2011). The corresponding model results are monthly means for May of the simulation year. The model underestimates the concentrations substantially but simulates the vertical gradient well. It suggests that the underestimation is more likely caused by potentially low biases in the emissions over the Australian continent rather than errors associated with vertical mixing in the model. Despite this, the model reproduces the seasonality well in surface 222Rn observations at Cape Grim (Fig. 11f), which is located on the island of Tasmania to the south of the Australian continent. Above 2.5 km, the vertical gradient of 222Rn concentrations decreases in both the observations and the model.
Two model uncertainties may affect our simulated 222Rn profiles: the remapping of the meteorological data from the original cubed-sphere grid in the parent GCM (GEOS-5) to an equally rectilinear (latitude–longitude) grid in the offline CTM (GEOS-Chem) and the degradation of the temporal and spatial resolutions of the meteorological archive (Yu et al., 2018). Yu et al. (2018) demonstrated that such remapping and using 3-hourly averaged wind archives may introduce 5 %–20 % low biases into vertical transport of 222Rn, including the weakened transport from the boundary layer to the upper troposphere. They also showed that degrading the spatial resolution of the meteorological archive for input to GEOS-Chem further weakened vertical transport because organized vertical motions in the finer resolution are averaged out in the coarser resolution. Such biases may partially contribute to the discrepancies between the simulated and observed 222Rn profiles, which appear to be larger in the mid-troposphere and upper troposphere (5.5–10 km) when the model is driven by GEOS-FP (Fig. 12). GEOS-FP has finer native horizontal resolution (0.25∘ latitude by 0.3125∘ longitude) than MERRA reanalysis (0.5∘ latitude by 0.667∘ longitude) and exhibits weaker convection, likely due to a more intensive regridding. An effort is currently ongoing to restore the lost vertical transport by implementing the modified Relaxed Arakawa–Schubert convection scheme in GEOS-Chem (He et al., 2019).
6.2 Role of convective transport: MERRA vs. GEOS-FP
To examine the role of convective transport in simulated distributions of 222Rn, we compare model simulations driven by MERRA and GEOS-FP in which the convective transport operator is turned on or off (i.e., A1, B1, A1-nc, and B1-nc, where “nc” denotes no convection; Table 2). Figure 13 shows the latitude–pressure cross-section of zonal mean 222Rn concentrations in these four simulations averaged over the boreal summer (June, July, and August). The concentrations are contoured on a logarithmic scale. The strong gradients above the tropopause in all panels are indicative of a fast decrease of 222Rn concentrations due to weak vertical diffusion. The interhemispheric asymmetry in 222Rn distributions reflects the larger landmass and 222Rn emissions in the Northern Hemisphere. The latitudinal and vertical distributions of 222Rn concentrations simulated with MERRA and GEOS-FP are very similar. The overall vertical transport in the simulation with MERRA is slightly stronger than with GEOS-FP as shown by the higher 222Rn concentrations near the subtropical tropopause between 15–30∘ N (Fig. 13a–b). In contrast, when convection is turned off (Fig. 13c–d), the model simulates higher 222Rn concentrations near the tropical tropopause with GEOS-FP than with MERRA, indicating that convection is stronger in MERRA than in GEOS-FP.
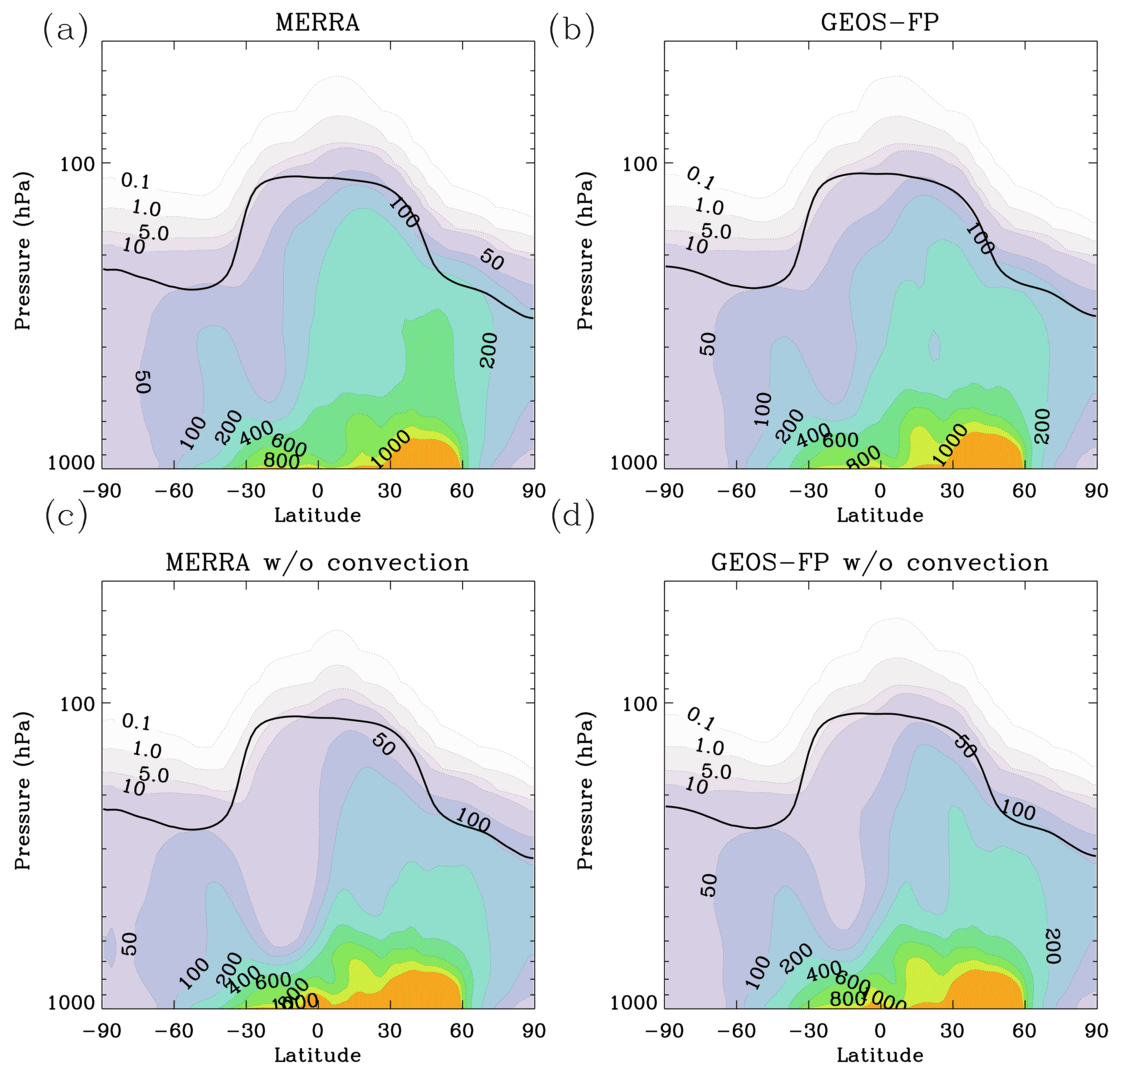
Figure 13Latitude–pressure cross-sections of zonal mean 222Rn concentrations averaged over June–July–August (mBq/SCM) as simulated by the GEOS-Chem model driven by (a) MERRA (A-1), (b) GEOS-FP (B-1), (c) MERRA without convection (A1-nc), and (d) GEOS-FP without convection (B1-nc). Bold black lines denote the zonal mean tropopause height (hPa) in the corresponding meteorological dataset.
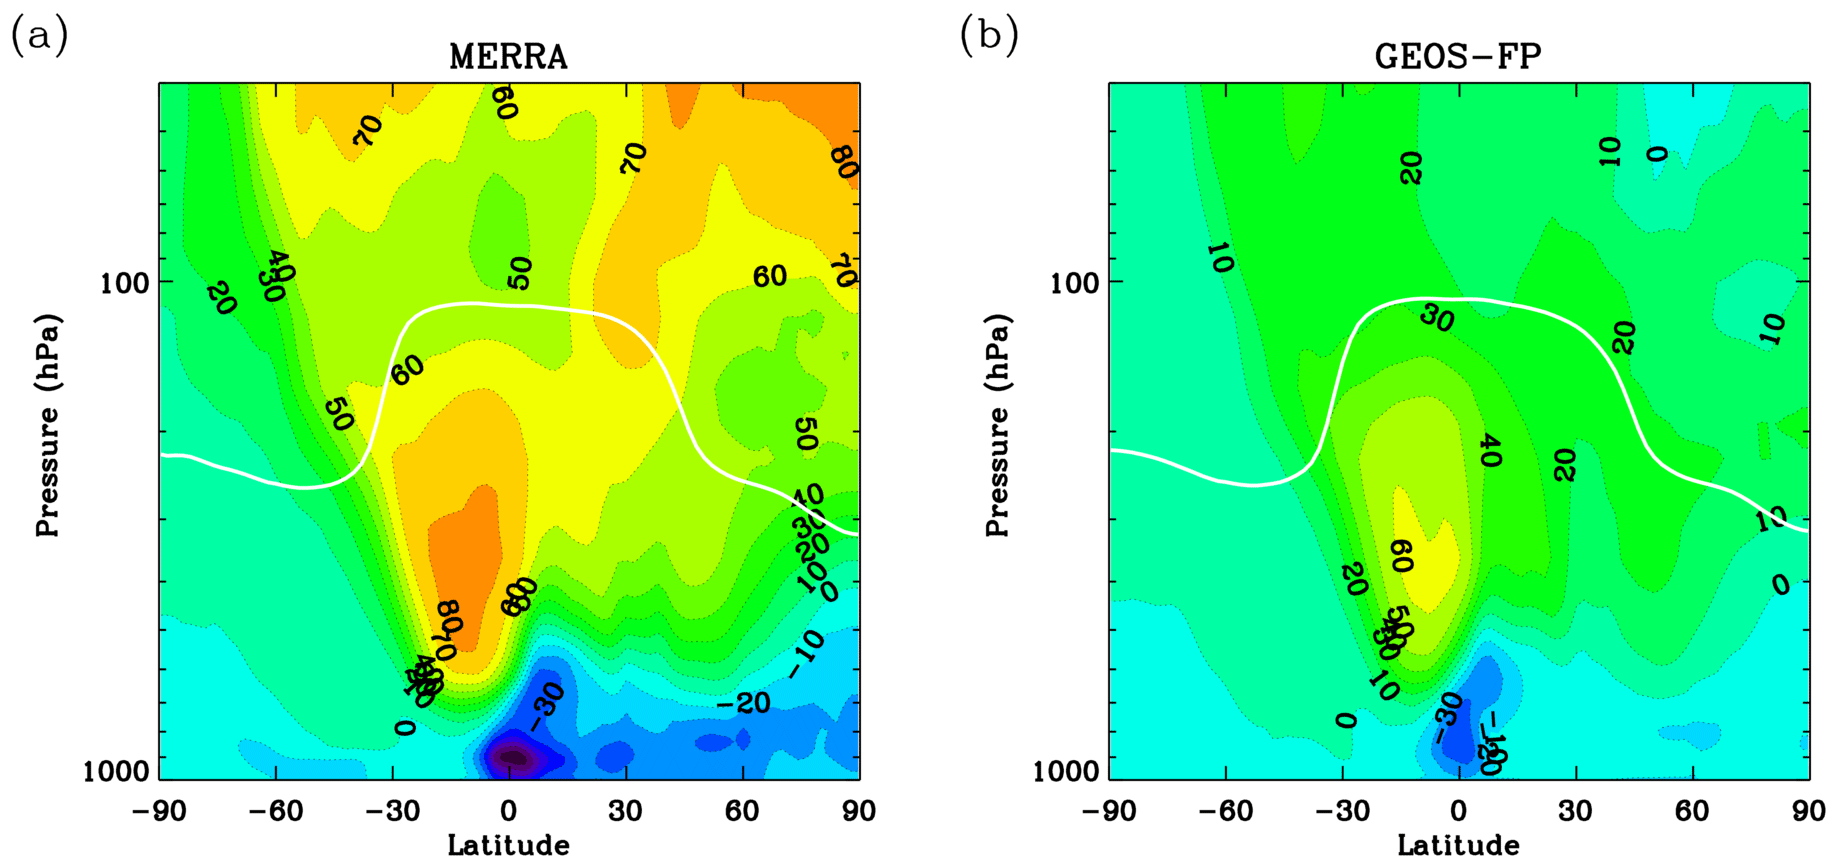
Figure 14Percentage changes in zonal mean 222Rn concentrations averaged over June–July–August due to convective transport in the GEOS-Chem simulations driven by (a) MERRA and (b) GEOS-FP. Values are (222Rn − 222RnRn × 100, where 222Rn and 222Rnnc are 222Rn concentrations simulated with (A1 and B1, Table 2) and without (A1-nc and B1-nc) the convection operator, respectively.
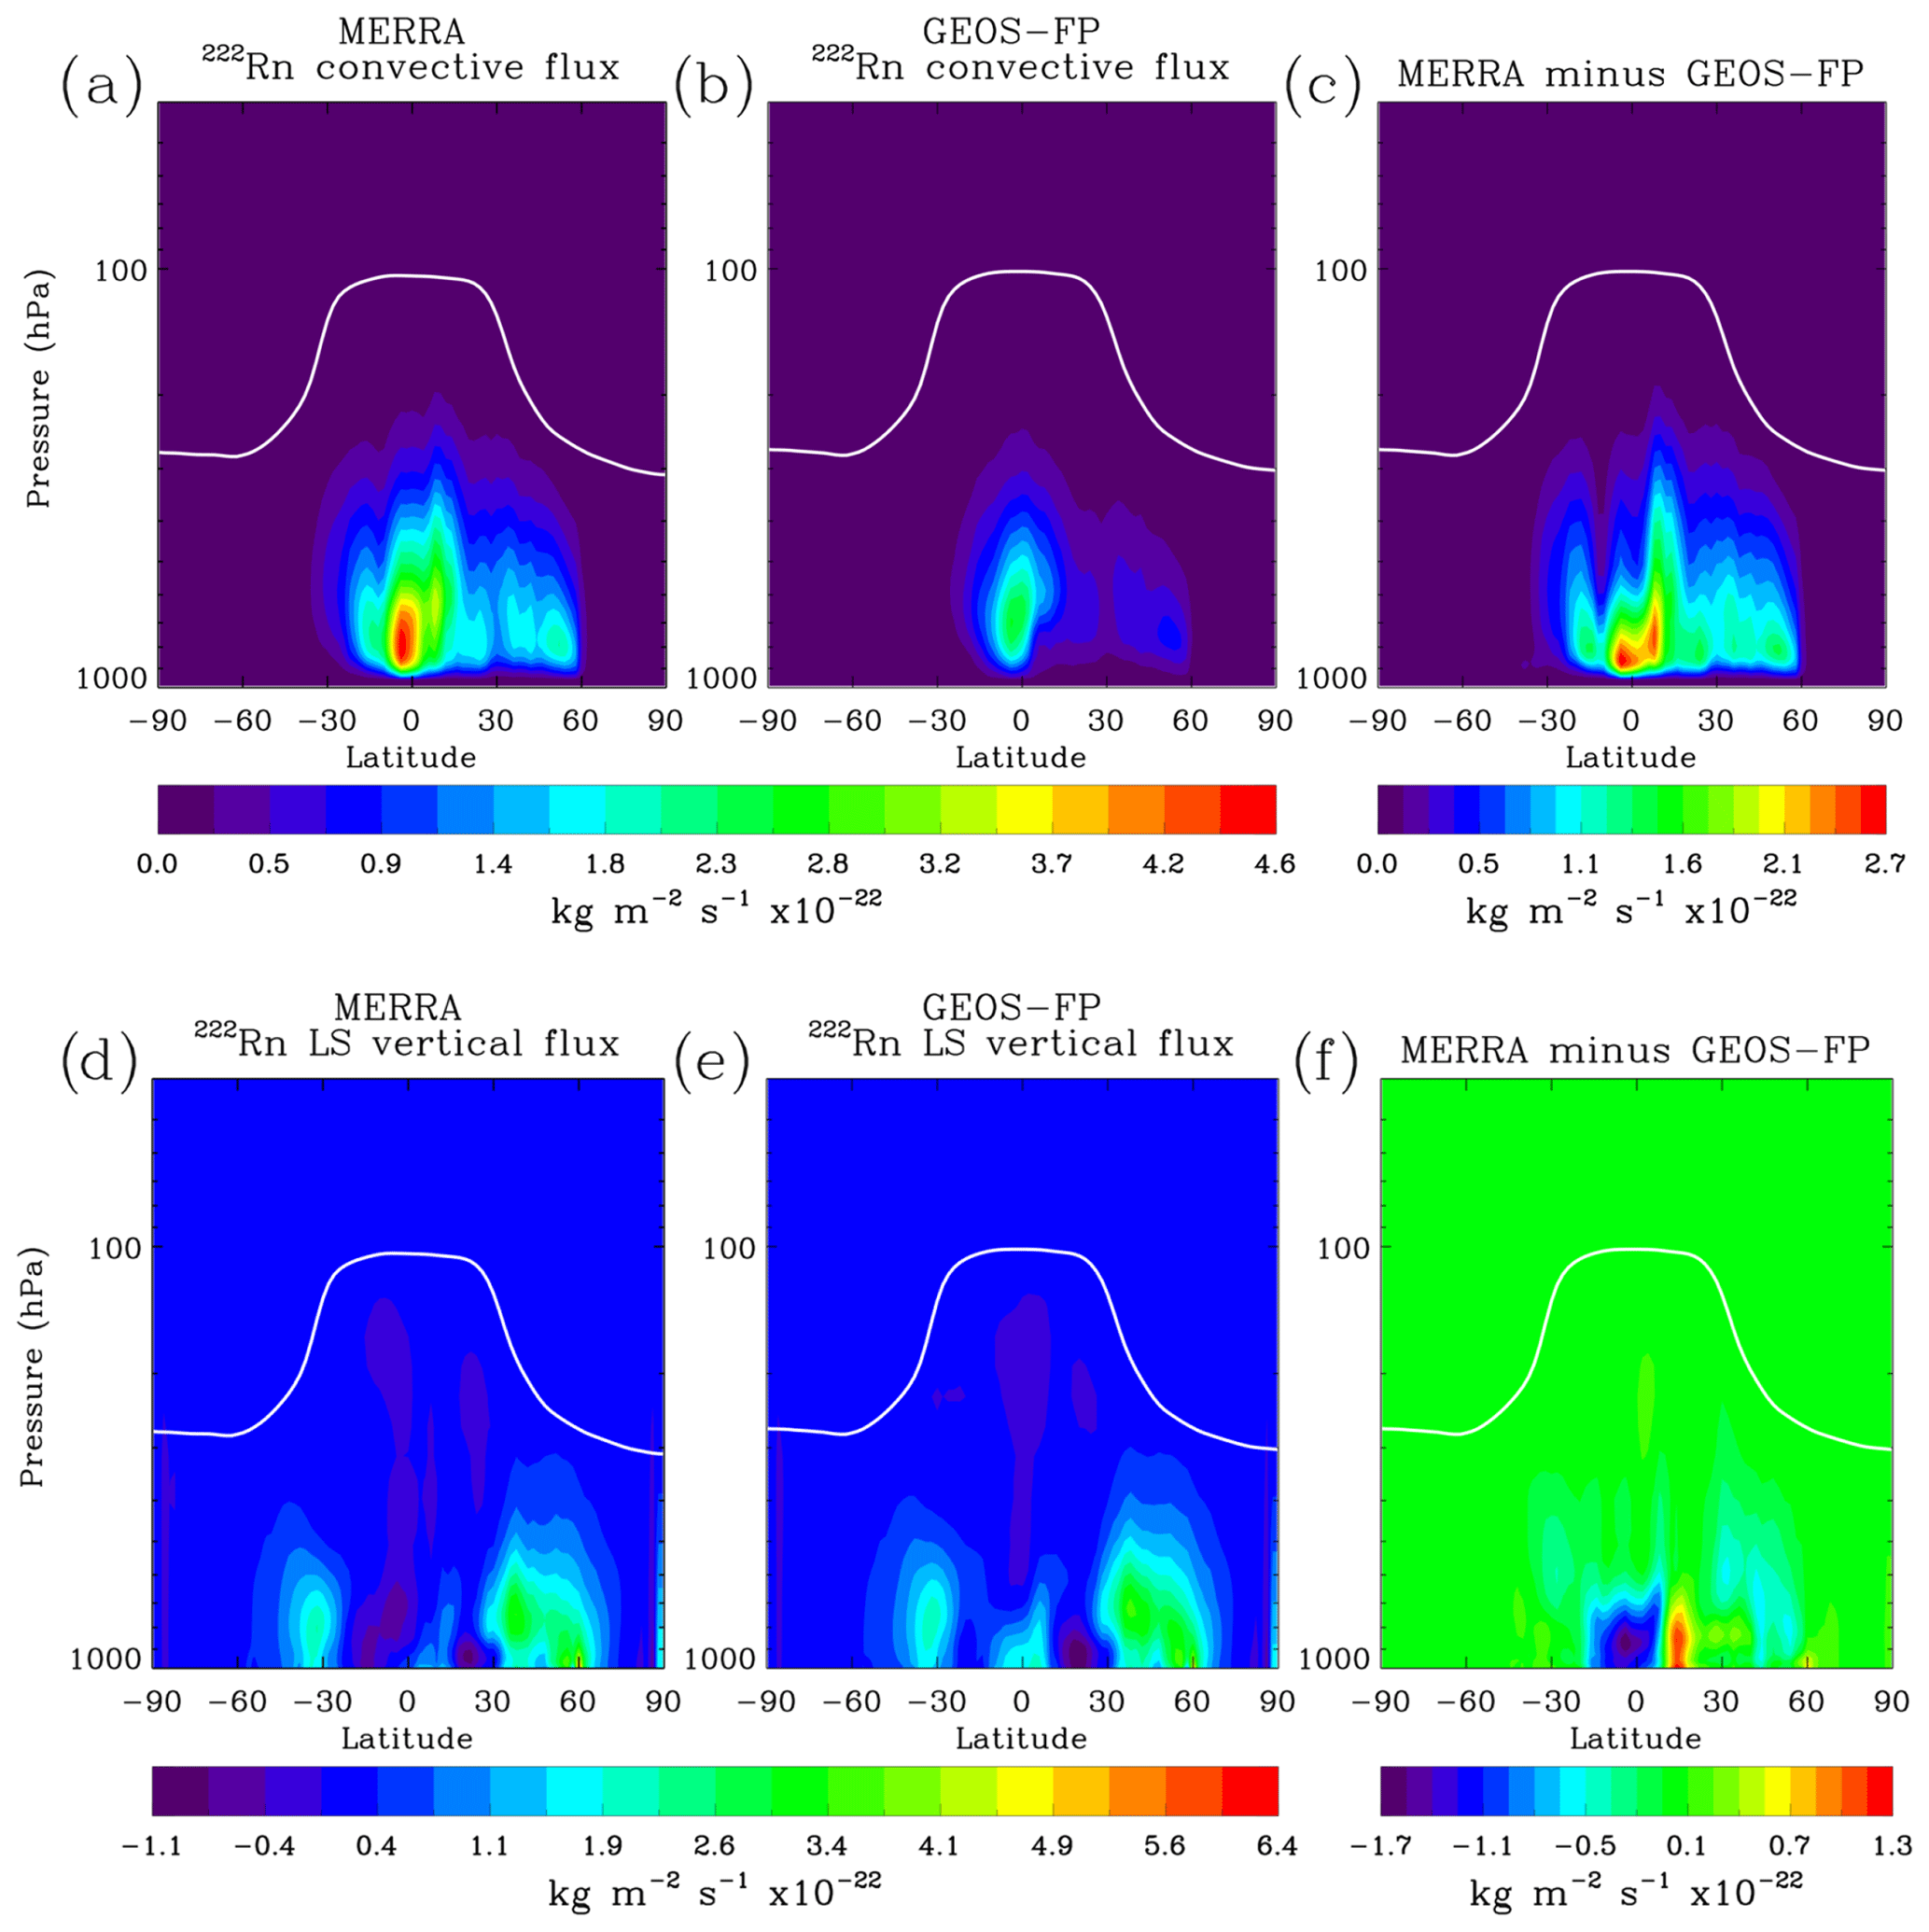
Figure 15Comparison of annual zonal mean vertical fluxes of 222Rn (× 10−22 kg m−2 s−1) in the GEOS-Chem simulations driven by MERRA and GEOS-FP. (a) Convective fluxes with MERRA, (b) convective fluxes with GEOS-FP, and (c) difference between panels (a) and (b). (d) Large-scale (LS) vertical fluxes with MERRA, (e) large-scale vertical fluxes with GEOS-FP, and (f) the difference between panels (e) and (f). The white lines indicate the tropopause height (hPa) in MERRA.
Figure 14 shows the percentage changes in 222Rn zonal mean concentrations averaged over the boreal summer due to convection in MERRA and GEOS-FP, defined as (222Rn − 222RnRn × 100 %, where 222Rn and 222Rnnc denote simulations with and without the convection operator, respectively. Where positive values occur, convection facilitates the transport of 222Rn to the region and increases 222Rn concentrations. Similarly, negative values indicate convection decreasing 222Rn concentrations. The negative values in the lower troposphere of the Northern Hemisphere along with the positives in the middle and upper troposphere are due to the pumping effect of convection, transporting surface-emitted 222Rn upward. Convection in the simulation with GEOS-FP transports about 20 %–30 % less 222Rn to higher altitudes in the tropics and subtropics compared to MERRA (Fig. 14a vs. b). Figure 15 shows the annual mean convective and large-scale vertical fluxes of 222Rn in the simulations with MERRA and GEOS-FP as well as their differences. Convective fluxes are stronger in a broader latitude range (30∘ S–55∘ N) in the simulation with MERRA. The largest difference appears in the tropical lower troposphere, where convective fluxes of 222Rn in the simulation with MERRA are about a factor of 2 larger than those in the simulation with GEOS-FP (Fig. 15c). The large-scale vertical fluxes of 222Rn in the simulation with GEOS-FP are significantly larger than those with MERRA (Fig. 15f), partly compensating for the differences in convective fluxes. This compensation leads to the aforementioned general similarity in the zonal mean 222Rn distributions in the two simulations (Fig. 13).
To further illustrate the differences in convective transport between the simulations with MERRA and GEOS-FP, we show in Fig. 16 the simulated 222Rn profiles averaged over the northern midlatitude land areas (30–60∘ N) for both cases of with and without convection. The solid black line with the upper x axis presents the corresponding concentration ratios between the two simulations. Similar to the earlier analysis of 222Rn vertical fluxes, convection in MERRA is stronger as indicated by the large change in 222Rn concentrations at high altitudes (e.g., 8 km) when convection is off (solid red line vs. dashed red line). The different characteristics of vertical transport in MERRA and GEOS-FP are better revealed by examining the 222Rn concentration ratio profiles (black and green lines with the upper x axis). Convective transport takes effect from the base of cloud layers (i.e., the lowest model layer with non-zero convective mass fluxes) in the model, whereas the large-scale vertical advection occurs from the bottom model layer up. As shown by 222Rn concentration ratios between the two simulations with convection turned off (green line, Fig. 16), the vertical transport of 222Rn through large-scale advection and boundary-layer mixing is more efficient in GEOS-FP than in MERRA (222Rn ratios < 1 above ∼ 2.5 km and > 1 below). Even with convection turned on, simulated near-surface 222Rn concentrations are still lower in GEOS-FP than in MERRA (solid black line, Fig. 16) because large-scale advection and boundary-layer mixing dominate near the surface and drain surface 222Rn faster. When 222Rn reaches the base of convective clouds, it is more efficiently uplifted in MERRA due to stronger convection, resulting in lower 222Rn concentrations in the lower troposphere (222Rn ratios < 1 from ∼ 0.75 to 4 km) and higher concentrations in the middle to upper troposphere (> 4 km). This feature should also affect the simulations of other surface-emitted species when using MERRA and GEOS-FP as the driving meteorology in GEOS-Chem.
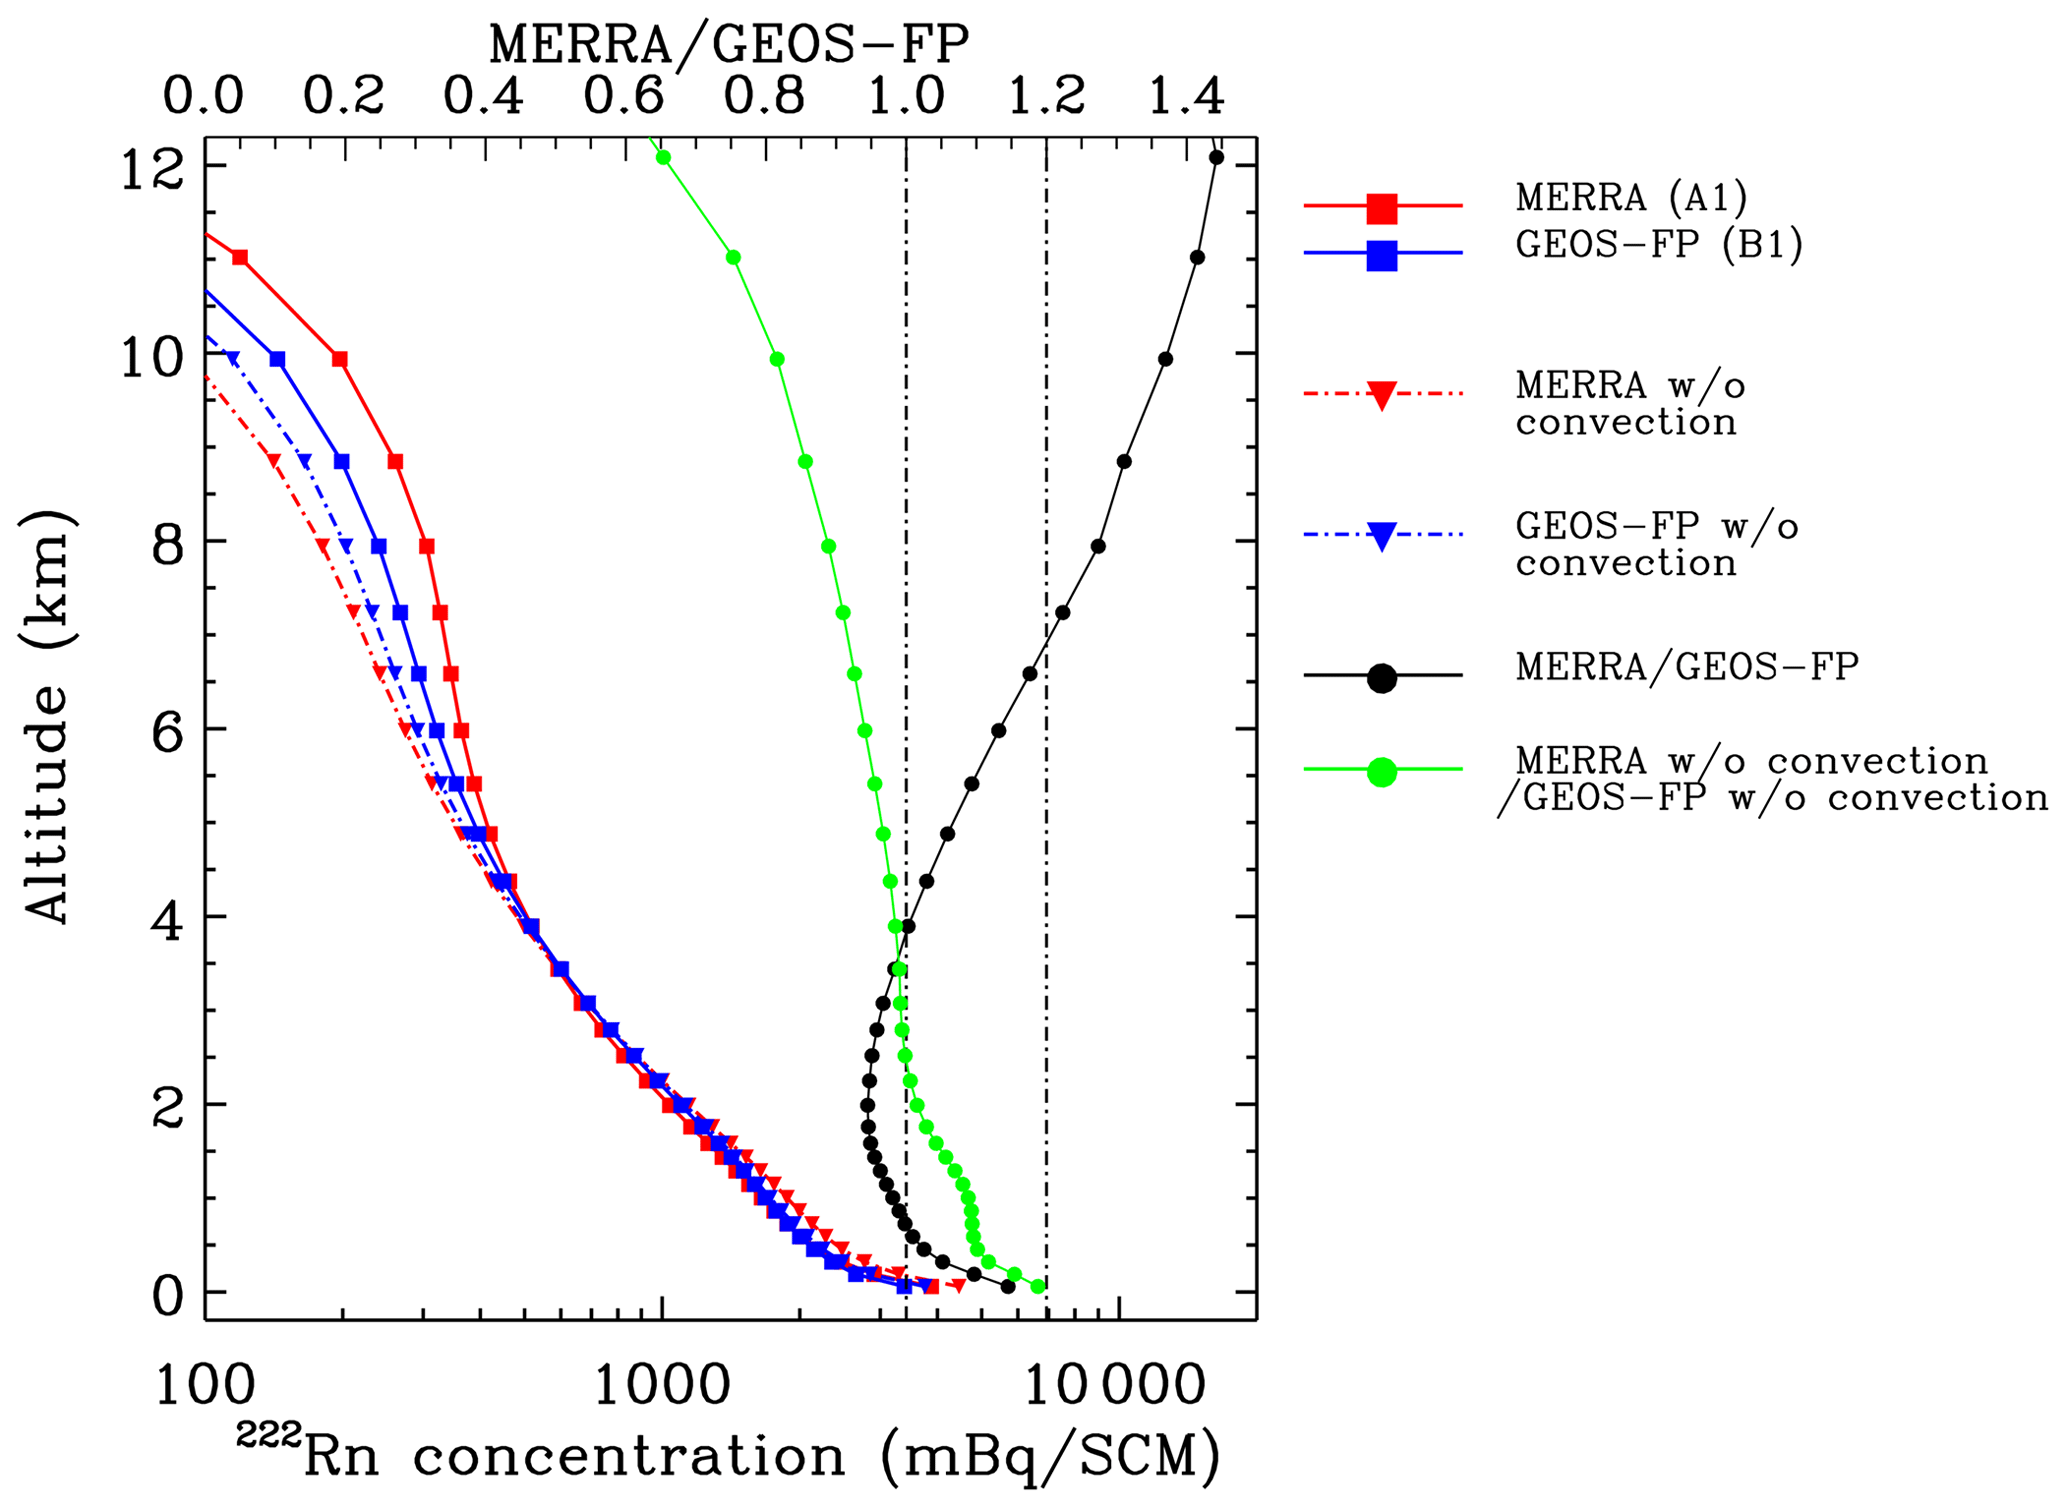
Figure 16Annual zonal mean 222Rn profiles (mBq/SCM, red and blue lines) averaged over land areas between 30–60∘ N latitudes in simulations driven by MERRA (A1 and A1-nc, Table 2) and GEOS-FP (B1 and B1-nc, Table 2), respectively. The black solid line (with the upper axis) shows the ratios of simulated 222Rn concentrations in the standard simulations with MERRA and GEOS-FP. The green line shows the same ratios when convection is turned off in the simulations. The two dotted–dashed black lines have constant ratios of 1.0 and 1.2, respectively.
We have evaluated the global distributions of 222Rn simulated by the GEOS-Chem chemical transport model with a focus on the sensitivity of simulated surface concentrations and seasonality to the choice of available emission scenarios. A preferred emission scenario was recommended based on evaluations against surface observation of 222Rn concentrations and 210Pb deposition fluxes. We have discussed the major factors controlling 222Rn emissions as well as potential emission uncertainties in East Asia, North Africa, and Antarctic. We have also characterized the vertical transport processes associated with the MERRA and GEOS-FP meteorological data products by comparing simulated 222Rn vertical profiles with observations.
We implemented three new global 222Rn emission scenarios in GEOS-Chem, SW98 (Schery and Wasiolek, 1998), ZK11 (Zhang et al., 2011), and ZKC (an optimized inventory modified from Zhang et al., 2011). All scenarios include prescribed regional variations and seasonality, which are lacking in the JA97 emission scenario (Jacob et al., 1997) currently used in the standard GEOS-Chem and other global models. JA97 often led to much larger biases in surface concentrations relative to the other scenarios because of lack of spatial variations and overly simplified emission reduction under freezing conditions (e.g., in high-latitude regions). The new emission options all resulted in remarkable increases in surface 222Rn concentrations at northern midlatitudes and high latitudes. Such increases were more pronounced in winter due to the accumulation effect within the shallow boundary layer. With constraints from observations, we are able to achieve much better agreement between the model and observations in all four defined regions (Europe, Asia, North America, and remote regions) using a customized emission scenario, ZKC. However, the simulation with ZKC still inherited some unsolved issues, e.g., large biases in Asia and poorly characterized emission fluxes in Antarctica and at some elevated sites. More measurements of soil radium content and surface 222Rn concentrations are desired to produce a better global 222Rn emission scenario. The seasonality in surface 222Rn concentrations at northern midlatitudes typically shows a low in spring and a peak in fall, a result of the competition between changes in emission fluxes and the strength of vertical transport (ventilation). In subtropical East and South Asia, the seasonality is strongly affected by the monsoon and shows a summer minimum. Our analyses also suggested that 222Rn emissions have been quantified more accurately over Europe due to more frequent and evenly distributed measurements across the continent.
We specifically investigated the underestimated Asian 222Rn emissions and explored possible reasons based on previous studies. Both our simulated surface 222Rn concentrations and 210Pb (decay daughter of 222Rn) deposition fluxes over Asia suggested underestimated Asian 222Rn emissions in the model. In the simulation experiments with Asian 222Rn emissions scaled up by a factor of 1.2 to 1.7, agreement with surface observations was significantly improved. However, due to limited knowledge about the spatial distributions and extents associated with the underestimation in Asian emissions, we did not apply a larger scaling factor, which would cause large overestimates of 210Pb deposition fluxes in the model. As a trade-off, we used a scaling factor of 1.2 for emissions over China in the ZKC inventory, which increased the simulated surface 222Rn concentrations and led to a better agreement with observations in Asia. The issue of underestimated Asian emissions is still open. An ideal solution would be an improved and spatially resolved emission map instead of using a uniform scaling factor for the region. The excessive 222Rn emissions in Asia may be due to multiple factors, including various surface textures, high contents of radium in the soil, active crust movement along the Asian earthquake zone, and high contents of radium in the fertilizer used in East Asia and India.
We found that it was challenging for model simulations driven by GEOS products to fully capture the vertical structure of observed 222Rn profiles. A comparison with summertime continental profiles showed that both MERRA and GEOS-FP have biased levels of convective detrainment. Convection in both MERRA and GEOS-FP was likely too deep in northern midlatitude land areas. The weak convection in GEOS-FP leads to large low biases of 222Rn in the middle–high troposphere. This is partly attributed to the lost vertical transport as a result of the remapping from the cubed-sphere to equally rectilinear grids and the degradation of the spatiotemporal resolution of the input meteorological data (Yu et al., 2018). A comparison of global 222Rn vertical distributions between the simulations driven by MERRA and GEOS-FP showed a distinct difference in the role of convective transport (versus large-scale vertical advection) in determining the 222Rn vertical distributions. The stronger convective transport in MERRA is partially compensated for by its weaker large-scale upward advection compared with GEOS-FP, resulting in similar vertical 222Rn distributions in the model simulations driven by the two meteorological products. This has important implications for using chemical transport models to interpret the transport of other trace gases and aerosols when these GEOS products are used as driving meteorology.
The 222Rn emission data used in this paper are described in Sect. 2.2. Observational data for model evaluation are introduced in Sect. 2.3. All model output, emission data, and observational datasets are available online (https://doi.org/10.5281/zenodo.3942287; Zhang et al., 2020).
The supplement related to this article is available online at: https://doi.org/10.5194/acp-21-1861-2021-supplement.
BZ and HL designed the study. BZ conducted the model simulations and led the analysis. BZ and HL wrote the manuscript, with contributions from all coauthors. JHC, GC, and TDF contributed to the analysis of model results in comparison with observational datasets. SC, CHK, and AGW contributed 222Rn surface and profile datasets. KZ contributed the ZK11 222Rn emission data and surface observational datasets. DBC contributed to the analysis of 222Rn vertical profiles. MPS and RMY contributed to the model development.
The authors declare that they have no conflict of interest.
The authors thank the editor and two anonymous referees for their comments. Hongyu Liu would like to thank Daniel Jacob for his comments on an earlier version of the manuscript and Andrea Molod for useful discussions. The Pacific Northwest National Laboratory is operated for DOE by Battelle Memorial Institute under contract DE-AC06-76RLO1830. NASA Center for Computational Sciences (NCCS) provided supercomputing resources. The GEOS-Chem model is managed by the Atmospheric Chemistry Modeling Group at Harvard University with support from NASA ACMAP and MAP programs. The GEOS-Chem Support Team at Harvard University and Dalhousie University are acknowledged for their effort.
This research has been supported by the NASA Atmospheric Composition Campaign Data Analysis and Modeling program (ACCDAM) managed by Hal Maring (grant no. NNX14AR07G).
This paper was edited by Yves Balkanski and reviewed by two anonymous referees.
Allen, D. J., Rood, R. B., Thompson, A. M., and Hudson, R.D.: Three-dimensional radon-222 calculations using assimilated meteorological data and a convective mixing algorithm, J. Geophys. Res.-Atmos., 101, 6871–6881, 1996.
Balkanski, Y. J., Jacob, D. J., Arimoto, R., and Kritz, M. A.: Distribution of 222 Rn over the North Pacific: implications for continental influences, J. Atmos. Chem., 14, 353–374, 1992.
Balkanski, Y. J., Jacob, D. J., Gardner, G. M., Graustein, W. C., and Turekian, K. K.: Transport and residence times of tropospheric aerosols inferred from a global three-dimensional simulation of 210Pb, J. Geophys. Res.-Atmos., 98, 20573–20586, https://doi.org/10.1029/93jd02456, 1993.
Bey, I., Jacob, D. J., Yantosca, R. M., Logan, J. A., Field, B. D., Fiore, A. M., Li, Q. B., Liu, H. G. Y., Mickley, L. J., and Schultz, M. G.: Global modeling of tropospheric chemistry with assimilated meteorology: Model description and evaluation, J. Geophys. Res., 106, 23073–23095, https://doi.org/10.1029/2001JD000807, 2001.
Botha, R., Labuschagne, C., Williams, A. G., Bosman, G., Brunke, E. G., Rossouw, A., and Lindsay, R.: Characterising fifteen years of continuous atmospheric radon activity observations at Cape Point (South Africa), Atmos. Environ., 176, 30–39, 2018.
Chambers, S., Zahorowski, W., Matsumoto, K., and Uematsu, M.: Seasonal variability of radon-derived fetch regions for Sado Island, Japan, based on 3 years of observations: 2002–2004, Atmos. Environ., 43, 271–279, 2009.
Chambers, S. D., Williams, A. G., Zahorowski, W., Griffiths, A., and Crawford, J.: Separating remote fetch and local mixing influences on vertical radon measurements in the lower atmosphere, Tellus B, 63, 843–859, https://doi.org/10.1111/j.1600-0889.2011.00565.x, 2011.
Chambers, S. D., Zahorowski, W., Williams, A. G., Crawford, J., and Griffiths, A. D.: Identifying tropospheric baseline air masses at Mauna Loa Observatory between 2004 and 2010 using Radon-222 and back trajectories, J. Geophys. Res.-Atmos., 118, 992–1004, 2013.
Chambers, S. D., Podstawczyńska, A., Williams, A. G., and Pawlak, W.: Characterising the influence of atmospheric mixing state on Urban Heat Island Intensity using Radon-222, Atmos. Environ., 147, 355–368, https://doi.org/10.1016/j.atmosenv.2016.10.026, 2016a.
Chambers, S. D., Kang, C. H., Williams, A. G., Crawford, J., Griffiths, A. D., Kim, K. H., and Kim, W. H.: Improving the representation of cross-boundary transport of anthropogenic pollution in East Asia using radon-222, Aerosol Air Qual. Res., 16, 958–976, https://doi.org/10.4209/aaqr.2015.08.0522, 2016b.
Chambers, S. D., Williams, A. G., Conen, F., Griffiths, A. D., Reimann, S., Steinbacher, M., Krummel, P. B., Steele, L. P., van der Schoot, M. V., Galbally, I. E., Molloy, S. B., and Barnes, J. E.: Towards a universal “Baseline” characterisation of air masses for high- and low-altitude observing stations using radon-222, Aerosol Air Qual. Res., 16, 885–899, https://doi.org/10.4209/aaqr.2015.06.0391, 2016c.
Chambers, S. D., Preunkert, S., Weller, R., Hong, S.-B., Humphries, R. S., Tositti, L., Angot, H., Legrand, M., Williams, A. G., Griffiths, A. D., Crawford, J., Simmons, J., Choi, T. J., Krummel, P. B., Molloy, S., Loh, Z., Galbally, I., Wilson, S., Magand, O., Sprovieri, F., Pirrone, N., and Dommergue, A.: Characterizing Atmospheric Transport Pathways to Antarctica and the Remote Southern Ocean Using Radon-222, Front. Earth Sci., 6, 1–28, https://doi.org/10.3389/feart.2018.00190, 2018.
Chevillard, A., Ciais, P., Karstens, U., Heimann, M., Schmidt, M., Levin, I., Jacob, D., Podzun, R., Kazan, V., Sartorius, H., and Weingartner, E.: Transport of 222Rn using the regional model REMO: A detailed comparison with measurements over Europe, Tellus B, 54, 850–871, 2002.
Conen, F. and Robertson, L. B.: Latitudinal distribution of radon-222 flux from continents, Tellus B, 54, 127–133, https://doi.org/10.1034/j.1600-0889.2002.00365.x, 2002.
Considine, D. B., Bergmann, D. J., and Liu, H.: Sensitivity of Global Modeling Initiative chemistry and transport model simulations of radon-222 and lead-210 to input meteorological data, Atmos. Chem. Phys., 5, 3389–3406, https://doi.org/10.5194/acp-5-3389-2005, 2005.
Debaje, S. B., Vernekar, K. G., and Ramachandran, T. V: Study of atmospheric radon-222 concentrations at Pune, Indian Journal of Environmental Protection, 16, 755–760, 1996.
Du, J., Du, J., Baskaran, M., Bi, Q., Huang, D., and Jiang, Y.: Temporal variations of atmospheric depositional fluxes of 7Be and 210Pb over 8 years (2006–2013) at Shanghai, China, and synthesis of global fallout data, J. Geophys. Res., 120, 4323–4339, 2015.
Eastham, S. D., Weisenstein, D. K., and Barrett, S. R. H.: Development and evaluation of the unified tropospheric-stratospheric chemistry extension (UCX) for the global chemistry-transport model GEOS-Chem, Atmos. Environ., 89, 52–63, https://doi.org/10.1016/j.atmosenv.2014.02.001, 2014.
Evangelista, H. and Pereira, E. B.: Radon flux at King George Island, Antarctic Peninsula, J. Environ. Radioactiv., 61, 283–304, 2002.
Genthon, C. and Armengaud, A.: Radon 222 as a comparative tracer of transport and mixing in two general circulation models of the atmosphere, J. Geophys. Res.-Atmos., 100, 2849–2866, https://doi.org/10.1029/94JD02846, 1995.
Griffiths, A. D., Zahorowski, W., Element, A., and Werczynski, S.: A map of radon flux at the Australian land surface, Atmos. Chem. Phys., 10, 8969–8982, https://doi.org/10.5194/acp-10-8969-2010, 2010.
Grossi, C., Chambers, S. D., Llido, O., Vogel, F. R., Kazan, V., Capuana, A., Werczynski, S., Curcoll, R., Delmotte, M., Vargas, A., Morguí, J.-A., Levin, I., and Ramonet, M.: Intercomparison study of atmospheric 222Rn and 222Rn progeny monitors, Atmos. Meas. Tech., 13, 2241–2255, https://doi.org/10.5194/amt-13-2241-2020, 2020.
Hack, J. J.: Parameterization of moist convection in the National Center for Atmospheric Research community climate model (CCM2), J. Geophys. Res., 99, 5551–5568, https://doi.org/10.1029/93JD03478, 1994.
He, T.-L., Jones, D., Molod, A., Kouatchou, J., Zhang, B., Liu, H., Yu, K., and Yantosca, R., Sensitivity analysis and optimization of the RAS system in GEOS-Chem, 9th International GEOS-Chem Meeting, 6–9 May 2019, Cambridge, MA, USA, 2019.
Hirao, S., Yamazawa, H., and Moriizumi, J.: Estimation of the Global 222Rn Flux Density from the Earth's Surface, Japanese J. Heal. Phys., 45, 161–171, https://doi.org/10.5453/jhps.45.161, 2010.
Hirsch, R. M. and Gilroy, E. J.: Methods of fitting a straight line to data: examples in water, J. Am. Water Resour. Assoc., 20, 705–711, https://doi.org/10.1111/j.1752-1688.1984.tb04753.x, 1984.
Iida, T., Yamada, K., Hashiguchi, Y., Moriizumi, J., Nagao, I., Komura, K., Yoshioka, K., Yihe, J., and Kim, Y.-S.: Measurements of atmospheric radon concentrations at various locations in east Asia, in: International workshop on distribution and speciation of radionuclides in the environment, 11–13 October 2000, Rokkasho, Aomori, Japan, edited by: Inaba, J., Hisamatsu, S., and Ohtsuka, Y., 123–132, ISBN 4-9980604-3-0, 2000.
Jacob, D. J., Prather, M. J., Rasch, P. J., Shia, R. L., Balkanski, Y. J., Beagley, S. R., Bergmann, D. J., Blackshear, W. T., Brown, M., Chiba, M., and Chipperfield, M. P.: Evaluation and intercomparison of global atmospheric transport models using 222Rn and other short-lived tracers, J. Geophys. Res., 102, 5953–5970, 1997.
Jin, Y., Iida, T., Wang, Z., Ikebe, Y., and Abe, S.: A subnationwide survey of outdoor and indoor 222Rn concentrations in China by passive method, in: Radon and Thorn in the Human Environment, edited by: Katase, A. and Shimo, M., Proceedings of the 7th Tohwa University International Symposium, 23–25 October 1997, Fukuoka, Japan, World Scientific Publishing Pte Ltd, Singapore, 276–281, 1998.
Karstens, U., Schwingshackl, C., Schmithüsen, D., and Levin, I.: A process-based 222radon flux map for Europe and its comparison to long-term observations, Atmos. Chem. Phys., 15, 12845–12865, https://doi.org/10.5194/acp-15-12845-2015, 2015.
Kikaj, D., Chambers, S. D., and Vaupotič, J.: Radon-based atmospheric stability classification in contrasting sub-Alpine and sub-Mediterranean environments, J. Environ. Radioact., 203, 125–134, https://doi.org/10.1016/j.jenvrad.2019.03.010, 2019.
Koch, D., Schmidt, G. A., and Field, C. V.: Sulfur, sea salt, and radionuclide aerosols in GISS ModelE, J. Geophys. Res., 111, D06206, https://doi.org/10.1029/2004JD005550, 2006.
Kritz, M. A., Rosner, S. W., and Stockwell, D. Z.: Validation of an off-line three-dimensional chemical transport model using observed radon profiles: 1. Observations, J. Geophys. Res, 103, 8425–8432, 1998.
Lin, J. T. and McElroy, M. B.: Impacts of boundary layer mixing on pollutant vertical profiles in the lower troposphere: Implications to satellite remote sensing, Atmos. Environ., 44, 1726–1739, https://doi.org/10.1016/j.atmosenv.2010.02.009, 2010.
Lin, S.-J. and Rood, R. B.: Multidimensional Flux-Form Semi-Lagrangian Transport Schemes, Mon. Weather Rev., 124, 2046–2070, 1996.
Lindeken, C. L.: Seasonal variations in the concentration of airborne radon and thoron daughters, Lawrence Radiation Lab, California University, Livermore, USA, 1967.
Liu, H., Jacob, D. J., Bey, I., and Yantosca, R. M.: Constraints from 210Pb and 7Be on wet deposition and transport in a global three-dimensional chemical tracer model driven by assimilated meteorological fields, J. Geophys. Res., 106, 12109–12128, https://doi.org/10.1029/2000JD900839, 2001.
Liu, H., Jacob, D. J., Dibb, J. E., Fiore, A. M., and Yantosca, R. M.: Constraints on the sources of tropospheric ozone from 210Pb-7Be-O3 correlations, J. Geophys. Res., 109, D07306, https://doi.org/10.1029/2003JD003988, 2004.
Liu, H., Considine, D. B., Horowitz, L. W., Crawford, J. H., Rodriguez, J. M., Strahan, S. E., Damon, M. R., Steenrod, S. D., Xu, X., Kouatchou, J., Carouge, C., and Yantosca, R. M.: Using beryllium-7 to assess cross-tropopause transport in global models, Atmos. Chem. Phys., 16, 4641–4659, https://doi.org/10.5194/acp-16-4641-2016, 2016.
Liu, J., Logan, J. A., Murray, L. T., Pumphrey, H. C., Schwartz, M. J., and Megretskaia, I. A.: Transport analysis and source attribution of seasonal and interannual variability of CO in the tropical upper troposphere and lower stratosphere, Atmos. Chem. Phys., 13, 129–146, https://doi.org/10.5194/acp-13-129-2013, 2013.
Liu, S. C., Mcafee, J. R., and Cicerone, R. J.: Radon-222 and Tropospheric Vertical Transport, J. Geophys. Res., 89, 7291–7297, https://doi.org/10.1029/JD089iD05p07291, 1984.
Lock, A. P., Brown, A. R., Bush, M. R., Martin, G. M., and Smith, R. N. B.: A new boundary layer mixing scheme. Part I: Scheme description and single-column model tests, Mon. Weather Rev., 128, 3187–3199, 2000.
López-Coto, I., Mas, J. L., and Bolivar, J. P.: A 40-year retrospective European radon flux inventory including climatological variability, Atmos. Environ., 73, 22–33, 2013.
Louis, J. F., Tiedke, M., and Geleyn, M.: A short history of the operational PBL-parameterization at ECMWF, ECMWF Workshop on Planetary Boundary Layer Parameterization, 25–27 November 1981, Shinfield Park, Reading, UK, 1981.
Martell, E. A.: Enhanced ion production in convective storms by transpired radon isotopes and their decay products, J. Geophys. Res., 90, 5909–5916, 1985.
Molod, A., Takacs, L., Suarez, M., Bacmeister, J., Song, I.-S., and Eichmann, A.: The GEOS-5 atmospheric general circulation model: Mean climate and development from MERRA to Fortuna, NASA Technical Repport Series on Global Modeling and Data Assimilation, Vol. 28, NASA TM-2012-104606, NASA Goddard Space Flight Center, Greenbelt, Maryland, USA, 2012.
Molod, A., Takacs, L., Suarez, M., and Bacmeister, J.: Development of the GEOS-5 atmospheric general circulation model: evolution from MERRA to MERRA2, Geosci. Model Dev., 8, 1339–1356, https://doi.org/10.5194/gmd-8-1339-2015, 2015.
Moore, H. E., Martell, E. A., and Poet, S. E.: Sources of polonium-210 in atmosphere, Environ. Sci. Technol., 10, 586–591, 1976.
Moorthi, S. and Suarez, M. J.: Relaxed Arakawa-Schubert. A parameterization of moist convection for general circulation models, Mon. Weather Rev., 120, 978–1002, 1992.
Nordeng, T. E.: Extended versions of the convective parametrization scheme at ECMWF and their impact on the mean and transient activity of the model in the tropics, Research Department Technical Memorandum, 206, 1–41, 1994.
Park, R. J., Jacob, D. J., Field, B. D., Yantosca, R. M., and Chin, M.: Natural and transboundary pollution influences on sulfate-nitrate-ammonium aerosols in the United States: Implications for policy, J. Geophys. Res.-Atmos., 109, D15204, https://doi.org/10.1029/2003JD004473, 2004.
Posselt, D. J., Jongeward, A. R., Hsu, C. Y., and Potter, G. L.: Object-based evaluation of MERRA cloud physical properties and radiative fluxes during the 1998 El Niño-La Niña transition, J. Climate, 25, 7313–7327, 2012.
Rasch, P. J., Feichter, J., Law, K., Mahowald, N., Penner, J., Benkovitz, C., Genthon, C., Giannakopoulos, C., Kasibhatla, P., Koch, D., and Levy, H.: A comparison of scavenging and deposition processes in global models: results from the WCRP Cambridge Workshop of 1995, Tellus B, 52, 1025–1056, 2000.
Reithmeier, C. and Sausen, R.: ATTILA: atmospheric tracer transport in a Lagrangian model, Tellus B, 54, 278–299, 2002.
Rienecker, M. M., Suarez, M. J., Gelaro, R., Todling, R., Bacmeister, J., Liu, E., Bosilovich, M. G., Schubert, S. D., Takacs, L., Kim, G. K., and Bloom, S.: MERRA: NASA's modern-era retrospective analysis for research and applications, J. Climate, 24, 3624–3648, 2011.
Schery, S. D.: Progress on global 222Rn flux maps and recommendations for future research, 1st International Expert Meeting on Sources and Measurements of Natural Radionuclides Applied to Climate and Air Quality Studies, Sponsored by WMO/IAEA/CNRS, 3–5 June 2003, Gif sur Yvette, France, WMO TD No. 1201, 43–47, 2004.
Schery, S. D. and Huang, S.: An estimate of the global distribution of radon emissions from the ocean, Geophys. Res. Lett., 31, L19104, https://doi.org/10.1029/2004GL021051, 2004.
Schery, S. D. and Wasiolek, M. A.: Modeling radon flux from the earth's surface, in: Radon and Thorn in the Human Environment, edited by: Katase, A. and Shimo, M., Proceedings of the 7th Tohwa University International Symposium, Fukuoka, Japan, 23–25 October 1997, World Scientific Publishing Pte Ltd, Singapore, 207–217, 1998.
Schmithüsen, D., Chambers, S., Fischer, B., Gilge, S., Hatakka, J., Kazan, V., Neubert, R., Paatero, J., Ramonet, M., Schlosser, C., Schmid, S., Vermeulen, A., and Levin, I.: A European-wide 222radon and 222radon progeny comparison study, Atmos. Meas. Tech., 10, 1299–1312, https://doi.org/10.5194/amt-10-1299-2017, 2017.
Stanfield, R. E., Su, H., Jiang, J. H., Freitas, S. R., Molod, A. M., Luo, Z. J., and Luo, M.: Convective entrainment rates estimated from Aura CO and CloudSat/CALIPSO observations and comparison with GEOS-5, J. Geophys. Res., 124, 9796–9807, 2019.
Szegvary, T., Leuenberger, M. C., and Conen, F.: Predicting terrestrial 222Rn flux using gamma dose rate as a proxy, Atmos. Chem. Phys., 7, 2789–2795, https://doi.org/10.5194/acp-7-2789-2007, 2007.
Szegvary, T., Conen, F., and Ciais, P.: European 222Rn inventory for applied atmospheric studies, Atmos. Environ., 43, 1536–1539, https://doi.org/10.1016/j.atmosenv.2008.11.025, 2009.
Turekian, K. Y., Nozaki, Y., and Benninger, L. K.: Geochemistry of atmospheric radon and radon products, Annu. Rev. Earth Planet. Sci., 5, 227–255, 1977.
Wilkening, M. H.: Daily and annual courses of natural atmospheric radioactivity, J. Geophys. Res., 64, 521–526, 1959.
Wilkening, M. H. and Clements, W. E.: Radon-222 from the ocean surface, J. Geophys. Res., 80, 3828–3830, 1975.
Wilkening, M. H., Clements, W. E., and Stanley, D.: Radon-222 flux measurements in widely separated regions, in: Natural radiation environment II, edited by: Adams, J. A. S., Lowder, W. M., and Gesell, T. F., Conference on natural radiation environment, 7–11 August 1972, Houston, TX, USA, Report Number CONF-720805–P2, 717–730, 1972.
Williams, A. G., Chambers, S., Zahorowski, W., Crawford, J., Matsumoto, K., and Uematsu, M.: Estimating the Asian radon flux density and its latitudinal gradient in winter using ground-based radon observations at Sado Island, Tellus B, 61, 732–746, https://doi.org/10.1111/j.1600-0889.2009.00438.x, 2009.
Williams, A. G., Zahorowski, W., Chambers, S., Griffiths, A., Hacker, J. M., Element, A., and Werczynski, S.: The vertical distribution of radon in clear and cloudy daytime terrestrial boundary layers, J. Atmos. Sci., 68, 155–174, https://doi.org/10.1175/2010JAS3576.1, 2011.
Williams, A. G., Chambers, S. D., Conen, F., Reimann, S., Hill, M., Griffiths, A. D., and Crawford, J.: Radon as a tracer of atmospheric influences on traffic-related air pollution in a small inland city, Tellus B, 68, 30967, https://doi.org/10.3402/tellusb.v68.30967, 2016.
Wu, S., Mickley, L. J., Jacob, D. J., Logan, J. A., Yantosca, R. M., and Rind, D.: Why are there large differences between models in global budgets of tropospheric ozone?, J. Geophys. Res.-Atmos., 112, 1–18, https://doi.org/10.1029/2006JD007801, 2007.
Yamanishi, H., Iida, T., Ikebe, Y., Abe, S., and Hata, T.: Measurements of regional distribution of radon-222 concentration, J. Nucl. Sci. Technol., 28, 331–338, 1991.
Yu, K., Keller, C. A., Jacob, D. J., Molod, A. M., Eastham, S. D., and Long, M. S.: Errors and improvements in the use of archived meteorological data for chemical transport modeling: an analysis using GEOS-Chem v11-01 driven by GEOS-5 meteorology, Geosci. Model Dev., 11, 305–319, https://doi.org/10.5194/gmd-11-305-2018, 2018.
Zahorowski, W., Chambers, S., Wang, T., Kang, C.-H. H., Uno, I., Poon, S., Oh, S.-N. N., Werczynski, S., Kim, J., and Henderson-Sellers, A. N. N.: Radon-222 in boundary layer and free tropospheric continental outflow events at three ACE-Asia sites, Tellus B, 57, 124–140, https://doi.org/10.1111/j.1600-0889.2005.00133.x, 2005.
Zaucker, F., Daum, P. H., Wetterauer, U., Berkowitz, C., Kromer, B., and Broecker, W.S. Atmospheric 222Rn measurements during the 1993 NARE Intensive, J. Geophys. Res., 101, 29149–29164, 1996.
Zhang, B., Liu, H., Crawford, J. H., Chen, G., Fairlie, T. D., Chambers, S., Kang, C.-H., Williams, A. G., Zhang, K., Considine, D. B., Sulprizio, M. P., and Yantosca, R. M.: Simulation of radon-222 with the GEOS-Chem global model: Emissions, seasonality, and convective transport, Zenodo, https://doi.org/10.5281/zenodo.3942287, 2020.
Zhang, B., Liu, H., Crawford, J., Fairlie, D., Chen, G., Dibb, J., Shah, V., Sulprizio, M., and Yantosca, R.: Constraints from airborne 210Pb observations on aerosol scavenging and lifetime in a global chemical transport model, in preparation, 2021.
Zhang, G. J. and McFarlane, N. A.: Sensitivity of climate simulations to the parameterization of cumulus convection in the Canadian Climate Centre general circulation model, Atmos. Ocean, 33, 407–446, 1995.
Zhang, K., Wan, H., Zhang, M., and Wang, B.: Evaluation of the atmospheric transport in a GCM using radon measurements: sensitivity to cumulus convection parameterization, Atmos. Chem. Phys., 8, 2811–2832, https://doi.org/10.5194/acp-8-2811-2008, 2008.
Zhang, K., Feichter, J., Kazil, J., Wan, H., Zhuo, W., Griffiths, A. D., Sartorius, H., Zahorowski, W., Ramonet, M., Schmidt, M., Yver, C., Neubert, R. E. M., and Brunke, E.-G.: Radon activity in the lower troposphere and its impact on ionization rate: a global estimate using different radon emissions, Atmos. Chem. Phys., 11, 7817–7838, https://doi.org/10.5194/acp-11-7817-2011, 2011.
Zhang, L., Jacob, D. J., Boersma, K. F., Jaffe, D. A., Olson, J. R., Bowman, K. W., Worden, J. R., Thompson, A. M., Avery, M. A., Cohen, R. C., Dibb, J. E., Flock, F. M., Fuelberg, H. E., Huey, L. G., McMillan, W. W., Singh, H. B., and Weinheimer, A. J.: Transpacific transport of ozone pollution and the effect of recent Asian emission increases on air quality in North America: an integrated analysis using satellite, aircraft, ozonesonde, and surface observations, Atmos. Chem. Phys., 8, 6117–6136, https://doi.org/10.5194/acp-8-6117-2008, 2008.
Zhuo, W., Guo, Q., Chen, B., and Cheng, G.: Estimating the amount and distribution of radon flux density from the soil surface in China, J. Environ. Radioact., 99, 1143–1148, 2008.
- Abstract
- Introduction
- Model and data
- Model results and evaluation with surface observations
- Excessive 222Rn emissions in East Asia
- Seasonality in surface 222Rn concentrations
- Vertical distribution of 222Rn concentrations
- Summary and conclusions
- Data availability
- Author contributions
- Competing interests
- Acknowledgements
- Financial support
- Review statement
- References
- Supplement