the Creative Commons Attribution 4.0 License.
the Creative Commons Attribution 4.0 License.
 | 21 Dec 2021
Mercury isotopic compositions in fine particles and offshore surface seawater in a coastal area of East China: implications for Hg sources and atmospheric transformations
Lingling Xu
Jiayan Shi
Yuping Chen
Yanru Zhang
Mengrong Yang
Yanting Chen
Liqian Yin
Lei Tong
Hang Xiao
Jinsheng Chen
Isotopic compositions of Mercury (Hg) in atmospheric particles (HgPM) are probably the mixed results of emission sources and atmospheric processes. Here, we present Hg isotopic compositions in daily fine particles (PM2.5) collected from an industrial site (Chunxiao – CX) and a nearby mountain site (Daimeishan – DMS) in a coastal area of East China, and in surface seawater close to the industrial area, to reveal the influence of anthropogenic emission sources and atmospheric transformations on Hg isotopes. The PM2.5 samples displayed a significant spatial difference in δ202Hg. For the CX site, the negative δ202Hg values are similar to those of source materials, and the HgPM contents were well correlated with chemical tracers, indicating the dominant contributions of local industrial activities to Hg, whereas the observed positive δ202Hg at the DMS site was likely associated with regional emissions and extended atmospheric processes during transport. The Δ199Hg values in PM2.5 from the CX and DMS sites were comparably positive. The unity slope of Δ199Hg versus Δ201Hg over all data suggests that the odd mass independent fractionation (MIF) of Hg was primarily induced by the photoreduction of Hg2+ in aerosols. The positive Δ200Hg values with a minor spatial difference were probably associated with the photooxidation of Hg0, which is generally enhanced in the coastal environment. Total Hg in offshore surface seawater was characterized by negative δ202Hg and near-zero Δ199Hg and Δ200Hg values, which are indistinguishable from Hg isotopes of source materials. Overall, the PM2.5 collected from industrial areas had comparable δ202Hg values but more positive Δ199Hg and Δ200Hg as compared to surface seawater. The results indicate that atmospheric transformations would induce the significant fractionation of Hg isotopes and obscure the Hg isotopic signatures of anthropogenic emissions.
- Article
(3089 KB) - Full-text XML
-
Supplement
(1345 KB) - BibTeX
- EndNote


Mercury (Hg) is a genotoxic element and was ranked with the priority-controlled pollutants in many countries. Atmospheric Hg was operationally defined to have the following three forms: gaseous elemental mercury (GEM), gaseous oxidized mercury (GOM), and particle bound mercury (PBM or HgPM; Schroeder and Munthe, 1998). Previous studies indicated that HgPM concentrations in urban and industrial areas could reach up to hundreds even thousands of pictograms per cubic meter (hereafter pg m−3), relative to tens of pg m−3 in uncontaminated remote areas (Fu et al., 2015; Mao et al., 2016). In addition, HgPM can account for up to 40 % of atmospheric Hg in industrial areas, relative to < 5 % in uncontaminated areas (Guo et al., 2022; Schroeder and Munthe, 1998). Hence, particulate matter (PM) can act as a vector of toxic Hg, and the inhalation of Hg-carrying particles is an important pathway of human exposure to atmospheric Hg. Coal combustion, non-ferrous metal smelting, and cement production were the three primary anthropogenic sources of atmospheric Hg, which are responsible for 47 % of the total global Hg emissions (UN Environment, 2019). On the other hand, HgPM undergoes complex transport and transformation processes in the atmosphere. HgPM can be formed by the uptake of GOM in particles, which made an important contribution to HgPM in the heavily particle polluted areas (Xu et al., 2020), whereas the reduction of GOM binding with dissolved organic carbon ligands in aqueous particles potentially converts it back to the gas phase (Horowitz et al., 2017). In addition, HgPM has a residence time of several weeks as it can transport and deposit at a regional scale (Selin, 2009). The research has suggested that atmospheric HgPM is generally a combined result of anthropogenic emissions and atmospheric processes, which plays a crucial role in the global cycling of Hg.
Analysis techniques of Hg isotopes and mechanisms of Hg isotopic fractionation have come a long way in the last decade (Blum and Johnson, 2017). Hg has seven stable isotopes (including 196Hg, 198Hg, 199Hg, 200Hg, 201Hg, 202Hg, and 204Hg) and exhibits mass dependent fractionation (MDF) and mass independent fractionation (MIF) in various environmental samples and processes (Blum and Johnson, 2017; Sonke and Blum, 2013; Yin et al., 2014a). The MDF of Hg isotopes is often reported as δ202Hg, while the MIF of odd mass-numbered Hg isotopes (odd MIF) is reported as Δ199Hg and Δ201Hg, and the MIF of even Hg isotopes (even MIF) is reported as Δ200Hg and Δ204Hg. Previous laboratory and field studies have revealed that nearly all biogeochemical processes induce the MDF of Hg isotopes, whereas significant odd MIF of Hg occurs mainly in photochemical processes (Bergquist and Blum, 2007; Blum et al., 2014; Malinovsky et al., 2010; G. Y. Sun et al., 2016). What is more, specific ratios of Δ199Hg Δ201Hg have been reported for different transformation processes, i.e., ∼ 1.0 for photoreduction of Hg2+ and ∼1.6 for photooxidation of Hg0 (Bergquist and Blum, 2007; G. Y. Sun et al., 2016). Even MIF of Hg isotopes is observed mostly in atmosphere-related samples, which are suggested to be associated with the photooxidation of Hg0 by UV and oxidants (Blum and Johnson, 2017; Chen et al., 2012; Fu et al., 2019). Therefore, Hg isotopes are capable of becoming useful tracers for the biogeochemical cycles of Hg in the environment.
There is a large difficulty in sampling enough Hg mass for analyzing Hg isotopes of atmospheric samples. Even so, a few public studies have proven that Hg isotopes are useful tools to investigate the potential sources and transformation processes of Hg in the atmosphere. The PM from major cities, as in northern and western China, mostly displayed significant negative MDF and near-zero odd MIF due to the dominant impact of anthropogenic emissions (Huang et al., 2015, 2016, 2019, 2020; Xu et al., 2017, 2019; Yu et al., 2016). A previous study conducted in remote areas of China has reported that the HgPM exposed to air masses of regional and long-range sources had distinct isotopic signatures (Fu et al., 2019). Recently, many studies have used Hg isotopes to investigate the contribution of domestic emissions and transboundary Hg transport to atmospheric HgPM. These studies have implied that the long-range transboundary Hg transport from southern Asia played a crucial role in the Himalaya and the Tibetan Plateau and even in southwestern and northwestern China (Fu et al., 2019; Guo et al., 2021, 2022). East China is densely populated and one of the most heavily industrialized area in China. The concentration of HgPM in this region has been well characterized (Hong et al., 2016; Xu et al., 2020; Yu et al., 2015), but only two studies conducted at the remote sites have referred to HgPM isotopes (Fu et al., 2019; Yu et al., 2016). To the best of our knowledge, there is no report on the isotopic compositions of HgPM from urban areas of East China. Similarly, the effect of atmospheric processes on the fractionation of Hg isotopes in the coastal region has not been well elucidated.
This study determined Hg isotopic compositions in PM2.5 collected from an industrial site and a mountain site in a coastal area of East China. A comparison of Hg isotopes at the neighboring sites would eliminate the impacts of meteorology and atmospheric Hg background, which vary across space on HgPM isotopes. Furthermore, this study measured the isotopic compositions of total mercury (THg) in surface seawater close to the industrial area and distinguished Hg isotopes between the atmospheric sample and surface medias. The objectives of this study are (1) to differentiate the Hg isotopes in PM2.5 from the two neighboring industrial and mountain sites, (2) to use the Hg isotopes to explore the influence of anthropogenic sources on the HgPM, and (3) to reveal the role of atmospheric transformations in varying HgPM isotopic compositions.
2.1 Study area description
PM2.5 sampling was conducted at an industrial site (Chunxiao – CX) and a nearby mountain site (Daimeishan – DMS) on the eastern coast of the Zhejiang province in East China (Fig. 1). The study region experiences a typical subtropical monsoon climate, with sea breezes in summer and continental breezes in winter. The average annual temperature, precipitation, relative humidity, and sunshine hours were 18.1∘, 1608 mm, 76.8 %, and 1797 h, respectively.
The CX site (121.91∘ E, 29.87∘ N, 15 m above ground level – a.g.l.) is located in the Urban Environment Observation and Research Station at the Chinese Academy of Sciences, Beilun District, Ningbo, China. Ningbo is a highly industrial city, and there is a high density of industrial activity around the CX site. Potential Hg point sources include a large coal-fired power plant (5000 MW), approximately 20 km to the northwest, a chloralkali plant, 20 km to the northeast, and an automobile assembly plant, within 1 km of the site. The CX site is in close proximity to the East China Sea (ECS; ∼0.6 km); thus, clean air masses from the sea in warm seasons would dilute the atmospheric Hg at the CX site. The DMS site (121.62∘ E, 29.68∘ N, 450 m above sea level – a.s.l.) is located at the summit of the Damei mountain, which is surrounded by trees. The site is 20 km to the coast of the ECS and approximately 22 km south of Ningbo. There are no significant Hg point sources within a radius of ∼ 10 km from the DMS site. However, an early study reported that intense regional emissions, like industrial activities and coal combustion in the Yangtze River Delta and the neighboring region of Anhui, Jiangsu, and Zhejiang provinces, caused a high atmospheric Hg concentration at the DMS site (Yu et al., 2015).
Surface seawater samples were collected in the offshore area of Ningbo. The seawater sampling area (about 122.04∘ E, 29.82∘ N; Fig. 1) is approximately 1 km west of the Beilun District, Ningbo, China. The salinity of the seawater samples ranged from 21.2 ‰ to 29.5 ‰. The pH of the seawater samples was in the range of 5.7–8.5, with the mean value of 7.5 ± 0.6.
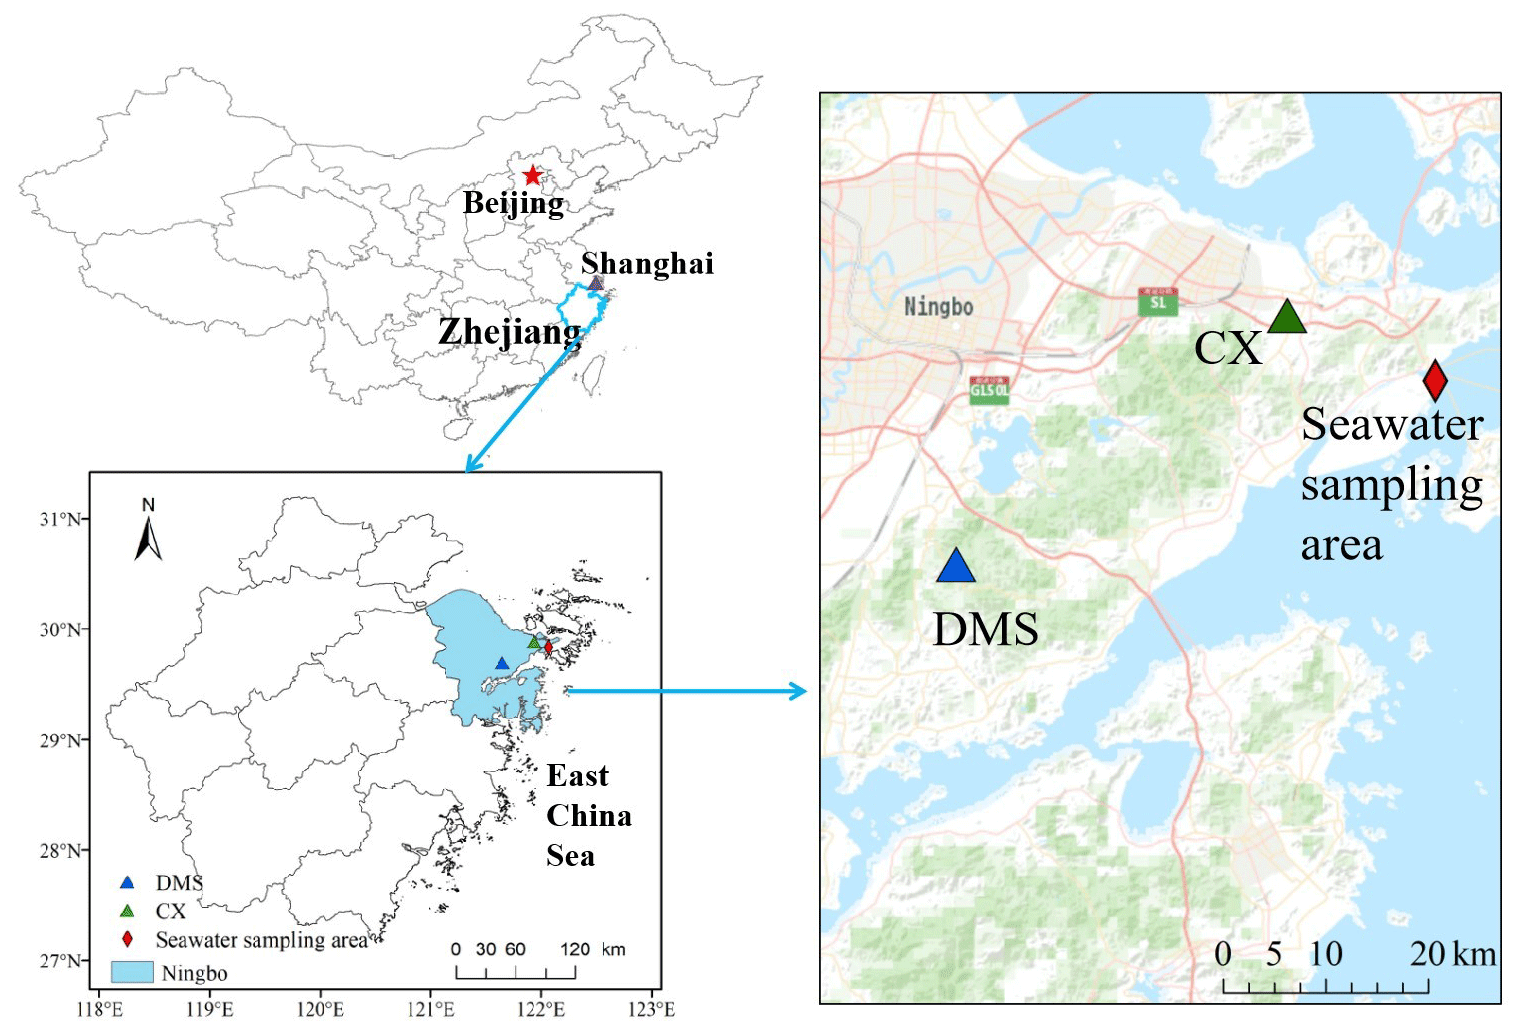
Figure 1Locations of PM2.5 (CX – industrial site; DMS – mountain site) and surface seawater sampling area.
2.2 Sample collection and analysis
2.2.1 Sampling of PM2.5
The period of PM2.5 sampling was from July 2017 to June 2018. Daily PM2.5 samples were collected 1–2 times a week at the CX site (except in January and February 2018) and once a week at the DMS site. Field blank samples were collected at each site. PM2.5 samples were collected on a preheated quartz fiber filter (500∘; 4 h; 8 × 10 in. (210 × 285 mm); Whatman Plc., Maidstone, UK) using a high-volume sampler (Tianhong TH1000H; China) with a flow rate of 1.05 m3 min−1. The filters were conditioned at 24±1 ∘C and 52±2 %. The mass loading of PM2.5 on filters was determined by mass difference before and after sampling. The filter samples were wrapped in aluminum foil and stored at −20 ∘C until analysis.
2.2.2 Concentration of Hg and other chemical species in PM2.5
A total of six punches (ca. 0.5 cm2 per punch) of each sampling filter were digested by a 10 mL of 40 % aqua regia (HNO3 : HCl = 1 : 3, ) in a water bath at 95 ∘C for 5 min; then, the solution was oxidized by 1 mL of 0.2 M BrCl and bathed for another 30 min. After cooling down, the extracted solution was diluted to 15 mL with ultrapure water and then analyzed by cold vapor atomic fluorescence spectrometry (CVAFS; Brooks Rand Model III; Brooks Rand Instruments, USA) following method 1631 of the U.S. Environmental Protection Agency (EPA). The content of Hg on blank filters can be negligible (42.5 pg at the CX site and 27.0 pg at the DMS site) relative to those on sample filters.
PM2.5 samples selected for Hg isotopes analysis were also measured for eight water soluble inorganic ions (K+, Ca2+, Na+, Mg2+, Cl−, SO, NO, and NH), elemental carbon (EC), organic carbon (OC), and levoglucosan. The water soluble ions were analyzed by ion chromatography (ICS-3000; Dionex, USA). EC and OC were analyzed using a carbon analyzer (model 4; Sunset Laboratory, USA) and the National Institute for Occupational Safety and Health (NIOSH) protocol. Analytical procedures and quality control procedures have been described by Xu et al. (2018). Levoglucosan, an excellent indicator of biomass burning, was analyzed using a gas chromatography–mass spectrometer detector (GC–MS; Agilent 7890A-5975C; Agilent Technologies, Inc., USA). Levoglucosan analytical procedures have been presented in detail elsewhere (Hong et al., 2019).
2.2.3 Sampling and analysis of Hg in seawater
Seawater samples were collected from the surface of the offshore sampling area twice a month during July 2017–June 2018, except for February 2018. Each time, three duplicate seawater samples of ∼ 50 mL were collected for THg content analysis. The final THg content was determined by the average of the three duplicate samples. In addition, ∼ 2 L surface seawater was sampled for Hg isotopes analysis each time. The seawater samples were stored in brown glass bottles and preserved with 1 % () HCl in the laboratory. They were analyzed for Hg content and isotopic compositions within a month.
The total Hg content in seawater samples was measured by CVAFS (Brooks Rand Model II; Brooks Rand Instruments, USA). A 25 mL seawater sample was digested with 0.2 M BrCl at least 12 h in advance and then analyzed using EPA method 1631. More details can be found in a previous study (Xu et al., 2014). The method blank was processed by filling up bottles with ultrapure water instead of seawater. The blank was lower than 10 pg (n= 15), which can be negligible compared to the samples.
2.3 Analysis of Hg isotopic compositions
2.3.1 PM2.5 sample processing
Due to the effects of precipitation and the short sampling duration, the mass of Hg on most of the PM2.5 samples was not sufficient for isotope detection. A total of 20 PM2.5 samples, including 10 at the CX site and 10 at the DMS site, were chosen for Hg isotope analysis. A preconcentration of Hg from PM2.5 samples was conducted following a dual-stage combustion protocol (Huang et al., 2015). To be specific, a tube furnace (OTF-1200X-∏; Kejin, China) consisting of two combustion stages was used. A sampling filter was embedded in a furnace quartz tube (50 mm outside diameter (OD); 46 mm inside diameter (ID); 80 cm length). The tube was then placed in the furnace so that the filter was at the first combustion stage. The second decomposition stage was heated up in advance and maintained at 1000 ∘C; then, the first combustion stage was heated up to 950 ∘C through a temperature-programmed procedure. The combustion procedure was run every day, with no samples in the furnace quartz tube before the PM2.5 sample treatment, to remove residual volatiles. The released Hg was transferred by O2 Ar gas (30 % 70 %) at a flow rate of 20 mL min−1 and then trapped by 10 mL of 40 % inverse aqua regia (2 : 4 : 9 ratio of 10 M HCl, 15 M HNO3, and ultrapure water) in a designated glass bottle. In advance of the PM2.5 sample analysis, the accuracy of the dual-stage combustion method was assessed by the analysis of the National Institute of Standards and Technology (NIST) standard reference materials (SRMs) 3133 Hg (dripped on blank filters) and the certified reference material GBW07434. The Hg recovery efficiency of the dual-stage protocol was in the range of 87.6 %–103.3 % (mean is 95.0±5.1 %; n= 6).
2.3.2 Seawater sample processing
A total of 20 seawater samples were analyzed for Hg isotopes. The ∼ 2 L seawater sample was first mixed with 4 mL of a 300 g L−1 NH2OH ⋅ HCl solution to neutralize the excess BrCl and then mixed with 8 mL of a 200 g L−1 SnCl2 solution to reduce the oxidized Hg. The pretreated seawater sample was stirred and bubbled for 1 h with Hg-free N2 at a flow rate of 400 mL min−1. The gaseous Hg purged off seawater samples was collected by a series of three gold traps. The gold traps were heated, and the released Hg was transferred by Hg-free N2 at 10–15 mL min−1 and concentrated by 10 mL of 40 % inverse aqua regia.
2.3.3 Hg isotopes analysis
All trapping solutions were preserved with 1 % () BrCl and stored at 4 ∘C in the dark before the Hg isotope analysis. Hg isotopic compositions were measured by a multicollector inductively coupled plasma mass spectrometer (MC-ICP-MS; Nu Instruments Ltd, UK) equipped with an introduction device, following the protocols presented in previous studies (Huang et al., 2015, 2021; Lin et al., 2015). The introduction device includes a modified cold vapor generator (CVG) and an Aridus3 nebulizer for the respective Hg and Tl introduction. Between the standard and the sample, the CVG was rinsed with 3 % () HNO3 solution to ensure the Hg signal returned to the background level. Instrument mass bias was corrected using both an internal standard (NIST 997 Tl) and a strict sample standard bracketing method (NIST 3133 Hg). A reference material (NIST 8610) was measured repeatedly for quality control. The preconcentration solutions were diluted to about 1.5–3.0 ng mL−1, and NIST 3133 and NIST 8610 were kept at 2.0 ng mL−1 during the analysis period. The MDF of Hg (represented by the δ value; per mille) is defined by the following equation (Blum and Bergquist, 2007):
where xxx is equal to 199, 200, 201, and 202. The MIF of Hg (Δ value; per mille) is calculated using the theoretically predicted MDF as the following equation (Blum and Bergquist, 2007):
where the mass-dependent scaling factor β is 0.252 for 199Hg, 0.502 for 200Hg, and 0.752 for 201Hg. The repeated measurement of NIST 8610 during the analysis session yielded δ202Hg and Δ199Hg values of ‰ and ‰ (2σ; n=7). In addition, a well-known reference material, UM-Almaden, showed long-term averages of δ202Hg = ‰ and Δ199Hg = ‰ (2σ; n= 25), which are well consistent with those in previous studies (Blum and Bergquist, 2007; Huang et al., 2015). The samples of this study were measured only once, so the 2σ uncertainties derived from repeated measurements of the NIST 3133 standard during each analysis section were applied to the samples.
3.1 Concentrations and isotopic compositions of Hg
Concentrations and isotopes of Hg at industrial and mountain sites are shown in Table 1. Mean volumetric concentrations of Hg were 16.3±17.8 pg m−3 at the CX site and 29.6±35.9 pg m−3 at the DMS site, which are comparable to those observed at remote sites (Fu et al., 2019) but lower than those reported from urban sites in China (Xu et al., 2019). The low volumetric concentrations of Hg observed in this study were likely associated with low PM2.5 concentrations (mean is 28.0 µg m−3 at the CX site and 34.8 µg m−3 at the DMS site) during the study period. The average mass concentrations of Hg were 0.52±0.23 µg g−1 (0.15 to 1.10; n=51) at the CX site and 0.85±0.63 µg g−1 (0.18 to 2.80; n=33) at the DMS site, respectively. A relatively high concentration of Hg has been reported at the DMS site before, which was likely due to regional Hg emissions, which are mainly from the industrial activities and coal combustion in the Yangtze River Delta and the neighboring region of Anhui, Jiangsu, and Zhejiang provinces (Yu et al., 2015). The Hg contents in PM2.5 of this study are higher than those of natural sources (e.g., dust and topsoil; 0.056–0.30 µg g−1; Schleicher et al., 2015) and those of coals in China (mean is 0.22 µg g−1; Yin et al., 2014b), which implies a potential contribution of anthropogenic sources with high Hg contents. The volumetric concentrations of Hg were closely correlated to Hg PM2.5 ratios at both the CX and DMS sites (R2= 0.50 and 0.60, p < 0.01), suggesting that atmospheric Hg concentrations were dependent on Hg contents, whereas a weak correlation between the Hg volumetric concentrations and PM2.5 masses was observed at the DMS site (R2= 0.25, p < 0.01) in contrast to the CX site (R2= 0.77, p < 0.01). The result likely indicates that the DMS site Hg was influenced by diverse sources of PM2.5 with different Hg levels and/or complex atmospheric Hg transformations (Xu et al., 2019). This is supported by the higher variation coefficient (VC = SDmean) of Hg mass concentrations at the DMS site (74.1 %) than at the CX site (44.2 %). Spatial differences in Hg were further examined by the relationships of Hg with other chemical species in PM2.5 (see Table S1 in the Supplement). In contrast to the DMS site, the mass concentrations of Hg at the CX site were well correlated to chemical tracers like Cl−, NO, K+, and OC (r= 0.40–0.57; p < 0.05; Spearman correlation), implying that there are contributions of steady anthropogenic sources to Hg in the industrial area.
The δ202Hg values for Hg at the CX site were in the range of −1.11 ‰ to 0.08 ‰ (mean is ‰; n= 10), while δ202Hg values at the DMS site were significantly higher and in a larger variation, from −0.78 ‰ to 1.10 ‰ (mean is 0.12±0.63 ‰; n= 10; p < 0.05; t test; Tables 1 and S2). HgPM isotopic compositions in multiple types of locations are shown in Fig. 2 and Table S3. The δ202Hg values at the CX site basically overlap those for PM in urban areas of China (mean is from −1.60 ‰ to −0.42 ‰), those for major source materials such as coal combustion, smelting, and cement plants (mean is −1.10 ‰, −0.87 ‰, and −1.42 ‰, respectively; Huang et al., 2016), and those for PM near-anthropogenic emissions such as industry, landfill, traffic, and coal-fired power plants (mean is from −2.41 ‰ to −0.58 ‰; Fig. 2). The result likely indicates an important contribution of anthropogenic sources to the CX site Hg. However, the δ202Hg values of the abovementioned potential sources are not distinguishable; thus, we could not identify the specific sources of Hg solely based on Hg isotopes. On the other hand, the slightly positive δ202Hg values at the DMS site are quite different from those observed at remote sites (mean is from −1.45 ‰ to −0.83 ‰; Fig. 2). Nevertheless, a less negative MDF of Hg has also been reported at the DMS site in a previous study (δ202Hg = −0.26 ‰; Yu et al., 2016). The HgPM from immediate anthropogenic emissions is generally characterized by negative δ202Hg, which, in turn, suggests that the more positive δ202Hg of HgPM at the DMS site might be affected by atmospheric processes like the photoreduction of Hg2+ (Bergquist and Blum, 2007; Zheng and Hintelmann, 2009).
In contrast to MDF, the odd MIF of Hg values at the two sites were comparable (p > 0.05; t test), with Δ199Hg values of 0.17±0.22 ‰ (from −0.17 ‰ to 0.52 ‰) at the CX site and 0.16±0.24 ‰ (from −0.22 ‰ to 0.47 ‰) at the DMS site, respectively. The significant positive Δ199Hg values in this study are similar to those observed in coastal areas (Rolison et al., 2013; Yu et al., 2020) and in remote areas in China (Fu et al., 2019) but are distinguishable from those in urban and industrial areas with near-zero values due to anthropogenic emissions (Das et al., 2016; Huang et al., 2016, 2018, 2020; Xu et al., 2017, 2019). A laboratory study has indicated that the photoreduction of Hg2+ restrains odd Hg in reactants (aerosols here) in priority, which shifts the Δ199Hg values positively (Bergquist and Blum, 2007). Thus, it is reasonably supposed that the positive odd MIF of HgPM in the study region was associated with the photoreduction of Hg2+ in aerosols. As shown in Table S2 and Fig. S1 in the Supplement, PM2.5 samples affected by the long-range transport of air masses mostly had large positive Δ199Hg, like the PM2.5 collected on 4 April 2018 from the CX site and on 10 January 2018 from the DMS site. It is probably related to the extensive photoreduction in Hg2+ of aerosols during the long-range transport, as previous studies have suggested (Fu et al., 2019; Huang et al., 2016). In addition, the MIF of 200Hg, most probably related to photoreactions, was significantly positive and displayed no spatial difference (0.11±0.07 ‰ at the CX site and 0.14±0.07 ‰ at the DMS site; p > 0.05; t test), which suggests enhanced and homogeneous photoreactions in the study region. It is worth noting that a part of PM2.5 samples collected from the DMS site displayed negative δ202Hg and near-zero Δ199Hg, which similar to those from the CX site (Fig. 2). Compared with the previous study (Yu et al., 2016), our results provide isotopic evidence that Hg at the DMS site was affected by multiple sources, and one of them might be regional anthropogenic emissions.
Table 1Concentrations and isotopic compositions of Hg at the industrial site (CX) and mountain site (DMS) in East China. Note: SD – standard deviation.
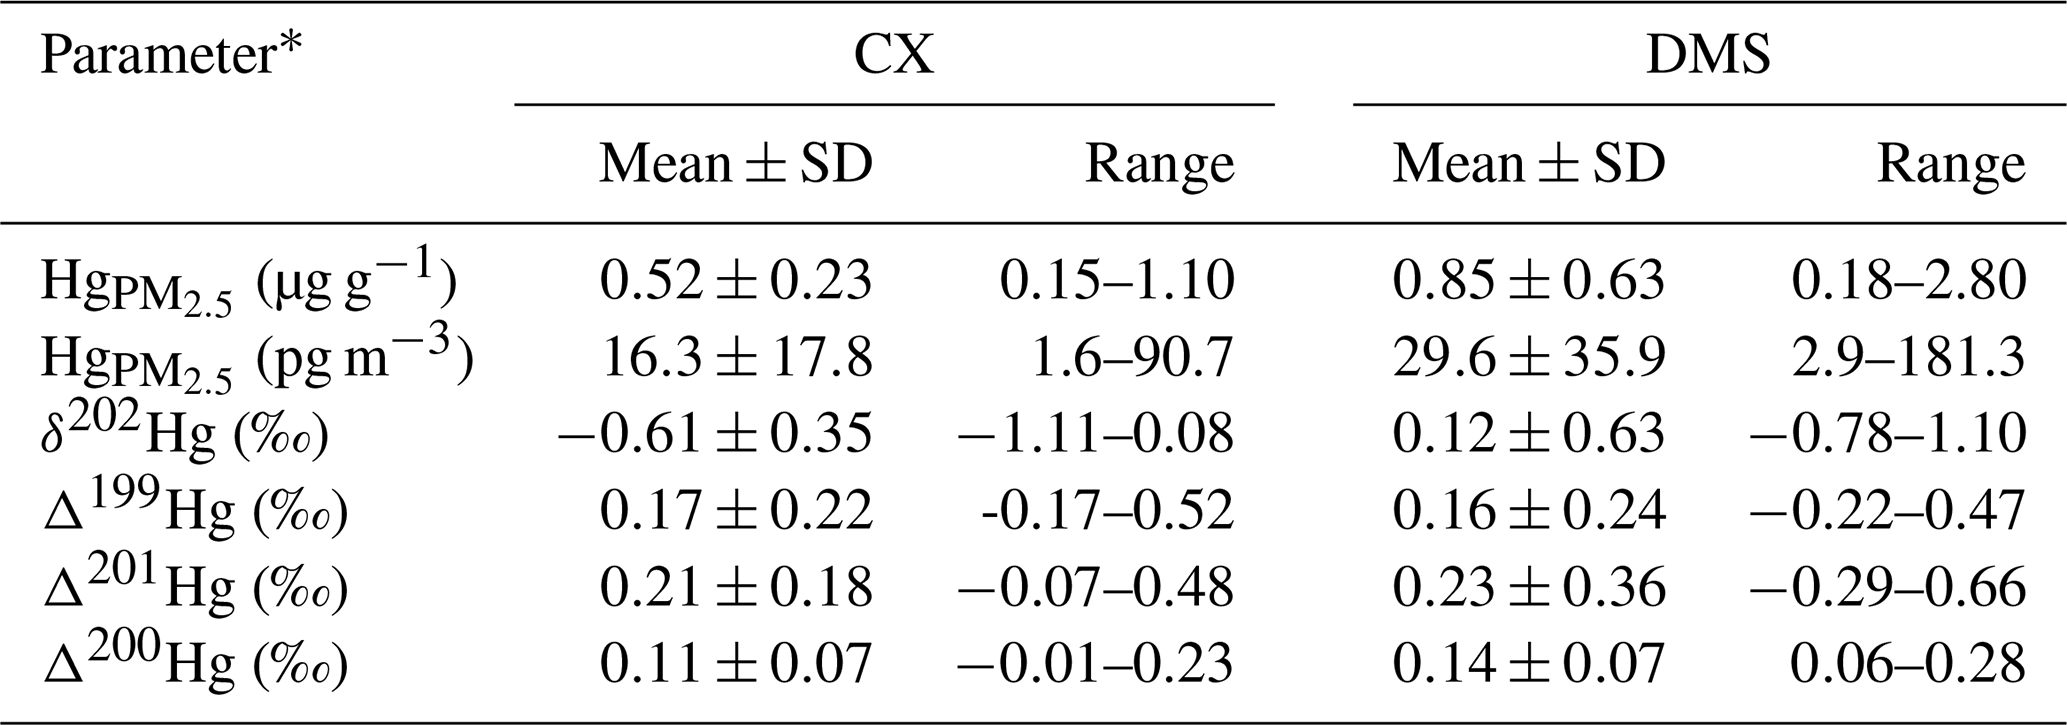
* A total of 51 samples collected from the CX site and 32 samples from the DMS site were used for Hg concentration analysis; this includes 10 samples from each site for isotope analysis.
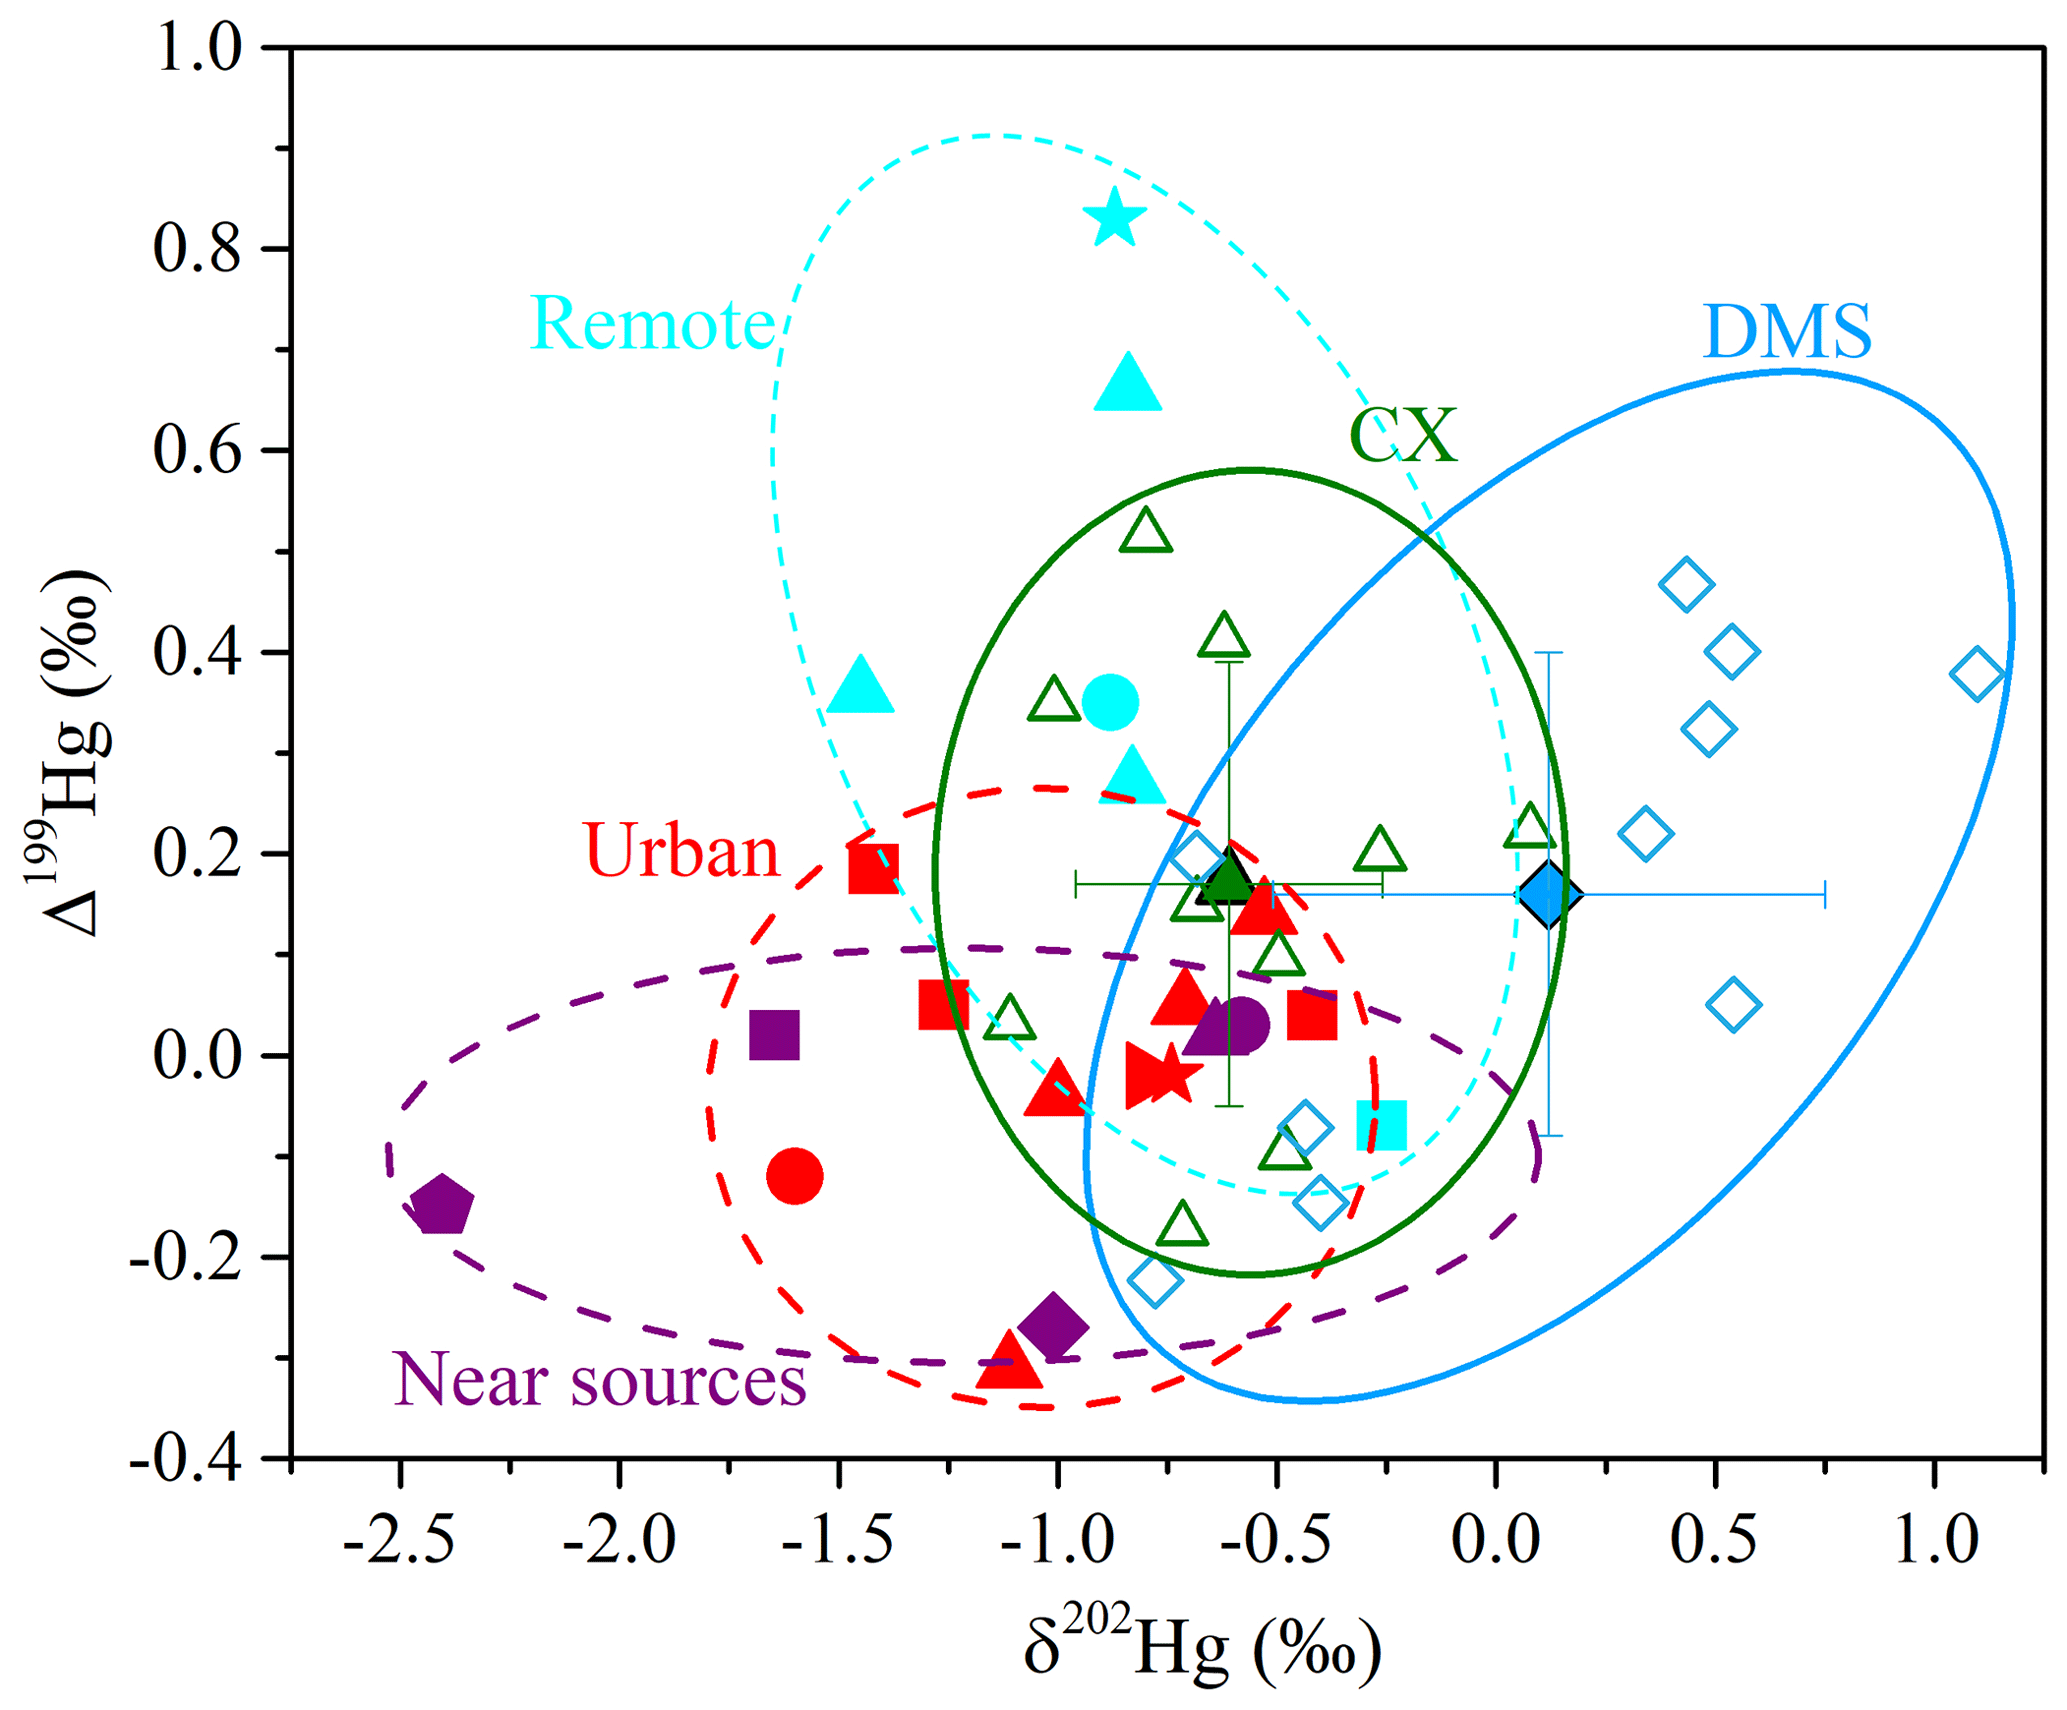
Figure 2Isotopic compositions of HgPM at the multiple types of sites. For this study, the green filled triangles and green empty triangles – mean and individual values at the CX site; the blue filled diamonds and blue empty diamonds – mean and individual values at the DMS site. For remote sites, the light blue star – coast; the light blue square and light blue triangle – mountain; the light blue circle – island (Fu et al., 2019; Rolison et al., 2013; Yu et al., 2016). For urban sites in China, the red triangle – Beijing; the red circle – Changchun; the red star – Chengdu; the red square – Guiyang; the red sideways triangle – Xi'an (Huang et al., 2015, 2016, 2019, 2020; Xu et al., 2017, 2019; Yu et al., 2016). For sites near the emission sources, the purple triangle and purple square – industrial; the purple pentagon – landfill; the purple diamond – traffic; the purple circle – near the coal-fired power plant (CFPP; Das et al., 2016; Huang et al., 2018; Yu et al., 2016).
3.2 Influence of anthropogenic emissions on MDF of Hg
Prior studies have compiled the Hg isotopic compositions of major source materials, such as fossil fuels, non-ferrous metal ores, and crustal rocks, which generally display large negative δ202Hg and negative or near-zero Δ199Hg values (Huang et al., 2016; R. Y. Sun et al., 2016). Combustion and/or industrial processing induces limited MIF (Sun et al., 2013; R. Y. Sun et al., 2016), so we assumed that emitted Hg conserves the odd isotope MIF of source materials. The Δ199Hg values for most of the Hg samples are distinguishable from those of source materials, indicating that anthropogenic emissions were not the driving factors for the odd MIF of Hg in the study region. As for MDF, the above analyses indicated that the MDF of Hg at the CX site was subjected to local anthropogenic sources, while the MDF at the DMS site was probably caused by the combination of atmospheric transformations and regional emissions. The result was supported by the correlation between δ202Hg values and Hg concentrations, which was insignificant at the DMS site but significant at a loose level at the CX site (Fig. 3a). A Pearson correlation between δ202Hg and chemical components was further conducted to explore the impacts of anthropogenic emissions on Hg.
The δ202Hg values at the CX site were significantly correlated to Cl− content (R2= 0.46; P < 0.05; Fig. 3b) and well associated with SO content in PM2.5 (R2= 0.38; P= 0.056; Fig. 3c). In this study, Cl− mainly originated from coal combustion, given that Cl− content in PM2.5 was not correlated to Na+. Besides, SO was primarily transformed from SO2, which is mainly emitted from coal combustion. The results imply that coal combustion played an important role in the MDF of Hg at the CX site. It has also been reported that coal combustion has a large contribution (of ∼ 50 %) to the total Hg emissions in Zhejiang province (Zhang et al., 2015). Differently to the CX site, the δ202Hg values at the DMS site were significantly correlated to SO 0.68; P < 0.05; Fig. 3c) but not to Cl− (P > 0.05; Table S4). It seems unlikely that coal combustion was the predominant contributor to the positive MDF at the DMS site, whereas, under the influence of transport, the transformation of SO2 to SO is usually enhanced, and the photoreduction of Hg2+ in aerosols tends to be extensive, which would shift δ202Hg to a positive value to a certain extent (Bergquist and Blum, 2007). The results imply that coal combustion emissions at a regional scale or from long-range transport had a potential impact on the MDF of Hg at the DMS site, which is consistent with an earlier study conducted at the same site based on Hg concentration and trajectory analysis (Yu et al., 2015).
It should be noted that the δ202Hg values at the CX site slightly shift to positive values compared to those for emitted HgPM from coal combustion. The Hg isotopic compositions of coal in China have large variations in MDF, with δ202Hg values from −2.36 ‰ to −0.14 ‰ (Biswas et al., 2008; Yin et al., 2014). A prior study estimated that emitted HgPM has a shift of −0.5 ‰ relative to δ202Hg of coal feeds, based on the mass balance model (Sun et al., 2014). Then, the δ202Hg values for HgPM emitted from coal combustion in China were estimated to be −2.86 ‰ to −0.64 ‰. There are many metal smelting factories near the CX site. Although we did not measure the tracers for smelting, the mean δ202Hg value for non-ferrous metal ores was reported to be ‰ (Yin et al., 2016). We assumed that Hg emitted from non-ferrous metal smelting conserves the isotopes of source materials due to a lack of data for processing at the current stage (R. Y. Sun et al., 2016). Then, a less negative MDF of Hg from non-ferrous metal smelting could explain the positive shift of MDF at the CX site relative to coal combustion emissions. Thus, it is reasonably inferred that the MDF of Hg at the CX site is a result of multiple anthropogenic sources such as coal combustion and non-ferrous metal smelting. In addition, we found a close negative correlation between δ202Hg and the levoglucosan content in PM2.5 at the CX site (R2= 0.67; P < 0.05; Fig. 3d), excluding a PM2.5 sample collected on 19 December 2017. Levoglucosan is considered to be an excellent indicator of biomass burning. Thus, we cannot rule out the possibility that the contribution of biomass burning led to a negative deviation in δ202Hg values at the CX site to some extent. Previous studies have reported that biological materials display negative δ202Hg and Δ199Hg values, like foliage (δ202Hg is −2.67 ‰ to −1.79 ‰; Δ199Hg is −0.47 ‰ to −0.06 ‰), litterfall samples (δ202Hg is −3.03 ‰ to −2.35 ‰; Δ199Hg is −0.44 ‰ to −0.22 ‰), and lichen (δ202Hg is −2.32 ‰ to −1.83 ‰; Δ199Hg is −0.35 ‰ to −0.22 ‰; Demers et al., 2013; Jiskra et al., 2015; Yin et al., 2013; Yu et al., 2016; Zheng et al., 2016). Such negative δ202Hg and Δ199Hg of biological materials could not explain the isotopes of Hg in this study. Moreover, the contribution of biomass burning is supposed to shift Δ199Hg values negatively, but we found no significant negative correlation between Δ199Hg and K+ or levoglucosan from the whole study period (Table S4). This unexpected result might be due to the fact that the substantial biomass burning often occurs in a short time (i.e., March 2018; Fig. S2a; FIRMS, 2021). In this study, the most negative odd MIF was observed for PM2.5 samples collected on 21 March 2018, with a Δ199Hg value of −0.17 ‰ at the CX site and −0.22 ‰ at the DMS site. Those PM2.5 samples were likely related to biomass burning, since they were associated with air masses originating from or passing through northeastern China with dense fire spots (Fig. S2b). The findings suggest the biomass burning was not the dominant contributor of Hg in the study region, but it would change the isotopes of Hg in some instances.
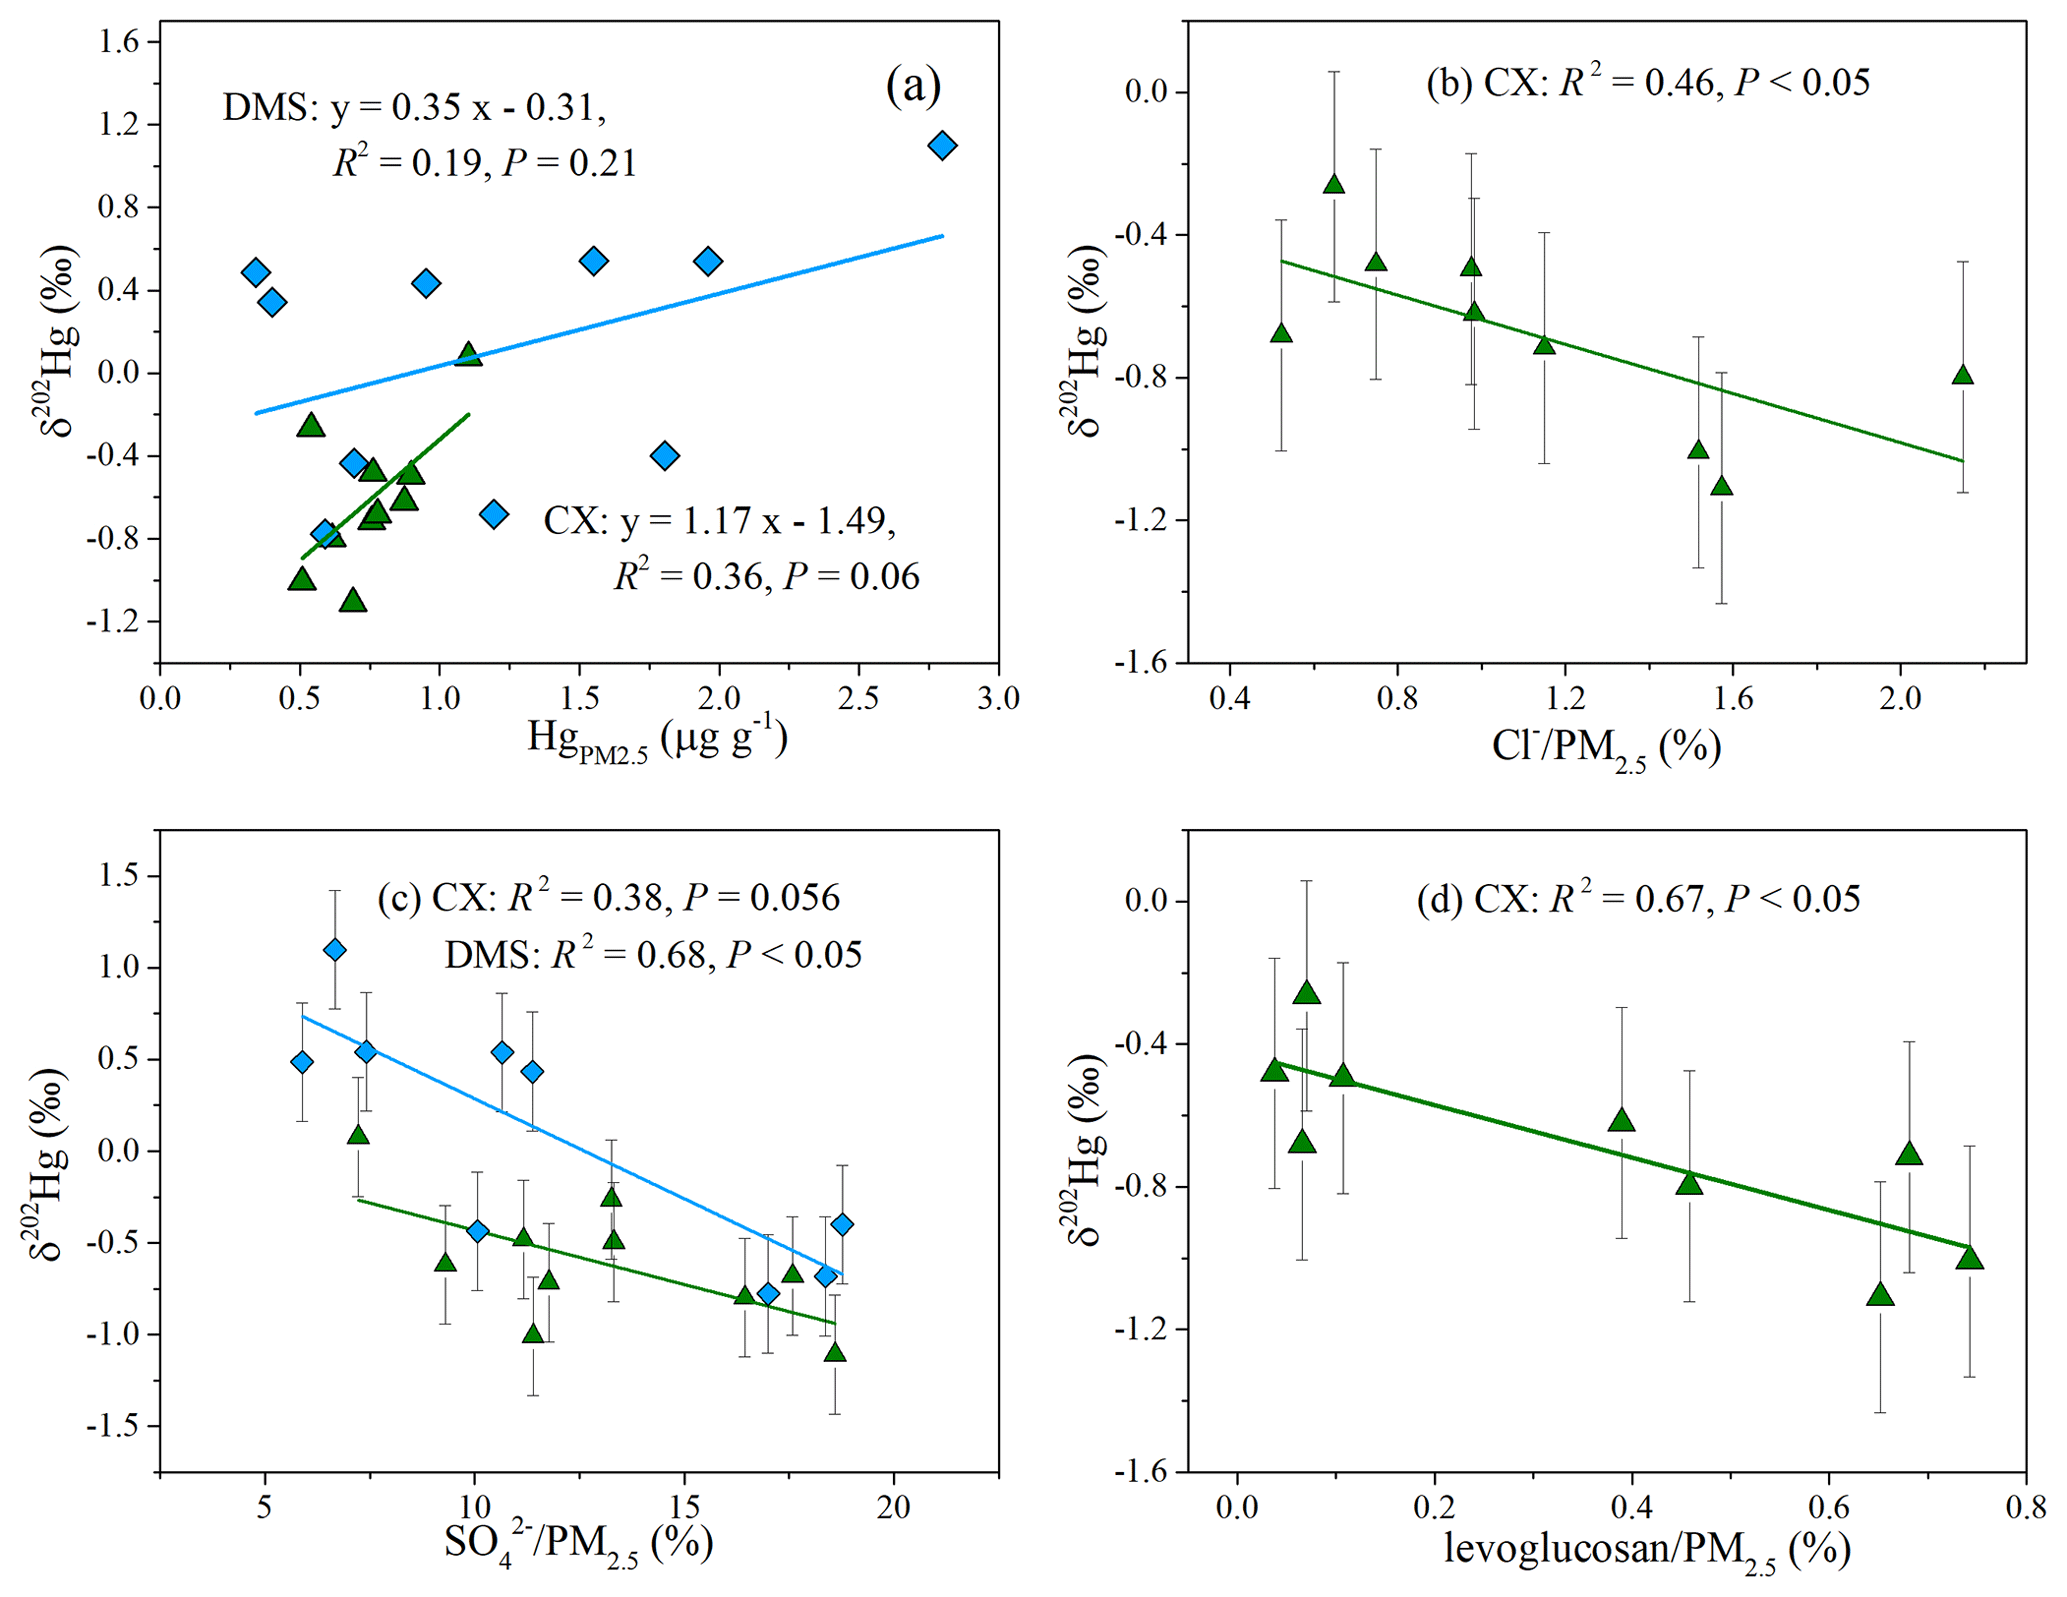
Figure 3Relationships of δ202Hg with (a) Hg, (b) Cl−, (c) SO, and (d) levoglucosan contents in PM2.5 at the CX site (green triangle) or DMS site (blue diamond). The uncertainty (2σ) for δ202Hg in PM2.5 is 0.25 ‰.
3.3 Influence of photochemical processes on isotopes of Hg
The large odd MIF of Hg isotopes in most PM2.5 samples of this study was likely related to photochemical processes. An experimental study has found that the oxidation of Hg0 by halogen atoms (Cl• or Br•) results in a negative shift of Δ199Hg in the product Hg2+ (G. Y. Sun et al., 2016). Given that the partitioning of Hg2+ between the gas and particle phases leads to limited odd MIF of Hg isotopes (Fu et al., 2019; Wiederhold et al., 2010), the formation of HgPM via the oxidation of Hg0 and following adsorption on particles could not explain the positive odd MIF of Hg in this study. Previous experiments and field studies have reported that the photoreduction of inorganic Hg2+ in the aqueous solution induces an odd MIF of Hg isotopes and results in large positive Δ199Hg values in reactants (aerosols here; Bergquist and Blum, 2007; Zheng and Hintelmann, 2009). Hence, the photoreduction of Hg2+ in aerosols was invoked as being a key factor for the odd MIF of Hg in the study region. The linear relationship between Δ199Hg and Δ201Hg is often used to identify the odd MIF processes of Hg isotopes. The slope of Δ199Hg versus Δ201Hg yielded from the data of each site was 1.16 (R2=0.92) at the CX site and 0.63 (R2=0.85) at the DMS site, respectively. The data over the two sites defined a straight line with a slope of 0.92 (R2=0.83; P < 0.01; Fig. 4a). The near-unity slope of Δ199Hg versus Δ201Hg was widely observed in particles from coastal site and from other locations in Asia (Fu et al., 2019; Rolison et al., 2013; Huang et al., 2016, 2019; Xu et al., 2019). The Δ199Hg Δ201Hg ratios of this study are more consistent with the indicative ratio of aqueous photoreduction of inorganic Hg2+ (∼ 1.0; Bergquist and Blum, 2007; Zheng and Hintelmann, 2009) but different from the ratios of other processes like photooxidation (1.64 by Br• and 1.89 by Cl•; G. Y. Sun et al., 2016) and photodemethylation (1.36; Bergquist and Blum, 2007). Therefore, the photoreduction of Hg2+ in aerosols might be the critical factor for the observed positive odd MIF of Hg in the study region.
The similarity of the odd MIF anomaly between the CX and DMS sites suggests that the photoreduction of Hg2+ in aerosols was homogeneous at a regional scale. However, the relationships of Δ199Hg with Hg content and δ202Hg showed distinct spatial differences. For the DMS site, the Δ199Hg values generally decreased as the Hg content increased (Fig. 4b), and the correlation between Δ199Hg and δ202Hg was significantly positive (R2= 0.56; P < 0.05; Fig. 4c). Experimental studies indicated that the photoreduction of Hg2+ releases Hg0 and preferentially retains odd and heavier isotopes in solutions (Bergquist and Blum, 2007; Zheng and Hintelmann, 2009), which is expected to result in a positive relationship between Δ199Hg and δ202Hg and an inverse relationship between the Δ199Hg and Hg content. In this study, the consistent relationships of Δ199Hg with δ202Hg and Hg at the DMS site strongly imply a predominant role of the photoreduction of Hg2+ in the isotopic fractionation of Hg at this site. Meanwhile, the δ202Hg signatures of anthropogenic emissions from regional and long-range transport might be largely obscured by photoreduction process, which well explains the positive δ202Hg at the DMS site. In contrast, the variation in Δ199Hg at the CX site was not associated with Hg contents or δ202Hg. The result suggests an insignificant impact of the photoreduction of Hg2+ relative to anthropogenic sources on the MDF and Hg content in PM2.5 at the CX site.
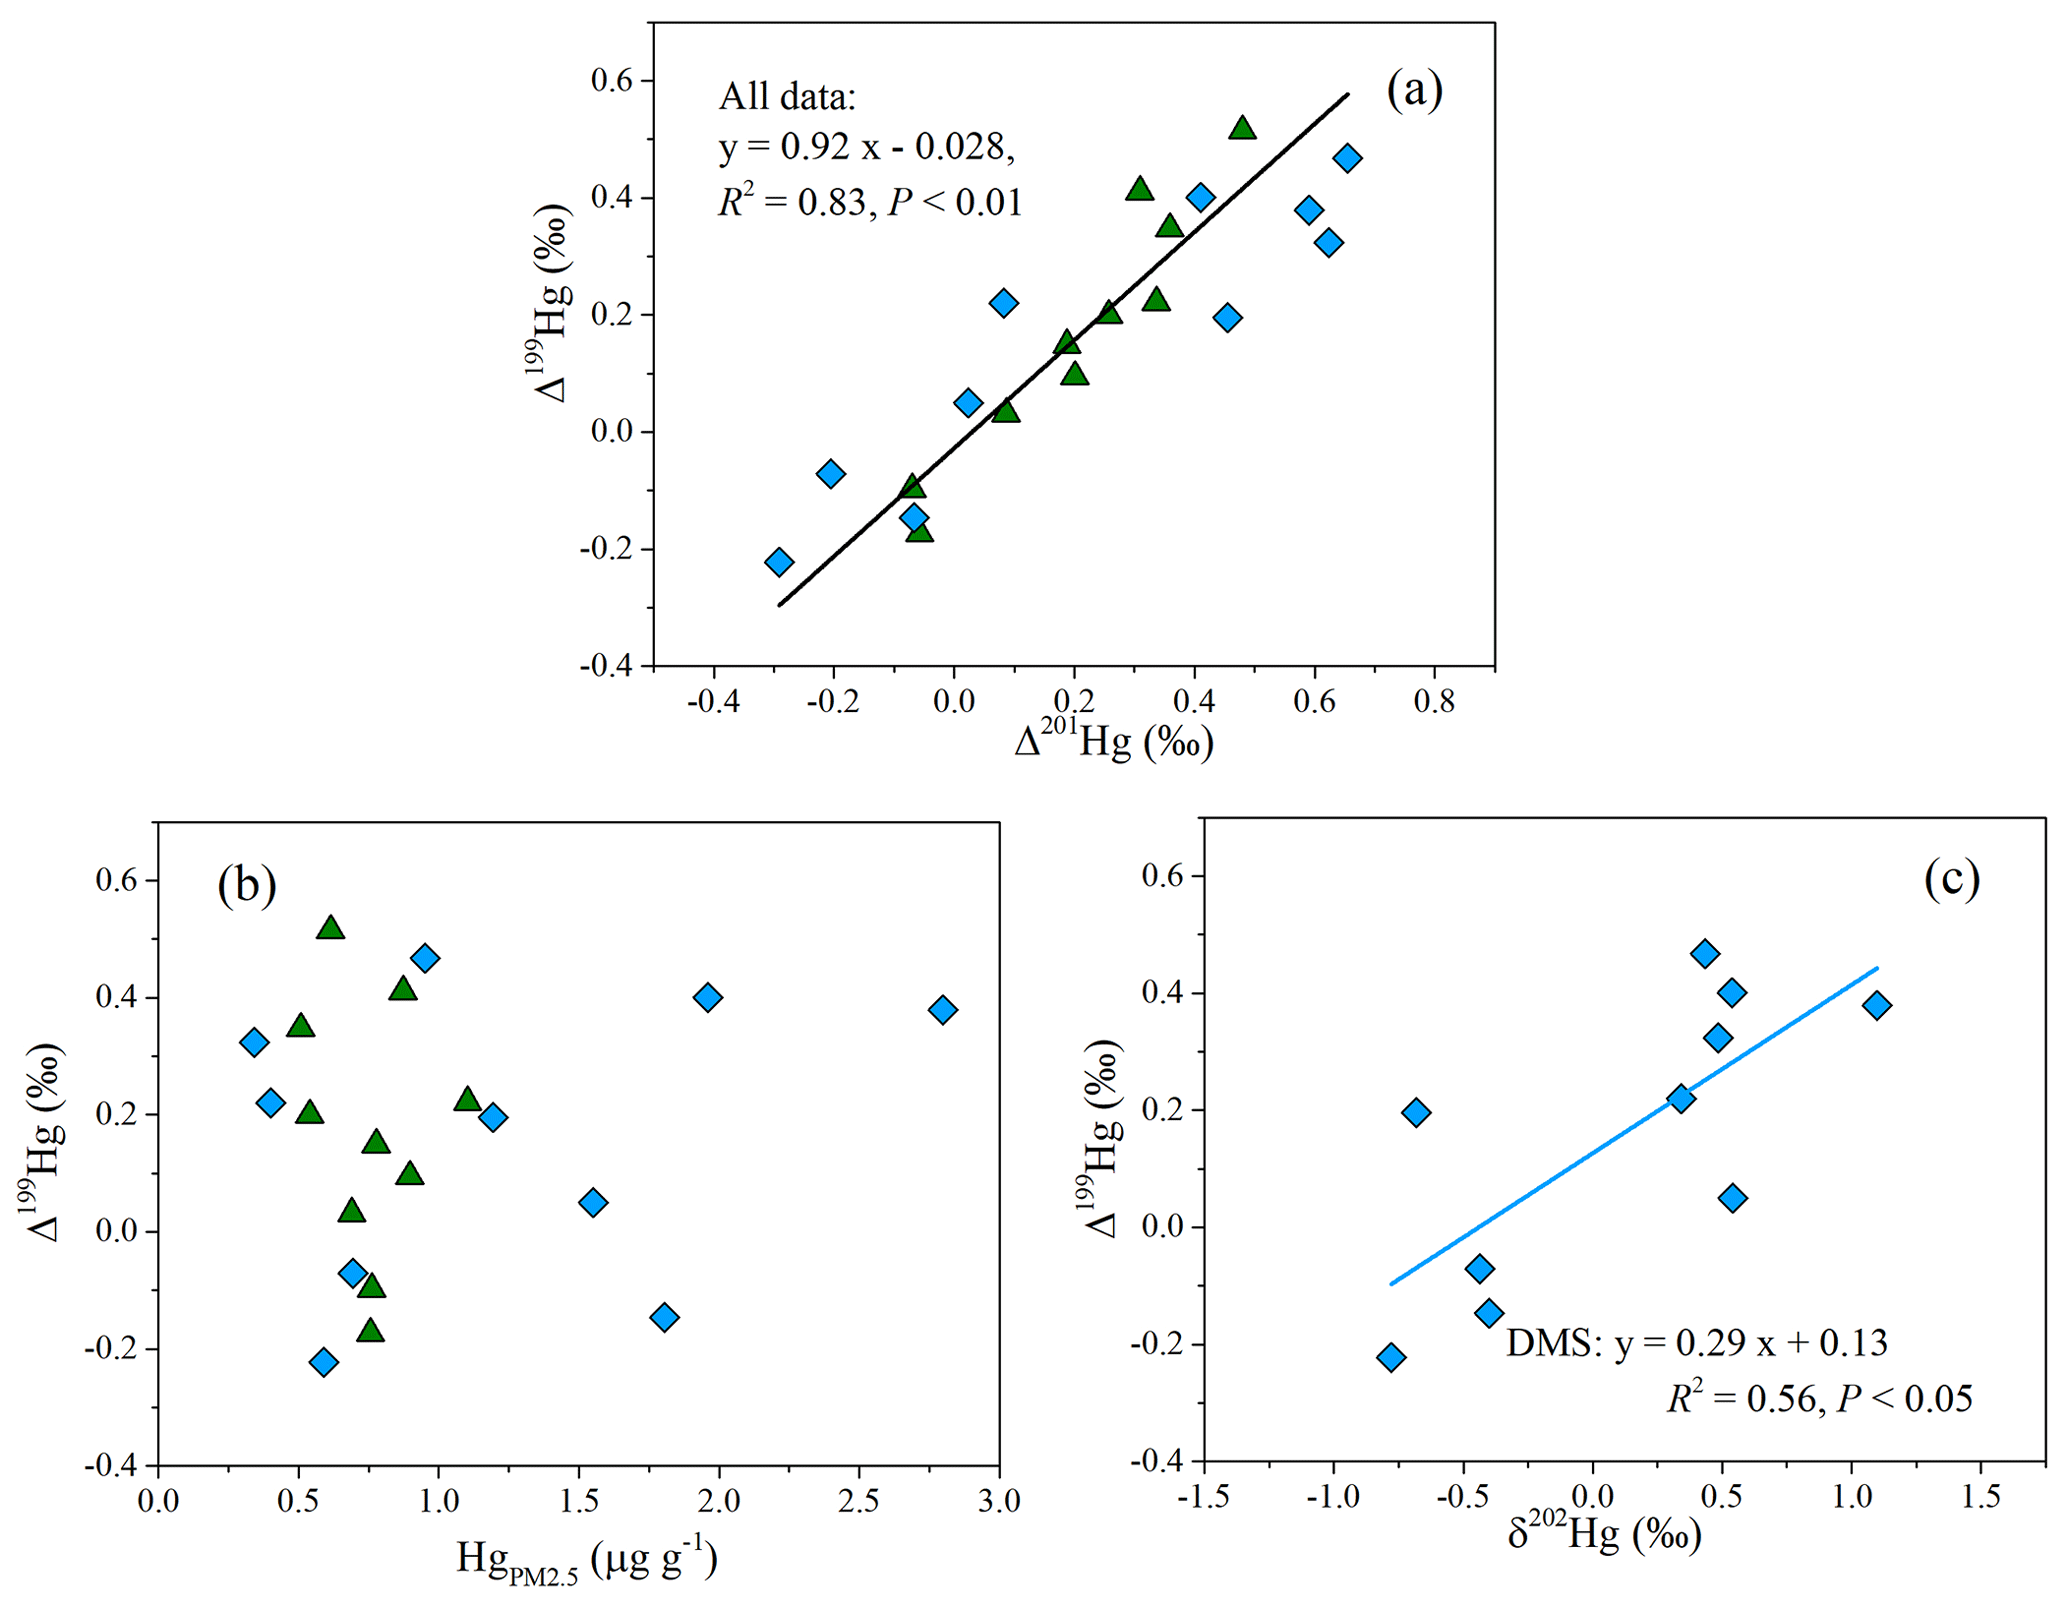
Figure 4Linear relationships between (a) Δ199Hg and Δ201Hg, the (b) Δ199Hg and Hg content, and (c) Δ199Hg and δ202Hg at the CX site (green triangle) and DMS site (blue diamond). The uncertainty (2σ) for Δ199Hg and δ202Hg in PM2.5 is 0.03 ‰ and 0.25 ‰, respectively.
3.4 Potential mechanism of even MIF
A small but significant MIF of 200Hg was observed in most PM2.5 samples from this study, with mean Δ200Hg values of 0.11±0.07 ‰ at the CX site and 0.14±0.07 ‰ at the DMS site. They are more positive than those in urban (mean is 0.01 ‰ to 0.09 ‰; Das et al., 2016; Huang et al., 2016; Xu et al., 2017) and remote areas (mean is 0.07 ‰ to 0.10 ‰; Fu et al., 2019) but similar to those in coastal areas and islands (Fu et al., 2019; Rolison et al., 2013). In general, Hg emitted from anthropogenic sources has Δ200Hg of near-zero (R. Y. Sun et al., 2016), while large Δ200Hg values are mainly observed in atmospheric samples, i.e., precipitation, gaseous Hg2+, and aerosols (Chen et al., 2012; Fu et al., 2019; Rolison et al., 2013). Significant even MIF of Hg isotopes has been suggested to be associated with the photooxidation of Hg0 from the upper troposphere and/or from in situ values involving UV light and oxidants (Chen et al., 2012; Fu et al., 2019). This could help explain significant Δ200Hg values in coastal areas where halogen atoms are expected to be abundant. The Δ200Hg values in PM2.5 were not different between sites, similar to Δ199Hg values, which supports that the observed Δ200Hg were associated with photochemical processes of minor spatial difference.
Gaseous elemental Hg is the predominant form of Hg in the atmosphere, which, in China, was generally characterized by slightly negative even MIF and odd MIF (Fu et al., 2018; Yu et al., 2020). Given that the gas–particle partitioning of Hg2+ is strongly temperature dependent, this process unlikely produces the MIF of Hg isotopes (Fu et al., 2019). Thus, comparing the MIF of Hg isotopes between Hg0 and HgPM might shed light on the effect of species conversion on Hg isotopes. The experimental study showed that the oxidation of Hg0 vapor by Cl• or Br• results in positive Δ200Hg values in products (G. Y. Sun et al., 2016). Thus, this process, which generally enhances in the coastal environment with abundant halogen atoms (Wang et al., 2019), would well explain the detectable positive Δ200Hg values in products. However, the oxidation of Hg0 by Cl• or Br• should produce a negative odd MIF in products (G. Y. Sun et al., 2016), which is inconsistent with the observed positive Δ199Hg in PM2.5. A recent study has reported that the oxidation of Hg0 by oxidizers other than Cl• or Br• might induce a positive odd MIF in the Hg2+ (Yu et al., 2020). However, the oxidizers have not been identified so far based on the limited isotopic study of Hg0 oxidation. Alternatively, the magnitude of the photoreduction of Hg2+, larger than the oxidation of Hg0 by Cl and Br atoms, could result in the observed positive odd MIF of HgPM. Since the photoreduction of Hg2+ most likely occurred in aerosols, as previously discussed, the oxidation of Hg0 and the consequent photoreduction of Hg2+ in aerosols was the possible cause of the positive Δ199Hg and Δ200Hg values of PM2.5 in the study region.
3.5 Isotopes of Hg in adjacent surface seawater
Hg isotopes are often used to track the transport and transformation of Hg in the environment. The average concentration of THg in seawater was 10.5±5.0 ng L−1, with a range of 1.9–23.6 ng L−1 (Table S1). As shown in Fig. 5, the concentrations of seawater THg displayed distinct time variations, with higher levels during September–March than during April–August, which is likely related to the precipitation cycle. The average δ202Hg value of seawater samples was ‰, with most samples falling in the range of −2.00 ‰ to −1.00 ‰, whereas the MIF of Hg isotopes in seawater samples was not significant, with mean Δ199Hg, Δ201Hg, and Δ200Hg values of ‰, 0.00±0.05 ‰, and 0.04±0.03 ‰, respectively. The negative MDF and near-zero MIF of surface seawater are consistent with those of source materials (Huang et al., 2016; R. Y. Sun et al., 2016), suggesting the dominant effect of anthropogenic emissions on Hg in offshore surface seawater. A minor change in the intensity of industrial activities, as expected, among the months also supports the above deduction.
Isotopic compositions of THg in surface seawater and HgPM at the adjacent industrial site are consistent in MDF but not in MIF. Similar results were obtained when comparing to wet deposition, which presented negative δ202Hg and positive Δ199Hg and Δ200Hg values (Chen et al., 2012; Huang et al., 2018). The negative MDF of Hg in industrial PM2.5 and adjacent surface seawater implies an important contribution of local anthropogenic sources. On the other hand, the unity slope of Δ199Hg versus Δ201Hg (Δ199Hg = 1.12 × Δ201Hg–0.02; R2= 0.68; n= 19; Fig. S3) indicates that the odd MIF of Hg isotopes in surface seawater was mainly produced by the photoreduction of Hg2+, whereas the minor Δ199Hg anomalies suggest that photoreduction was not evident for surface seawater. A big discrepancy in the MIF of Hg isotopes between atmospheric samples and surface seawater further evidences that atmospheric transformations would induce the significant MIF of Hg isotopes and obscure the Hg isotopic signatures of anthropogenic emissions.
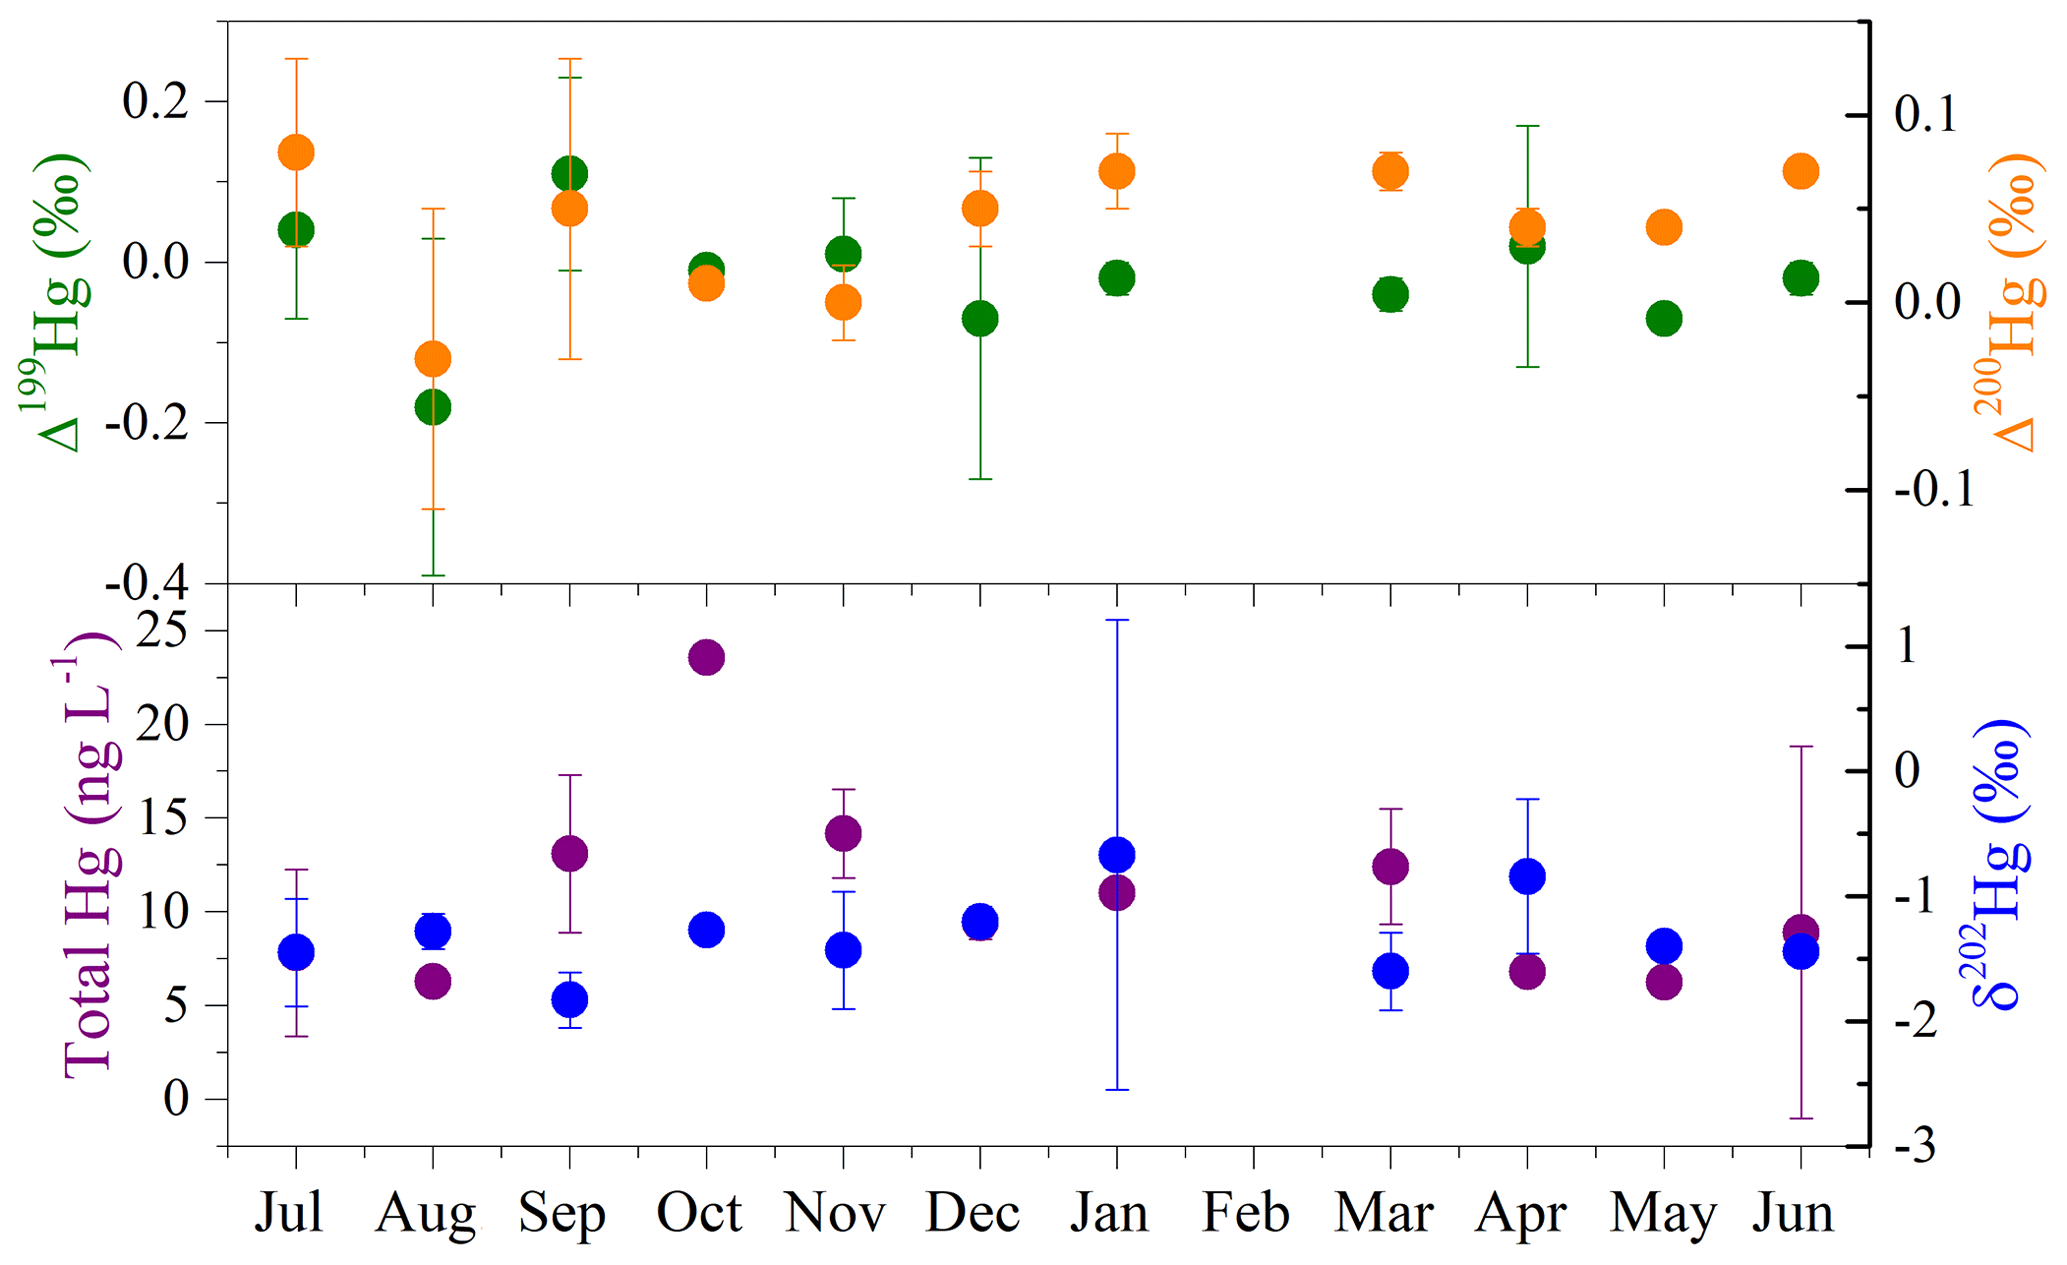
Figure 5Monthly variations in the total Hg concentration, δ202Hg, Δ199Hg, and Δ200Hg of surface seawater during the sampling period from July 2017 to June 2018.
This study investigated Hg isotopic compositions in PM2.5 collected from the neighboring industrial and mountain sites in a coastal area and in surface seawater close to the industrial area. Hg displayed a significant spatial difference in MDF but not in odd MIF. Negative δ202Hg in PM2.5 at the CX site was primarily induced by local industrial activities like coal combustion, whereas the slightly positive δ202Hg at the DMS site could not be fully explained by anthropogenic emissions. Other than the effect of regional transport, a close correlation between δ202Hg and Δ199Hg at the DMS site implies that photochemical processes likely contributed to the MDF of Hg. Significant positive odd MIF of Hg and the unity slope of Δ199Hg versus Δ201Hg indicate an important role of the photoreduction of Hg2+ in aerosols. The observed positive Δ200Hg values in this study were probably associated with the photooxidation of Hg0, which is generally enhanced in the coastal environment. THg in surface seawater was characterized by negative MDF and near-zero odd MIF, which is more consistent with isotopic signatures of source materials. The MIF anomalies of Hg isotopes were larger for atmospheric PM2.5 than for surface seawater, suggesting that atmospheric transformations induce significant MIF of Hg isotopes and obscure Hg isotopic signatures of initial anthropogenic emissions.
A comparison of the isotopic compositions of Hg was conducted between the neighboring industrial and mountain sites, which effectively revealed the influence of anthropogenic emission sources and transformation processes on Hg isotopes. Hg isotopic compositions in industrial PM2.5 and offshore surface seawater were also compared. The results indicate that atmospheric transformations would induce significant fractionation of Hg isotopes and obscure specific Hg isotopic signatures of initial emissions.
A dataset for this paper can be accessed at https://doi.org/10.5281/zenodo.5784847 (Xu et al., 2021). The HYSPLIT trajectory model is available from the U.S. National Oceanic and Atmospheric Administration, Air Resources Laboratory: https://www.arl.noaa.gov/hysplit/ (NOAA, 2004). Gridded meteorological data are available from the Global Data Assimilation System: ftp://arlftp.arlhq.noaa.gov/pub/archives/gdas1 (GDAS1, 2021). Fire data are available from the Fire Information for Resource Management System: https://firms.modaps.eosdis.nasa.gov/map/ (FIRMS, 2021).
The supplement related to this article is available online at: https://doi.org/10.5194/acp-21-18543-2021-supplement.
JC, LX, and YZ designed this study. ML, LY, YaC, LT, and HX conducted the sampling. YZ and LX participated in the sample treatment and measurements. LX wrote the paper. JS and YuC helped with the graphics production. All authors reviewed the paper.
The contact author has declared that neither they nor their co-authors have any competing interests.
Publisher's note: Copernicus Publications remains neutral with regard to jurisdictional claims in published maps and institutional affiliations.
This research was financially supported by National Natural Science Foundation of China (grant nos. 21507127, 41575146, and U1405235), the Natural Science Foundation of Fujian province (grant no. 2016J05050), the Cultivating Project of Strategic Priority Research Program of Chinese Academy of Sciences (CAS; grant no. XDPB1903), the CAS Center for Excellence in Regional Atmospheric Environment (grant no. E0L1B20201), and the Xiamen Atmospheric Environment Observation and Research Station of Fujian Province. We would like to thank Shuyuan Huang (Xiamen University), for his help with the Hg isotopes analysis. We also thank the handling editor and the two reviewers, for their constructive comments and suggestions.
This research has been supported by the National Natural Science Foundation of China (grant nos. 21507127, 41575146, and U1405235), the Cultivating Project of Strategic Priority Research Program of Chinese Academy of Sciences (grant no. XDPB1903), the Natural Science Foundation of Fujian Province (grant no. 2016J05050), and the CAS Center for Excellence in Regional Atmospheric Environment (grant no. E0L1B20201).
This paper was edited by Anne Perring and reviewed by two anonymous referees.
Bergquist, B. A. and Blum, J. D.: Mass-dependent and -independent fractionation of Hg isotopes by photoreduction in aquatic systems, Science, 318, 417–420, https://doi.org/10.1126/science.1148050, 2007.
Biswas, A., Blum, J. D., Bergquist, B. A., Keeler, G. J., and Xie, Z. Q.: Natural mercury isotope variation in coal deposits and organic soils, Environ. Sci. Technol., 42, 8303–8309, https://doi.org/10.1021/es801444b, 2008.
Blum, J. D. and Bergquist, R. A.: Reporting of variations in the natural isotopic composition of mercury, Anal. Bioanal. Chem., 338, 353–359, https://doi.org/10.1007/s00216-007-1236-9, 2007.
Blum, J. D. and Johnson, M. W.: Recent developments in mercury stable isotope analysis, Non-Traditional Stable Isotopes, 82, 733–757, https://doi.org/10.2138/rmg.2017.82.17, 2017.
Blum, J. D., Sherman, L. S., and Johnson, M. W.: Mercury isotopes in earth and environmental sciences, Annu. Rev. Earth Pl. Sc., 42, 249–269, https://doi.org/10.1146/annurev-earth-050212-124107, 2014.
Chen, J. B., Hintelmann, H., Feng, X. B., and Dimock, B.: Unusual fractionation of both odd and even mercury isotopes in precipitation from Peterborough, ON, Canada, Geochim. Cosmochim. Ac., 90, 33–46, https://doi.org/10.1016/j.gca.2012.05.005, 2012.
Das, R., Wang, X. F., Khezri, B., Webster, R. D., Sikdar, P. K., and Datta, S.: Mercury isotopes of atmospheric particle bound mercury for source apportionment study in urban Kolkata, India, Elementa-Sci. Anthrop., 4, 1–12, https://doi.org/10.12952/journal.elementa.000098, 2016.
Demers, J. D., Blum, J. D., and Zak, D. R.: Mercury isotopes in a forested ecosystem: Implications for air-surface exchange dynamics and the global mercury cycle, Global Biogeochem. Cy., 27, 222–238, https://doi.org/10.1002/gbc.20021, 2013.
FIRMS: Fire Information for Resource Management System, available at: https://firms.modaps.eosdis.nasa.gov/map/, last access: 16 December 2021.
Fu, X. W., Zhang, H., Yu, B., Wang, X., Lin, C.-J., and Feng, X. B.: Observations of atmospheric mercury in China: a critical review, Atmos. Chem. Phys., 15, 9455–9476, https://doi.org/10.5194/acp-15-9455-2015, 2015.
Fu, X. W., Yang, X., Tan, Q. Y., Ming, L. L., Lin, T., Lin, C.-J., Li, X. D., and Feng, X. B.: Isotopic composition of gaseous elemental mercury in the marine boundary layer of East China Sea, J. Geophys. Res.-Atmos., 123, 7656–7669, https://doi.org/10.1029/2018JD028671, 2018.
Fu, X. W., Zhang, H., Feng, X. B., Tan, Q. Y., Ming, L. L., Liu, C., and Zhang, L. M.: Domestic and transboundary sources of atmospheric particulate bound mercury in remote areas of China: Evidence from mercury isotopes, Environ. Sci. Technol., 53, 1947–1957, https://doi.org/10.1021/acs.est.8b06736, 2019.
GDAS1: Global Data Assimilation System, available at: ftp://arlftp.arlhq.noaa.gov/pub/archives/gdas1, last access: 16 December 2021.
Guo, J. M., Sharma, C. M., Tripathee L., Kang, S. C., Fu, X. W., Huang, J., Shrestha K. L., and Chen, P. F.: Source identification of atmospheric particle-bound mercury in the Himalayan foothills through non-isotopic and isotope analyses, Environ. Pollut., 286, 117317, https://doi.org/10.1016/j.envpol.2021.117317, 2021.
Guo, J. M., Tripathee, L., Kang, S. C., Zhang, Q. G., Huang, J., Sharma, C. M., Chen, P. F., Paudyal, R., and Rupakheti, D.: Atmospheric particle-bound mercury in the northern Indo-Gangetic Plain region: Insights into sources from mercury isotope analysis and influencing factors, Geosci. Front., 13, 101274, https://doi.org/10.1016/j.gsf.2021.101274, 2022.
Horowitz, H. M., Jacob, D. J., Zhang, Y., Dibble, T. S., Slemr, F., Amos, H. M., Schmidt, J. A., Corbitt, E. S., Marais, E. A., and Sunderland, E. M.: A new mechanism for atmospheric mercury redox chemistry: implications for the global mercury budget, Atmos. Chem. Phys., 17, 6353–6371, https://doi.org/10.5194/acp-17-6353-2017, 2017.
Hong, Y. W., Chen, J. S., Deng, J. J., Tong, L., Xu, L. L., Niu, Z. C., Yin, L. Q., Chen, Y. T., and Hong, Z. Y.: Pattern of atmospheric mercury speciation during episodes of elevated PM2.5 levels in a coastal city in the Yangtze River Delta, China, Environ. Pollut., 218, 259–268, https://doi.org/10.1016/j.envpol.2016.06.073, 2016.
Hong, Z. Y., Zhang, H., Zhang, Y. R., Xu, L. L., Liu, T. T., Xiao, H., Hong, Y. W., Chen, J. S., Li, M. R., Deng, J. J., Wu, X., Hu, B. Y., and Chen, X. Q.: Secondary organic aerosol of PM2.5 in a mountainous forest area in southeastern China: Molecular compositions and tracers implication, Sci. Total Environ., 653, 496–503, https://doi.org/10.1016/j.scitotenv.2018.10.370, 2019.
Huang, Q., Liu, Y. L., Chen, J. B., Feng, X. B., Huang, W. L., Yuan, S. L., Cai, H. M., and Fu, X. W.: An improved dual-stage protocol to pre-concentrate mercury from airborne particles for precise isotopic measurement, J. Anal. Atom. Spectrom., 30, 957–966, https://doi.org/10.1039/c4ja00438h, 2015.
Huang, Q., Chen, J., Huang, W., Fu, P., Guinot, B., Feng, X., Shang, L., Wang, Z., Wang, Z., Yuan, S., Cai, H., Wei, L., and Yu, B.: Isotopic composition for source identification of mercury in atmospheric fine particles, Atmos. Chem. Phys., 16, 11773–11786, https://doi.org/10.5194/acp-16-11773-2016, 2016.
Huang, Q., Chen, J., Huang, W., Reinfelder, J. R., Fu, P., Yuan, S., Wang, Z., Yuan, W., Cai, H., Ren, H., Sun, Y., and He, L.: Diel variation in mercury stable isotope ratios records photoreduction of PM2.5-bound mercury, Atmos. Chem. Phys., 19, 315–325, https://doi.org/10.5194/acp-19-315-2019, 2019.
Huang, Q., Reinfelder, J. R., Fu, P. Q., and Huang, W. L.: Variation in the mercury concentration and stable isotope composition of atmospheric total suspended particles in Beijing, China, J. Hazard. Mater., 383, 121131, https://doi.org/10.1016/j.jhazmat.2019.121131, 2020.
Huang, S. Y., Sun, L. M., Zhou, T. J., Yuan, D. X., Du, B., and Sun, X. W.: Natural stable isotopic compositions of mercury in aerosols and wet precipitations around a coal-fired power plant in Xiamen, southeast China, Atmos. Environ., 173, 72–80, https://doi.org/10.1016/j.atmosenv.2017.11.003, 2018.
Huang, S. Y., Zhao, Y. H., Lv, S. P., Wang, W. G., Wang, W. L., Zhang, Y. B., Huo, Y. L., Sun, X. W., and Chen, Y. J.: Distribution of mercury isotope signatures in Yundang Lagoon, Xiamen, China, after long-term interventions, Chemosphere, 272, 129716, https://doi.org/10.1016/j.chemosphere.2021.129716, 2021.
Jiskra, M., Wiederhold, J. G., Skyllberg, U., Kronberg, R. M., Hajdas, I., and Kretzschmar, R.: Mercury deposition and re-emission pathways in boreal forest soils investigated with Hg isotope signatures, Environ. Sci. Technol., 49, 7188–7196, https://doi.org/10.1021/acs.est.5b00742, 2015.
Lin, H. Y., Yuan, D. X., Lu, B. Y., Huang, S. Y., Sun, L. M., Zhang, F., and Gao, Y. Q.: Isotopic composition analysis of dissolved mercury in seawater with purge and trap preconcentration and a modified Hg introduction device for MC-ICP-MS, J. Anal. Atom. Spectrom., 30, 353–359, https://doi.org/10.1039/c4ja00242c, 2015.
Malinovsky, D., Latruwe, K., Moens, L., and Vanhaecke, F.: Experimental study of mass-independence of Hg isotope fractionation during photodecomposition of dissolved methylmercury, J. Anal. Atom. Spectrom., 25, 950–956, https://doi.org/10.1039/b926650j, 2010.
Mao, H., Cheng, I., and Zhang, L.: Current understanding of the driving mechanisms for spatiotemporal variations of atmospheric speciated mercury: a review, Atmos. Chem. Phys., 16, 12897–12924, https://doi.org/10.5194/acp-16-12897-2016, 2016.
NOAA: National Oceanic and Atmospheric Administration, Air Resources Laboratory (ARL), Tech. Rep., available at: https://www.arl.noaa.gov/hysplit/ (last access: 16 December 2021), 2004.
Rolison, J. M., Landing, W. M., Luke, W., Cohen, M., and Salters, V. J. M.: Isotopic composition of species-specific atmospheric Hg in a coastal environment, Chem. Geol., 336, 37–49, https://doi.org/10.1016/j.chemgeo.2012.10.007, 2013.
Schleicher, N. J., Schäfer, J., Blanc, G., Chen, Y., Chai, F., Cen, K., and Norra, S.: Atmospheric particulate mercury in the megacity Beijing: spatio-temporal variations and source apportionment, Atmos. Environ., 109, 251–261, https://doi.org/10.1016/j.atmosenv.2015.03.018, 2015.
Schroeder, W. H. and Munthe, J.: Atmospheric mercury – An overview, Atmos. Environ., 32, 809–822, https://doi.org/10.1016/S1352-2310(97)00293-8, 1998.
Selin, N. E.: Global biogeochemical cycling of mercury: A review, Annu. Rev. Env. Resour., 34, 43–63, https://doi.org/10.1146/annurev.environ.051308.084314, 2009.
Sonke, J. E. and Blum, J. D.: Advances in mercury stable isotope biogeochemistry preface, Chem. Geol., 336, 1–4, https://doi.org/10.1016/j.chemgeo.2012.10.035, 2013.
Sun, R. Y., Heimburger, L. E., Sonke, J. E., and Liu, G. J.: Mercury stable isotope fractionation in six utility boilers of two large coal-fired power plants, Chem. Geol., 336, 103–111, https://doi.org/10.1016/j.chemgeo.2012.10.055, 2013.
Sun, R. Y., Sonke, J. E., Heimburger, L. E., Belkin, H. E., Liu, G. J., Shome, D., Cukrowska, E., Liousse, C., Pokrovsky, O. S., and Streets, D. G.: Mercury stable isotope signatures of world coal deposits and historical coal combustion emissions, Environ. Sci. Technol., 48, 7660–7668, https://doi.org/10.1021/es501208a, 2014.
Sun, G. Y., Sommar, J., Feng, X. B., Lin, C.-J., Ge, M. F., Wang, W. G., Yin, R. S., Fu, X. W., and Shang, L. H.: Mass-dependent and -independent fractionation of mercury isotope during gas-phase oxidation of elemental mercury vapor by atomic Cl and Br, Environ. Sci. Telchnol., 50, 9232–9241, https://doi.org/10.1021/acs.est.6b01668, 2016.
Sun, R. Y., Streets, D. G., Horowitz, H. M., Amos, H. M., Liu, G. J., Perrot, V., Toutain, J. P., Hintelmann, H., Sunderland, E. M., and Sonke, J. E.: Historical (1850–2010) mercury stable isotope inventory from anthropogenic sources to the atmosphere, Elementa-Sci. Anthrop., 4, 1–15, https://doi.org/10.12952/journal.elementa.000091, 2016.
UN Environment: Global Mercury Assessment 2018, UN Environment Programme, Chemicals and Health Branch Geneva, Switzerland, available at: https://www.unep.org/resources/publication/global-mercury-assessment-2018 (last access: 16 December 2021), 2019.
Wang, S. Y., McNamara, S. M., Moore, C. W., Obrist, D., Steffen, A., Shepson, P. B., Steabler, R. M., Raso, A. R. W., and Pratt, K. A.: Direct detection of atmospheric atomic bromine leading to mercury and ozone depletion, P. Natl. Acad. Sci. USA, 116, 14479–14484, https://doi.org/10.1073/pnas.1900613116, 2019.
Wiederhold, J. G., Cramer, C. J., Daniel, K., Infante, I., Bourdon, B., and Kretzschmar, R.: Equilibrium mercury isotope fractionation between dissolved Hg(II) species and thiol-bound Hg, Environ. Sci. Technol., 44, 4191–4197, https://doi.org/10.1021/es100205t, 2010.
Xu, H. M., Sonke, J. E., Guinot, B., Fu, X. W., Sun, R. Y., Lanzanova, A., Candaudap, F., Shen, Z. X., and Cao, J. J.: Seasonal and annual variations in atmospheric Hg and Pb isotopes in Xi'an, China, Environ. Sci. Technol., 51, 3759–3766, https://doi.org/10.1021/acs.est.6b06145, 2017.
Xu, H. M., Sun, R. Y., Cao, J. J., Huang, R. J., Guinot, B., Shen, Z. X., Jiskra, M., Li, C. X., Du, B. Y., He, C., Liu, S. X., Zhang, T., and Sonke, J. E.: Mercury stable isotope compositions of Chinese urban fine particulates in winter haze days: Implications for Hg sources and transformations, Chem. Geol., 504, 267–275, https://doi.org/10.1016/j.chemgeo.2018.11.018, 2019.
Xu, L. L., Chen, J. S., Yang, L. M., Yin, L. Q., Yu, J. S., Qiu, T. X., and Hong, Y. W.: Characteristics of total and methyl mercury in wet deposition in a coastal city, Xiamen, China: Concentrations, fluxes and influencing factors on Hg distribution in precipitation, Atmos. Environ. 99, 10–16, https://doi.org/10.1016/j.atmosenv.2014.09.054, 2014.
Xu, L. L., Jiao, L., Hong, Z. Y., Zhang, Y. R., Du, W. J., Wu, X., Chen, Y. T., Deng, J. J., Hong, Y. W., and Chen, J. S.: Source identification of PM2.5 at a port and an adjacent urban site in a coastal city of China: Impact of ship emissions and port activities, Sci. Total Environ., 634, 1205–1213, https://doi.org/10.1016/j.scitotenv.2018.04.087, 2018.
Xu, L. L., Zhang, Y. R., Tong, L., Chen, Y. P., Zhao, G. Q., Hong, Y. W., Xiao, H., and Chen, J. S.: Gas-particle partitioning of atmospheric reactive mercury and its contribution to particle bound mercury in a coastal city of the Yangtze River Delta, China, Atmos. Environ., 239, 117744, https://doi.org/10.1016/j.atmosenv.2020.117744, 2020.
Xu, L. L., Shi, J. Y., Chen, Y. P., Zhang, Y. R., Yang, M. L., Chen, Y. T., Yin, L. Q., Tong, L., Xiao, H., and Chen, J. S.: Mercury isotopic compositions in fine particles and offshore surface seawater in a coastal area of East China: implications for Hg sources and atmospheric transformations, Zenodo [data set], https://doi.org/10.5281/zenodo.5784847, 2021.
Yin, R. S., Feng, X. B., and Meng, B.: Stable mercury isotope variation in rice plants (Oryza sativa L.) from the Wanshan mercury mining district, SW China, Environ. Sci. Technol., 47, 2238–2245, https://doi.org/10.1021/es304302a, 2013.
Yin, R. S., Feng, X. B., Li, X. D., Yu, B., and Du, B. Y.: Trends and advances in mercury stable isotopes as a geochemical tracer, Trends Environ. Anal., 2, 1–10, https://doi.org/10.1021/es500322n, 2014a.
Yin, R. S., Feng, X. B., and Chen, J. B.: Mercury stable isotopic compositions in coals from major coal producing fields in China and their geochemical and environmental Implications, Environ. Sci. Technol., 48, 5565–5574, https://doi.org/10.1021/es500322n, 2014b.
Yin, R. S., Feng, X. B., Hurley, J. P., Krabbenhoft, D. P., Lepak, R. F., Hu, R. Z., Zhang, Q., Li, Z. G., and Bi, X. W.: Mercury isotopes as proxies to identify sources and environmental impacts of mercury in Sphalerites, Sci. Rep.-UK, 6, 2045–2322, https://doi.org/10.1038/srep18686, 2016.
Yu, B., Wang, X., Lin, C. J., Fu, X. W., Zhang, H., Shang, L. H., and Feng, X. B.: Characteristics and potential sources of atmospheric mercury at a subtropical near-coastal site in East China, J. Geophys. Res.-Atmos., 120, 8563–8574, https://doi.org/10.1002/2015JD023425, 2015.
Yu, B., Fu, X. W., Yin, R. S., Zhang, H., Wang, X., Lin, C. J., Wu, C. S., Zhang, Y. P., He, N. N., Fu, P. Q., Wang, Z. F., Shang, L. H., Sommar, J., Sonke, J. E., Maurice, L., Guinot, B., and Feng, X. B.: Isotopic composition of atmospheric mercury in China: New evidence for sources and transformation processes in air and in vegetation, Environ. Sci. Technol., 50, 9262–9269, https://doi.org/10.1021/acs.est.6b01782, 2016.
Yu, B., Yang, L., Wang, L., Liu, H., Xiao, C., Liang, Y., Liu, Q., Yin, Y., Hu, L., Shi, J., and Jiang, G.: New evidence for atmospheric mercury transformations in the marine boundary layer from stable mercury isotopes, Atmos. Chem. Phys., 20, 9713–9723, https://doi.org/10.5194/acp-20-9713-2020, 2020.
Zhang, L., Wang, S. X., Wang, L., Wu, L., Duan, L., Wu, Q. R., Wang, F. Y., Yang, M., Yang, H., Hao, J. M., and Liu, X.: Updated emission inventories for speciated atmospheric mercury from anthropogenic sources in China, Environ. Sci. Technol., 49, 3185–3194, https://doi.org/10.1021/es504840m, 2015.
Zheng, W. and Hintelmann, H.: Mercury isotope fractionation during photoreduction in natural water is controlled by its Hg DOC ratio, Geochim. Cosmochim. Ac., 73, 6704–6715, https://doi.org/10.1016/j.gca.2009.08.016, 2009.
Zheng, W., Obrist, D., Weis, D., and Bergquist, B. A.: Mercury isotope compositions across North American forests, Global Biogeochem. Cy., 30, 1475–1492, https://doi.org/10.1002/2015gb005323, 2016.