the Creative Commons Attribution 4.0 License.
the Creative Commons Attribution 4.0 License.
 | 16 Dec 2021
Urban aerosol chemistry at a land–water transition site during summer – Part 2: Aerosol pH and liquid water content
Michael A. Battaglia Jr.
Nicholas Balasus
Katherine Ball
Vanessa Caicedo
Ruben Delgado
Annmarie G. Carlton
Christopher J. Hennigan
Particle acidity (aerosol pH) is an important driver of atmospheric chemical processes and the resulting effects on human and environmental health. Understanding the factors that control aerosol pH is critical when enacting control strategies targeting specific outcomes. This study characterizes aerosol pH at a land–water transition site near Baltimore, MD, during summer 2018 as part of the second Ozone Water-Land Environmental Transition Study (OWLETS-2) field campaign. Inorganic fine-mode aerosol composition, gas-phase NH3 measurements, and all relevant meteorological parameters were used to characterize the effects of temperature, aerosol liquid water (ALW), and composition on predictions of aerosol pH. Temperature, the factor linked to the control of NH3 partitioning, was found to have the most significant effect on aerosol pH during OWLETS-2. Overall, pH varied with temperature at a rate of −0.047 K−1 across all observations, though the sensitivity was −0.085 K−1 for temperatures > 293 K. ALW had a minor effect on pH, except at the lowest ALW levels (< 1 µg m−3), which caused a significant increase in aerosol acidity (decrease in pH). Aerosol pH was generally insensitive to composition (, , total NH3 (Tot-NH3) = NH3 + ), consistent with recent studies in other locations. In a companion paper, the sources of episodic NH3 events (95th percentile concentrations, NH3 > 7.96 µg m−3) during the study are analyzed; aerosol pH was higher by only ∼ 0.1–0.2 pH units during these events compared to the study mean. A case study was analyzed to characterize the response of aerosol pH to nonvolatile cations (NVCs) during a period strongly influenced by primary Chesapeake Bay emissions. Depending on the method used, aerosol pH was estimated to be either weakly (∼ 0.1 pH unit change based on NH3 partitioning calculation) or strongly (∼ 1.4 pH unit change based on ISORROPIA thermodynamic model predictions) affected by NVCs. The case study suggests a strong pH gradient with size during the event and underscores the need to evaluate assumptions of aerosol mixing state applied to pH calculations. Unique features of this study, including the urban land–water transition site and the strong influence of NH3 emissions from both agricultural and industrial sources, add to the understanding of aerosol pH and its controlling factors in diverse environments.
- Article
(1806 KB) - Full-text XML
- Companion paper
-
Supplement
(1992 KB) - BibTeX
- EndNote


The acidity, or pH, of atmospheric aerosols affects the chemical and physical properties of airborne particles and, thus, their impacts on climate and health (Pye et al., 2020). The gas–particle partitioning of semi-volatile acidic and basic compounds – notably NH3, HNO3, HCl, and organic acids – depends in part on aerosol pH, which directly affects the particulate matter (PM) mass concentration (Nenes et al., 2020). The solubility of many particulate components is pH-dependent, including metals and nutrients, with implications for particle toxicity and nutrient deposition to ecosystems (Fang et al., 2017; Kanakidou et al., 2016). The optical properties of light-absorbing organic compounds, known as brown carbon, can exhibit a strong pH dependence, which directly affects their climate impacts (Phillips et al., 2017). However, direct measurements of aerosol pH remain challenging. Single-particle studies of aerosol pH using Raman spectroscopy have been performed but are limited by the presence of both and limiting their application to more acidic particles (Boyer et al., 2020; Rindelaub et al., 2016). Colorimetric measurements of aerosol pH have also been employed, but such techniques have been limited to laboratory studies with relatively simple aerosol compositions (Craig et al., 2018; Jang et al., 2020). Given the importance of aerosol pH for atmospheric processes and the limitation in estimating acidity with proxies (e.g., ion balances), there has been increased effort in recent years to identify the factors that affect pH and to characterize temporal and spatial variations in the atmosphere (Hennigan et al., 2015).
Globally, aerosol pH is often quite acidic due to the ubiquity and abundance of strong acids like H2SO4, HNO3, and HCl (Pye et al., 2020). Ammonia (NH3) is unique among species that affect pH because it is the most abundant basic compound in the atmosphere. NH3 partitioning is controlled by the concentration of strong acids and by the ambient temperature and relative humidity, hence, the dependence of pH on both composition and meteorology (Zheng et al., 2020). In some regimes, the meteorological factors are more important than the compositional factors, explaining why NH3 can exist partially in the gas phase even when the aerosol pH is highly acidic (Nenes et al., 2020; Weber et al., 2016). Due to its abundance and semi-volatile properties, NH3 was identified as the most important buffering agent in aerosols across locations with diverse emissions, composition, and climatology (Zheng et al., 2020). In single-phase aqueous particles, organic compounds have a minor effect on pH (Battaglia et al., 2019), though this is not the case for particles that have undergone liquid–liquid phase separation (Pye et al., 2018). Nonvolatile cations (NVCs) typically contribute a minor fraction of PM mass but can be critical for accurate predictions of pH, especially if NVC concentrations are overestimated (Vasilakos et al., 2018). Globally, NVCs are most important in regions heavily impacted by dust emissions (Pye et al., 2020) but have minor effects on pH in other regions (Tao and Murphy, 2019; Zheng et al., 2020).
Aerosol pH is also strongly affected by meteorological factors. Equilibrium constants, including those that determine the gas–particle partitioning and aqueous dissociation of semi-volatile acids and bases, are temperature-dependent. Temperature is a dominant factor driving variability in the seasonal and diurnal cycling of pH (Guo et al., 2015; Tao and Murphy, 2019). Temperature gradients, as occur in and around urban areas, can also drive large differences in pH, even if the composition is uniform over the same scales (Battaglia et al., 2017). Relative humidity (RH) regulates aerosol liquid water content (ALWC), which affects the partitioning of soluble gases and aqueous-phase solute concentrations. ALWC may be the most important factor responsible for large pH differences observed between the southeast US (pH ∼ 0.5–1.0) and the heavily polluted North China Plain (pH ∼ 4–5), the two regions where pH has been most extensively studied to date (Zheng et al., 2020). These effects can be complex or even partially offset. For example, an increase in temperature reduces pH, owing to the shift in NH3 partitioning towards the gas phase, but NH3 emissions increase with temperature as well, producing an increase in pH and partially offsetting the pH changes due to temperature (Tao, 2020). More research is needed to better understand how all these factors together affect pH and how this changes spatially and temporally.
In this study, aerosol pH was characterized during the summertime (4 June to 5 July 2018) at a land–water transition site near a large urban area (Baltimore, MD) as part of the OWLETS-2 (second Ozone Water-Land Environmental Transition Study) field campaign. This site is unique because meteorological phenomena, such as the bay breeze, affect pollution dispersion and recirculation (Loughner et al., 2014). Baltimore is impacted by different regional emission sources, as it is located in the populous and heavily trafficked I-95 corridor, downwind of the Ohio River valley (He et al., 2013), and relatively close to regional agricultural operations that emit large amounts of NH3 (Pinder et al., 2006). In a companion paper, the local sources of NH3 during the OWLETS-2 study were examined, including an analysis of transient events with unexpectedly high NH3 concentrations (Balasus et al., 2021). In this study, the effects of the observed NH3 concentrations (including the aforementioned transient concentrations of unexpectedly high values), in combination with the unique meteorological phenomena associated with the land–water transition, on ALW and aerosol pH were investigated.
The OWLETS-2 study was conducted to characterize effects of meteorological phenomena associated with the land–water transition on summertime air quality in Baltimore. Hart-Miller Island (HMI, coordinates 39.2421∘, −76.3627∘), a site located on the Chesapeake Bay, ∼ 10 km east of downtown Baltimore, hosted many of the ground-based measurements during the study (Fig. S1 in the Supplement). Semi-continuous measurements of aerosol inorganic chemical composition and gas-phase NH3 were conducted at HMI. The measurement details are provided in the companion paper (Balasus et al., 2021). Briefly, the water-soluble ionic components of PM2.5 were measured with a particle-into-liquid sampler coupled to a dual ion chromatograph (PILS-IC, Metrohm) operated according to Valerino et al. (2017). NH3 was measured with an AiRRmonia Analyzer (RR Mechatronics) (Norman et al., 2009). Meteorological parameters were measured with a Vaisala MAWS201 weather station at 1 min resolution.
The 5 min NH3 measurements and 1 min meteorological measurements were averaged to the 20 min sampling time of the PILS-IC. Aerosol pH for each 20 min sample was calculated according to the NH3 partitioning method presented in Zheng et al. (2020). This method uses the relevant temperature-dependent equilibrium constants and the measured concentrations of NH3 and to calculate pH. The method of Zheng et al. (2020) is based upon a similar approach in prior studies (Hennigan et al., 2015; Keene et al., 2004); the two methods are identical, with minor differences only due to equilibrium constant values used based on ranges provided in the literature. Indeed, very close agreement was observed (slope = 0.967, R2 = 0.977, n = 872) in calculated pH between the NH3 partitioning methods of Zheng et al. (2020) and Hennigan et al. (2015). The aqueous-phase concentration is derived from the mass concentration of from the PILS-IC and the ALWC. The ISORROPIA-II thermodynamic equilibrium model was used to calculate ALWC using the PILS-IC, NH3, and meteorological data as inputs (Fountoukis and Nenes, 2007). The model was run in forward mode (NH3 and aerosol were input at total NH3) using the metastable assumption according to the recommendation of Guo et al. (2015).
Although ISORROPIA can provide pH, the NH3 partitioning method was used for pH calculations in this study:
where in Eq. (1), [NH3(aq)] is the molality of NH3 in solution (mol kg−1, calculated by multiplying and ), [NH3(g)] is the equivalent molality of gaseous NH3 in solution (mol kg−1, given by Eq. 2), and is the molality of in solution (mol kg−1). Equation (2) calculates [NH3(g)], where is the partial pressure of NH3 (atm), ρw is the density of water (µg m−3), R is the gas constant (atm L mol−1 K−1), T is temperature (K), and AWC is aerosol water content (µg m−3 air). Equation (3) calculates the last unknown term in Eq. (1), which is , the effective dissociation constant (where is Henry's law constant of NH3 in ).
Direct measurements of aerosol pH are not available to test model predictions, so the partitioning of semi-volatile species that depend on pH, most commonly NH3/ and HNO3/, is a key metric used to evaluate model performance (Pye et al., 2020). ISORROPIA is used extensively for predictions of pH; however, in this study the measured and ISORROPIA-predicted values of NH3 partitioning ( = NH3/(NH3 + )) did not always agree well (Fig. S2). There were systematic differences in pH between the two methods (mean pH difference = 0.6 pH units), and they were not correlated (R2 = 0.097, not shown). The source of the discrepancy in NH3 partitioning (ISORROPIA modeled versus measurement-calculated) is unknown, though it is not likely the result of an incorrect assumption of equilibrium (see the Supplement and the companion paper, Balasus et al., 2021, for more details).
Commonly, a reasonable estimate of measurement errors associated with the species of interest is on the order of 15 % +1 nmol m−3 for online sampling methods (Murphy et al., 2017). Utilizing this estimate in the extreme acidic case (ambient observed and adjusted to + 15 % + 1 nmol m−3; adjusted to −15 % −1 nmol m−3) or non-acidic case ( and adjusted down by −15 % −1 nmol m−3 and adjusted up by + 15 % + 1 nmol m−3), the uncertainty of aerosol pH was predicted to vary by 0.1–1 pH units (Murphy et al. 2017). Similarly, Pye et al. (2020) reported that in cases for RH above 60 %, deviations of the ISORROPIA-predicted pH and the IUPAC-defined pH are less than 1 pH unit. The present calculations have similar uncertainties in the pH calculations.
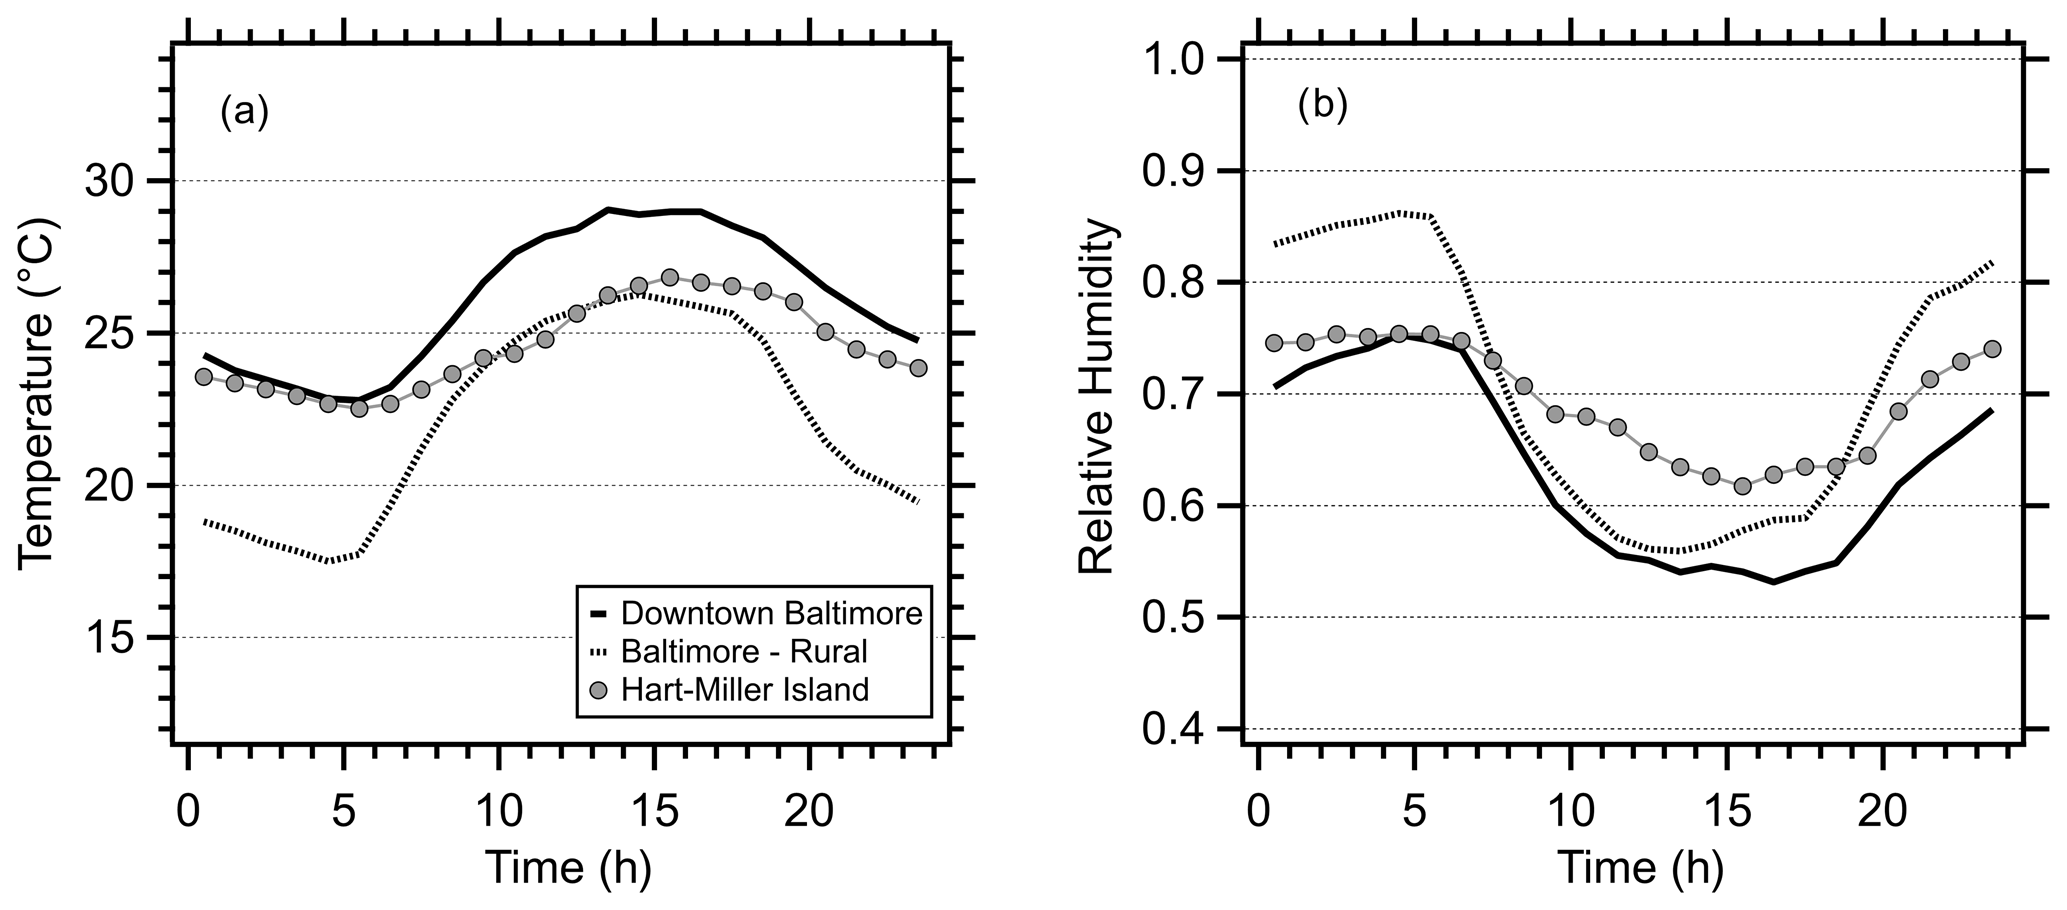
Figure 1Diurnal profiles of (a) temperature and (b) relative humidity at three sites during the OWLETS-2 study. Hart-Miller Island (HMI) is a land–water transition site and was the location of aerosol composition and gas-phase measurements during the campaign. Temperatures at HMI resembled the downtown location during the night but showed characteristics of the rural site during the day. RH at HMI was between the urban and rural sites at night but was elevated during the daytime due to the Chesapeake Bay.
3.1 Meteorological effect on pH
As in many cities, the urban heat island effect in Baltimore evolves throughout the day, with urban–rural temperature and RH gradients peaking at night (Battaglia et al., 2017). Meteorological conditions at HMI demonstrate unique features associated with the land–water transition. At night, the average temperature observed at HMI was close to conditions observed in downtown Baltimore but transitioned to match the conditions at a nearby rural site during the day (Fig. 1a). Overall, the range in average hourly temperatures at HMI was lower (4.3 ∘C; 22.5–26.8 ∘C) than the averages observed at either the downtown site (range 6.2 ∘C; 22.8–29.0 ∘C) or the rural site (range 8.8 ∘C; 17.5–26.3 ∘C). Likewise, the average hourly RH profile at HMI had a significantly smaller range (13.7 %; 61.7 %–75.4 %) than the RH profiles at the downtown (range 22.1 %; 53.2 %–75.3 %) or rural sites (range 30.3 %; 55.9 %–86.2 %) (Fig. 1b). The differences shown in Fig. 1 were due to the proximity of HMI to the Chesapeake Bay and have several implications for aerosol pH, which will be discussed in detail below.
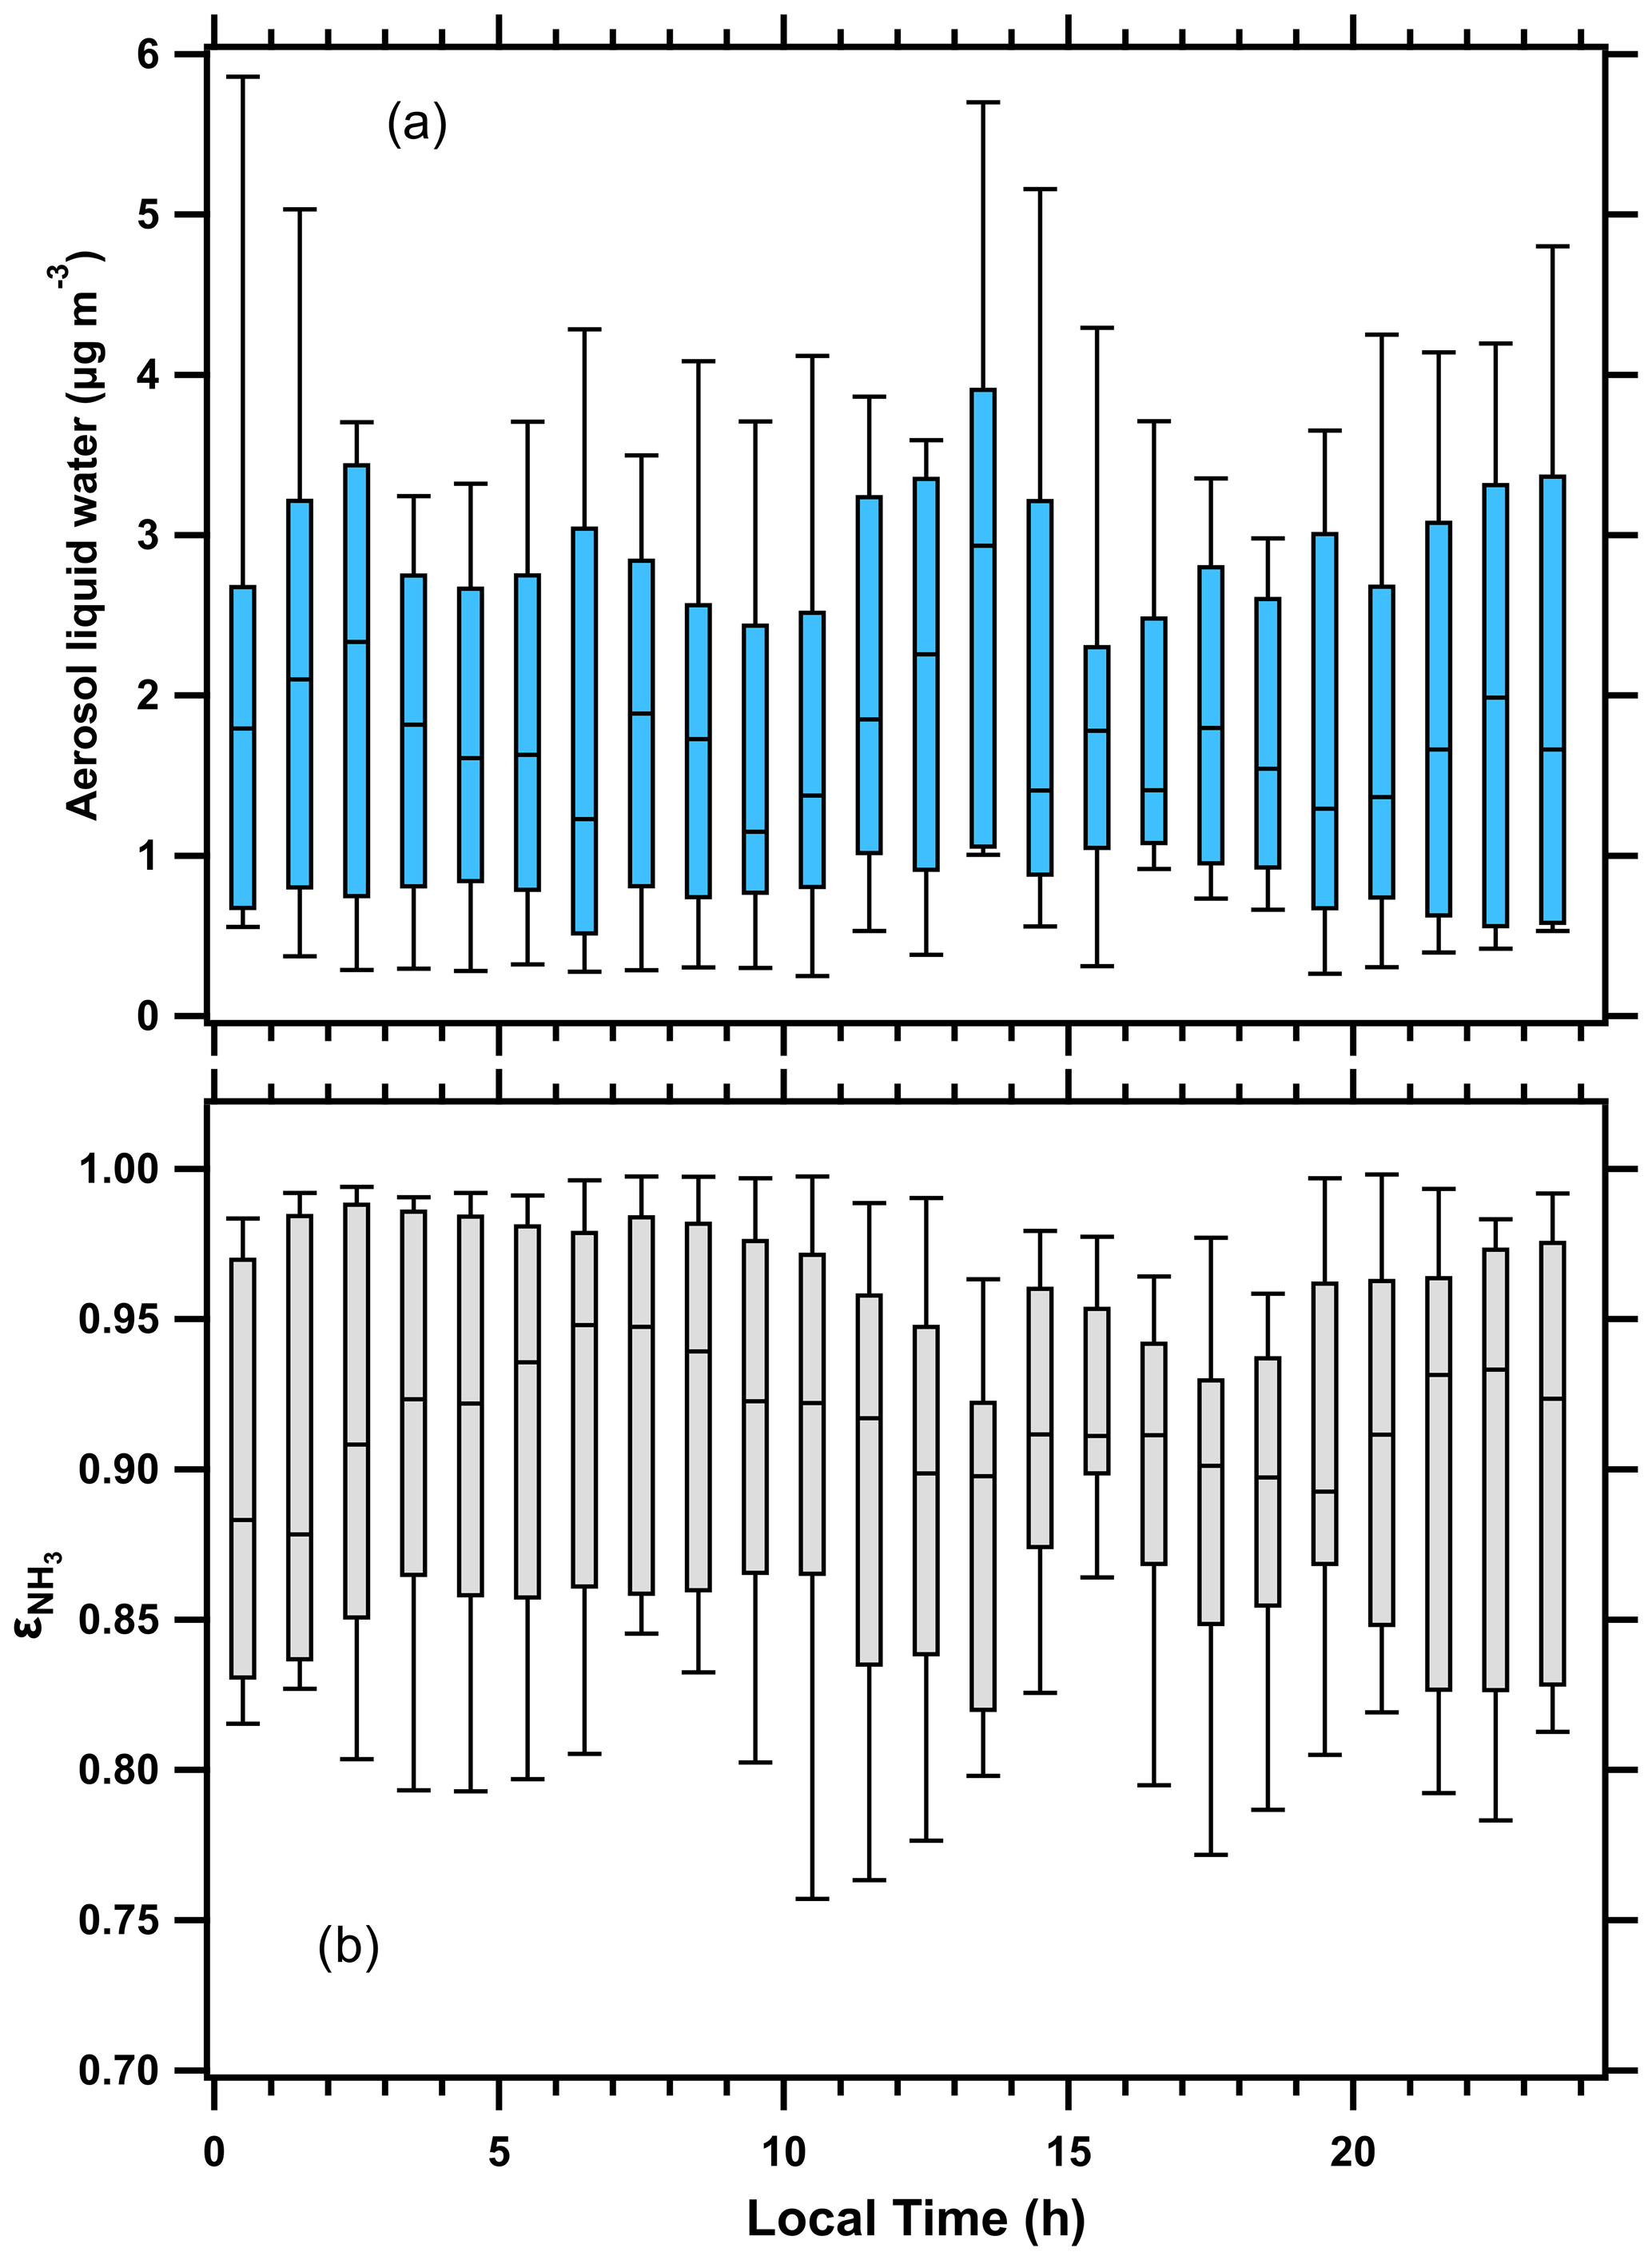
Figure 2Box plots of (a) aerosol liquid water and (b) ( = NH3(g)/(NH3(g) + (aq))) during the OWLETS-2 study. The statistics shown are the median, quartiles, and 10th and 90th percentiles.
Due to the meteorological conditions discussed above, the diurnal profile of ALWC at HMI was unique (Fig. 2a). Typical profiles of ALWC in the eastern US closely follow RH, with minima in the afternoon and maxima at night or in the pre-dawn morning hours (Guo et al., 2015; Battaglia et al., 2017). During OWLETS-2, ALWC did not show a distinct diurnal profile that was correlated with RH. Instead, the highest median ALWC at HMI occurred between 12:00–14:00 LT (local time; during the study this is UTC−4) (Fig. 2a). This daily peak in ALWC coincided with a pronounced enhancement in aerosol , which is discussed in the companion paper (Balasus et al., 2021). The partitioning of NH3, , also showed a diurnal profile that was unexpected (Fig. 2b). Due to the strong temperature dependence of vapor pressure and equilibrium constants, NH3 partitioning typically shifts towards the gas-phase during the daytime ( increases) and shifts towards the aerosol phase at night ( decreases) (Guo et al., 2017). The increase in gas-phase NH3 emissions with increasing temperature can also contribute to an elevated during the daytime. The diurnal profile of observed at HMI did not follow temperature, as the median peaked during 06:00–08:00 LT and decreased slightly into the afternoon (Fig. 2b). This shows a shift of NH3 partitioning towards the condensed phase as daily temperatures peaked. This was enabled by the ALWC remaining steady throughout the afternoon. Overall, the median value for the entire OWLETS-2 study was 0.915, showing NH3 partitioning was shifted towards the gas phase.
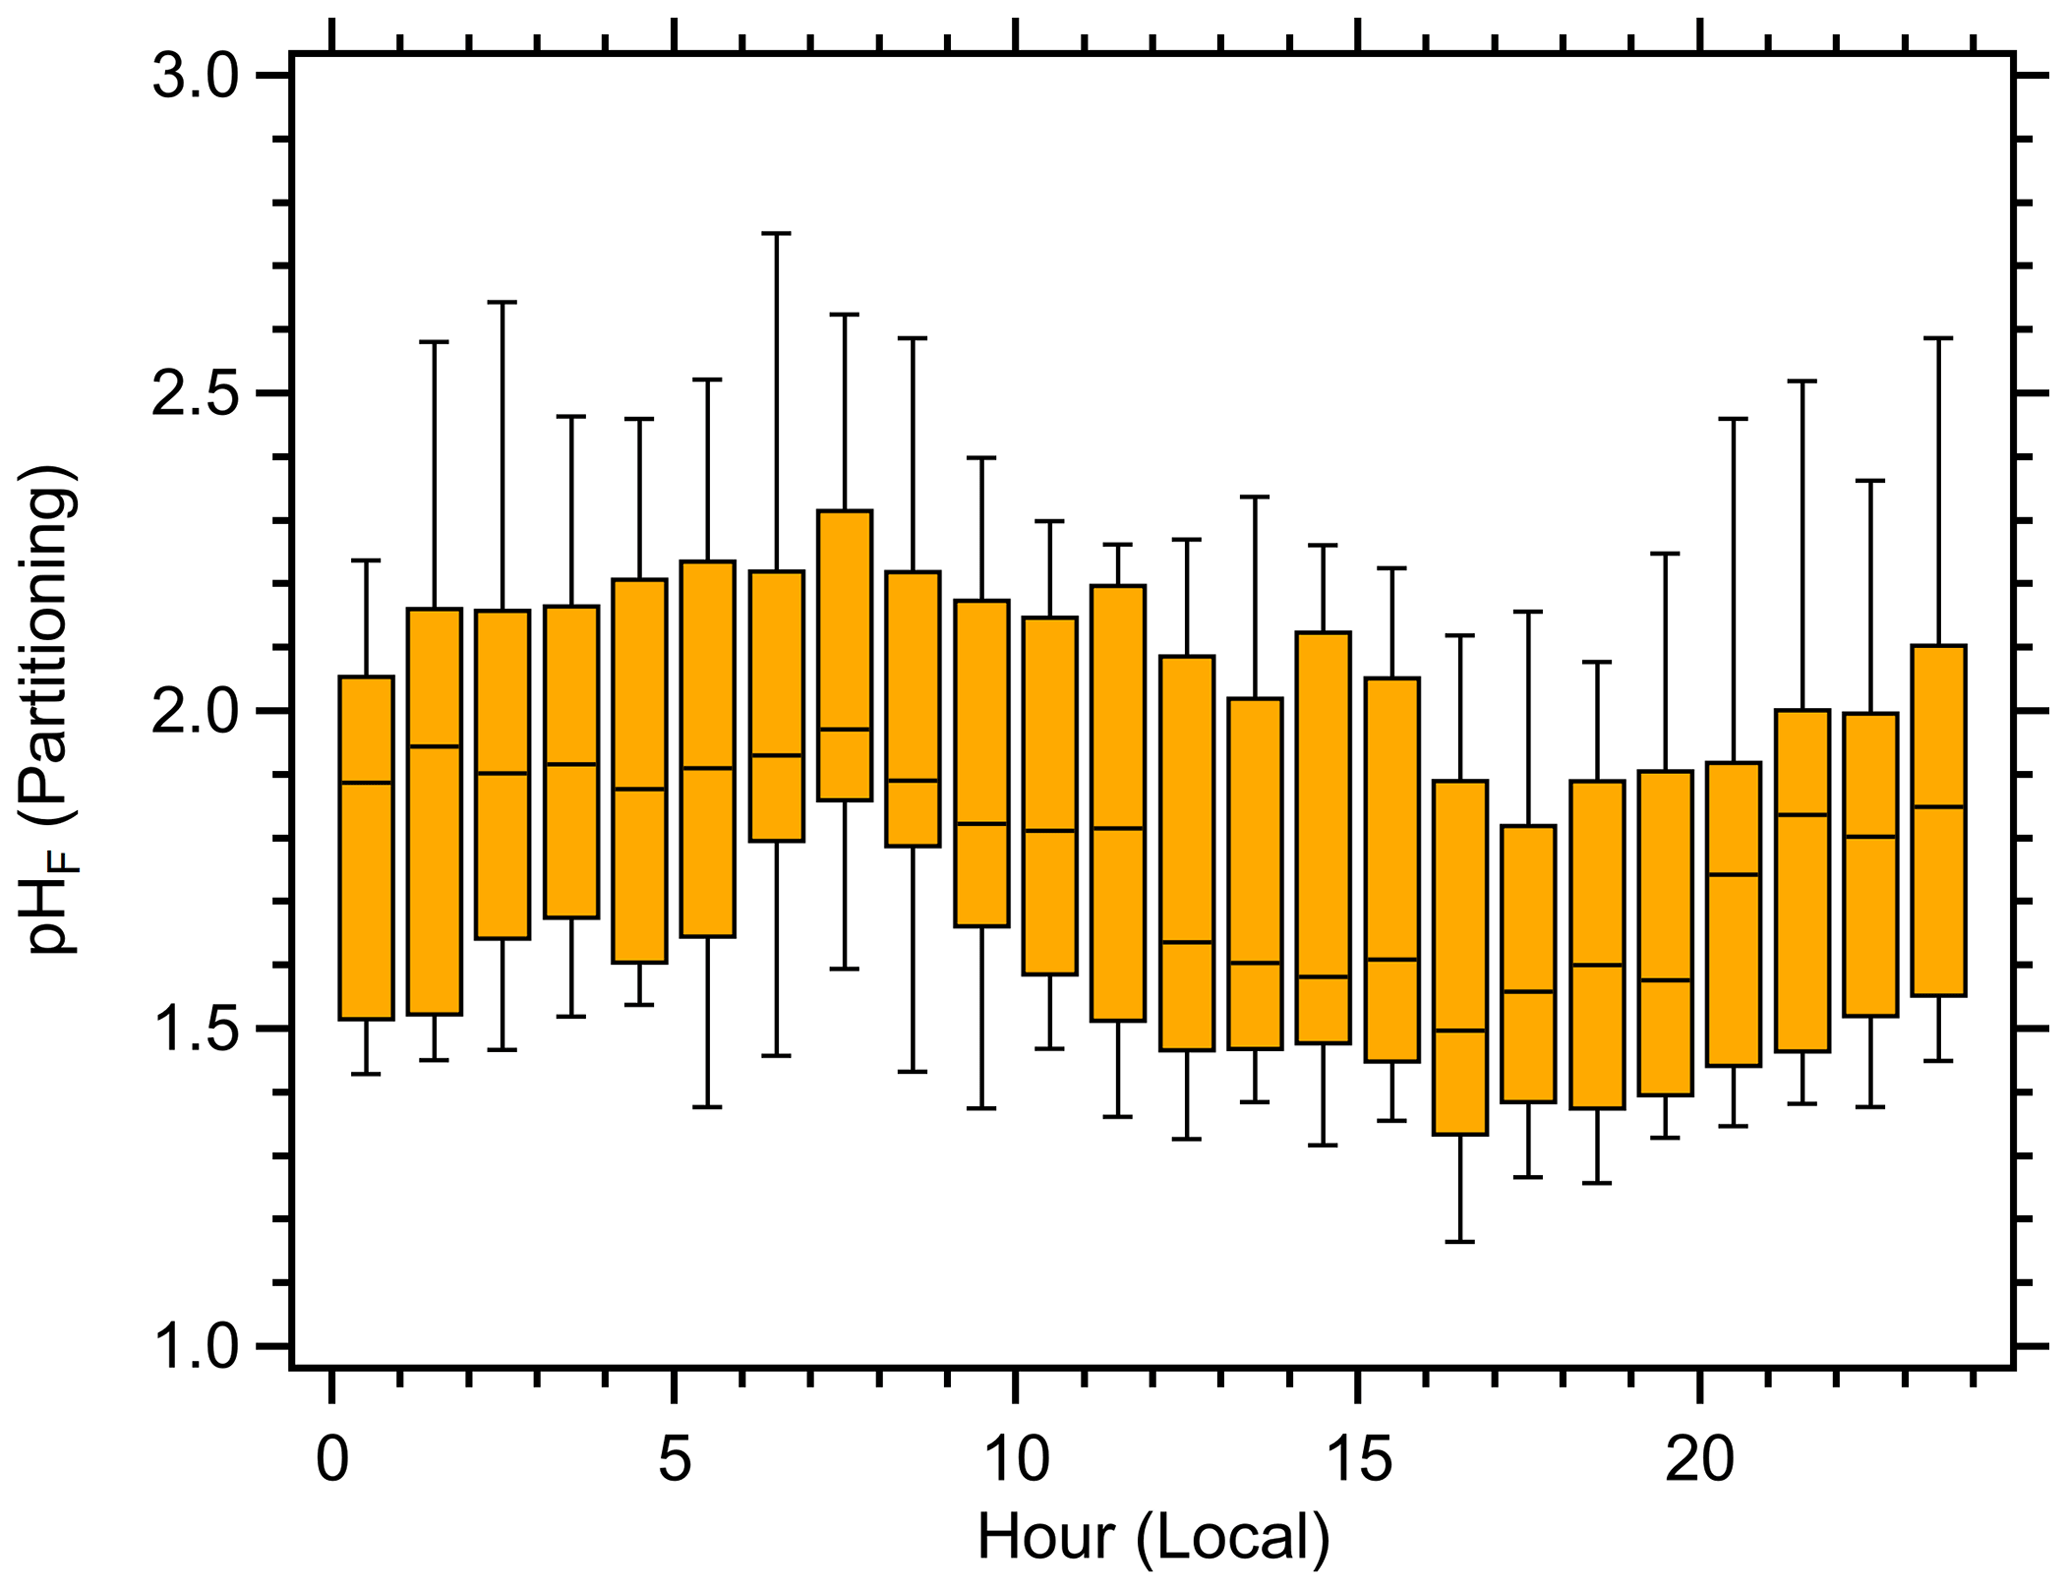
Figure 3Box plot of the aerosol pH diurnal profile calculated using the NH3 partitioning method at Hart-Miller Island during OWLETS-2. The statistics shown are the median, quartiles, and 10th and 90th percentiles.
The diurnal profile of aerosol pH computed using the NH3 partitioning method followed a qualitatively similar pattern to prior studies (Battaglia et al. 2017), with maxima in the early morning and minima in the afternoon; however, there was a much smaller amplitude in the median hourly pH values (Fig. 3). The highest median pH value (1.97) was observed between 07:00–08:00 LT, while the lowest median pH (1.50) was observed between 16:00–17:00 LT. For the entire study, there was only a ∼ 1 pH unit difference between the 10th and 90th percentile values (1.39 and 2.36, respectively). The relatively muted diurnal profile of aerosol pH was due to the unique meteorology that resembled a nearby urban site at night and transitioned to match the nearby rural site during the day. The companion paper shows the diurnal profiles of aerosol inorganic composition (Balasus et al., 2021). Figures 2 and 3 are consistent with recent studies that demonstrate the high sensitivity of pH to meteorological factors (Battaglia et al., 2017; Tao and Murphy, 2019; Zheng et al., 2020). It is interesting to note that the ISORROPIA predictions of aerosol pH yield a distinctly different diurnal profile than the pH predicted by NH3 partitioning (Fig. S3). The difference in pH between the two methods peaked in the afternoon between 12:00–14:00 LT, when particles were most acidic, and was a minimum in the early morning when pH was highest (Fig. S3). The reason for these discrepancies are explored in the discussion below.
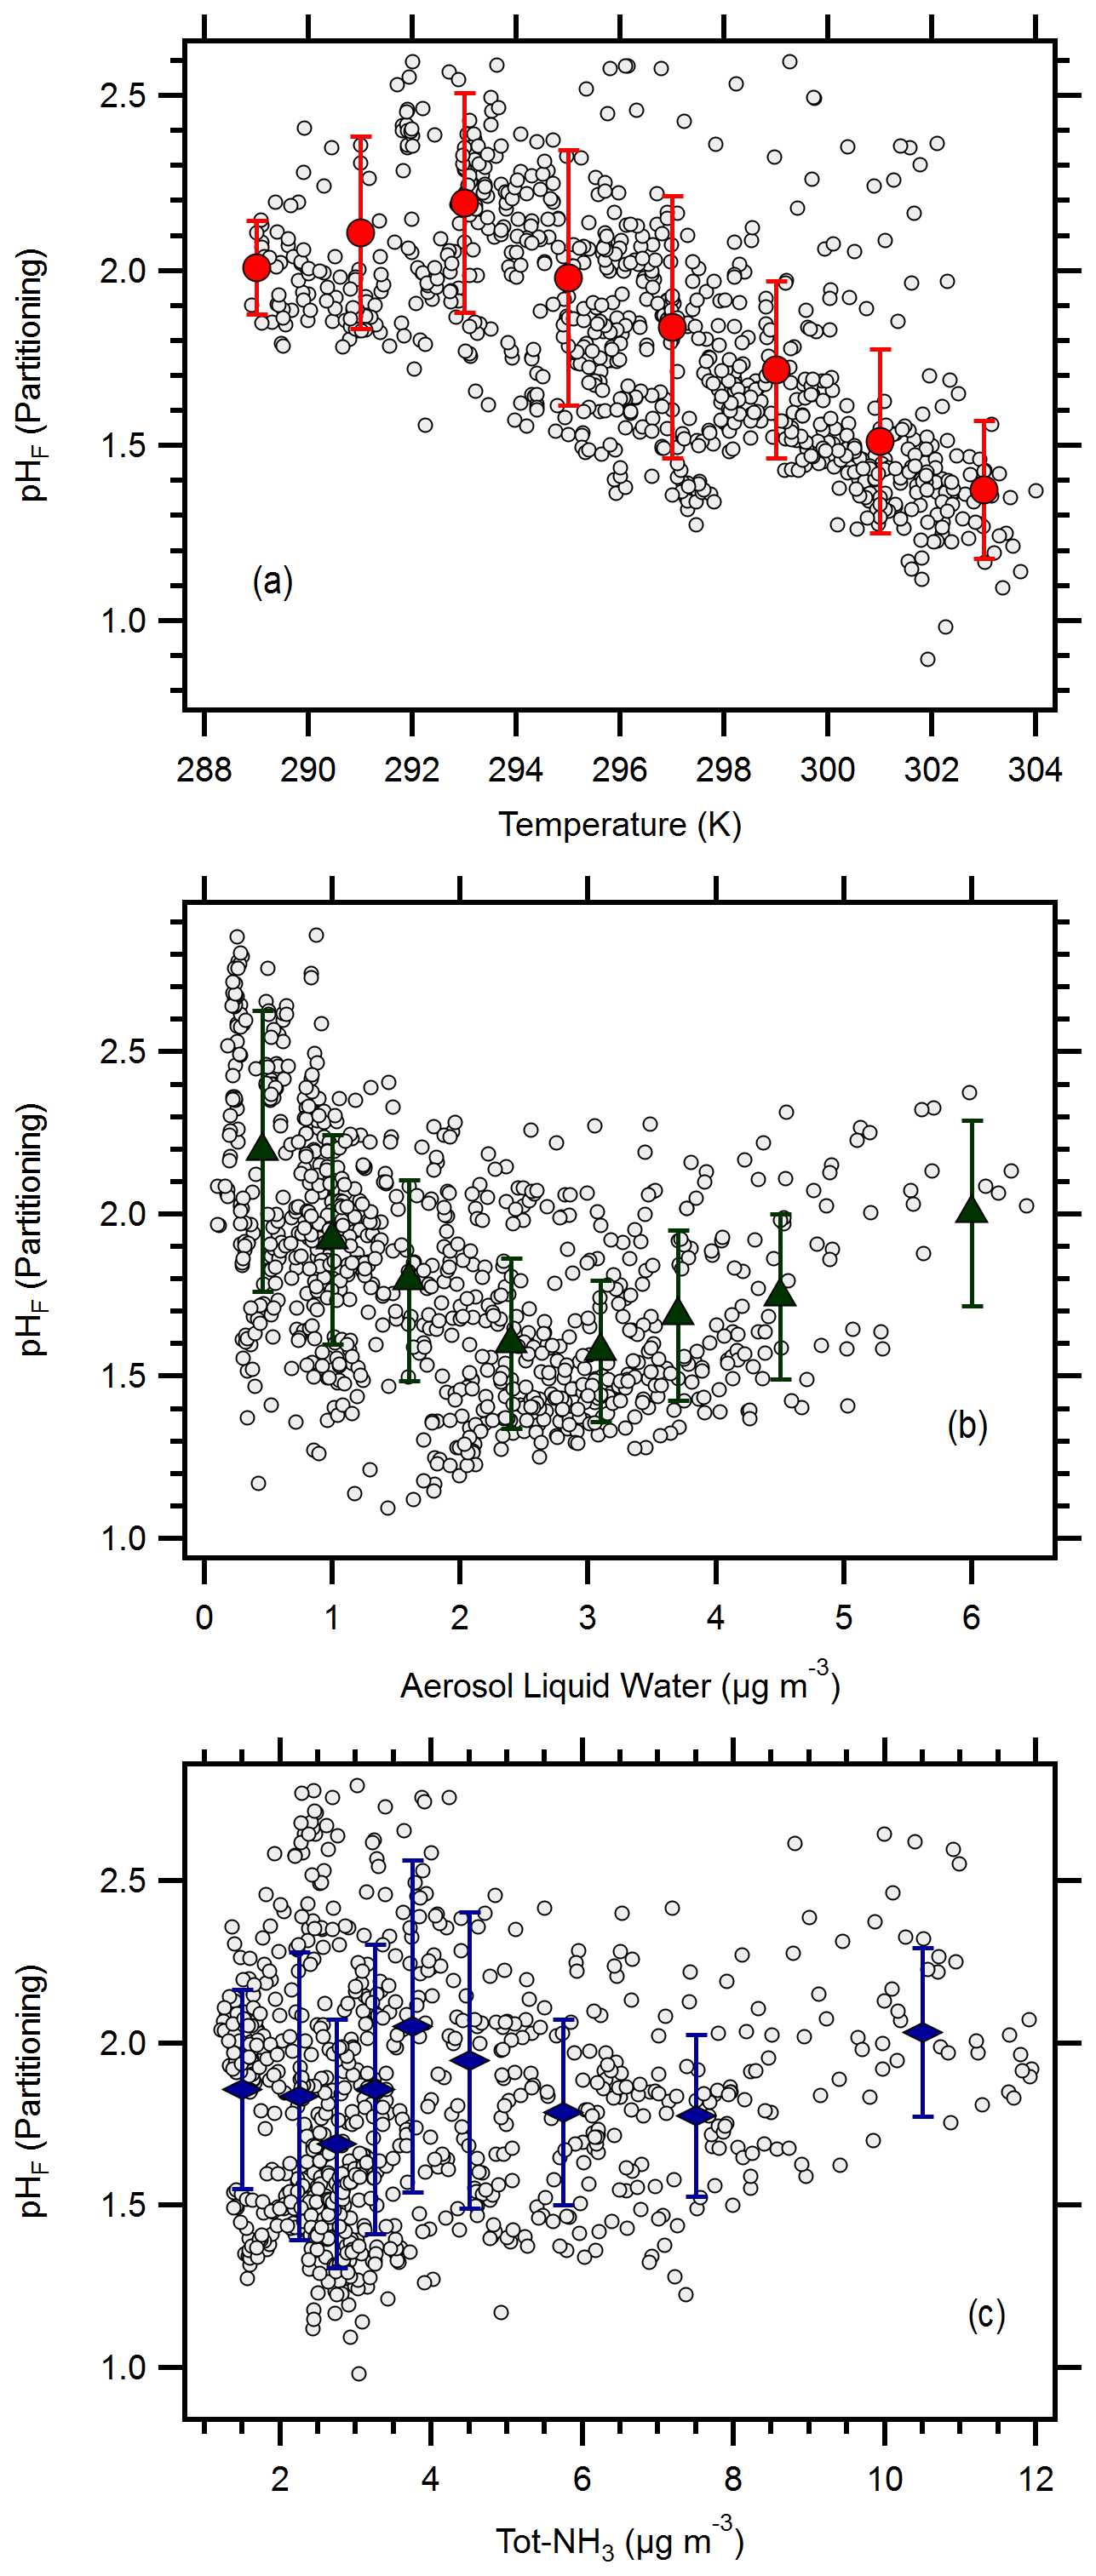
Figure 4Relationship between aerosol pH and (a) temperature, (b) aerosol liquid water, and (c) total NH3 (Tot-NH3 = NH3 + ). Symbols represent mean values, while error bars represent standard deviations; bins were limited to a maximum of 160 points per bin.
Results suggest that pH was most sensitive to temperature changes at HMI during OWLETS-2 (Fig. 4a). Across the full temperature range, the observed pH sensitivity to temperature was −0.047 K−1. A recent study contrasting pH in the southeast US and the North China Plain found that temperature affects pH linearly at a rate of approximately −0.055 K−1 (Zheng et al., 2020). A separate study from a Canadian observational network found that the pH–temperature dependence is not linear but changes with temperature (Tao and Murphy, 2019; Tao, 2020). Over the range of conditions observed during OWLETS-2, Tao (2020) computed a pH sensitivity to temperature of approximately −0.045 to −0.055 K−1. In a previous study, the pH sensitivity to temperature in Baltimore was −0.048 K−1, though this was calculated for conditions of constant atmospheric composition (Battaglia et al., 2017). While the present results share consistencies with these studies, the results in Fig. 4a suggest important differences, as well. An increase in pH was observed with increasing temperature for conditions below 293 K (n = 156). In the companion paper, NH3 concentrations dramatically increased with temperature < 293 K but exhibited a much weaker dependence on temperature for conditions > 293 K (Balasus et al., 2021). Under the warmer conditions, the pH relationship with temperature was linear during OWLETS-2, with a sensitivity of −0.085 K−1 (Fig. 4a). The results in Fig. 4a are consistent with Tao (2020), as they demonstrate the offsetting responses of pH to temperature through effects on NH3 emissions and partitioning.
These results contribute to the growing body of work demonstrating the importance of temperature to aerosol pH. Collectively, these studies suggest that the sensitivity of pH to temperature is constrained between −0.045 and −0.085 K−1, although the present results illustrate circumstances where a positive relationship between temperature and pH can exist, as well. It is notable that similar ΔpH/ΔT values are observed across a range of locations and for variable data sets that include monthly averages of long-term observations (Tao and Murphy, 2019) and 20 min measurements made over a period of weeks (presented here).
Aerosol pH was not strongly affected by ALWC over the range of conditions observed during OWLETS-2, except at ALWC below 1 µg m−3 (Fig. 4b). At the lowest ALWC levels, the increase in pH occurs because of the diluting effect of water; however, at ALWC above 1 µg m−3, other factors appear to be more important (e.g., temperature). ALWC was recently identified as the most significant contributor to regional pH differences (Zheng et al., 2020). In that study, the pH–ALWC relationship was highly nonlinear, with the greatest sensitivity calculated at ALWC levels < 25 µg m−3, conditions corresponding to all the OWLETS-2 observations. Tao (2020) found that pH was extremely sensitive to RH, presumed to be a surrogate for ALWC, when RH was < 20 % or RH > 80 %; however, pH was quite insensitive to RH variations in the region of 20 % < RH < 80 %. Approximately 25 % (208 out of 875) of RH values during OWLETS-2 were above 80 %; yet no increase in pH was observed at the highest ALWC, suggesting that other factors were offsetting the diluting effect of water as ALWC increased. It is interesting to note that ISORROPIA predicts a stronger effect of ALWC on pH, with the diluting effect apparent as pH increases with increasing ALWC. A combination of particle mass loading, aerosol composition, and ambient RH are responsible for the variations in ALWC.

Figure 5Relationship between NH3 partitioning ( = NH3/(NH3 + )) and aerosol liquid water. Symbols represent mean values, while error bars represent standard deviations; bins were limited to a maximum of 160 points per bin.
The result shown in Fig. 4b is somewhat surprising because NH3 partitioning was quite sensitive to ALWC (Fig. 5); the relatively invariant aerosol pH is unexpected given the increase in NH3 uptake in the presence of ALWC. With increasing NH3 uptake in the presence of, and concurrent with, the increased ALWC, it would be anticipated that aerosol pH would become less acidic, both through the reaction of NH3 to form and due to the dilution effect of liquid water. However, the results of Figs. 4 and 5 reveal that despite both the increase in NH3 uptake and increase in ALWC, aerosol pH remains relatively unchanged, with only a 0.5 pH unit change at the highest values of ALWC. NH3 partitioning shifted towards the condensed phase ( decreased) at increasing ALWC, consistent with the results of Nenes et al. (2020). was more sensitive to ALWC than it was to either temperature or RH (Fig. S5). This result shows the importance that ALWC can have on PM2.5 mass concentrations, as water serves as an important medium enhancing the condensation of organic and inorganic water-soluble species (Carlton et al., 2018; El-Sayed et al., 2016). Figure 5 demonstrates the importance of ALWC in changing the dry deposition of reactive nitrogen species. Nenes et al. (2021) predict that NH3 and HNO3 dry deposition rates will both be high under the conditions observed during OWLETS-2 (i.e., ALWC < 10 µg m−3 and pH ∼ 1.5). This is also consistent with a modeling study showing increased dry deposition of reactive nitrogen in coastal regions, including the OWLETS-2 study domain (Loughner et al., 2016).
3.2 Composition effects on aerosol pH
In contrast to meteorological factors, aerosol composition did not have a major effect on pH variability during OWLETS-2. Consistent with prior studies, neither the sulfate concentration nor the molar ratio contributed significantly to pH variability (Weber et al., 2016; Hennigan et al., 2015). Figure 4c shows that pH was also relatively insensitive to the total NH3 (Tot-NH3) concentration, in agreement with the results from other locations (Zheng et al., 2020; Tao, 2020; Weber et al., 2016). While the predictions of ISORROPIA generally did not capture the trends between pH and the meteorological factors, it is interesting to note that ISORROPIA predicts that pH is relatively insensitive to Tot-NH3, as well, except at the highest concentrations (Fig. S4).
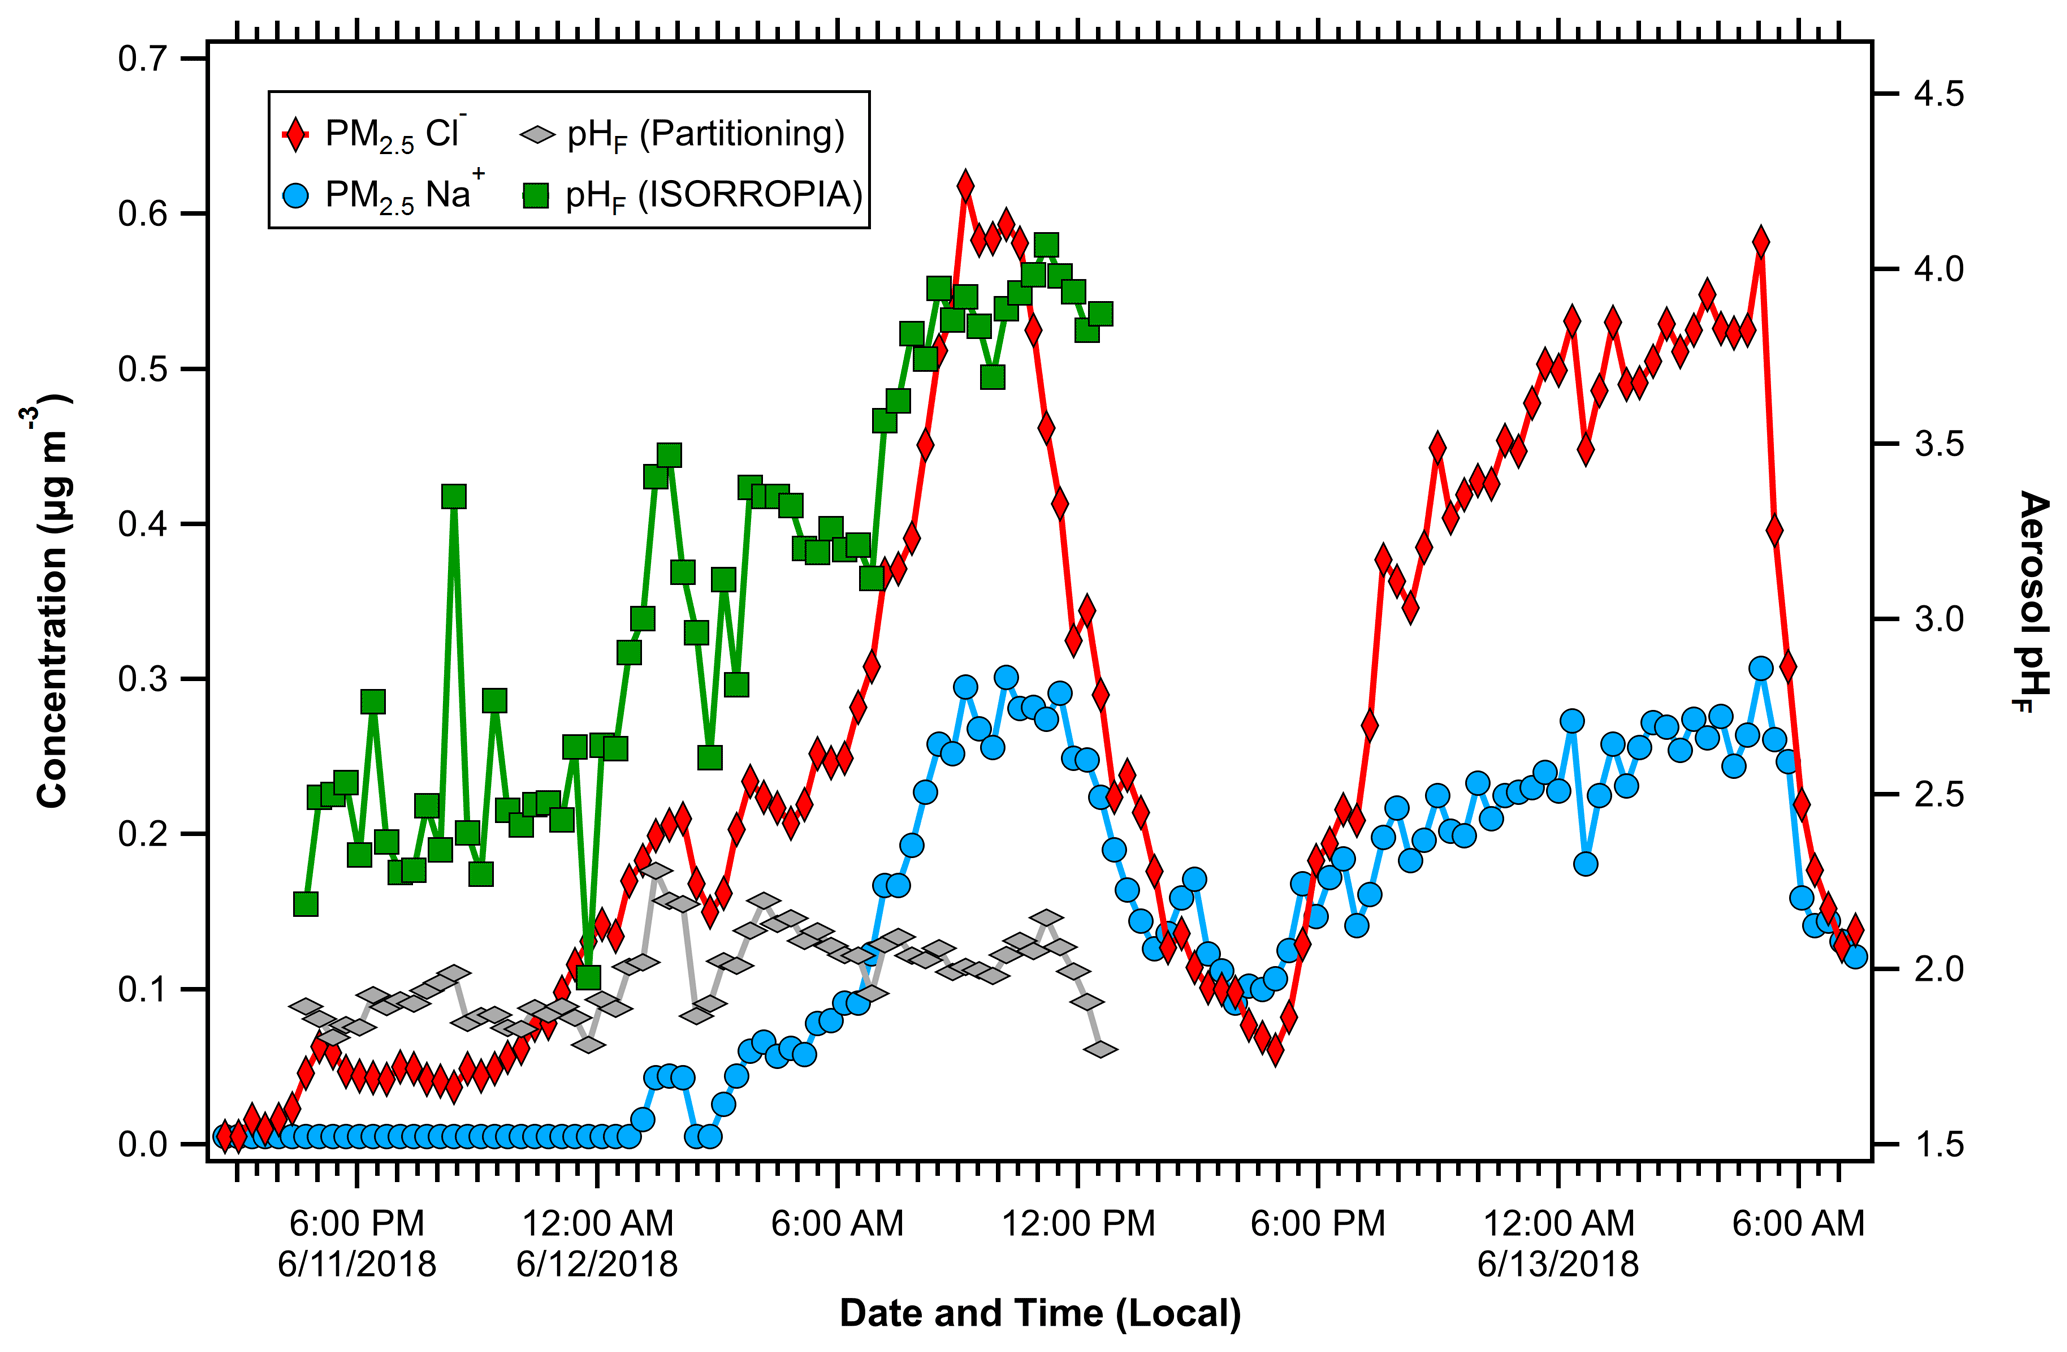
Figure 6Concentrations of PM2.5 Na+ and Cl− during a period with primary Chesapeake Bay emissions. Aerosol pH calculated by NH3 partitioning and ISORROPIA show different behaviors, suggesting the aerosol distribution was externally mixed during this time.
Composition and concentration differences between HMI and the urban and rural sites are analyzed in more detail in the companion paper (Balasus et al., 2021). In the companion paper, episodic NH3 events that derived from dairy, poultry, and industrial sources were characterized (Balasus et al., 2021). For the events with complete aerosol composition and meteorology data (8 out of 11 NH3 events in total), mean and median aerosol pH (2.00 and 1.96, respectively) were only moderately higher than the study mean and median pH values (1.85 and 1.83, respectively); this difference is not statistically significant at the 95 % confidence level. This includes an aerosol pH of 1.92 at the peak NH3 concentration observed during the entire study (19.3 µg m−3), an event influenced by industrial emissions near downtown Baltimore (Balasus et al., 2021). Together, the results suggest that pH may be more affected by the proximity of the HMI site to the Chesapeake Bay than it was to regional agricultural NH3 emissions or to episodic NH3 events from local industrial sources.
3.3 Case study: effect of NVCs on pH
NVCs affect thermodynamic predictions of NH3 partitioning and, thus, pH (Guo et al., 2018; Vasilakos et al., 2018). Seawater is alkaline, and primary marine emissions contain high concentrations of NVCs (O'Dowd and De Leeuw, 2007). Marine aerosols rapidly acidify, typically in seconds or minutes, though the timescale depends upon particle size (Angle et al., 2021; Pszenny et al., 2004). Studies have examined the acidity of sea spray aerosols and their evolution, but none, to the best of our knowledge, have done so in a polluted urban environment. The OWLETS-2 study offered a unique opportunity to analyze the pH of primary marine particles emitted within several kilometers of a large urban area. The Chesapeake Bay is brackish, with increasing salinity moving down the bay towards the Atlantic Ocean (Pritchard, 1952). Near the OWLETS-2 measurement site at HMI, salinity is variable, but average conditions are ∼ 5 g kg−1 (https://www.chesapeakebay.net, last accessed 20 November 2020). This is about a factor of 7 lower than typical seawater but shows the potential for primary emissions to contribute salts that could impact aerosol pH at HMI.

Figure 7Correlation between PM2.5 Na+ and Cl− during the event shown in Fig. 6. Lower ratios were observed at higher concentrations, suggesting HNO3 uptake displaced HCl.
Elevated concentrations of Na+ and Cl− in PM2.5 were infrequently observed during OWLETS-2, with one notable 36 h period showing evidence of primary marine impact. Na+ and Cl− were well correlated (R2 = 0.78) from 11 to 13 June, a period that coincided with the highest concentrations of both species (Figs. 6 and 7). It is noteworthy that wind speeds were not elevated during this time (average winds = 3.1 m s−1 compared to campaign-average wind speeds of 2.9 m s−1); longer term measurements would be needed to characterize factors driving the primary bay emissions. During this event, the pH calculation using NH3 partitioning suggests that the primary marine emissions had a minimal effect on aerosol pH. The average pH during this period was 1.98, which was only slightly higher than the average for the entire study (1.85). Further, as the total Na+ + Cl− concentration increased by more than an order of magnitude, from 0.05 µg m−3 around 18:00 LT on 11 June to 0.9 µg m−3 at 09:00 LT on 12 June, the pH only increased by 0.1 pH unit during the same period (Fig. 6). Gas-phase NH3 data were not available for the entire NaCl event, so pH calculations were limited to the first ∼ 20 h.
The pH predictions from ISORROPIA during this period display a more significant effect on aerosol pH. The average pH predicted by ISORROPIA is 3.08, which is 0.7 pH units higher than the study average from ISORROPIA. Further, while the pH calculated using NH3 partitioning is insensitive to Na+ and Cl−, ISORROPIA predicts a rise of 1.4 pH units as Na+ and Cl− increase (Fig. 6). The NH3 partitioning predicted by ISORROPIA deviates from the observations during this event (r = −0.19, Fig. S6 in the Supplement). The most likely explanation for this behavior is different chemical compositions of the coarse- and fine-mode particles. Fresh marine emissions acidify quickly, and evidence was found for chemical processing of NaCl. HNO3 displacement of HCl is a well-known phenomenon in sea salt particles (Brimblecombe and Clegg, 1988). ratios slightly above unity were observed when aerosol nitrate concentrations were low and below unity when nitrate concentrations were elevated (Fig. 7). Nitrate formation, including HNO3 uptake to sea salt, is highly sensitive to pH (Kakavas et al., 2021; Vasilakos et al., 2018). Nitrate (along with Na+ and Cl−) is a direct input to ISORROPIA, suggesting that the pH trend in Fig. 6 is due to the increased influence of coarse-mode particles. The PILS inlet was equipped with a 2.5 µm cut-point cyclone (URG-2000-30-EH, URG Corp.), which allows for some penetration of particles with dp < 4.5 µm (http://www.urgcorp.com/products/inlets/teflon-coated-aluminum-cyclones/urg-2000-30eh, last accessed 29 January 2021). Likewise, primary sea salt emissions often exhibit a size distribution tail that extends below 2.5 µm (Feng et al., 2017).
The above analysis identifies limitations computing aerosol pH with both approaches and highlights opportunities to use complementary information from each to inform factors driving aerosol pH. ISORROPIA's assumption of an internally mixed aerosol distribution cannot be applied to predict pH in this system (Fountoukis and Nenes, 2007). However, it does provide insight into the likely presence of coarse-mode particles with pH significantly higher than the fine mode. Conversely, Na+, Cl−, and are not direct inputs into the pH calculation using NH3 partitioning, though they are used to compute aerosol liquid water, which is an input in the pH calculation. These NVCs have been shown to have sometimes significant effects on the ratios of ammonium-to-sulfate, which could lead to inconsistencies in the calculation of aerosol pH when considered in the ALWC calculation only (Guo et al. 2015). resides predominantly in the fine mode (Seinfeld and Pandis, 2016), so the partitioning approach is unlikely to capture the acidity of the coarse-mode or fine-mode particles in the tail of the distribution of primary emissions that may be externally mixed with secondary particles, such as dust or sea salt. This may lead to underestimates of NVC effects on aerosol pH using the partitioning approach. The combined information from both methods suggests that aerosols sampled at HMI during the NaCl event were characterized by a strong size-dependent pH gradient, with fine-mode particles more acidic (pH ∼ 2) than the coarse mode (pH up to 4.5). Estimates of pH derived from size-segregated aerosol composition measurements have observed the same phenomenon (Angle et al., 2021; Fang et al., 2017; Kakavas et al., 2021; Keene et al., 2002).
There is growing recognition of the importance of aerosol pH affecting atmospheric processes relevant to public health and ecosystems (Fang et al., 2017; Nenes et al., 2021). Observations of spatial and temporal variations in pH are needed so that the factors that control pH and contribute to variability in different environments can be fully understood. This study is unique as it represents the first characterization of aerosol pH at a land–water transition site near a large urban area. Baltimore, MD, is impacted by regional agricultural emissions and by industrial point-source emissions of NH3. The companion paper examines the sources of episodic NH3 events and the associated effects on aerosol composition (Balasus et al., 2021). Although average and peak NH3 concentrations during this study were significantly higher than a nearby inland site, the effects on aerosol pH appear relatively insignificant, as pH during the peak events was only ∼ 0.1 pH unit higher than non-event periods. This finding is consistent with studies at other locations that show aerosol pH is often insensitive to Tot-NH3 and to the aerosol NH4:SO4 ratio (Weber et al., 2016; Zheng et al., 2020; Tao and Murphy, 2019).
The unique characteristics of the OWLETS-2 study and measurement locations also offered insight into the composition and meteorological influences on aerosol pH. In the companion paper, the composition effects were shown to be muted in comparison to the meteorological effects (Balasus et al., 2021). It was shown that the unique diurnal profiles, particularly in ALWC (which did not correlate with RH) and (which did not correlate with T), resulted in meteorological factors, notably temperature, having the most important influence on aerosol pH. Across the full temperature range of the study, the observed pH sensitivity to temperature was −0.047 K−1, with increases in sensitivity up to −0.085 K−1 when the temperature was > 293 K. The sensitivity of aerosol pH shown here is in good agreement with previous studies in the Baltimore region and beyond, e.g., Toronto (Tao and Murphy, 2019; Battaglia et al. 2017). Conversely, aerosol pH was not strongly affected by ALWC during the OWLETS-2 study, except when ALWC was below 1 µg m−3, in contrast to the results of Zheng et al. (2020). The results of Zheng et al. (2020) identifying ALWC as the most important factor driving aerosol pH variability were derived from the results of studies in multiple locations, including bulk aqueous solutions. However, this analysis suggests that the factors that drive aerosol pH variability may exhibit important site-to-site differences that must be considered before generalizations are applied.
A case study of the NVC effect on aerosol pH had significantly different outcomes depending on the method for calculating pH. ISORROPIA predicted a pH increase of ∼ 1.4 pH units during an event with primary aerosol emissions from the Chesapeake Bay, while the pH calculation using NH3 partitioning predicted a much less significant effect (∼ 0.1 pH unit). This difference is attributed to the likely presence of externally mixed particles during the events, which may include primary marine emissions elevated in NVCs. Bougiatioti et al. (2016) evaluated aerosol pH at a remote site in the Mediterranean, where samples with a marine origin demonstrated vastly different pH between fine- (average pH = 0.4) and coarse-mode (average pH = 7.3) particles. Similarly, Keene et al. (2002) demonstrated the effect of marine aerosol size distribution on aerosol pH, with fine-mode particles predicted to reside in the range of 1–2 and with supermicron particles to reside in the range of 3–4, consistent with the current results. Hence, a limitation of this study is the lack of size-resolved aerosol composition measurements. This study underscores the need to evaluate assumptions of internally mixed aerosols when applying pH calculations, which may be a critical factor in overestimating the effects of NVCs on pH. Models with size-resolved aerosol composition may be required to capture this effect across scales in future studies (Kakavas et al., 2021).
Data are available at https://www-air.larc.nasa.gov/cgi-bin/ArcView/owlets.2018 (NASA, 2021).
The supplement related to this article is available online at: https://doi.org/10.5194/acp-21-18271-2021-supplement.
CJH, AGC, and RD conceived the analysis and study participation. MABJ, NB, and KB collected and analyzed the PILS-IC and NH3 data. NB, MABJ, and CH conducted the thermodynamic modeling analyses. VC and AC provided analytical input and interpretation. NB, CJH, KB, and MABJ wrote the manuscript. All authors provided feedback and revisions to the manuscript.
The contact author has declared that neither they nor their co-authors have any competing interests.
Publisher's note: Copernicus Publications remains neutral with regard to jurisdictional claims in published maps and institutional affiliations.
Annmarie G. Carlton and Christopher J. Hennigan were supported by funding from the National Science Foundation (grant nos. AGS-1719252 and AGS-1719245). Ruben Delgado and Vanessa Caicedo were supported by the Maryland Department of the Environment (contract no. U00P8400651). Nicholas Balasus and Katherine Ball received support through the NOAA Office of Education, Educational Partnership Program with Minority Serving Institutions (EPP/MSI) and the Cooperative Science Center for Earth System Sciences and Remote Sensing Technologies (grant no. NA16SEC4810008).
This paper was edited by Thorsten Bartels-Rausch and reviewed by two anonymous referees.
Angle, K. J., Crocker, D. R., Simpson, R. M. C., Mayer, K. J., Garofalo, L. A., Moore, A. N., Garcia, S. L. M., Or, V. W., Srinivasan, S., Farhan, M., Sauer, J. S., Lee, C., Pothier, M. A., Farmer, D. K., Martz, T. R., Bertram, T. H., Cappa, C. D., Prather, K. A., and Grassian, V. H.: Acidity across the interface from the ocean surface to sea spray aerosol, P. Natl. Acad. Sci. USA, 118, e2018397118, https://doi.org/10.1073/pnas.2018397118, 2021.
Balasus, N., Battaglia Jr., M. A., Ball, K., Caicedo, V., Delgado, R., Carlton, A. G., and Hennigan, C. J.: Urban aerosol chemistry at a land–water transition site during summer – Part 1: Impact of agricultural and industrial ammonia emissions, Atmos. Chem. Phys., 21, 13051–13065, https://doi.org/10.5194/acp-21-13051-2021, 2021.
Battaglia Jr., M. A., Douglas, S., and Hennigan, C. J.: Effect of the Urban Heat Island on Aerosol pH, Environ. Sci. Technol., 51, 13095–13103, https://doi.org/10.1021/acs.est.7b02786, 2017.
Battaglia Jr., M. A., Weber, R. J., Nenes, A., and Hennigan, C. J.: Effects of water-soluble organic carbon on aerosol pH, Atmos. Chem. Phys., 19, 14607–14620, https://doi.org/10.5194/acp-19-14607-2019, 2019.
Bougiatioti, A., Nikolaou, P., Stavroulas, I., Kouvarakis, G., Weber, R., Nenes, A., Kanakidou, M., and Mihalopoulos, N.: Particle water and pH in the eastern Mediterranean: source variability and implications for nutrient availability, Atmos. Chem. Phys., 16, 4579–4591, https://doi.org/10.5194/acp-16-4579-2016, 2016.
Boyer, H. C., Gorkowski, K., and Sullivan, R. C.: In Situ pH Measurements of Individual Levitated Microdroplets Using Aerosol Optical Tweezers, Anal. Chem., 92, 1089–1096, https://doi.org/10.1021/acs.analchem.9b04152, 2020.
Brimblecombe, P., and Clegg, S. L.: The Solubility and Behavior of Acid Gases in the Marine Aerosol, J. Atmos. Chem., 7, 1–18, https://doi.org/10.1007/bf00048251, 1988.
Carlton, A. M. G., Pye, H. O. T., Baker, K. R., and Hennigan, C. J.: Additional benefits of federal air quality rules: model estimates of controllable biogenic secondary organic aerosol, Environ. Sci. Technol., 52, 9254–9265, https://doi.org/10.1021/acs.est.8b01869, 2018.
Craig, R. L., Peterson, P. K., Nandy, L., Lei, Z., Hossain, M. A., Camarena, S., Dodson, R. A., Cook, R. D., Dutcher, C. S., and Ault, A. P.: Direct Determination of Aerosol pH: Size-Resolved Measurements of Submicrometer and Supermicrometer Aqueous Particles, Anal. Chem., 90, 11232–11239, https://doi.org/10.1021/acs.analchem.8b00586, 2018.
El-Sayed, M. M. H., Amenumey, D., and Hennigan, C. J.: Drying-Induced Evaporation of Secondary Organic Aerosol during Summer, Environ. Sci. Technol., 50, 3626–3633, https://doi.org/10.1021/acs.est.5b06002, 2016.
Fang, T., Guo, H. Y., Zeng, L. H., Verma, V., Nenes, A., and Weber, R. J.: Highly Acidic Ambient Particles, Soluble Metals, and Oxidative Potential: A Link between Sulfate and Aerosol Toxicity, Environ. Sci. Technol., 51, 2611–2620, https://doi.org/10.1021/acs.est.6b06151, 2017.
Feng, L., Shen, H., Zhu, Y., Gao, H., and Yao, X.: Insight into Generation and Evolution of Sea-Salt Aerosols from Field Measurements in Diversified Marine and Coastal Atmospheres, Sci. Rep., 7, 41260, https://doi.org/10.1038/srep41260, 2017.
Fountoukis, C. and Nenes, A.: ISORROPIA II: a computationally efficient thermodynamic equilibrium model for K+-Ca2+-Mg2+--Na+---Cl−-H2O aerosols, Atmos. Chem. Phys., 7, 4639–4659, https://doi.org/10.5194/acp-7-4639-2007, 2007.
Guo, H., Xu, L., Bougiatioti, A., Cerully, K. M., Capps, S. L., Hite Jr., J. R., Carlton, A. G., Lee, S.-H., Bergin, M. H., Ng, N. L., Nenes, A., and Weber, R. J.: Fine-particle water and pH in the southeastern United States, Atmos. Chem. Phys., 15, 5211–5228, https://doi.org/10.5194/acp-15-5211-2015, 2015.
Guo, H., Liu, J., Froyd, K. D., Roberts, J. M., Veres, P. R., Hayes, P. L., Jimenez, J. L., Nenes, A., and Weber, R. J.: Fine particle pH and gas–particle phase partitioning of inorganic species in Pasadena, California, during the 2010 CalNex campaign, Atmos. Chem. Phys., 17, 5703–5719, https://doi.org/10.5194/acp-17-5703-2017, 2017.
Guo, H., Nenes, A., and Weber, R. J.: The underappreciated role of nonvolatile cations in aerosol ammonium-sulfate molar ratios, Atmos. Chem. Phys., 18, 17307–17323, https://doi.org/10.5194/acp-18-17307-2018, 2018.
He, H., Stehr, J. W., Hains, J. C., Krask, D. J., Doddridge, B. G., Vinnikov, K. Y., Canty, T. P., Hosley, K. M., Salawitch, R. J., Worden, H. M., and Dickerson, R. R.: Trends in emissions and concentrations of air pollutants in the lower troposphere in the Baltimore/Washington airshed from 1997 to 2011, Atmos. Chem. Phys., 13, 7859–7874, https://doi.org/10.5194/acp-13-7859-2013, 2013.
Hennigan, C. J., Izumi, J., Sullivan, A. P., Weber, R. J., and Nenes, A.: A critical evaluation of proxy methods used to estimate the acidity of atmospheric particles, Atmos. Chem. Phys., 15, 2775–2790, https://doi.org/10.5194/acp-15-2775-2015, 2015.
Jang, M., Sun, S., Winslow, R., Han, S., and Yu, Z.: In situ aerosol acidity measurements using a UV–Visible micro-spectrometer and its application to the ambient air, Aerosol Sci. Tech., 54, 446–461, https://doi.org/10.1080/02786826.2020.1711510, 2020.
Kakavas, S., Patoulias, D., Zakoura, M., Nenes, A., and Pandis, S. N.: Size-resolved aerosol pH over Europe during summer, Atmos. Chem. Phys., 21, 799–811, https://doi.org/10.5194/acp-21-799-2021, 2021.
Kanakidou, M., Myriokefalitakis, S., Daskalakis, N., Fanourgakis, G., Nenes, A., Baker, A. R., Tsigaridis, K., and Mihalopoulos, N.: Past, Present, and Future Atmospheric Nitrogen Deposition, J. Atmos. Sci., 73, 2039–2047, https://doi.org/10.1175/jas-d-15-0278.1, 2016.
Keene, W. C., Pszenny, A. A. P., Maben, J. R., and Sander, R.: Variation of marine aerosol acidity with particle size, Geophys. Res. Lett., 29, 1101, https://doi.org/10.1029/2001gl013881, 2002.
Keene, W. C., Pszenny, A. A. P., Maben, J. R., Stevenson, E., and Wall, A.: Closure evaluation of size-resolved aerosol pH in the New England coastal atmosphere during summer, J. Geophys. Res.-Atmos., 109, D23307, https://doi.org/10.1029/2004jd004801, 2004.
Loughner, C. P., Tzortziou, M., Follette-Cook, M., Pickering, K. E., Goldberg, D., Satam, C., Weinheimer, A., Crawford, J. H., Knapp, D. J., Montzka, D. D., Diskin, G. S., and Dickerson, R. R.: Impact of Bay-Breeze Circulations on Surface Air Quality and Boundary Layer Export, J. Appl. Meteorol. Clim., 53, 1697–1713, https://doi.org/10.1175/jamc-d-13-0323.1, 2014.
Loughner, C. P., Tzortziou, M., Shroder, S., and Pickering, K. E.: Enhanced dry deposition of nitrogen pollution near coastlines: A case study covering the Chesapeake Bay estuary and Atlantic Ocean coastline, J. Geophys. Res.-Atmos., 121, 14221–14238, https://doi.org/10.1002/2016jd025571, 2016.
Murphy, J. G., Gregoire, P., Tevlin, A., Wentworth, G., Ellis, R., Markovic, M., and VandenBoer, T.: Observational constraints on particle acidity using measurements and modelling of particles and gases, Faraday Discuss., 200, 379–395, https://doi.org/10.1039/C7FD00086C, 2017.
NASA: Airborne Science Data for Atmospheric Composition, available at: https://www-air.larc.nasa.gov/cgi-bin/ArcView/owlets.2018, last access: 14 December 2021.
Nenes, A., Pandis, S. N., Weber, R. J., and Russell, A.: Aerosol pH and liquid water content determine when particulate matter is sensitive to ammonia and nitrate availability, Atmos. Chem. Phys., 20, 3249–3258, https://doi.org/10.5194/acp-20-3249-2020, 2020.
Nenes, A., Pandis, S. N., Kanakidou, M., Russell, A. G., Song, S., Vasilakos, P., and Weber, R. J.: Aerosol acidity and liquid water content regulate the dry deposition of inorganic reactive nitrogen, Atmos. Chem. Phys., 21, 6023–6033, https://doi.org/10.5194/acp-21-6023-2021, 2021.
Norman, M., Spirig, C., Wolff, V., Trebs, I., Flechard, C., Wisthaler, A., Schnitzhofer, R., Hansel, A., and Neftel, A.: Intercomparison of ammonia measurement techniques at an intensively managed grassland site (Oensingen, Switzerland), Atmos. Chem. Phys., 9, 2635–2645, https://doi.org/10.5194/acp-9-2635-2009, 2009.
O'Dowd, C. D., and De Leeuw, G.: Marine aerosol production: a review of the current knowledge, Philos. T. R. Soc. A, 365, 1753–1774, https://doi.org/10.1098/rsta.2007.2043, 2007.
Phillips, S. M., Bellcross, A. D., and Smith, G. D.: Light Absorption by Brown Carbon in the Southeastern United States is pH-dependent, Environ. Sci. Technol., 51, 6782–6790, https://doi.org/10.1021/acs.est.7b01116, 2017.
Pinder, R. W., Adams, P. J., Pandis, S. N., and Gilliland, A. B.: Temporally resolved ammonia emission inventories: Current estimates, evaluation tools, and measurement needs, J. Geophys. Res.-Atmos., 111, D16310, https://doi.org/10.1029/2005jd006603, 2006.
Pritchard, D. W.: Salinity Distribution and Circulation in the Chesapeake Bay Estuarine System, J. Mar. Res., 11, 106–123, 1952.
Pszenny, A. A. P., Moldanová, J., Keene, W. C., Sander, R., Maben, J. R., Martinez, M., Crutzen, P. J., Perner, D., and Prinn, R. G.: Halogen cycling and aerosol pH in the Hawaiian marine boundary layer, Atmos. Chem. Phys., 4, 147–168, https://doi.org/10.5194/acp-4-147-2004, 2004.
Pye, H. O. T., Zuend, A., Fry, J. L., Isaacman-VanWertz, G., Capps, S. L., Appel, K. W., Foroutan, H., Xu, L., Ng, N. L., and Goldstein, A. H.: Coupling of organic and inorganic aerosol systems and the effect on gas–particle partitioning in the southeastern US, Atmos. Chem. Phys., 18, 357–370, https://doi.org/10.5194/acp-18-357-2018, 2018.
Pye, H. O. T., Nenes, A., Alexander, B., Ault, A. P., Barth, M. C., Clegg, S. L., Collett Jr., J. L., Fahey, K. M., Hennigan, C. J., Herrmann, H., Kanakidou, M., Kelly, J. T., Ku, I.-T., McNeill, V. F., Riemer, N., Schaefer, T., Shi, G., Tilgner, A., Walker, J. T., Wang, T., Weber, R., Xing, J., Zaveri, R. A., and Zuend, A.: The acidity of atmospheric particles and clouds, Atmos. Chem. Phys., 20, 4809–4888, https://doi.org/10.5194/acp-20-4809-2020, 2020.
Rindelaub, J. D., Craig, R. L., Nandy, L., Bondy, A. L., Dutcher, C. S., Shepson, P. B., and Ault, A. P.: Direct Measurement of pH in Individual Particles via Raman Microspectroscopy and Variation in Acidity with Relative Humidity, J. Phys. Chem. A, 120, 911–917, https://doi.org/10.1021/acs.jpca.5b12699, 2016.
Seinfeld, J. H., and Pandis, S. N.: Atmospheric chemistry and physics: from air pollution to climate change, 3rd Edn., John Wiley and Sons, Hoboken, NJ, 2016.
Tao, Y.: Identification of Major Factors Influencing Aerosol pH and the Quantitative Relationship between pH and Ammonia Gas/Particle Partitioning, PhD Thesis, University of Toronto, Toronto, available at: https://hdl.handle.net/1807/103788 (last access: 30 April 2021), 2020.
Tao, Y. and Murphy, J. G.: The sensitivity of PM2.5 acidity to meteorological parameters and chemical composition changes: 10-year records from six Canadian monitoring sites, Atmos. Chem. Phys., 19, 9309–9320, https://doi.org/10.5194/acp-19-9309-2019, 2019.
Valerino, M. J., Johnson, J. J., Izumi, J., Orozco, D., Hoff, R. M., Delgado, R., and Hennigan, C. J.: Sources and composition of PM2.5 in the Colorado Front Range during the DISCOVER-AQ study, J. Geophys. Res.-Atmos., 122, 566–582, https://doi.org/10.1002/2016jd025830, 2017.
Vasilakos, P., Russell, A., Weber, R., and Nenes, A.: Understanding nitrate formation in a world with less sulfate, Atmos. Chem. Phys., 18, 12765–12775, https://doi.org/10.5194/acp-18-12765-2018, 2018.
Weber, R. J., Guo, H., Russell, A. G., and Nenes, A.: High aerosol acidity despite declining atmospheric sulfate concentrations over the past 15 years, Nat. Geosci., 9, 282–285, https://doi.org/10.1038/ngeo2665, 2016.
Zheng, G., Su, H., Wang, S., Andreae, M. O., Pöschl, U., and Cheng, Y.: Multiphase buffer theory explains contrasts in atmospheric aerosol acidity, Science, 369, 1374, https://doi.org/10.1126/science.aba3719, 2020.