the Creative Commons Attribution 4.0 License.
the Creative Commons Attribution 4.0 License.
 | 15 Dec 2021
First insights into northern Africa high-altitude background aerosol chemical composition and source influences
Nabil Deabji
Khanneh Wadinga Fomba
Souad El Hajjaji
Abdelwahid Mellouki
Laurent Poulain
Sebastian Zeppenfeld
Field measurements were conducted to determine aerosol chemical composition at a newly established remote high-altitude site in North Africa at the Atlas Mohammed V (AMV) atmospheric observatory located in the Middle Atlas Mountains. The main objectives of the present work are to investigate the variations in the aerosol composition and better assess global and regional changes in atmospheric composition in North Africa. A total of 200 particulate matter (PM10) filter samples were collected at the site using a high-volume (HV) collector in a 12 h sampling interval from August to December 2017. The chemical composition of the samples was analyzed for trace metals, water-soluble ions, organic carbon (), aliphatic hydrocarbons, and polycyclic aromatic hydrocarbon (PAH) contents.
The results indicate that high-altitude aerosol composition is influenced by both regional and transregional transport of emissions. However, local sources play an important role, especially during low wind speed periods, as observed for November and December. During background conditions characterized by low wind speeds (avg. 3 m s−1) and mass concentrations in the range from 9.8 to 12 µg m−3, the chemical composition is found to be dominated by inorganic elements, mainly suspended dust (61 %) and ionic species (7 %), followed by organic matter (7 %), water content (12 %), and unidentified mass (11 %). Despite the proximity of the site to the Sahara, its influence on the atmospheric composition at this high-altitude site was mainly seasonal and accounted for only 22 % of the sampling duration. Biogenic organics contributed up to 7 % of the organic matter with high contributions from compounds such as heneicosane, hentriacontane, and nonacosane. The AMV site is dominated by four main air mass inflows, which often leads to different aerosol chemical compositions. Mineral dust influence was seasonal and ranged between 21 % and 74 % of the PM mass, with peaks observed during the summer, and was accompanied by high concentrations of SO of up to 3.0 µg m−3. During winter, PM10 concentrations are low (<30 µg m−3), the influence of the desert is weaker, and the marine air masses (64 %) are more dominant with a mixture of sea salt and polluted aerosol from the coastal regions (Rabat and Casablanca). During the daytime, mineral dust contribution to PM increased by about 42 % because of road dust resuspension. In contrast, during nighttime, an increase in the concentrations of alkanes, PAHs, alkane-2-ones, and anthropogenic metals such as Pb, Ni, and Cu was found due to variations in the boundary layer height. The results provide the first detailed seasonal and diurnal variation of the aerosol chemical composition, which is valuable for long-term assessment of climate and regional influence of air pollution in North Africa.
- Article
(10569 KB) - Full-text XML
-
Supplement
(1488 KB) - BibTeX
- EndNote


Aerosols are important constituents of the atmosphere due to their role in controlling climate processes and their impact on air quality, the environment, and ecosystems. They can have adverse effects on human health and have been associated with respiratory disorders, strokes, and pulmonary and cardiovascular diseases (Du et al., 2016; Pope et al., 2018; Song et al., 2014). Aerosol particles can serve as cloud condensation nuclei and as substrates for heterogeneous reactions (Leng et al., 2014). Their chemical composition affects aerosol–cloud interaction and may exert a warming or a cooling influence on the atmosphere due to direct and radiative forcing (King et al., 2003; Satheesh and Krishna Moorthy, 2005). Therefore, the study of aerosol chemical proprieties is essential for a better understanding of atmospheric processes.
Atmospheric aerosol particle composition depends on local and regional emission sources as well as transboundary pollution. The particles are emitted directly into the atmosphere from natural sources such as sea salt or mineral dust and anthropogenic activities such as industrial or traffic emissions, constituting primary emissions. They can also be formed in the atmosphere through gas-to-particle conversion or particle-phase reactions, constituting secondary aerosols (Carter et al., 2005). After emission, these particles are exposed to changing humidity, temperature, pressure, and solar radiation in the atmosphere that alters their properties through different aging and oxidative processes during atmospheric transport. Consequently, high-altitude sites provide the required infrastructure for investigating and characterizing the possible atmospheric aerosol interactions associated with the particles.
High-altitude sites in remote regions are less affected by direct local anthropogenic emissions. Their high altitude allows the study of aerosol particles in the free atmosphere and provides a good impression of aerosol background concentrations. The topography, meteorological conditions, and changing boundary layer heights provide various pathways for aerosol interactions, which could influence inversion processes and enhance biogenic particle formation. Such sites are hence unique for monitoring the temporal variation in the aerosol chemical compositions over longer periods and provide a better understanding of various factors, such as meteorology, climate, and environmental changes that may in the long term affect the local and regional air composition (Okamoto and Tanimoto, 2016).
There is increasing interest in atmospheric aerosol studies at high-altitude sites. Studies have investigated the aerosol chemical composition in mountainous regions, highlighting the influence of mountain valleys, nighttime mountain breeze, and topography in dispersing polluted air masses to the free troposphere (Zhang et al., 2009; Alastuey et al., 2005; Buchunde et al., 2019; Leena et al., 2017; Glasius et al., 2018; Lugauer et al., 1998; Mukherjee et al., 2020). Furthermore, other studies at the northeastern Himalayas, India (Chatterjee et al., 2010), the Bachelor Observatory Mountain in Oregon, USA (Ambrose et al., 2011), and a mountain site at Lulang on the southeastern Tibetan Plateau, China (Zhao et al., 2013), have reported the importance of the aerosol chemical composition at mountain sites in the identification of potential source regions of anthropogenic pollutants and their mechanism of transport. Some observations and models have elaborated the emissions of some trace gases such as CO and O3 from the boundary layer into the free troposphere by convective, frontal, and orographic lifting at mountain sites (Bey et al., 2001; Ding et al., 2015; Liang et al., 2004; Weiss-Penzias et al., 2006). Nevertheless, the effects of these mechanisms have rarely been studied at the aerosol chemical composition scale. Despite the increasing interest in high-altitude aerosol research, most studies have reported measurements of tracer gases over long-term periods, but limited studies have addressed the interaction between natural emissions such as mineral dust, biogenic compounds, and anthropogenic emissions in the free troposphere (Fiore et al., 2009; Jonson et al., 2010; Logan et al., 2012; Gilge et al., 2010; Kumar et al., 2013).
Moreover, such studies have been reported mostly in central Europe, Asia, and North America (Okamoto and Tanimoto, 2016). A few attempts in Africa have been made to investigate the microphysical and optical properties of mineral dust transport in North Africa (Kandler et al., 2009; Müller et al., 2012; Ryder et al., 2018; Schladitz et al., 2009; Veselovskii et al., 2016). Other studies have focused on polluted regions (Benchrif et al., 2018; Inchaouh, 2017; Tahri et al., 2013) such that information about the chemical composition of particulate matter at high altitudes is limited. Likewise, background aerosol information, which is essential in assessing long-term regional changes in atmospheric composition in this region, remains scarce and difficult to assess due to lack of the necessary infrastructure. This poor state of knowledge limits transregional investigation of the effect of different sources and source regions on the chemical composition of aerosol particles over sensitive regions such as the Atlas Mountains in North Africa.
The Middle Atlas region located in the north of Morocco is typically considered an area with high rainfall. Still, according to a report from the Moroccan Ministry of Environment, the annual average rainfall decreased by about 100 mm, with an increase in temperature by about 1.5 ∘C (Royaume du Maroc, 2009), within the past 50 years. These are indicators of the sensitive nature of the Middle Atlas region to a changing climate. The Ifrane national park, which is located in the Middle Atlas, suffers from intense pressure due to forest degradation and overgrazing, resulting in significant climatic consequences (Campbell et al., 2017). At the same time, it is classified as a site of biological and ecological interest. Recently, soil erosion was particularly intense in some clay-dominated valleys (Mounir et al., 2019). This change can lead to several consequences such as an increase in aridity, reduction of precipitation, and changes in primary emissions and atmospheric composition. Thus, the observations from this region could provide new knowledge of atmospheric composition changes over time, related to different climatic and anthropogenic dynamics. The evaluation of local, regional, transregional, and climate change effects can help to assess air quality and climate-relevant mitigation strategies.
The aim of this study was therefore to (i) quantify and characterize the variability of PM10 mass concentration in the high altitudes of the Middle Atlas region, (ii) determine their chemical composition, (iii) identify the possible sources of the aerosol particles, and (iv) evaluate the relative contributions of the source regions to the observed concentrations. Within the present study, chemical composition at the high-altitude AMV observatory is presented. Chemical components such as trace metals, OC, EC, ionic, and organic species were investigated, and meteorological and back-trajectory analysis was performed. Moreover, the influence of dust on the chemical composition and the day and night variation of the PM10 concentration was investigated.
2.1 Site description and particle sampling
The Atlas Mohammed V (AMV) atmospheric research station, situated in a strategic location in the Middle Atlas, was founded in 2017. It is operated by the Centre National de la Recherche Scientifique (CNRS-ICARE; Orléans, France), the Mohammed V University (Rabat, Morocco), and the Leibniz Institute for Tropospheric Research (TROPOS; Leipzig, Germany). The observatory is located at Michlifen in the Middle Atlas region at an altitude of 2100 m a.s.l in a remote hilly site (33∘24′22.2′′ N, 5∘06′12.0′′ W). On one side are the plains and plateaus of central Atlantic Morocco, and on the other side are the arid areas. It is about 300 km north of the Sahara, about 230 km east of the Atlantic Ocean and the populated and industrial regions of Casablanca and Rabat, and about 340 km south of the Mediterranean Sea. The orientation of the Middle Atlas Mountains diagonally extends from southwest to northeast over a distance of 450 km. The AMV station is surrounded by cedar forests and pastureland that come to life in spring and summer, which is a sharp contrast to the hot, dry climate surrounding it. The nearest urban towns are Ifrane and Azrou, which are about 22 km away, and Fes city is located 82 km north of the AMV station. Due to its remote location, the influence of anthropogenic emissions from the Ifrane area is low.
Aerosol particles were sampled using a PM10 high-volume Digitel (DHA-80, Switzerland) with a flow rate of 500 L min−1 on quartz-fiber filters (Munktell, MK 360). The collection period was from August to December 2017, during which 200 filters were collected in a day and nighttime (12 h) sampling routine. At the end of the sampling, the collected filters were placed in a refrigerator at a temperature of 5 ∘C and subsequently frozen at −20 ∘C. After storage, the filters were transported at −20 ∘C to TROPOS (Leipzig, Germany) in aluminum cans for chemical analysis. In September due to power failure and instrument outage fewer samples were collected (n=20). Due to the lower number of samples, the missing days of sampling were replaced by the average concentration of the collected samples in September.
2.2 Local meteorology and station characteristics
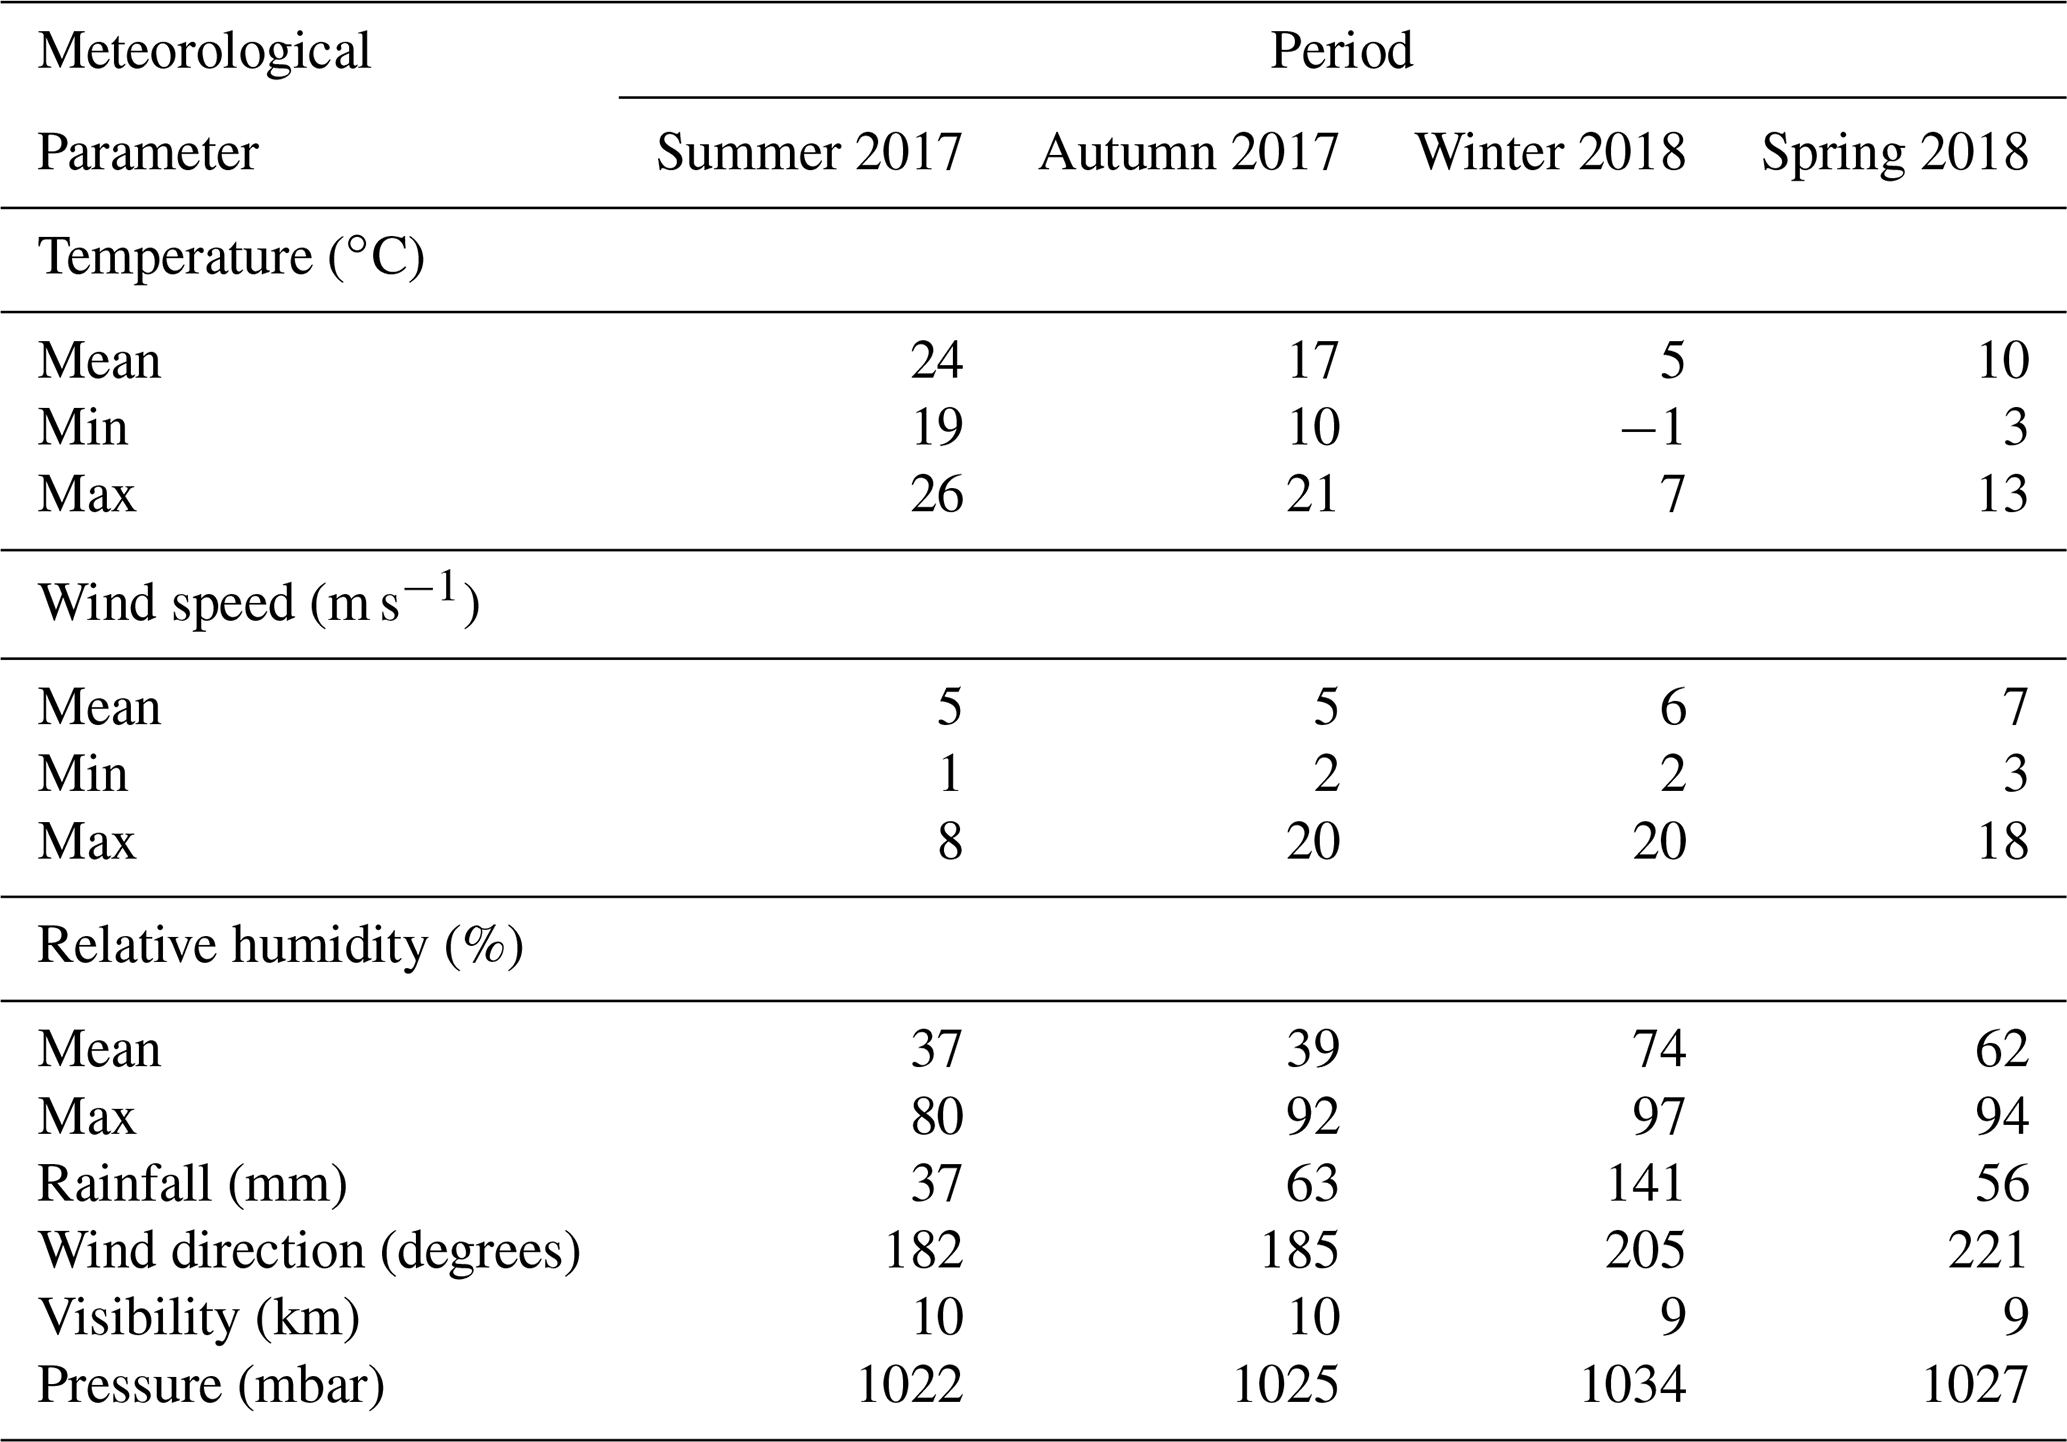
Meteorological data were collected from summer 2017 to spring 2018 for major parameters such as temperature, relative humidity, wind speed and direction, atmospheric pressure, visibility, and precipitation at a sampling rate of 1 min using an automated weather station (Bresser AWS, Germany). As shown in Table 1, in summer, temperatures are moderate or warm during the day and cool at night. Winter is much colder, and the daily temperature amplitudes are lower because the valleys only receive the sun's rays in the middle of the day. In winter, the station remains entirely in the shade for several weeks. Thermal contrasts between slopes are important when the topographic terrain is oriented east–west. Thermal breezes are common during high-pressure weather in the valleys. The temperature varies seasonally, especially during the transition from summer to winter, with maximum and minimum values of 26 and −1 ∘C, respectively. The annual average temperature is approximately 14 ∘C, with a sharp decrease during the night.
Table 1Meteorological parameters over the Middle Atlas from summer 2017 to spring 2018.
In contrast, the visibility varies slightly, with intense UV radiation during summer when the sky is often clear. Fog occurrence is high during autumn and winter. The wind comes from all directions, but it is dominated by air mass from the west, as shown in Fig. 2. The average wind speed at AMV was about 5.8 m s−1 but reached a maximum of 19.7 m s−1 due to turbulence in the mountain region, especially during winter. Over the summer, the minimum wind speed was about 1.6 m s−1, and the relative humidity (RH) was low. In autumn, RH was on average about 36 % and reached up to 97 % under the influence of marine air mass in winter. The Middle Atlas region is considered to be a very humid and temperate climate. Indeed, the water balance required for plants is mainly positive in winter at about 141 mm, while annual precipitation is 300 mm. Rainfall occurs mainly during winter, with heavy thunderstorms and a lot of snow coverage. The northern part of the Middle Atlas Mountains is the wettest region in Morocco after the Rif mountain regions, according to Nourelbait et al. (2016). Precipitation increases in frequency and intensity during the winter. Indeed, the mountain imposes an ascent of air masses, which results in cooling, the formation of clouds, and the condensation of water vapor. The proportion of snowfall also increases rapidly because of the altitude, especially in winter. On the other hand, no difference was observed for the visibility during the seasons, which shows an average value of 10 km.
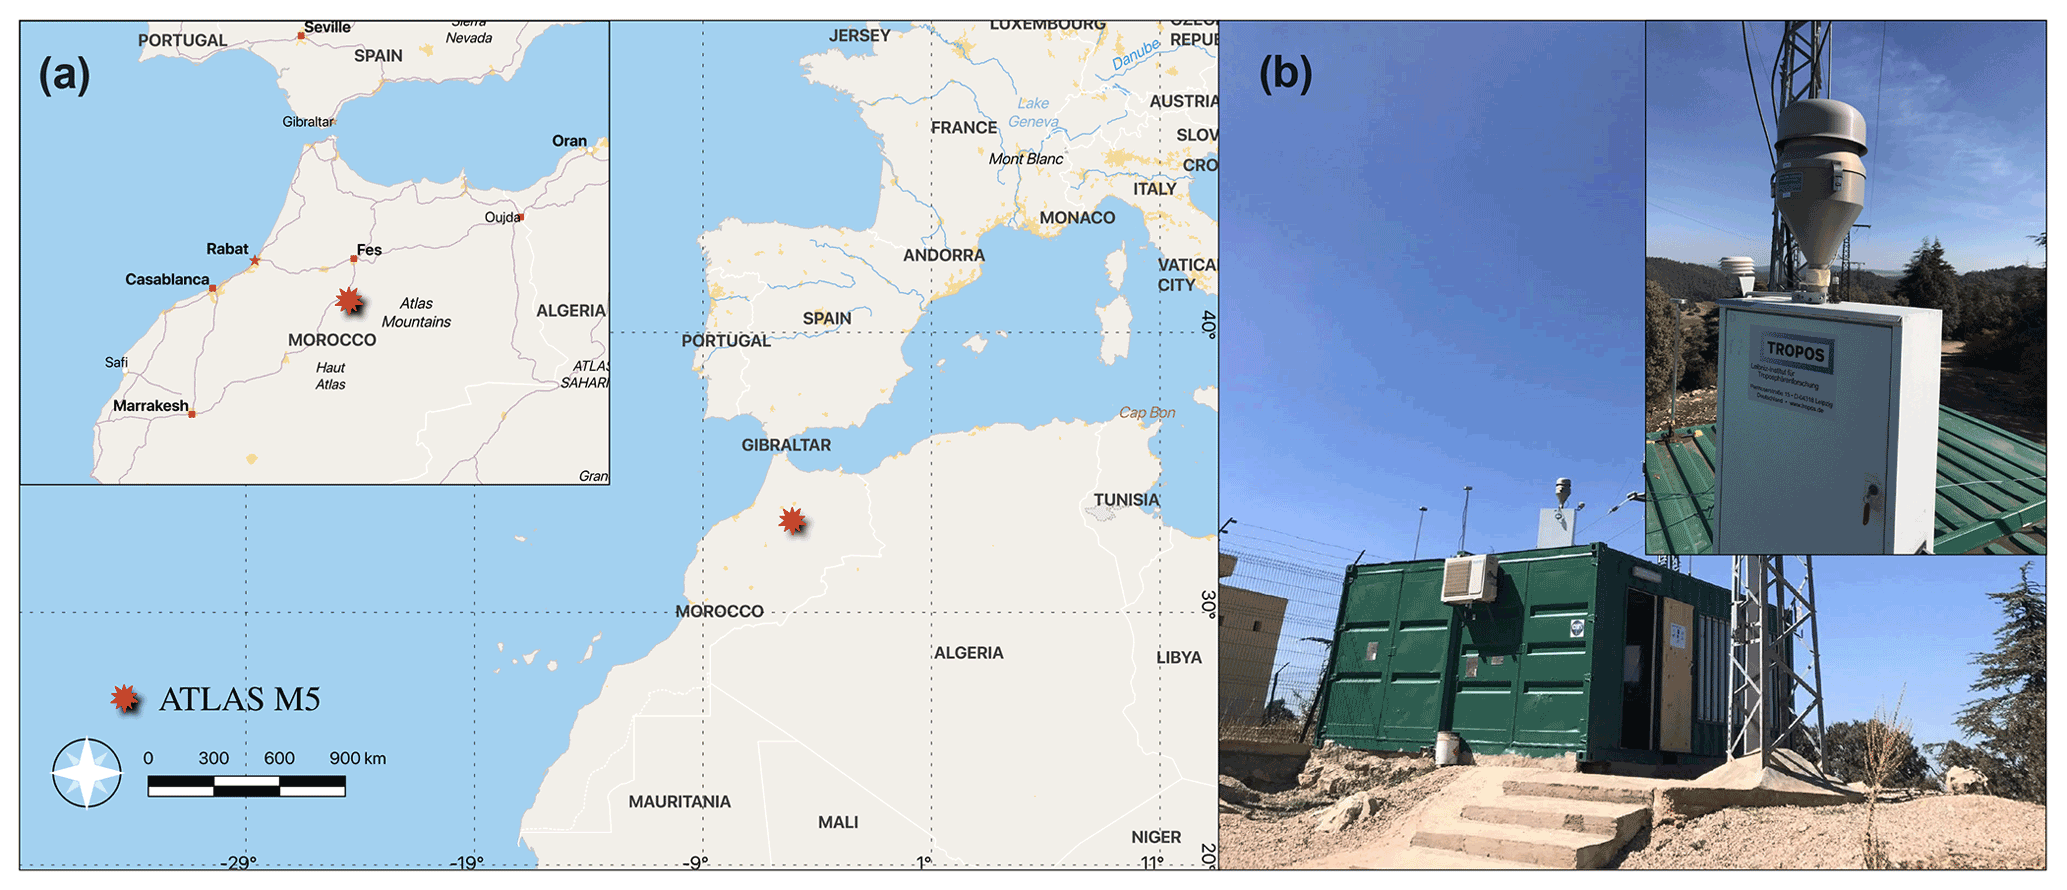
Figure 1(a) Location map of the AMV site in the Middle Atlas; (b) Photo of the AMV site.

There is a wide variation in local wind distribution over seasons in which the wind comes from all directions, except the north. During summer, southeast winds have a higher frequency but a lower average speed of about 5.8 m s−1. Similarly, southeast winds are dominant with a slight decrease in wind frequency during the fall, while western winds are dominant by up to 30 % during winter and spring. During this period, there is a strong occurrence of westerly winds, which are often characterized by high wind speeds (stiff breeze) of up to 20 m s−1. To conclude, the wind frequently comes from the west and southwest during the winter months, in contrast to the dominant south winds in summer.
2.3 Aerosol particle chemical analysis
2.3.1 Particle mass
The collected filters were weighed on a microbalance with an accuracy of 10 µg (mod. AT261 Delta Range, Mettler) after being stabilized for 72 h at constant temperature (20±1 ∘C) and humidity (50±5 %) before and after sampling. The difference between the weights was determined and divided by the total sampling volume to obtain the mass concentrations. After the determination of the particulate matter concentration, both organic and inorganic analyses were carried out at the TROPOS laboratories.
2.3.2 Carbon compounds
Organic carbon and elemental carbon were analyzed by a thermo-optical method (Sunset Laboratory Inc., USA) at a maximum temperature of 850 ∘C with the normalized temperature program EUSAAR2 (EUropean Supersites for Atmospheric Aerosol Research), as described in the literature (Cavalli et al., 2010; Yttri et al., 2019). The method is in line with the standard proposed by the European networks (ACTRIS, EMEP). Samples were thermally desorbed from the filter medium under an inert He atmosphere followed by an oxidizing O2–He atmosphere using carefully controlled heating ramps. A flame ionization detector is used to quantify methane after catalytic methanation of CO2. First, the sample is heated up to about 870 ∘C in an inert atmosphere of pure helium. These conditions allow the organic carbon to volatilize and to be fed into the second furnace filled with Mn2O (oxidation catalyst), where it is quantitatively oxidized into CO2. As a second step, the sample is placed in an oxidizing atmosphere (helium and oxygen), leading to the oxidation and volatilization of the refractory elemental carbon remaining on the filter (van Pinxteren et al., 2015). Charring processes lead to the overestimation of EC and an underestimation of OC, resulting in lower ratios. Therefore, an optical correction was applied for the charring process. The optical correction of charring for pyrolytic carbon is obtained by measuring the transmission of the sample with a laser (wavelength 678 nm). The detection limit for measurement was 0.2 µg cm−2. Organic matter (OM) was estimated based on the f conversion factor, according to Turpin and Lim (2001). The total carbon (TC) was considered to be the sum of organic carbon and elemental carbon (TC = OC + EC). Organic matter was about twice the organic carbon (OM = 2.1 × OC). Since the conversion factor depends on the specific proportion of each site, the factor is suggested because it takes into account aged aerosols (Turpin and Lim, 2001). The primary organic carbon (POC) fraction in the PM10 was estimated using EC as a tracer by taking the minimum ratio for the entire study period and multiplying it by the EC content, as in the following equation: POC = ()min× EC. Consequently, the secondary organic carbon (SOC) contribution to the total OC can be estimated as the difference between the total organic carbon and total primary organic carbon concentrations (SOC = OC − POC).
Organic compounds such as n-alkanes, oxygenated polycyclic aromatic hydrocarbons (oxy-PAHs), and n-alkane-2-ones were detected using a Curie-point pyrolyzer (JPS-350, JAI Inc., Japan) coupled with a gas chromatography mass spectrometry (GC-MS) system (6890 N GC, 5973 inert MSD, Agilent Technologies, CA, USA), as described by Neusüss et al. (2000).
Saccharidic compounds such as mannitol, glucose, levoglucosan, and arabitol were determined using high-performance anion-exchange chromatography with pulsed amperometric detection (HPAEC-PAD), as described by Iinuma et al. (2009).
2.3.3 Trace metals
Trace metals were determined using the total reflection X-ray fluorescence technique (TXRF), whereby three spots of 8 mm diameter each were digested in 1.125 mL HNO3 and 0.375 HCl using the Mars 6 (CEM, Germany) microwave. 50 µL of the digested solution was deposited on previously siliconized quartz carriers, and 10 ng of gallium was added onto the sample as an internal standard. The samples were subsequently measured using an S2-PICOFOX (Bruker AXS Microanalysis GmbH, Germany) instrument. Further details of the technique and measurement procedure have been reported elsewhere (Fomba et al., 2020).
2.3.4 Water-soluble ions
The major ionic constituents were analyzed using a standard ion chromatography technique (ICS3000, Dionex, USA) equipped with automatic eluent generation (KOH for anions and methanesulfonic acid – MSA – for cations) and a micro-membrane removal unit. Ion analysis was performed for Na+, NH, K+, Mg2+, and Ca2+ cations, as well as Cl− and Br−, NO−, SO, and C2O anions. For these analyses, three spots of 2 cm diameter were each extracted from the filter in deionized water via shaking for 2 h. The extract was filtered through a 0.45 µm unidirectional syringe filter to remove insoluble matter, and the filtrate was analyzed. The blank field filters were analyzed using similar procedures and were subtracted from the sample concentrations following the methodology described by Iinuma et al. (2009).
2.3.5 Estimation of sea salt components
Sea salt concentrations were calculated by adding chloride to sodium, and the sea salt (ss) contributions of potassium (ss-K+), calcium (ss-Ca2+), magnesium (ss-Mg2+), and sulfate (ss-SO) have been estimated as 0.03, 0.5, 0.12, and 0.25 fractions of the measured Na+, respectively (Marenco et al., 2006). However, the estimation of sea salt assumes that all Na and Cl come from marine contribution without taking into consideration other potential sources. The estimation of non-sea-salt sulfate (nss-SO) was done by subtracting the contribution of ss-SO from the total SO mass concentration (Amodio et al., 2014). The water content of the samples was estimated according to the E-AIM (Extended Aerosol Inorganics Model) III of Clegg et al. (1998).
2.4 Determination of mineral dust
Mineral dust (MD) is a significant contributor to atmospheric particulate matter, especially in North Africa, where the average percentage can vary from 7 % to 62 % (Gherboudj et al., 2017). The high spatiotemporal variability of the dust emission can sometimes be difficult to quantify correctly and may lead to some uncertainty. Therefore, the estimation of MD can be subjective because several estimation methods are available in the literature. The most common methods were applied to the samples collected at the AMV station. Within the present study, the aim was first to evaluate and then select an appropriate method for the interpretation of the results. Four methods were highlighted that are representative of those used in the literature. The first method implemented by Fomba et al. (2014) consists of subtracting the total PM10 mass concentration from the analyzed mass of the other elements, representing the upper limit of the possible MD concentration in the samples. This method is an interesting approach, especially when the elemental analysis is not available. However, to improve the MD quantification using available MD-related elements, applying a stoichiometric equation reduces the uncertainty of the values. Using this method, an average MD concentration of about 24.5 µg m−3 was obtained. In contrast, methods 2 and 3 use different approaches. They estimate MD based on given stoichiometry and apply different elemental concentrations such as Al, Ca, Fe, or Ti to estimate the MD load. Method 2 uses the factor (1.16) to compensate for the exclusion of MgO, Na2O, K2O, and H2O from the crustal mass calculation, as shown in Table 2 (Maenhaut et al., 2005), whereas method 3 considers carbonate such as calcite, dolomite, and other oxides such as TiO2, Fe2O3, and MnO2 (Minguillón et al., 2007; Nerriere et al., 2007). As a result, the average MD concentrations using methods 2 and 3 were similar at about 19.9 and 18.9 µg m−3, respectively. Method 4 takes into account that sea salt significantly affects these concentrations, and the non-sea-salt (nss) content of the elements, such as nss-Ca2+ or nss-Mg2+, is used to replace the total Ca and Mg concentrations. This is more accurate in a sea-salt-dominated environment but could underestimate the calcium contribution as sodium also has a crustal origin (Cesari et al., 2012; Perrino et al., 2014). The average MD concentration from this method was about 15.5 µg m−3.
Table 2Comparison of different methods for dust estimation. SD: standard deviation. Note that the concentrations of dust are given in micrograms per cubic meter (µg m−3).

In conclusion, differences of up to 37 % were obtained between these methods. The obtained MD concentrations were high for method 1, lowest for method 4, and similar between methods 3 and 4, indicating their robustness. Method 3 does not consider quantifying silicates (SiO2) and aluminosilicate (Al2SiO2), which is a major component in natural mineral dust. However, method 2 allows us to take into account the overall mineral composition and was therefore applied in this study. Due to limitations in quantifying Si from quartz fiber, MD was finally estimated by replacing “Si” with “Ca” based on the established soil stoichiometric ratio of the average upper continental crust (Si = 10.3 Ca), according to Wedepohl (1995) in the equation used in method 2. The final equation used for mineral dust estimation is given as follows.
2.5 Back-trajectory analysis
For the origin of the air masses reaching the station, 96 h back trajectories were estimated using the NOAA HYSPLIT (Hybrid Single-Particle Lagrangian Trajectory, HYSPLIT 4) model (http://www.ready.noaa.gov/ready/hysplit4.html, last access: 13 July 2021; Draxler and Hess, 2004) using the 1∘ resolution Global Data Assimilation System (GDAS) input data. Due to the resolution of the input data, the exact altitude of the mountain is not properly represented, and according to the HYSPLIT model at the AMV site, the terrain height is at 1000 m only. Therefore, trajectories were calculated every hour for the altitude of 1000 m above the model ground level. The profile of the air mass altitude during transport was applied for the interpretation of the data for each air mass.
To group the back trajectories into distinct transport patterns, a manual classification approach was used. This method consists of grouping 12 trajectories with the time interval between adjacent nodes of 1 h calculated for 96 h and attributing them to a specific air mass category. The assignment of the trajectories was based on their crossing over given latitude–longitude grids attributed to given geographical sectors. To assign a sample to a specific air mass category, 60 % of the trajectories must have a similar profile. Samples (n=15 samples) with trajectories from mixed origins (e.g., marine air mass over Europe and the desert) were excluded from the classification of the air masses. In total, the air masses of 175 samples could be grouped into four distinct categories, which were background air mass (BAM), Atlantic coast Europe (ACE), Mediterranean coast Europe (MCE), and Saharan dust (SD).
3.1 Variation of PM10 mass
The PM10 mass concentration time series at the AMV station varied from 9.5 to 145.6 µg m−3 with an average of 29.2±17.3 µg m−3. The PM10 mass shows a strong seasonal variation during the 5 months of measurement from August to December 2017, as illustrated in Fig. 3a. The highest monthly concentration was observed in August (49.9±25.9 µg m−3) and continuously decreased until December (15.9±5.6 µg m−3), as shown in Fig. 3b. The observed temporal variation in the concentration is most likely related to factors such as meteorological conditions and the air mass arriving at the station. To understand the seasonal variation of the particulate matter load, PM10 mass was combined with wind speed and wind direction to create the polar plots as presented in Fig. 3c, which illustrates the variation of PM10 concentrations as a function of wind speed and direction.
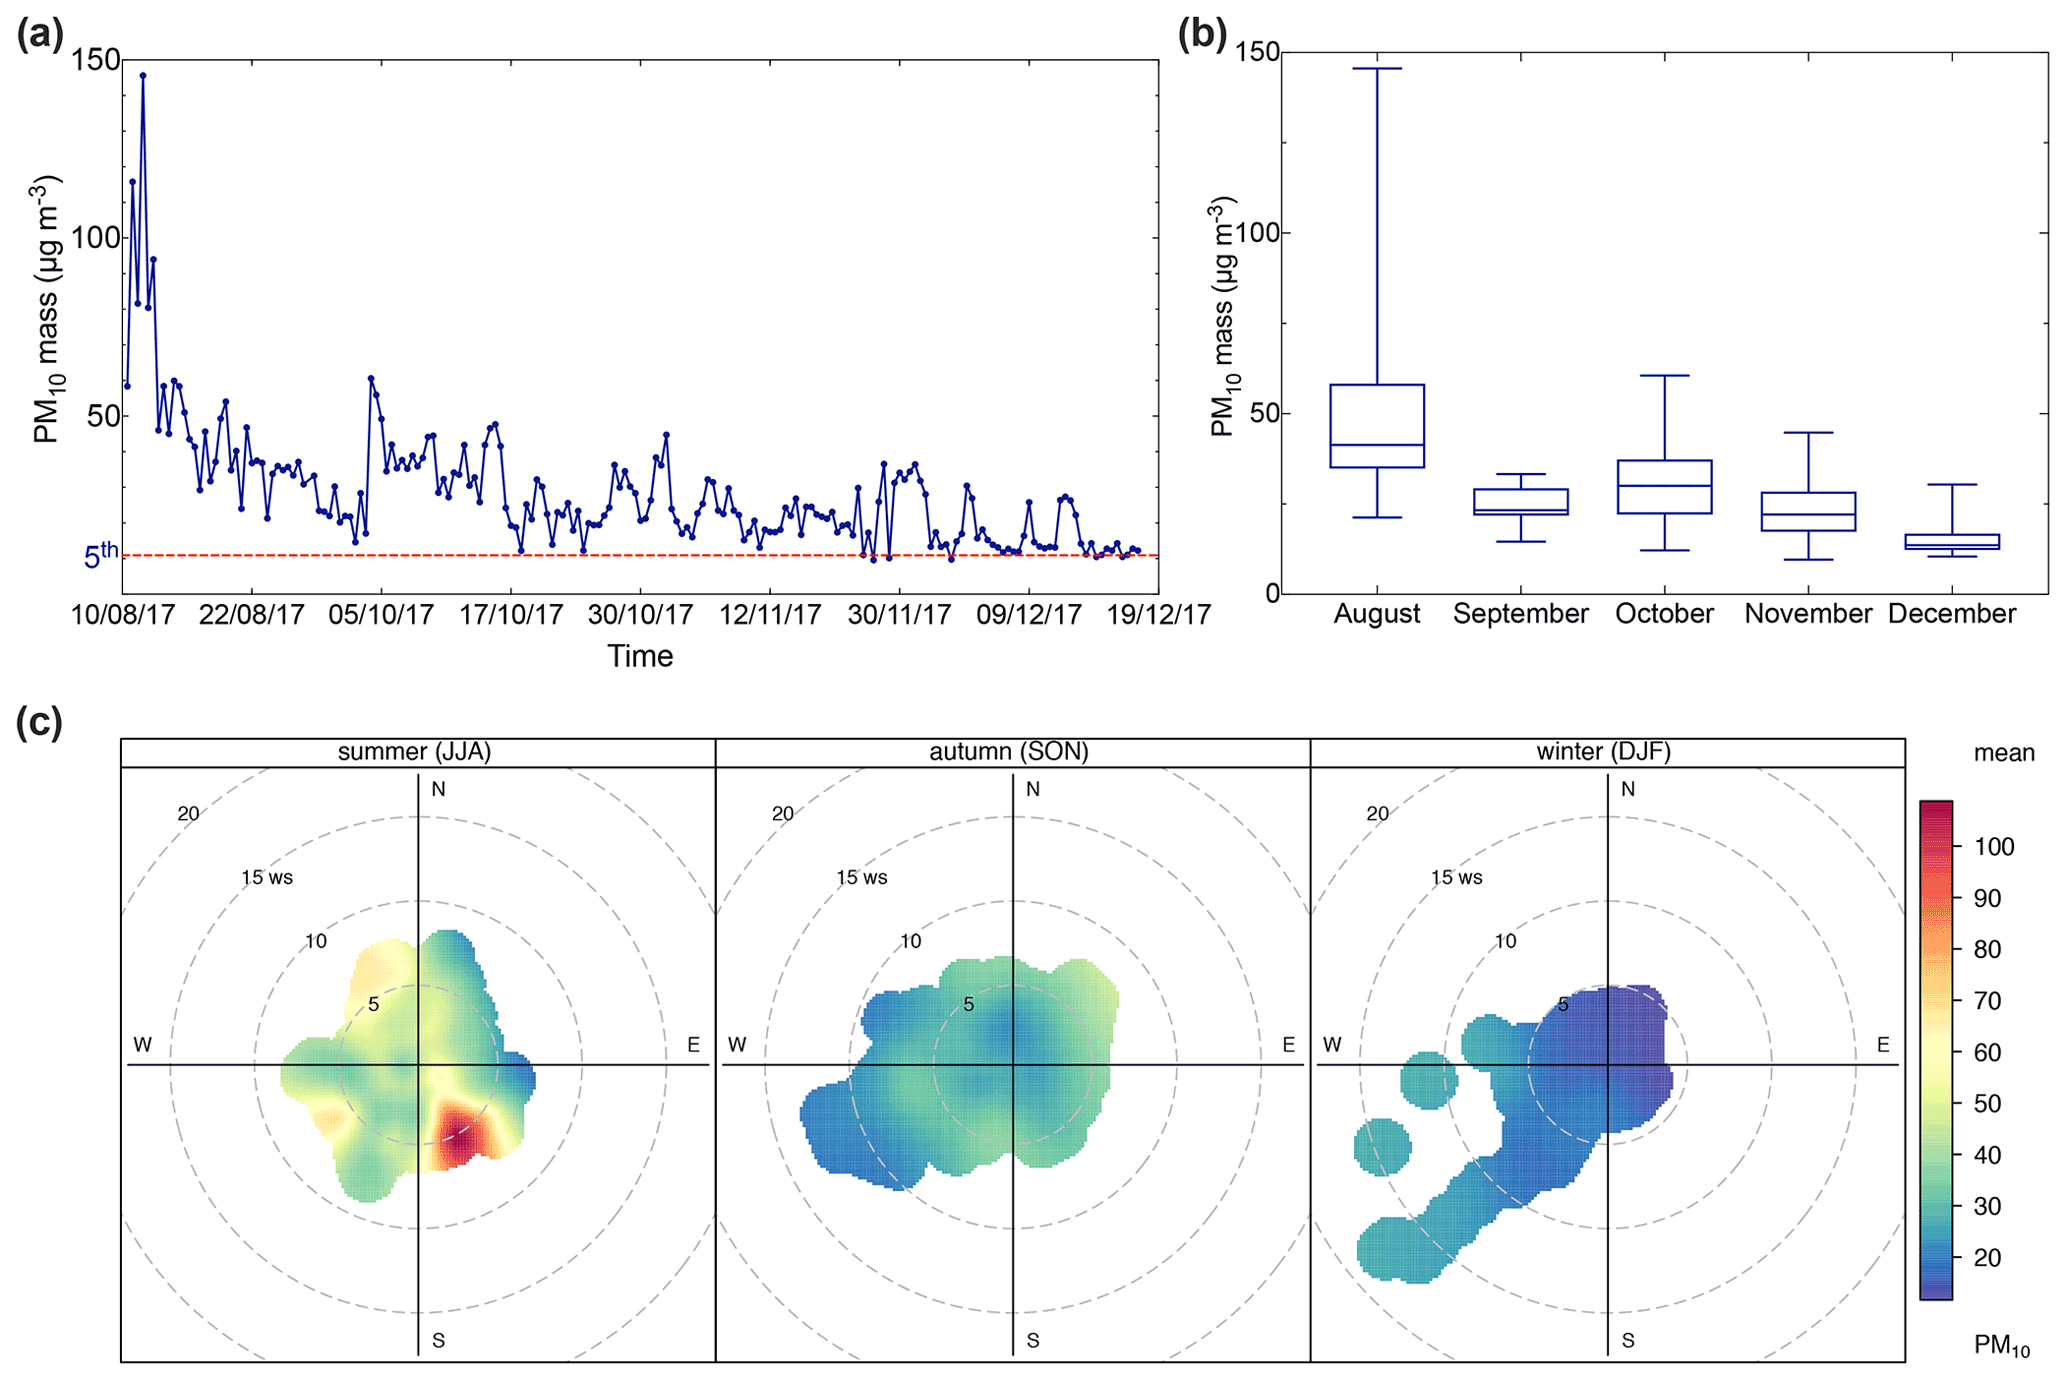
Figure 3(a) Time series of daily PM10 mass; (b) box plot of monthly averages of PM10 mass; (c) pollution rose of PM10 mass. The presented data were separated according to each season into summer (August), fall (September–November), and winter (December). Time series of daily PM10 mass, with the dotted line representing the 5th percentile of the data.
During August, the high PM10 concentrations were mostly related to high wind speeds from the southeast. For example, PM10 mass concentration often exceeded 50 µg m−3 and sometimes even reached up to 145 µg m−3 during August, when the wind speed was stronger than 9 m s−1. The high PM10 concentration recorded was due to the influence of Saharan dust events during periods of air mass influence from the southern sector located in the southeast of the AMV station. The Middle Atlas region is marked by particular meteorological conditions during the summer with low humidity and often low precipitation (avg. 37 mm), as shown in Table 1. These hot and arid conditions are known to favor the transport of dust particles from the Saharan desert to the Atlas Mountains (Rodríguez et al., 2011). Furthermore, high concentrations of up to 40–50 µg m−3 were observed as well with westerly winds, especially during northwest and southwest winds. High PM10 concentrations were observed during strong westerly winds of up to >7 m s−1. The back-trajectory analysis suggests that the high concentrations during this period were most likely associated with the long-range transport of aerosol particles from the western coast of the Iberian Peninsula. In contrast to the summer period, PM10 mass concentrations were lower during the fall, despite some temporal peaks. The PM10 concentrations were generally lower in September (24.2±5.1 µg m−3) and October (30.5±10.8 µg m−3). During this period, wind originated from the northeast, suggesting the influence of air mass transport from the Mediterranean Sea coast. A sharp fall in PM concentrations was noticed in November (22.8±7.9 µg m−3) and December (15.9±5.6 µg m−3). Overall, the PM10 concentration decreased from the summer to winter by 32 %. This trend is most likely due to the increased amount of precipitation (peaks of 852 mm) during fall and winter, which can lead to the wash-out effect of aerosol and its components (Holst et al., 2008).
To establish a reference baseline and evaluate the background conditions at the site, the lower 5th percentile of the PM10 concentrations (PM10<12 µg m−3) was found to be representative of remote background aerosol conditions. The PM10 frequency and probability density function, as shown in Fig. S3 in the Supplement, confirmed this observation. The samples within this PM concentration range had similar air mass trajectories and typical meteorological conditions with low wind speeds <3 m s−1. The air masses typically traveled in the free troposphere at about 1000 m a.s.l., crossing the North Atlantic Ocean before arriving at the site within the prior 96 h. These conditions were, however, not free from local and regional pollution from point sources such as dust resuspension from cars accessing the site.
Consequently, the average background PM10 mass concentration at the AMV was 10.9 µg m−3, which was found to be stable and representative of periods of little external influence. In comparison, Benchrif et al. (2018) reported background PM10 values for northern Morocco with an average of 12.2 µg m−3, which is very similar to the concentrations determined in this study of 10.9 µg m−3. The mean concentration recorded at AMV from this study (29.2±17.3 µg m−3) agreed well with the PM10 concentration of other remote high-altitude sites, such as Darjeeling in the northeastern Himalayas (29 µg m−3; Chatterjee et al., 2010), Lhasa in Tibet (37 µg m−3; Wang et al., 2015), and Mahabaleshwar in India (37 µg m−3; Leena et al., 2017) as presented in Table 3. Other high-altitude stations, such as Izaña in the Canary Islands (46 µg m−3), showed much higher PM10, most likely due to the exposure to strong Saharan dust events (García et al., 2017). In contrast, the PM10 concentrations at AMV were considerably higher than the PM10 levels recorded at European and Asian high-altitude sites. For example, the average PM10 mean value recorded in this study was about twice that of Mount Cimone, Italy (16 µg m−3; Marenco et al., 2006), a factor of 6 greater than the PM10 at Mt. Everest (Decesari et al., 2010) and in Puy de Dôme, France (6 µg m−3; Bourcier et al., 2012), and approximately 10 times greater than the average level in Jungfraujoch (3 µg m−3; Cozic et al., 2008). Other Moroccan sites, such as Marrakech, Meknes, and Agadir, which are exposed to strong urban emissions, usually show PM10 concentrations between 50 and 110 µg m−3, which are much higher than the concentration found at AMV in this study (Inchaouh, 2017; Tahri et al., 2013, 2017). These results highlight a better air quality at AMV in comparison to many sites and indicate that the station can serve as a good remote reference station for defining background concentrations in Morocco and possibly the whole of North Africa.
Table 3Average mass concentration of PM10 from other high-altitude sites and urban sites in Morocco reported in the literature according to altitude. Data from this study are shown in bold.

3.2 Air mass origins
The calculation of back trajectories using the HYSPLIT model allowed the identification of several remote sources of PM10 at the station. Four main air mass categories were identified, as shown in Fig. 4: (i) air masses that spent the last 96 h over the Atlantic Ocean at high altitude (1000 m.asl) representative of typical background air mass (BAM) conditions, which influenced about 5.3 % of all samples; (ii) air masses originating from the Atlantic and crossing over the coast of Europe (ACE), especially Spain and Moroccan industrial cities located at the North Atlantic coast, influencing about 26.8 % of all samples; (iii) air masses from Europe crossing over the Mediterranean coast and Europe (MCE) as well as over northern Moroccan cities, as shown in Fig. 4c, influencing about 37.4 % of all samples; and (iv) air masses originating from the southern and/or eastern Sahara crossing the desert (SD) at different altitudes before arriving at the AMV and influencing about 22.6 % of all samples. The back trajectories representing mixing scenarios (7.9 % of all samples) were not assigned to any of the four major classes as mentioned above.
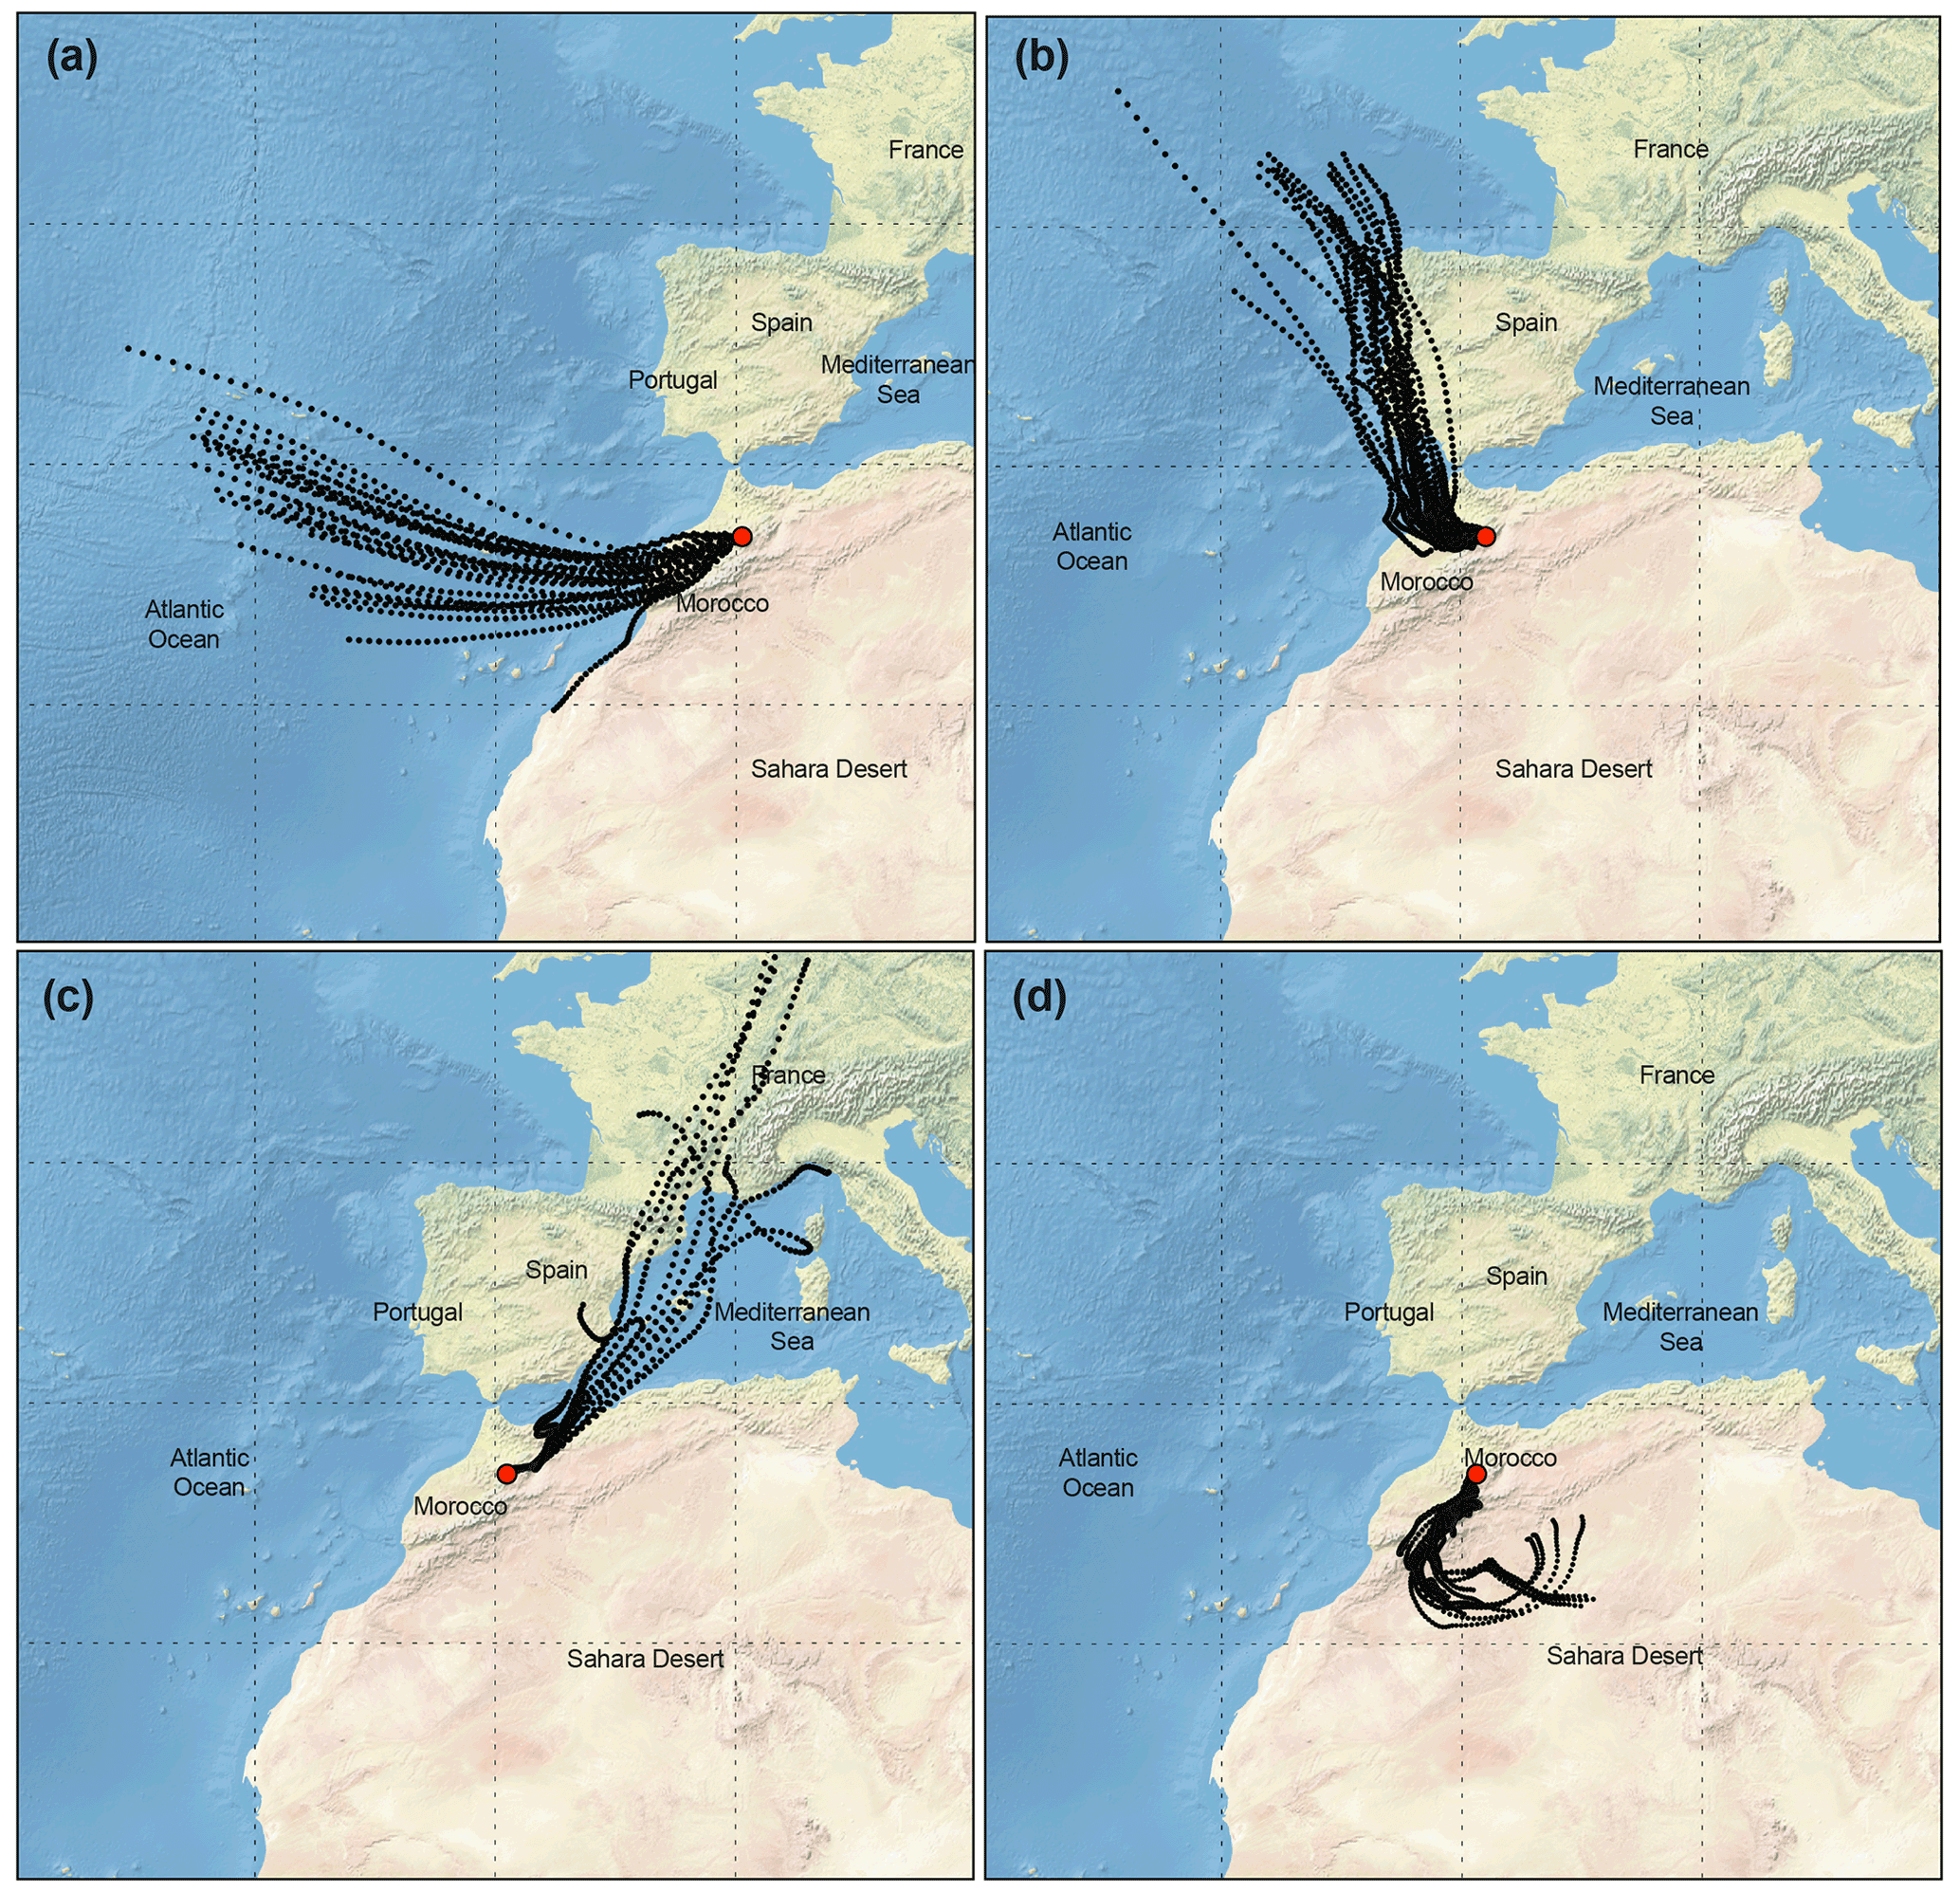
Figure 4Typical 96 h air mass back trajectory performed for AMV during routine sample periods; aerosol type and PM10 mass concentration are given in parentheses. (a) 18 December 2017: air mass from the North Atlantic Ocean considered to be representative of background conditions (BAM, m=10.9 µg m−3). (b) 10 October 2017: air mass from Europe crossing the coastline of northern Morocco (Atlantic coast Europe, m=44.1 µg m−3). (c) 2 November 2017: slightly polluted air mass from the northeast crossing Mediterranean Sea Morocco (Mediterranean coast Europe, m=26.4 µg m−3). (d) 13 August 2017: dust-loaded air mass coming from the Sahara (Saharan dust, m=94.1 µg m−3).
3.3 Characterization of aerosol chemical composition
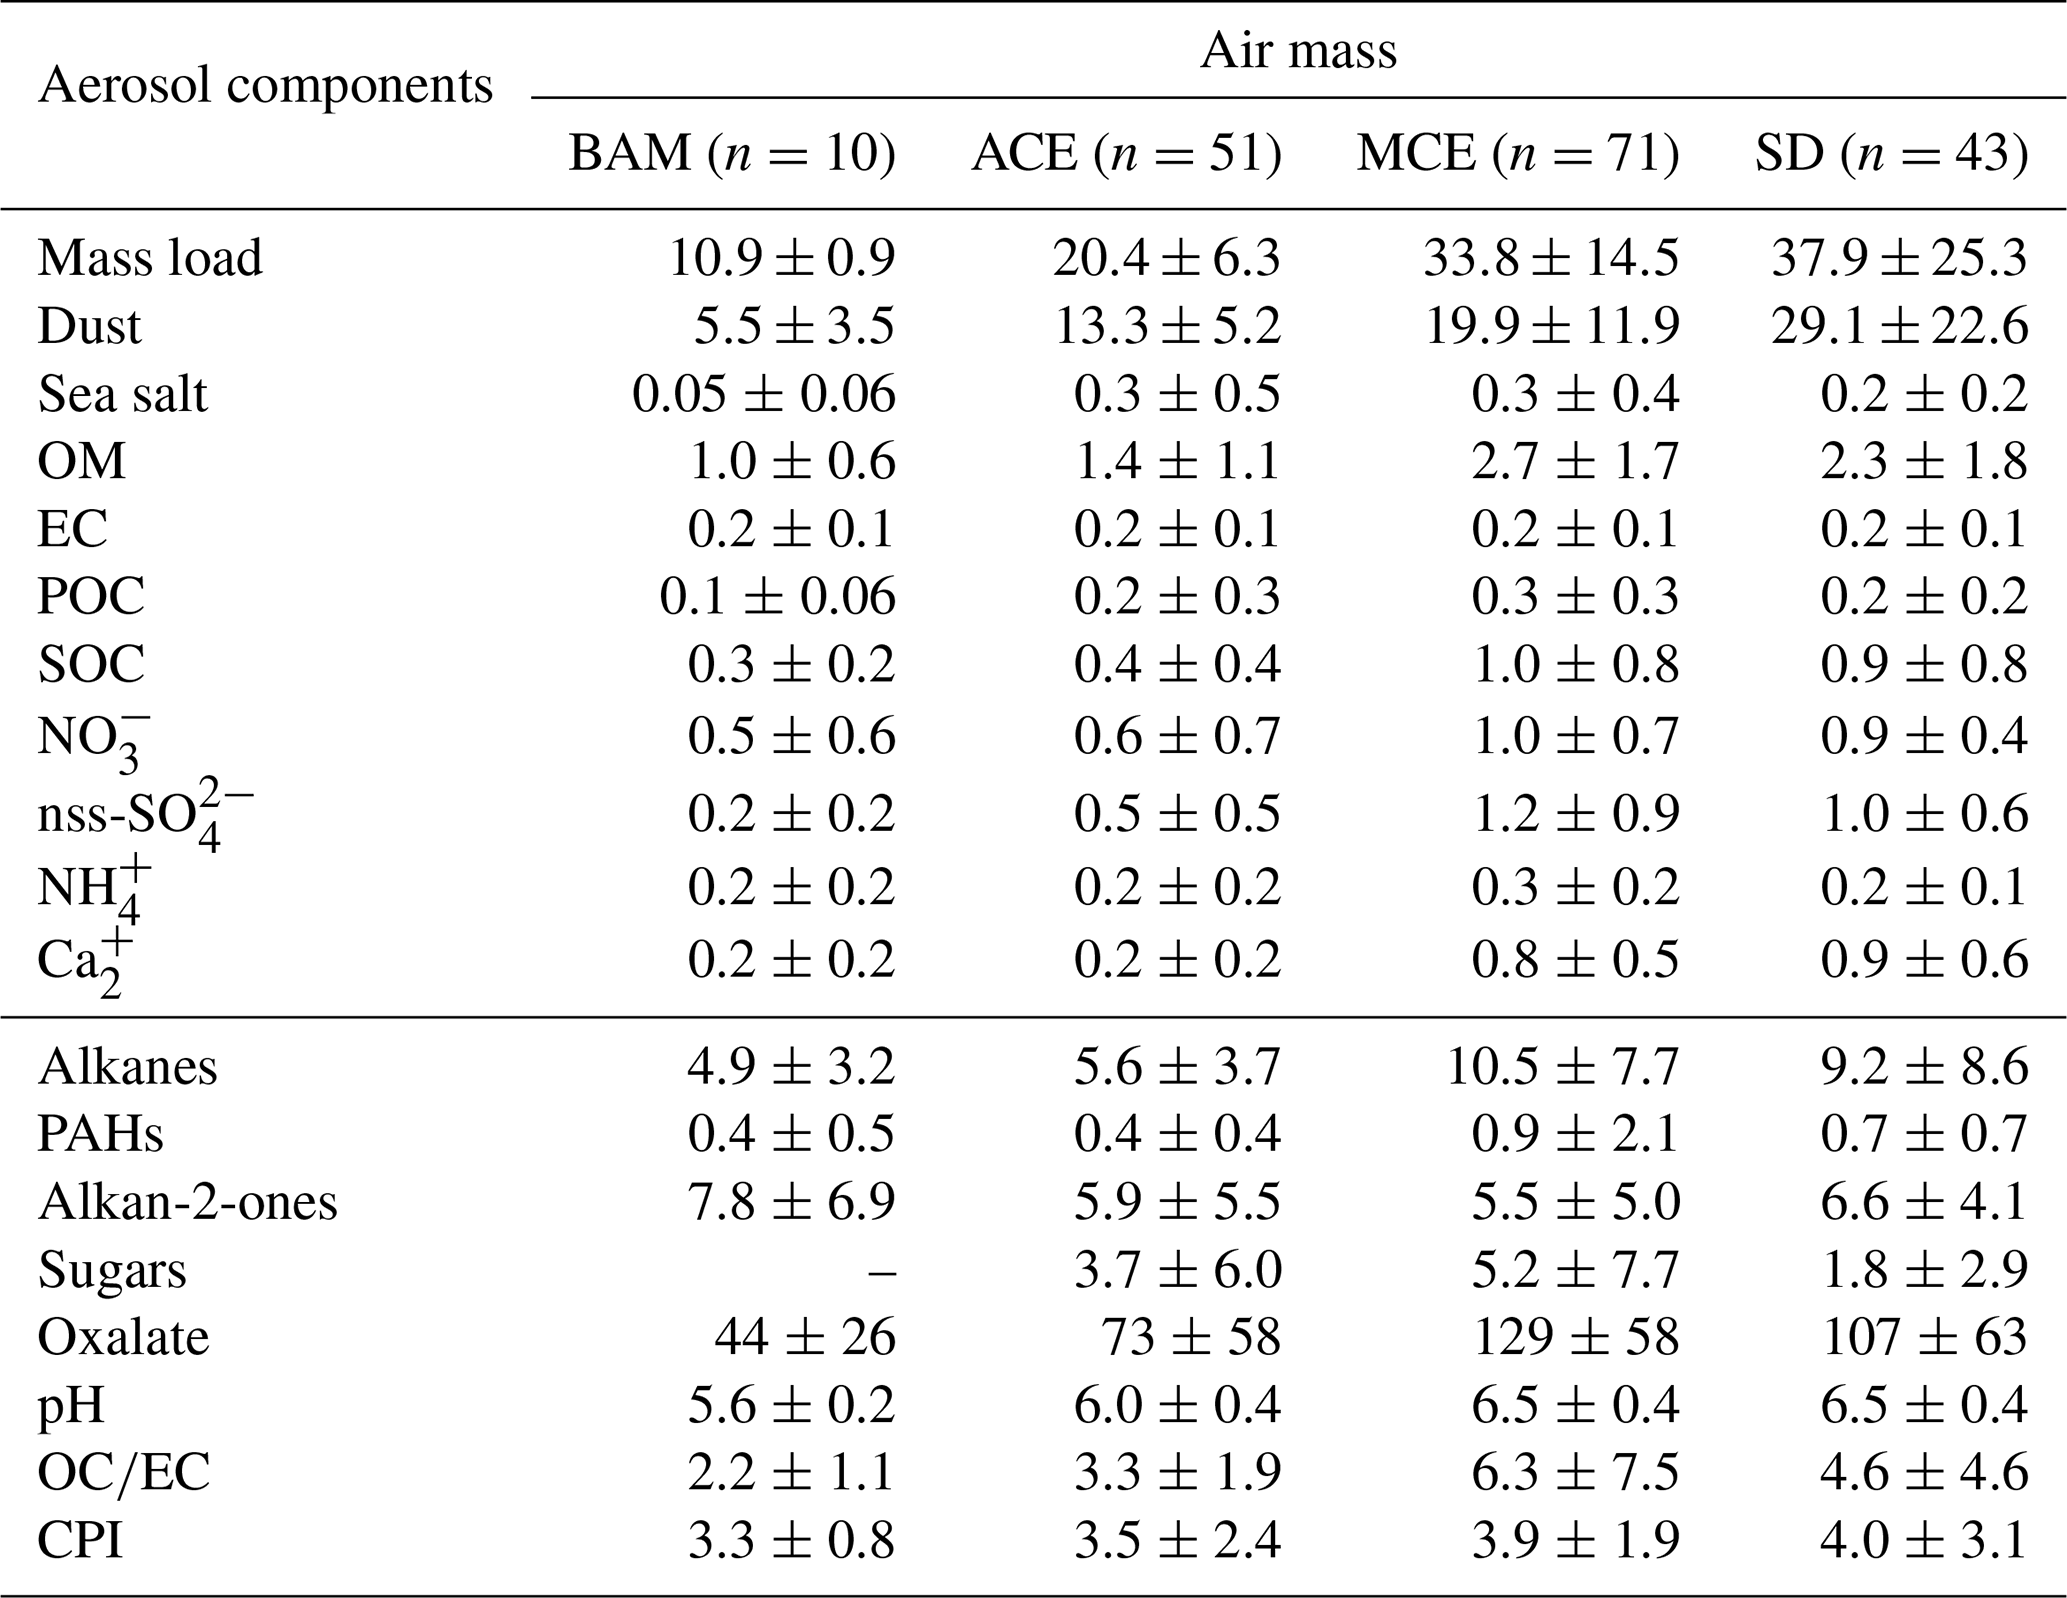
The statistics of the measured PM10 chemical components for the four air mass categories are shown in Table 4, including the average concentrations and their variations (standard deviation). Note that the concentrations of dust are given in micrograms per cubic meter (µg m−3). Likewise, Fig. 6 shows the time series of the investigated chemical species within the sampling period colored with periods of the different air mass influence.
Table 4Concentrations of main aerosol chemical species in PM10 according to each air mass (µg m−3) at AMV; the number of samples is written in parentheses. The organic compositions including alkanes, PAHs, alkan-2-ones, sugars, and oxalate are given in units of ng m−3.
3.3.1 Mineral dust
During the 5 months of PM collection at the AMV site, the average mineral dust concentration was about 17.7±7.4 µg m−3 and varied strongly between 0.05 µg m−3 and 107 µg m−3. The highest mean concentrations were observed in August (39 µg m−3) and the lowest in December (3.7 µg m−3). Low concentrations were observed during days with low wind speeds (<2 m s−1), low Saharan dust air mass inflow, and after precipitation events, which typically occurred in the fall and winter. The influence of the Saharan dust on the Middle Atlas region remains relatively dependent on meteorological conditions. The first conditions are the direction and speed of the wind, as typical Saharan dust events were observed during high wind speed periods from the south and southeast. Secondly, their progression depends mainly on favorable weather conditions for transport, the difference in temperature between day and night, humidity, and especially the scarcity of rainfall. Thirdly, the High Atlas mountains situated at 4000 m of altitude act as a barrier to Saharan dust transport, which forces the winds to deviate from their path. All these factors influence the transport of large particles from the Sahara to the Middle Atlas during the different seasons.
Nevertheless, even during days of low wind speed, mineral dust still dominated the aerosol composition and contributed up to 51 % of the total mass, as shown in Fig. S4, for typical background-condition chemical composition. The highest aerosol mass was observed during days of Saharan dust events from 10 to 13 August when air mass crossed the Sahara (SD) before arriving at the AMV site. The duration of Saharan dust events varied from 1 to 3 d, with the longest event (also supported by back-trajectory analysis) observed during August. Most dust events occurred during the summer, as indicated by the strong increase in typical crustal elements (Guinot et al., 2007; Arimoto et al., 2006) such as nss-Ca2+ and Fe (Fig. 6). Mineral dust was found to be more than 7 times higher (37.9±25.3 µg m−3) during dust events (SD) in comparison to remote background conditions (BAM), with an average concentration of 5.5±3.5 µg m−3, as observed in Table 4. Other less intense Saharan dust storms occurred during the summer season between 21 and 24 August with a similar high dust concentration that was 5 times higher than background dust concentrations. The presence of mineral dust is relatively low but still significant for air masses other than SD, such as during the ACE (13.3±5.2 µg m−3) and MCE (19.9±11.9 µg m−3) air mass influences, as shown in Table 4. This suggests that the air masses were very often loaded with mineral dust originating from regional sources in the Middle Atlas. The ratio was used to distinguish between different mineral dust sources. ratios close to 0.4 indicate dust from the south, while ratios greater than 1 indicate dust from the east. The ratio is about 0.5 during BAM conditions, indicating local sources emitted by road dust or resuspension of agricultural activities.
Mineral dust can be transported over long distances, particularly from the North African source region to the Mediterranean basin and Europe (Schepanski et al., 2016). For instance, the high-altitude site in Mt. Cimone, Italy, recorded several days with African dust transport, which influenced the chemical composition (Marenco et al., 2006). However, the Saharan dust concentration at AMV (17.7 µg m−3) is approximately 4 times higher than at Mt. Cimone (4 µg m−3). Nevertheless, the average concentrations of elements such as Al, Fe, Ti, and Mn are comparable with the values reported at Mt. Cimone, Italy (Marenco et al., 2006; Table 5). However, the calcium concentration at the AMV (0.65±0.58 ng m−3) was 2 times higher than the concentration recorded in Mt. Cimone. Furthermore, the calcium concentration was 5 times higher than the concentration recorded at other high-altitude stations such as Mt. Himalaya and Mt. Everest (Chatterjee et al., 2010d; Decesari et al., 2010). This suggests that the AMV experiences higher amounts of calcium-rich dust in comparison to other sites. Some studies have reported a high content of calcite in the soils of northern Morocco of 1.07 ng m−3, which confirms the predominance of calcium-rich dust in the Atlas regions (Desboeufs and Cautenet, 2005; Kandler et al., 2009; Benchrif et al., 2018).
Table 5Concentrations of main aerosol chemical species in PM10 (ng m−3) at AMV compared to other high-altitude mountain stations. Data are reported in the format average (mean ± standard deviation). NA: not available. Note that the concentrations of PM10 mass are given in micrograms per cubic meter (µg m−3).

a Present study; b Bourcier et al., 2012; c Chatterjee et al., 2010; d Marenco et al., 2006; e Decesari et al., 2010.
3.3.2 OC and EC
Organic carbon (OC) and elemental carbon (EC) showed strong variation and distinct differences with an average of 1.1±0.8 and 0.2±0.1 µg m−3, respectively. The OC has both primary and secondary origin, and it can be formed from primarily emitted substances through condensation or chemical reactions among them (Sarkar et al., 2019). The OC concentration reached a maximum 4.5 µg m−3 during summer, whereas the lowest concentration was observed during winter at about 0.03 µg m−3. The average concentration of OC progressively decreased from summer (2.1±0.8 µg m−3) to winter (0.3±0.2 µg m−3). The abundant contribution of organic matter in summer can be due to high biogenic emissions in the Middle Atlas. A slight increase in OC was also observed during dust events, as shown in Fig. 5, which suggests that the dust deposited at AMV also contained biogenic material from the surroundings of the Middle Atlas region. The average concentration of POC was found to be 0.2±0.3µg m−3 (26 % of OC concentration), whereas SOC was estimated as 0.8±0.7 µg m−3 (74 % of OC).

Figure 5Time series of major aerosol chemical constituents in PM10 filter samples collected from August to December 2017. The color of the symbols displayed for each sample represents a specific air mass origin: background (blue); ACE (red); MCE (green); SD (yellow).

Figure 6Time series of organic compounds in PM10 filter samples collected from August to December 2017 at AMV. The color of the symbols displayed for each sample represents a specific air mass origin: background (blue); ACE (red); MCE (green); SD (yellow).
The EC concentration showed little temporal variation except for a few pollution episodes during which peaks in the EC concentrations could be observed (Fig. 5). The sudden increase in EC observed during summer (0.6 µg m−3) and autumn (0.7 µg m−3) was characterized by two different sources: firstly, from Europe through the Atlantic coast during ACE air mass influence in summer; secondly, from nearby urban regions, especially in the evenings when the temperature is low (with an average of 5 ∘C) and high values of anthropogenic metals, such as Pb, Cu, and Ni, are observed. The wind direction and back-trajectory analysis indicate that the most likely sources of pollution are the urban cities of Fes and Meknes, located about 85 and 50 km to the north from the station. However, the winter period was marked by low EC concentrations, with an average of 0.1±0.06 µg m−3. The elemental carbon concentration (EC) concentrations (0.2 µg m−3) for Saharan dust air masses were low, indicating that the influence of urban pollution during dust events was low. A few studies have observed that North African dust was often loaded with pollutants (Gangoiti et al., 2006; Kalderon-Asael et al., 2009; Astitha et al., 2010). Nevertheless, according to the back trajectories, the transport of mineral dust takes place directly from the Sahara situated in the south of the AMV site, without passing through cities with intense anthropogenic activities. The study of Decesari et al. (2010) reported similar concentrations of OC (0.8±0.6 µg m−3) and lower EC (0.1±0.1 µg m−3) concentrations in PM10 at the Himalayan high-altitude station in Nepal. Furthermore, Sharma et al., 2020 reported higher OC (5.4±2.0 µg m−3) and EC (2.2±2.0 µg m−3) at the high-altitude site of Darjeeling, India, most likely due to the higher influence of anthropogenic activities at the site.
The ratio contributes to assessing the aging of aerosols during long-range transport as well as the impact of the combustion source producing EC. The average ratio was computed as 4.8±5.4 µg with a range of 0.2–56.1. Conversely, the ratio tends to decrease from summer (11.2±9.7) to winter (2.2±1.4). The decreasing trend of the ratio can be due to the formation of secondary organic aerosols in summer by photochemical processes, as shown by the high secondary organic carbon (SOC) content observed during August (1.9±0.8 µg m−3) in contrast to December (0.1±0.2 µg m−3). At the same time, the increase in wood combustion from nearby urban regions during colder periods (autumn–winter), combined with the changes in the meteorological conditions, prevents the transport of pollutants (Chu et al., 2005). The highest ratio (6.3±7.5) was observed for MCE air masses, while the lowest ratio was recorded for BAM at about 2.2±1.1, as shown in Table 4. The ratio observed at AMV for BAM was similar to those found in local samples in northern Morocco with an average of 1.9 (Benchrif et al., 2018). Moreover, the ratio shows a slight difference with those observed at Mt. Everest (Decesari et al., 2010) whose ratios varied from 5 to 9. To conclude, carbonaceous aerosols show strong season and temporal variation with high OC values observed during summer due to biogenic emissions, mineral dust, and long-range transport, in contrast to EC, which shows low variability except during a few regional anthropogenic pollution events.
3.3.3 Sea salt
The Middle Atlas region is influenced by two maritime sources of sea salt: more often from the Atlantic Ocean and sometimes from the Mediterranean Sea. During the study period, the average concentration of sea salt remained low (0.4±0.5 µg m−3) and contributed only 1.6 % of the total PM10 concentration. The highest concentrations were recorded during August when sea salt concentrations reached a maximum of 3.4 µg m−3. The sea salt then decreased gradually, reaching a minimum concentration of 0.06 µg m−3 during December. The sea salt concentration was high when wind speed exceeded 6 m s−1, indicating that sea salt is strongly dependent on meteorological conditions and air mass sources.
The higher concentrations of Na+ (0.6±0.3 µg m−3) and Cl−(0.4±0.3 µg m−3) in the hot season (August–September) could be due to a larger contribution of marine aerosol. During this period, sea salt made up 11 % of the total PM10 mass, especially when the air mass came from the Atlantic Ocean (ACE) in comparison to <1 % of the PM10 mass when the air masses were from the Sahara (SD). However, no significant difference was noticed in sea salt concentrations found in the ACE (0.4±0.7 µg m−3) and MCE samples (0.4±0.5 µg m−3), as shown in Table 4. Na+ concentration was high during a pollution episode on 16 August, which coincided with high concentrations of EC, SO, NO, and NH. This was due to the influence of ACE air masses with high EC content that made up about 2 % of the PM10 mass at the AMV site. The average ratio of in PM10 was found to be lower (0.4) than the value typically observed in seawater (1.8) (McInnes et al., 1994; Prodi et al., 2009). This points to chlorine depletion due to chemical reactions that involve NaCl and HNO3 or H2SO4, leading to the formation of NaNO3 or Na2SO4 and gaseous HCl (McInnes et al., 1994). The estimated chlorine depletion was 42 % for ACE and 49 % for MCE air masses, which is comparable with reported values from 28 % to 63 % (Avg. 48 %) observed in PM10 in the Atlantic Ocean and Mediterranean Sea (Contini et al., 2010, 2014). Consequently, sea salt was mainly present as aged sea salt at AMV during the sampling period. A detailed discussion on the correlation between Na+ and Cl− will be elaborated on in Sect. 3.4.
The comparison of sodium and chloride concentrations with other high-altitude studies is shown in Table 5. The concentrations of Na+ (1.8±2.3 µg m−3) and Cl− (0.8±1.3 µg m−3) are several times lower than those at Darjeeling in India, which has a concentration of Na+ and Cl− of 2.2±2.0 and 2.3±1.5 µg m−3, respectively. On the other hand, the concentrations of Na+ and Cl− were 4 to 8 times higher than the values reported at Mt. Everest station located at an altitude of 5079 m a.s.l. In addition, the concentration of chloride was in good agreement with those observed in Mt. Cimone, Italy, of 0.8±0.9 µg m−3. Sea salt concentration observed at the AMV (0.4 µg m−3) was 5 times lower than at Tetouan (2.4 µg m−3), a coastal Mediterranean city in northern Morocco, and approximately 20 times lower than at the Cape Verde Atmospheric Observatory (CVAO) located in the tropical Atlantic Ocean (Benchrif et al., 2018; Fomba et al., 2014). The contribution of marine aerosols originating from the Atlantic Ocean remains relatively low compared to other sites but is nevertheless existent.
3.3.4 Ammonium, nitrate, and sulfate
A significant part of PM composition was associated with the formation of secondary inorganic aerosols (SIAs), which are mainly composed of sulfate, nitrate, and ammonium. They made up about 7.2 % of the PM10 mass. The temporal variation during the sampling period of SO, NO, and NH is presented in Fig. 6, with average concentrations of 0.9±0.8, 0.8±0.6, and 0.3±0.2 µg m−3, respectively. In summer, the concentrations were relatively high during a few days in August, with the observation of the highest sulfate, nitrate, and ammonium concentrations of up to 6.1, 4.4, and 1.2 µg m−3, respectively (Fig. 6). This was due to the transport of polluted MCE air masses through the Mediterranean Sea and across cities in the north of Morocco, leading to high PM-loaded aerosols. On average, the influences of long-range transport for the ACE and MCE air masses for sulfate (2.8 µg m−3) and nitrate (2.3 µg m−3) were similar. However, the contribution of ammonium (1.7 µg m−3) to particulate matter was particularly higher for MCE air mass. Additionally, other peaks were also observed in aerosol concentrations for both SO and NO during August. This could be attributed to the long-range transport of dust aerosol from the Saharan desert in southern Morocco. The subsequent months demonstrate a clear decreasing trend of SIA from high concentrations in summer (3.8 µg m−3) to relatively low concentrations during winter (1.0 µg m−3). On average, the sulfate concentration for MCE (1.2±0.9 µg m−3) was about 5 times higher than background sulfate concentrations (0.2±0.2 µg m−3). In addition, non-sea-salt sulfate (nss-SO) represented about 95 % of the total SO at AMV and had a strong correlation with NH, suggesting that secondary sulfate was mainly present as ammonium sulfate (detailed discussion later in Sect. 3.4).
Secondary inorganic aerosol over the Atlas Mountains has been compared with the data reported at other high-altitude stations (Table 5). The average concentration of nitrate (0.8±0.6 µg m−3) at AMV was comparable with those reported at Mt. Himalaya and Mt. Cimone of 0.9±0.2 µg m−3 and 0.8±0.7 µg m−3, respectively (Chatterjee et al., 2010; Marenco et al., 2006). However, the concentration of NO was found to be approximately 2 times higher than the value reported in Puy de Dôme (Bourcier et al., 2012), as shown in Table 5. Two factors cloud be responsible for the high nitrate concentration recorded at AMV. Firstly, the mineral dust particles present in the Middle Atlas region contain calcium carbonates (calcite and dolomite), which can react with nitric acid gas in the atmosphere to form nitrate salts (Krueger et al., 2004; Khrissi et al., 2018). Second, the difference could be explained by long-range transport of polluted air mass from MCE and ACE, which enhanced the nitrate concentration. Similar concentrations of ammonium at AMV (0.3±0.2 µg m−3) were found at Puy de Dôme, France (0.3±0.2 µg m−3), whereas the concentration was 5 times lower than those reported at other high-altitude sites such as Mt. Himalaya (Chatterjee et al., 2010). This indicates that the influence of ammonium remains relatively low despite the proximity of the site to agricultural activities located in the surroundings of Meknes. The concentrations of sulfate (0.9±0.8 µg m−3) over AMV were comparable with those at Puy de Dôme (1.3±1.1 µg m−3) but were almost 4–5 times lower than all the other hilly stations except Mt. Everest (Decesari et al., 2010).
3.3.5 Organic compounds
The identification of the organic chemical compounds enables a better understanding of the organic fraction in the composition of aerosols and the quantification of the contribution of biogenic as well as anthropogenic emissions (Jaenicke, 2005). Therefore, a large number of individual organic chemical compounds were analyzed. Figure 6 shows the temporal variation of organic compounds, including n-alkanes, PAHs, n-alkan-2-ones, and sugars.
n-alkanes
The distinguishing aspect of alkanes is their specific source and their ability to provide information about their origins (Pietrogrande et al., 2010). Individual n-alkanes with C-atom numbers in the range 19–34 were analyzed. Figure 6 shows the temporal variation of the n-alkanes, revealing strong variations over the seasons with an average concentration of about 8.4±7.1 ng m−3. The average concentration decreases from summer (16.1±8.9 ng m−3) to winter (2.6±2.0 ng m−3). On average, the alkane concentration during BAM conditions was about 4.9±3.2 ng m−3 and was dominated by biogenic species such as heneicosane, hentriacontane, and nonacosane, which made up about 60 % of the total alkanes, as shown in Fig. S10. During SD air mass influence, such as in August, high concentrations of alkanes were observed (50.9 ng m−3). The predominant compounds during dust events were pentacosane, hexacosane, heptacosane, and nonacosane, suggesting that OC was loaded with biogenic matter (Pio et al., 2001). MCE air mass influence revealed a considerably high (10.5±7.7 ng m−3) n-alkane concentration with elevated concentrations of typical anthropogenic tracers found on the samples such as nonadecane and tricosane. This indicates that long-range-transported MCE air masses were often loaded with anthropogenic material. While the contribution of MCE and SD air masses to alkanes is 2 times higher than during background conditions, the concentration recorded for ACE of 5.6±3.7 ng m−3 remains relatively similar to BAM conditions. Additionally, organic compounds such as pristane and phytane, which are considered typical molecular markers of traffic emissions, were rarely found in most of the samples. This indicates that the influence of traffic was considerably low.
To distinguish between natural biogenic emissions from plants and incomplete combustion, the carbon preference index (CPI) was also calculated and used as a marker (Alves et al., 2012; Pietrogrande et al., 2011). The part of n-alkanes with an even number of C atoms exceeding the distribution of the average concentration of n-alkanes can be considered to be coming from plant waxes. However, odd C-atom numbers can originate from incomplete biomass combustion (Iinuma et al., 2007). Table 4 presents the CPI values calculated according to each air mass. The average CPI value was 3.8±2.4 and ranged from 0.7 to 18.6. However, high CPI (≫1) was observed for all air masses, which indicates that the alkanes originated from plants waxes, as presented in Table 4 (Kavouras, 2002). In contrast, no values of CPI were recorded close to 1, which shows the minor influence of anthropogenic activities and traffic emissions at AMV. The average concentration of alkanes was dominated by odd C atoms with a concentration of 6.4 ng m−3 compared to 1.9 ng m−3 for even C atoms. During summer, higher concentrations were observed of approximately 39.2 and 10.4 ng m−3 for n-alkanes with odd and even C atoms, respectively. Therefore, the average CPI increase during dust events for SD air mass influence (4.0±3.1) was due to the higher contribution of odd C-atom alkanes. Similar to SD, the average CPI for MCE was about 3.9±1.9 during MCE air mass influence due to the higher contribution of even C-atom alkanes. However, a slight decrease in the mean CPI (3.3±0.80) was observed during BAM conditions occurring mainly during autumn and winter, as the biogenic activity was relatively low compared to the summer. Overall, the most dominant n-alkanes such as nonacosane and hentriacontane were observed for all the air masses, indicating high local influence, and they were typically associated with biogenic activity.
PAHs
In the present study, polycyclic aromatic hydrocarbons (PAHs) with three to seven rings were quantified. The temporal variation of the sum of the 20 identified PAH compounds is presented in Fig. 6. The contribution of PAHs was much lower than alkanes with an average concentration of 0.6±0.8 ng m−3 over the whole study period. Contrary to what has been observed for alkanes, the PAH concentrations determined during the autumn months were higher than those during the summer and winter. The highest amount of PAH was detected during October of approximately 5.7 ng m−3 due to long-range transport of MCE air masses, as shown in Fig. 6. The minimum concentration was observed during winter of about 0.05 ng m−3. The average background concentration of PAHs was 0.4±0.5 µg m−3, which was low in comparison to other organic compounds, likely because of high evaporation on warm days (Cincinelli et al., 2007). For MCE air mass, the PAH concentrations increased by 52 % compared to the BAM concentration, as shown in Table 4. The most abundant PAHs found in the BAM samples were fluorene and retene, which represent 75 % of total background PAH concentrations. An abundance of fluorene (Fa) and retene (Rete) was found in samples from different air masses, suggesting that they potentially originate from similar local or regional emission sources. Moreover, fluorene and retene are marker compounds for wood combustion or combustion of organic substances, but they are also found in trace concentrations in the combustion of gasoline or diesel (Spindler et al., 2012). Other compounds such as coronene, dibenzo(ah)anthracene, and phenanthrene were observed during long-range transport of polluted air masses for MCE air mass influence. The contribution of PAHs was lower for ACE (0.4±0.4 µg m−3) air masses than for MCE air mass influence, which indicates that not all long-range transport was loaded with combustion tracers. The average PAH concentration was higher for SD than ACE air masses (about 0.7±0.7 µg m−3). The most abundant compounds were fluorene and 9H-fluorenone, which were found within a similar concentration range. Therefore, mineral dust transport was not affected by the combustion processes. As a result, the observation of the PAH concentration shows a strong variation, with high biogenic activities in the surroundings during summer and high anthropogenic PAHs during pollution episodes from combustion processes in autumn.
n-alkan-2-ones
In total, five n-alkan-2-ones were detected in this study, as shown in Fig. S8. The n-alkan-2-one concentrations increased significantly from summer (1.8 ng m−3) to autumn (9.7 ng m−3), then decreased continuously to winter (6.3 ng m−3), with an average of 6.6 ng m−3 for the whole sampling period. The minimum concentration was recorded during the summer of about 0.6 ng m−3. In contrast, the maximum concentration was reached during autumn of about 52 ng m−3 due to ACE air mass influence, as shown in Fig. 6. The sum of n-alkane-2-ones was between 0.67 and 13.2 ng m−3. The same relative composition of n-alkan-2-one concentrations was observed in both seasons, suggesting that they came from similar sources. However, the levels of n-alkan-2-one were much lower in concentration than those of n-alkanes. The average background concentration of the total n-alkan-2-one was 5.9±5.5 ng m−3. During this period, major n-alkan-2-one constituents recorded at AMV were 2-nonadecanone, 2-heptadecanone, and 2-octadecanone, which represented 29 %, 25 %, and 18 % of the total detected n-alkan-2-ones, respectively. These organic compounds that appear in fossil fuel burning events were found in low concentrations at the AMV. The remaining part was made up of 2-hexadecanone and 2-octadecanone, which made up 15.6 % and 6.2 % of the total n-alkan-2-ones, respectively. The discrepancy of n-alkan-2-one concentrations in comparison to BAM chemical composition was low from August to October. The trend is completely reversed, as the average concentration was significantly elevated during November and December. During these two months, the concentration increased by 35 %. Some spikes detected in November and December are characterized by a change in wind direction and high wind speeds. These samples, with higher concentrations for 2-heptadecanone and 2-nonadecanone, show a strong correlation with temperature. Indeed, this period marks the beginning of winter, with average temperatures dropping as low as 5 ∘C, as shown in Table 1. No correlation between alkane-2-ones was found with elemental carbon, but the analysis of the data shows a strong correlation only for the night samples with As and K+. This indicates that a possible source of the n-alkan-2-ones is combustion due to residential heating. These data present the first measurement made that shows the influence of combustion in North Africa on n-alkan-2-one concentrations. Similar conclusions were reported by Müller (1997), who highlighted the anthropogenic source of alkane-2-ones during winter.
Two main sources are known to be responsible for the presence of n-alkane-2-one in the air: incomplete combustion and in situ microbial α oxidation of the carbon chain (Khedidji et al., 2020). The first source often creates n-alkane-2-one with a predominance of odd-numbered carbon atoms; on the other hand, the last source gives rise to the opposite. In the present study, a strong predominance of odd n-alkane-2-one rather than pairs was observed, suggesting that the incomplete combustion of organic material was the principal ambient source in this region. In particular, heptadecane-2-one (K17) was the most abundant in all the samples and reached a maximum of 5.2 ng m−3.
Sugar alcohols
Three main sugar alcohols, which are levoglucosan, arabitol, and glucose, were identified between August 2011 and December 2017 in the AMV samples. The sugar concentration levels in the aerosol samples ranged from 0.02 to 39.6 ng m−3. The average concentrations of sugar compounds were higher during summer (7.9 ng m−3) and decreased continually until November (1.2 ng m−3). During December, the concentrations were relatively higher than November (2.1 ng m−3) when some high peaks were observed. Glucose was about 5 times higher in summer than in winter. Notably, there were 3 extreme days on which high sugar concentrations were observed, as shown in Fig. 6: 13 August 2017 (39.6 ng m−3), 18 September 2017 (ng m−3), and 20 October (28.6 ng m−3). These peaks are due to the long-range transport from the coast of Europe (ACE) and the coast of the Mediterranean Sea (MCE). The average sugar concentrations during these air mass influences were 3.7±6.0 ng m−3 (ACE) and 5.2±7.7 ng m−3 (MCE), as listed in Table 4. In contrast, sugar compounds were relatively low in SD (1.8±2.9 ng m−3) air masses and were not found in the background PM10 conditions. Levoglucosan, which is considered a good tracer of biomass burning emissions in aerosol particulate matter, was particularly higher for ACE (2.0 ng m−3) and MCE (1.6 ng m−3) air mass influence, as displayed in Fig. S10. (Bauer et al., 2008). Arabitol shows a similar concentration for MCE and ACE with a mean of 1.0 ng m−3, suggesting that particles were loaded with primary biological aerosols such as pollen, fungal spores, vegetative debris, viruses, and bacteria from the marine coast (Fu et al., 2012). Glucose remained relatively high during MCE air mass influence in comparison to other air mass influences. During SD air mass influence, the concentration of arabitol was extremely low with a concentration less than 0.08 ng m−3. However, glucose showed a higher concentration of about 0.7 ng m−3 but remains 3 times lower than MCE concentrations. This indicates that the sugars most likely originated from marine air masses.
To conclude, sugars have two potential major sources at AMV: a natural biological source from marine air masses including MCE and ACE and an anthropogenic source from biomass burning, potentially from urban cities close to the site. The contribution of arabitol and glucose was significantly higher during the summer, which is linked to more developed vegetation and higher biogenic activity, and, in contrast to winter, levoglucosan was higher.
3.3.6 Crustal enrichment factor
Analysis of the crustal enrichment factor (EF) has been used to estimate the contributions of crustal matter to the ambient PM10 particles at AMV. For this study, titanium (Ti) was used as a reference element due to the low recovery of Al and high recovery of Ti, and as it is also considered a suitable tracer for mineral dust (Fomba et al., 2013). Furthermore, Al or Fe has more anthropogenic sources than Ti. However, the comparison of EFs for Ti and Al as reference elements shows a similar trend, with only slight differences observed in the absolute values. The average upper continental crust composition, according to Wedepohl (1995), was used for the calculation of the enrichment factors. The EF relative to Ti was calculated using Eq. (2) as follows:
The enrichment factor provides the ability to classify metals based on their enrichment to the soil. Elements with an EF under 2 are considered to have a composition similar to the reference soil values. An enrichment factor above 2 but below 10 is assumed to have low enrichment with a possible mixture of both crustal and non-crustal sources. Elements with an EF above 10 are considered enriched, while enrichment factors above 100 are considered highly enriched, suggesting that the elements are from non-crustal and more likely anthropogenic sources. The enrichment factor does not take into account each pollution episode but is a general approach to the classification of metals according to their crustal origin. Within the present study, the elemental enrichment factors showed similar trends for the different air mass inflow to the station. Three groups of elements could be identified from the elemental enrichment factors. Figure 7 shows the average PM10 elemental crustal enrichment factors at AMV according to the respective air mass origins.
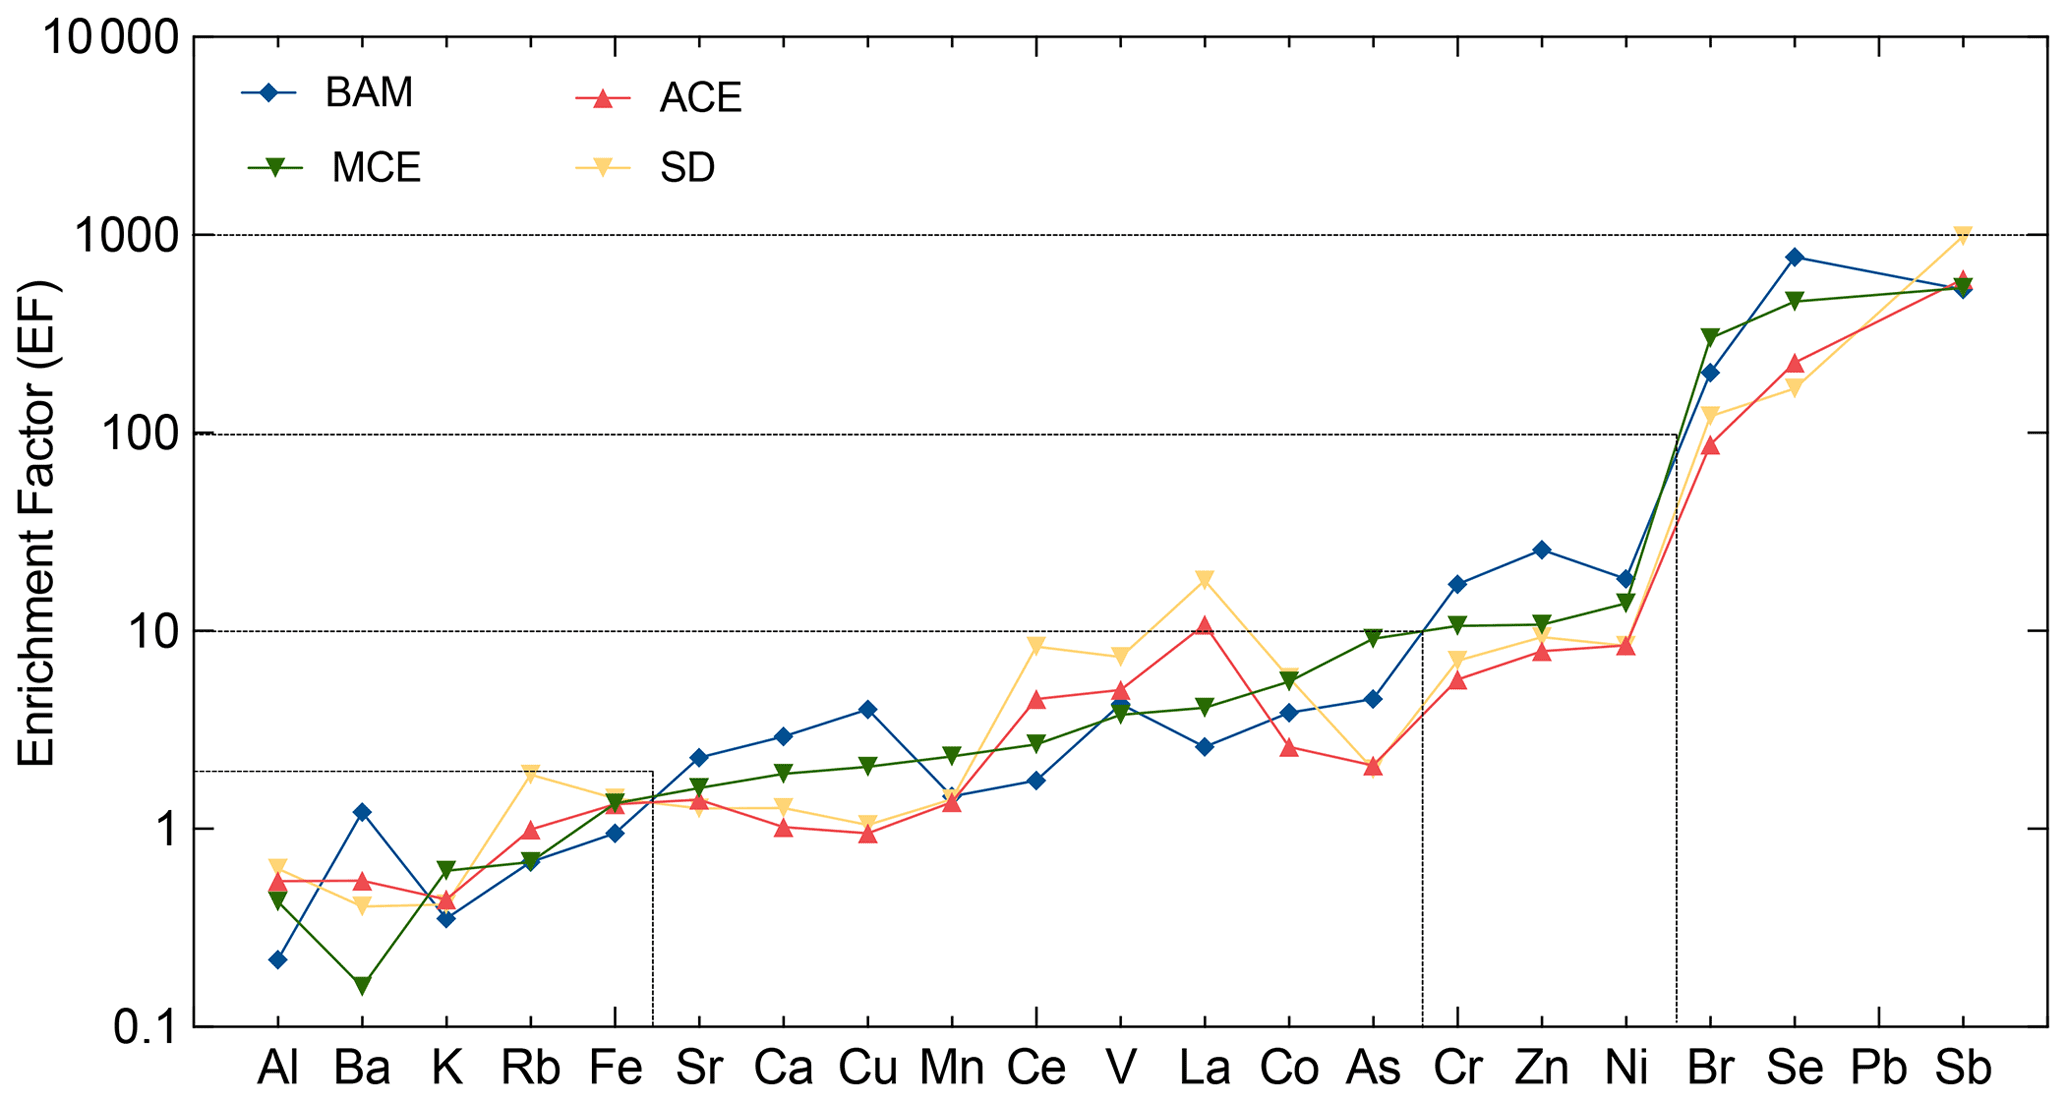
Figure 7Crustal enrichment factors (EFs) of aerosol PM10 evaluated for the different trace metal elements at AMV. The averaged values are plotted according to their respective air mass origins.
Group I includes elements such as Al, Ba, Rb, K, and Fe with enrichment factors between 0.8 and 2. Their enrichment factors suggest that these elements are associated with particulate matter from the resuspension of soil or other crustal sources. Elements such as Al, Fe, and Mn show little dispersion, and their variation seems to be constant across different air masses, clearly indicating that the source was soil. As suggested by other studies, these metals could also have an anthropogenic source, but in this study, they clearly showed crustal matter origin (Viana et al., 2008; Birmili et al., 2006; Contini et al., 2012). On one hand, no correlation was found between Al, Fe, and anthropogenic tracers such as EC or other heavy metals, which indicates their natural origin. On the other hand, K showed slightly higher EFs for air masses from the Atlantic Ocean, suggesting that sea salt and sources other than mineral dust, such as biomass combustion, might have contributed to its presence.
Group II elements include heavy metals such as Sr, Ca, Cu, Mn, Ce, V, La, Co, and As. These elements had enrichment factors ranging from 2 to 10, indicating the possibility of having mixed origin from both crustal and anthropogenic sources. The lowest enrichment factors were observed during BAM, suggesting that the elements may have been of crustal origin. In contrast, the highest enrichment factors were mainly observed in air masses that originated from the coast of Europe (ACE) and crossed major urban cities such as Rabat–Salé–Kenitra and Casablanca before arriving at Atlas station M5. In this case, it is assumed that these elements were probably influenced during transport by anthropogenic emissions. In contrast, the Mediterranean Sea air mass appears to have remained relatively unaffected by anthropogenic emissions. In addition to its atmospheric crustal origin, V had a high enrichment factor, mainly due to residual oil combustion, especially at night. Particles from oil combustion processes were often observed in high concentrations during winter due to their size, long lifetime in the atmosphere, and the combustion activities in the nearby urban cities.
Group III contains the elements with EF from 10 to 1000, including heavy metals such as Cr, Zn, Ni, and Pb, as well as Br, Se, and Sb. These elements showed high enrichment factors in all air mass directions. They are mainly present in the marine air masses of the Atlantic, but also the Mediterranean air masses. An increase in heavy metal concentration has been observed during winter and at night when the temperature drops and the air mass inflow from the cities towards the mountain prevails. Atmospheric Ni and Cr are released during combustion processes, while Pb is mainly released from smelters or the combustion of unleaded petrol, waste, and coal (Pacyna et al., 2007). Combustion processes are generally the main contributors to these anthropogenic metals. Zn had a weak correlation with Pb and Ni, suggesting that its origin is also anthropogenic. The nearest urban cities are Meknes and Fes, where anthropogenic activities such as waste incineration and road traffic pollution are common. Furthermore, the ratio was observed to be higher for the MCE air mass at about 2.8, which is considered typical for heavy fuel oil combustion (Mazzei et al., 2008; Pandolfi et al., 2009; Bove et al., 2014).
3.4 Inter-relationship between aerosol components
The inter-relationship between the different species and the scatter plots are presented in Fig. 8. The analysis of the single correlation coefficients allows obtaining information about the possible common sources of aerosol.

Figure 8Scatter plot of (a) NH with NO and nss-SO during summer; (b) NH with NO and nss-SO during autumn–winter; (c) Na+ and Cl SO for ACE air mass; (d) Na+ and Cl NO for MCE air mass at the AMV site.
3.4.1 Nitrate and nss-sulfate
The correlation between NO and nss-SO (r2=0.76) indicates their possible common origin. The correlation was more pronounced for MCE air masses (r2=0.80) in contrast to ACE (r2=0.43) air masses, suggesting an enhanced transport of secondary anthropogenic aerosol from the Mediterranean coast (Liu et al., 2017) to the AMV site. The nss-sulfate concentrations were slightly correlated with vanadium, which is associated with the emissions of oil combustion, ship emissions, and iron and steel industrial emissions (Pandolfi et al., 2011). A strong correlation of NO and nss-SO was observed with oxalate (C2H), which could indicate that they have a common source and that they originate from biomass burning and secondary transformations. Nss-SO also originated from crustal sources, especially as elevated concentrations were observed during dust events. This assertion was supported by a good correlation of nss-SO with nss-Ca2+ (Fig. S7), indicating the likely presence of calcite particles of crustal origin. A similar observation was reported by Okada and Kai (2004), who observed that desert dust was associated with sulfur compounds and organic matter from surrounding agricultural areas. Indeed, the particles with high sulfate content were accompanied by Ca and were assigned as gypsum particles, also suggesting that the sulfur in these particles originated from a sedimentary source (Falkovich et al., 2001).
3.4.2 Ammonium nitrate and ammonium sulfate
The analysis of the correlation matrices between nss-SO and NO with ammonium (NH) was applied to better understand the inter-relationship between the secondary inorganic species. A correlation between nss-SO and NH (r2=0.90) supported the hypothesis of dominant ammonium sulfate particles (NH4)2SO4 in the summer, especially when air masses were coming from ACE, as shown in Fig. 8. During this period, a strong correlation was found between sulfate and solar radiation, which suggests that nss-SO was produced via photochemical reaction (Baker and Scheff, 2007). Nevertheless, the transport of nss-SO from the Atlantic coast also contributes to the formation of ammonium sulfate. However, the trend is more towards ammonium nitrate (NH4NO3) in winter, given that the main correlation of NH with NO (r2=0.95) is mainly present in MCE air masses. Nitrate shows a strong dependency on the temperature at AMV, most likely due to the stability of ammonium nitrate in the atmosphere at low temperatures (Squizzato et al., 2013). The predominance of nitrates over sulfates during winter, when nitrates and ammonium remain high, is probably due to the influence of temperature that prevents the dissociation of ammonium nitrate particles (Ricciardelli et al., 2017). Moreover, a similar pattern of NO and NH was observed by Querol et al. (2004) at the Mediterranean coast with a summer minimum, and the authors suggested that it could be due to the low thermal stability of nitrate in the hot season.
3.4.3 Sodium and chlorine
The evolution of the sea salt constituents and their relationship with the most important aerosol acidic species such as NO and SO were investigated according to their air mass origins (Fig. 8). A correlation between sodium and chlorine was observed (r2=0.76), as shown in Fig. 8. The scatter plot of molar equivalent concentrations of Na+ and Cl− shows a strong correlation, specifically for ACE and SD air masses. However, the data points are below the seawater reference line and only approach this line when the Cl− concentration is combined with NO and nss-SO. This indicates that chloride was depleted in the sea salt particles due to the displacement of chloride by sulfate from sulfuric acid when air masses were coming from MCE and ACE, especially as photochemical processes favor sulfate formation during summer. The same scenario has been observed for NO with a considerable difference during the winter. Indeed, the correlation between sodium and the sum of chloride and nitrate shows chloride depletion and indicates that the Mediterranean Sea air mass was loaded with aged sea salt. Similar results were observed in the north of Morocco where the mass fraction of nitrate was higher in the coarse fraction, which indeed corresponds to aged sea salt (Benchrif et al., 2018). No correlation between Na+ and Cl− was observed in the BAM conditions.
3.5 Day and nighttime variation
3.5.1 Inorganic ions, mineral dust, and organic carbon (OC)
Diurnal variations of various PM10 chemical species were analyzed to understand the influence of day and night variations on their concentrations. Figure 9 shows the variation for given chemical species. The OC increase from nighttime (0.9 µg m−3) to the day (1.2 µg m−3) was accompanied by a slight increase in alkanes such as pristane, docosane, and nonacosane, as observed in Fig. 9a. These alkanes indicate that the organic fraction was dominated by biogenic sources during the day. The highest concentrations of biogenic compounds were reached during the summer. During summer, higher concentrations of Al (0.6 µg m−3) and Fe (0.7 µg m−3) were observed during the day compared to the night. This increase seems to be related to an additional source from the resuspension of road dust due to car traffic during the day. Nevertheless, the transport of mineral dust tracers from the Saharan dust could be controlled by other factors. For example, the study done by Khan et al. (2015) indicates that the penetration of dust into the free troposphere in the Atlas Mountains can also be due to orographic lifting, convection on the mountain slopes, and updrafts in the breeze front, while the Ca2+ concentration, which is approximately 0.6 µg m−3, seems stable between day and night. The continuous presence of calcium indicates that it comes from a different source, most likely local or regional. This difference in trace metal concentrations shows the important role that calcium plays as a local source.
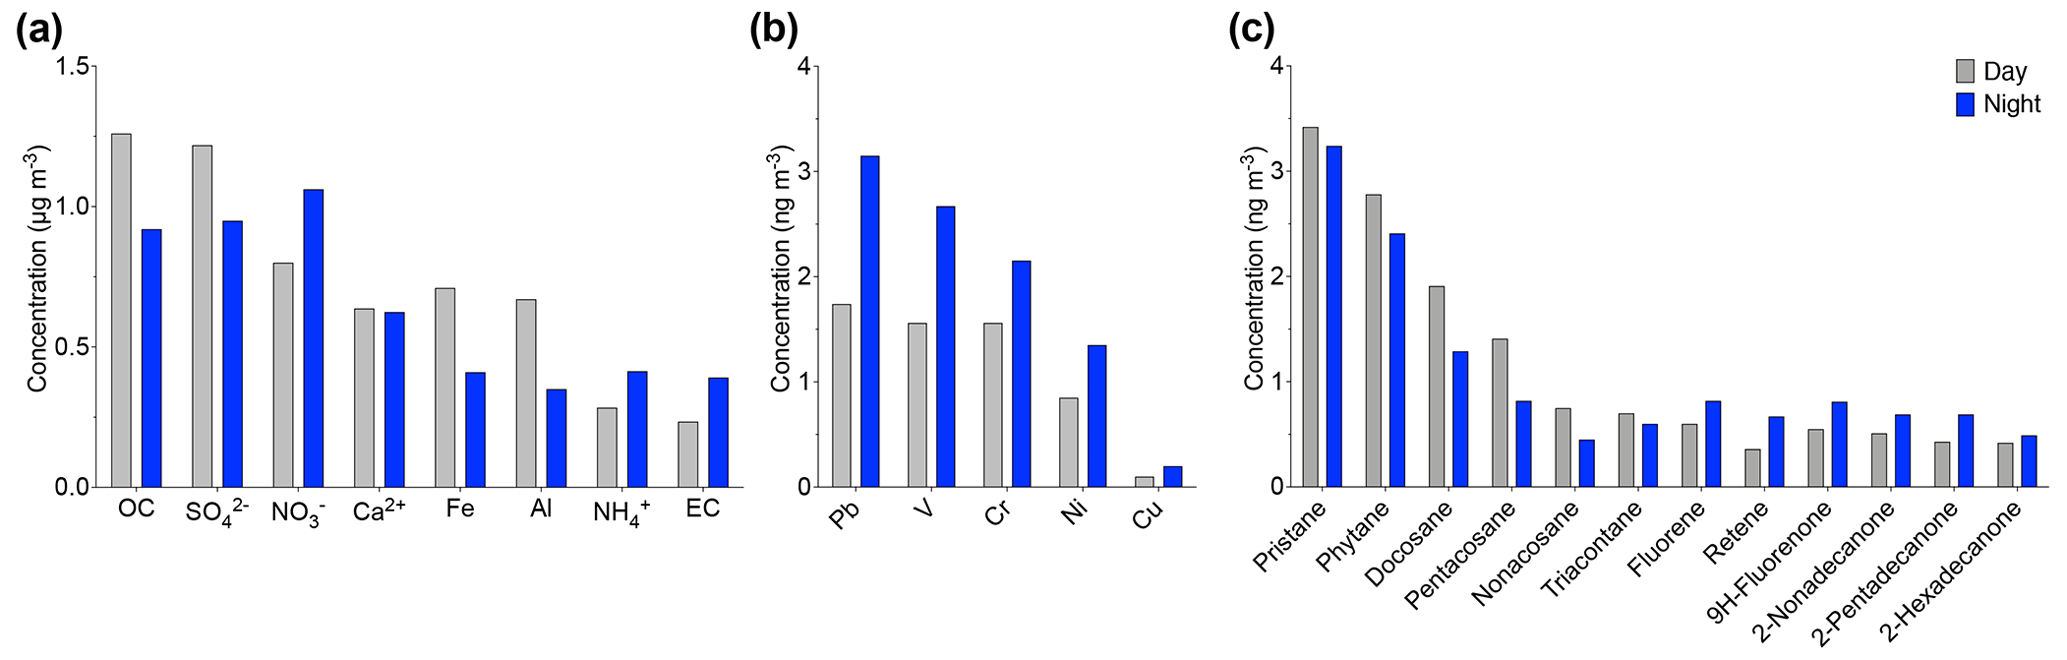
Figure 9Day and nighttime variation of (a) OC, EC, ionic chemical species, (b) anthropogenic metals, and (c) organic compounds such as alkanes, PAHs, and alkane-2-ones.
3.5.2 Elemental carbon (EC), anthropogenic metals, and PAHs
The composition of PM10 in the evening is characterized by a high concentration of anthropogenic trace elements. The EC concentrations slightly increased in the evening from 0.2 to 0.3 µg m−3. Also, an increase in PAHs and alkane-2-one concentrations such as fluorene, retene, and 2-nonadecanone was observed during the nighttime. The PAH concentrations during the day and nighttime were 0.6 and 0.8 µg m−3, respectively. In particular, fluorene was the most abundant PAH in all the night samples and reached a maximum of 2.6 ng m−3. A correlation (r2=0.67) was found between PAHs and EC during nighttime, indicating their anthropogenic origins. In addition, anthropogenic metals such as Pb, Cr, V, Cr, Ni, and Cu associated with combustion and traffic emissions increase by a factor of 1.8 during the evening (Fig. 9b). Indeed, the anthropogenic influence at the AMV site occurs during the evening due to two important factors. First, the site is in a mountainous region influenced by the temperature fluctuation between day and night. The rapid cooling between day and night was accompanied by a change in aerosol sources. This phenomenon is widespread, especially in summer. Second, the variation of the air mass, combined with a change in the height of the boundary layer, contributes to the transport of pollutants from the urban sites Fes and Meknes to the AMV site.
3.5.3 Influence of meteorology
The variation of the meteorological parameters between day and night is a critical factor that can indeed influence the chemical composition of the particles. First, a significant difference in PM10 was observed on days when the day and night temperature difference was substantial, for example, on 12 August. The concentration decreased during the day (113 µg m−3) to 80.4 µg m−3 at night. Second, the influence of meteorology on secondary inorganic aerosols, such as sulfate and nitrate, was characterized by different variations between day and night. On the one hand, the sulfate is slightly enhanced from night (0.9 µg m−3) to the day (1.2 µg m−3). This increase during the day could be explained partly by sulfate originating from dust resuspension. However, a correlation between solar radiation and sulfate suggests that photo-oxidation during the day could also be a source of the sulfate increase, whereas nitrate recorded during the day (0.8 µg m−3) shows higher concentrations during the night (1.0 µg m−3). The drop in temperature between the day and the night, especially during the winter, allows for the rapid formation of ammonium nitrate.
3.5.4 Mechanism of day–night variation
In principle, two mechanisms control the variation between day and night: the wind direction and the boundary layer height. The wind direction plays an important role because it introduces air mass transported from different sources. Indeed, the wind blows from all directions, but it is dominated from the east section during the day and by the west during the night, as shown in Fig. S10. High speeds were recorded during the night up to 17.5 m s−1, mostly associated with marine air masses. This suggests that long-distance transport often occurred during the night, while the wind speed during the day was relatively lower. The lower wind speed during the day indicates that the influence of local sources is important. Furthermore, the topography and the embedded valleys also play a role in the pollution transport during the daytime, as shown by Lang et al. (2015). Mountains can give rise to daytime upslope winds and nighttime downslope winds. The valley bottom warms during the day; warm air rises up the slopes of the surrounding mountains and hills to create a valley breeze. During nighttime, radiation from the Earth's surface cools the slopes, causing cooler, denser air to drain into the valley. In addition, local boundary layer processes and long-range transport contribute to chemical composition changes (Nair et al., 2007). A similar impact of mountain–valley circulations on air pollution was observed by Bei et al. (2018). Studies at high-altitude sites in southwestern India have also found that diurnal variations of aerosol particle concentrations were related to mountain–valley winds and the variation in planetary boundary layer height (Buchunde et al., 2019).
3.6 Differences in chemical composition between dust and non-dust events
To investigate the impact of the dust event on the PM10 chemical composition, the data have been segregated into two categories: dust and non-dust episode. Only selected days with a high influence of Saharan air mass with Al >1 µg m−3 were representative for dust event days. This approach was previously used by Koçak et al. (2012) to investigate the influence of mineral dust in the eastern Mediterranean. The non-dust samples were categorized based on aerosol Al concentrations (Al <1 µg m−3). All the samples that constitute a mixing scenario were excluded. Figure 10 shows the average concentrations of (a) PM10 mass, (b) and ratios, (c) OC and major ionic species, (d) EC and minor ionic species, and (e) organic compounds during non-dust and dust events.
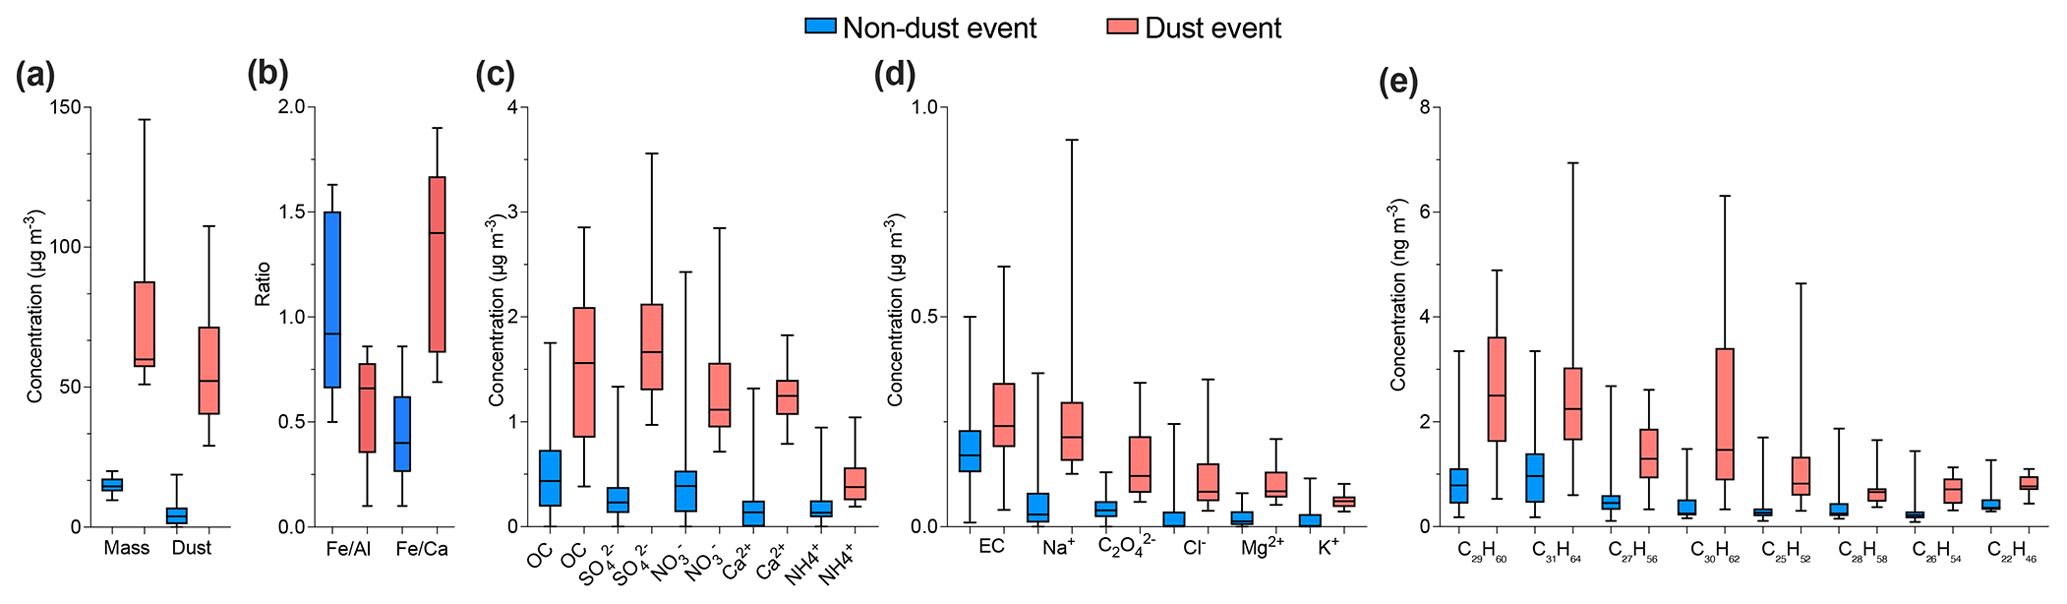
Figure 10Box plot in the period of dust and non-dust events for concentrations of (a) PM10 mass and mineral dust, (b) and ratios, (c) OC and major water-soluble ions, (d) EC and minor water-soluble ions, and (e) organic compounds.
3.6.1 Mass
The long-range transport of mineral dust showed a significant impact on PM10 composition. During dust events, PM10 concentrations were on average 3 times higher and up to a maximum of 10 times higher in comparison to non-dust days. Mineral dust was about 5 times higher in comparison to non-dust samples (Fig. 10a). In addition, RH was lower during dust event days, ranging from 20 % to 45 %, whereas it was 50 % to 70 % on the non-dust days. Similar results were observed by Mukherjee et al., (2020), showing the impact of dust on the local meteorological conditions.
3.6.2 Minerals, metals, and ions
Aerosol inorganic species demonstrate distinct differences in chemical composition between dust and non-dust events. Although the North African mineral dust is mainly made up of clay minerals and quartz, the content of calcium carbonates varies depending on the North African source (Chiapello et al., 1997; Glaccum and Prospero, 1980). A comparison between and ratios was used to provide the potential geographical origin of mineral dust according to its chemical composition (Formenti et al., 2014). The variability of the ratio was relatively low (0.9) during non-dust events and decreased to about 0.6 during the dust events, as shown in Fig. 10b. The ratio was also used to make distinctions amongst sources. It was found that, on average, the ratio was 1.4 during dust events and 0.4 during non-dust events. These ratios, which are robust indicators of large-scale mineral dust source variation, were supported by air mass backward trajectories.
The back-trajectory analysis indicates that particles during dust events came from the Saharan region of Mauritania and southern Morocco, as also highlighted by their high ratio, while mineral dust during BAM as described above was from local sources emitted as road dust or resuspension from agricultural activities. ratios close to 0.4 indicate that the dust comes from the south, while ratios higher than 1 indicate that the dust comes from the east. The average ratio obtained at the station was 0.54, which suggests that the dust often originated from southern Morocco. During the dust event, the ratio reached 1.9, which suggests long-distance transport of the dust from the eastern Saharan regions; this agrees with the pollution rose, which indicates high concentrations from southeast winds.
An increase in the concentration of many ions was also observed during dust events. Sulfate, nitrate, calcium, and ammonium showed an increase in the average concentration of about a factor of 4.5, while chloride, magnesium, and potassium experienced an increase in their concentrations by a factor of 5 (Fig. 10c and d). During dust events, sodium concentration also experienced an increase by a factor of 3. Its correlation with iron and aluminum suggested its possible soil origin. Other metals of anthropogenic origin (not plotted), such as Cu, Ni, and Pb, showed no significant difference between dust and non-dust events.
3.6.3 Organics
Figure 10c reveals that organic carbon increased averagely during the dust event from 0.5 to 3.5 µg m−3. Samples collected during the dust period showed a strong correlation between organic matter and other elements of crustal origin such as nss-Ca2+ and nss-Mg2+. The ratio was in the range of 4–6 during the dust period, while the ratio was lower than 3 during BAM, which suggests that the organic fraction was affected by desert dust particles. Specifically, there is a clear correlation between Fe, Mn, Al, K+, Ca2+, OC, and to a lesser extent Mg2+. During this period, a correlation was observed for OC and some organic species (nonacosane and heptacosane) with mineral elements such as calcium (r2=0.81) and magnesium (r2=0.73). During the winter, this relationship became practically insignificant (r2=0.15). This suggests a possible common origin of this species, with is crustal mineral aerosol, as is also confirmed by the low enrichment factor of all the species mentioned. Some organic compounds increase during dust events, especially odd alkanes such as nonaconsane, hentriacontane, heptacosane, and tricosane, by a factor of 4. In contrast, elemental carbon remains globally constant with marginal changes (Fig. 10e). The PAH fluorene showed similar concentrations during dust events and background conditions, indicating that Saharan dust was not a significant source. An increase of about 65 % was observed for pentacosane, octacosane, hexacosane, and decosane. Due to the biodiversity of several plant species and remarkable microbiological activity surrounding the Atlas regions, an increase in some organic compounds and the organic matter fraction suggests that mineral dust was loaded with biogenic compounds during dust transport.
In the present study, PM10 particulate matter was chemically characterized at the newly established AMV research station located in the Middle Atlas region (Morocco) at an altitude of 2100 m from August to December 2017. The aerosol chemical composition was evaluated during remote background conditions, and the main air mass origins were identified. The data show an overview of the background chemical composition and the different sources affecting aerosol composition at such a remote high-altitude site. The influence of desert dust was investigated as the site location is close to the Sahara.
Despite the proximity of the site to the Saharan desert, the influence of the desert on the atmospheric composition at this altitude was only seasonal. PM10 mass concentration showed a decreasing trend, with high concentrations during summer due to dust events, and was significantly reduced during autumn due to the wash-out effect from enhanced rainfall. Four main air mass inflows at the site were identified using back-trajectory analysis, with each air mass distinguished by different chemical compositions. The influence of marine air mass from the Mediterranean Sea is prevalent at AMV and made up 37 % of all air masses. The chemical composition in the Middle Atlas during the sampling period is mainly dominated by locally emitted dust (61 %) with a high contribution from road dust, ionic species (7 %), organic matter (7 %), water content (12 %), and indeterminate mass (11 %). Biogenic organics contributed up to 7 % of the organic matter. Organic matter increased during dust events due to biogenic crustal material emissions. Diurnal variation of PM was related to the variation in the planetary boundary layer, mountain–valley winds, and changes in different local sources. Mineral dust influence was seasonal and ranged between 20 % and 74 % of the mass concentration on PM10, with peaks observed during the summer accompanied by high concentrations of SO of up to 3.0 µg m−3.
During winter, PM10 concentrations are low, the influence of the desert is weaker, and the marine air masses are more dominant, with a mixture of polluted aerosol from the coastal regions of Rabat and Casablanca, and sea salt is observed. High concentrations of mineral dust were observed during the daytime due to the resuspension of road dust, while an increase in PAHs and anthropogenic metals such as Pb, Ni, and Cu was found during nighttime because of the boundary layer variation. Data show that proximity to the desert does not necessarily imply constant exposure to mineral dust. Furthermore, topography and temperature variation at mountain sites control PM concentrations.
This is the first high-altitude aerosol characterization study in North Africa, which fills an important gap in the African region. The data from the AMV sites thus present a reference for aerosol particle composition under regional background conditions as well as during the influence of continental air masses. Several other studies are needed to better understand the influence of the desert on the chemical composition but also the microphysical properties in the Middle Atlas region. In this study, only the chemical composition of bulk PM10 particles was investigated; however, the size distribution remains an important factor and should be considered in further studies. An additional study on the chemical composition of the urban cities near the AMV, especially in Fes, would allow a better understanding of the anthropogenic influence in the north of Morocco.
All data will be made available upon request to the authors.
The supplement related to this article is available online at: https://doi.org/10.5194/acp-21-18147-2021-supplement.
AM, HH, and SEH designed the experiment at the AMV station; KWF and ND performed the fieldwork, collected the samples, and performed the data analysis. ND performed the laboratory investigations, compiled the final figures, and wrote the article. LP contributed to the back-trajectory calculation and the classification of air masses. ND and KWF undertook the results interpretation to which HH contributed. SZ contributed to text improvement for certain sections of the paper. All authors reviewed, edited, and contributed to the article.
The contact author has declared that neither they nor their co-authors have any competing interests.
Publisher's note: Copernicus Publications remains neutral with regard to jurisdictional claims in published maps and institutional affiliations.
The authors would like to thank Ibrahim Ouchen, Sayf El Islam Barcha, and Mehdi El Baramoussi for their efforts in sample collection at the AMV and the TROPOS laboratory assistants for their helpful work, including Kangwei Li, Julia Wilk, Susanne Fuchs, Sylvia Haferkorn, and Cornelia Pielok. All are greatly appreciated.
This research has been supported by Horizon 2020 (MARSU (grant no. 690958)).
This paper was edited by Eduardo Landulfo and reviewed by three anonymous referees.
Alastuey, A., Querol, X., Castillo, S., Escudero, M., Avila, A., Cuevas, E., Torres, C., Romero, P., Exposito, F., and Garcia, O.: Characterisation of TSP and PM2.5 at Izaña and Sta. Cruz de Tenerife (Canary Islands, Spain) during a Saharan Dust Episode (July 2002), Atmospheric Environment, 39, 4715–4728, https://doi.org/10.1016/j.atmosenv.2005.04.018, 2005.
Alves, C., Vicente, A., Pio, C., Kiss, G., Hoffer, A., Decesari, S., Prevôt, A. S. H., Minguillón, M. C., Querol, X., Hillamo, R., Spindler, G., and Swietlicki, E.: Organic compounds in aerosols from selected European sites – Biogenic versus anthropogenic sources, Atmos. Environ., 59, 243–255, https://doi.org/10.1016/j.atmosenv.2012.06.013, 2012.
Ambrose, J. L., Reidmiller, D. R., and Jaffe, D. A.: Causes of high O3 in the lower free troposphere over the Pacific Northwest as observed at the Mt. Bachelor Observatory, Atmos. Environ., 45, 5302–5315, https://doi.org/10.1016/j.atmosenv.2011.06.056, 2011.
Amodio, M., Catino, S., Dambruoso, P. R., de Gennaro, G., Di Gilio, A., Giungato, P., Laiola, E., Marzocca, A., Mazzone, A., Sardaro, A., and Tutino, M.: Atmospheric Deposition: Sampling Procedures, Analytical Methods, and Main Recent Findings from the Scientific Literature, Adv. Meteorol., 2014, 1–27, https://doi.org/10.1155/2014/161730, 2014.
Arimoto, R., Kim, Y. J., Kim, Y. P., Quinn, P. K., Bates, T. S., Anderson, T. L., Gong, S., Uno, I., Chin, M., Huebert, B. J., Clarke, A. D., Shinozuka, Y., Weber, R. J., Anderson, J. R., Guazzotti, S. A., Sullivan, R. C., Sodeman, D. A., Prather, K. A., and Sokolik, I. N.: Characterization of Asian Dust during ACE-Asia, Global Planet. Change, 52, 23–56, https://doi.org/10.1016/j.gloplacha.2006.02.013, 2006.
Astitha, M., Kallos, G., Spyrou, C., O'Hirok, W., Lelieveld, J., and Denier van der Gon, H. A. C.: Modelling the chemically aged and mixed aerosols over the eastern central Atlantic Ocean – potential impacts, Atmos. Chem. Phys., 10, 5797–5822, https://doi.org/10.5194/acp-10-5797-2010, 2010.
Baker, K. and Scheff, P.: Photochemical model performance for PM2.5 sulfate, nitrate, ammonium, and precursor species SO2, HNO3, and NH3 at background monitor locations in the central and eastern United States, Atmos. Environ., 41, 6185–6195, https://doi.org/10.1016/j.atmosenv.2007.04.006, 2007.
Bauer, H., Schueller, E., Weinke, G., Berger, A., Hitzenberger, R., Marr, I. L., and Puxbaum, H.: Significant contributions of fungal spores to the organic carbon and to the aerosol mass balance of the urban atmospheric aerosol, Atmos. Environ., 42, 5542–5549, https://doi.org/10.1016/j.atmosenv.2008.03.019, 2008.
Bei, N., Zhao, L., Wu, J., Li, X., Feng, T., and Li, G.: Impacts of sea-land and mountain-valley circulations on the air pollution in Beijing-Tianjin-Hebei (BTH): A case study, Environ. Pollut., 234, 429–438, https://doi.org/10.1016/j.envpol.2017.11.066, 2018.
Benchrif, A., Guinot, B., Bounakhla, M., Cachier, H., Damnati, B., and Baghdad, B.: Aerosols in Northern Morocco: Input pathways and their chemical fingerprint, Atmos. Environ., 174, 140–147, https://doi.org/10.1016/j.atmosenv.2017.11.047, 2018.
Bey, I., Jacob, D. J., Yantosca, R. M., Logan, J. A., Field, B. D., Fiore, A. M., Li, Q., Liu, H. Y., Mickley, L. J., and Schultz, M. G.: Global modeling of tropospheric chemistry with assimilated meteorology: Model description and evaluation, J. Geophys. Res., 106, 23073–23095, https://doi.org/10.1029/2001JD000807, 2001.
Birmili, W., Allen, A. G., Bary, F., and Harrison, R. M.: Trace Metal Concentrations and Water Solubility in Size-Fractionated Atmospheric Particles and Influence of Road Traffic, Environ. Sci. Technol., 40, 1144–1153, https://doi.org/10.1021/es0486925, 2006.
Bourcier, L., Sellegri, K., Chausse, P., Pichon, J. M., and Laj, P.: Seasonal variation of water-soluble inorganic components in aerosol size-segregated at the puy de Dôme station (1,465 m a.s.l.), France, J. Atmos. Chem., 69, 47–66, https://doi.org/10.1007/s10874-012-9229-2, 2012.
Bove, M. C., Brotto, P., Cassola, F., Cuccia, E., Massabò, D., Mazzino, A., Piazzalunga, A., and Prati, P.: An integrated PM2.5 source apportionment study: Positive Matrix Factorisation vs. the chemical transport model CAMx, Atmos. Environ., 94, 274–286, https://doi.org/10.1016/j.atmosenv.2014.05.039, 2014.
Buchunde, P., Safai, P. D., Mukherjee, S., Leena, P. P., Siingh, D., Meena, G. S., and Pandithurai, G.: Characterisation of particulate matter at a high-altitude site in southwest India: Impact of dust episodes, J. Earth Syst. Sci., 128, 237, https://doi.org/10.1007/s12040-019-1265-8, 2019.
Campbell, J. F. E., Fletcher, W. J., Joannin, S., Hughes, P. D., Rhanem, M., and Zielhofer, C.: Environmental Drivers of Holocene Forest Development in the Middle Atlas, Morocco, Front. Ecol. Evol., 5, 113, https://doi.org/10.3389/fevo.2017.00113, 2017.
Carter, W., Cockeriii, D., Fitz, D., Malkina, I., Bumiller, K., Sauer, C., Pisano, J., Bufalino, C., and Song, C.: A new environmental chamber for evaluation of gas-phase chemical mechanisms and secondary aerosol formation, Atmos. Environ., 39, 7768–7788, https://doi.org/10.1016/j.atmosenv.2005.08.040, 2005.
Cavalli, F., Viana, M., Yttri, K. E., Genberg, J., and Putaud, J.-P.: Toward a standardised thermal-optical protocol for measuring atmospheric organic and elemental carbon: the EUSAAR protocol, Atmos. Meas. Tech., 3, 79–89, https://doi.org/10.5194/amt-3-79-2010, 2010.
Cesari, D., Contini, D., Genga, A., Siciliano, M., Elefante, C., Baglivi, F., and Daniele, L.: Analysis of raw soils and their re-suspended PM10 fractions: Characterisation of source profiles and enrichment factors, Appl. Geochem., 27, 1238–1246, https://doi.org/10.1016/j.apgeochem.2012.02.029, 2012.
Chatterjee, A., Adak, A., Singh, A. K., Srivastava, M. K., Ghosh, S. K., Tiwari, S., Devara, P. C. S., and Raha, S.: Aerosol Chemistry over a High Altitude Station at Northeastern Himalayas, India, PLoS ONE, 5, e11122, https://doi.org/10.1371/journal.pone.0011122, 2010.
Chiapello, I., Bergametti, G., Chatenet, B., Bousquet, P., Dulac, F., and Soares, E. S.: Origins of African dust transported over the northeastern tropical Atlantic, J. Geophys. Res., 102, 13701–13709, https://doi.org/10.1029/97JD00259, 1997.
Chu, A. K. M., Kwok, R. C. W., and Yu, K. N.: Study of pollution dispersion in urban areas using Computational Fluid Dynamics (CFD) and Geographic Information System (GIS), Environ. Modell. Softw., 20, 273–277, https://doi.org/10.1016/j.envsoft.2004.05.007, 2005.
Cincinelli, A., Bubba, M. D., Martellini, T., Gambaro, A., and Lepri, L.: Gas-particle concentration and distribution of n-alkanes and polycyclic aromatic hydrocarbons in the atmosphere of Prato (Italy), Chemosphere, 68, 472–478, https://doi.org/10.1016/j.chemosphere.2006.12.089, 2007.
Clegg, S. L., Brimblecombe, P., and Wexler, A. S.: Thermodynamic Model of the System HNHSONOH2O at Tropospheric Temperatures, J. Phys. Chem. A, 102, 2137–2154, https://doi.org/10.1021/jp973042r, 1998.
Contini, D., Genga, A., Cesari, D., Siciliano, M., Donateo, A., Bove, M. C., and Guascito, M. R.: Characterisation and source apportionment of PM10 in an urban background site in Lecce, Atmos. Res., 95, 40–54, https://doi.org/10.1016/j.atmosres.2009.07.010, 2010.
Contini, D., Belosi, F., Gambaro, A., Cesari, D., Stortini, A. M., and Bove, M. C.: Comparison of PM10 concentrations and metal content in three different sites of the Venice Lagoon: An analysis of possible aerosol sources, Journal of Environmental Sciences, 24, 1954–1965, https://doi.org/10.1016/S1001-0742(11)61027-9, 2012.
Contini, D., Cesari, D., Donateo, A., Chirizzi, D., and Belosi, F.: Characterization of PM10 and PM2.5 and Their Metals Content in Different Typologies of Sites in South-Eastern Italy, Atmosphere, 5, 435–453, https://doi.org/10.3390/atmos5020435, 2014.
Cozic, J., Verheggen, B., Weingartner, E., Crosier, J., Bower, K. N., Flynn, M., Coe, H., Henning, S., Steinbacher, M., Henne, S., Collaud Coen, M., Petzold, A., and Baltensperger, U.: Chemical composition of free tropospheric aerosol for PM1 and coarse mode at the high alpine site Jungfraujoch, Atmos. Chem. Phys., 8, 407–423, https://doi.org/10.5194/acp-8-407-2008, 2008.
Decesari, S., Facchini, M. C., Carbone, C., Giulianelli, L., Rinaldi, M., Finessi, E., Fuzzi, S., Marinoni, A., Cristofanelli, P., Duchi, R., Bonasoni, P., Vuillermoz, E., Cozic, J., Jaffrezo, J. L., and Laj, P.: Chemical composition of PM10 and PM1 at the high-altitude Himalayan station Nepal Climate Observatory-Pyramid (NCO-P) (5079 m a.s.l.), Atmos. Chem. Phys., 10, 4583–4596, https://doi.org/10.5194/acp-10-4583-2010, 2010.
Desboeufs, K. V. and Cautenet, G.: Transport and mixing zone of desert dust and sulphate over Tropical Africa and the Atlantic Ocean region, Atmos. Chem. Phys. Discuss., 5, 5615–5644, https://doi.org/10.5194/acpd-5-5615-2005, 2005.
Ding, K., Liu, J., Ding, A., Liu, Q., Zhao, T. L., Shi, J., Han, Y., Wang, H., and Jiang, F.: Uplifting of carbon monoxide from biomass burning and anthropogenic sources to the free troposphere in East Asia, Atmos. Chem. Phys., 15, 2843–2866, https://doi.org/10.5194/acp-15-2843-2015, 2015.
Draxler, R. and Hess, G.: Description of the HYSPLIT4 modeling system, NOAA Technical Memorandum, ERL, ARL-224, 24, 2004.
Du, Y., Xu, X., Chu, M., Guo, Y., and Wang, J.: Air particulate matter and cardiovascular disease: the epidemiological, biomedical and clinical evidence, J. Thorac. Dis., 8, 12, https://doi.org/10.3978/j.issn.2072-1439.2015.11.37 2016.
Falkovich, A. H., Ganor, E., Levin, Z., Formenti, P., and Rudich, Y.: Chemical and mineralogical analysis of individual mineral dust particles, J. Geophys. Res., 106, 18029–18036, https://doi.org/10.1029/2000JD900430, 2001.
Fiore, A. M., Dentener, F. J., Wild, O., Cuvelier, C., Schultz, M. G., Hess, P., Textor, C., Schulz, M., Doherty, R. M., Horowitz, L. W., MacKenzie, I. A., Sanderson, M. G., Shindell, D. T., Stevenson, D. S., Szopa, S., Van Dingenen, R., Zeng, G., Atherton, C., Bergmann, D., Bey, I., Carmichael, G., Collins, W. J., Duncan, B. N., Faluvegi, G., Folberth, G., Gauss, M., Gong, S., Hauglustaine, D., Holloway, T., Isaksen, I. S. A., Jacob, D. J., Jonson, J. E., Kaminski, J. W., Keating, T. J., Lupu, A., Marmer, E., Montanaro, V., Park, R. J., Pitari, G., Pringle, K. J., Pyle, J. A., Schroeder, S., Vivanco, M. G., Wind, P., Wojcik, G., Wu, S., and Zuber, A.: Multimodel estimates of intercontinental source-receptor relationships for ozone pollution, J. Geophys. Res., 114, D04301, https://doi.org/10.1029/2008JD010816, 2009.
Fomba, K. W., Müller, K., van Pinxteren, D., and Herrmann, H.: Aerosol size-resolved trace metal composition in remote northern tropical Atlantic marine environment: case study Cape Verde islands, Atmos. Chem. Phys., 13, 4801–4814, https://doi.org/10.5194/acp-13-4801-2013, 2013.
Fomba, K. W., Müller, K., van Pinxteren, D., Poulain, L., van Pinxteren, M., and Herrmann, H.: Long-term chemical characterization of tropical and marine aerosols at the Cape Verde Atmospheric Observatory (CVAO) from 2007 to 2011, Atmos. Chem. Phys., 14, 8883–8904, https://doi.org/10.5194/acp-14-8883-2014, 2014.
Fomba, K. W., Deabji, N., Barcha, S. E. I., Ouchen, I., Elbaramoussi, E. M., El Moursli, R. C., Harnafi, M., El Hajjaji, S., Mellouki, A., and Herrmann, H.: Application of TXRF in monitoring trace metals in particulate matter and cloud water, Atmos. Meas. Tech., 13, 4773–4790, https://doi.org/10.5194/amt-13-4773-2020, 2020.
Formenti, P., Caquineau, S., Desboeufs, K., Klaver, A., Chevaillier, S., Journet, E., and Rajot, J. L.: Mapping the physico-chemical properties of mineral dust in western Africa: mineralogical composition, Atmos. Chem. Phys., 14, 10663–10686, https://doi.org/10.5194/acp-14-10663-2014, 2014.
Fu, P., Kawamura, K., Kobayashi, M., and Simoneit, B. R. T.: Seasonal variations of sugars in atmospheric particulate matter from Gosan, Jeju Island: Significant contributions of airborne pollen and Asian dust in spring, Atmos. Environ., 55, 234–239, https://doi.org/10.1016/j.atmosenv.2012.02.061, 2012.
Gangoiti, G., Alonso, L., Navazo, M., García, J. A., and Millán, M. M.: North African soil dust and European pollution transport to America during the warm season: Hidden links shown by a passive tracer simulation: European pollution transport to America, J. Geophys. Res., 111, D10109, https://doi.org/10.1029/2005JD005941, 2006.
García, M. I., Rodríguez, S., and Alastuey, A.: Impact of North America on the aerosol composition in the North Atlantic free troposphere, Atmos. Chem. Phys., 17, 7387–7404, https://doi.org/10.5194/acp-17-7387-2017, 2017.
Gherboudj, I., Naseema Beegum, S., and Ghedira, H.: Identifying natural dust source regions over the Middle-East and North-Africa: Estimation of dust emission potential, Earth-Science Reviews, 165, 342–355, https://doi.org/10.1016/j.earscirev.2016.12.010, 2017.
Gilge, S., Plass-Duelmer, C., Fricke, W., Kaiser, A., Ries, L., Buchmann, B., and Steinbacher, M.: Ozone, carbon monoxide and nitrogen oxides time series at four alpine GAW mountain stations in central Europe, Atmos. Chem. Phys., 10, 12295–12316, https://doi.org/10.5194/acp-10-12295-2010, 2010.
Glaccum, R. A. and Prospero, J. M.: Saharan aerosols over the tropical North Atlantic – Mineralogy, Mar. Geol., 37, 295–321, https://doi.org/10.1016/0025-3227(80)90107-3, 1980.
Glasius, M., Hansen, A. M. K., Claeys, M., Henzing, J. S., Jedynska, A. D., Kasper-Giebl, A., Kistler, M., Kristensen, K., Martinsson, J., Maenhaut, W., Nøjgaard, J. K., Spindler, G., Stenström, K. E., Swietlicki, E., Szidat, S., Simpson, D., and Yttri, K. E.: Composition and sources of carbonaceous aerosols in Northern Europe during winter, Atmos. Environ., 173, 127–141, https://doi.org/10.1016/j.atmosenv.2017.11.005, 2018.
Guinot, B., Cachier, H., Sciare, J., Tong, Y., Xin, W., and Jianhua, Y.: Beijing aerosol: Atmospheric interactions and new trends, J. Geophys. Res., 112, D14314, https://doi.org/10.1029/2006JD008195, 2007.
Hien, P. D., Bac, V. T., Tham, H. C., Nhan, D. D., and Vinh, L. D.: Influence of meteorological conditions on PM2.5 and PM2.5−10 concentrations during the monsoon season in Hanoi, Vietnam, 12, 3473–3484, https://doi.org/10.1016/S1352-2310(02)00295-9, 2002.
Holst, J., Mayer, H., and Holst, T.: Effect of meteorological exchange conditions on PM10 concentration, Meteorol. Z., 17, 273–282, https://doi.org/10.1127/0941-2948/2008/0283, 2008.
Iinuma, Y., Brüggemann, E., Gnauk, T., Müller, K., Andreae, M. O., Helas, G., Parmar, R., and Herrmann, H.: Source characterization of biomass burning particles: The combustion of selected European conifers, African hardwood, savanna grass, and German and Indonesian peat, J. Geophys. Res., 112, D08209, https://doi.org/10.1029/2006JD007120, 2007.
Iinuma, Y., Engling, G., Puxbaum, H., and Herrmann, H.: A highly resolved anion-exchange chromatographic method for determination of saccharidic tracers for biomass combustion and primary bio-particles in atmospheric aerosol, Atmos. Environ., 43, 1367–1371, https://doi.org/10.1016/j.atmosenv.2008.11.020, 2009.
Inchaouh, M.: state of ambient air quality in marrakech city (morocco) over the period 2009–2012, Int. J. Geomate, 12, 99–106, 2017.
Jaenicke, R.: Abundance of Cellular Material and Proteins in the Atmosphere, Science, 308, 73–73, https://doi.org/10.1126/science.1106335, 2005.
Jonson, J. E., Stohl, A., Fiore, A. M., Hess, P., Szopa, S., Wild, O., Zeng, G., Dentener, F. J., Lupu, A., Schultz, M. G., Duncan, B. N., Sudo, K., Wind, P., Schulz, M., Marmer, E., Cuvelier, C., Keating, T., Zuber, A., Valdebenito, A., Dorokhov, V., De Backer, H., Davies, J., Chen, G. H., Johnson, B., Tarasick, D. W., Stübi, R., Newchurch, M. J., von der Gathen, P., Steinbrecht, W., and Claude, H.: A multi-model analysis of vertical ozone profiles, Atmos. Chem. Phys., 10, 5759–5783, https://doi.org/10.5194/acp-10-5759-2010, 2010.
Kalderon-Asael, B., Erel, Y., Sandler, A., and Dayan, U.: Mineralogical and chemical characterization of suspended atmospheric particles over the east Mediterranean based on synoptic-scale circulation patterns, Atmos. Environ., 43, 3963–3970, https://doi.org/10.1016/j.atmosenv.2009.03.057, 2009.
Kandler, K., Schütz, L., Deutscher, C., Ebert, M., Hofmann, H., Jäckel, S., Jaenicke, R., Knippertz, P., Lieke, K., Massling, A., Petzold, A., Schladitz, A., Weinzierl, B., Wiedensohler, A., Zorn, S., and Weinbruch1, S.: Size distribution, mass concentration, chemical and mineralogical composition and derived optical parameters of the boundary layer aerosol at Tinfou, Morocco, during SAMUM 2006, Tellus B, 61, 32–50, https://doi.org/10.1111/j.1600-0889.2008.00385.x, 2009.
Kavouras, I. G.: Particle size distribution of organic primary and secondary aerosol constituents in urban, background marine, and forest atmosphere, J. Geophys. Res., 107, 4069, https://doi.org/10.1029/2000JD000278, 2002.
Khan, B., Stenchikov, G., Weinzierl, B., Kalenderski, S., and Osipov, S.: Dust plume formation in the free troposphere and aerosol size distribution during the Saharan Mineral Dust Experiment in North Africa, Tellus B, 67, 27170, https://doi.org/10.3402/tellusb.v67.27170, 2015.
Khedidji, S., Müller, K., Rabhi, L., Spindler, G., Fomba, K. W., van Pinxteren, D., Yassaa, N., and Herrmann, H.: Chemical Characterization of Marine Aerosols in a South Mediterranean Coastal Area Located in Bou Ismaïl, Algeria, Aerosol Air Qual. Res., 20, 2448–2473, https://doi.org/10.4209/aaqr.2019.09.0458, 2020.
Khrissi, S., Bejjit, L., Haddad, M., Falguères, C., Ait Lyazidi, S., and El Amraoui, M.: Study of marbles from Middle Atlas (Morocco): elemental, mineralogical and structural analysis, IOP Conf. Ser.-Mat. Sci., 353, 012013, https://doi.org/10.1088/1757-899X/353/1/012013, 2018.
King, M. D., Menzel, W. P., Kaufman, Y. J., Tanre, D., Gao, B.-C., Platnick, S., Ackerman, S. A., Remer, L. A., Pincus, R., and Hubanks, P. A.: Cloud and aerosol properties, precipitable water, and profiles of temperature and water vapor from MODIS, IEEE T. Geosci. Remote, 41, 442–458, https://doi.org/10.1109/TGRS.2002.808226, 2003.
Koçak, M., Theodosi, C., Zarmpas, P., Séguret, M. J. M., Herut, B., Kallos, G., Mihalopoulos, N., Kubilay, N., and Nimmo, M.: Influence of mineral dust transport on the chemical composition and physical properties of the Eastern Mediterranean aerosol, Atmos. Environ., 57, 266–277, https://doi.org/10.1016/j.atmosenv.2012.04.006, 2012.
Krueger, B. J., Grassian, V. H., Cowin, J. P., and Laskin, A.: Heterogeneous chemistry of individual mineral dust particles from different dust source regions: the importance of particle mineralogy, Atmos. Environ., 38, 6253–6261, https://doi.org/10.1016/j.atmosenv.2004.07.010, 2004.
Kumar, A., Wu, S., Weise, M. F., Honrath, R., Owen, R. C., Helmig, D., Kramer, L., Val Martin, M., and Li, Q.: Free-troposphere ozone and carbon monoxide over the North Atlantic for 2001–2011, Atmos. Chem. Phys., 13, 12537–12547, https://doi.org/10.5194/acp-13-12537-2013, 2013.
Lang, M. N., Gohm, A., and Wagner, J. S.: The impact of embedded valleys on daytime pollution transport over a mountain range, Atmos. Chem. Phys., 15, 11981–11998, https://doi.org/10.5194/acp-15-11981-2015, 2015.
Leena, P. P., Vijayakumar, K., Anilkumar, V., and Pandithurai, G.: Analysing temporal variability of particulate matter and possible contributing factors over Mahabaleshwar, a high-altitude station in Western Ghats, India, J. Atmos. Sol.-Terr. Phy., 164, 105–115, https://doi.org/10.1016/j.jastp.2017.08.013, 2017.
Leng, C., Zhang, Q., Tao, J., Zhang, H., Zhang, D., Xu, C., Li, X., Kong, L., Cheng, T., Zhang, R., Yang, X., Chen, J., Qiao, L., Lou, S., Wang, H., and Chen, C.: Impacts of new particle formation on aerosol cloud condensation nuclei (CCN) activity in Shanghai: case study, Atmos. Chem. Phys., 14, 11353–11365, https://doi.org/10.5194/acp-14-11353-2014, 2014.
Liang, Q., Jaeglé, L., Jaffe, D. A., Weiss-Penzias, P., Heckman, A., and Snow, J. A.: Long-range transport of Asian pollution to the northeast Pacific: Seasonal variations and transport pathways of carbon monoxide: transport pathways to the northeast pacific, J. Geophys. Res., 109, D23S07, https://doi.org/10.1029/2003JD004402, 2004.
Liu, J., Russell, L. M., Lee, A. K. Y., McKinney, K. A., Surratt, J. D., and Ziemann, P. J.: Observational evidence for pollution-influenced selective uptake contributing to biogenic secondary organic aerosols in the southeastern U.S.: Evidence for Selective Uptake of bSOA, Geophys. Res. Lett., 44, 8056–8064, https://doi.org/10.1002/2017GL074665, 2017.
Logan, J. A., Staehelin, J., Megretskaia, I. A., Cammas, J.-P., Thouret, V., Claude, H., De Backer, H., Steinbacher, M., Scheel, H.-E., Stübi, R., Fröhlich, M., and Derwent, R.: Changes in ozone over Europe: Analysis of ozone measurements from sondes, regular aircraft (MOZAIC) and alpine surface sites: CHANGES IN OZONE OVER EUROPE, J. Geophys. Res., 117, 0148–0227, https://doi.org/10.1029/2011JD016952, 2012.
Lugauer, M., Baltensperger, U., Furger, M., Gaggeler, H. W., Jost, D. T., Schwikowski, M., and Wanner, H.: Aerosol transport to the high Alpine sites Jungfraujoch (3454 m asl) and Colle Gnifetti (4452 m asl), Tellus B, 50, 76–92, https://doi.org/10.1034/j.1600-0889.1998.00006.x, 1998.
Maenhaut, W., Raes, N., Chi, X., Cafmeyer, J., Wang, W., and Salma, I.: Chemical composition and mass closure for fine and coarse aerosols at a kerbside in Budapest, Hungary, in spring 2002, X-Ray Spectrom., 34, 290–296, https://doi.org/10.1002/xrs.820, 2005.
Marenco, F., Bonasoni, P., Calzolari, F., Ceriani, M., Chiari, M., Cristofanelli, P., D'Alessandro, A., Fermo, P., Lucarelli, F., Mazzei, F., Nava, S., Piazzalunga, A., Prati, P., Valli, G., and Vecchi, R.: Characterization of atmospheric aerosols at Monte Cimone, Italy, during summer 2004: Source apportionment and transport mechanisms, J. Geophys. Res., 111, D24202, https://doi.org/10.1029/2006JD007145, 2006.
Mazzei, F., D'Alessandro, A., Lucarelli, F., Nava, S., Prati, P., Valli, G., and Vecchi, R.: Characterization of particulate matter sources in an urban environment, Sci. Total Environ., 401, 81–89, https://doi.org/10.1016/j.scitotenv.2008.03.008, 2008.
McInnes, L. M., Covert, D. S., Quinn, P. K., and Germani, M. S.: Measurements of chloride depletion and sulfur enrichment in individual seasalt particles collected from the remote marine boundary layer, J. Geophys. Res., 99, 8257–8268, https://doi.org/10.1029/93JD03453, 1994.
Minguillón, M. C., Querol, X., Alastuey, A., Monfort, E., and Miró, J. V.: PM sources in a highly industrialised area in the process of implementing PM abatement technology, Quantification and evolution, J. Environ. Monitor., 9, 1071–1081, https://doi.org/10.1039/B705474B, 2007.
Mukherjee, S., Singla, V., Meena, G. S., Aslam, M. Y., Safai, P. D., Buchunde, P., Vasudevan, A. K., Jena, C. K., Ghude, S. D., Dani, K., and Pandithurai, G.: Sub micron aerosol variability and its ageing process at a high altitude site in India: Impact of meteorological conditions, Environ. Pollut., 265, 115019, https://doi.org/10.1016/j.envpol.2020.115019, 2020.
Mounir, S., Saoud, N., Charroud, M., Mounir, K., and Choukrad, J.: The Middle Atlas Geological karsts forms: Towards Geosites characterization, Oil Gas Sci. Technol., 74, 17, https://doi.org/10.2516/ogst/2018089, 2019.
Müller, K.: Determination of aldehydes and ketones in the atmosphere – A comparative long time study at an urban and a rural site in Eastern Germany, Chemosphere, 35, 2093–2106, https://doi.org/10.1016/S0045-6535(97)00267-1, 1997.
Müller, L., Reinnig, M.-C., Naumann, K. H., Saathoff, H., Mentel, T. F., Donahue, N. M., and Hoffmann, T.: Formation of 3-methyl-1,2,3-butanetricarboxylic acid via gas phase oxidation of pinonic acid – a mass spectrometric study of SOA aging, Atmos. Chem. Phys., 12, 1483–1496, https://doi.org/10.5194/acp-12-1483-2012, 2012.
Nair, V. S., Moorthy, K. K., Alappattu, D. P., Kunhikrishnan, P. K., George, S., Nair, P. R., Babu, S. S., Abish, B., Satheesh, S. K., Tripathi, S. N., Niranjan, K., Madhavan, B. L., Srikant, V., Dutt, C. B. S., Badarinath, K. V. S., and Reddy, R. R.: Wintertime aerosol characteristics over the Indo-Gangetic Plain (IGP): Impacts of local boundary layer processes and long-range transport: winter aerosols over indo-gangetic plain, J. Geophys. Res., 112, D13205, https://doi.org/10.1029/2006JD008099, 2007.
Nerriere, É., Guegan, H., Bordigoni, B., Hautemaniere, A., Momas, I., Ladner, J., Target, A., Lameloise, P., Delmas, V., Personnaz, M.-B., Koutrakis, P., and Zmirou-Navier, D.: Spatial heterogeneity of personal exposure to airborne metals in French urban areas, Sci. Total Environ., 373, 49–56, https://doi.org/10.1016/j.scitotenv.2006.10.042, 2007.
Neusüss, C., Pelzing, M., Plewka, A., and Herrmann, H.: A new analytical approach for size-resolved speciation of organic compounds in atmospheric aerosol particles: Methods and first results, J. Geophys. Res., 105, 4513–4527, https://doi.org/10.1029/1999JD901038, 2000.
Okada, K. and Kai, K.: Atmospheric mineral particles collected at Qira in the Taklamakan Desert, China, Atmos. Environ., 38, 6927–6935, https://doi.org/10.1016/j.atmosenv.2004.03.078, 2004.
Okamoto, S. and Tanimoto, H.: A review of atmospheric chemistry observations at mountain sites, Prog. Earth Planet. Sci., 3, 34, https://doi.org/10.1186/s40645-016-0109-2, 2016.
Pacyna, E. G., Pacyna, J. M., Fudala, J., Strzelecka-Jastrzab, E., Hlawiczka, S., Panasiuk, D., Nitter, S., Pregger, T., Pfeiffer, H., and Friedrich, R.: Current and future emissions of selected heavy metals to the atmosphere from anthropogenic sources in Europe, Atmos. Environ., 41, 8557–8566, https://doi.org/10.1016/j.atmosenv.2007.07.040, 2007.
Pandolfi, M., Gonzalez-Castanedo, Y., Alastuey, A., Pey, J., Querol, X., and de La Rosa, J. D.: Source apportionment to PM10 and PM2.5 at multiple sites in the Bay of Gibraltar (S Spain) by PMF: estimate of shipping emission, 7662, 2009.
Pandolfi, M., Gonzalez-Castanedo, Y., Alastuey, A., de la Rosa, J. D., Mantilla, E., de la Campa, A. S., Querol, X., Pey, J., Amato, F., and Moreno, T.: Source apportionment of PM10 and PM2.5 at multiple sites in the strait of Gibraltar by PMF: impact of shipping emissions, Environ. Sci. Pollut. Res., 18, 260–269, https://doi.org/10.1007/s11356-010-0373-4, 2011.
Perrino, C., Catrambone, M., Dalla Torre, S., Rantica, E., Sargolini, T., and Canepari, S.: Seasonal variations in the chemical composition of particulate matter: a case study in the Po Valley, Part I: macro-components and mass closure, Environ. Sci. Pollut. Res., 21, 3999–4009, https://doi.org/10.1007/s11356-013-2067-1, 2014.
Pietrogrande, M. C., Mercuriali, M., Perrone, M. G., Ferrero, L., Sangiorgi, G., and Bolzacchini, E.: Distribution of n-Alkanes in the Northern Italy Aerosols: Data Handling of GC-MS Signals for Homologous Series Characterization, Environ. Sci. Technol., 44, 4232–4240, https://doi.org/10.1021/es1001242, 2010.
Pietrogrande, M. C., Abbaszade, G., Schnelle-Kreis, J., Bacco, D., Mercuriali, M., and Zimmermann, R.: Seasonal variation and source estimation of organic compounds in urban aerosol of Augsburg, Germany, Environ. Pollut., 159, 1861–1868, https://doi.org/10.1016/j.envpol.2011.03.023, 2011.
Pio, C. A., Alves, C. A., and Duarte, A. C.: Identification, abundance and origin of atmospheric organic particulate matter in a Portuguese rural area, Atmos. Environ., 35, 1365–1375, https://doi.org/10.1016/S1352-2310(00)00391-5, 2001.
Pope, C. A., Cohen, A. J., and Burnett, R. T.: Cardiovascular Disease and Fine Particulate Matter: Lessons and Limitations of an Integrated Exposure – Response Approach, Circ. Res., 122, 1645–1647, https://doi.org/10.1161/circresaha.118.312956, 2018.
Prodi, F., Belosi, F., Contini, D., Santachiara, G., Matteo, L. D., Gambaro, A., Donateo, A., and Cesari, D.: Aerosol fine fraction in the Venice Lagoon: Particle composition and sources, Atmos. Res., 10, 141–150, https://doi.org/10.1016/j.atmosres.2008.09.020, 2009.
Querol, X., Alastuey, A., Ruiz, C. R., Artiñano, B., Hansson, H. C., Harrison, R. M., Buringh, E., ten Brink, H. M., Lutz, M., Bruckmann, P., Straehl, P., and Schneider, J.: Speciation and origin of PM10 and PM2.5 in selected European cities, Atmos. Environ., 38, 6547–6555, https://doi.org/10.1016/j.atmosenv.2004.08.037, 2004.
Ricciardelli, I., Bacco, D., Rinaldi, M., Bonafè, G., Scotto, F., Trentini, A., Bertacci, G., Ugolini, P., Zigola, C., Rovere, F., Maccone, C., Pironi, C., and Poluzzi, V.: A three-year investigation of daily PM2.5 main chemical components in four sites: the routine measurement program of the Supersito Project (Po Valley, Italy), Atmos. Environ., 152, 418–430, https://doi.org/10.1016/j.atmosenv.2016.12.052, 2017.
Rodríguez, S., Alastuey, A., Alonso-Pérez, S., Querol, X., Cuevas, E., Abreu-Afonso, J., Viana, M., Pérez, N., Pandolfi, M., and de la Rosa, J.: Transport of desert dust mixed with North African industrial pollutants in the subtropical Saharan Air Layer, Atmos. Chem. Phys., 11, 6663–6685, https://doi.org/10.5194/acp-11-6663-2011, 2011.
Royaume du Maroc: Plan national de lutte contre le réchauffement climatique, Ministère de l'Énergie, des Mines, de l'Eau et de l'Environnement, (Département de l’Environnement), Rabat, 35 p., 2009.
Ryder, C. L., Marenco, F., Brooke, J. K., Estelles, V., Cotton, R., Formenti, P., McQuaid, J. B., Price, H. C., Liu, D., Ausset, P., Rosenberg, P. D., Taylor, J. W., Choularton, T., Bower, K., Coe, H., Gallagher, M., Crosier, J., Lloyd, G., Highwood, E. J., and Murray, B. J.: Coarse-mode mineral dust size distributions, composition and optical properties from AER-D aircraft measurements over the tropical eastern Atlantic, Atmos. Chem. Phys., 18, 17225–17257, https://doi.org/10.5194/acp-18-17225-2018, 2018.
Sarkar, S., Chauhan, A., Kumar, R., and Singh, R. P.: Impact of Deadly Dust Storms (May 2018) on Air Quality, Meteorological, and Atmospheric Parameters Over the Northern Parts of India, GeoHealth, 3, 67–80, https://doi.org/10.1029/2018GH000170, 2019.
Satheesh, S. K. and Krishna Moorthy, K.: Radiative effects of natural aerosols: A review, Atmos. Environ., 39, 2089–2110, https://doi.org/10.1016/j.atmosenv.2004.12.029, 2005.
Schepanski, K., Mallet, M., Heinold, B., and Ulrich, M.: North African dust transport toward the western Mediterranean basin: atmospheric controls on dust source activation and transport pathways during June–July 2013, Atmos. Chem. Phys., 16, 14147–14168, https://doi.org/10.5194/acp-16-14147-2016, 2016.
Schladitz, A., Müller, T., Kaaden, N., Massling, A., Kandler, K., Ebert, M., Weinbruch, S., Deutscher, C., and Wiedensohler, A.: In situ measurements of optical properties at Tinfou (Morocco) during the Saharan Mineral Dust Experiment SAMUM 2006, Tellus B, 61, 64–78, https://doi.org/10.1111/j.1600-0889.2008.00397.x, 2009.
Sharma, S. K., Choudhary, N., Kotnala, G., Das, D., Mukherjee, S., Ghosh, A., Vijayan, N., Rai, A., Chatterjee, A., and Mandal, T. K.: Wintertime carbonaceous species and trace metals in PM10 in Darjeeling: A high altitude town in the eastern Himalayas, Urban Climate, 34, 100668, https://doi.org/10.1016/j.uclim.2020.100668, 2020.
Song, Q., Christiani, D., Wang, X., and Ren, J.: The Global Contribution of Outdoor Air Pollution to the Incidence, Prevalence, Mortality and Hospital Admission for Chronic Obstructive Pulmonary Disease: A Systematic Review and Meta-Analysis, Ind. J. Env. Res. Pub. He., 11, 11822–11832, https://doi.org/10.3390/ijerph111111822, 2014.
Spindler, G., Gnauk, T., Grüner, A., Iinuma, Y., Müller, K., Scheinhardt, S., and Herrmann, H.: Size-segregated characterization of PM10 at the EMEP site Melpitz (Germany) using a five-stage impactor: a six year study, J. Atmos. Chem., 69, 127–157, https://doi.org/10.1007/s10874-012-9233-6, 2012.
Squizzato, S., Masiol, M., Brunelli, A., Pistollato, S., Tarabotti, E., Rampazzo, G., and Pavoni, B.: Factors determining the formation of secondary inorganic aerosol: a case study in the Po Valley (Italy), Atmos. Chem. Phys., 13, 1927–1939, https://doi.org/10.5194/acp-13-1927-2013, 2013.
Tahri, M., Bounakhla, M., Zghaïd, M., Benchrif, A., Zahry, F., Noack, Y., and Benyaïch, F.: TXRF characterization and source identification by positive matrix factorization of airborne particulate matter sampled in Kenitra City (Morocco): TXRF characterization and source identification in Kenitra City, Morocco, X-Ray Spectrom., 42, 284–289, https://doi.org/10.1002/xrs.2484, 2013.
Tahri, M., Benchrif, A., Bounakhla, M., Benyaich, F., and Noack, Y.: Seasonal variation and risk assessment of PM2.5 and PM2.5–10 in the ambient air of Kenitra, Morocco, Environ. Sci.-Proc. Imp., 19, 1427–1436, https://doi.org/10.1039/C7EM00286F, 2017.
Turpin, B. J. and Lim, H.-J.: Species Contributions to PM2.5 Mass Concentrations: Revisiting Common Assumptions for Estimating Organic Mass, Aerosol Sci. Technol., 35, 602–610, https://doi.org/10.1080/02786820119445, 2001.
Van Pinxteren, D., Brüggemann, E., Gnauk, T., Müller, K., Thiel, C., and Herrmann, H.: A GIS based approach to back trajectory analysis for the source apportionment of aerosol constituents and its first application, J. Atmos. Chem., 67, 1–28, https://doi.org/10.1007/s10874-011-9199-9, 2010.
Van Pinxteren, M., Fiedler, B., van Pinxteren, D., Iinuma, Y., Körtzinger, A., and Herrmann, H.: Chemical characterization of sub-micrometer aerosol particles in the tropical Atlantic Ocean: marine and biomass burning influences, J. Atmos. Chem., 72, 105–125, https://doi.org/10.1007/s10874-015-9307-3, 2015.
Veselovskii, I., Goloub, P., Podvin, T., Bovchaliuk, V., Derimian, Y., Augustin, P., Fourmentin, M., Tanre, D., Korenskiy, M., Whiteman, D. N., Diallo, A., Ndiaye, T., Kolgotin, A., and Dubovik, O.: Retrieval of optical and physical properties of African dust from multiwavelength Raman lidar measurements during the SHADOW campaign in Senegal, Atmos. Chem. Phys., 16, 7013–7028, https://doi.org/10.5194/acp-16-7013-2016, 2016.
Viana, M., Pandolfi, M., Minguillón, M. C., Querol, X., Alastuey, A., Monfort, E., and Celades, I.: Inter-comparison of receptor models for PM source apportionment: Case study in an industrial area, Atmos. Environ., 42, 3820–3832, https://doi.org/10.1016/j.atmosenv.2007.12.056, 2008.
Wang, Y. Q., Zhang, X. Y., Sun, J. Y., Zhang, X. C., Che, H. Z., and Li, Y.: Spatial and temporal variations of the concentrations of PM10, PM2.5 and PM1 in China, Atmos. Chem. Phys., 15, 13585–13598, https://doi.org/10.5194/acp-15-13585-2015, 2015.
Wedepohl, K. H.: The composition of the continental crust, Geochim. Cosmochim. Ac., 59, 1217–1232, https://doi.org/10.1016/0016-7037(95)00038-2, 1995.
Weiss-Penzias, P., Jaffe, D. A., Swartzendruber, P., Dennison, J. B., Chand, D., Hafner, W., and Prestbo, E.: Observations of Asian air pollution in the free troposphere at Mount Bachelor Observatory during the spring of 2004: observations at Mount Bachelor Observatory, J. Geophys. Res., 111, D10304, https://doi.org/10.1029/2005JD006522, 2006.
Yttri, K. E., Simpson, D., Bergström, R., Kiss, G., Szidat, S., Ceburnis, D., Eckhardt, S., Hueglin, C., Nøjgaard, J. K., Perrino, C., Pisso, I., Prevot, A. S. H., Putaud, J.-P., Spindler, G., Vana, M., Zhang, Y.-L., and Aas, W.: The EMEP Intensive Measurement Period campaign, 2008–2009: characterizing carbonaceous aerosol at nine rural sites in Europe, Atmos. Chem. Phys., 19, 4211–4233, https://doi.org/10.5194/acp-19-4211-2019, 2019.
Zhang, J. M., Wang, T., Ding, A. J., Zhou, X. H., Xue, L. K., Poon, C. N., Wu, W. S., Gao, J., Zuo, H. C., Chen, J. M., Zhang, X. C., and Fan, S. J.: Continuous measurement of peroxyacetyl nitrate (PAN) in suburban and remote areas of western China, Atmos. Environ., 43, 228–237, https://doi.org/10.1016/j.atmosenv.2008.09.070, 2009.
Zhao, Z., Cao, J., Shen, Z., Xu, B., Zhu, C., Chen, L.-W. A., Su, X., Liu, S., Han, Y., Wang, G., and Ho, K.: Aerosol particles at a high-altitude site on the Southeast Tibetan Plateau, China: Implications for pollution transport from South Asia: AEROSOL PARTICLES IN SOUTHEAST TP, J. Geophys. Res.-Atmos., 118, 11360–11375, https://doi.org/10.1002/jgrd.50599, 2013.