the Creative Commons Attribution 4.0 License.
the Creative Commons Attribution 4.0 License.
 | 07 Dec 2021
Observation and modeling of high-7Be concentration events at the surface in northern Europe associated with the instability of the Arctic polar vortex in early 2003
Hongyu Liu
Miguel Ángel Hernández-Ceballos
Jussi Paatero
Darko Sarvan
Vladimir Djurdjevic
Laura Tositti
Jelena Ajtić
Events of very high concentrations of 7Be cosmogenic radionuclide have been recorded at low-elevation surface stations in the subpolar regions of Europe during the cold season. With an aim to investigate the mechanisms responsible for those peak 7Be events, and in particular to verify if they are associated with the fast descent of stratospheric air masses occurring during sudden stratospheric warming (SSW) events, we analyze 7Be observations at six sampling sites in Fennoscandia during January–March 2003 when very high 7Be concentrations were observed and the Arctic vortex was relatively unstable as a consequence of several SSW events. We use the GEOS-Chem chemistry and transport model driven by the MERRA-2 meteorological reanalysis to simulate tropospheric 7Be over northern Europe. We show that the model reasonably reproduces the temporal evolution of surface 7Be concentrations observed at the six sampling sites. Our analysis of model simulations, surface 7Be observations, atmospheric soundings of ozone and temperature and surface ozone measurements indicates that the 7Be peak observed in late February 2003 (between 20 and 28 February 2003) at the six sampling sites in Fennoscandia was associated with downward transport of stratospheric vortex air that originated during an SSW that occurred a few days earlier (between 18 and 21 February 2003).
- Article
(24267 KB) - Full-text XML
-
Supplement
(1406 KB) - BibTeX
- EndNote


Beryllium-7 (7Be) is a cosmogenic radionuclide widely monitored and analyzed around the world (e.g., Tositti et al., 2004, 2014; Gourdin et al., 2014; Sýkora et al., 2017). Due to its relatively long radioactive half-life (53.22 d) and its cosmogenic origin in the upper troposphere and lower stratosphere (UT-LS) (Lal and Peters, 1967), 7Be is considered a tracer for intrusion of stratospheric air into the troposphere and large-scale subsidence (e.g., Liu et al., 2016; Chae and Kim, 2019; Heikkila et al., 2008). The variability of the 7Be activity concentration in surface layers is driven by both static and dynamic factors, e.g., geographical location of the monitoring sites (e.g., Hernández-Ceballos et al., 2015), seasonal atmospheric processes driving transport of carrier aerosols (Lal and Peters, 1967), stratosphere–troposphere air mass exchange (Cristofanelli et al., 2003, 2009; Putero et al., 2016; Brattich et al., 2017a), synoptic influences (Usoskin et al., 2009), downward transport in the troposphere (Lee et al., 2007), solar activity, and dry and wet deposition (e.g., Hernández-Ceballos et al., 2015, 2016; Ioannidou and Papastefanou, 2006).
The spatial and temporal variability of the 7Be surface concentrations in Europe and their relationship with meteorological variables was previously analyzed in many studies (e.g., Piñero García et al., 2012; Błażej and Mietelski, 2014). The impact of the 11-year solar modulation on the 7Be concentrations in the air is well established (e.g., Leppänen et al., 2010). The distinctive spring–summer maximum of 7Be concentrations is widely described and mainly linked with the increased downward transport from the upper troposphere resulting from the intense convection and higher tropopause height typical of the warm season (Cristofanelli et al., 2006; Gerasopoulos et al., 2001, 2003). In addition, cases of high 7Be surface concentration, some of which occurred over the autumn–winter season, have been analyzed in Europe, e.g., over the Iberian Peninsula (Hernández-Ceballos et al., 2017) and at high-altitude stations in the Alps and the Apennines (Brattich et al., 2017a, b; Cristofanelli et al., 2006, 2009). The spring–summer maximum was originally observed with fission products injected into the stratosphere during atmospheric nuclear tests (Dutkiewicz and Husain, 1985; Cristofanelli et al., 2018). A recent study by Salminen-Paatero et al. (2019), who used potential vorticity analysis to gain insights into stratosphere-to-troposphere transport of radionuclides at Rovaniemi (Finnish Lapland) indicated that the transfer of stratospheric air into the upper troposphere was at its maximum in March followed by descent to the ground level during late spring and early summer.
Further, over the last decade many studies have investigated the 7Be records in northern Europe (Leppänen et al., 2010, 2012; Leppänen and Paatero, 2013; Sarvan et al., 2017; Leppänen, 2019), one of the three regions in Europe identified with a distinct 7Be behavior in the surface air (Ajtić et al., 2016, 2017; Hernández-Ceballos et al., 2015, 2016). Among these studies, Ajtić et al. (2016) analyzed the 7Be concentration measured in Helsinki, Finland, over 25 years (1987–2011) and pointed out a relatively high number of 7Be extremes occurring over autumn and winter: more specifically, 10 % of the highest 7Be concentrations (above the 90th percentile) were observed in the cold season (October-March). Furthermore, recent studies have also indicated that the polar vortices can have a notable influence on the wintertime 7Be surface concentrations in both the Northern (Ajtić et al., 2018; Bianchi et al., 2019; Terzi and Kalinowski, 2017) and the Southern Hemisphere (Pacini et al., 2015).
In particular, Ajtić et al. (2018) and Bianchi et al. (2019) employed two different methodologies to identify episodes of extremely high 7Be surface concentrations in autumn and winter, pointing out a large number of cases over the October–March period of the years investigated. The comparison of the dates identified in both analyses showed an overlap with the events of the so-called sudden stratospheric warming (SSW) of the Arctic vortex, i.e., a sudden rise in the polar temperatures that leads to a highly irregular shape of the vortex and its misalignment from the pole. Ajtić et al. (2018) also noted cases of extremely high 7Be concentrations occurring right after a very low 7Be concentration over the Fennoscandian Peninsula during autumn and winter. Overall, this relationship between the SSW of the Arctic vortex and high 7Be surface concentrations is likely linked to the perturbed stratosphere–troposphere interactions associated with SSW events, which could favor a fast descent of (1) midlatitude air rich in 7Be, thus increasing this radionuclide's surface abundance, and (2) aged vortex air wherein 7Be is subjected to radioactive decay and not transported from outside the vortex, thus decreasing the 7Be surface abundance.
The atmospheric circulation in the Arctic is dominated by the presence of two distinct polar vortices, one in the troposphere and one in the stratosphere (Waugh et al., 2017). The two vortices present well-defined features: first, the vortex in the troposphere is much more extended than the stratospheric one, and second, while the tropospheric vortex is present all-year round, the stratospheric polar vortex exists only from fall to spring (Waugh et al., 2017). The stratospheric polar vortex in winter stems from the large-scale temperature gradients between the midlatitudes and the poles. Therefore, the stratospheric polar vortex begins to form in autumn as a result of the decreasing solar heating in the polar regions; it strengthens during winter and then breaks down in spring when solar radiation returns to the polar region. Larger topographic and land–sea contrasts and the resulting stronger upward-propagating waves in the Northern Hemisphere make the northern stratospheric vortex, or the Arctic vortex, weaker and more distorted than its Southern Hemisphere counterpart, the Antarctic vortex. SSW, a major mode of the temporal variability of the Arctic vortex, is the strongest manifestation of the coupling of the stratosphere–troposphere system, with influence on the tropospheric flow lasting for many weeks (Charlton and Polvani, 2007) and with significant effects on chemical composition in the middle atmosphere (Sofieva et al., 2012; Tao et al., 2015). While major SSW, the so-called vortex split (Charlton and Polvani, 2007; Charlton et al., 2007), can even cause the stratospheric vortex to break down during midwinter (Waugh et al., 2017), vortex displacements are instead characterized by a shift of the polar vortex off the pole and its subsequent distortion into a “comma shape” during the extrusion of a vortex filament (Charlton and Polvani, 2007; Charlton et al., 2007). Previous works suggested that the occurrence of SSW events is capable of greatly perturbing the polar vortex and hence the stratospheric potential vorticity (PV) distribution (e.g., Matthewman et al., 2009) and the vertical distribution of ozone (e.g., Sonneman et al., 2006; Madhu, 2016). Additionally, the meteorological conditions associated with SSW events in the Arctic have been linked with the occurrences of 7Be winter extremes, especially in the presence of a very high Scandinavian teleconnection index (Ajtic et al., 2018).
While the initial scientific interest over the stratospheric polar vortex was especially linked to the stratospheric ozone loss over the poles, it is now recognized that the vortices might affect the processes in the troposphere and surface weather (e.g., Mitchell et al., 2013). The present work aims to investigate in detail the atmospheric processes responsible for high 7Be activities recorded in the cold season over the Fennoscandian Peninsula and its relationship with the Arctic polar vortex through model simulations. For this purpose, we conduct 7Be simulations for the period of January–March 2003 using the GEOS-Chem global 3-D chemical and transport (CTM) model. The period was selected because of the large number of events with extremely high 7Be concentrations at the surface in Fennoscandia; some of these events were preceded by very low surface concentrations in the lower troposphere (< 10th percentile). This period thus offers the opportunity to test the hypothesis that SSW events facilitate a fast descent of not only the midlatitude but also vortex air (Ajtić et al., 2018). To achieve this goal, our analysis will therefore focus on the following:
-
investigating the processes responsible for the variability of 7Be concentrations in surface air in northern Europe;
-
better understanding whether and how SSW and the Arctic vortex wintertime instability influence the surface concentrations of 7Be in northern Europe;
-
quantifying the rate of air subsidence on the inner and outer side of the vortex during the period of its instability.
To analyze the influence of SSW and of the Arctic polar vortex on 7Be concentrations, we first assess the performance of the GEOS-Chem model in reproducing the observed 7Be variability. We then use model simulations together with other supporting measurements from soundings and meteorological datasets to examine the processes responsible for the variability in the 7Be concentrations over the period of January–March 2003.
As opposed to the cosmogenic origin of 7Be, 210Pb (half-life 22.3 years) is a nuclide of crustal origin derived from decay of 222Rn (half-life 3.8 d), which is emitted from soils by decay of 226Ra. Owing to the contrasting natural origins of the two nuclides, the 7Be 210Pb ratio is often regarded as indicative of vertical transport processes and convective activity in the atmosphere (e.g., Koch et al., 1996; Tositti et al., 2004; Brattich et al., 2017a, b). After being produced by contrasting physical mechanisms, both 7Be and 210Pb rapidly attach to ambient submicron-sized particles (e.g., Gaffney et al., 2004) and are removed by wet (mainly) and dry (secondarily) deposition processes of their carrier aerosol. The bias in the simulated 7Be 210Pb ratio due to uncertainties in the model deposition schemes is thus reduced. For this reason, besides 7Be, the 7Be 210Pb ratio was also analyzed to gain further insights into vertical transport processes during the study period.
The rest of this paper is organized as follows. Section 2 describes the radioactivity (7Be and 210Pb) and meteorological data used. Section 3 provides a brief description of GEOS-Chem, the HYSPLIT trajectory model, and statistical parameters used to assess the model's performance in reproducing the observations. Section 4 presents an overview of the 7Be observations made in northern Europe in the boreal winter 2003. Section 4 presents and discusses the main results of this work. Specifically, Sect. 4.1 analyzes the precipitation and transport pattern in the study region, while Sect. 4.2 assesses how well the GEOS-Chem model performs in reproducing the observed variability in the monthly mean surface 7Be concentrations during the study period. Section 4.3 further evaluates the performance of the model in reproducing the short-time variability of 7Be in northern Europe, followed by an interpretation of the observed variability using model simulations and additional meteorological and ozone observations in Sect. 4.4. Finally, summary and conclusions are given in Sect. 5.
In this section we briefly describe the 7Be and 210Pb radioactivity data as well as the meteorological datasets analyzed in this work.
2.1 7Be data
Since 1988, the Radioactivity Environmental Monitoring data bank (REMdb) (https://data.jrc.ec.europa.eu/collection/id-0117, last access: 23 November 2021) has brought together and stored in a harmonized way environmental radioactivity data (air, water, milk and mixed diet) measured by the European Union member states (Sangiorgi et al., 2019). Among the set of sample types and measurements recommended in 2000/473/Euratom (European Commission, 2000), measurements of natural radioelements, such as 7Be in surface air, are required, and hence, it is very closely monitored and widely stored in the REMdb (De Cort et al., 2007).
Within the REMdb, the activity concentration of 7Be in the surface air in northern Europe (latitude north of 55∘ N) is available for six surface sampling sites (Hernández-Ceballos et al., 2015), all located at elevations ranging from 9 to 130 m a.s.l.: Ivalo, Umeå, Helsinki, Kista, Harku and Risø, however, with varying start dates and sampling frequencies (Fig. 1a). The largest dataset is for Helsinki where, since 1999, the sampling has been performed daily or once every 2 d. Datasets for Ivalo, Umeå, Kista and Risø also span more than two decades and have a good temporal coverage (roughly once a week since 1995). In particular, 7Be activity concentrations were obtained by gamma-spectrometry analysis performed by the European Union Competent Authorities. Aerosol samples were collected on filter papers using air samplers with a flow rate of several hundred cubic meters per day, and then their radioactivity concentrations were analyzed in laboratories.
2.2 210Pb data
Daily aerosol samples were collected in Helsinki on the roof of the Finnish Meteorological Institute's main building (60∘10′ N, 24∘57′ E). Filters (Munktell MGA, diameter Ø = 240 mm) were changed every day at 06:00 UTC. The air volume was about 3500 m3 d−1. The filters were assayed for 210Pb by alpha counting of the in-grown daughter nuclide 210Po (Mattsson et al., 1996).
2.3 Meteorological and ozone data
The 7Be variability is tightly linked to horizontal and vertical transport of the carrier aerosol, and to precipitation that leads to the radionuclide's removal from the atmosphere. Here we used the Modern-Era Retrospective analysis for Research and Applications, Version 2 (MERRA-2) meteorological reanalysis (Gelaro et al., 2017) to assist in the data analysis and to drive the GEOS-Chem model simulations. MERRA-2 is produced with version 5.12.4 of the Goddard Earth Observing System (GEOS) atmospheric data assimilation system. It assimilates modern observations of the atmosphere, ocean, land and chemistry and includes assimilation of aerosol remote sensing data.
Vertical soundings of air temperature from the Finnish Meteorological Institute's (FMI) Arctic Space Centre (http://fmiarc.fmi.fi, last access: 23 November 2021) at Sodankylä, northern Finland (67.37∘ N, 26.63∘ E) were obtained from the University of Wyoming (http://weather.uwyo.edu/upperair/sounding.html, last access: 23 November 2021). To study the effect of downward transport of stratospheric air masses into the troposphere, potential vorticity (PV) values (Holton et al., 1995) were calculated from ERA-Interim wind, temperature, and surface pressure fields (Dee et al., 2011) obtained from the European Centre for Medium-Range Weather Forecasts (ECMWF), Reading, UK.
Ozone sounding data (Kivi et al., 2007; Denton et al., 2019) was retrieved from the database of the FMI's Arctic Space Centre (http://litdb.fmi.fi, last access: 23 November 2021).
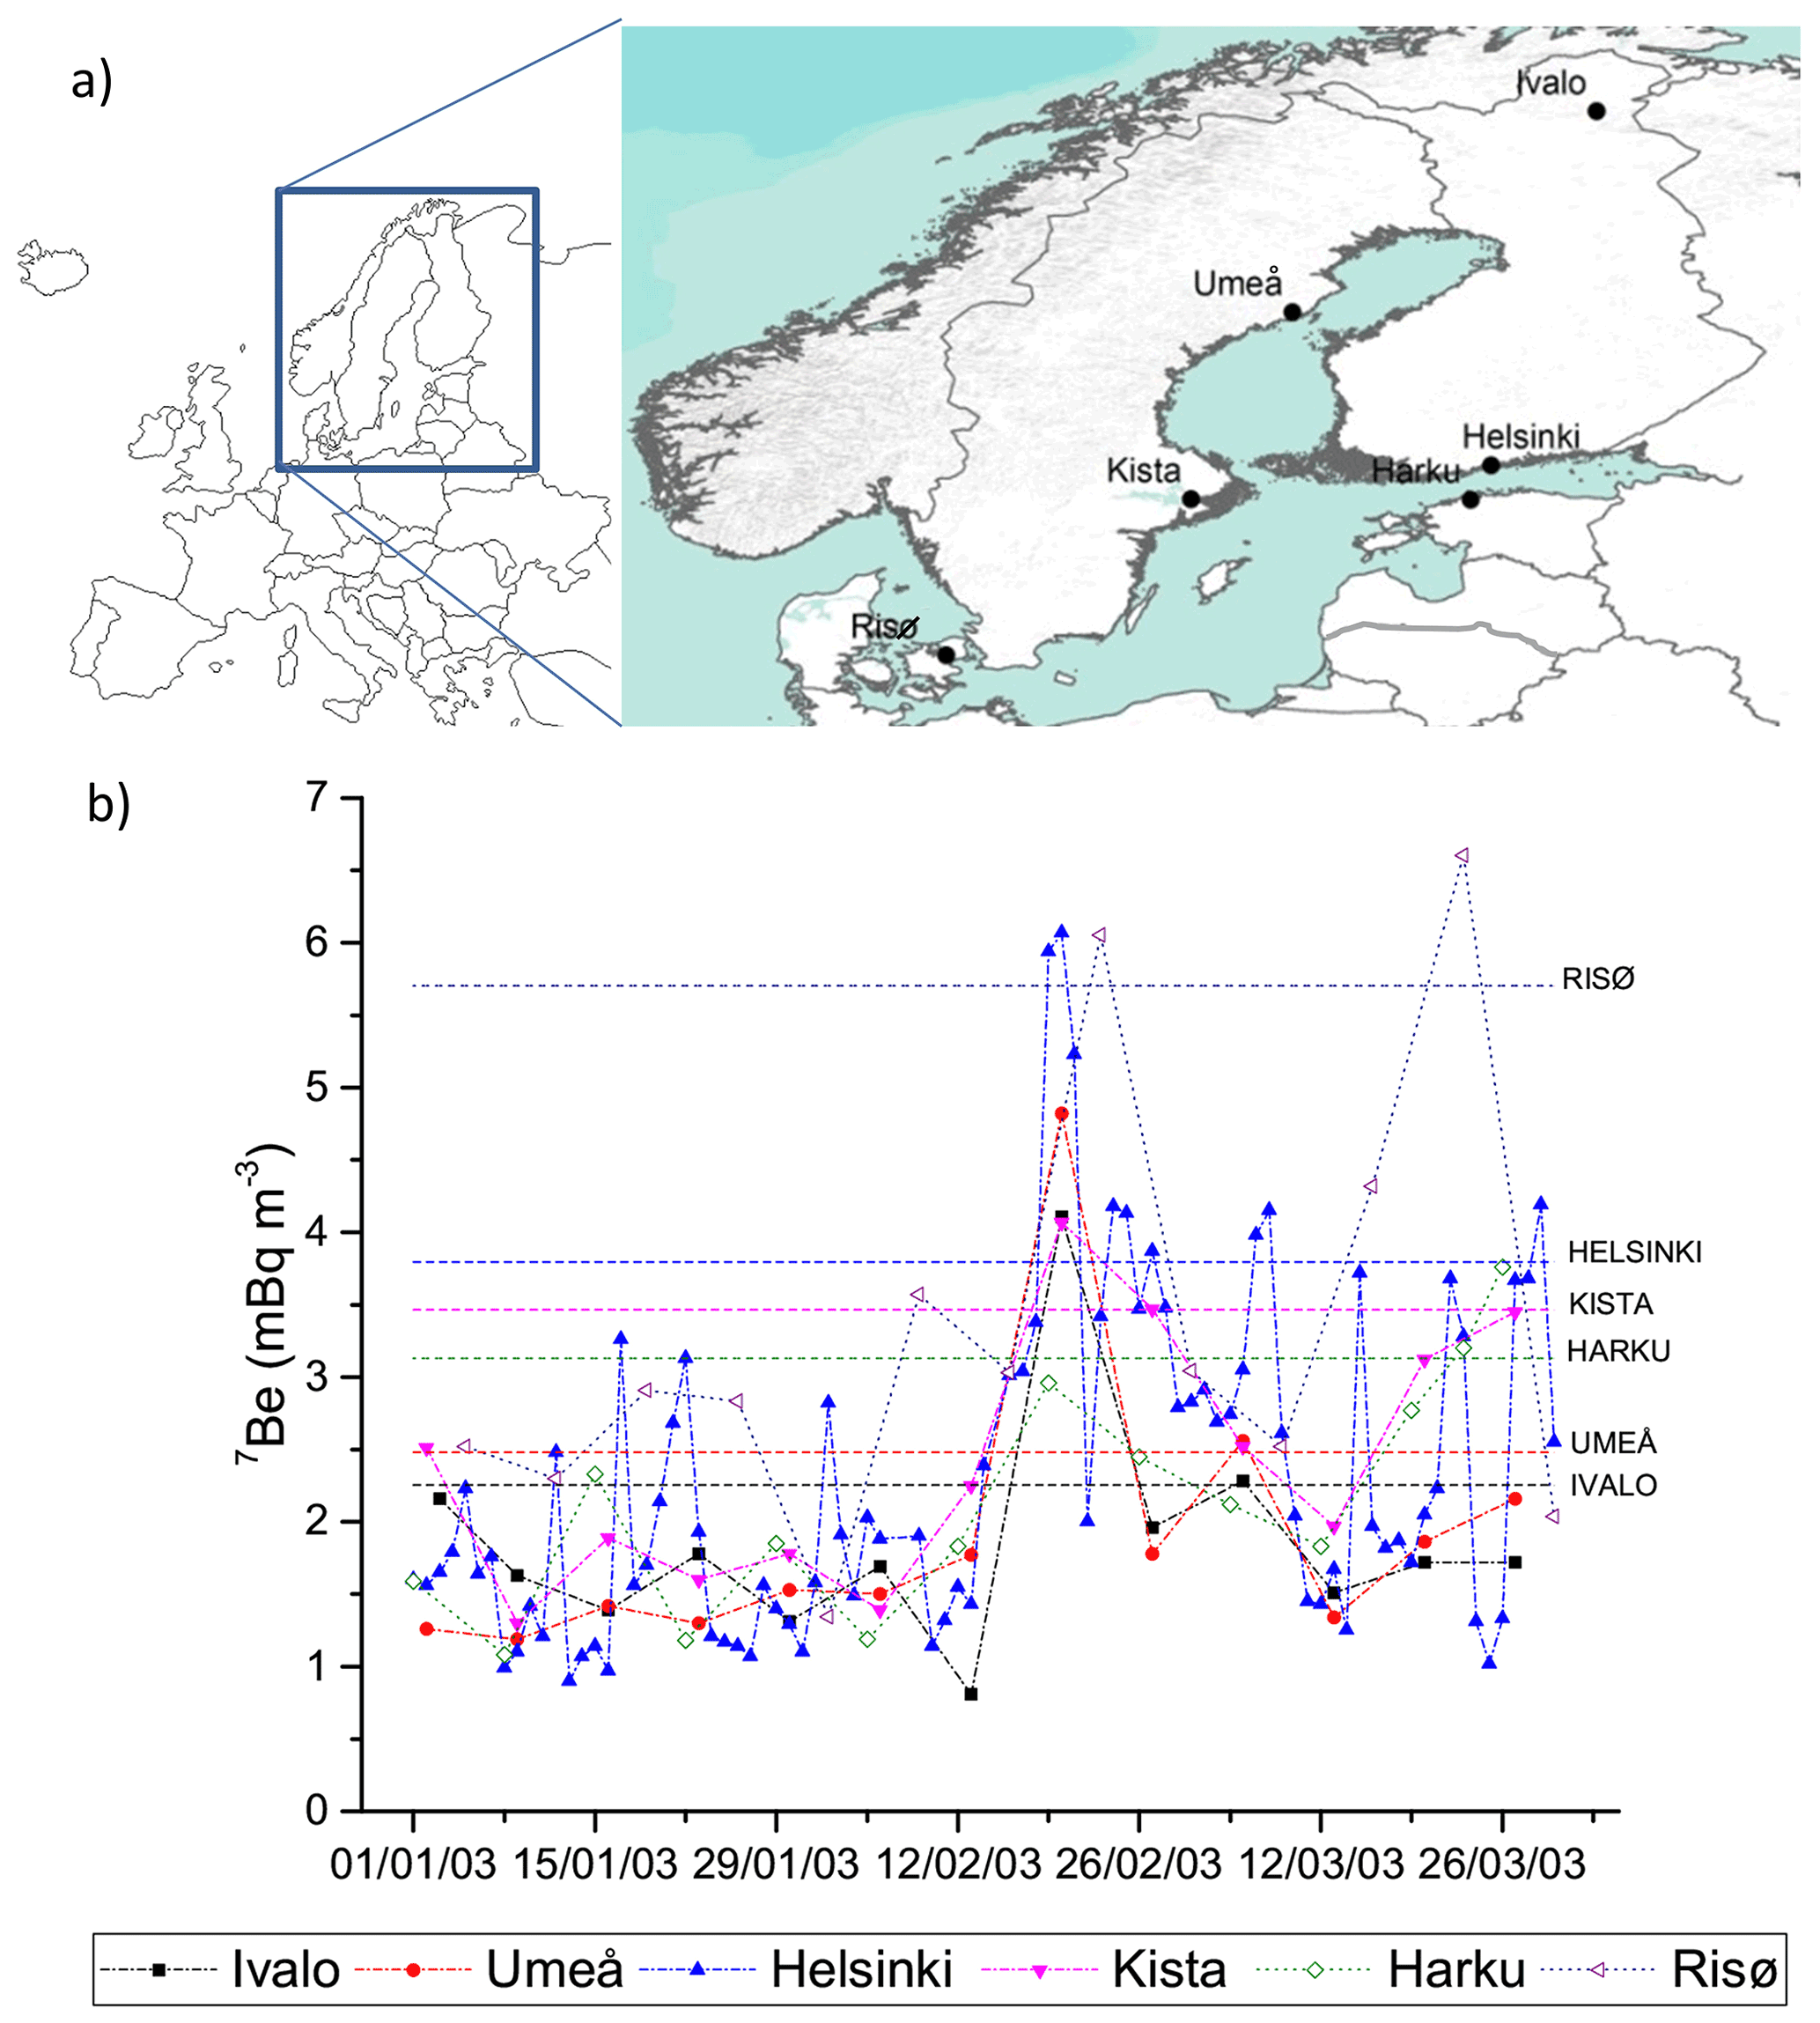
Figure 1(a) Location of the 7Be sampling sites in northern Europe (source: https://mapamundiparaimprimir.com/europa/); (b) 7Be concentrations measured at six surface sampling sites in northern Europe during the 2002–2003 boreal winter. Dashed lines indicate the 90th percentile reference line for each sampling site.
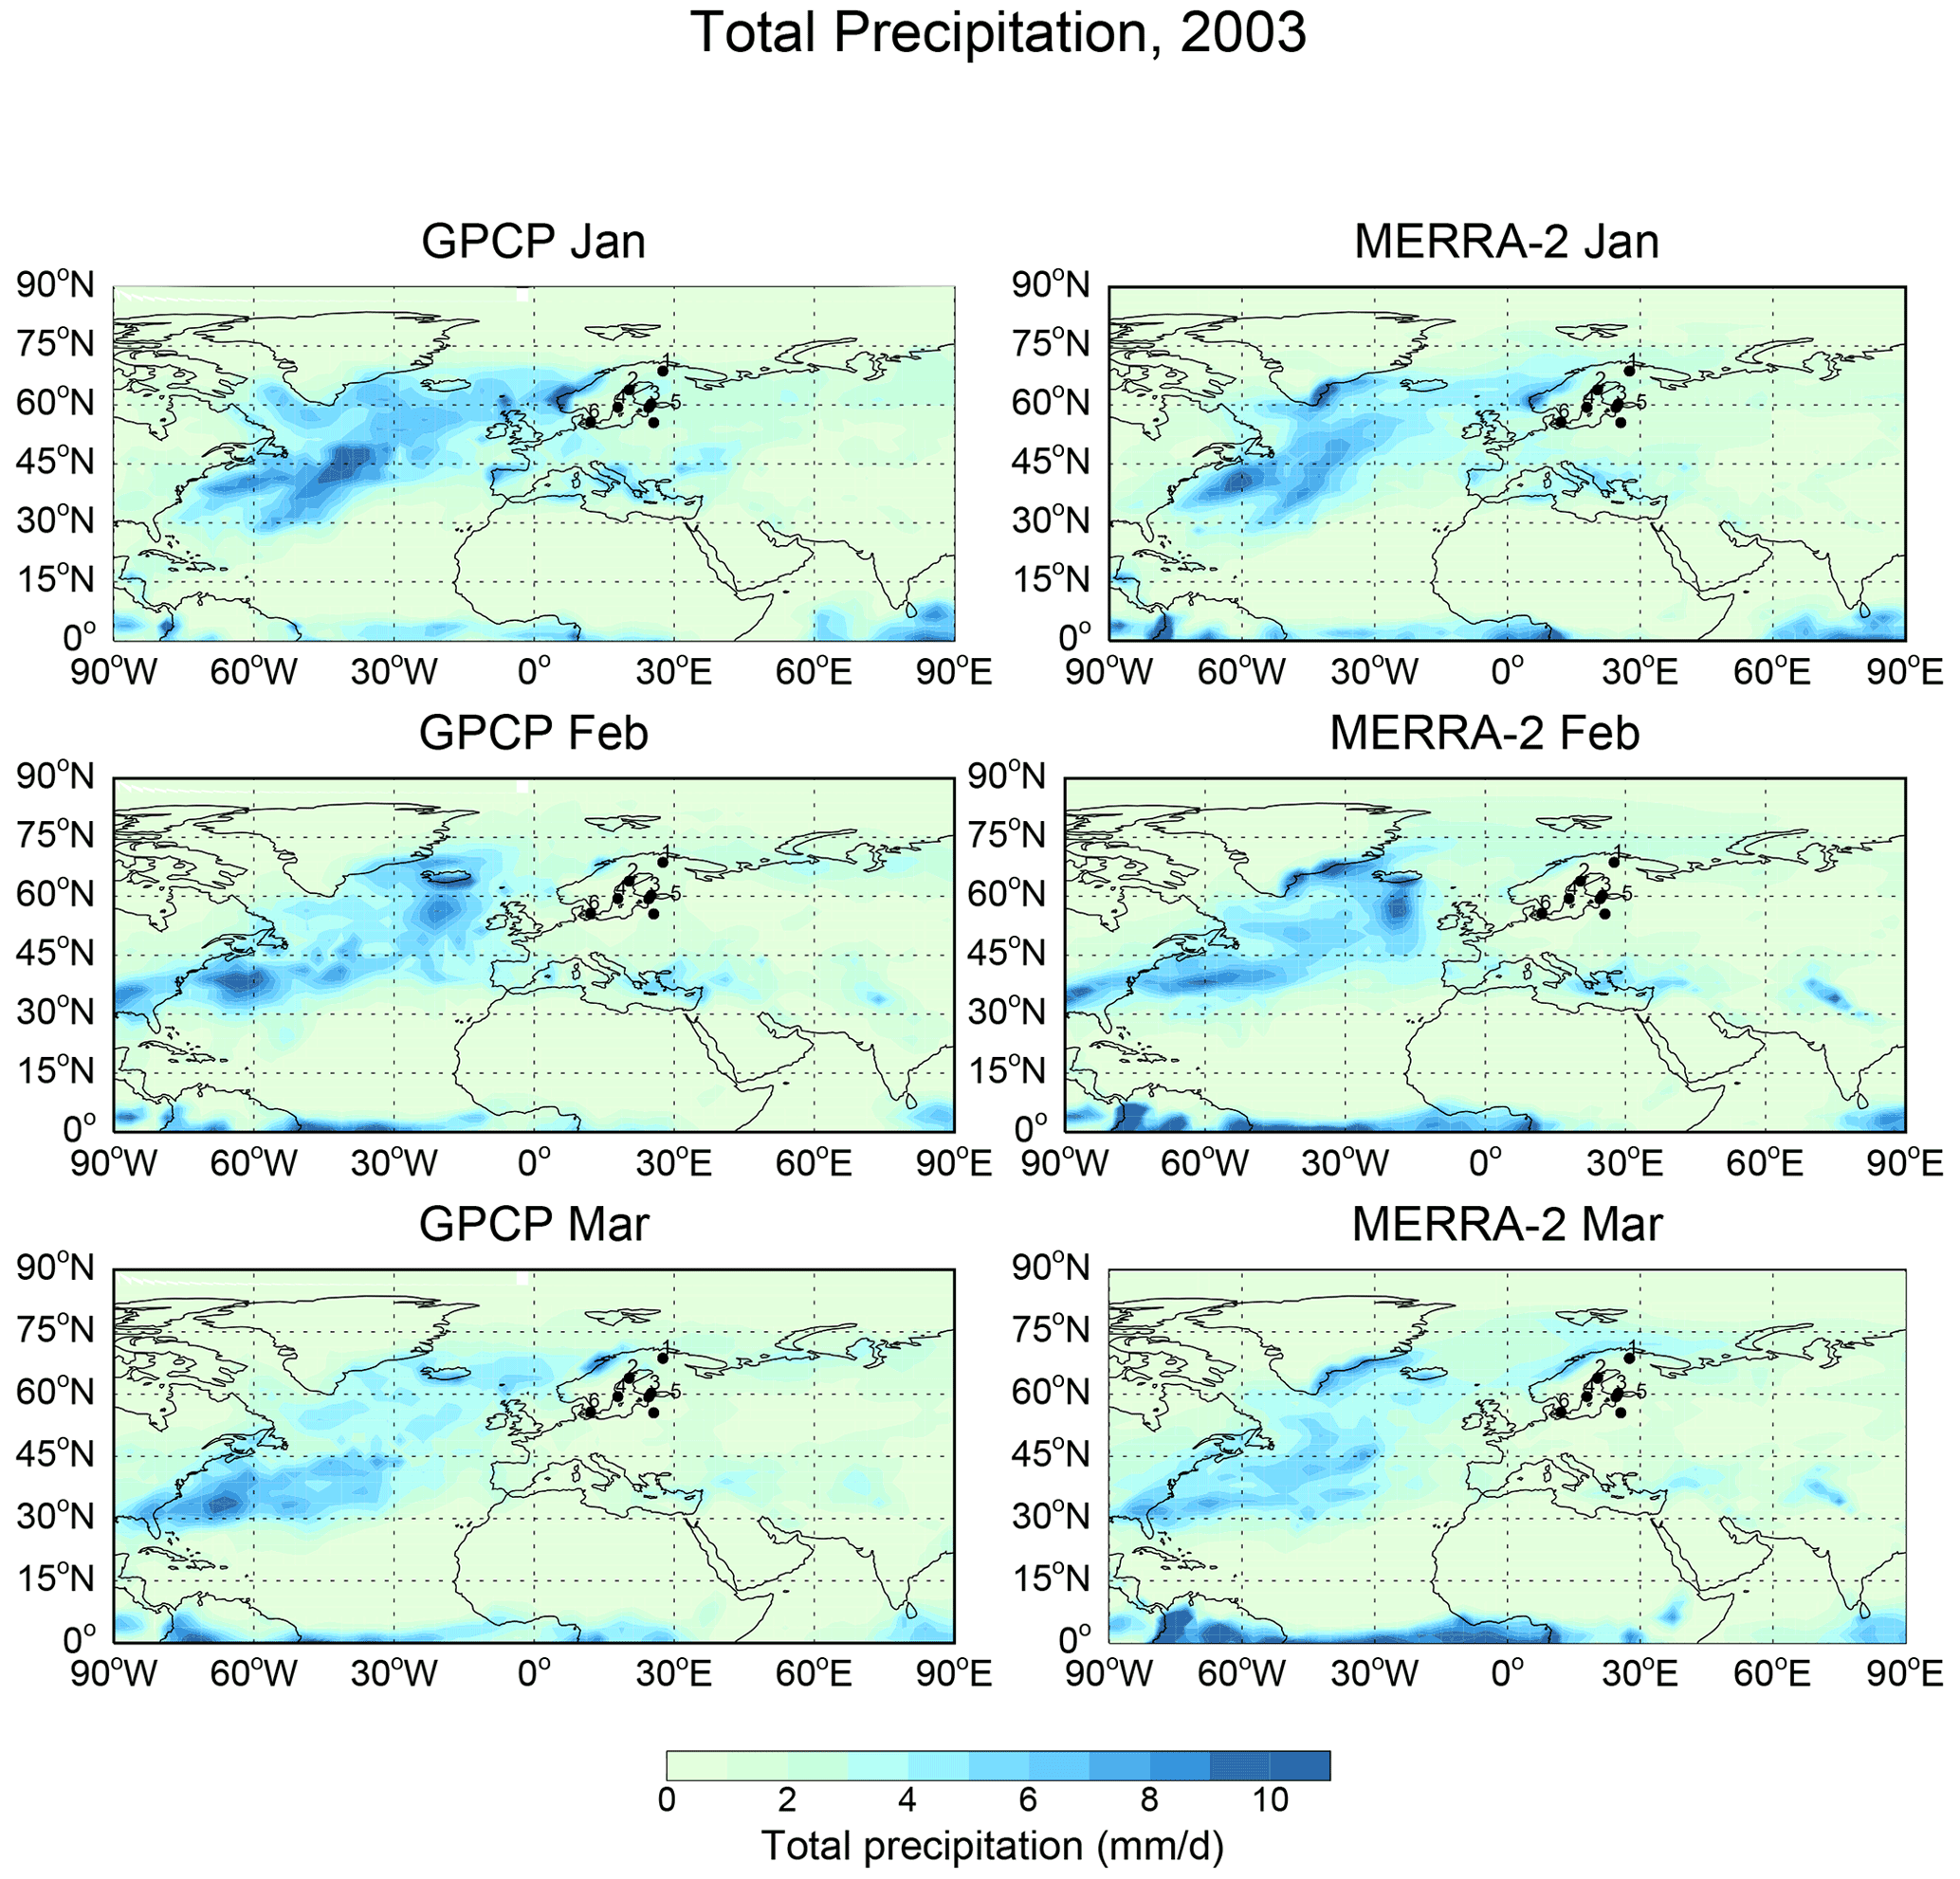
Figure 2Comparison of the MERRA-2 total precipitation during January–March 2003 with the GPCP observations. The black dots indicate the locations of the sampling sites: 1 = Ivalo, 2 = Umeå, 3 = Helsinki, 4 = Kista, 5 = Harku, 6 = Risø.
In this section we give a brief description of the GEOS-Chem and HYSPLIT models and the statistical parameters used to indicate the model performances.
3.1 GEOS-Chem model
GEOS-Chem (http://www.geos-chem.org, last access: 23 November 2021) is a global 3-D CTM that has been widely used to study atmospheric composition and processes (e.g., Bey et al., 2001; Park et al., 2004; Eastham et al., 2014). In this study, we use the GEOS-Chem v11-01f to simulate 7Be and 210Pb and assist in interpreting the observations. GEOS-Chem includes a radionuclide simulation option (222Rn-210Pb-7Be), which simulates the emission, transport (advection, convection, boundary layer mixing), deposition and decay of the radionuclide tracers (Jacob et al., 1997; Liu et al., 2001; Yu et al., 2018).
We used the 7Be production rates recommended by Lal and Peters (1967) for a maximum solar activity year (1958), which has been shown to produce the best results compared to aircraft 7Be observations in the stratosphere where 7Be concentrations mainly result from a balance between production and radioactive decay, and their observations can be used as a constraint on the 7Be source (Koch et al., 1996; Liu et al., 2001). In this work, the production rates of Lal and Peters (1967) are formulated as a function of latitude and pressure without seasonal variation (Koch et al., 1996). About two-thirds of atmospheric 7Be is generated in the stratosphere. While there are more accurate modern models (e.g., Masarik and Beer, 1999; Webber et al., 2007; Usoskin and Kovaltsov, 2008; Poluianov et al., 2016), the use of the Lal and Peters production rates is sufficient for this study where we mainly focus on atmospheric transport features. Although the Lal and Peters sources are used here for temporal variability studies, they are not applicable for quantitative studies of the 7Be activities (e.g., Golubenko et al., 2021)
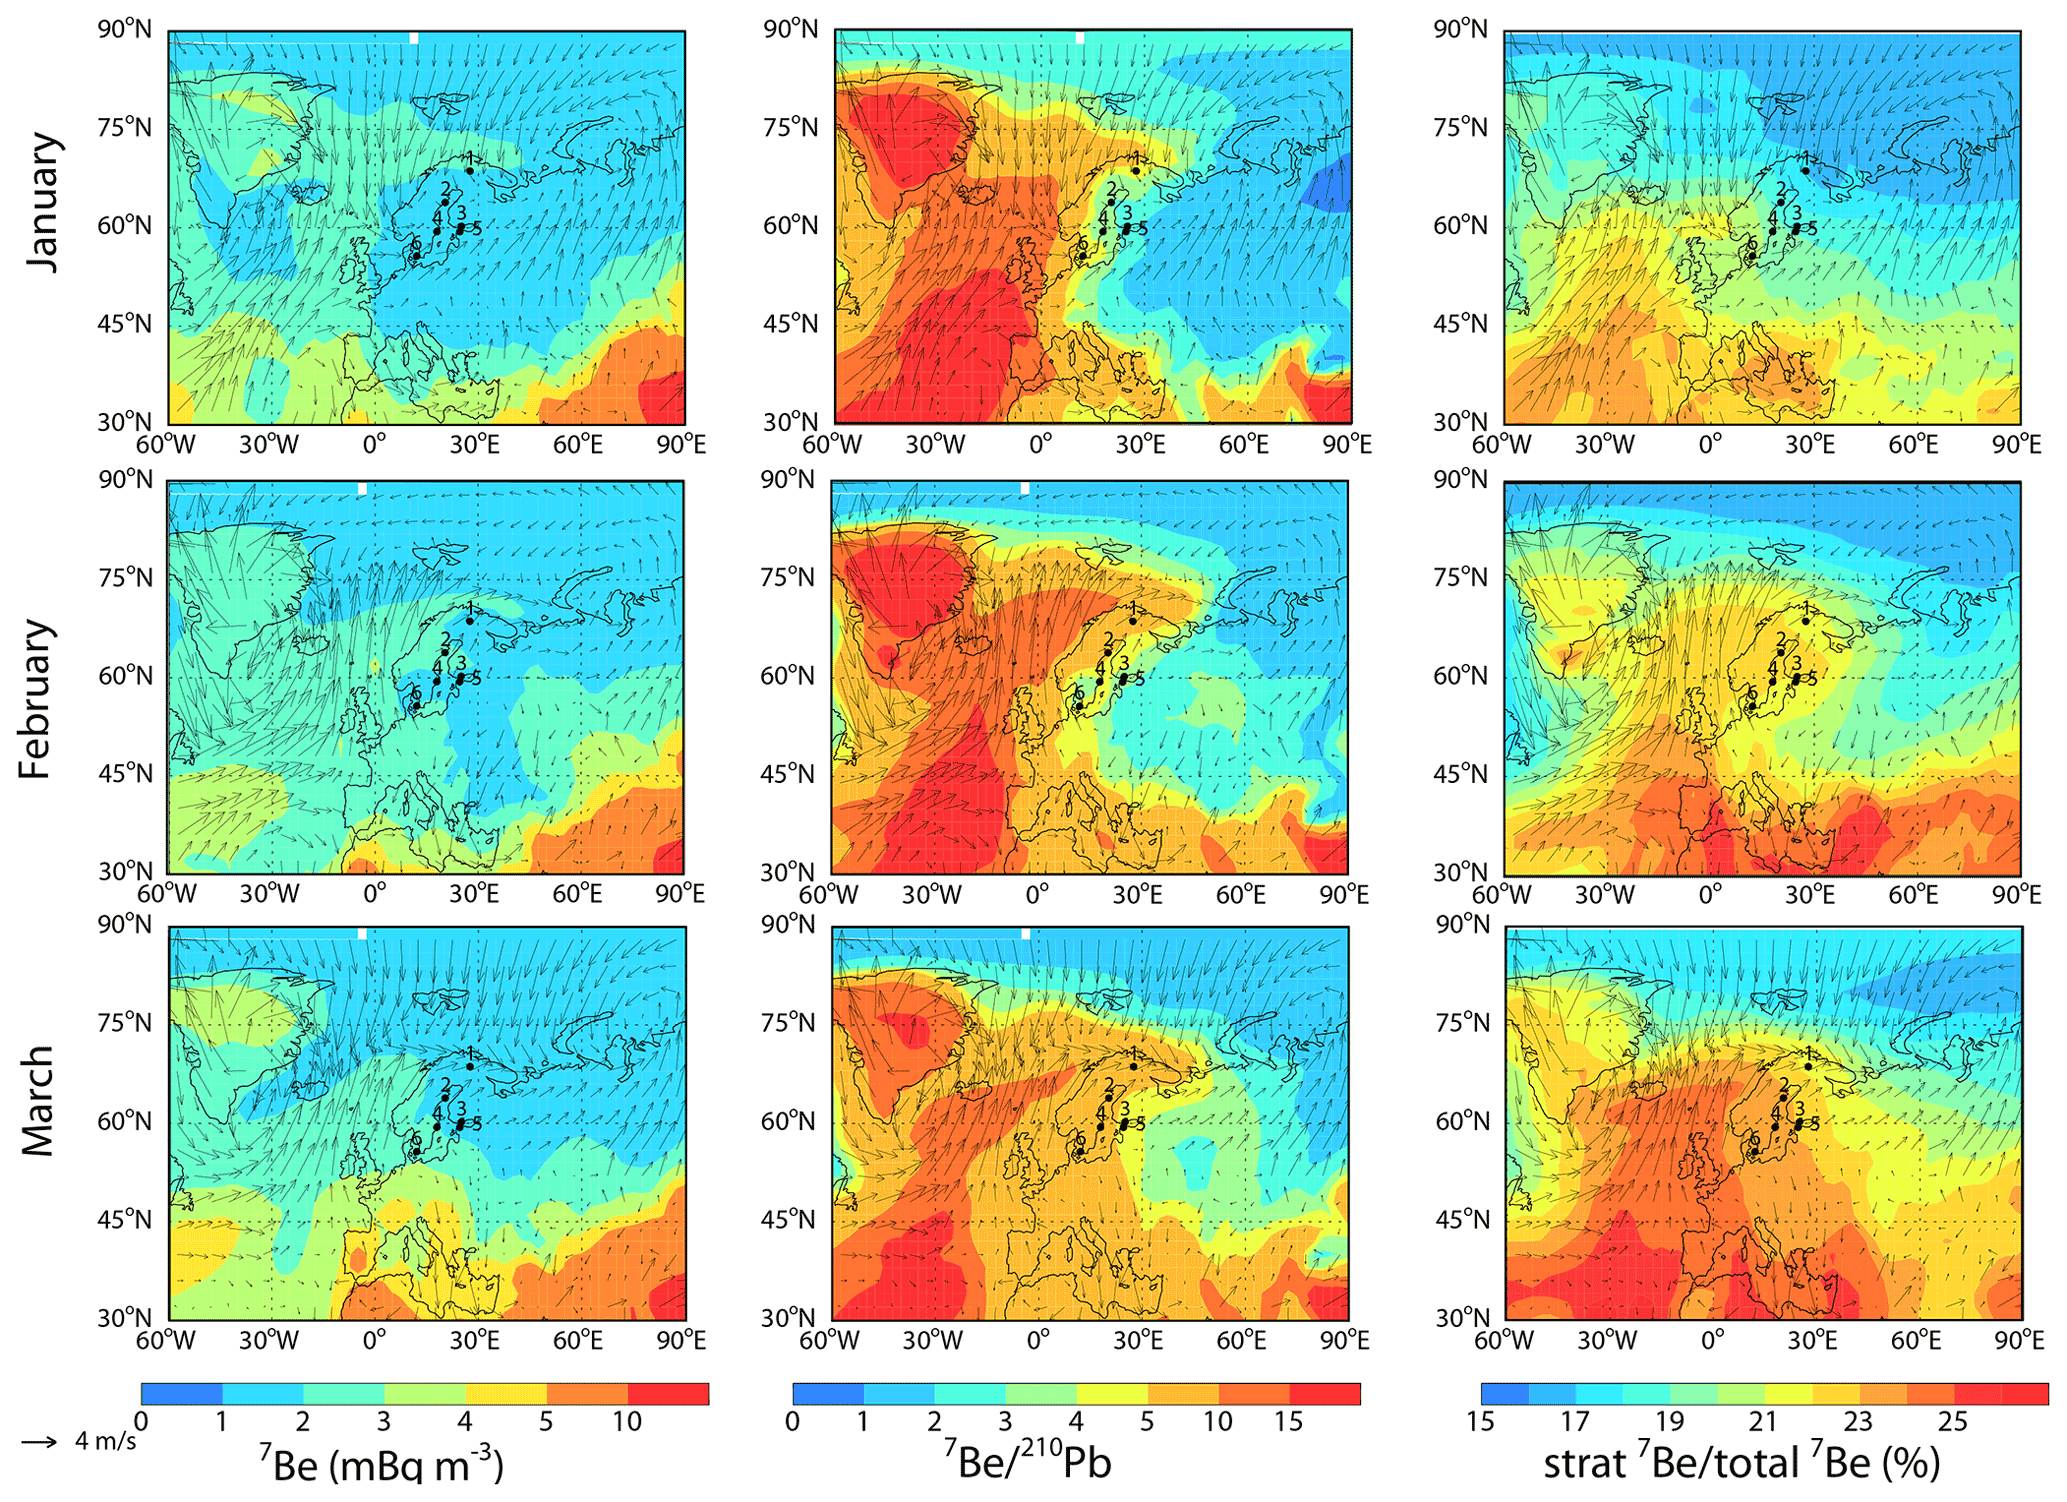
Figure 3Simulated monthly mean 7Be surface concentrations (mBq m−3), 7Be 210Pb ratio and fraction of stratospheric 7Be for January–March 2003. Arrows represent winds in the MERRA-2 reanalysis. The dots indicate the locations of the sampling sites: 1 = Ivalo, 2 = Umeå, 3 = Helsinki, 4 = Kista, 5 = Harku, 6 = Risø.
222Rn emission follows a recent work by Zhang et al. (2021), in which a customized emission map was built upon a few previously published emission scenarios and evaluated against global 222Rn surface observations and aircraft profiles. 222Rn emission flux rate is a function of latitude, longitude and month. 7Be and 210Pb are assumed to behave like aerosols once formed in the atmosphere and subject to dry and wet deposition (Liu et al., 2001). Both wet and dry deposition for 222Rn are neglected due to its inert nature.
GEOS-Chem simulations in this work are driven by the MERRA-2 meteorological reanalysis. The native resolution of MERRA-2 is 0.667∘ longitude by 0.5∘ latitude, with 72 vertical layers (top at 0.01 hPa). The meteorological fields are regridded into 2.5∘ longitude by 2∘ latitude for the GEOS-Chem simulations in this work. GEOS-Chem uses the TPCORE advection algorithm of Lin and Rood (1996). Convective transport is calculated using archived convective mass fluxes (Wu et al., 2007). Boundary-layer mixing is based on the non-local scheme implemented by Lin and McElroy (2010). The wet deposition scheme follows that of Liu et al. (2001) and includes rainout (in-cloud scavenging) due to stratiform and anvil precipitation, scavenging in convective updrafts (Mari et al., 2000), and washout (below-cloud scavenging) by precipitation (Wang et al., 2011). Precipitation formation and evaporation fields are archived in MERRA-2 and used directly by the model wet deposition scheme. Dry deposition is based on the resistance-in-series scheme of Wesely (1989).
In addition to the standard model simulations of 7Be and 210Pb, we separately transport 7Be produced in the model layers above the MERRA-2 thermal tropopause (i.e., stratospheric 7Be tracer) to quantify the stratospheric contribution to 7Be in the troposphere. This approach was previously used by Liu et al. (2001, 2016). Stratospheric fraction of 7Be is defined as the ratio of the stratospheric 7Be tracer concentration to the 7Be concentration from the standard simulation. All model simulations are conducted for the period of January 2002–March 2003 with initial conditions from a previous 5-year simulation. Hourly and monthly mean outputs for January–March 2003 are used for analysis.
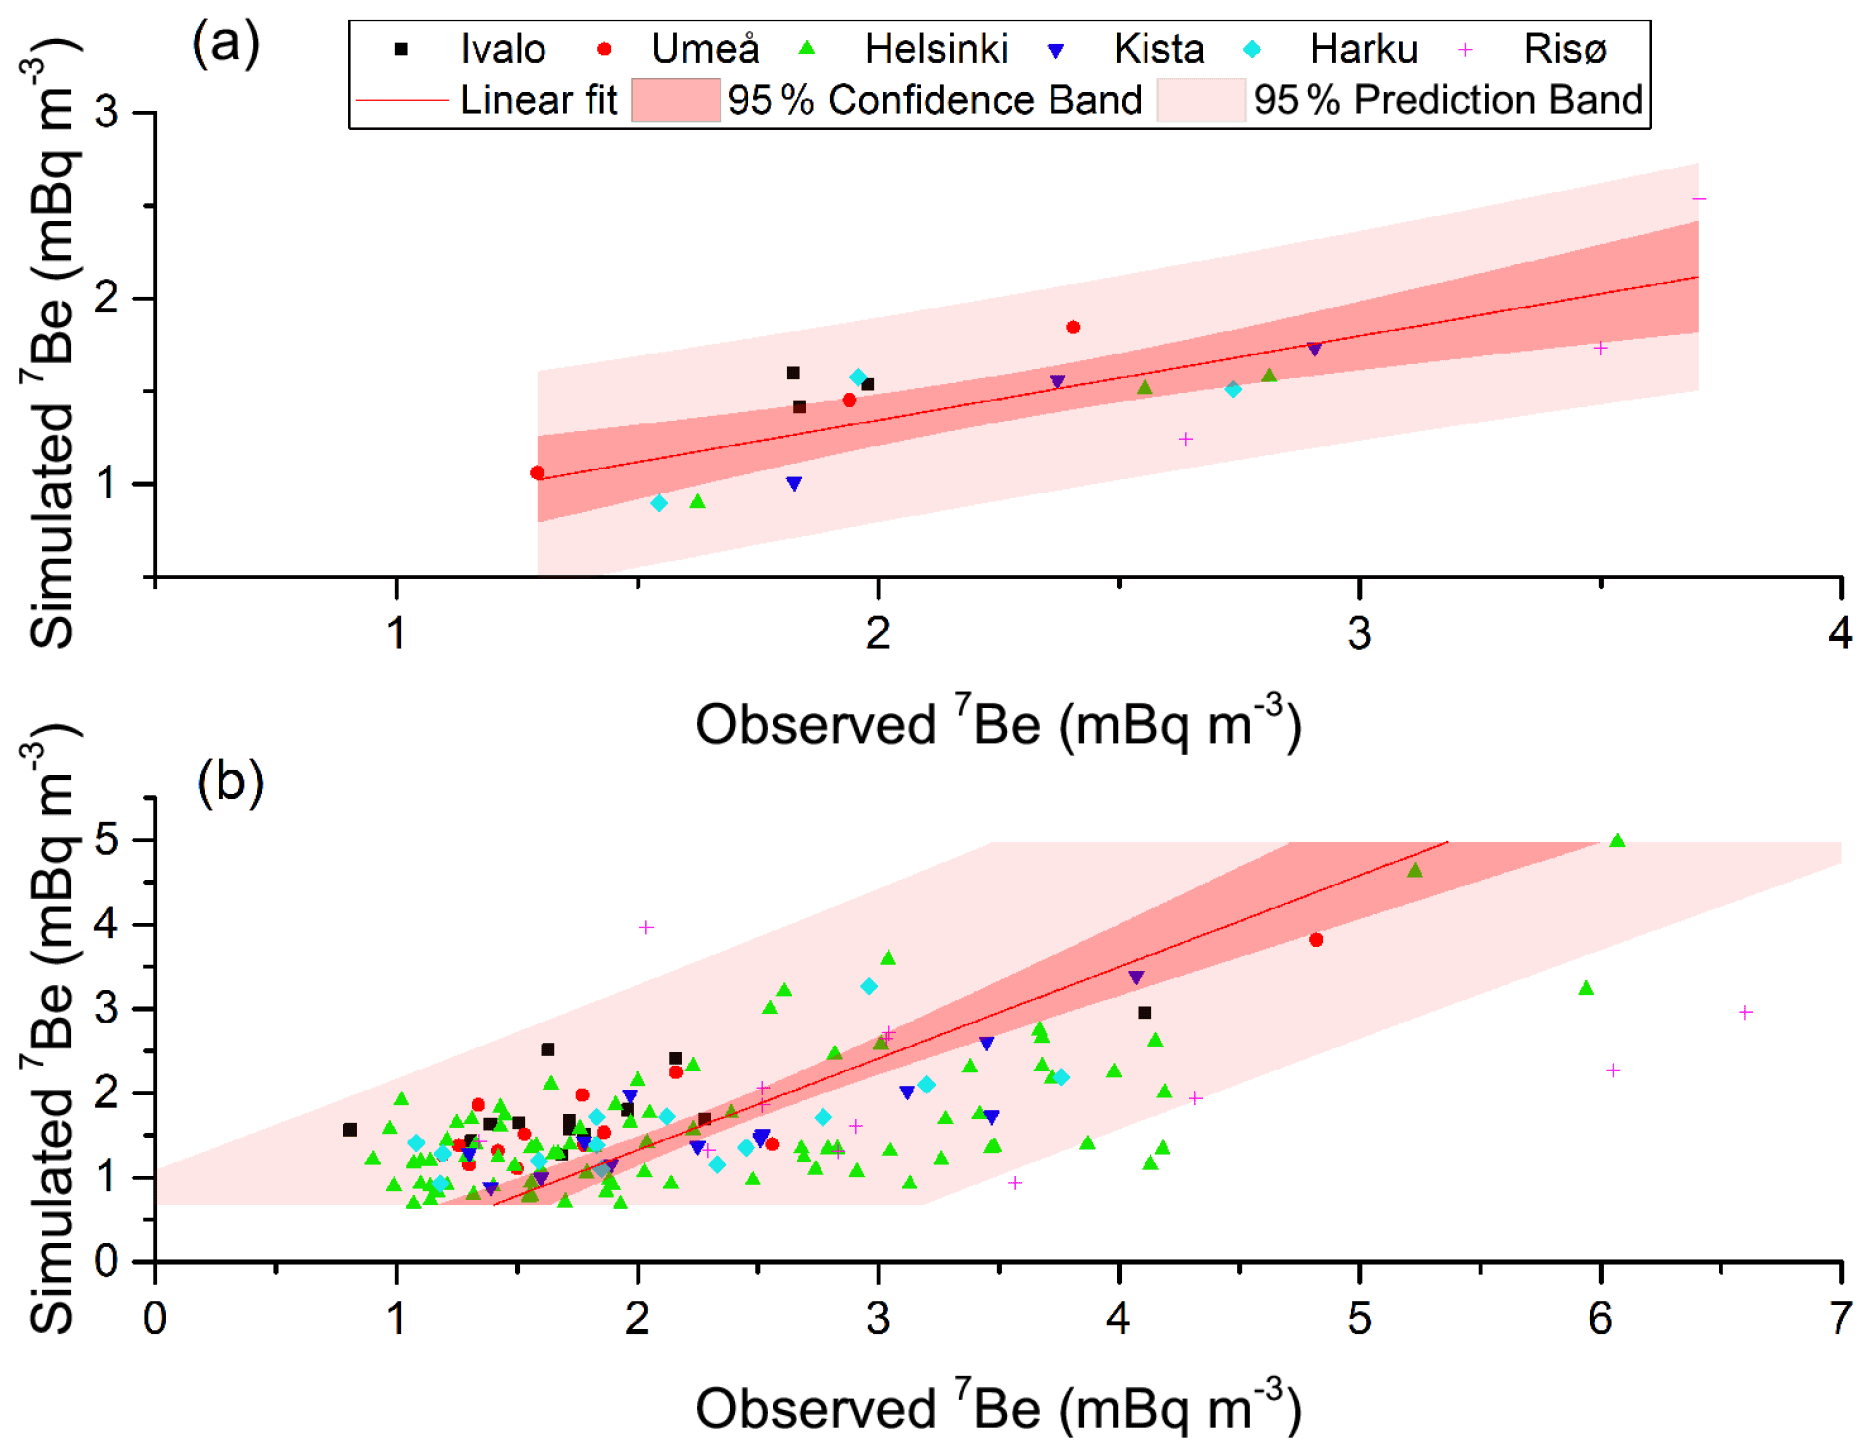
Figure 4Scatter plots of (a) simulated vs. observed 7Be monthly means at the six sampling sites and (b) simulated vs. observed 7Be weekly (daily in the case of Helsinki) means at the six sampling sites. Also shown are the linear regression line and the 95 % confidence and prediction bands around the linear fit.
3.2 HYSPLIT
The Hybrid Single Particle Lagrangian Integrated Trajectory (HYSPLIT) model, developed by the NOAA's Air Resources Laboratory (ARL) (Stein et al., 2015), was used to calculate a set of backward trajectories during the study period. To compute the 96 h 3-D backward trajectories at 00:00, 06:00, 12:00 and 18:00 UTC and with different ending heights, 100, 500, 1000 and 1500 m above ground level, the NCEP (National Centers for Environmental Prediction) FNL Operational Global Analysis (NCEP/NWS/NOAA/U.S. Department of Commerce, 2000) meteorological files were used. Computation used the vertical velocity (w, m/s) field contained in the meteorological input file. While 96 h was considered a sufficiently long period to represent the synoptic air flows, the heights were selected to help us to understand the behavior of the airflows circulating in the atmospheric boundary layer (ABL), just above the ABL and in the free troposphere. We used the cluster methodology implemented in the HYSPLIT model to group the calculated trajectories according to their length and curvature and thus identify the airflow patterns over the whole period of the analysis (Hernández-Ceballos et al., 2013; Brattich et al., 2016). It is worth mentioning that clusters, as well as trajectories, indicate an estimation of the general airflow rather than the exact pathway of an air parcel (e.g., Jorba et al., 2004; Salvador et al., 2008).
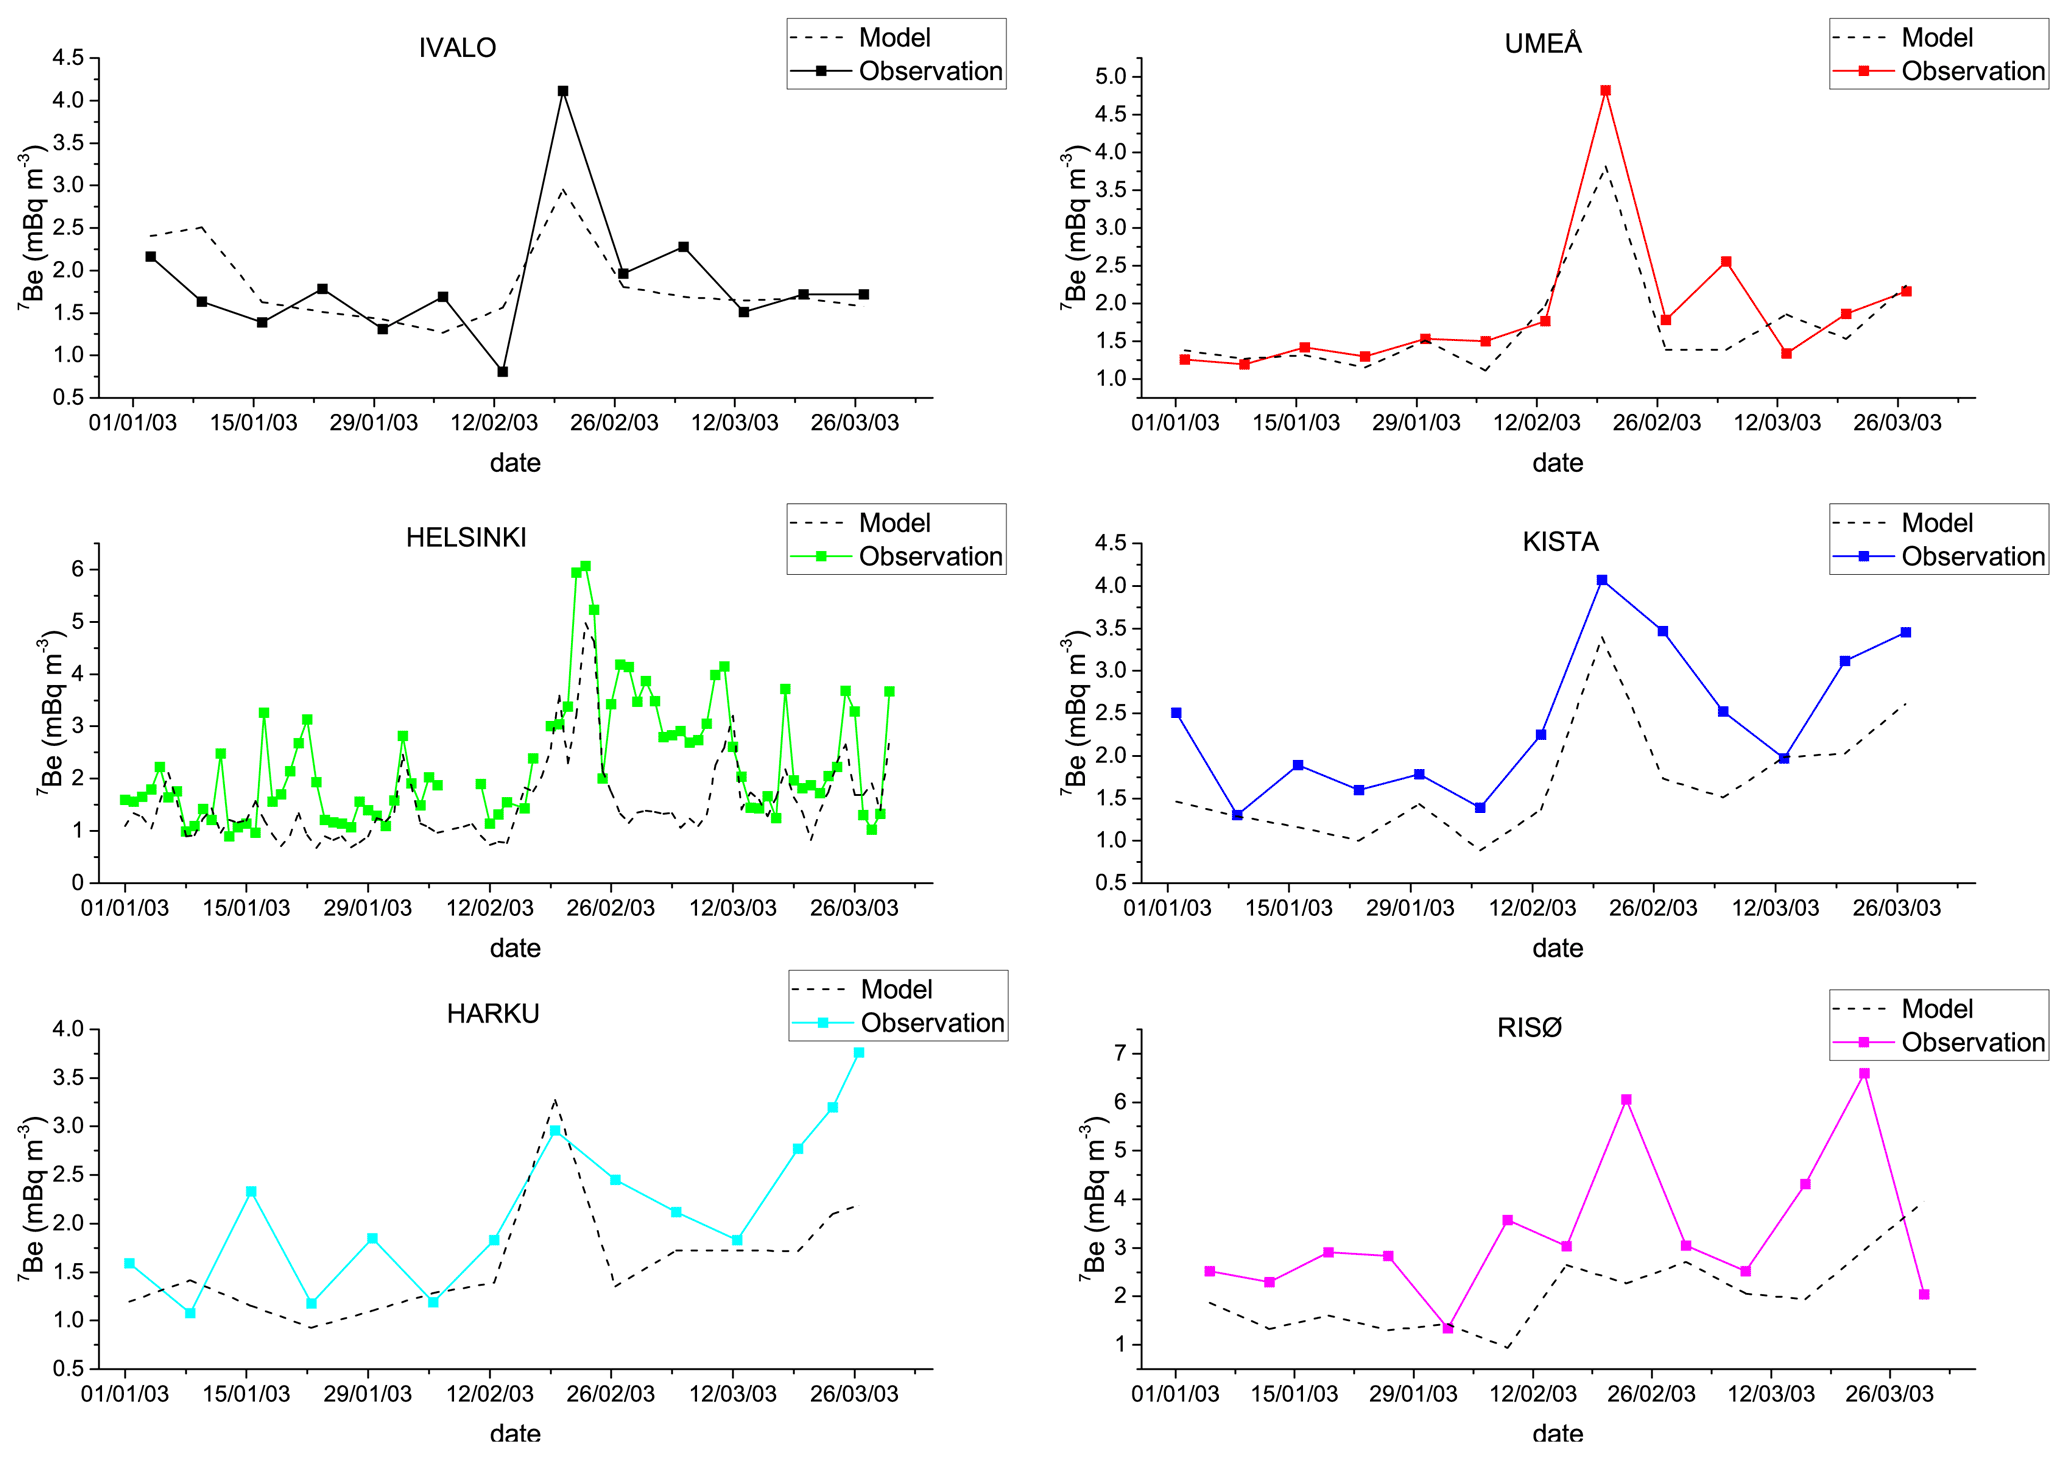
Figure 5Temporal evolution of simulated and observed 7Be surface concentrations at the six sampling sites. Values are weekly (daily in the case of Helsinki) means.
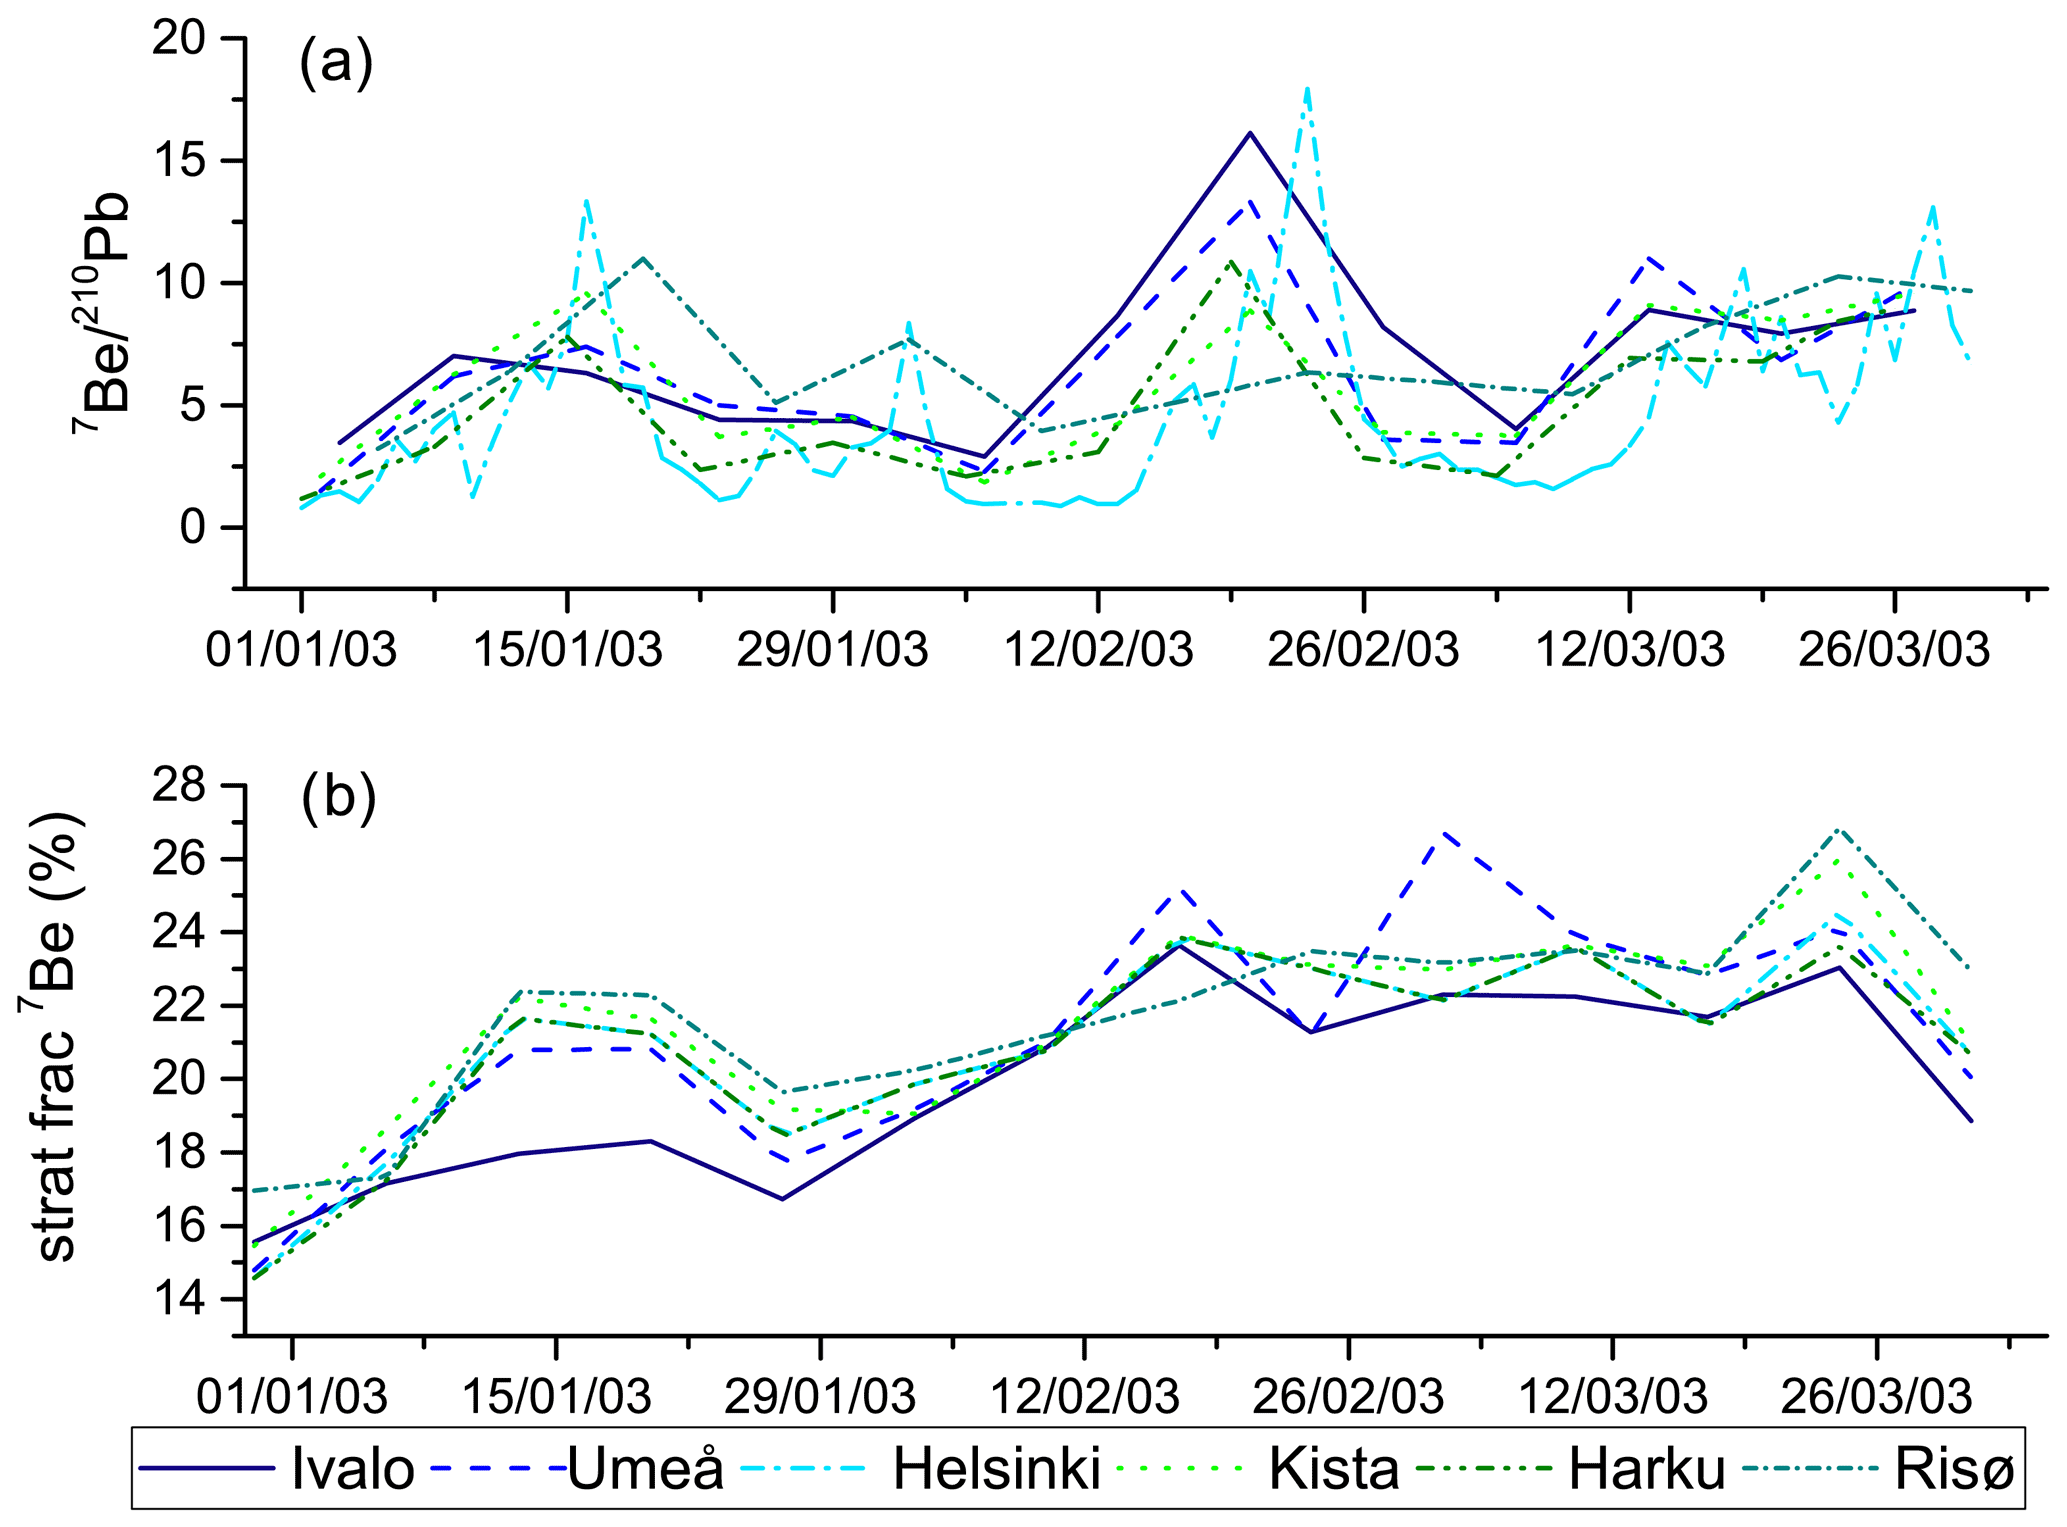
Figure 6Temporal evolution of the simulated (a) 7Be 210Pb and (b) fraction of stratospheric 7Be (calculated as the ratio between the stratospheric 7Be and the total 7Be concentrations, in percentage) at the six sampling sites during January–March 2003. Values are weekly means.
3.3 Evaluation of the model output
The performance of the model in reproducing observed activity concentrations was evaluated by calculating some basic statistical parameters, such as the mean and standard deviation and other indicators, according to the methodology developed by Hanna (1993) and summarized later by Chang and Hanna (2004). Specifically, the performance of the CTM was evaluated using the following set of indicators, proposed by Carruthers et al. (2000):
-
The mean bias (MB), a measure of the mean difference between the modeled and observed concentrations:
where Cm is modeled concentration and Co is observed concentration.
-
The normalized mean square error (NMSE), a measure of the mean difference between matched pairs of modeled and observed concentrations:
-
The fraction of modeled concentrations within a factor of 2 of observations (FA2), i.e., for which .
-
The Pearson's correlation coefficient (R), a measure of the extent of a linear relationship between the modeled and observed concentrations:
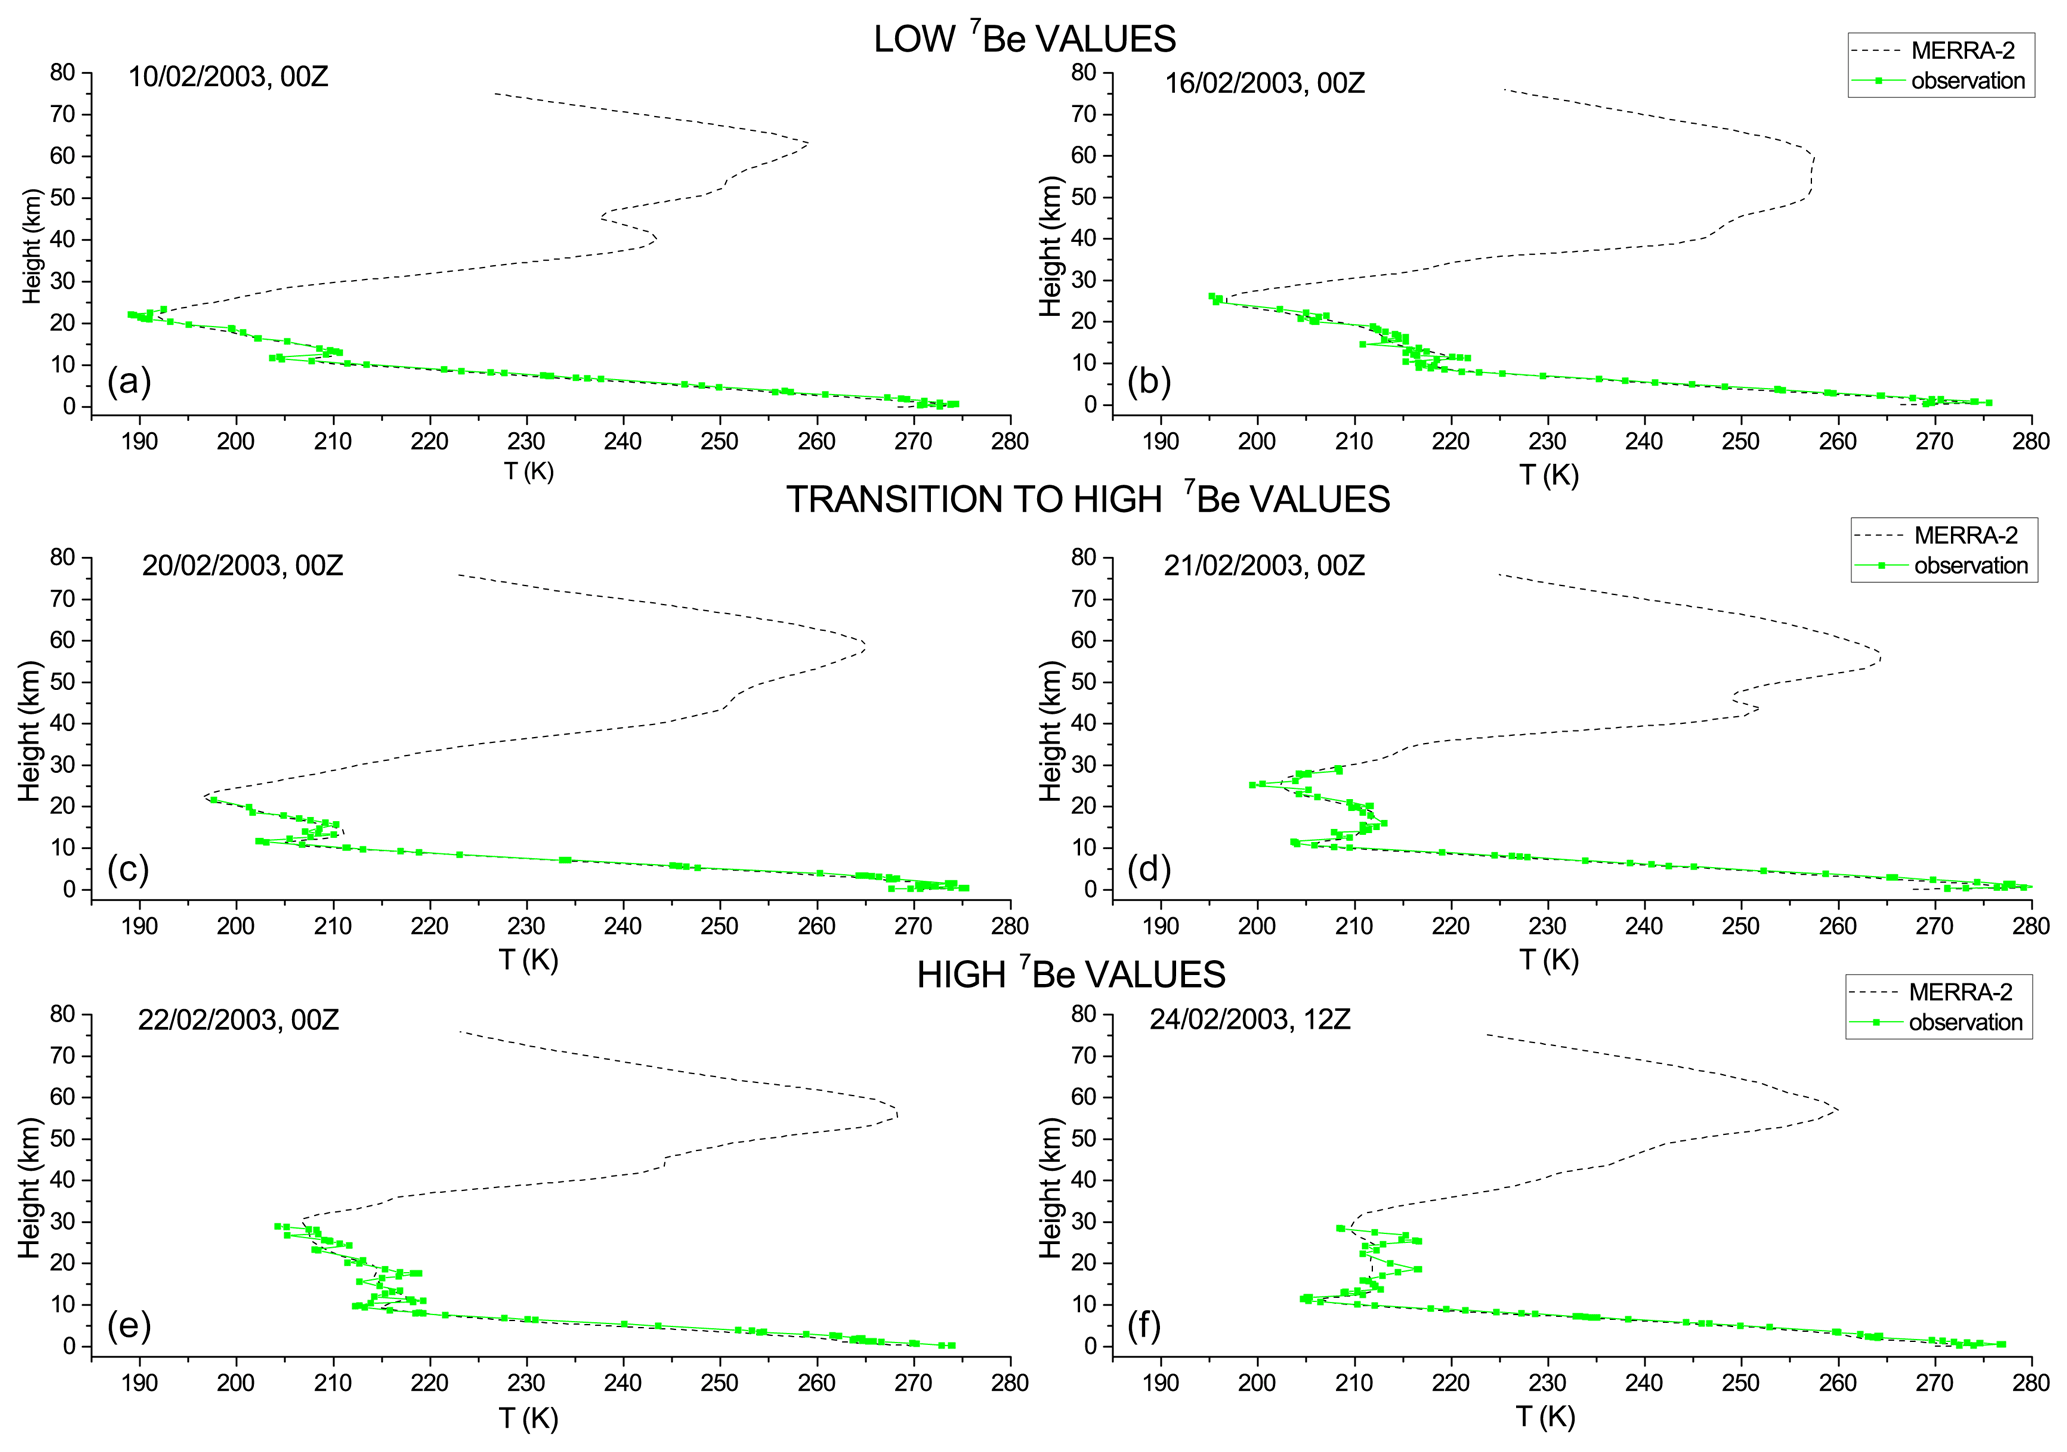
Figure 7Vertical profiles of air temperature in the MERRA-2 reanalysis (dotted line) and in the soundings at the Sodankylä station in Finland on selected days of low 7Be values (a, b: 10 and 16 February 2003, 00:00 UTC), transition to high 7Be values (c, d: 20 February 2003, 00:00 UTC and 21 February 2003, 12:00 UTC) and high 7Be values (e, f: 22 and 24 February 2003, 00:00 UTC) at the six sampling sites in northern Europe.
Additionally, the statistical significance of the Pearson's correlation coefficient and the Z test were also evaluated to identify the presence of statistically significant differences between observed and simulated concentrations. A perfect model has MB and NMSE values equal to 0 and FA2 value equal to 1, while the R results range from −1 (perfect negative relationship) to +1 (perfect positive relationship), where 0 implies no relationship between the variables. To better understand the quantitative differences between observations and simulations, scatter plots were used.
4.1 Boreal winter 2002–2003
As indicated by Ajtić et al. (2018) and Bianchi et al. (2019), the winter of 2003 offers a good opportunity to investigate a possible link between SSW events and extreme surface concentrations of 7Be detected in northern Europe. This period is sufficiently covered by the 7Be activity concentration measurements at all six monitoring sites.
In particular, very high 7Be activity concentrations, above the 90th percentile (calculated over the 1995–2011 period) simultaneously at most of the Fennoscandian Peninsula sampling sites, were recorded around 23–24 February 2003 (Ajtić et al., 2016, 2018) (Fig. 1b). During the 2002–2003 boreal winter, the Arctic vortex was relatively unstable, with six SSW events taking place over the whole season (Peters et al., 2010). Two very pronounced episodes, which were both associated with the vortex splitting and fast SSW recovery, occurred in January and February, respectively (Günther et al., 2008). The evolution of the vortex caused vortex filamentation and vigorous mixing of the vortex and midlatitude stratospheric air (Günther et al., 2008; Müller et al., 2003). Several balloon flights inside the Arctic polar vortex in early 2003 observed unusual trace gas distributions connected to an intrusion of mesospheric air down to altitudes of about 25 km (Engel et al., 2006; Huret et al., 2006; Müller et al., 2007). Such disturbances around the pole are expected to affect the troposphere, i.e., weather conditions (Baldwin and Dunkerton, 2001), and air chemical composition (Hsu, 1980; Limpasuvan et al., 2004). Hence, the high 7Be concentrations that were measured in Fennoscandia around 24 February 2003 could be a result of downward motion of midlatitude stratospheric air. Interestingly, prior to this episode, very low (below the 10th percentile for each site) surface concentrations of 7Be were measured in Risø, Kista and Ivalo on 3, 10 and 16 February 2003, respectively (Fig. 1). These low values were tentatively linked by Ajtic et al. (2018) with the transport of aged stratospheric vortex air poor in 7Be, even though they are more likely related to precipitation scavenging that occurred in the days before, as shown by the ECA&D (European Climate Assessment & Dataset, https://www.ecad.eu/, last access: 23 November 2021) records. The reader is referred to Ajtić et al. (2018) for more details.
4.2 Analysis of winter precipitation and transport in the Fennoscandian Peninsula: observations vs. model simulations
Before analyzing the temporal pattern of simulated 7Be concentrations, we analyzed the precipitation and transport pattern in the MERRA-2 meteorological dataset that drives the GEOS-Chem simulations. In particular, the MERRA-2 precipitation was evaluated against the data from Global Precipitation Climatology Project (GPCP) v2.2 (https://rda.ucar.edu/datasets/ds728.2/, last access: 23 November 2021) satellite and surface observations in winter 2003 (Adler et al., 2003).
Figure 2 shows the MERRA-2 and GPCP monthly precipitation in winter for the region within 0–90∘ N and 90∘ W–90∘ E. Good agreement is found between the MERRA-2 and the GPCP precipitations averaged over the region. Specifically, the geographical distribution of precipitation in MERRA-2 shows some important features that are consistent with the observed climatology precipitations: the desert climate in northern Africa with very low precipitation throughout the period, high precipitation over the North Atlantic region during winter and the seasonal pattern of precipitation in Europe which is similar to that in the North Atlantic region.
To assess the capability of the model to correctly capture the trend in precipitation during the observation period at the sampling sites, we examined the normalized differences between the MERRA-2 and the observed precipitation, calculated as a difference between the MERRA-2 and the observed values, normalized over the observed value (Table 1).
Table 1Normalized differences between the MERRA-2 and observed precipitation, calculated as differences between the MERRA-2 and the observed values, normalized over the observed value, at each sampling site (left). Positive values indicate that the model tends to overestimate observations while the negative ones indicate underestimation. Statistical parameters (mean ± SD = mean ± standard deviation; MB = mean bias; NMSE = normalized mean square error; R= correlation coefficient; FA2 = factor of 2) indicating the model performance in reproducing GPCP monthly accumulated precipitation at the six sampling sites in northern Europe (right).

Table 2Normalized differences between the simulated and observed 7Be monthly means, calculated as differences between the simulated and the observed values, normalized over the observed value, at each sampling site (left). Statistical parameters (mean ± SD = mean ± standard deviation; MB = mean bias; NMSE = normalized mean square error; FA2 = factor of 2) indicating the model performance in reproducing observed 7Be monthly means at the six sampling sites in northern Europe and 7Be 210Pb and 210Pb monthly means in Helsinki (right).
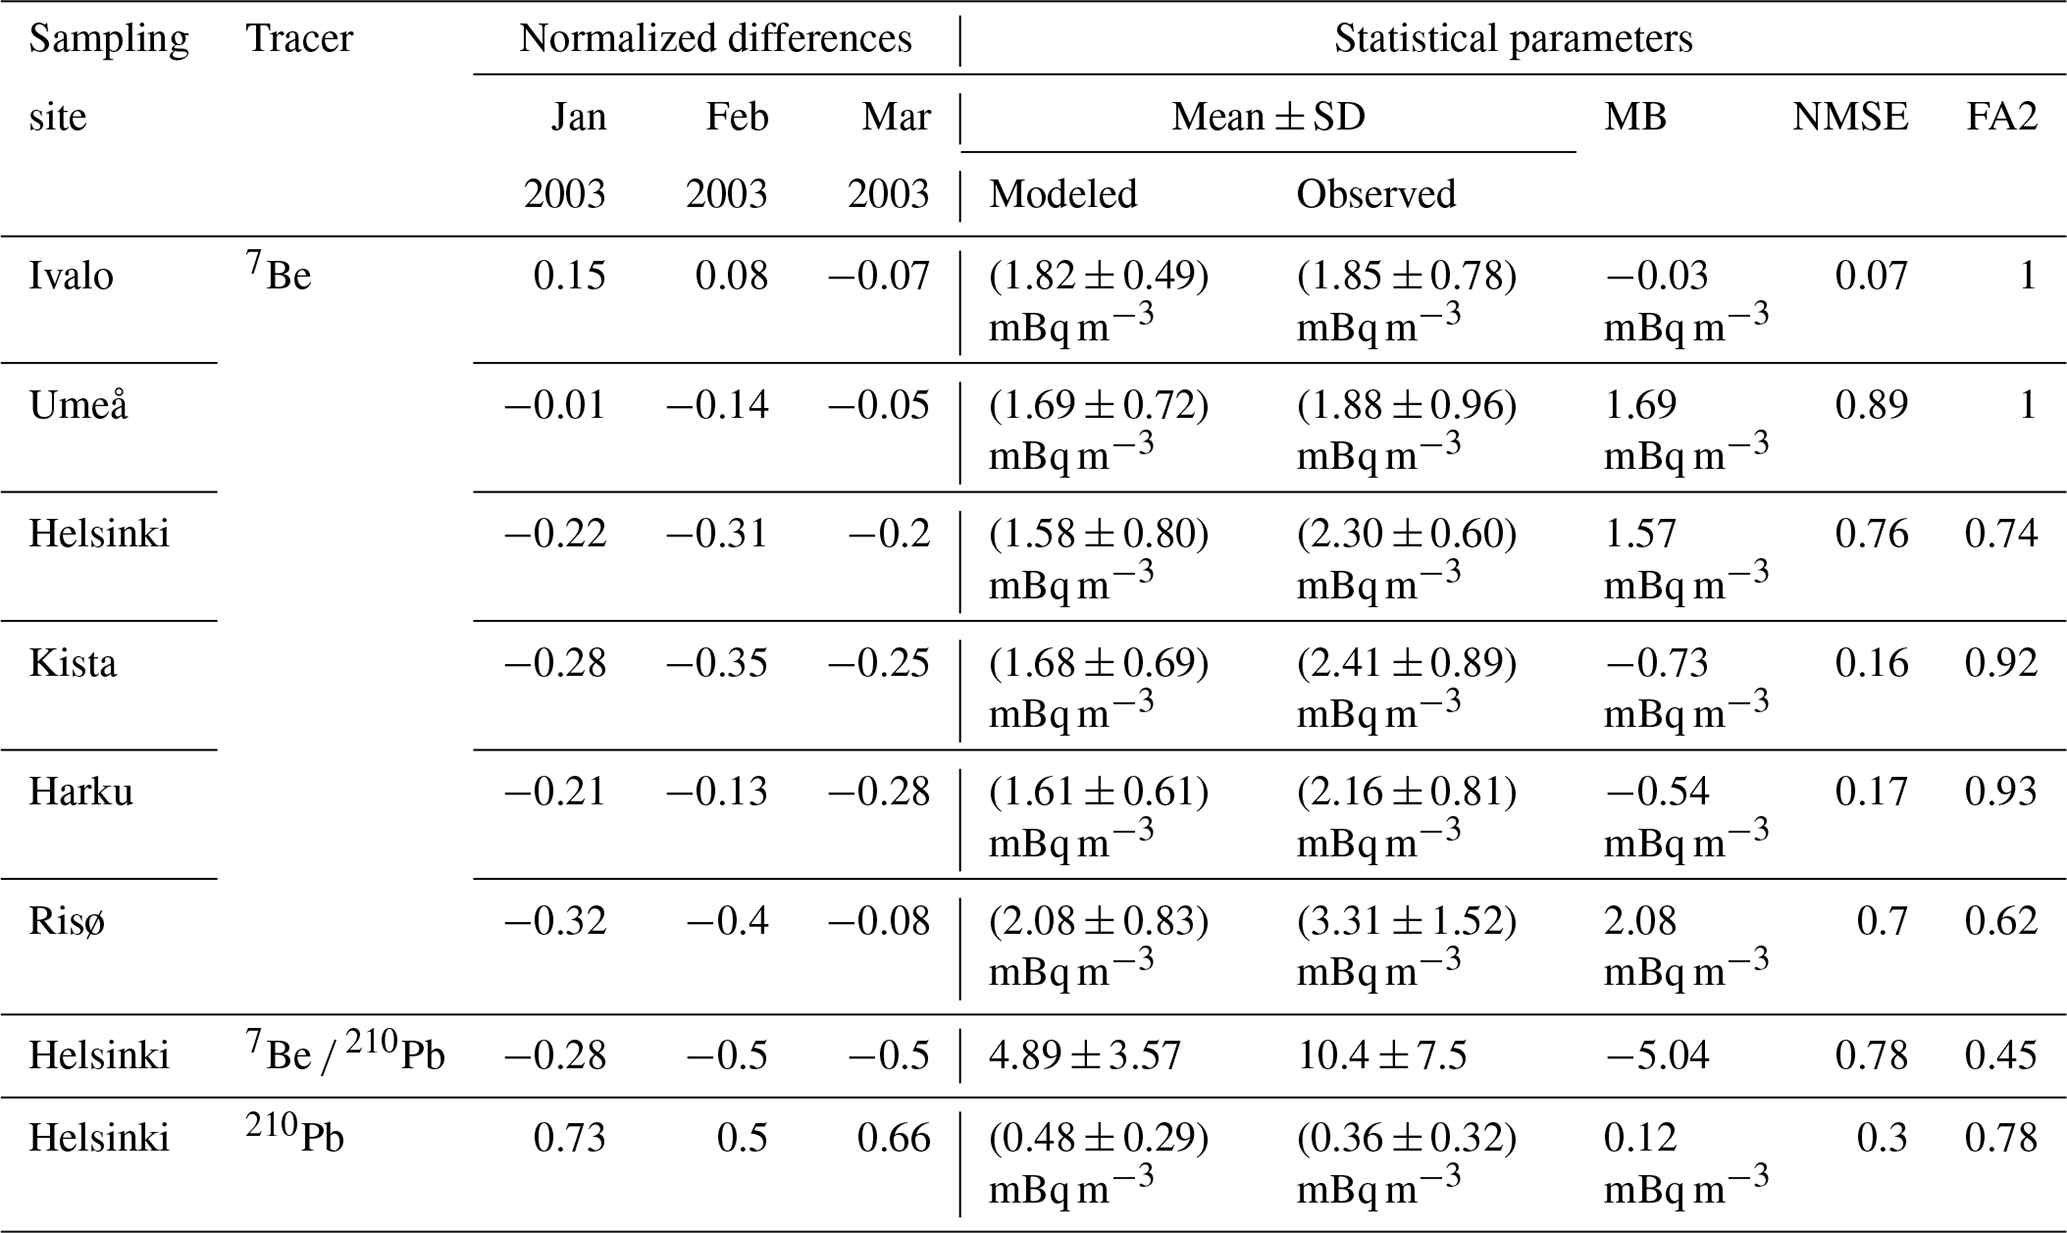
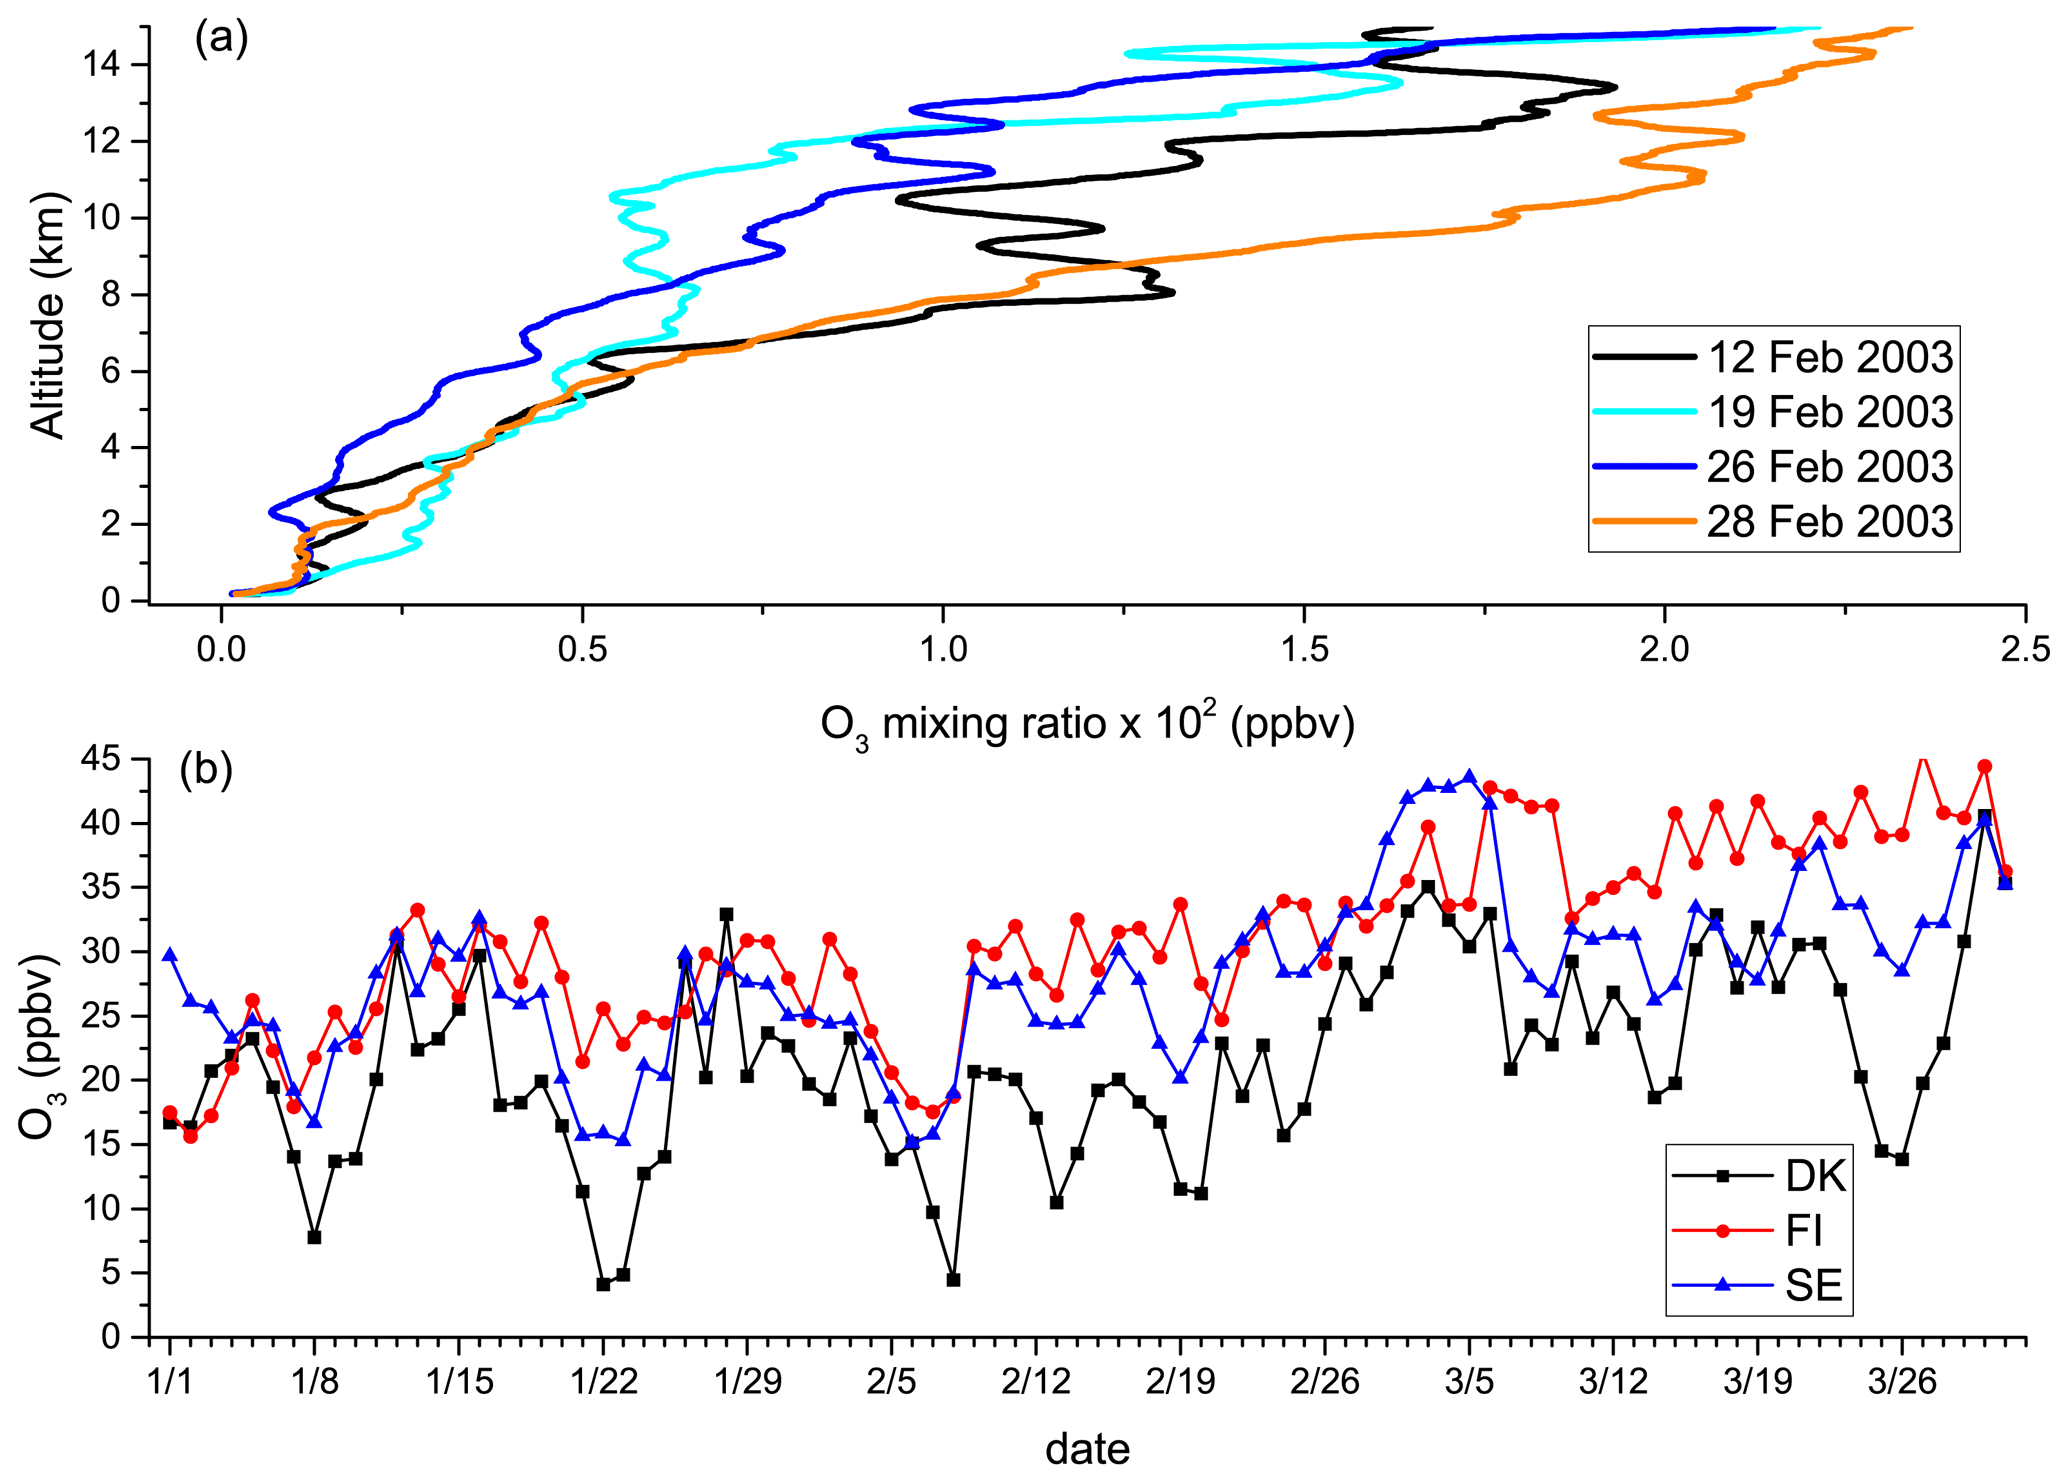
Figure 8(a) Vertical profiles of ozone mixing ratios (ppbv) obtained by ozone soundings at the Sodankylä Arctic station during 4 different days in February 2003: 12, 19, 16 and 28 February 2003; (b) Daily mean O3 concentrations recorded at ground-based air quality stations located in Denmark (DK), Finland (FI) and Sweden (SE) during January–March 2003.
Overall, the MERRA-2 precipitation tends to be higher than that of GPCP at all sampling sites (Table 1) except for Harku and Helsinki, and especially in the February–March period. This result is in agreement with the findings of Gelaro et al. (2017), who compared the global precipitation of MERRA-2 and GPCP and reported a general positive bias over northern high latitudes. However, the agreement between MERRA-2 and GPCP precipitation seasonality is reasonable, as indicated by the correlation coefficient values, higher than 0.85 at all sites except for Ivalo (−0.32), and the low NMSE values, in the range of 0–0.42 (Table 1). The low negative correlation at Ivalo is due to the fact that while the GPCP-observed precipitation at this site is similar between January and February with a general tendency towards lower values from January to March 2003, the model simulates a decrease from January to February with a small increase in March. However, the statistical parameters reported in Table 1 indicate a small overall discrepancy between the GPCP and MERRA-2 precipitation at all sites.
Figure 3 shows that winter circulation in the Fennoscandian Peninsula is dominated by SW and W winds (Chen, 2000; Linderson, 2001). The analysis of the main circulation in the 3 months in Fig. 3 reveals low wind speeds from S–SW in the study area and period. A region of strong wind speeds, possibly corresponding to the Arctic vortex, is clearly visible at surface level to the west of the study area in all 3 months. In addition, there appears to be a convergence area (opposite wind directions) between 60 and 75∘ N. Model-simulated 7Be 210Pb ratios and fraction of stratospheric 7Be increased over the 3-month period and peaked in March, suggesting increasing stratospheric influence, subsidence or convective mixing in the study region.
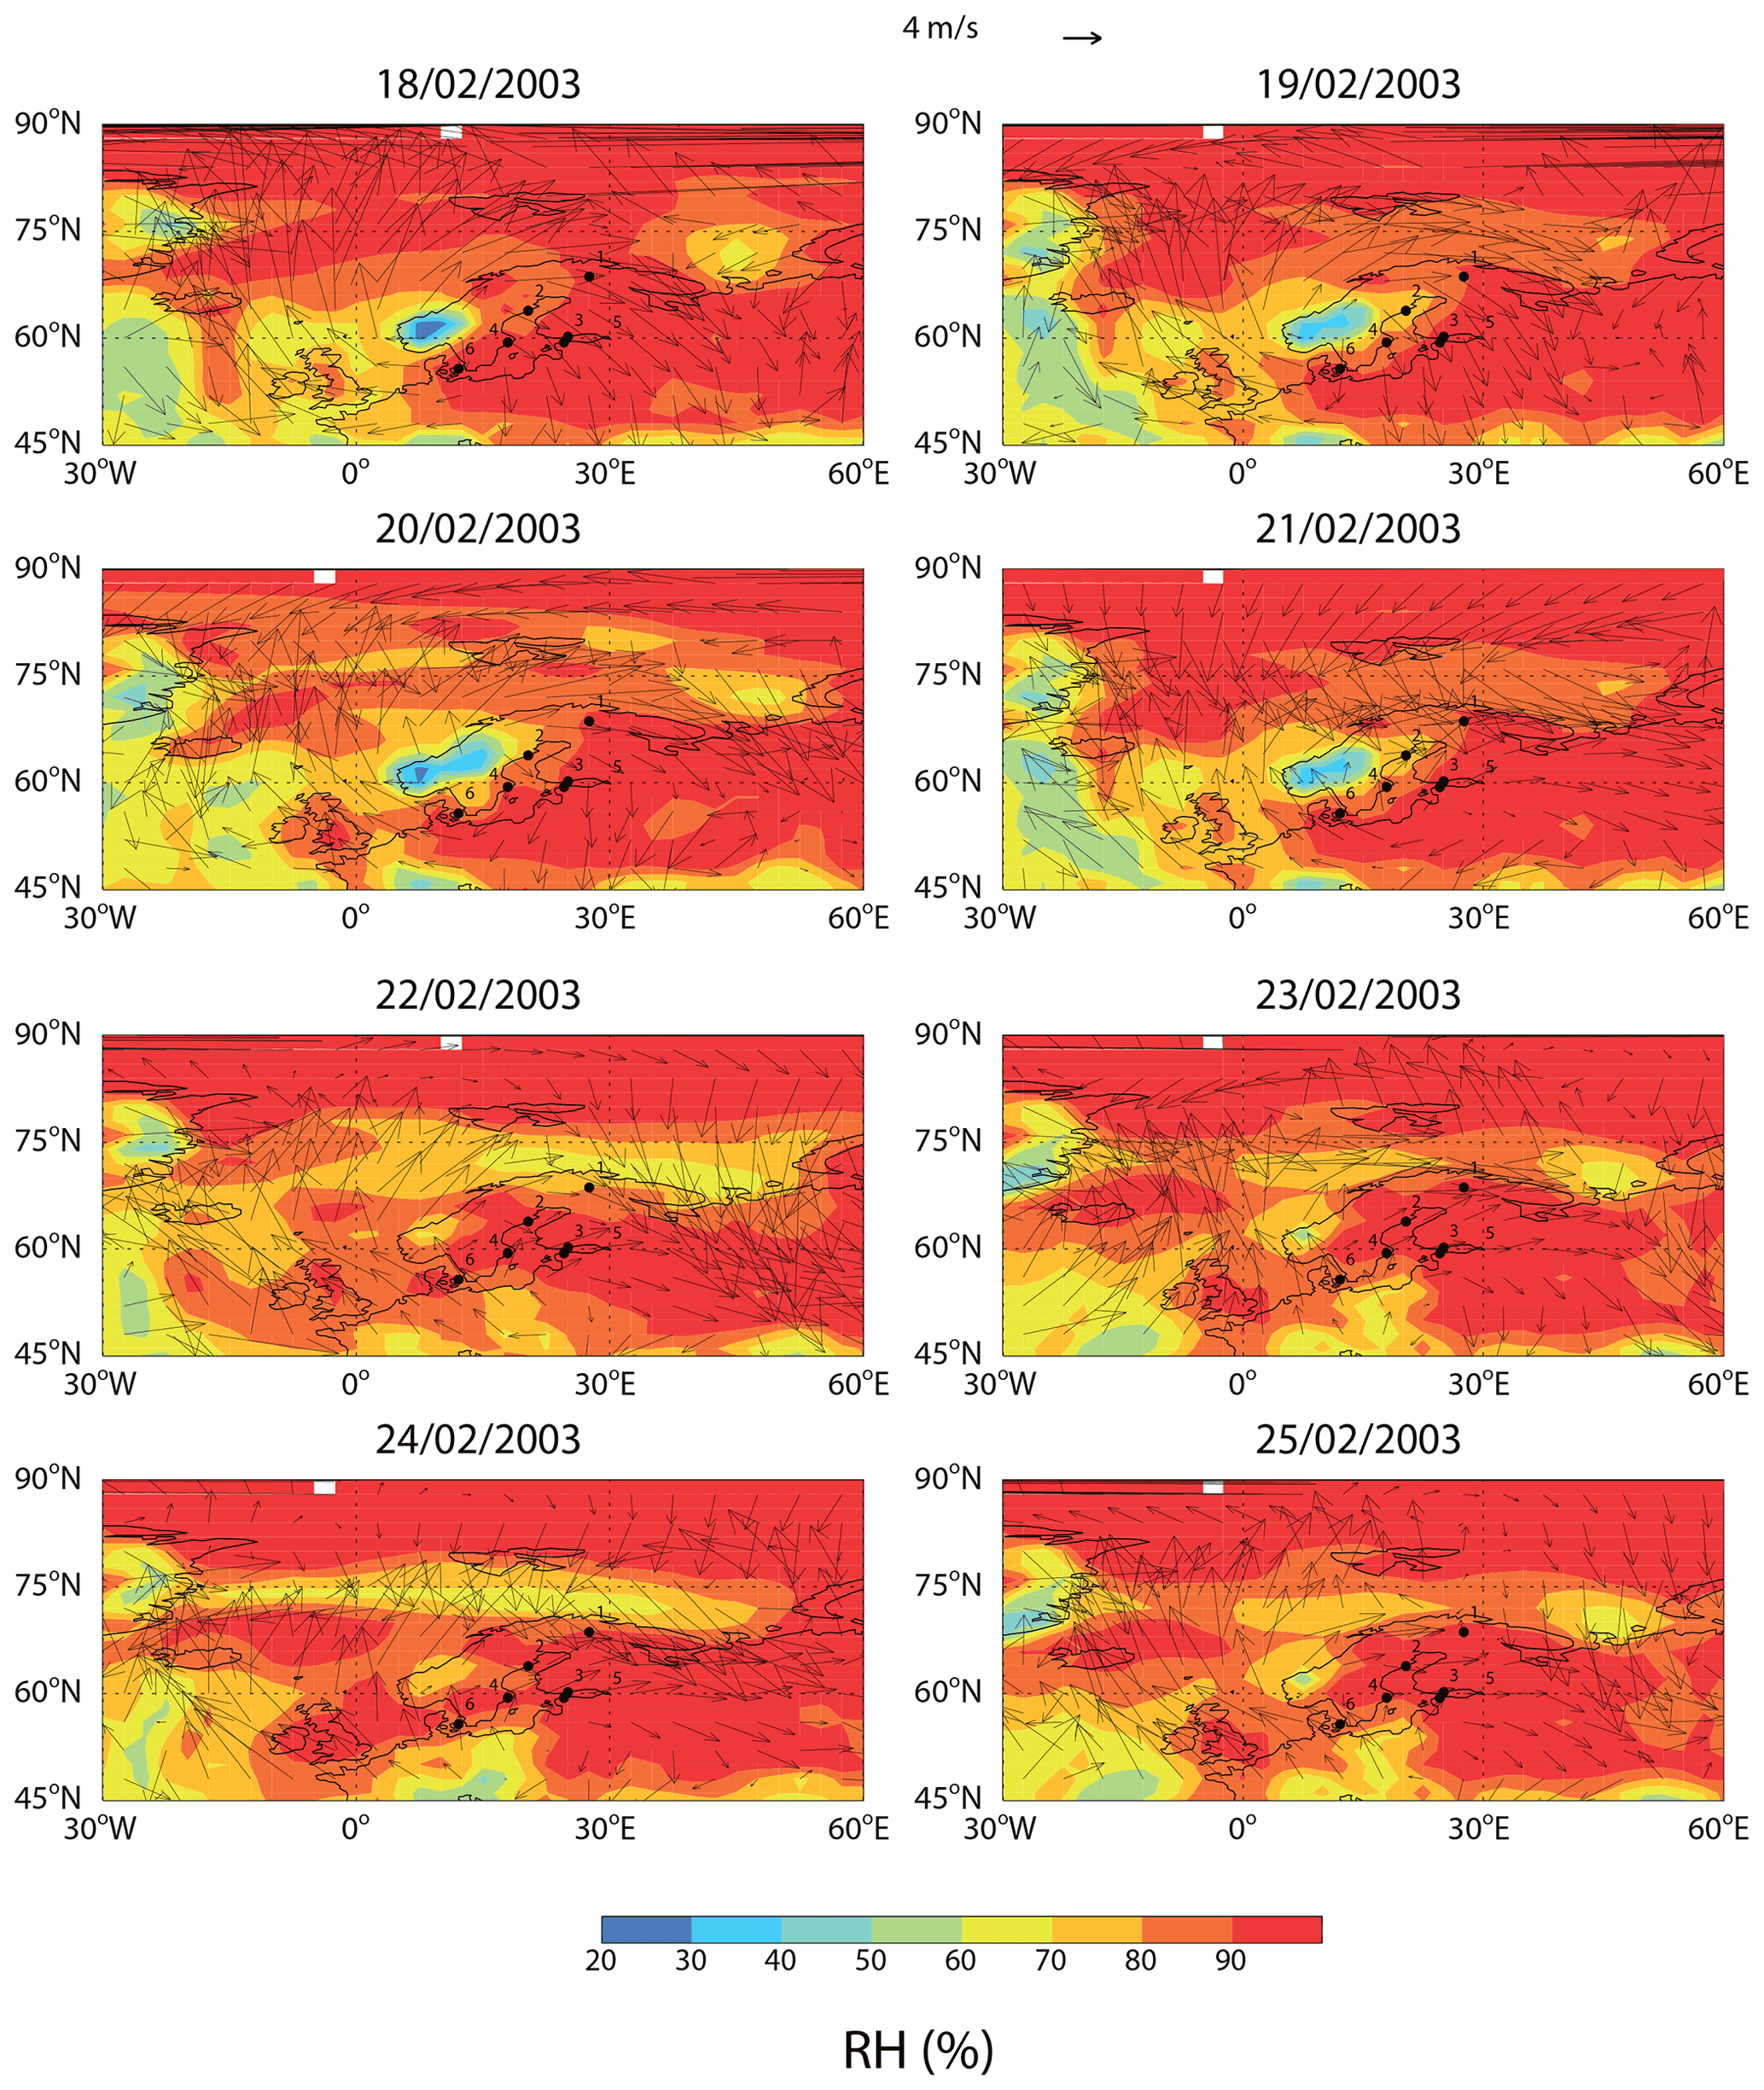
Figure 9MERRA-2 daily mean relative humidity (colors) and winds (arrows) at ground level during 18–25 February 2003. The dots indicate the locations of the sampling sites: 1 = Ivalo, 2 = Umeå, 3 = Helsinki, 4 = Kista, 5 = Harku, 6 = Risø.
4.3 Variations of the monthly mean surface 7Be concentrations in the Arctic region: model simulations vs. observations
Figure 4a shows a scatter plot comparing the simulated and observed monthly mean 7Be concentrations at the six sampling sites. Table 2 reports the statistical parameters and the normalized differences that indicate the performance of the GEOS-Chem model in reproducing the observed 7Be monthly means.
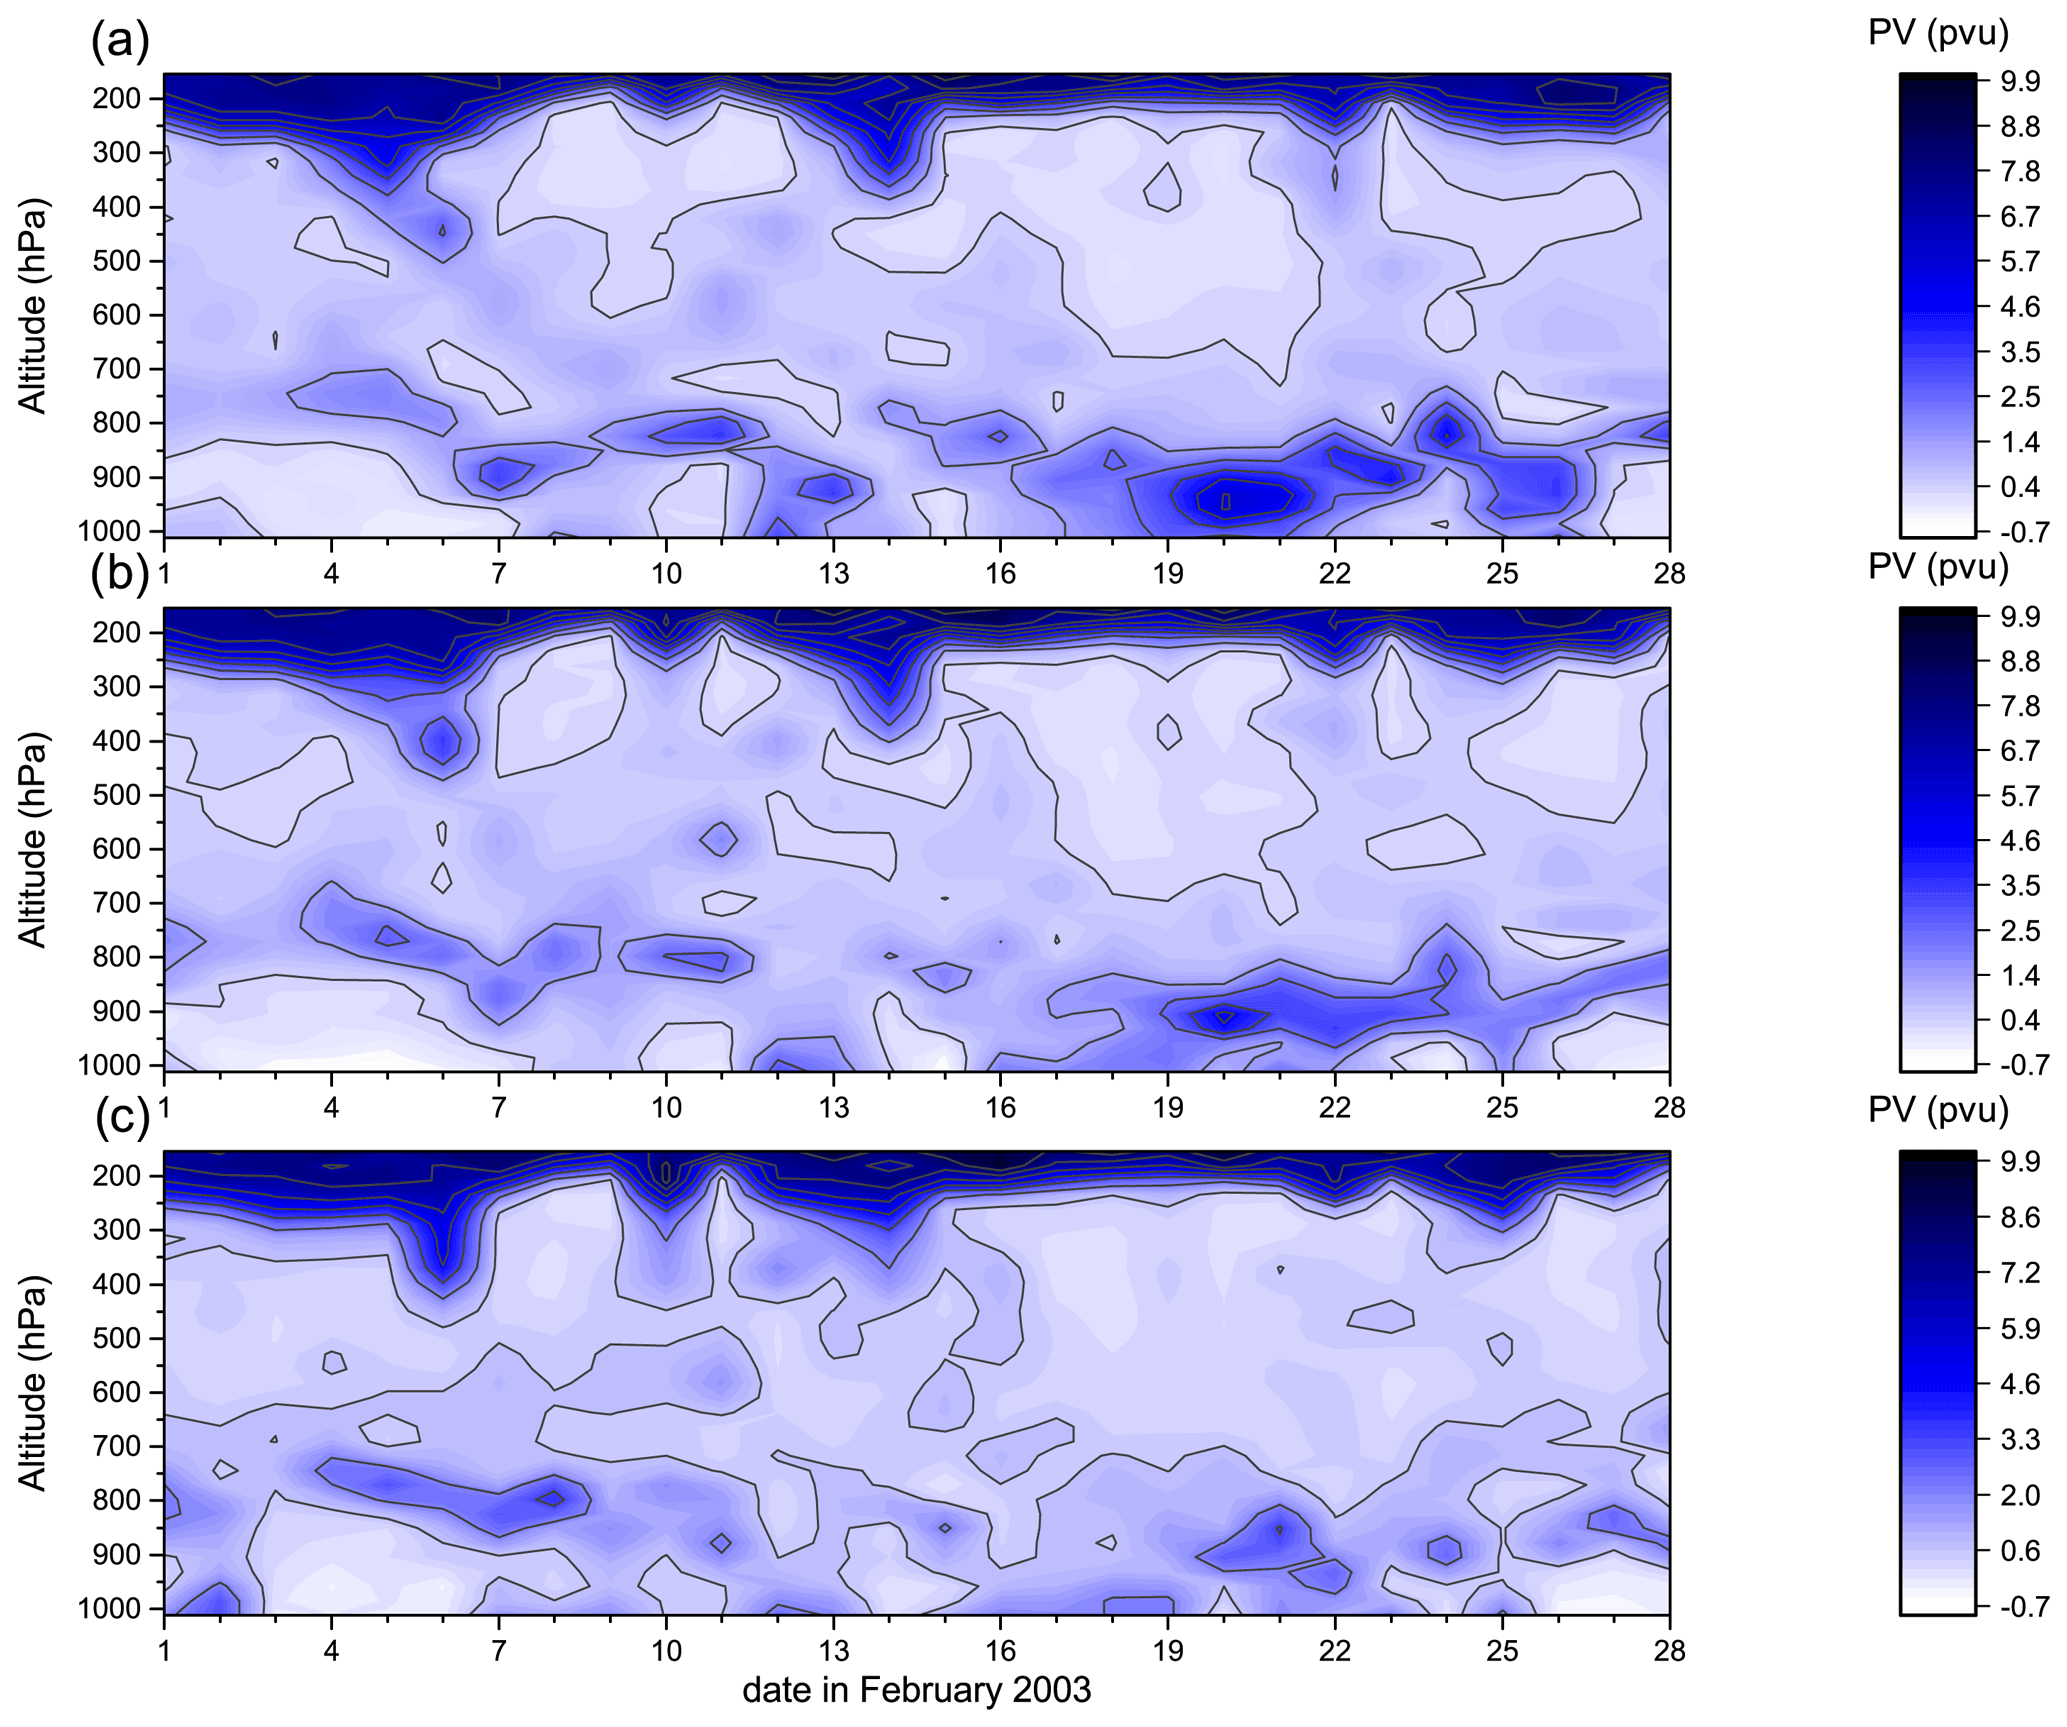
Figure 10Time–height cross sections of calculated daily potential vorticity during the month of February 2003 at three latitudes: (a) 63∘ N, (b) 64.5∘ N and (c) 66∘ N along the 21∘ E meridian.
In general, the model simulates well the month-to-month trend in 7Be concentrations measured at the sampling sites, as indicated by the fact that all the values fall within the 95 % confidence levels (Fig. 4a) and the high positive correlation coefficients (>0.7) except for Ivalo and the low MB and NMSE values (Table 2). In fact, the normalized differences are not very high (generally <1), except at Risø. The bias between the model and the observations is partly attributed to the coarse horizontal resolution of the model. Overall, the simulations underestimate the observed values, likely due to uncertainties associated with the deposition schemes and/or precipitation as discussed earlier.
The use of the 7Be production rate of Lal and Peters (1967) for a solar maximum year (1958) may also partly explain the tendency of simulated 7Be to be lower than observed. The sunspot number in 2003 (99.3) was rather low (slowly decreasing from 2000, a solar maximum year, and reaching minimum in 2008) compared with the value of 184.8 in 1958. As is known, the galactic cosmic-ray intensity, largely responsible for the production of cosmogenic radionuclides, at the Earth's orbit is inversely related to solar activity (Potgieter, 2013), leading to the well-known phase opposition between sunspot number and 7Be concentration (e.g., Hernández-Ceballos et al., 2015). Sunspot number data herein used were extracted from the World Data Center for the production, preservation and dissemination of the international sunspot number (Sunspot Index and Long-term Solar Observation, SILSO, Royal Observatory of Belgium, Brussels, https://wwwbis.sidc.be/silso/datafiles, last access: 23 November 2021).
4.4 Variations of the 7Be weekly and daily mean surface concentrations in the Arctic region: observations vs. model simulations
After analyzing the model's performance in reproducing 7Be monthly mean observations in the previous section, here we compare the simulated and observed weekly (daily in the case of Helsinki) 7Be activity concentrations at the six sampling sites (Fig. 4b). Table 3 shows the corresponding parameters that indicate the performance of the GEOS-Chem model in reproducing observations. The weekly evolution of simulated versus observed 7Be concentrations at these sites is shown in Fig. 5.
Table 3Statistical parameters indicating the model performance in reproducing observed 7Be weekly (daily in the case of Helsinki) means at the six sampling sites in northern Europe. The asterisk aside the value of the correlation coefficient and of the Z indicates that the value is statistically significant at the 0.05 significance level.
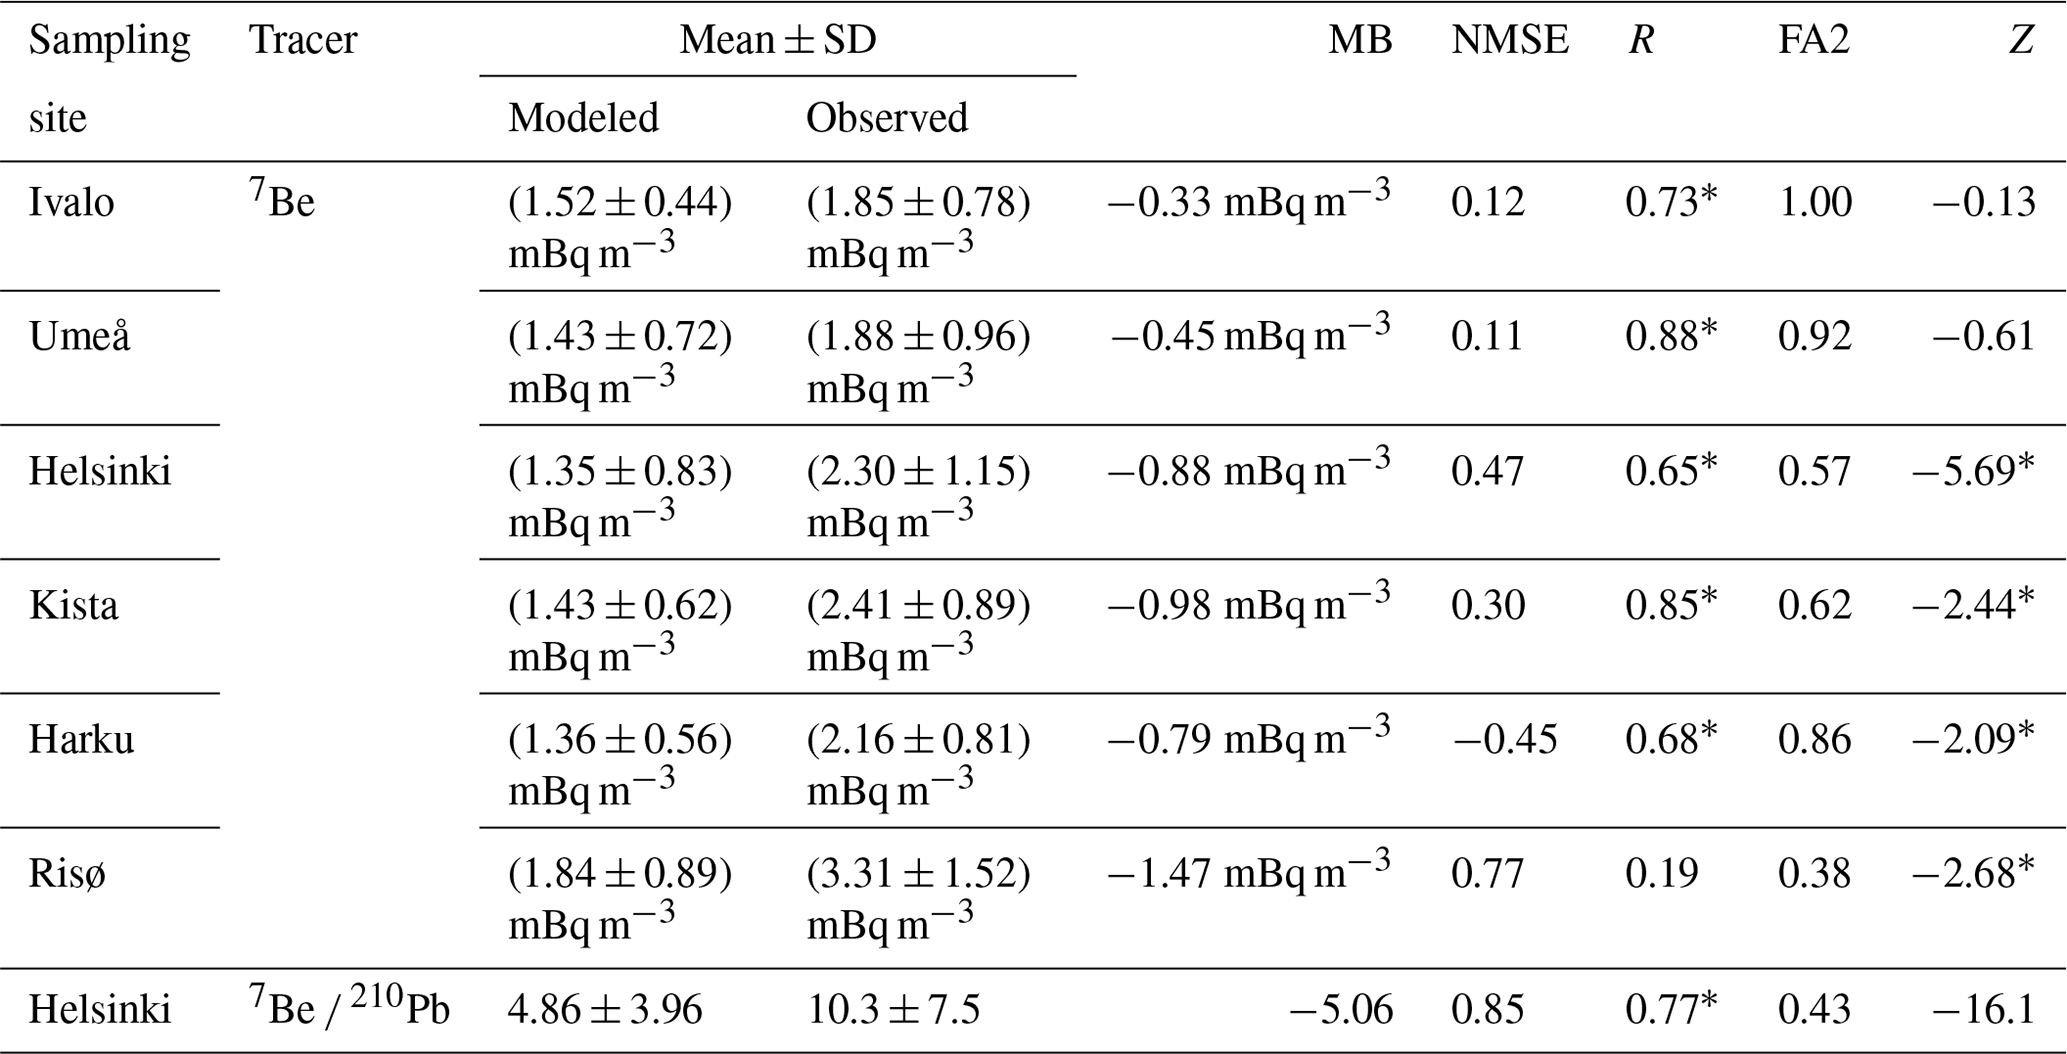
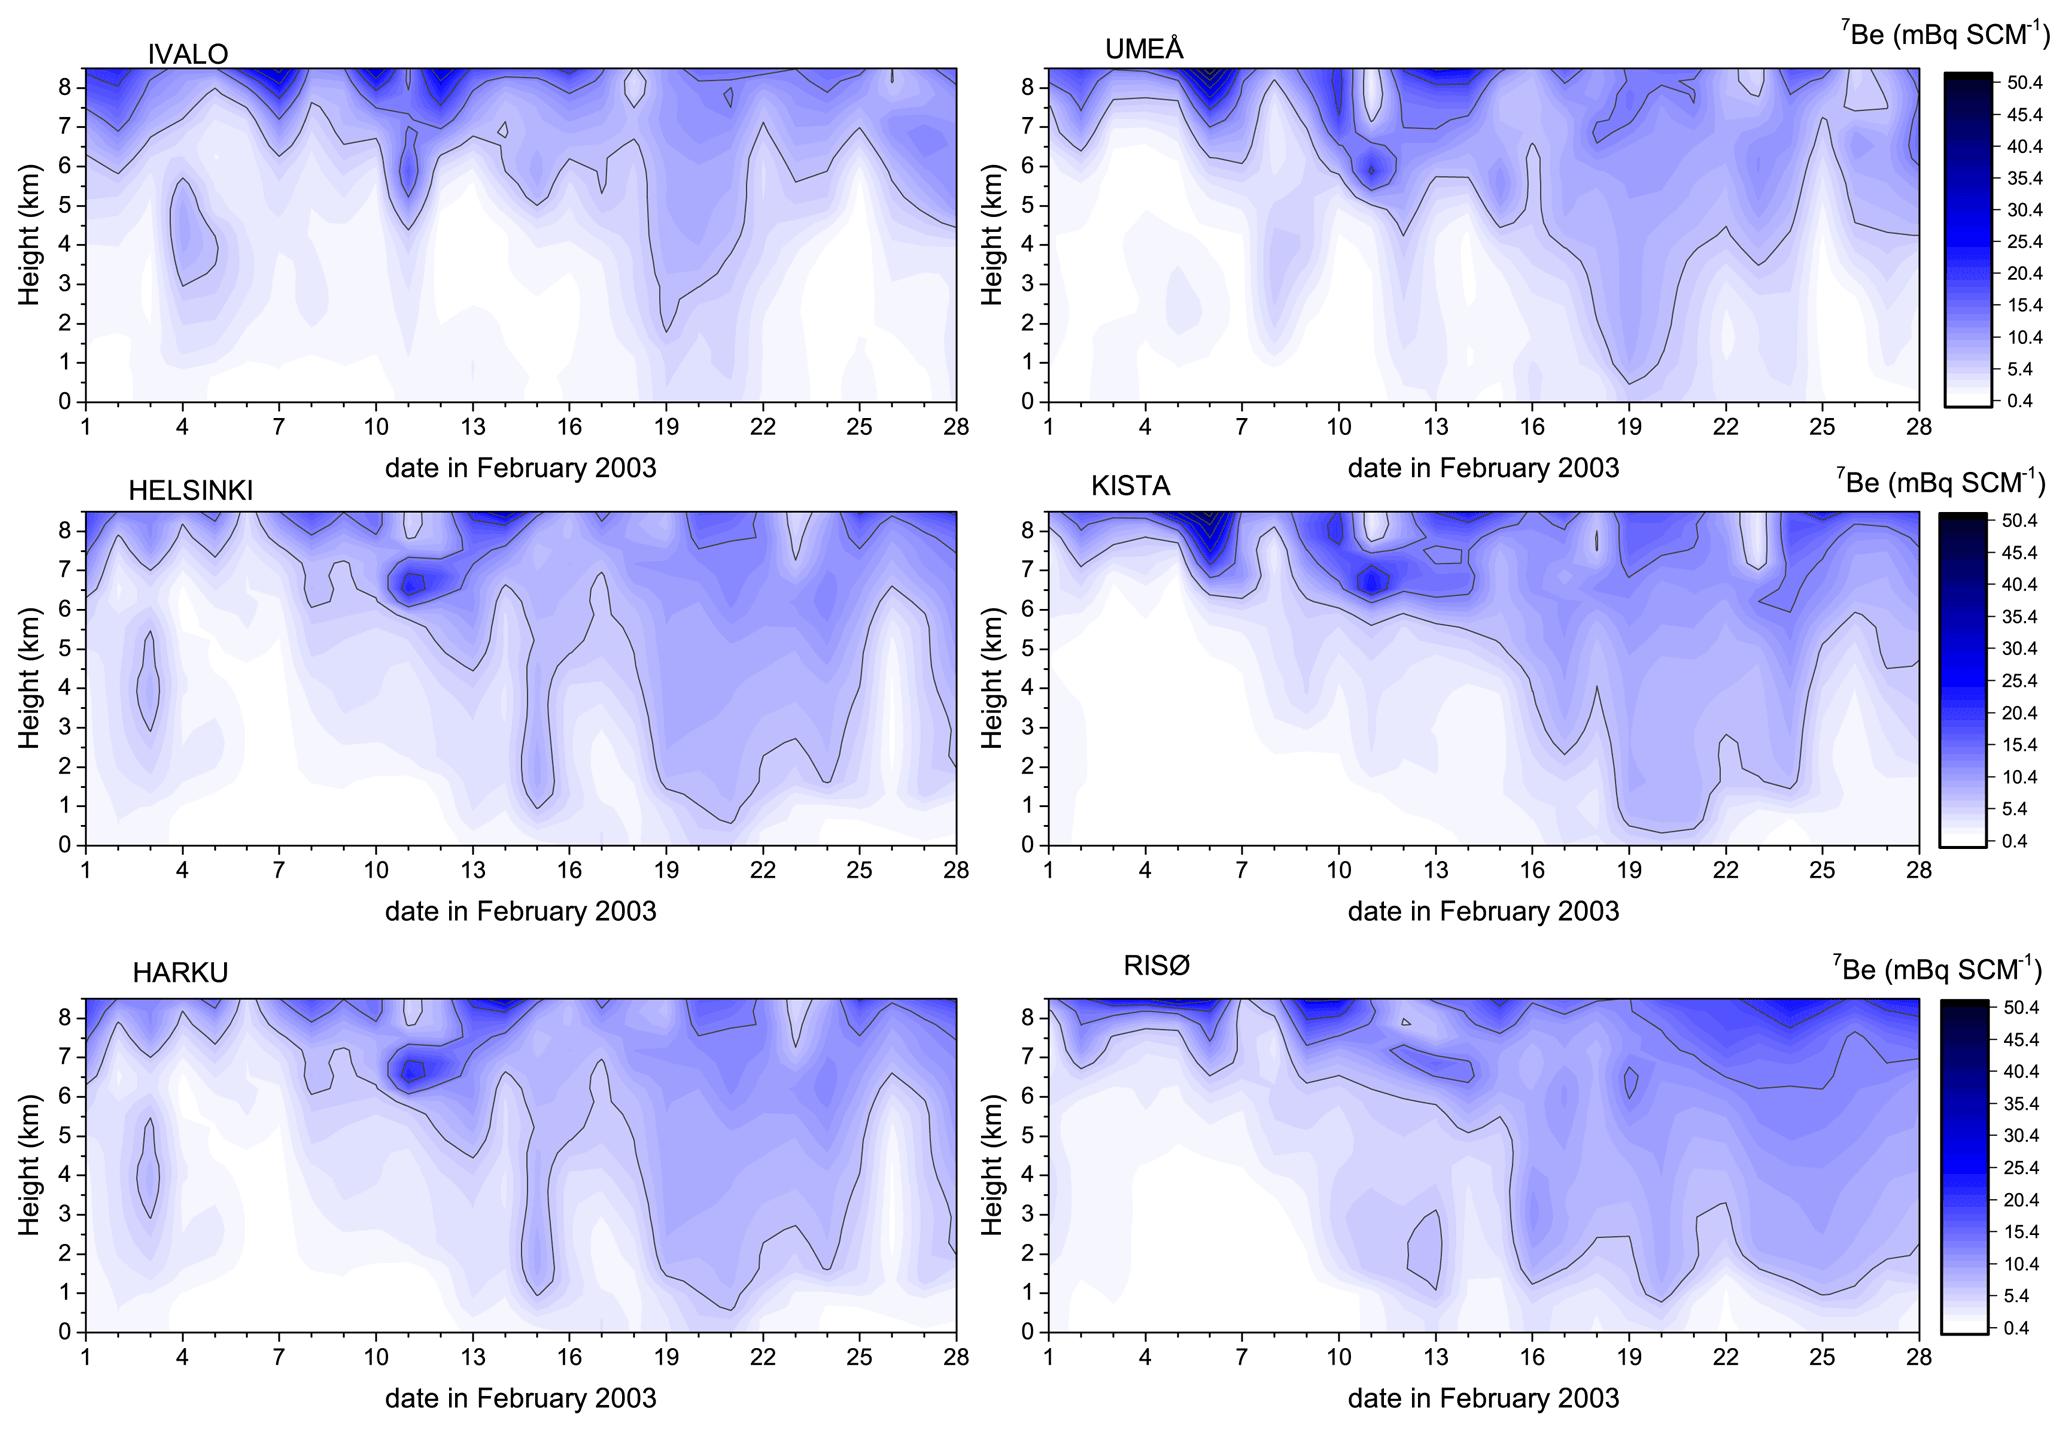
Figure 11Time–height cross sections of simulated hourly 7Be concentrations (mBq SCM−1 where SCM stands for standard cubic meter) during the month of February 2003 at the six sampling sites.
As with the monthly means, the model generally represents adequately the temporal pattern but not the magnitude of weekly mean concentrations, which tend to be lower than those observed (Table 3, Figs. 4b and 5). This bias can arise from the higher precipitation in the model than in the observations and/or from errors in the deposition schemes. However, the correct reproduction of the 7Be temporal pattern, as indicated by the high correlation values at all sampling sites with the exception of Risø, suggests that the model captures the transport processes leading to the peak in 7Be concentrations at the end of February 2003 and the preceding very low concentration values. In addition, the low MB and NMSE values calculated at all sites and especially at Ivalo and Umeå suggest that the model reproduces adequately the observed values (Fig. 5). The significance of the Z test for the differences between mean observed and simulated values indicates the presence of statistically significant differences, reflecting the model's general tendency to underestimate observations.
As for the 7Be 210Pb ratio in Helsinki (Table 3), the model tends to underestimate the observed ratio, which could be due to the model underestimating 7Be and overestimating 210Pb. Nevertheless, the relatively high correlation between the simulated and observed ratios suggests a reasonable simulation of the temporal pattern of this tracer.
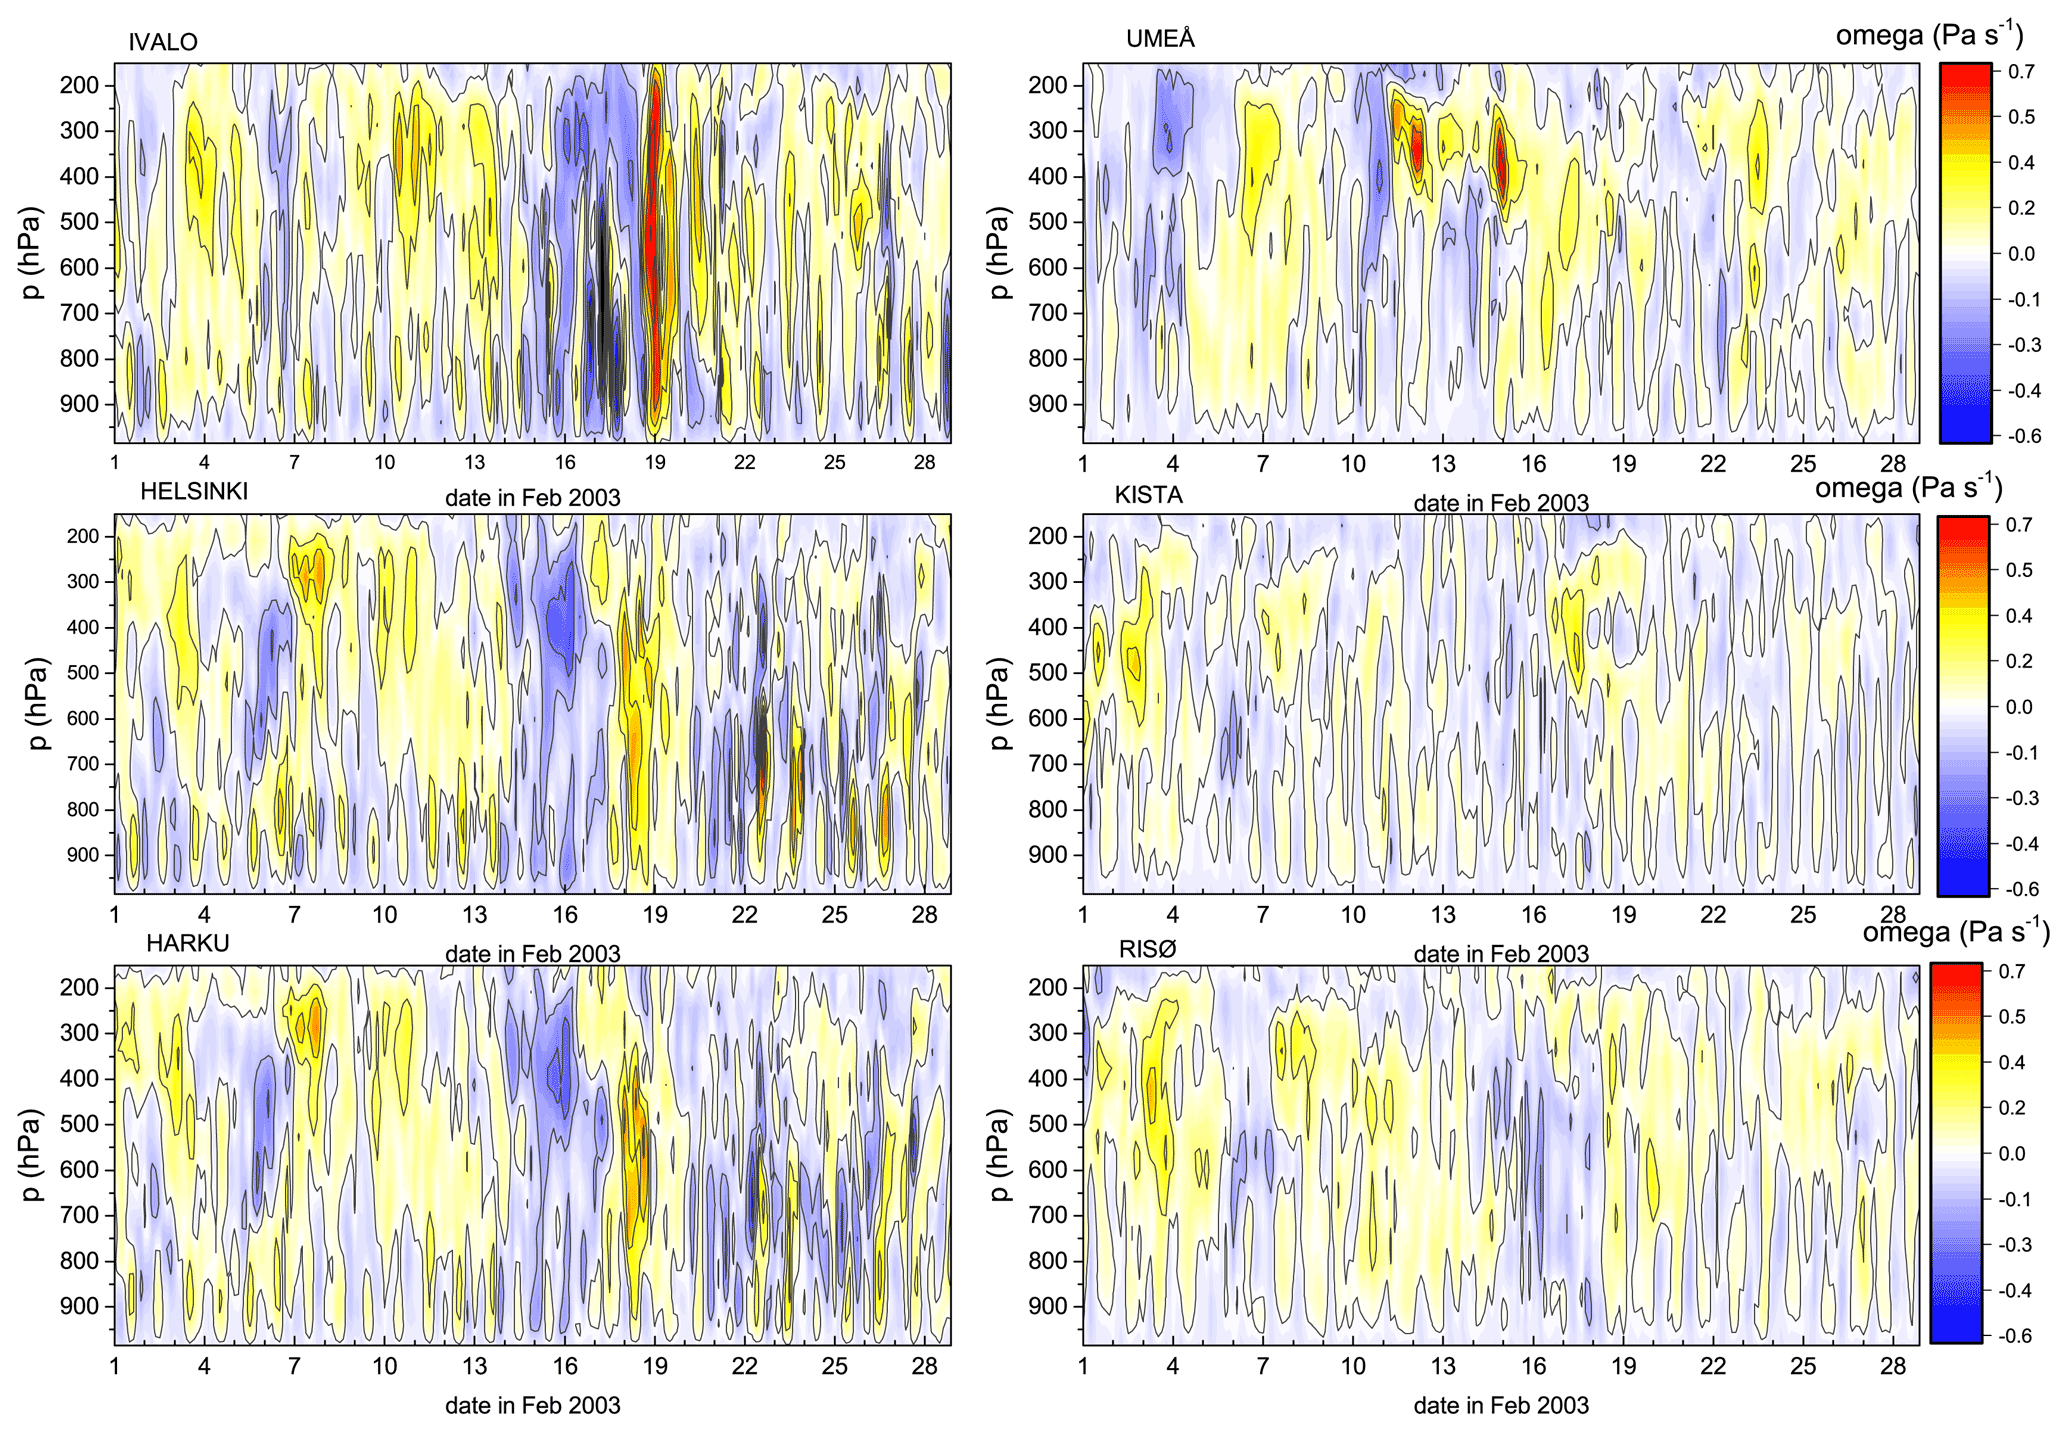
Figure 12Time–height cross sections of MERRA-2 3-hourly average vertical pressure velocity (omega, in Pa s−1) during the month of February 2003 sampled at the six sampling sites. Red color indicates large positive omega values, corresponding to a descending motion, whereas blue color stands for large negative omega values, corresponding to a rising motion. Black lines are contours of omega values.
4.5 Understanding the 7Be variations during the 2002–2003 boreal winter
As mentioned earlier (Sect. 4.1), an SSW event occurred at the end of February 2003. We concentrated our analysis on two different periods during the month: early in the month, between 3 and 16 February when very low 7Be concentration values were recorded, and at the end of the month between 20 and 28 February characterized by extremely high 7Be concentrations. To gain further insights into the 7Be variations during the 2002–2003 boreal winter (Sect. 4.1), we analyzed the simulated 7Be 210Pb ratio, maps of surface winds and relative humidity, ozone soundings, and vertical cross sections of simulated 7Be activity concentrations and calculated potential vorticity, and simulated and observed vertical profiles of air temperature. The results were further supported with the analysis of the clusters of back-trajectories during the two different periods of low and high 7Be concentrations.
Figure 6 presents the temporal (weekly mean) pattern of 7Be 210Pb and of the stratospheric fraction of 7Be (calculated as the ratio of the stratospheric 7Be tracer concentration to the total 7Be concentration in the troposphere) at the six sampling sites, while daily observations of the 7Be 210Pb ratio at Helsinki and Sodankylä (67.367∘ N, 26.629∘ E; 160 km south of Ivalo) are presented in the Supplement (hereafter SI). At the beginning of February, the ratio was generally quite low at all the sites. In contrast, the week of 19–26 February 2003 was marked by an evident peak in the 7Be 210Pb ratio and a simultaneous increase in the fraction of 7Be originating in the stratosphere at all sites, which together could be the first indication of a prominent vertical transport from the UT-LS region. The low 7Be 210Pb ratio at Risø results from the simultaneous increase in both 7Be and 210Pb concentrations, together with the delayed stratospheric influence at this site as evidenced by the pattern of the stratospheric 7Be fraction (Fig. 6b).
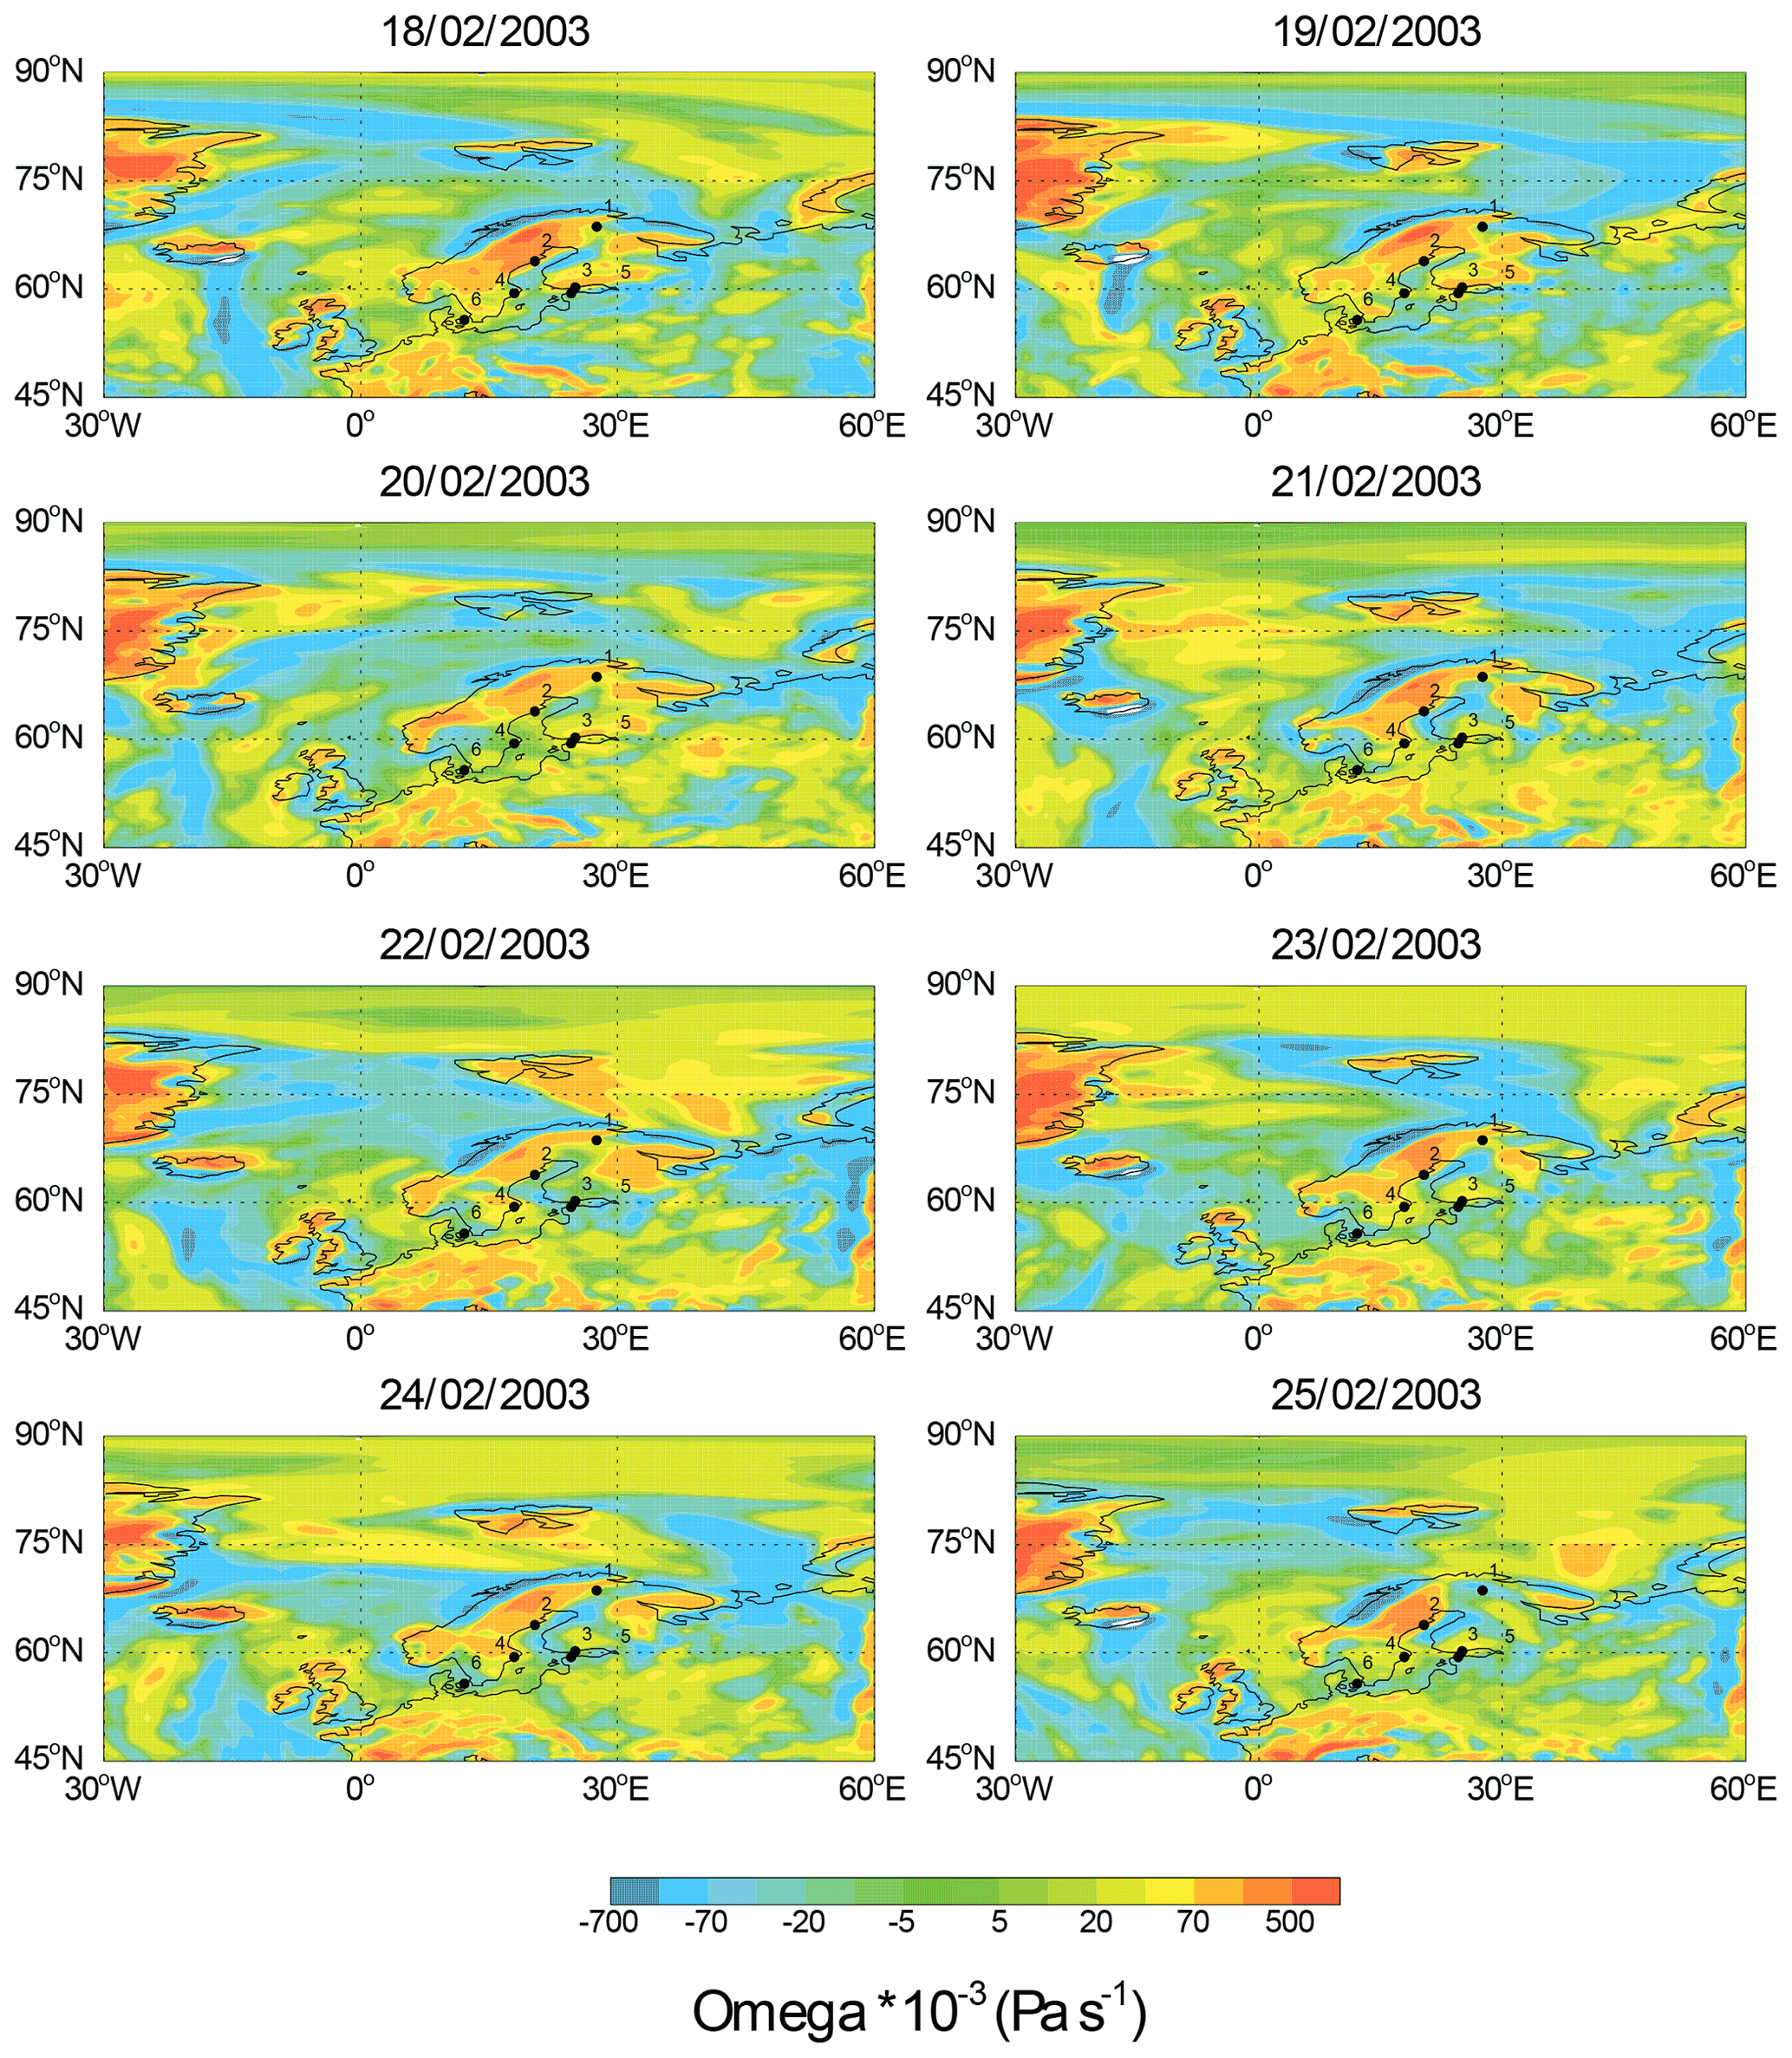
Figure 13MERRA-2 daily mean vertical pressure velocity (omega) at 940 hPa during 18–25 February 2003. The dots indicate the locations of the sampling sites: 1 = Ivalo, 2 = Umeå, 3 = Helsinki, 4 = Kista, 5 = Harku, 6 = Risø.
Hence, we further examined the vertical profiles of temperature with an aim to identify differences in vertical transport near the beginning and end of February. The soundings from the Sodankylä station in the Arctic offer three sets of measurements for each of the investigated periods: on 10 and 16 February, which fall into the period when very low 7Be concentrations were recorded in Kista and Ivalo, respectively; 22 and 24 February, the days marked by extremely high 7Be concentrations over the Fennoscandian Peninsula; and 20 and 21 February in the period of transition to high 7Be concentration over the Fennoscandian Peninsula. Figure 7 shows air temperature profiles in the MERRA-2 dataset and atmospheric soundings at the Sodankylä station. Besides the very good agreement between the MERRA-2 and observed temperatures, a warming of the stratosphere (20–60 km) and a different vertical temperature structure of the lower stratosphere around 20–24 February as compared to the 10 and 16 February profiles are also evident. The observation of the increase in stratospheric temperatures suggests the link between the SSW and the 7Be peak observed at the six sampling sites located in northern Europe. In addition, the ozone soundings at the Sodankylä station reveal an ozone mixing ratio peak in the lower troposphere (∼1.5–3 km) on 19 February 2003 as compared to those observed during 12, 26 and 28 February 2003 (Fig. 8a), consistent with downward transport from higher altitudes around that day. Despite the chemical ozone loss in the Arctic vortex in the stratosphere in 2003 as observed by ozone soundings (Tilmes et al., 2006), obviously lower-stratospheric ozone was still enhanced relative to tropospheric ozone. In addition, average O3 values recorded at surface air quality stations located in Denmark, Finland and Sweden, which are available through the saqgetr R package (Grange, 2019), show enhanced O3 concentrations in late February 2003, consistent with the aforementioned peaks in the 7Be 210Pb ratio as well as stratospheric 7Be fraction. This further suggests the transport of stratospheric air masses to the surface.
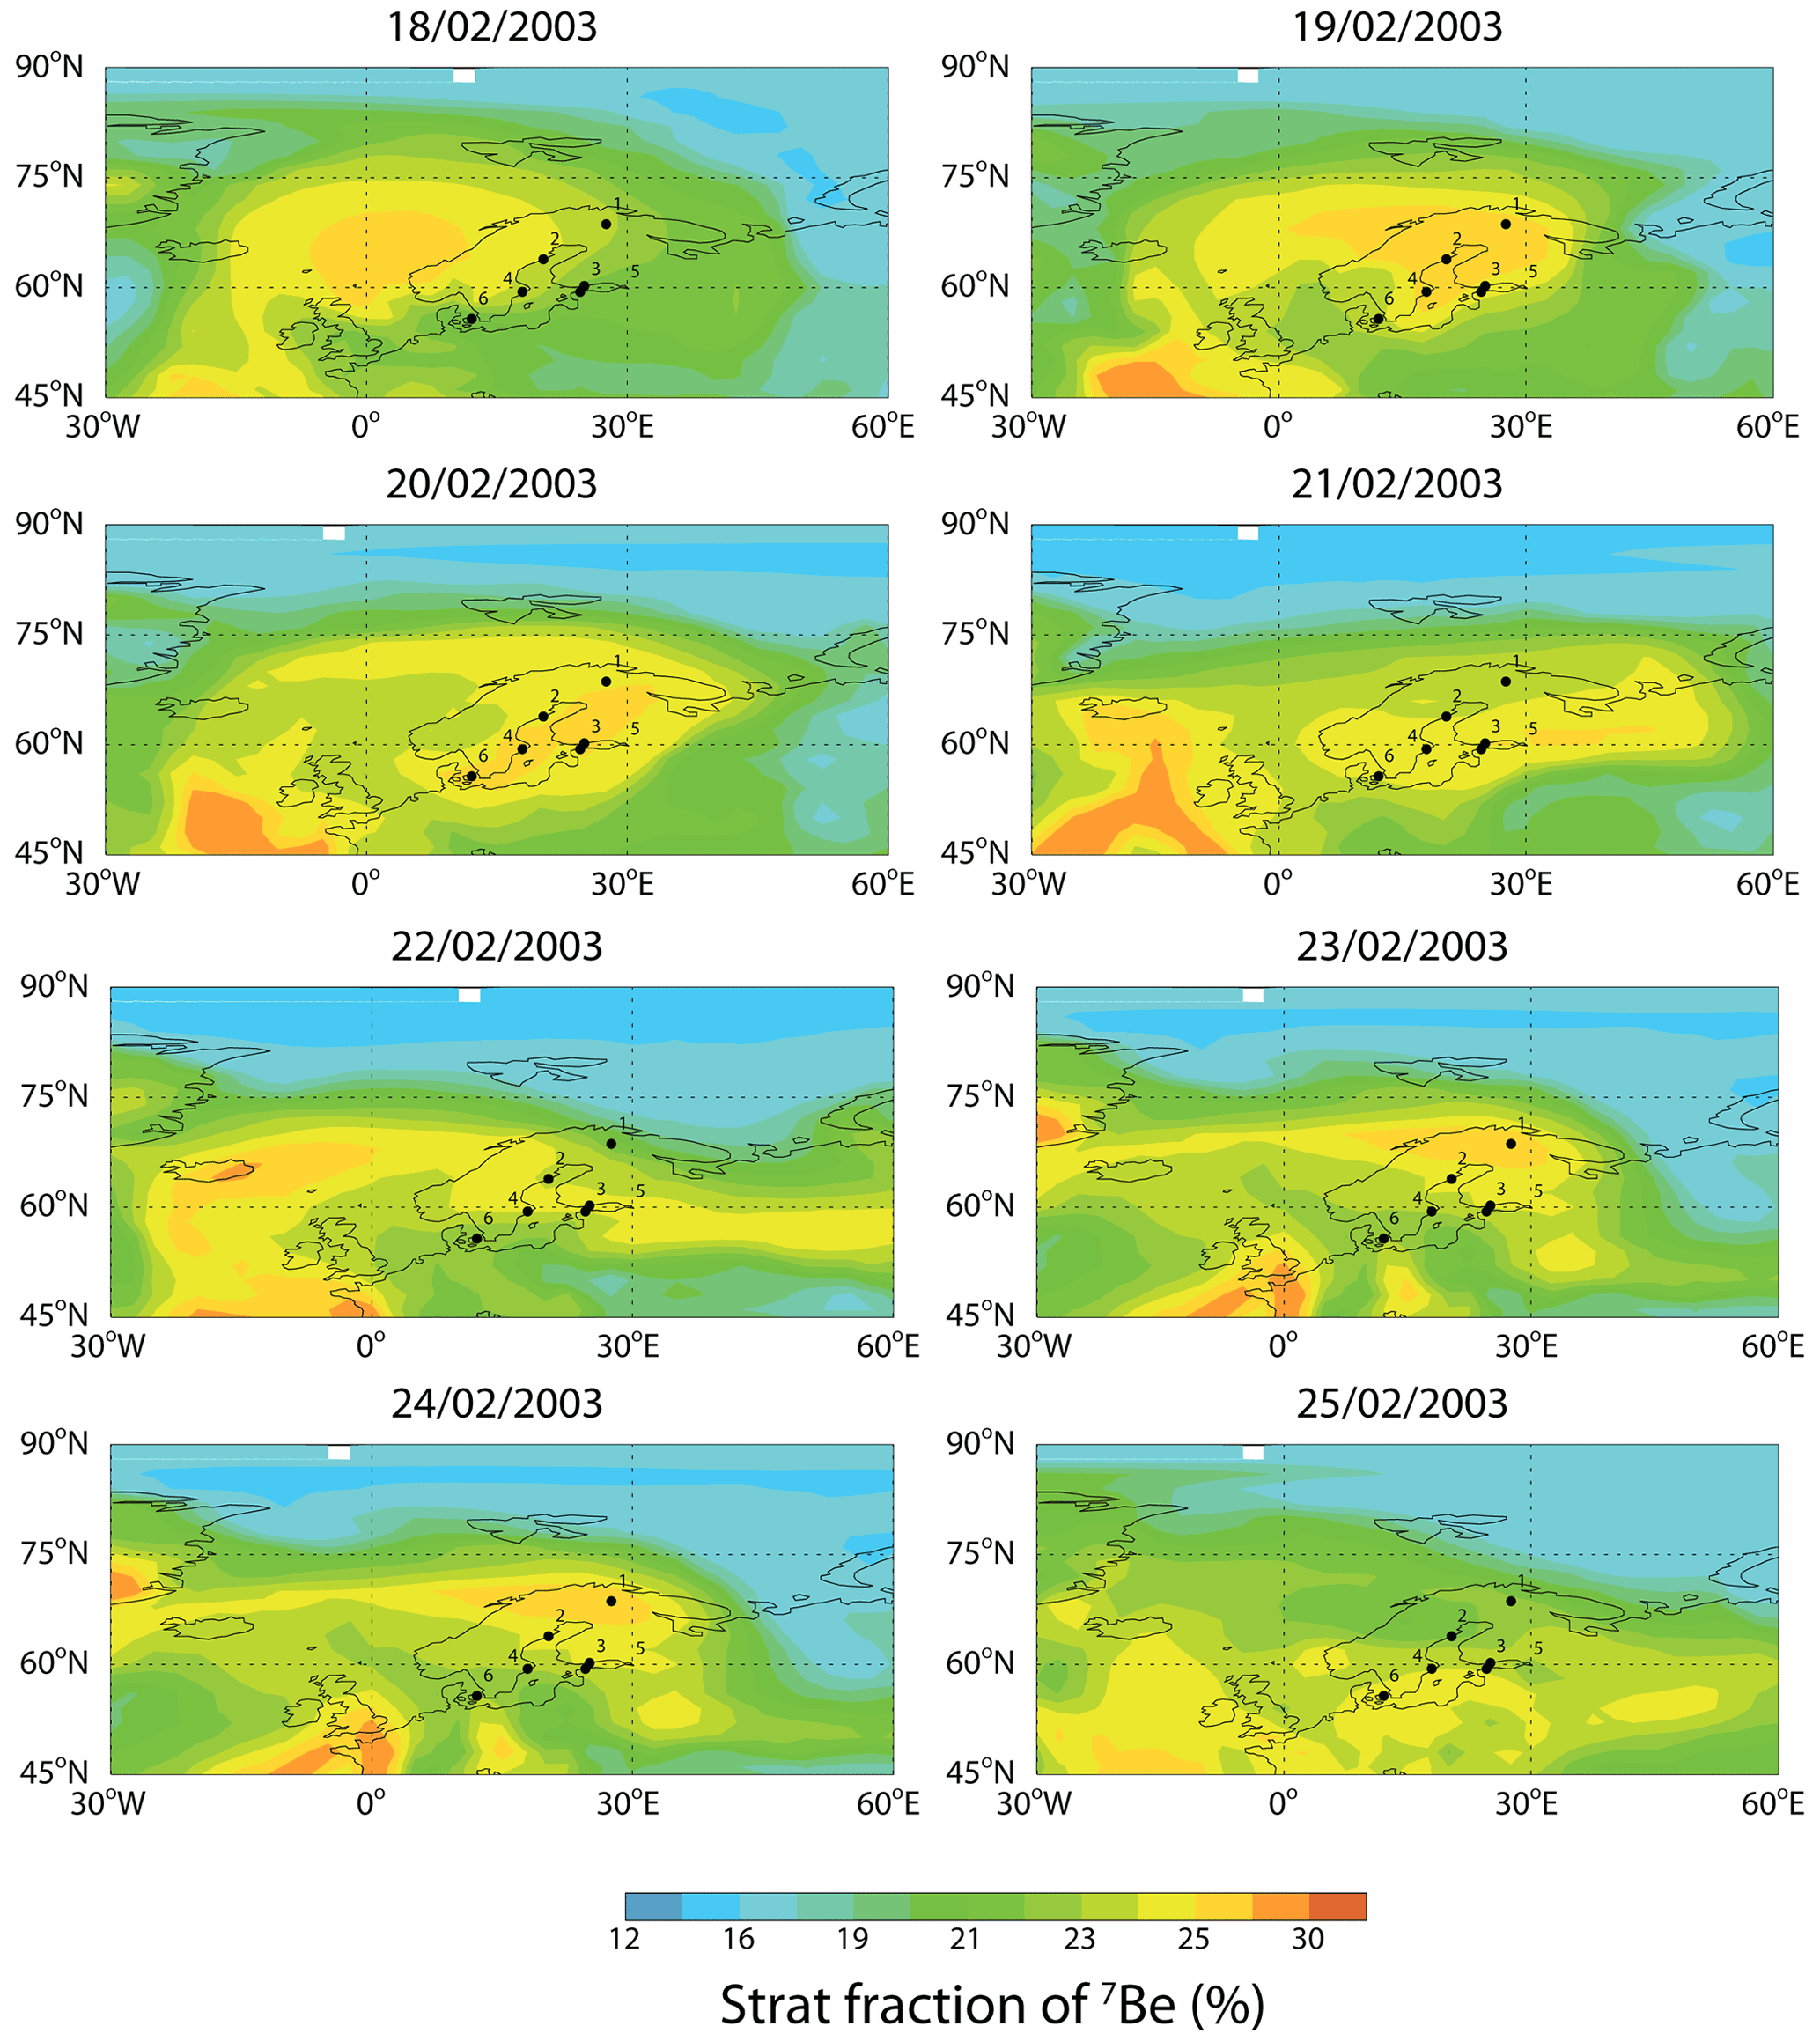
Figure 14Simulated daily mean fraction of 7Be originating in the stratosphere (%) at 940 hPa. The dots indicate the locations of the sampling sites: 1 = Ivalo, 2 = Umeå, 3 = Helsinki, 4 = Kista, 5 = Harku, 6 = Risø.
Simultaneously, the analysis of maps of surface transport and relative humidity (Fig. 9) highlights the different winds and relative humidity values in the two periods, with low relative humidity values (∼40 %–50 %) suggesting subsidence from 18 to 21 February, and the transition from a clockwise circulation to the fast and complex wind system typical of the second period corresponding to the high 7Be peak and the SSW. Together with the increase in stratospheric temperatures observed in Fig. 7, the reversal of zonal winds confirms the link between the 7Be peak and the SSW event, in agreement with Sofieva et al. (2012). Interestingly, the parcel of the lowest relative humidity values occurs during the 18–21 February period, i.e., a couple of days before the dates of the 7Be peaks in the measurements and those peaks in the simulated 7Be 210Pb ratio and stratospheric 7Be fraction (Figs. 1b and 6). Together with enhanced ozone concentrations observed in the lower troposphere on 19 February, this suggests that the downward transport from the UT-LS was triggered by the SSW occurring a few days before.
To better constrain the stratospheric origin of the air masses arriving at the sampling sites during the two periods, we further analyzed the potential vorticity data from ECMWF during the month of February 2003 at three latitudes (63, 64.5 and 66∘ N) along the 21∘ E meridian (Fig. 10), while vertical cross sections of MERRA-2 PV are provided in Fig. S3. The data clearly reveal a bubble of high potential vorticity down to the surface at the three latitudes from 18–22 February 2003, particularly at the northernmost latitude where values higher than 1.6 PVU, a value considered as a threshold for stratospheric air in the lower troposphere especially when in conjunction with low relative humidity, high 7Be 210Pb ratios and ozone (Cristofanelli et al., 2006), were observed. Indeed, PV is considered as a quasi-passive tracer, because of its conservation properties under adiabatic conditions (Hoor et al., 2010; Gettelman et al., 2011), and the tropopause level can be identified as regions of strong enhancements in gradients of PV, essentially indicated by distinct values in the troposphere and stratosphere. Recent studies of PV cutoff lows in the Northern Hemisphere extratropics (Pinheiro et al., 2017; Portmann et al., 2021; Muñoz et al., 2020) suggest that the majority of the events are relatively short-lived, persisting for about 2–3 d, a value in good agreement with the vertical motion subject of this study.
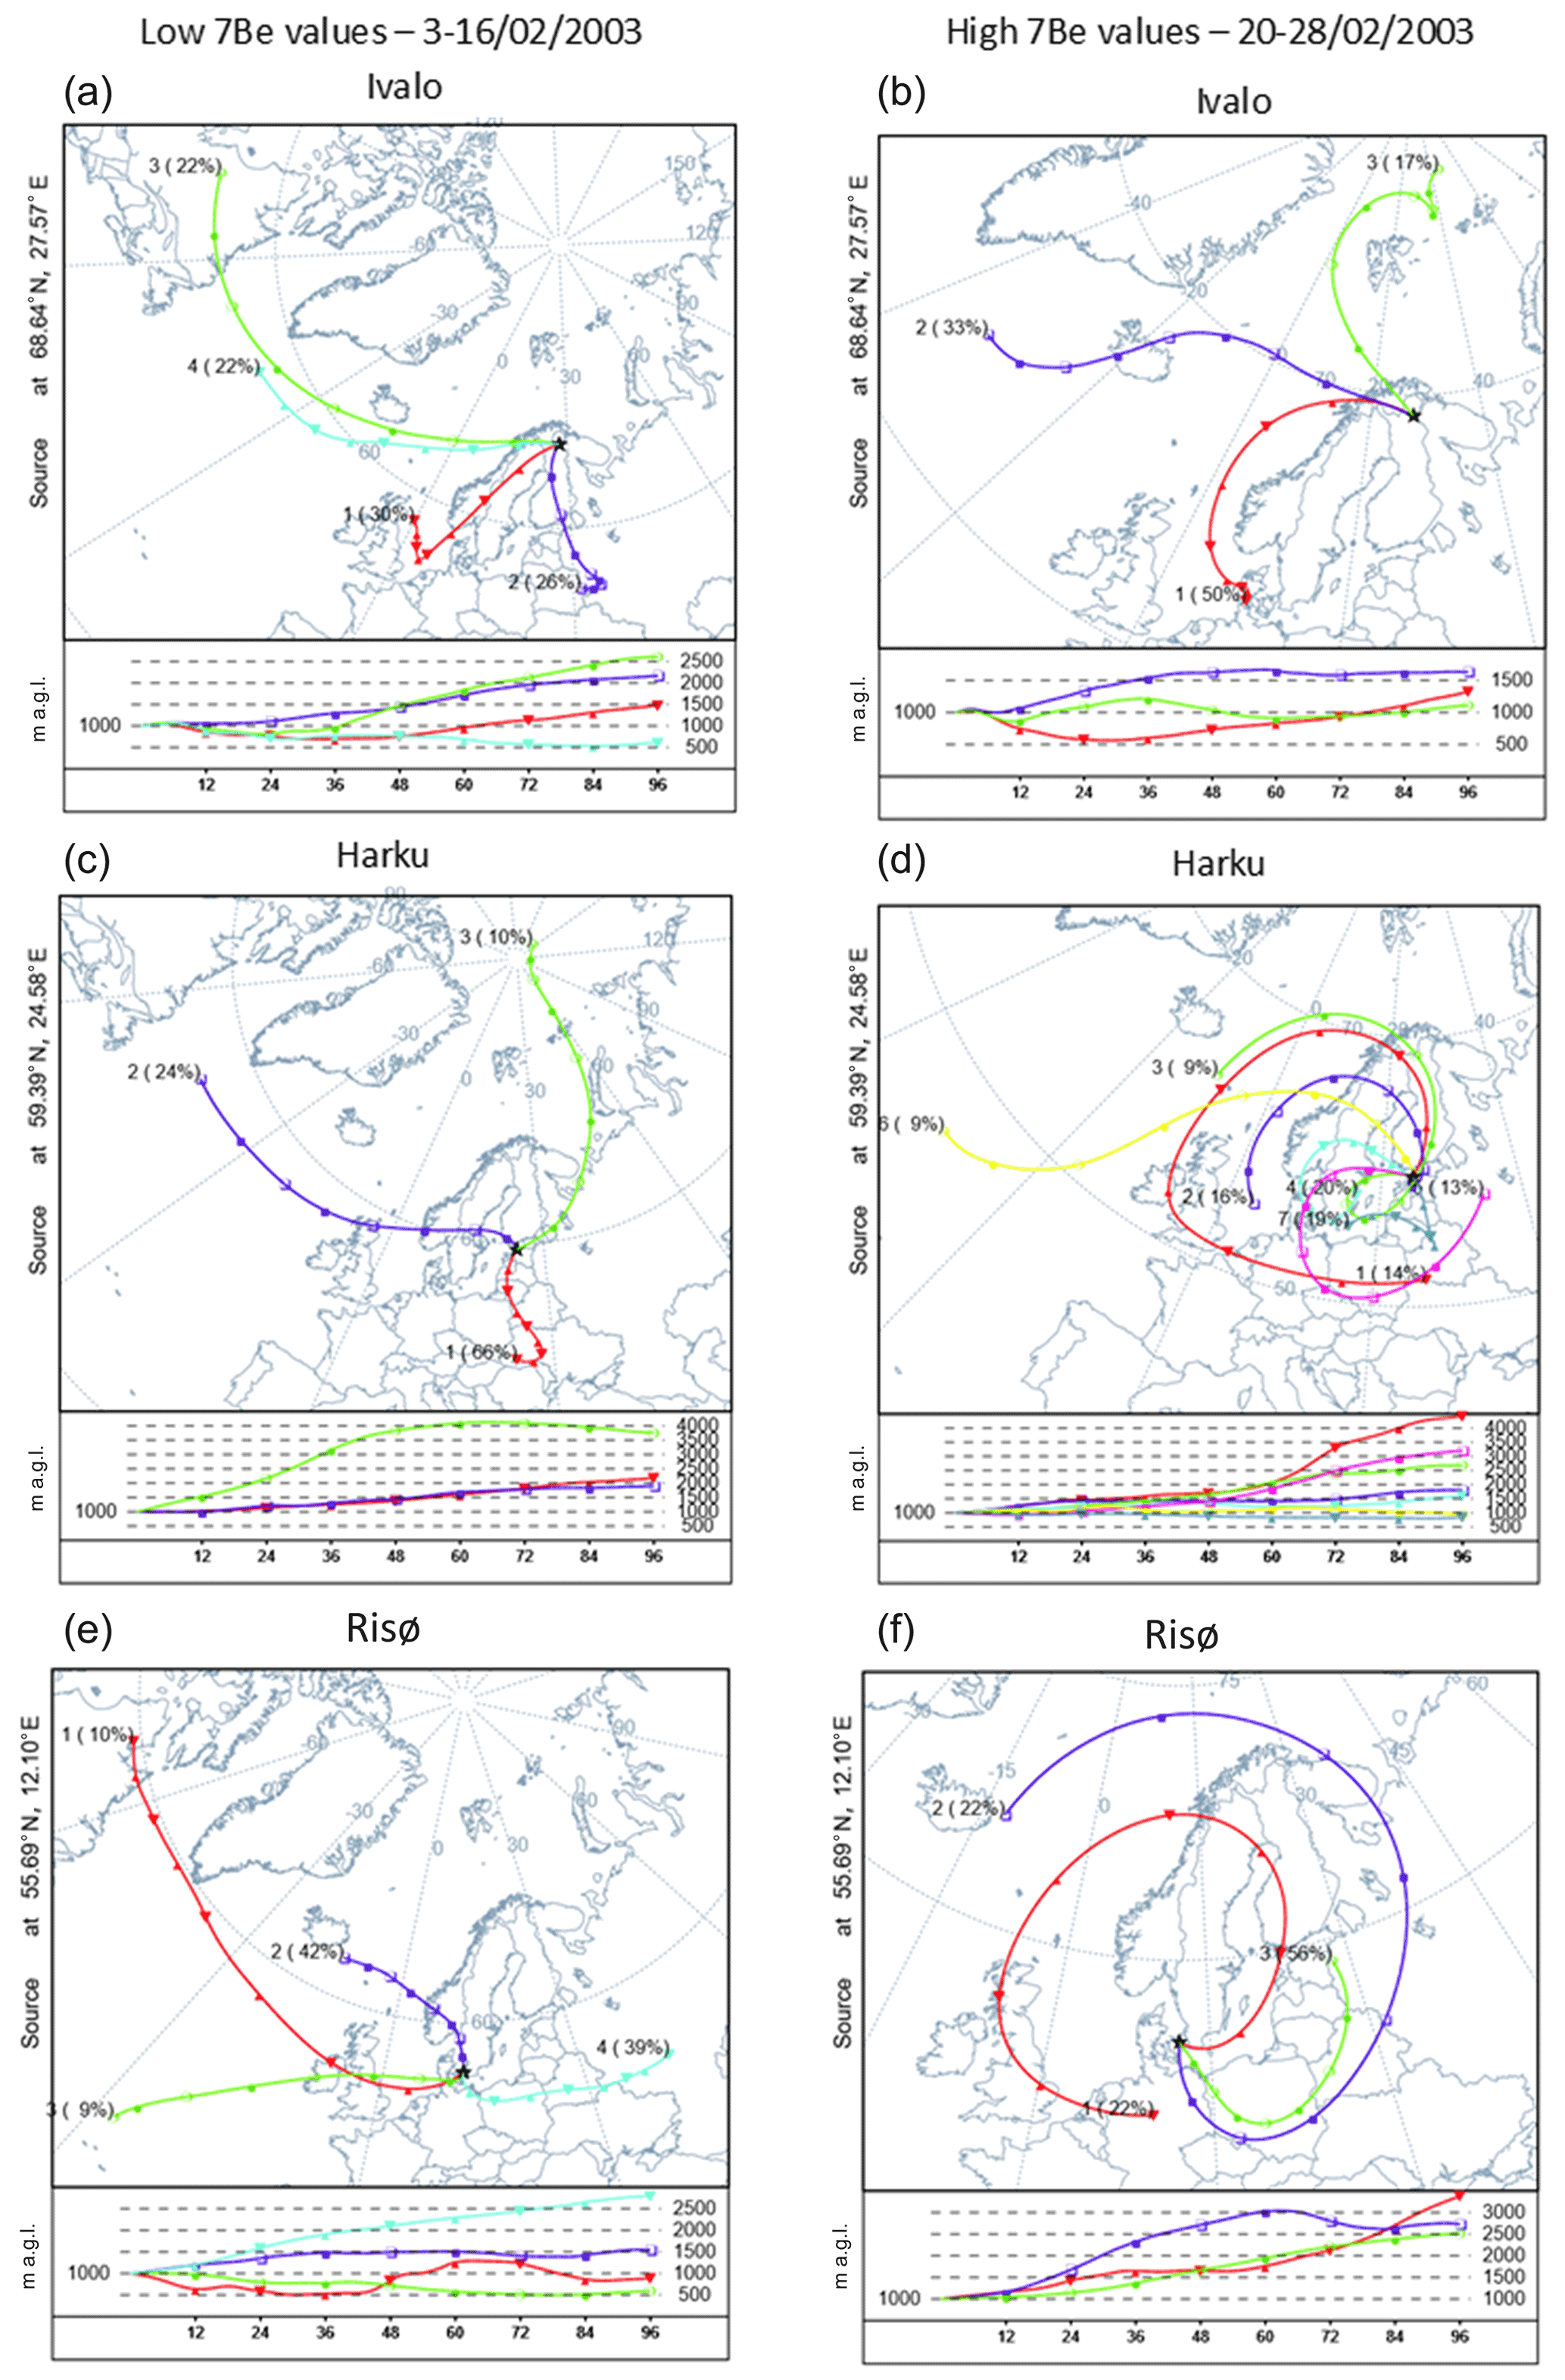
Figure 15Average trajectory cluster results (centroids) arriving in Ivalo, Harku and Risø at 1000 m for low 7Be values (left: 3–16 February 2003) and high 7Be values (right: 20–28 February 2003), respectively. The stations are ordered by latitude from top to bottom (coordinates of the receptor site are provided on the left of each plot). The right numbers between brackets in the centroids are the percentage of complete trajectories occurring in that cluster, and the left numbers are an identification number of the centroid. In each panel, the upper plot shows the average latitude–longitude plot of each trajectory cluster, while the bottom panel presents the time vs. trajectory average altitude plot.
The low relative humidity (Fig. 9) and high potential vorticity (Fig. 10) corresponded to high 7Be descending to lower atmospheric levels, as simulated by the model (Fig. 11). The descending vertical motion from the upper vertical levels during the period is clearly visible in the MERRA-2 vertical pressure velocity (omega) fields sampled at the six sampling sites for the month of February 2003, especially for the northernmost sites (Fig. 12) where omega is largely positive with near-surface values up to 0.3–0.4 Pa s−1 around 18–19 February. Further evidence of this is seen from the maps of vertical pressure velocity (Fig. 13) and of the stratospheric fraction of 7Be originating in the stratosphere (Fig. 14) at 940 hPa in the boundary layer. Note that positive vertical pressure velocity as seen over both Fennoscandia and Greenland (Fig. 13) during 18–25 February 2003 indicates descending motions that can facilitate the transport of stratospherically influenced air, if present, to the ground-level. This explains why Fennoscandia saw increased stratospheric influence on surface 7Be concentrations during this period (Fig. 14), but Greenland did not see much. However, on monthly average, Greenland is a region with significant stratospheric influences in February 2003 (middle right panel, Fig. 3).
Analysis and comparison of 4 d back-trajectories at each sampling station allowed a reconstruction of two distinct atmospheric circulation patterns in the two periods. Figure 15 shows the clustering results for three sampling sites (Ivalo, Harku and Risø) during both periods. The stations are ordered as a function of decreasing latitude from high (upper panels) to low (lower panels). Only results at 1000 m (well above the winter PBL height) are shown, and cluster results for other altitudes in the lower troposphere are similar. While the first period (with low 7Be values) presents the dominance of westerly winds (air masses flowing eastward), as is typical at these latitudes (Zanis et al., 1999), the second period is characterized by a clockwise displacement of airflows with origins at higher altitudes (Fig. 15). This pattern in the second period is better established at lower-latitude stations (Helsinki, Harku, Kista and Risø) compared to higher-latitude ones (Ivalo, Umeå). It likely results from the aged vortex (Günther et al., 2008) and the SSW at the end of February, corresponding to a decrease in the MERRA-2 daily average height of the thermal tropopause on 21–22 February at the Sodankylä station in Finland (Fig. S4) during the SSW (Peethani et al., 2014; Wargan and Coy, 2016). Associated with these processes is the downward transport of stratospheric air previously identified with an independent approach.
We have used a global 3-D model (GEOS-Chem) driven by the MERRA-2 meteorological reanalysis to simulate atmospheric concentrations of 7Be of cosmogenic origin for the period of January–March 2003. The aim was to verify the mechanisms responsible for the surface 7Be variabilities in northern Europe, and to test the hypothesis that SSW events may facilitate fast descent of UT-LS vortex air to the surface. The period was selected as it involves two intense SSW events and observations of extremely high 7Be concentrations at six sampling sites in Fennoscandia.
Before using the model's output to investigate the processes responsible for 7Be variability in northern Europe over the period, we evaluated the MERRA-2 precipitation fields against the GPCP satellite and surface observations. A generally good agreement was found both at regional scale and at the six sampling sites. Analysis of the wind fields in the study period indicated low wind speeds from S-SW in agreement with the major circulation patterns over the Fennoscandian Peninsula in winter, and the presence of a region of strong wind speeds to the west of the study area, likely in connection with the Arctic polar vortex.
The model reproduced efficiently the 7Be and 7Be 210Pb temporal (i.e., monthly and weekly) patterns at the six sampling sites in the study period, even though it presented a tendency to underestimate the observed surface 7Be concentrations. The lower modeled values are likely due to its coarse horizontal resolution (2.5∘ longitude by 2∘ latitude), lack of year-to-year variation in 7Be production rates and uncertainties associated with precipitation scavenging.
In order to investigate the processes responsible for 7Be variability at the six sampling sites during the study period, and in particular to test whether the peak 7Be concentrations measured in Fennoscandia around 24 February 2003 originated from fast descent of stratospheric vortex air facilitated by SSW, we analyzed time–height cross sections of simulated 7Be and potential vorticity, vertical profiles of air temperature, maps of surface winds and relative humidity, and ozone soundings. The analysis of the temporal variations of simulated 7Be 210Pb ratio and fraction of 7Be originated in the stratosphere indicates a peak during the week of 19–26 February 2003, suggesting downward transport from the UT-LS region. The latter was corroborated by a layer of ozone mixing ratio enhancements in the lower troposphere recorded by the soundings at the Sodankylä station on 19 February. Furthermore, the vertical profiles of air temperature indicated a warming of the stratosphere and a change in shape in the vicinity of the tropopause region during the period, suggesting the link between the downward transport of the vortex air and SSW.
Our analysis of time–height cross sections of simulated 7Be concentrations, calculated potential vorticity and MERRA-2 vertical pressure velocity (omega) revealed the vertical downward transport to the surface of a stratospheric air parcel characterized by high potential vorticity, high vertical velocity (in particular at Ivalo on 19 February) and high 7Be concentrations, further supporting the stratospheric origin of the air masses during the investigated period.
Additionally, low relative humidity and a change in the circulation pattern from slow and clockwise to fast, swirling winds occurred over the study area. The change in the circulation pattern and the downward transport of stratospheric air was verified by the analysis of the clusters of back-trajectories during the periods of low and high 7Be concentrations, which showed a change from westerlies to airflows from upper vertical levels.
Altogether, these analyses confirm the link between the SSW and transport of stratospheric air to the surface, resulting in high surface 7Be concentrations observed in February 2003 in Fennoscandia. Since more frequent SSW events are expected in a warmer climate (Kang and Tziperman, 2017, 2018; Simpkins, 2017), this link has important implications for the impact of climate change on atmospheric transport, tropospheric composition and air quality in northern high-latitude regions.
7Be activity concentration data are available in the Radioactivity Environmental Monitoring (REM) database (https://data.jrc.ec.europa.eu/collection/id-0117, European Commission, 2021). All model output, and 210Pb daily observational data at Helsinki and Sodankylä for January–March 2003 are available online (https://doi.org/10.5281/zenodo.4117521, Brattich et al., 2021).
The supplement related to this article is available online at: https://doi.org/10.5194/acp-21-17927-2021-supplement.
JA, MAHC and EB designed the study. HL and BZ conducted the GEOS-Chem model simulations. MAHC led the calculation and analysis of HYSPLIT back-trajectories. EB developed the analysis methodology and led the analysis of observational data and model output, with contributions from all coauthors. JP contributed 210Pb and meteorological observational datasets. EB wrote the paper with contributions from all coauthors.
The contact author has declared that neither they nor their co-authors have any competing interests.
Publisher’s note: Copernicus Publications remains neutral with regard to jurisdictional claims in published maps and institutional affiliations.
Jelena Ajtic, Darko Sarvan and Vladimir Djurdjevic acknowledge the support by the Ministry of Education, Science and Technological Development of the Republic of Serbia (contract numbers 451-03-9/2021-14/200143 and 451-03-9/2021-14/200162). Hongyu Liu and Bo Zhang acknowledge funding support from the NASA Modeling, Analysis and Prediction program and Atmospheric Composition Campaign Data Analysis and Modeling program. NASA Center for Climate Simulation (NCCS) provided supercomputing resources. The GEOS-Chem model is managed by the Atmospheric Chemistry Modeling Group at Harvard University with support from NASA ACMAP and MAP programs. The University of Wyoming, ECMWF, Dr. Rigel Kivi from the Finnish Meteorological Institute Arctic Space Center and Dr. Laura Thölix from the Finnish Meteorological Institute are gratefully acknowledged for providing and helping with temperature profiles, ozone soundings and potential vorticity data used to support the detection of air masses of stratospheric origin in the troposphere. The World Data Center is gratefully acknowledged for the production, preservation and dissemination of the international sunspot number (Sunspot Index and Long-term Solar Observation, SILSO, Royal Observatory of Belgium, Brussels, http://www.sidc.be/silso/datafiles#total, last access: 23 November 2021). Support for the Twentieth Century Reanalysis Project version 3 dataset is provided by the U.S. Department of Energy, Office of Science Biological and Environmental Research (BER; http://science.energy.gov/ber/, last access: 23 November 2021), by the National Oceanic and Atmospheric Administration Climate Program Office, and by the NOAA Physical Sciences Laboratory. NASA/GSFC/SED/ESD/LA/MAPB and contributors are gratefully acknowledged for developing and computing the GPCP (Global Precipitation Climatology Project) as part of the Global Energy and Water Cycle Exchanges (GEWEX) project. Stuart Grange is gratefully acknowledged for providing access to European air quality data through the saqgetr R package.
This research was partially supported by the Ministry of Education, Science and Technological Development of the Republic of Serbia (contract numbers 451-03-9/2021-14/200143 and 451-03-9/2021-14/200162) and by the NASA Modeling, Analysis and Prediction (MAP) program (grant no. 80NSSC17K0221) and Atmospheric Composition Campaign Data Analysis and Modeling (ACCDAM) program (grant no. NNX14AR07G).
This paper was edited by Amanda Maycock and reviewed by three anonymous referees.
Adler, R. F., Huffmann, G. J., Chang, A., Ferraro, R., Xie, P.-P., Janowiak, J., Rudolf, B., Schneider, U., Curtis, S., Bolvin, D., Gruber, A., Susskind, J. Arkin, P, and Nelkin, E.,: The version-2 Global Precipitation Climatology Project (GPCP) monthly precipitation analysis (1979–present), J. Hydrometeorol., 4, 1147–1167, https://doi.org/10.1175/1525-7541(2003)004<1147:TVGPCP>2.0.CO;2, 2003.
Ajtić, J., Djurdjevic, V., Sarvan, D., Brattich, E., and Hernández-Ceballos, M.A.: Analysis of extreme beryllium-7 specific activities in surface air, Radiation & Applications, 1, 216–221, https://doi.org/10.21175/RadJ.2016.03.040, 2016.
Ajtić, J. V., Sarvan D., Djurdjevic, V. S., Hernández-Ceballos, M. A., and Brattich, E.: Beryllium-7 surface concentration extremes in Europe, Facta Universitatis – Series: Physics, Chemistry and Technology, 15, 45–55, 2017.
Ajtić, J., Brattich, E., Sarvan, D., Djurdjevic, V., and Hernández-Ceballos, M. A.: Factors affecting the 7Be surface concentration and its extremely high occurrences over the Scandinavian Peninsula during autumn and winter, Chemosphere, 199, 278–285, https://doi.org/10.1016/j.chemosphere.2018.02.052, 2018.
Baldwin, M. P. and Dunkerton, T. J.: Stratospheric Harbingers of Anomalous Weather Regimes, Science, 294, 581–584, https://doi.org/10.1126/science.1063315, 2001.
Bey, I., Jacob, D. J., Yantosca, R. M., Logan, J. A., Field, B. D., Fiore, A. M., Li, Q. B., Liu, H. G. Y., Mickley, L. J., and Schultz, M. G.: Global modeling of tropospheric chemistry with assimilated meteorology: Model description and evaluation, J. Geophys. Res.-Atmos., 106, 23073–23095, https://doi.org/10.1029/2001JD000807, 2001.
Bianchi, S., Plastino, W., Brattich, E., Djurdjevic, V., Longo, A., Hernández-Ceballos, M. A., Sarvan, D., and Ajtić, J.: Analysis of trends, periodicities, and correlations in the beryllium-7 time series in Northern Europe, Appl. Radiat. Isot. 148, 160–167, https://doi.org/10.1016/j.apradiso.2019.03.038, 2019.
Błażej, S. and Mietelski, J. W.: Cosmogenic 22Na, 7Be and terrestrial 137Cs, 40K radionuclides in ground level air samples collected weekly in Kraków (Poland) over years 2003–2006, J. Radioanal. Nucl., 300, 747–756, https://doi.org/10.1007/s10967-014-3049-6, 2014.
Brattich, E., Hernández-Ceballos, M. A., Orza, J. A. G., Bolívar, J. P., and Tositti, L.: The western Mediterranean basin as an aged aerosols reservoir. Insights from an old-fashioned but efficient radiotracer. Atmos. Environ., 141, 481–493, doi;10.1016/j.atmosenv.2016.07.022, 2016
Brattich, E., Orza, J. A. G., Cristofanelli, P., Bonasoni, P., and Tositti, L.: Influence of stratospheric air masses on radiotracers and ozone over the central Mediterranean, J. Geophys. Res., 122, 7164–7182, https://doi.org/10.1002/2017JD027036, 2017a.
Brattich, E., Liu, H., Tositti, L., Considine, D. B., and Crawford, J. H.: Processes controlling the seasonal variations in 210Pb and 7Be at the Mt. Cimone WMO-GAW global station, Italy: a model analysis, Atmos. Chem. Phys., 17, 1061–1080, https://doi.org/10.5194/acp-17-1061-2017, 2017b.
Brattich, E., Liu, H., Hernández-Ceballos, M. A., Paatero, J., Sarvan, D., Djurdjevic, V., Tositti, L., and Ajtic, J.: Observation and modeling of high-7Be events in Northern Europe associated with the instability of the Arctic polar vortex in early 2003, Observation and modeling of high-7Be events in Northern Europe associated with the instability of the Arctic polar vortex in early 2003, Zenodo [data set], https://doi.org/10.5281/zenodo.4117521, last access: 23 November 2021.
Carruthers, D. J., Edmunds, H. A., Lester, A. E., McHugh, C. A., and Singles, R. J.: Use and validation of ADMS-Urban in contrasting urban and industrial locations, Int. J. Environ. Pollut., 14, 363-374, https://doi.org/10.1504/IJEP.2000.000558, 2000.
Chae, J-S. and Kim, G.: Large seasonal variations in fine aerosol precipitation rates revealed using cosmogenic 7Be as a tracer, Sci. Total Environ., 673, 1–6, https://doi.org/10.1016/j.scitotenv.2019.03.482, 2019.
Chang, J. C. and Hanna, S. R.: Air quality model performance evaluation, Meteorol. Atmos. Phys., 87, 167–196, https://doi.org/10.1007/s00703-003-0070-7, 2004.
Charlton, A. J. and Polvani, L. M.: A new look at Stratospheric Sudden Warmings. Part I: climatology and modelling benchmarks, J. Climate, 20, 449–469, https://doi.org/10.1175/JCLI3996.1, 2007.
Charlton, A. J., Polvani, L. M., Perlwitz, J., Sassi, F., Manzini, E., Shibata, K., Pawson, S., Nielsen, J. E., and Rind, D.: A new look at Stratospheric Sudden Warmings. Part II: evaluation of numerical simulations. J. Climate, 20, 470–488, https://doi.org/10.1175/JCLI3994.1, 2007.
Chen, D.: A monthly circulation climatology for Sweden and its application to a winter temperature case study, Int. J. Climatol., 20, 1067–1076, https://doi.org/10.1002/1097-0088(200008)20:10<1067::AID-JOC528>3.0.CO;2-Q, 2000.
Cristofanelli, P., Bonasoni, P., Collins, W., Feichter, J., Forster, C., James, P., Kentarchos, A., Kubik, P. W., Land, C., Meloen, J., Roelofs, G. J., Siegmund, P., Sprenger, M., Schnabel, C., Stohl, A., Tobler, L., Tositti, L., Trickl, T., and Zanis, P.: Stratosphere-to-troposphere transport: A model and method evaluation, J. Geophys. Res.-Atmos., 108, 8525, https://doi.org/10.1029/2002JD002600, 2003.
Cristofanelli, P., Bonasoni, P., Tositti, L., Bonafè, U., Calzolari, F., Evangelisti, F., Sandrini, S., and Stohl, A.: A 6-year analysis of stratospheric intrusions and their influence on ozone at Mt. Cimone (2165 m above sea level), J. Geophys. Res.-Atmos., 111, D03306, https://doi.org/10.1029/2005JD006553, 2006.
Cristofanelli, P., Calzolari, F., Bonafé, U., Duchi, R., Marinoni, A., Roccato, F., Tositti, L., and Bonasoni, P.: Stratospheric intrusion index (SI2) from baseline measurement data, Theor. Appl. Climatol., 97, 317–325, https://doi.org/10.1007/s00704-008-0073-x, 2009.
Cristofanelli, P., Brattich, E., Decesari, S., Landi, T.C., Maione, M., Putero, D., Tositti, L., and Bonasoni, P.: Studies on environmental radionuclides at Mt. Cimone, Chapter in: High Mountain Atmospheric Research. The Italian Mt. Cimone WMO/GAW Global Station (2165 m a.s.l.), SpringerBriefs in Meteorology, Springer International Publishing, Switzerland, ISBN 978-3-319-61126-6, https://doi.org/10.1007/978-3-319-61127-3, 2018.
De Cort, M., Sangiorgi, M. Hernandez Ceballos, M. A., Vanzo, S., Nweke, E., Tognoli, P. V., and Tollefsen, T.: REM data bank – Years 1984–2006, European Commission, Joint Research Centre (JRC) [data set], https://doi.org/10.2905/jrc-10117-10024, 2007
Dee, D. P., Uppala, S. M., Simmons, A. J., Berrisford, P., Poli, P., Kobayashi, S., Andrae, U., Balmaseda, M. A., Balsamo, G., Bauer, P., Bechtold, P., Beljaars, A. C. M., van de Berg, L., Bidlot, J., Bormann, N., Delsol, C., Dragani, R., Fuentes, M., Geer, A. J., Haimberger, L., Healy, S. B., Hersbach, H., Hólm, E. V., Isaksen, L., Kållberg, P., Köhler, M., Matricardi, M., McNally, A. P., Monge-Sanz, B. M., Morcrette, J.-J., Park, B.-K., Peubey, C., de Rosnay, P., Tavolato, C., Thépaut, J.-N., and Vitart, F.: The ERA-Interim reanalysis: configuration and performance of the data assimilation system, Q. J. Roy. Meteor. Soc., 137, 553–597, https://doi.org/10.1002/qj.828, 2011.
Denton, M. H., Kivi, R., Ulich, T., Rodger, C. J., Clilverd, M. A., Denton, J. S., and Lester, M.: Observed response of stratospheric and mesospheric composition to sudden stratospheric warmings, J. Atmos. Sol., 191, 105054, https://doi.org/10.1016/j.jastp.2019.06.001, 2019.
Dutkiewicz, V. A. and Husain, L.: Stratospheric and tropospheric components of 7Be in surface air, J. Geophys. Res.-Atmos., 90, 5783–5788, https://doi.org/10.1029/JD090iD03p05783, 1985.
Eastham, S. D., Weisenstein, D. K., and Barrett, S. R. H.: Development and evaluation of the unified tropospheric-stratospheric chemistry extension (UCX) for the global chemistry-transport model GEOS-Chem, Atmos. Environ., 89, 52–63, https://doi.org/10.1016/j.atmosenv.2014.02.001, 2014.
Engel, A., Möbius, T., Haase, H.-P., Bönisch, H., Wetter, T., Schmidt, U., Levin, I., Reddmann, T., Oelhaf, H., Wetzel, G., Grunow, K., Huret, N., and Pirre, M.: Observation of mesospheric air inside the arctic stratospheric polar vortex in early 2003, Atmos. Chem. Phys., 6, 267–282, https://doi.org/10.5194/acp-6-267-2006, 2006.
European Commission: Commission recommendation of 8 June 2000 on the application of Article 36 of the Euratom Treaty concerning the monitoring of the levels of radioactivity in the environment for the purpose of assessing the exposure of the population as a whole, available at: https://op.europa.eu/it/publication-detail/-/publication/8116b329-eb85-4bda-8d4b-e8c9e0d152c2/language-en (last access: 2 July 2021), 2000.
European Commission: Radioactivity Environmental Monitoring data bank, available at: https://data.jrc.ec.europa.eu/collection/id-0117, last access: 23 November 2021.
Gaffney, J. S., Marley, N., and Cunningham, M. M.: Natural radionuclides in fine aerosols in the Pittsburgh area, Atmos. Environ., 38, 3191–3200, https://doi.org/10.1016/j.atmosenv.2004.03.015, 2004.
Gelaro, R., McCarthy, W., Suárez, M.J., Todling, R., Molod, A., Takacs, L., Randles, C. A., Darmenov, A., Bosilovich, M. G., Reichle, R., Wargan, K., Coy, L., Cullather, R., Draper, C., Akella, S., Buchard, V., Conaty, A., da Silva, A. M., Gu, W., Kim, G.-K., Koster, R., Lucchesi, R., Merkova, D., Nielsen, J. E., Partyka, G., Pawson, S., Putman, W., Rienecker, M., Schubert, S. D., Sienkiewicz, M., and Zhao, B.: The Modern-Era Retrospective Analysis for Research and Applications, Version 2 (MERRA-2), J. Climate, 30, 5419–5454, https://doi.org/10.1175/JCLI-D-16-0758.1, 2017.
Gerasopoulos, E., Zanis, P., Stohl, A., Zerefos, C. S., Papastefanou, C., Ringer, W., Tobler, L., Hübener, S., Gäggeler, H. W., Kanter, H. J., Tositti, L., and Sandrini, S.: A climatology of 7Be at four high-altitude stations at the Alps and the Northern Apennines, Atmos. Environ., 35, 6347–6360, doi :10.1016/S1352-2310(01)00400-9, 2001.
Gerasopoulos, E., Zerefos, C. S., Papastefanou, C., Zanis, P., and O'Brien, K.: Low-frequency variability of beryllium-7 surface concentrations over the Eastern Mediterranean, Atmos. Environ., 37, 1745–1756, https://doi.org/10.1016/S1352-2310(03)00068-2, 2003.
Getterlman, A., Hoor, P., Pan, L. L., Randel, W. J., Hegglin, M. I., and Birner, T. : The extratropical upper troposphere and lower stratosphere, Rev. Geophys., 49, RG3003, https://doi.org/10.1029/2011RG000355, 2011.
Golubenko, K., Rozanov, E., Kovaltsov, G., Leppänen, A.-P., Sukhodolov, T., and Usoskin, I.: Chemistry-climate model SOCOL-AERv2-BEv1 with the cosmogenic Beryllium-7 isotope cycle, Geosci. Model Dev. Discuss. [preprint], https://doi.org/10.5194/gmd-2021-56, in review, 2021.
Gourdin, E., Evrard, O., Huon, S., Reyss, J.-L., Ribolzi, O., Bariac, T., Sengtaheuanghoung, O., and Ayrault, S.: Spatial and temporal variability of 7Be and 210Pb wet deposition during four successive monsoon storms in a catchment of northern Laos, J. Environ. Radioact., 136, 195–205, https://doi.org/10.1016/j.jenvrad.2014.06.008, 2014.
Grange, S. K.: Technical note: saqgetr R package, available at: https://drive.google.com/open?id=1IgDODHqBHewCTKLdAAxRyR7ml8ht6Ods (last access: 2 July 2021), 2019.
Günther, G., Müller, R., von Hobe, M., Stroh, F., Konopka, P., and Volk, C. M.: Quantification of transport across the boundary of the lower stratospheric vortex during Arctic winter 2002/2003, Atmos. Chem. Phys., 8, 3655–3670, https://doi.org/10.5194/acp-8-3655-2008, 2008.
Hanna, S. R.: Uncertainties in air quality model predictions, Bound.-Layer Meteorol., 62, 3–20, 1993.
Hernández-Ceballos, M. A., Cinelli, G., Marín Ferrer, M., Tollefsen, T., De Felice, L., Nweke, E., Tognoli, P. V., Vanzo, S., and De Cort, M.: A climatology of 7Be in surface air in European Union, J. Environ. Radioactiv., 141, 62–70, https://doi.org/10.1016/j.jenvrad.2014.12.003, 2015.
Heikkilä, U., Beer, J., and Feichter, J.: Modeling cosmogenic radionuclides 10Be and 7Be during the Maunder Minimum using the ECHAM5-HAM General Circulation Model, Atmos. Chem. Phys., 8, 2797–2809, https://doi.org/10.5194/acp-8-2797-2008, 2008.
Hernández-Ceballos, M. A., Adame, J. A., Bolívar, J. P., and De La Morena, P.: Vertical behaviour and meteorologica properties of air masses in the southwest of the Iberian Peninsula (1997–2007), Meteorol. Atmos. Phys., 119, 163–175, https://doi.org/10.1007/s00703-012-0225-5, 2013.
Hernández-Ceballos, M. A., Brattich, E., Cinelli, G., Ajtić, J., and Djurdjevic, V.: Seasonality of 7Be concentrations in Europe and influence of tropopause height, Tellus B, 68, 29534, https://doi.org/10.3402/tellusb.v68.29534, 2016.
Hernández-Ceballos, M. A., Brattich, E., Lozano, R. L., and Cinelli, G.: 7Be behaviour and meteorological conditions associated with 7Be peak events in Spain, J. Environ. Radioactiv., 166, 17–26, https://doi.org/10.1016/j.jenvrad.2016.03.019, 2017
Holton, J. R., Haynes, P. H., McIntyre, M. E., Douglass, A. R., Rood, R. B., and Pfister, L.: Stratosphere–troposphere exchange, Rev. Geophys., 33, 403–439, 1995.
Hoor, P., Wernli, H., Hegglin, M. I., and Bönisch, H.: Transport timescales and tracer properties in the extratropical UTLS, Atmos. Chem. Phys., 10, 7929–7944, https://doi.org/10.5194/acp-10-7929-2010, 2010.
Hsu, C.-P. F.: Air Parcel Motions during a Numerically Simulated Sudden Stratospheric Warming, J. Atmos. Sci., 37, 2768–2792, https://doi.org/10.1175/1520-0469(1980)037<2768:APMDAN>2.0.CO;2, 1980.
Huret, N., Pirre, M., Hauchecorne, A., Robert, C., and Catoire, V.: On the vertical structure of the stratosphere at midlatitudes during the first stage of the polar vortex formation and in the polar region in the presence of a large mesospheric descent, J. Geophys. Res., 111, D6, https://doi.org/10.1029/2005JD006102, 2006.
Ioannidou, A. and Papastefanou, C.: Precipitation scavenging of 7Be and 137Cs radionuclides in air, J. Environ. Radioactiv., 85, 121–136, https://doi.org/10.1016/j.jenvrad.2005.06.005, 2006.
Jacob, D. J. D., Prather, M. J. M., Rasch, P. P. J., Shia, R. R.-L., Balkanski, Y. J., Beagley, S. R., Bergmann, D. J., Blackshear, W. T., Brown, M., Chiba, M., Chipperfield, M. P., de Grandpré, J., Dignon, J. E., Feichter, J., Genthon, C., Grose, W. L., Kasibhatla, P.S., Köhler, I., Kritz, M. A., Law, K., Penner, J. E., Ramonet, M., Reeves, C.E., Rotman, D. A., Stockwell, D. Z., Van Velthoven, P. F. J., Verver, G., Wild, O., Yang H., and Zimmermann, P.: Evaluation and intercomparison of global atmospheric transport models using 222Rn and other short-lived tracers, J. Geophys. Res.-Atmos., 102, 5953–5970, https://doi.org/10.1029/96JD02955, 1997.
Jorba, O., Pérez, C., Rocadenbosch, F., and Baldasano, J. M. Cluster analysis of 4-day back trajectories arriving in the Barcelona area, Spain, from 1997 to 2002, J. Appl. Meteorol. Climatol., 43, 887–901, https://doi.org/10.1175/1520-0450(2004)043<0887:CAODBT>2.0.CO;2, 2004.
Kang, W. and Tziperman, E.: More frequent sudden stratospheric warming events due to enhanced MJO forcing expected in a warmer climate, J. Climate, 30, 8727–8743, https://doi.org/10.1175/JCLI-D-17-0044.1, 2017.
Kang, W. and Tziperman, E.: The MJO-SSW teleconnection: interaction between MJO-forced waves and the midlatitude jet, Geophys. Res. Lett., 45, 4400–4409, https://doi.org/10.1029/2018GL077937, 2018.
Kivi, R., Kyrö, E., Turunen, T., Harris, N. R. P., von der Gathen, P., Rex, M., Anderson, S. B., and Wohltmann, I.: Ozonesonde observations in the Arctic during 1989–2003: ozone variability and trends in the lower stratosphere and free troposphere, J. Geophys. Res., 112, D08306, https://doi.org/10.1029/2006JD007271, 2007.
Koch, D. M., Jacob, D. J., and Graustein, W. C.: Vertical transport in tropospheric aerosols as indicated by 7Be and 210Pb in a chemical tracer model, J. Geophys. Res.-Atmos., 101, 18651–18666, https://doi.org/10.1029/96JD01176, 1996.
Lal, D. and Peters, B.: Cosmic ray produced radioactivity on the earth, in: Cosmic Rays II, edited by: Sitte, K., Springer, Berlin, Heidelberg, 551–612, 1967.
Lee, H. N., Tositti, L., Zheng, X., and Bonasoni, P.: Analyses and comparisons of 7Be, 210Pb and activity ratio 7Be 210Pb with ozone observations at two GAW stations from high mountains, J. Geophys. Res.-Atmos., 112, 1–11, https://doi.org/10.1029/2006JD007421, 2007.
Leppänen, A.-P.: Deposition of naturally occurring 7Be and 210Pb in Northern Finland, J. Environ. Radioactiv., 208–209, 105995, https://doi.org/10.1016/j.jenvrad.2019.105995, 2019.
Leppänen, A.-P., Pacini, A. A., Usoskin, I. G., Aldahan, A., Echer, E., Evangelista, H., Klemola, S., Kovaltsov, G. A., Mursula, K., and Possnert, G.: Cosmogenic 7Be in air: a complex mixture of production and transport, J. Atmos. Sol., 72, 1036–1043, https://doi.org/10.1016/j.jastp.2010.06.006, 2010.
Leppänen, A.-P., Usoskin, I. G., Kovaltsov, G. A., and Paatero, J.: Cosmogenic 7Be and 22Na in Finland: Production, observed periodicities and the connection to climatic phenomena, J. Atmos. Sol. Terr. Phys., 74, 16–180, https://doi.org/10.1016/j.jastp.2011.10.017, 2012.
Leppänen, A.-P and Paatero, J.: 7Be in Finland during the 1999–2001 solar maximum and 2007–2009 solar minimum, J. Atmos. Sol. Terr. Phys., 97, 1–10, https://doi.org/10.1016/j.jastp.2013.01.007, 2013.
Limpasuvan, V., Thompson, D. W. J., and Hartmann, D. L.: The Life Cycle of the Northern Hemisphere Sudden Stratospheric Warmings, J. Climate, 17, 2584–2596, https://doi.org/10.1175/1520-0442(2004)017<2584:TLCOTN>2.0.CO;2, 2004.
Lin, J. T. and McElroy, M. B.: Impacts of boundary layer mixing on pollutant vertical profiles in the lower troposphere: Implications to satellite remote sensing, Atmos. Environ., 44, 1726–1739, https://doi.org/10.1016/j.atmosenv.2010.02.009, 2010.
Lin, S.-J. and Rood, R. B.: Multidimensional Flux-Form Semi-Lagrangian Transport Schemes, Mon. Weather Rev., 124, 2046–2070, https://doi.org/10.1175/1520-0493(1996)124<2046:MFFSLT>2.0.CO;2, 1996.
Linderson, M.-L.: Objective classification of atmospheric circulation over Southern Scandinavia, Int. J. Climatol., 21, 155–169, https://doi.org/10.1002/joc.604, 2001.
Liu, H., Jacob, D. J., Bey, I., and Yantosca, R. M.: Constraints from 210Pb and 7Be on wet deposition and transport in a global three-dimensional chemical tracer model driven by assimilated meteorological fields, J. Geophys. Res.-Atmos., 106, 12109–12128, https://doi.org/10.1029/2000JD900839, 2001.
Liu, H., Considine, D. B., Horowitz, L. W., Crawford, J. H., Rodriguez, J. M., Strahan, S. E., Damon, M. R., Steenrod, S. D., Xu, X., Kouatchou, J., Carouge, C., and Yantosca, R. M.: Using beryllium-7 to assess cross-tropopause transport in global models, Atmos. Chem. Phys., 16, 4641–4659, https://doi.org/10.5194/acp-16-4641-2016, 2016.
Madhu, V.: Effects of sudden stratospheric warming events on the distribution of total column ozone over polar and middle latitude regions, Open J. Mar. Sci., 6, 2, https://doi.org/10.4236/ojms.2016.62025, 2016.
Mari, C., Jacob, D. J., and Bechtold, P.: Transport and scavenging of soluble gases in a deep convective cloud, J. Geophys. Res.-Atmos., 105, 22255–22267, https://doi.org/10.1029/2000JD900211, 2000.
Masarik, J. and Beer, J.: Simulation of particle fluxes and cosmogenic nuclide production in the Earth's atmosphere, J. Geophys. Res., 104, 12099–12111, https://doi.org/10.1029/1998JD200091, 1999.
Mattsson, R., Paatero, J., and Hatakka, J.: Automatic Alpha/Beta Analyser for Air Filter Samples – Absolute Determination of Radon Progeny by Pseudo-coincidence Techniques, Radiat. Prot. Dosim., 63, 133–139, https://doi.org/10.1093/oxfordjournals.rpd.a031520, 1996.
Matthewmann, N. J., Esler, J. G., Charlton-Perez, A. J., and Polvani, L.: A new look at stratospheric sudden warmings. Part III: polar vortex evolution and vertical structure, J. Climate, 22, 1566–1585, https://doi.org/10.1175/2008JCLI2365.1, 2009.
Mitchell, D. M., Gray, L. J., and Anstey, J: The influence of stratospheric vortex displacements and splits on surface climate, J. Climate, 26, 2668–2682, https://doi.org/10.1175/JCLI-D-12-00030.1, 2013.
Müller, M., Neuber, R., Fierli, F., Hauchecorne, A., Vömel, H., and Oltmans, S. J.: Stratospheric water vapour as tracer for Vortex filamentation in the Arctic winter 2002/2003, Atmos. Chem. Phys., 3, 1991–1997, https://doi.org/10.5194/acp-3-1991-2003, 2003.
Müller, R., Tilmes, S., Grooß, J.-U., Engel, A., Oelhaf, H., Wetzel, G., Huret, N., Pirre, M., Catoire, V., Toon, G., and Nakjima, H.: Impact of mesospheric intrusions on ozone-tracer relations in the stratospheric polar vortex, J. Geophys. Res., 112, D23307, https://doi.org/10.1029/2006JD008315, 2007.
Muñoz, C., Schultz, D., and Vaughan, G.: A midlatitude climatology and interannual variability of 200- and 500-hPa cutoff lows, J. Climate, 33, 2201–2222, https://doi.org/10.1175/JCLI-D-19-0497.1, 2020.
NCEP/NWS/NOAA/U.S. Department of Commerce: NCEP FNL Operational Model Global Tropospheric Analyses, continuing from July 1999, Research Data Archive at the National Center for Atmospheric Research, Computational and Information Systems Laboratory, https://doi.org/10.5065/D6M043C6 (last access: 23 November 2021), 2000.
Pacini, A. A., Usoskin, I. G., Mursula, K., Echer, E., and Evangelista, H.: Signature of a sudden stratospheric warming in the near-ground 7Be flux, Atmos. Environ., 113, 27–31, https://doi.org/10.1016/j.atmosenv.2015.04.065, 2015.
Park, R. J., Jacob, D. J., Field, B. D., Yantosca, R. M., and Chin, M.: Natural and transboundary pollution influences on sulfate-nitrate-ammonium aerosols in the United States: Implications for policy, J. Geophys. Res.-Atmos., 109, D15, https://doi.org/10.1029/2003JD004473, 2004.
Peethani, S., Sharma, N., and Pathakoti, M.: Effect of tropospheric and stratospheric temperatures on tropopause height, Remote Sens. Lett., 5, 933–940, https://doi.org/10.1080/2150704X.2014.973078, 2014.
Peters, D. H. W., Vargin, P., Gabriel, A., Tsvetkova, N., and Yushkov, V.: Tropospheric forcing of the boreal polar vortex splitting in January 2003, Ann. Geophys., 28, 2133–2148, https://doi.org/10.5194/angeo-28-2133-2010, 2010.
Piñero García, F., Ferro García, M. A., and Azahra, M.: 7Be behaviour in the atmosphere of the city of Granada January 2005 to December 2009, Atmos. Environ., 47, 84–91, https://doi.org/10.1016/j.atmosenv.2011.11.034, 2012.
Pinheiro, H. R., Hodges, K. I., Gan, M. A., and Ferreira, N. J.: A new perspective of the climatological features of upper-level cut-off lows in the Southern Hemisphere, Clim. Dyn., 48, 541–559, https://doi.org/10.1007/s00382-016-3093-8, 2016.
Poluianov, S. V., Kovaltsov, G. A., Mishev, A. L., and Usoskin, I. G.: Production of cosmogenic isotopes 7Be, 10Be, 14C, 22Na, and 36Cl in the atmosphere: altitudinal profiles of yield functions, J. Geophys. Res., 121, 8125–8136, https://doi.org/10.1002/2016JD025034, 2016.
Portmann, R., Sprenger, M., and Wernli, H.: The three-dimensional life cycles of potential vorticity cutoffs: a global and selected regional climatologies in ERA-Interim (1979–2018), Weather Clim. Dynam., 2, 507–534, https://doi.org/10.5194/wcd-2-507-2021, 2021.
Potgieter, M. S.: Solar modulation of cosmic rays, Living Rev. Sol. Phys., 10, 3, https://doi.org/10.12942/lrsp-2013-3, 2013.
Putero, D., Cristofanelli, P., Sprenger, M., Škerlak, B., Tositti, L., and Bonasoni, P.: STEFLUX, a tool for investigating stratospheric intrusions: application to two WMO/GAW global stations, Atmos. Chem. Phys., 16, 14203–14217, https://doi.org/10.5194/acp-16-14203-2016, 2016.
Salminen-Paatero, S., Thölix, L., Kivi, R., and Paatero, J.: Nuclear contamination sources in surface air of Finnish Lapland in 1965–2011 studied by means of 137Cs, 90Sr, and total beta activity, Environ. Sci. Pollut. Res., 26, 21511–21523, https://doi.org/10.1007/s11356-019-05451-0, 2019.
Salvador, P., Artíñano, B., Querol, X., and Alastuey, A.: A combined analysis of backward trajectories and aerosol chemistry to characterise long-range transport episodes of particulate matter: The Madrid air basin, a case study, Sci. Tot. Environ., 390, 495–506, https://doi.org/10.1016/j.scitotenv.2007.10.052, 2008.
Sangiorgi, M., Hernández Ceballos, M. A., Iurlaro, G., Cinelli, G., and de Cort, M.: 30 years of European Commission Radioactivity Environmental Monitoring data bank (REMdb) – an open door to boost environmental radioactivity research, Earth Syst. Sci. Data, 11, 589–601, https://doi.org/10.5194/essd-11-589-2019, 2019.
Sarvan, D., Stratimirović, Đ., Blesić, S., Djurdjevic, V., Miljković, V., and Ajtić, J.: Dynamics of beryllium-7 specific activity in relation to meteorological variables, tropopause height, teleconnection indices and sunspot number, Physica A, 469, 813–823, https://doi.org/10.1016/j.physa.2016.11.040, 2017.
Simpkins, G.: Tropics to stratosphere, Nat. Clim. Change, 7, 624, https://doi.org/10.1038/nclimate3385, 2017.
Sofieva, V. F., Kalakoski, N., Verronen, P. T., Päivärinta, S.-M., Kyrölä, E., Backman, L., and Tamminen, J.: Polar-night O3, NO2 and NO3 distributions during sudden stratospheric warmings in 2003–2008 as seen by GOMOS/Envisat, Atmos. Chem. Phys., 12, 1051–1066, https://doi.org/10.5194/acp-12-1051-2012, 2012.
Sonnemann, G.R., Grygalashvyly, M., and Berger, U.: Impact of a stratospheric warming event in January 2001 on the minor constituents in the MLT region calculated on the basis of a new 3D-model LIMA of the dynamics and chemistry of the middle atmosphere, J. Atmos. Sol.-Terr. Phys., 68, 2012–2025, https://doi.org/10.1016/j.jastp.2006.04.005, 2006.
Stein, A. F., Draxler, R. R., Rolph, G. D., Stunder, B. J. B., Cohen, M. D., and Ngan, F.: NOAA's HYSPLIT atmospheric transport and dispersion modeling system, B. Am. Meteorol. Soc., 96, 2059–2077, https://doi.org/10.1175/BAMS-D-14-00110.1, 2015.
Sýkora, I., Holý, K., Jeskovský, M., Müllerov, M., Bulko, M., and Povinec, P. P.: Long-term variations of radionuclides in the Bratislava air, J. Environ. Radioactiv., 166, 27–35, https://doi.org/10.1016/j.jenvrad.2016.03.004, 2017.
Tao, M., Konopka, P., Ploeger, F., Grooß, J.-U., Müller, R., Volk, C. M., Walker, K. A., and Riese, M.: Impact of the 2009 major sudden stratospheric warming on the composition of the stratosphere, Atmos. Chem. Phys., 15, 8695–8715, https://doi.org/10.5194/acp-15-8695-2015, 2015.
Terzi, L. and Kalinowski, M. B.: World-wide seasonal variation of 7Be related to large-scale atmospheric circulation dynamics, J. Environ. Radioactiv., 178–179, 1–15, https://doi.org/10.1016/j.jenvrad.2017.06.031, 2017.
Tilmes, S., Müller, R., Engel, A., Rex, M., Russell III, J. M.: Chemical ozone loss in the Arctic and Antarctic stratosphere between 1992 and 2005, Geophys. Res. Lett., 33, 20, https://doi.org/10.1029/2006GL026925, 2006.
Tositti, L., Hübener, S., Kanter, H. J., Ringer, W., Sandrini, S., and Tobler, L.: Intercomparison of sampling and measurement of 7Be in air at four high-altitude locations in Europe, Appl. Rad. Isot., 61, 1497–1502, https://doi.org/10.1016/j.apradiso.2004.04.003, 2004.
Tositti, L., Brattich, E., Cinelli, G., and Baldacci, D.: 12 years of 7Be and 210Pb in Mt. Cimone and their correlation with meteorological parameters, Atmos. Environ., 87, 108–122, https://doi.org/10.1016/j.atmosenv.2014.01.014, 2014.
Usoskin, I. G. and Kovaltsov, G. A.: Production of cosmogenic 7Be isotope in the atmosphere: Full 3-D modeling, J. Geophys. Res., 113, D12107, https://doi.org/10.1029/2007JD009725, 2008.
Usoskin, I. G, Field, C. V., Schmidt, G. A., Leppänen, A.-P., Aldahan, A., Kovaltsov, G. A., Possnert, G., and Ungar, R. K.: Short-term production and synoptic influences on atmospheric 7Be concentrations, J. Geophys. Res.-Atmos., D6, 114, https://doi.org/10.1029/2008JD011333, 2009.
Wang, Q., Jacob, D. J., Fisher, J. A., Mao, J., Leibensperger, E. M., Carouge, C. C., Le Sager, P., Kondo, Y., Jimenez, J. L., Cubison, M. J., and Doherty, S. J.: Sources of carbonaceous aerosols and deposited black carbon in the Arctic in winter-spring: implications for radiative forcing, Atmos. Chem. Phys., 11, 12453–12473, https://doi.org/10.5194/acp-11-12453-2011, 2011.
Wargan, K. and Coy, L.: Strengthening of the tropopause inversion layer during the 2009 Sudden Stratospheric Warming: a MERRA-2 study, J. Atmos. Sci., 73, 1871–1887, https://doi.org/10.1175/JAS-D-15-0333.1, 2016.
Waugh, D. W., Sobel, A. H., and Polvani, L. M.: What is the polar vortex and how does it influence weather?, B. Am. Meteorol. Soc., 98, 37–44, https://doi.org/10.1175/BAMS-D-15-00212.1, 2017.
Webber, W. R., Higbie, P. R., and McCracken, K. G.: Production of the cosmogenic isotopes 3H, 7Be, 10Be, and 36Cl in the Earth's atmosphere by solar and galactic cosmic rays, J. Geophys. Res., 112, A10, https://doi.org/10.1029/2007JA012499, 2007.
Wesely, M. L.: Parameterization of surface resistance to gaseous dry deposition in regional numerical models, Atmos. Environ., 16, 1293–1304, 1989.
Wu, S., Mickley, L. J., Jacob, D. J., Logan, J. A., Yantosca, R. M., and Rind, D. Why are there large differences between models in global budgets of tropospheric ozone?, J. Geophys. Res.-Atmos., 112, 1–18, https://doi.org/10.1029/2006JD007801, 2007.
Yu, K., Keller, C. A., Jacob, D. J., Molod, A. M., Eastham, S. D., and Long, M. S.: Errors and improvements in the use of archived meteorological data for chemical transport modeling: an analysis using GEOS-Chem v11-01 driven by GEOS-5 meteorology, Geosci. Model Dev., 11, 305–319, https://doi.org/10.5194/gmd-11-305-2018, 2018.
Zanis, P., Schuepbach, E., Gäggeler, H. W., Hübener, S., and Tobler, L.: Factors controlling beryllium-7 at Jungfraujoch in Switzerland, Tellus, 51, 789e805, 1999.
Zhang, B., Liu, H., Crawford, J. H., Chen, G., Fairlie, T. D., Chambers, S., Kang, C.-H., Williams, A. G., Zhang, K., Considine, D. B., Sulprizio, M. P., and Yantosca, R. M.: Simulation of radon-222 with the GEOS-Chem global model: emissions, seasonality, and convective transport, Atmos. Chem. Phys., 21, 1861–1887, https://doi.org/10.5194/acp-21-1861-2021, 2021.