the Creative Commons Attribution 4.0 License.
the Creative Commons Attribution 4.0 License.
 | 07 Dec 2021
Measurement report: New particle formation characteristics at an urban and a mountain station in northern China
Ying Zhou
Simo Hakala
Xiaohong Yao
Tommy Chan
Juha Kangasluoma
Shahzad Gani
Jenni Kontkanen
Pauli Paasonen
Yongchun Liu
Tuukka Petäjä
Markku Kulmala
Atmospheric new particle formation (NPF) events have attracted increasing attention for their contribution to the global aerosol number budget and therefore their effects on climate, air quality and human health. NPF events are regarded as a regional phenomenon, occurring over a large area. Most observations of NPF events in Beijing and its vicinity were conducted in populated areas, whereas observations of NPF events on mountaintops with low anthropogenic emissions are still rare in China. The spatial variation of NPF event intensity has not been investigated in detail by incorporating both urban areas and mountain measurements in Beijing. Here, we provide NPF event characteristics in summer 2018 and 2019 at urban Beijing and a comparison of NPF event characteristics – NPF event frequency, formation rate and growth rate – by comparing an urban Beijing site and a background mountain site separated by ∼80 km from 14 June to 14 July 2019, as well as giving insights into the connection between both locations. During parallel measurements at urban Beijing and mountain background areas, although the median condensation sink during the first 2 h of the common NPF events was around 0.01 s−1 at both sites, there were notable differences in formation rates between the two locations (median of 5.42 cm−3 s−1 at the urban site and 1.13 cm−3 s−1 at the mountain site during the first 2 h of common NPF events). In addition, the growth rates in the 7–15 nm range for common NPF events at the urban site (median of 7.6 nm h−1) were slightly higher than those at the mountain site (median of 6.5 nm h−1). To understand whether the observed events were connected, we compared air mass trajectories as well as meteorological conditions at both stations. Favorable conditions for the occurrence of regional NPF events were largely affected by air mass transport. Overall, our results demonstrate a clear inhomogeneity of regional NPF within a distance of ∼100 km, possibly due to the discretely distributed emission sources.
- Article
(7033 KB) - Full-text XML
- BibTeX
- EndNote


Atmospheric new particle formation (NPF) events resulting from the formation of clusters and stable aerosol particles from gas-phase precursors have been recognized as a major contributor to the global aerosol budget (Kulmala et al., 2004; Zhang et al., 2011). Once the newly formed particles grow to certain sizes, they can act as cloud condensation nuclei (CCN), affecting the regional and global climate (Pierce and Adams, 2009; Yu and Luo, 2009). NPF events were also found to contribute to haze formation and thus can influence air quality, especially in megacities where the precursor concentrations and associated formation rates are rather high (Guo et al., 2014, 2020; Kulmala et al., 2021; Du et al., 2021).
The occurrence of NPF events is a result of the competition between factors promoting and inhibiting cluster formation and their growth. For instance, sufficient sulfuric acid and other low-volatility vapors have been confirmed to be important in particle nucleation and growth in field observations as well as in chamber experiments (Ehn et al., 2014; Wang et al., 2017; Lehtipalo et al., 2018; Yao et al., 2018; Deng et al., 2020). Additionally, background particles can inhibit new particle formation by acting as a condensation sink (CS) for vapor precursors and a coagulation sink for newly formed particles. Indeed, Cai et al. (2017) found that the Fuchs surface area (AFuchs) (which is linearly proportional to condensation sink) determined the occurrence of NPF events in urban Beijing. In the atmosphere, air mass trajectories and meteorological conditions can affect the occurrence of NPF events by modifying the source–sink competition. Wu et al. (2007) summarized favorable conditions for NPF events in Beijing based on a 1-year observation as sufficient solar radiation (sunny days), northerly wind, low relative humidity and fewer pre-loading large particles. Similarly, in other environments, plenty of radiation, intermediate temperatures and a low condensation sink favor the occurrence of NPF events (Qi et al., 2015; Dada et al., 2017; Kerminen et al., 2018). Regional NPF events can happen with a spatial extent up to several hundred kilometers and vertical extent from the boundary layer to the free troposphere under favorable conditions (Hussein et al., 2009; Shen et al., 2011; Dai et al., 2017). Earlier studies have shown the regional nature of NPF events by finding similarities in the occurrence and characteristics of NPF events simultaneously observed at two or more sites. For instance, Komppula et al. (2006) investigated the occurrence of NPF events at two forest stations in northern Finland during 2000–2003. Their results suggested that same air mass source regions, favorable weather conditions and clean air at both stations were necessary for NPF events occurring simultaneously at the two stations. Vana et al. (2016) compared observations at three sites over a distance of 1000 km in northern Finland, southern Finland and Estonia in 2013–2014. They found that some events have the same origin. On the other hand, Jun et al. (2014) observed that NPF events occurred less frequently in downtown Toronto than at a nearby background site and attributed this observation to the high condensation and coagulation sink due to primary particle emission from traffic in urban areas. Moreover, Carnerero et al. (2018) observed horizontal distribution and a regional impact of the NPF events with data from urban, urban background and suburban stations in the Madrid metropolitan area, Spain, in July 2016. Their results indicated that ultra-fine particles were detected quasi-homogenously in an area spanning at least 17 km horizontally, and the NPF events extended over the full vertical extension of the mixed layer. Finally, Salma et al. (2016) found that regional NPF events were modified and transformed by urban NPF events during their observation in 2008–2009 and 2012–2013 in Budapest and at a regional background site 71 km away from it. In comparison to the aforementioned studies in Europe, a similar study was also carried out to understand the regional NPF events in the North China Plain. Wang et al. (2013) characterized the NPF events observed at an urban Beijing site and a regional background site about 120 km northeast of the urban site from March to November in 2008. They observed 96 and 87 NPF events in urban Beijing and the background site, respectively, among which 52 NPF events were observed simultaneously at both sites. They found that NPF events were slightly weaker in the background site compared to those observed at the urban site. However, the factors that influence the occurrence of NPF events at the two stations simultaneously were left undetermined.
In addition to horizontal extension of NPF events, the vertical extension of NPF events has also attracted the attention of researchers. It has been confirmed that NPF events can be triggered within the whole low tropospheric column at the same time and even above the planetary boundary layer upper limit (Boulon et al., 2011). Sellegri et al. (2019) reviewed NPF events observed at six different altitude stations. They found that NPF events were most favored at altitudes close to the interface of the free troposphere with the planetary boundary layer and in the vicinity of clouds. In addition, at high-altitude sites, the CS may not be the limiting factor for NPF occurrence as a higher CS is associated with more precursors for nucleation and initial growth. Based on observations at two different altitudes (340 and 560 m above sea level) in northern Finland, Komppula et al. (2003) found that NPF events had similar formation and growth rates between these two heights, while due to the vertical movement of air masses, the difference of NPF event start time between these two sites was limited within 30 min. Similar results were also observed at two sites in France that formation and growth rates were similar between two altitudes (660 and 1465 m above sea level), while the contribution of ion-induced nucleation was higher at high altitudes (Boulon et al., 2011). Finally, during a recent observation in Spain, growth rates were higher at the mountain site (2500 m a.s.l.) than at the urban site (680 m a.s.l.), while the difference between formation rates varied with altitude (Casquero-Vera et al., 2020).
In addition to largely populated urban areas, there is a large mountain area within the Beijing–Tianjin–Hebei (BTH) region, where, to the best of our knowledge, the characteristics of NPF events are not well studied. In this study, we conducted simultaneous measurements of NPF event characteristics at an urban site in Beijing and a background mountain site about 80 km west of urban Beijing from 14 June to 14 July 2019.
Based on our observations, we aim to (i) compare the characteristics of the NPF events between the two sites, including the frequency, formation rate and growth rate; (ii) figure out the connections and differences between NPF events at these two sites; and (iii) identify the favorable conditions for regional NPF events. Due to the profound contribution of NPF events to the global aerosol number loading and air quality degradation, identifying the conditions that promote or inhibit the occurrence of regional-scale NPF events could help to minimize their adverse effects.
2.1 Measurement sites' description
Urban site. The Beijing University of Chemical Technology (BUCT; 39.94∘ N, 116.31∘ E) station is located on the fifth floor of a university building inside the west campus of BUCT. The station is surrounded by several main roads with heavy traffic and residential areas and, thus, can be considered a typical urban station. The altitude of the west campus of BUCT is around 20 m above sea level, and the urban site is around 12 m above ground level. More details of this station can be found in Zhou et al. (2020). Observations at the urban site have been continuous since 17 January 2018 and were only interrupted for necessary instrument maintenance. The location is referred to as “UB” hereafter and is shown on the map in Fig. 1.
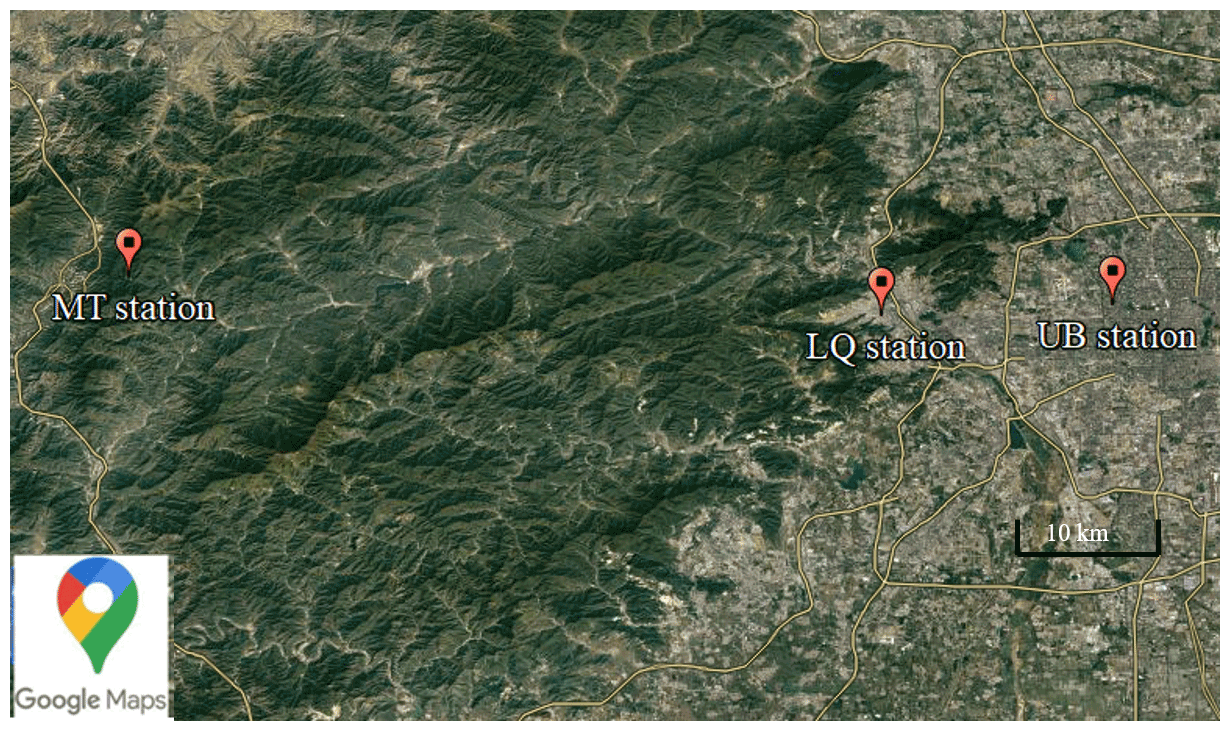
Figure 1Map showing locations of the urban station (UB), Longquan station (LQ) and the mountain station (MT). Image was produced using © Google Maps.
Mountain site. The Beijing Forest Ecosystem Research Station (39.96∘ N, 115.43∘ E) is located in the west of Beijing, referred to as “MT” hereafter, and is part of the Chinese Ecological Research Network (CERN). It is located in the mountain areas west of Beijing, about 80 km from the urban site; see also Fig. 1. The altitude of the station is 1170 m above sea level, and it is surrounded by forests. The closest anthropogenic activities are associated with small villages located in the valley nearby the MT station. Observations at the MT station are from 14 June to 14 July 2019. For better comparability, we only used the data collected simultaneously at both stations.
Longquan station. The Longquan national monitoring station sits in the town of Longquan, Mentougou District, Beijing. It is 20 km west of the UB site and 60 km east of the MT site and is considered a suburban station. The location is referred to as “LQ” hereafter and is shown on the map in Fig. 1.
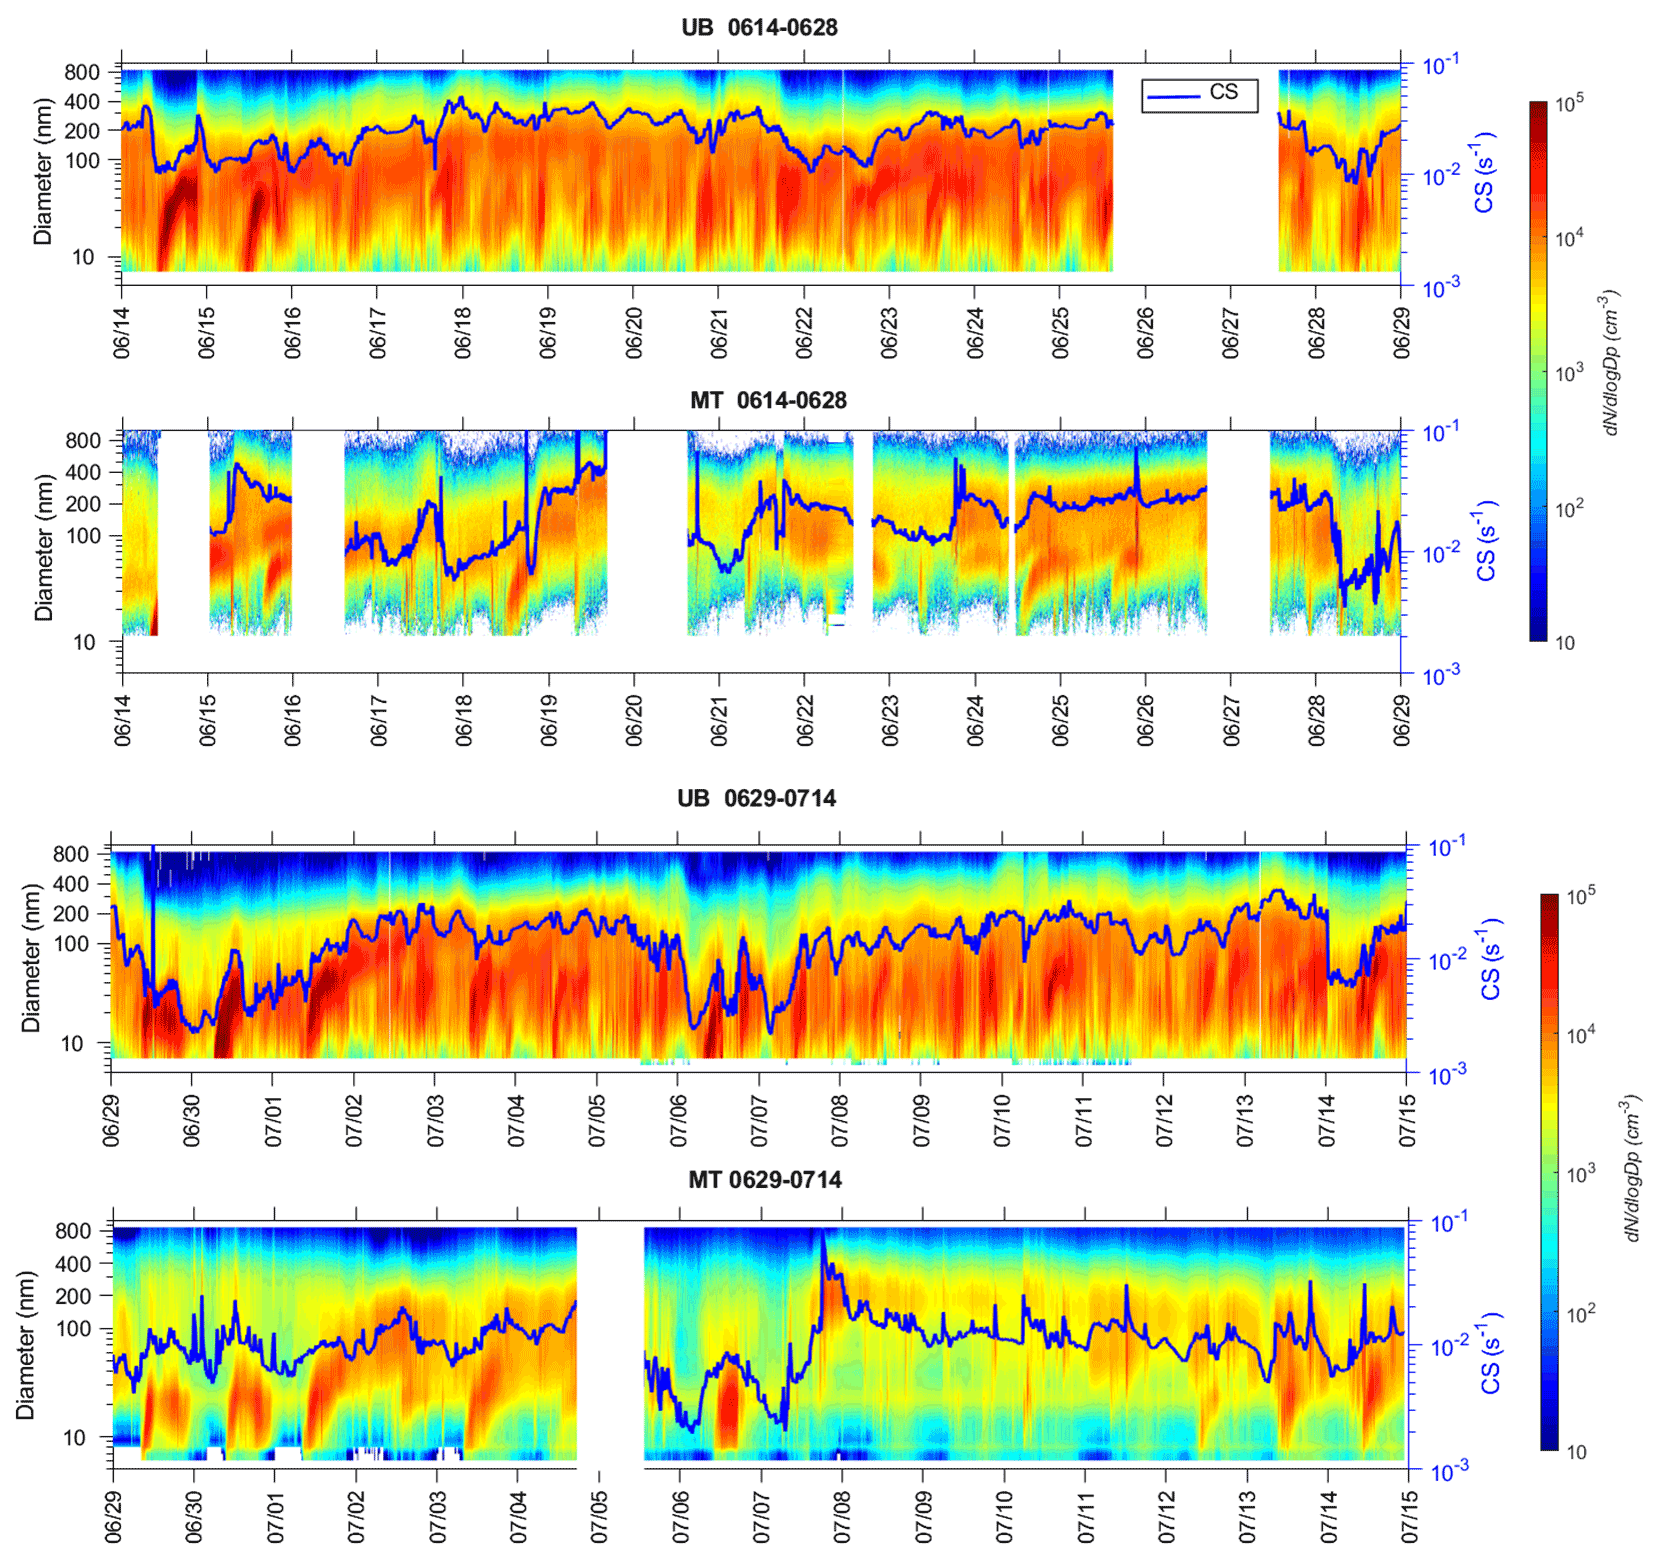
Figure 2Time series of particle number size distribution and CS (blue line) at UB and MT stations during our observations. Time resolutions of particle number size distribution data and CS were 8 min at the UB station and 4 min at the MT station, respectively.
2.2 Instrumentation
Particle number size distribution was measured in parallel at both sites (Fig. 2). Particle number size distribution data in the size range of 6–840 nm were collected using a differential mobility particle sizer (DMPS) at the UB station. The instrument consists of one Hauke-type DMA (differential mobility analyzer, home-built by the University of Helsinki) in different flow rates and one CPC (condensation particle counter; TSI Model 3772). Details of this instrument can be found in Salma et al. (2011) and Kangasluoma et al. (2020). At MT station, a scanning mobility particle sizer (SMPS; consists of a TSI differential mobility analyzer, Model 3081) and a fast mobility particle sizer (FMPS, TSI Model 3091) were used to measure particle number size distribution from 14 to 28 June and from 29 June to 14 July, respectively. The size ranges of the SMPS and FMPS are 7–1218 and 6.04–856 nm, respectively. The total number concentration from 4 to 3000 nm, measured by a condensation particle counter (CPC; TSI Model 3775), was used to calibrate the particle number size distributions from the FMPS according to the method suggested by Zimmerman et al. (2015). More details about the instrument are found in previous studies (Wang et al., 2019; Gao et al., 2020). The particle number size distribution measured by the FMPS correlated well with the SMPS during the comparison in laboratory after being calibrated (Lee et al., 2013).
To ensure a high quality of particle number size distribution data at the UB site, a particle number size distribution system (PSD) also sampled in parallel with the DMPS from 1 June to 31 August 2019 (summer 2019). It included a nano-scanning mobility particle sizer (nano-SMPS, 3–55 nm, mobility diameter), a long SMPS (25–650 nm, mobility diameter) and an aerodynamic particle sizer (APS, 0.55–10 µm, aerodynamic diameter). Details of this instrument can be found in Liu et al. (2016) and Deng et al. (2020).

Figure 3Median particle number size distribution in 5–900 nm measured by the DMPS and PSD system during our observation from 1 June to 31 August 2019 at the UB station. The time window of the data is from 09:00–15:00 of every day.
The PSD was used as a reference. As shown in Fig. 3, median particle number size distribution obtained from PSD and DMPS matched well in terms of data trend. Varying with particle diameter, particle number size distribution data measured by DMPS can be higher or lower than PSD within a factor of 2.
We cannot compare particle number size distribution data obtained from the DMPS, SMPS and FMPS as we did not sample with these three instruments in parallel at the same site. However, it is reasonable to assume that particle number size distributions obtained from the FMPS were comparable with those from the DMPS as, on the one hand, the measurement techniques of particle number size distribution in the size range of these two instruments have been well developed and applied in quite a lot observations (Wang et al., 2017; Kangasluoma et al., 2020); on the other hand, the particle number size distribution from the FMPS was carefully calibrated, and the FMPS was properly operated during the observation as discussed above. Similar conclusions apply for the SMPS as well, for which we can rely on using the measurement from this instrument to discuss at least NPF event frequency at the MT site during 14 to 28 June 2019, during which parameters of only one NPF event are calculated.
Sulfur dioxide (SO2) concentration data were collected by the Thermo Scientific gas analyzer model 43i-TLE with a time resolution of 5 min at the UB station. There was no direct measurement of SO2 concentrations at the MT station, but the SO2 measurement at the closest national monitoring station (Longquan station, around 60 km from the MT station and 20 km from the UB station; see Fig. 1) was used to indicate the strong decline of SO2 concentration from urban Beijing towards the west areas. The time series of SO2 concentration at the UB station and Longquan station during the whole observation is shown in Fig. 4. Due to the lower emission, the SO2 concentration at the MT station is expected to be even lower than that at Longquan station.
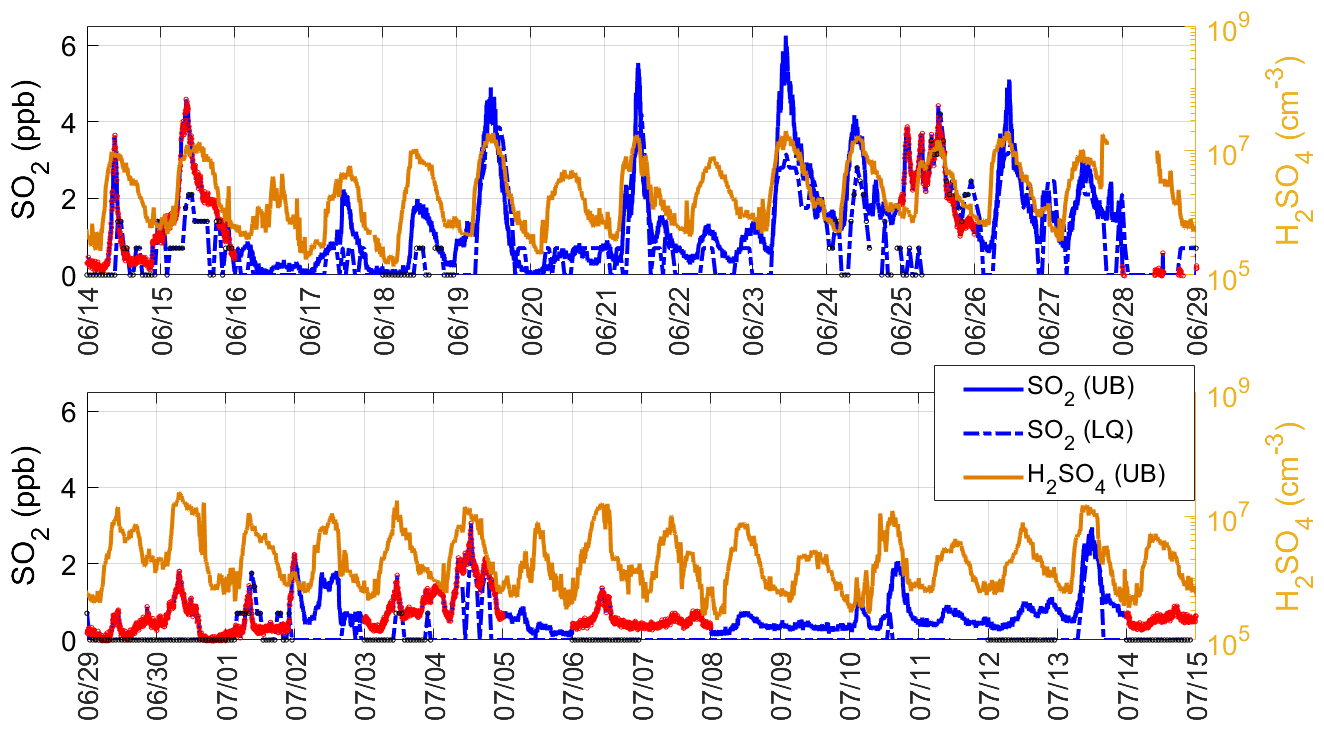
Figure 4Time series of SO2 concentration (ppb) at the UB station and Longquan station (LQ) during our observation (left axis) as well as H2SO4 concentration measured at the UB station (right axis). Data below the detection limit are set as zero at both stations. Data on NPF event days were marked in red at the UB station and black at the MT station. The time resolution for SO2 data was 5 min at the UB station and 1 h at LQ station, respectively.
The sulfuric acid concentration was measured at the UB station by a chemical ionization–atmospheric interface–time of flight mass spectrometer (CI-APi-ToF; Aerodyne Research Inc.) equipped with a nitrate chemical ionization at the UB station (Lu et al., 2019). There were no sulfuric acid data available at the MT station, and since no SO2 concentrations were available, a sulfuric acid proxy concentration could not be derived.
The meteorological conditions such as relative humidity (RH, %), temperature (∘C) and solar radiation (UVA and UVB, W m−2) were measured using a Vaisala weather station data acquisition system (AWS310, PWD22, CL51), MetCon at the UB station and a Vaisala MAWS301 automatic weather station at the MT station. The measurements at the MT station were carried out at the height of 1.5 m. The wind speed (m s−1) and wind direction (∘) data were also measured by the weather station at the UB site, while at the MT site, we obtained these as reanalysis data from the ERA5 model (Olauson, 2018).
2.3 Air mass back trajectories
Air mass back trajectories were calculated using a Lagrangian particle dispersion model FLEXPART (FLEXible PARTicle dispersion model) version 9.02 (Stohl et al., 2005). As the meteorological input, we used ECMWF (European Centre for Medium-Range Weather Forecasts) operational forecast data with 0.15∘ horizontal and 1 h temporal resolution. Particle retroplume simulations were performed hourly for both sites during the whole study period. For each retroplume simulation, we used 50 000 model particles distributed evenly between 0–100 m above the measurement site. The released model particles were traced backwards in time for 72 h, unless they exceeded the model grid (20–60∘ N, 95–135∘ E, resolution: 0.05∘).
Based on the arrival direction of the 72 h backward trajectories, the prevailing air mass transport conditions at each site were classified into five groups: north group, west group, east group, south group and local group. Air masses arriving from north, northwest and northeast, including Mongolia, Inner Mongolia and northeast China, were classified into the north group. Air masses from Shanxi province, Inner Mongolia and further west were classified into the west group. Air masses from the ocean east of Beijing were classified into the east group, and air masses from southern areas were classified into the south group. Stagnant air masses that had only travelled short distances and/or were circulating around the measurement site were classified into the local group. Examples of air mass trajectories belonging to these five groups are shown in Fig. 5. In general, air masses from the north and west supply clean air from the mountainous areas to both stations, whereas air masses from the east and south travel over highly populated areas, thus accumulating air pollutants. However, the impact of local air masses on the pollution levels at the two sites can be different; at the UB station, local air masses are polluted by the urban emissions, while at the MT station stagnant air could cause a clean situation due to low anthropogenic emissions. More details on the relationship between air mass transport conditions and the extent of pollution are discussed in later sections.
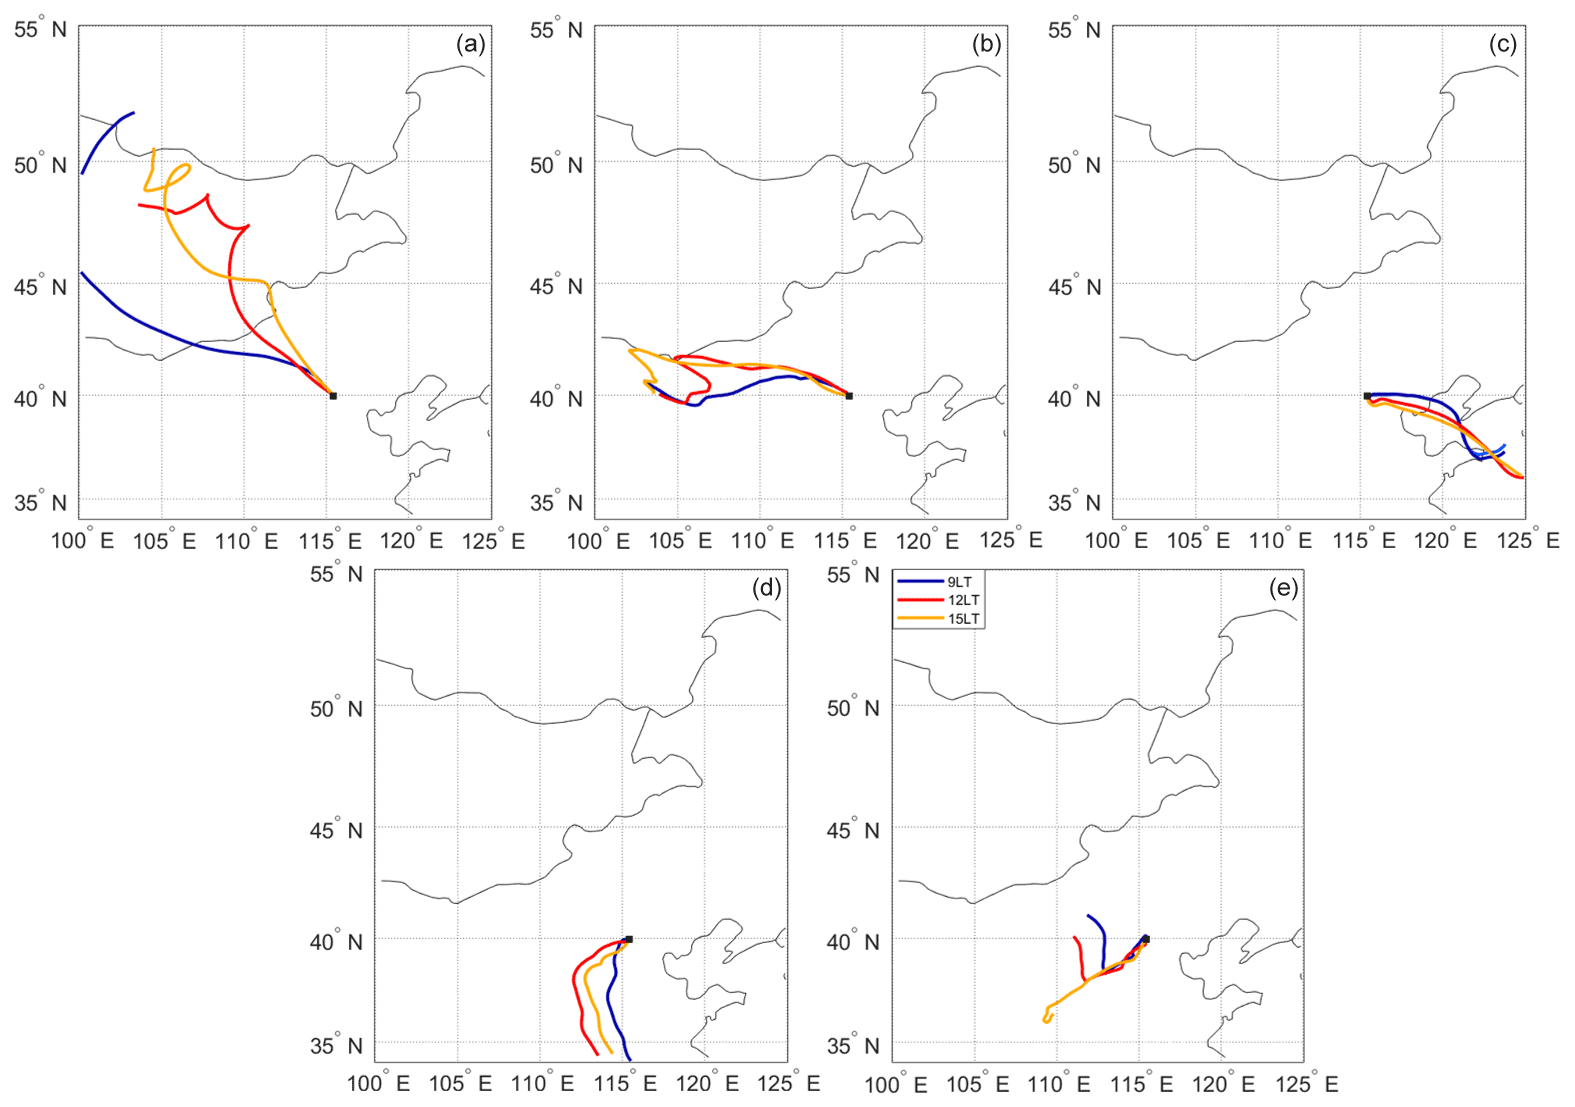
Figure 5Examples of air masses arrived at both stations from the (a) north group, (b) west group, (c) east group, (d) south group and (d) local group during 09:00–15:00 (local time, LT). Both stations are under the same marker.
2.4 Estimating the spatial extent of NPF
The observation of regional new particle formation events, where the growth of newly formed particles can be followed for several hours, is a result of NPF events taking place over a large spatial area. This is because as time progresses, the particles observed at a measurement site should have originated from further and further away due to nonzero wind conditions. Following the progression of the observed NPF event and using air mass back trajectories, we can estimate where the particles observed at different stages of the NPF event were initially formed by calculating the air mass locations at the onset time of the NPF event (assuming that NPF occurs simultaneously over the larger area). Typically, the mode related to the NPF event disappears from the observations after some time. This is an indication of the currently observed air mass arriving from an area where NPF was no longer taking place due to unfavorable local conditions. If the shift in the air mass origin towards unfavorable conditions occurs gradually over time, the mode related to the NPF event can enter a stage of growth stagnation (or even decrease in size) before disappearing completely (Kivekäs et al., 2016). This is because the increasing transport time between NPF onset and observation of the particles at the measurement site provides less and less additional “material” for aerosol growth towards the more unfavorable conditions. Calculating the locations where NPF is assumed to have taken place for longer data sets including several regional NPF events can give an estimation of the typical spatial extent of NPF around the measurement location. It should be noted that even in relatively clear cases, the subjective determination of NPF event onset and end times can easily lead to uncertainties of few tens of kilometers in the estimations. In locations with strong primary pollution sources, such as urban Beijing, objective determination of NPF event start and stop times becomes even more difficult. More details and discussion related to the method and its uncertainties can be found in Kristensson et al. (2014).
2.5 NPF event classification
Particle number size distribution data from both stations were used for classifying individual days into new particle formation (NPF) event days and non-event days. This classification followed procedures presented by Dal Maso et al. (2005) and later adapted for urban locations (Chu et al., 2021) in which a day is classified as a NPF event day if (a) a new mode in the size range smaller than 25 nm appeared, and (b) the new mode kept growing over several hours. On the other hand, non-event days are the days which do not fit any of the above-mentioned criteria, and undefined days are the days which fit either one of the above-mentioned criteria. At UB site, we also observed some cases in which nucleation-mode particle number concentration burst without mode diameter increases. It could be related to non-regional NPF events (Dai et al., 2017). We did not observe such cases at the MT site. Actually, the abundant anthropogenic emissions in the megacity could provide enough precursors for non-regional NPF events. However, traffic emissions can also provide abundant primary nucleation-mode particles, making it difficult to distinguish whether the new mode was from an NPF event or traffic. So we classified such events as “undefined” also.
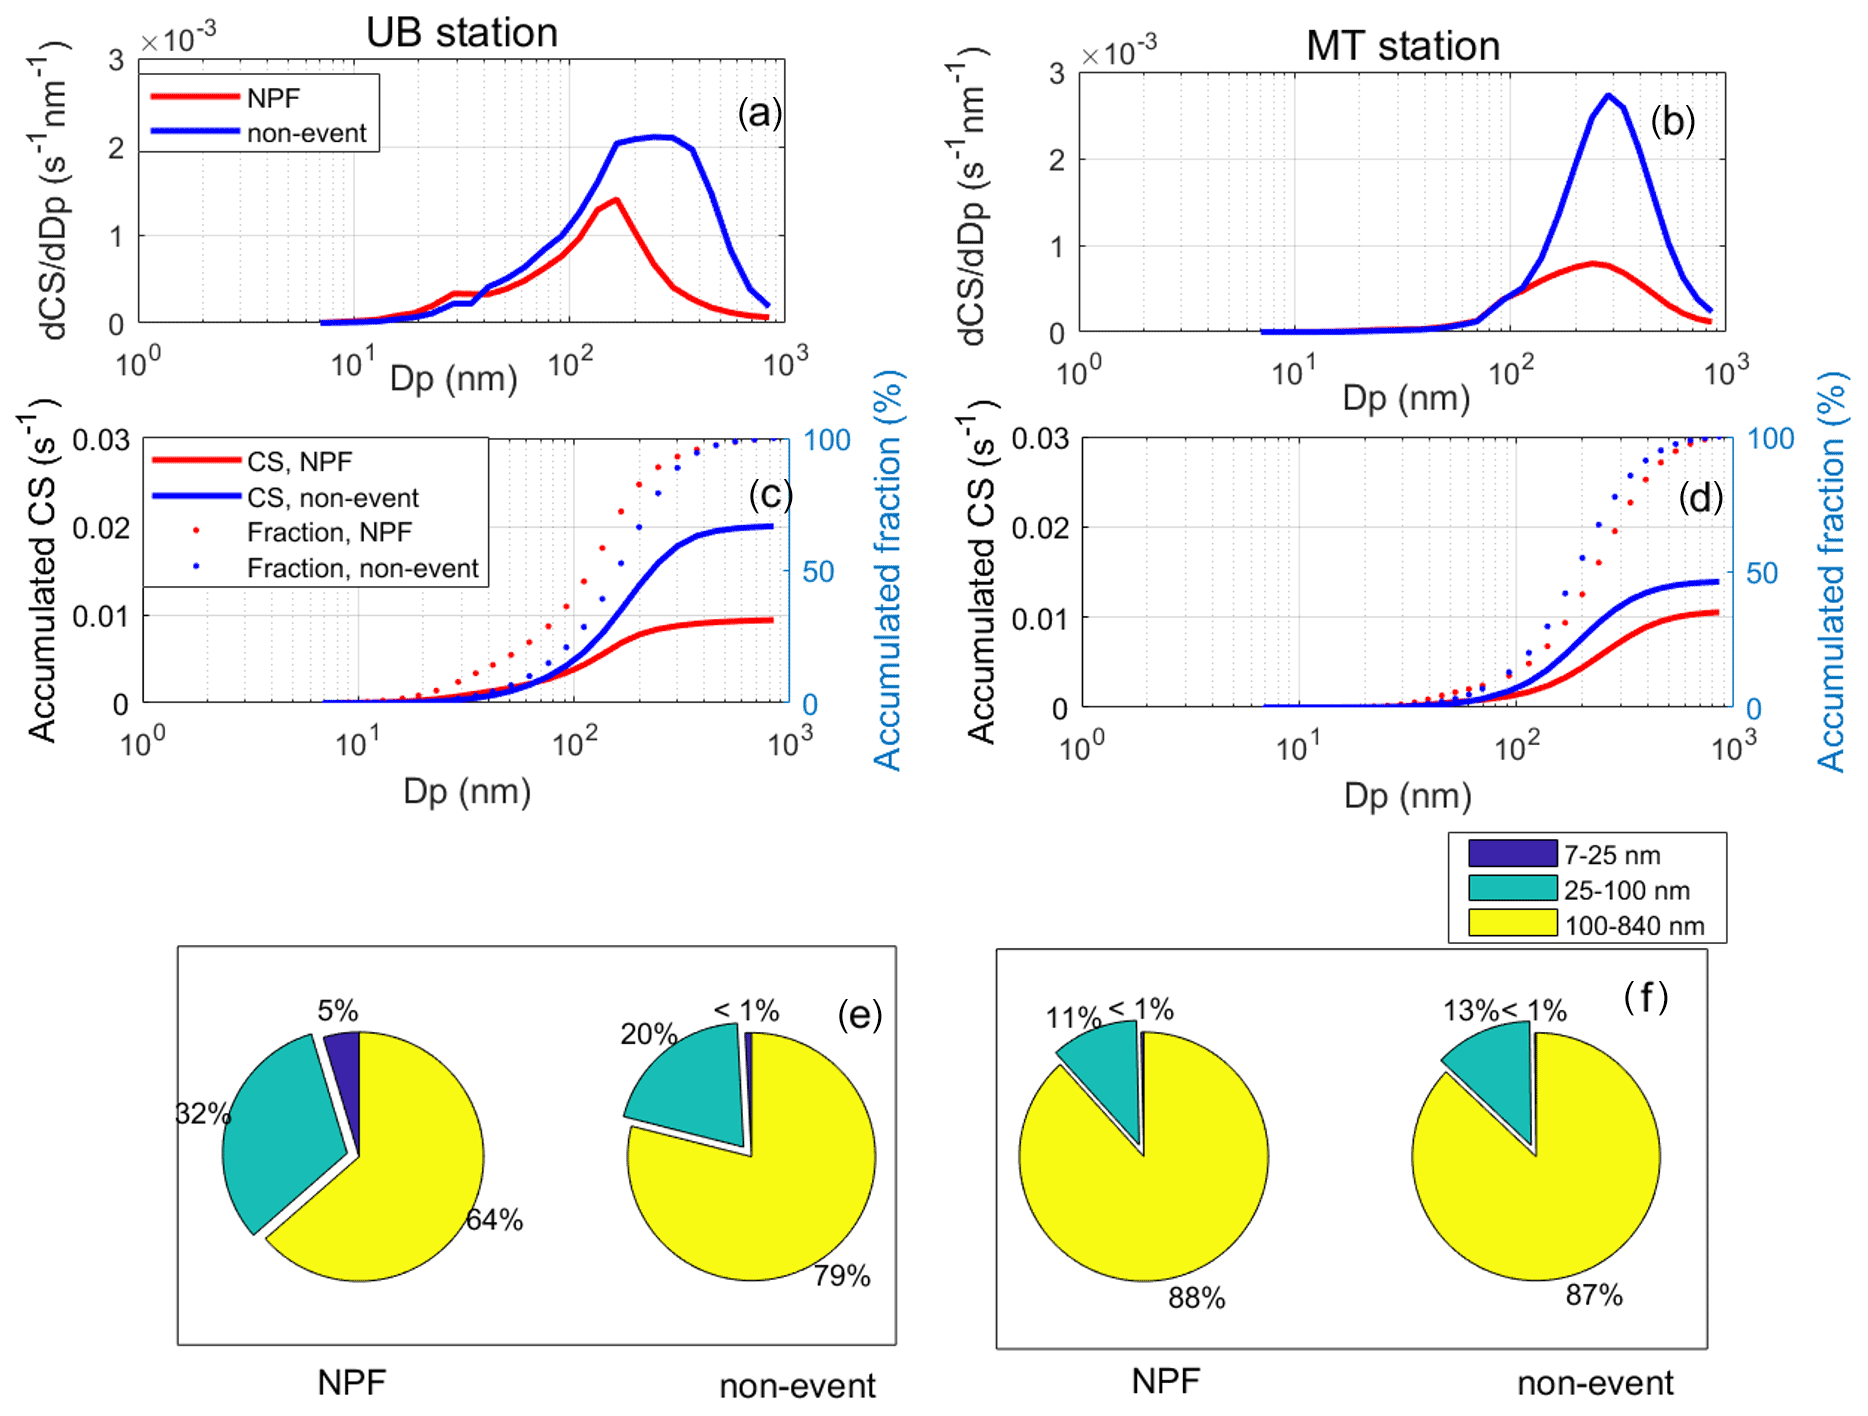
Figure 6Median CS size distribution (a, b), accumulated CS contributed by particles from 6 nm and the ratio between accumulated CS and total CS (c, d). Contribution of size-segregated particles to total CS (e, f) at each site on NPF and non-event days during 09:00–15:00 LT. The left and right panels represent data observed at the UB and MT site, respectively. The time resolutions for CS and particle number concentration data were 8 min at the UB station and 4 min at the MT station, respectively.
2.6 Characteristics of NPF events
2.6.1 Condensation sink
The condensation sink (CS) was calculated from particle size distribution data using the method described by Kulmala et al. (2012):
where D is the diffusion coefficient of the condensing vapor, sulfuric acid in our case; represents the transition-regime correction factor; and is the particle number concentration with diameter . As shown in Fig. 6, particles in the size range of 20–800 nm dominated the total CS at the UB station and particles in the size range of 50–800 nm dominated the total CS at the MT station. Although the size ranges of the DMPS, FMPS and SMPS slightly differ, all of them cover the main size range which constituted the CS, and thus the calculation of CS should not be significantly influenced by differences in the instrument size ranges.
As shown in Fig. 6c and e, on NPF event days, particles smaller than 100 nm built a CS of s−1, contributing 37 % to the total CS. At the MT site, particles smaller than 100 nm only built a CS of s−1, contributing less than 12 % to the total CS (Fig. 6d and f). Although 100–840 nm particle number concentration at the UB site was much less than that at the MT site, 1–100 nm (especially 25–100 nm) particles compensated for the total CS by a higher number concentration on NPF event days (CS at each site will be discussed in Sect. 3.1.2).
The data on rainy days were discarded from analysis at both sites; hence the precipitation was considered to have minor effects on our CS calculation. We calculated CS at both sites, assuming RH to be 0 %. It should be noted that the CS may have been underestimated by a factor of 1.12–1.33 at the MT site when we include RH in the CS calculation, e.g., 30 %–70 % during 09:00–15:00 (local time, LT).
2.6.2 Particle growth rates
Growth rates were calculated for the size range of 7–15 nm (GR7−15 nm) using the 50 % appearance time method introduced by Lehtipalo et al. (2014) and Dada et al. (2020a) according to
where t2 and t1 are the appearance times of particles with sizes of dp2 and dp1, respectively. The appearance time is defined as the time at which the concentration of particles at size dp reaches 50 % of its maximum.
2.6.3 Particle formation rates
The formation rates of particles of diameters 7 nm (J7) were calculated from particle number size distribution data using the method presented by Kulmala et al. (2012) and modified for urban environments by Cai and Jiang (2017):
Here, Jk is the formation rate at size dk (cm−3 s−1; 7 nm in this study), du is the upper size limit of the targeted aerosol population (10 nm in this study), dmin is the smallest particle size detected by particle size spectrometers (to make the results comparable, the dmin was set to 7 nm), is the number concentration of particles from size dk to du (particles with diameters of du are not accounted for), di represents the lower limit of the ith size bin, β(i,g) is the coagulation coefficient for the collision of two particles with a size of di and dg and GRu refers to the growth rate at size du (nm h−1; Deng et al., 2020).
Determination of nucleation start and stop times was affected by traffic emissions at the UB station. Hence, we chose a time window of the first 2 h of NPF event for formation rates calculation at both sites. During the time window, we always observed 7–10 nm particle number concentration burst significantly from the background level at both sites.
3.1 Origin of NPF events at both sites
During our observation in summer 2018 and 2019 (from June to August of each year) at the UB station, there were 155 d with valid data, 53 d of which were classified as NPF event days, corresponding to an NPF event frequency of 34 %. This NPF event frequency was consistent with an earlier observation in summer in urban Beijing from 2004 to 2008, while it was smaller than during other seasons, especially winter during that observation, and another 1-year observation in UB station (Wu et al., 2007; Wang et al., 2013; Deng et al., 2020).
For comparison of NPF characteristics between UB and MT stations, a parallel short-term observation was conducted at the MT station from 14 June to 14 July 2019. In Fig. 2, we show the particle number size distribution and CS during our short-term observations at both stations. There were a total of 12 and 13 NPF events observed at the UB station and the MT station, corresponding to an NPF event frequency of 48 % (12 of 25) and 52 % (13 of 25), respectively. Data were considered valid when visual inspection of the particle number size distribution data and the instrument status did not indicate problems in the measurements. Only days with valid data at both stations were taken into consideration in our analysis. In addition, nine NPF events were observed at both stations on the same day (referred to as common NPF events). Detailed information on the classified NPF event and non-event days, including the formation rates, growth rates and their associated air mass origins during the short-term observation are provided in Table 1.
Table 1NPF event and non-event days during our observation at both stations.

a: NPF event observed at both stations. b: NPF event day at the UB station with a non-event day at the MT station. c: NPF event day at the MT station with a non-event day at the UB station. d: non-event day at both stations on the same day. e: undefined day at both stations. f: undefined day at the UB station with a NPF event day at the MT station. g: undefined day at the MT station with a NPF event day at the UB station. h: undefined day at the UB station with a non-event day at the MT station. *: NPF event observed at the MT station was transported from somewhere else. –: the values cannot be reliably calculated. Only days for which particle number size distribution was valid are included in this table.
In order to understand the conditions favoring NPF events at both stations, we analyzed various ambient parameters, including air mass trajectories, meteorological variables, condensation sink and sulfuric acid concentration.
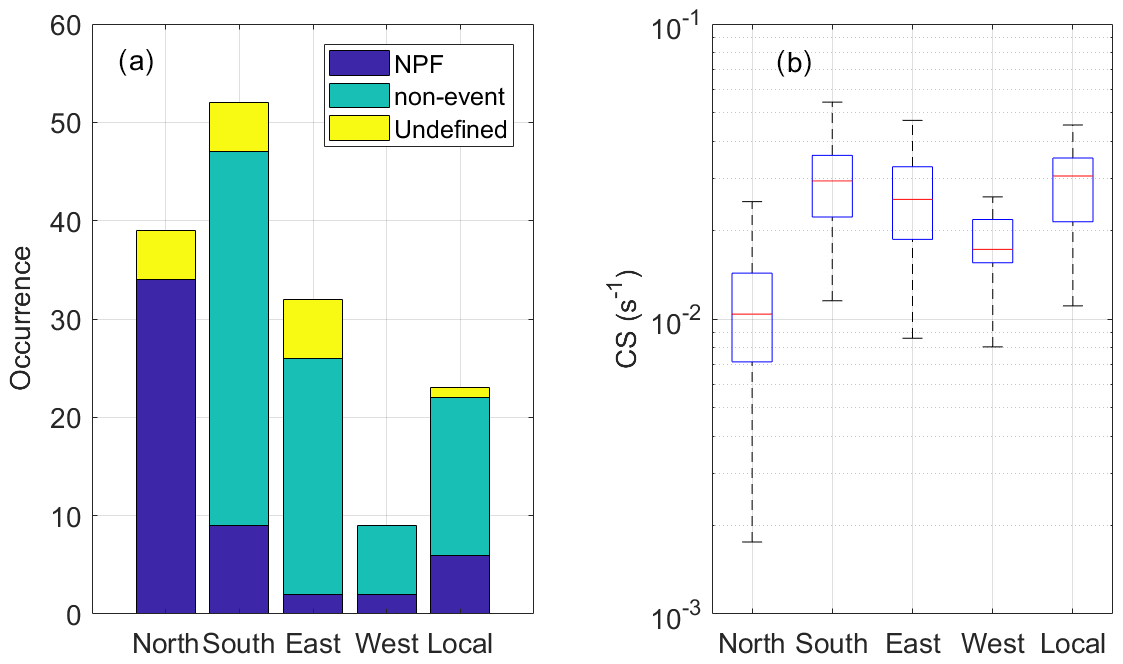
Figure 7Occurrence of NPF events and non-events under air masses arriving from different directions (a) as well as medians and percentiles of condensation sink (CS, s−1) during 09:00–11:00 LT) under different air masses (b) during our observation in summer 2018 and 2019 at the UB station. The red line represents the median of the data, and the lower and upper edges of the box represent 25th and 75th percentiles of the data, respectively. The length of the whiskers represents 1.5 times the interquartile range, which includes 99.3 % of the data. The time resolution of CS was 8 min.
3.1.1 Favorable air mass origin for NPF events at individual locations
In Fig. 7, we show frequencies of air masses arriving at the UB station from different directions during our observation in summer 2018 and 2019. The most frequent air masses arriving at the UB station belonged to the south group. During our observation in the two summers, out of 155 d, 52 d belonged to the south group, and 39, 32, 9 and 23 d in air masses belonged to north, east, west and local groups, respectively. NPF event frequency with respect to air masses is also shown in Fig. 7. It is noticeable that air mass origin influenced the occurrence of NPF events at the UB site as the majority of NPF events occurred when the air masses were coming from the north. During our observation in summer 2018 and 2019, 34 (out of 55) NPF events occurred in air masses from the north group and 9, 2, 2 and 6 NPF events in the south, east, west and local groups, respectively (Fig. 7a). One prominent feature of these air masses is their difference in CS. The CS of the air masses classified as the north group (with median values of 0.01 s−1 at the UB station) is substantially lower than that in other air mass classes (CS = 0.03, 0.025, 0.017 and 0.03 s−1, for south, east, west and local, respectively), which might explain the high NPF event frequency associated with this air mass class. During the observation from 14 June to 14 July in summer 2019, the most frequent air masses arriving at both sites belonged to the north group as shown in Table 1. Out of 25 d, there were 8 and 9 d belonging to the north group, at UB and MT sites, respectively. The highest frequency of NPF events also occurred when the air masses were coming from the north. The high NPF events frequency during our observation from 14 June to 14 July could also be attributed to the frequent air masses arriving at both sites from north to Beijing.
As shown in Table 1, NPF events occurring simultaneously at both sites only happened when air masses arrived at both sites from the same directions, suggesting that most of the observed NPF events took place over the whole studied area, extending for several hundreds of kilometers (Dai et al., 2017; Du et al., 2021). The occurrences of common NPF events also closely connected with air mass origins that seven (out of nine) common NPF events occurred under air masses in the north group, with the other two NPF events in the south group.
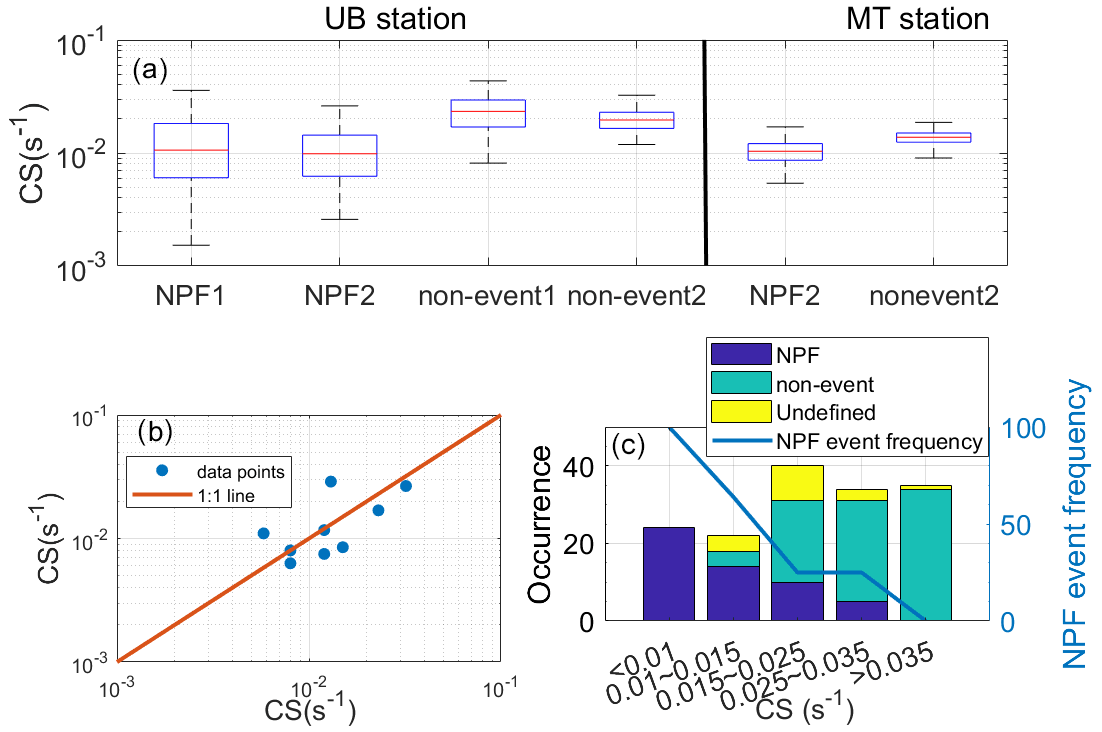
Figure 8(a) Median and percentiles of condensation sink (CS, s−1) during our observations at both stations. “NPF1” and “non-event1” refer to NPF and non-event days during summer 2018 and 2019, while “NPF2” and “non-event2” refer to NPF and non-event days during the short-term parallel observation from 14 June to 14 July 2019 at both sites. The red line represents the median of the data, and the lower and upper edges of the box represent 25th and 75th percentiles of the data, respectively. The length of the whiskers represents 1.5 times the interquartile range, which includes 99.3 % of the data. The time resolution of CS was 8 min. (b) Median CS during the first 2 h of NPF events on common NPF event days measured at both stations (MT vs. UB). (c) Numbers of NPF event, non-event and undefined days as well as NPF event frequency as a function of CS during our observation in summer 2018 and 2019 at the UB station.
3.1.2 The role of condensation sink in NPF event occurrence
Figure 8a shows the difference in CS between NPF event and non-event days during our observation in summer 2018 and 2019 (two whole summers) at the UB site and short-term parallel observations at both sites. “NPF1” and “non-event1” refer to NPF and non-event days during the two whole summers, respectively, while “NPF2” and “non-event2” refer to NPF and non-event days during the short-term parallel observation period from 14 June to 14 July 2019 at both sites, respectively. The longer term periods are used for confirming the representativeness of the short-term overlapping period for the whole summer. As shown in Fig. 8a, the median CS on NPF1 or NPF2 days is equivalent for UB station (CSNPF1=0.010 s−1; CSNPF2=0.009 s−1) and less than a factor of 1.2 different between non-event1 and non-event2 in UB station (CS s−1; CS s−1), which confirms the representativeness of our short-term measurement period of the overall urban Beijing summer.
Our results in Fig. 8a show that the median CS was ∼0.01 s−1 during the first 2 h of the NPF events, at both stations. On common NPF event days, the median CS was 0.009 s−1 at the UB station and ∼0.01 s−1 at the MT station, respectively. In comparison, on non-event days, during roughly the same time period (09:00–11:00 LT), the CS was substantially higher, with median values of 0.02 and 0.014 s−1, at UB and MT stations, respectively. Figure 8b presents the median CS during the first 2 h of NPF events on common NPF event days measured at both stations and shows the high correlation between the two.
Figure 8c shows the NPF event frequency as a function of CS during our observation at the UB site in summer 2018 and 2019 and how the NPF event frequency decreased with increasing CS. When CS was smaller than 0.01 s−1, all days were classified as NPF event days, and when CS was larger than 0.035 s−1, no day was classified as an NPF event day. This shows the major role of background particles in controlling the occurrence or inhibition of NPF events as shown in several previous studies in China and internationally (Deng et al., 2021; Cai et al., 2017; Kulmala et al., 2017). While we cannot present a similar figure from the MT station, the same conclusion applies where CS does play a role in inhibiting NPF observation, owing to the difference in the CS values observed between NPF and non-events at the MT station as shown in Fig. 8a. Yet, since the overall preexisting particle concentration at the MT is rather on the low end, the role of CS might not be as vital at the MT station as at the UB station.
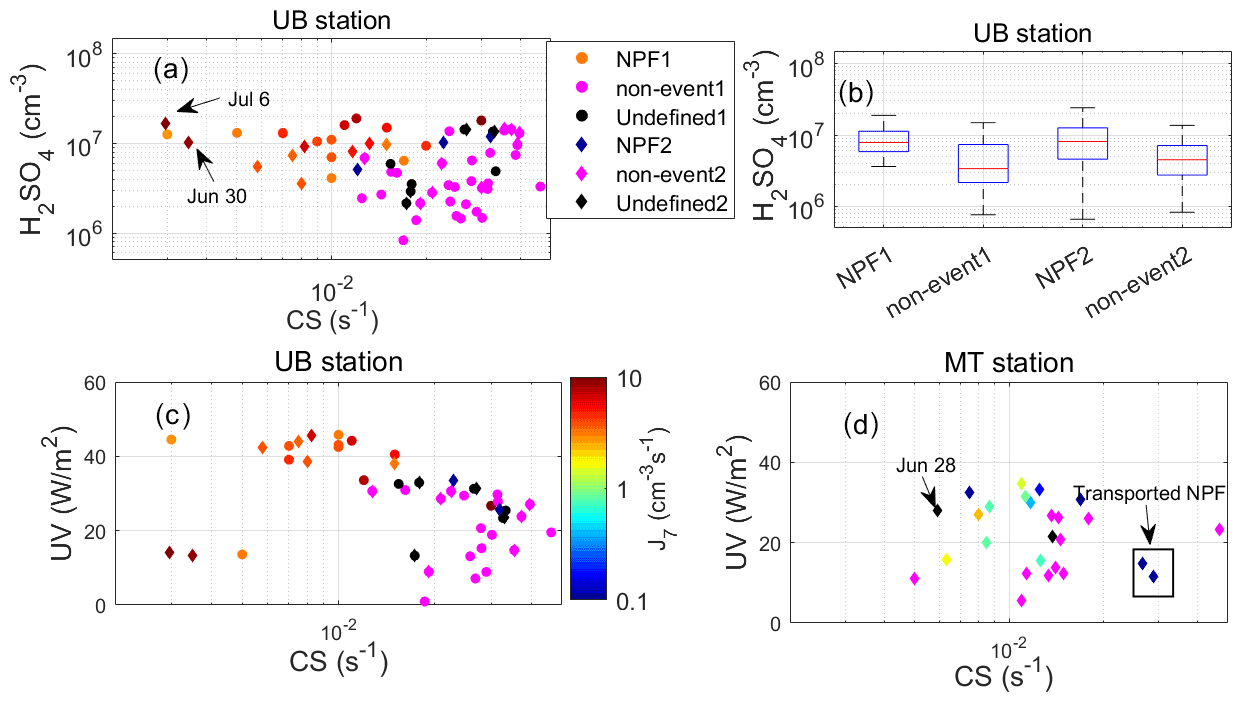
Figure 9(a) Median condensation sink (CS, s−1) and H2SO4 concentration (cm−3) and (b) medians and percentiles of H2SO4 concentration observed at the UB station during the first 2 h of NPF events and 09:00–11:00 on non-event days. (c) Solar radiation (UVA + UVB, W m−2) during the first 2 h of every NPF event and 09:00–11:00 on every non-event day at the UB station. “NPF1” and “non-event1” refer to NPF event and non-event days in summer 2018 and 2019, and “NPF2” and “non-event2” refer to NPF event and non-event days during the observation from 14 June to 14 July 2019. (d) Median condensation sink (CS, s−1) and solar radiation (UVA + UVB, W m−2) during the first 2 h of every NPF event and 09:00–11:00 on every non-event day at the MT station. Transported NPF event cases and 1 non-event day with air masses belonging to west group (28 June) were all pointed out in the figure. The size of data points on NPF event days reflects the formation rate (J7, cm−3 s−1) when it can be calculated reliably. The time resolution of CS was 8 min at the UB station and 4 min at the MT station, respectively. The time resolution was 30 min for H2SO4 data at the UB station and 1 h for UV data at both stations.
Different from NPF events under low CS (<0.01 s−1), these NPF events under high CS were characterized by a relatively high H2SO4 concentration (>107 cm−3) or low formation rates (Fig. 9a), discussed in further details in the coming sections. In comparison, at the MT station, when CS was smaller than ∼0.013 s−1, most (10 out of 14) days were classified as NPF event days as shown in Fig. 9d. When CS was larger than ∼0.013 s−1, we only observed one local NPF event and another two non-local NPF events (Table 1). The local NPF event under high CS at the MT station was characterized as high UV (>30 W m−2) and low formation rate (J7 were too small to be reliably calculated) as well.
3.1.3 Role of meteorological variables in NPF event occurrence
While the air mass source regions and their connection to the CS seem to explain the general picture of NPF event occurrences at the two sites well, we still have some cases unexplained. For example, as shown in Table 1, there were several non-event days observed at the MT station with air masses belonging to north and west groups, which were connected to low CS. This indicates that a further investigation into other NPF-related variables is still required.
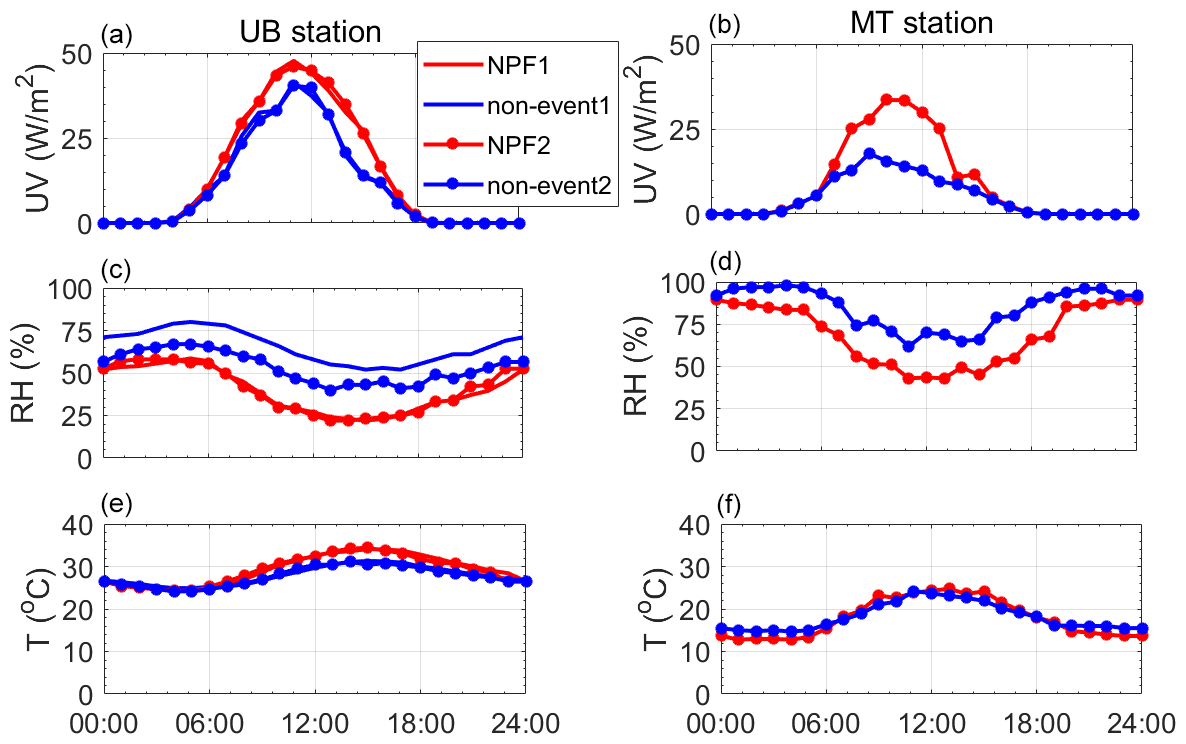
Figure 10(a, b) Diurnal pattern of solar radiation (UV, W m−2), (c, d) Temperature (T, ∘C), and (e, f) Relative humidity (RH, %), at UB (a, c, e) and MT (b, d, f) stations on both NPF event and non-event days. Time resolutions for all data points here were 1 h. `NPF1” and “non-event1” refer to NPF event and non-event days in summer 2018 and 2019, and “NPF2” and “non-event2” refer to NPF event and non-event days during the observation from 14 June to 14 July 2019.
In Fig. 10, we show diurnal variation of meteorological variables during our observation in summer 2018 and 2019 at the UB site and observations from 14 June to 14 July 2019 at UB and MT sites. It is noticeable that the short-term observation compared well with the long-term observation and therefore is representative of summer at the UB site, as shown in Fig. 10.
First, the intensity of solar radiation is considered to be one of the most important parameters deciding NPF event occurrence as it translates into photochemistry strength (Chu et al., 2019). The median UV (UVA + UVB) intensity at the UB station on NPF event and non-event days was 38.3 and 32.9 W m−2, respectively. The UV intensity was on average ∼15 % higher on NPF event days than on non-event days at the UB station. Although UV intensity was important for NPF event occurrence, we still observed NPF events at the UB station under low UV intensity, e.g., cases on 30 June and 6 July. These two events all started immediately after sunrise (06:30 LT on 30 June and 07:00 LT on 6 July; see Table 1) and median UV intensity during the first 2 h of NPF events was only 13.2 and 14.1 W m−2, respectively. However, sulfuric acid concentration was higher than 107 cm−3 at the same time; the possible reason is high SO2 concentration and low CS (∼0.003 s−1) outcompeting the low UV intensity (Dada et al., 2020b), as well as the possibility of having other H2SO4 sources (Yao et al., 2020).
At MT station, the median UV intensity on NPF event and non-event days was 28.4 and 14.2 W m−2, respectively. The lower UV at the MT station in general might be related to the higher RH (Fig. 10c and d) and thus more cloudiness and fog at the MT station (Dada et al., 2018). The UV intensity was on average ∼100 % higher on NPF event days than on non-event days at the UB station. All local NPF events happened when UV intensity was higher than 15 W m−2, as shown in Fig. 9d.
On the other hand, as shown in Fig. 10c and d, the median relative humidity (RH) was lower on NPF event days than non-event days at both stations. This is consistent with earlier results that high RH suppressed NPF events by increasing CS and coagulation sink (CoagS), as it can enhance the particle hygroscopic growth (Hamed et al., 2011). In addition, high RH was also found to be associated with more clouds, resulting in less solar radiation (Dada et al., 2018).
The median temperatures at the UB station on event and non-event days were 31 and 29 ∘C, respectively, and at the MT station 23 and 19 ∘C, respectively. The median temperature was lower at the MT station than at the UB station, due to the higher altitude of the station and likely also the weaker solar radiation (Fig. 10e and f). At both stations, the median temperature was very similar on NPF event and non-event days, suggesting that temperature was not a crucial factor for NPF event occurrence during the measurement in summer.
3.1.4 Role of sulfuric acid concentrations in NPF event occurrence
Sulfuric acid has been found to be the main precursor vapor participating in NPF in China and in many locations around the world due to its low volatility (Yao et al., 2018; Chu et al., 2019). In Fig. 9a, we show the concentration of sulfuric acid as a function of CS during summer 2018 and 2019 at the UB site. As shown in Fig. 9b, the median sulfuric acid (H2SO4) concentrations at the UB station were 8.1×10⁶ and 4.5×106 cm−3 on NPF event days and non-event days, respectively, during observation from 14 June to 14 July 2019 and 7.9×10⁶ and 3.4×106 cm−3 on NPF event days and non-event days, respectively, during the observation in summer 2018 and 2019. This suggests that H2SO4 was important for NPF events at the UB station (Deng et al., 2020; Dada et al., 2020b). On the other hand, as shown in Fig. 9a, the H2SO4 concentration during 09:00–11:00 LT on non-event days could be comparable with that on NPF event days, especially when CS was high. The H2SO4 concentration during 09:00–11:00 LT on non-event days could be comparable with that on NPF event days, especially when CS was high. Altogether, our observation shows that the occurrence of NPF events was controlled by both H2SO4 and CS at the UB station (Cai et al., 2021).
In addition, although we did not perform the measurement of H2SO4 at the MT station, concentration of H2SO4 is expected to be much lower than that at the UB station. First, the SO2 concentration measured at the town of Longquan was always below the detection limit (∼0.5 ppb) during our observation period. In comparison, median SO2 concentration at the UB station was 0.87 ppb for all days and 0.65 ppb for NPF event days during our short-term parallel observation period. The spatial decreasing trend of SO2 concentration from urban Beijing to the west implies a low SO2 concentration at the MT station, especially when the nearby anthropogenic sources are sparse (Liu et al., 2008; Ying et al., 2010; Wang et al., 2011; Yang-Chun et al., 2013). Second, the oxidation of SO2 by photochemistry reactions could also be limited by the low solar radiation at the MT station as we discussed in Sect. 3.1.3. Third, CS, as the main sink of H2SO4, was comparable at the MT station to that in the UB station on NPF event days (as shown in Fig. 8a). Altogether, the lower production rate and the equivalent loss rate of H2SO4 at the MT station likely result in the lower H2SO4 concentration, in comparison to UB station.
Due to the lack of H2SO4 measurements, the NPF mechanism at the MT station cannot be inferred. Nevertheless, we show that the occurrence of NPF is a response to photochemistry (and very likely to H2SO4) and CS in Fig. 9d. It is clear that high UV intensity and low CS favored the occurrence of NPF.
3.2 NPF event start time at both stations
There was no significant difference in NPF event start times between the long-term and short-term parallel observations at the UB site. In this section, we only compare NPF event start times of coincident events at UB and MT sites during the short-term parallel observations.
During our observation period, there was no advection of air masses between the two sites on common NPF event days, indicating that the NPF events occurred at each site independently. As shown in Table 1, all common NPF events started after sunrise and prior to noon, except the two non-local NPF events at the MT station. However, NPF event start time was different between the two sites. Earlier research studies in Nanjing, China, and at Nordic stations showed similar results that NPF events can be observed simultaneously at two or more sites but that the start time can be different, and the local meteorology, source strength and background aerosols could drive temporal behavior of NPF events at each site (Hussein et al., 2009; Dai et al., 2017).
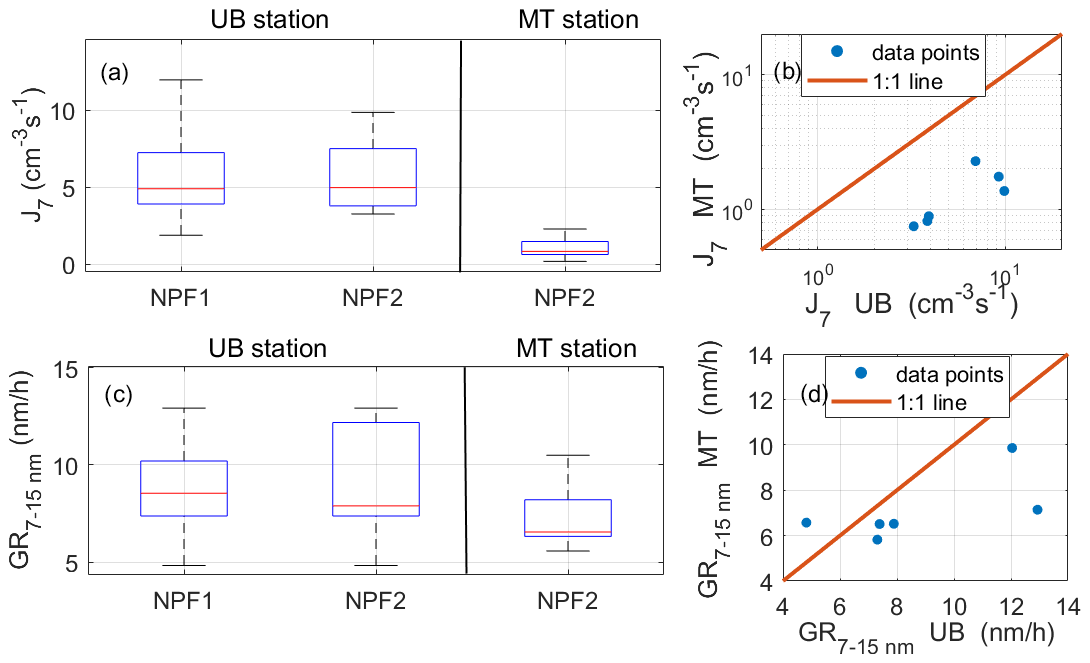
Figure 11Median and percentages of formation rates of 7 nm (J7, cm−3 s−1) (a) and growth rates from 7 to 15 nm (GR6−15 nm, nm h−1) (c) measured at both stations during our observation as well as comparison between J7 (b) and GR6−15 nm (d) of common NPF events. The red line represents the median of the data, and the lower and upper edges of the box represent 25th and 75th percentiles of the data, respectively. The length of the whiskers represents 1.5 times the interquartile range, which includes 99.3 % of the data. “NPF1” and “non-event1” refer to NPF event and non-event days in summer 2018 and 2019, and “NPF2” and “non-event2” refer to NPF event and non-event days during the observation from 14 June to 14 July 2019.
3.3 Particle formation and growth rates at both stations
The formation rate (J7) at the two stations during the measurements is presented in Fig. 11a. J7 observed during the short-term parallel observation (NPF2) at the UB site was in the range of 3.0–10.0 cm−3 s−1 with a median of 5.4 cm−3 s−1, comparable with that observed in summer 2018 and 2019 (NPF1 = 2–14.0 cm−3 s−1 with a median of 4.9 cm−3 s−1) and significantly higher than the values in the MT station (0.75–3.0 cm−3 s−1 with a median of 0.82 cm−3 s−1) for common NPF events (Fig. 11b). These values are comparable to earlier observations in urban Beijing and another regional background station in the North China Plain (NCP) (Wang et al., 2013). Earlier observations in the NCP and the Yangtze River Delta also show higher formation rates at urban sites than corresponding background sites by roughly a factor of 2 due to lower anthropogenic emissions at background sites (Wang et al., 2013; Dai et al., 2017; Shen et al., 2018). The much lower J7 observed at the MT station is very likely associated with the low H2SO4 concentration at this station, as we discussed above. However, other reasons, such as the low concentration of H2SO4 stabilizers, e.g., amines, cannot be ruled out either. Also, the J7 at the UB station could be affected by particle emissions due to the proximity of the location to the highway, while compared with NPF events, the effect of traffic emissions is shown to be minor (Kontkanen et al., 2020; Zhou et al., 2020). In addition, Boulon et al. (2011) observed that new particles could be formed at low altitude and transported to the higher altitude sites; however, to confirm whether this phenomenon can happen at the MT site, we still need observation on vertical wind conditions or vertical evolution of potential temperature.
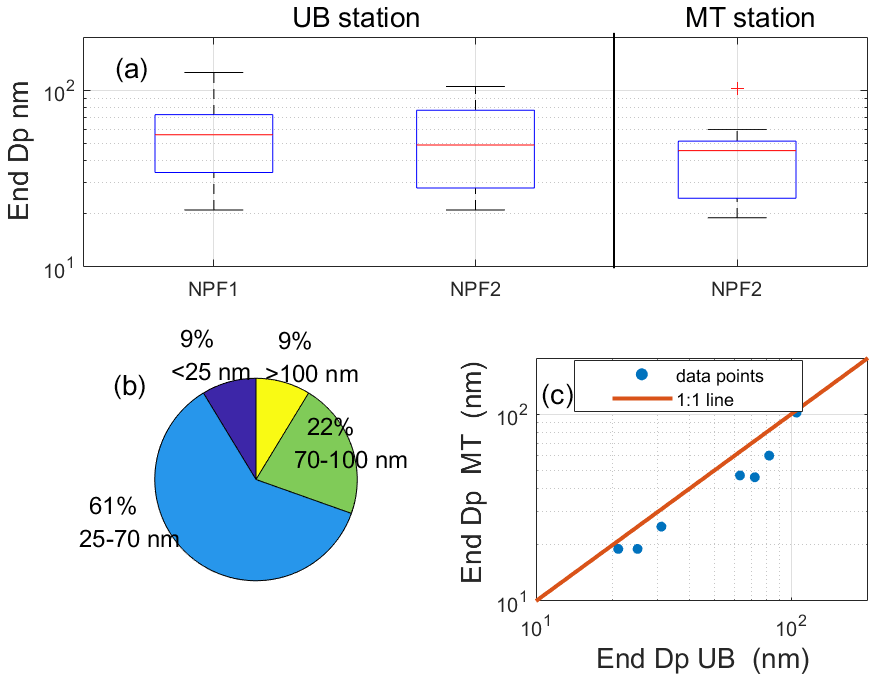
Figure 12(a) Median and percentiles of end diameters (End Dp; nm) of NPF events measured at both sites. The red line represents the median of the data, and the lower and upper edges of the box represent 25th and 75th percentiles of the data, respectively. The length of the whiskers represents 1.5 times the interquartile range, which includes 99.3 % of the data. “NPF1” and “non-event1” refer to NPF event and non-event days in summer 2018 and 2019, and “NPF2” and “non-event2” refer to NPF event and non-event days during the observation from 14 June to 14 July 2019. (b) Frequencies of end diameters in the size range of smaller than 25, 25–70, 70–100 nm and above 100 nm during our observation at the UB station in summer 2018 and 2019. (c) Comparison between end diameters of common NPF events at both stations.
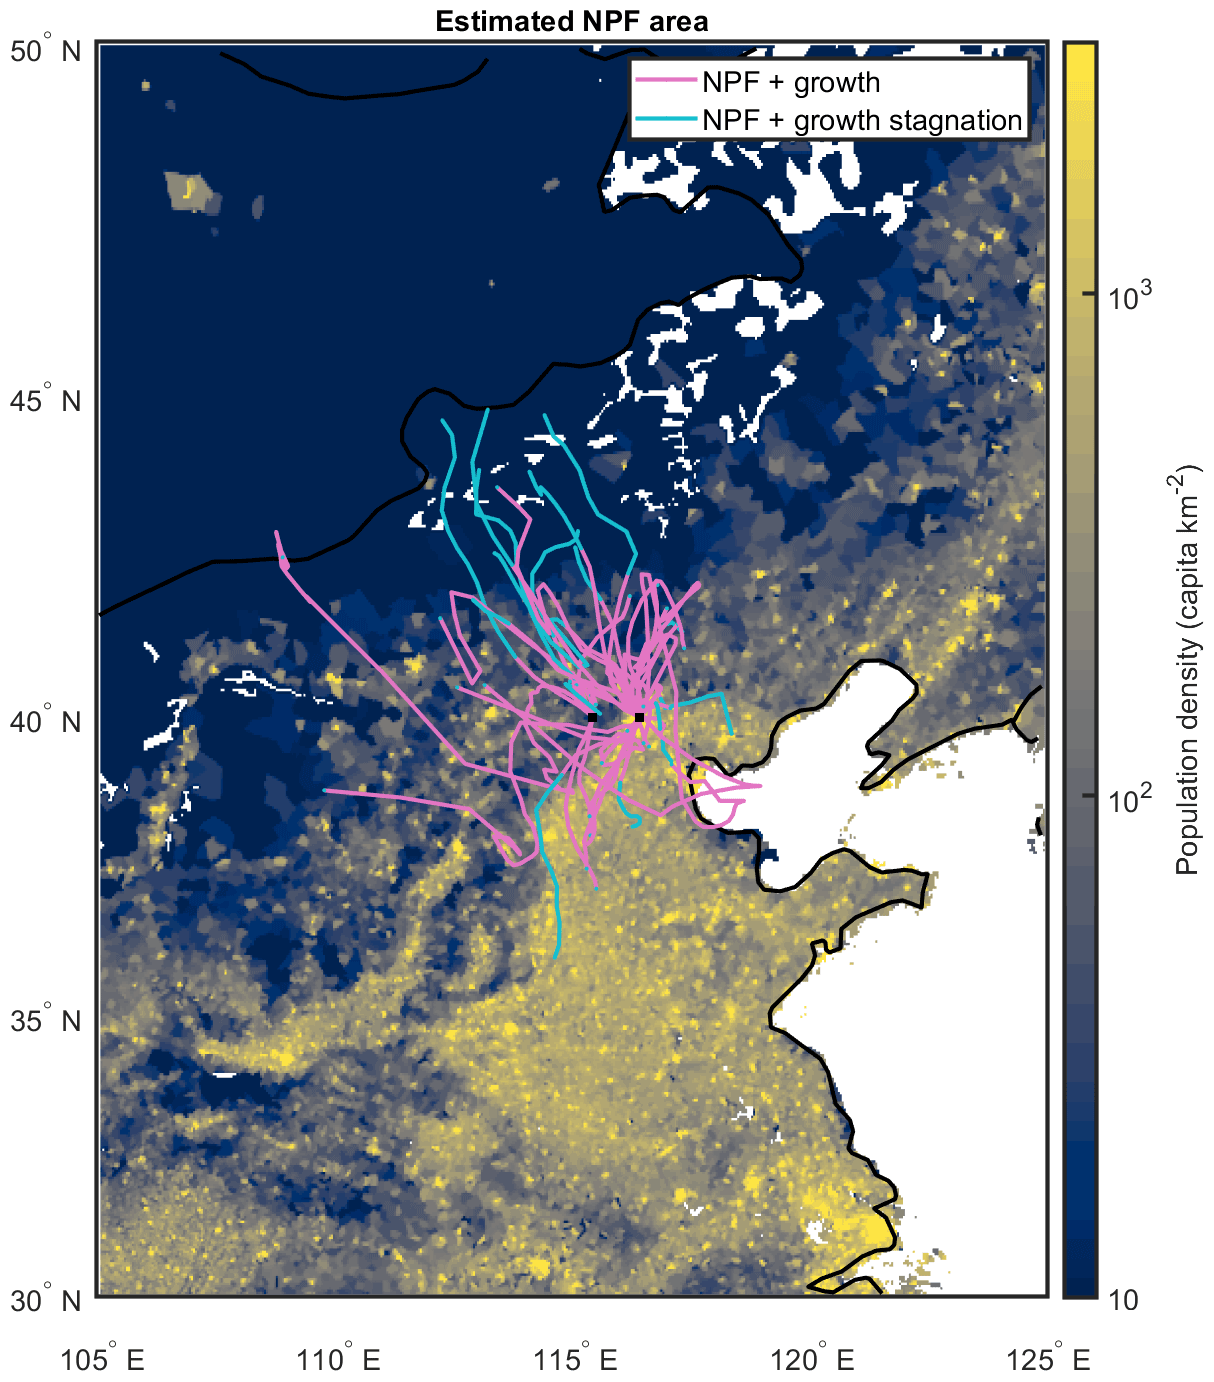
Figure 13Spatial extent of the area where new particle formation events are estimated to have taken place based on air mass back trajectories and the observed NPF events at both sites. Each line represents a single NPF event and extends to the point beyond which continuation of the mode formed in an NPF event was no longer observed at the measurement site. In other words, if an air mass is located outside the area roughly outlined by the colored lines during the typical onset time of NPF and then transported to our measurement sites, NPF is unlikely to have occurred in said air mass. The lines change color from pink to light blue if the observed NPF event enters a stage of growth stagnation, which can indicate a less favorable environment for the formation and growth of new particles. The lines are overlaid on top of a population density map (Gridded Population of the World; GPWv4.10; CC-BY 4.0), which is used to illustrate the level of anthropogenic activities and emissions.
The growth rate in the size range of 7–15 nm (GR7−15 nm) at the UB station (4.8–12.9 nm h−1 with a median of 7.8 nm h−1) during NPF2 was also comparable with the whole summers (NPF1) (4.8–12.9 nm h−1 with a median of 8.5 nm h−1). While the difference in J7 was 7 times higher in UB than in MT, the observed GR was only slightly higher at the UB station than at the MT station (5.7–10.5 nm h−1 with a median of 6.5 nm h−1) for common NPF events (Fig. 11c and d), implying that precursors needed for particle formation were much more abundant in the polluted urban environment (Wang et al., 2013), while those needed for growth are rather comparable. The GR at the UB station was comparable to another long-term observation at the UB station (1.1–8.0 nm h−1) in 2018 and other urban areas in China (Herrmann et al., 2014; Chu et al., 2019; Deng et al., 2020). Consistent with earlier observations showing that H2SO4 could only contribute to a small fraction of the particle growth in this size range (Paasonen et al., 2018; Qi et al., 2018; Guo et al., 2020), the growth rates at both stations cannot be explained by the H2SO4 concentration. This implies that other condensable species, very likely low-volatility organic vapors, play an important role in particle growth at both stations. At the UB station, anthropogenic volatile organic compounds (VOCs) are dominant precursors of these low-volatility organic vapors (Guo et al., 2020; Deng et al., 2021), while VOCs at the MT station, with rare anthropogenic sources, are likely dominated by biogenic emissions.

Figure 14Median particle number size distribution as well as CS (blue lines) on NPF event and non-event days at UB (a, b) and MT (c, d) stations and median and percentiles of nucleation- (e), Aitken- (f) and accumulation-mode (g) particle number concentration on NPF event and non-event days during our observation from 14 June to 14 July 2019 at both stations. The red line represents the median of the data, and the lower and upper edges of the box represent 25th and 75th percentiles of the data, respectively. The length of the whiskers represents 1.5 times the interquartile range, which includes 99.3 % of the data. Data outside the whiskers are considered outliers and are marked with red crosses.
3.4 Ending diameters of newly formed grown particles
Earlier observations have shown that diameters of newly formed particles should be larger than 70 nm to contribute to cloud condensation nuclei significantly (Man et al., 2015; Ma et al., 2021) and will be considered as haze particles when their size reaches larger than 100 nm (Kulmala et al., 2021). In Fig. 12, we show ending diameters (End Dp) of newly formed grown particles during our observations at both sites. End Dp during the observation from 14 June to 14 July at the UB site (21–105 nm, with a median of 49 nm; Fig. 12a) had similar characteristics to those during the long-term observation in summer (21–126 nm, with a median of 56 nm; Fig. 12a), where most End Dp values were in the range of 25–70 nm. As shown in Fig. 12b, 61 % of End Dp values were in the range of 25–70 nm, and only 9 % of End Dp values were larger than 100 nm during our observation in summer 2018 and 2019 at the UB site. We found that the ending diameters are slightly higher at the UB site than the MT site, but the difference is not significant (49 vs. 45 nm), as shown in Fig. 12c.
Earlier research has pointed out that in order to observe particle growth up to 100 nm at a measurement station under typical conditions, simultaneous NPF should happen over a very large area (e.g., with wind speed 5 m s−1 and growth rate of 3 nm h−1 from the station to roughly 600 km upwind from the station) (Paasonen et al., 2018). During our observation in summer 2018 and 2019, most of the newly formed modes kept growing for about 20 h after an NPF event started, and the maximum horizontal extension of the observed NPF events in the growth stage is restricted to within about 200 km (∼2∘ in latitude) north of UB site (Fig. 13). As shown in Fig. 13, the population density is also higher within the area extending ∼200 km north than beyond this limit. Therefore, it seems that NPF events were limited to the regions with some contribution from anthropogenic emissions during air mass transport from areas north of Beijing. Roughly similar extent of the NPF area is also seen in other directions. However, towards the south, it is more likely that increasing condensation sink from accumulating pollution becomes the limiting factor for NPF occurrence rather than decreasing strength in emission sources. NPF events at the MT station had similar characteristics as those at the UB station, with the NPF event region extending a few hundred kilometers towards the north. The NPF events in this direction were disrupted after a relatively similar distance (or they enter the growth stagnation phase). The limited NPF event area could possibly explain why most End Dp values we observed were smaller than 70 nm.
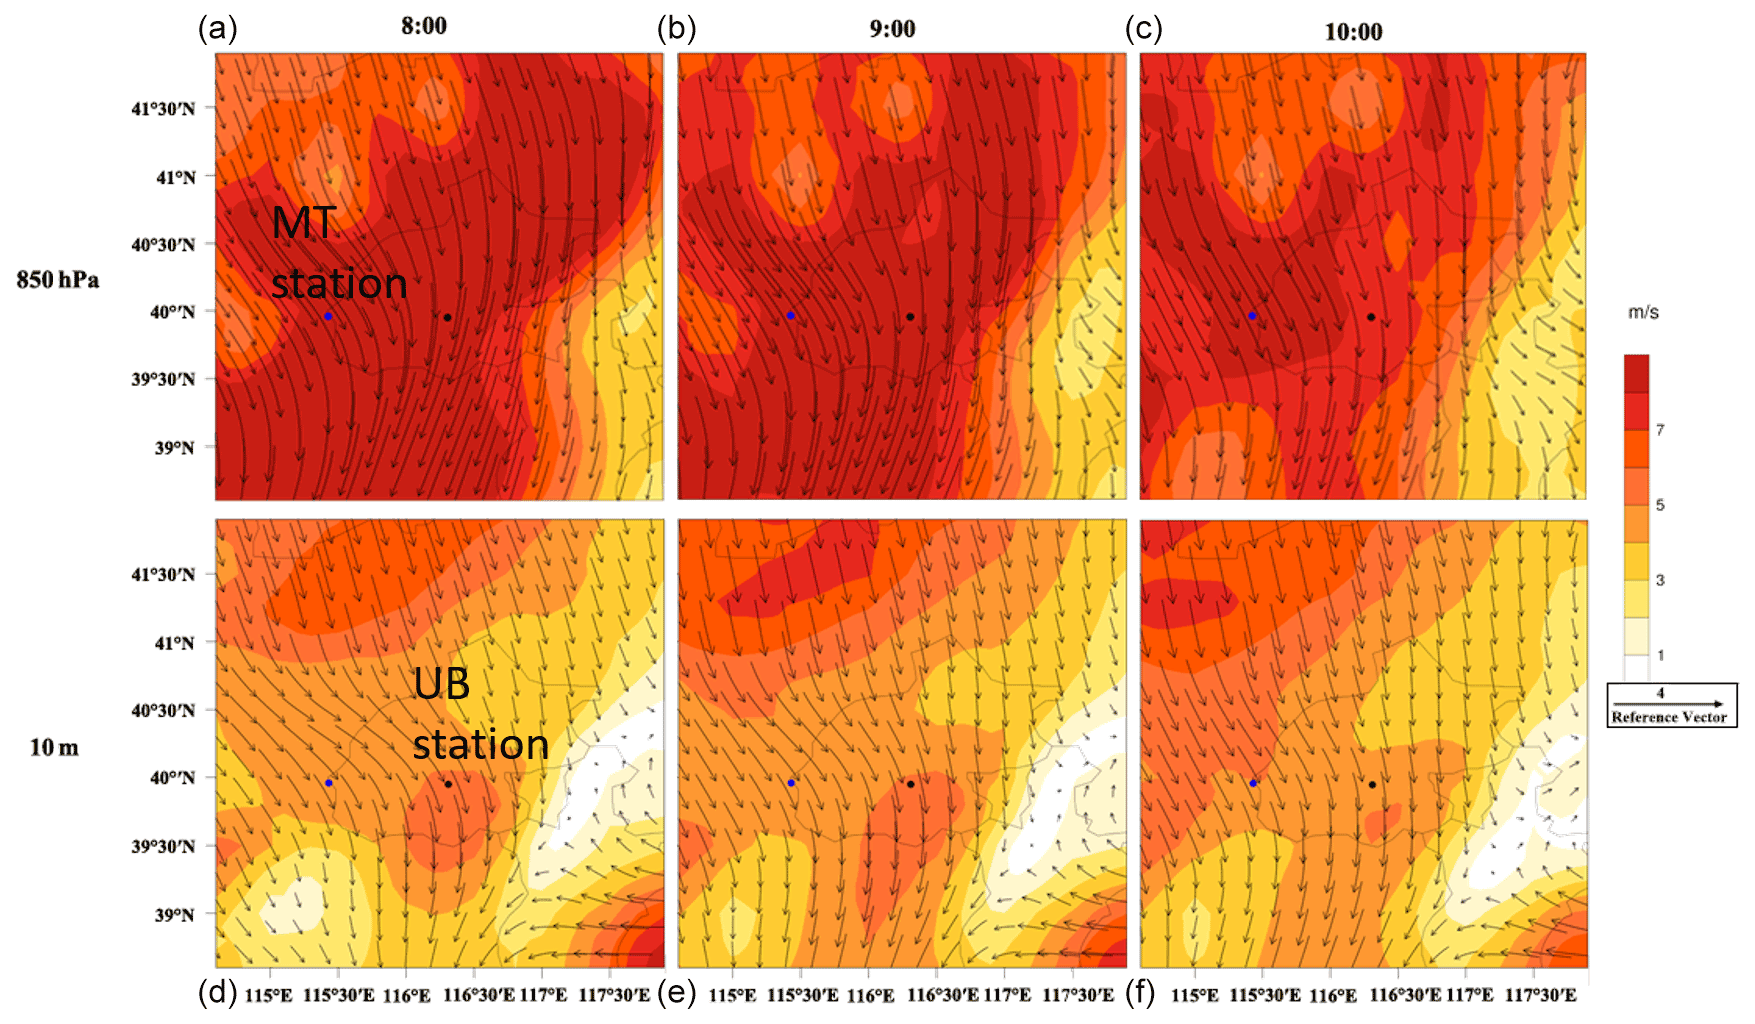
Figure 15Wind distribution at 08:00, 09:00 and 10:00 on 30 June 2019 at 10 m above ground level (d–f) and 850 hPa (close to the altitude of MT station, a–c). The blue and black points on the figures represent MT and UB stations, respectively.
3.5 Effect of topography
In Fig. 14, we show average particle number size distributions and particle number concentrations on NPF event and non-event days during our short-term parallel observation at both sites. On NPF event days, nucleation-mode (6–25 nm) and Aitken-mode (25–100 nm) particle number concentrations were much smaller at the MT station than those at the UB station due to smaller formation rates and fewer anthropogenic emissions. Interestingly, accumulation-mode (100–840 nm) particle number concentrations were higher at the MT station (701–2900 cm−3, with a median of 1500 cm−3) than those at the UB station (350–1416 cm−3 with a median of 700 cm−3) (Fig. 14b). Due to the close proximity of the two measurement sites, the air mass arrival directions and source regions were (mostly) similar at both sites throughout the measurement period; hence the regional and transported air masses cannot explain the higher accumulation-mode particle number concentration at the MT site. As there were few primary emissions at the MT site, the accumulation-mode particles could be attributed to secondary particles (Kulmala et al., 2021), indicating particles at the MT station were more aged than those at the UB station (Fig. 14a). The possible reasons is that mountains block pollution diffusion, which in the end resulted in a comparable CS at the MT station as UB station.
Figure 15 shows an example of the wind distribution before and during an NPF event on 30 June 2019 at 850 hPa (close to the altitude of MT station) and 10 m above ground level. As shown in Fig. 15, the reanalyzed wind directions at 850 hPa were similar to those at 10 m above ground level at the MT station. Actually, the wind conditions on other NPF event days at the MT station during our observation had similar characteristics that the wind directions were similar between 850 hPa and 10 m above ground level, indicating air masses were well mixed during NPF events. Earlier observations also found that NPF events happened uniformly within the mixing layer at their observation stations and that particle number size distribution remains roughly constant within the mixing layer (Shen et al., 2018; Lampilahti et al., 2021).
We conducted observations of NPF events at an urban site (UB) and a background mountain site (MT) in Beijing and fully analyzed the favorable conditions for NPF event occurrences at each of the sites. In order to identify the similarities and differences between NPF events at both stations in terms of frequency and intensity, we compared certain NPF events' characteristics, including formation rate, growth rate and NPF event start time, as well as ending diameters of newly formed growing particles at both stations. We found that NPF events are most of the time a regional phenomenon occurring over the studied areas and connected closely with air mass source regions during our observation. The air masses from the north favored common NPF events more than any other mass trajectories due to their associated clean air masses and thus low CS. Additionally, air masses from the north group always resulted in an NPF event at the UB station, while other factors still suppressed their occurrence at the MT station. For example, we found that sufficiently high solar radiation, e.g., UV (UVA + UVB) intensity larger than 15 W m−2, is required for an NPF event to occur at the MT station, and NPF events observed under solar radiation conditions smaller than 15 W m−2 were rather transported NPF events from areas upwind of the MT station. Moreover, we found that the CS limit for NPF event occurrence at the UB station was ∼0.032 s−1, which is consistent with earlier observations in urban Beijing. In comparison, at the MT station the CS limit could be ∼0.013 s−1, above which local NPF events could possibly be suppressed, associated with the lower SO2 concentration.
Although NPF events could happen simultaneously at both stations, the NPF event strength (formation rates) was significantly higher at the UB station than the MT station, possibly due to spatial inhomogeneity in the sources of aerosol precursor compounds as well as solar radiation. In addition, the growth rates in size range of 7–15 nm were also slightly higher at the UB station than the MT station. Regional NPF events were observed to occur with the horizontal extent within around 200 km when air masses arrived at Beijing from the north; as a result, only a few NPF events were observed to end with mode diameters larger than 70 nm. The upwind extension of regional NPF events was limited to the areas with some anthropogenic emissions. There should not be any discrete boundary between the regions in which an NPF event is or is not occurring, but with decreasing anthropogenic emissions, the strength (formation rates and growth rates) should decrease. Overall, our results highlight the importance of anthropogenic emissions in NPF event occurrence and subsequently growth in the North China Plain during summer. However, there are still some uncertainties due to the limited data set. For more robust knowledge on NPF events in the North China Plain, and to figure out the effect of urban emissions on regional NPF events, we still need long-term observations, including particle number size distribution down to sub-3 nm and gas- and particle-phase chemistry upwind and downwind of urban Beijing. Such observations can shed light on the regionality of NPF events and the dynamical development of the aerosol population influenced by radical chemistry in the plume of a megacity.
The data displayed in this paper are available online at https://doi.org/10.5281/zenodo.5644694 (Dada and Zhou, 2021).
YZ, CY, YG and XY performed the measurements. YZ, SH, CY, YG, LD and XY analyzed the data. YZ, CY, SH and LD wrote the manuscript. All authors reviewed the paper and contributed to the scientific discussions.
The contact author has declared that neither they nor their co-authors have any competing interests.
The sole
responsibility of this publication lies with the author. The European Union
is not responsible for any use that may be made of the information contained
therein.
Publisher's note: Copernicus Publications remains neutral with regard to jurisdictional claims in published maps and institutional affiliations.
This publication has been produced within the framework
of the EMME-CARE project, which has received funding from the European
Union's Horizon 2020 Research and Innovation Programme (grant
no. 856612) and the Government of Cyprus. This research has also
received funding from the European Commission (ERC-ATM-GTP (grant no. 742206)), as well as the Academy of Finland (project nos. 316114 and 311932).
Simo Hakala received financial support from the doctoral programme in Atmospheric Sciences
(ATM-DP, University of Helsinki).
Open-access funding was provided by the Helsinki University Library.
This paper was edited by Fangqun Yu and reviewed by three anonymous referees.
Boulon, J., Sellegri, K., Hervo, M., Picard, D., Pichon, J.-M., Fréville, P., and Laj, P.: Investigation of nucleation events vertical extent: a long term study at two different altitude sites, Atmos. Chem. Phys., 11, 5625–5639, https://doi.org/10.5194/acp-11-5625-2011, 2011.
Cai, R. and Jiang, J.: A new balance formula to estimate new particle formation rate: reevaluating the effect of coagulation scavenging, Atmos. Chem. Phys., 17, 12659–12675, https://doi.org/10.5194/acp-17-12659-2017, 2017.
Cai, R., Yang, D., Fu, Y., Wang, X., Li, X., Ma, Y., Hao, J., Zheng, J., and Jiang, J.: Aerosol surface area concentration: a governing factor in new particle formation in Beijing, Atmos. Chem. Phys., 17, 12327–12340, https://doi.org/10.5194/acp-17-12327-2017, 2017.
Cai, R., Yan, C., Yang, D., Yin, R., Lu, Y., Deng, C., Fu, Y., Ruan, J., Li, X., Kontkanen, J., Zhang, Q., Kangasluoma, J., Ma, Y., Hao, J., Worsnop, D. R., Bianchi, F., Paasonen, P., Kerminen, V.-M., Liu, Y., Wang, L., Zheng, J., Kulmala, M., and Jiang, J.: Sulfuric acid–amine nucleation in urban Beijing, Atmos. Chem. Phys., 21, 2457–2468, https://doi.org/10.5194/acp-21-2457-2021, 2021.
Carnerero, C., Pérez, N., Reche, C., Ealo, M., Titos, G., Lee, H.-K., Eun, H.-R., Park, Y.-H., Dada, L., Paasonen, P., Kerminen, V.-M., Mantilla, E., Escudero, M., Gómez-Moreno, F. J., Alonso-Blanco, E., Coz, E., Saiz-Lopez, A., Temime-Roussel, B., Marchand, N., Beddows, D. C. S., Harrison, R. M., Petäjä, T., Kulmala, M., Ahn, K.-H., Alastuey, A., and Querol, X.: Vertical and horizontal distribution of regional new particle formation events in Madrid, Atmos. Chem. Phys., 18, 16601–16618, https://doi.org/10.5194/acp-18-16601-2018, 2018.
Casquero-Vera, J. A., Lyamani, H., Dada, L., Hakala, S., Paasonen, P., Román, R., Fraile, R., Petäjä, T., Olmo-Reyes, F. J., and Alados-Arboledas, L.: New particle formation at urban and high-altitude remote sites in the south-eastern Iberian Peninsula, Atmos. Chem. Phys., 20, 14253–14271, https://doi.org/10.5194/acp-20-14253-2020, 2020.
Chu, B., Kerminen, V.-M., Bianchi, F., Yan, C., Petäjä, T., and Kulmala, M.: Atmospheric new particle formation in China, Atmos. Chem. Phys., 19, 115–138, https://doi.org/10.5194/acp-19-115-2019, 2019.
Chu, B., Dada, L., Liu, Y., Yao, L., Wang, Y., Du, W., Cai, J., Daellenbach, K., Chen, X., Simonen, P., Zhou, Y., Deng, C., Fu, Y., Yin, R., Li, H., He, X.-C., Feng, Z., Yan, C., Kangasluoma, J., and Kulmala, M.: Particle growth with photochemical age from new particle formation to haze in the winter of Beijing, China, Sci. Total Environ., 753, 142207, https://doi.org/10.1016/j.scitotenv.2020.142207, 2021.
Dada, L. and Zhou, Y.: Calculated parameters related to new particle formation events at an urban and a mountain station in Northern China, Zenodo [data set], https://doi.org/10.5281/zenodo.5644694, 2021.
Dada, L., Paasonen, P., Nieminen, T., Buenrostro Mazon, S., Kontkanen, J., Peräkylä, O., Lehtipalo, K., Hussein, T., Petäjä, T., Kerminen, V.-M., Bäck, J., and Kulmala, M.: Long-term analysis of clear-sky new particle formation events and nonevents in Hyytiälä, Atmos. Chem. Phys., 17, 6227–6241, https://doi.org/10.5194/acp-17-6227-2017, 2017.
Dada, L., Chellapermal, R., Buenrostro Mazon, S., Paasonen, P., Lampilahti, J., Manninen, H. E., Junninen, H., Petäjä, T., Kerminen, V.-M., and Kulmala, M.: Refined classification and characterization of atmospheric new-particle formation events using air ions, Atmos. Chem. Phys., 18, 17883–17893, https://doi.org/10.5194/acp-18-17883-2018, 2018.
Dada, L., Lehtipalo, K., Kontkanen, J., Nieminen, T., Baalbaki, R., Ahonen, L., Duplissy, J., Yan, C., Chu, B., Petäjä, T., Lehtinen, K., Kerminen, V.-M., Kulmala, M., and Kangasluoma, J.: Formation and growth of sub-3-nm aerosol particles in experimental chambers, Nat. Protoc., 15, 1013–1040, https://doi.org/10.1038/s41596-019-0274-z, 2020a.
Dada, L., Ylivinkka, I., Baalbaki, R., Li, C., Guo, Y., Yan, C., Yao, L., Sarnela, N., Jokinen, T., Daellenbach, K. R., Yin, R., Deng, C., Chu, B., Nieminen, T., Wang, Y., Lin, Z., Thakur, R. C., Kontkanen, J., Stolzenburg, D., Sipilä, M., Hussein, T., Paasonen, P., Bianchi, F., Salma, I., Weidinger, T., Pikridas, M., Sciare, J., Jiang, J., Liu, Y., Petäjä, T., Kerminen, V.-M., and Kulmala, M.: Sources and sinks driving sulfuric acid concentrations in contrasting environments: implications on proxy calculations, Atmos. Chem. Phys., 20, 11747–11766, https://doi.org/10.5194/acp-20-11747-2020, 2020b.
Dai, L., Wang, H., Zhou, L., An, J., Tang, L., Lu, C., Yan, W., Liu, R., Kong, S., Chen, M., Lee, S., and Yu, H.: Regional and local new particle formation events observed in the Yangtze River Delta region, China, J. Geophys. Res.-Atmos., 122, 2389–2402, https://doi.org/10.1002/2016jd026030, 2017.
Dal Maso, M., Kulmala, M., Riipinen, I., Wagner, R., Hussein, T., Aalto, P. P., and Lehtinen, K. E. J.: Formation and growth of fresh atmospheric aerosols: eight years of aerosol size distribution data from SMEAR II, Hyytiala, Finland, Boreal Environ. Res., 10, 323–336, 2005.
Deng, C., Fu, Y., Dada, L., Yan, C., Cai, R., Yang, D., Zhou, Y., Yin, R., Lu, Y., Li, X., Qiao, X., Fan, X., Nie, W., Kontkanen, J., Kangasluoma, J., Chu, B., Ding, A., Kerminen, V. M., Paasonen, P., Worsnop, D. R., Bianchi, F., Liu, Y., Zheng, J., Wang, L., Kulmala, M., and Jiang, J.: Seasonal Characteristics of New Particle Formation and Growth in Urban Beijing, Environ. Sci. Technol., 54, 8547–8557, https://doi.org/10.1021/acs.est.0c00808, 2020.
Deng, C., Cai, R., Yan, C., Zheng, J., and Jiang, J.: Formation and growth of sub-3 nm particles in megacities: impact of background aerosols, Faraday Discuss., 226, 348–363, https://doi.org/10.1039/D0FD00083C, 2021.
Du, W., Dada, L., Zhao, J., Chen, X., Daellenbach, K. R., Xie, C., Wang, W., He, Y., Cai, J., Yao, L., Zhang, Y., Wang, Q., Xu, W., Wang, Y., Tang, G., Cheng, X., Kokkonen, T. V., Zhou, W., Yan, C., Chu, B., Zha, Q., Hakala, S., Kurppa, M., Järvi, L., Liu, Y., Li, Z., Ge, M., Fu, P., Nie, W., Bianchi, F., Petäjä, T., Paasonen, P., Wang, Z., Worsnop, D. R., Kerminen, V.-M., Kulmala, M., and Sun, Y.: A 3D study on the amplification of regional haze and particle growth by local emissions, Climate Atmos. Sci., 4, 4, https://doi.org/10.1038/s41612-020-00156-5, 2021.
Ehn, M., Thornton, J. A., Kleist, E., Sipila, M., Junninen, H., Pullinen, I., Springer, M., Rubach, F., Tillmann, R., Lee, B., Lopez-Hilfiker, F., Andres, S., Acir, I.-H., Rissanen, M., Jokinen, T., Schobesberger, S., Kangasluoma, J., Kontkanen, J., Nieminen, T., Kurten, T., Nielsen, L. B., Jorgensen, S., Kjaergaard, H. G., Canagaratna, M., Maso, M. D., Berndt, T., Petaja, T., Wahner, A., Kerminen, V.-M., Kulmala, M., Worsnop, D. R., Wildt, J., and Mentel, T. F.: A large source of low-volatility secondary organic aerosol, Nature, 506, 476–479, 2014.
Gao, Y., Zhang, D., Wang, J., Gao, H., and Yao, X.: Variations in Ncn and Nccn over marginal seas in China related to marine traffic emissions, new particle formation and aerosol aging, Atmos. Chem. Phys., 20, 9665–9677, https://doi.org/10.5194/acp-20-9665-2020, 2020.
Guo, S., Hu, M., Zamora, M. L., Peng, J. F., Shang, D. J., Zheng, J., Du, Z. F., Wu, Z., Shao, M., Zeng, L. M., Molina, M. J., and Zhang, R. Y.: Elucidating severe urban haze formation in China, P. Natl. Acad. Sci. USA, 111, 17373–17378, https://doi.org/10.1073/pnas.1419604111, 2014.
Guo, S., Hu, M., Peng, J., Wu, Z., Zamora, M. L., Shang, D., Du, Z., Zheng, J., Fang, X., Tang, R., Wu, Y., Zeng, L., Shuai, S., Zhang, W., Wang, Y., Ji, Y., Li, Y., Zhang, A. L., Wang, W., Zhang, F., Zhao, J., Gong, X., Wang, C., Molina, M. J., and Zhang, R.: Remarkable nucleation and growth of ultrafine particles from vehicular exhaust, P. Natl. Acad. Sci. USA, 117, 3427–3432, https://doi.org/10.1073/pnas.1916366117, 2020.
Hamed, A., Korhonen, H., Sihto, S.-L., Joutsensaari, J., Järvinen, H., Petäjä, T., Arnold, F., Nieminen, T., Kulmala, M., Smith, J. N., Lehtinen, K. E. J., and Laaksonen, A.: The role of relative humidity in continental new particle formation, J. Geophys. Res., 116, 116, https://doi.org/10.1029/2010jd014186, 2011.
Herrmann, E., Ding, A. J., Kerminen, V.-M., Petäjä, T., Yang, X. Q., Sun, J. N., Qi, X. M., Manninen, H., Hakala, J., Nieminen, T., Aalto, P. P., Kulmala, M., and Fu, C. B.: Aerosols and nucleation in eastern China: first insights from the new SORPES-NJU station, Atmos. Chem. Phys., 14, 2169–2183, https://doi.org/10.5194/acp-14-2169-2014, 2014.
Hussein, T., Junninen, H., Tunved, P., Kristensson, A., Dal Maso, M., Riipinen, I., Aalto, P. P., Hansson, H.-C., Swietlicki, E., and Kulmala, M.: Time span and spatial scale of regional new particle formation events over Finland and Southern Sweden, Atmos. Chem. Phys., 9, 4699–4716, https://doi.org/10.5194/acp-9-4699-2009, 2009.
Jun, Y.-S., Jeong, C.-H., Sabaliauskas, K., Richard Leaitch, W., and Evans, G. J.: A year-long comparison of particle formation events at paired urban and rural locations, Atmos. Pollut. Res., 5, 447–454, https://doi.org/10.5094/apr.2014.052, 2014.
Kangasluoma, J., Cai, R., Jiang, J., Deng, C., Stolzenburg, D., Ahonen, L. R., Chan, T., Fu, Y., Kim, C., Laurila, T. M., Zhou, Y., Dada, L., Sulo, J., Flagan, R. C., Kulmala, M., Petäjä, T., and Lehtipalo, K.: Overview of measurements and current instrumentation for 1–10 nm aerosol particle number size distributions, J. Aerosol Sci., 148, 105584, https://doi.org/10.1016/j.jaerosci.2020.105584, 2020.
Kerminen, V. M., Chen, X. M., Vakkari, V., Petäjä, T., Kulmala, M., and Bianchi, F.: Atmospheric new particle formation and growth: review of field observations, Environ. Res. Lett., 13, 10, https://doi.org/10.1088/1748-9326/aadf3c, 2018.
Kivekäs, N., Carpman, J., Roldin, P., Leppä, J., O'Connor, E., Kristensson, A., and Asmi, E.: Coupling an aerosol box model with one-dimensional flow: a tool for understanding observations of new particle formation events, Tellus B, 68, 29706, https://doi.org/10.3402/tellusb.v68.29706, 2016.
Komppula, M., Lihavainen, H., Hatakka, J., Paatero, J., Aalto, P., Kulmala, M., and Viisanen, Y.: Observations of new particle formation and size distributions at two different heights and surroundings in subarctic area in northern Finland, J. Geophys. Res.-Atmos., 108, 4295, https://doi.org/10.1029/2002jd002939, 2003.
Komppula, M., Sihto, S.-L., Korhonen, H., Lihavainen, H., Kerminen, V.-M., Kulmala, M., and Viisanen, Y.: New particle formation in air mass transported between two measurement sites in Northern Finland, Atmos. Chem. Phys., 6, 2811–2824, https://doi.org/10.5194/acp-6-2811-2006, 2006.
Kontkanen, J., Deng, C., Fu, Y., Dada, L., Zhou, Y., Cai, J., Daellenbach, K. R., Hakala, S., Kokkonen, T. V., Lin, Z., Liu, Y., Wang, Y., Yan, C., Petäjä, T., Jiang, J., Kulmala, M., and Paasonen, P.: Size-resolved particle number emissions in Beijing determined from measured particle size distributions, Atmos. Chem. Phys., 20, 11329–11348, https://doi.org/10.5194/acp-20-11329-2020, 2020.
Kristensson, A., Johansson, M., Swietlicki, E., Kivekäs, N., Hussein, T., Nieminen, T., Kulmala, M., and Dal Maso, M.: NanoMap: geographical mapping of atmospheric new particle formation through analysis of particle number size distribution data, Boreal Environ. Res., 19, 329–342, 2014.
Kulmala, M., Vehkamaki, H., Petaja, T., Dal Maso, M., Lauri, A., Kerminen, V. M., Birmili, W., and McMurry, P. H.: Formation and growth rates of ultrafine atmospheric particles: a review of observations, J. Aerosol. Sci., 35, 143–176, https://doi.org/10.1016/j.jaerosci.2003.10.003, 2004.
Kulmala, M., Petäjä, T., Nieminen, T., Sipilä, M., Manninen, H. E., Lehtipalo, K., Dal Maso, M., Aalto, P. P., Junninen, H., Paasonen, P., Riipinen, I., Lehtinen, K. E. J., Laaksonen, A., and Kerminen, V. M.: Measurement of the nucleation of atmospheric aerosol particles, Nat. Protoc., 7, 1651–1667, https://doi.org/10.1038/nprot.2012.091, 2012.
Kulmala, M., Kerminen, V. M., Petaja, T., Ding, A. J., and Wang, L.: Atmospheric gas-to-particle conversion: why NPF events are observed in megacities?, Faraday Discuss., 200, 271–288, https://doi.org/10.1039/c6fd00257a, 2017.
Kulmala, M., Dada, L., Dällenbach, K., Yan, C., Stolzenburg, D., Kontkanen, J., Ezhova, E., Hakala, S., Tuovinen, S., Kokkonen, T., Kurppa, M., Cai, R., Zhou, Y., Yin, R., Baalbaki, R., Chan, T., Chu, B., Deng, C., Fu, Y., Ge, M., He, H., Heikkinen, L., Junninen, H., Nei, W., Rusanen, A., Vakkari, V., Wang, Y., Wang, L., yao, l., Zheng, J., Kujansuu, J., Kangasluoma, J., Petäjä, T., Paasonen, P., Järvi, L., Worsnop, D., Ding, A., Liu, Y., Jiang, J., Bianchi, F., Yang, G., Liu, Y., Lu, Y., and Kerminen, V.-M.: Is reducing new particle formation a plausible solution to mitigate particulate air pollution in Beijing and other Chinese megacities?, Faraday Discuss., 226, 334–347, https://doi.org/10.1039/d0fd00078g, 2021.
Lampilahti, J., Manninen, H. E., Nieminen, T., Mirme, S., Ehn, M., Pullinen, I., Leino, K., Schobesberger, S., Kangasluoma, J., Kontkanen, J., Järvinen, E., Väänänen, R., Yli-Juuti, T., Krejci, R., Lehtipalo, K., Levula, J., Mirme, A., Decesari, S., Tillmann, R., Worsnop, D. R., Rohrer, F., Kiendler-Scharr, A., Petäjä, T., Kerminen, V.-M., Mentel, T. F., and Kulmala, M.: Zeppelin-led study on the onset of new particle formation in the planetary boundary layer, Atmos. Chem. Phys., 21, 12649–12663, https://doi.org/10.5194/acp-21-12649-2021, 2021.
Lee, B. P., Li, Y. J., Flagan, R. C., Lo, C., and Chan, C. K.: Sizing characterization of the fast mobility particle sizer (FMPS) against SMPS and HR-ToF-AMS, Aerosol Sci. Technol., 47, 1030–1037, https://doi.org/10.1080/02786826.2013.810809, 2013.
Lehtipalo, K., Leppä, J., Kontkanen, J., Kangasluoma, J., Wimmer, D., Franchin, A., Schobesberger, S., Junninen, H., Petäjä, T., Sipilä, M., Mikkilä, J., Vanhanen, J., Worsnop, D. R., and Kulmala, M.: methods for determining particle size distribution and growth rates between 1 and 3 nm using the Particle Size Magnifier, Boreal Environ. Res., 19, 215–236, 2014.
Lehtipalo, K., Yan, C., Dada, L., Bianchi, F., Xiao, M., Wagner, R., Stolzenburg, D., Ahonen, L. R., Amorim, A., Baccarini, A., Bauer, P. S., Baumgartner, B., Bergen, A., Bernhammer, A. K., Breitenlechner, M., Brilke, S., Buchholz, A., Mazon, S. B., Chen, D. X., Chen, X. M., Dias, A., Dommen, J., Draper, D. C., Duplissy, J., Ehn, M., Finkenzeller, H., Fischer, L., Frege, C., Fuchs, C., Garmash, O., Gordon, H., Hakala, J., He, X. C., Heikkinen, L., Heinritzi, M., Helm, J. C., Hofbauer, V., Hoyle, C. R., Jokinen, T., Kangasluoma, J., Kerminen, V. M., Kim, C., Kirkby, J., Kontkanen, J., Kurten, A., Lawler, M. J., Mai, H. J., Mathot, S., Mauldin, R. L., Molteni, U., Nichman, L., Nie, W., Nieminen, T., Ojdanic, A., Onnela, A., Passananti, M., Petäjä, T., Piel, F., Pospisilova, V., Quéléver, L. L. J., Rissanen, M. P., Rose, C., Sarnela, N., Schallhart, S., Schuchmann, S., Sengupta, K., Simon, M., Sipilä, M., Tauber, C., Tomé, A., Tröstl, J., Väisänen, O., Vogel, A. L., Volkamer, R., Wagner, A. C., Wang, M. Y., Weitz, L., Wimmer, D., Ye, P. L., Ylisirnio, A., Zha, Q. Z., Carslaw, K. S., Curtius, J., Donahue, N. M., Flagan, R. C., Hansel, A., Riipinen, I., Virtanen, A., Winkler, P. M., Baltensperger, U., Kulmala, M., and Worsnop, D. R.: Multicomponent new particle formation from sulfuric acid, ammonia, and biogenic vapors, Sci. Adv., 4, 12, https://doi.org/10.1126/sciadv.aau5363, 2018.
Liu, J., Zhang, X. L., Xu, X. F., and Xu, H. H.: Comparison analysis of variation characteristics of SO2, NOx, O3 and PM2.5 between rural and urban areas, Huan Jing Ke Xue, 29, 1059–1065, 2008.
Liu, J. Q., Jiang, J. K., Zhang, Q., Deng, J. G., and Hao, J. M.: A spectrometer for measuring particle size distributions in the range of 3 nm to 10 mum, Front. Env. Sci. Eng., 10, 63–72, https://doi.org/10.1007/s11783-014-0754-x, 2016.
Lu, Y., Yan, C., Fu, Y., Chen, Y., Liu, Y., Yang, G., Wang, Y., Bianchi, F., Chu, B., Zhou, Y., Yin, R., Baalbaki, R., Garmash, O., Deng, C., Wang, W., Liu, Y., Petäjä, T., Kerminen, V.-M., Jiang, J., Kulmala, M., and Wang, L.: A proxy for atmospheric daytime gaseous sulfuric acid concentration in urban Beijing, Atmos. Chem. Phys., 19, 1971–1983, https://doi.org/10.5194/acp-19-1971-2019, 2019.
Ma, L., Zhu, Y., Zheng, M., Sun, Y., Huang, L., Liu, X., Gao, Y., Shen, Y., Gao, H., and Yao, X.: Investigating three patterns of new particles growing to the size of cloud condensation nuclei in Beijing's urban atmosphere, Atmos. Chem. Phys., 21, 183–200, https://doi.org/10.5194/acp-21-183-2021, 2021.
Man, H. Y., Zhu, Y. J., Ji, F., Yao, X. H., Lau, N. T., Li, Y. J., Lee, B. P., and Chan, C. K.: Comparison of Daytime and Nighttime New Particle Growth at the HKUST Supersite in Hong Kong, Environ. Sci. Technol., 49, 7170–7178, 2015.
Olauson, J.: ERA5: The new champion of wind power modelling?, Renewable Energy, 126, 322–331, 2018.
Paasonen, P., Peltola, M., Kontkanen, J., Junninen, H., Kerminen, V.-M., and Kulmala, M.: Comprehensive analysis of particle growth rates from nucleation mode to cloud condensation nuclei in boreal forest, Atmos. Chem. Phys., 18, 12085–12103, https://doi.org/10.5194/acp-18-12085-2018, 2018.
Pierce, J. R. and Adams, P. J.: Uncertainty in global CCN concentrations from uncertain aerosol nucleation and primary emission rates, Atmos. Chem. Phys., 9, 1339–1356, https://doi.org/10.5194/acp-9-1339-2009, 2009.
Qi, X., Ding, A., Roldin, P., Xu, Z., Zhou, P., Sarnela, N., Nie, W., Huang, X., Rusanen, A., Ehn, M., Rissanen, M. P., Petäjä, T., Kulmala, M., and Boy, M.: Modelling studies of HOMs and their contributions to new particle formation and growth: comparison of boreal forest in Finland and a polluted environment in China, Atmos. Chem. Phys., 18, 11779–11791, https://doi.org/10.5194/acp-18-11779-2018, 2018.
Qi, X. M., Ding, A. J., Nie, W., Petäjä, T., Kerminen, V.-M., Herrmann, E., Xie, Y. N., Zheng, L. F., Manninen, H., Aalto, P., Sun, J. N., Xu, Z. N., Chi, X. G., Huang, X., Boy, M., Virkkula, A., Yang, X.-Q., Fu, C. B., and Kulmala, M.: Aerosol size distribution and new particle formation in the western Yangtze River Delta of China: 2 years of measurements at the SORPES station, Atmos. Chem. Phys., 15, 12445–12464, https://doi.org/10.5194/acp-15-12445-2015, 2015.
Salma, I., Borsós, T., Weidinger, T., Aalto, P., Hussein, T., Dal Maso, M., and Kulmala, M.: Production, growth and properties of ultrafine atmospheric aerosol particles in an urban environment, Atmos. Chem. Phys., 11, 1339–1353, https://doi.org/10.5194/acp-11-1339-2011, 2011.
Salma, I., Németh, Z., Kerminen, V.-M., Aalto, P., Nieminen, T., Weidinger, T., Molnár, Á., Imre, K., and Kulmala, M.: Regional effect on urban atmospheric nucleation, Atmos. Chem. Phys., 16, 8715–8728, https://doi.org/10.5194/acp-16-8715-2016, 2016.
Sellegri, K., Rose, C., Marinoni, A., Lupi, A., Wiedensohler, A., Andrade, M., Bonasoni, P., and Laj, P.: New particle formation: A review of ground-based observations at mountain research stations, Atmosphere, 10, 493, https://doi.org/10.3390/atmos10090493, 2019.
Shen, X., Sun, J., Kivekäs, N., Kristensson, A., Zhang, X., Zhang, Y., Zhang, L., Fan, R., Qi, X., Ma, Q., and Zhou, H.: Spatial distribution and occurrence probability of regional new particle formation events in eastern China, Atmos. Chem. Phys., 18, 587–599, https://doi.org/10.5194/acp-18-587-2018, 2018.
Shen, X. J., Sun, J. Y., Zhang, Y. M., Wehner, B., Nowak, A., Tuch, T., Zhang, X. C., Wang, T. T., Zhou, H. G., Zhang, X. L., Dong, F., Birmili, W., and Wiedensohler, A.: First long-term study of particle number size distributions and new particle formation events of regional aerosol in the North China Plain, Atmos. Chem. Phys., 11, 1565–1580, https://doi.org/10.5194/acp-11-1565-2011, 2011.
Stohl, A., Forster, C., Frank, A., Seibert, P., and Wotawa, G.: Technical note: The Lagrangian particle dispersion model FLEXPART version 6.2, Atmos. Chem. Phys., 5, 2461–2474, https://doi.org/10.5194/acp-5-2461-2005, 2005.
Vana, M., Komsaare, K., Hõrrak, U., Mirme, S., Nieminen, T., Petäjä, T., Noe, S. M., Kontkanen, J., Manninen, H. E., and Kulmala, M.: Characteristics of new-particle formation at three SMEAR stations, Boreal Environ. Res., 21, 345–362, 2016.
Wang, J., Shen, Y., Li, K., Gao, Y., Gao, H., and Yao, X.: Nucleation-mode particle pool and large increases in Ncn and Nccn observed over the northwestern Pacific Ocean in the spring of 2014, Atmos. Chem. Phys., 19, 8845–8861, https://doi.org/10.5194/acp-19-8845-2019, 2019.
Wang, M., Zhu, T., Zhang, J. P., Zhang, Q. H., Lin, W. W., Li, Y., and Wang, Z. F.: Using a mobile laboratory to characterize the distribution and transport of sulfur dioxide in and around Beijing, Atmos. Chem. Phys., 11, 11631–11645, https://doi.org/10.5194/acp-11-11631-2011, 2011.
Wang, Z. B., Hu, M., Sun, J. Y., Wu, Z. J., Yue, D. L., Shen, X. J., Zhang, Y. M., Pei, X. Y., Cheng, Y. F., and Wiedensohler, A.: Characteristics of regional new particle formation in urban and regional background environments in the North China Plain, Atmos. Chem. Phys., 13, 12495–12506, https://doi.org/10.5194/acp-13-12495-2013, 2013.
Wang, Z. B., Wu, Z. J., Yue, D. L., Shang, D. J., Guo, S., Sun, J. Y., Ding, A. J., Wang, L., Jiang, J. K., Guo, H., Gao, J., Cheung, H. C., Morawska, L., Keywood, M., and Hu, M.: New particle formation in China: Current knowledge and further directions, Sci. Total Environ., 577, 258–266, 2017.
Wu, Z., Hu, M., Liu, S., Wehner, B., Bauer, S., Ma ßling, A., Wiedensohler, A., Petäjä, T., Dal Maso, M., and Kulmala, M.: New particle formation in Beijing, China: Statistical analysis of a 1-year data set, J. Geophys. Res., 112, D09209, https://doi.org/10.1029/2006jd007406, 2007.
Yu, Y. C., Hu, B., and Wang, Y. S.: Changing characteristics of the main air pollutants of the Dongling Mountain in Beijing, Huan Jing Ke Xue, 34, 2505–2511, 2013.
Yao, L., Garmash, O., Bianchi, F., Zheng, J., Yan, C., Kontkanen, J., Junninen, H., Mazon, S. B., Ehn, M., Paasonen, P., Sipilä, M., Wang, M. Y., Wang, X. K., Xiao, S., Chen, H. F., Lu, Y. Q., Zhang, B. W., Wang, D. F., Fu, Q. Y., Geng, F. H., Li, L., Wang, H. L., Qiao, L. P., Yang, X., Chen, J. M., Kerminen, V. M., Petäjä, T., Worsnop, D. R., Kulmala, M., and Wang, L.: Atmospheric new particle formation from sulfuric acid and amines in a Chinese megacity, Science, 361, 278–281, https://doi.org/10.1126/science.aao4839, 2018.
Yao, L., Fan, X., Yan, C., Kurtén, T., Daellenbach, K. R., Li, C., Wang, Y., Guo, Y., Dada, L., and Rissanen, M. P., Cai, J., Tham, Y. J., Zha, Q., Zhang, S., Du, W., Yu, M., Zheng, F., Zhou, Y., Kontkanen, J., Chan, T., Shen, J., Kujansuu, J. T., Kangasluoma, J., Jiang, J., Wang, L., Worsnop, D. R., Petäjä, T., Kerminen, V.-M., Liu, Y., Chu, B., He, H., Kulmala, M., and Bianchi, F.: Unprecedented Ambient Sulfur Trioxide (SO3) Detection: Possible Formation Mechanism and Atmospheric Implications, Environ. Sci. Tech. Let., 7, 809–818, https://doi.org/10.1021/acs.estlett.0c00615, 2020.
Ying, G., Ma, J., and Xing, Y.: Comparison of air quality management strategies of PM10, SO2, and NOx by an industrial source complex model in Beijing, Environ. Prog., 26, 33–42, 2010.
Yu, F. and Luo, G.: Simulation of particle size distribution with a global aerosol model: contribution of nucleation to aerosol and CCN number concentrations, Atmos. Chem. Phys., 9, 7691–7710, https://doi.org/10.5194/acp-9-7691-2009, 2009.
Zhang, R., Khalizov, A., Wang, L., Hu, M., and Xu, W.: Nucleation and growth of nanoparticles in the atmosphere, Chem. Rev., 112, 1957–2011, 2011.
Zhou, Y., Dada, L., Liu, Y., Fu, Y., Kangasluoma, J., Chan, T., Yan, C., Chu, B., Daellenbach, K. R., Bianchi, F., Kokkonen, T. V., Liu, Y., Kujansuu, J., Kerminen, V.-M., Petäjä, T., Wang, L., Jiang, J., and Kulmala, M.: Variation of size-segregated particle number concentrations in wintertime Beijing, Atmos. Chem. Phys., 20, 1201–1216, https://doi.org/10.5194/acp-20-1201-2020, 2020.
Zimmerman, N., Jeong, C.-H., Wang, J. M., Ramos, M., Wallace, J. S., and Evans, G. J.: A source-independent empirical correction procedure for the fast mobility and engine exhaust particle sizers, Atmos. Environ., 100, 838, https://doi.org/10.1016/j.atmosenv.2014.10.054, 2015.