the Creative Commons Attribution 4.0 License.
the Creative Commons Attribution 4.0 License.
 | 03 Dec 2021
Is the Atlantic Ocean driving the recent variability in South Asian dust?
Priyanka Banerjee
Sreedharan Krishnakumari Satheesh
Krishnaswamy Krishna Moorthy
This study investigates the large-scale factors controlling interannual variability in dust aerosols over South Asia during 2001–2018. We use a parameter DA%, which refers to the frequency of days in a year when high dust activity is experienced over a region, as determined by a combination of satellite aerosol optical depth and the Ångström exponent. While a positive sea surface temperature (SST) anomaly in the central Pacific Ocean was important in controlling DA% over South Asia during 2001–2010; in recent years, the North Atlantic Ocean has assumed a dominant role. Specifically, high DA% is associated with warming in the midlatitude and cooling in the subtropical North Atlantic SSTs: the location of the two southern arms of the North Atlantic SST tripole pattern. This shift towards a dominant role of the North Atlantic SST in controlling DA% over South Asia coincides with a recent shift towards a persistently positive phase of the North Atlantic oscillation (NAO) and a resultant positive phase of the springtime SST tripole pattern. Interestingly, there has also been a shift in the relation between the two southern arms of the SST tripole and NAO, which has resulted in weakening of the southwest monsoon circulation over the northern Indian Ocean and strengthening of the dust-carrying westerlies and northerlies in the lower troposphere and mid-troposphere. Simulations with an Earth system model show that the positive phase of the North Atlantic SST tripole pattern is responsible for a 10 % increase in the dust optical depth over South Asia during May–September; with increases as high as 30 % during the month of June. This increase is mainly due to transport by the westerlies at the 800 hPa pressure level, which increases the dust concentration at this pressure level by 20 % on average during May–September and up to 50 % during June.
- Article
(15142 KB) - Full-text XML
-
Supplement
(644 KB) - BibTeX
- EndNote


South Asia is believed to be highly vulnerable to the long-term impacts of climate change (Stocker et al., 2013). One of the ways in which the impact of climate change is felt in this region is via aerosol feedback on the regional climate (e.g., Satheesh and Ramanathan, 2000; Ramanathan et al., 2005; Bollasina et al., 2011). Mineral dust is the most important aerosol component (by mass) present in this region (e.g., Ginoux et al., 2012; Jin et al., 2018; Banerjee et al., 2019). Several studies during the last 2 decades have shown that mineral dust can influence different aspects of the climate of South Asia, with the largest focus given to the impact of dust on the radiative balance (e.g., Deepshikha et al., 2006; Zhu et al., 2007; Pandithurai et al., 2008) and the southwest monsoon (SWM) precipitation (Vinoj et al., 2014; Jin et al., 2014; Solmon et al., 2015). However, to better appreciate the dust–climate feedback, it is important to understand what large-scale factors control dust emission and transport in this region, and if there are long-term changes in these controlling factors. At present, there is very little understanding of these factors, sometimes with a lack of consensus among the studies.
There is some recent indirect evidence of El Niño/La Niña influencing dust fluxes over South Asia. For example, Kim et al. (2016) reported that La Niña conditions are associated with increased absorbing aerosols over northwestern India which, in turn, lead to a positive feedback on the SWM precipitation. On the contrary, Abish and Mohankumar (2013) argued that increased zonal transport and subsidence over India during El Niño years can lead to enhanced absorbing aerosols, like dust, over India. A few other studies have shown that variability in dust aerosols over Southwest Asia is controlled by climatic factors like El Niño/La Niña at an interannual timescale (Notaro et al., 2015; Yu et al., 2015; Banerjee and Prasanna Kumar, 2016) and by the Pacific decadal oscillation (PDO) at an interdecadal timescale (Notaro et al., 2015; Yu et al., 2015; Pu and Ginoux, 2016). Eastward transport of dust from Southwest Asia by the mid-level westerlies has been shown to contribute about 50 % of the total dust optical depth over the Indo-Gangetic Plain of South Asia (Banerjee et al., 2019) and can influence the dust trend over this region. The Indian Ocean dipole (IOD) is the other teleconnection that influences atmospheric circulation over this region, with the positive phase of the IOD counteracting the impact of El Niño on precipitation over South and Southwest Asia (Ashok et al., 2001, 2004). This can reduce the magnitude of anomalies of dust over Southwest Asia due to an El Niño event (Banerjee and Prasanna Kumar, 2016). During the beginning of the 21st century, a positive trend in SWM precipitation due to the negative phase of the interdecadal Pacific oscillation (Huang et al., 2020) resulted in a negative trend in dust aerosol over South Asia (Pandey et al., 2017; Jin and Wang, 2018). Ice core records in the central Himalayas have shown an inverse relation between SWM precipitation and dust deposition (Thompson et al., 2000). During the winter season, the aerosol optical depth over northern India is shown to be positively correlated with the simultaneous central Pacific Nino index and negatively correlated with the Antarctic oscillation during the preceding autumn (Gao et al., 2019).
The main dust source regions over South Asia are spread across the Thar Desert and the Indo-Gangetic Plain in India and Pakistan; the Makran coast and the Hamun-i-Mashkel in Pakistan; and the Dasht-e Mārgō and the Rigestan Desert in Afghanistan (Walker et al., 2009; Ginoux et al., 2012). The Dasht-e Mārgō, the Rigestan Desert, and the Hamun-i-Mashkel receive predominantly winter precipitation from the Mediterranean low-pressure systems traveling eastwards. The remaining regions receive summer precipitation from the SWM system, although the total amount of precipitation received is very low. It has been shown by several studies that one of the major factors controlling the interannual variability in the SWM rainfall is El Niño/La Niña, with developing El Niño conditions over the Pacific Ocean leading to a weakening of the SWM moisture influx (e.g., Sikka, 1980; Rasmusson and Carpenter, 1983; Ashok et al., 2004). Tropical Pacific Ocean warming (cooling) in the El Niño region is also responsible for wetter (drier) than normal conditions over the winter precipitation region in Southwest Asia (Barlow et al., 2002; Mariotti, 2002). This implies that the conditions prevailing over the Pacific Ocean have an important role in controlling the level of dust activity over the northern Indian Ocean (IO) and South Asia, either directly through the precipitation impact on dust emission and/or indirectly through dust transport from Southwest Asia. However, on the backdrop of global warming and the internal variability in the Pacific Ocean at different timescales (e.g., Kosaka and Xie, 2016; Deser et al., 2017a), the well-known El Niño–monsoon relation has undergone changes in recent decades. Since the late 1970s, the relation between El Niño and the negative rainfall anomaly over India has become less significant, possibly due to the higher rate of warming of the Eurasian landmass in recent years compared with the IO or due to the cooling of the Pacific Ocean (Kumar et al., 1999; Kinter et al., 2002). Simultaneously, the Atlantic Ocean has assumed a stronger role in modulating the monsoon circulation over the northern IO (Chang et al., 2001; Kucharski et al., 2007, 2008). While some studies have shown the importance of the sea surface temperature (SST) along the south equatorial Atlantic (Kucharski et al., 2007, 2008), other studies have shown that positive SST anomalies over the western North Atlantic centered on 40∘ N can lead to positive monsoon anomalies over India (Srivastava et al., 2002; Rajeevan and Sridhar, 2008). Over the North Atlantic Ocean, the dominant mode of sea level pressure variability during winter is the North Atlantic oscillation (NAO) (Hurrell, 1995). The tripole pattern of the SST over the North Atlantic associated with the winter NAO (see, e.g., Visbeck et al., 1998) can persist during spring and impact the summer circulation over Eurasia (Gastineau and Frankignoul, 2015; Ossó et al., 2018). During the summer months, two dominant modes of variability are the summer NAO (Folland et al., 2009) and the summer East Atlantic (SEA) pattern (Ossó et al., 2018, 2020). During the 1948–2016 period, for the summer months of June–September, NAO explained about 36 % of the variance and SEA explained about 16 % of the variance in the sea level pressure (Osborne et al., 2020). A few studies have shown that such variability in SST and circulation over the North Atlantic has the potential to influence the SWM circulations over South Asia. For example, the SST anomalies associated with the Atlantic multidecadal oscillations can influence the tropospheric temperature, leading to strengthening or weakening of the monsoon via modulation of the frequency and strength of the NAO (Goswami et al., 2006). The cold (positive) phases of the SST tripole over the North Atlantic have induced stronger westerlies over the northern IO (Krishnamurthy and Krishnamurthy, 2015). The influences of the extratropical North Atlantic/Pacific SSTs on the South Asian monsoon are stronger during weak El Niño/La Niña years (Chattopadhyay et al., 2015).
On the abovementioned backdrop, we examine how changes in the spatial pattern of ocean warming during 2001–2018 have led to an increased dependence of South Asian dust on the North Atlantic Ocean, shifting from the previously dominant influence of the equatorial Pacific SST. Using observations and reanalysis data, we explore the physical mechanism by which a remote response of the circulation over South Asia is invoked by SST anomalies over the North Atlantic. Furthermore, we have performed control and sensitivity studies using an Earth system model to investigate in detail how dust emission and transport is impacted by perturbing the SST over the North Atlantic Ocean. For this study, we have chosen a domain encompassing 24–32∘ N and 65–82∘ E. We consider this as the dust belt of South Asia. The region is influenced predominantly by SWM precipitation. Unless stated otherwise, all analyses involving spatial averaging focus only on this region.
2.1 Satellite observation and reanalysis data
The main source of dust aerosol data for this study is from the Moderate Resolution Imaging Spectroradiometer (MODIS) aboard the Terra (2001–2018) and Aqua (2003–2018) satellites, which provide the longest satellite-based information on both aerosol load and size distribution over land and ocean. We have calculated the frequency of days in a year when substantial dust activity is experienced over South Asia (DA%) using the MODIS Level 3 version 6.1 daily Deep Blue aerosol optical depth (T) and the Ångström exponent (α). The MODIS Deep Blue algorithm is used to retrieve aerosol information over bright surfaces, like arid regions, where surface reflectance is low at the blue end of the spectrum (Hsu et al., 2004, 2006). The criteria used for estimating DA% are (i) T>0.6 and (ii) α<0.2, in order to isolate the days dominated by moderately high-load coarse-mode aerosols. This yields a map of the main dust source regions in and around South Asia at a 1∘ × 1∘ horizontal resolution. Previously, along with Deep Blue T and α, single-scattering albedo has also been used to account for the absorptive property of dust when deriving the dust optical depth (Ginoux et al., 2012; Pu and Ginoux, 2018). For our present purpose, the T and α combination is sufficient, as we are deriving the frequency of days of dust activity and not the absolute optical depth. Figure 1a shows the spatial distribution of DA% averaged for 2001–2018 as well as its standard deviation (SD). High values of DA% coincide with known locations of dust source regions. The high values of SD indicate that these dust source regions experience significant interannual variability in DA%. The inset in Fig. 1a shows the monthly climatology of DA% and the SD, which reveals that the highest values occur during June–July and lowest values occur during November. Over the dust belt of South Asia, for 2001–2018, the average DA% from MODIS Terra is 5.2 (SD is 1.7), and the average DA% from MODIS Aqua is 4.2 (SD is 1.7). Changing the threshold values of both T and α by 50 % and recalculation of DA% does not lead to any significant changes in these results. MODIS-derived DA% matches well with the year-to-year variability in the dust optical depth (Td) from the Infrared Atmospheric Sounder Interferometer (IASI) aboard Metop-A (2008–2018) with a correlation coefficient of 0.73, which is significant at the 99 % confidence level (Fig. 1b). IASI reports Td at a 10 µm wavelength and at a spatial resolution of 0.5∘ × 0.5∘ (Capelle et al., 2018). For 2008–2018, the IASI dataset yields annual average Td value of 0.17 (SD of 0.02). In subsequent analyses, we use the combined DA% obtained from MODIS Terra and Aqua.

Figure 1(a) Shading shows the spatial distribution of DA% averaged for 2001–2018, and contours are the standard deviations of DA% for the same period. The black rectangle indicates the dust belt in South Asia (24–32∘ N, 65–82∘ E) which is used for subsequent analysis. The monthly climatology and the standard deviation of DA% over the dust belt in South Asia are shown in the inset using black squares and vertical bars, respectively. (b) Time series of the MODIS-derived DA% and IASI-retrieved annual dust optical depth over the dust belt in South Asia.
To examine the linkages between the spatial variability in the SST during different periods and South Asian dust activity, we have used three SST datasets: (1) National Oceanic and Atmospheric Administration (NOAA) Extended Reconstructed SST (ERSST) version 5 (Huang et al., 2017), available at a 2∘ × 2∘ spatial resolution; (2) Centennial in situ Observation-Based Estimates (COBE) version 2 SST data, at a 1∘ × 1∘ spatial resolution (Hirahara et al., 2014); and (3) Optimal Interpolation SST version 2 (OISST) data, at a 1∘ × 1∘ spatial resolution (Reynolds et al., 2002). All of the SST datasets are at a monthly temporal resolution. The ERSST version 5 data combine ship and buoy SST from the International Comprehensive Ocean–Atmosphere Dataset (ICOADS) along with Argo data since 2000. COBE also uses ICOADS data along with data from the Kobe Collection. Finally, OISST combines Advanced Very High Resolution Radiometer (AVHRR) retrievals with shipborne and buoy data. To separate the impact of the Atlantic Ocean on dust from the Pacific, partial correlations between SST and DA% have been calculated using the following relation:
where r12,3 is the correlation between variables 1 and 2 after removing the impact of variable 3. In Eq. (1), rij refers to the correlation between variables i and j.
Atmospheric data, such as wind vectors, geopotential height, sea level pressure, and velocity potential, have been taken from the National Centers for Environmental Prediction/National Center for Atmospheric Research (NCEP/NCAR) Reanalysis at a 2.5∘ × 2.5∘ spatial resolution (Kalnay et al., 1996). For precipitation, we have used monthly Global Precipitation Climatology Project (GPCP) version 2.3 data available at a 2.5∘ × 2.5∘ spatial resolution, which combine rain gauge measurements with satellite observations (Huffman et al., 1997). Additionally, monthly precipitation data averaged from daily data were obtained from the Precipitation Estimation from Remotely Sensed Information using Artificial Neural Networks (PERSIANN) system at a 0.25∘ × 0.25∘ spatial resolution. The PERSIANN algorithm is applied on Gridded Satellite (GridSat-B1) brightness temperature observations in the infrared region (Ashouri et al., 2015). The precipitation data are then corrected for bias against GPCP precipitation estimates. To track the large-scale variability over the North Atlantic, Hurrell's station-based seasonal NAO index has been used for the years 2001–2018 (Hurrell, 1995; Hurrell and Deser, 2009). The NAO index is calculated based on the difference between normalized sea level pressure over Lisbon, Portugal, and Stykkishólmur/Reykjavik in Iceland.
2.2 CESM experiments
Simulations were carried out using the Community Earth System Model (CESM) version 1.2 to examine the mechanism by which SST anomalies over the North Atlantic Ocean impact the dust cycle over South Asia. CESM is a fully coupled model used for simulations of global climate across different spatial and temporal scales. There are several components to the CESM model (e.g., atmosphere, land, sea ice, and ocean), which are linked through a coupler. We have used the Community Atmosphere Model version 4 with the Bulk Aerosol Module (CAM4-BAM) coupled with the Community Land Model version 4 in “Satellite Phenology” (CLM-SP) configuration. Simulations are carried out for trace gas levels corresponding to the year 2000 at a 0.9∘ × 1.25∘ spatial resolution with 26 vertical levels.
The emission of dust is calculated within the CLM model, while dust transport and deposition as well as the radiative effects are calculated within the CAM model (Mahowald et al., 2006). Dust emission follows the treatment of the Dust Entrainment and Deposition scheme of Zender et al. (2003a). Dust emission is based on a saltation process, which depends on modeled wind friction velocity, soil moisture, vegetation, and snow cover. This saltation flux occurs whenever the wind friction velocity exceeds a threshold (Marticorena and Bergametti, 1995). Additionally, dust emission is corrected by a geomorphic source function, which accounts for the spatial variability in erodible materials (Zender et al., 2003b). In CAM4-BAM, dust is emitted in four size bins: 0.1–1.0, 1.0–2.5, 2.5–5.0, and 5.0–10.0 µm. Dust is transported based on the CAM4 tracer advection scheme and is removed via dry (gravitational and turbulent deposition) and wet deposition (convective and large-scale precipitation) (Zender et al., 2003a; Neale et al., 2010). The solubility factor and scavenging coefficient are taken here as 0.15 and 0.10, respectively.
Two sets of simulations have been carried out with CESM: (1) the “Ctrl” simulation, where the atmosphere was forced with prescribed climatological monthly SST and sea ice from the Hadley Centre (1870–1981) (Rayner et al., 2003) and NOAA Optimal Interpolation SST (1981–2010) (Hurrell et al., 2008), and (2) the “NAtl” simulation, where the month-by-month observed trend in the SST during the 2011–2018 period was imposed over the climatological SST only over the North Atlantic Ocean – that is, over the region from 5 to 80∘ N and from 5 to 85∘ W. Over rest of the domain, the climatological SST from Hurrell was prescribed. Thus, the differences between the NAtl and Ctrl simulations solely reflect the impact of the North Atlantic SST anomalies, as observed during 2011–2018, on the atmospheric circulation and dust load. A total of 15 years of simulations have been carried out for each of the Ctrl and NAtl cases with each year being initialized from the atmospheric state at the end of the previous year. For this study, monthly mean values for the last 10 years of model runs have been used for both the cases. In the following section, we have assessed CESM simulations of atmospheric circulation and dust over the study region.
2.3 Model validation
In general, CESM simulations can reproduce the main features of the North Atlantic summer climate and circulation, which are the focus here. Sea-level-pressure-based empirical orthogonal analysis carried out for CESM Large Ensemble simulations for 1920–2012 has revealed that the NAO accounts for a 40-member mean variance of 43 % for the winter months (Deser et al., 2017b). With our 10-year CESM simulation, we can still identify the dominant modes of variability. The empirical orthogonal function using the June–September sea level pressure from CESM shows that the NAO accounts for 63 % and the SEA pattern accounts for 14 % of sea level pressure variance (Supplement Fig. S1). To examine CESM performance over South Asia, we have compared outputs from the CESM Ctrl simulation with NCEP/NCAR wind at the 850 hPa pressure level and PERSIANN precipitation separately for the spring inter-monsoon (April–May) and SWM (June–September) periods (Fig. 2a, b, c, d). The comparisons reveal that the Ctrl run reproduces the main features of circulations and precipitation over South Asia quite well, although with certain biases, which impact dust distribution and its temporal evolution. During April–May, anomalous westerlies drive a positive precipitation bias over peninsular India and the southeastern Bay of Bengal (Fig. 2a, b). The anomalous southerlies over the southern part of the Indo-Gangetic Plain lead to a negative precipitation bias there but a positive bias over the eastern Himalayas. During June–September, there are positive precipitation biases along the west coast of India, in southern India, in the Himalayan foothills, and in most of the Middle East. A negative precipitation bias prevails over eastern India and Southeast Asia, bordering the northeastern Bay of Bengal (Figs. 2c, d). The positive bias along the west coast of India is associated with stronger westerlies in the Ctrl run. The anomalous anticyclone over the northern Bay of Bengal leads to a negative precipitation bias of around 30 %. This dipole in the precipitation bias over the South Asian monsoon region has been recognized in Phase 5 of the Coupled Model Intercomparison Project (CMIP5) suite of models (Sperber et al., 2013) and has been attributed to several causes: a SST bias over the western equatorial IO (Annamalai et al., 2017); suppression of moist convection processes due to a smoothing of topography (Boos and Hurley, 2013); and weak advection of cold, dry air off the Somali coast which reduces available moisture (Hanf and Annamalai, 2020). Comparing the temporal evolution of CESM-simulated precipitation with observations from PERSIANN (Fig. 2e, f), we see that a wet bias generally prevails over both the Indian domain (Fig. 2e) and the South Asian dust belt (Fig. 2f). CESM simulates a 1-month delay in the peak monsoon rainfall over these regions.
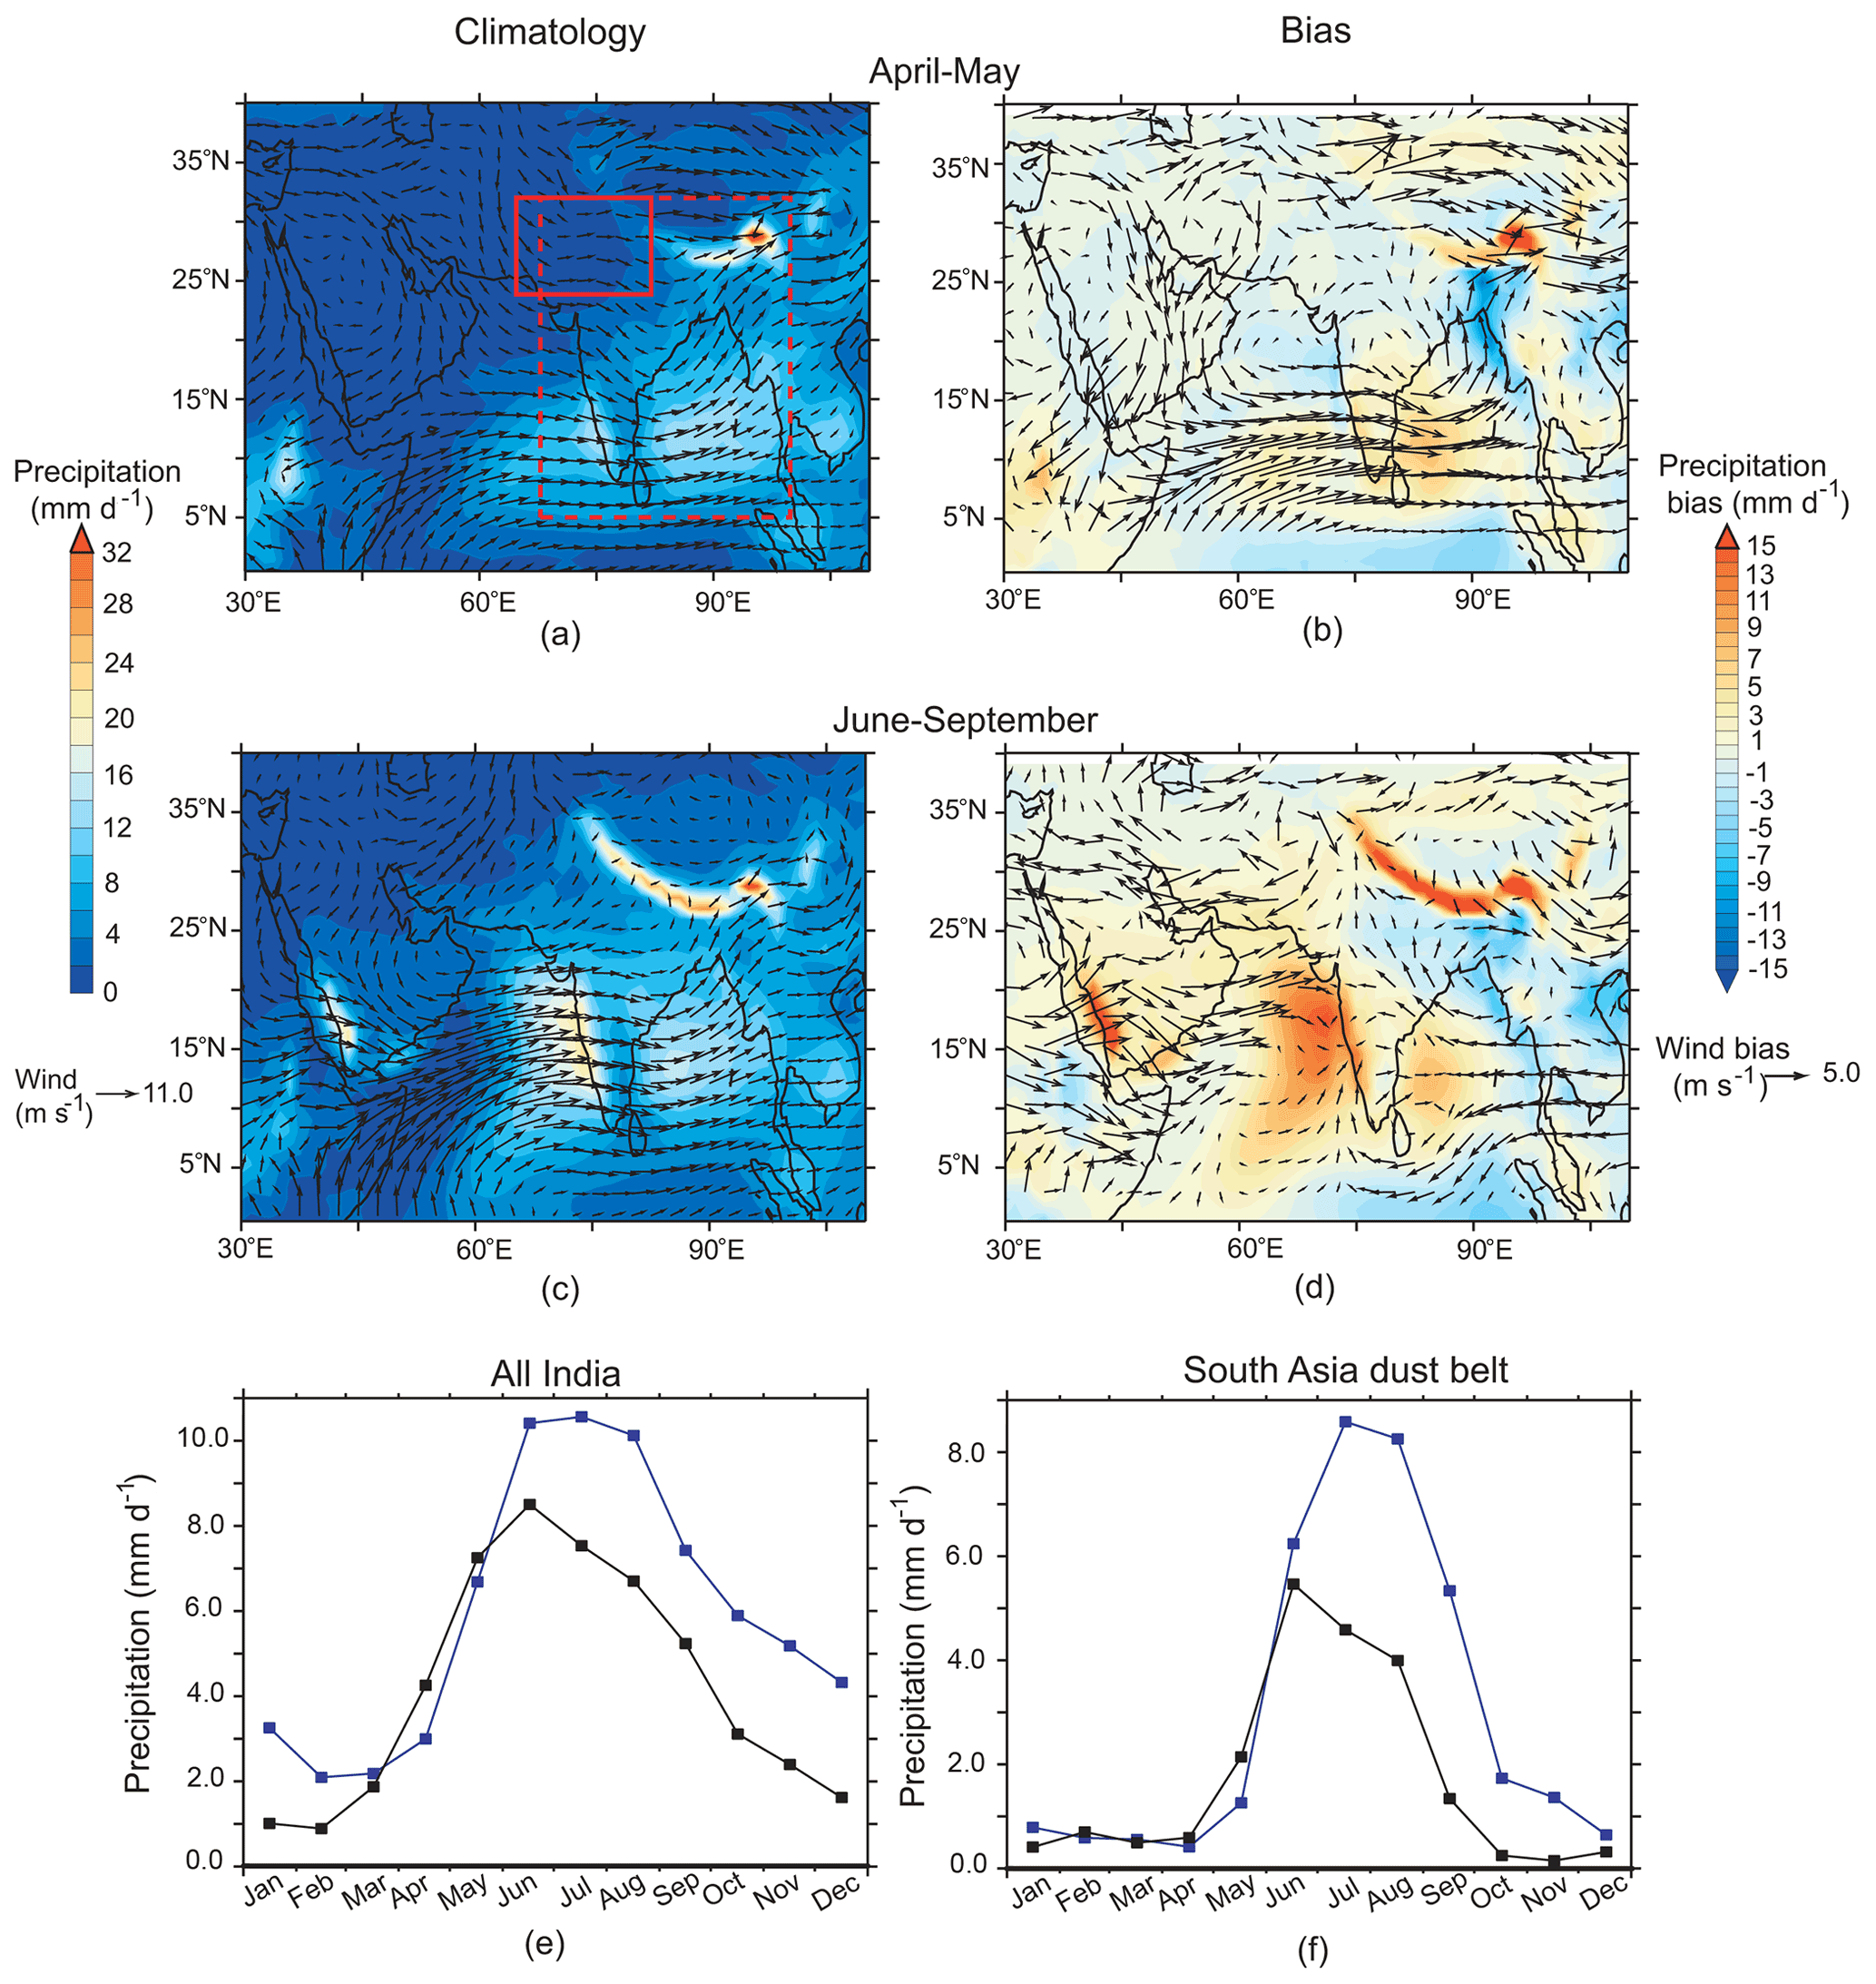
Figure 2Comparison of the CESM Ctrl simulation with observations/reanalysis data. CESM-simulated climatology of precipitation and wind for (a) April–May and (c) June–September are shown. Differences between CESM-simulated precipitation (shading) and PERSIANN values and between CESM-simulated wind (arrows) and NCEP/NCAR Reanalysis values at the 850 hPa pressure level are given for (b) April–May and (d) June–September. The time evolution of CESM (blue curve) and PERSIANN precipitation (black curve) over (e) all of India (5–32∘ N, 68–100∘ E) and (f) the South Asian dust belt (24–32∘ N, 65–82∘ E); these domains are indicated by the dashed and solid red boxes in panel (a), respectively.
With respect to the CESM simulation of dust, we have compared the dust optical depth (Td) from the Ctrl run with IASI-retrieved Td and coarse-mode T data from Aerosol Robotic Network (AERONET) stations at Kanpur (2001–2018), Lahore (2010–2016), and Jaipur (2010–2017). For this, we used version 3 AERONET Level 2.0 cloud-cleared aerosol data. In general, CESM Ctrl reproduces the main dust emission regions over South and Southwest Asia (Fig. 3a) along with the temporal evolution of Td (Fig. 3b). However, the positive bias in precipitation over the dust source region, prevailing almost throughout the year, leads to underestimations of Td compared with observations. This discrepancy between CESM and observations is low during the winter months and increases during the monsoon months when CESM simulates an approximate 3.5 mm d−1 positive bias in precipitation over the South Asian dust belt and an approximate 2 m s−1 easterly wind bias. For example, during May, when Td peaks, CESM simulates a Td value of ∼ 0.2, whereas AERONET coarse-mode T values over Kanpur, Jaipur, and Lahore are almost double. A negative bias in CESM Td is also apparent when compared to IASI-observed 10 µm Td over South Asia (Fig. 3b). Although the precipitation bias during April–May is low (∼ 0.1 mm d−1; Fig. 2b), an easterly wind bias of 0.7 m s−1 leads to low transport from the west. A similar negative bias in dust associated with weak northwesterlies over the Indo-Gangetic Plain has been noted for a CESM-CAM5 simulation submitted to CMIP5 (Sanap et al., 2014). One important reason for the CESM underestimation of Td can be the exclusion of anthropogenic sources of dust, which contribute to nearly half of the total annual dust emission (Ginoux et al., 2012). Several improvements for simulating dust with CESM have been suggested: updating dust emission size distribution, optical properties, wet deposition parameterizations, and tuning soil erodibility (Albani et al., 2014). While further improvements in CESM for better representation of the dust cycle over South Asia are a topic for the future, in the case of this study, notwithstanding the negative bias, the CESM Ctrl simulation is able to simulate the pattern of the spatial distribution and seasonal evolution of South Asian dust. This is adequate for the present work, as we are interested in the direction of change in the simulated dust load due to the North Atlantic SST tripole rather than in the absolute magnitude of Td.
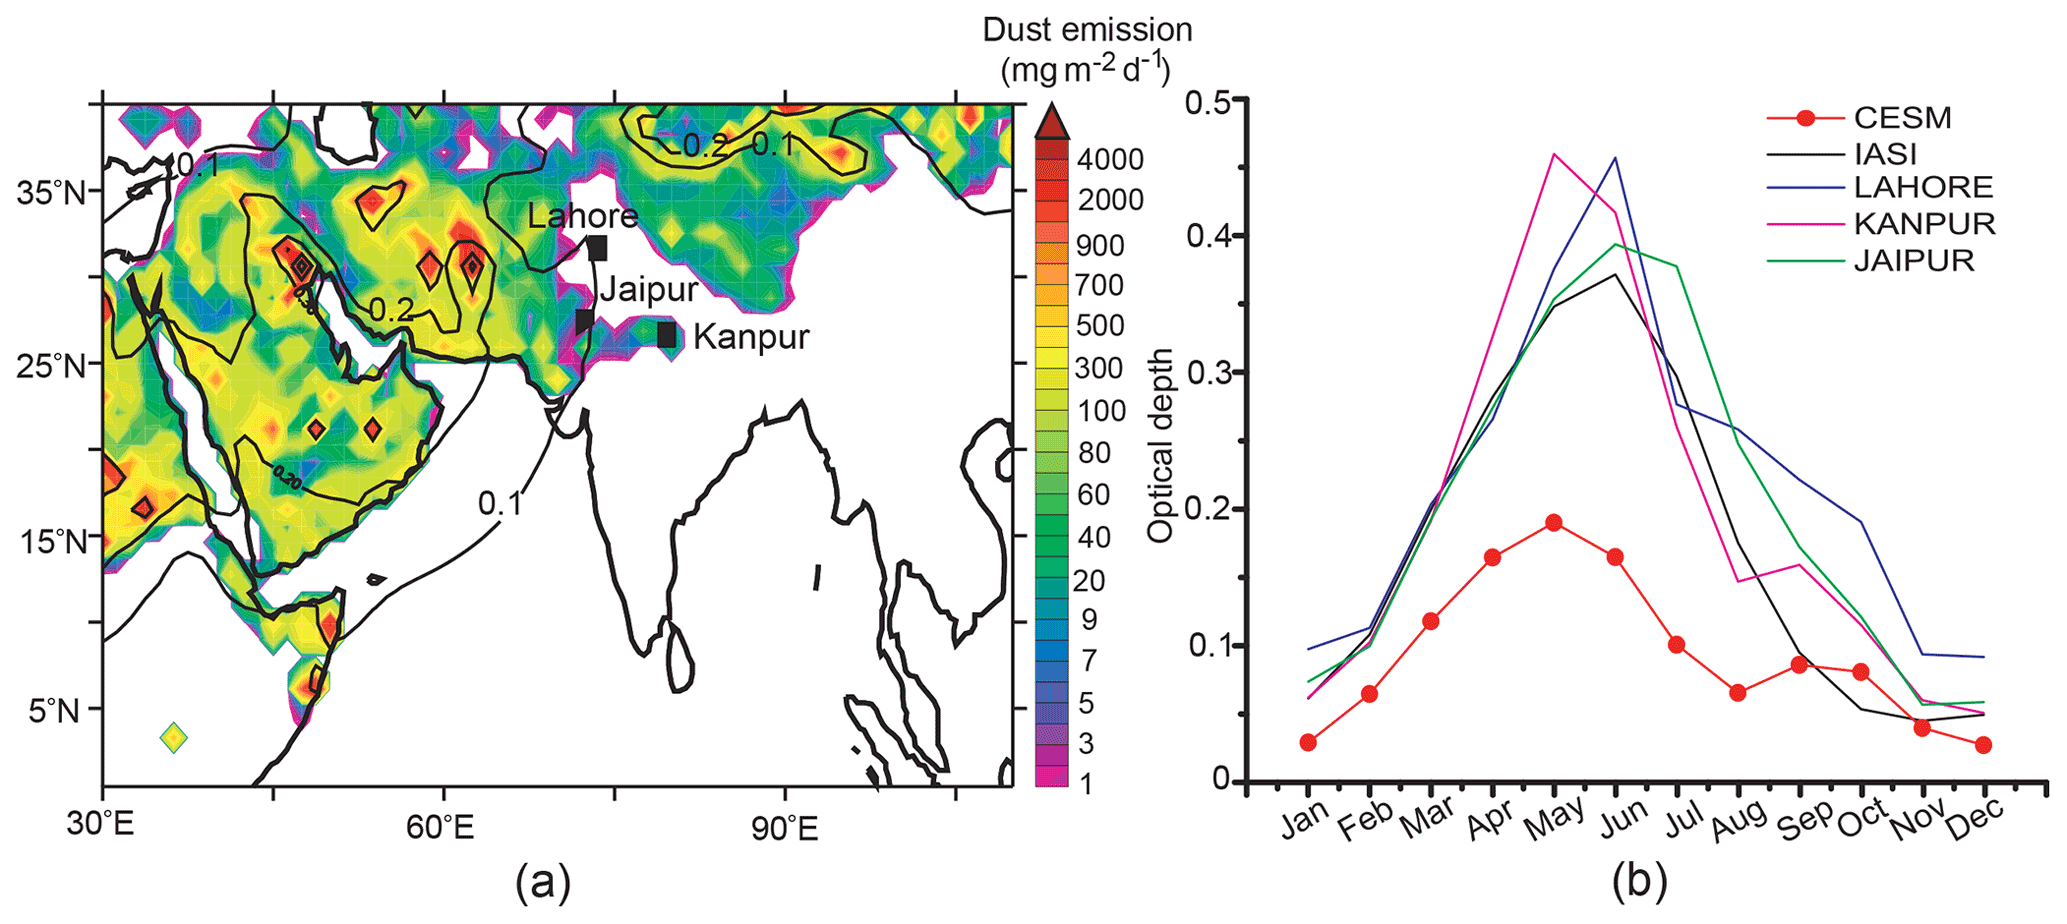
Figure 3(a) Shading shows the distribution of the main dust-emitting regions from CESM, and the contours indicate the dust optical depth. Both parameters have been averaged for 10 model years. (b) Comparison of the monthly climatology of the dust optical depth over the South Asian dust belt from the CESM Ctrl simulation with IASI and AERONET (Lahore, Kanpur, and Jaipur) observations.
We first demonstrate that there is a change in the relation between dust aerosol variability over South Asia and global SSTs during 2001–2018, with the role of the North Atlantic Ocean assuming importance in the recent years. We next discuss the possible physical mechanism involved by which SST anomalies over key regions in the North Atlantic influence the circulation over South Asia. Finally, CESM simulation results are used to isolate the effect of North Atlantic SST variability on dust emission and transport over South Asia.
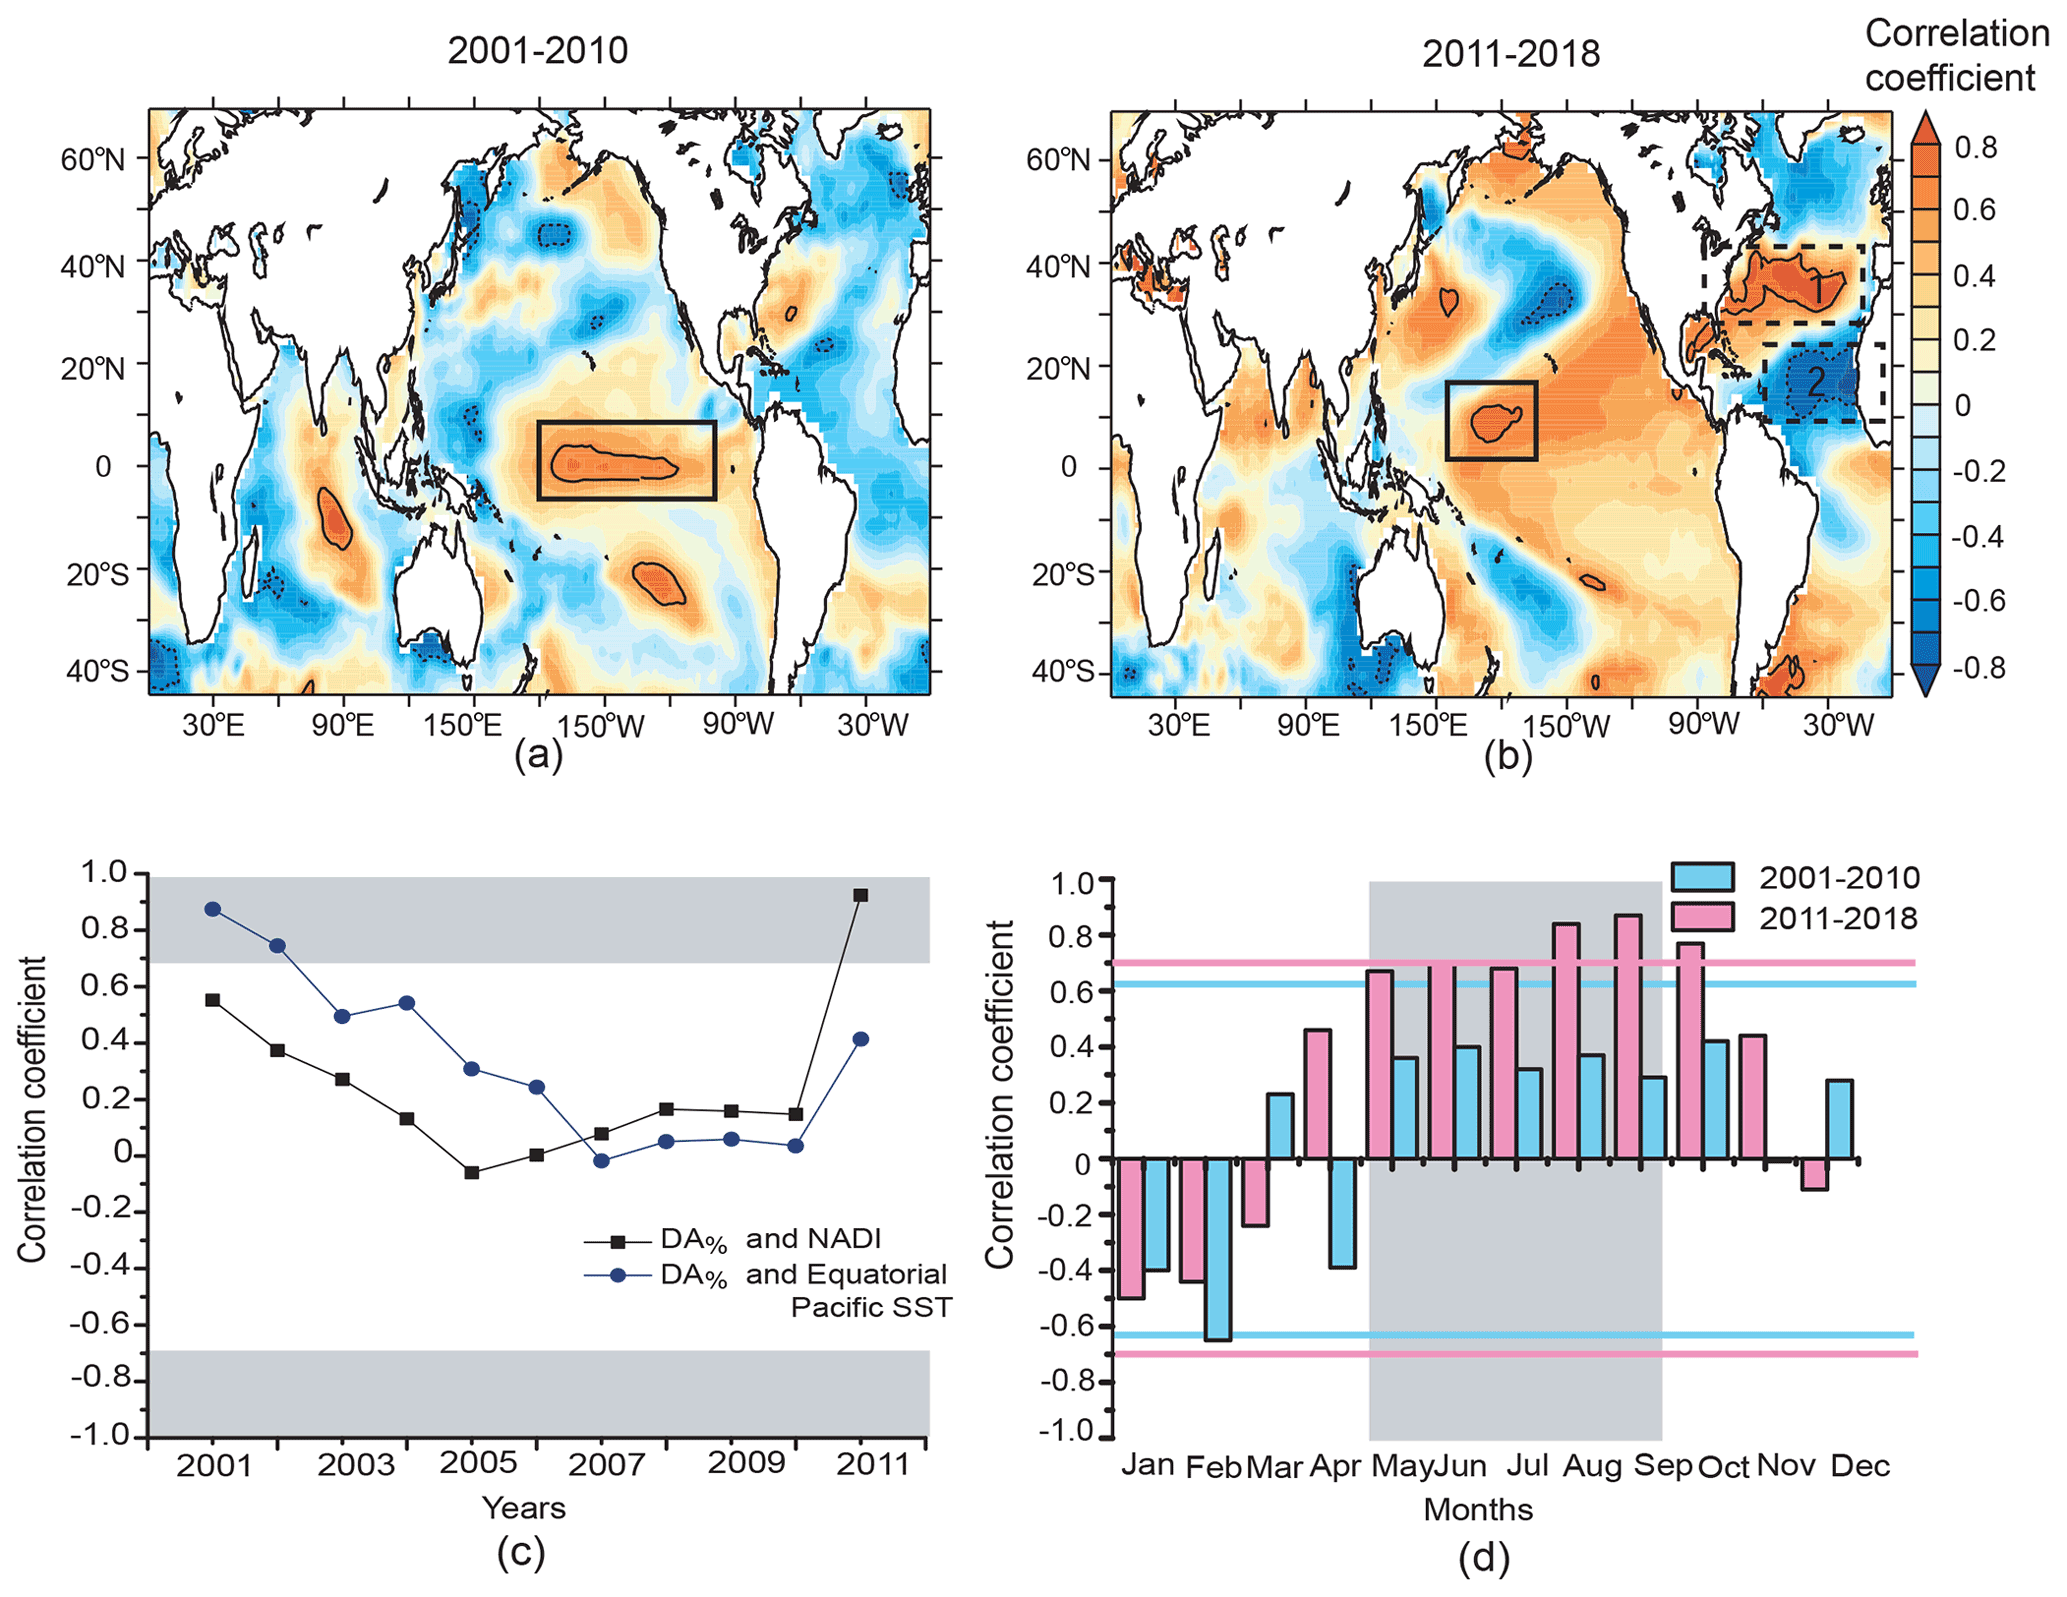
Figure 4Correlation between the percentage frequency of annual dust activity (DA%) and the annual average SST for (a) 2001–2010 and (b) 2011–2018. The black contours enclose the regions where the correlation coefficient is significant at the 95 % confidence level. The solid (dashed) boxes show the main regions where DA% over South Asia has significant correlations over the Pacific (Atlantic) Ocean (see text for details). In panel (b), the regions used for constructing the North Atlantic difference index (NADI) are marked as “1” and “2”. (c) The 8-year running correlation between DA% and the April–June NADI (black curve) and between DA% and the September–October central equatorial Pacific SST (blue curve). The x axis shows the first year for each correlation window, and the gray shaded regions mark the 95 % significance level. (d) Correlation between the April–June NADI and monthly DA% are plotted. The blue and pink horizontal lines indicate the 95 % confidence levels for 2001–2010 and 2011–2018, respectively. The gray shaded region highlights the months that have DA% values greater than the annual average DA%.
3.1 Decadal change in the correlation between dust and SST
We have carried out a correlation analysis of DA% over the dust belt of South Asia with annual averaged SSTs for the 2001–2010 and 2011–2018 periods, respectively. Maps of the spatial distribution of the correlation coefficients for these two periods are shown in Fig. 4a and b, respectively. During 2001–2010, the largest coherent region with which DA% shows a significant positive correlation encompasses the central equatorial Pacific (Fig. 4a; marked by the solid rectangle). During 2011–2018, this region contracted and shifted northwestward (Fig. 4b; solid rectangle), while two new regions of significant correlations emerged: (1) over the midlatitude North Atlantic centered on 40∘ N (significant positive correlation) and (2) over the subtropical North Atlantic centered on 20∘ N off the western coast of North Africa (significant negative correlation). These two respective regions are shown using dashed rectangles and are marked as “1” and “2” in Fig. 4b. Although a weak signature of this correlation pattern is present in 2001–2010, it emerged as significantly strong in 2011–2018. Conducting month-by-month analysis of the impact of SSTs on DA% (not shown), it is seen that the positive correlation between DA% and SST over the central equatorial Pacific during 2001–2010 is most prominent during September–October, whereas that over the North Atlantic during 2011–2018 is most prominent during April–June; these months are used here for subsequent analysis. We have constructed a North Atlantic difference index (NADI) of SST by considering the regions where DA% is significantly correlated with the North Atlantic SST, as seen in Fig. 4b. The NADI is the standardized difference in SST over the midlatitude (region 1 – taken as 25–40∘ N, 70–25∘ W) and subtropical (region 2 – taken as 10–20∘ N, 70–25∘ W) North Atlantic, averaged for April–June. Furthermore, Fig. 4c shows the 8-year running correlations between DA% over South Asia and the September–October central equatorial Pacific SST (taken as 5∘ N–5∘ S, 175–140∘ W) and the April–June NADI, which clearly demonstrates the transition from the Pacific control of dust during 2001–2010 to the North Atlantic control of dust during 2011–2018. This justifies our basis of separation of the two periods in Fig. 4a and b. Figure 4d depicts the variation in the correlation coefficient between the April–June NADI and monthly DA% over South Asia for the respective 2001–2010 and 2011–2018 periods. Monthly DA% is simply the percentage of days in a month when T>0.6 and α<0.2. Figure 4d clearly shows that the correlation between the NADI and DA% is stronger and significant (at the 95 % confidence level) for 2011–2018, during May–October, in comparison with 2001–2010. The months with a significant correlation largely coincide with the high dust months over South Asia, where dust loads peak during May–June. During 2001–2010, the partial correlation between the annual NADI and annual DA% adjusted for annual central equatorial Pacific SST is 0.19. During 2011–2018, this improves to 0.82, which is significant at the 99 % confidence level. For 2001–2010, a significant negative relation between the NADI and DA% is seen only for the month of February.
The central equatorial Pacific, where the SST is significantly correlated with DA% during 2001–2010, is historically a prime region driving the variability in the SWM and, by some extension, dust emission and transport. Since the 1990s, stronger El Niño signals have been detected in the central Pacific SST compared with the eastern Pacific (Yeh et al., 2009; Lee and McPhaden, 2010). Interestingly, there was a cooling trend in the central Pacific SST from 2001 to 2010 (of −0.8∘ C per decade), during which time this region was a major driver of DA% over South Asia (solid box in Fig. 5a). This formed a part of the hiatus within the ongoing global warming trend since the beginning of the 21st century, leading to a slowdown in global mean surface temperature warming rate to 0.02–0.09∘ C per decade (Xie and Kosaka, 2017). Several studies have shown that this has coincided with the negative phase of the Pacific decadal oscillation and has been largely attributed to the internal variability over the Pacific Ocean (Kosaka and Xie, 2013, 2016; Trenberth and Fasullo, 2013; England et al., 2014). The extreme El Niño of 2015 brought about the end of the global warming hiatus (Hu and Fedorov, 2017). This cooling trend is more prominent during the boreal winter months (Trenberth et al., 2014).
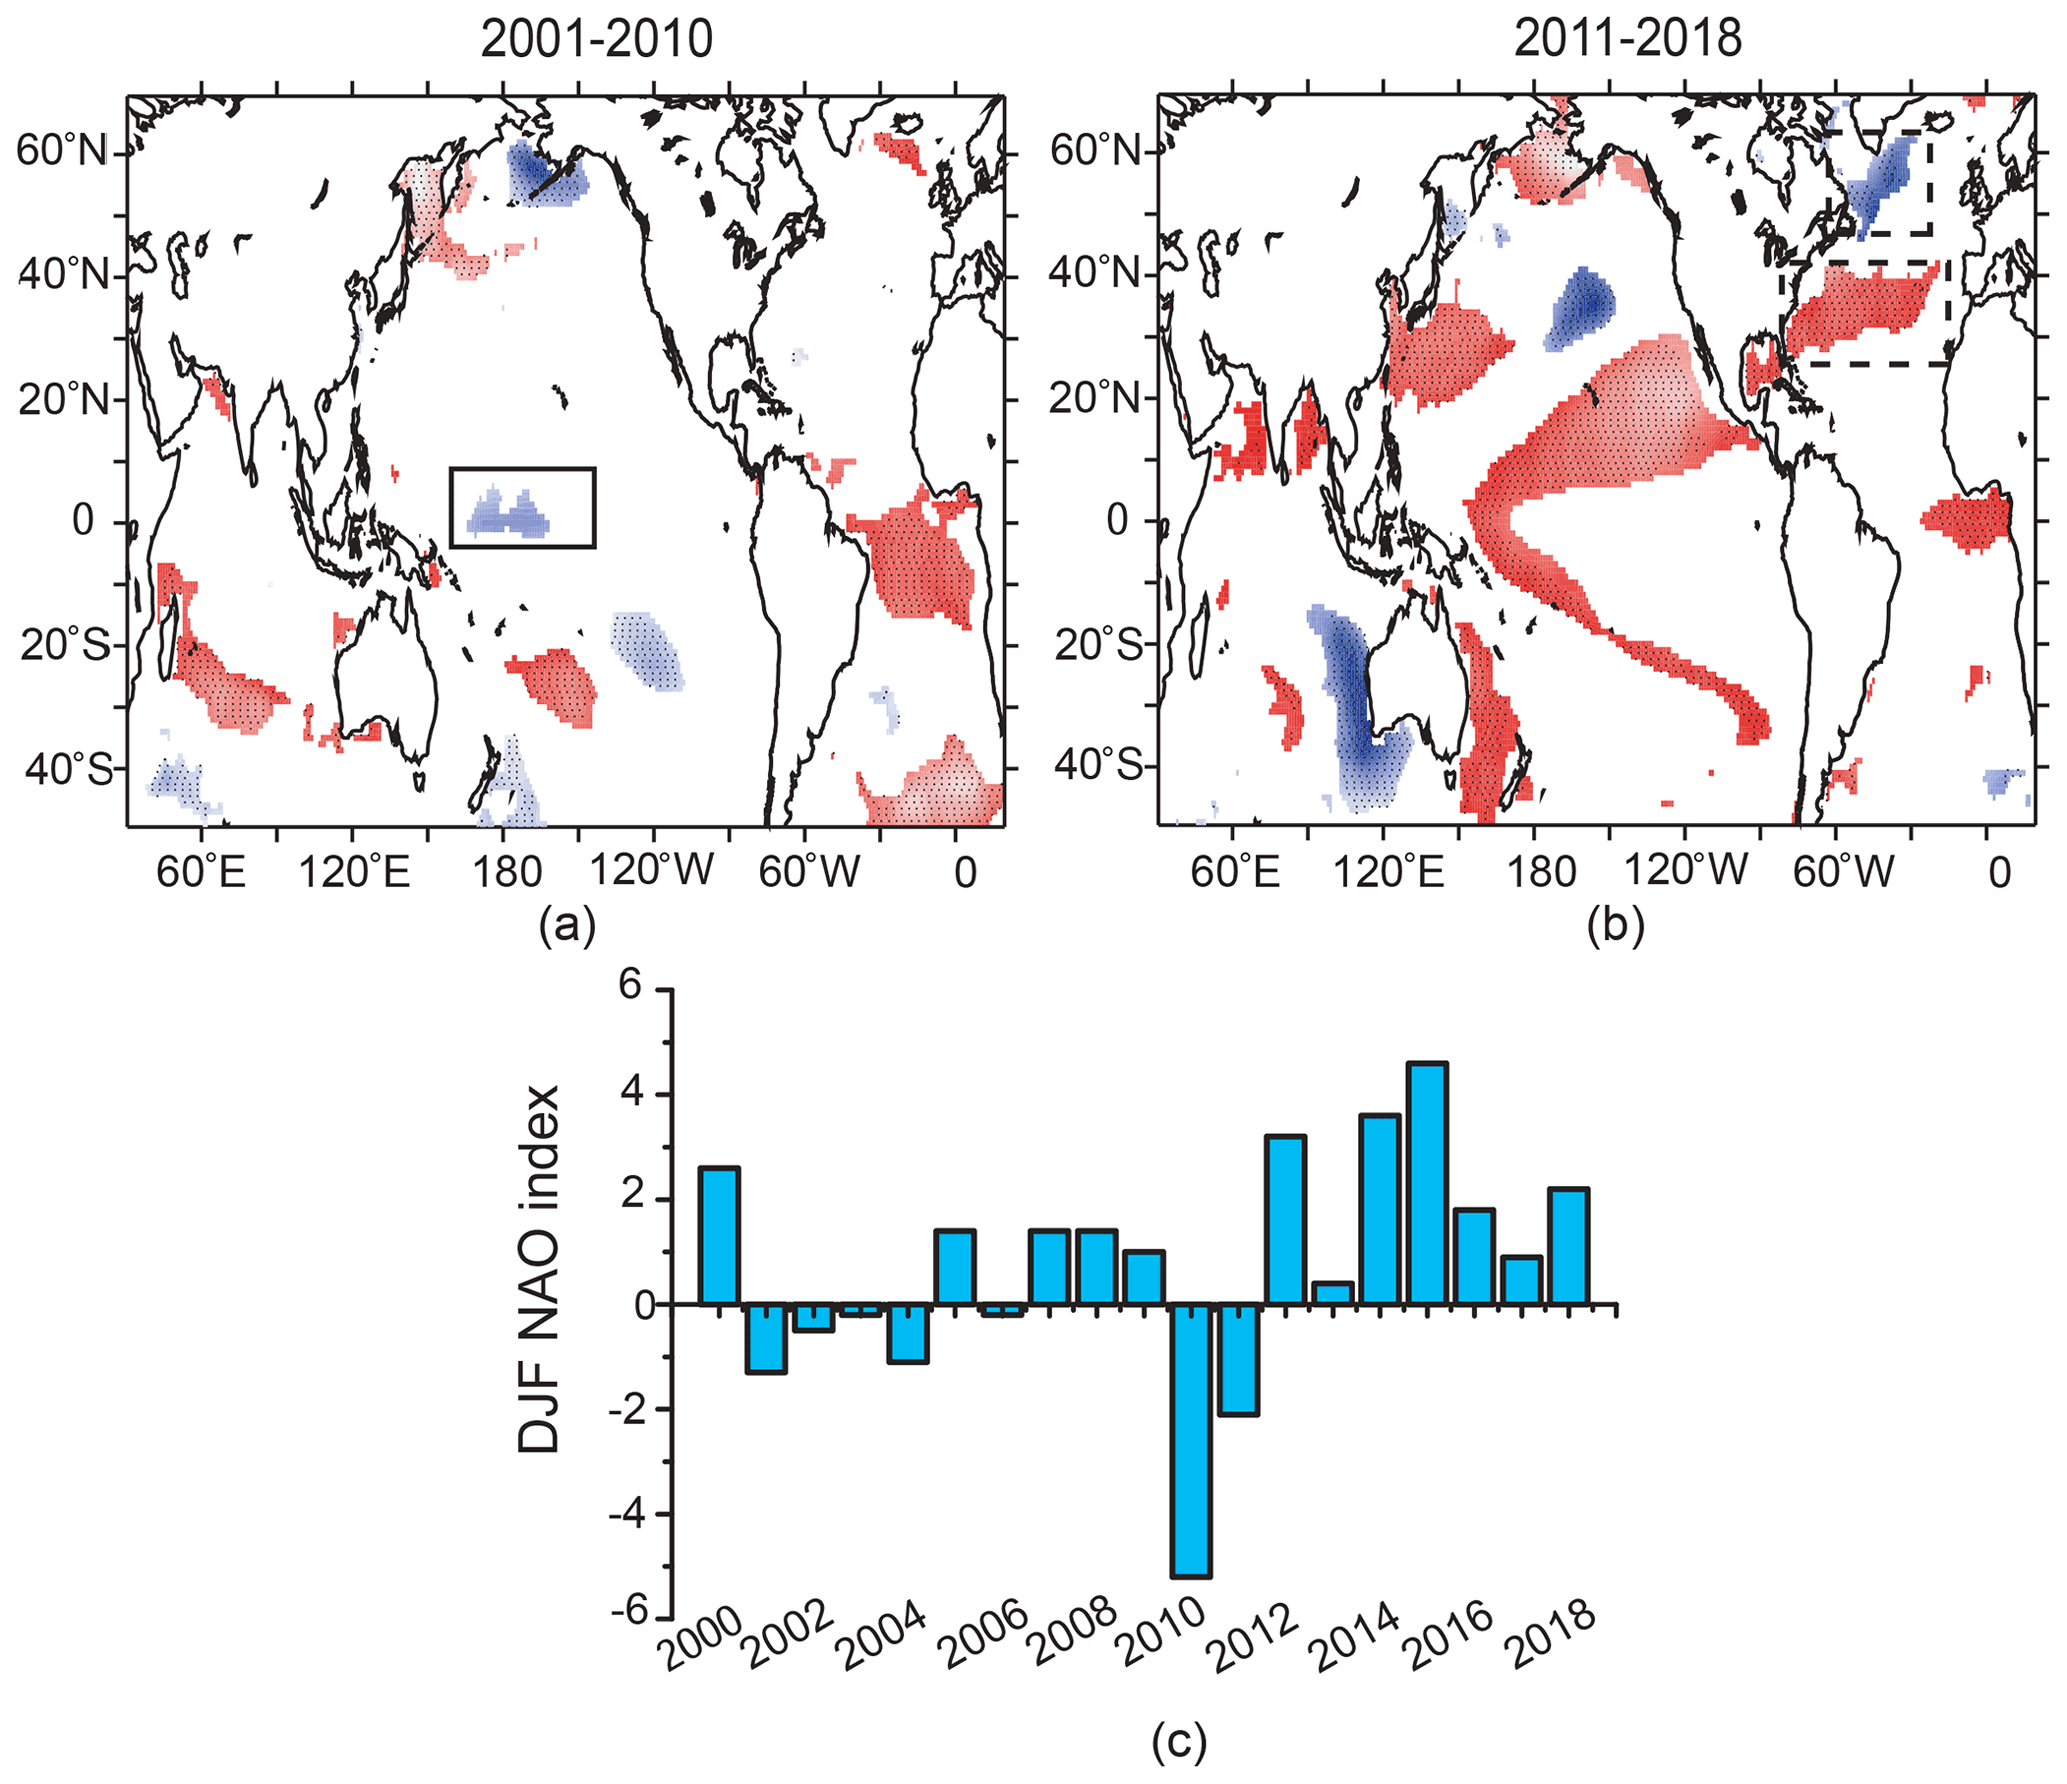
Figure 5Regions experiencing positive (red shading) and negative (blue shading) trends in sea surface temperature during (a) September–October of 2001–2010 and (b) April–June of 2011–2018 that are significant at the 90 % confidence level. The overlaid black stippling shows the regions where the trend is significant at the 95 % confidence level. (c) Time series of the December–February Hurrell's station-based NAO index for 2000–2018.

Figure 6Correlation between the September–October central equatorial Pacific SST and different meteorological parameters averaged for May–September for (a, b) 2001–2010 and for (c, d) 2011–2018. (a, c) Shading shows the correlation between the Pacific SST and geopotential height at the 200 hPa pressure level, and the contours enclose the regions where correlations are significant at the 95 % confidence level. (b, d) Solid red (dashed blue) contours enclose regions with a positive (negative) correlation between the Pacific SST and precipitation that is significant at the 95 % confidence level. Arrows show the correlation between the Pacific SST and wind vectors averaged over 850–700 hPa pressure levels. Light blue shading highlights the regions where one of the components of the wind vector has a significant (at the 95 % confidence level) correlation.
With the end of the global warming hiatus, the North Atlantic Ocean emerged as an important driver of the interannual variability in DA% over South Asia during the 2011–2018 period. A few recent studies have shown that the Atlantic Ocean has assumed increasing influence over the climate of the Asian monsoon region since late 1970s, as the influence of the tropical Pacific has decreased (Kucharski et al., 2007; Sabeerali et al., 2019; Srivastava et al., 2019). This, in turn, impacts the circulation responsible for dust uplift and transport. The spatial pattern of the correlation between DA% and SST for 2011–2018 in Fig. 4b shows a resemblance to the SST tripole pattern resulting from surface heat exchanges during the positive phase of the NAO (Bjerkness, 1964; Visbeck et al., 2001; Rodwell et al., 1999; Han et al., 2016). In general, the positive phase of the NAO results in a positive SST anomaly over the midlatitude North Atlantic and negative SST anomalies over the subtropical and the subpolar North Atlantic (also see Supplement Fig. S2a, b, c). DA% is significantly correlated with the regions associated with these midlatitude (region 1 in Fig. 4b) and subtropical (region 2 in Fig. 4b) arms of the SST tripole. This tripole has recently changed sign from being negative (warm phase) during 2001–2010 to positive (cold phase) during 2011–2018 (Supplement Fig. S2d, e). That is, during 2011–2018, the SST over the North Atlantic shows a decreasing trend in the subtropics (centered on 20∘ N), which is not significant, a significant (at the 95 % confidence level) increasing trend over the midlatitude (centered on 40∘ N), and a significant decreasing trend in the subpolar region (centered on 60∘ N, dashed boxes in Fig. 5b). The SST trends over the North Atlantic during 2001–2010, on the other hand, are not significant. In fact, the December–February NAO index was neutral to negative during 2001–2010 (average NAO index of −0.4) and changed to positive during 2011–2018 (average NAO index of 2.4) (Delworth et al., 2016; Iles and Hegerl, 2017) in tune with the switch in the sign of SST tripole during this period (Fig. 5c). However, as is shown in Sect. 3.3, during 2011–2018 there was also a change in the relation between the North Atlantic SST anomalies, NADI, and NAO, which remotely impacts circulation over South Asia. Thus, in summary, with the resumption of global warming, the North Atlantic SST seems to assume importance in controlling dust activity over South Asia, indicating a shift from the well-known importance of the Pacific SST. This takes place during a persistent positive phase of NAO and positive (cold) phase of the North Atlantic SST tripole. In the following sections, we show how the Pacific Ocean influence on the circulation controlling South Asian dust is reduced during 2011–2018. This is followed by a discussion on the physical mechanism responsible for North Atlantic SST leading to increased South Asian dust activity during this period.
3.2 Reduced influence of the Pacific Ocean on South Asian dust
Several studies have linked warming of the central equatorial Pacific Ocean, associated with the developing phase of an El Niño, to weak monsoon conditions over South Asia and drought (e.g., Kumar at al., 2006; Ashok et al., 2007; Wang et al., 2015). This is due to the shifts in the Walker circulation leading to anomalous ascending motion over the warm SST region and compensatory descending motion over South Asia. In Fig. 6a and b, we can see such signatures of weakening of the monsoon induced by central equatorial Pacific SST warming during the September–October months of 2001–2010. This is characterized by anomalous lowering of the 200 hPa geopotential height over South Asia during May–September due to reduced diabatic heating. There is anomalous near-surface northerly wind over the northern IO and negative precipitation anomalies over a large part of India and its surroundings. The negative precipitation anomalies over northwestern India, Pakistan, and Afghanistan along with anomalous northwesterly winds at 850–700 hPa over the Indo-Gangetic Plain are most relevant to increased dust emission, transport, and longer atmospheric residence time due to less wet deposition. In contrast, during 2011–2018, the central Pacific SST does not have any significant impact on geopotential height and precipitation over the dust belt of South Asia (Fig. 6c, d). This points to a weakening relation between central Pacific SST and atmospheric circulation over South Asia. The northwesterly wind anomaly induced over some parts of the Indo-Gangetic Plain during this period overlaps partially with dust source regions. Overall, it appears that dryness due to the suppression of precipitation over a large area plays an important role compared with anomalous wind in the lower troposphere to mid-troposphere. Partial correlation between annual averaged central equatorial Pacific SST and DA% adjusted for the annual NADI gives a correlation coefficient of 0.64 during 2001–2010, which is significant at the 95 % confidence level. However, for the 2011–2018 period, the partial correlation only yields a value of −0.23.
3.3 Physical mechanism linking South Asian dust to Atlantic SST
The observations in Sect. 3.1 invoke the following question: what was the possible mechanism via which changes in the North Atlantic SST impacted South Asian dust activity during 2011–2018, when the Pacific Ocean influence was reduced? The April to June North Atlantic difference index (NADI, described in Sect. 3.1) is more strongly and persistently correlated with the winter and spring NAO index during 2001–2010 than during 2011–2018 (Fig. 7). This indicates that, although persistent positive phases of the NAO and SST tripole is observed, the relation between the winter and spring NAO and NADI (via SST tripole) has changed during the 2011–2018 period. This has impacted circulation over South Asia and, hence, the dust load. To understand the mechanism involved, we have estimated the correlation between the April–June NADI and different meteorological fields averaged for the months from May to September, during which time the NADI is significantly correlated with DA% (see Fig. 4d) and high dust activity is also widespread over South Asia. The results in Fig. 8 reveal that, during 2001–2010, the NADI leads to a cyclonic circulation anomaly at the 500–200 hPa pressure level northwest off the British Isles (red box in Fig. 8a) and a tripole-like SST anomaly with warming in the Norwegian Sea (Fig. 8b). This resembles the summertime East Atlantic (SEA) pattern, which is the second dominant mode of variability after the NAO over the North Atlantic Ocean during summer (Wulff et al., 2017; Ossó et al., 2018, 2020), although there are certain differences: (1) the cold subpolar arm of the SST tripole has greater southward extension (Fig. 8b) and (2) an additional positive sea level pressure anomaly along western North Atlantic between 10 and 50∘ N is detected (Fig. 8c). The cyclonic circulation anomaly extends through the entire depth of the troposphere (not shown) and emanates a wave train (Borah et al., 2020), as indicated by anomalies of the meridional wind in Fig. 8a. Anticyclonic circulation over Southwest Asia associated with the wave train translates to anomalous near-surface northerly winds over the central Indo-Gangetic Plain and the Bay of Bengal (Fig. 9a). This signals a weakening of the SWM circulation. The velocity potential at the 850 hPa pressure level (green contours in Fig. 8c) during May–September of 2001–2010 points to large-scale descending motion and divergence over the North Atlantic. This is associated with negative precipitation anomalies over the cooler SST regions of the North Atlantic as well as over the Sahel (green contours in Fig. 8b). The impact of the NADI over South Asia is mostly felt through the reduction in precipitation over west India and westerly wind anomalies in the south-central Indo-Gangetic Plain. Negative precipitation anomalies are also present over the dust source regions of the Middle East and the southern part of Central Asia.

Figure 7Correlation between the seasonal NAO index and the April–June North Atlantic difference index (NADI) for 2001–2010 and 2011–2018. The blue and pink horizontal lines indicate the 95 % confidence levels for 2001–2010 and 2011–2018, respectively.
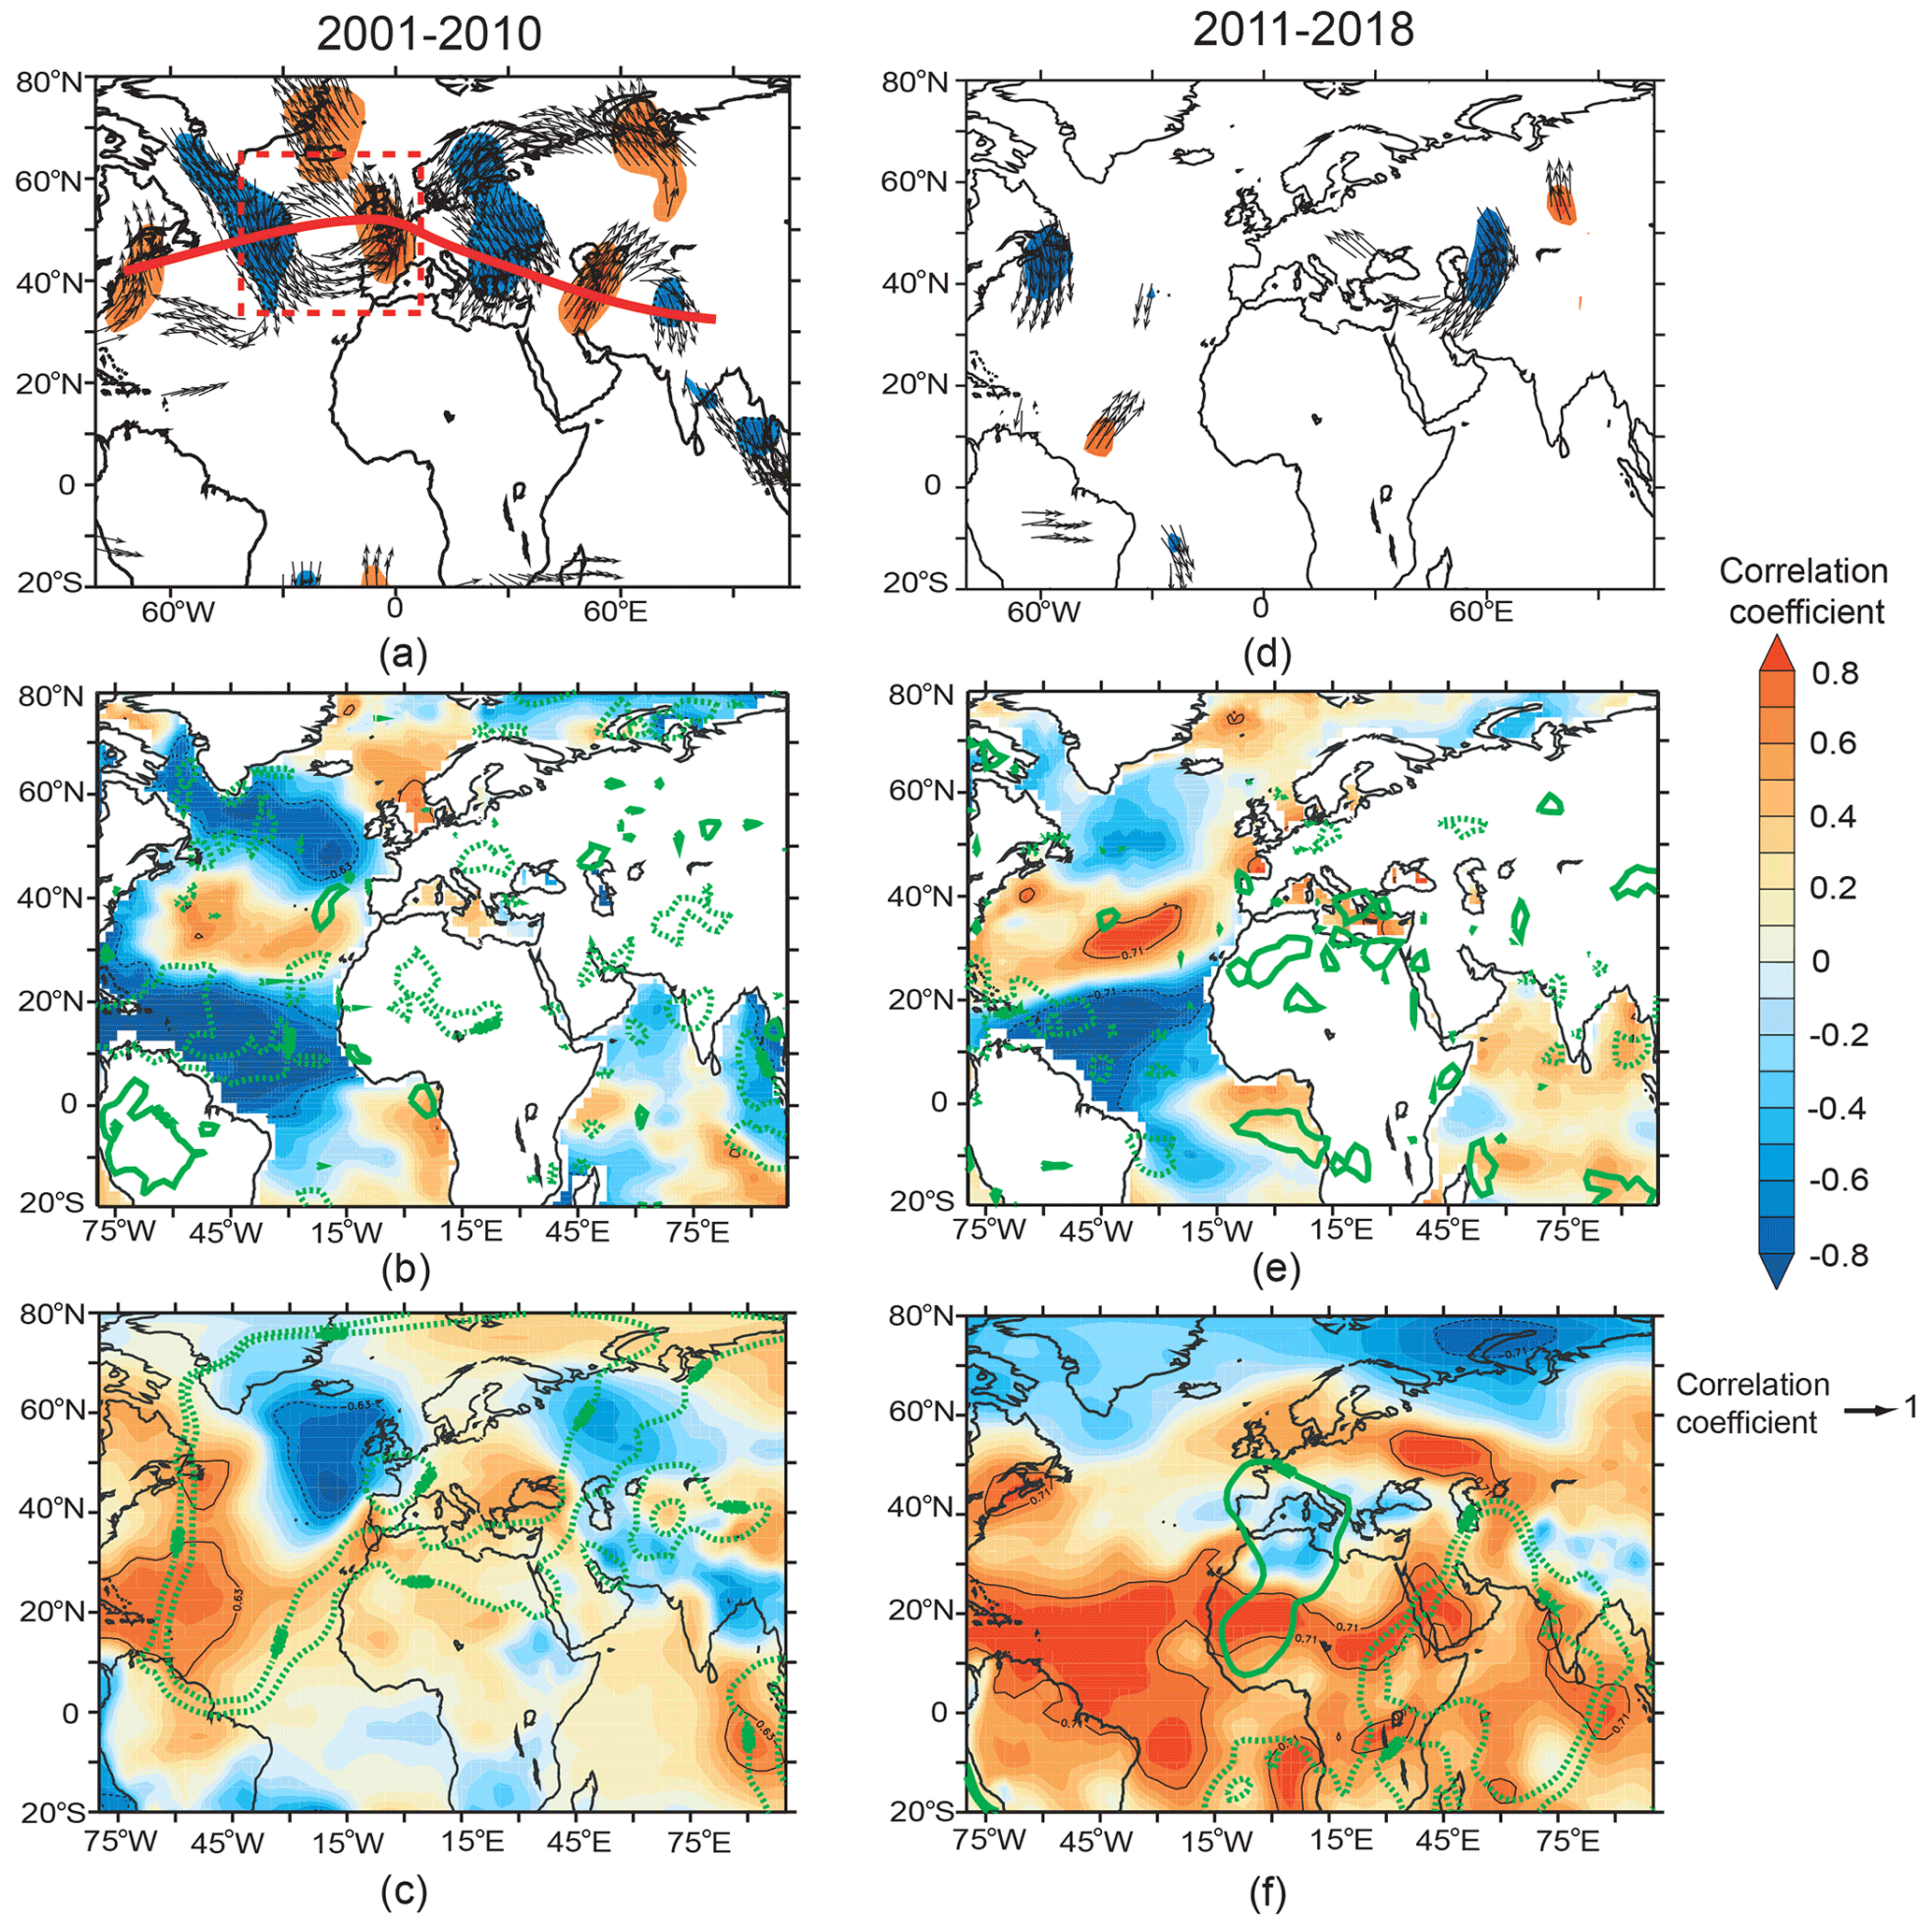
Figure 8Correlation between the April–June North Atlantic difference index (NADI) and different meteorological parameters from the NCEP/NCAR Reanalysis averaged for May–September for (a–c) 2001–2010 and (d–f) 2011–2018. (a, d) Arrows show the correlation between the NADI and wind vectors averaged between the 500 and 200 hPa pressure levels that are significant at the 95 % confidence level. Red and blue shading highlight the regions where the meridional component of the wind has significant (at the 95 % confidence level) positive and negative correlations with the NADI, respectively. (b, e) Shading shows the correlation between the NADI and SST, and the green contours enclose the regions where a significant correlation (at the 95 % confidence level) exists between the NADI and precipitation. Black contours indicate the regions where the correlation between the NADI and SST is significant at the 95 % confidence level. (c, f) Shading shows the correlation between the NADI and sea level pressure, and the green contours enclose the regions where a significant correlation exists between the NADI and velocity potential at the 850 hPa pressure level: inner and outer contours indicate the 95 % and 90 % confidence levels, respectively. Black contours indicate the regions where the correlation between the NADI and sea level pressure is significant at the 95 % confidence level. For all of the panels, solid and dashed contours are indicative of significant positive and negative correlations, respectively.
During 2011–2018, the significant imprint of the NADI on the SEA wind pattern northwest off the British Isles is absent, along with a weakening of the wave train (Fig. 8d), implying a shift in the relation between them. The anomalous southwesterlies over the eastern part of the Caspian Sea are replaced by anomalous northerlies. Near the surface level, this translates to stronger northerlies and northwesterlies over the dust source regions of southwest Asia and northwestern India (Fig. 9b). With the North Atlantic SST tripole changing sign from warm during 2001–2010 to cold during 2011–2018 (Supplement Fig. S2d, e), the NADI is significantly correlated with the midlatitude and subtropical arms of the SST tripole but not with the subpolar arm of the SST tripole (shading in Fig. 8e). Additionally, there is an eastward shift in the region of positive correlation between the NADI and the midlatitude arm of the tripole and a southward shift in the region of negative correlation between the NADI and the subtropical arm of the tripole. The region of low pressure off the British Isles, seen during 2001–2010, is absent during 2011–2018 (Fig. 8f) due to the absence of the SEA pattern. Instead, a large region of positive correlation between the NADI and sea level pressure over the subtropical North Atlantic appears (Fig. 8f). Correlating the northern and southern boxes of the NADI separately with sea level pressure shows that the combined effect of SST warming over the northern box and SST cooling over the southern box leads to this anomalous high sea level pressure (Supplement Fig. S3). The northern box coincides with the location of the Azores high, which forms the northern part of the descending branch of the Hadley cell. Anomalous SST warming in this region, through overlying mass redistribution, can induce anomalous descending motion and increase sea level pressure in the tropics. As the SST over the midlatitude North Atlantic showed a significant positive trend during 2011–2018, as opposed to the 2001–2010 period, the impact of the SST over the northern box of the NADI on the sea level pressure is pronounced during 2011–2018. The eastward extension of anomalous warm midlatitude SSTs has resulted in convergence, as indicated by the 850 hPa velocity potential (green contours in Fig. 8f), and a positive precipitation anomaly over the Mediterranean region, including North Africa and the northwestern part of the Arabian Peninsula (green contours in Fig. 8e). Additionally, warming (cooling) of the tropical North Atlantic SST can induce a compensatory descending (ascending) motion over the Mediterranean region (Sun et al., 2009). The summertime wet anomaly over the Mediterranean region leads to anomalous descending motion over South Asia, the Middle East, and East Africa, which is indicated by a negative velocity potential at 850 hPa over this region (Fig. 8f). The net effect is that the region of positive sea level pressure anomalies now stretches to encompass the Sahel, the Middle East, western India, and the central part of northern IO (orange shading in Fig. 8f). Over South Asia this development suppresses the southwest monsoon circulation and precipitation over different regions of India and leads to general dryness. Together, a weakening of the southwest monsoon circulation and development of anomalous dust-bearing northerlies/northwesterlies over southwest Asia and northwestern India drives an active dust season over South Asia.
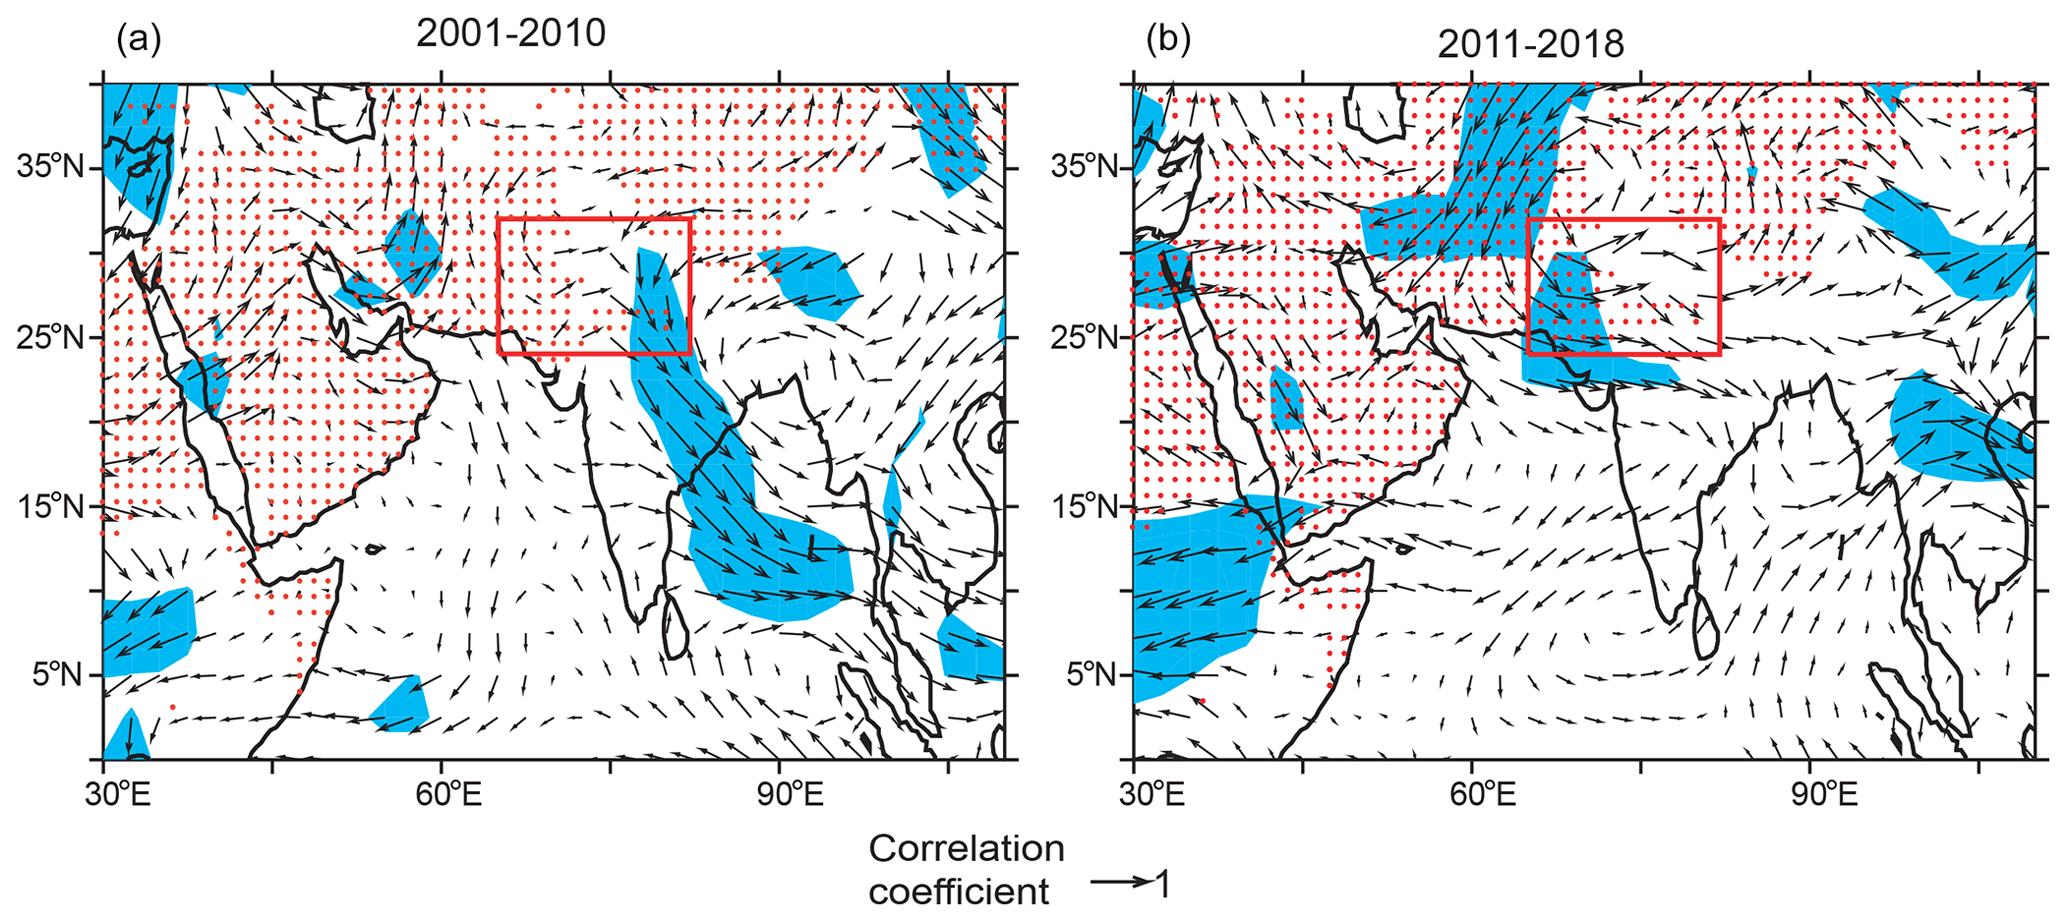
Figure 9Correlation between the April–June North Atlantic difference index (NADI) and wind averaged over 700–850 hPa for May–September for (a) 2001–2010 and for (b) 2011–2018. Light blue shading highlights the regions where one of the components of the wind vector is significantly (at the 95 % confidence level) correlated with the NADI. Red stippling show dust emission regions obtained from CESM model simulations, and the red square encloses the South Asian dust belt considered in this study.
In summary, although a persistent positive phase of the NAO prevailed during 2011–2018, a disassociation between the NAO and NADI, via changes in the North Atlantic SST anomaly pattern, influenced circulation over the Eurasian sector and over North Africa. Over South Asia and surroundings, this resulted in weakening of the Atlantic wave train, increased subsidence, and positive anomalies of sea level pressure, which resulted in general weakening of the monsoon and strengthening of the dust-transporting northerlies and westerlies.
3.4 CESM simulation of Atlantic Ocean influence
The teleconnection between the North Atlantic SST and dust load over South Asia is explored further with the help of CESM simulations, with a view to isolating the contributions of North Atlantic SST anomalies. To achieve this, we have compared two sets of simulations, as explained in Sect. 2.2, for 10 model years: one with climatological SST (Ctrl run) and the other with the SST trend for 2011–2018 superposed on the climatological SST over the North Atlantic (NAtl run). The difference (NAtl − Ctrl run) yields the contribution solely from North Atlantic SST anomalies. It is important to note here that while the NADI reflects the gradient between the midlatitude and subtropical branches of North Atlantic SST, SST anomalies imposed for the NAtl run illustrate the response due to the spatial pattern of SST anomalies over the entire North Atlantic due to a persistent positive phase of the NAO. As discussed in Sect. 2.3, although there are certain limitations, CESM can reproduce the main aspects of atmospheric circulation and the spatial and temporal characteristics of dust over South Asia quite well. This gives us confidence in using the model for our present study.
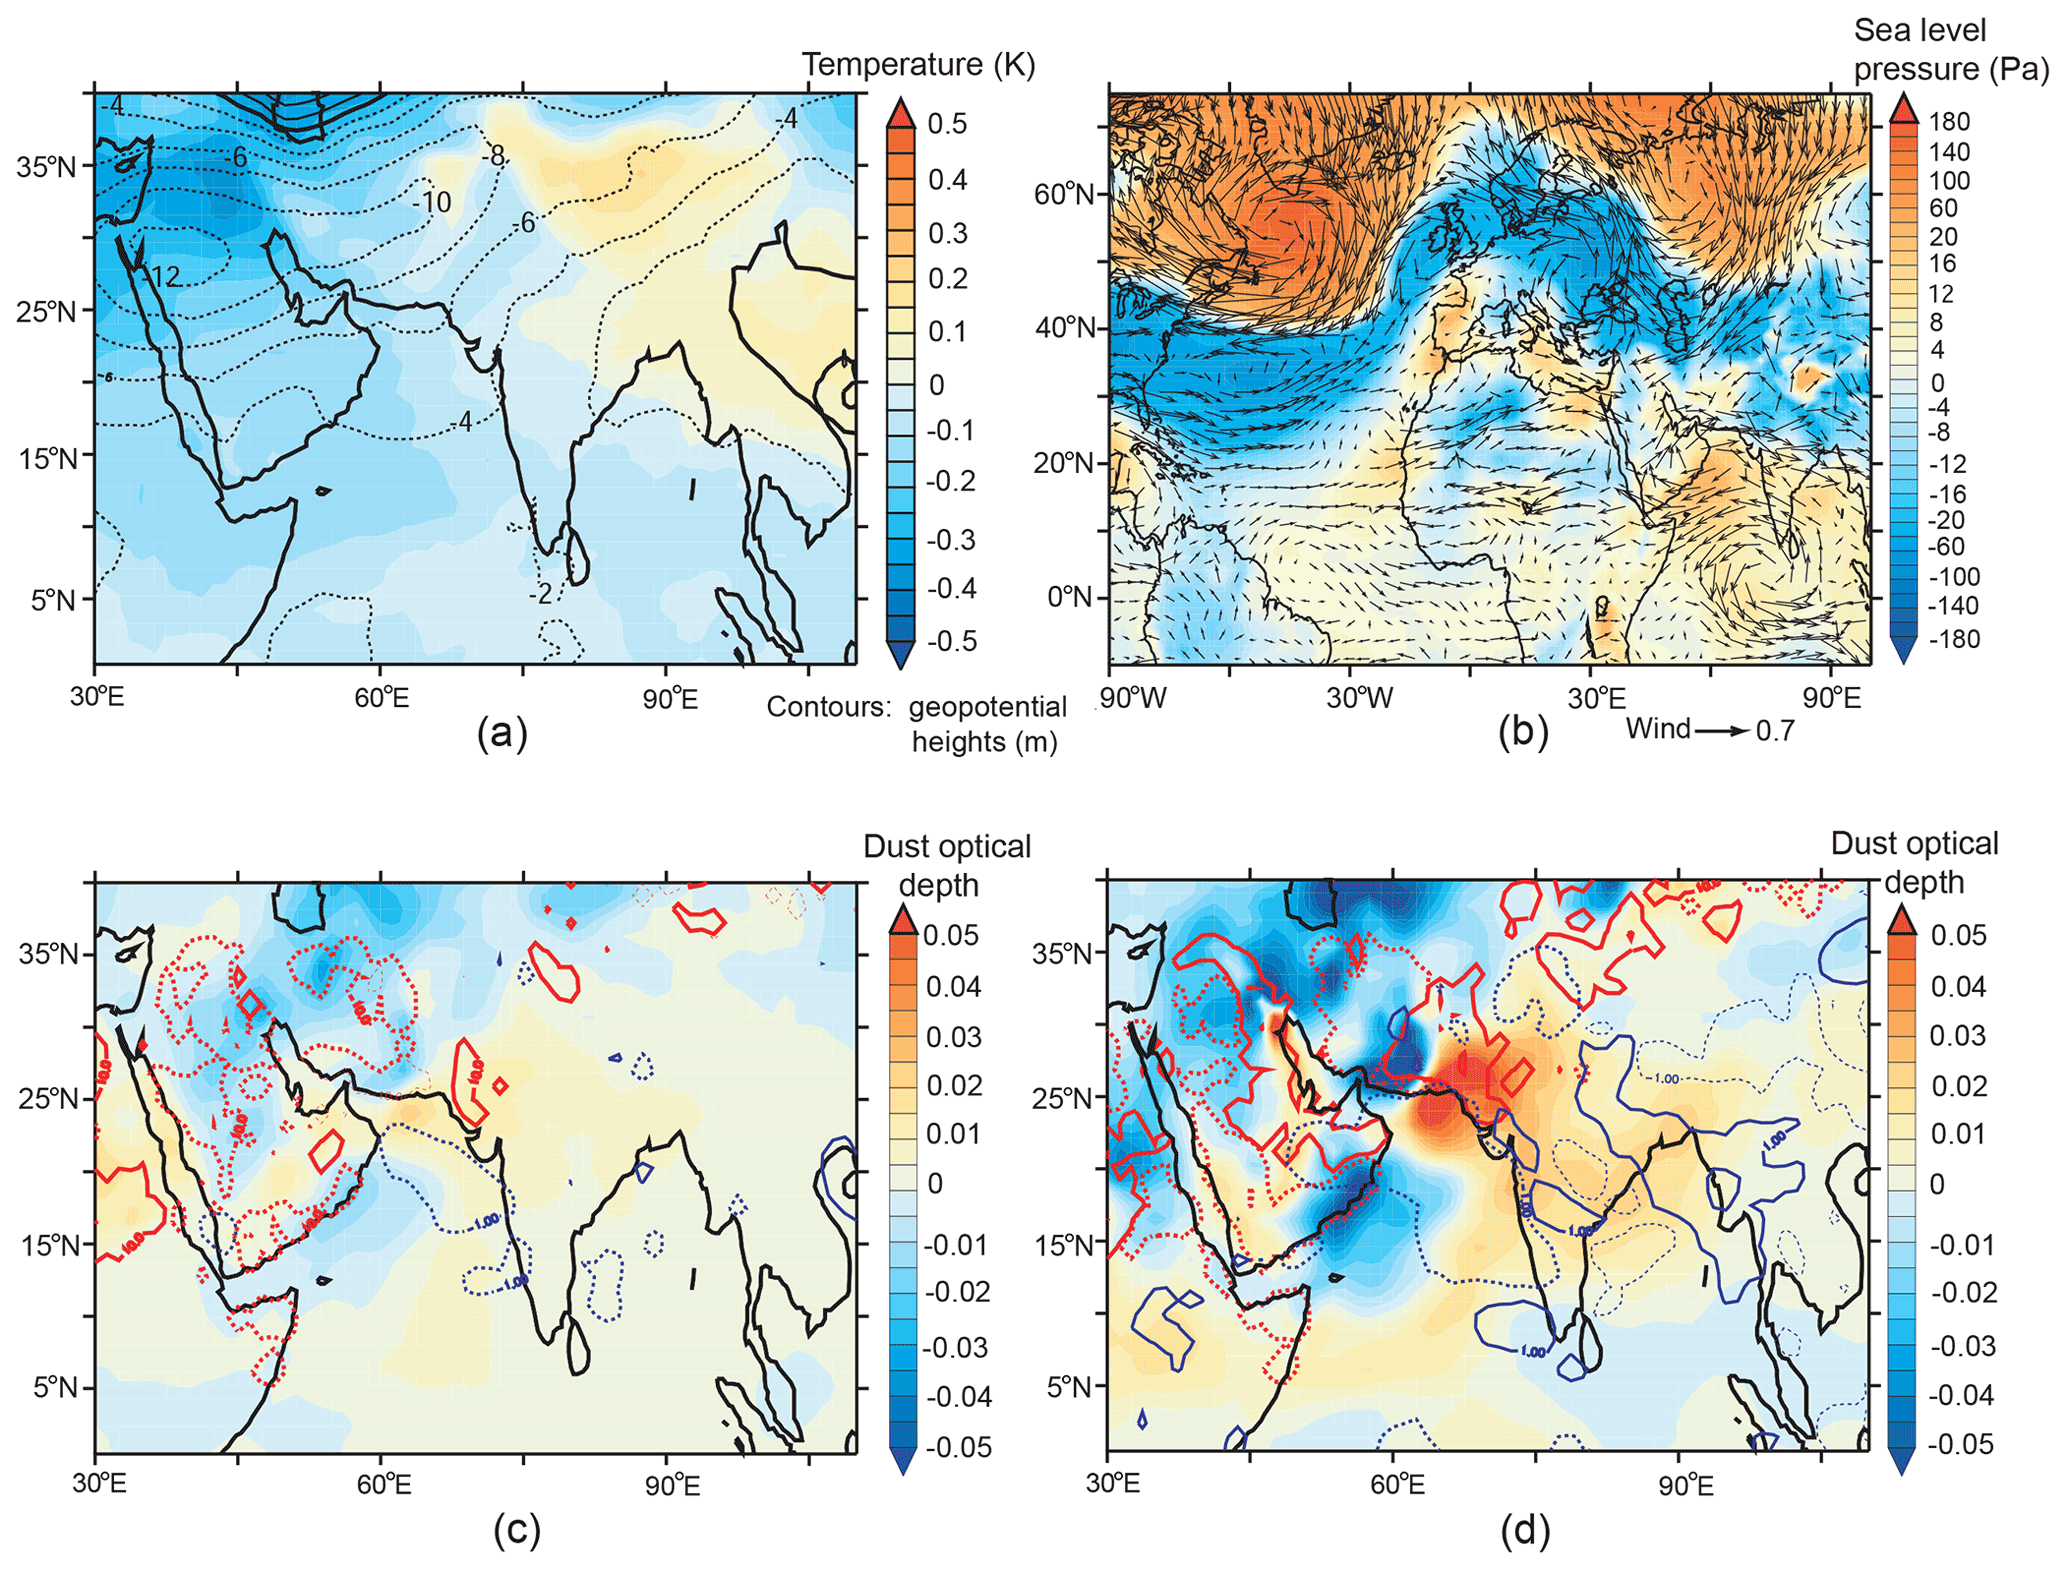
Figure 10Differences between the CESM NAtl and CESM Ctrl simulations for (a–c) May–September. (a) Shading and contours indicate differences in temperature and geopotential height, respectively, at the 200 hPa pressure level. (b) Shading indicates a difference in sea level pressure, and the arrows indicate a difference in wind vectors at the 850 hPa pressure level. (c) A difference in the dust optical depth over the northern Indian Ocean and surrounding regions is shown using shading. The thick red contours enclose the regions where the dust emission flux difference is greater than 10 mg m2 d−1, and the thin blue contours enclose the regions where the precipitation difference is greater than 1 mm d−1. Panel (d) is the same as panel (c) but for the month of June. For all contours, positive values are shown using solid lines and negative values are shown using dashed lines.
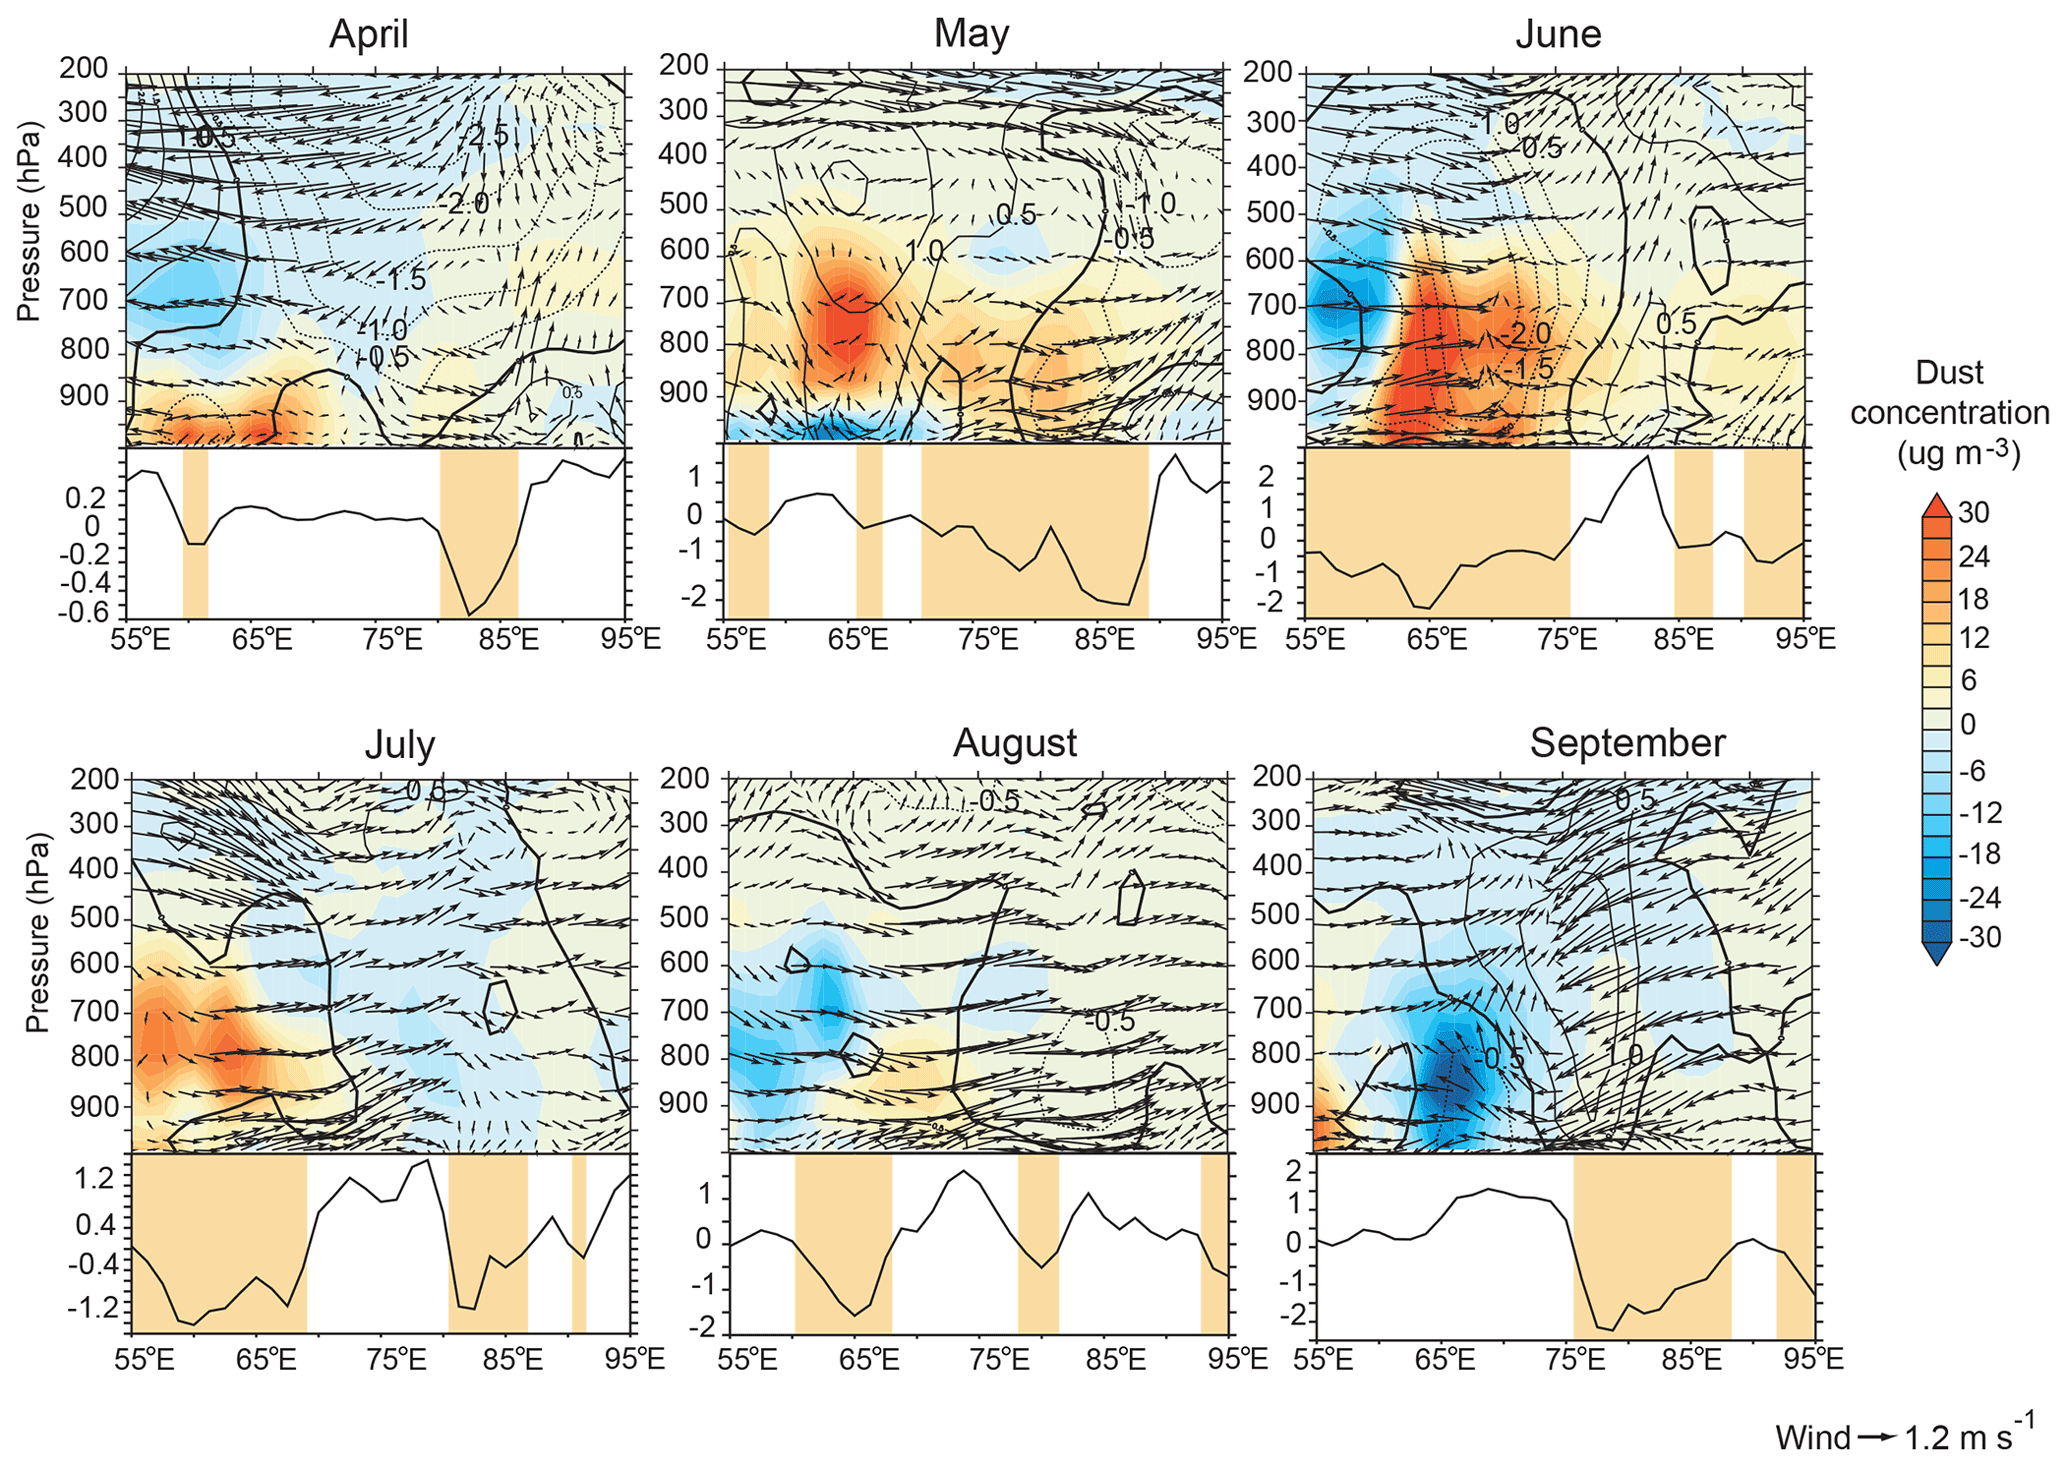
Figure 11Sections along 25∘ N illustrating month-wise differences in dust transport between the CESM NAtl and CESM Ctrl simulations. In the upper part of each panel, shading indicates the difference in dust concentrations between the two simulations, the vectors are the differences in the zonal and vertical components of wind, and the contours are the differences in the meridional component of wind. Solid (dashed) contours indicate southerly (northerly) wind anomalies. The lower part of each panel plots precipitation differences (in mm d−1) between the CESM NAtl and CESM Ctrl simulations along 25∘ N. The orange shades indicate the longitudinal belts that have negative precipitation anomalies. Note that the vertical velocity is expressed as pascals per second (Pa s−1) and has been multiplied by 40.
The differences between the NAtl and Ctrl simulations for May–September are shown in Fig. 10, which highlights that the North Atlantic SST anomaly, similar to during 2011–2018, can modulate South Asian dust activity via a combination of reduced precipitation over the northern IO and strengthening of the dust-bearing northwesterlies over the dust source regions. A cold SST tripole anomaly results in cooling in the upper troposphere and lowering of the geopotential heights over South and Southwest Asia – both of which are important indicators of a weak South Asian monsoon circulation (Fig. 10a). An east–west wave train over the midlatitude and subpolar regions of Eurasia sets in with anticyclonic circulation over the subpolar North Atlantic and cyclonic circulations over the midlatitude North Atlantic and also over the British Isles (Fig. 10b). Furthermore, a positive anomaly of sea level pressure extends eastwards from the subtropical North Atlantic and is particularly strong over the northern IO. These anomalies are similar to the response of the sea level pressure to the NADI seen in the tropics but are the opposite of that seen north of the midlatitudes (Fig. 8f). Previously, model simulations have shown that the tropical North Atlantic SST opposes the response of sea level pressure to the extratropical part of the cold SST tripole (Osborne et al., 2020). A cyclonic circulation over the central equatorial IO and an anticyclonic circulation over the northwestern IO inhibit the inflow of moisture into much of the Indian subcontinent, leading to a rainfall deficit. It is the westerlies, which form the northern branch of the anticyclone, that transport dust from the South Asian sources. For May–September, the maximum increase in the dust optical depth (Td) due to the SST tripole is located over the South Asian dust source region, with dust emissions from the Thar being the main contributor (Fig. 10c). While the increase in Td over the dust source regions is up to 10 %, dust transport by the strengthened westerlies can lead to an increase in Td of up to 20 % in the eastern Indo-Gangetic Plain. Simultaneously, anomalous southerlies and southeasterlies over the Arabian Peninsula suppress dust activity in the region (Fig. 10b, c). The peak increase in Td over South Asia due to North Atlantic SST is observed during June, when a ∼ 30 % increase in Td compared with CESM-simulated climatological values is achieved over the South Asian dust source regions (Fig. 10d). To test the significance of the positive anomalies of Td, we carried out Monte Carlo calculations by randomly selecting 6 years from the NAtl and Ctrl simulations and differencing the Td. By repeating this procedure 600 times, we find that in 90 % cases NAtl − Ctrl yields positive anomalies of Td. It is important to note that although there is a rainfall deficit over South Asia and the northern IO, only a small area within the main dust source regions is impacted. This implies that a general increase in dryness and Td due to the cold phase of the North Atlantic SST tripole is widespread over South Asia. However, the strengthened westerlies are responsible for enhanced dust flux over the dust belt of South Asia. In this context, it is also worth mentioning that earlier works have reported that cooling over the North Atlantic, either associated with the cold phase of the Atlantic multidecadal oscillation or due to the slowdown of the Atlantic meridional oscillation, is associated with a weakened monsoon (e.g., Goswami et al., 2006; Zhang and Delworth, 2006; Feng and Hu, 2008; Liu et al., 2020). At the decadal scale, rainfall data for 1901–2004 showed that the positive (cold) phase of the SST tripole is associated with excess monsoon over India due to strengthening of the westerlies over the northern IO (Krishnamurthy and Krishnamurthy, 2015). However, the sign of the correlation between the South Asian monsoon and the SST tripole has undergone changes since 2000 with the negative (warm) phase of the SST tripole being associated, with strong monsoon over South Asia and vice versa (Gao et at., 2017), implying interdecadal shifts in the relation between the two. These observations support our arguments above.
The increase in Td discussed above is enabled by strengthening of dust-transporting westerlies at the 800 hPa pressure level, which can, averaged for May–September, increase the dust concentration by 20 % at this altitude. This furthers when we analyze month-by-month changes in dust transport, as shown in Fig. 11, where a much stronger influence of the North Atlantic SST tripole on dust concentrations is evident. The positive anomalies of the dust concentration slowly start to build up during April to reach a peak during June and then subside by September. During May and June, the North Atlantic SST tripole can enhance the dust concentration by 40 %–50 % in the lower troposphere and mid-troposphere over the South Asian dust belt. These are also the months when maximum negative anomalies of precipitation are seen, following which positive anomalies of precipitation build up. During May, the maximum dust concentration anomaly centered on the 800 hPa pressure level is associated with transport from the eastern Arabian Peninsula (due to anomalous southwesterly winds). During June, on the other hand, the strengthened northerlies transport dust all the way from the eastern part of Central Asia into South Asia between 60 and 75∘ E. Additionally, descending motion above the 500 hPa pressure level leads to trapping of dust below this level. The overall weakening of the South Asian monsoon circulation is also demonstrated by the anomalous upper-level westerlies.
Our study underlines the need to look at large-scale factors, which are global in nature, in significantly modulating the dust load over South Asia, in addition to changes in local factors. This is specifically relevant considering that about 50 % of dust over this region is transported from remote (nonlocal) sources (Banerjee et al., 2019). In this light, we have attempted to understand how changes in large-scale SST patterns can impact dust emissions and transport pathways in this region. The “memory” of SST provides a bridge between the circulation changes taking place across the globe. Our study relies on satellite data which are only available since 2001. Even with these data, we see significant changes in terms of the relative importance of the SST from different regions in driving interannual variability in dust over South Asia.
Our study shows that the North Atlantic SST has emerged as a dominant player in controlling dust activity over South Asia during the second decade of the 21st century, in contrast to the hitherto important role played by the Pacific SST. During the global warming hiatus period of 2001–2010, the SST over the equatorial central Pacific Ocean modulated the strength of the South Asian summer monsoon and, by extension, dust levels. From 2011 onwards, persistent positive phases of the NAO resulted in a positive (cold) phase of the North Atlantic SST tripole pattern. During this period, high dust activity is associated with a negative SST anomaly over the subtropical North Atlantic and a positive SST anomaly over the midlatitude North Atlantic – the regions corresponding to the two southern arms of the North Atlantic SST tripole. The difference in SST between these two regions, which we term the North Atlantic difference index (or NADI), results in the SEA-like circulation anomaly and east–west wave train during the May–September months of 2001–2010. Interestingly, changes in the pattern of the North Atlantic SST anomalies during 2011–2018 weakened the relation between the NAO and NADI and also diluted the impact of the NADI on the SEA pattern. The result is a weakening of the South Asian monsoon circulation and development of anomalous dust-transporting northwesterlies and northerlies. This is facilitated by a weakening of the wave train from the North Atlantic and positive sea level pressure anomalies extending from the tropical North Atlantic into the northern IO. Sensitivity studies conducted with the CESM model show that the North Atlantic SST tripole anomaly can lead to around a 10 % increase in the dust optical depth when averaged for May–September, whereas it can contribute to a 30 % increase in the dust optical depth during the month of June. Most of the increase in the dust load can be attributed to enhanced transport at the 800 hPa pressure level, which increases the dust concentration by 20 % for May–September and by as much as 40 %–50 % during May–June.
The present study demonstrates the impact of the North Atlantic Ocean using 18 years of satellite data. However, in the past, cold events in the North Atlantic have been associated with the slowdown of the South Asian monsoon system and an increase in dust fluxes over the northern Indian Ocean and Southwest Asia (e.g., Pourmand et al., 2004; Mohtadi et al., 2014; Safaierad et al., 2020). Longer-term data need to be analyzed from the recent past in order to better understand how this relation between dust and the North Atlantic SST has fluctuated over time. This will provide important clues as to how future relative changes in the global SST in a warming world can control dust fluxes over South Asia and the possible climate implications.
The code for CESM1.2 is available at https://www.cesm.ucar.edu/models/cesm1.2/ (last access: 31 August 2017, Hurrell et al., 2013).
Level 3 MODIS version 6.1 daily aerosol data were downloaded from the Level 1 and Atmosphere Archive and Distribution System (LAADS) Distributed Active Archive Center (DAAC) website (https://ladsweb.modaps.eosdis.nasa.gov/missions-and-measurements/science-domain/l3-atmosphere, last access: 5 February 2019, Hsu et al., 2004, 2006). IASI dust optical depth was obtained from https://iasi.aeris-data.fr/dust-aod_iasi_a_data/ (last access: 5 November 2019, Capelle et al., 2018). NCEP/NCAR meteorological fields (Kalnay et al., 1996), NOAA ERSST version 5 data (Huang et al., 2017), OISST version 2 (Reynolds et al., 2002), COBE SST version 2 data (Hirahara et al., 2014), and GPCP version 2.3 (Huffman et al., 1997) precipitation data were obtained from National Oceanic and Atmospheric Administration (NOAA) Physical Sciences Laboratory website (https://psl.noaa.gov/data/gridded/, last access: 29 July 2019, NCAR, 2019). Monthly PERSIANN precipitation data are maintained at the University of California, Irvine (UCI), Center for Hydrometeorology and Remote Sensing (CHRS) website (https://chrsdata.eng.uci.edu/, Ashouri et al., 2015, last access: 6 January 2020). Hurrell's station-based NAO data are available at https://climatedataguide.ucar.edu/climate-data/hurrell-north-atlantic-oscillation-nao-index-station-based (last access: 3 August 2020, Hurrell, 1995; Hurrell and Deser, 2009). AERONET coarse-mode aerosol data were obtained from https://aeronet.gsfc.nasa.gov/ (last access: 31 August 2020, AERONET, 2020).
The supplement related to this article is available online at: https://doi.org/10.5194/acp-21-17665-2021-supplement.
PB conceived the study, carried out model simulations, analyzed the data, and wrote the paper. SKS and KKM contributed to scientific analysis and revision of the paper.
The contact author has declared that neither they nor their co-authors have any competing interests.
Publisher’s note: Copernicus Publications remains neutral with regard to jurisdictional claims in published maps and institutional affiliations.
This article is part of the special issue “Interactions between aerosols and the South West Asian monsoon”. It is not associated with a conference.
We acknowledge the computational facilities provided by the Supercomputer Education and Research Centre (SERC) at the Indian Institute of Science for carrying out the CESM simulations. Sreedharan Krishnakumari Satheesh was supported by the J.C. Bose Fellowship from SERB, New Delhi, and the Tata Education and Development Trust.
This research has been supported by the Ministry of Earth Sciences (grant no. MM/NERC-MoES-1/2014/002). Priyanka Banerjee has also been supported by the Department of Science and Technology INSPIRE Faculty scheme (INSPIRE Faculty code IFA-18-EAS-72).
This paper was edited by Jerome Brioude and reviewed by Jerome Brioude and one anonymous referee.
Abish, B. and Mohanakumar, K.: Absorbing aerosol variability over the Indian subcontinent and its increasing dependence on ENSO, Glob. Planet. Change, 106, 13–19, https://doi.org/10.1016/j.gloplacha.2013.02.007, 2013.
AERONET: Aerosol Robotic network [dataset], available at: https://aeronet.gsfc.nasa.gov/, last access: 31 August 2020.
Albani, S., Mahowald, N. M., Perry, A. T., Scanza, R. A., Heavens, N. G., Zender, C. S., Maggi, V., Kok, J. F., and Otto-Bliesner, B. L.: Improved dust representation in the Community Atmosphere Model. J. Adv. Model. Earth Syst., 6, 541–570, https://doi.org/10.1002/2013MS000279, 2014.
Annamalai, H., Taguchi, B., McCreary, J. P., Nagura, M., and Miyama, T.: Systematic errors in South Asian monsoon simulation: Importance of equatorial Indian Ocean processes, J. Clim., 30, 8159–8178, https://doi.org/10.1175/JCLI-D-16-0573.1, 2017.
Ashok, K., Guan, Z., and Yamagata, T.: Impact of the Indian Ocean dipole on the relationship between the Indian monsoon rainfall and ENSO, Geophys. Res. Lett., 28, 4499–4502, https://doi.org/10.1029/2001GL013294, 2001.
Ashok, K., Guan, Z., Saji, N. H., and Yamagata, T.: Individual and combined influences of ENSO and the Indian Ocean Dipole on the Indian Summer Monsoon, J. Climate, 17, 3141–3155, https://doi.org/10.1175/1520-0442(2004)017<3141:IACIOE>2.0.CO;2, 2004.
Ashok, K., Behera, S. K., Rao, S. A., Weng, H. Y., and Yamagata, T.: El Niño Modoki and its possible teleconnection, J. Geophys. Res.-Ocean., 112, C11007, https://doi.org/10.1029/2006JC003798, 2007.
Ashouri, H., Hsu, K., Sorooshian, S., Braithwaite, D. K., Knapp, K. R., Cecil, L. D., Nelson, B. R., and Pratt, O. P.: PERSIANN-CDR: daily precipitation climate data record from multisatellite observations for hydrological and climate studies, B. Am. Meteorol. Soc., 96, 69–83, https://doi.org/10.1175/BAMS-D-13-00068.1, 2015.
Barlow, M., Heidi, C., and Bradfield, L.: Drought in Central and Southwest Asia: La Ninã, the Warm Pool, and Indian Ocean Precipitation, J. Climate, 15, 697–700, 2002.
Banerjee, P. and Kumar, S. P.: ENSO Modulation of Interannual Variability of Dust Aerosols over the Northwest Indian Ocean, J. Clim., 29, 1287–1303, https://doi.org/10.1175/JCLI-D-15-0039.1, 2016.
Banerjee, P., Satheesh, S. K., Krishnamoorthy, K., Nanjundiah, R. S., and Nair, V. S.: Long-Range Transport of Mineral Dust to the Northeast Indian Ocean: Regional versus Remote Sources and the Implications, J. Clim., 32, 1525–1549, https://doi.org/10.1175/JCLI-D-18-0403.1, 2019.
Bjerknes, J.: Atlantic air-sea interaction, Adv. Geophys., 10, 1–82 https://doi.org/10.1016/S0065-2687(08)60005-9, 1964.
Bollasina, M. A., Ming, Y., and Ramaswamy, V.: Anthropogenic aerosols and the weakening of the South Asian summer monsoon, Science, 334, 502–505, https://doi.org/10.1126/science.1204994, 2011.
Boos, W. R. and Hurley, J. V.: Thermodynamic Bias in the Multimodel Mean Boreal Summer Monsoon, J. Clim., 26, 2279–2287, https://doi.org/10.1175/jcli-d-12-00493.1, 2013.
Borah, P. J., Venugopal, V., Sukhatme, J., Muddevihal, P., and Goswami, B. N.: Indian monsoon derailed by a North Atlantic wavetrain, Science, 370, 1335–1338, https://doi.org/10.1126/science.aay6043, 2020.
Capelle, V., Chédin, A., Pondrom, M., Crevoisier, C., Armante, R., Crepeau, L., and Scott, N.: Infrared dust aerosol optical depth retrieved daily from IASI and comparison with AERONET over the period 2007–2016, Remote Sens. Environ., 206, 15–32, https://doi.org/10.1016/j.rse.2017.12.008, 2018.
Chang, C., Harr, P., and Ju, J.: Possible Roles of Atlantic Circulations on the Weakening Indian Monsoon Rainfall–ENSO Relationship, J. Clim., 14, 2376–2380, https://doi.org/10.1175/1520-0442(2001)014<2376:PROACO>2.0.CO;2, 2001.
Chattopadhyay, R., Phani, R., Sabeerali, C. T., Dhakate, A. R., Salunke, K. D., Mahapatra, S., Suryachandra Rao, A., and Goswami, B. N.: Influence of extratropical sea-surface temperature on the Indian summer monsoon: An unexplored source of seasonal predictability, Q. J. Roy. Meteor. Soc., 141, 2760–2775, https://doi.org/10.1002/qj.2562, 2015.
Delworth, T. L., Zeng, F., Vecchi, G. A., Yang, X., Zhang, L., and Zhang, R.: The North Atlantic Oscillation as a driver of rapid climate change in the Northern Hemisphere, Nat. Geosci., 9, 509–513, https://doi.org/10.1038/ngeo2738, 2016.
Deser, C., Guo, R., and Lehner, F.: The relative contributions of tropical Pacific sea surface temperatures and atmospheric internal variability to the recent global warming hiatus, Geophys. Res. Lett., 44, 7945–7954, https://doi.org/10.1002/2017GL074273, 2017a.
Deser, C., Hurrell, J. W., and Phillips, A.S.: The role of the North Atlantic Oscillation in European climate projections, Clim. Dynam., 49, 3141–3157, https://doi.org/10.1007/s00382-016-3502-z, 2017b.
Deepshikha, S., Satheesh, S. K., and Srinivasan, J.: Dust aerosols over India and adjacent continents retrieved using METEOSAT infrared radiance Part II: quantification of wind dependence and estimation of radiative forcing, Ann. Geophys., 24, 63–79, https://doi.org/10.5194/angeo-24-63-2006, 2006.
England, M. H., McGregor, S., Spence, P., Meehl, G. A., Timmermann, A., Cai, W., Gupta, A. S., McPhaden, M. J., Purich, A., and Santoso, A.: Recent intensification of wind-driven circulation in the Pacific and the on-going warming hiatus, Nat. Clim. Change, 4, 222–227, https://doi.org/10.1038/nclimate2106, 2014.
Feng, S. and Hu, Q.: How the North Atlantic Multidecadal Oscillation may have influenced the Indian summer monsoon during the past two millennia?, Geophys. Res. Lett., 35, L01707, https://doi.org/10.1029/2007GL032484, 2008.
Folland, C. K., Knight, J., Linderholm, H. W., Fereday, D., Ineson, S., and Hurrell, J. W.: The summer North Atlantic Oscillation: past, present, and future, J. Clim., 22, 1082–1103, 2009.
Gao, M., Sherman, P., Song, S., Yu, Y., Wu, Z., and McElroy, M. B.: Seasonal prediction of Indian wintertime aerosol pollution using the ocean memory effect, Sci. Adv., 5, eaav4157, https://doi.org/10.1126/sciadv.aav4157, 2019.
Gao, Y., Wang, H. J., and Chen, D.: Interdecadal variations of the South Asian summer monsoon circulation variability and the associated sea surface temperatures on interannual scales, Adv. Atmos. Sci., 34, 816–832, https://doi.org/10.1007/s00376-017-6246-8, 2017.
Gastineau, G. and Frankignoul, C.: Influence of the North Atlantic SST Variability on the Atmospheric Circulation during the Twentieth Century, J. Clim., 28, 1396–1416, https://doi.org/10.1175/JCLI-D-14-00424.1, 2015.
Ginoux, P., Prospero, J. M., Gill, T. E., Hsu, N. C., and Zhao, M.: Global-scale attribution of anthropogenic and natural dust sources and their emission rates based on MODIS Deep Blue aerosol products, Rev. Geophys., 50, RG3005, https://doi.org/10.1029/2012RG000388, 2012.
Goswami, B. N., Madhusoodanan, M., Neema, C., and Sengupta, D.: A physical mechanism for North Atlantic SST influence on the Indian summer monsoon, Geophys. Res. Lett., 33, L02706, https://doi.org/10.1029/2005GL024803, 2006.
Han, Z., Luo, F. F., and Wan, J. H.: The observational influence of the North Atlantic SST tripole on the early spring atmospheric circulation, Geophys. Res. Lett., 43, 2998–3003, https://doi.org/10.1002/2016GL068099, 2016.
Hanf, F. S. and Annamalai, H.: Systematic Errors in South Asian Monsoon Precipitation: Process-Based Diagnostics and Sensitivity to Entrainment in NCAR Models, J. Clim., 33, 2817–2840, https://doi.org/10.1175/JCLI-D-18-0495.1, 2020.
Hirahara, S., Ishii, M., and Fukuda, Y.: Centennial-scale sea surface temperature analysis and its uncertainty, J. Clim., 27, 57–75, https://doi.org/10.1175/JCLI-D-12-00837.1, 2014.
Hsu, N. C., Tsay, S. C., King, M. D., and Herman, J. R.: Aerosol Properties over Bright-Reflecting Source Regions, IEEE T. Geosci. Remote, 42, 557–569, https://doi.org/10.1109/TGRS.2004.824067, 2004.
Hsu, N. C., Tsay, S.-C., King, M. D., and Herman, J. R.: Deep Blue retrievals of Asian aerosol properties during ACE-Asia, IEEE T. Geosci. Remote Sens., 44, 3180–3195, https://doi.org/10.1109/TGRS.2006.879540, 2006.
Hu, S. and Fedorov, A. V.: The extreme El Niño of 2015–2016 and the end of global warming hiatus, Geophys. Res. Lett., 44, 3816–3824, https://doi.org/10.1002/2017GL072908, 2017.
Huang B., Thorne, P. W., Banzon, V. F., Boyer, T., Chepurin, G., Lawrimore, J. H., Menne, M. J., Smith, T. M., Vose, R. S., and Zhang, H-M.: Extended Reconstructed Sea Surface Temperature, Version 5 (ERSSTv5): Upgrades, Validations, and Intercomparisons, J. Clim., 30, 8179–8205, https://doi.org/10.1175/JCLI-D-16-0836.1, 2017.
Huang, X., Zhou, T., Turner, A., Dai, A., Chen, X., Clark, R., and Zou, L.: The Recent Decline and Recovery of Indian Summer Monsoon Rainfall: Relative Roles of External Forcing and Internal Variability, J. Clim., 33, 5035–5060, https://doi.org/10.1175/jcli-d-19-0833.1, 2020.
Huffman, G. J., Alder, R. F., Arkin, P., Chang, A., Ferraro, R., Gruber, A., Janowiak, J., McNab, A., Rudolf, B., and Schneider, U.: The Global Precipitation Climatology Project (GPCP) Combined Precipitation Dataset, B. Am. Meteorol. Soc., 78, 5–20, https://doi.org/10.1175/1520-0477(1997)078<0005:TGPCPG>2.0.CO;2, 1997.
Hurrell, J. W.: Decadal trends in the North Atlantic oscillation: Regional temperatures and precipitation, Science, 269, 676–679, https://doi.org/10.1126/science.269.5224.676, 1995.
Hurrell, J. W. and Deser C.: North Atlantic climate variability: the role of the North Atlantic Oscillation, J. Mar. Syst., 78, 28–41, https://doi.org/10.1016/j.jmarsys.2008.11.026, 2009.
Hurrell, J. W., Hack, J. J., Shea, D., Caron, J. M., and Rosinski, J.: A New Sea Surface Temperature and Sea Ice Boundary Dataset for the Community Atmosphere Model, J. Clim., 21, 5145–5153, https://doi.org/10.1175/2008JCLI2292.1, 2008.
Hurrell, J. W., Holland, M. M., Gent, P. R., Ghan, S., Kay, J. E., Kushner, P. J., amarque, J. F., Large, W. G., Lawrence, D., Lindsay, K., Lipscomb, W. H., Long, M. C., Mahowald, N., Marsh, D. R., Neale, R. B., Rasch, P., Vavrus, S., Vertenstein, M., Bader, D., Collins, W. D., Hack, J. J., Kiehl, J. T., and Marshall, S.: The community earth system model: A framework for collaborative research, B. Am. Meteorol. Soc., 94, 1339–1360, https://doi.org/10.1175/BAMS-12-00121.1, 2013.
Iles, C. and Hegerl, G.: Role of the North Atlantic Oscillation in decadal temperature trends, Environ. Res. Lett., 12, 114010, https://doi.org/10.1088/1748-9326/aa9152, 2017.
Jin, Q. and Wang, C.: The greening of Northwest Indian subcontinent and reduction of dust abundance resulting from Indian summer monsoon revival, Sci. Rep., 8, 4573, https://doi.org/10.1038/s41598-018-23055-5, 2018.
Jin, Q., Wei, J., and Yang, Z.-L.: Positive response of Indian summer rainfall to Middle East dust, Geophys. Res. Lett., 41, 4068–4074, https://doi.org/10.1002/2014GL059980, 2014.
Jin, Q., Wei, J., Pu, B., Yang, Z. L., and Parajuli, S. P.: High summertime aerosol loadings over the Arabian Sea and their transport pathways, J. Geophys. Res.-Atmos., 123, 10568–10590, https://doi.org/10.1029/2018jd028588, 2018.
Kalnay, E., Kanamitsu, M., Kistler, R., Collines, W., Deaven, D., Gandin, L., Iredell, M., Saha, S., White, G., Woollen, J., Zhu, Y., Leetmaa, A., Reynolds, R., Chelliah, M., Ebisuzaki, W., Higgins, W., Janowiak, J., Mo, K. C., Ropelewski, C., and Wang, J.: The NCEP/NCAR 40-year reanalysis project, B. Am. Meteorol. Soc., 77, 437–471, https://doi.org/10.1175/1520-0477(1996)077<0437:Tnyrp>2.0.Co;2, 1996.
Kim, M.-K., Lau, W. K. M., Kim, K.-M., Sang, J., Kim, Y.-H., and Lee, W.-S.: Amplification of ENSO effects on Indian summer monsoon by absorbing aerosols, Clim. Dynam., 46, 2657–2671, https://doi.org/10.1007/s00382-015-2722-y, 2016.
Kinter III, J., Miyakoda, K., and Yang, S.: Recent change in the connection from the Asian monsoon to ENSO, J. Clim., 15, 1203–1215, https://doi.org/10.1175/1520-0442(2002)015<1203:RCITCF>2.0.CO;2, 2002.
Kosaka, Y. and Xie, S. P.: Recent global-warming hiatus tied to equatorial Pacific surface cooling, Nature, 501, 403–407, https://doi.org/10.1038/nature12534, 2013.
Kosaka, Y. and Xie , S. P.: The tropical Pacific as a key pacemaker of the variable rates of global warming, Nat. Geosci., 9, 669–673, https://doi.org/10.1038/ngeo2770, 2016.
Krishnamurthy, L. and Krishnamurthy, V.: Teleconnections of Indian monsoon rainfall with AMO and Atlantic tripole, Clim. Dynam., 46, 2269–2285, https://doi.org/10.1007/s00382-015-2701-3, 2015.
Kucharski, F., Bracco, A., Yoo, J. H., and Molteni, F.: Low-frequency variability of the Indian monsoon – ENSO relation and the Tropical Atlantic: the “weakening” of the '80s and '90s, J. Clim., 20, 4255–4266, https://doi.org/10.1175/JCLI4254.1, 2007.
Kucharski, F., Bracco, A., Yoo, J. H., and Molteni, F.: Atlantic forced component of the Indian monsoon interannual variability, Geophys. Res. Lett., 35, L04706, https://doi.org/10.1029/2007GL033037, 2008.
Kumar, K. K., Rajagopalan, B., and Cane, K. A.: On the weakening relationship between the Indian Monsoon and ENSO, Science, 284, 2156–2159, https://doi.org/10.1126/science.284.5423.2156, 1999.
Kumar, K. K., Rajagopalan, B., Hoerling, M., Bates, G., and Cane, M. A.: Unraveling the mystery of Indian monsoon failure during El Niño, Science, 314, 115–119, https://doi.org/10.1126/science.1131152, 2006.
Lee, T. and McPhaden, M. J.: Increasing intensity of El Niño in the central-equatorial Pacific, Geophys. Res. Lett., 37, L14603, https://doi.org/10.1029/2010GL044007, 2010.
Liu, W., Fedorov, A. V., Xie, S. P., and Hu, S.: Climate impacts of a weakened Atlantic Meridional Overturning Circulation in a warming climate, Sci. Adv., 6, eaaz4876, https://doi.org/10.1126/sciadv.aaz4876, 2020.
Mahowald, N. M., Muhs, D. R., Levis, S., Rasch, P. J., Yoshioka, M., Zender, C. S., and Luo, C.: Change in atmospheric mineral aerosols in response to climate: Last glacial period, preindustrial, modern, and doubled carbon dioxide climates, J. Geophys. Res.-Atmos., 111, D10202, https://doi.org/10.1029/2005JD006653, 2006.
Mariotti, A., Zeng, N., and Lau, K.-M.: Euro-Mediterranean rainfall and ENSO – a seasonally varying relationship, Geophys. Res. Lett., 29, 1621–1625, https://doi.org/10.1029/2001GL014248, 2002.
Marticorena, B. and Bergametti, G.: Modeling the atmospheric dust cycle.1. Design of a soil-derived emission scheme, J. Geophys. Res.-Atmos., 100, 16415–16430, 1995.
Mohtadi, M., Prange, M., Oppo, D.W., De Pol-Holz, R., Merkel, U., Zhang, X., Steinke, S., and Lückge, A.: North Atlantic forcing of tropical Indian Ocean climate, Nature, 509, 76–80, 2014.
NCAR: Gridded Climate Datasets, available at: https://psl.noaa.gov/data/gridded/, last access: 29 July 2019.
Neale, R. B., Richter, J. H., Conley, A. J., Park, S., Lauritzen, P. H., and Gettleman, A.: Description of the NCAR Community Atmosphere Model (CAM 4.0), NCAR Tech. Note NCAR/TN-485+STR, 212 pp., available at: http://www.cesm.ucar.edu/models/ccsm4.0/cam/docs/description/cam4_desc.pdf (last access: 18 September 2020), 2010.
Notaro, M., Yu, Y., and Kalashnikova, O. V.: Regime shift in Arabian dust activity, triggered by persistent fertile crescent drought, J. Geophys. Res.-Atmos., 120, 10229–10249, https://doi.org/10.1002/2015JD023855, 2015.
Osborne, J. M., Collins, M., Screen, J. A., Thomson, S. I., and Dunstone, N.: The North Atlantic as a Driver of Summer Atmospheric Circulation, J. Clim., 33, 7335–7351, https://doi.org/10.1175/JCLI-D-19-0423.1, 2020.
Ossó, A., Sutton, R., Shaffrey, L., and Dong, B.: Observational evidence of European summer weather patterns predictable from spring, P. Natl. Acad. Sci. USA, 115, 59–63, https://doi.org/10.1073/pnas.1713146114, 2018.
Ossó, A., Sutton, R., Shaffrey, L., and Dong, B.: Development, Amplification, and Decay of Atlantic/European Summer Weather Patterns Linked to Spring North Atlantic Sea Surface Temperatures, J. Clim., 33, 5939–5951, https://doi.org/10.1175/JCLI-D-19-0613.1, 2020.
Pandey, S. K., Vinoj, V., Landu, K., and Babu, S. S.: Declining pre-monsoon dust loading over South Asia: Signature of a changing regional climate, Sci. Rep., 7, 16062, https://doi.org/10.1038/s41598-017-16338-w, 2017.
Pandithurai, G., Dipu, S., Dani, K. K., Tiwari, S., Bisht, D. S., Devara, P. C. S., and Pinker, R. T.: Aerosol radiative forcing during dust events over New Delhi, India, J. Geophys. Res.-Atmos., 113, D13209, https://doi.org/10.1029/2008JD009804, 2008.
Pourmand, A., Marcantonio, F., and Schulz, H.: Variations in productivity and eolian fluxes in the northeastern Arabian Sea during the past 110 ka, Earth Planet. Sc. Lett., 221, 39–54, https://doi.org/10.1016/S0012-821X(04)00109-8, 2004.
Pu, B. and Ginoux, P.: The impact of the Pacific Decadal Oscillation on springtime dust activity in Syria, Atmos. Chem. Phys., 16, 13431–13448, https://doi.org/10.5194/acp-16-13431-2016, 2016.
Pu, B. and Ginoux, P.: How reliable are CMIP5 models in simulating dust optical depth?, Atmos. Chem. Phys., 18, 12491–12510, https://doi.org/10.5194/acp-18-12491-2018, 2018.
Rajeevan, M. and Sridhar, L.: Inter-annual relationship between Atlantic sea surface temperature anomalies and Indian summer monsoon, Geophys. Res. Lett., 35, L21704, https://doi.org/10.1029/2008GL036025, 2008.
Ramanathan, V., Chung, C., Kim, D., Bettge, T., Buja, L., Kiehl, J. T., Washington, W. M., Fu, Q., Sikka, D. R., and Wild, M.: Atmospheric brown clouds: Impacts on South Asian climate and hydrological cycle, P. Natl. Acad. Sci. USA, 102, 5326–5333, https://doi.org/10.1073/pnas.0500656102, 2005.
Rasmusson, E. M. and Carpenter, T. H.: The relationship between eastern equatorial Pacific sea surface temperatures and rainfall over India and Sri Lanka, Mon. Weather Rev., 111, 517–528, 1983.
Rayner, N. A., Parker, D. E., Horton, E. B., Folland, C. K., Alexander, L. V., Rowell, D. P., Kent, E. C., and Kaplan, A.: Global analyses of sea surface temperature, sea ice, and night marine air temperature since the late nineteenth century, J. Geophys. Res.-Atmos., 108, 4407, https://doi.org/10.1029/2002JD002670, 2003.
Reynolds, R. W., Rayner, N. A., Smith, T. M., Stokes, D. C., and Wang, W.: An improved in situ and satellite SST analysis for climate, J. Clim., 15, 1609–1625, https://doi.org/10.1175/1520-0442(2002)015<1609:AIISAS>2.0.CO;2, 2002.
Rodwell, M. J., Rowell, D. P., and Folland, C. K.: Oceanic forcing of the wintertime North Atlantic Oscillation and European climate, Nature, 398, 320–323, https://doi.org/10.1038/18648, 1999.
Sabeerali, C. T., Ajayamohan, R. S., Bangalath, H. K., and Chen, N.: Atlantic Zonal Mode: an emerging source of Indian summer monsoon variability in a warming world, Geophys. Res. Lett., 46, 4460–4464, https://doi.org/10.1029/2019GL082379, 2019.
Safaierad, R., Mohtadi, M., Zolitschka, B., Yokoyama, Y., Vogt, C., and Schefuß, E.: Elevated dust depositions in West Asia linked to ocean–atmosphere shifts during North Atlantic cold events, P. Natl. Acad. Sci. USA, 117, 18272–18277, https://doi.org/10.1073/pnas.2004071117, 2020.
Sanap, S. D., Ayantika, D. C., Pandithurai, G., and Niranjan, K.: Assessment of the aerosol distribution over Indian subcontinent in CMIP5 models, Atmos. Environ., 87, 123–137, https://doi.org/10.1016/j.atmosenv.2014.01.017, 2014.
Satheesh, S. K. and Ramanathan, V.: Large differences in tropical aerosol forcing at the top of the atmosphere and Earth's surface, Nature, 405, 60–63, 2000.
Sikka, D. R.: Some aspects of the large scale fluctuations of summer monsoon rainfall over India in relation to fluctuations in the planetary and regional scale circulation parameters, P. Ind. Acad. Sci., 89, 179–195, 1980.
Solmon, F., Nair, V. S., and Mallet, M.: Increasing Arabian dust activity and the Indian summer monsoon, Atmos. Chem. Phys., 15, 8051–8064, https://doi.org/10.5194/acp-15-8051-2015, 2015.
Sperber, K. R., Annamalai, H., Kang, I.-S., Kitoh, A., Moise, A., Turner, A., Wang, B., and Zhou, T.: The Asian summer monsoon: an intercomparison of CMIP5 vs. CMIP3 simulations of the late 20th century, Clim. Dynam., 41, 2711–2744, https://doi.org/10.1007/s00382-012-1607-6, 2013.
Srivastava, A. K., Rajeevan, M., and Kulkarni, R.: Teleconnection of OLR and SST anomalies over Atlantic Ocean with Indian summer monsoon, Geophys. Res. Lett., 29, 1284, https://doi.org/10.1029/2001GL013837, 2002.
Srivastava, G., Chakraborty, A., and Nanjundiah, R.S.: Multidecadal see-saw of the impact of ENSO on Indian and West African summer monsoon rainfall, Clim. Dynam., 52, 6633–6649, https://doi.org/10.1007/s00382-018-4535-2, 2019.
Stocker, T. F., Qin, D., Plattner, G.-K., Tignor, M., Allen, S. K., Boschung, J., Nauels, A., Xia, Y., Bex, V., and Midgley, P. M.: Climate Change 2013: The Physical Science Basis, Contribution of Working Group I to the Fifth Assessment Report of the Inter-governmental Panel on Climate Change, Cambridge University Press, Cambridge, UK and New York, NY, USA, 2013.
Sun, J. Q., Wang, H. J., and Yuan, W.: Role of the tropical Atlantic sea surface temperature in the decadal change of the summer North Atlantic Oscillation, J. Geophys. Res.-Atmos., 114, D20110, https://doi.org/10.1029/2009JD012395, 2009.
Trenberth, K. E. and Fasullo, J. T.: An apparent hiatus in global warming?, Earth's Future, 1, 19–32, https://doi.org/10.1002/2013EF000165, 2013.
Trenberth, K. E., Fasullo, J. T., Branstator, G., and Phillips, A. S.: Seasonal aspects of the recent pause in surface warming, Nat. Clim. Change, 4, 911–916, https://doi.org/10.1038/nclimate2341, 2014.
Thompson, L. G., Yao, T., Mosley-Thompson, E., Davis, M. E., Henderson, K. A., and Lin, P. N.: A high-resolution millennial record of the South Asian Monsoon from Himalayan ice cores, Science, 289, 1916–1919, 2000.
Vinoj, V., Rasch, P., Wang, H., Yoon, J., Ma, P., Landu, K., and Singh, B.: Short-term modulation of Indian summer monsoon rainfall by West Asian dust, Nat. Geosci., 7, 308–313, https://doi.org/10.1038/ngeo2107, 2014.
Visbeck, M., Cullen, H., Krahmann, G., and Naik, N.: An ocean model's response to North Atlantic Oscillation-like wind forcing, Geophys. Res. Lett., 25, 4521–4524, 1998.
Visbeck, M. H., Hurrell, J. W., Polvani, L., and Cullen, H. M.: The North Atlantic Oscillation: past, present and future, P. Natl. Acad. Sci. USA, 98, 12876–12877, 2001.
Walker, A. L., Liu, M., Miller, S. D., Richardson, K. A., and Westphal, D. L.: Development of a dust source database for mesoscale forecasting in southwest Asia, J. Geophys. Res.-Atmos., 114, D18207, https://doi.org/10.1029/2008JD011541, 2009.
Wang, B., Xiang, B., Li, J., Webster, P. J., Rajeevan, M. N., Liu, J., and Ha, K.-J.: Rethinking Indian monsoon rainfall prediction in the context of recent global warming, Nat. Commun., 6, 7154, https://doi.org/10.1038/ncomms8154, 2015.
Wulff, C. O., Greatbatch, R. J., Domeisen, D. I. V., Gollan, G., and Hansen, F.: Tropical forcing of the summer east Atlantic pattern, Geophys. Res. Lett., 44, 11166–11173, https://doi.org/10.1002/2017GL075493, 2017.
Xie, S.-P. and Kosaka, Y.: What caused the global surface warming hiatus of 1998–2013?, Curr. Clim. Change Rep., 3, 128–140, https://doi.org/10.1007/s40641-017-0063-0, 2017.
Yeh, S.-W., Kug, J.-S., Dewitte, B., Kwon, M.-H., Kirtman, B.P., and Jin, F.-F.: El Niño in a changing climate, Nature, 461, 511–514, 2009.
Yu, Y., Notaro, M., Liu, Z., Wang, F., Alkolibi, F., Fadda, E., and Bakhrjy, F.: Climatic controls on the interannual to decadal variability in Saudi Arabian dust activity: toward the development of a seasonal dust prediction model, J. Geophys. Res.-Atmos., 120, 1739–1758, https://doi.org/10.1002/2014JD022611, 2015.
Zender, C. S., Bian, H., and Newman, D.: Mineral Dust Entrainment and Deposition (DEAD) model: Description and 1990s dust climatology, J. Geophys. Res.-Atmos., 108, 4416, https://doi.org/10.1029/2002JD002775, 2003a.
Zender, C. S., Newman, D., and Torres, O.: Spatial heterogeneity in aeolian erodibility: uniform, topographic, geomorphic and hydrologic hypotheses, J. Geophys. Res.-Atmos., 108, 4543, https://doi.org/10.1029/2002JD003039, 2003b.
Zhang, R. and Delworth, T. L.: Impact of Atlantic multidecadal oscillations on India/Sahel rainfall and Atlantic hurricanes, Geophys. Res. Lett., 33, L17712, https://doi.org/10.1029/2006GL026267, 2006.
Zhu, A., Ramanathan, V., Li, F., and Kim, D.: Dust plumes over the Pacific, Indian, and Atlantic oceans: climatology and radiative impact, J. Geophys. Res.-Atmos., 112, D16208, https://doi.org/10.1029/2007JD008427, 2007.