the Creative Commons Attribution 4.0 License.
the Creative Commons Attribution 4.0 License.
 | 09 Feb 2021
Assessing the vertical structure of Arctic aerosols using balloon-borne measurements
Jessie M. Creamean
Gijs de Boer
Hagen Telg
Darielle Dexheimer
Matthew D. Shupe
Amy Solomon
Allison McComiskey
The rapidly warming Arctic is sensitive to perturbations in the surface energy budget, which can be caused by clouds and aerosols. However, the interactions between clouds and aerosols are poorly quantified in the Arctic, in part due to (1) limited observations of vertical structure of aerosols relative to clouds and (2) ground-based observations often being inadequate for assessing aerosol impacts on cloud formation in the characteristically stratified Arctic atmosphere. Here, we present a novel evaluation of Arctic aerosol vertical distributions using almost 3 years' worth of tethered balloon system (TBS) measurements spanning multiple seasons. The TBS was deployed at the U.S. Department of Energy Atmospheric Radiation Measurement Program's facility at Oliktok Point, Alaska. Aerosols were examined in tandem with atmospheric stability and ground-based remote sensing of cloud macrophysical properties to specifically address the representativeness of near-surface aerosols to those at cloud base. Based on a statistical analysis of the TBS profiles, ground-based aerosol number concentrations were unequal to those at cloud base 86 % of the time. Intermittent aerosol layers were observed 63 % of the time due to poorly mixed below-cloud environments, mostly found in the spring, causing a decoupling of the surface from the cloud layer. A uniform distribution of aerosol below cloud was observed only 14 % of the time due to a well-mixed below-cloud environment, mostly during the fall. The equivalent potential temperature profiles of the below-cloud environment reflected the aerosol profile 89 % of the time, whereby a mixed or stratified below-cloud environment was observed during a uniform or layered aerosol profile, respectively. In general, a combination of aerosol sources, thermodynamic structure, and wet removal processes from clouds and precipitation likely played a key role in establishing observed aerosol vertical structures. Results such as these could be used to improve future parameterizations of aerosols and their impacts on Arctic cloud formation and radiative properties.
- Article
(6459 KB) - Full-text XML
- BibTeX
- EndNote


Over the past few decades, the Arctic has been observed to warm at a pace at least twice as fast as the rest of the planet, a phenomenon known as Arctic amplification (Jeffries et al., 2013; Overland et al., 2018). This warming has resulted in melting of land and sea ice (Koenigk et al., 2020), which have consequential impacts on Arctic ecology (Arrigo and van Dijken, 2015; Gabric et al., 2018; Gamberg, 2020), socioeconomics among indigenous communities (Huntington et al., 2017; John et al., 2004), commercial shipping operations (Stephenson et al., 2018), and global weather and climate patterns (Overland et al., 2015; Thomas et al., 2013; Wei et al., 2017).
The presence of atmospheric aerosols has been established as an important modulator of environmental change in the Arctic (Abbatt et al., 2019; Law and Stohl, 2007; Quinn et al., 2008), yet the magnitude of their effects, especially on clouds through nucleation of droplets and ice, is not well understood and thus contributes significantly to uncertainty in climate model simulations (Fridlind and Ackerman, 2018; Klein et al., 2009; Taylor et al., 2019; Zelinka et al., 2020). Aerosol properties have been measured at surface observatories around the Arctic for several decades (e.g., Barrie and Barrie, 1990; Bodhaine, 1983; Freud et al., 2017; Maenhaut et al., 1989; Pacyna et al., 1984; Quinn et al., 2000; Quinn et al., 2002, 2009; Schmeisser et al., 2018; Sharma et al., 2019; Uttal et al., 2016). From these observatories, we have learned that there is a strong seasonal evolution in the abundance and sources of aerosols, with significantly higher mass concentrations under the winter–spring “Arctic haze” phenomenon, as compared to the relatively pristine summer influenced by local biogenic emissions and intermittent transport of aerosols from lower-latitude wildfires and local sea spray aerosol in the fall (Croft et al., 2016; Garrett et al., 2010; Lange et al., 2018; Quinn et al., 2008; Quinn et al., 2009; Shaw, 1995; Udisti et al., 2016; Willis et al., 2018; Winiger et al., 2019). From the perspective of aerosol–cloud interactions, the concentration, size, and composition of aerosols have been shown to play a significant role in augmenting the radiative effects of Arctic clouds with respect to both solar and infrared radiation (Garrett and Zhao, 2006; Lubin and Vogelmann, 2006, 2007, 2010; Maahn et al., 2017; Mauritsen et al., 2011). Numerous studies have demonstrated that the Arctic atmosphere is often highly stratified (Graversen et al., 2008; Persson et al., 2002) and that turbulent coupling between the surface and clouds is sporadic (Brooks et al., 2017). This stratification results in layering of aerosols that are not captured by surface observations (Brock et al., 2011; Fisher et al., 2010; Jacob et al., 2010; Matsui et al., 2011a, b; McNaughton et al., 2011). Although less common, unstable conditions occasionally exist whereby a well-mixed boundary layer can couple the surface to the cloud mixed layer or the clouds are low enough for cloud-driven turbulence to couple the cloud mixed-layer and surface layer (Curry et al., 1988; Shupe et al., 2013; Sotiropoulou et al., 2014; Vüllers et al., 2021), with aerosol near the surface representative of that at cloud base due to vertical mixing. The contrasting and dynamic characteristics of the lower Arctic atmosphere, as well as the fact that most of preceding information on aerosols are gleaned from ground-based observations, motivate the need for profiling measurements to directly explore the vertical distributions of aerosols and their interactions with clouds.
Remote sensing can be of value by filling in spatial gaps of vertical aerosol observations. While polar orbiting sensors offer valuable information on aerosol class and optical properties within the troposphere, they can be limited in that (1) little to no vertically resolved aerosol data are available north of 82∘ N (e.g., the Cloud-Aerosol Lidar and Infrared Pathfinder Satellite Observation, CALIPSO, satellite); (2) signals become attenuated under optically thick clouds, casting a “shadow”; (3) sensors have issues with surface brightness when masking clouds, especially over the high-albedo frozen surfaces (Mei et al., 2013); (4) sensors may underestimate aerosol quantities and their radiative effects (Thorsen and Fu, 2015), especially in relatively pristine locations; and (5) the lowest couple hundred meters are affected by surface returns, prohibiting accurate measurements of lower boundary layer aerosol (Kim et al., 2017). Further, coverage at any given location occurs only once every 16 d for active sensors like the Cloud-Aerosol Lidar with Orthogonal Polarization (CALIOP) lidar. Surface-based remote sensing tools such as lidars and sun photometers offer the advantage of providing continuous observations of the vertical distribution of aerosol and/or optical properties, yet they offer limited vertical resolution, are subject to lower altitude thresholds, are sensitive to low aerosol concentrations and the presence of cloud cover and precipitation, require assumptions regarding correction factors, and/or may struggle to capture quantifiable data such as aerosol number and size (e.g., Gui, 2016; Hoff, 1988; Kavaya and Menzies, 1985; Kovalev, 1995; Welton and Campbell, 2002). Further, sun photometers require solar radiance and thus are not useful for much of the Arctic annual cycle.
Manned aircraft have afforded valuable insight into aerosol sources, vertical structure, physiochemical properties, and aerosol–cloud interactions dating back to the 1980s and 1990s. Characterizing sources of aerosols and gases transported from midlatitude pollution and biomass burning sources during the springtime Arctic haze (Borys, 1989; Chuan, 1993; Herbert et al., 1993; Parungo et al., 1993; Parungo et al., 1990; Pilewskie and Valero, 1993; Schnell, 1984) and late summer (Browell et al., 1992; Gregory et al., 1992; Harriss et al., 1992) was a central focus of earlier campaigns in the Alaskan Arctic. In the late 1990s and in the 2000s, several aircraft campaigns in the Alaskan Arctic focused on assessing impacts of aerosols on Arctic mixed-phase clouds (AMPCs) in the spring (Curry et al., 2000; Fridlind et al., 2007) and fall (McFarquhar et al., 2007). The fourth International Polar Year (IPY, 2008) – a collaborative, international effort with intensive foci in the polar regions – involved several aircraft campaigns to characterize regional and transported aerosols and their impacts on clouds in the spring and summer in the North American Arctic (Brock et al., 2011; Lathem et al., 2013; McFarquhar et al., 2011; Wang et al., 2011; Zamora et al., 2016), European Arctic (Ancellet et al., 2014), and Greenland (Quennehen et al., 2011; Thomas et al., 2013). More recent spring and summertime aircraft campaigns in the North American (Creamean et al., 2018c; Maahn et al., 2017), European (Eirund et al., 2019; Liu et al., 2015; Wendisch et al., 2019; Young et al., 2017; Young et al., 2016a, b), and Canadian Arctic sectors (Abbatt et al., 2019; Burkart et al., 2017; Leaitch et al., 2016; Schulz et al., 2019; Willis et al., 2019) involved a more comprehensive set of observations to assess spatiotemporal distributions of aerosols, their sources, and their impacts on cloud microphysics. While such Arctic airborne missions have yielded crucial information on aerosol sources and their impacts on clouds over the course of the last 3 decades, they are logistically and financially demanding, focus on relatively short and intensive periods, and can be affected by fast-flying flow-induced issues (Spanu et al., 2020). Additionally, traditional manned aircraft are often not able to fly within hundreds of meters of the ground, preventing them from providing critical information on near-surface aerosol properties and the surface–cloud interface.
To bridge the gap between aerosols at the surface and at altitudes attainable by manned aircraft, smaller platforms such as unmanned aerial and tethered balloon systems (UASs and TBSs, respectively) can be employed on a more routine basis than traditional manned aircraft. Aerosol size distributions, composition, biology, and/or cloud-relevant properties have been measured via UAS and TBS at several locations globally (Ardon-Dryer et al., 2011; Bryan et al., 2014; Creamean et al., 2018d; de Boer et al., 2016; Greenberg et al., 2009; Maletto et al., 2003; Marinou et al., 2019; Porter et al., 2020; Renard et al., 2016; Schrod et al., 2017; Siebert et al., 2004; Techy et al., 2010; Telg et al., 2017; Wehner et al., 2007); however, such observations are relatively sparse in the Arctic compared to lower latitudes. Balloon-borne observations of aerosols date back to the 1980s and 1990s (Hofmann et al., 1990; Khattatov et al., 1994; Kondo et al., 1990; Suortti et al., 2001), yet these were focused on stratospheric aerosol. Recent technological and instrumentational advancements have afforded information on the vertical distribution, size, and type of aerosol present in the Arctic boundary layer (Atkinson et al., 2013; Dagsson-Waldhauserova et al., 2019; Ferrero et al., 2019). Both TBSs and UASs have their advantages and disadvantages in terms of flight ceiling, profiling, retrievability, cost, operational logistics, and payload restrictions, but some major advantages of TBSs are their flexibility to profile and hover at desired altitudes, and their flight duration can be several hours depending on power availability for instrumentation.
Uncertainties in model representations of aerosol–cloud interactions, especially in the Arctic, are exacerbated when models attempt to simulate cloud–radiation interactions and the surface energy budget (Sedlar et al., 2020). This is in part due to the unique behavior of AMPCs, which can persist for days within 1 km of the ground (Gierens et al., 2020; Morrison et al., 2012; Shupe, 2011; Shupe et al., 2011) and have been shown to increase surface temperature by almost 20 ∘C (Dimitrelos et al., 2020). Additionally, persistent Arctic mixed-phase stratocumulus clouds, which typically have low liquid water amounts, are particularly sensitive to modulations from aerosols compared to thicker stratocumulus clouds at other latitudes (de Boer et al., 2013; Eirund et al., 2019; Morrison et al., 2008; Norgren et al., 2018; Solomon et al., 2018). Therefore, both near-surface profiling and ground-based measurements equate to an ideal combination for investigating relationships between aerosols, clouds, and atmospheric state to address these issues and improve representation of aerosol impacts on Arctic cloud microphysics and radiative properties.
In this paper, we provide some unique perspectives on the distribution of aerosol properties in the lower Arctic atmosphere collected using TBS at Oliktok Point, Alaska, between spring 2016 and summer 2019 (de Boer et al., 2018; de Boer et al., 2015; Dexheimer et al., 2019). Oliktok Point is a unique Arctic site as it has been shown to be influenced by aerosols from local oilfield activity in addition to the other more ubiquitous Arctic aerosol sources (Creamean et al., 2018b, c; Maahn et al., 2017). These flights generally occurred between the months of May and October under various field campaigns, including the Inaugural Campaigns for ARM Research using Unmanned Systems (ICARUS; de Boer et al., 2018), Aerosol Vertical Profiling at Oliktok Point (AVPOP; Creamean et al., 2018a) and Profiling at Oliktok Point to Enhance Year of Polar Prediction (YOPP) Experiments (POPEYE; de Boer et al., 2019a, b). Using aerosol and atmospheric state measurements from these systems, we attempt to answer the following question: are ground-based aerosol measurements representative of those at cloud level? We also address under which atmospheric conditions such links exist (i.e., cloud that is coupled or decoupled from the surface). Section 2 provides an overview of the platforms and sensors deployed as part of these campaigns. Section 3 includes information on aerosol vertical distribution, a comparison with surface-based observations, and the relationships between aerosol stratification and thermodynamic stratification. Finally, Sect. 4 offers discussion on the impact of these measurements, as well as a summary of our findings.
Figure 1Maps illustrating (a) the location of Oliktok Point, Alaska, and (b) the scale (in nautical miles, nm) of the restricted airspace area (R-2204) set up for operation of the TBS with the location of AMF3 (red triangle). The map was created using satellite imagery obtained through the © Google Earth Application Programming Interface. Also shown are images of the TBS (34 m3 helikite), including (c) the Sandia National Laboratories winch trailer used for flight and (d) a close-up of a typical instrument payload. Only the instruments mentioned in this paper are labeled.
2.1 Flight characteristics
TBS flights were conducted at the Department of Energy Atmospheric Radiation Measurement (DOE ARM) Program's third Mobile Facility (AMF3) in Oliktok Point, Alaska (70.51∘ N, 149.86∘ W, 2 m above mean sea level (a.m.s.l.); see Fig. 1a. Oliktok Point includes a restricted airspace area (R-2204) to enable TBS flights at AMF3 (for details, see de Boer et al., 2018; de Boer et al., 2015; Fig. 1b). The dates, times, and flight hours for all TBS flights used from ICARUS, AVPOP, and POPEYE are provided in Table 1. Flights occurred at altitudes up to 1.5 km a.m.s.l. and with durations from 1 to 9 h in various atmospheric conditions, including clear sky, broken to overcast clouds, rain, sleet, and snow (Dexheimer et al., 2019). Typical profiles included the following procedures: (1) a gradual ascent, hovering at a desired altitude, then a gradual descent; (2) if already airborne, a gradual descent, hovering at a desired altitude, then gradual ascent; (3) a quick ascent and descent; (4) a quick ascent followed by hovering at a desired altitude, then quick descent; and (5) a stepwise path up or down. A flight consisted of one or a combination of these profiles, especially when a cloud was present and variable in terms of location throughout the flight (Sect. 3.1).
Table 1Dates, times, and instruments flown during TBS flights presented in this study from the Inaugural Campaigns for ARM Research using Unmanned Systems (ICARUS), Aerosol Vertical Profiling at Oliktok Point (AVPOP), and Profiling at Oliktok Point to Enhance Year of Polar Prediction (YOPP) Experiments (POPEYE) flight campaigns at AMF3.
2.2 In situ measurements
2.2.1 Tethered balloon system (TBS) platform
The TBS platform consisted of a helium-filled balloon, tether, and winch (see Dexheimer, 2018, for complete details). Two different balloons were used, including a 34 m3 helikite (Allsopp Helikites Ltd.) and a 79 m3 aerostat (SkyDoc™ and Drone Aviation Corp.). The helikite (Fig. 1c) uses lighter-than-air principles to obtain its initial lift and a kite-like structure to achieve stability and dynamic lift, while the larger aerostat uses a skirt instead of a kite to achieve stability in flight (de Boer et al., 2018; Dexheimer, 2018; Dexheimer et al., 2019). The helikite was typically used for flights with desired altitudes up to 700 m above the ground, had a maximum payload of < 10 kg, and could be operated at wind speeds < 11 m s−1. The aerostat was used when desired altitudes were > 600 m above the ground, a heavier payload was needed (10–25 kg), and when surface wind speeds were < 8 m s−1 (Dexheimer, 2018). Several winches were employed, including (1) a commercial, off-the-shelf electric winch (SkyDoc™) that has been modified at Sandia National Laboratories and integrated into a dedicated balloon trailer for both the aerostat and helikite (Fig. 1c), (2) a hydraulic winch and pump that have been integrated into a dedicated balloon trailer (Carolina Unmanned Vehicles, Inc.) for the helikite, and (3) a small electric winch (My-te) attached to a receiver on a truck for the helikite. The most used winch deployed > 2 km of Plasma® 12-strand synthetic rope, which has a minimum breaking strength of 2494 kg (Cortland Company, Inc.).
2.2.2 Balloon-borne instrumentation
The commercial sensors integrated into the ARM TBS platform and presented here included a Portable Optical Particle Spectrometer (POPS; Gao et al., 2016; Telg et al., 2017) (Handix Scientific LLC) for particle size distributions and a standard iMet-1-RSB radiosonde (International Met Systems, Inc.) for pressure, temperature, relative humidity, and GPS altitude and position. When GPS altitude data were not recorded or suspect, altitude was derived from the iMet pressure-based altitude retrievals. Total payload weight for the flight-ready POPS enclosure and radiosonde was approximately 6.3 kg. A condensation particle counter (CPC 3007; TSI, Inc.) was also commonly deployed with the POPS and iMet sensors for total particle concentrations (10–1000 nm), but those data are not presented here as our focus is on size-resolved aerosol number concentrations that are comparable to other aerosol sizing measurements (see the next section). Up to two POPSs were suspended along the tether at different altitudes. One POPS was operated just below the balloon in order to reach the maximum possible altitude (Fig. 1d). If a second POPS was deployed, it was generally located up to 100 meters lower than the top POPS to sample near the cloud base. The POPS measures particle size distributions from 140 nm to 3 µm with a 405 nm wavelength laser, has a maximum particle concentration of 1250 cm−3 (±10 % accuracy), and a sample flow rate of 0.18 L min−1. It can function down to −40 ∘C with an additional heat source for the laser and within the enclosure; thus, operation is possible in the cold Arctic temperatures at Oliktok Point and in AMPCs. Optical particle counters (OPCs) similar to the POPS have been operated successfully via balloon in several previous studies all over the world (Creamean et al., 2018d; Greenberg et al., 2009; Hofmann, 1993; Hofmann et al., 1989; Iwasaka et al., 2003; Kim et al., 2003; Maletto et al., 2003; Renard et al., 2016; Siebert et al., 2004; Tobo et al., 2007; Wehner et al., 2007).
2.2.3 Ground-based measurements
The AMF3 – which was installed at Oliktok Point in 2013 and will be relocated to the southeastern U.S. in 2021 (https://www.arm.gov/capabilities/observatories/amf, last access: 10 September 2020) – includes a comprehensive collection of instrumentation for gases, aerosols, clouds, precipitation, atmospheric state, and thermodynamic structure. For the current work, we exploited continuous ground-based measurements of (1) total aerosol concentrations in the ultrafine (3 nm–10 µm) and fine (10 nm–10 µm) modes using an ultrafine and fine condensation particle counter (CPCu and CPCf, respectively; TSI, Inc.), (2) aerosol size distributions from the ultra-high-sensitivity aerosol spectrometer (UHSAS; Droplet Measurement Technologies, Inc.; Uin, 2016), (3) cloud base height from a ceilometer (Vaisala CL31; Morris, 2016), (4) cloud extent and macrophysics using the Ka-band ARM zenith radar (KAZR; ProSensing, Inc.; Widener et al., 2012), (5) liquid water path from a three-channel (23.8, 30, 89 GHz) microwave radiometer system (MWR; Radiometrics, Inc.; Cadeddu, 2012), (6) precipitation data from a NASA ground-based precipitation imaging package (PIP; https://www.arm.gov/capabilities/instruments/precipip, last access: 10 September 2020), and (7) basic surface meteorology including wind speed and direction from the aerosol observing system (AOSMET, which is part of the AOS measurement suite; Kyrouac, 2016). The UHSAS measures aerosol size distributions from 60 to 1000 nm, which has a 140 to 1000 nm overlap with the POPS. When directly comparing data between the UHSAS and POPS, only number concentrations within this overlap region were used. The AOS inlet is positioned at a height of approximately 10 m above the ground. We employed a combination of the ceilometer and KAZR to establish cloud presence, base, and depth in order to classify when the POPS was measuring aerosol concentrations below, in, and above cloud.
2.3 Data mining and availability
All data from the POPS, iMet, CPCs, UHSAS, ceilometer, KAZR, MWR, PIP, and AOSMET were compiled into single data files per flight and are available on the DOE ARM Data Archive as an intensive operating period (IOP) product (https://adc.arm.gov/discovery/#/results/primary_meas_type_code::aerosconc/iopShortName::amf2018avpop/instrument_category_code::atmprof, last access: 10 September 2020). To simplify data analysis, we identified parameters that are most relevant to addressing the question of whether ground-based aerosol measurements are representative of those at cloud level, and merged them into a single product, where we aligned and if needed resampled timestamps indices. This product includes retrievals from in situ measurements on the tether (instrument payload altitude, relative humidity, temperature, potential temperature, equivalent potential temperature, particle number concentration, and particle mean diameter), in situ ground observations (precipitation rate and particle number concentration), ground-based remote sensing (cloud base and cloud top altitudes and liquid water path), and hybrid retrievals (particle number concentrations in the overlapping size range from the UHSAS and POPS). The data presented here have been reprocessed from the POPS raw data retrieved from the instrument after each flight session. This step was necessary to improve the signal-to-noise ratio, which is particularly important in low particle number conditions encountered frequently in the Arctic, and to match detection limits of POPS and the UHSAS instruments. Data from one of the POPS flights (SN18) during May 2017 were omitted due to an instrument pump failure. These discrepancies were remedied after the May flights, and observations from this sensor were re-integrated into the analysis. Lower atmospheric stability was determined using the thermodynamic measurements provided by the iMet sensors. Specifically, the equivalent potential temperature (θE) was calculated using the Python MetPy package (May et al., 2020). With θE profiles available from the TBS, the variance in θE between the surface and cloud base was analyzed to evaluate mixing in the lower atmosphere. Since well-mixed atmospheres should have a constant θE profile, increased variance would indicate some form of stratification within the column. Based on a statistical evaluation of this variance, a threshold of 0.25 was selected as a cut-off for distinguishing between well-mixed and stratified profiles. Unless otherwise indicated, data herein are presented in a.m.s.l. and universal coordinated time (UTC).
Here, we describe definitions for key terms used throughout this paper. A “flight” corresponds to the entire duration of a TBS deployment, while a “profile” represents a segment of ascent or descent during the flights – there can be multiple profiles per flight (there is example of how a flight is dissected into profiles in Fig. 2). Specifically, a profile is defined by the measurements in between the minimum and maximum altitude attained during each ascent and descent. We also compare aerosol concentrations at various vertical levels relative to the ground and to cloud height. “Ground” aerosol concentrations are defined as the POPS number concentrations averaged between 20 and 40 m, and profile data below 20 m were removed due to aerosol contamination from the winch generator (i.e., spikes in POPS number concentration were typically observed below this altitude). POPS data quality at the ground was cross-checked with the UHSAS number concentrations in the overlapping size region (see Sect. 3.1). “Cloud base” aerosol concentrations are defined as POPS number concentrations averaged between the average cloud base height for each profile and 40 m below that altitude. “Below-cloud”, “in-cloud”, and “above-cloud” aerosol are defined as the average number concentration of aerosol from the POPS from 20 m to the average cloud base height, the average cloud base height to average cloud top height, and average cloud top height to the maximum height of each profile, respectively.
Figure 2An example of how flight profiles are defined using the 9 July 2018 data. The red and green markers represent the minimum and maximum altitude of each profile, respectively, and thus define the start and end points of each profile. This example consisted of six profiles for the entire flight time period.
In total, 282 profiles were obtained. The TBS flew and collected POPS data at the ground and at cloud base for 63 of those 282 profiles. Remaining profiles either did not reach cloud base or were profiles in or above cloud during the middle of the flight that did not descend to the ground. The 63 profiles were categorized into cases, including (1) cases where the ground POPS concentrations were equal to cloud base POPS concentrations, (2) cases featuring decreasing or increasing POPS concentrations with height to cloud base height (called “gradients”), and (3) cases with intermittent layers of aerosol between the ground and cloud base height. Cases where the ground was equal to cloud base” were defined programmatically as when cloud base POPS concentrations were within 10 % of the ground POPS concentrations. This metric was used to determine whether ground-based aerosol is representative of aerosol at cloud base. For cases where aerosol number concentrations at the ground did not equal those at cloud base, gradients and intermittent layers were identified visually. Cases where ground was equal to cloud base were also visually checked to assure they belonged to the correct case category and that intermittent layers were not present. Some visual intervention was necessary for placement of profiles in their correct case categories. θE profiles were compared in tandem with the POPS profiles to identify if the boundary layer was thermodynamically well-mixed or stratified. A mixed or stratified boundary layer corresponded to θE within or outside of this variance threshold, respectively. Profiles with missing or insufficient POPS or θE data were removed from statistical analyses (Sect. 3.3).
3.1 General atmospheric and ground-based aerosol conditions during TBS flights in Arctic Alaska
TBS flights spanning the campaigns in Table 1 occurred over a range of atmospheric conditions, including clear sky (e.g., 10 July 2018), cloud cover, and during precipitation events (examples shown in Fig. 3). During cloudy periods, the TBS flew below, in, and above cloud when the cloud top was low enough for the TBS to fly through and the conditions allowed for it (e.g., 17 May and 17 August 2018). Substantial changes in cloud depth were often observed during flight periods due to precipitation or changes in atmospheric dynamics and mixing (e.g., 6–8 August 2017 and 21, 23, and 25 September 2018). Cloud base was observed to be as low as 72 m and as high as 7590 m but was 1132 m on average (median of 718 m) during the TBS profiles. Cloud top height ranged from 177 to 9800 m (average and median of 2443 and 1413 m, respectively). Precipitation occurred during 47 of the 282 total profiles. Ambient temperatures measured by the iMet sensors ranged from −12 to 23 ∘C during the flights (average and median of 4.7 and 3.2 ∘C, respectively). Often, temperature inversions were observed, and in combination with clouds they caused unique transitions in the vertical distributions of aerosol number concentrations (e.g., 21 September 2018) as discussed further herein.
Figure 3Data from select flights from ICARUS, AVPOP, and POPEYE. Colored lines show the altitude of the POPS instruments (left axes) where the color scale represents aerosol number concentration. Days with two lines indicate both POPS were deployed and operational and demonstrate the relative location of each POPS on the tether. Orange lines represent the temperature measured by the iMet instruments (right axes), and like the POPS some flights contained multiple iMet sensors. The dark grey markers represent cloud base as measured by the ground-based ceilometer, and the lighter shaded grey region indicates the location and depth of the clouds as measured by the KAZR radar. One clear-sky case is shown (10 July 2018).
Number concentrations measured with the POPS at ground level (i.e., concentrations in the range of 20–40 m) were comparable to the UHSAS at the ground for the overlapping size range between the two instruments (Fig. 4a): the average UHSAS to POPS ratio was 1.01 ± 0.9 (median of 0.77), indicating very good agreement between the two separate instruments during TBS flights. A side-by-side comparison was conducted on 1 July 2018 (i.e., the POPS was placed near the AOS inlet) and demonstrated good agreement in the overlapping size regions between the POPS and UHSAS (not shown), akin to previous in-depth comparison efforts that reported a coincidence error of less than 25 % (Mei et al., 2020). The POPS appeared to have slightly higher concentrations when greater than approximately 100 to 150 cm−3 (Fig. 4b); however, both methods were still in good agreement even when including all the data measured by POPS between ground and cloud base (Fig. 4c). Possible sources of disagreement could be due to (1) the inlets (i.e., the UHSAS is on a stack inlet in which the air is humidity controlled to 40 % versus the POPS, which has a small inlet directly exposed to ambient conditions), (2) concentrations not being corrected for aerosol loss in either instrument, and/or (3) proximity to very localized sources (e.g., the AMF3 generators or operations vehicle exhaust).
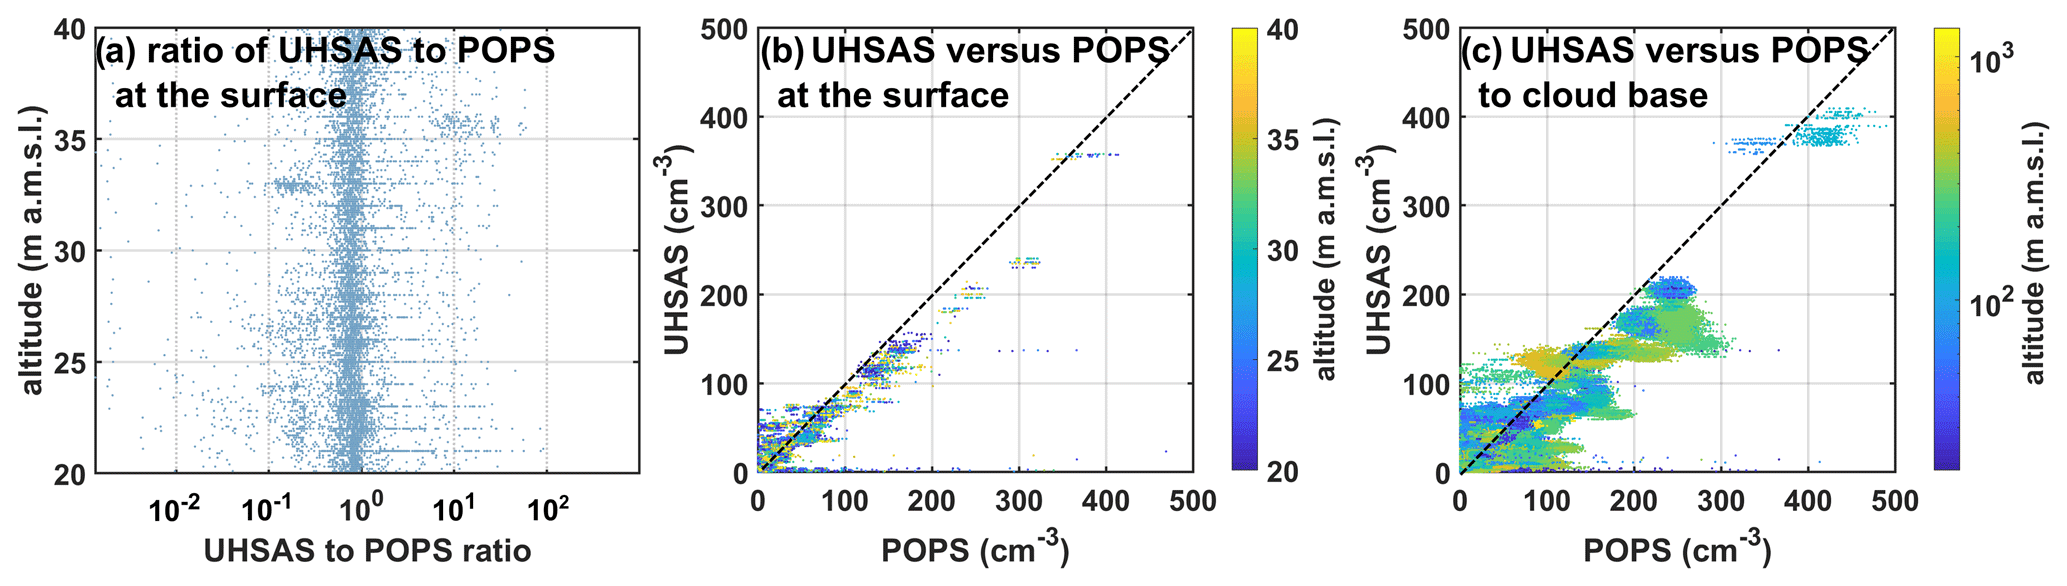
Figure 4(a) The ratio of UHSAS to POPS aerosol number concentrations in the overlapping size range (130–1000 nm) and on the ground (defined as 20–40 m a.m.s.l.) versus altitude from all flights. Scatterplots of UHSAS versus POPS aerosol number concentrations for (b) measurements on the ground and (c) from the ground to cloud base (cloud base altitude varied for each flight). Data for (b) and (c) are colored by altitude (note the different scales for each panel). Dashed lines show the 1:1 line.
3.2 Seasonal variability in aerosol vertical distributions
Figure 5 demonstrates the transitions in number concentration and mean particle diameter during all TBS deployments. The highest concentrations were observed when the TBS flew well below cloud base in the summer (e.g., profiles 81–100, 180–200, and 230–240), which is likely due to a combination of more prominent surface sources and separation of those sources from cloud base where scavenging of the aerosol could occur (Browse et al., 2012; Huang et al., 2010; Limbeck and Puxbaum, 2000; Yum and Hudson, 2001). In general, the highest number concentrations of the smallest particles observed by the POPS were likely primary combustion particles from Prudhoe Bay oilfield emissions, which have been previously observed as a prominent source on the Alaska North Slope (Creamean et al., 2018c; Gunsch et al., 2017; Kirpes et al., 2020), and possibly to a lesser extent the growth of aerosols from new particle formation events (Kolesar et al., 2017). The TBS data agreed with the ground-based UHSAS data whereby relatively high concentrations of particles within the size range (i.e., 60 nm–1 µm) that would be expected from oilfield plumes (Gunsch et al., 2020) were observed, specifically when strong winds originated from the southeast (Fig. 6) where a high density of oil wells exists (Creamean et al., 2018c). The Alaska North Slope is also subject to local marine biological emissions that increase particle numbers starting in May and peak during the summer (specifically July) when sunlight hours and open-water sources are at their maxima (Creamean et al., 2018b; Polissar et al., 2001; Quinn et al., 2009; Quinn et al., 2002). This biological source could have contributed to the particles measured at Oliktok Point, but given the dominant wind direction this was likely a minor influence during the summer months of the current study. However, the low concentrations of aerosol associated with easterly winds were likely a result of an influence from marine biological aerosol as demonstrated by Creamean et al. (2018b) in May 2017. Some of the largest particles were observed in low concentrations during the summer and relatively high concentrations in the fall (e.g., profiles 45–60, 120–140, 260–270; Fig. 5), presumably due to influences from supermicrometer sea salt aerosol when open water is present off the coast (May et al., 2016; Quinn et al., 2002). September was particularly influenced by marine sources given the low particle counts and easterly winds from over open ocean directly off the coast of Oliktok Point (Fig. 1b), while October was likely influenced by a combination of supermicrometer sea salt and oilfield activities as the winds transitioned to predominantly originating from the Prudhoe Bay oil wells (Fig. 6). Emissions from a local open lead were visible during early July 2018 (e.g., profiles 81–100; Fig. 5), indicating that the high number concentrations observed during this period in part originated from the open-water source, as supported by the predominantly easterly wind direction (97∘, on average during these days; Fig. 6). The spring flights occurred in May – coincident with the timing of the initial breakup of the polar vortex (Stone et al., 2010) and calmer, easterly winds (Fig. 6)– and were generally lower in concentration compared to the summer, with average sizes spanning the full spectrum (Fig. 5).
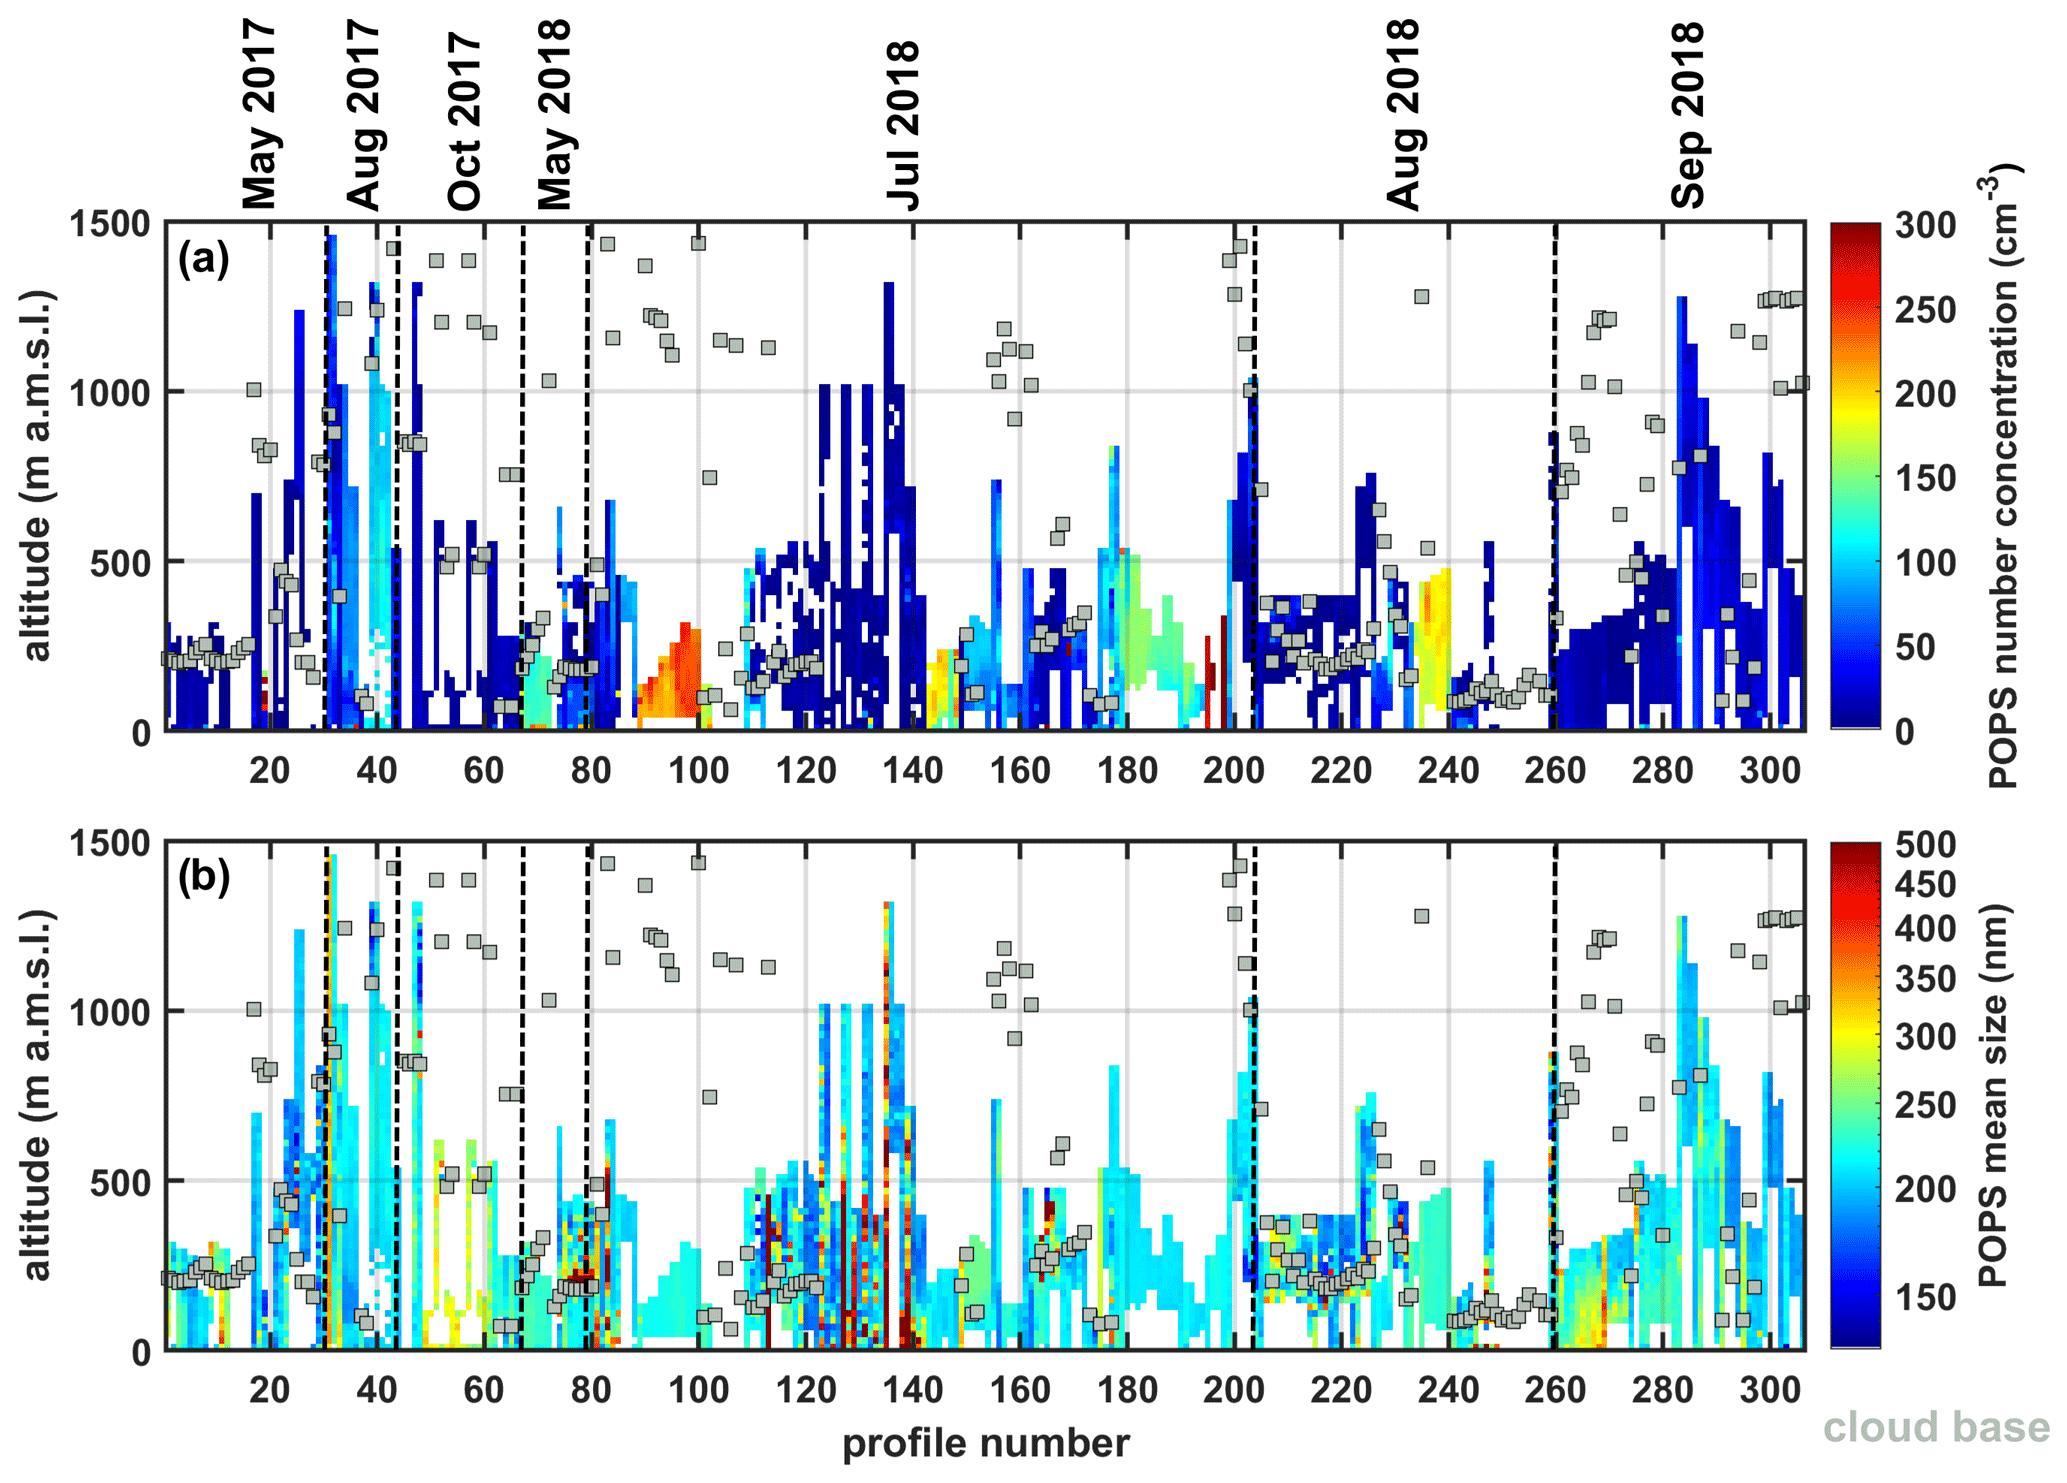
Figure 5Image plots of POPS (a) total number concentration and (b) mean particle size during all profiles from the TBS deployments plotted by altitude. The color scales represent number concentration and mean size, respectively. White regions indicate no data were obtained. The grey markers represent mean cloud base height during each profile. Profiles without cloud base shown either do not have cloud base data or have a cloud base above 1.5 km a.m.s.l.
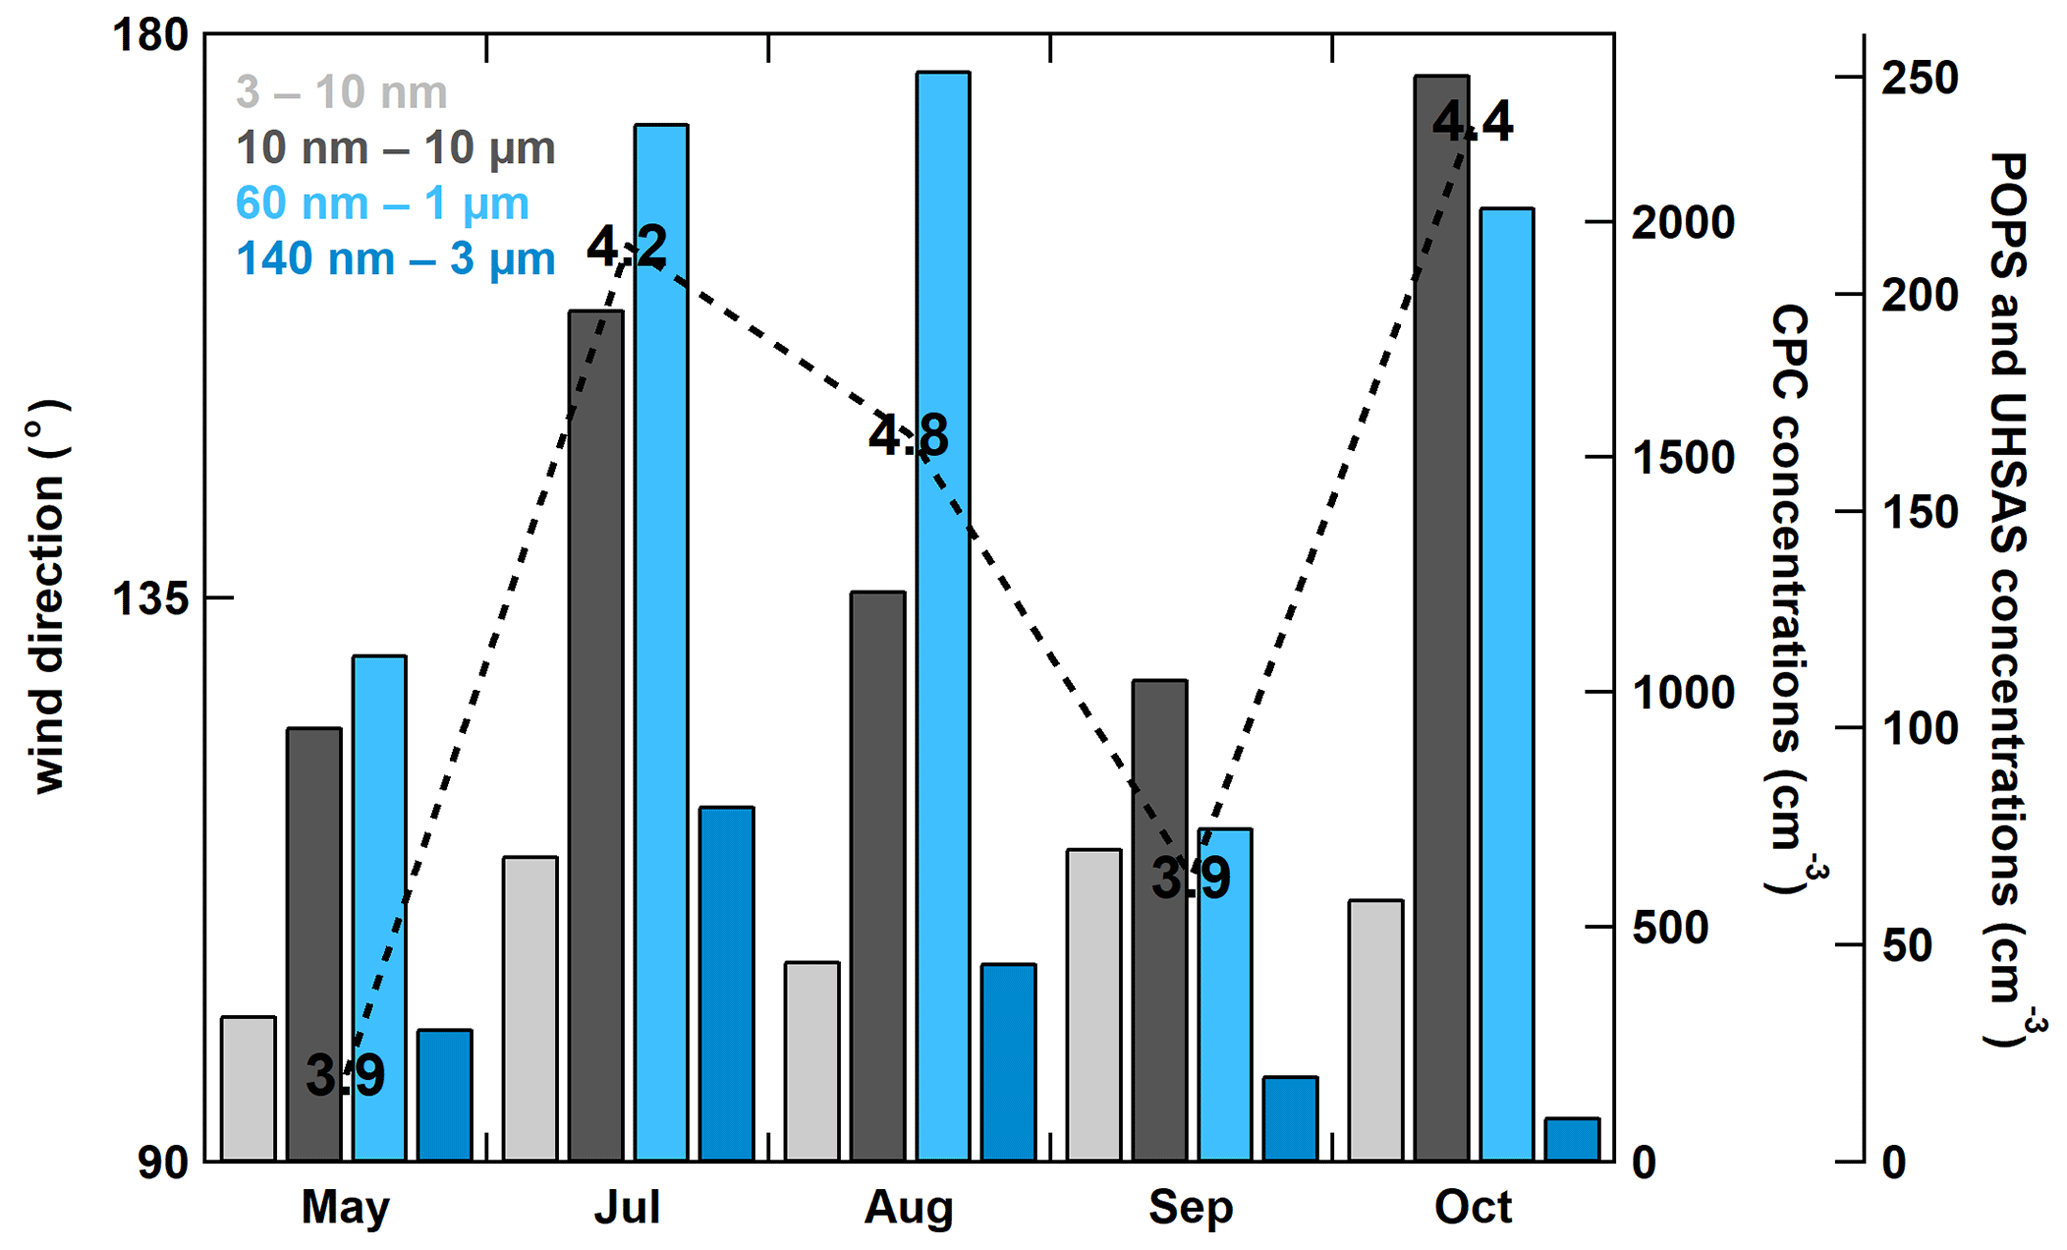
Figure 6Ground-based monthly averaged wind direction at Oliktok Point from days where the TBS flew. The black numbers for the wind direction markers indicate the average wind speed (in m s−1). Colored bars indicate the monthly averaged aerosol number concentrations measured by the CPCf (10 nm–10 µm), UHSAS (60 nm–1 µm), and POPS (140 nm–3 µm). The difference between the CPCu and CPCf is shown as the 3–10 nm particles. Note the CPCs and UHSA and POPS are shown on different axes. The POPS concentrations are averaged from those measured at all below-cloud altitudes (20 m to cloud base), while the remaining aerosol instruments and wind measurements were only surface based (instrumentation included in the AMF3).
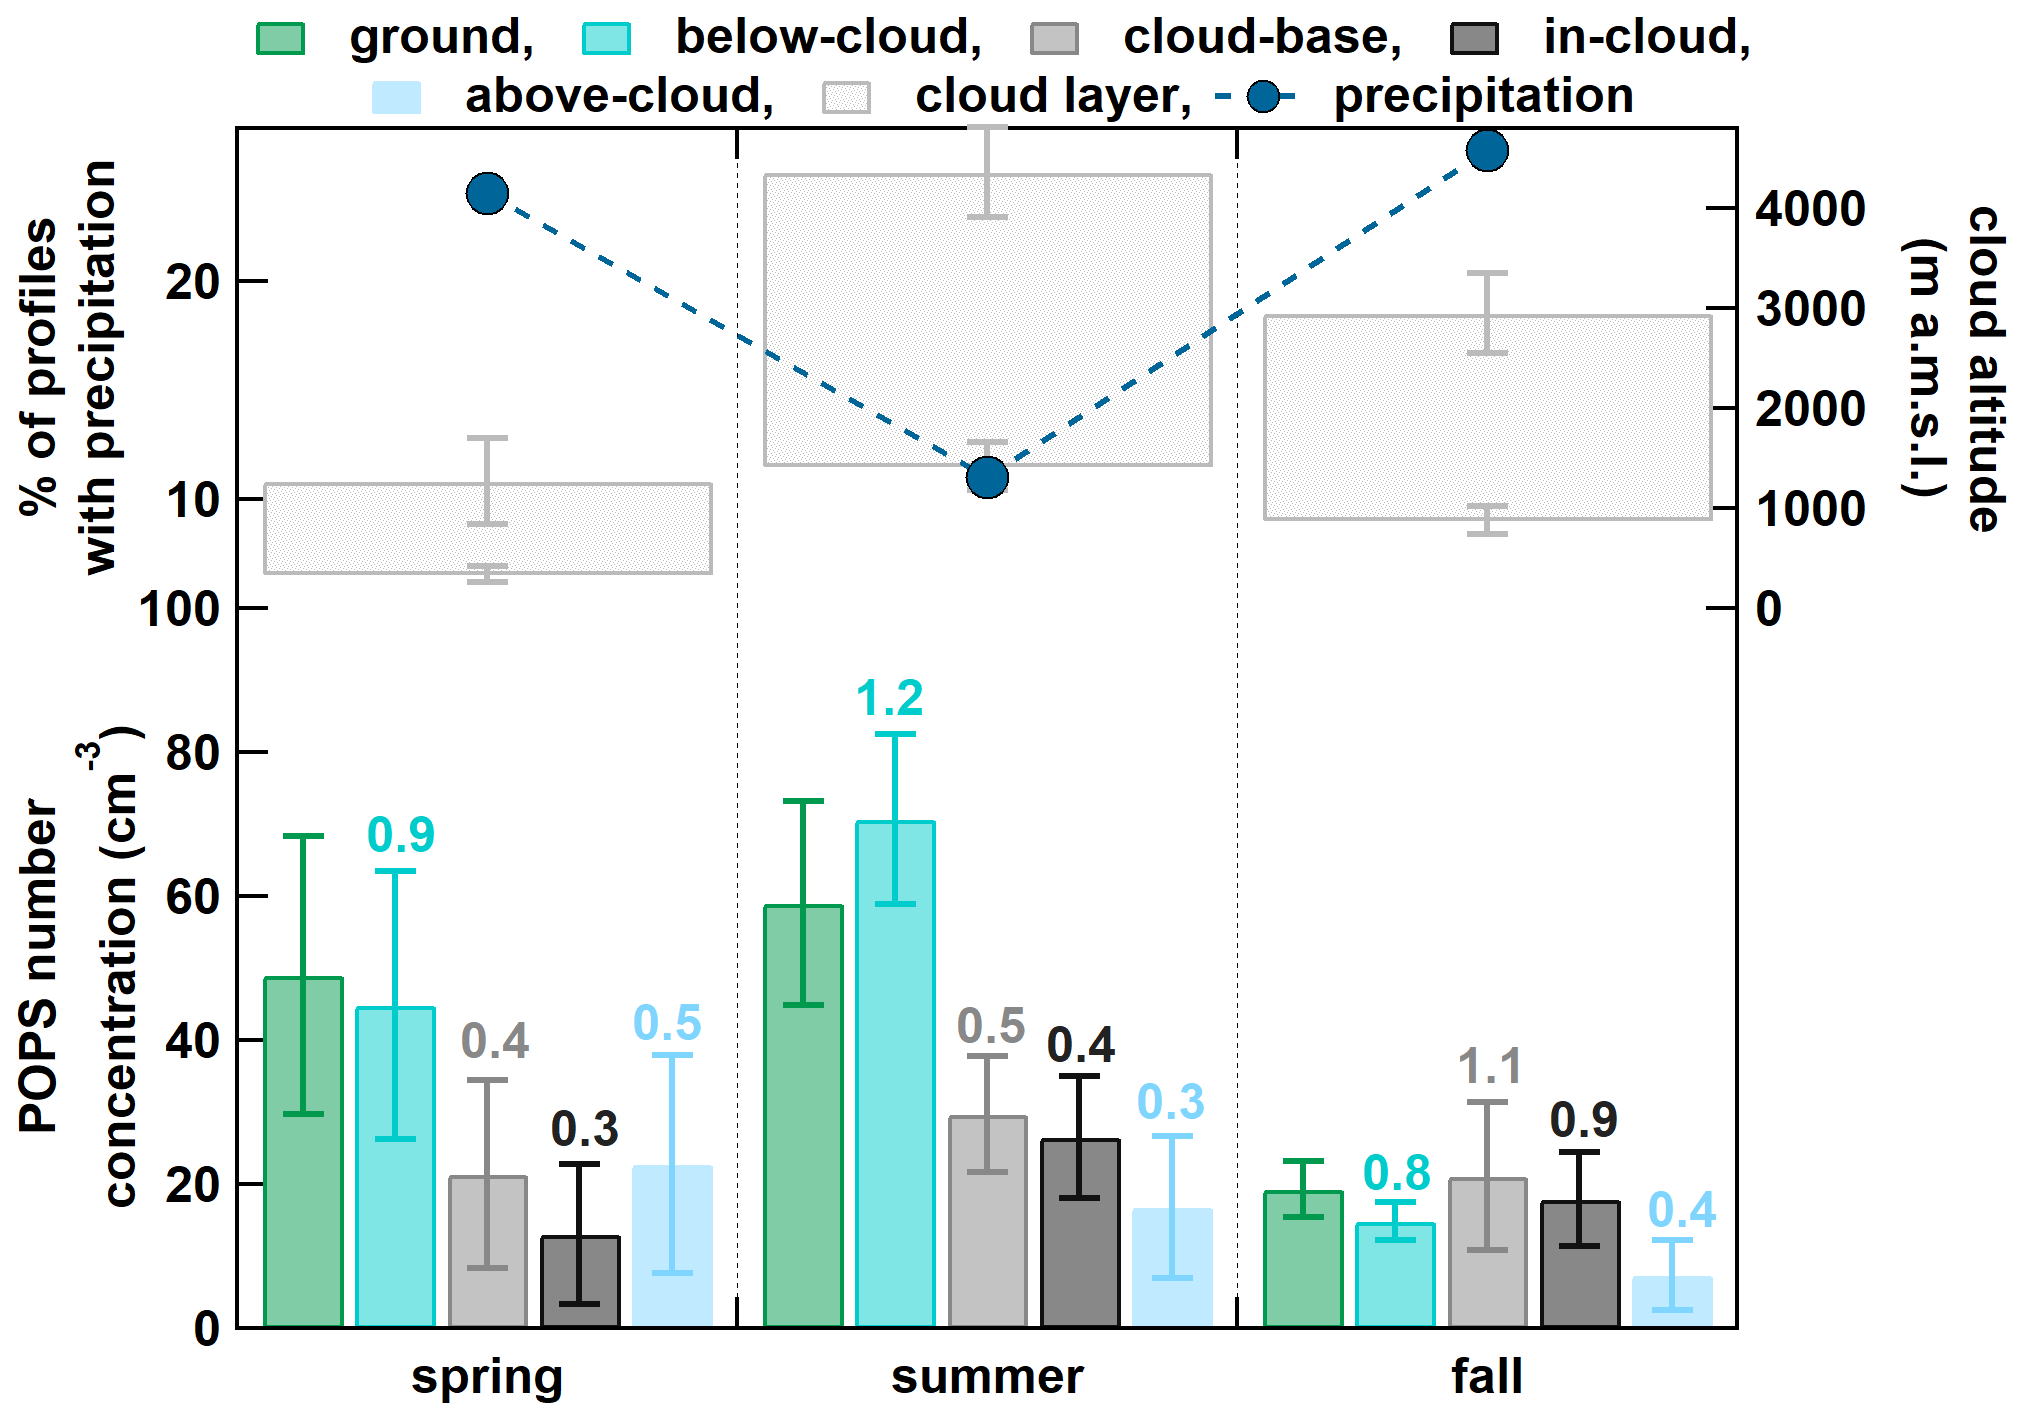
Figure 7Seasonal breakdown of clouds, precipitation, and aerosol number concentration for the 282 profiles containing POPS data. (top) Average cloud altitude and percentage of profiles with precipitation during all TBS flight profiles per season estimated from the ceilometer, KAZR, and PIP. POPS total number concentrations during the spring, summer, and fall for all TBS flight profiles separated into measurements taken at the ground (20–40 m), below-cloud (20 m to average cloud base height), cloud base (the 40 m layer below average cloud base height), in-cloud (average cloud base height to average cloud top height), and above-cloud (average cloud-top height to maximum altitude) regions averaged per profile. The numbers above the bars represent the ratio of that region's concentrations to the ground concentrations (i.e., to the green bar). Error bars indicate 95 % confidence intervals.
The seasonal dependencies of aerosol number concentrations measured by TBS are summarized in Fig. 7, with spring, summer, and fall corresponding to 9 (38), 27 (176), and 10 (68) flights (profiles), respectively. Specifically, we compare between aerosol concentrations at the ground, below the cloud, at cloud base, in the cloud, and above the cloud. In addition, we show average values for cloud base height and depth and the percentage of profiles during precipitation. Average number concentrations were highest in the summer at almost all vertical levels, particularly for below-cloud aerosol, which could be caused by (1) a combination of sources including local oilfield emissions, local or regional biogenic aerosol production, and episodic regionally transported aerosol from Siberian and Alaskan wildfires (Creamean et al., 2018c; Maahn et al., 2017; Stohl, 2006); (2) inefficient below-cloud scavenging; and (3) insufficient wet removal via precipitation. The highest and deepest clouds were observed in the summer, in agreement with previous work on the Alaska North Slope (Shupe et al., 2011). Additionally, precipitation was much less prominent in the summer than spring or fall (11 % of profiles had precipitation versus 24 % and 26 % in spring and fall, respectively). In concert, these observations indicate there was likely less efficient scavenging of aerosol by clouds and precipitation in the summer as compared to other seasons. The spring did not have as high concentrations of aerosol at all levels below cloud top as the summer, which could be a result of more efficient wet scavenging from clouds (i.e., they were lowest during the spring profiles) and precipitation. Another explanation could be that our “spring” flights occurred in May during the tail end of the Arctic haze, weakening of the polar vortex, and the very start of the transition into peak biological productivity from marine and terrestrial sources but prior to influences from regional wildfires (Creamean et al., 2018b, c). Oilfield emissions are likely not responsible for the difference in the seasons since previous studies have indicated these emissions are persistent (Creamean et al., 2018c; Gunsch et al., 2020; Kolesar et al., 2017; Maahn et al., 2017). The only exception is the above-cloud aerosol, which was highest during the spring compared to summer and fall, characteristic of long-range transported Arctic haze that typically resides in elevated layers in the free troposphere (Brock et al., 2011) and, to a lesser degree, closer to the surface (Quinn et al., 2007). Capturing this below-cloud region further demonstrates the utility for TBS measurements in the lowest levels of the Arctic atmosphere. The lowest aerosol concentrations were measured during fall, probably due to (1) limited influences from long-range transport; (2) less impact from regional fires; (3) reduction of sunlight, yielding less biological productivity; and (4) wet scavenging by precipitation (26 % of profiles occurred during precipitation).
3.3 Relationships between aerosols, thermodynamics, and cloud structure
In addition to variability in emissions, transport, and wet removal mechanisms, the stability of the atmosphere helps govern the vertical distribution of the aerosol population resulting from the major sources and sinks. Here, we mainly focus on the below-cloud environment to assess relationships between aerosol concentrations at the surface, in the boundary layer, and at cloud base. Profiles were classified into four separate cases based on the structure of POPS number concentration with height and atmospheric mixing (i.e., θE) below-cloud: (1) profiles with a well-mixed below-cloud environment (i.e., approximately constant θE) and consistent aerosol concentrations with height up to cloud base, (2) profiles with a stratified below-cloud environment and increasing or decreasing gradient in below-cloud aerosol, (3) profiles with a stratified below-cloud environment and intermittent aerosol layers between the ground and cloud base, and (4) outliers wherein no relationship between below-cloud thermodynamic structure and number concentrations existed. Only profiles with θE and POPS data are classified into the different cases (63 profiles total). These data are illustrated in Fig. 8 as ratios of θE and POPS number concentrations at all altitudes within the below-cloud region as compared to their respective values at the ground. The cases where the ground aerosol was equivalent to the cloud base aerosol concentrations under a well-mixed below-cloud environment (case 1) all fall at the 1:1 nexus of both parameters (i.e., θE and POPS number concentrations were both consistent in their below-cloud profiles from their ground values). There were very few profiles that fit the constraints of case 1 (eight profiles) when a mixed layer existed in the below-cloud environment, as shown by the very consistent θE with height. For cases whereby below-cloud stratification existed (46 profiles total), θE caused a gradient (increasing or decreasing aerosol number concentrations with height) or intermittent layers (one or more layers or “spikes” with elevated number concentrations; aerosol layers existed at levels approximately equivalent to the locations of temperature inversions). Data from these cases fall along the “cross” evident in Fig. 8. Interestingly, the outlier profiles (seven total) appeared to occur during well-mixed conditions (i.e., consistent θE with height) but had aerosol profiles with decreasing gradients (six profiles with θE ratio ∼1 and POPS ratio < 1) or decreasing gradients with an intermittent layer (one profile with θE ratio ∼ 1 and POPS ratio < 1 but with spikes). The outliers spanned all seasons (one, two, and four profiles for spring, summer, and fall, respectively) but typically occurred during conditions that had (1) highly variable cloud base (i.e., large standard deviations with the minimum reaching down to near the surface, (2) a very low average cloud base (< 200 m), (3) high relative humidity at the surface, and/or (4) precipitation. One possible explanation is that as aerosols approached the highly variable or very low cloud bases due to activation into cloud particles (i.e., scavenging), they left a relatively thin layer of depletion (Hoffmann et al., 2015; Solomon et al., 2015). Another possible explanation is that local surface sources became diluted as they mixed upwards. The surface winds were northeasterly or westerly during most profiles (six profiles), with one profile occurring during southeasterly winds. It is possible that some combination of source dilution and/or rapid changes in thermodynamic structure of the boundary layer from clouds, humidity, and precipitation originating from storm systems predominantly from over the Arctic Ocean causes the discrepancy between aerosol and thermodynamic profiles.
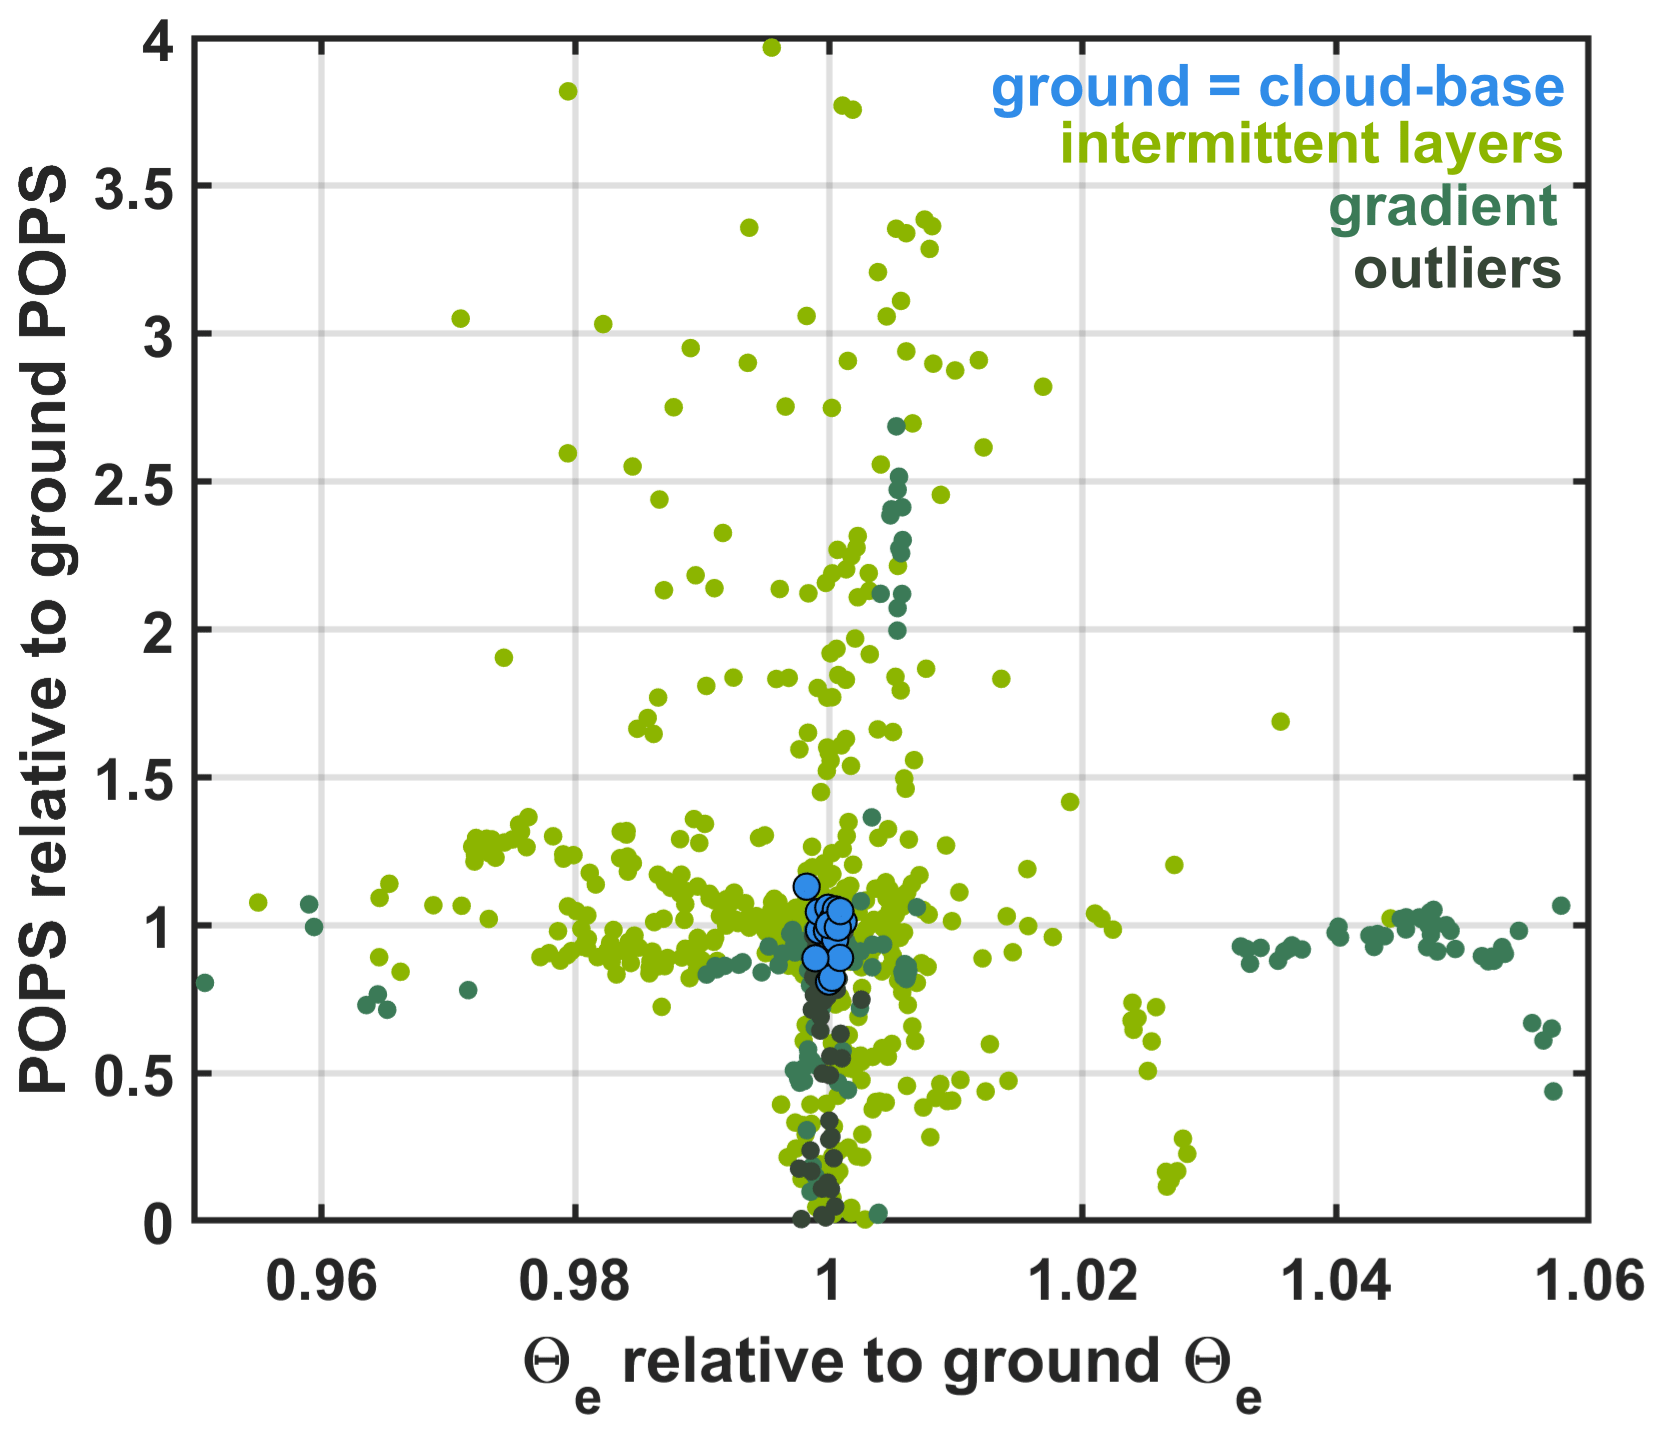
Figure 8Scatterplot of POPS aerosol number concentrations and θE relative to their ground values (20–40 m) for each profile. Data are from the 63 profiles containing POPS and θE throughout the entire below-cloud environment. Each point represents data from one altitude; thus, there are several data points per profile. Data are grouped by case, including profiles where ground aerosol was equivalent to concentrations at cloud base under well-mixed conditions (9 profiles), profiles with intermittent layers of aerosol under stratified conditions (37 profiles), profiles with gradients in aerosol under stratified conditions (9 profiles), and outliers where the atmospheric stability and mixing cannot be used to explain the vertical distribution of the aerosol (7 profiles).
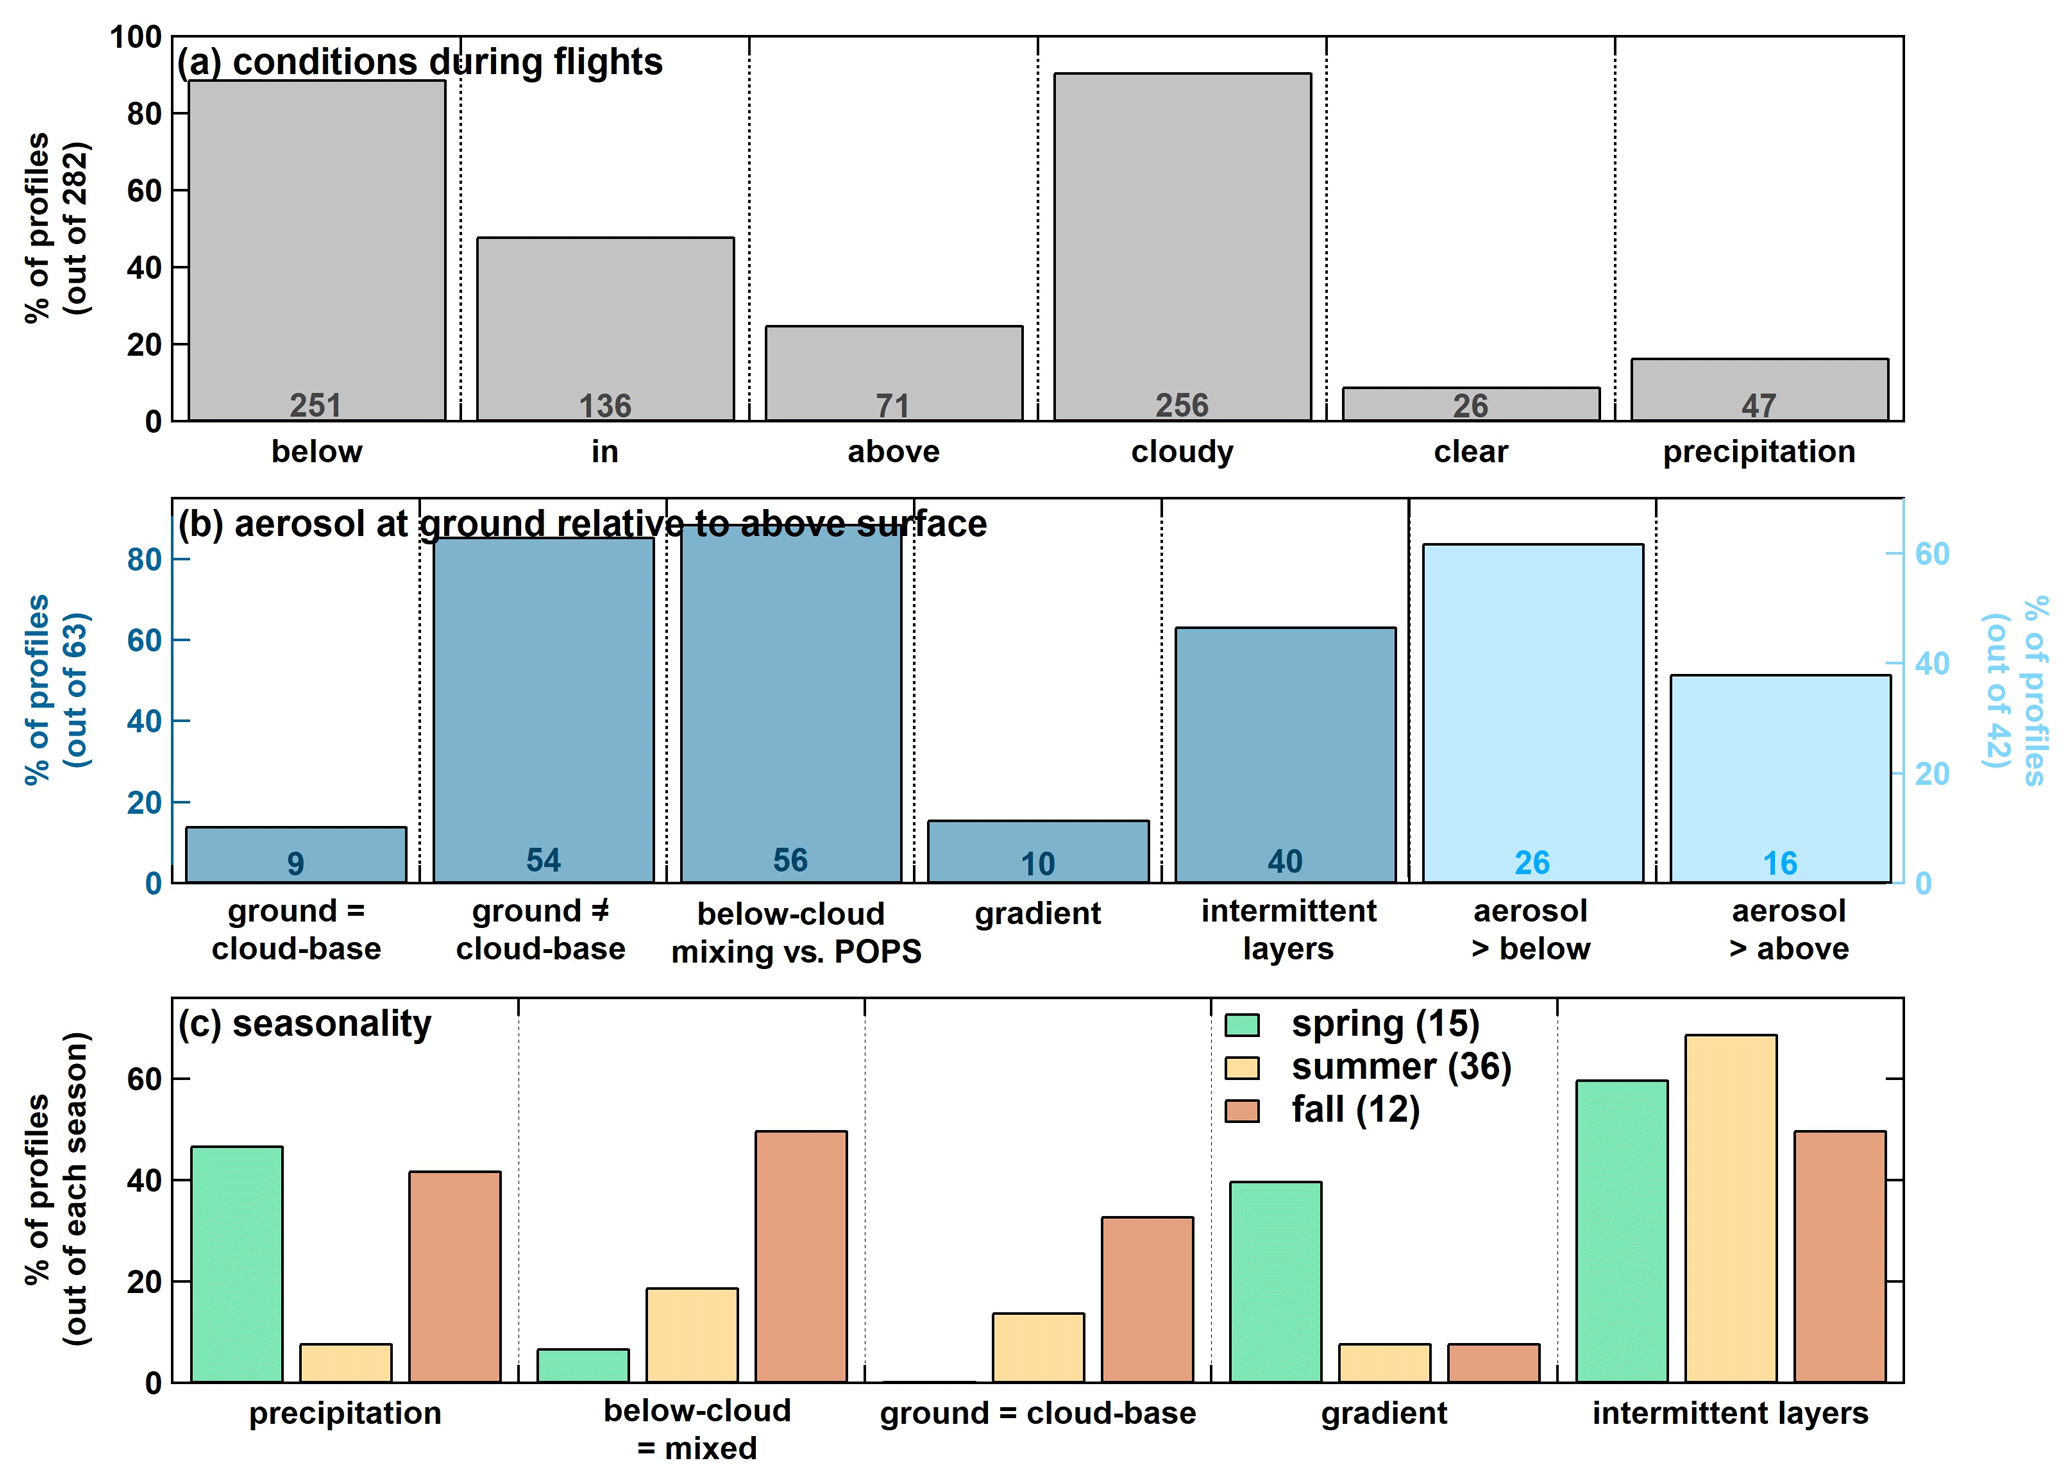
Figure 9Statistics from all profiles with POPS data (282 total) during the ARM TBS campaigns, including (a) when the POPS flew below, in, and above cloud and conditions during the flights (clear or cloudy), and precipitation. Out of the profiles in which POPS was operational at cloud base and at the ground (63 total), panel (b) shows cases where aerosol concentrations were equivalent or not equal at ground and cloud base. When not equal, cases are categorized into an increasing or decreasing gradient with height when intermittent layers were present, and cases where below-cloud mixing can explain the stratification of the aerosol. Also shown are cases where the POPS measured above and below cloud within the same profiles (42 total) and had higher aerosol concentrations below and above cloud. Panel (c) shows various conditions by season from (b). The number of cases is provided for (a) and (b). The number of profiles per season is provided in (c).
The flight conditions and seasonality during the cases and outlier profiles are summarized in Fig. 9. The TBS flew over a range of vertical coverage, including below (89 % of all 282 profiles with POPS data), in (48 %), and above cloud (25 %). The conditions during the TBS flights were mostly cloudy (91 %) and precipitation occurred during 17 % of the 282 profiles (Fig. 9a). Cases where the concentrations of the aerosols at the ground were equivalent to those at cloud base (14 % of the 63 profiles containing POPS measurements at the ground and cloud base) and cases with gradients (16 %) and intermittent layers (63 %) are shown in Fig. 9b. Most of the aerosol was found below as compared to above cloud (38 % of the profile subset had higher aerosol concentrations above cloud as opposed to 62 % having higher concentrations below). The below-cloud environment (i.e., coupled and well-mixed versus decoupled and stratified) reflected the aerosol vertical structure (i.e., concentrations at the ground were similar or dissimilar to those just below cloud base) for most of the profiles (89 %).
The conditions and cases are further broken down into seasons (Fig. 9c). Only the spring had no profiles where the ground aerosol was equivalent to the cloud base in terms of number concentrations and was chiefly impacted by gradients (40 % of the spring profiles with POPS observations at the ground and cloud base) and intermittent layers of aerosols (60 %), which is expected from long-range transported haze aerosol. It is possible the relatively low and variable clouds (i.e., low mean cloud base heights with large standard deviations) in the spring (Fig. 7) influenced the variable aerosol distributions, particularly the decreasing aerosol concentrations when approaching cloud base due to cloud scavenging of aerosol. The summer's high aerosol number concentrations were likely a result of less efficient wet scavenging and relatively little precipitation (Fig. 9c) in combination with higher clouds (Fig. 7) during the summer flights. Additionally, aerosols were predominantly found in layers in the below-cloud environment, possibly due to a mixture of sources from regionally transported wildfire, local oilfields, marine biological emissions, and inefficient below-cloud mixing (Fig. 9c). Most cases where the ground-based aerosol concentrations were equivalent to those near cloud base existed in the fall when the below-cloud environment was mixed far more often than spring and summer. For the 63 profiles, precipitation was highest (lowest) in fall (summer), when the lowest (highest) aerosol concentrations were observed, indicating wet scavenging played a role in controlling the aerosol population below-cloud in combination with a reduction of aerosol sources in the fall.
We present a summary of findings from routine TBS measurements of aerosol number concentrations in tandem with ground-based measurements of aerosols, atmospheric state, and cloud macrophysical properties in northern Alaska from 2 consecutive years and during multiple seasons. To directly address the question posed regarding the representativeness of ground-based measurements of aerosols to those aloft, we compiled data from all TBS flights and disseminated them into profiles, evaluating how the profiles were structured during each season relative to cloud base. This representativeness was observed only 14 % of the time, mostly during the fall months and infrequently during the late summer. The other 86 % of the time, aerosol structure existed as increasing or decreasing gradients up to cloud base or in intermittent layers in the below-cloud environment. The vertical distribution of the aerosols can be explained by a combination of known seasonal sources on the North Slope of Alaska and observed thermodynamic structure and wet scavenging from clouds and precipitation. These findings afford novel information on aerosol vertical structure in the Arctic, especially where traditional platforms such as remote sensing and manned aircraft fail to provide ample coverage. This study is the first to directly evaluate intra-seasonal aerosol vertical properties under the context of the below-cloud Arctic environment.
Overall, the TBS is a useful tool that can fill in key observational gaps of aerosols by providing detailed information on aerosol profiles. In tandem with an understanding of common aerosol sources and auxiliary measurements on cloud and precipitation properties and atmospheric thermodynamic and kinematic structure, the vertical distribution of aerosol number can be explained. This detailed information is crucial for appropriately simulating aerosol–cloud interaction processes, which are especially challenging to model in the Arctic. DOE ARM aims to achieve a richer observational dataset of TBS aerosol measurements through plans for additional flights at a variety of locations and environments for the ARM program, including at ARM fixed sites and for major field campaigns, with deployments including filter sampling for offline aerosol chemical and microphysical property analyses. We recommend that future efforts by the more general Arctic aerosol community should focus on continuing routine observations of aerosol vertical structure in additional, diverse locations throughout the Arctic and during periods with more limited observations such as winter. Ongoing efforts, including the Alfred Wegener Institute (AWI) and Leibniz Institute for Tropospheric Research (TROPOS) TBS observations in the central Arctic during the year-long Multidisciplinary drifting Observatory for the Study of Arctic Climate expedition (MOSAiC; https://mosaic-expedition.org/, last access: 10 September 2020), are extremely valuable for tackling the issue of limited in situ observational coverage of lower atmospheric aerosol properties in the Arctic. Continued development of an enhanced dataset on aerosol vertical structure would be incredibly beneficial for improving representation of aerosol sources and interactions with clouds in the Arctic and beyond. More broadly, refining parameterizations and the general understanding of Arctic aerosol sources, transport, and removal via precipitation and cloud scavenging through enhanced observations will ultimately improve understanding of cloud formation processes and subsequent impacts on the delicate yet dynamic Arctic climate.
The equivalent potential temperature was calculated using the Python MetPy package (https://doi.org/10.5065/D6WW7G29, May et al., 2020).
All data are publicly available and can be accessed through the U.S. DOE ARM Data Archive. The data files produced for this paper can be found at https://doi.org/10.5439/1651201 (Atmospheric Radiation Measurement (ARM) user facility, 1994).
JMC was the lead on this project and was primarily responsible for writing the manuscript. GdB, HT, FM, and DD assisted with data analysis and filtering. All authors contributed to data interpretation and to the writing of the manuscript.
The authors declare that they have no conflict of interest.
Data used throughout the publication were collected thanks to the dedicated efforts of AMF3 site operators and facility managers (Mark Ivey, Fred Helsel, Jasper Hardesty) under funding from the U.S. Department of Energy Atmospheric Radiation Measurement (ARM) Program and are available for download through the ARM data archive (https://www.arm.gov/data, last access: 10 September 2020). We would like to thank additional members of the northern Alaska site science team (Maximilian Maahn, David Turner, Sergey Matrosov, Christopher Cox, and Christopher Williams) for helpful discussions during the initial stages of this analysis and for their assistance in the planning of the TBS campaigns leveraged.
This research has been supported by the Department of Energy, Atmospheric Systems Research Program (grant no. DE-SC0013306).
This paper was edited by Hang Su and reviewed by two anonymous referees.
Abbatt, J. P. D., Leaitch, W. R., Aliabadi, A. A., Bertram, A. K., Blanchet, J.-P., Boivin-Rioux, A., Bozem, H., Burkart, J., Chang, R. Y. W., Charette, J., Chaubey, J. P., Christensen, R. J., Cirisan, A., Collins, D. B., Croft, B., Dionne, J., Evans, G. J., Fletcher, C. G., Galí, M., Ghahremaninezhad, R., Girard, E., Gong, W., Gosselin, M., Gourdal, M., Hanna, S. J., Hayashida, H., Herber, A. B., Hesaraki, S., Hoor, P., Huang, L., Hussherr, R., Irish, V. E., Keita, S. A., Kodros, J. K., Köllner, F., Kolonjari, F., Kunkel, D., Ladino, L. A., Law, K., Levasseur, M., Libois, Q., Liggio, J., Lizotte, M., Macdonald, K. M., Mahmood, R., Martin, R. V., Mason, R. H., Miller, L. A., Moravek, A., Mortenson, E., Mungall, E. L., Murphy, J. G., Namazi, M., Norman, A.-L., O'Neill, N. T., Pierce, J. R., Russell, L. M., Schneider, J., Schulz, H., Sharma, S., Si, M., Staebler, R. M., Steiner, N. S., Thomas, J. L., von Salzen, K., Wentzell, J. J. B., Willis, M. D., Wentworth, G. R., Xu, J.-W., and Yakobi-Hancock, J. D.: Overview paper: New insights into aerosol and climate in the Arctic, Atmos. Chem. Phys., 19, 2527–2560, https://doi.org/10.5194/acp-19-2527-2019, 2019.
Ancellet, G., Pelon, J., Blanchard, Y., Quennehen, B., Bazureau, A., Law, K. S., and Schwarzenboeck, A.: Transport of aerosol to the Arctic: analysis of CALIOP and French aircraft data during the spring 2008 POLARCAT campaign, Atmos. Chem. Phys., 14, 8235–8254, https://doi.org/10.5194/acp-14-8235-2014, 2014.
Ardon-Dryer, K., Levin, Z., and Lawson, R. P.: Characteristics of immersion freezing nuclei at the South Pole station in Antarctica, Atmos. Chem. Phys., 11, 4015–4024, https://doi.org/10.5194/acp-11-4015-2011, 2011.
Arrigo, K. R. and van Dijken, G. L.: Continued increases in Arctic Ocean primary production, Prog. Oceanogr., 136, 60–70, https://doi.org/10.1016/j.pocean.2015.05.002, 2015.
Atkinson, D. E., Sassen, K., Hayashi, M., Cahill, C. F., Shaw, G., Harrigan, D., and Fuelberg, H.: Aerosol properties over Interior Alaska from lidar, DRUM Impactor sampler, and OPC-sonde measurements and their meteorological context during ARCTAS-A, April 2008, Atmos. Chem. Phys., 13, 1293–1310, https://doi.org/10.5194/acp-13-1293-2013, 2013.
Barrie, L. A. and Barrie, M. J.: Chemical-Components of Lower Tropospheric Aerosols in the High Arctic – 6 Years of Observations, J. Atmos. Chem., 11, 211–226, https://doi.org/10.1007/Bf00118349, 1990.
Bodhaine, B. A.: Aerosol measurements at four background sites, J. Geophys. Res.-Oceans, 88, 10753–10768, https://doi.org/10.1029/JC088iC15p10753, 1983.
Borys, R. D.: Studies of ice nucleation by Arctic aerosol on AGASP-II, J. Atmos. Chem., 9, 169–185, https://doi.org/10.1007/BF00052831, 1989.
Brock, C. A., Cozic, J., Bahreini, R., Froyd, K. D., Middlebrook, A. M., McComiskey, A., Brioude, J., Cooper, O. R., Stohl, A., Aikin, K. C., de Gouw, J. A., Fahey, D. W., Ferrare, R. A., Gao, R.-S., Gore, W., Holloway, J. S., Hübler, G., Jefferson, A., Lack, D. A., Lance, S., Moore, R. H., Murphy, D. M., Nenes, A., Novelli, P. C., Nowak, J. B., Ogren, J. A., Peischl, J., Pierce, R. B., Pilewskie, P., Quinn, P. K., Ryerson, T. B., Schmidt, K. S., Schwarz, J. P., Sodemann, H., Spackman, J. R., Stark, H., Thomson, D. S., Thornberry, T., Veres, P., Watts, L. A., Warneke, C., and Wollny, A. G.: Characteristics, sources, and transport of aerosols measured in spring 2008 during the aerosol, radiation, and cloud processes affecting Arctic Climate (ARCPAC) Project, Atmos. Chem. Phys., 11, 2423–2453, https://doi.org/10.5194/acp-11-2423-2011, 2011.
Brooks, I. M., Tjernström, M., Persson, P. O. G., Shupe, M. D., Atkinson, R. A., Canut, G., Birch, C. E., Mauritsen, T., Sedlar, J., and Brooks, B. J.: The Turbulent Structure of the Arctic Summer Boundary Layer During The Arctic Summer Cloud-Ocean Study, J. Geophys. Res.-Atmos., 122, 9685–9704, https://doi.org/10.1002/2017jd027234, 2017.
Browell, E. V., Butler, C. F., Kooi, S. A., Fenn, M. A., Harriss, R. C., and Gregory, G. L.: Large-scale variability of ozone and aerosols in the summertime Arctic and sub-Arctic troposphere, J. Geophys. Res.-Atmos., 97, 16433–16450, https://doi.org/10.1029/92jd00159, 1992.
Browse, J., Carslaw, K. S., Arnold, S. R., Pringle, K., and Boucher, O.: The scavenging processes controlling the seasonal cycle in Arctic sulphate and black carbon aerosol, Atmos. Chem. Phys., 12, 6775–6798, https://doi.org/10.5194/acp-12-6775-2012, 2012.
Bryan, N. C., Stewart, M., Granger, D., Guzik, T. G., and Christner, B. C.: A method for sampling microbial aerosols using high altitude balloons, J. Microbiol. Meth., 107, 161–168, https://doi.org/10.1016/j.mimet.2014.10.007, 2014.
Burkart, J., Willis, M. D., Bozem, H., Thomas, J. L., Law, K., Hoor, P., Aliabadi, A. A., Köllner, F., Schneider, J., Herber, A., Abbatt, J. P. D., and Leaitch, W. R.: Summertime observations of elevated levels of ultrafine particles in the high Arctic marine boundary layer, Atmos. Chem. Phys., 17, 5515–5535, https://doi.org/10.5194/acp-17-5515-2017, 2017.
Cadeddu, M.: Microwave Radiometer–3 channel (MWR3C) Handbook, ARM Climate Research Facility, DOE/SC-ARM-TR-206, 2012.
Chuan, R. L.: AGASP II arctic haze aerosol characteristics – Influence of volcanic eruption emissions, Atmos. Environ. A.-G., 27, 2901–2906, https://doi.org/10.1016/0960-1686(93)90321-O, 1993.
Creamean, J. M., Dexheimer, D., and Mei, F.: Aerosol Vertical Profiling at Oliktok Point (AVPOP) Field Campaign Report, U.S. Department of Energy, Office of Science, Office of Biological and Environmental Research, DOE/SC-ARM-18-032, 2018a.
Creamean, J. M., Kirpes, R. M., Pratt, K. A., Spada, N. J., Maahn, M., de Boer, G., Schnell, R. C., and China, S.: Marine and terrestrial influences on ice nucleating particles during continuous springtime measurements in an Arctic oilfield location, Atmos. Chem. Phys., 18, 18023–18042, https://doi.org/10.5194/acp-18-18023-2018, 2018b.
Creamean, J. M., Maahn, M., de Boer, G., McComiskey, A., Sedlacek, A. J., and Feng, Y.: The influence of local oil exploration and regional wildfires on summer 2015 aerosol over the North Slope of Alaska, Atmos. Chem. Phys., 18, 555–570, https://doi.org/10.5194/acp-18-555-2018, 2018c.
Creamean, J. M., Primm, K. M., Tolbert, M. A., Hall, E. G., Wendell, J., Jordan, A., Sheridan, P. J., Smith, J., and Schnell, R. C.: HOVERCAT: a novel aerial system for evaluation of aerosol–cloud interactions, Atmos. Meas. Tech., 11, 3969–3985, https://doi.org/10.5194/amt-11-3969-2018, 2018d.
Croft, B., Martin, R. V., Leaitch, W. R., Tunved, P., Breider, T. J., D'Andrea, S. D., and Pierce, J. R.: Processes controlling the annual cycle of Arctic aerosol number and size distributions, Atmos. Chem. Phys., 16, 3665–3682, https://doi.org/10.5194/acp-16-3665-2016, 2016.
Curry, J. A., Ebert, E. E., and Herman, G. F.: Mean and turbulence structure of the summertime Arctic cloudy boundary layer, Q. J. Roy. Meteor. Soc., 114, 715–746, https://doi.org/10.1002/qj.49711448109, 1988.
Curry, J. A., Hobbs, P. V., King, M. D., Randall, D. A., Minnis, P., Isaac, G. A., Pinto, J. O., Uttal, T., Bucholtz, A., Cripe, D. G., Gerber, H., Fairall, C. W., Garrett, T. J., Hudson, J., Intrieri, J. M., Jakob, C., Jensen, T., Lawson, P., Marcotte, D., Nguyen, L., Pilewskie, P., Rangno, A., Rogers, D. C., Strawbridge, K. B., Valero, F. P. J., Williams, A. G., and Wylie, D.: FIRE Arctic Clouds Experiment, B. Am. Meteorol. Soc., 81, 5–30, https://doi.org/10.1175/1520-0477(2000)081<0005:FACE>2.3.CO;2, 2000.
Dagsson-Waldhauserova, P., Renard, J.-B., Olafsson, H., Vignelles, D., Berthet, G., Verdier, N., and Duverger, V.: Vertical distribution of aerosols in dust storms during the Arctic winter, Sci. Rep.-UK, 9, 16122, https://doi.org/10.1038/s41598-019-51764-y, 2019.
de Boer, G., Hashino, T., Tripoli, G. J., and Eloranta, E. W.: A numerical study of aerosol influence on mixed-phase stratiform clouds through modulation of the liquid phase, Atmos. Chem. Phys., 13, 1733–1749, https://doi.org/10.5194/acp-13-1733-2013, 2013.
de Boer, G., Ivey, M. D., Schmid, B., McFarlane, S., and Petty, R.: Unmanned platforms monitor the Arctic atmosphere, EOS, 97, https://doi.org/10.1029/2016EO046441, 2015.
de Boer, G., Palo, S., Argrow, B., LoDolce, G., Mack, J., Gao, R.-S., Telg, H., Trussel, C., Fromm, J., Long, C. N., Bland, G., Maslanik, J., Schmid, B., and Hock, T.: The Pilatus unmanned aircraft system for lower atmospheric research, Atmos. Meas. Tech., 9, 1845–1857, https://doi.org/10.5194/amt-9-1845-2016, 2016.
de Boer, G., Ivey, M., Schmid, B., Lawrence, D., Dexheimer, D., Mei, F., Hubbe, J., Bendure, A., Hardesty, J., Shupe, M. D., McComiskey, A., Telg, H., Schmitt, C., Matrosov, S. Y., Brooks, I., Creamean, J., Solomon, A., Turner, D. D., Williams, C., Maahn, M., Argrow, B., Palo, S., Long, C. N., Gao, R.-S., and Mather, J.: A Bird's-Eye View: Development of an Operational ARM Unmanned Aerial Capability for Atmospheric Research in Arctic Alaska, B. Am. Meteorol. Soc., 99, 1197–1212, https://doi.org/10.1175/bams-d-17-0156.1, 2018.
de Boer, G., Dexheimer, D., Mei, F., Hubbe, J., Longbottom, C., Carroll, P. J., Apple, M., Goldberger, L., Oaks, D., Lapierre, J., Crume, M., Bernard, N., Shupe, M. D., Solomon, A., Intrieri, J., Lawrence, D., Doddi, A., Holdridge, D. J., Hubbell, M., Ivey, M. D., and Schmid, B.: Atmospheric observations made at Oliktok Point, Alaska, as part of the Profiling at Oliktok Point to Enhance YOPP Experiments (POPEYE) campaign, Earth Syst. Sci. Data, 11, 1349–1362, https://doi.org/10.5194/essd-11-1349-2019, 2019a.
de Boer, G., Shupe, M., Solomon, A., and Intrieri, J.: Profiling at Oliktok Point to Enhance Year of Polar Prediction (YOPP) Experiments (POPEYE) Field Campaign Report, U.S. Department of Energy, Office of Science, Office of Biological and Environmental Research, DOE/SC-ARM-19-010, 2019b.
Atmospheric Radiation Measurement (ARM) user facility: Arctic aerosol vertical profile data from the ICARUS, AVPOP, and POPEYE TBS campaigns, May 2017–September 2018, 70degree29′42′′ N, 149∘53′9.6′′ W: OLI M1 – Oliktok Point, Alaska, AMF3, edited by: Creamean, J. and Telg, H., Fort Collins and Boulder, Colorado, https://doi.org/10.5439/1651201, 1994 (updated daily).
Dexheimer, D.: Tethered Balloon System (TBS) Instrument Handbook, ARM Climate Research Facility, DOE/SC-ARM-TR-206, 2018.
Dexheimer, D., Airey, M., Roesler, E., Longbottom, C., Nicoll, K., Kneifel, S., Mei, F., Harrison, R. G., Marlton, G., and Williams, P. D.: Evaluation of ARM tethered-balloon system instrumentation for supercooled liquid water and distributed temperature sensing in mixed-phase Arctic clouds, Atmos. Meas. Tech., 12, 6845–6864, https://doi.org/10.5194/amt-12-6845-2019, 2019.
Dimitrelos, A., Ekman, A. M. L., Caballero, R., and Savre, J.: A Sensitivity Study of Arctic Air-Mass Transformation Using Large Eddy Simulation, J. Geophys. Res.-Atmos., 125, e2019JD031738, https://doi.org/10.1029/2019jd031738, 2020.
Eirund, G. K., Possner, A., and Lohmann, U.: Response of Arctic mixed-phase clouds to aerosol perturbations under different surface forcings, Atmos. Chem. Phys., 19, 9847–9864, https://doi.org/10.5194/acp-19-9847-2019, 2019.
Ferrero, L., Ritter, C., Cappelletti, D., Moroni, B., Močnik, G., Mazzola, M., Lupi, A., Becagli, S., Traversi, R., Cataldi, M., Neuber, R., Vitale, V., and Bolzacchini, E.: Aerosol optical properties in the Arctic: The role of aerosol chemistry and dust composition in a closure experiment between Lidar and tethered balloon vertical profiles, Sci. Total Environ., 686, 452–467, https://doi.org/10.1016/j.scitotenv.2019.05.399, 2019.
Fisher, J. A., Jacob, D. J., Purdy, M. T., Kopacz, M., Le Sager, P., Carouge, C., Holmes, C. D., Yantosca, R. M., Batchelor, R. L., Strong, K., Diskin, G. S., Fuelberg, H. E., Holloway, J. S., Hyer, E. J., McMillan, W. W., Warner, J., Streets, D. G., Zhang, Q., Wang, Y., and Wu, S.: Source attribution and interannual variability of Arctic pollution in spring constrained by aircraft (ARCTAS, ARCPAC) and satellite (AIRS) observations of carbon monoxide, Atmos. Chem. Phys., 10, 977–996, https://doi.org/10.5194/acp-10-977-2010, 2010.
Freud, E., Krejci, R., Tunved, P., Leaitch, R., Nguyen, Q. T., Massling, A., Skov, H., and Barrie, L.: Pan-Arctic aerosol number size distributions: seasonality and transport patterns, Atmos. Chem. Phys., 17, 8101–8128, https://doi.org/10.5194/acp-17-8101-2017, 2017.
Fridlind, A. M., Ackerman, A. S., McFarquhar, G., Zhang, G., Poellot, M. R., DeMott, P. J., Prenni, A. J., and Heymsfield, A. J.: Ice properties of single-layer stratocumulus during the Mixed-Phase Arctic Cloud Experiment: 2. Model results, 112, D24202, https://doi.org/10.1029/2007jd008646, 2007.
Fridlind, A. M. and Ackerman, A. S.: Chapter 7 – Simulations of Arctic Mixed-Phase Boundary Layer Clouds: Advances in Understanding and Outstanding Questions, in: Mixed-Phase Clouds, edited by: Andronache, C., Elsevier, 153–183, 2018.
Gabric, A., Matrai, P., Jones, G., and Middleton, J.: The Nexus between Sea Ice and Polar Emissions of Marine Biogenic Aerosols, B. Am. Meteorol. Soc., 99, 61–81, https://doi.org/10.1175/bams-d-16-0254.1, 2018.
Gamberg, M.: Threats to Arctic Ecosystems, in: Encyclopedia of the World's Biomes, edited by: Goldstein, M. I. and DellaSala, D. A., Elsevier, Oxford, 532–538, 2020.
Gao, R. S., Telg, H., McLaughlin, R. J., Ciciora, S. J., Watts, L. A., Richardson, M. S., Schwarz, J. P., Perring, A. E., Thornberry, T. D., Rollins, A. W., Markovic, M. Z., Bates, T. S., Johnson, J. E., and Fahey, D. W.: A light-weight, high-sensitivity particle spectrometer for PM2.5 aerosol measurements, Aerosol Sci. Tech., 50, 88–99, https://doi.org/10.1080/02786826.2015.1131809, 2016.
Garrett, T., Zhao, C., and Novelli, P.: Assessing the relative contributions of transport efficiency and scavenging to seasonal variability in Arctic aerosol, Tellus B, 62, 190–196, https://doi.org/10.1111/j.1600-0889.2010.00453.x, 2010.
Garrett, T. J. and Zhao, C.: Increased Arctic cloud longwave emissivity associated with pollution from mid-latitudes, Nature, 440, 787–789, https://doi.org/10.1038/nature04636, 2006.
Gierens, R., Kneifel, S., Shupe, M. D., Ebell, K., Maturilli, M., and Löhnert, U.: Low-level mixed-phase clouds in a complex Arctic environment, Atmos. Chem. Phys., 20, 3459–3481, https://doi.org/10.5194/acp-20-3459-2020, 2020.
Graversen, R. G., Mauritsen, T., Tjernström, M., Källén, E., and Svensson, G.: Vertical structure of recent Arctic warming, Nature, 451, 53–56, https://doi.org/10.1038/nature06502, 2008.
Greenberg, J. R., Guenther, A. B., and Turnipseed, A.: Tethered balloon-based soundings of ozone, aerosols, and solar radiation near Mexico City during MIRAGE-MEX, Atmos. Environ., 43, 2672–2677, https://doi.org/10.1016/j.atmosenv.2009.02.019, 2009.
Gregory, G. L., Anderson, B. E., Warren, L. S., Browell, E. V., Bagwell, D. R., and Hudgins, C. H.: Tropospheric ozone and aerosol observations: The Alaskan Arctic, 97, 16451–16471, https://doi.org/10.1029/91jd01310, 1992.
Gui, K., Che, H., Chen, Q., Yu, J., Zheng, Y., Lu, S., Wang, H., Wang, Y., Zhang, X., and Shi, G.: Analysis of the Error in Retrievals of Aerosol Optical Properties from Sunphotometer Measurements of CARSNET Due to a Variety of Objective Factors, Atmosphere, 7, 9, https://doi.org/10.3390/atmos7010009, 2016.
Gunsch, M. J., Kirpes, R. M., Kolesar, K. R., Barrett, T. E., China, S., Sheesley, R. J., Laskin, A., Wiedensohler, A., Tuch, T., and Pratt, K. A.: Contributions of transported Prudhoe Bay oil field emissions to the aerosol population in Utqiaġvik, Alaska, Atmos. Chem. Phys., 17, 10879–10892, https://doi.org/10.5194/acp-17-10879-2017, 2017.
Gunsch, M. J., Liu, J., Moffett, C. E., Sheesley, R. J., Wang, N., Zhang, Q., Watson, T. B., and Pratt, K. A.: Diesel Soot and Amine-Containing Organic Sulfate Aerosols in an Arctic Oil Field, Environ. Sci. Technol., 54, 92–101, https://doi.org/10.1021/acs.est.9b04825, 2020.
Harriss, R. C., Wofsy, S. C., Bartlett, D. S., Shipham, M. C., Jacob, D. J., Hoell Jr., J. M., Bendura, R. J., Drewry, J. W., McNeal, R. J., Navarro, R. L., Gidge, R. N., and Rabine, V. E.: The Arctic Boundary Layer Expedition (ABLE 3A): July–August 1988, J. Geophys. Res.-Atmos., 97, 16383–16394, https://doi.org/10.1029/91jd02109, 1992.
Herbert, G. A., Sheridan, P. J., Schnell, R. C., Bieniulis, M. Z., and Bodhaine, B. A.: Analysis of meteorological conditions during AGASP-IV, 30 March–23 April 1992, Technical memo, United States, 1993.
Hoff, R. M.: Vertical Structure of Arctic Haze Observed by Lidar, J. Appl. Meteorol. Clim., 27, 125–139, https://doi.org/10.1175/1520-0450(1988)027<0125:Vsoaho>2.0.Co;2, 1988.
Hoffmann, F., Raasch, S., and Noh, Y.: Entrainment of aerosols and their activation in a shallow cumulus cloud studied with a coupled LCM–LES approach, Atmos. Res., 156, 43–57, https://doi.org/10.1016/j.atmosres.2014.12.008, 2015.
Hofmann, D. J., Rosen, J. M., Harder, J. W., and Hereford, J. V.: Balloon-borne measurements of aerosol, condensation nuclei, and cloud particles in the stratosphere at McMurdo Station, Antarctica, during the spring of 1987, J. Geophys. Res.-Atmos., 94, 11253–11269, https://doi.org/10.1029/JD094iD09p11253, 1989.
Hofmann, D. J., Deshler, T., Arnold, F., and Schlager, H.: Balloon observations of nitric acid aerosol formation in the Arctic stratosphere: II. Aerosol, Geophys. Res. Lett., 17, 1279–1282, https://doi.org/10.1029/GL017i009p01279, 1990.
Hofmann, D. J.: Twenty years of balloon-borne tropospheric aerosol measurements at Laramie, Wyoming, J. Geophys. Res.-Atmos., 98, 12753–12766, https://doi.org/10.1029/93JD00466, 1993.
Huang, L., Gong, S. L., Jia, C. Q., and Lavoué, D.: Importance of deposition processes in simulating the seasonality of the Arctic black carbon aerosol, J. Geophys. Res-.Atmos., 115, D17207, https://doi.org/10.1029/2009JD013478, 2010.
Huntington, H. P., Quakenbush, L. T., and Nelson, M.: Evaluating the Effects of Climate Change on Indigenous Marine Mammal Hunting in Northern and Western Alaska Using Traditional Knowledge, Front. Mar. Sci., 4, 319, https://doi.org/10.3389/fmars.2017.00319, 2017.
Iwasaka, Y., Shi, G.-Y., Shen, Z., Kim, Y. S., Trochkine, D., Matsuki, A., Zhang, D., Shibata, T., Nagatani, M., and Nakata, H.: Nature of Atmospheric Aerosols over the Desert Areas in the Asian Continent: Chemical State and Number Concentration of Particles Measured at Dunhuang, China, Water Air Soil Poll., 3, 129–145, https://doi.org/10.1023/a:1023282221749, 2003.
Jacob, D. J., Crawford, J. H., Maring, H., Clarke, A. D., Dibb, J. E., Emmons, L. K., Ferrare, R. A., Hostetler, C. A., Russell, P. B., Singh, H. B., Thompson, A. M., Shaw, G. E., McCauley, E., Pederson, J. R., and Fisher, J. A.: The Arctic Research of the Composition of the Troposphere from Aircraft and Satellites (ARCTAS) mission: design, execution, and first results, Atmos. Chem. Phys., 10, 5191–5212, https://doi.org/10.5194/acp-10-5191-2010, 2010.
Jeffries, M. O., Overland, J. E., and Perovich, D. K.: THE ARCTIC shifts to a new normal, Phys. Today, 66, 35–40, https://doi.org/10.1063/Pt.3.2147, 2013.
John, C. C. G., Huntington, H. P., Brewster, K., Eicken, H., Norton, D. W., and Glenn, R.: Observations on Shorefast Ice Dynamics in Arctic Alaska and the Responses of the Iñupiat Hunting Community, Arctic, 57, 363–374, 2004.
Kavaya, M. J. and Menzies, R. T.: Lidar aerosol backscatter measurements: systematic, modeling, and calibration error considerations, Appl. Opt., 24, 3444–3453, https://doi.org/10.1364/AO.24.003444, 1985.
Khattatov, V., Yushkov, V., Khaplanov, M., Zaitzev, I., Rosen, J., and Kjome, N.: Some results of water vapor, ozone and aerosol balloon borne measurements during EASOE, Geophys. Res. Lett., 21, 1299–1302, https://doi.org/10.1029/93gl03559, 1994.
Kim, M.-H., Omar, A. H., Vaughan, M. A., Winker, D. M., Trepte, C. R., Hu, Y., Liu, Z., and Kim, S.-W.: Quantifying the low bias of CALIPSO's column aerosol optical depth due to undetected aerosol layers, J. Geophys. Res.-Atmos., 122, 1098–1113, https://doi.org/10.1002/2016JD025797, 2017.
Kim, Y. S., Iwasaka, Y., Shi, G.-Y., Shen, Z., Trochkine, D., Matsuki, A., Zhang, D., Shibata, T., Nagatani, M., and Nakata, H.: Features in Number Concentration-Size Distributions of Aerosols in the Free Atmosphere over the Desert Areas in the Asian Continent: Balloon-Borne Measurements at Dunhuang, China, Water Air Soil Poll., 3, 147–159, https://doi.org/10.1023/a:1023234305819, 2003.
Kirpes, R. M., Rodriguez, B., Kim, S., China, S., Laskin, A., Park, K., Jung, J., Ault, A. P., and Pratt, K. A.: Emerging investigator series: influence of marine emissions and atmospheric processing on individual particle composition of summertime Arctic aerosol over the Bering Strait and Chukchi Sea, Environ. Sci., 22, 1201–1213, https://doi.org/10.1039/C9EM00495E, 2020.
Klein, S. A., McCoy, R. B., Morrison, H., Ackerman, A. S., Avramov, A., Boer, G. d., Chen, M., Cole, J. N. S., Del Genio, A. D., Falk, M., Foster, M. J., Fridlind, A., Golaz, J.-C., Hashino, T., Harrington, J. Y., Hoose, C., Khairoutdinov, M. F., Larson, V. E., Liu, X., Luo, Y., McFarquhar, G. M., Menon, S., Neggers, R. A. J., Park, S., Poellot, M. R., Schmidt, J. M., Sednev, I., Shipway, B. J., Shupe, M. D., Spangenberg, D. A., Sud, Y. C., Turner, D. D., Veron, D. E., Salzen, K. v., Walker, G. K., Wang, Z., Wolf, A. B., Xie, S., Xu, K.-M., Yang, F., and Zhang, G.: Intercomparison of model simulations of mixed-phase clouds observed during the ARM Mixed-Phase Arctic Cloud Experiment. I: single-layer cloud, Q. J. Roy. Meteor. Soc., 135, 979–1002, https://doi.org/10.1002/qj.416, 2009.
Koenigk, T., Key, J., and Vihma, T.: Climate Change in the Arctic, Physics and Chemistry of the Arctic Atmosphere, Springer, Cham, 2020.
Kolesar, K. R., Cellini, J., Peterson, P. K., Jefferson, A., Tuch, T., Birmili, W., Wiedensohler, A., and Pratt, K. A.: Effect of Prudhoe Bay emissions on atmospheric aerosol growth events observed in Utqiagvik (Barrow), Alaska, Atmos. Environ., 152, 146–155, https://doi.org/10.1016/j.atmosenv.2016.12.019, 2017.
Kondo, Y., Aimedieu, P., Matthews, W. A., Fahey, D. W., Murcray, D. G., Hofmann, D. J., Johnston, P. V., Iwasaka, Y., Iwata, A., and Sheldon, W. R.: Balloon-borne measurements of total reactive nitrogen, nitric acid, and aerosol in the cold Arctic stratosphere, Geophys. Res. Lett., 17, 437–440, https://doi.org/10.1029/GL017i004p00437, 1990.
Kovalev, V. A.: Sensitivity of the lidar solution to errors of the aerosol backscatter-to-extinction ratio: influence of a monotonic change in the aerosol extinction coefficient, Appl. Opt., 34, 3457–3462, https://doi.org/10.1364/AO.34.003457, 1995.
Kyrouac, J.: Aerosol Observing System Surface Meteorology (AOSMET) Instrument Handbook, ARM Climate Research Facility, DOE/SC-ARM-TR-184, 2016.
Lange, R., Dall'Osto, M., Skov, H., Nøjgaard, J. K., Nielsen, I. E., Beddows, D. C. S., Simo, R., Harrison, R. M., and Massling, A.: Characterization of distinct Arctic aerosol accumulation modes and their sources, Atmos. Environ., 183, 1–10, https://doi.org/10.1016/j.atmosenv.2018.03.060, 2018.
Lathem, T. L., Beyersdorf, A. J., Thornhill, K. L., Winstead, E. L., Cubison, M. J., Hecobian, A., Jimenez, J. L., Weber, R. J., Anderson, B. E., and Nenes, A.: Analysis of CCN activity of Arctic aerosol and Canadian biomass burning during summer 2008, Atmos. Chem. Phys., 13, 2735–2756, https://doi.org/10.5194/acp-13-2735-2013, 2013.
Law, K. S. and Stohl, A.: Arctic air pollution: Origins and impacts, Science, 315, 1537–1540, https://doi.org/10.1126/science.1137695, 2007.
Leaitch, W. R., Korolev, A., Aliabadi, A. A., Burkart, J., Willis, M. D., Abbatt, J. P. D., Bozem, H., Hoor, P., Köllner, F., Schneider, J., Herber, A., Konrad, C., and Brauner, R.: Effects of 20–100 nm particles on liquid clouds in the clean summertime Arctic, Atmos. Chem. Phys., 16, 11107–11124, https://doi.org/10.5194/acp-16-11107-2016, 2016.
Limbeck, A. and Puxbaum, H.: Dependence of in-cloud scavenging of polar organic aerosol compounds on the water solubility, J. Geophys. Res.-Atmos., 105, 19857–19867, https://doi.org/10.1029/2000JD900123, 2000.
Liu, D., Quennehen, B., Darbyshire, E., Allan, J. D., Williams, P. I., Taylor, J. W., Bauguitte, S. J.-B., Flynn, M. J., Lowe, D., Gallagher, M. W., Bower, K. N., Choularton, T. W., and Coe, H.: The importance of Asia as a source of black carbon to the European Arctic during springtime 2013, Atmos. Chem. Phys., 15, 11537–11555, https://doi.org/10.5194/acp-15-11537-2015, 2015.
Lubin, D. and Vogelmann, A. M.: A climatologically significant aerosol longwave indirect effect in the Arctic, Nature, 439, 453–456, https://doi.org/10.1038/nature04449, 2006.
Lubin, D. and Vogelmann, A. M.: Expected magnitude of the aerosol shortwave indirect effect in springtime Arctic liquid water clouds, Geophys. Res. Lett., 34, L11801, https://doi.org/10.1029/2006gl028750, 2007.
Lubin, D. and Vogelmann, A. M.: Observational quantification of a total aerosol indirect effect in the Arctic, Tellus B, 62, 181–189, https://doi.org/10.1111/j.1600-0889.2010.00460.x, 2010.
Maahn, M., de Boer, G., Creamean, J. M., Feingold, G., McFarquhar, G. M., Wu, W., and Mei, F.: The observed influence of local anthropogenic pollution on northern Alaskan cloud properties, Atmos. Chem. Phys., 17, 14709–14726, https://doi.org/10.5194/acp-17-14709-2017, 2017.
Maenhaut, W., Cornille, P., Pacyna, J. M., and Vitols, V.: Trace element composition and origin of the atmospheric aerosol in the Norwegian arctic, Atmos. Environ., 23, 2551–2569, https://doi.org/10.1016/0004-6981(89)90266-7, 1989.
Maletto, A., McKendry, I. G., and Strawbridge, K. B.: Profiles of particulate matter size distributions using a balloon-borne lightweight aerosol spectrometer in the planetary boundary layer, Atmos. Environ., 37, 661–670, https://doi.org/10.1016/S1352-2310(02)00860-9, 2003.
Marinou, E., Tesche, M., Nenes, A., Ansmann, A., Schrod, J., Mamali, D., Tsekeri, A., Pikridas, M., Baars, H., Engelmann, R., Voudouri, K.-A., Solomos, S., Sciare, J., Groß, S., Ewald, F., and Amiridis, V.: Retrieval of ice-nucleating particle concentrations from lidar observations and comparison with UAV in situ measurements, Atmos. Chem. Phys., 19, 11315–11342, https://doi.org/10.5194/acp-19-11315-2019, 2019.
Matsui, H., Kondo, Y., Moteki, N., Takegawa, N., Sahu, L. K., Koike, M., Zhao, Y., Fuelberg, H. E., Sessions, W. R., Diskin, G., Anderson, B. E., Blake, D. R., Wisthaler, A., Cubison, M. J., and Jimenez, J. L.: Accumulation-mode aerosol number concentrations in the Arctic during the ARCTAS aircraft campaign: Long-range transport of polluted and clean air from the Asian continent, J. Geophys. Res.-Atmos., 116, D20217, https://doi.org/10.1029/2011JD016189, 2011a.
Matsui, H., Kondo, Y., Moteki, N., Takegawa, N., Sahu, L. K., Zhao, Y., Fuelberg, H. E., Sessions, W. R., Diskin, G., Blake, D. R., Wisthaler, A., and Koike, M.: Seasonal variation of the transport of black carbon aerosol from the Asian continent to the Arctic during the ARCTAS aircraft campaign, J. Geophys. Res.-Atmos., 116, D05202, https://doi.org/10.1029/2010JD015067, 2011b.
Mauritsen, T., Sedlar, J., Tjernström, M., Leck, C., Martin, M., Shupe, M., Sjogren, S., Sierau, B., Persson, P. O. G., Brooks, I. M., and Swietlicki, E.: An Arctic CCN-limited cloud-aerosol regime, Atmos. Chem. Phys., 11, 165–173, https://doi.org/10.5194/acp-11-165-2011, 2011.
May, N. W., Quinn, P. K., McNamara, S. M., and Pratt, K. A.: Multiyear study of the dependence of sea salt aerosol on wind speed and sea ice conditions in the coastal Arctic, J. Geophys. Res.-Atmos., 121, 9208–9219, https://doi.org/10.1002/2016JD025273, 2016.
May, R. M., Arms, S. C., Marsh, P., Bruning, E., Leeman, J. R., Goebbert, K., Thielen, J. E., and Bruick, Z.: MetPy: A Python Package for Meteorological Data, Version 0.12.1.post2, https://doi.org/10.5065/D6WW7G29, 2020.
McFarquhar, G. M., Zhang, G., Poellot, M. R., Kok, G. L., McCoy, R., Tooman, T., Fridlind, A., and Heymsfield, A. J.: Ice properties of single-layer stratocumulus during the Mixed-Phase Arctic Cloud Experiment: 1. Observations, J. Geophys. Res.-Atmos., 112, D24201, https://doi.org/10.1029/2007jd008633, 2007.
McFarquhar, G. M., Ghan, S., Verlinde, J., Korolev, A., Strapp, J. W., Schmid, B., Tomlinson, J. M., Wolde, M., Brooks, S. D., Cziczo, D., Dubey, M. K., Fan, J., Flynn, C., Gultepe, I., Hubbe, J., Gilles, M. K., Laskin, A., Lawson, P., Leaitch, W. R., Liu, P., Liu, X., Lubin, D., Mazzoleni, C., Macdonald, A.-M., Moffet, R. C., Morrison, H., Ovchinnikov, M., Shupe, M. D., Turner, D. D., Xie, S., Zelenyuk, A., Bae, K., Freer, M., and Glen, A.: Indirect and Semi-direct Aerosol Campaign, B. Am. Meteorol. Soc., 92, 183–201, https://doi.org/10.1175/2010bams2935.1, 2011.
McNaughton, C. S., Clarke, A. D., Freitag, S., Kapustin, V. N., Kondo, Y., Moteki, N., Sahu, L., Takegawa, N., Schwarz, J. P., Spackman, J. R., Watts, L., Diskin, G., Podolske, J., Holloway, J. S., Wisthaler, A., Mikoviny, T., de Gouw, J., Warneke, C., Jimenez, J., Cubison, M., Howell, S. G., Middlebrook, A., Bahreini, R., Anderson, B. E., Winstead, E., Thornhill, K. L., Lack, D., Cozic, J., and Brock, C. A.: Absorbing aerosol in the troposphere of the Western Arctic during the 2008 ARCTAS/ARCPAC airborne field campaigns, Atmos. Chem. Phys., 11, 7561–7582, https://doi.org/10.5194/acp-11-7561-2011, 2011.
Mei, F., McMeeking, G., Pekour, M., Gao, R.-S., Kulkarni, G., China, S., Telg, H., Dexheimer, D., Tomlinson, J., and Schmid, B.: Performance Assessment of Portable Optical Particle Spectrometer (POPS), Sensors, 20, 6269, https://doi.org/10.3390/s20216294, 2020.
Mei, L., Xue, Y., de Leeuw, G., von Hoyningen-Huene, W., Kokhanovsky, A. A., Istomina, L., Guang, J., and Burrows, J. P.: Aerosol optical depth retrieval in the Arctic region using MODIS data over snow, Remote Sens. Environ., 128, 234–245, https://doi.org/10.1016/j.rse.2012.10.009, 2013.
Morris, V. R.: Ceilometer Instrument Handbook, U.S. Department of Energy, Office of Science, Office of Biological and Environmental Research, DOE/SC-ARM-TR-020, 2016.
Morrison, H., Pinto, J. O., Curry, J. A., and McFarquhar, G. M.: Sensitivity of modeled arctic mixed-phase stratocumulus to cloud condensation and ice nuclei over regionally varying surface conditions, J. Geophys. Res.-Atmos., 113, D05203, https://doi.org/10.1029/2007jd008729, 2008.
Morrison, H., de Boer, G., Feingold, G., Harrington, J., Shupe, M. D., and Sulia, K.: Resilience of persistent Arctic mixed-phase clouds, Nat. Geosci., 5, 11–17, https://doi.org/10.1038/ngeo1332, 2012.
Norgren, M. S., de Boer, G., and Shupe, M. D.: Observed aerosol suppression of cloud ice in low-level Arctic mixed-phase clouds, Atmos. Chem. Phys., 18, 13345–13361, https://doi.org/10.5194/acp-18-13345-2018, 2018.
Overland, J., Francis, J. A., Hall, R., Hanna, E., Kim, S.-J., and Vihma, T.: The Melting Arctic and Midlatitude Weather Patterns: Are They Connected?, J. Climate, 28, 7917–7932, https://doi.org/10.1175/jcli-d-14-00822.1, 2015.
Overland, J., Dunlea, E., Box, J. E., Corell, R., Forsius, M., Kattsov, V., Olsen, M. S., Pawlak, J., Reiersen, L.-O., and Wang, M.: The urgency of Arctic change, Polar Sci., 21, 6–13, https://doi.org/10.1016/j.polar.2018.11.008, 2018.
Pacyna, J. M., Vitols, V., and Hanssen, J. E.: Size-Differentiated Composition of the Arctic Aerosol at Ny-Alesund, Spitsbergen, Atmos. Environ., 18, 2447–2459, https://doi.org/10.1016/0004-6981(84)90015-5, 1984.
Parungo, F., Nagamoto, C., Herbert, G., Harris, J., Schnell, R., Sheridan, P., and Zhang, N.: Individual particle analyses of arctic aerosol samples collected during AGASP-III, Atmos. Environ. A.-Gen., 27, 2825–2837, https://doi.org/10.1016/0960-1686(93)90314-O, 1993.
Parungo, F. P., Nagamoto, C. T., Sheridan, P. J., and Schnell, R. C.: Aerosol characteristics of Arctic haze sampled during AGASP-II, Atmos. Environ. A-Gen., 24, 937–949, https://doi.org/10.1016/0960-1686(90)90296-Y, 1990.
Persson, P. O. G., Fairall, C. W., Andreas, E. L., Guest, P. S., and Perovich, D. K.: Measurements near the Atmospheric Surface Flux Group tower at SHEBA: Near-surface conditions and surface energy budget, J. Geophys. Res.-Oceans, 107, SHE 21-21–SHE 21-35, https://doi.org/10.1029/2000jc000705, 2002.
Pilewskie, P. and Valero, F. P. J.: Optical depths and haze particle sizes during AGASP III, Atmos. Environ. A-Gen., 27, 2895–2899, https://doi.org/10.1016/0960-1686(93)90320-X, 1993.
Polissar, A. V., Hopke, P. K., and Harris, J. M.: Source regions for atmospheric aerosol measured at Barrow, Alaska, Environ. Sci. Technol., 35, 4214–4226, https://doi.org/10.1021/es0107529, 2001.
Porter, G. C. E., Sikora, S. N. F., Adams, M. P., Proske, U., Harrison, A. D., Tarn, M. D., Brooks, I. M., and Murray, B. J.: Resolving the size of ice-nucleating particles with a balloon deployable aerosol sampler: the SHARK, Atmos. Meas. Tech., 13, 2905–2921, https://doi.org/10.5194/amt-13-2905-2020, 2020.
Quennehen, B., Schwarzenboeck, A., Schmale, J., Schneider, J., Sodemann, H., Stohl, A., Ancellet, G., Crumeyrolle, S., and Law, K. S.: Physical and chemical properties of pollution aerosol particles transported from North America to Greenland as measured during the POLARCAT summer campaign, Atmos. Chem. Phys., 11, 10947–10963, https://doi.org/10.5194/acp-11-10947-2011, 2011.
Quinn, P. K., Bates, T. S., Miller, T. L., Coffman, D. J., Johnson, J. E., Harris, J. M., Ogren, J. A., Forbes, G., Anderson, T. L., Covert, D. S., and Rood, M. J.: Surface submicron aerosol chemical composition: What fraction is not sulfate?, J. Geophys. Res.-Atmos., 105, 6785–6805, https://doi.org/10.1029/1999jd901034, 2000.
Quinn, P. K., Miller, T. L., Bates, T. S., Ogren, J. A., Andrews, E., and Shaw, G. E.: A 3-year record of simultaneously measured aerosol chemical and optical properties at Barrow, Alaska, J. Geophys. Res.-Atmos., 107, 4130, https://doi.org/10.1029/2001jd001248, 2002.
Quinn, P. K., Shaw, G., Andrews, E., Dutton, E. G., Ruoho-Airola, T., and Gong, S. L.: Arctic haze: current trends and knowledge gaps, Tellus B, 59, 99–114, https://doi.org/10.1111/j.1600-0889.2006.00238.x, 2007.
Quinn, P. K., Bates, T. S., Baum, E., Doubleday, N., Fiore, A. M., Flanner, M., Fridlind, A., Garrett, T. J., Koch, D., Menon, S., Shindell, D., Stohl, A., and Warren, S. G.: Short-lived pollutants in the Arctic: their climate impact and possible mitigation strategies, Atmos. Chem. Phys., 8, 1723–1735, https://doi.org/10.5194/acp-8-1723-2008, 2008.
Quinn, P. K., Bates, T. S., Schulz, K., and Shaw, G. E.: Decadal trends in aerosol chemical composition at Barrow, Alaska: 1976–2008, Atmos. Chem. Phys., 9, 8883–8888, https://doi.org/10.5194/acp-9-8883-2009, 2009.
Renard, J.-B., Dulac, F., Berthet, G., Lurton, T., Vignelles, D., Jégou, F., Tonnelier, T., Jeannot, M., Couté, B., Akiki, R., Verdier, N., Mallet, M., Gensdarmes, F., Charpentier, P., Mesmin, S., Duverger, V., Dupont, J.-C., Elias, T., Crenn, V., Sciare, J., Zieger, P., Salter, M., Roberts, T., Giacomoni, J., Gobbi, M., Hamonou, E., Olafsson, H., Dagsson-Waldhauserova, P., Camy-Peyret, C., Mazel, C., Décamps, T., Piringer, M., Surcin, J., and Daugeron, D.: LOAC: a small aerosol optical counter/sizer for ground-based and balloon measurements of the size distribution and nature of atmospheric particles – Part 2: First results from balloon and unmanned aerial vehicle flights, Atmos. Meas. Tech., 9, 3673–3686, https://doi.org/10.5194/amt-9-3673-2016, 2016.
Schmeisser, L., Backman, J., Ogren, J. A., Andrews, E., Asmi, E., Starkweather, S., Uttal, T., Fiebig, M., Sharma, S., Eleftheriadis, K., Vratolis, S., Bergin, M., Tunved, P., and Jefferson, A.: Seasonality of aerosol optical properties in the Arctic, Atmos. Chem. Phys., 18, 11599–11622, https://doi.org/10.5194/acp-18-11599-2018, 2018.
Schnell, R. C.: Arctic haze and the Arctic Gas and Aerosol Sampling Program (AGASP), Geophys. Res. Lett., 11, 361–364, https://doi.org/10.1029/GL011i005p00361, 1984.
Schrod, J., Weber, D., Drücke, J., Keleshis, C., Pikridas, M., Ebert, M., Cvetković, B., Nickovic, S., Marinou, E., Baars, H., Ansmann, A., Vrekoussis, M., Mihalopoulos, N., Sciare, J., Curtius, J., and Bingemer, H. G.: Ice nucleating particles over the Eastern Mediterranean measured by unmanned aircraft systems, Atmos. Chem. Phys., 17, 4817–4835, https://doi.org/10.5194/acp-17-4817-2017, 2017.
Schulz, H., Zanatta, M., Bozem, H., Leaitch, W. R., Herber, A. B., Burkart, J., Willis, M. D., Kunkel, D., Hoor, P. M., Abbatt, J. P. D., and Gerdes, R.: High Arctic aircraft measurements characterising black carbon vertical variability in spring and summer, Atmos. Chem. Phys., 19, 2361–2384, https://doi.org/10.5194/acp-19-2361-2019, 2019.
Sedlar, J., Tjernström, M., Rinke, A., Orr, A., Cassano, J., Fettweis, X., Heinemann, G., Seefeldt, M., Solomon, A., Matthes, H., Phillips, T., and Webster, S.: Confronting Arctic Troposphere, Clouds, and Surface Energy Budget Representations in Regional Climate Models With Observations, J. Geophys. Res.-Atmos., 125, e2019JD031783, https://doi.org/10.1029/2019jd031783, 2020.
Sharma, S., Barrie, L. A., Magnusson, E., Brattström, G., Leaitch, W. R., Steffen, A., and Landsberger, S.: A Factor and Trends Analysis of Multidecadal Lower Tropospheric Observations of Arctic Aerosol Composition, Black Carbon, Ozone, and Mercury at Alert, Canada, J. Geophys. Res.-Atmos., 124, 14133–14161, https://doi.org/10.1029/2019jd030844, 2019.
Shaw, G. E.: The Arctic Haze Phenomenon, B. Am. Meteorol. Soc., 76, 2403–2413, https://doi.org/10.1175/1520-0477(1995)076<2403:tahp>2.0.co;2, 1995.
Shupe, M. D.: Clouds at Arctic Atmospheric Observatories. Part II: Thermodynamic Phase Characteristics, J. Appl. Meteorol. Clim., 50, 645–661, https://doi.org/10.1175/2010jamc2468.1, 2011.
Shupe, M. D., Walden, V. P., Eloranta, E., Uttal, T., Campbell, J. R., Starkweather, S. M., and Shiobara, M.: Clouds at Arctic Atmospheric Observatories. Part I: Occurrence and Macrophysical Properties, J. Appl. Meteorol. Clim., 50, 626–644, https://doi.org/10.1175/2010jamc2467.1, 2011.
Shupe, M. D., Persson, P. O. G., Brooks, I. M., Tjernström, M., Sedlar, J., Mauritsen, T., Sjogren, S., and Leck, C.: Cloud and boundary layer interactions over the Arctic sea ice in late summer, Atmos. Chem. Phys., 13, 9379–9399, https://doi.org/10.5194/acp-13-9379-2013, 2013.
Siebert, H., Stratmann, F., and Wehner, B.: First observations of increased ultrafine particle number concentrations near the inversion of a continental planetary boundary layer and its relation to ground-based measurements, Geophys. Res. Lett., 31, L09102, https://doi.org/10.1029/2003gl019086, 2004.
Solomon, A., Feingold, G., and Shupe, M. D.: The role of ice nuclei recycling in the maintenance of cloud ice in Arctic mixed-phase stratocumulus, Atmos. Chem. Phys., 15, 10631–10643, https://doi.org/10.5194/acp-15-10631-2015, 2015.
Solomon, A., de Boer, G., Creamean, J. M., McComiskey, A., Shupe, M. D., Maahn, M., and Cox, C.: The relative impact of cloud condensation nuclei and ice nucleating particle concentrations on phase partitioning in Arctic mixed-phase stratocumulus clouds, Atmos. Chem. Phys., 18, 17047–17059, https://doi.org/10.5194/acp-18-17047-2018, 2018.
Sotiropoulou, G., Sedlar, J., Tjernström, M., Shupe, M. D., Brooks, I. M., and Persson, P. O. G.: The thermodynamic structure of summer Arctic stratocumulus and the dynamic coupling to the surface, Atmos. Chem. Phys., 14, 12573–12592, https://doi.org/10.5194/acp-14-12573-2014, 2014.
Spanu, A., Dollner, M., Gasteiger, J., Bui, T. P., and Weinzierl, B.: Flow-induced errors in airborne in situ measurements of aerosols and clouds, Atmos. Meas. Tech., 13, 1963–1987, https://doi.org/10.5194/amt-13-1963-2020, 2020.
Stephenson, S. R., Wang, W., Zender, C. S., Wang, H., Davis, S. J., and Rasch, P. J.: Climatic Responses to Future Trans-Arctic Shipping, Geophys. Res. Lett., 45, 9898–9908, https://doi.org/10.1029/2018gl078969, 2018.
Stohl, A.: Characteristics of atmospheric transport into the Arctic troposphere, J. Geophys. Res.-Atmos., 111, D11306, https://doi.org/10.1029/2005JD006888, 2006.
Stone, R. S., Herber, A., Vitale, V., Mazzola, M., Lupi, A., Schnell, R. C., Dutton, E. G., Liu, P. S. K., Li, S. M., Dethloff, K., Lampert, A., Ritter, C., Stock, M., Neuber, R., and Maturilli, M.: A three-dimensional characterization of Arctic aerosols from airborne Sun photometer observations: PAM-ARCMIP, April 2009, J. Geophys. Res.-Atmos., 115, D13203, https://doi.org/10.1029/2009JD013605, 2010.
Suortti, T., Karhu, J., Kivi, R., Kyrö, E., Rosen, J., Kjome, N., Larsen, N., Neuber, R., Khattatov, V., Rudakov, V., Yushkov, V., and Nakane, H.: Evolution of the Arctic stratospheric aerosol mixing ratio measured with balloon-borne aerosol backscatter sondes for years 1988–2000, J. Geophys. Res.-Atmos., 106, 20759–20766, https://doi.org/10.1029/2000jd000180, 2001.
Taylor, P. C., Boeke, R. C., Li, Y., and Thompson, D. W. J.: Arctic cloud annual cycle biases in climate models, Atmos. Chem. Phys., 19, 8759–8782, https://doi.org/10.5194/acp-19-8759-2019, 2019.
Techy, L., Schmale III, D. G., and Woolsey, C. A.: Coordinated aerobiological sampling of a plant pathogen in the lower atmosphere using two autonomous unmanned aerial vehicles, J. Field Robot., 27, 335–343, https://doi.org/10.1002/rob.20335, 2010.
Telg, H., Murphy, D. M., Bates, T. S., Johnson, J. E., Quinn, P. K., Giardi, F., and Gao, R.-S.: A practical set of miniaturized instruments for vertical profiling of aerosol physical properties, Aerosol Sci. Tech., 51, 715–723, https://doi.org/10.1080/02786826.2017.1296103, 2017.
Thomas, J. L., Raut, J.-C., Law, K. S., Marelle, L., Ancellet, G., Ravetta, F., Fast, J. D., Pfister, G., Emmons, L. K., Diskin, G. S., Weinheimer, A., Roiger, A., and Schlager, H.: Pollution transport from North America to Greenland during summer 2008, Atmos. Chem. Phys., 13, 3825–3848, https://doi.org/10.5194/acp-13-3825-2013, 2013.
Thorsen, T. J. and Fu, Q.: CALIPSO-inferred aerosol direct radiative effects: Bias estimates using ground-based Raman lidars, J. Geophys. Res.-Atmos., 120, 12209–212220, https://doi.org/10.1002/2015jd024095, 2015.
Tobo, Y., Iwasaka, Y., Shi, G. Y., Kim, Y. S., Ohashi, T., Tamura, K., and Zhang, D. Z.: Balloon-borne observations of high aerosol concentrations near the summertime tropopause over the Tibetan Plateau, Atmos. Res., 84, 233–241, https://doi.org/10.1016/j.atmosres.2006.08.003, 2007.
Udisti, R., Bazzano, A., Becagli, S., Bolzacchini, E., Caiazzo, L., Cappelletti, D., Ferrero, L., Frosini, D., Giardi, F., Grotti, M., Lupi, A., Malandrino, M., Mazzola, M., Moroni, B., Severi, M., Traversi, R., Viola, A., and Vitale, V.: Sulfate source apportionment in the Ny-Ålesund (Svalbard Islands) Arctic aerosol, Rend. Lincei, 27, 85–94, https://doi.org/10.1007/s12210-016-0517-7, 2016.
Uin, J.: Ultra-High-Sensitivity Aerosol Spectrometer Instrument Handbook, U.S. Department of Energy, Office of Science, Office of Biological and Environmental Research, DOE/SC-ARM-TR-163, 2016.
Uttal, T., Starkweather, S., Drummond, J. R., Vihma, T., Makshtas, A. P., Darby, L. S., Burkhart, J. F., Cox, C. J., Schmeisser, L. N., Haiden, T., Maturilli, M., Shupe, M. D., Boer, G. D., Saha, A., Grachev, A. A., Crepinsek, S. M., Bruhwiler, L., Goodison, B., McArthur, B., Walden, V. P., Dlugokencky, E. J., Persson, P. O. G., Lesins, G., Laurila, T., Ogren, J. A., Stone, R., Long, C. N., Sharma, S., Massling, A., Turner, D. D., Stanitski, D. M., Asmi, E., Aurela, M., Skov, H., Eleftheriadis, K., Virkkula, A., Platt, A., Førland, E. J., Iijima, Y., Nielsen, I. E., Bergin, M. H., Candlish, L., Zimov, N. S., Zimov, S. A., O'Neill, N. T., Fogal, P. F., Kivi, R., Konopleva-Akish, E. A., Verlinde, J., Kustov, V. Y., Vasel, B., Ivakhov, V. M., Viisanen, Y., and Intrieri, J. M.: International Arctic Systems for Observing the Atmosphere: An International Polar Year Legacy Consortium, 97, 1033-1056, https://doi.org/10.1175/bams-d-14-00145.1, 2016.
Vüllers, J., Achtert, P., Brooks, I. M., Tjernström, M., Prytherch, J., Burzik, A., and Neely III, R.: Meteorological and cloud conditions during the Arctic Ocean 2018 expedition, Atmos. Chem. Phys., 21, 289–314, https://doi.org/10.5194/acp-21-289-2021, 2021.
Wang, Q., Jacob, D. J., Fisher, J. A., Mao, J., Leibensperger, E. M., Carouge, C. C., Le Sager, P., Kondo, Y., Jimenez, J. L., Cubison, M. J., and Doherty, S. J.: Sources of carbonaceous aerosols and deposited black carbon in the Arctic in winter-spring: implications for radiative forcing, Atmos. Chem. Phys., 11, 12453–12473, https://doi.org/10.5194/acp-11-12453-2011, 2011.
Wehner, B., Siebert, H., Stratmann, F., Tuch, T., Wiedensohler, A., Petaja, T., Dal Maso, M., and Kulmala, M.: Horizontal homogeneity and vertical extent of new particle formation events, Tellus B, 59, 362–371, https://doi.org/10.1111/j.1600-0889.2007.00260.x, 2007.
Wei, L., Qin, T., and Li, C.: Seasonal and inter-annual variations of Arctic cyclones and their linkage with Arctic sea ice and atmospheric teleconnections, Acta Oceanol. Sin., 36, 1–7, https://doi.org/10.1007/s13131-017-1117-9, 2017.
Welton, E. J. and Campbell, J. R.: Micropulse Lidar Signals: Uncertainty Analysis, J. Atmos. Ocean. Tech., 19, 2089–2094, https://doi.org/10.1175/1520-0426(2002)019<2089:Mlsua>2.0.Co;2, 2002.
Wendisch, M., Macke, A., Ehrlich, A., Lüpkes, C., Mech, M., Chechin, D., Dethloff, K., Velasco, C. B., Bozem, H., Brückner, M., Clemen, H.-C., Crewell, S., Donth, T., Dupuy, R., Ebell, K., Egerer, U., Engelmann, R., Engler, C., Eppers, O., Gehrmann, M., Gong, X., Gottschalk, M., Gourbeyre, C., Griesche, H., Hartmann, J., Hartmann, M., Heinold, B., Herber, A., Herrmann, H., Heygster, G., Hoor, P., Jafariserajehlou, S., Jäkel, E., Järvinen, E., Jourdan, O., Kästner, U., Kecorius, S., Knudsen, E. M., Köllner, F., Kretzschmar, J., Lelli, L., Leroy, D., Maturilli, M., Mei, L., Mertes, S., Mioche, G., Neuber, R., Nicolaus, M., Nomokonova, T., Notholt, J., Palm, M., Pinxteren, M. v., Quaas, J., Richter, P., Ruiz-Donoso, E., Schäfer, M., Schmieder, K., Schnaiter, M., Schneider, J., Schwarzenböck, A., Seifert, P., Shupe, M. D., Siebert, H., Spreen, G., Stapf, J., Stratmann, F., Vogl, T., Welti, A., Wex, H., Wiedensohler, A., Zanatta, M., and Zeppenfeld, S.: The Arctic Cloud Puzzle: Using ACLOUD/PASCAL Multiplatform Observations to Unravel the Role of Clouds and Aerosol Particles in Arctic Amplification, B. Am. Meteorol. Soc., 100, 841–871, https://doi.org/10.1175/bams-d-18-0072.1, 2019.
Widener, K., Bharadwaj, N., and Johnson, K.: Ka-Band ARM Zenith Radar (KAZR) Handbook, U.S. Department of Energy, Office of Science, Office of Biological and Environmental Research, DOE/SC-ARM/TR-106, 2012.
Willis, M. D., Leaitch, W. R., and Abbatt, J. P. D.: Processes Controlling the Composition and Abundance of Arctic Aerosol, Rev. Geophys., 56, 621–671, https://doi.org/10.1029/2018rg000602, 2018
Willis, M. D., Bozem, H., Kunkel, D., Lee, A. K. Y., Schulz, H., Burkart, J., Aliabadi, A. A., Herber, A. B., Leaitch, W. R., and Abbatt, J. P. D.: Aircraft-based measurements of High Arctic springtime aerosol show evidence for vertically varying sources, transport and composition, Atmos. Chem. Phys., 19, 57–76, https://doi.org/10.5194/acp-19-57-2019, 2019.
Winiger, P., Barrett, T. E., Sheesley, R. J., Huang, L., Sharma, S., Barrie, L. A., Yttri, K. E., Evangeliou, N., Eckhardt, S., Stohl, A., Klimont, Z., Heyes, C., Semiletov, I. P., Dudarev, O. V., Charkin, A., Shakhova, N., Holmstrand, H., Andersson, A., and Gustafsson, Ö.: Source apportionment of circum-Arctic atmospheric black carbon from isotopes and modeling, J. Sci. Adv., 5, eaau8052, https://doi.org/10.1126/sciadv.aau8052, 2019.
Young, G., Jones, H. M., Choularton, T. W., Crosier, J., Bower, K. N., Gallagher, M. W., Davies, R. S., Renfrew, I. A., Elvidge, A. D., Darbyshire, E., Marenco, F., Brown, P. R. A., Ricketts, H. M. A., Connolly, P. J., Lloyd, G., Williams, P. I., Allan, J. D., Taylor, J. W., Liu, D., and Flynn, M. J.: Observed microphysical changes in Arctic mixed-phase clouds when transitioning from sea ice to open ocean, Atmos. Chem. Phys., 16, 13945–13967, https://doi.org/10.5194/acp-16-13945-2016, 2016a.
Young, G., Jones, H. M., Darbyshire, E., Baustian, K. J., McQuaid, J. B., Bower, K. N., Connolly, P. J., Gallagher, M. W., and Choularton, T. W.: Size-segregated compositional analysis of aerosol particles collected in the European Arctic during the ACCACIA campaign, Atmos. Chem. Phys., 16, 4063–4079, https://doi.org/10.5194/acp-16-4063-2016, 2016b.
Young, G., Connolly, P. J., Jones, H. M., and Choularton, T. W.: Microphysical sensitivity of coupled springtime Arctic stratocumulus to modelled primary ice over the ice pack, marginal ice, and ocean, Atmos. Chem. Phys., 17, 4209–4227, https://doi.org/10.5194/acp-17-4209-2017, 2017.
Yum, S. S., and Hudson, J. G.: Vertical distributions of cloud condensation nuclei spectra over the springtime Arctic Ocean, J. Geophys. Res.-Atmos., 106, 15045–15052, https://doi.org/10.1029/2000JD900357, 2001.
Zamora, L. M., Kahn, R. A., Cubison, M. J., Diskin, G. S., Jimenez, J. L., Kondo, Y., McFarquhar, G. M., Nenes, A., Thornhill, K. L., Wisthaler, A., Zelenyuk, A., and Ziemba, L. D.: Aircraft-measured indirect cloud effects from biomass burning smoke in the Arctic and subarctic, Atmos. Chem. Phys., 16, 715–738, https://doi.org/10.5194/acp-16-715-2016, 2016.
Zelinka, M. D., Myers, T. A., McCoy, D. T., Po-Chedley, S., Caldwell, P. M., Ceppi, P., Klein, S. A., and Taylor, K. E.: Causes of Higher Climate Sensitivity in CMIP6 Models, Geophys. Res. Lett., 47, e2019GL085782, https://doi.org/10.1029/2019GL085782, 2020.