the Creative Commons Attribution 4.0 License.
the Creative Commons Attribution 4.0 License.
 | 25 Nov 2021
Seasonality of the particle number concentration and size distribution: a global analysis retrieved from the network of Global Atmosphere Watch (GAW) near-surface observatories
Martine Collaud Coen
Elisabeth Andrews
Isaline Bossert
Cathrine Lund Myhre
Thomas Tuch
Alfred Wiedensohler
Markus Fiebig
Pasi Aalto
Andrés Alastuey
Elisabeth Alonso-Blanco
Marcos Andrade
Begoña Artíñano
Todor Arsov
Urs Baltensperger
Susanne Bastian
Olaf Bath
Johan Paul Beukes
Benjamin T. Brem
Nicolas Bukowiecki
Juan Andrés Casquero-Vera
Sébastien Conil
Konstantinos Eleftheriadis
Olivier Favez
Harald Flentje
Maria I. Gini
Francisco Javier Gómez-Moreno
Martin Gysel-Beer
Anna Gannet Hallar
Ivo Kalapov
Nikos Kalivitis
Anne Kasper-Giebl
Melita Keywood
Jeong Eun Kim
Sang-Woo Kim
Adam Kristensson
Markku Kulmala
Heikki Lihavainen
Neng-Huei Lin
Hassan Lyamani
Angela Marinoni
Sebastiao Martins Dos Santos
Olga L. Mayol-Bracero
Frank Meinhardt
Maik Merkel
Jean-Marc Metzger
Nikolaos Mihalopoulos
Jakub Ondracek
Marco Pandolfi
Noemi Pérez
Tuukka Petäjä
Jean-Eudes Petit
David Picard
Jean-Marc Pichon
Veronique Pont
Jean-Philippe Putaud
Fabienne Reisen
Karine Sellegri
Sangeeta Sharma
Gerhard Schauer
Patrick Sheridan
James Patrick Sherman
Andreas Schwerin
Ralf Sohmer
Mar Sorribas
Junying Sun
Pierre Tulet
Ville Vakkari
Pieter Gideon van Zyl
Fernando Velarde
Paolo Villani
Stergios Vratolis
Zdenek Wagner
Sheng-Hsiang Wang
Kay Weinhold
Rolf Weller
Margarita Yela
Vladimir Zdimal
Paolo Laj
Aerosol particles are a complex component of the atmospheric system which influence climate directly by interacting with solar radiation, and indirectly by contributing to cloud formation. The variety of their sources, as well as the multiple transformations they may undergo during their transport (including wet and dry deposition), result in significant spatial and temporal variability of their properties. Documenting this variability is essential to provide a proper representation of aerosols and cloud condensation nuclei (CCN) in climate models. Using measurements conducted in 2016 or 2017 at 62 ground-based stations around the world, this study provides the most up-to-date picture of the spatial distribution of particle number concentration (Ntot) and number size distribution (PNSD, from 39 sites). A sensitivity study was first performed to assess the impact of data availability on Ntot's annual and seasonal statistics, as well as on the analysis of its diel cycle. Thresholds of 50 % and 60 % were set at the seasonal and annual scale, respectively, for the study of the corresponding statistics, and a slightly higher coverage (75 %) was required to document the diel cycle.
Although some observations are common to a majority of sites, the variety of environments characterizing these stations made it possible to highlight contrasting findings, which, among other factors, seem to be significantly related to the level of anthropogenic influence. The concentrations measured at polar sites are the lowest (∼ 102 cm−3) and show a clear seasonality, which is also visible in the shape of the PNSD, while diel cycles are in general less evident, due notably to the absence of a regular day–night cycle in some seasons. In contrast, the concentrations characteristic of urban environments are the highest (∼ 103–104 cm−3) and do not show pronounced seasonal variations, whereas diel cycles tend to be very regular over the year at these stations. The remaining sites, including mountain and non-urban continental and coastal stations, do not exhibit as obvious common behaviour as polar and urban sites and display, on average, intermediate Ntot (∼ 102–103 cm−3). Particle concentrations measured at mountain sites, however, are generally lower compared to nearby lowland sites, and tend to exhibit somewhat more pronounced seasonal variations as a likely result of the strong impact of the atmospheric boundary layer (ABL) influence in connection with the topography of the sites. ABL dynamics also likely contribute to the diel cycle of Ntot observed at these stations. Based on available PNSD measurements, CCN-sized particles (considered here as either >50 nm or >100 nm) can represent from a few percent to almost all of Ntot, corresponding to seasonal medians on the order of ∼ 10 to 1000 cm−3, with seasonal patterns and a hierarchy of the site types broadly similar to those observed for Ntot.
Overall, this work illustrates the importance of in situ measurements, in particular for the study of aerosol physical properties, and thus strongly supports the development of a broad global network of near surface observatories to increase and homogenize the spatial coverage of the measurements, and guarantee as well data availability and quality. The results of this study also provide a valuable, freely available and easy to use support for model comparison and validation, with the ultimate goal of contributing to improvement of the representation of aerosol–cloud interactions in models, and, therefore, of the evaluation of the impact of aerosol particles on climate.
- Article
(2695 KB) - Full-text XML
-
Supplement
(1416 KB) - BibTeX
- EndNote


Atmospheric aerosol particles are an essential component of the climate system. They affect the Earth's radiation balance directly by interacting with solar radiation, and indirectly by contributing to cloud formation. These effects, and in particular the latter, are widely recognized as one of the largest sources of uncertainty in climate change projections (IPCC, 2013), further reflecting the difficulty of obtaining an accurate representation of aerosols and cloud condensation nuclei (CCN, i.e. one of the critical elements in the evaluation of cloud aerosol interactions) in climate models. In addition to the large diversity of their sources (primary or secondary, natural or anthropogenic), particles undergo transformations that lead to changes in their properties during transport. Also, in contrast with greenhouse gases, they have a short lifetime, which results in a highly heterogeneous distribution in space and time. Providing reliable observations of aerosol properties at appropriate spatial and temporal scales is therefore essential, and requires combined approaches adapted to the diversity of these scales and the information they can provide for climate studies. Satellite observations can document extensive aerosol properties with significant geographic coverage, but they have only limited temporal resolution and are only partially adapted to the study of some aerosol properties such as the size distribution. Also, due to atmospheric boundary layer (ABL) structure segregation of vertical air masses and evolution of such structures on a daily basis (e.g. Gierens et al., 2019), it is currently very difficult to attribute aerosol properties measured with satellite observations to defined depths in the ABL. In contrast, in situ measurements performed at ground-level stations are often representative of limited geographical areas and do not allow assessment of vertical variability, but they do allow a more detailed characterization of the aerosol, at a fine temporal resolution.
The Geophysical Monitoring for Climate Change (GMCC) programme, established by NOAA in the early 1970's, was the first network dedicated to long-term measurements of climate-relevant aerosol properties. The particle number concentration, considered to be a primary indicator of human impact on atmospheric composition, was the first aerosol property measured at the GMCC stations (e.g. Bodhaine, 1983). Since then, the number of measured properties has increased and measurement of the particle number size distribution (PNSD) is now quite common. In comparison to the total number concentration alone, the knowledge of the PNSD offers additional information on particle formation processes, transport and type, and, more broadly, on their potential climatic impact. As summarized by Asmi et al. (2013), the effect particles may have on climate is indeed not necessarily proportional to their total number concentration. This effect is, in fact, highly variable across the particle size spectrum, as both the potential of aerosol particles to act as CCN and their ability to efficiently scatter or absorb light depends not only on their chemical composition but on their size as well. Among other examples, the importance of measuring the PNSD over long enough time periods in contrasting environments is also illustrated in the more recent study by Schmale et al. (2018) for the understanding of aerosol–cloud interactions and, ultimately, the improvement of their representation in models. Finally, as a clear sign of its value, the PNSD was recently proposed as an aerosol essential climate variable (ECV) for climate monitoring in the Global Climate Observing System (GCOS, https://gcos.wmo.int/en/networks, last access: 17 November 2021). In addition, while these aspects are beyond the scope of the present study, the knowledge of the particle size is also essential to assess the effects aerosols may have on human health, as the size constrains the ability of the particles to enter the respiratory system. The health effect of ultrafine particles (<100 nm) is for instance discussed and compared to that of fine (<2.5 µm) and larger (<10 µm) particles in the recent review by Schraufnagel (2020).
In order to meet the need to document as broad a variety of conditions as possible, the number of stations for systematic monitoring of aerosols has also increased over the past 50 years. Although some sites remain independent, at present measurements are mainly organized within networks that ensure the homogeneity of protocols used for data acquisition, quality control and provision and also promote the continuity of the measurements. The GAW (Global Atmosphere Watch) aerosol network, initiated in 1997 under the leadership of the GAW Scientific Advisory Group (SAG) for aerosols, brings together a significant number of sites, which at the same time belong to regional networks such as ACTRIS (Aerosols, Clouds and Trace gases Research Infrastructure, https://www.actris.eu/, last access: 17 November 2021) or the NOAA Federated Aerosol Network (NOAA-FAN) (Andrews et al., 2019). Although there is still a bias in the world data coverage, the growing number of sites has made it possible to study the spatial variability of aerosol properties and/or their long-term evolution at regional and even global scale.
Taking advantage of the existing monitoring networks (and/or research projects), seven companion studies dedicated to aerosol phenomenology have been conducted in Europe since 2004 (Van Dingenen et al., 2004; Putaud et al., 2004, 2010; Cavalli et al., 2016; Zanatta et al., 2016; Pandolfi et al., 2018; Bressi et al., 2021). Up to 60 sites have contributed to this project involving observations of physical, optical and chemical aerosol properties. Moreover, Asmi et al. (2011) reported on the variability of the PNSD, also in Europe, based on measurements collected at 24 sites; shortly after, the first multi-site long-term trend analyses of aerosol optical properties (Collaud Coen et al., 2013) as well as number concentration and PNSD (Asmi et al., 2013) were performed using measurements conducted at stations located in Europe, North America, Antarctica and on Pacific Ocean islands. The characteristics of specific processes such as new particle formation (NPF), which is thought to be responsible for a major fraction of the particle number at the global scale (Spracklen et al., 2006, 2008; Merikanto et al., 2009; Gordon et al., 2017), could also be investigated and compared in various environments (Kerminen et al., 2018; Nieminen et al., 2018). Analyses dedicated to specific environments were also carried out. As an example, Sellegri et al. (2019), Andrews et al. (2011) and Collaud Coen et al. (2018) all concentrated on measurements performed at mountain sites, and focussed on NPF, on aerosol optical properties and on the influence of the ABL, respectively. The monitoring of an increasing number of variables finally made it possible to explore the link between the different properties of the particles and to carry out closure studies at the above-mentioned network sites, such as that performed by Schmale et al. (2017, 2018) using long-term measurements of CCN number concentrations, particle number size distributions and chemical composition from 12 ACTRIS sites.
The present work is part of the SARGAN (in-Situ AeRosol GAW observing Network) initiative, which has been introduced in Laj et al. (2020) and aims at supporting a global aerosol monitoring network to become a GCOS associated network. The most complete and up-to-date analysis of the trends and variability of aerosol optical properties measured worldwide was recently reported within the framework of this project (Collaud Coen et al., 2020). Two other studies involving observations and outputs from the AeroCom models (Aerosol Comparisons between Observations and Models, https://aerocom.met.no/, last access: 17 November 2021) were also carried out: Gliß et al. (2021) assessed the ability of global models to reproduce present-day aerosol optical properties and Mortier et al. (2020) performed a multi-parameter analysis of the trends of optical, chemical-composition and mass aerosol properties over the last 2 decades.
A preliminary view of the variability of the particle number concentration was reported in Laj et al. (2020), using measurements performed at 57 sites in 2016 or 2017. This study was however limited to basic statistics and also did not include any description of the PNSD. The present work aims to complement the analysis initiated in Laj et al. (2020) in order to (1) provide the most up-to-date information on the spatial and temporal variability of the particle number concentration worldwide and discuss what determines this variability, and (2) extend the analysis to the PNSD. This new study, based on observations collected at 62 sites around the world in 2016 or 2017, also complements the previous work of Asmi et al. (2011), which focused on measurements collected in 2008–2009 in Europe only. Although the findings of the two studies are naturally compared in this paper, there is, however, no detailed analysis of the changes or differences observed for the sites they have in common, since both studies are based on limited measurement periods (1–2 years) which do not allow the evaluation of possible trends; these aspects will be addressed in a separate paper. The first part of the present paper is dedicated to a sensitivity study aimed at assessing the impact of data availability on the total particle number concentration annual and seasonal statistics, as well as on the analysis of its diel cycle (Sect. 4). The seasonality of the particle number concentration and PNSD are then investigated (Sect. 5). Finally, two shorter sections are dedicated to the analysis of the diel cycle of the total particle number concentration (Sect. 6), and to the study of the CCN-sized fraction of the aerosol spectrum (Sect. 7).
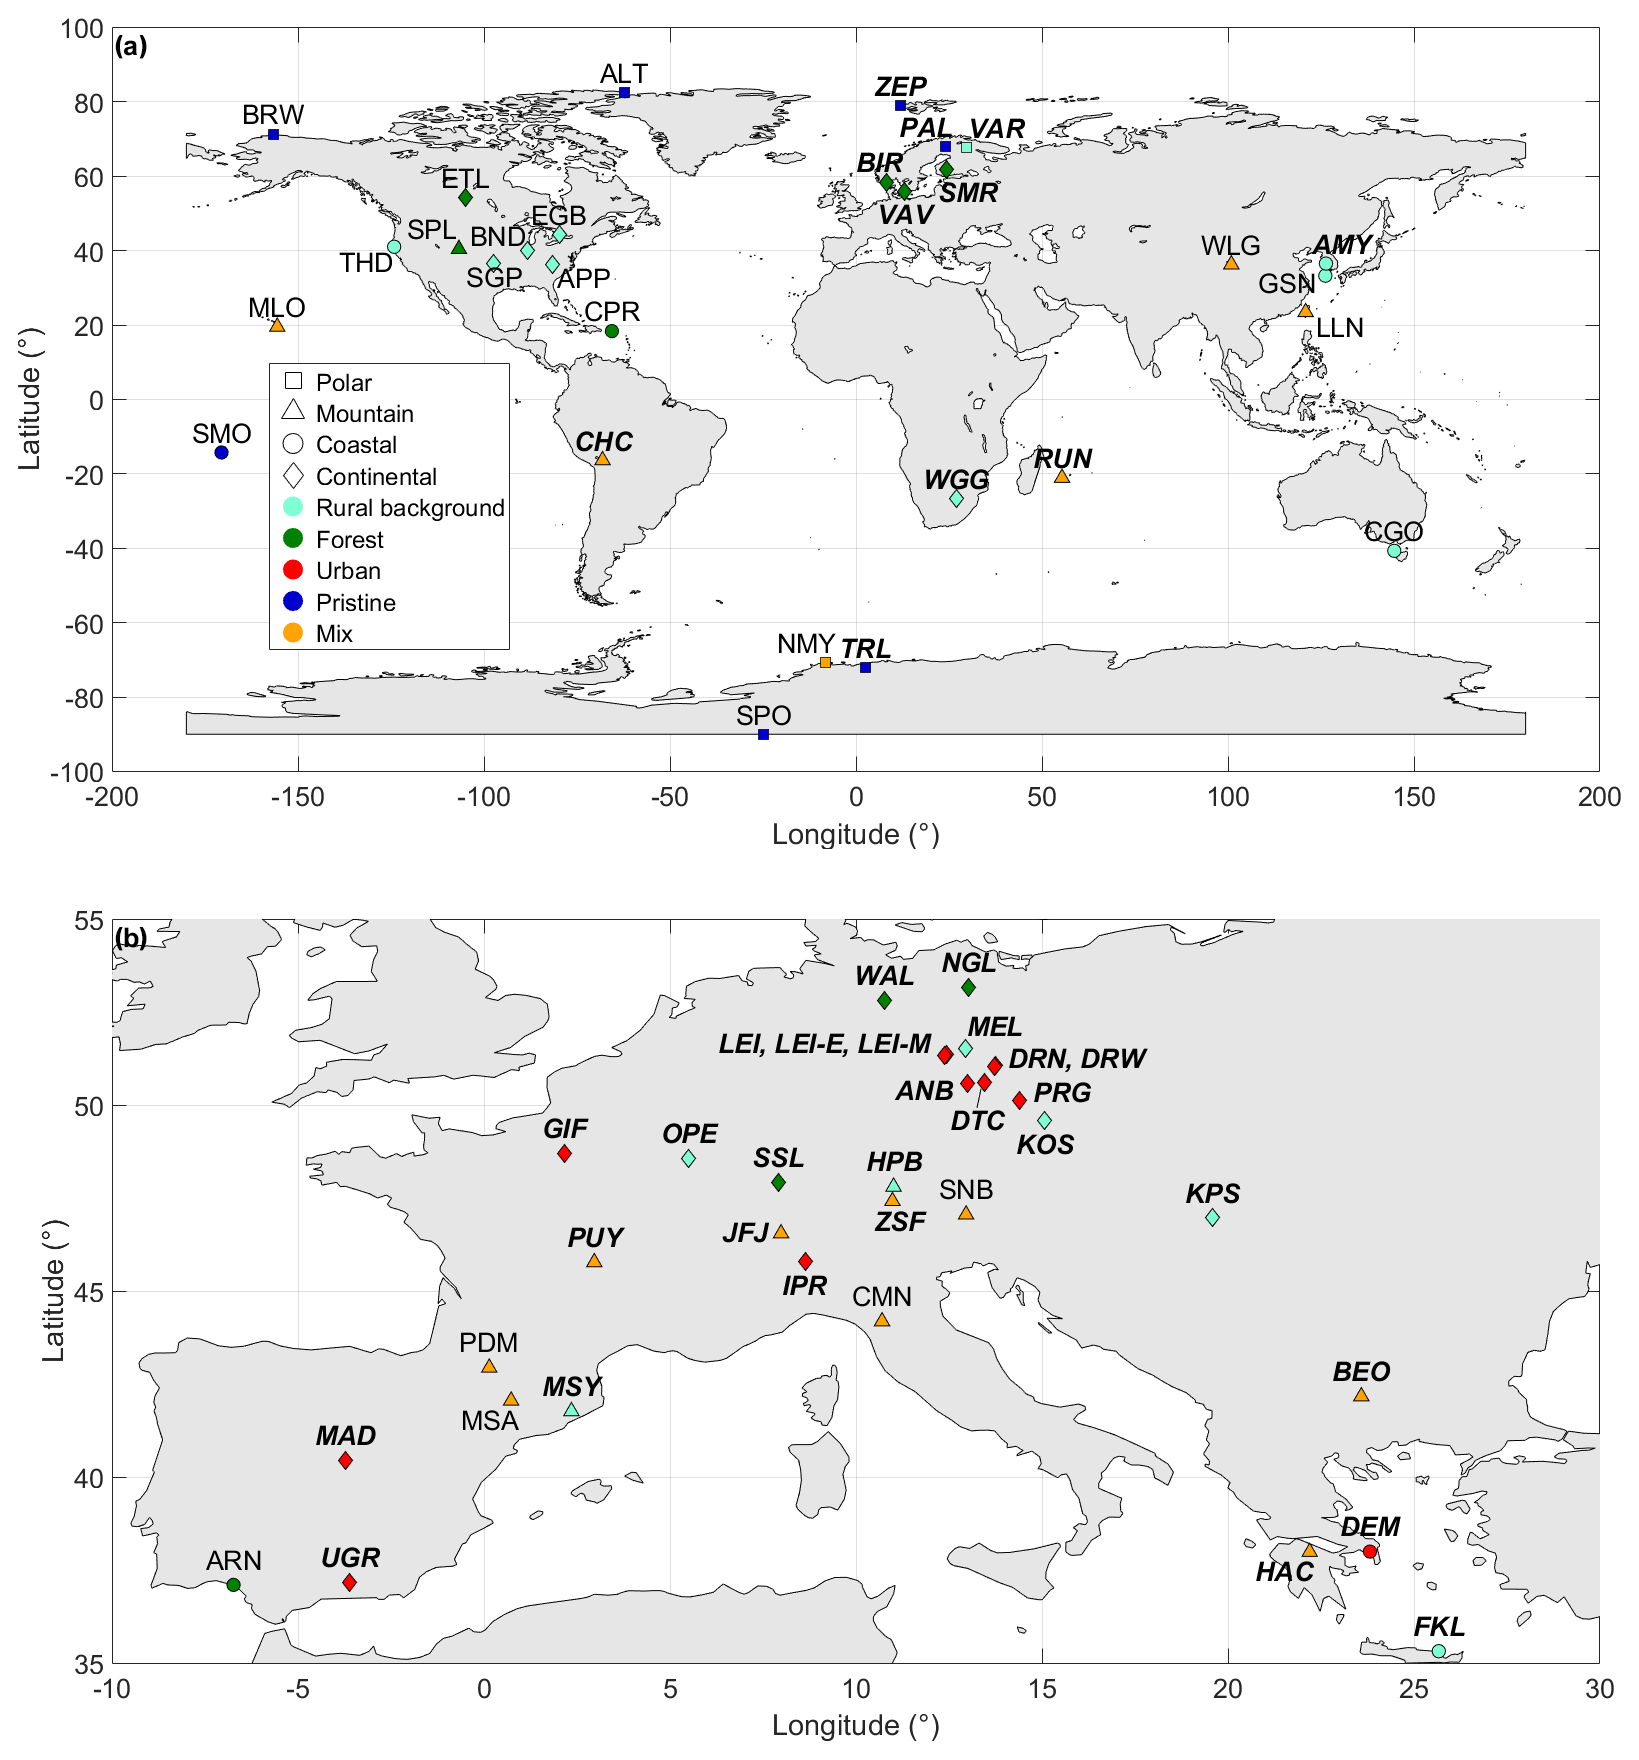
Figure 1Geographical distribution of the stations with their abbreviations (see Table 1) (a) at the global scale and (b) specifically over central and southern Europe. The shapes and colours of the markers indicate geographical and footprint categories, respectively. The sites operating a mobility particle size spectrometer (MPSS) are additionally marked in italic bold.
Data collected at 62 sites contributing to SARGAN in 2017 or 2016, i.e. the reference years as chosen in Laj et al. (2020) (see more details about data availability and coverage criteria in Sect. 4), were included in the present work, among which 57 were already involved in the short analysis of the total number concentration reported in that study. As indicated in Table 1 and further illustrated in Fig. 1, the majority of these sites are located in the Northern Hemisphere, with, in particular, 39 stations in Europe and 10 in North America, among which 5 are located above the polar circle. Polar regions are fairly well represented in the Southern Hemisphere as well, with 3 sites in Antarctica, but other parts of the world tend to be underrepresented, with only 2 sites in Africa, 4 in Asia, 1 in South America and 3 in the south-west Pacific. In spite of this inhomogeneous distribution, a multitude of conditions are however represented in the combined dataset. The stations are classified based on the combination of a geographical (continental, coastal, mountain, or polar) and footprint (rural background, forest, urban, pristine or mixed) criteria as introduced in Laj et al. (2020). Note that the classification of mountain sites does not solely rely on elevation but also requires that the station is located higher than the neighbouring environment. Regarding the “pristine” class, it includes stations that sample background air in comparison to more anthropogenically influenced locations, but this classification does not imply, however, that these sites are completely free of anthropogenic interference. In particular, while the Arctic is a pristine region from an aerosol source perspective, anthropogenic influence through long-range transport can be substantial (particularly during winter and spring when the polar vortex extends and includes more polluted area; e.g. Abbatt et al., 2019, and references therein). As shown in Fig. 1, the spatial distribution of the sites in relation to their classification again reveals certain limitations. For instance, all urban stations are located in Europe, and there is a clear lack of data from desert areas. A final bias concerns the type of data collected at these sites. Specifically, the stations equipped with mobility particle size spectrometers (MPSSs) for the monitoring of the PNSD are mainly located in Europe (34 out of 39 sites), while other sites operate condensation particle counters (CPCs), which retrieve measurements of the total particle number concentration only.
As previously implied, most of the stations listed in Table 1 are regional or global GAW sites (https://gawsis.meteoswiss.ch, last access: 17 November 2021), and belong to regional (mainly ACTRIS and NOAA-FAN) and/or national networks, such as the German Ultrafine Aerosol Network (GUAN; Birmili et al., 2009), or the Spanish Network of Environmental Differential Mobility Analysers (REDMAAS; Gómez-Moreno et al., 2015; Alonso-Blanco et al., 2018). With the exception of WGG and WLG, hourly means of the particle number concentration and/or PNSD are available for all these sites on the database EBAS (http://ebas.nilu.no, last access: 17 November 2021), which is managed by the Norwegian Institute for Air Research (NILU) and which hosts the World Data Center for Aerosol (WDCA, http://www.gaw-wdca.org, last access: 17 November 2021) data repository. The inversion of MPSS data was performed by the institutes operating the instruments before submission to the database, and, for both CPC and MPSS, particle number concentrations were reported in particles per cubic centimetre at standard temperature and pressure (STP, T= 273.15 K and P= 101 325 Pa), following the recommendations from Wiedensohler et al. (2012). As reported in Laj et al. (2020), the diameters associated with MPSS data correspond to the geometric mean mobility diameter of the size intervals used in the inversion. MPSS measurements are usually representative of dry aerosol properties, as the relative humidity of the sampled air is recommended to be kept below 40 % (Wiedensohler et al., 2012). To ensure the quality of the analysis, only the data marked as valid were used, similar to Asmi et al. (2011). It is important to note, however, that despite the procedures that are being implemented within the research networks with the aim of achieving consistency in data from different sites, different data submitters may flag their data differently both because of their scientific use of the data and the tools at their disposal. For instance, a very strict and automated wind screening criterion is applied at some stations (SPO, BRW, ALT and MLO), with an impact on data coverage, while for other sites such as NMY, data from a given wind sector are flagged but considered valid when there is no further indication for contamination (e.g. from concurrent black carbon measurements). Additional checking of the data was performed in collaboration with each instrument's principal investigator to ensure the homogeneity of the dataset, but we cannot exclude the possibility that specific treatment of the data applied at some sites (but not specified in the metadata available on EBAS) may have not been reported. As part of this quality control process, negative concentrations arising from inversion issues in certain conditions (e.g. presence of particles above the size range covered by the MPSS, such as dust or sea salt; Pfeifer et al., 2014; Wiedensohler et al., 2018) were filtered out.
Table 1List of SARGAN stations included in the present study. The geographical (with the following abbreviations: Mt for mountain, Con for continental and Coast for coastal) and footprint (RB for rural background, F for forest, U for urban, P for pristine and Mix for mixed) categories are indicated for each site, together with the year considered in the analysis (2016 or 2017), the type of instrument operated at the site (CPC or MPSS) and the corresponding cut point or diameter range.
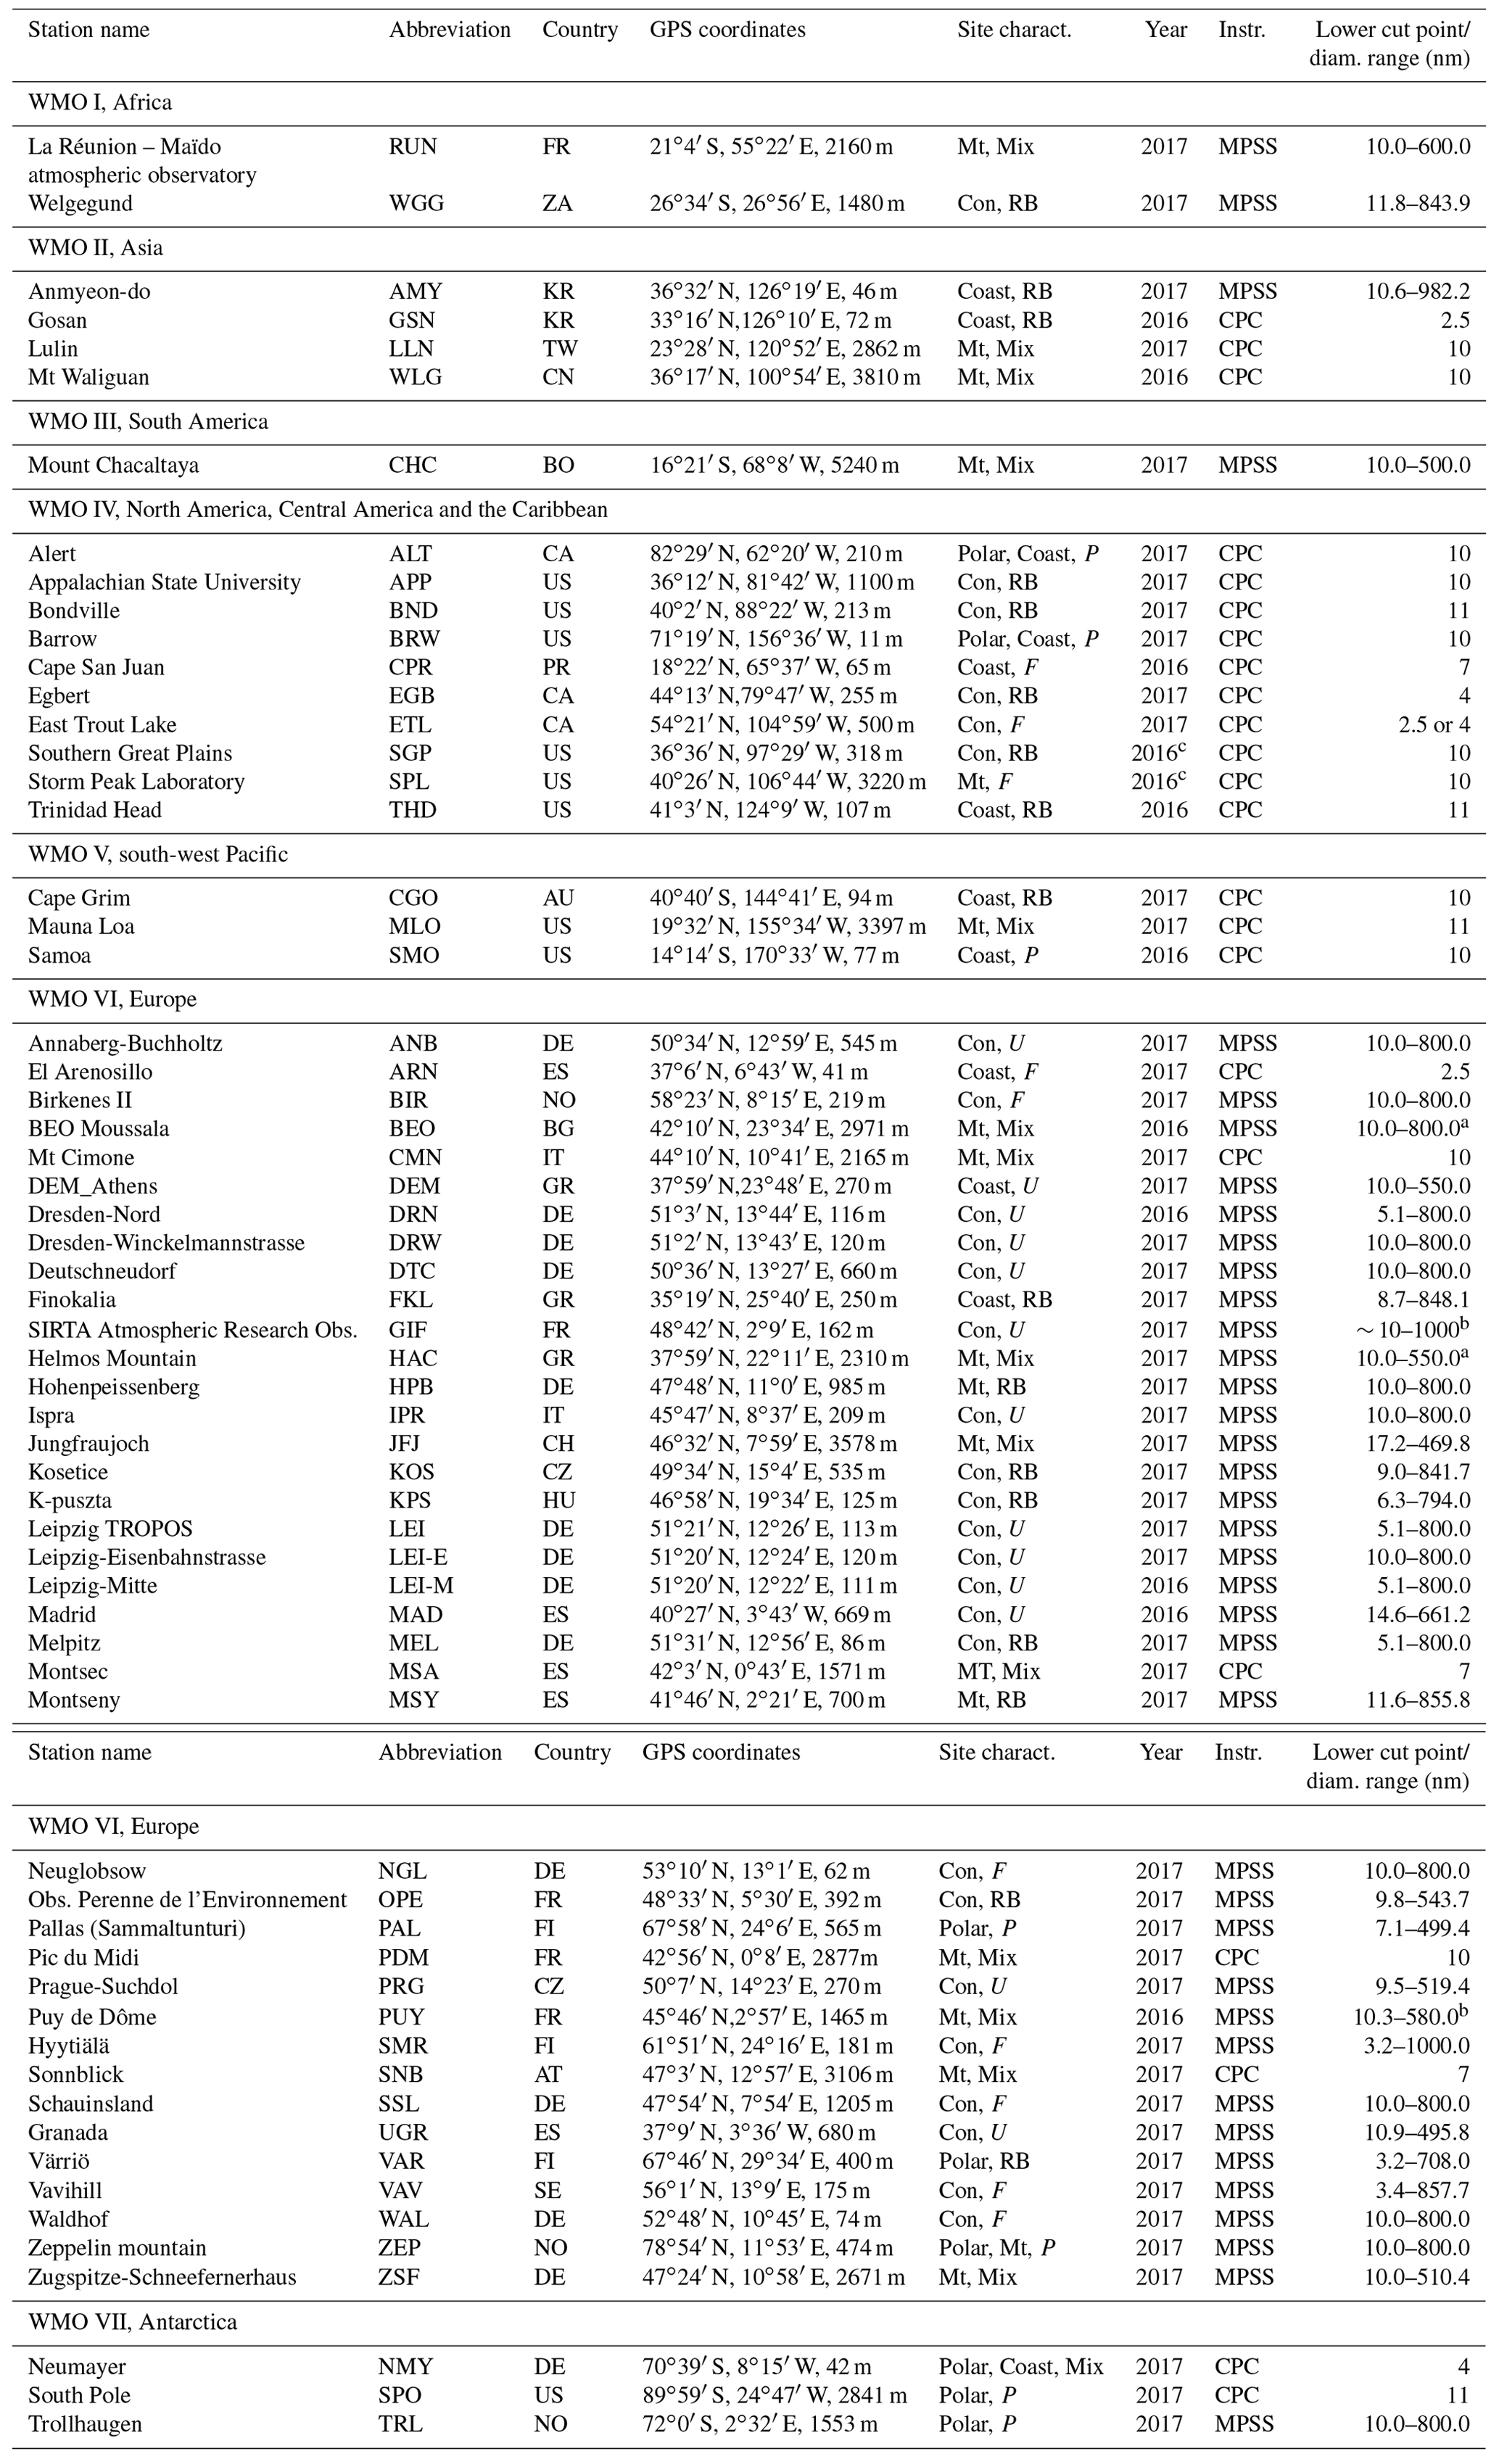
a The first size bin was excluded from the analysis for these sites (frequent negative concentrations). The diameter of the first bin included in the analysis is 11.2 nm for BEO and 11.1 nm for HAC. b The size range indicated in the data file is larger for these sites (7.9–1357.7 and 3.0–995.0 nm for GIF and PUY, respectively), but measurements are actually conducted on the ranges reported in the table. c The data for 2017 were not available at the time of analysis for these stations.
3.1 The total particle number concentration (Ntot)
3.1.1 Definition – sensitivity to instrumental characteristics
While different nomenclatures are commonly used to refer to the particle number concentration (e.g. CN, PNC), the total particle number concentration will be hereafter referred to as Ntot in the present work, for consistency with Laj et al. (2020). Also following the same approach as in Laj et al. (2020), measurements performed with both CPC and MPSS were first analysed together in order to have as large spatial coverage as possible for the study of Ntot. To allow for the comparison of observations derived from both instrument types, the particle number concentration in the range of between 10 and 500 nm was inferred from MPSS measurements as an estimate of Ntot. This size range was selected as it is common to most of the MPSS included in this study, and its lower end is moreover comparable to the lower cut-off diameter of 15 of the 23 CPC involved in the comparison (10 or 11 nm) (Table 1). One should however keep in mind that some of the remaining CPC have significantly lower cut points (e.g. 2.5 nm at ARN, ETL and GSN), and that some MPSS in contrast only detect particles slightly larger than 10 nm (e.g. up to ∼ 17 nm at JFJ), as such cut point differences are likely to influence Ntot. These aspects are discussed in more detail in the Supplement.
The relevance of this approach was further assessed by the comparison of Ntot derived from collocated CPC and MPSS measurements, since, besides the effect of different lower cut points, differences may also arise from the fact that each of these instruments has its own operational characteristics and data treatment procedures. For example, CPC instruments detect particles smaller than their lower cut point because the lower cut point corresponds to the diameter at which 50 % of the particles are detected. This may have a non-negligible effect on Ntot in the presence of a significant amount of small particles, such as during NPF events. On the other hand, there may be an overestimation of the particle concentration in the nucleation mode (and consequently Ntot) by the MPSS if background counts of the CPC in the MPSS are too high, which may become critical during the inversion process. Data from six stations (HPB, MSY, PAL, PUY, SMR and VAR), where both instruments are operated with lower cut-off diameters adapted to the comparison (i.e. ∼ 10 nm for the CPCs and ≤ 10 nm for MPSSs, to allow proper calculation of Ntot), were used to assess such issues. As illustrated in Fig. S2, MPSS tend to retrieve slightly lower Ntot compared to CPC at four sites, while the opposite is seen at the 2 remaining stations. The agreement between the two instruments is nonetheless fair at all sites, as reflected by the slopes relatively close to 1 (0.50–1.30) and the rather low y-intercept values (−30–1034) obtained for the linear fittings at most of the stations, as well as by the fairly large coefficients of determination (R2>0.74) (Table S1).
3.1.2 Methodology for the study of Ntot
The seasonal variations in Ntot were explored based on the comparison of the seasonal medians. For simplicity, seasons were assigned using the common December–February (DJF), March–May (MAM), June–August (JJA) and September–November (SON) division at all sites, even for the stations where other time divisions would be more appropriate. This is the case, for instance, at CHC, where the weather is affected by two main seasons (May–August and December–March) with tropical characteristics (i.e. dry and wet, respectively). Such specificities should be kept in mind when interpreting the results.
In addition, the diel cycle of Ntot was investigated based on the analysis of the autocorrelation and partial autocorrelation functions (ACF and PACF, respectively), using the approach described in the Supplement of the study by Collaud Coen et al. (2018). Briefly, the autocorrelations at 1 h (first lag) were first removed from the dataset, and the ACF and PACF were then calculated on the resulting whitened time series at each time lag up to lag 36. In the case of ideal diel cycles, one could simply use the PACF at lag 24 as a metric for the strength of the cycle (i.e. to evaluate how regular the cycle amplitude is), hereafter referred to as Dcy. Similar to Collaud Coen et al. (2018), the sum of the PACF between lags 22 and 26 was used instead, as the diel cycle may not always be found over a 24 h period due to the variability of both the natural and anthropogenic factors which determine it. There is no scale as such, or threshold values, that can be used to explain the quantitative meaning of Dcy, but Dcy generally takes on higher values the more regular the diel cycle is over time. Only the PACF values statistically significant at 95 % confidence level were considered, and the diel cycles were calculated at the annual scale only because the time series were too short (1 year, with limited data availability at some sites) to properly investigate the seasonal change in the diel cycle; this aspect is only briefly addressed through a few case studies. As further explained in Sect. 4.2, a stricter coverage criterion was additionally imposed in this specific part of the analysis.
3.2 Methodology for the analysis of the PNSD
The study of the PNSD was performed based on the seasonal medians of the distribution. In order to help in the evaluation of the seasonal contrasts and in the comparison between the sites, log-normal modes were additionally fitted to the median distributions, as described in Eq. (1).
where Nm,i, Dm,i and σm,i are the concentration (cm−3), the peak mean diameter (nm) and the geometric standard deviation of mode i, respectively. The analysis of the PNSD (including the fitting procedure) was restricted to the size range 20–500 nm to avoid possible bias in the comparison of the sites (1) due to differences in lower cut points or (2) related to increased uncertainty in the measurement of sub-20 nm particles (Wiedensohler et al., 2012). This also allowed a relevant description of the PNSD with only two log-normal modes, as previously done by Asmi et al. (2011). With this approach, the first mode is often a combination of the usual nucleation and Aitken modes, as reflected by the relatively high geometric standard deviation compared to that of the second mode (see Table A1 and Fig. S6). Nevertheless, this first mode will be referred to as Aitken mode for simplicity. The bimodal description performs well in reproducing the observations, as illustrated by the relatively large coefficients of determination obtained between measured and fitted PNSD (R2>0.98, Table A1), supporting the relevance of such an approach.
3.3 Investigation of the CCN-sized fraction of aerosols
The ability of a particle to act as CCN is determined both by its intrinsic properties (size and chemical composition) and by the surrounding atmospheric conditions (cloud supersaturation). The relative importance of particle size and chemical composition (which determines, in particular, its hygroscopicity) in the activation process has been the subject of multiple studies, sometimes leading to contrasting results (Schmale et al., 2018 and references therein). Some conclude that the particle size is paramount in determining the CCN impact (e.g. Dusek et al., 2006), while the knowledge of its chemical composition, including the size-resolved chemical composition and state of mixing, seems more important in other situations, in particular when fresh pollution aerosol is considered (e.g. Ervens et al., 2010).
The spatial and temporal variability of CCN concentrations, as well as the properties of the particles involved in cloud formation, have recently been studied by Schmale et al. (2017, 2018) using long-term measurements of CCN number concentration, particle number size distribution and chemical composition performed at 12 sites representative of various environments. While the value of such collocated observations, even when temporary, is demonstrated by Schmale and co-workers, there are no such data for all the sites considered in this study. A simpler approach has therefore been adopted here, based on the assumption that all particles larger than a given activation diameter are potential CCN, regardless of their chemical composition. This approach was previously used by Asmi et al. (2011) and also in several studies specifically dedicated to the evaluation of the contribution of NPF to the formation of CCN (Kerminen et al., 2012, and references therein; Rose et al. 2017, 2019). Very good agreement between measured CCN and predictions from size distribution only was, for instance, reported for JFJ by Jurány et al. (2011). The relevance of such a method was further validated by Hoyle et al. (2016): using activation diameter statistics from multiple campaigns (Hammer et al., 2014), they showed that 79 % of the observed variance in cloud droplet numbers at JFJ could be explained by the concentration of particles larger than 80 nm. This threshold diameter was close to the overall median activation diameter (87 nm) reported by Hammer et al. (2014) for an approximate cloud supersaturation of 0.35 %, although the activation diameter at this site was occasionally as low as 40 nm with a supersaturation of 0.86 % (Motos et al., 2019). A tight connection between cloud droplet number concentration and the concentration of particles larger than 100 nm, itself very close to the CCN concentration measured at 0.24 % supersaturation, was also observed at PUY by Asmi et al. (2012). One should, however, keep in mind that such an approach might be less accurate for the prediction of CCN in the presence of fresh pollution aerosol, whose ability to act as CCN may depend more largely on the chemical composition than in the case of aged particles, such as those sampled at PUY or JFJ.
Similar to Asmi et al. (2011), two different activation diameters were considered in the present work, 50 and 100 nm, in order to reflect the above-mentioned effects of both the properties of the particle itself and atmospheric conditions in the activation process. These threshold diameters are consistent with the findings of previous studies based on direct CCN measurements, which indicate that the smallest particles involved in the formation of real atmospheric cloud droplets are usually in the range of 50–150 nm; those include in particular the results of Schmale et al. (2018), who report that at 0.2 % supersaturation, activation diameters have a distribution centred around or slightly larger than 100 nm at most of the sites involved in their analysis. The number concentrations of particles in the ranges of 50–500 and 100–500 nm, hereafter referred to as N50 and N100, were thus inferred from available MPSS measurements and used as proxies for the CCN number concentration. It should be noted that estimates of CCN number concentrations based on particle characteristics such as size do not necessarily translate to cloud drop number (CDN) concentrations. Other factors also need to be considered, such as updraught velocity or if there is competition for water vapour due to high CCN concentrations or, as alluded to above, whether supersaturation values reach a sufficiently high value to enable the CCN to CDN transformation. Analysis of this last process and evaluation of CDN concentrations are, however, beyond the scope of the present work.
4.1 Impact on the annual and seasonal statistics of Ntot
In the analysis of Ntot presented in Laj et al. (2020), annual and seasonal statistics were reported when 75 % of the hourly data was available over the statistics reference period (year or season). In cases when the 2017 coverage was not sufficient (i.e. <75 % for all seasons) or 2017 data were not available at the time of analysis, the 2016 data were considered instead. Three stations were nevertheless discarded from the analysis (MSA, RUN and VAV) due to not having adequate coverage for either year, and among the 285 medians (annual and seasonal) which could have been expected for the other 57 sites, only 197 (69 %) were effectively calculated due to insufficient data availability in the remaining cases. As illustrated in Fig. 2, long gaps are seen in some datasets, indicating that despite the efforts made to ensure continuous measurements, interruptions (e.g. caused by instrumental failure or malfunctioning, natural disasters) cannot be avoided, and the difficulty of access to some of the sites can further complicate the situation. However, while these long gaps obviously result in reduced data availability at some sites, the 75 % coverage required in Laj et al. (2020) may have been too high, also limiting the number of statistics that can be included in the analysis.
The first aim of the present study was thus to investigate the effect of reduced data availability on the statistics of Ntot to evaluate the possibility of lowering the 75 % threshold used in Laj et al. (2020) without compromising the relevance of the analysis. For that purpose, the 11 sites with an annual data coverage of more than 95 % were selected (ETL, IPR, KOS, LEI-E, NGL, NMY, PAL, SNB, THD, TRL and VAR) and, for each site, the statistics derived from the original dataset were compared to those calculated from reduced datasets in which the absence of data was simulated. The selected stations do not represent all geographic and footprint categories, but they remain representative of a variety of environments. Two different approaches were used to investigate how, on top of the data availability itself, the length and configuration of the missing periods were affecting the results. Note that, however, none of these approaches were designed to address the effect of regular/cyclic gaps in the datasets or to correspond to very specific conditions prone to affect the instrument or the transmission of the data. They also are not intended to evaluate the effect of intentional data rejection resulting from automatic filtering based on systematic criteria (e.g. wind direction). As mentioned previously, such filtering occurs at SPO, BRW, ALT and MLO; for these four stations, the coverage criteria discussed here were not applied.
Exclusion of weeks was first performed to replicate long gaps in the data, similar to what can happen in the event of an instrument failure. Note that a week refers here to a block of 7 or 8 d, so that, for the sake of simplicity, each month has 4 weeks and the full year is 48 weeks long in total. The exclusion of 1 to 24 consecutive weeks was tested at the annual scale, and in each case all possible combinations were considered (e.g. there are 47 possibilities to exclude 2 consecutive weeks out of 48). The median and percentiles of Ntot were computed for all combinations, and for each combination we calculated the ratio of the newly derived median of Ntot over that derived from the original dataset. In addition, in order to gain more insight into the variability associated with each simulated gap length, the maximum of the 75th percentile of Ntot obtained from the different combinations was divided by the 75th percentile of Ntot calculated from the original dataset. Similarly, the 25th percentile from the original full Ntot dataset was divided by the minimum of the 25th percentile of all the different combinations.
As illustrated in Fig. 3, there is almost no impact on the annual statistics of Ntot when the measurement interruption is shorter than 4–5 weeks, and the effect remains limited for all types of sites with up to ∼ 12 weeks missing, with most of the medians computed from the reduced datasets within a factor of 1.5 of that derived from the original datasets. The variability is however more pronounced for the polar sites (NMY, PAL, TRL and VAR), especially as the length of the measurement interruption increases. This observation is consistent with the strong seasonal contrast of Ntot highlighted for these sites in Laj et al. (2020) and further discussed in Sect. 5.2.1. For data gaps of up to 18–19 continuous weeks, the medians of the ratios are relatively evenly distributed around 1. In contrast, as the simulated gap in the data gets longer, the distribution of the ratios becomes less symmetric around 1, clearly reflecting the fact that the seasonal cycle of Ntot (regardless of its strength) is not represented in the statistics anymore. In fact, the absence of more than 19 consecutive weeks implies that at least part of the period of JJA, when either the highest or lowest concentrations are often measured (depending on the hemisphere, see Sect. 5), is missing, which in turn affects the statistics.
The same analysis was repeated at the seasonal scale, and the exclusion of individual hourly averages was finally tested at both scales – annual and seasonal – to reproduce the rejection of sporadic data points as it may occur, for instance, during data quality control. The corresponding results are detailed in the Supplement. For comparable data availability, long interruptions in the datasets tend to have a slightly stronger impact on the statistics compared to the absence of individual data points. As illustrated in Figs. 2 and S5, such long interruptions are moreover mostly responsible for the low data coverage observed at some sites. Indeed, 9 of the 14 sites which have an annual data availability below 64 % have experienced measurement interruptions longer than 90 d, and, more broadly, 29 of the 39 stations which have an annual data availability lower than 88 % have missing data over periods longer than 30 d (Fig. S5). The definition of the coverage criteria to be used in this work was in turn based on the results obtained from the simulation of long gaps in the datasets. Based on the observations from Fig. S3, a threshold of 50 % was set at the seasonal scale, and 60 % of the data was required at the annual scale to ensure some minimal representativeness of the datasets with respect to seasonal cycles (Fig. 3). Although they are not based on strict statistical criteria, these thresholds seem to allow a reasonable compromise between availability and quality of statistics for the dataset of interest. Following these criteria, the three stations (MSA, RUN and VAV) discarded from the study of Ntot reported in Laj et al. (2020) were included in the present work. These looser requirements also allowed the analysis of 53 more summary statistics for the 57 other sites already included in Laj et al. (2020). Furthermore, unlike in Laj et al. (2020), the data from 2016 were used for THD in order to benefit from greater coverage for this station, which closed in early June 2017. Note that for consistency, in spite of the modified coverage criteria, the 2016 data were still considered for the sites for which this was already the case in Laj et al. (2020); this also made it possible to increase the number of statistics for all these sites (10 in total) except WLG.
4.2 Impact on the estimation of Dcy
Using the same approach as in Sect. 4.1, the effect of reduced data availability on the autocorrelation patterns and, more importantly, on the amplitude of the diel cycle of Ntot was investigated. As introduced in Sect. 3.1.2, Dcy was calculated as the sum of the PACF coefficients obtained for the whitened time series of Ntot for lags between 22 and 26 h. The analysis was performed at the annual scale with the threshold data availability of 60 % defined in Sect. 4.1 as a starting point, and the sensitivity of Dcy to the data coverage was further investigated by also simulating data availability of 75 %. These targets were reached in two ways: first by excluding 19 and 12 consecutive weeks, respectively, from the original time series and second by removing enough randomly selected, non-contiguous individual hourly averages. As with the statistics of Ntot, all possible combinations of weeks to exclude were considered in the first case, and the second test was repeated 25 times with different sets of randomly selected hourly averages. An overview of the results obtained at all sites is shown in Fig. 4. More specifically, Fig. 4a and c show, for each of the reduced datasets, the ratio between the newly derived Dcy and the value found in the original time series. In addition, Fig. 4b and d further illustrate the variability of Dcy, calculated for each site as the difference between the maximum and the minimum of Dcy found in the reduced datasets normalized by the Dcy value of the complete time series.
As illustrated in Fig. 4a, long interruptions in the time series overall have more significant effects on Dcy than on the statistics of Ntot (Sect. 4.1). The exclusion of 12 and 19 weeks nonetheless lead to comparable results, as reflected by the variability of Dcy (Fig. 4b), which is often similar in both cases. On the other hand, this variability is observed to decrease with the magnitude of Dcy in the original dataset, which suggests that the evaluation of Dcy is all the more uncertain in reduced time series as its value is already low in the complete dataset. Although they have a more pronounced effect on Dcy than on the statistics of Ntot, gaps of longer consecutive periods have, for the same resulting data availability, a weaker impact compared to the absence of individual data points. This observation, which contrasts with the findings of the previous section, is expected because the number of value pairs available for the determination of the ACF (and consequently affecting the PACF and Dcy calculation) drops significantly when an increasing number of sporadic values is missing, with a likely effect on the significance of the resulting correlations. In such a situation, a negative Dcy may appear, a priori without physical meaning, but rather in response to the decreased amount of data in the reduced datasets, while positive values are associated with the complete datasets. This is the case for all the sites highlighted by a black square at the top of panels a and, more importantly, c of Fig. 4 and for which such negative Dcy values are not shown. Note that observations from TRL are not presented since a negative Dcy value is obtained in the original dataset at this site; again this negative value is most likely an artefact, which is thought to arise in this case from the very strong variability of Ntot caused by the occurrence of snow storms between April and August at this site. As shown in Fig. 4c, the occurrence of a negative Dcy value is the most frequent when degrading the data availability to 60 %, and the variability of Dcy is also the highest, up to almost 300 % (Fig. 4d). When the simulated data availability is raised to 75 %, the occurrence of negative Dcy values is less frequent, but the variability of Dcy remains on average more pronounced than in the case of consecutive missing weeks. As in the case of longer interruptions, the variability of Dcy resulting from the absence of individual data points seems, however, to decrease with the magnitude of Dcy in the complete time series.
Based on these last observations, and even if long interruptions (e.g. due to instrument failure) were the main reason for decreased data availability in the datasets (Fig. S5), the coverage criteria were raised to 75 % for the study of Dcy, and the main analysis was limited to the annual scale. The seasonal change in the diel cycle was only briefly investigated at a few sites with particularly high coverage to give further insight into the findings obtained at the annual scale. All the results presented in Sect. 6 should nonetheless be considered with caution, as the length of the selected datasets in any case remains limited for such an application.
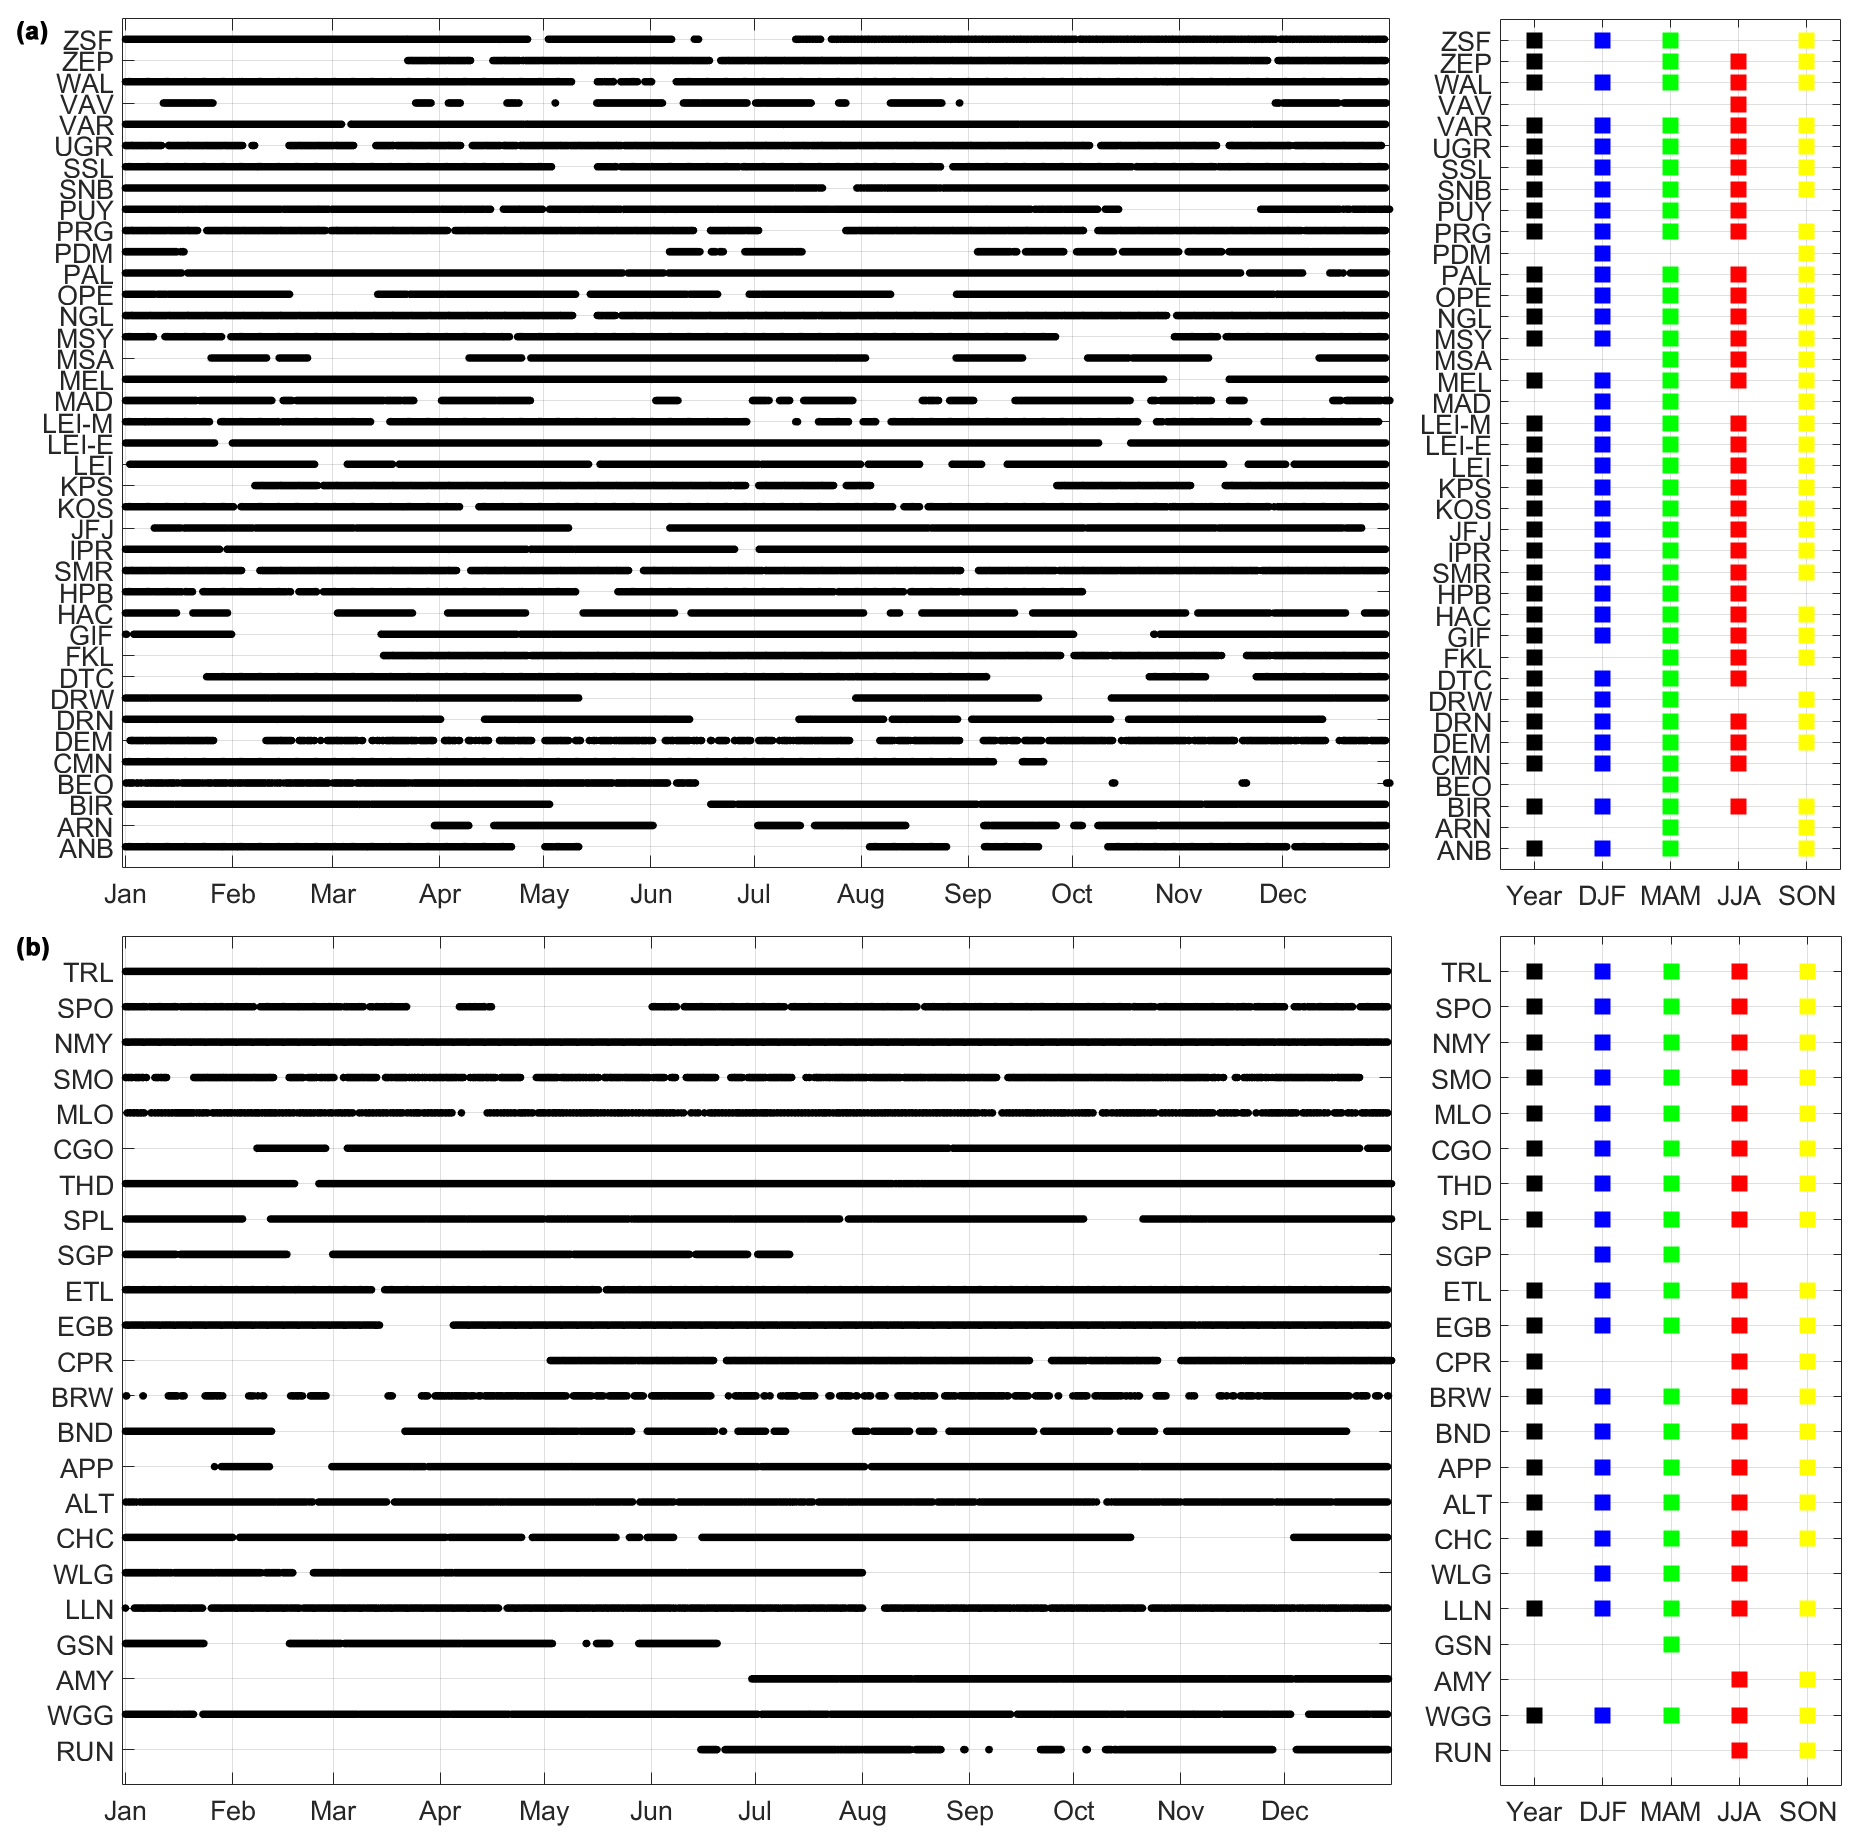
Figure 2Data coverage of the sites. For clarity, (a) European and (b) remaining stations are shown separately. Black dots on the left panel indicate the presence of valid hourly data, and markers on the right panel indicate the periods (year and seasons) for which the corresponding data availability was sufficient to compute statistics (i.e. 50 % for seasons and 60 % for the full year).
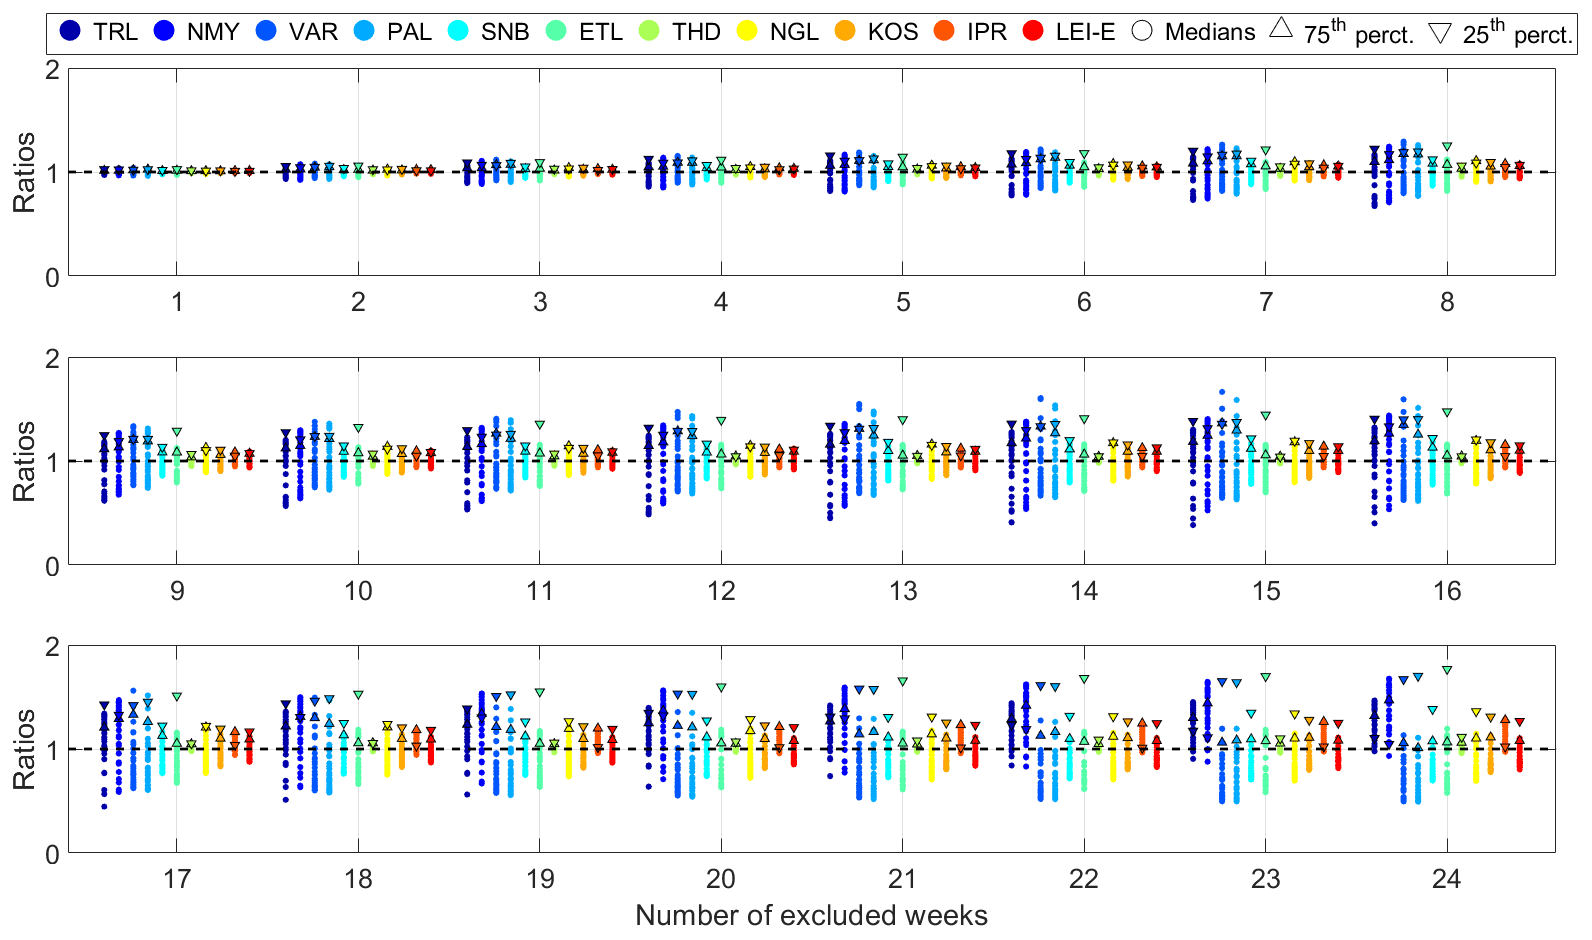
Figure 3Variability of Ntot annual statistics in reduced datasets. For each investigated gap length (between 1 and 24 consecutive weeks), all possible combinations were tested, and in each case the ratio between the newly derived median of Ntot and that derived from the original dataset was calculated (circles). The upward and downward triangles provide insight into the range of variability. The triangles facing up represent the ratio between the maximum value of the 75th percentile of Ntot obtained from the reduced datasets and the 75th percentile calculated from the original time series. The triangles facing down represent the 25th percentile from the original dataset divided by the minimum of the 25th percentile.
5.1 Structure of the section
The seasonality of Ntot was investigated first, together with the PNSD when measurements were available. The results are discussed below, separately for the following station types defined as combinations of geographical and/or footprint criteria among which comparable trends or features could be identified: mountain sites, polar stations, continental and coastal urban stations, and remaining lowland sites (i.e. non-urban continental and coastal stations). Note that all polar sites characterized by an additional geographical category (i.e. ALT, BRW and NMY; Table 1) were considered only as polar sites in this analysis.
Figure 5 provides an overview of the spatial distribution of Ntot based on the medians (annual and/or seasonal) computed for all sites, which are also reported in Table S2 in the Supplement. This overall picture is complemented by the results shown in Fig. 6, which offers an additional viewpoint based on the ranking of the sites according to (1) the annual median of Ntot (Fig. 6.a), in a similar way as in Fig. 8 in Laj et al. (2020), and to (2) the ratio of the maximum and minimum seasonal medians of Ntot (Fig. 6c). This ratio, hereafter referred to as SeasC and used as a metric to evaluate the seasonal variability of Ntot, was calculated when all seasonal medians were available; the seasons corresponding to the medians used in the calculation of SeasC are also shown for each site on the right-hand side of Fig. 6c. In addition to Fig. 6a, which, together with the annual median of Ntot, also indicates the corresponding first and third quartiles, Fig. 6b provides the normalized interquartile range of Ntot, hereafter referred to as NIQR. The NIQR, calculated as the ratio of the interquartile range over the corresponding median aims to allow a comparison of the variability of Ntot independent of the concentration level observed at each site. In other words, the NIQR corresponds to the relative variability of Ntot expressed as a percentage of the median, which is used as a reference in this approach. Similar information is also provided at the seasonal scale in Fig. 7 for further investigation of the intra-seasonal variability of the particle concentration. Note that the analyses presented in Fig. 6 are restricted to the stations where data availability was sufficient over the periods of interest.
The study was further limited to the sites where MPSS data were available for the investigation of the PNSD. Median distributions and corresponding modes (defined through the separation by the bimodal fit procedure, see Sect. 3.2) are shown for each site and season (depending on data availability) in Figs. A1–A6 in Appendix A, and corresponding characteristics of the modes (i.e. modal concentrations Nm,1 and Nm,2, mode peak locations Dm,1 and Dm,2, and geometric standard deviations σm,1 and σm,2) are reported in Table A1. In addition, the modal parameters are shown for all sites as a function of their type in Figs. 8, 9 and S6, which also indicate, for each station, the site-specific variability of each parameter. For a given site, this variability was calculated when at least two seasons were available as the ratio between the standard deviation of the parameter over the corresponding mean (calculated from all available seasonal values, i.e. between two and four seasons). Similar to the NIQR, such normalization was adopted to allow for the quantification of the variability regardless of the absolute value of the parameters and in turn make the comparison between the sites more relevant. One should, however, keep in mind that the variations in the modal parameters are often connected when interpreting the site-specific variability of each single parameter. As an example, changes in the concentration and width of a mode can be seen concurrently, and the resulting increase or decrease in the modal concentration can contrast with the initial guess one could make from the visualization of the median distributions only. This is the case for instance at ZEP, where the MAM to JJA increase in Nm,1 reported in Table A1 is not as pronounced as expected from the clear enhancement of the sub-50 nm particle concentration visible in Fig. A1 due to the concurrent strong decrease in σm,1 (Table A1 and Fig. S6). As shown in Fig. S6, site-specific variability of the geometric standard deviation is limited overall for both modes (9 % on average) but can nonetheless reach 27 %–28 %, with the highest variability observed at urban sites.
In addition to Tables A1 and S2 (as well as Figs. 12–13 and S7–S8 and Tables 2 and S3 discussed in Sect. 7), which provide ready-to-use information for the modelling community on both particle number concentrations in the size ranges of interest for this work and the parameters used to describe the PNSD, qualified time series of Ntot (as well as N50 and N100), and seasonal medians of the PNSD are available in Rose et al. (2021).
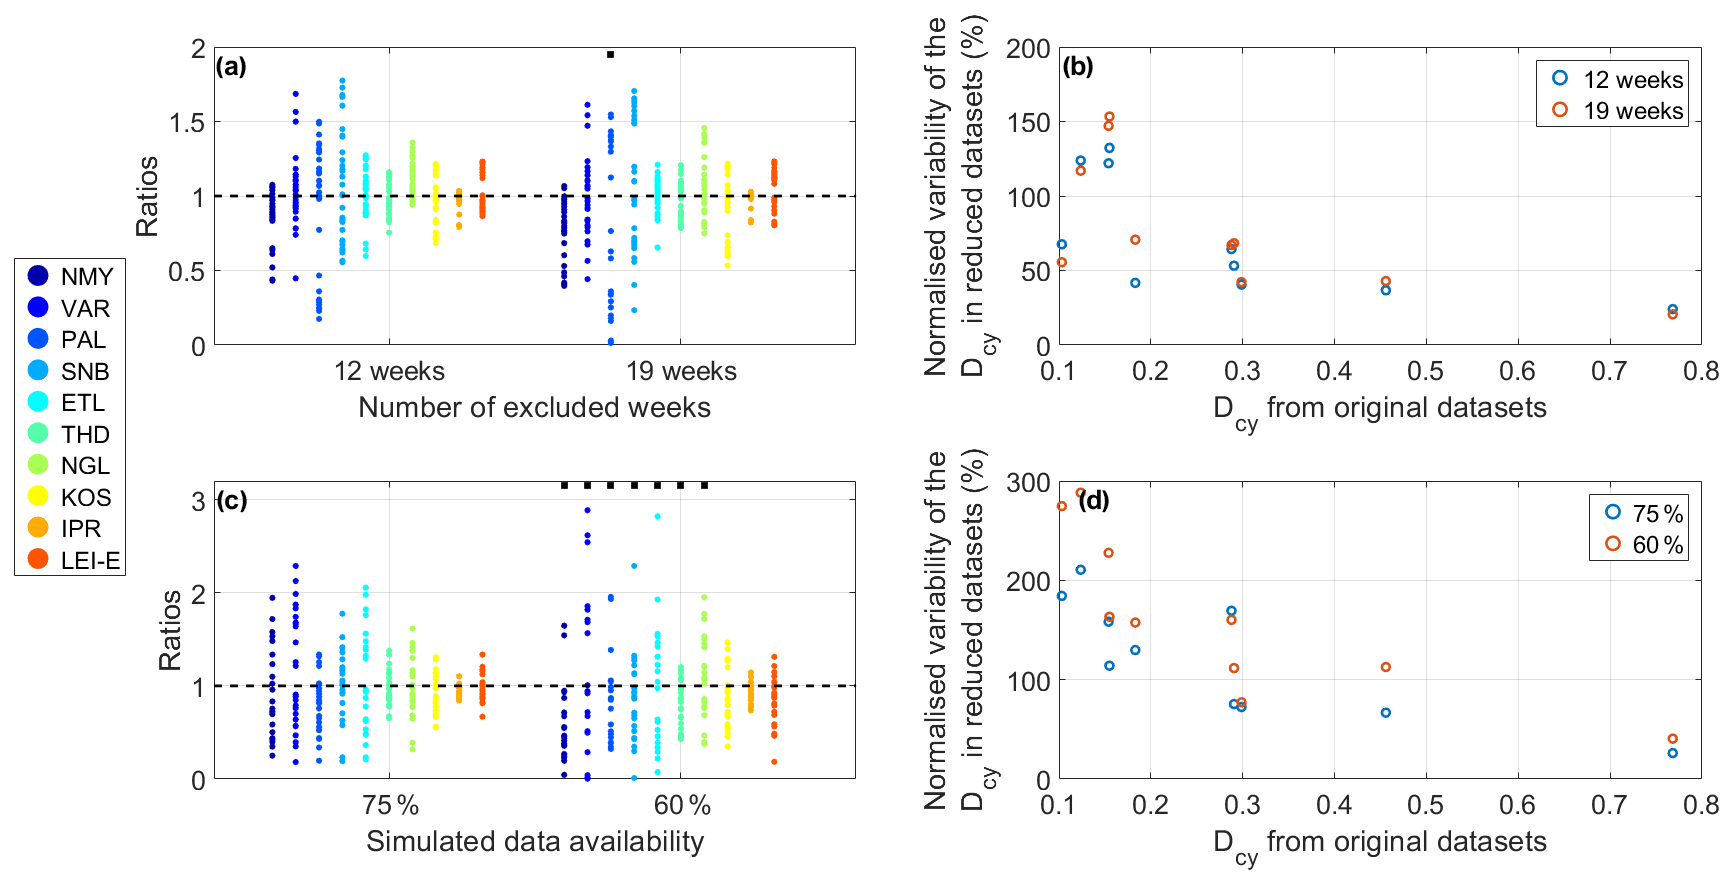
Figure 4Variability of the diel cycle (Dcy) of Ntot in datasets with data availabilities degraded to ∼ 60 % and ∼ 75 % as a result of the exclusion of 12 and 19 consecutive weeks (all possible combinations tested) (two top panels) and individual hourly averages (test repeated 25 times) (bottom two panels). In (a) and (c), the ratio between the newly derived Dcy value and that calculated from the original dataset was calculated for each reduced dataset. Black squares indicate the occurrence of negative Dcy values (not considered in the calculation of the ratios) at the corresponding sites. Panels (b) and (d) show the variability of Dcy, calculated for each site and each target data availability as the difference between the maximum and the minimum of Dcy derived from the reduced datasets normalized by Dcy calculated from the complete time series, as a function of the original Dcy value.
5.2 Results from different station types
5.2.1 Polar sites
As shown in Figs. 5 and 6a, the lowest particle concentrations are on average observed at polar stations, where annual medians of Ntot are on the order of 102 cm−3. Consistent with earlier observations by Asmi et al. (2011), the variability of the particle number concentration is the most pronounced at these sites, as shown in Fig. 6a and further reflected by the corresponding NIQR presented in Fig. 6b (∼ 160 % on average, up to ∼ 240 % at PAL and VAR). This variability is primarily related to a remarkably strong seasonal contrast of Ntot at most of these stations (SeasC >7 at five of the seven documented sites, Fig. 6c), with, in particular, enhanced concentrations observed during local summer which often contrast with winter minima. The exception is BRW, where all seasonal medians are quite similar. The variability of Ntot is also influenced by a pronounced intra-seasonal variability at some stations (Fig. 7), including for instance BRW during JJA (NIQR ∼ 250 %), and to a slightly lesser extent at TRL and NMY during MAM (∼ 210 %).
The corresponding PNSD are characterized by an Aitken mode located at 42 ± 14 nm and an accumulation mode found, on average, at 149 ± 37 nm (Table A1 and Fig. 9). Similar to Ntot, the shape of the PNSD is nonetheless highly variable at polar stations (Fig. A1), with the largest site-specific variability observed for Nm,1 (on the order of 89 % on average versus 59 % for Nm,2, Fig. 8). The variability of Nm,1 is significantly more pronounced at polar stations compared to other station types and also contrasts with the trend observed at other sites, where Nm,2 is instead more variable throughout the year. Enhanced concentrations of Aitken mode particles coinciding with the maximum of Ntot during local summer more specifically appear as a common feature of the four polar sites equipped with an MPSS (Table A1 and Fig. 8). This is consistent with findings by Freud et al. (2017) for size distributions measured at five Arctic sites.
Despite their distinctive behaviour, slight differences are noticed among the stations located at high latitudes. This first includes the tendency of Ntot to further decrease towards the poles, under conditions of minimal anthropogenic influence, down to 38 cm−3 at SPO during local winter. The PNSDs measured at these sites also experience contrasting evolution throughout the year. In fact, the summer PNSD is almost unimodal at PAL and VAR and differs significantly from the bimodal distributions observed during other seasons. At the Arctic station ZEP, in spite of the strong changes exhibited in Fig. A1 (in particular between MAM and JJA), two distinct modes are clearly seen during all investigated seasons (DJF missing), while, in contrast, this bimodal feature is much less pronounced at TRL regardless of the season. While being less obvious, changes in the modes' peak location also accompany the evolution of the modal concentrations at the sites located in the Northern Hemisphere (Fig. 9), with the most pronounced site-specific variability again observed for the Aitken mode, on the order of 28 % on average (versus 11 % for the accumulation mode). Larger diameters are more specifically seen for both modes during MAM at ZEP and later during JJA at PAL and VAR, while the modes' diameters are, in contrast, almost constant at TRL.
While similar processes are certainly contributing to Ntot at all these sites, contrasting properties of the PNSD likely result from varying sources and local specificities across the relevant latitude ranges. Transport was for instance reported as an important source of Aitken and accumulation mode particles during the summer at Arctic sites such as ZEP and ALT, while the accompanying wet deposition reduced the number concentration of accumulation mode particles (Croft et al., 2016). Secondary aerosol formation, including NPF, was furthermore observed at polar stations (Kerminen et al., 2018, and references therein; Nieminen et al., 2018), with slightly different seasonal patterns which presumably result from the diversity of condensing vapours (and their associated concentration) involved in the process at the different sites. For instance, compounds of marine origin that are related to ocean ice cover and biological activity are likely contributing more to aerosol formation in the pristine conditions found at the sites located at extreme latitudes (Abbatt et al., 2019; Jang et al., 2019; Baccarini et al., 2020) than at sub-Arctic sites such as PAL and VAR. Finally, some specific phenomena have also been previously reported to affect the PNSD. This is for instance the case during the pervasive annual episodes of Arctic haze observed across much of the region, which cause elevated number concentrations of accumulation mode particles during springtime in the Arctic region (Abbatt et al., 2019, and references therein), as reflected in the measurements collected at ZEP during this time of the year (Fig. A1). As reported in earlier studies (e.g. Croft et al., 2016; Freud et al., 2017), this likely affects NPF over this region, where the maximum frequency of occurrence of the process is observed during JJA, when the existing aerosol surface area is reduced, while this maximum is, in contrast, seen earlier during spring at sub-Arctic sites (Nieminen et al., 2018).
5.2.2 Urban stations
In contrast to polar sites, stations located in urban areas, both continental and coastal, exhibit the highest Ntot, with yearly medians in the range of 103–104 cm−3 (Figs. 5 and 6a). As shown in Fig. 6a and b, the variability of Ntot is also less pronounced in urban conditions, with an average NIQR of ∼ 90 %. Specifically, these sites, which are all located in Europe, display only limited seasonal variation (SeasC <2 for the nine documented sites, Fig. 6c). Despite the lack of a clear trend in the seasonal cycle, slightly greater medians are nonetheless observed during the summer at five stations, while winter concentrations are on average higher at IPR and UGR, where the most pronounced contrast is seen. Intra-seasonal variability is also minimal at urban stations, with the NIQR mainly below 100 % (Fig. 7).
The weak seasonality of Ntot is associated with limited changes in the PNSDs, which are almost unimodal throughout the year and shifted towards the lower end of the investigated size range at a majority of urban sites compared to other station types, with elevated concentrations of sub-100 nm particles (Figs. A2–A3). The distributions are specifically dominated by a wider Aitken mode compared to other station types (σm,1>2) (Table A1 and Fig. S6), which is on average located at 32 ± 11 nm and only experiences a limited seasonal variation in its properties at most of the sites (on average 20 % and 22 % for the mode diameter and modal concentration, respectively, Table A1 and Figs. 8–9). In contrast, the characteristics of the accumulation mode show more variability for a given site (on the order of 26 % and 77 % for the mode peak location and concentration, respectively) but with no clear pattern among the sites. On average, this second mode is positioned at 122 ± 37 nm but is often found below 100 nm and sometimes even overlaps strongly with the Aitken mode (Table A1 and Fig. 9). Furthermore, the accumulation mode can be relatively wide, as observed for instance at LEI-M and DRN during DJF (Fig. S6). The shape of the PNSD at IPR, while also almost unimodal, is slightly different from those of the other urban sites, with features comparable to those observed for rural background continental sites. As noticed earlier by Asmi et al. (2011), a distinctive behaviour at IPR is in particular observed in DJF, with elevated particle concentrations of around 100 nm resulting from the accumulation of aerosols in the lowermost levels of the troposphere (<1000 m) during this time of the year (Barnaba et al., 2010). As mentioned before, increased concentrations of ground-level particles are also measured during winter at UGR, in particular in the range of 50–100 nm (Fig. A2), and these were earlier attributed to the combined effect of several factors including ABL dynamics and enhanced anthropogenic activities (domestic heating) by Lyamani et al. (2010).
More broadly, sub-100 nm particles, which often dominate the urban PNSDs, are emitted directly into the atmosphere from combustion processes related to traffic, industry or residential heating or from other sources, such as vehicle brakes, and they can also be formed from gaseous precursors (Rönkkö and Hilkka, 2019). As indicated in this recent review, a number of studies have been conducted to investigate the characteristics of urban aerosol and to assess the relative importance of the above-mentioned sources. Different approaches have been used, including simultaneous measurements of the PNSD at different locations in the same urban area (e.g. Harrison et al., 1999; Salma et al., 2014), possibly coupled with laboratory experiments (Rönkkö et al., 2017) or the application of statistical methods for the analysis of data collected at a single site (Pey et al., 2009; Dall'Osto et al., 2012; Al-Dabbous and Kumar, 2015; Brines et al., 2015). All of these studies agree on a very strong contribution of traffic-related emissions to the total particle number concentration. More specifically, Pey et al. (2009) indicate that road traffic could explain, on average, 54 %, 69 %, 74 % and 86 % of the particle concentration measured at Barcelona (Spain) in the ranges of 13–20, 20–30, 30–50 and 50–100 nm, respectively, while Rönkkö et al. (2017) and Olin et al. (2020) report the importance of traffic emissions in the sub-3 nm range as well. While traffic-related emissions are often subject to daily variation (e.g. increase during morning and evening rush hours), probably affecting the diel cycle of Ntot at urban sites (see Sect. 6), they however experience more limited seasonal variation, which likely explains the weak seasonality of Ntot in urban areas. The fact that slightly higher particle number concentrations are observed during summer at a number of urban stations, when the atmospheric boundary layer (ABL) height is also increased compared to colder months, suggests, however, that there are certainly additional sources of aerosols in summer which compensate for the ABL dilution effect. Increased concentrations of sub-40 nm particles are observed during MAM and more importantly JJA at some stations (PRG, LEI, DRN and GIF, Fig. A2), supporting a probable role of secondary aerosol processes in the build-up of increased summer Ntot at these sites. This assumption is supported by the results of Salma et al. (2014) and Brines et al. (2015), who report that NPF can represent a significant source of particles in the urban atmosphere, in particular during spring and summer and more broadly under high-insolation conditions. In addition to supplementary sources, we also cannot exclude the existence of a seasonally reduced particle sink on Ntot at some sites. Such an effect was for instance reported for Botsalano (semi-clean location) and Marikana (industries and residential area nearby) in South Africa, where the lack of wet removal during the dry season (from May to September) contributes to higher particle number concentrations during this time of the year, in particular above 100 nm (Vakkari et al., 2013). The studies of Harrison et al. (1999) and Salma et al. (2014) also underline the strong spatial heterogeneity of observations within a given urban area, also visible in our dataset when comparing measurements from LEI and LEI-E, which are separated by only ∼ 3 km. Fresh traffic emissions have a strong impact on the shape of the PNSD, with an increased amount of small particles (<10 nm) compared to urban background sites (Harrison et al., 1999; Salma et al., 2014; Rönkkö et al., 2017), and also contribute to observed high-frequency variations, which can be attributed (at least partly) to the wide variety of vehicular sources emission characteristics (Harrison et al., 1999). This is in particular the case for roadside samples, such as those collected at DRN, LEI-E and LEI-M in the present study.
5.2.3 Non-urban sites and mountain stations
The remaining sites, including mountain and non-urban continental and coastal stations, do not exhibit as clear a common behaviour as polar and urban sites and display, on average, intermediate Ntot, with yearly medians on the order of 102–103 cm−3 (Figs. 5 and 6a). As shown in Fig. 6a, the signature of their dominant footprint is noticeable, with lower concentrations measured in forested areas, or at stations influenced by air masses of various origins (“mixed”), compared to rural background sites. However, the distinction between the different geographical categories (i.e. mountain, continental and coastal) is less pronounced. Nonetheless, as noted in Laj et al. (2020) and in agreement with previous observations from Asmi et al. (2011), particle concentrations measured at mountain sites tend to be lower compared to nearby lowland sites, as observed for instance for SNB (3106 m a.s.l., annual median of Ntot ∼ 1027 cm−3) and KOS (535 m a.s.l., 2690 cm−3). Also, as discussed below, mountain sites, and specifically those characterized by mixed footprints, tend to exhibit somewhat more pronounced seasonal variations relative to lowland stations. This is likely a result of the strong impact of the ABL height variability (e.g. Herrmann et al., 2015; Rose et al., 2017) in connection with the topography of the sites (Collaud Coen et al., 2018), which largely determines the contribution of long-range transport relative to more local sources of particles.
Non-urban continental and coastal sites
Particle number concentrations measured at non-urban continental and coastal sites are overall lower compared to those observed at urban stations, but similar features are observed among all these lowland sites. Specifically, the variability of Ntot is comparable (NIQR ∼ 100 %, Fig. 6b), as a result of both limited intra- (Fig. 7) and inter-seasonal variability (Fig. 6c). A slight enhancement of Ntot is visible during local spring (6 sites) or summer (9 sites) at all 17 non-urban lowland sites documented in Fig. 6c except ETL and THD, where higher concentrations are instead found in autumn. Similar to urban sites, this likely results from the concurrent variability of particle sources and ABL dynamics, as for instance hypothesized for OPE by Farah et al. (2020), who suggested a biogenic secondary source for the extra particles observed in the warmest seasons. However, as mentioned already, an effect of a seasonally reduced sink (mainly from precipitation) on the variations in Ntot can also not be excluded at some sites (e.g. Vakkari et al., 2013). As shown in Fig. 6c, the stations located in forested areas tend to exhibit stronger seasonal variations. This is likely explained by the biogenic nature of at least some of the aerosol sources at these sites, which are affected by a strong seasonality that is related to the biosphere activity. The distinct nature of these forested sites is also visible in the PNSD, which tend to have a more pronounced bimodal shape compared to rural background stations, where the distributions are, in contrast, more monomodal and similar to those observed at urban sites (Figs. A3–A5). Specifically, the northernmost stations located in forested areas, SMR and BIR, feature similar PNSD variations as the sub-Arctic polar stations PAL and VAR, including a growth of the Aitken mode in summer with greater concentrations and larger mode diameters (Table A1 and Figs. 8–9). On average, the Aitken and accumulation modes are found at 51 ± 13 and 174 ± 29 nm, respectively, at non-urban sites. These are actually the largest mode diameters among all station types, with the most noticeable shift (compared to other station types) observed for the first mode at the two coastal sites AMY and FKL (Table A1 and Fig. 9). Despite being less pronounced compared to urban stations, the site-specific variability for Nm,2 is also significant at non-urban sites: on the order of 48 % on average (versus 31 % for Nm,1, Fig. 8). In spite of the clear seasonal variations in the PNSD at some of these sites (Fig. A4), the variability of Dm,1 and Dm,2 is, on average, also less pronounced than at urban sites (16 % and 12 % for Dm,1 and Dm,2, respectively, Fig. 9).
Despite the differences observed in terms of level of Ntot and characteristics of the PNSD, this last analysis highlights similarities between observations conducted from urban and non-urban areas, and particularly between measurements from urban and rural background sites. This result suggests that diluted urban aerosol is likely contributing to the aerosol sampled at a number of non-urban stations, in particular those located in the vicinity of urban areas.
Mountain stations
As mentioned earlier, the seasonality of the observations collected at mountain sites is somewhat stronger than at lowland stations (other than polar). This is the case in particular at stations characterized by mixed footprints, where there can be difference of up to a factor of almost 5 between the maximum and minimum seasonal medians of Ntot (Fig. 6c). Similar to polar sites (although for different reasons, as discussed later in this section), higher Ntot values are mostly found during local summer (six sites), and often contrast with winter minima (five sites). The main exception is CHC, which sees its highest Ntot during JJA, which, as noted in Sect. 3.1.2, coincides with the dry season at this site located in the tropics. This seasonal contrast contributes to an average NIQR of ∼ 117 % for mountain sites (Fig. 6b), which is also explained by the relatively marked intra-seasonal variability of Ntot compared to lowland sites (other than polar) (Fig. 7). Note that the particularly low NIQR values observed at MLO (Figs. 6b and 7, between 38 % and 46 % in the different seasons) are likely related to the automatic filtering of the data based on wind direction.
The PNSDs collected at mountain sites exhibit a stronger bimodal behaviour compared to lowland stations (other than polar), with mean diameters for the two modes close to those obtained for polar sites. These modes are, on average, found at 39 ± 9 and 142 ± 25 nm, but, similar to Ntot, significant variability of the PNSD is observed, both among the sites and seasons. The most significant site-specific variability is observed for Nm,2 (on the order of 76 % versus 36 % for Nm,1, Fig. 8), while, like all other station types except urban, the peak location of the Aitken mode is slightly more variable (20 %) than that of the accumulation mode (13 %) (Fig. 9). The contrast between the sites is sometimes striking, as observed for instance for JFJ and CHC, where the medians of Ntot differ by 1 order of magnitude (Fig. 6a) as a likely result of the contrasting surroundings of these sites. The impact of the emissions from the neighbouring urban area of La Paz (∼ 20 km) on the measurements performed at CHC was demonstrated by Chauvigné et al. (2019), while there is no such major source of pollution in the vicinity of JFJ. Similarities among sites can also be seen. For instance, the two mountain stations located below 1000 m a.s.l. – MSY and HPB – feature Ntot levels and variability comparable to those of rural background continental sites (Fig. 6) and a less obvious bimodal behaviour of the PNSD, particularly for MSY (Figs. A5 and A6).
Following this last observation, the connection between the medians of Ntot and the elevation of the sites was further investigated, separately for each season (Fig. 10.a). The linear fit between these two variables is shown in the plot to further guide the eye, but the strength of the correlation was more specifically evaluated by means of Spearman's rank correlation coefficient, which does not require the variables to be normally distributed and assesses monotonic relationships, whether linear or not. Note that in order to include measurements from CHC and RUN (the two mountain sites located in the Southern Hemisphere), local seasons are considered in this part of the study (i.e. for example, DJF data from CHC and RUN contribute to summer data). In addition, in order to include as many sites as possible, we did not limit this analysis to the sites with sufficient data availability over all four seasons, which means that the number of points considered in the search for correlations varies from season to season from 11 in fall to 16 in spring.
As shown in Fig. 10a, there is a tendency for Ntot to decrease with altitude in all seasons but winter, where the opposite is seen. However, the correlations between Ntot and the station elevation are not statistically significant for any season except summer, where the correlation is found to be statistically significant at the 95 % confidence level. This last observation is consistent with the fact that measurements collected at mountain sites during this time of the year are likely more connected to the lower-tropospheric layers due to increased ABL dynamics (including thermally driven wind systems) and height; in contrast, Ntot values are more representative of free-tropospheric air masses and long-range transport during winter, where a weaker connection between altitude and Ntot is thus expected. The results of this correlation study seem, however, to be strongly influenced by the observations from CHC, which is the highest station and where, nonetheless, winter concentrations are much higher compared to other sites. This might be related to the close proximity of the urban area of La Paz, but we also cannot exclude the idea that the use of the common division DJF–MAM–JJA–SON is not adapted to this station located in the tropics. More broadly, this result challenges the relevance of using altitude alone to describe the influence of lower-tropospheric levels on measurements performed at mountain sites. Based on Collaud Coen et al. (2018), the mesoscale topographical features around the station should be considered as well; the connection between Ntot and the ABL-TopoIndex (Collaud Coen et al., 2018), an index defined to provide a more complete characterization of the ABL influence at high-altitude sites, was thus investigated here as well. This topography-based index is defined in such a way that the greater the influence of the ABL, the higher the value it takes. As shown in Fig. 10b, all correlations are statistically significant at the 95 % confidence level and positive. This result is consistent with earlier findings by Collaud Coen et al. (2018), who more specifically highlighted a positive correlation between particle concentration and the components of the ABL-TopoIndex describing the ease of local transport of both particles and their precursors to the station. The overall stronger connection observed between Ntot and the ABL-TopoIndex (compared to the station elevation alone) clearly illustrates the need to take the topography around the sites into account to characterize the ABL influence on observations performed at mountain stations. In summer, however, the correlation between Ntot and the ABL-TopoIndex appears to be weaker than in the case of altitude, as reflected by the absolute value of the corresponding Spearman's rank correlation coefficients (0.57 versus 0.76). During this time of the year, inputs from the ABL at mountain sites are certainly not only more frequent but also associated with higher particle loading, in line with increased Ntot observed in the lower layers (Sect. 5.2.1–5.2.3). We hypothesize that the absence of aerosol source inventories in the ABL-TopoIndex explains the lower Spearman rank correlation with Ntot during maximal ABL influence in summer, whereas the standard decrease in aerosol with altitude and ABL depth has a strong impact on the connection between Ntot and altitude. Repeating the same approach with the modal concentrations instead of Ntot would have probably provided more insight into these aspects, but such an analysis was not performed for the present work because of the limited data availability in some seasons.
Overall, the topography and environs of the sites (which determine the ABL influence) combined with the variations in the ABL height strongly affect the seasonal cycles of the particle number concentration and size distribution observed at mountain stations. At JFJ, for instance, the greatest variability is observed for Nm,2, the median of which is increased by almost 1 order of magnitude between local winter and summer (Table A1 and Fig. 8). This results from the increased frequency of ABL injections during summer, which are the main source of accumulation mode particles at this site (Herrmann et al., 2015). Such significant variability of Nm,2 is also seen at CHC, where it is accompanied by a widening of the accumulation mode and decrease in its mean diameter, reflecting the overall shift of the whole distribution towards the lower end of the investigated size range during JJA (Table A1 and Figs. 8, 9 and S6). The concentration of sub-40 nm particles is clearly enhanced during this time of the year at CHC (Fig. A6), coinciding with elevated NPF frequency observed at the site (Rose et al., 2015). Additional insight into the occurrence and role of NPF at mountain stations is more broadly considered in the recent review by Sellegri et al. (2019).
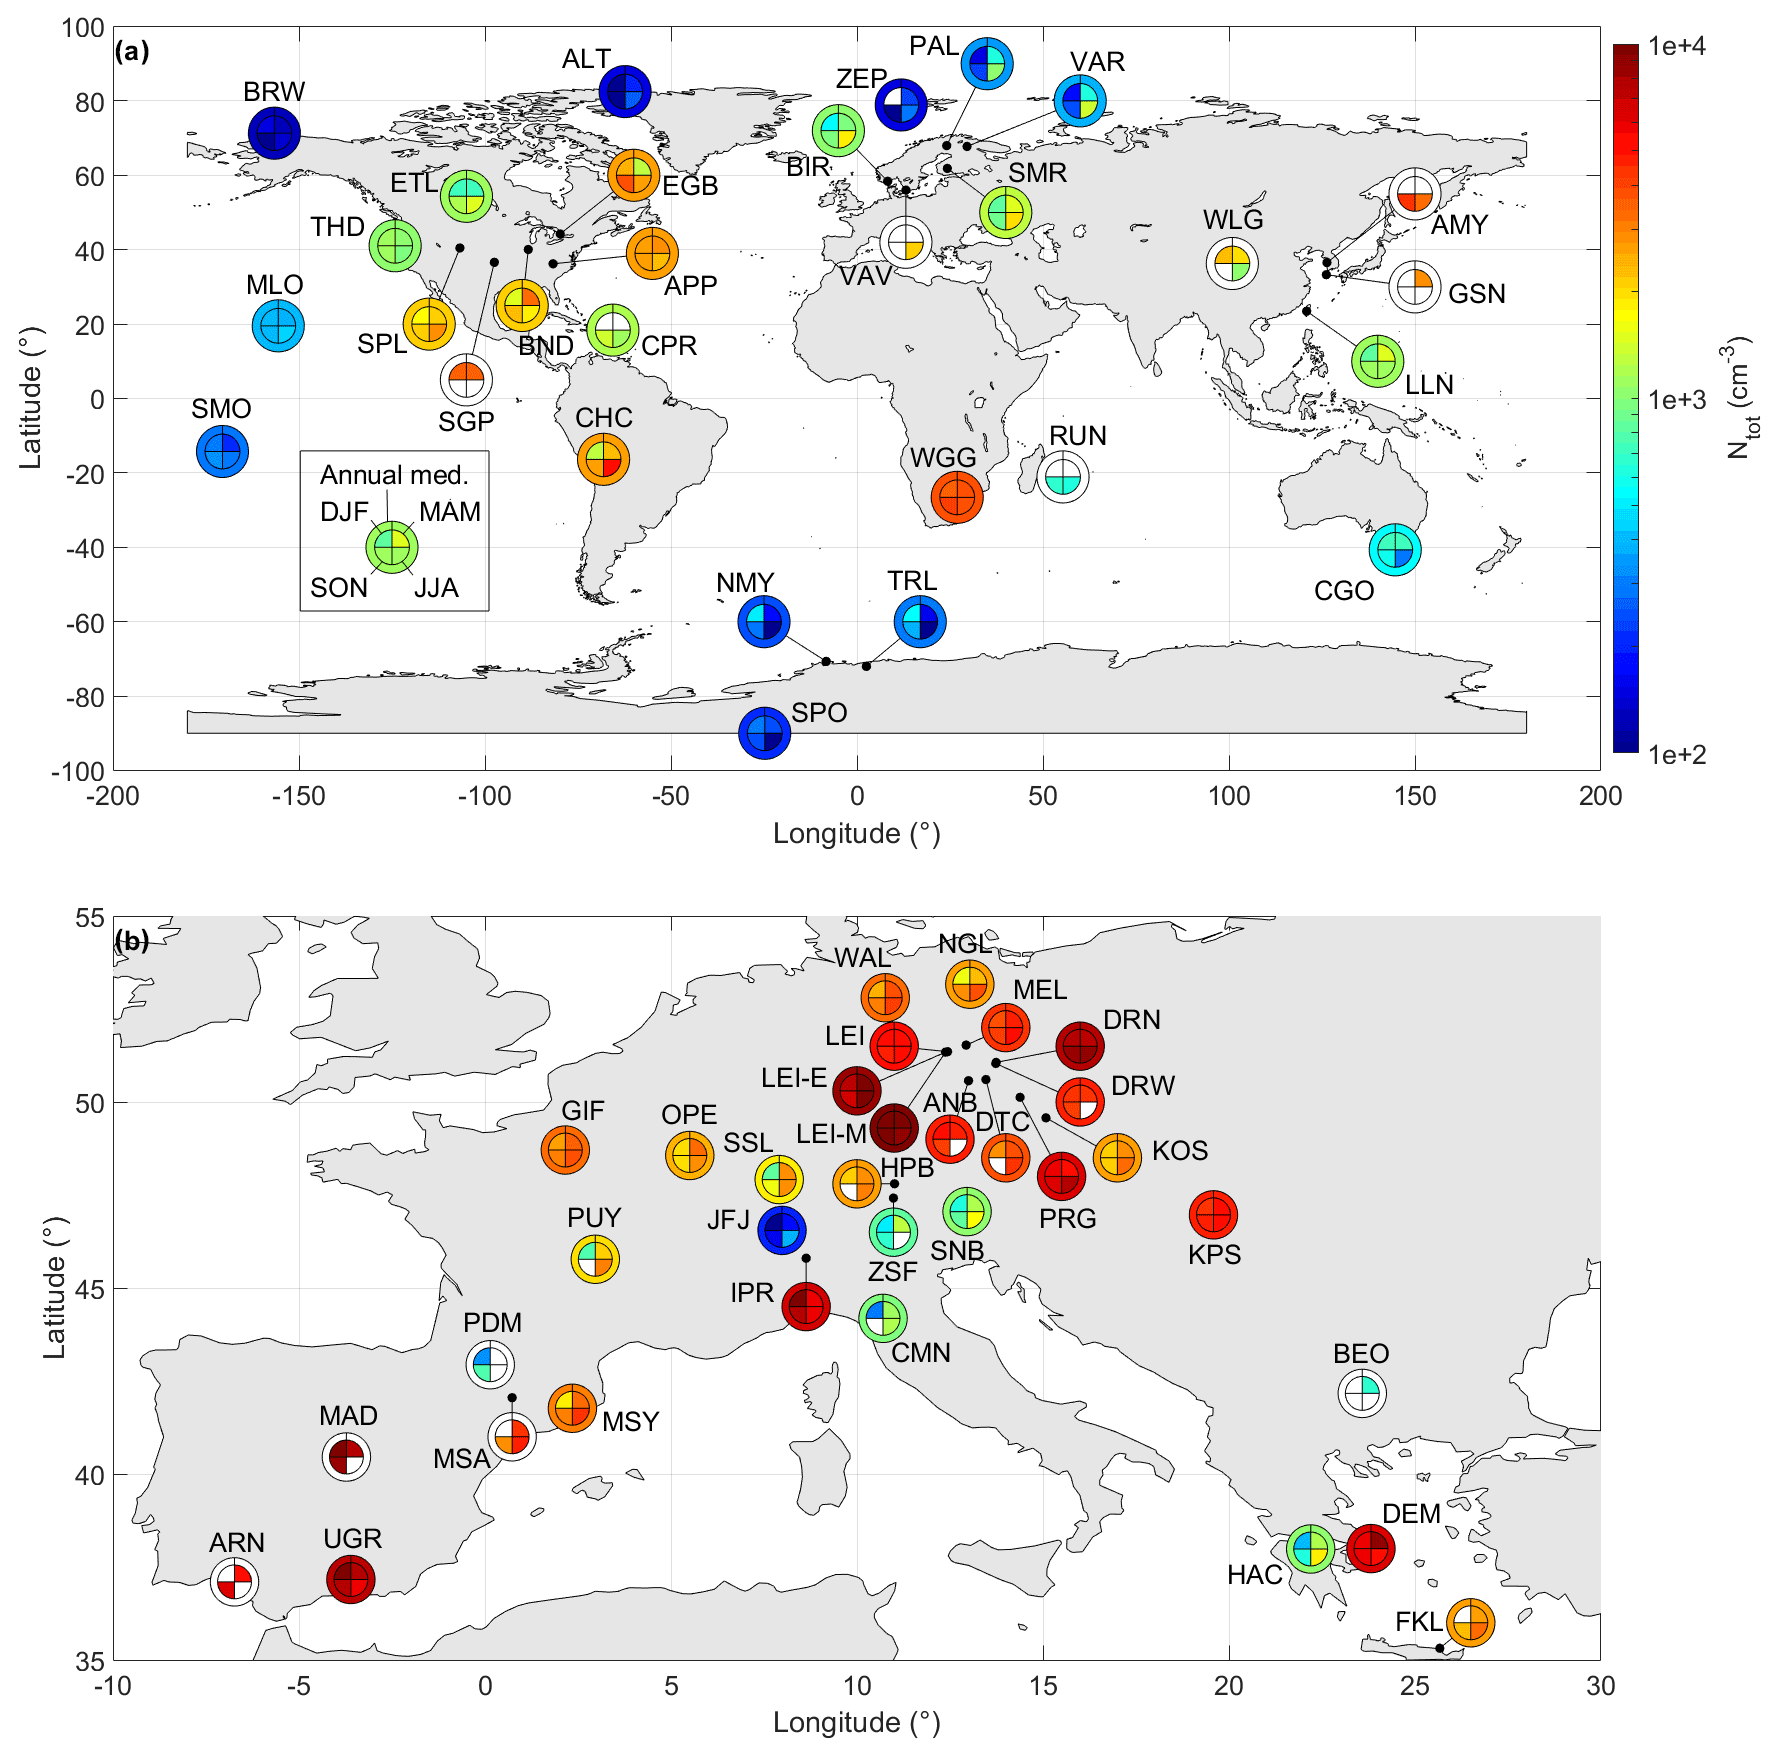
Figure 5Geographical distribution of Ntot (a) at the global scale and (b) specifically over Europe. As indicated in the legend, for each station, seasonal medians are shown in the inner part of the corresponding pie chart and the annual median is represented by the outer ring. The symbols are left empty when data availability was not sufficient over the corresponding period.
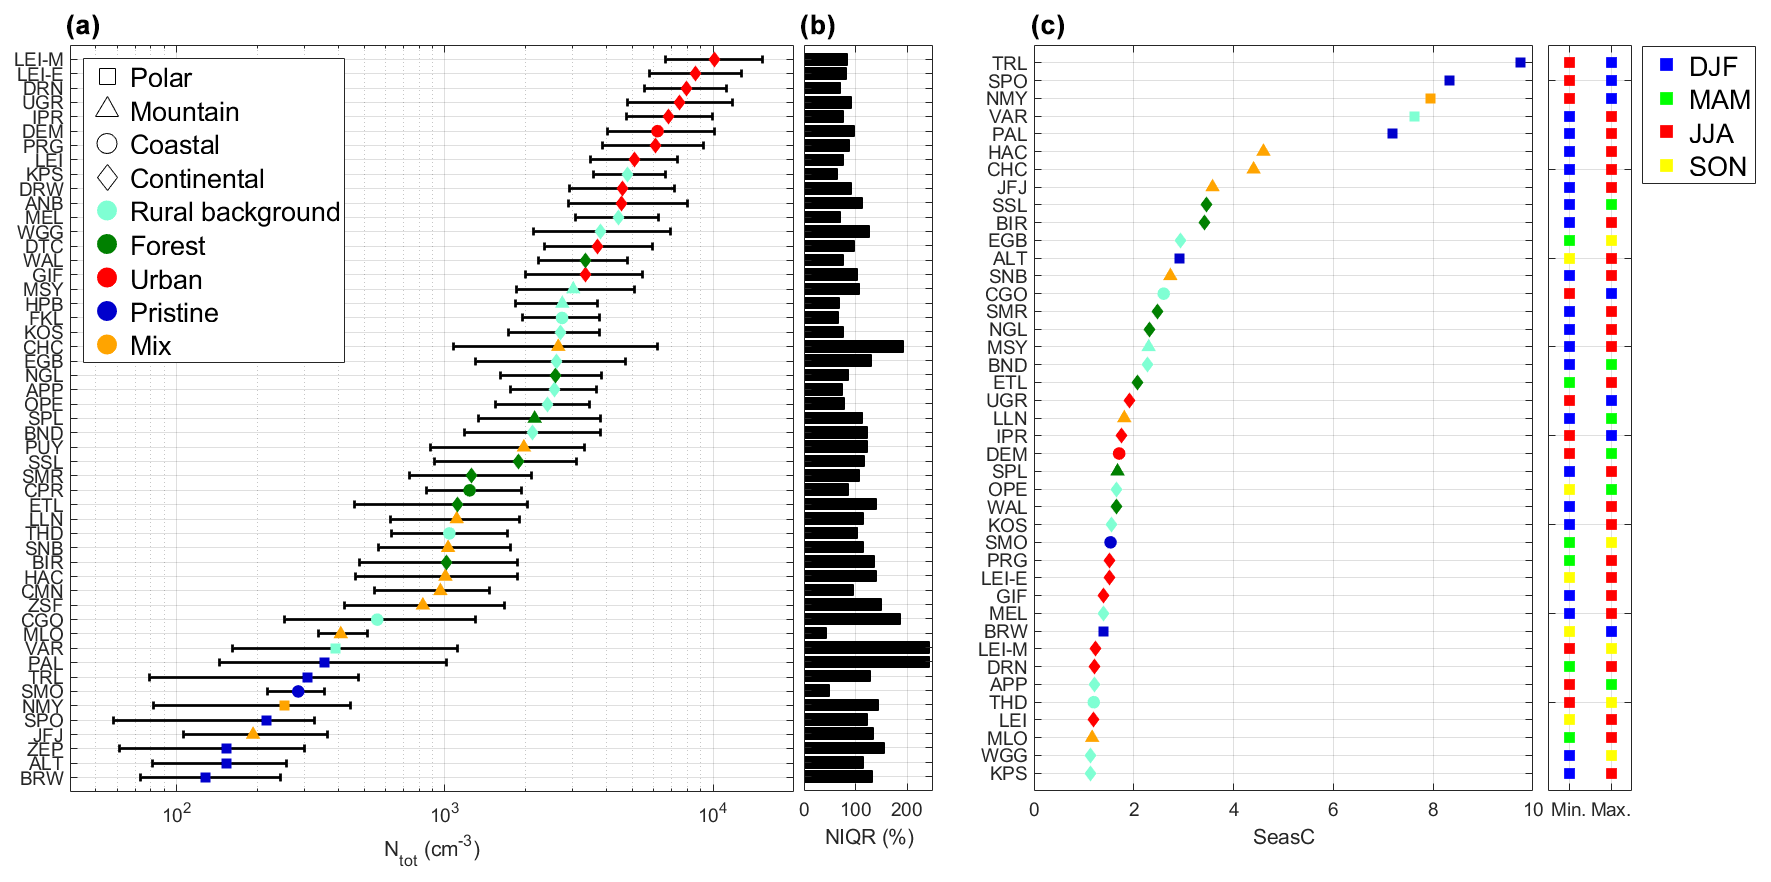
Figure 6Ranking of the stations based on (a) the annual median of Ntot and (c) the variable SeasC, used as a metric to evaluate the magnitude of the seasonal contrast of Ntot. In (a), the markers represent the median of Ntot, and the left and right ends of the error bars represent the first and third quartile of the data, respectively. The annual variability of Ntot is again shown in (b) by means of the NIQR calculated for each site displayed in (a). Different symbols and colours in (a) and (c) indicate geographical and footprint categories, respectively. The right-hand side of (c) also shows the seasons corresponding to the minimum and maximum seasonal medians of Ntot used in the calculation of SeasC. Additional explanations regarding the calculation and interpretation of SeasC and NIQR are available in Sect. 5.1.

Figure 7Intra-seasonal variability of Ntot. Stations are sorted based on the classification reported in Table 1. The meaning of the abbreviations used for the footprint is the following: P for pristine, F for forest, RB for rural background, U for urban and Mix for mixed. Explanations regarding the calculation and interpretation of the NIQR are available in Sect. 5.1.
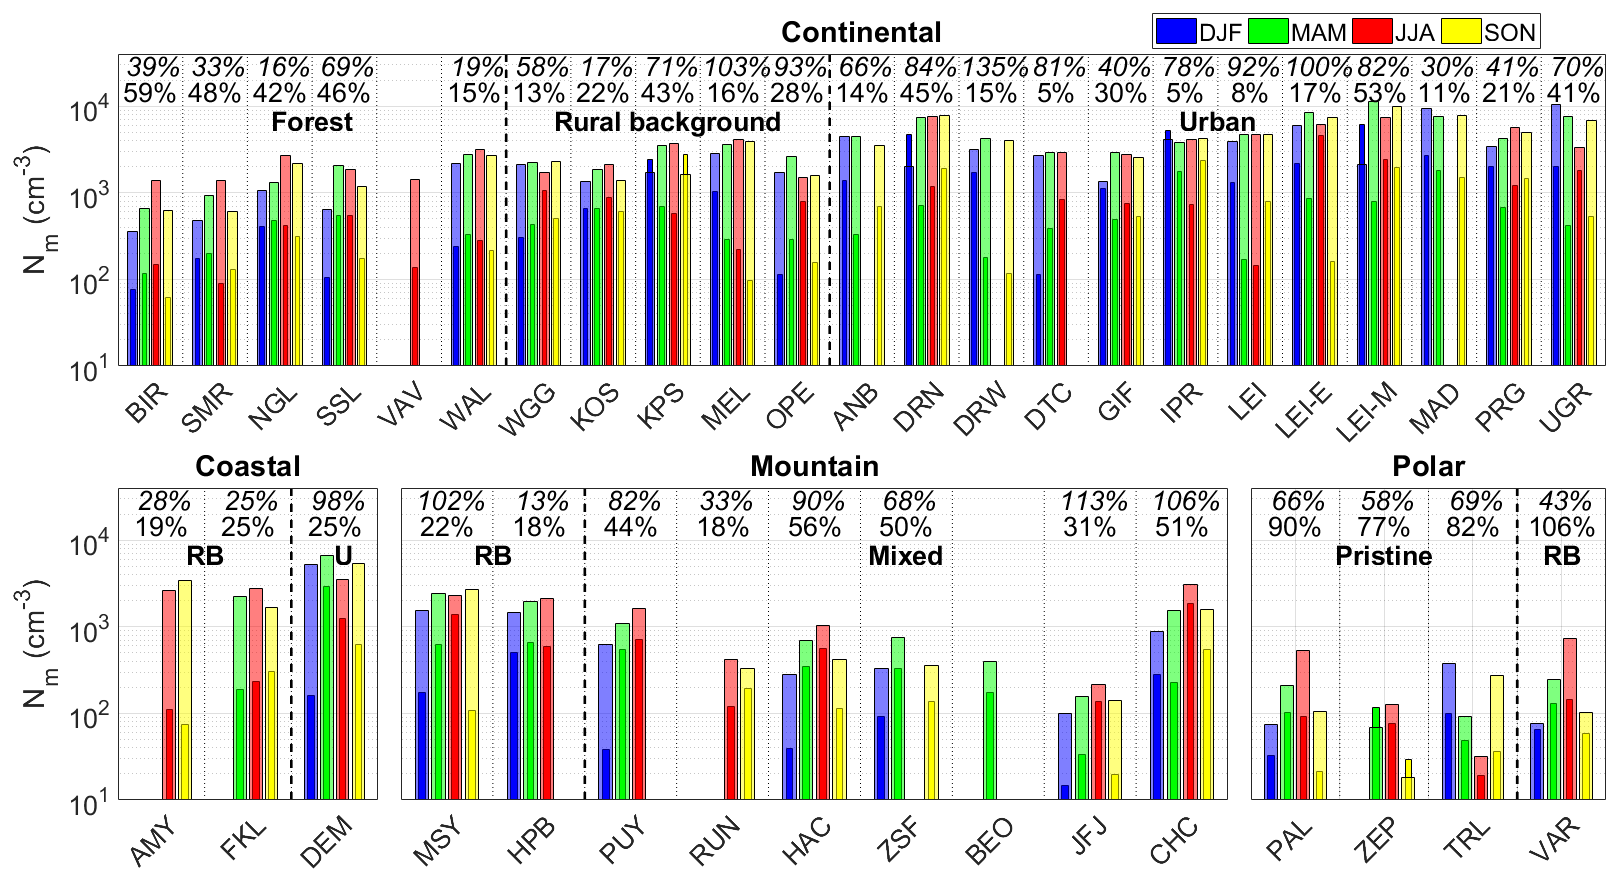
Figure 8Modal concentrations. For each site and season, the thicker bar represents the modal concentration of the Aitken mode (Nm,1) and the thinner one that of the accumulation mode (Nm,2). The values at the top of each panel indicate the site-specific variability of the modal concentrations, with the italicized text corresponding to Nm,2. The meaning of the abbreviations used for the footprint is the following: RB for rural background and U for urban. Details regarding the calculation of the site-specific variability of the mode characteristics are available in Sect. 5.1.

Figure 9Mode peak locations. For each site and season, the thicker bar represents the mean diameter of the Aitken mode (Dm,1) and the thinner one that of the accumulation mode (Dm,2). The values at the top of each panel indicate the site-specific variability of the position of the modes, with the italicized text corresponding to Dm,2. The meaning of the abbreviations used for the footprint is the following: RB for rural background and U for urban. Details regarding the calculation of the site-specific variability of the mode characteristics are available in Sect. 5.1.
Figure 10Connection between Ntot and (a) the elevation of the mountain sites and (b) corresponding ABL-TopoIndex in each season. The linear fit between the two variables is shown in each case to further guide the eye, but the strength of the correlation is evaluated based on Spearman's rank correlation coefficient. Statistically significant correlations at the 95 % confidence level are represented by squares, while non-statistically significant correlations (at the 90 % confidence level) are represented by triangles. Observations from RUN and CHC, the two mountains sites located in the Southern Hemisphere, are highlighted by the black circles in the scatter plots.
Figure 11a presents Dcy calculated at the annual scale for the 34 sites that had sufficient data availability (>75 %). To help interpret these results, Fig. 11b additionally shows the seasonal Dcy values calculated for the 11 sites with the highest coverage (>95 % at the annual scale and in turn sufficient data availability in all seasons) previously involved in the sensitivity studies reported in Sect. 4. For DJF, where the 3 months considered are not consecutive, Dcy was calculated in two different ways: first, by proceeding as for the other seasons, as if the 3 months were consecutive, and second, by excluding the calculation of autocorrelation over non-consecutive periods. The results of these two approaches are presented in Fig. 11b, DJF V1 corresponding to the first method and DJF V2 to the second. As a reminder, only the PACF coefficients (between lags 22 and 26) statistically significant at the 95 % confidence level were used in the calculation, which explains why some Dcy values are missing in Fig. 11b. Negative Dcy values were also filtered out, which is why, in particular, the annual Dcy obtained for TRL and JFJ, both negative based on the 2017 data, are not shown in Fig. 11a. As already indicated in Sect. 4.2, these negative values likely have no physical meaning; rather, they most probably result from an alternation of contrasting conditions at the site (e.g. in connection with the dynamics of the ABL at JFJ) or from specific meteorological phenomena (e.g. snow storms at TRL) that impact the average diel cycle of Ntot. It should also be noted that the value reported for ZSF may be affected by the daily absence of data between 11:00 and 22:00 UTC from 15 July onwards at this site.
Contrasting values are observed among polar stations, but the annual Dcy is on average weak at these sites (Fig. 11a), as a likely consequence of the absence of a regular day–night cycle in some seasons and also because there is no strong anthropogenic activity prone to influence Dcy in these pristine environments. As shown in Fig. 11b, Dcy values are in fact mainly reported during the transition seasons, when there is a day–night distinction; although they are less frequent than in summer, NPF events are also observed during this time of the year (e.g. Nieminen et al., 2018), which can contribute to the identified cycles. The average behaviour described by the annual Dcy is therefore of limited value for these polar sites which, in addition to the common characteristics mentioned above, have individual specificities that also affect the diel cycle of Ntot. As mentioned already, this is for example the case for TRL, where the occurrence of snow storms between April and August has a strong impact on the evolution of Ntot.
Overall, higher Dcy values are found at urban and mountain sites (Fig. 11a). In urban conditions, the diel cycle is probably largely influenced by anthropogenic factors that have a strong diurnal variability but, in contrast, limited seasonal variations (e.g. morning and evening traffic rush hours), thus allowing a noticeable regularity of these cycles over the year. Indeed, relatively high Dcy values are observed in all seasons at IPR and LEI-E (Fig. 11b). The lower summer values, observed at both sites, are probably related to a decrease in traffic and increase in ABL height, while domestic heating, which is commonly more intense from October to April, certainly contributes to the identification of more pronounced cycles during these months. At mountain sites, diel cycles of Ntot, like seasonal cycles, are probably largely influenced by ABL dynamics. The continuous influence of the residual or continuous aerosol layer in summer (see Collaud Coen et al., 2018, and references therein for the nomenclature) or, in contrast, the lower ABL heights observed in winter may lead to lower Dcy values during these seasons. This is observed, at least partially, at SNB, where Dcy in SON is higher than the summer and winter Dcy values (Fig. 11b). However, this behaviour is certainly not universal, and the environmental specificities of certain sites (e.g. island station or coastal zone, complex topography) can certainly also constrain the cycles. For example, given the altitude of LLN and its proximity to the ocean, it is possible that at this station the residual layer does not remain or is dispersed by winds during the night in summer, which could lead to higher Dcy values at this time of the year. In addition, we cannot exclude the possibility that enhanced photochemical processes in summer, while contributing (together with increased precursor availability) to favour secondary aerosol formation, might also influence Dcy at these sites.
For the remaining low-altitude sites, Dcy values are observed over a wide range (Fig. 11a), which can probably be explained by the diversity of conditions observed at these sites (e.g. altitude range, nature of the sources, including the proximity to anthropogenic sources). This diversity is reflected by the Dcy values reported in Fig. 11b, which show contrasting seasonal cycles from one site to another.
While the latter analysis highlights some additional contrasts among the different station types, it also indicates that the interpretation of the annual Dcy values must be conducted with caution, in light of the type of station and the possible specificities of certain sites. When the diel cycle is relatively homogeneous throughout the year (e.g. at urban sites), the annual Dcy value describes a real average behaviour, whereas when the natural and/or anthropogenic factors that determine Dcy are highly variable from one season to another (e.g. at polar sites), the annual Dcy value only has a limited value. The complete analysis of Dcy therefore requires a detailed seasonal study, taking into account the environmental characteristics of each site, and could be the subject of a future study using the extended time series available for some stations.
Figure 11(a) Ranking of the stations based on the regularity of the diel cycle (Dcy) of Ntot. (b) Seasonal Dcy calculated for the 11 sites with the highest coverage (>95 %). Polar and mountain sites are shown in the upper panel, and other lowland stations are shown in the lower panel.
As explained in Sect. 3.3, the number concentrations of particles in the ranges of 50–500 (N50) and 100–500 nm (N100) were used as proxies for the number concentration of potential CCN. Since similar trends are obtained for N50 and N100, only the results corresponding to N100 are shown herein (Figs. 12 and 13), while the equivalent observations for N50 are shown in the Supplement (Figs. S7 and S8).
Figure 12 shows the seasonal medians (as well as the first and third quartiles) of N100, while Fig. S7 shows the same for N50. The trends observed for the different station types are similar to what was highlighted for Ntot. The lowest concentrations are again obtained for the polar sites, with medians for N100 on the order of ∼ 10 to a few hundred particles, which is on average lower than the values obtained at mountain and other non-urban lowland sites (∼ 100–1000 cm−3) and, more importantly, at urban sites (∼ 1000 cm−3). Similar orders of magnitude are obtained for N50 but with concentrations that are slightly higher due to the contribution of particles between 50 and 100 nm in diameter. As in the case of Ntot, there is some variability within each station type, and this seems to be more pronounced for mountain (e.g. JFJ vs. CHC) and polar sites. Although based on a reduced number of sites, such intra-station type variability has also been shown by the direct measurements of the CCN number concentration reported by Schmale et al. (2018). With respect to the seasonal variations in N50 and N100, there are again similarities with what was obtained for Ntot. In particular, we observe clear cycles for polar and mountain sites, almost non-existent cycles for urban sites, and a range of patterns for the remaining sites according to their characteristic footprint (e.g. stronger variations at forest compared to rural background lowland sites). There are, however, small differences to the results obtained for Ntot, particularly in the magnitude of the contrasts, which are probably related to the variability of the contributions of N100 and N50 to Ntot in the different seasons, as demonstrated for example by Jurányi et al. (2011) at JFJ.
In order to further address this aspect, Fig. 13 (and S8) presents the relationship between N100 (or N50) and Ntot for the stations which had sufficient data availability in all seasons (i.e. >50 %, see Fig. 2) and separately for the four station types discussed so far. Given the high number of points, raster graphs are used instead of standard correlation plots; on these graphs, the colour of each pixel indicates the number of data points (hourly averages) falling into its area (all pixels have an equal area on a log–log scale). The linear fit performed on the logarithm of the variables is also presented for the whole dataset and for each season separately. The logarithm is used here because it allows a more immediate visualization of the contribution of N100 (or N50) to Ntot and its variability; the fit equations and corresponding coefficients of determination are reported in Table 2 (and Table S3). Statistics of the ratio between N100 (or N50) and Ntot are in addition reported for each station type and period (year and seasons). Note that in order to allow and facilitate comparison of sites located in different hemispheres, local seasons are considered in this final analysis. Finally, as a complement to the distinction between seasons, Fig. S9 presents the scatter plots of N100 and N50 as a function of Ntot for polar, mountain and the remaining non-urban sites, this time highlighting the different footprints present in each class of sites.
As shown in Fig. 13, N100 represents from a few tenths of a percent to almost all of Ntot. The median annual contributions of N100 to Ntot are comparable at polar, urban and mountain sites (∼ 19 %), while being slightly higher at other lowland sites (∼ 26 %). The lowest contributions are observed during fall at polar sites, particularly at the two sites PAL and VAR located in the Northern Hemisphere, and during winter at mountain sites (Fig. 13a and d). These observations might be, at least partly, related to increased frequency of cloud occurrence during these seasons. This is for instance the case at PAL, where low clouds (below 1000 m) are more often seen during fall (Komppula et al., 2005), or at PUY, where the frequency of cloud occurrence is on the order of 60 % in winter compared to 24 % in summer (Baray et al., 2019). In cloudy conditions, the sampling efficiency of activated particles may be lower than that of smaller interstitial particles or even not possible in the absence of a whole air inlet (e.g. PAL), thus leading to an artificial shift of the PNSD towards lower sizes. In contrast, the highest ratios between N100 and Ntot are observed during summer at these sites, when clouds are less prevalent and the transport (in connection to ABL dynamics at mountain sites) of CCN-sized particles is the most favoured (e.g. Croft et al., 2016; Herrmann et al., 2015). We cannot exclude, however, the possibility that efficient wet deposition, reported to reduce accumulation mode particles at some Arctic sites (Croft et al., 2016), could lead to observations specific to these sites, possibly contrasting with the average picture shown in Fig. 13a. At lowland sites other than polar, higher contributions of N100 to Ntot occur during winter, when the presence of small particles in connection with NPF is less frequent and additional sources of larger particles, such as residential heating, are in contrast more intense. At urban stations, the 75th percentile of the ratio between N100 and Ntot is on average lower compared to other station types, likely reflecting the significant contribution of traffic-related sub-100 nm particles to Ntot in all seasons (see Sect. 5.2.2).
The contributions of N50 to Ntot are logically higher than those of N100, systematically above a few percent and up to ∼ 100 % for all station types, being on average twice as high at the annual scale (Fig. S8). Similar trends to those obtained for N100 are observed, with, in particular, close median annual contributions for polar, urban and mountain stations (43 %–48 %) and slightly higher contributions at other lowland sites (∼ 55 %). We also find the same hierarchy of footprints within a station type (Fig. S9) as well as the same seasonal characteristics for the different station types. The winter maximum of the ratio between N50 and Ntot is however less marked than in the case of N100 at lowland sites other than polar, supporting the existence of an additional source of particles larger than 100 nm in winter compared to other seasons at these stations. The signature of traffic, which is a permanent source of sub-100 nm and, in particular, sub-50 nm particles (e.g. Pey et al., 2009) is again visible at urban sites, with the 75th percentile of the ratio between N50 and Ntot being lower than for the other sites. The stronger connection between N50 and Ntot is also reflected in the higher coefficients of determination associated with the linear fits (Tables 2 and S3).
A feature common to all types of sites is the almost constant contribution of N100 and N50 over the whole range of Ntot in winter and fall, reflected by the slopes close to 1 obtained for all the corresponding fits (slopes between 0.86 and 1.05 for N100 and between 0.92 and 1.03 for N50; see Tables 2 and S3, respectively). For all the lowland sites, the contribution of N100 to Ntot is generally lower for the highest Ntot values in spring (slopes between 0.64 and 0.78), with the strongest contrast observed for the polar sites. This is also the case in summer for lowland stations other than polar and is probably related to the more important contribution to Ntot of small particles originating from NPF, particularly favoured during these seasons (Nieminen et al., 2018). Logically, the same trend is observed for N50 but in a less pronounced way (slopes between 0.70 and 0.90 at lowland sites during spring), since the probability that NPF particles contribute to N50 is higher than N100. The fits obtained for polar stations in summer have slopes approaching 1 (0.91 for N100 and 0.99 for N50), indicating rather constant contributions of N100 and N50 to Ntot over the whole range of Ntot in this season as well. This is also the case for mountain sites, where, both during spring and summer, the slopes of the corresponding fits are even closer to 1 than during winter and fall (0.94 and 0.97 for N100 for spring and summer, respectively, and 0.95 and 0.94 for N50).
This last analysis, focused on the largest particles of the spectrum, makes it possible to obtain an estimate of the concentration of potential CCN based solely on the knowledge of the PNSD. According to the previous results, an estimate of the CCN-sized particle concentration may even be deduced from the knowledge of Ntot only in some seasons, when the contributions of N100 and N50 are observed to be constant over the whole range of Ntot. However, while such a simple approach assuming that all particles larger than a given activation diameter are potential CCN was reported to lead to reasonable results at JFJ (Jurányi et al., 2011), a more precise analysis would require information on other parameters that impact the activation diameter, such as the hygroscopicity of the sampled particles for each site, which probably varies seasonally according to the nature of the particles, the total number of activated particles, which reduces the supersaturation, and the updraught velocity (Schmale et al., 2018).
Figure 12Seasonal statistics of N100, the particle number concentration in the range of 100–500 nm, used as a proxy for potential CCN population. The bars represent the median of N100, and the lower and upper ends of the error bars represent the first and third quartiles of the data, respectively. Stations are sorted based on the classification reported in Table 1. The meaning of the abbreviations used for the footprint is the following: RB for rural background and U for urban.

Figure 13Scatter plots of N100 as a function of Ntot (hourly averages) for the different station types: (a) polar sites, (b) urban sites, (c) other lowland sites and (d) mountain sites. The colour of each pixel indicates the number of data points (hourly averages) falling into its area (all pixels have equal area on a log–log scale). The linear fit performed on the logarithm of the data, separately for each period (year and seasons), is also presented. The statistics of the ratio between N100 and Ntot calculated for each of these periods are in addition shown for each station type in the insert of the corresponding panel; the markers represent the median of the ratios, and the lower and upper limits of the error bars indicate the first and third quartiles, respectively.
Table 2Connection between N100, the particle number concentration in the range of 100–500 nm, used as a proxy for the CCN population, and Ntot. For each station type and season, the equation of the linear fit performed on the logarithm of the data is reported in the second column, and the corresponding coefficient of determination in the third column. Note that based on the corresponding p values, all correlations were found to be significant at the 95 % confidence level (p<0.05).

This study, based on data collected at 62 sites around the world, provides the most up-to-date picture of the spatial distribution of aerosol concentration and particle number size distribution. Specifically, 38 more stations than previously considered in Asmi et al. (2011) were included, and all WMO regions were covered. However, as noted earlier in Laj et al. (2020), there is a strong bias in the world data coverage, with a majority of stations located in Europe (39 sites) and North America (10) and a lack of observations in other regions, in particular in Africa (2), Asia (4) and South America (1). Analysis of the spatial distribution of the sites in relation to their classification also reveals certain limitations. For instance, all urban stations are located in Europe, and there is a clear lack of data on deserts; considering oceans cover >70 % of Earth, it can certainly be considered that there is a lack of marine observations as well. A final bias concerns the type of data collected at these sites, with most of the MPSS allowing PNSD monitoring located in Europe (34 sites out of 39), while elsewhere a CPC is the dominant instrument.
The first objective of this study was to assess the impact of data availability on Ntot's annual and seasonal statistics (median, 25th and 75th percentiles), in order to determine a threshold for a reasonable compromise between the number of statistics included and their quality. To do this, the absence of data was simulated in the Ntot time series of the stations with data availability greater than 95 % over the year (11 sites). It appears that the lack of individual hourly averages has, for comparable coverage, less impact on the statistics than long periods of missing data. However, although there are differences from one station to another, in particular with a more pronounced effect at polar sites and also from one season to another, it appears overall that seasonal statistics are only slightly impacted when the corresponding data availability remains above 50 % in the reduced datasets. At the annual level, a slightly higher coverage, 60 %, is necessary to maintain the representativeness of the statistics. An availability of 75 % year-round was required for the study of the diel cycle of Ntot, which appears to be more sensitive to the data coverage and also to missing individual data points (as opposed to long consecutive data gaps).
The analysis of Ntot reveals few common behaviours amongst all sites. In particular, it appears that higher concentrations are often observed in spring and summer, as a likely result of enhanced emission sources and/or favoured formation processes (in connection with ABL dynamics at mountain stations) and possibly reduced particle sinks at some sites. Also, the first log-normal mode fitted to the PNSD, which is a combination of the usual nucleation and Aitken modes, is wider than the second (accumulation) mode at all sites, and most of the time it dominates the distribution. With the exception of polar sites, where the characteristics of the Aitken mode show a particularly pronounced variability, the concentration of this first mode is also less variable from one season to another than that of the second mode; its location is in contrast more variable for all station types except urban. Beyond these common features, however, there are notable differences among sites. Among other factors (including the nature and the proximity of the aerosol sources), the level of anthropogenic influence seems to strongly impact the observations and contributes significantly to the contrasting patterns observed for the different station types.
The lowest concentrations, on the order of 102 cm−3, are observed at polar sites but with significant annual variability resulting from both marked seasonal contrasts and significant intra-seasonal variability at some sites. The PNSD is mostly bimodal, especially in the Northern Hemisphere, but also shows a strong seasonal contrast and reflects the specificities of each site (e.g. impact of Arctic haze on summer measurements at ZEP). The diel cycle is, on average, weak at polar sites, probably as a consequence of the absence of a regular day–night cycle in some seasons and also because there is no strong anthropogenic activity likely to influence it in these pristine environments.
In contrast to the polar sites, stations located in urban areas, both continental and coastal, exhibit the highest Ntot, with yearly medians in the range of 103–104 cm−3. Due to limited intra-seasonal variability and low seasonal contrast, the variability of Ntot is overall less pronounced at these sites. The weak seasonality of Ntot is associated with minimal changes in the PNSD, which are almost unimodal throughout the year and shifted towards the lower end of the investigated size range at a majority of stations, with elevated concentrations of sub-100 nm particles. In contrast, the diel cycle of Ntot is pronounced for these sites, reflecting the significant impact of anthropogenic activities on the measurements.
The remaining sites, including mountain and non-urban continental and coastal stations, do not exhibit as clear a common behaviour as polar and urban sites and display, on average, intermediate Ntot, with yearly medians on the order of 102–103 cm−3. Particle concentrations measured at mountain sites tend to be lower compared to nearby lowland sites, with more pronounced seasonal variations, but there is overall little difference between the geographical categories. The signature of the dominant footprints is in contrast more pronounced, with lower concentrations measured in forested areas or at stations influenced by air masses of various origins (“mixed”) compared to rural background sites.
Particle number concentrations measured at non-urban continental and coastal sites are overall lower compared to those observed at urban stations but exhibit comparable variability, as a result of both limited intra- and inter-seasonal variability. The stations located in forested areas, however, show more noticeable variations and are also distinguished by the shape of their PNSDs, which tend to have a more pronounced bimodal behaviour compared to rural background stations. The modes representative of the distributions measured at non-urban sites peak at the largest diameters among all station types, with the most important shift to larger diameters being observed at coastal sites (AMY and FKL). The diel cycle of Ntot is overall less marked at these sites compared to urban stations.
Observations from mountain stations are influenced by the site topography and environs, which, coupled with the variations in the ABL height, largely explain the significant intra- and inter seasonal contrasts observed at these sites, as well as the pronounced diel cycle of Ntot. The PNSD measured at mountain sites exhibit a stronger bimodal behaviour compared to lowland stations (other than polar) but with noticeable differences from site to site. Features comparable to those of lowland rural background continental sites are observed for the two mountain stations located below 1000 m a.s.l. (MSY and HPB).
Furthermore, the specific analysis of the CCN-sized particle number concentration (i.e. >50–100 nm, referred to as N50 and N100) indicates that these particles of climatic importance can represent between a few percent and almost all of Ntot, with seasonal medians on the order of ∼ 10 to 1000 cm−3 depending on the site and season. The trends observed for N50 and N100, including the classification of the station types according to concentration levels and the existence of seasonal contrasts, are overall similar to those observed for Ntot. Differences are however observed, particularly in the magnitude of the contrasts, due to the variability of the contributions of N100 and N50 to Ntot, themselves tightly connected to the variability of the particle sources in the different seasons.
By comparing and contrasting observations that characterize the different station types, this study shows the importance of collecting data in various environments and therefore highlights the need to increase the monitoring spatial coverage in certain regions and/or environments in the future. The need for harmonized protocols for data acquisition and quality control, as well as ease of access and availability, clearly indicates the interest in developing these observations within networks and/or distributed research infrastructures. Operating in the context of a network may also promote the sustainability of the observations, necessary to capture the seasonal contrasts characteristic of certain station types or, more importantly, for the evaluation of long-term trends. Such a trend study of Ntot will be carried out for the sites with sufficiently long time series (>10 years) and will be reported in a separate paper.
The results of this study, which cover a variety of environments across all WMO regions, also provide valuable, freely available and easy to use support to the modelling community to perform model comparison and validation with respect to particle number concentration and size distribution. In particular, a sufficiently accurate description of these aerosol properties is a crucial step towards an improved representation of aerosol–cloud interactions in models and, therefore, better evaluation of their effect on climate.
Table A1Parameters of the modes identified for the description of the median particle number size distributions measured at the stations equipped with an MPSS. Nm, σm and Dm are the number concentration, the geometric standard deviation and the geometric mean dry diameter of the mode, respectively. R2 is the coefficient of determination between observed and fitted size distributions. The results are reported separately for each season.
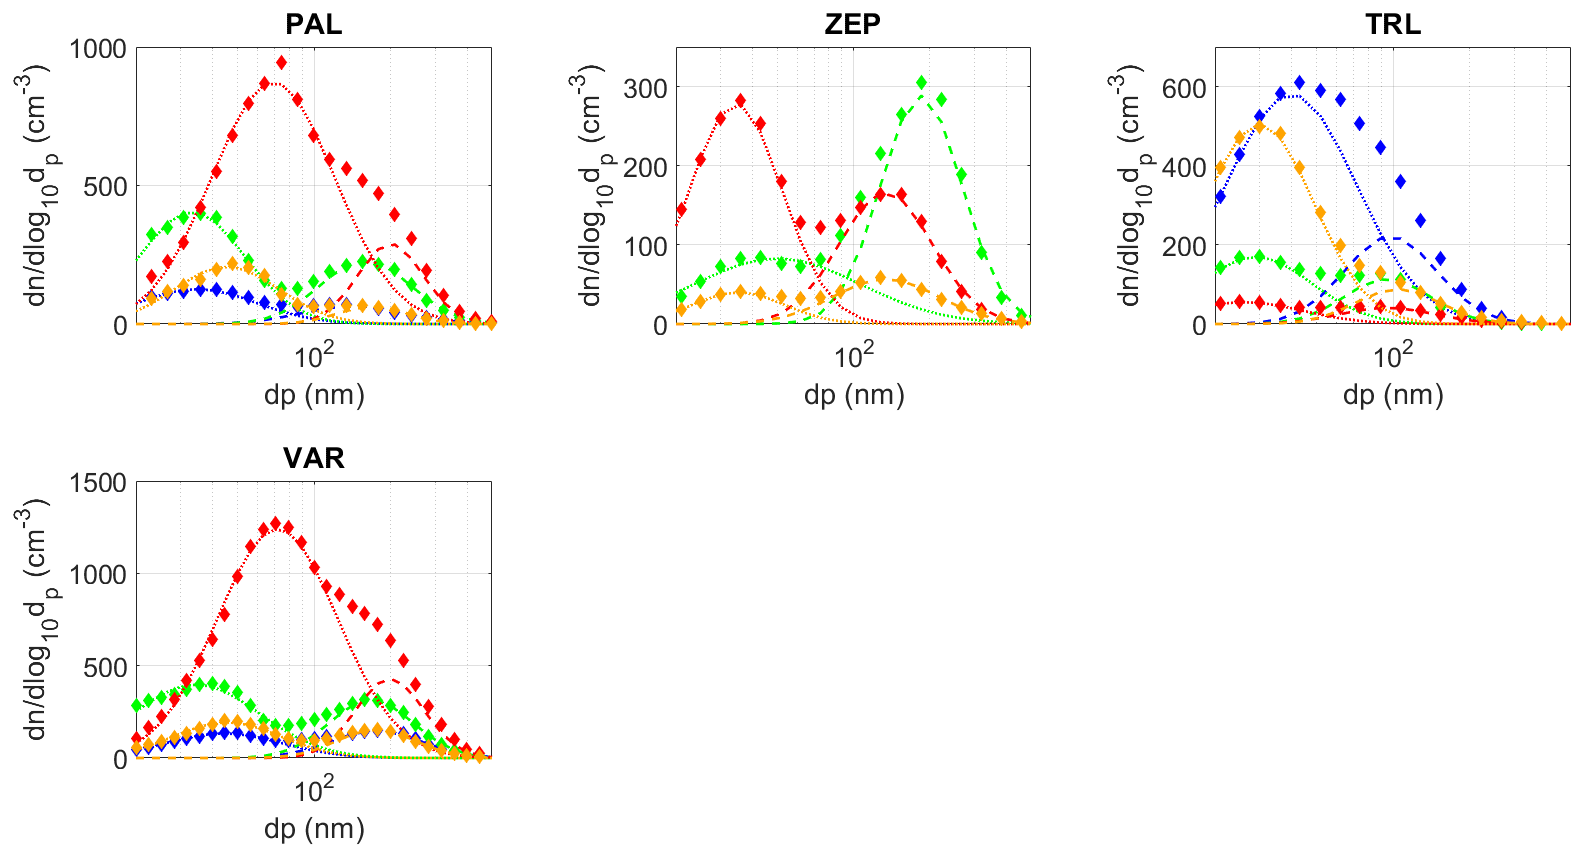
Figure A1Median particle size distributions (diamonds) and corresponding modes (dotted lines) at polar sites. Blue lines and markers correspond to DJF, green lines and markers to MAM, red lines and markers to JJA, and orange lines and markers to SON.
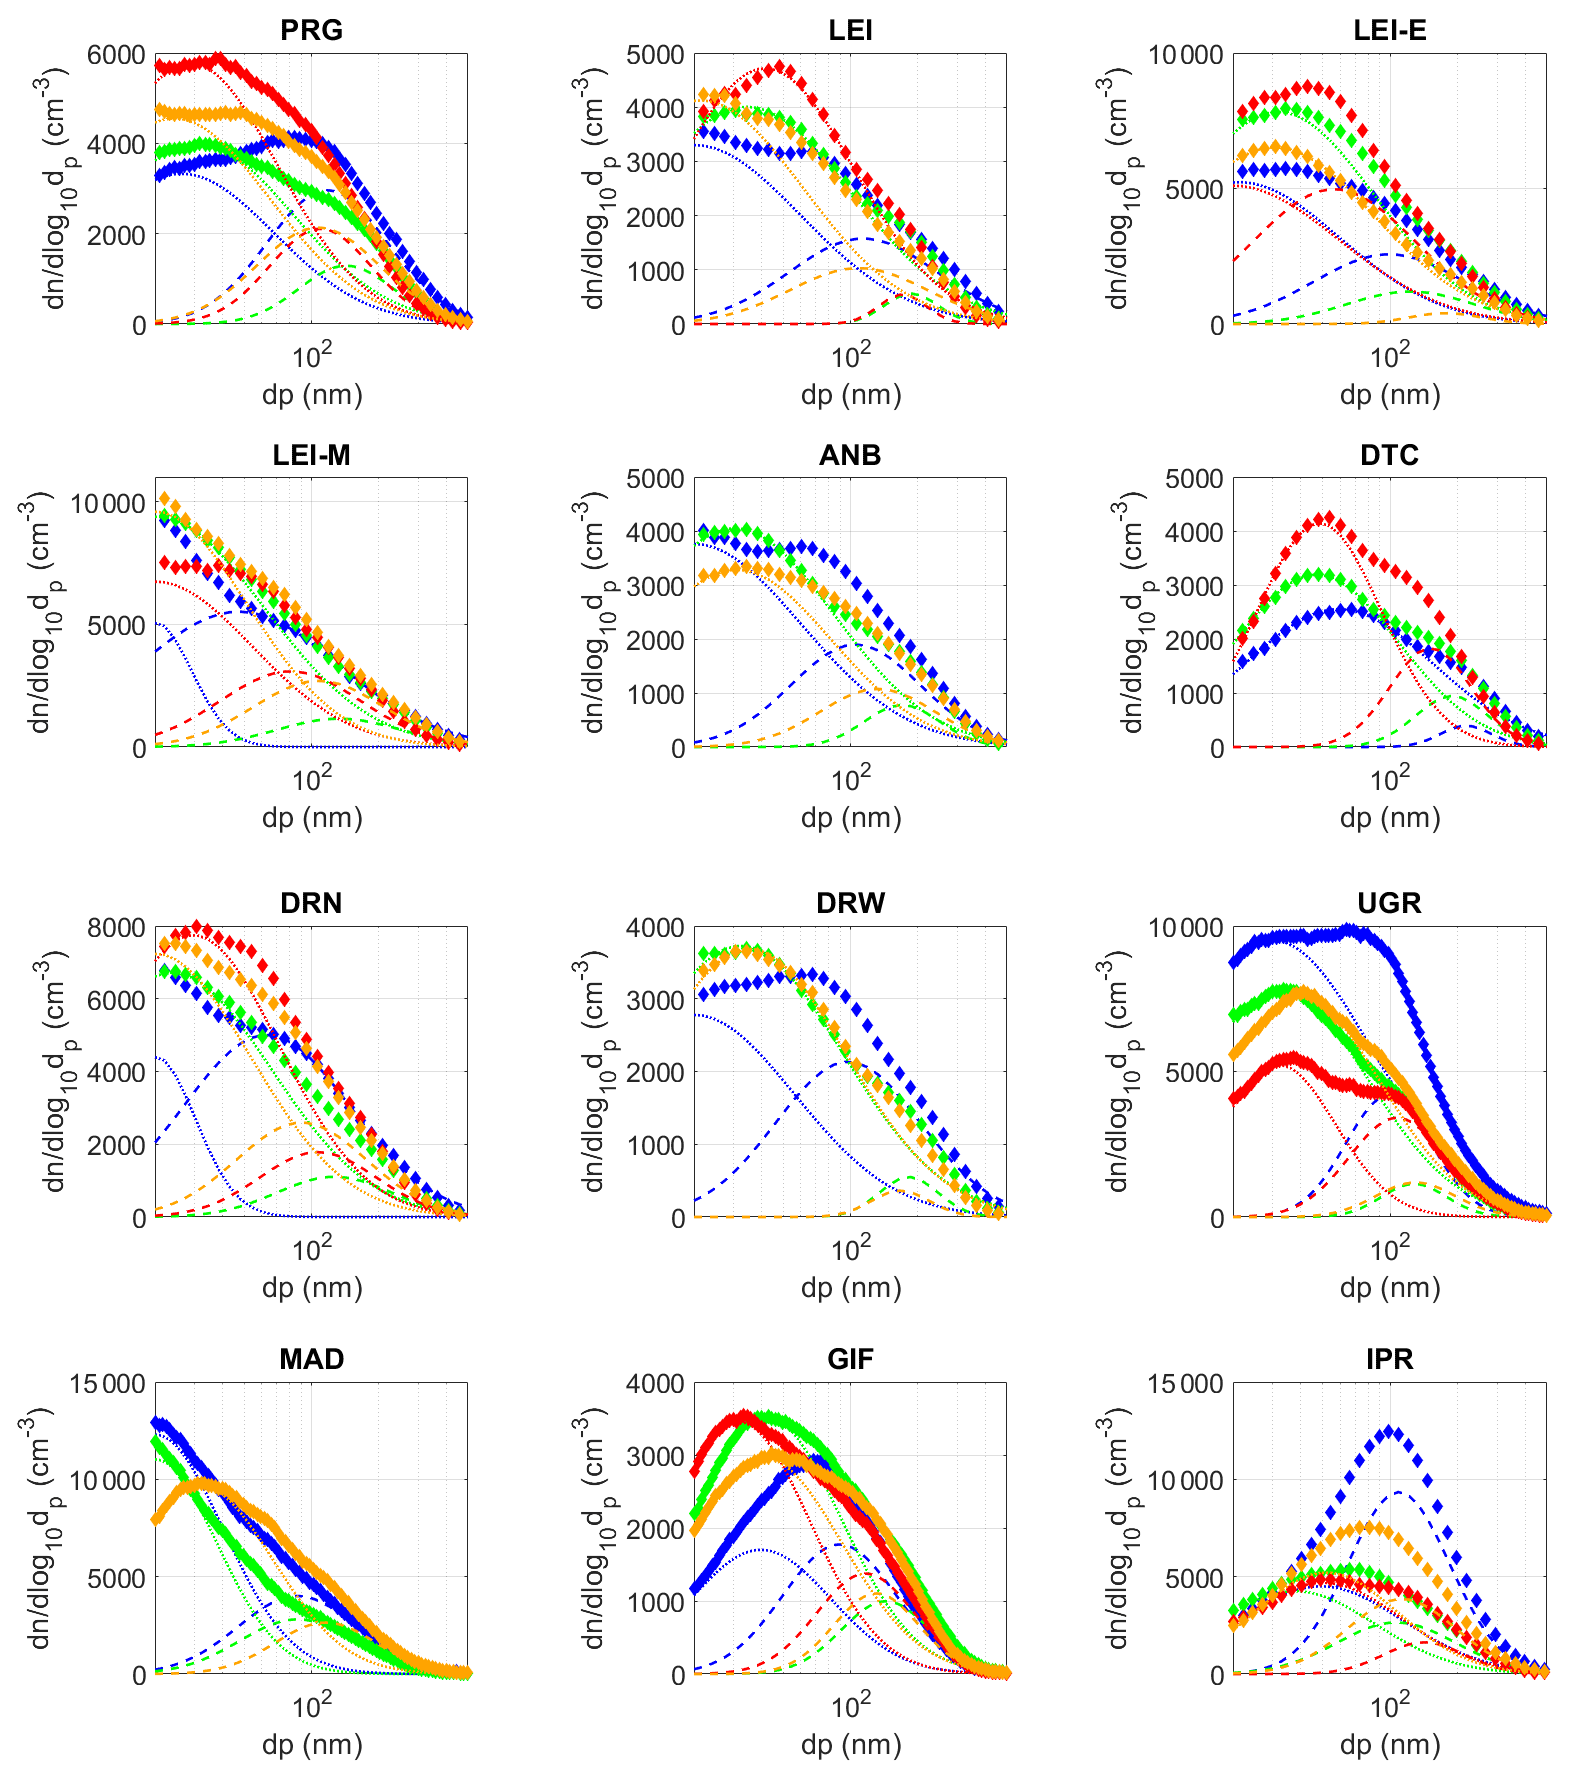
Figure A2Median particle size distributions (diamonds) and corresponding modes (dotted lines) at urban continental sites. See Fig. A1 for an explanation of the symbols.
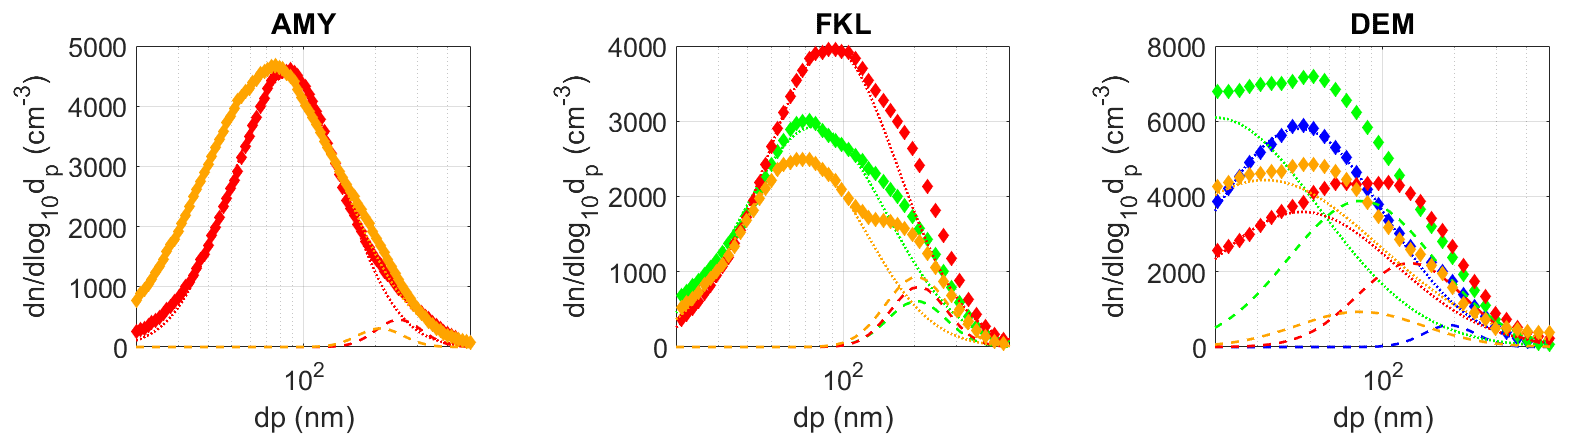
Figure A3Median particle size distributions (diamonds) and corresponding modes (dotted lines) at coastal sites. See Fig. A1 for an explanation of the symbols.
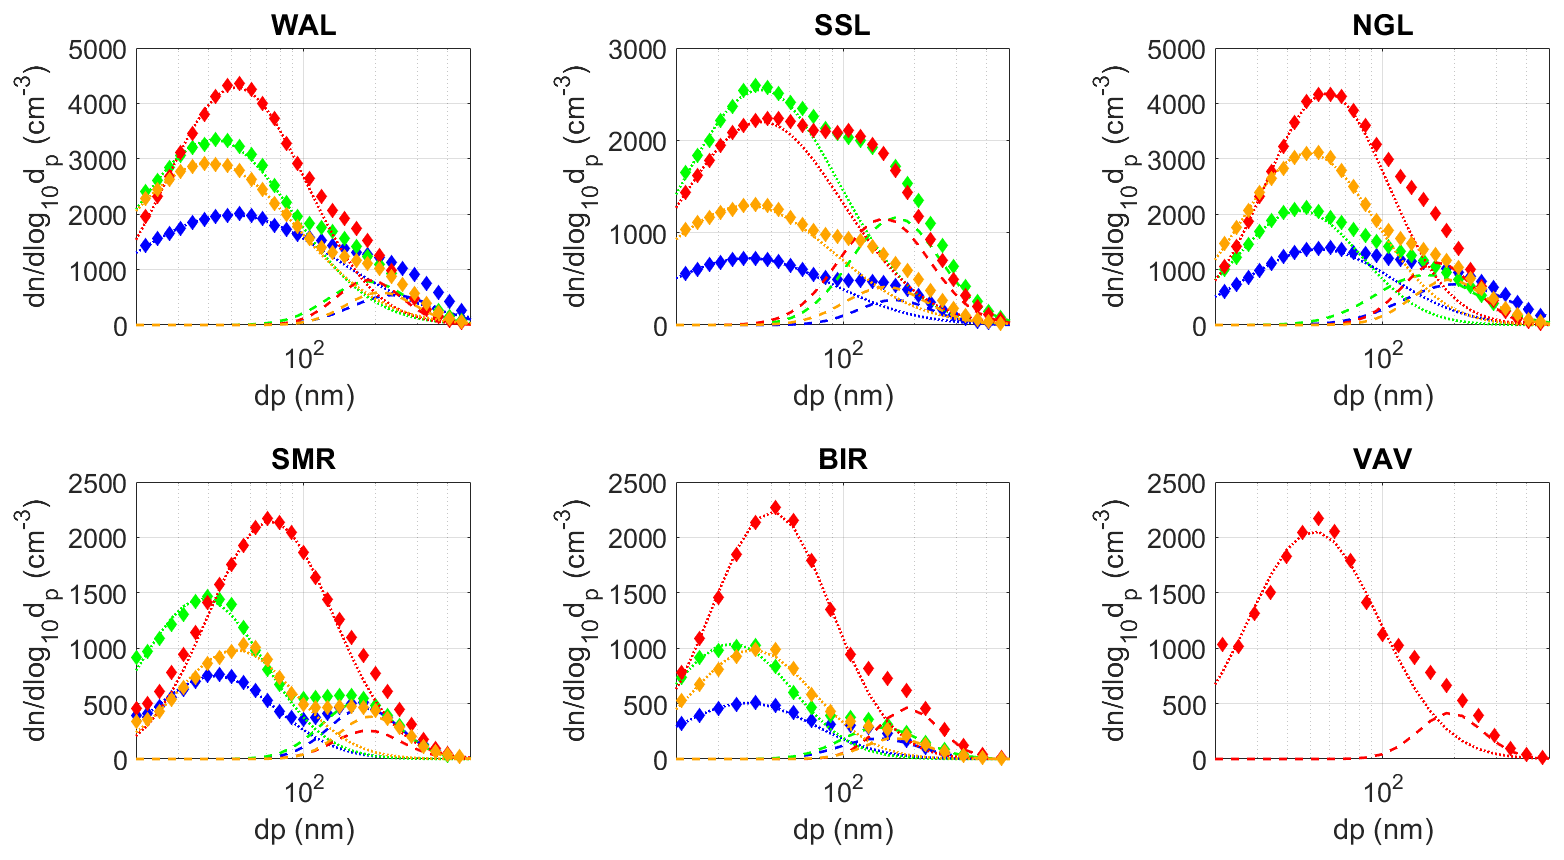
Figure A4Median particle size distributions (diamonds) and corresponding modes (dotted lines) at forest continental sites. See Fig. A1 for an explanation of the symbols.

Figure A5Median particle size distributions (diamonds) and corresponding modes (dotted lines) at rural background continental sites. See Fig. A1 for an explanation of the symbols.
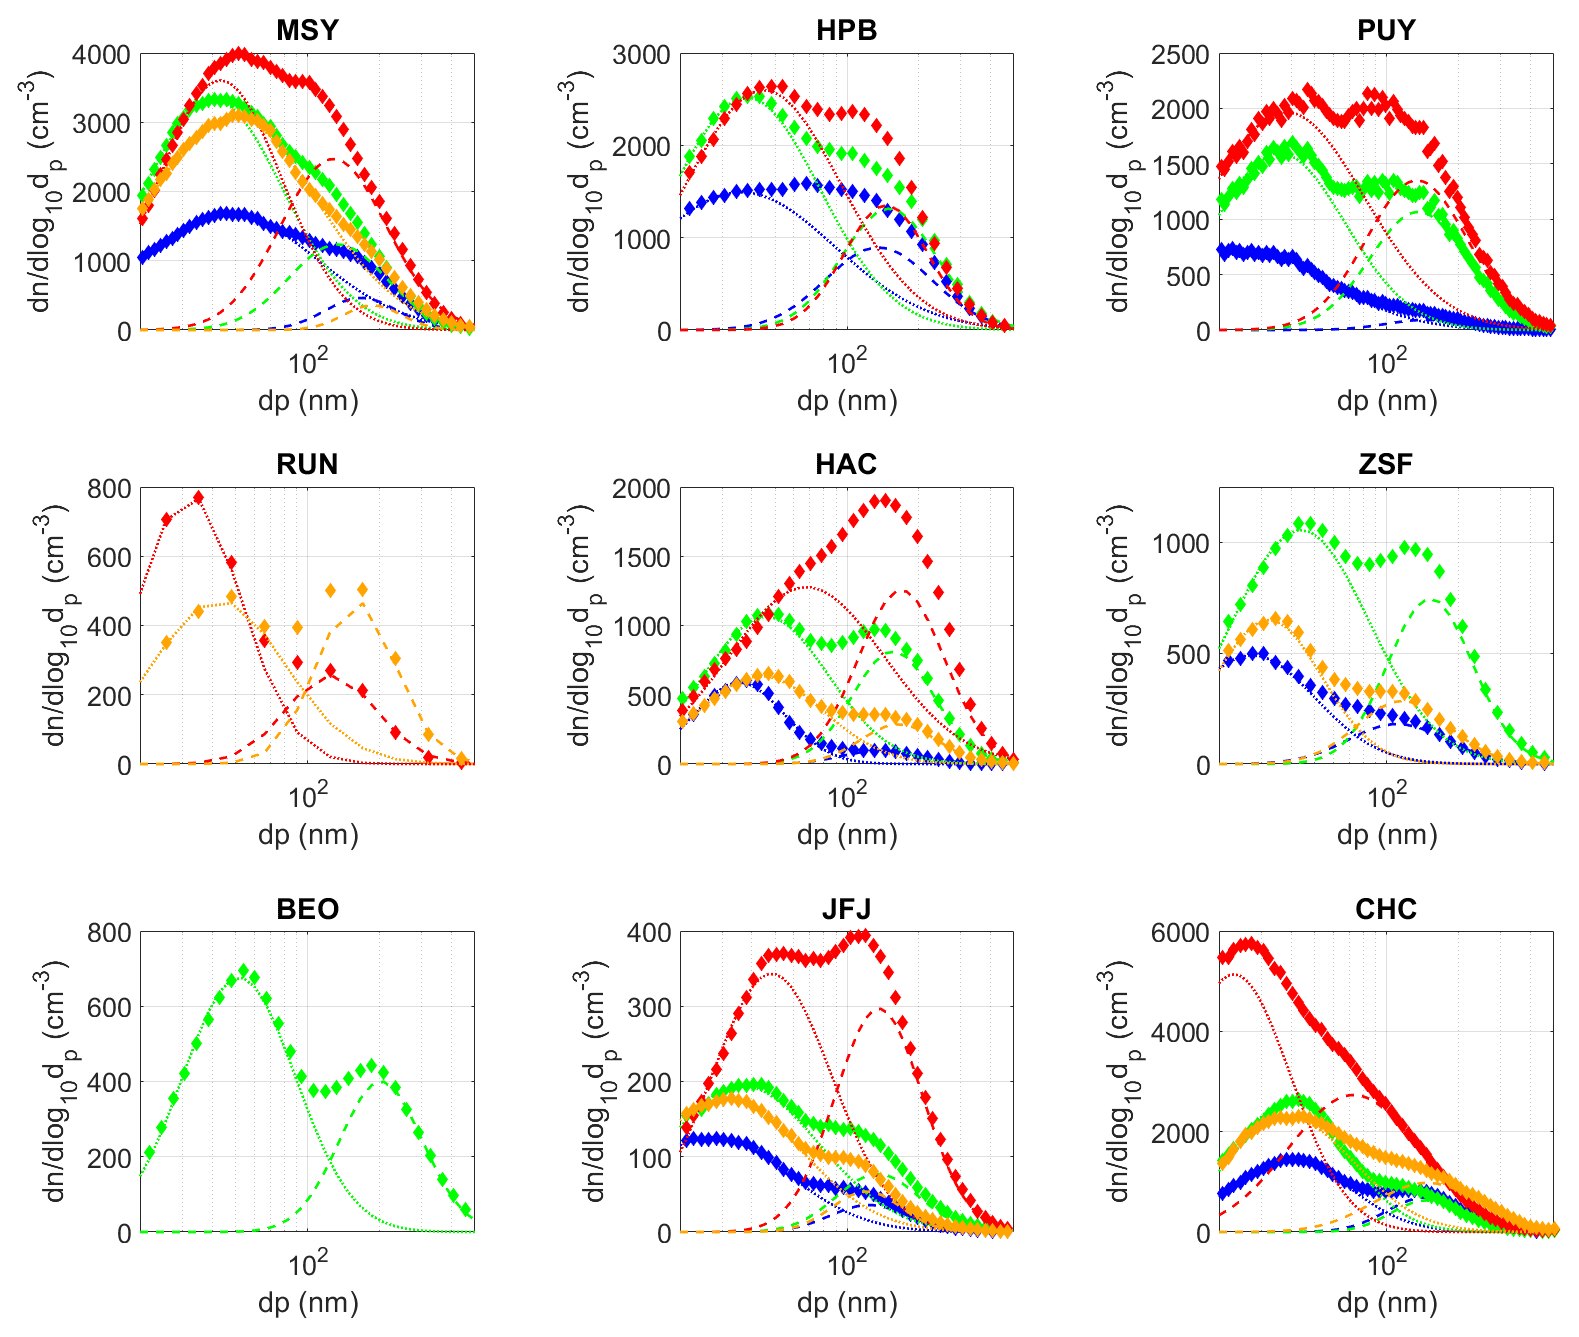
Figure A6Median particle size distributions (diamonds) and corresponding modes (dotted lines) at mountain sites. See Fig. A1 for an explanation of the symbols.
Data are freely available at https://doi.org/10.21336/gen.sg1y-ay21 (Rose et al., 2021).
The supplement related to this article is available online at: https://doi.org/10.5194/acp-21-17185-2021-supplement.
CR, MCC, EA and PL defined the concept and methodology of the paper. Curation of data was done by CLM, YL and MF as part of the duties of the World Data Center for Aerosols. IB provided support in data analysis, and the formal analysis of datasets was done by CR, MCC and EA. The original draft was written by CR, while EA, MCC, PL, KS, JPP, UB, MG, OF, JPB, VV, EAB, JACV, MS, SWK, JS, HL, YL, MA RW and IB participated in the scientific discussion and contributed to reviewing and editing the paper. All the authors have contributed to the necessary funding for the provision of data used in the paper.
The authors declare that they have no conflict of interest.
Publisher’s note: Copernicus Publications remains neutral with regard to jurisdictional claims in published maps and institutional affiliations.
NOAA base funding supports the observatories BRW, BND, MLO, SMO, SPO and THD, where efforts of the dedicated observatory staff and of programmer Derek Hageman are appreciated. BRW observations are also supported in part by the Atmospheric Radiation Measurement (ARM) user facility, a US Department of Energy (DOE) Office of Science user facility managed by the Biological and Environmental Research programme.
Measurements at Welgegund are supported by North-West University, the University of Helsinki and the Finnish Meteorological Institute. This publication also forms part of the output of the Biogeochemistry Research Infrastructure Platform (BIOGRIP) of the Department of Science and Innovation of South Africa.
Pallas and SMEAR II are grateful for the support of the Academy of Finland Centre of Excellence programme (project no. 272041), the Academy of Finland project Greenhouse gas, aerosol and albedo variations in the changing Arctic (project no. 269095), and the Novel Assessment of Black Carbon in the Eurasian Arctic: From Historical Concentrations and Sources to Future Climate Impacts (NABCEA, project no. 296302).
Aerosol measurements at Anmyeon-do were supported by the Korea Meteorological Administration Research and Development Program “Development of Monitoring and Analysis Techniques for Atmospheric Composition in Korea” under grant KMA2018-00522. Measurements at Gosan were supported by the National Research Foundation of Korea (2017R1D1A1B06032548) and the Korea Meteorological Administration Research and Development Program under grant KMI2018-01111.
The Lulin station is operated under the grants funded by the Taiwan Environmental Protection Administration.
WLG is supported by the China Meteorological Administration, where efforts of the dedicated observatory staff are appreciated.
Sites PDM, PUY, GIF, CHC and RUN are partially operated with the support of CNRS-INSU under the long-term observation programme and the French Ministry for Research under the ACTRIS-FR national research infrastructure. PDM and GIF received specific support from the French Ministry of the Environment. ATMO Occitanie is mentioned for sampling operations at PDM. Measurements at SIRTA are hosted by CNRS and by the alternative energies and atomic energy commission (CEA) with additional contributions from the French Ministry of the Environment through its funding to the reference laboratory for air quality monitoring (LCSQA). PUY is grateful for support from ATMO Auvergne Rhône Alpes for sampling operations and the support from the personnel of the Observatoire de Physique du Globe de Clermont-Ferrand (OPGC). The specific support of the Institut de Recherche et Développement (IRD) in France and the Universidad Mayor de San Andrés in Bolivia support operations at CHC operations.
The Steamboat Ski Resort provided logistical support and in-kind donations for SPL. The Desert Research Institute is a permittee of the Medicine Bow–Routt National Forests and an equal opportunity service provider and employer. SPL appreciates the extensive assistance of the NOAA/ESRL Federated Aerosol Network, of Ian McCubbin, site manager of SPL, and of Ty Atkins, Joe Messina, Dan Gilchrist and Maria Garcia, who provided technical assistance with the maintenance and data quality control for the aerosol instruments.
SGP measurements/mentorship were supported by DOE-7F-30118 and staff on site.
The Cape Grim Baseline Air Pollution Monitoring Station is grateful to the Australian Bureau of Meteorology for their long-term and continued support and all the staff from the Bureau of Meteorology and CSIRO, who have contributed to the generation of records reported here.
The aerosol measurements at the Jungfraujoch were conducted with financial support from MeteoSwiss (GAW-CH aerosol monitoring programme) and from the European Union as well as the Swiss State Secretariat for Education, Research and Innovation (SERI) for the European Research Infrastructure for the observation of Aerosol, Clouds and Trace Gases (ACTRIS). The International Foundation High Altitude Research Station Jungfraujoch and Gornergrat (HFSJG) is mentioned for providing the research platform at the Jungfraujoch.
The aerosol measurements at Kosetice received funding from the European Union's Horizon 2020 research and innovation programme under grant agreement no. 654109 and from the project for support of the national research infrastructure ACTRIS – participation of the Czech Republic (ACTRIS-CZ – LM2015037) supported by the Ministry of Education, Youth and Sports of CR within National Sustainability Program I (NPU I), grant agreement no. LO1415. The measurements were also supported by ERDF “ACTRIS-CZ RI” (no. CZ.02.1.01/0.0/0.0/16_013/0001315).
Measurements at the Madrid site were funded by the following projects: CRISOL (CGL2017–85344-R MINECO/AEI/FEDER, UE), TIGAS-CM (Madrid Regional Government Y2018/EMT5177), AIRTEC-CM (Madrid Regional Government P2018/EMT4329), REDMAAS2020 (RED2018-102594-T CIENCIA) and Red de Excelencia ACTRIS-ESPAÑA (CGL2017-90884-REDT). Measurements at Montsec and Montseny were supported by the Spanish Ministry of Economy, Industry and Competitiveness and FEDER funds under project HOUSE (CGL2016-78594-R) and by the Generalitat de Catalunya (AGAUR 2017 SGR41 and the DGQA). Aerosol measurements at El Arenosillo Observatory are supported by the National Institute for Aerospace Technology and by different R&D projects of the Ministerio Español de Economía, Industria y Competitividad (MINECO). Aerosol measurements at UGR are supported by the Spanish Ministry of Economy and Competitiveness through projects no. CGL2016-81092-R, CGL2017-90884-REDT, RTI2018-097864-B-I00 and PGC2018-098770-B-I00 and by the Andalusia Regional Government through project no. P18-RT-3820.
FKL, HAC and DEM are grateful for funding by project PANhellenic infrastructure for Atmospheric Composition and climate change (MIS 5021516), which is implemented under action Reinforcement of the Research and Innovation Infrastructure, funded by operational programme Competitiveness, Entrepreneurship and Innovation (NSRF 2014-2020) and co-financed by Greece and the European Union (European Regional Development Fund).
CPC measurements at Sonnblick are supported by the Climate and Air Quality Commission of the Austrian Academy of Sciences and the office of the provincial government Salzburg, Unit 5/02.
At CMN, aerosol measurements were partially supported by the Italian Ministry of Research and Education.
Measurements at Birkenes II are financed by the Norwegian Environment Agency.
VAV is grateful for various Swedish FORMAS, Swedish Research Council (VR) grants and the Magnus Bergvall and Märta och Erik Holmberg foundations and the Swedish EPA for making the research possible at the VAV site.
NMY wishes to thank the many technicians and scientists of the Neumayer overwintering crews, whose outstanding commitment enabled continuous, high-quality aerosol records over many years.
Gunter Löschau is acknowledged for his contribution to the data acquisition at ANB, DTC and DRN.
This research was supported by the European Commission's Horizon 2020 Framework Programme (ACTRIS2 (grant agreement no. 654109)), the University of Helsinki, the Finnish Meteorological Institute, the Department of Science and Innovation of South Africa, the Academy of Finland Centre of Excellence programme (project no. 272041), the Academy of Finland project Greenhouse gas, aerosol and albedo variations in the changing Arctic (project no. 269095), the Novel Assessment of Black Carbon in the Eurasian Arctic: From Historical Concentrations and Sources to Future Climate Impacts (NABCEA, project no. 296302), the Korea Meteorological Administration Research and Development Program “Development of Monitoring and Analysis Techniques for Atmospheric Composition in Korea” (grant no. KMA2018-00522), the National Research Foundation of Korea (grant no. 2017R1D1A1B06032548), the Korea Meteorological Administration Research and Development Program (grant no. KMI2018-01111), the Taiwan Environmental Protection Administration, the China Meteorological Administration, the National Scientific Foundation of China (41675129, 41875147), the National Key R&D Program of the Ministry of Science and Technology of the People's Republic of China (grant no. 2016YFC0203305 and 2018YFC0213204), the Chinese Academy of Meteorological Sciences (2020KJ001), the Innovation Team for Haze-fog Observation and Forecasts of MOST and CMA, CNRS-INSU, the French Ministry for Research under the ACTRIS-FR national research infrastructure, the French Ministry of the Environment, MeteoSwiss (GAW-CH aerosol monitoring programme), the Swiss State Secretariat for Education, Research and Innovation (SERI), the Ministry of Education, Youth and Sports of CR within National Sustainability Program I (NPU I, grant no. LO1415), ERDF “ACTRISCZ RI” (grant no. CZ.02.1.01/0.0/0.0/16_013/0001315), CRISOL (CGL2017-85344-R MINECO/AEI/FEDER, UE), TIGAS-CM (Madrid Regional Government Y2018/EMT-5177), AIRTEC-CM (Madrid Regional Government P2018/EMT4329), REDMAAS2020 (RED2018-102594-T CIENCIA), Red de Excelencia ACTRIS-ESPAÑA (CGL2017-90884-REDT), the Spanish Ministry of Economy, Industry and Competitiveness, FEDER funds (project HOUSE, grant no. CGL2016-78594-R), the Generalitat de Catalunya (AGAUR 2017 SGR41 and the DGQA), the National Institute for Aerospace Technology, the Ministerio Español de Economía, Industria y Competitividad (MINECO), the Spanish Ministry of Economy and Competitiveness (projects no. CGL2016-81092-R, CGL2017-90884-REDT, RTI2018-097864-B-I00 and PGC2018-098770-B-I00), the Andalusia Regional Government (project no. P18-RT-3820), the PANhellenic infrastructure for Atmospheric Composition and climate change (MIS 5021516), Research and Innovation Infrastructure, Competitiveness, Entrepreneurship and Innovation (grant no. NSRF 2014-2020), the Italian Ministry of Research and Education, the Norwegian Environment Agency, Swedish FORMAS, the Swedish Research Council (VR), the Magnus Bergvall foundation, the Märta och Erik Holmberg foundation, and the Swedish EPA.
This paper was edited by Lynn M. Russell and reviewed by two anonymous referees.
Abbatt, J. P. D., Leaitch, W. R., Aliabadi, A. A., Bertram, A. K., Blanchet, J.-P., Boivin-Rioux, A., Bozem, H., Burkart, J., Chang, R. Y. W., Charette, J., Chaubey, J. P., Christensen, R. J., Cirisan, A., Collins, D. B., Croft, B., Dionne, J., Evans, G. J., Fletcher, C. G., Galí, M., Ghahremaninezhad, R., Girard, E., Gong, W., Gosselin, M., Gourdal, M., Hanna, S. J., Hayashida, H., Herber, A. B., Hesaraki, S., Hoor, P., Huang, L., Hussherr, R., Irish, V. E., Keita, S. A., Kodros, J. K., Köllner, F., Kolonjari, F., Kunkel, D., Ladino, L. A., Law, K., Levasseur, M., Libois, Q., Liggio, J., Lizotte, M., Macdonald, K. M., Mahmood, R., Martin, R. V., Mason, R. H., Miller, L. A., Moravek, A., Mortenson, E., Mungall, E. L., Murphy, J. G., Namazi, M., Norman, A.-L., O'Neill, N. T., Pierce, J. R., Russell, L. M., Schneider, J., Schulz, H., Sharma, S., Si, M., Staebler, R. M., Steiner, N. S., Thomas, J. L., von Salzen, K., Wentzell, J. J. B., Willis, M. D., Wentworth, G. R., Xu, J.-W., and Yakobi-Hancock, J. D.: Overview paper: New insights into aerosol and climate in the Arctic, Atmos. Chem. Phys., 19, 2527–2560, https://doi.org/10.5194/acp-19-2527-2019, 2019.
Al-Dabbous, A. N. and Kumar, P.: Source apportionment of airborne nanoparticles in a Middle Eastern city using positive matrix factorization, Environ. Sci., 17, 802–812, https://doi.org/10.1039/C5EM00027K, 2015.
Alonso-Blanco, E., Gómez-Moreno, F., Artíñano, B., Iglesias-Samitier, S., Juncal-Bello, V., Piñeiro-Iglesias, M., López-Mahía, P., Pérez, N., Brines, M., and Alastuey, A.: Temporal and spatial variability of atmospheric particle number size distributions across Spain, Atmos. Environ. 190, 146–160, https://doi.org/10.1016/j.atmosenv.2018.06.046, 2018.
Andrews, E., Ogren, J. A., Bonasoni, P., Marinoni, A., Cuevas, E., Rodríguez, S., Sun, J. Y., Jaffe, D. A., Fischer, E. V., Baltensperger, U., Weingartner, E., Collaud Coen, M., Sharma, S., Macdonald, A. M., Leaitch, W. R., Lin, N.-H., Laj, P., Arsov, T., Kalapov, I., Jefferson, A., and Sheridan, P.: Climatology of aerosol radiative properties in the free troposphere, Atmos. Res., 102, 365–393, https://doi.org/10.1016/j.atmosres.2011.08.017, 2011.
Andrews, E., Sheridan, P., Ogren, J.A., Hageman, D., Jefferson, A., Wendell, J., Alastuey, A., Alados-Arboledas, L., Bergin, M., Ealo, M., Hallar, A.G., Hoffer, A., Kalapov, I., Keywood, M., Kim, J., Kim, S.-W., Kolonjari, F., Labuschagne, C., Lin, N.-H., Macdonald, A., Mayol-Bracero, O.L., McCubbin, I.B., Pandolfi, M., Reisen, F., Sharma, S., Sherman, J. P., Sorribas, M., and Sun, J.: Overview of the NOAA/ESRL Federated Aerosol Network, Bull. Am. Meteorol. Soc., 100, 123–135, 2019.
Asmi, A., Wiedensohler, A., Laj, P., Fjaeraa, A.-M., Sellegri, K., Birmili, W., Weingartner, E., Baltensperger, U., Zdimal, V., Zikova, N., Putaud, J.-P., Marinoni, A., Tunved, P., Hansson, H.-C., Fiebig, M., Kivekäs, N., Lihavainen, H., Asmi, E., Ulevicius, V., Aalto, P. P., Swietlicki, E., Kristensson, A., Mihalopoulos, N., Kalivitis, N., Kalapov, I., Kiss, G., de Leeuw, G., Henzing, B., Harrison, R. M., Beddows, D., O'Dowd, C., Jennings, S. G., Flentje, H., Weinhold, K., Meinhardt, F., Ries, L., and Kulmala, M.: Number size distributions and seasonality of submicron particles in Europe 2008–2009, Atmos. Chem. Phys., 11, 5505–5538, https://doi.org/10.5194/acp-11-5505-2011, 2011.
Asmi, E., Freney, E., Hervo, M., Picard, D., Rose, C., Colomb, A., and Sellegri, K.: Aerosol cloud activation in summer and winter at puy-de-Dôme high altitude site in France, Atmos. Chem. Phys., 12, 11589–11607, https://doi.org/10.5194/acp-12-11589-2012, 2012.
Asmi, A., Collaud Coen, M., Ogren, J. A., Andrews, E., Sheridan, P., Jefferson, A., Weingartner, E., Baltensperger, U., Bukowiecki, N., Lihavainen, H., Kivekäs, N., Asmi, E., Aalto, P. P., Kulmala, M., Wiedensohler, A., Birmili, W., Hamed, A., O'Dowd, C., G Jennings, S., Weller, R., Flentje, H., Fjaeraa, A. M., Fiebig, M., Myhre, C. L., Hallar, A. G., Swietlicki, E., Kristensson, A., and Laj, P.: Aerosol decadal trends – Part 2: In-situ aerosol particle number concentrations at GAW and ACTRIS stations, Atmos. Chem. Phys., 13, 895–916, https://doi.org/10.5194/acp-13-895-2013, 2013.
Baccarini, A., Karlsson, L., Dommen, J., Duplessis, P., Vüllers, J., Brooks, I. M., Saiz-Lopez, A., Salter, M., Tjernström, M., Baltensperger, U., Zieger, P., and Schmale, J.: Frequent new particle formation over the high Arctic pack ice by enhanced iodine emissions, Nat. Commun., 11, 4924, https://doi.org/10.1038/s41467-020-18551-0, 2020.
Baray, J.-L., Bah, A., Cacault, P., Sellegri, K., Pichon, J.-M., Deguillaume, L., Montoux, N., Noel, V., Seze, G., Gabarrot, F., Payen, G., and Duflot, V: Cloud Occurrence Frequency at Puy de Dôme (France) Deduced from an Automatic Camera Image Analysis: Method, Validation, and Comparisons with Larger Scale Parameters, Atmosphere, 10, 808, https://doi.org/10.3390/atmos10120808, 2019.
Barnaba, F., Putaud, J. P. , Gruening, C., dell'Acqua, A., and Dos Santos, S.: Annual cycle in co-located in situ, total-column, and height-resolved aerosol observations in the Po Valley (Italy): Implications for ground-level particulate mattermass concentration estimation from remote sensing, J. Geophys. Res., 115, D19209, https://doi.org/10.1029/2009JD013002, 2010.
Birmili, W., Weinhold, K., Nordmann, S., Wiedensohler, A., Spindler, G., Muller, K., Herrmann, H., Gnauk, T., Pitz, M., Cyrys, J., Flentje, H., Nickel, C., Kulhbusch, T., Lschau, G., Haase, D., Meinhardt, F., Schwerin, A., Ries, L., and Wirtz, K.: Atmospheric aerosol measurements in the German Ultrafine Aerosol Network (GUAN), – Part 1: Soot and particle number distributions, Gefahrst. Reinhalt. L., 69, 137–145, 2009.
Bodhaine, B. A.: Aerosol measurements at four background sites, J. Geophys. Res., 88, 10753–10768, https://doi.org/10.1029/JC088iC15p10753, 1983.
Bressi, M., Cavalli, F., Putaud, J. P., Fröhlich, R., Petit, J.-E., Aas, W., Äijälä, M., Alastuey, A., Allan, J. D., Aurela, M., Berico, M., Bougiatioti, A., Bukowiecki, N., Canonaco, F., Crenn, V., Dusanter, S., Ehn, M., Eller, M., Elsasser, M., Graf, P., Green, D. C., Heikkinen, L., Hermann, H., Holzinger, R., Hueglin, C., Kiendler-Scharr, A., Kubelová, L., Lunder, C., Maasikmets, M., Makeš, O., Malaguti, A., Mihalopoulos, N., Nicolas, J. B., O'Dowd, C., Ovadnevaite, J., Petralia, E., Poulain, L., Priestman, M., Riffault, V., Ripoll, A., Schlag, P., Schwarz, J., Sciare, J., Slowik, J., Sosedova, Y., Stavroulas, I., Teinemaa, E., Vodička, P., Williams, P. I., Wiedensohler, A., Young, D. E., Zhang, S., Favez, O., Minguillón, M. C., and Prévôt, A. S. H.: A European aerosol phenomenology – 7: high-time resolution chemical characteristics of submicron particulate matter across Europe, Atmos. Environ., 10, https://doi.org/10.1016/j.aeaoa.2021.100108, 2021.
Brines, M., Dall'Osto, M., Beddows, D. C. S., Harrison, R. M., Gómez-Moreno, F., Núñez, L., Artíñano, B., Costabile, F., Gobbi, G. P., Salimi, F., Morawska, L., Sioutas, C., and Querol, X.: Traffic and nucleation events as main sources of ultrafine particles in high-insolation developed world cities, Atmos. Chem. Phys., 15, 5929–5945, https://doi.org/10.5194/acp-15-5929-2015, 2015.
Cavalli, F., Alastuey, A., Areskoug, H., Ceburnis, D., Cech, J., Genberg, J., Harrison, R. M., Jaffrezo, J. L., Kiss, G., Laj, P., Mihalopoulos, N., Perez, N., Quincey, P., Schwarz, J., Sellegri, K., Spindler, G., Swietlicki, E., Theodosi, C., Yttri, K. E., Aas, W., and Putaud, J. P.: A European aerosol phenomenology – 4: harmonized concentrations of carbonaceous aerosol at 10 regional background sites across Europe, Atmos. Environ., 144, 133–145, 2016.
Chauvigné, A., Aliaga, D., Sellegri, K., Montoux, N., Krejci, R., Močnik, G., Moreno, I., Müller, T., Pandolfi, M., Velarde, F., Weinhold, K., Ginot, P., Wiedensohler, A., Andrade, M., and Laj, P.: Biomass burning and urban emission impacts in the Andes Cordillera region based on in situ measurements from the Chacaltaya observatory, Bolivia (5240 m a.s.l.), Atmos. Chem. Phys., 19, 14805–14824, https://doi.org/10.5194/acp-19-14805-2019, 2019.
Collaud Coen, M., Andrews, E., Asmi, A., Baltensperger, U., Bukowiecki, N., Day, D., Fiebig, M., Fjaeraa, A. M., Flentje, H., Hyvärinen, A., Jefferson, A., Jennings, S. G., Kouvarakis, G., Lihavainen, H., Lund Myhre, C., Malm, W. C., Mihapopoulos, N., Molenar, J. V., O'Dowd, C., Ogren, J. A., Schichtel, B. A., Sheridan, P., Virkkula, A., Weingartner, E., Weller, R., and Laj, P.: Aerosol decadal trends – Part 1: In-situ optical measurements at GAW and IMPROVE stations, Atmos. Chem. Phys., 13, 869–894, https://doi.org/10.5194/acp-13-869-2013, 2013.
Collaud Coen, M., Andrews, E., Aliaga, D., Andrade, M., Angelov, H., Bukowiecki, N., Ealo, M., Fialho, P., Flentje, H., Hallar, A. G., Hooda, R., Kalapov, I., Krejci, R., Lin, N.-H., Marinoni, A., Ming, J., Nguyen, N. A., Pandolfi, M., Pont, V., Ries, L., Rodríguez, S., Schauer, G., Sellegri, K., Sharma, S., Sun, J., Tunved, P., Velasquez, P., and Ruffieux, D.: Identification of topographic features influencing aerosol observations at high altitude stations, Atmos. Chem. Phys., 18, 12289–12313, https://doi.org/10.5194/acp-18-12289-2018, 2018.
Collaud Coen, M., Andrews, E., Alastuey, A., Arsov, T. P., Backman, J., Brem, B. T., Bukowiecki, N., Couret, C., Eleftheriadis, K., Flentje, H., Fiebig, M., Gysel-Beer, M., Hand, J. L., Hoffer, A., Hooda, R., Hueglin, C., Joubert, W., Keywood, M., Kim, J. E., Kim, S.-W., Labuschagne, C., Lin, N.-H., Lin, Y., Lund Myhre, C., Luoma, K., Lyamani, H., Marinoni, A., Mayol-Bracero, O. L., Mihalopoulos, N., Pandolfi, M., Prats, N., Prenni, A. J., Putaud, J.-P., Ries, L., Reisen, F., Sellegri, K., Sharma, S., Sheridan, P., Sherman, J. P., Sun, J., Titos, G., Torres, E., Tuch, T., Weller, R., Wiedensohler, A., Zieger, P., and Laj, P.: Multidecadal trend analysis of in situ aerosol radiative properties around the world, Atmos. Chem. Phys., 20, 8867–8908, https://doi.org/10.5194/acp-20-8867-2020, 2020.
Croft, B., Martin, R. V., Leaitch, W. R., Tunved, P., Breider, T. J., D'Andrea, S. D., and Pierce, J. R.: Processes controlling the annual cycle of Arctic aerosol number and size distributions, Atmos. Chem. Phys., 16, 3665–3682, https://doi.org/10.5194/acp-16-3665-2016, 2016.
Dall'Osto, M., Beddows, D. C. S., Pey, J., Rodriguez, S., Alastuey, A., Harrison, R. M., and Querol, X.: Urban aerosol size distributions over the Mediterranean city of Barcelona, NE Spain, Atmos. Chem. Phys., 12, 10693–10707, https://doi.org/10.5194/acp-12-10693-2012, 2012.
Dusek, U., Frank, G. P., Hildebrandt, L., Curtius, J., Schneider, J., Walter, S., Chand, D., Drewnick, F., Hings, S., Jung, D., Borrmann, S., and Andreae, M. O.: Size matters more than chemistry for cloud-nucleating ability of aerosol particles, Science, 312, 1375–1378, https://doi.org/10.1126/science.1125261, 2006.
Ervens, B., Cubison, M. J., Andrews, E., Feingold, G., Ogren, J. A., Jimenez, J. L., Quinn, P. K., Bates, T. S., Wang, J., Zhang, Q., Coe, H., Flynn, M., and Allan, J. D.: CCN predictions using simplified assumptions of organic aerosol composition and mixing state: a synthesis from six different locations, Atmos. Chem. Phys., 10, 4795–4807, https://doi.org/10.5194/acp-10-4795-2010, 2010.
Farah, A., Villani, P., Conil, S., Langrene, L., Laj, P., and Sellegri, K.: Characterization of aerosol physical and optical properties at the Perennial Observatory of the Environment (OPE) site, Atmosphere, 11, 172, https://doi.org/10.3390/atmos11020172, 2020.
Freud, E., Krejci, R., Tunved, P., Leaitch, R., Nguyen, Q. T., Massling, A., Skov, H., and Barrie, L.: Pan-Arctic aerosol number size distributions: seasonality and transport patterns, Atmos. Chem. Phys., 17, 8101–8128, https://doi.org/10.5194/acp-17-8101-2017, 2017.
Gierens, R. T., Henriksson, S., Josipovic, M., Vakkari, V., Van Zyl, P. G., Beukes, J. P., Wood, C. R., and O'Connor, E. J.: Observing continental boundary-layer structure and evolution over the South African savannah using a ceilometer, Theor. Appl. Climatol., 136, 333–346, https://doi.org/10.1007/s00704-018-2484-7, 2019.
Gliß, J., Mortier, A., Schulz, M., Andrews, E., Balkanski, Y., Bauer, S. E., Benedictow, A. M. K., Bian, H., Checa-Garcia, R., Chin, M., Ginoux, P., Griesfeller, J. J., Heckel, A., Kipling, Z., Kirkevåg, A., Kokkola, H., Laj, P., Le Sager, P., Lund, M. T., Lund Myhre, C., Matsui, H., Myhre, G., Neubauer, D., van Noije, T., North, P., Olivié, D. J. L., Rémy, S., Sogacheva, L., Takemura, T., Tsigaridis, K., and Tsyro, S. G.: AeroCom phase III multi-model evaluation of the aerosol life cycle and optical properties using ground- and space-based remote sensing as well as surface in situ observations, Atmos. Chem. Phys., 21, 87–128, https://doi.org/10.5194/acp-21-87-2021, 2021.
Gómez-Moreno, F.J., Alonso, E., Artíñano, B., Juncal-Bello, V., Iglesias-Samitier, S., Piñeiro Iglesias, M., Mahía, P.L., Pérez, N., Pey, J., and Ripoll, A.: Intercomparisons of mobility size spectrometers and condensation particle counters in the frame of the Spanish atmospheric observational aerosol network, Aerosol Sci. Tech., 49, 777–785, https://doi.org/10.1080/02786826.2015.1074656, 2015.
Gordon, H., Kirkby, J., Baltensperger, U., Bianchi, F., Breitenlechner, M., Curtius, J., Dias, A., Dommen, J., Donahue, N. M., Dunne, E. M., Duplissy, J., Ehrhart, S., Flagan, R. C., Frege, C., Fuchs, C., Hansel, A., Hoyle, C. R., Kulmala, M., Kürten, A., Lehtipalo, K., Makhmutov, V., Molteni, U., Rissanen, M. P., Stozkhov, Y., Tröstl, J., Tsagkogeorgas, G., Wagner, R., Williamson, C., Wimmer, D., Winkler, P. M., Yan, C., and Carslaw, K. S.: Causes and importance of new particle formation in the present-day and preindustrial atmospheres, J. Geophys. Res.-Atmos., 122, 8739–8760, https://doi.org/10.1002/2017jd026844, 2017.
Hammer, E., Bukowiecki, N., Gysel, M., Jurányi, Z., Hoyle, C. R., Vogt, R., Baltensperger, U., and Weingartner, E.: Investigation of the effective peak supersaturation for liquid-phase clouds at the high-alpine site Jungfraujoch, Switzerland (3580 m a.s.l.), Atmos. Chem. Phys., 14, 1123–1139, https://doi.org/10.5194/acp-14-1123-2014, 2014.
Harrison, R. M., Jones, M., and Collins, G.: Measurements of the physical properties of particles in the urban atmosphere, Atmos. Environ., 33, 309–321, https://doi.org/10.1016/S1352-2310(98)00164-2, 1999.
Herrmann, E., Weingartner, E., Henne, S., Vuilleumier, L., Bukowiecki, N., Steinbacher, M., Conen, F., Collaud Coen, M., Hammer, E., Jurány, Z., Baltensperger, U., and Gysel, M.: Analysis of long-term aerosol size distribution data from Jungfraujoch with emphasis on free tropospheric conditions, cloud influence, and air mass transport, J. Geophys. Res.-Atmos., 120, 9459–9480, https://doi.org/10.1002/2015JD023660, 2015.
Hoyle, C. R., Webster, C. S., Rieder, H. E., Nenes, A., Hammer, E., Herrmann, E., Gysel, M., Bukowiecki, N., Weingartner, E., Steinbacher, M., and Baltensperger, U.: Chemical and physical influences on aerosol activation in liquid clouds: a study based on observations from the Jungfraujoch, Switzerland, Atmos. Chem. Phys., 16, 4043–4061, https://doi.org/10.5194/acp-16-4043-2016, 2016.
IPCC: Working Group I Contribution to the IPCC Fifth Assessment Report Climate Change 2013: The Physical Science Basis, Summary for Policymakers, IPCC, Geneva, Switzerland, Final Draft, 1535 pp., 2013.
Jang, E., Park, K.-T., Yoon, Y. J., Kim, T.-W., Hong, S.-B., Becagli, S., Traversi, R., Kim, J., and Gim, Y.: New particle formation events observed at the King Sejong Station, Antarctic Peninsula – Part 2: Link with the oceanic biological activities, Atmos. Chem. Phys., 19, 7595–7608, https://doi.org/10.5194/acp-19-7595-2019, 2019.
Jurányi, Z., Gysel, M., Weingartner, E., Bukowiecki, N., Kammermann, L., and Baltensperger, U.: A 17 month climatology of the cloud condensation nuclei number concentration at the high alpine site Jungfraujoch, J. Geophys. Res., 116, D10204, https://doi.org/10.1029/2010JD015199, 2011.
Kerminen, V.-M., Paramonov, M., Anttila, T., Riipinen, I., Fountoukis, C., Korhonen, H., Asmi, E., Laakso, L., Lihavainen, H., Swietlicki, E., Svenningsson, B., Asmi, A., Pandis, S. N., Kulmala, M., and Petäjä, T.: Cloud condensation nuclei production associated with atmospheric nucleation: a synthesis based on existing literature and new results, Atmos. Chem. Phys., 12, 12037–12059, https://doi.org/10.5194/acp-12-12037-2012, 2012.
Kerminen, V. M., Chen, X., Vakkari, V., Petäjä, T., Kulmala, M., and Bianchi, F.: Atmospheric new particle formation and growth: Review of field observations, Environ. Res. Lett., 13, https://doi.org/10.1088/1748-9326/aadf3c, 2018.
Komppula, M, Lihavainen, H., Kerminen, V.-M., Kulmala, M., and Viisanen, Y.: Measurements of cloud droplet activation of aerosol particles at a clean subarctic background site, J. Geophys. Res., 110, D06204, https://doi.org/10.1029/2004JD005200, 2005.
Laj, P., Bigi, A., Rose, C., Andrews, E., Lund Myhre, C., Collaud Coen, M., Lin, Y., Wiedensohler, A., Schulz, M., Ogren, J. A., Fiebig, M., Gliß, J., Mortier, A., Pandolfi, M., Petäja, T., Kim, S.-W., Aas, W., Putaud, J.-P., Mayol-Bracero, O., Keywood, M., Labrador, L., Aalto, P., Ahlberg, E., Alados Arboledas, L., Alastuey, A., Andrade, M., Artíñano, B., Ausmeel, S., Arsov, T., Asmi, E., Backman, J., Baltensperger, U., Bastian, S., Bath, O., Beukes, J. P., Brem, B. T., Bukowiecki, N., Conil, S., Couret, C., Day, D., Dayantolis, W., Degorska, A., Eleftheriadis, K., Fetfatzis, P., Favez, O., Flentje, H., Gini, M. I., Gregorič, A., Gysel-Beer, M., Hallar, A. G., Hand, J., Hoffer, A., Hueglin, C., Hooda, R. K., Hyvärinen, A., Kalapov, I., Kalivitis, N., Kasper-Giebl, A., Kim, J. E., Kouvarakis, G., Kranjc, I., Krejci, R., Kulmala, M., Labuschagne, C., Lee, H.-J., Lihavainen, H., Lin, N.-H., Löschau, G., Luoma, K., Marinoni, A., Martins Dos Santos, S., Meinhardt, F., Merkel, M., Metzger, J.-M., Mihalopoulos, N., Nguyen, N. A., Ondracek, J., Pérez, N., Perrone, M. R., Petit, J.-E., Picard, D., Pichon, J.-M., Pont, V., Prats, N., Prenni, A., Reisen, F., Romano, S., Sellegri, K., Sharma, S., Schauer, G., Sheridan, P., Sherman, J. P., Schütze, M., Schwerin, A., Sohmer, R., Sorribas, M., Steinbacher, M., Sun, J., Titos, G., Toczko, B., Tuch, T., Tulet, P., Tunved, P., Vakkari, V., Velarde, F., Velasquez, P., Villani, P., Vratolis, S., Wang, S.-H., Weinhold, K., Weller, R., Yela, M., Yus-Diez, J., Zdimal, V., Zieger, P., and Zikova, N.: A global analysis of climate-relevant aerosol properties retrieved from the network of Global Atmosphere Watch (GAW) near-surface observatories, Atmos. Meas. Tech., 13, 4353–4392, https://doi.org/10.5194/amt-13-4353-2020, 2020.
Lyamani, H., Olmo, F. J., and Alados-Arboledas, L.: Physical and optical properties of aerosols over an urban location in Spain: seasonal and diel variability, Atmos. Chem. Phys., 10, 239–254, https://doi.org/10.5194/acp-10-239-2010, 2010.
Merikanto, J., Spracklen, D. V., Mann, G. W., Pickering, S. J., and Carslaw, K. S.: Impact of nucleation on global CCN, Atmos. Chem. Phys., 9, 8601–8616, https://doi.org/10.5194/acp-9-8601-2009, 2009.
Mortier, A., Gliß, J., Schulz, M., Aas, W., Andrews, E., Bian, H., Chin, M., Ginoux, P., Hand, J., Holben, B., Zhang, H., Kipling, Z., Kirkevåg, A., Laj, P., Lurton, T., Myhre, G., Neubauer, D., Olivié, D., von Salzen, K., Skeie, R. B., Takemura, T., and Tilmes, S.: Evaluation of climate model aerosol trends with ground-based observations over the last 2 decades – an AeroCom and CMIP6 analysis, Atmos. Chem. Phys., 20, 13355–13378, https://doi.org/10.5194/acp-20-13355-2020, 2020.
Motos, G., Schmale, J., Corbin, J. C., Modini, Rob. L., Karlen, N., Bertò, M., Baltensperger, U., and Gysel-Beer, M.: Cloud droplet activation properties and scavenged fraction of black carbon in liquid-phase clouds at the high-alpine research station Jungfraujoch (3580 m a.s.l.), Atmos. Chem. Phys., 19, 3833–3855, https://doi.org/10.5194/acp-19-3833-2019, 2019.
Nieminen, T., Kerminen, V.-M., Petäjä, T., Aalto, P. P., Arshinov, M., Asmi, E., Baltensperger, U., Beddows, D. C. S., Beukes, J. P., Collins, D., Ding, A., Harrison, R. M., Henzing, B., Hooda, R., Hu, M., Hõrrak, U., Kivekäs, N., Komsaare, K., Krejci, R., Kristensson, A., Laakso, L., Laaksonen, A., Leaitch, W. R., Lihavainen, H., Mihalopoulos, N., Németh, Z., Nie, W., O'Dowd, C., Salma, I., Sellegri, K., Svenningsson, B., Swietlicki, E., Tunved, P., Ulevicius, V., Vakkari, V., Vana, M., Wiedensohler, A., Wu, Z., Virtanen, A., and Kulmala, M.: Global analysis of continental boundary layer new particle formation based on long-term measurements, Atmos. Chem. Phys., 18, 14737–14756, https://doi.org/10.5194/acp-18-14737-2018, 2018.
Olin, M., Kuuluvainen, H., Aurela, M., Kalliokoski, J., Kuittinen, N., Isotalo, M., Timonen, H. J., Niemi, J. V., Rönkkö, T., and Dal Maso, M.: Traffic-originated nanocluster emission exceeds H2SO4-driven photochemical new particle formation in an urban area, Atmos. Chem. Phys., 20, 1–13, https://doi.org/10.5194/acp-20-1-2020, 2020.
Pandolfi, M., Alados-Arboledas, L., Alastuey, A., Andrade, M., Angelov, C., Artiñano, B., Backman, J., Baltensperger, U., Bonasoni, P., Bukowiecki, N., Collaud Coen, M., Conil, S., Coz, E., Crenn, V., Dudoitis, V., Ealo, M., Eleftheriadis, K., Favez, O., Fetfatzis, P., Fiebig, M., Flentje, H., Ginot, P., Gysel, M., Henzing, B., Hoffer, A., Holubova Smejkalova, A., Kalapov, I., Kalivitis, N., Kouvarakis, G., Kristensson, A., Kulmala, M., Lihavainen, H., Lunder, C., Luoma, K., Lyamani, H., Marinoni, A., Mihalopoulos, N., Moerman, M., Nicolas, J., O'Dowd, C., Petäjä, T., Petit, J.-E., Pichon, J. M., Prokopciuk, N., Putaud, J.-P., Rodríguez, S., Sciare, J., Sellegri, K., Swietlicki, E., Titos, G., Tuch, T., Tunved, P., Ulevicius, V., Vaishya, A., Vana, M., Virkkula, A., Vratolis, S., Weingartner, E., Wiedensohler, A., and Laj, P.: A European aerosol phenomenology – 6: scattering properties of atmospheric aerosol particles from 28 ACTRIS sites, Atmos. Chem. Phys., 18, 7877–7911, https://doi.org/10.5194/acp-18-7877-2018, 2018.
Pey, J., Querol, X., Alastuey, A., Rodríguez, S., Putaud, J. P., and Van Dingenen, R.: Source apportionment of urban fine and ultra-fine particle number concentration in a Western Mediterranean city, Atmos. Environ., 43, 4407–4415, https://doi.org/10.1016/j.atmosenv.2009.05.024, 2009.
Pfeifer, S., Birmili, W., Schladitz, A., Müller, T., Nowak, A., and Wiedensohler, A.: A fast and easy-to-implement inversion algorithm for mobility particle size spectrometers considering particle number size distribution information outside of the detection range, Atmos. Meas. Tech., 7, 95–105, https://doi.org/10.5194/amt-7-95-2014, 2014.
Putaud, J. P., Raes, F., Van Dingenen, R., Brüggemann, E., Facchini, M. C., Decesari, S., Fuzzi, S., Gehrig, R., Hüglin, C., Laj, P., Lorbeer, G., Maenhaut, W., Mihalopoulos, N., Müller, K., Querol, X., Rodriguez, S., Schneider, J., Spindler, G., Ten Brink, H., Tørseth, K., and Wiedensohler, A.: European aerosol phenomenology – 2: chemical characteristics of particulate matter at kerbside, urban, rural and background sites in Europe, Atmos. Environ., 38, 2579–2595, 2004.
Putaud, J. P., Van Dingenen, R., Alastuey, A., Bauer, H., Birmili, W., Cyrys, J., Flentje, H., Fuzzi, S., Gehrig, R., Hansson, H. C., Harrison, R. M., Hermann, H., Hitzenberger, R., Hüglin, C., Jones, A. M., Kasper-Giebl, A., Kiss, G., Kousa, A., Kuhlbusch, T. A. J., Lóschau, G., Maenhaut, W., Molnar, A., Moreno, T., Pekkanen, J., Perrino, C., Pitz, M., Puxbaum, H., Querol, X., Rodriguez, S., Salma, I., Schwarz, J., Smolik, J., Schneider, J., Spindler, G., ten Brink, H., Tursic, J., Viana, M., Wiedensohler, A., and Raes, F.: A European aerosol phenomenology – 3: physical and chemical characteristics of particulate matter from 60 rural, urban, and kerbside sites across Europe, Atmos. Environ., 44, 1308–1320, 2010.
Rönkkö, T. and Hilkka, T.: Overview of Sources and Characteristics of Nanoparticles in Urban Traffic-Influenced Areas, J. Alzheimer's Disease, 72, 15–28, https://doi.org/10.3233/JAD-190170, 2019.
Rönkkö, T., Kuuluvainen, H., Karjalainen, P., Keskinen, J., Hillamo, R., Niemi, J. V., Pirjola, L., Timonen, H. J., Saarikoski, S., Saukko, E., Järvinen, A., Silvennoinen, H., Rostedt, A., Olin, M., Yli-Ojanperä, J., Nousiainen, P., Kousa, A., and Dal Maso, M.: Traffic is a major source of atmospheric nanocluster aerosol, P. Natl. Acad. Sci. USA, 114, 7549–7554, https://doi.org/10.1073/pnas.1700830114, 2017.
Rose, C., Sellegri, K., Velarde, F., Moreno, I., Ramonet, M., Weinhold, K., Krejci, R., Ginot, P., Andrade, M., Wiedensohler, A., and Laj, P.: Frequent nucleation events at the high altitude station of Chacaltaya (5240 m a.s.l.), Bolivia, Atmos. Environ., 102, 18–29, 2015.
Rose, C., Sellegri, K., Moreno, I., Velarde, F., Ramonet, M., Weinhold, K., Krejci, R., Andrade, M., Wiedensohler, A., Ginot, P., and Laj, P.: CCN production by new particle formation in the free troposphere, Atmos. Chem. Phys., 17, 1529–1541, https://doi.org/10.5194/acp-17-1529-2017, 2017.
Rose, C., Foucart, B., Picard, D., Colomb, A., Metzger, J.-M., Tulet, P., and Sellegri, K.: New particle formation in the volcanic eruption plume of the Piton de la Fournaise: specific features from a long-term dataset, Atmos. Chem. Phys., 19, 13243–13265, https://doi.org/10.5194/acp-19-13243-2019, 2019.
Rose, C., Collaud Coen, M., Andrews, E., Lin, Y., Bossert, I., Lund Myhre, C., Tuch, T., Wiedensohler, A., Fiebig, M., Aalto, P., Alastuey, A., Alonso-Blanco, E., Andrade, M., Artíñano, B., Arsov, T., Baltensperger, U., Bastian, S., Bath, O., Beukes, J. P., Brem, B. T., Bukowiecki, N., Casquero-Vera, J. A., Conil, S., Eleftheriadis, K., Favez, O., Flentje, H., Gini, M. I., Gómez-Moreno, F. J., Gysel-Beer, M., Hallar, A. G., Kalapov, I., Kalivitis, N., Kasper-Giebl, A., Keywood, M., Kim, J. E., Kim, S.-W., Kristensson, A., Kulmala, M., Lihavainen, H., Lin, N.-H., Lyamani, H., Marinoni, A., Martins Dos Santos, S., Mayol-Bracero, O. L., Meinhardt, F., Merkel, M., Metzger, J.-M., Mihalopoulos, N., Ondracek, J., Pandolfi, M., Pérez, N., Petäjä, T., Petit, J.-E., Picard, D., Pichon, J.-M., Pont, V., Putaud, J.-P., Reisen, F., Sellegri, K., Sharma, S., Schauer, G., Sheridan, P., Sherman, J. P., Schwerin, A., Sohmer, R., Sorribas, M., Sun, J., Tulet, P., Vakkari, V., van Zyl, P. G., Velarde, F., Villani, P., Vratolis, S., Wagner, Z., Wang, S.-H., Weinhold, K., Weller, R., Yela, M., Zdimal, V., and Laj, P.: Seasonality of the particle number concentration and size distribution: a global analysis retrieved from the network of Global Atmosphere Watch (GAW) near-surface observatories, ACTRIS Data Centre, https://doi.org/10.21336/gen.sg1y-ay21, 2021.
Salma, I., Borsós, T., Németh, Z., Weidinger, T., Aalto, T., and Kulmala, M.: Comparative study of ultrafine atmospheric aerosol within a city, Atmos. Environ., 92, 154–161, 2014.
Schmale, J., Henning, S., Henzing, B., Keskinen, H., Sellegri, K., Ovadnevaite, J., Bougiatioti, A., Kalivitis, N., Stavroulas, I., Jefferson, A., Park, M., Schlag, P., Kristensson, A., Iwamoto, Y., Pringle, K., Reddington, C., Aalto, P., Äijälä, M., Baltensperger, U., Bialek, J., Birmili, W., Bukowiecki, N., Ehn, M., Fjæraa, A. M., Fiebig, M., Frank, G., Fröhlich, R., Frumau, A., Furuya, M., Hammer, E., Heikkinen, L., Herrmann, E., Holzinger, R., Hyono, H., Kanakidou, M., Kiendler-Scharr, A., Kinouchi, K., Kos, G., Kulmala, M., Mihalopoulos, N., Motos, G., Nenes, A., O'Dowd, C., Paramonov, M., Petäjä, T., Picard, D., Poulain, L., Prévôt, A. S. H., Slowik, J., Sonntag, A., Swietlicki, E., Svenningsson, B., Tsurumaru, H., Wiedensohler, A., Wittbom, C., Ogren, J. A., Matsuki, A., Yum, S. S., Lund Myhre, C., Carslaw, K., Stratmann, F., and Gysel, M.: Collocated observations of cloud condensation nuclei, particle size distributions, and chemical composition, Sci. Data, 4, 170003, https://doi.org/10.1038/sdata.2017.3, 2017.
Schmale, J., Henning, S., Decesari, S., Henzing, B., Keskinen, H., Sellegri, K., Ovadnevaite, J., Pöhlker, M. L., Brito, J., Bougiatioti, A., Kristensson, A., Kalivitis, N., Stavroulas, I., Carbone, S., Jefferson, A., Park, M., Schlag, P., Iwamoto, Y., Aalto, P., Äijälä, M., Bukowiecki, N., Ehn, M., Frank, G., Fröhlich, R., Frumau, A., Herrmann, E., Herrmann, H., Holzinger, R., Kos, G., Kulmala, M., Mihalopoulos, N., Nenes, A., O'Dowd, C., Petäjä, T., Picard, D., Pöhlker, C., Pöschl, U., Poulain, L., Prévôt, A. S. H., Swietlicki, E., Andreae, M. O., Artaxo, P., Wiedensohler, A., Ogren, J., Matsuki, A., Yum, S. S., Stratmann, F., Baltensperger, U., and Gysel, M.: Long-term cloud condensation nuclei number concentration, particle number size distribution and chemical composition measurements at regionally representative observatories, Atmos. Chem. Phys., 18, 2853–2881, https://doi.org/10.5194/acp-18-2853-2018, 2018.
Schraufnagel, D. E.: The health effects of ultrafine particles, Exp. Mol. Med., 52, 311–317, https://doi.org/10.1038/s12276-020-0403-3, 2020.
Sellegri, K., Rose, C., Marinoni, A., Lupi, A., Wiedensohler, A., Andrade, M., Bonasoni, P., and Laj, P.: New Particle Formation: A Review of Ground-Based Observations at Mountain Research Stations, Atmosphere, 10, 493, https://doi.org/10.3390/atmos10090493, 2019.
Spracklen, D. V., Carslaw, K. S., Kulmala, M., Kerminen, V. M., Mann, G. W., and Sihto, S. L.: The contribution of boundary layer nucleation events to total particle concentrations on regional and global scales, Atmos. Chem. Phys., 6, 5631–5648, https://doi.org/10.5194/acp-6-5631-2006, 2006.
Spracklen, D. V., Carslaw, K. S., Kulmala, M., Kerminen, V.-M., Sihto, S.-L., Riipinen, I., Merikanto, J., Mann, G. W., Chipperfield, M. P., Wiedensohler, A., Birmili, W., and Lihavainen, H.: Contribution of particle formation to global cloud condensation nuclei concentrations, Geophys. Res. Lett., 35, L06808, https://doi.org/10.1029/2007gl033038, 2008.
Vakkari, V., Beukes, J. P., Laakso, H., Mabaso, D., Pienaar, J. J., Kulmala, M., and Laakso, L.: Long-term observations of aerosol size distributions in semi-clean and polluted savannah in South Africa, Atmos. Chem. Phys., 13, 1751–1770, https://doi.org/10.5194/acp-13-1751-2013, 2013.
Van Dingenen, R., Putaud, J. P., Raes, F., Baltensperger, U., Charron, A., Facchini, M. C., Decesari, S., Fuzzi, S., Gehrig, R., Hansson, H. C., Harrison, R. M., Hüglin, C., Jones, A. M., Laj, P., Lorbeer, G., Maenhaut, W., Palgren, F., Querol, X., Rodriguez, S., Schneider, J., Ten Brink, H., Tunved, P., Tørseth, K., Wehner, B., Weingartner, E., Wiedensohler, A., and Wåhlin, P.: A European aerosol phenomenology – 1: physical characteristics of particulate matter at kerbside, urban, rural and background sites in Europe, Atmos. Environ., 38, 2561–2577, 2004.
Wiedensohler, A., Birmili, W., Nowak, A., Sonntag, A., Weinhold, K., Merkel, M., Wehner, B., Tuch, T., Pfeifer, S., Fiebig, M., Fjäraa, A. M., Asmi, E., Sellegri, K., Depuy, R., Venzac, H., Villani, P., Laj, P., Aalto, P., Ogren, J. A., Swietlicki, E., Williams, P., Roldin, P., Quincey, P., Hüglin, C., Fierz-Schmidhauser, R., Gysel, M., Weingartner, E., Riccobono, F., Santos, S., Grüning, C., Faloon, K., Beddows, D., Harrison, R., Monahan, C., Jennings, S. G., O'Dowd, C. D., Marinoni, A., Horn, H.-G., Keck, L., Jiang, J., Scheckman, J., McMurry, P. H., Deng, Z., Zhao, C. S., Moerman, M., Henzing, B., de Leeuw, G., Löschau, G., and Bastian, S.: Mobility particle size spectrometers: harmonization of technical standards and data structure to facilitate high quality long-term observations of atmospheric particle number size distributions, Atmos. Meas. Tech., 5, 657–685, https://doi.org/10.5194/amt-5-657-2012, 2012.
Wiedensohler, A., Wiesner, A., Weinhold, K., Birmili, W., Hermann, M., Merkel, M., Müller, T., Pfeifer, S., Schmidt, A., Tuch, T., Velarde, F., Quincey, P., Seeger, S., and Nowak, A.: Mobility particle size spectrometers: Calibration procedures and measurement uncertainties, Aerosol Sci. Technol., 52, 146–164, https://doi.org/10.1080/02786826.2017.1387229, 2018.
Zanatta, M., Gysel, M., Bukowiecki, N., Müller, T., Weingartner, E., Areskoug, H., Fiebig, M., Yttri, K. E., Mihalopoulos, N., Kouvarakis, G., Beddows, D., Harrison, R. M., Cavalli, F., Putaud, J. P., Spindler, G., Wiedensohler, A., Alastuey, A., Pandolfi, M., Sellegri, K., Swietlicki, E., Jaffrezo, J. L., Baltensperger, U., and Laj, P.: A European aerosol phenomenology – 5: climatology of black carbon optical properties at 9 regional background sites across Europe, Atmos. Environ., 145, 346–364, 2016.
- Abstract
- Introduction
- Measurement sites and data handling
- Relevant metrics for the description of the total particle number concentration and size distribution
- Data availability – coverage criteria
- Seasonality of the total particle number concentration and size distribution
- Diel cycle of the total particle number concentration
- Focus on CCN-sized particles
- Summary and conclusion
- Appendix A
- Data availability
- Author contributions
- Competing interests
- Disclaimer
- Acknowledgements
- Financial support
- Review statement
- References
- Supplement