the Creative Commons Attribution 4.0 License.
the Creative Commons Attribution 4.0 License.
 | 25 Nov 2021
Response of atmospheric composition to COVID-19 lockdown measures during spring in the Paris region (France)
Jean-Eudes Petit
Jean-Charles Dupont
Olivier Favez
Valérie Gros
Yunjiang Zhang
Jean Sciare
Leila Simon
François Truong
Nicolas Bonnaire
Tanguy Amodeo
Robert Vautard
Martial Haeffelin
Since early 2020, the COVID-19 pandemic has led to lockdowns at national scales. These lockdowns resulted in large cuts of atmospheric pollutant emissions, notably related to the vehicular traffic source, especially during spring 2020. As a result, air quality changed in manners that are still currently under investigation. The robust quantitative assessment of the impact of lockdown measures on ambient concentrations is however hindered by weather variability. In order to circumvent this difficulty, an innovative methodology has been developed. The Analog Application for Air Quality (A3Q) method is based on the comparison of each day of lockdown to a group of analog days having similar meteorological conditions. The A3Q method has been successfully evaluated and applied to a comprehensive in situ dataset of primary and secondary pollutants obtained at the SIRTA observatory, a suburban background site of the megacity of Paris (France). The overall slight decrease of submicron particulate matter (PM1) concentrations (−14 %) compared to business-as-usual conditions conceals contrasting behaviors. Primary traffic tracers (NOx and traffic-related carbonaceous aerosols) dropped by 42 %–66 % during the lockdown period. Further, the A3Q method enabled us to characterize changes triggered by NOx decreases. Particulate nitrate and secondary organic aerosols (SOAs), two of the main springtime aerosol components in northwestern Europe, decreased by −45 % and −25 %, respectively. A NOx relationship emphasizes the interest of NOx mitigation policies at the regional (i.e., city) scale, although long-range pollution advection sporadically overcompensated for regional decreases. Variations of the oxidation state of SOA suggest discrepancies in SOA formation processes. At the same time, the expected ozone increase (+20 %) underlines the negative feedback of NO titration. These results provide a quasi-comprehensive observation-based insight for mitigation policies regarding air quality in future low-carbon urban areas.
- Article
(986 KB) - Full-text XML
-
Supplement
(751 KB) - BibTeX
- EndNote


With the worldwide spread of the SARS-CoV-2 coronavirus, the COVID-19 outbreak has been responsible for millions of premature deaths. In order to slow down contagion rates, social interactions have progressively been limited until the establishment of strict lockdowns at national scales (Anderson et al., 2020) enforced during several weeks, especially during spring 2020 in Europe. The corresponding stay-at-home orders resulted in a sudden halt of economic activities and, as a consequence, in an unprecedented drop of emission of pollution sources. From this perspective, and despite tragic death records, these lockdowns are unique opportunities to characterize an extreme end of mitigation policy scenarios and future low-carbon megacities from direct observations. Scientific initiatives are thriving across the globe in order to assess the impact of lockdowns on air quality. They report, for the most part, a sharp decrease of the concentrations of nitrogen oxides (NOx), as well as an increase of tropospheric ozone (e.g., China: Le et al., 2020; India: Mahato et al., 2020; USA: Q. Liu et al., 2020; Europe: Sicard et al., 2020; Grange et al., 2021; South America: Siciliano et al., 2020) as a response to stay-at-home orders.
The increase of ozone is one counterintuitive example of the complex chemistry occurring within the atmosphere, although its link with the decrease of NOx concentrations has been well established (e.g., Reis et al., 2000). As highlighted by Kroll et al. (2020), beyond NOx, O3 and particulate matter (PMx), additional information is needed in order to further characterize the impacts of lockdown on the atmospheric chemical system. Indeed, PM is composed of several different fractions, from organic to inorganic and from primary to secondary pollutants, with diverse sources and transformation processes. Any concentration change of PM may derive from various compensatory feedbacks which are not characterized, limiting therefore our understanding of the impacts of lockdown on air quality. Moreover, springtime in northwestern Europe is usually associated with high PM pollution episodes dominated by secondary material (mainly ammonium nitrate and sulfate and secondary organic aerosols, SOAs), as shown in Bressi et al. (2021). Ammonium nitrate is formed in the atmosphere from the neutralization of nitric acid (formed through NOx oxidation) with ammonia. The comprehensive characterization of SOA formation is also blurred by the overwhelming numbers of transformation pathways, precursors and oxidant availability. Thus far, only few studies have investigated the impacts of lockdown on PM chemistry and sources in Asia (e.g., Chang et al., 2020; Sun et al., 2020; Tian et al., 2021; Manchanda et al., 2021) by comparing the lockdown period with other periods (either a pre-lockdown period or the same period of the year of previous years).
On the other hand, the assessment of air quality implications of large cuts in urban pollutant emissions is strongly hampered by meteorological variability, which is one of the main drivers of air pollution temporality. For instance, unfavorable meteorology has previously been associated with an increase of PM concentrations in various urban areas worldwide (e.g., Dupont et al., 2016; Wang et al., 2020). Sun et al. (2020) also highlighted severe hazes during lockdown in China, linked to stagnant meteorological conditions. Therefore, without climatologically representative values, specific care must be taken when comparing concentrations observed during and outside the lockdown period. The robustness of this assessment depends on the way meteorology is handled and on what reference period is chosen to compare with the lockdown period. A recent review by Gkatzelis et al. (2021) pointed out that, despite the luxuriance of scientific literature, more than half of examined articles did not take meteorology into account. Advances in machine-learning (ML) approaches have however enabled the contributions of meteorological conditions to the temporal variations of primary and secondary PM components to be disentangled (e.g., Stirnberg et al., 2021). ML has successfully been applied mainly on NOx and O3 in various European urban areas (Petetin et al., 2020; Grange et al., 2021). But weather-corrected studies of PM chemistry are still scarce, especially in western Europe.
The present study aims at reconciling a robust and innovative methodology with a quasi-comprehensive in situ dataset, acquired within the Paris region (France). The 12 million inhabitants of the region, representing around 20 % of the total French population, were placed under lockdown from 17 March 2020 to 10 May 2020, further designated as LP2020.
2.1 Instrumentation
In situ measurement datasets used in this study have been primarily obtained at the SIRTA atmospheric observatory (2.15∘ E, 48.71∘ N; Haeffelin et al., 2005), a facility which contributes to the EU research infrastructure ACTRIS (https://www.actris.eu, last access: 23 November 2021), following its quality assurance and quality control guidelines. The chemical composition of major submicron non-refractory species has been monitored since the end of 2011 using a quadrupole aerosol chemical speciation monitor (ACSM; Ng et al., 2011), constituting the longest ACSM dataset worldwide. Measurement principles of the ACSM are extensively described elsewhere (Budisulistiorini et al., 2014; Zhang et al., 2019; Poulain et al., 2020). Here, 30 min concentrations of submicron organic aerosols (OAs), nitrate (NO3), sulfate (SO4), ammonium (NH4) and chloride (Cl) were corrected with a time-dependent collection efficiency (Middlebrook et al., 2012) (CE). The ACSM at SIRTA was regularly calibrated using 300 nm ammonium nitrate and ammonium sulfate particles to derive ionization efficiencies (IEs) and showed satisfactory performances during ACTRIS intercomparison exercises (Crenn et al., 2015; Freney et al., 2019).
The black carbon dataset consists in aethalometer measurements (Drinovec et al., 2015). It is composed of subsequent and harmonized datasets obtained from AE31 (January 2011–March 2013) and AE33 (March 2013–June 2020) devices and applying a common validation procedure (Petit et al., 2017a). Briefly, for each elementary measurement data point (5 and 1 min time base for AE31 and AE33, respectively), BCλ concentrations were set as invalid when below LoD (limit of detection; 100 ng/m3); for BC950 nm≥200 ng/m3, the spectral dependence was calculated from the linear regression of ln(λ) versus ln(Batn). Measurements were considered valid for a r2 (of this linear regression) higher than 0.9 and aerosol Ångström exponent (AAE) comprised between 0.8 and 3.
Daily concentrations of nitrogen monoxide (NO) and nitrogen dioxide (NO2) were retrieved from 1 min measurements performed with a T200UP Teledyne instrument, equipped with a blue light photolytic converter and a Nafion dryer. The instrument has been regularly calibrated with a reference standard from National Physics Laboratory (Teddington, UK), and NO and NO2 concentrations have been corrected from ozone interference. The NOx analyzer has participated in the two ACTRIS intercomparison exercises organized at Hohenpeissenberg in 2012 and 2016 and has shown a good comparability with other instruments. Other NOx observations throughout the Paris region between 2012 and 2020 were retrieved from the regional air quality monitoring structure (Airparif, https://www.airparif.asso.fr, last access: 23 November 2021). In this respect, urban NOx concentrations refer here to the average of all urban background stations measuring NOx.
As the ozone instrument from SIRTA experienced a major breakdown in 2020, daily ozone (O3) concentrations were obtained between 2012 and 2020 from a peri-urban station in Les Ulis (2.165∘ E, 48.68∘ N), operated by Airparif. This station is located around 10 km away from SIRTA, and O3 from Les Ulis has shown a good comparability with O3 from SIRTA during the period of common measurements.
Meteorological variables at SIRTA (wind speed and direction, temperature, relative humidity and pressure) were provided from the ReObs database (Chiriaco et al., 2018).
2.2 Source apportionment of carbonaceous aerosols
Fossil fuel (BCff) and biomass burning (BCwb) fractions were estimated from aethalometer measurements (Sandradewi et al., 2008). Since the choice of αff and αwb is critical, and given the size of our dataset, their determination was based on the statistical hourly distribution of the AAE (Fig. S1). The value of 1.85 was chosen for αwb, corresponding to a maximum frequency during the night. This value is close to the values used previously at SIRTA (Zhang et al., 2019) and to the recommended value of 1.72 (Zotter et al., 2017). PMff and PMwb were estimated from BCff and BCwb concentrations, respectively, following the conversion factors of 2 and 10.3 found for SIRTA during the same season (Petit et al., 2014).
A source apportionment study of OA was carried out by positive matrix factorization (PMF; Paatero and Tapper, 1994) from January to May 2020. The analysis has been carried out seasonally (January–February and March–April–May) in order to prevent influence from the seasonality of the profiles of secondary factors (Canonaco et al., 2015). Profiles of hydrocarbon-like organic aerosols (HOAs) and biomass burning organic aerosols (BBOAs) were constrained with a random a value approach (Canonaco et al., 2013), a third factor being left unconstrained (oxygenated organic aerosol, OOA). The criteria approach of SoFi Pro (Canonaco et al., 2021) was then used to select satisfactory solutions over 100 runs, from the Pearson correlation (r) of HOA vs. BCff, HOA vs. NOx and BBOA vs. BCwb. Results obtained here enrich the existing time series (Zhang et al., 2019) from June 2011 to March 2018 (where MO-OOA and LO-OOA were summed as OOA). Both PMF outputs were obtained with the same reference profiles of HOA and BBOA (Fröhlich et al., 2015), and similar a values for HOA and BBOA were used (on average 0.26 and 0.32 for HOA and BBOA, respectively; 0.21 and 0.22 in Zhang et al., 2019). As a result, HOA and BBOA profiles are very consistent, with the slope and r2 higher than 0.9.
The oxidation properties (Kroll et al., 2011) of secondary organic aerosols were characterized by removing the contribution of primary factors to the OA matrix, as follows:
From there, O:CSOA, H:CSOA and OScSOA were calculated from the improved Aiken (Aiken et al., 2008) equations provided in Canagaratna et al. (2015), using 29, 43 and 44. Given the unit mass resolution of the instrument, it is important to underline that these equations provide only qualitative information for ACSM data. Absolute values, most probably associated with significant uncertainties, will therefore not be discussed here. Nevertheless, it is sufficient to characterize a change, since they are uniformly applied throughout the dataset.
The full time series between 2012 and 2020 is presented in Fig. S2.
2.3 Back-trajectory calculation
With the PC-based version of HYSPLIT (Stein et al., 2015) using 1∘ × 1∘ Global Data Assimilation System (GDAS) files, 120 h back-trajectories ending at SIRTA (49.15∘ E, 2.19∘ N) at 500 m a.g.l. were calculated every 6 h from 2012 to 2020. Calculations using HYSPLIT executables were automatically controlled by ZeFir (Petit et al., 2017b), a user-friendly interface based on Igor Pro 6.3 (Wavemetrics©). The cluster analysis presented in Sect. 3.1 was also applied from HYSPLIT executables, controlled by ZeFir. Five clusters were used (Fig. S3a), in accordance with the total spatial variance (TSV). The two oceanic clusters were summed as one.
3.1 Choice of the comparison reference period
The assessment of lockdown impact on air quality lies on the use of a reference period, which is assumed to be representative of business-as-usual conditions during LP2020, following
In the current literature, different reference periods are used, from a pre-lockdown period (pLP2020, Toscano and Murena, 2020; Dantas et al., 2020; Otmani et al., 2020), to the weeks corresponding to LP of previous years (e.g., 17 March to 11 May during 2017–2019 is LP2017–2019). Nevertheless, in the case of SIRTA, applying these methodologies unquestioningly, without verifying the inherent hypothesis that data are comparable, can lead to significant variability and counterintuitive results. Figure 1 presents concentration relative changes for the SIRTA dataset, using pLP2020, LP2019, LP2017–2019, LP2015–2019 and LP2012–2019 as references. Significant increases for all pollutants (e.g., +83 % in NOx, +439 % in PM1) are found with pLP2020, which seems to contradict the observed drop of traffic. For the other reference periods, results reveal a substantial decrease for the concentrations of pollutants related to traffic emissions (i.e., BCff, HOA and NOx) but clear increases of all other investigated pollutants, especially secondaries.
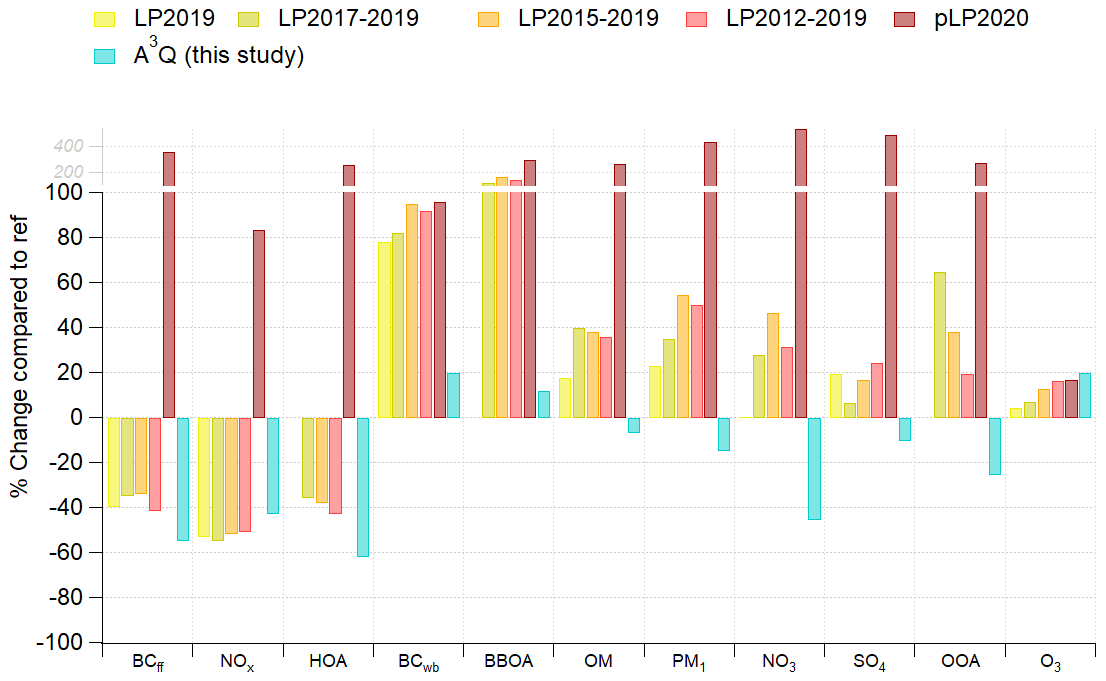
Figure 1Relative concentration change (%) of each species used in this study following different reference periods, as well as from the A3Q approach presented in this article.
As reference periods, they assume meteorological conditions representative of LP2020. However, April 2020 in France was exceptionally warmer (+4.5 ∘C), drier (−43 % of precipitation in the Paris region) and sunnier (i.e., hours of sunshine during the day; +60 %) than usual (1981–2010 climatological reference values). Table S1 presents the meteorological variability of the different reference periods (in terms of ambient temperature, RH, pressure and wind speed) and shows that they do not reproduce the meteorology of LP2020 (in terms of min, max and average, especially T and RH) and also fail at reproducing its temporality (low r values). Moreover, from a trajectory cluster analysis (Fig. S3a), it appears that they misrepresent the variability of air mass origin. The unrealistic features of pLP2020 can indeed be explained by a drastic change of western Europe meteorological conditions (from low-pressure to high-pressure system) concomitantly with the application of lockdown policy measures in France (Fig. 2). For the other reference periods, they still underrepresent the continental sector (13 %–18 %) compared to LP2020 (28 %) and inversely overrepresent oceanic air masses. Given the fact that, for instance, NO3, SO4 and OOA exhibit highest concentrations with continental air masses, these methodologies at SIRTA most likely underestimate business-as-usual concentrations and therefore lead to erroneous results.

To overcome all these issues and account for the strong synergy between PM chemical composition, emission sources and meteorology, we developed the Analog Application for Air Quality (A3Q) method, which is described below.
3.2 The Analog Application for Air Quality (A3Q) approach
3.2.1 Description
Analogs of atmospheric circulation (Yiou et al., 2013; Lorenz, 1969; Van Den Dool, 1994; Zorita and Storch, 1999; Cattiaux et al., 2012) have been widely used for different climatological purposes, notably for atmospheric reconstructions and in the characterization of the role of synoptic circulation in extreme meteorological events (Yiou et al., 2013; Vautard et al., 2018). Circulation analogs are generally computed from daily pressure spatial distributions. Here, we built the analogy based on three successive layers:
Synoptic. Circulation analogs are computed similarly to previous studies. We used daily sea-level pressure (SLP) data to better characterize near-surface atmospheric circulation as our study covers near-surface pollutants. The SLP data are extracted from NCEP/NCAR reanalysis data (Kalnay et al., 1996) along the historical period that covers 2012 to 2019. The SLP fields considered here have a horizontal resolution of 2.5×2.5∘ and cover a spatial domain ranging −20∘ W to +15∘ E in longitude and +40 to +60∘ N in latitude. This region is chosen because it includes atmospheric pressure patterns that influence near-surface wind (Raynaud et al., 2017) in our area of study. For each day of the study period, the 50 best circulation analogs (minimum spatial correlation of 0.5) are sought, using the spatial correlation as a way to measure similarity between SLP fields. The calendar distance between the day in the study period and days in the historic period is a maximum of 30 d. Out of 50 potential days with analog atmospheric circulation, only those with a spatial correlation higher than 0.6 (representing 97.8 % of all analog days, 23.2 analogs/day on average) were kept.
Regional. The air mass trajectory (AMT) of each synoptic analog was compared to the AMT of the corresponding lockdown day. For each day, trajectory density (log of the occurrence of trajectory endpoints) was calculated over a 0.5∘ × 0.5∘ grid covering western Europe. The distribution of spatial correlation values between each day of LP and each analog day is presented in Fig. S4. Since this distribution is rather spread out, a low threshold at 0.2 (representing 70 % of analog days, 16.3 analogs/day on average) was selected in order to remove the worst analog AMT but also to keep sufficient variability. An example of satisfactory and unsatisfactory analogs is shown in Fig. S5.
Local. A specific constraint on local ambient temperature and relative humidity (RH) was implemented. Indeed, both variables are key drivers of the partitioning of semi-volatile material, such as ammonium nitrate. Therefore, a satisfactory representation of local meteorological conditions by the analogs is needed in order to robustly capture and characterize any change of concentration. Over the study period, the analog performance regarding temperature and RH respectively ranges from −15 to +15 ∘C and from −36 % to +64 %. Concretely, analogs that are much colder and wetter (higher RH) than the observation day may be associated with enhanced condensation of semi-volatile and/or hygroscopic compounds, which would lead to an overestimation of the estimated decrease of, e.g., nitrate. This specifically occurred on 21, 22 and 23 April 2020. To avoid that issue, we excluded the analogs having the 5 % worst performance from the list. Acceptable ranges were therefore between the 5th and 95th percentiles (excluded) of ΔT and ΔRH values, which were respectively ]−9.3, 6[ and ]−19, 35[. Despite these relatively wide ranges, the A3Q methodology allows us to efficiently reconstruct meteorological conditions during the lockdown period. Indeed, Fig. S11 presents, for the January–May 2020 period, the temporal variations of observed and estimated temperature, RH and pressure. It shows low mean bias values, as well as satisfactory correlation coefficients (r value of 0.78, 0.82 and 0.63, respectively), which indicates a satisfactory analogy. Sensitivity tests presented below also demonstrate that stricter ranges do not significantly change the analog results.
Daily absolute concentration change (DAC) and median relative change (MRC) for each species are defined as
where and are the daily concentration at ti of species j, measured and calculated from A3Q, respectively. and are the median concentration during lockdown, measured and calculated from A3Q, respectively.
3.2.2 Data preparation
Daily averages have been computed for each variable. A valid average is considered if at least 75 % of the day is covered.
Because the dataset consists in multi-year observations, long-term trends may impact the estimated concentration change due to lockdown. To that end, a seasonal Mann–Kendall (MK) test was performed on each variable for the January 2012–February 2020 period. The Mann–Kendall R package was used (Bigi and Vogt, 2020; Collaud Coen et al., 2020), which includes three pre-whitening approaches in order to reduce the weight of autocorrelation. Results are summarized in Table 1. From this analysis, NOx, OA, HOA, OOA, O3 and BCff concentrations (2012–2020, including lockdown) were linearly corrected on a daily basis.
Table 1Sen's slope (in µg/m3/year) and MK p value for each variable of the study. No slope means that the result does not reach the 95 % confidence interval. The slope is statistically significant for p<0.05.
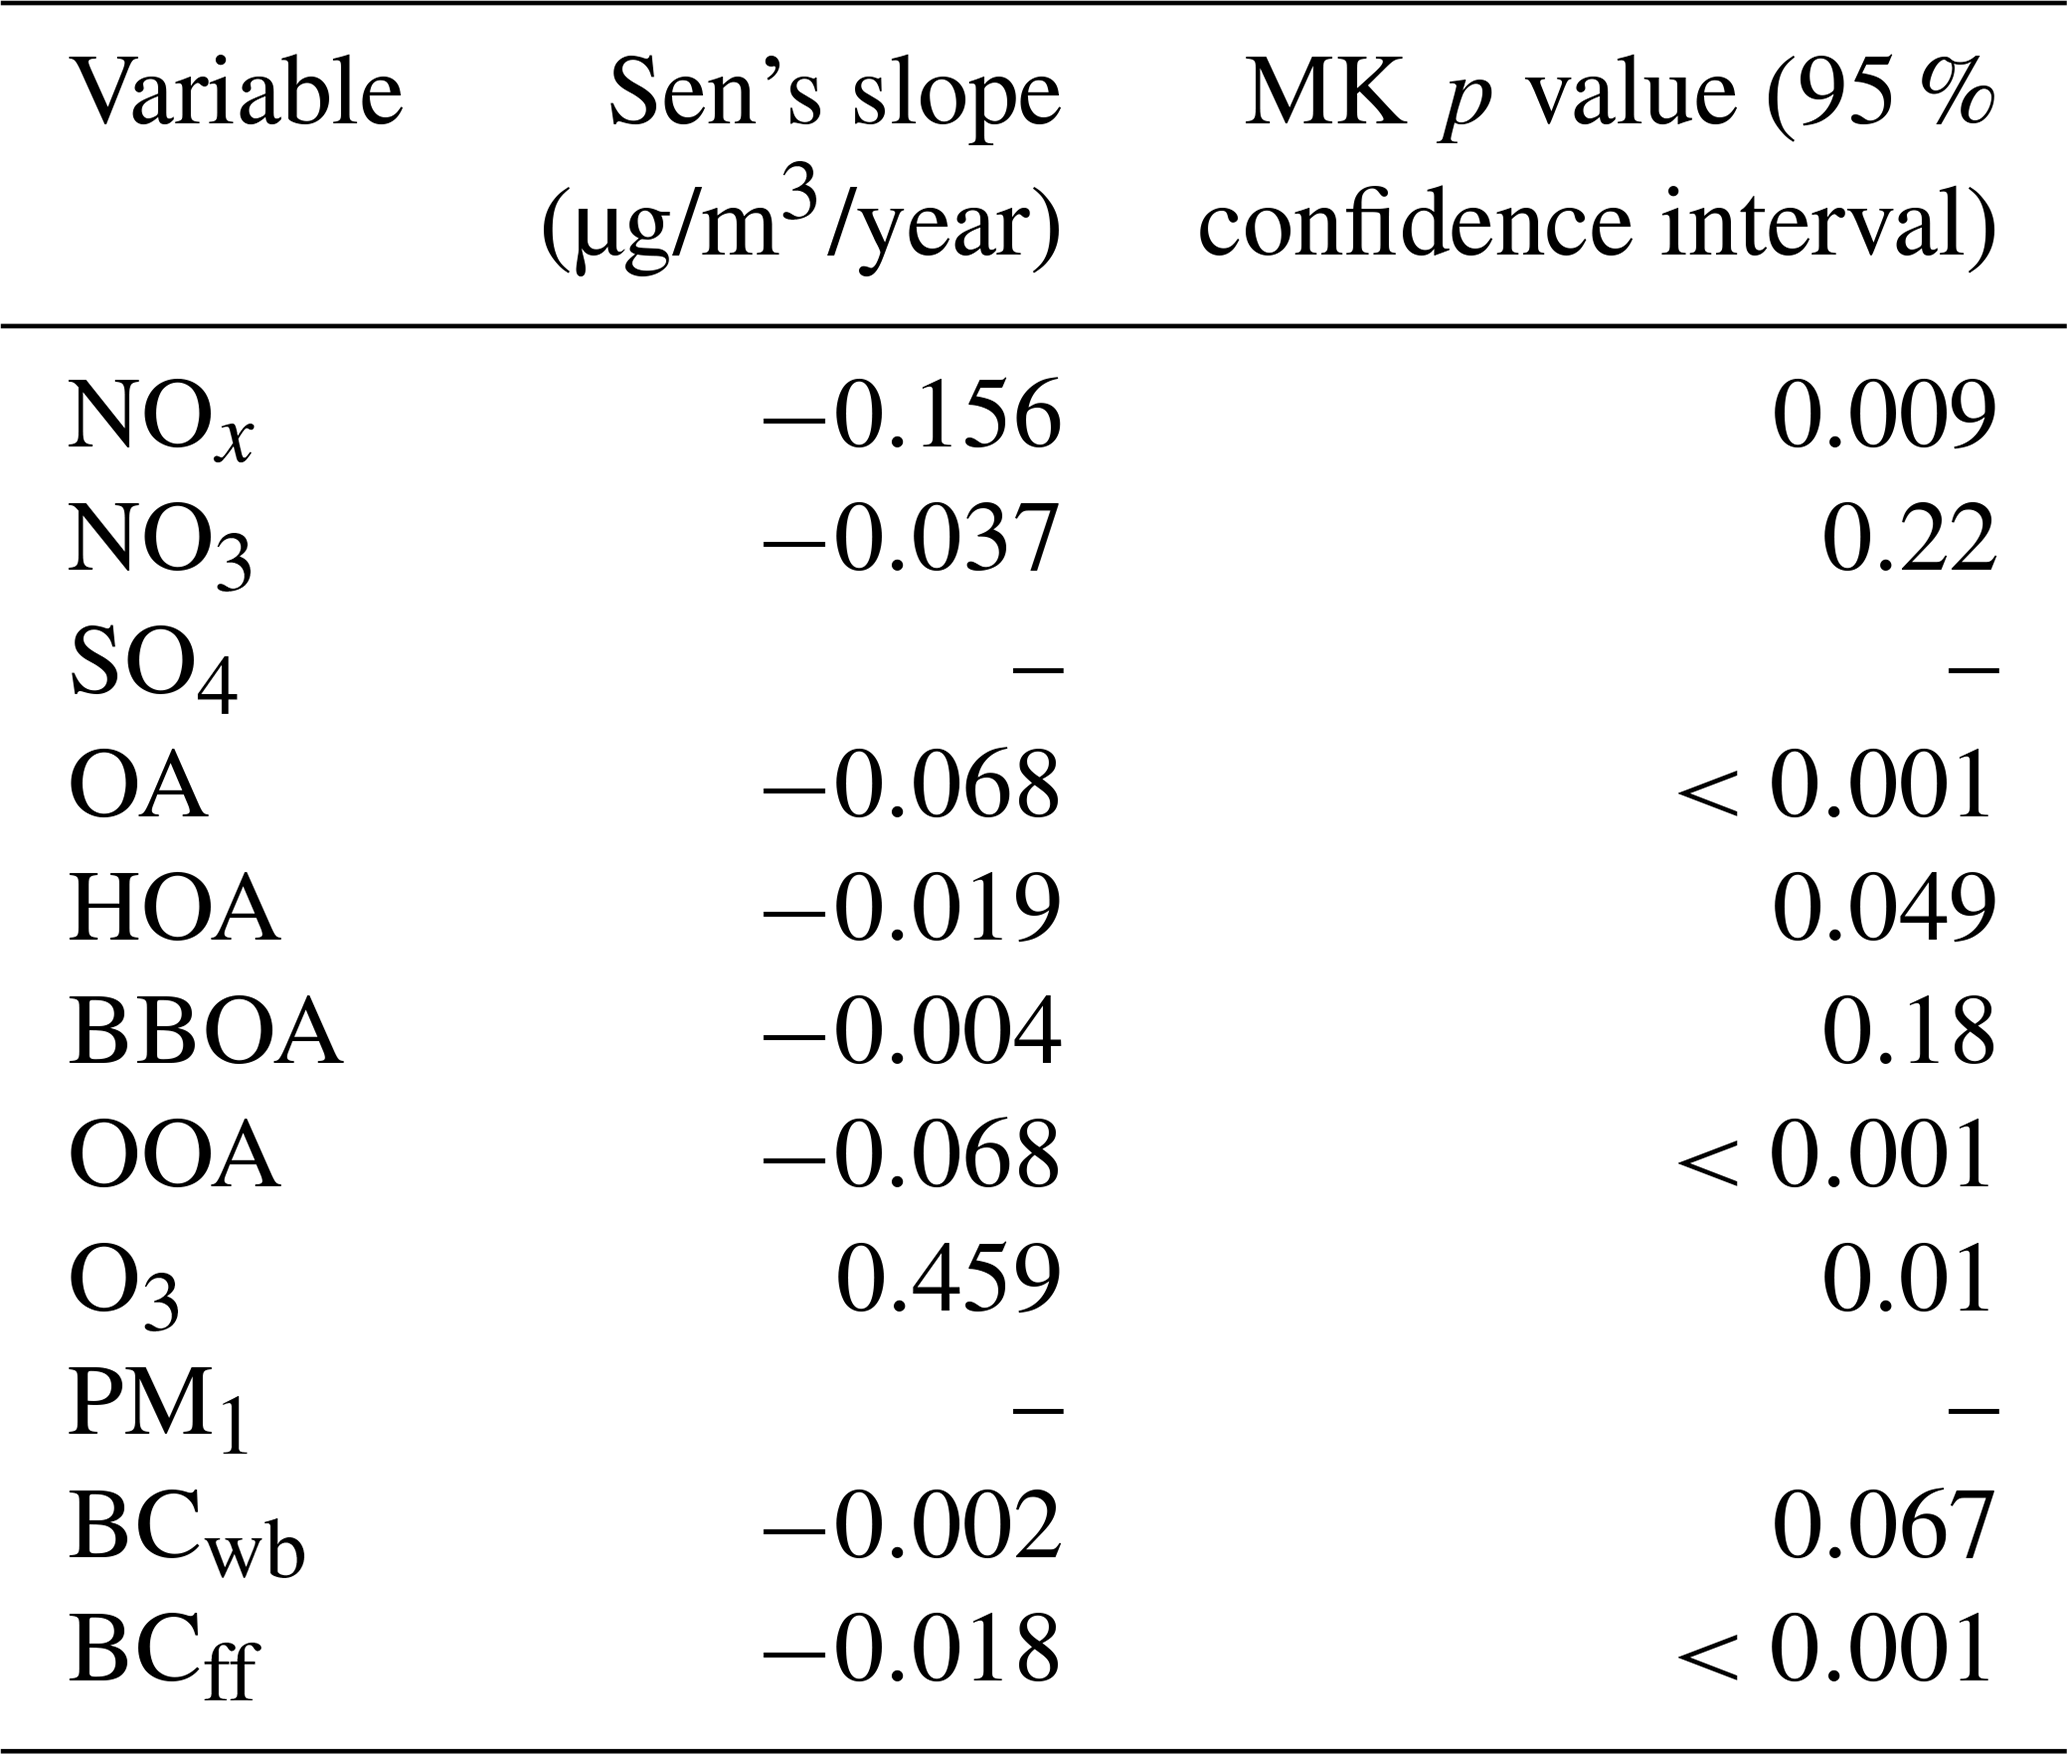
In order to limit the unwanted weight of positive outliers which have poor statistical representativity, the 1 % highest daily concentrations of each variable were removed.
3.2.3 Sensitivity tests
The results presented here primarily depend on the list of analog days that are calculated. The overall analog number is at first determined by the strictness of the correlation coefficients of atmospheric circulation and air mass origin. Selection of best analogy leads to poor statistical representativeness (Fig. S6), with a low number of analog days. It is instead preferable to remove analog days associated with the worst trajectory correlation (Fig. S4). It is noteworthy that little change in the correlation coefficients (Table 2, Scenario 1–4) has little impact on the results (for all variables) presented in this paper (Fig. S7). This can mainly be related to the reasonable change in the number of analog days.
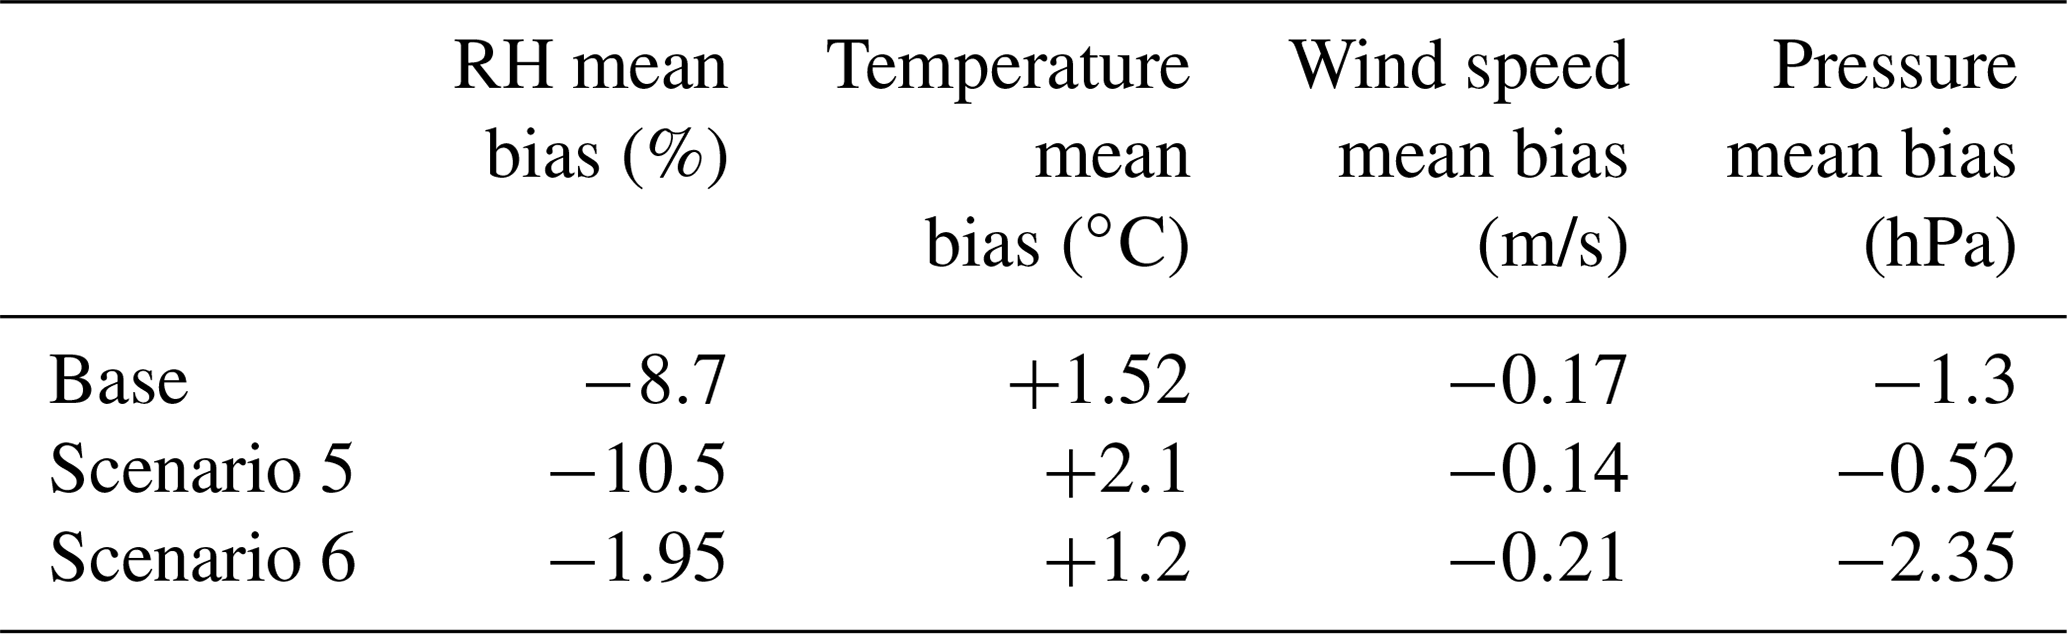
Similarly, the impact of subsequent filtering with temperature and relative humidity was also investigated. To this end, two additional scenarios were considered (Scenario 5–6, Table 2). Scenario 5 and Scenario 6 have limited impact on traffic-related variables (Fig. S7), as opposed to wood-burning tracers and secondary compounds. This especially highlights the essential role of meteorological representativeness in order to characterize the changes of secondary pollution. Indeed, when no temperature and RH filtering is performed (Scenario 5), the highest decrease of NO3 is linked to analog days that are associated with higher RH (Fig. S8a) and lower temperature (Fig. S8b), which favor the partitioning of nitrate in the particulate phase. Scenario 6 has a stricter filtering than the base one and exhibits very good performance regarding the reconstruction of meteorological conditions (Table 3). However, we show that both scenarios have very similar daily NO3 concentration change despite slight discrepancies in meteorological performance. This underlines that the thresholds used in the base scenario are sufficient to provide robust results.
Table 2Acceptability thresholds used in different scenarios to evaluate the sensitivity of our methodology.
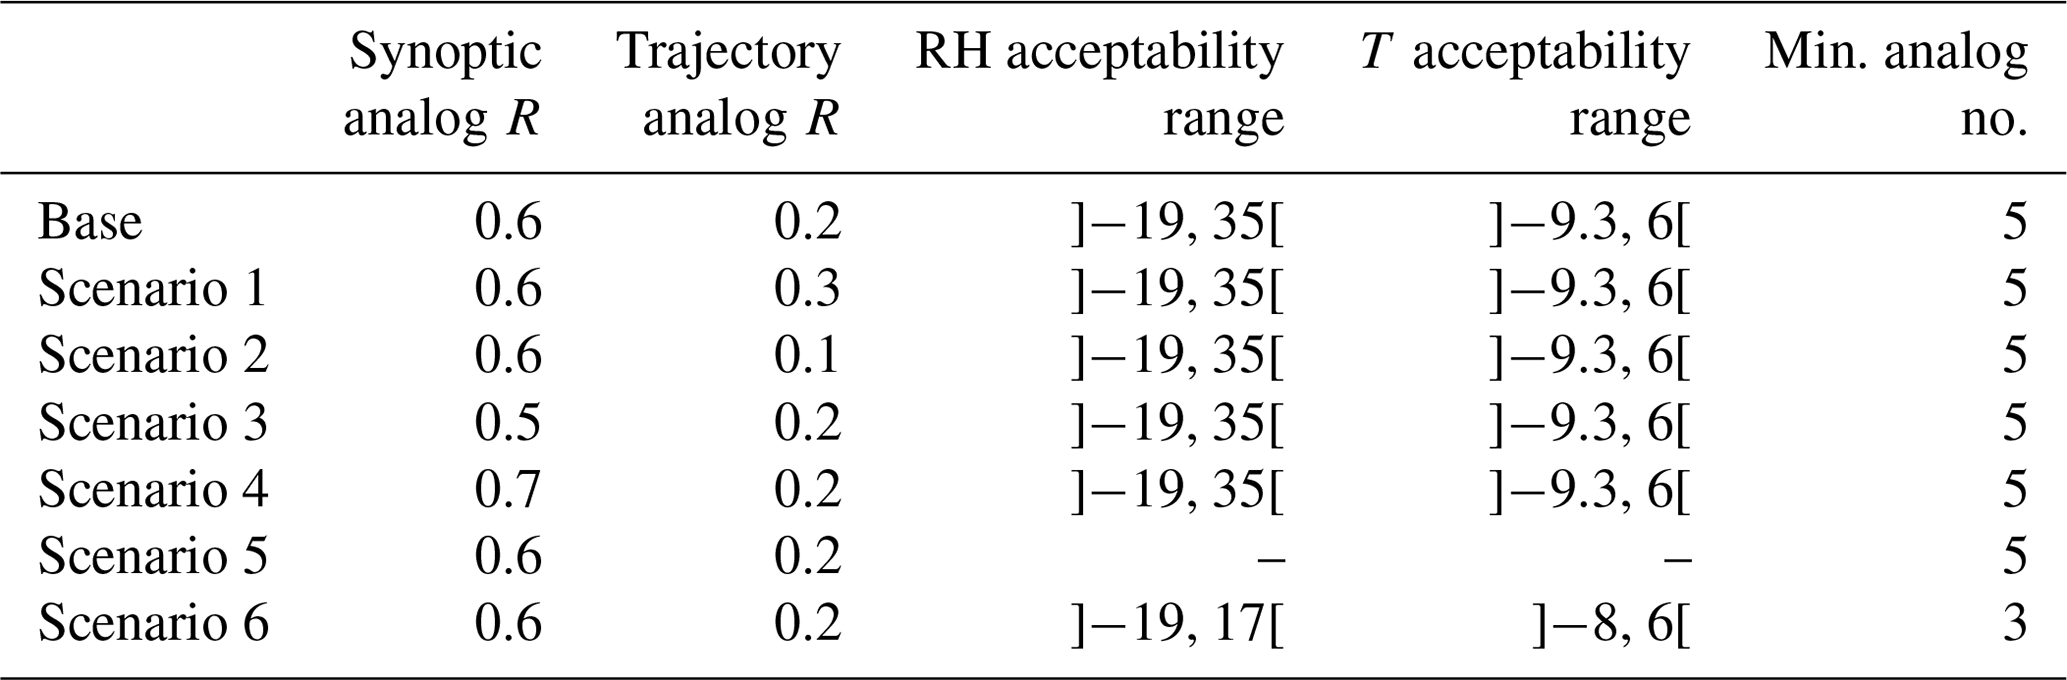
Table 3Performance (expressed as mean bias) of different scenarios to predict meteorological parameters during lockdown.
3.2.4 Performance evaluation
Furthermore, the performance of the analog methodology has been evaluated on a business-as-usual period, from 1 January 2020 to 1 March 2020, similarly to the work of Petetin et al. (2020) and Grange et al. (2021) The construction of the analog list went through the same steps, with the same thresholds. The acceptability range for ΔT and ΔRH moved to ]−5, 4[ and ]−16, 19[, respectively. This can primarily be related to the less extreme climatological conditions of January–February 2020. Mean bias (MB), normalized mean bias (NMB), Pearson's correlation coefficient (r) and the fraction of data within a ratio of 2 (FAC2) have been used for the evaluation.
Scatter plots and metric values are respectively presented in Fig. 3 and Table 4. Results indicate satisfactory performance of all variables during the evaluation period, although the range of observed concentrations remains rather low.
The lower performance of BBOA in terms of co-variations (r=0.45) may be related to the absence of 2019 data, where fewer analog days could lead to higher dispersion but also to the fickleness of the wood-burning source. Still, as presented in the Results section, BBOA variations are consistent with BCwb.
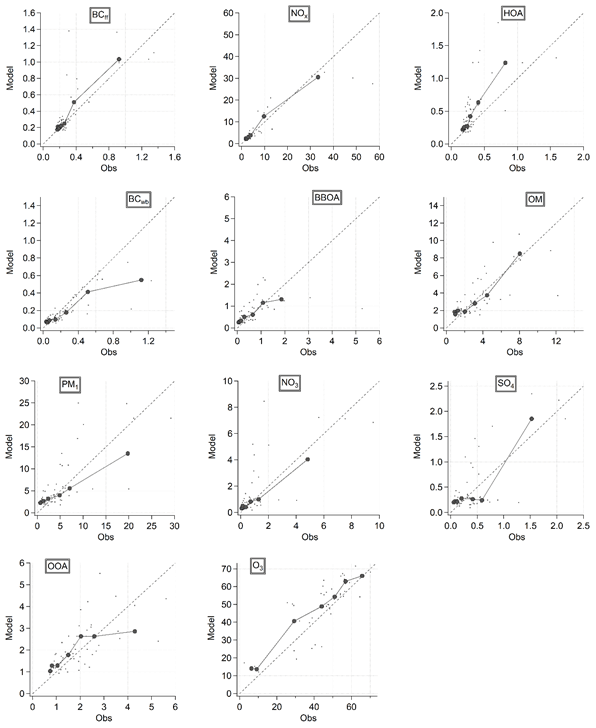
Figure 3Scatter plots of observed versus estimated concentrations by A3Q during the evaluation period of January–February 2020. Dots represent daily values during the evaluation period, and round markers are averages over ranges of observed concentrations.
Table 4Metric values (MB, NMB, FAC2 and r) for the evaluation of A3Q during January–February 2020.

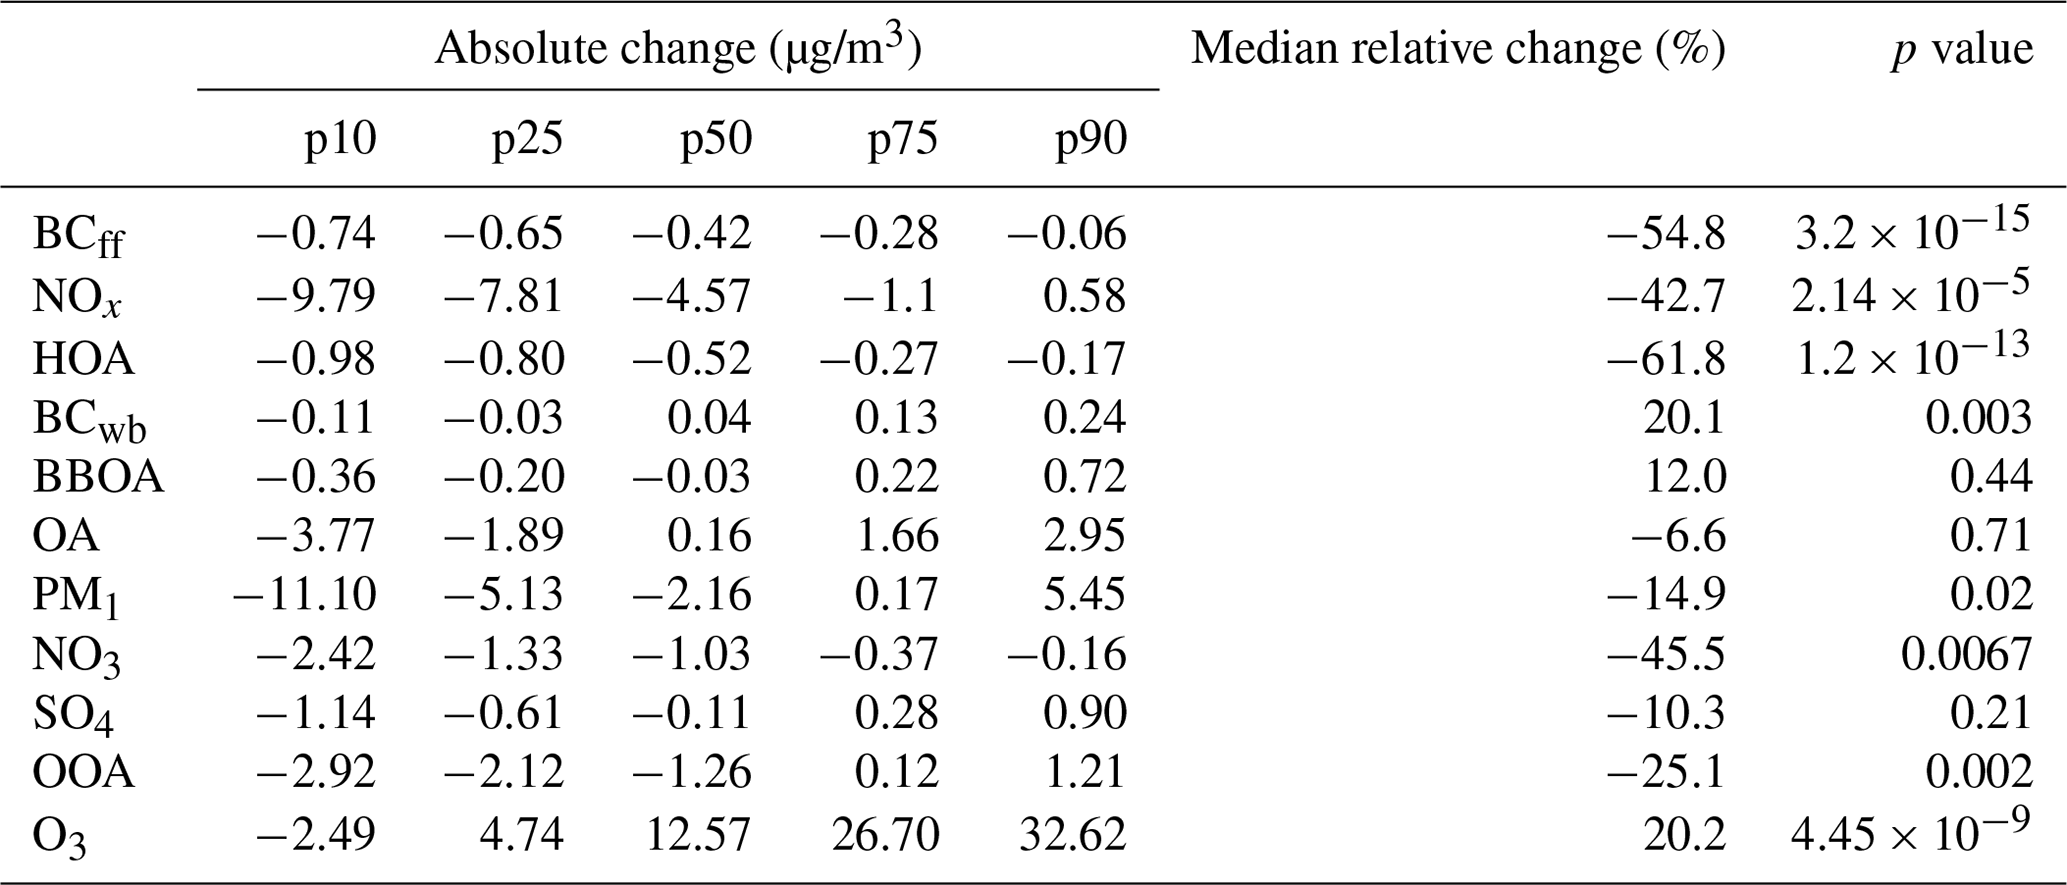
Figure 4 presents the distribution of absolute concentration change for each species during lockdown. Results are further discussed in the following subsections.

Figure 4Absolute changes of ambient concentrations of reactive gases and particulate pollutants due to lockdown. Box plots represent the distribution of daily absolute change (µg/m3); 10th, 25th, 50th, 75th and 90th percentiles were used. Values are presented in Table 5.
Table 5Distribution of absolute concentration change (10th, 25th, 50th, 75th and 90th percentile were used), as well as the median relative change (%). The p values (95 % confidence interval) of the pairing Student t test between observations and analog time series during lockdown.
4.1 Primary sources
Species usually considered as markers for primary traffic emissions (NOx, BCff and HOA) exhibit a median decrease of concentrations by 42 %–62 % (Table 5) at SIRTA. For NOx, this is very consistent with previous results in the Paris region using machine-learning approaches (−42 %, Grange et al., 2021). Moreover, the NOx decrease at SIRTA, a peri-urban background station, also matches the relative decrease calculated for urban and peri-urban stations across the region (−42 % and −39 %, respectively), although absolute changes are graduated (−11 and −16.4 µg/m3 for urban and peri-urban stations, respectively). Although the intensity of the decrease differed from site to site, the temporality of the change was uniform at the regional scale, including SIRTA (Fig. 5). It is also consistent with traffic counting data in the Paris region (https://dataviz.cerema.fr/trafic-routier/, last access: 23 November 2021), with a slow traffic increase throughout the lockdown period.
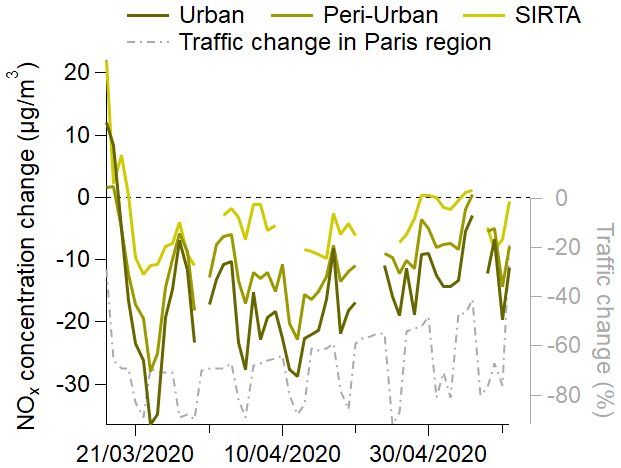
Figure 5Temporal variation of NOx concentration changes at SIRTA and urban and peri-urban background stations of the Paris region.
On the other hand, wood-burning tracers (BCwb and BBOA) exhibit an increase of +20 % and +58 % respectively, which can primarily be related to the stay-at-home order, enhancing emissions of residential heating (Grange et al., 2021). Although absolute change is limited (Fig. 4), by converting BCwb to PMwb, and BCff to PMff, increased PMwb concentrations compensated for or even exceeded the decrease of PMff during specific days (Fig. 6). At the same time, the mean weekly variation of wood burning changed during lockdown (Fig. S9), with increased concentrations during the week, compared to the relatively flat variation in business-as-usual conditions (e.g., +67 % on Fridays). Therefore, lockdown changed both the intensity and temporality of the wood-burning source in the Paris region.
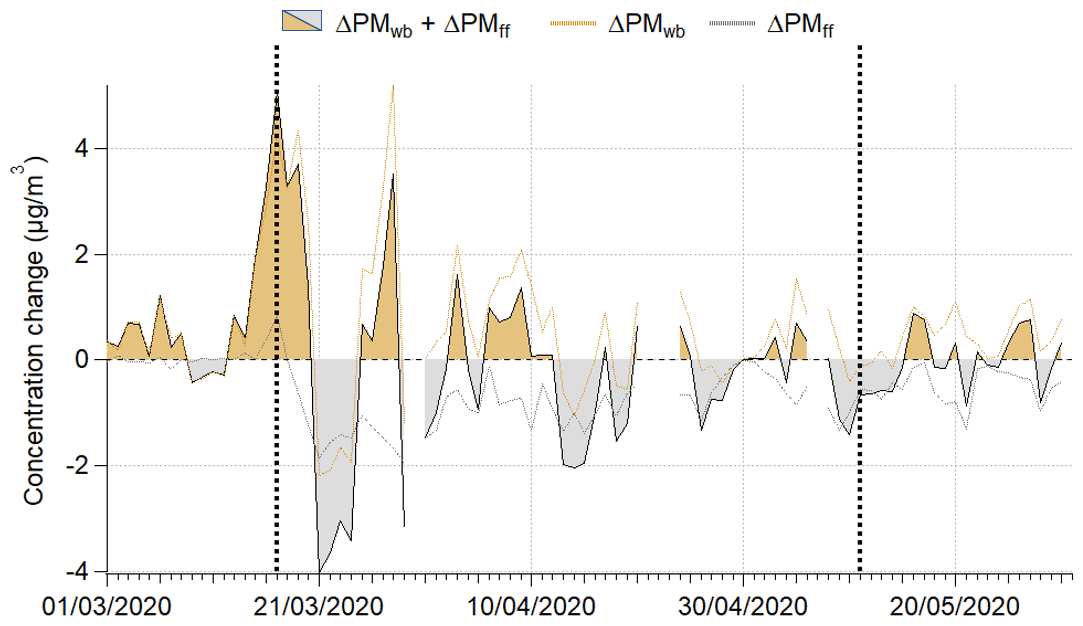
Figure 6Temporal variations of ΔPMwb+ΔPMff during lockdown. Brown shaded area shows compensation of wood burning. Individual PMwb and PMff concentration changes are also displayed with dotted lines. Black vertical lines delimit the start and the end of the lockdown period.
4.2 NOx-induced influence on secondary pollutants
4.2.1 Ozone
Nitrogen oxides play a central role within the atmospheric reactor, enabling the formation of secondary pollutants (Kroll et al., 2020) such as tropospheric ozone and secondary organic and inorganic aerosols (SOAs and SIAs, respectively). Ozone is found to increase by 20 % (Fig. 4). This negative feedback, due to the titration effect of NO, is already well characterized (Reis et al., 2000), and the magnitude of the change inversely follows the one of NOx well (Fig. 7a). A sharp enough decrease of NOx shall tip over ozone formation to a NOx-limited system (Markakis et al., 2014), which may be seen from this relationship, where ozone concentration change stabilizes at +20 µg/m3 for ΔNOx below −10 µg/m3 at SIRTA. Nevertheless, it is worth highlighting that the climatological extreme of spring 2020, with strong positive temperature anomalies, should have also contributed to increased O3 concentrations, as previously emphasized for Europe (Meleux et al., 2007). Even though meteorology is taken into account by the A3Q method, the unique character of this springtime heatwave inherently blurs the discrimination between ambient temperature and NOx impacts on ozone formation. This limitation would also occur for any other statistical approaches, such as machine learning. Figure 7b shows indeed that some of the highest ΔO3 values are associated with high temperatures (daily average >18 ∘C), concomitantly with substantial decrease of NOx concentrations. On the other hand, positive ΔO3 values are also obtained for rather low temperature (<10 ∘C) and highest decreases of NOx, which means that in this case the increase of O3 is only NOx-related.
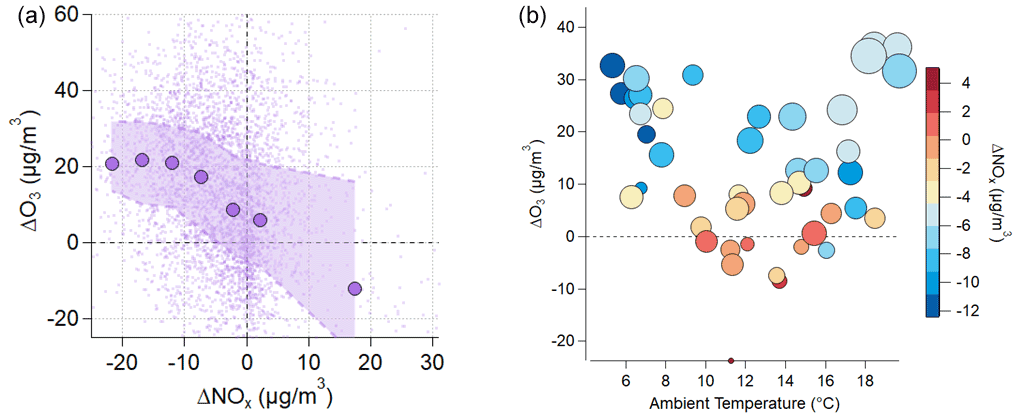
Figure 7(a) Concentration change (µg/m3) of O3 versus concentration change of NOx (µg/m3). Colored dots correspond to 100 resampling runs following the inverse normal distribution law, whose mid-height width is the standard deviation of each analog day. Markers represent the median, bottom and top and the shaded area the 25th and 75th percentile, respectively. (b) Concentration change of O3 versus ambient temperature. Marker's color and size are respectively function of ΔNOx and observed O3 concentrations.
4.2.2 Particulate nitrate
Springtime in the Paris region is usually associated with PM pollution episodes that are mainly triggered by particulate ammonium nitrate (Beekmann et al., 2015) (NH4NO3), resulting from the reaction between HNO3 (NOx oxidation) and ammonia (NH3). For that matter, agricultural activities (the major source of NH3 in western Europe; Fortems-Cheiney et al., 2016) were neither stopped nor restrained during lockdown. Therefore, business-as-usual ammonia concentrations can reasonably be assumed, and since the formation regime of nitrate in Paris has previously been found to be NOx-limited (Petetin et al., 2016), a change of regime to NH3-limited is highly unlikely (Viatte et al., 2021). Nitrate exhibits a median decrease of 45 %. The decrease linearly follows the one of NOx (Fig. 8), although both compounds differ in terms of reactivity and footprint. A similar relationship is shown when using urban and peri-urban NOx concentrations (Fig. S10), which is consistent with the temporal correlation of ΔNOx throughout the Paris region (Fig. 5). However, a slight shouldering of the decrease for urban NOx can be noticed, which implies that this efficiency regarding NO3 is related to the amplitude of NOx reduction.
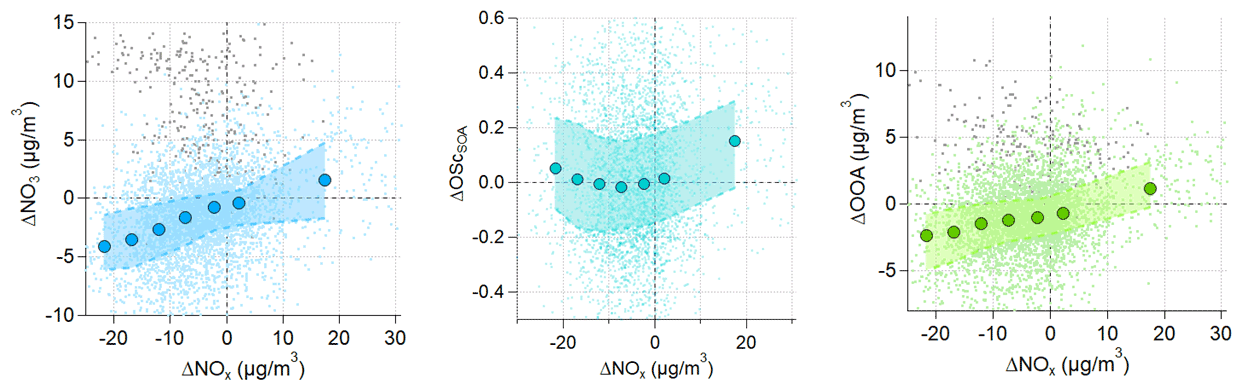
Figure 8Same as Fig. 7a, for NO3, OOA and OScSOA. Grey dots correspond to days with predominant long-range transport, identified by a positive NO3 and OOA concentration change concomitantly with a SO4 concentration peak (Fig. 9), which have been excluded from percentile calculations. Markers represent the median, bottom and top and the shaded area the 25th and 75th percentile, respectively.
This result suggests the importance of rapid ammonium nitrate formation at a rather local scale (Petit et al., 2015; Wang et al., 2020) but shall not eclipse continental advection that can occur in Paris, especially during springtime (e.g., Beekmann et al., 2015). To that end, sulfate shows little change (−8 %) with no clear statistical significance (p>0.05), which indicates a similar influence of long-range pollution advection and that SO2 sources in eastern Europe (Pay et al., 2012) may not have experienced a significant decrease. Consistent information on that matter is unfortunately still rather scarce at the European scale. Filonchyk et al. (2020) recently showed an increase of SO2 in several Polish urban areas, although their methodology does not take meteorology into account. The Carbon Monitor initiative (Z. Liu et al., 2020) also records a decrease of 11.5 % of the power sector in Europe during 2020 compared to 2019. On specific days, positive peaks of ΔNO3 are concomitant with higher SO4 concentrations (Fig. 9). Since SO4 has been previously found to be mainly advected in northern France (e.g., Favez et al., 2021), also supported by the cluster analysis in Fig. S3b, this means that nitrate was, in these cases, mainly advected from long-range transport, despite a decrease of NOx. It is also concomitant with higher nitrogen oxidation ratio (NOR = NO3 (NO2 + NO3)) values and the highest positive change (top panel of Fig. 9), suggesting a higher efficiency of HNO3 formation. Given the NOx NO3 relationship (Fig. 8a), and hypothesizing that a decrease of locally formed NO3 is always associated with a decrease of NOx concentration at the measurement site, long-range-transported NO3 can be assumed to overcompensate for the regional decrease (Eq. 4).
where is the daily concentration change at ti, calculated from A3Q. is calculated from the relationship with ΔNOx (Fig. 8).
For instance, on 28 March and 19 April, the total ΔNO3 respectively of 11.7 and 6.7 µg/m3 could be apportioned into a regional decrease of −5.5 and −3.7 µg/m3, with an advected contribution of 17.2 and 10.4 µg/m3, respectively. This result would need to be further investigated and confirmed by, e.g., chemistry transport model simulations, but it still underlines the deleterious impact of long-range transport.
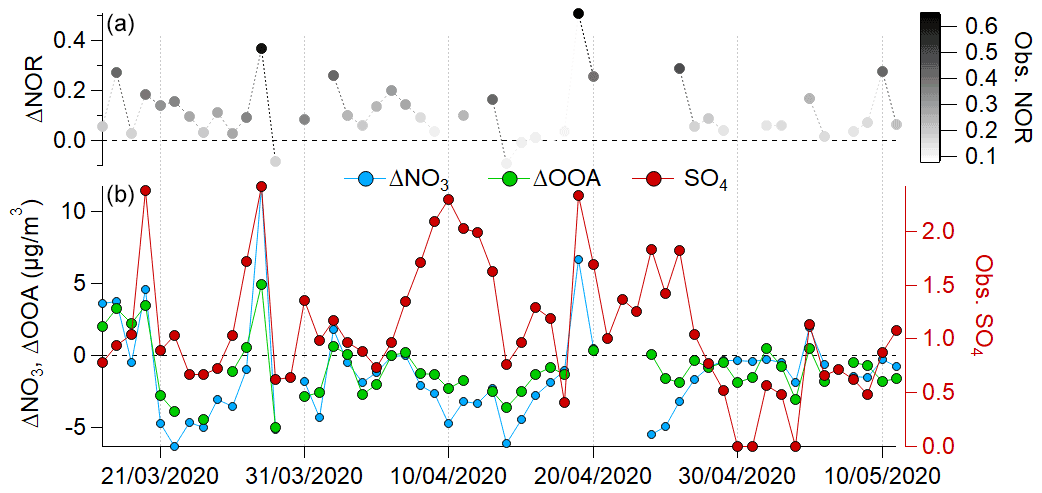
Figure 9Temporal variation during LP2020 of (b) ΔNO3, ΔOOA and SO4 concentrations (µg/m3) and (a) ΔNOR values, color-coded by observed NOR.
4.2.3 Secondary organic aerosols
Secondary organic aerosols, proxied by OOA concentrations, exhibit a decrease of 25 % compared to business-as-usual conditions. Given the multitude of SOA precursors and formation pathways, this decrease can be linked to numerous factors. Indeed, Srivastava et al. (2019) recently highlighted the complexity of the SOA fractions in the Paris region during springtime. The lack of specific organic tracers prevents us from thoroughly apportioning SOA over the long-term analysis period of 2012–2020. As a consequence, the apparent decrease of 25 % may derive from several compensatory feedbacks, which cannot be individually characterized here. Although SOA in Paris can not only be related to traffic (Crippa et al., 2013; Srivastava et al., 2019), the decrease of OOA seems to be also correlated with ΔNOx (Fig. 8b). NOx steps in SOA formation notably when reacting with peroxy radicals (R-O2), resulting from volatile organic compound (VOC) oxidation with the hydroxyl radical. The exceptional amount of sunshine during lockdown may have positively influenced the availability of OH• for the initialization of SOA formation. However, no direct observations available at SIRTA can support this assumption directly. The odd oxygen Ox (), a conservative tracer of photochemical chemistry (Sun et al., 2020), shows a slight increase (+9 %). But unlike the findings of Herndon et al. (2008) in Mexico City during spring, only a moderate correlation is found with OOA (r2=0.4, slope = 0.068, following the recommendation of removing wood-burning- and long-range-transport-related episodes). This may be linked to the rather low Ox concentrations (60–110 µg/m3) during the lockdown period.
Despite very limited change on average (<1 %), daily OScSOA is found to differ from business-as-usual conditions, adopting a comma-like shape, as a function of ΔNOx (Fig. 8c). Indeed, although ΔOScSOA decreases until ΔNO µg/m3, it increases back for higher NOx decreases, reaching a median of +0.05. Despite being moderate, this behavior may reflect some changes in SOA chemistry, notably regarding gas-phase oxidation of anthropogenic precursors, as highlighted in Herndon et al. (2008). But at this stage, the whole equation comprises too many unknown variables (from VOC precursors to particulate end products) in order to fully describe the impacts of lockdown measures on the numerous SOA formation mechanisms; this remains arduously apprehensible.
4.3 Implications for air quality
The lockdown enforced during spring 2020 in Paris corresponds to a real-life emission scenario, representing the extreme case of a quasi-total interruption of the vehicular traffic source. Up to now, no mitigation policy could have gone that far. From the results presented here, the impact of NOx control on submicron primary traffic-related aerosols (BCff and HOA) remains limited, mainly because both do not contribute much to PM1 concentrations during spring (5.0 % and 5.7 % respectively). However, it is worth mentioning that a higher impact can be expected within PM10 in the vicinity of traffic, related to the decrease of non-exhaust emissions (brake/tire wear and resuspension). This fraction has recently been highlighted as particularly harmful for human health (Daellenbach et al., 2020); therefore NOx control shall provide a significant co-benefit for that specific matter.
Reducing the concentrations of secondary compounds is an arduous task because mitigation policies can inherently only focus on the reduction of primary pollutants. But regional NOx reduction appears to have the potential to be an efficient mitigation policy regarding secondary aerosols (mainly NO3 and SOA to a lesser extent), which account on average for more than half of PM1 during spring at SIRTA (respectively 28.9 % and 31.4 %). Moreover, although the traffic ban has been applied consistently over the lockdown period, the decrease of NOx concentrations at SIRTA ranges from 0 to around −20 µg/m3. Adding the impact of NOx on BCff, HOA, NO3, NH4 (considering neutralized aerosols) and OOA together, the corresponding change of PM-related material ranges from −2 to −9 µg/m3 (Fig. 10). The efficiency of NOx mitigation shall therefore be put in perspective with meteorological conditions (e.g., horizontal dispersion, since lowest ΔNOx values are associated with continental air masses), as well as the vertical atmospheric dynamic (Dupont et al., 2016). It is also worth mentioning that in the case of long-range pollution transport episodes, substantial efforts to reduce emissions at the city scale will not be enough to counterbalance additional advected material, as shown previously for NO3 and OOA.
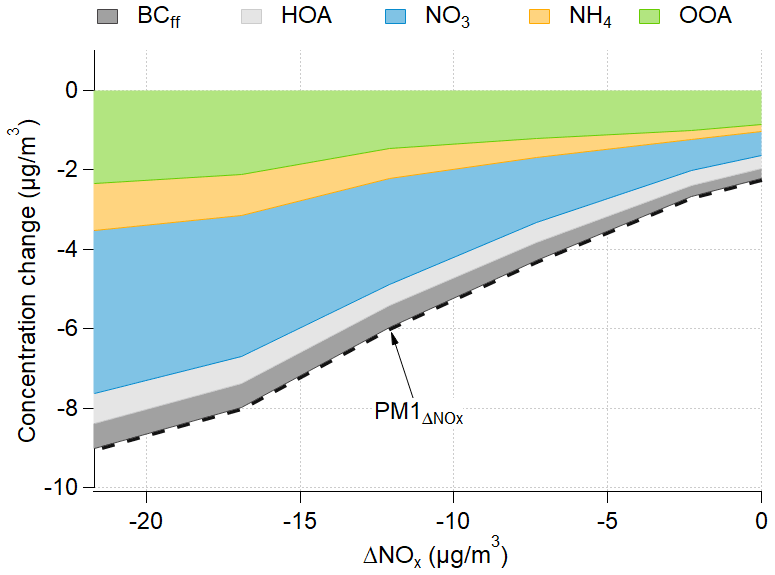
Figure 10Impact of regional NOx concentration change on PM-related species (BCff, HOA, NO3, NH4, OOA). ΔNH4 was estimated from ΔNO3, assuming aerosol neutralization (Petit et al., 2015).
The COVID-19 pandemic led to life-changing restrictions, with strict stay-at-home orders in western Europe during spring 2020. As a consequence, light-duty vehicular traffic was almost completely stopped in urban areas, such as the Paris region. Despite tragic death records, lockdowns represent an open-air mitigation experiment, in a period that is usually associated with PM pollution episodes dominated by secondary material. However, the characterization of a change in chemical composition is not straightforward because meteorology can strongly contribute to the temporal variability of atmospheric pollutants. To that end, a unique methodology was built in order to compare each day of lockdown with analog days having similar meteorology. The analogy was based on three successive meteorological layers, where synoptic, regional and local meteorology was considered. This innovative approach was applied to a comprehensive in situ dataset, acquired at the SIRTA observatory, a suburban station located 20 km southwest of Paris. The A3Q method provided satisfactory results over a business-as-usual period, which ensures a robust characterization of concentration changes in the Paris region during lockdown. Yet, A3Q requires a long-term dataset whose length is 9 years +; otherwise results can rapidly suffer from shortfall of representativeness. Also the analogy needs to be carefully inspected, notably in terms of local meteorology. Indeed, the first synoptic layer appears to be not quite enough to capture all the specificity of the sampling site.
The unprecedented drop of traffic commuting due to the stay-at-home order led to an expected decrease of primary traffic pollutants NOx (−42 %), HOA (−62 %) and BCff (−55 %), as well as an increase of ozone concentrations due to the lesser contribution of the O3 sink by NO. Concomitantly, primary particles related to residential wood burning show a slight increase (+12 %–20 %). The decrease of NOx (−42 %) triggered positive feedbacks regarding secondary aerosols, especially nitrate and SOA, which are found to drop by 42 % and 25 % respectively. A NOx relationship suggests the significance of rather local pollution formation, contrasting with previous results in the region. The decrease of NO3 was compensated for sporadically during long-range transport episodes. The oxidation state of SOA is also seen to vary with NOx concentration change, but our understanding of the phenomena involved still remains limited, notably due to the lack of long-term VOC in situ observations in the Paris region.
Finally, the proposed A3Q method may be considered an efficient tool to monitor and quantify the impact of lockdowns in other urban areas more precisely. It could also be useful for the quantitative evaluation of emergency mitigation policies settled during pollution episodes.
In situ measurements at SIRTA are available through the EBAS database (https://ebas.nilu.no, last access: 23 November 2021). Ozone data from Airparif are available at https://www.airparif-asso.fr (last access: 23 November 2021). GDAS files for back-trajectory calculation are available at https://www.arl.noaa.gov/hysplit/hysplit/ (last access: 23 November 2021). The ZeFir procedure is available at https://sites.google.com/site/zefirproject/ (last access: 23 November 2021).
The supplement related to this article is available online at: https://doi.org/10.5194/acp-21-17167-2021-supplement.
JEP, OF, VG, YZ, JS, LS, FT, NB, TA and JCD contributed to the availability of in situ measurements at SIRTA. YZ performed the source apportionment analysis between 2012 and 2020. RV provided the list of analog days from synoptic circulation. JCD and MH demonstrated the feasibility of the analog method on SIRTA in situ data. JEP performed the additional analyses, with contributions from LS. JEP wrote the paper, with assistance from all authors.
The contact author has declared that neither they nor their co-authors have any competing interests.
Publisher's note: Copernicus Publications remains neutral with regard to jurisdictional claims in published maps and institutional affiliations.
This article is part of the special issue “Quantifying the impacts of stay-at-home policies on atmospheric composition and properties of aerosol and clouds over the European regions using ACTRIS related observations (ACP/AMT inter-journal SI)”. It is not associated with a conference.
The authors would like to thank Robin Aujay-Plouzeau, Roland Sarda-Estève, Dominique Baisnée and Vincent Crenn for their contribution in maintaining data acquisition at SIRTA. Christophe Boitel and Marc-Antoine Drouin are acknowledged for their support in data management. This work also greatly benefited from discussions within the COLOSSAL COST action CA16109.
This research has been supported by the European Commission, Seventh Framework Programme (ACTRIS (grant no. 262254)), the European Commission, H2020 Research Infrastructures ACTRIS projects (ACTRIS 2 (grant no. 654109)), the National Center for Scientific Research (CNRS), the French alternatives energies and Atomic Energy Commission (CEA), the French Ministry of Environment, and the DIM-R2DS program from the Ile-de-France region. This work has also been supported by CNRS-INSU for the measurements performed at the SI-SIRTA and those within the long-term monitoring aerosol program SNO-CLAP, both of which are components of the ACTRIS French Research Instructure and whose data are hosted at the AERIS data center (https://www.aeris-data.fr/, last access: 23 November 2021).
This paper was edited by Manvendra K. Dubey and reviewed by two anonymous referees.
Aiken, A. C., DeCarlo, P. F., Kroll, J. H., Worsnop, D. R., Huffman, J. A., Docherty, K. S., Ulbrich, I. M., Mohr, C., Kimmel, J. R., and Sueper, D.: and ratios of primary, secondary, and ambient organic aerosols with high-resolution time-of-flight aerosol mass spectrometry, Environ. Sci. Technol., 42, 4478–4485, 2008.
Anderson, R. M., Heesterbeek, H., Klinkenberg, D., and Hollingsworth, T. D.: How will country-based mitigation measures influence the course of the COVID-19 epidemic?, The Lancet, 395, 931–934, https://doi.org/10.1016/S0140-6736(20)30567-5, 2020.
Beekmann, M., Prévôt, A. S. H., Drewnick, F., Sciare, J., Pandis, S. N., Denier van der Gon, H. A. C., Crippa, M., Freutel, F., Poulain, L., Ghersi, V., Rodriguez, E., Beirle, S., Zotter, P., von der Weiden-Reinmüller, S.-L., Bressi, M., Fountoukis, C., Petetin, H., Szidat, S., Schneider, J., Rosso, A., El Haddad, I., Megaritis, A., Zhang, Q. J., Michoud, V., Slowik, J. G., Moukhtar, S., Kolmonen, P., Stohl, A., Eckhardt, S., Borbon, A., Gros, V., Marchand, N., Jaffrezo, J. L., Schwarzenboeck, A., Colomb, A., Wiedensohler, A., Borrmann, S., Lawrence, M., Baklanov, A., and Baltensperger, U.: In situ, satellite measurement and model evidence on the dominant regional contribution to fine particulate matter levels in the Paris megacity, Atmos. Chem. Phys., 15, 9577–9591, https://doi.org/10.5194/acp-15-9577-2015, 2015.
Bigi, A. and Vogt, F. P. A.: mannkendall/R: First release (v1.0.0), Zenodo, https://doi.org/10.5281/zenodo.4134633, 2020.
Bressi, M., Cavalli, F., Putaud, J. P., Fröhlich, R., Petit, J.-E., Aas, W., Äijälä, M., Alastuey, A., Allan, J. D., Aurela, M., Berico, M., Bougiatioti, A., Bukowiecki, N., Canonaco, F., Crenn, V., Dusanter, S., Ehn, M., Elsasser, M., Flentje, H., Graf, P., Green, D. C., Heikkinen, L., Hermann, H., Holzinger, R., Hueglin, C., Keernik, H., Kiendler-Scharr, A., Kubelová, L., Lunder, C., Maasikmets, M., Makeš, O., Malaguti, A., Mihalopoulos, N., Nicolas, J. B., O'Dowd, C., Ovadnevaite, J., Petralia, E., Poulain, L., Priestman, M., Riffault, V., Ripoll, A., Schlag, P., Schwarz, J., Sciare, J., Slowik, J., Sosedova, Y., Stavroulas, I., Teinemaa, E., Via, M., Vodička, P., Williams, P. I., Wiedensohler, A., Young, D. E., Zhang, S., Favez, O., Minguillón, M. C., and Prevot, A. S. H.: A European aerosol phenomenology - 7: High-time resolution chemical characteristics of submicron particulate matter across Europe, Atmos. Environ., 10, 100108, https://doi.org/10.1016/j.aeaoa.2021.100108, 2021.
Budisulistiorini, S. H., Canagaratna, M. R., Croteau, P. L., Baumann, K., Edgerton, E. S., Kollman, M. S., Ng, N. L., Verma, V., Shaw, S. L., Knipping, E. M., Worsnop, D. R., Jayne, J. T., Weber, R. J., and Surratt, J. D.: Intercomparison of an Aerosol Chemical Speciation Monitor (ACSM) with ambient fine aerosol measurements in downtown Atlanta, Georgia, Atmos. Meas. Tech., 7, 1929–1941, https://doi.org/10.5194/amt-7-1929-2014, 2014.
Canagaratna, M. R., Jimenez, J. L., Kroll, J. H., Chen, Q., Kessler, S. H., Massoli, P., Hildebrandt Ruiz, L., Fortner, E., Williams, L. R., Wilson, K. R., Surratt, J. D., Donahue, N. M., Jayne, J. T., and Worsnop, D. R.: Elemental ratio measurements of organic compounds using aerosol mass spectrometry: characterization, improved calibration, and implications, Atmos. Chem. Phys., 15, 253–272, https://doi.org/10.5194/acp-15-253-2015, 2015.
Canonaco, F., Crippa, M., Slowik, J. G., Baltensperger, U., and Prévôt, A. S. H.: SoFi, an IGOR-based interface for the efficient use of the generalized multilinear engine (ME-2) for the source apportionment: ME-2 application to aerosol mass spectrometer data, Atmos. Meas. Tech., 6, 3649–3661, https://doi.org/10.5194/amt-6-3649-2013, 2013.
Canonaco, F., Slowik, J. G., Baltensperger, U., and Prévôt, A. S. H.: Seasonal differences in oxygenated organic aerosol composition: implications for emissions sources and factor analysis, Atmos. Chem. Phys., 15, 6993–7002, https://doi.org/10.5194/acp-15-6993-2015, 2015.
Canonaco, F., Tobler, A., Chen, G., Sosedova, Y., Slowik, J. G., Bozzetti, C., Daellenbach, K. R., El Haddad, I., Crippa, M., Huang, R.-J., Furger, M., Baltensperger, U., and Prévôt, A. S. H.: A new method for long-term source apportionment with time-dependent factor profiles and uncertainty assessment using SoFi Pro: application to 1 year of organic aerosol data, Atmos. Meas. Tech., 14, 923–943, https://doi.org/10.5194/amt-14-923-2021, 2021.
Cattiaux, J., Yiou, P., and Vautard, R.: Dynamics of future seasonal temperature trends and extremes in Europe: a multi-model analysis from CMIP3, Clim. Dynam., 38, 1949–1964, https://doi.org/10.1007/s00382-011-1211-1, 2012.
Chang, Y., Huang, R., Ge, X., Huang, X., Hu, J., Duan, Y., Zou, Z., Liu, X., and Lehmann, M. F.: Puzzling Haze Events in China During the Coronavirus (COVID-19) Shutdown, Geophys. Res. Lett., 47, e2020GL088533, https://doi.org/10.1029/2020GL088533, 2020.
Chiriaco, M., Dupont, J.-C., Bastin, S., Badosa, J., Lopez, J., Haeffelin, M., Chepfer, H., and Guzman, R.: ReOBS: a new approach to synthesize long-term multi-variable dataset and application to the SIRTA supersite, Earth Syst. Sci. Data, 10, 919–940, https://doi.org/10.5194/essd-10-919-2018, 2018.
Collaud Coen, M., Andrews, E., Bigi, A., Martucci, G., Romanens, G., Vogt, F. P. A., and Vuilleumier, L.: Effects of the prewhitening method, the time granularity, and the time segmentation on the Mann–Kendall trend detection and the associated Sen's slope, Atmos. Meas. Tech., 13, 6945–6964, https://doi.org/10.5194/amt-13-6945-2020, 2020.
Crenn, V., Sciare, J., Croteau, P. L., Verlhac, S., Fröhlich, R., Belis, C. A., Aas, W., Äijälä, M., Alastuey, A., Artiñano, B., Baisnée, D., Bonnaire, N., Bressi, M., Canagaratna, M., Canonaco, F., Carbone, C., Cavalli, F., Coz, E., Cubison, M. J., Esser-Gietl, J. K., Green, D. C., Gros, V., Heikkinen, L., Herrmann, H., Lunder, C., Minguillón, M. C., Močnik, G., O'Dowd, C. D., Ovadnevaite, J., Petit, J.-E., Petralia, E., Poulain, L., Priestman, M., Riffault, V., Ripoll, A., Sarda-Estève, R., Slowik, J. G., Setyan, A., Wiedensohler, A., Baltensperger, U., Prévôt, A. S. H., Jayne, J. T., and Favez, O.: ACTRIS ACSM intercomparison – Part 1: Reproducibility of concentration and fragment results from 13 individual Quadrupole Aerosol Chemical Speciation Monitors (Q-ACSM) and consistency with co-located instruments, Atmos. Meas. Tech., 8, 5063–5087, https://doi.org/10.5194/amt-8-5063-2015, 2015.
Crippa, M., DeCarlo, P. F., Slowik, J. G., Mohr, C., Heringa, M. F., Chirico, R., Poulain, L., Freutel, F., Sciare, J., Cozic, J., Di Marco, C. F., Elsasser, M., Nicolas, J. B., Marchand, N., Abidi, E., Wiedensohler, A., Drewnick, F., Schneider, J., Borrmann, S., Nemitz, E., Zimmermann, R., Jaffrezo, J.-L., Prévôt, A. S. H., and Baltensperger, U.: Wintertime aerosol chemical composition and source apportionment of the organic fraction in the metropolitan area of Paris, Atmos. Chem. Phys., 13, 961–981, https://doi.org/10.5194/acp-13-961-2013, 2013.
Daellenbach, K. R., Uzu, G., Jiang, J., Cassagnes, L.-E., Leni, Z., Vlachou, A., Stefenelli, G., Canonaco, F., Weber, S., Segers, A., Kuenen, J. J. P., Schaap, M., Favez, O., Albinet, A., Aksoyoglu, S., Dommen, J., Baltensperger, U., Geiser, M., El Haddad, I., Jaffrezo, J.-L., and Prévôt, A. S. H.: Sources of particulate-matter air pollution and its oxidative potential in Europe, Nature, 587, 414–419, https://doi.org/10.1038/s41586-020-2902-8, 2020.
Dantas, G., Siciliano, B., França, B. B., da Silva, C. M., and Arbilla, G.: The impact of COVID-19 partial lockdown on the air quality of the city of Rio de Janeiro, Brazil, Sci. Total Environ., 729, 139085, https://doi.org/10.1016/j.scitotenv.2020.139085, 2020.
Drinovec, L., Močnik, G., Zotter, P., Prévôt, A. S. H., Ruckstuhl, C., Coz, E., Rupakheti, M., Sciare, J., Müller, T., Wiedensohler, A., and Hansen, A. D. A.: The “dual-spot” Aethalometer: an improved measurement of aerosol black carbon with real-time loading compensation, Atmos. Meas. Tech., 8, 1965–1979, https://doi.org/10.5194/amt-8-1965-2015, 2015.
Dupont, J.-C., Haeffelin, M., Badosa, J., Elias, T., Favez, O., Petit, J. E., Meleux, F., Sciare, J., Crenn, V., and Bonne, J. L.: Role of the boundary layer dynamics effects on an extreme air pollution event in Paris, Atmos. Env., 141, 571–579, https://doi.org/10.1016/j.atmosenv.2016.06.061, 2016.
Favez, O., Weber, S., Petit, J.-E., Alleman, L. Y., Albinet, A., Riffault, V., Chazeau, B., Amodeo, T., Salameh, D., Zhang, Y., Srivastava, D., Samaké, A., Aujay-Plouzeau, R., Papin, A., Bonnaire, N., Boullanger, C., Chatain, M., Chevrier, F., Detournay, A., Dominik-Sègue, M., Falhun, R., Garbin, C., Ghersi, V., Grignion, G., Levigoureux, G., Pontet, S., Rangognio, J., Zhang, S., Besombes, J.-L., Conil, S., Uzu, G., Savarino, J., Marchand, N., Gros, V., Marchand, C., Jaffrezo, J.-L., and Leoz-Garziandia, E.: Overview of the French Operational Network for In Situ Observation of PM Chemical Composition and Sources in Urban Environments (CARA Program), Atmosphere, 12, 207, https://doi.org/10.3390/atmos12020207, 2021.
Filonchyk, M., Hurynovich, V., and Yan, H.: Impact of Covid-19 lockdown on air quality in the Poland, Eastern Europe, Environ. Res., 198, 110454, https://doi.org/10.1016/j.envres.2020.110454, 2020.
Fortems-Cheiney, A., Dufour, G., Hamaoui-Laguel, L., Foret, G., Siour, G., Van Damme, M., Meleux, F., Coheur, P.-F., Clerbaux, C., Clarisse, L., Favez, O., Wallasch, M., and Beekmann, M.: Unaccounted variability in NH3 agricultural sources detected by IASI contributing to European spring haze episode: Agricultural NH3 Detected by IASI, Geophys. Res. Lett., 43, 5475–5482, https://doi.org/10.1002/2016GL069361, 2016.
Freney, E., Zhang, Y., Croteau, P., Amodeo, T., Williams, L., Truong, F., Petit, J.-E., Sciare, J., Sarda-Esteve, R., Bonnaire, N., Arumae, T., Aurela, M., Bougiatioti, A., Mihalopoulos, N., Coz, E., Artinano, B., Crenn, V., Elste, T., Heikkinen, L., Poulain, L., Wiedensohler, A., Herrmann, H., Priestman, M., Alastuey, A., Stavroulas, I., Tobler, A., Vasilescu, J., Zanca, N., Canagaratna, M., Carbone, C., Flentje, H., Green, D., Maasikmets, M., Marmureanu, L., Minguillon, M. C., Prevot, A. S. H., Gros, V., Jayne, J., and Favez, O.: The second ACTRIS inter-comparison (2016) for Aerosol Chemical Speciation Monitors (ACSM): Calibration protocols and instrument performance evaluations, Aerosol Sci. Technol., 53, 830–842, https://doi.org/10.1080/02786826.2019.1608901, 2019.
Fröhlich, R., Crenn, V., Setyan, A., Belis, C. A., Canonaco, F., Favez, O., Riffault, V., Slowik, J. G., Aas, W., Aijälä, M., Alastuey, A., Artiñano, B., Bonnaire, N., Bozzetti, C., Bressi, M., Carbone, C., Coz, E., Croteau, P. L., Cubison, M. J., Esser-Gietl, J. K., Green, D. C., Gros, V., Heikkinen, L., Herrmann, H., Jayne, J. T., Lunder, C. R., Minguillón, M. C., Močnik, G., O'Dowd, C. D., Ovadnevaite, J., Petralia, E., Poulain, L., Priestman, M., Ripoll, A., Sarda-Estève, R., Wiedensohler, A., Baltensperger, U., Sciare, J., and Prévôt, A. S. H.: ACTRIS ACSM intercomparison – Part 2: Intercomparison of ME-2 organic source apportionment results from 15 individual, co-located aerosol mass spectrometers, Atmos. Meas. Tech., 8, 2555–2576, https://doi.org/10.5194/amt-8-2555-2015, 2015.
Gkatzelis, G. I., Gilman, J. B., Brown, S. S., Eskes, H., Gomes, A. R., Lange, A. C., McDonald, B. C., Peischl, J., Petzold, A., Thompson, C. R., and Kiendler-Scharr, A.: The global impacts of COVID-19 lockdowns on urban air pollution, Elementa-Sci. Anthrop., 9, 00176, https://doi.org/10.1525/elementa.2021.00176, 2021.
Grange, S. K., Lee, J. D., Drysdale, W. S., Lewis, A. C., Hueglin, C., Emmenegger, L., and Carslaw, D. C.: COVID-19 lockdowns highlight a risk of increasing ozone pollution in European urban areas, Atmos. Chem. Phys., 21, 4169–4185, https://doi.org/10.5194/acp-21-4169-2021, 2021.
Haeffelin, M., Barthès, L., Bock, O., Boitel, C., Bony, S., Bouniol, D., Chepfer, H., Chiriaco, M., Cuesta, J., Delanoë, J., Drobinski, P., Dufresne, J.-L., Flamant, C., Grall, M., Hodzic, A., Hourdin, F., Lapouge, F., Lemaître, Y., Mathieu, A., Morille, Y., Naud, C., Noël, V., O'Hirok, W., Pelon, J., Pietras, C., Protat, A., Romand, B., Scialom, G., and Vautard, R.: SIRTA, a ground-based atmospheric observatory for cloud and aerosol research, Ann. Geophys., 23, 253–275, https://doi.org/10.5194/angeo-23-253-2005, 2005.
Herndon, S. C., Onasch, T. B., Wood, E. C., Kroll, J. H., Canagaratna, M. R., Jayne, J. T., Zavala, M. A., Knighton, W. B., Mazzoleni, C., Dubey, M. K., Ulbrich, I. M., Jimenez, J. L., Seila, R., de Gouw, J. A., de Foy, B., Fast, J., Molina, L. T., Kolb, C. E., and Worsnop, D. R.: Correlation of secondary organic aerosol with odd oxygen in Mexico City, Geophys. Res. Lett., 35, L15804, https://doi.org/10.1029/2008GL034058, 2008.
Kalnay, E., Kanamitsu, M., Kistler, R., Collins, W., Deaven, D., Gandin, L., Iredell, M., Saha, S., White, G., Woollen, J., Zhu, Y., Leetmaa, A., Reynolds, B., Chelliah, M., Ebisuzaki, W., Higgins, W., Janowiak, J., Mo, K. C., Ropelewski, C., Wang, J., Jenne, R., and Joseph, D.: The NCEP/NCAR 40-Year Reanalysis Project, B. Am. Meteorol. Soc., 77, 437–472, https://doi.org/10.1175/1520-0477(1996)077<0437:TNYRP>2.0.CO;2, 1996.
Kroll, J. H., Donahue, N. M., Jimenez, J. L., Kessler, S. H., Canagaratna, M. R., Wilson, K. R., Altieri, K. E., Mazzoleni, L. R., Wozniak, A. S., Bluhm, H., Mysak, E. R., Smith, J. D., Kolb, C. E., and Worsnop, D. R.: Carbon oxidation state as a metric for describing the chemistry of atmospheric organic aerosol, Nat. Chem., 3, 133–139, https://doi.org/10.1038/nchem.948, 2011.
Kroll, J. H., Heald, C. L., Cappa, C. D., Farmer, D. K., Fry, J. L., Murphy, J. G., and Steiner, A. L.: The complex chemical effects of COVID-19 shutdowns on air quality, Nat. Chem., 12, 777–779, https://doi.org/10.1038/s41557-020-0535-z, 2020.
Le, T., Wang, Y., Liu, L., Yang, J., Yung, Y. L., Li, G., and Seinfeld, J. H.: Unexpected air pollution with marked emission reductions during the COVID-19 outbreak in China, Science, 369, 702–706, https://doi.org/10.1126/science.abb7431, 2020.
Liu, Q., Harris, J. T., Chiu, L. S., Sun, D., Houser, P. R., Yu, M., Duffy, D. Q., Little, M. M., and Yang, C.: Spatiotemporal impacts of COVID-19 on air pollution in California, USA, Sci. Total Environ., 750, 141592, https://doi.org/10.1016/j.scitotenv.2020.141592, 2020.
Liu, Z., Ciais, P., Deng, Z., Davis, S. J., Zheng, B., Wang, Y., Cui, D., Zhu, B., Dou, X., Ke, P., Sun, T., Guo, R., Zhong, H., Boucher, O., Bréon, F.-M., Lu, C., Guo, R., Xue, J., Boucher, E., Tanaka, K., and Chevallier, F.: Carbon Monitor, a near-real-time daily dataset of global CO2 emission from fossil fuel and cement production, Sci. Data, 7, 392, https://doi.org/10.1038/s41597-020-00708-7, 2020.
Lorenz, E. N.: The predictability of a flow which possesses many scales of motion, Tellus, 21, 289–307, https://doi.org/10.1111/j.2153-3490.1969.tb00444.x, 1969.
Mahato, S., Pal, S., and Ghosh, K. G.: Effect of lockdown amid COVID-19 pandemic on air quality of the megacity Delhi, India, Sci. Total Environ., 730, 139086, https://doi.org/10.1016/j.scitotenv.2020.139086, 2020.
Manchanda, C., Kumar, M., Singh, V., Faisal, M., Hazarika, N., Shukla, A., Lalchandani, V., Goel, V., Thamban, N., Ganguly, D., and Tripathi, S. N.: Variation in chemical composition and sources of PM2.5 during the COVID-19 lockdown in Delhi, Environ. Int., 153, 106541, https://doi.org/10.1016/j.envint.2021.106541, 2021.
Markakis, K., Valari, M., Colette, A., Sanchez, O., Perrussel, O., Honore, C., Vautard, R., Klimont, Z., and Rao, S.: Air quality in the mid-21st century for the city of Paris under two climate scenarios; from the regional to local scale, Atmos. Chem. Phys., 14, 7323–7340, https://doi.org/10.5194/acp-14-7323-2014, 2014.
Meleux, F., Solmon, F., and Giorgi, F.: Increase in summer European ozone amounts due to climate change, Atmos. Environ., 41, 7577–7587, https://doi.org/10.1016/j.atmosenv.2007.05.048, 2007.
Middlebrook, A. M., Bahreini, R., Jimenez, J. L., and Canagaratna, M. R.: Evaluation of Composition-Dependent Collection Efficiencies for the Aerodyne Aerosol Mass Spectrometer using Field Data, Aerosol Sci. Technol., 46, 258–271, https://doi.org/10.1080/02786826.2011.620041, 2012.
Ng, N. L., Herndon, S. C., Trimborn, A., Canagaratna, M. R., Croteau, P. L., Onasch, T. B., Sueper, D., Worsnop, D. R., Zhang, Q., and Sun, Y. L.: An aerosol chemical speciation monitor (ACSM) for routine monitoring of the composition and mass concentrations of ambient aerosol, Aerosol Sci. Technol., 45, 780–794, 2011.
Otmani, A., Benchrif, A., Tahri, M., Bounakhla, M., Chakir, E. M., El Bouch, M., and Krombi, M.: Impact of Covid-19 lockdown on PM10, SO2 and NO2 concentrations in Salé City (Morocco), Sci. Total Environ., 735, 139541, https://doi.org/10.1016/j.scitotenv.2020.139541, 2020.
Paatero, P. and Tapper, U.: Positive matrix factorization: A non-negative factor model with optimal utilization of error estimates of data values, Environmetrics, 5, 111–126, https://doi.org/10.1002/env.3170050203, 1994.
Pay, M. T., Jiménez-Guerrero, P., and Baldasano, J. M.: Assessing sensitivity regimes of secondary inorganic aerosol formation in Europe with the CALIOPE-EU modeling system, Atmos. Environ., 51, 146–164, https://doi.org/10.1016/j.atmosenv.2012.01.027, 2012.
Petetin, H., Sciare, J., Bressi, M., Gros, V., Rosso, A., Sanchez, O., Sarda-Estève, R., Petit, J.-E., and Beekmann, M.: Assessing the ammonium nitrate formation regime in the Paris megacity and its representation in the CHIMERE model, Atmos. Chem. Phys., 16, 10419–10440, https://doi.org/10.5194/acp-16-10419-2016, 2016.
Petetin, H., Bowdalo, D., Soret, A., Guevara, M., Jorba, O., Serradell, K., and Pérez García-Pando, C.: Meteorology-normalized impact of the COVID-19 lockdown upon NO2 pollution in Spain, Atmos. Chem. Phys., 20, 11119–11141, https://doi.org/10.5194/acp-20-11119-2020, 2020.
Petit, J.-E., Favez, O., Sciare, J., Canonaco, F., Croteau, P., Močnik, G., Jayne, J., Worsnop, D., and Leoz-Garziandia, E.: Submicron aerosol source apportionment of wintertime pollution in Paris, France by double positive matrix factorization (PMF2) using an aerosol chemical speciation monitor (ACSM) and a multi-wavelength Aethalometer, Atmos. Chem. Phys., 14, 13773–13787, https://doi.org/10.5194/acp-14-13773-2014, 2014.
Petit, J.-E., Favez, O., Sciare, J., Crenn, V., Sarda-Estève, R., Bonnaire, N., Močnik, G., Dupont, J.-C., Haeffelin, M., and Leoz-Garziandia, E.: Two years of near real-time chemical composition of submicron aerosols in the region of Paris using an Aerosol Chemical Speciation Monitor (ACSM) and a multi-wavelength Aethalometer, Atmos. Chem. Phys., 15, 2985–3005, https://doi.org/10.5194/acp-15-2985-2015, 2015.
Petit, J.-E., Amodeo, T., Meleux, F., Bessagnet, B., Menut, L., Grenier, D., Pellan, Y., Ockler, A., Rocq, B., Gros, V., Sciare, J., and Favez, O.: Characterising an intense PM pollution episode in March 2015 in France from multi-site approach and near real time data: Climatology, variabilities, geographical origins and model evaluation, Atmos. Environ., 155, 68–84, https://doi.org/10.1016/j.atmosenv.2017.02.012, 2017a.
Petit, J.-E., Favez, O., Albinet, A., and Canonaco, F.: A user-friendly tool for comprehensive evaluation of the geographical origins of atmospheric pollution: Wind and trajectory analyses, Environ. Model. Softw., 88, 183–187, https://doi.org/10.1016/j.envsoft.2016.11.022, 2017b.
Poulain, L., Spindler, G., Grüner, A., Tuch, T., Stieger, B., van Pinxteren, D., Petit, J.-E., Favez, O., Herrmann, H., and Wiedensohler, A.: Multi-year ACSM measurements at the central European research station Melpitz (Germany) – Part 1: Instrument robustness, quality assurance, and impact of upper size cutoff diameter, Atmos. Meas. Tech., 13, 4973–4994, https://doi.org/10.5194/amt-13-4973-2020, 2020.
Raynaud, D., Hingray, B., Zin, I., Anquetin, S., Debionne, S., and Vautard, R.: Atmospheric analogues for physically consistent scenarios of surface weather in Europe and Maghreb: Atmospheric analogues for physically consistent surface weather, Int. J. Climatol., 37, 2160–2176, https://doi.org/10.1002/joc.4844, 2017.
Reis, S., Simpson, D., Friedrich, R., Jonson, J. E., Unger, S., and Obermeier, A.: Road traffic emissions – predictions of future contributions to regional ozone levels in Europe, Atmos. Environ., 34, 4701–4710, https://doi.org/10.1016/S1352-2310(00)00202-8, 2000.
Sandradewi, J., Prévôt, A. S. H., Szidat, S., Perron, N., Alfarra, M. R., Lanz, V. A., Weingartner, E., and Baltensperger, U.: Using Aerosol Light Absorption Measurements for the Quantitative Determination of Wood Burning and Traffic Emission Contributions to Particulate Matter, Environ. Sci. Technol., 42, 3316–3323, https://doi.org/10.1021/es702253m, 2008.
Sicard, P., De Marco, A., Agathokleous, E., Feng, Z., Xu, X., Paoletti, E., Rodriguez, J. J. D., and Calatayud, V.: Amplified ozone pollution in cities during the COVID-19 lockdown, Sci. Total Environ., 735, 139542, https://doi.org/10.1016/j.scitotenv.2020.139542, 2020.
Siciliano, B., Dantas, G., da Silva, C. M., and Arbilla, G.: Increased ozone levels during the COVID-19 lockdown: Analysis for the city of Rio de Janeiro, Brazil, Sci. Total Environ., 737, 139765, https://doi.org/10.1016/j.scitotenv.2020.139765, 2020.
Srivastava, D., Favez, O., Petit, J.-E., Zhang, Y., Sofowote, U. M., Hopke, P. K., Bonnaire, N., Perraudin, E., Gros, V., Villenave, E., and Albinet, A.: Speciation of organic fractions does matter for aerosol source apportionment. Part 3: Combining off-line and on-line measurements, Sci. Total Environ., 690, 944–955, https://doi.org/10.1016/j.scitotenv.2019.06.378, 2019.
Stein, A. F., Draxler, R. R., Rolph, G. D., Stunder, B. J. B., Cohen, M. D., and Ngan, F.: NOAA's HYSPLIT Atmospheric Transport and Dispersion Modeling System, B. Am. Meteorol. Soc., 96, 2059–2077, https://doi.org/10.1175/BAMS-D-14-00110.1, 2015.
Stirnberg, R., Cermak, J., Kotthaus, S., Haeffelin, M., Andersen, H., Fuchs, J., Kim, M., Petit, J.-E., and Favez, O.: Meteorology-driven variability of air pollution (PM1) revealed with explainable machine learning, Atmos. Chem. Phys., 21, 3919–3948, https://doi.org/10.5194/acp-21-3919-2021, 2021.
Sun, Y., Lei, L., Zhou, W., Chen, C., He, Y., Sun, J., Li, Z., Xu, W., Wang, Q., Ji, D., Fu, P., Wang, Z., and Worsnop, D. R.: A chemical cocktail during the COVID-19 outbreak in Beijing, China: Insights from six-year aerosol particle composition measurements during the Chinese New Year holiday, Sci. Total Environ., 742, 140739, https://doi.org/10.1016/j.scitotenv.2020.140739, 2020.
Tian, J., Wang, Q., Zhang, Y., Yan, M., Liu, H., Zhang, N., Ran, W., and Cao, J.: Impacts of primary emissions and secondary aerosol formation on air pollution in an urban area of China during the COVID-19 lockdown, Environ. Int., 150, 106426, https://doi.org/10.1016/j.envint.2021.106426, 2021.
Toscano, D. and Murena, F.: The Effect on Air Quality of Lockdown Directives to Prevent the Spread of SARS-CoV-2 Pandemic in Campania Region – Italy: Indications for a Sustainable Development, Sustainability, 12, 5558, https://doi.org/10.3390/su12145558, 2020.
Van Den Dool, H. M.: Searching for analogues, how long must we wait?, Tellus A, 46, 314–324, https://doi.org/10.1034/j.1600-0870.1994.t01-2-00006.x, 1994.
Vautard, R., Colette, A., van Meijgaard, E., Meleux, F., Jan van Oldenborgh, G., Otto, F., Tobin, I., and Yiou, P.: Attribution of Wintertime Anticyclonic Stagnation Contributing to Air Pollution in Western Europe, B. Am. Meteorol. Soc., 99, S70–S75, https://doi.org/10.1175/BAMS-D-17-0113.1, 2018.
Viatte, C., Petit, J.-E., Yamanouchi, S., Van Damme, M., Doucerain, C., Germain-Piaulenne, E., Gros, V., Favez, O., Clarisse, L., Coheur, P.-F., Strong, K., and Clerbaux, C.: Ammonia and PM2.5 Air Pollution in Paris during the 2020 COVID Lockdown, Atmos., 12, 160, https://doi.org/10.3390/atmos12020160, 2021.
Wang, P., Chen, K., Zhu, S., Wang, P., and Zhang, H.: Severe air pollution events not avoided by reduced anthropogenic activities during COVID-19 outbreak, Resour. Conserv. Recycl., 158, 104814, https://doi.org/10.1016/j.resconrec.2020.104814, 2020.
Yiou, P., Salameh, T., Drobinski, P., Menut, L., Vautard, R., and Vrac, M.: Ensemble reconstruction of the atmospheric column from surface pressure using analogues, Clim. Dynam., 41, 1333–1344, https://doi.org/10.1007/s00382-012-1626-3, 2013.
Zhang, Y., Favez, O., Petit, J.-E., Canonaco, F., Truong, F., Bonnaire, N., Crenn, V., Amodeo, T., Prévôt, A. S. H., Sciare, J., Gros, V., and Albinet, A.: Six-year source apportionment of submicron organic aerosols from near-continuous highly time-resolved measurements at SIRTA (Paris area, France), Atmos. Chem. Phys., 19, 14755–14776, https://doi.org/10.5194/acp-19-14755-2019, 2019.
Zorita, E. and Storch, H. V.: The Analog Method as a Simple Statistical Downscaling Technique: Comparison with More Complicated Methods, J. Climate, 12, 2474–2489, 1999.
Zotter, P., Herich, H., Gysel, M., El-Haddad, I., Zhang, Y., Močnik, G., Hüglin, C., Baltensperger, U., Szidat, S., and Prévôt, A. S. H.: Evaluation of the absorption Ångström exponents for traffic and wood burning in the Aethalometer-based source apportionment using radiocarbon measurements of ambient aerosol, Atmos. Chem. Phys., 17, 4229–4249, https://doi.org/10.5194/acp-17-4229-2017, 2017.
- Abstract
- Introduction
- In situ characterization of the atmospheric composition
- Methodology to estimate the impact of lockdown measures: an attempt to compare apples to apples
- Results and discussion
- Conclusion
- Data availability
- Author contributions
- Competing interests
- Disclaimer
- Special issue statement
- Acknowledgements
- Financial support
- Review statement
- References
- Supplement