the Creative Commons Attribution 4.0 License.
the Creative Commons Attribution 4.0 License.
 | 24 Nov 2021
Investigation of near-global daytime boundary layer height using high-resolution radiosondes: first results and comparison with ERA5, MERRA-2, JRA-55, and NCEP-2 reanalyses
Jianping Guo
Jian Zhang
Hong Liao
Shaodong Zhang
Kaiming Huang
Yanmin Lv
Jia Shao
Tao Yu
Bing Tong
Jian Li
Tianning Su
Steve H. L. Yim
Ad Stoffelen
Panmao Zhai
Xiaofeng Xu
The planetary boundary layer (PBL) governs the vertical transport of mass, momentum, and moisture between the surface and the free atmosphere, and thus the determination of PBL height (BLH) is recognized as crucial for air quality, weather, and climate analysis. Although reanalysis products can provide important insight into the global view of BLH in a seamless way, the BLH observed in situ on a global scale remains poorly understood due to the lack of high-resolution (1 or 2 s) radiosonde measurements. The present study attempts to establish a near-global BLH climatology at synoptic times (00:00 and 12:00 UTC) and in the daytime using high-resolution radiosonde measurements over 300 radiosonde sites worldwide for the period 2012 to 2019, which is then compared against the BLHs obtained from four reanalysis datasets, including ERA5, MERRA-2, JRA-55, and NCEP-2. The variations in daytime BLH exhibit large spatial and temporal dependence, and as a result the BLH maxima are generally discerned over the regions such as the western United States and western China, in which the balloon launch times mostly correspond to the afternoon. The diurnal variations in BLH are revealed with a peak at 17:00 local solar time (LST). The most promising reanalysis product is ERA5, which underestimates BLH by around 130 m as compared to radiosondes released during daytime. In addition, MERRA-2 is a well-established product and has an underestimation of around 160 m. JRA-55 and NCEP-2 might produce considerable additional uncertainties, with a much larger underestimation of up to 400 m. The largest bias in the reanalysis data appears over the western United States and western China, and it might be attributed to the maximal BLH in the afternoon when the PBL has risen. Statistical analyses further indicate that the biases of reanalysis BLH products are positively associated with orographic complexity, as well as the occurrence of static instability. To our best knowledge, this study presents the first near-global view of high-resolution radiosonde-derived boundary layer height and provides a quantitative assessment of the four frequently used reanalysis products.
- Article
(11697 KB) - Full-text XML
-
Supplement
(1036 KB) - BibTeX
- EndNote


The planetary boundary layer (PBL) is where most exchanges of heat, moisture, momentum, and mass take place between the free atmosphere and ground surface (Stull, 1988; Liu and Liang, 2010). The spatial and temporal variability in the PBL, through a variety of physical processes, has a profound influence on research fields such as air quality (Stull, 1988; Li et al., 2017), convective storm (Oliveira et al., 2020), and global warming (Davy and Esau, 2016), among others. It is well known to be influenced by radiative cooling at night and by downward solar radiation reaching the ground surface at daytime, respectively, forming a stable boundary layer (SBL) and convective boundary layer (CBL), with a typical PBL depth (BLH) of less than 500 m and 1–3 km (Zhang et al., 2020a), respectively. For climate models, most of the PBL processes occur at sub-grid scales and thus are either underrepresented or not fully represented (von Engeln and Teixeira, 2013). Meanwhile, there are many problems in elucidating the PBL processes using numerical model simulations (Martins et al., 2010), even over the relatively homogeneous ocean (Belmonte Rivas and Stoffelen, 2019), which is likely due to the scarcity of fine-scale vertical observations of the atmosphere.
Over the oceans Belmonte Rivas and Stoffelen (2019) performed a climatological comparison between state-of-the-art reanalysis and scatterometer surface winds in the PBL, revealing mean and transient PBL model errors. Houchi et al. (2010), based on high-resolution radiosondes, verified the climatological wind profiles and found in particular wind shear a factor of 2–3 lower simulated by the European Centre for Medium-Range Weather Forecasts (ECMWF) model. Wind shear is recognized to be able to significantly modulate turbulent mixing of atmospheric pollutants (Zhang et al., 2020b), and thus the inabilities of the model in this regard may have repercussions for air quality prediction.
The critical interaction between PBL turbulence and vertical structures of thermodynamic variables, as the heart of PBL physics, makes the determination of BLH a big challenge due largely to the difficulty for those instruments with coarse vertical resolution in resolving the sharp gradients of temperature and water vapor at the top of the PBL, as well as estimating PBL-top entrainment and lateral entrainment (Teixeira et al., 2021). Thus, this highlights the importance of high-resolution vertical measurements of thermodynamic variables. The temporal and spatial variations in BLH have been extensively assessed in previous studies at a regional or national scale, such as the contiguous United States (Seidel et al., 2012; Zhang et al., 2020a), Europe (Palarz et al., 2018), and the Arctic and Antarctic (Zhang et al., 2011), which are mainly implemented by low-resolution radiosonde measurements, reanalysis, or both. Fortunately, a few pioneering studies in characterizing BLH have adopted high-resolution measurements at a national scale over China (Guo et al., 2016; Zhang et al., 2018; Su et al., 2018) and the United States (Seidel et al., 2010). Notable diurnal and seasonal cycles have been revealed (e.g., Guo et al., 2016; Short et al., 2019). Besides the regional results, several attempts have been made to provide global-scale retrievals of BLH using the Global Positioning System radio occultation (GPS RO) and Integrated Global Radiosonde Archive (IGRA) version 2 (Seidel et al., 2010; Gu et al., 2020; Ratnam and Basha, 2010), in which seasonal variations in and maritime–continental contrasts of BLHs have been achieved. The measurements of GPS RO, at a vertical resolution of 100 m around the PBL top, are typically used to determine BLH by searching for the altitude with a sharp gradient in the refractivity profile (Basha et al., 2018). However, such a sharp gradient of refractivity might overestimate BLH compared to other methods that the community usually used, such as the parcel method (Seidel et al., 2010). Compared with high-resolution soundings, IGRA is sparsely sampled in the vertical (about 10–30 layers below 500 hPa), which could result in large uncertainties in estimating BLH. Likewise, additional errors could be introduced in reanalysis products for their sparse vertical resolutions (about 6–42 layers below 500 hPa), which are equivalent to or bigger than IGRA. A large spread emerges in the explicit determination of BLH from a variety of instruments; in spite of that the BLH detection based on radiosonde is the most accepted methodology for deriving the CBL and SBL (Seidel et al., 2012; de Arruda Moreira et al., 2018).
A wide range of reanalysis products, such as those from the fifth generation ECMWF atmospheric reanalysis of the global climate (ERA5), the National Aeronautics and Space Administration (NASA) Modern-Era Retrospective-analysis for Research and Applications version 2 (MERRA-2), Japanese 55-year Reanalysis (JRA-55), and the National Centers for Environmental Prediction (NCEP) climate forecast system version 2 (NCEP-2), provide a rich ensemble of climate data products (Saha et al., 2014; Hersbach et al., 2020; Kobayashi et al., 2015; Gelaro et al., 2017) but are sensitive to both empirical parameterizations and the diagnostic method chosen, while verification by direct observations of BLH are sparse (Seibert et al., 2000). Some intercomparisons between instruments or model data, such as radiosonde, CALIOP, and ERA-interim reanalysis, have been previously conducted and yielded good consistency in seasonal and spatial variation (e.g., Guo et al., 2016; Zhang et al., 2016). However, Basha et al. (2018) demonstrate that ERA-interim can underestimate BLH by around 900 m compared to GPS RO. This underestimation may be caused by different kinetic or thermodynamic assumptions used. For instance, ERA-interim is implemented with a bulk Richardson number (BRN) method (Palm et al., 2005), which is believed to be suitable for all atmospheric conditions (Anderson, 2009). It is worth highlighting that the state-of-the-art reanalysis could be one of the most promising data sources for obtaining the synoptic or climatological features of BLH.
Despite much progress made in developing the BLH products, there are still some unresolved issues in quantifying the variability in BLH from a global perspective. These issues include the worldwide variation in BLH by high-resolution vertical soundings, the intercomparisons among reanalysis datasets, and further evaluations with radiosonde observations, especially in the daytime based on the same retrieval algorithm. To this end, this study seeks to address the following scientific questions: (1) a climatological distribution of near-global BLH by using high-resolution radiosonde measurements; (2) intercomparisons of ERA5, MERRA-2, JRA-55, and NCEP-2 with additional evaluation with radiosondes; and (3) the investigation of potential sources for the biases of BLH between observation and reanalysis. The rest of the paper is organized as follows. The descriptions of high-resolution radiosonde data, reanalysis products, and the bulk Richardson number method are given in Sect. 2. Section 3 presents the spatial distributions of BLH by radiosonde and reanalyses and their intercomparisons. A brief conclusion and remarks are finally outlined in Sect. 4.
2.1 High-resolution radiosonde measurements
In 2018, IGRA provided atmospheric soundings at around 445 radiosonde sites across the globe, including pressure, temperature, humidity, and wind vector. The number of pressure levels below 500 hPa is around 10–30. By comparison, for high-resolution radiosondes, the sampling rate is 1 or 2 s, corresponding to a vertical resolution of approximately 5–10 m throughout the atmosphere. The high-resolution radiosonde measurements used in the present study are obtained from 342 sites around the world, which are provided by several organizations, including the China Meteorological Administration (CMA), the National Oceanic and Atmospheric Administration (NOAA) of the United States, the German Deutscher Wetterdienst (Climate Data Center), the Centre for Environmental Data Analysis (CEDA) of the United Kingdom, the Global Climate Observing System (GCOS) Reference Upper-Air Network (GRUAN), and the University of Wyoming.
The CMA has maintained the China Radiosonde Network (CRN), which contains 120 operational stations homogeneously distributed across mainland China with a vertical sampling rate of 1 s (5–8 m resolution), since 2011 (Guo et al., 2016, 2019; Zhang et al., 2016, 2018; Su et al., 2020). The NOAA started the Radiosonde Replacement System (RRS) program in 2005, which involved 89 sites with a vertical resolution of 5 m (Zhang et al., 2019). The German Deutscher Wetterdienst (Climate Data Center) has been sharing the radiosonde measurements at 14 sites with a sampling rate of 2 s since 2010. Moreover, the 10 m resolution soundings at 12 sites were provided by the CEDA, which began to share soundings in 1990, and eight radiosonde sites were shared by GRUAN with a vertical resolution smaller than 10 m. An additional 93 sites came from the University of Wyoming, which started in 2017, with a sampling rate of 2 or 1 s. In total, over 678 000 soundings at 342 stations are used here for the period of January 2012 to December 2019, in total 8 years, including 633 000 soundings at the regular release times of 00:00 and 12:00 UTC and 43 000 more irregular observations during intensive observation periods (IOPs).
Radiosonde measurements are taken twice per day following the World Meteorological Organisation (WMO) protocol for synoptic times at 00:00 and 12:00 UTC (Seibert et al., 2000) except for special field campaign observations at specified stations or time ranges during IOPs. The protocol implies that stations at different longitudes sample the diurnal cycle differently. For instance, stations near 0∘ E (London) and 180∘ E (Samoa) sample at midnight and midday, while stations near 90∘ E (Bangladesh) and 90∘ W (Chicago) sample at dawn and dusk, with intermediate longitudes at linearly varying intermediate local solar times (LSTs) of day. For wintertime regions near 90∘ W and 90∘ E, the release times are insufficient for evaluating the BLH during daytime. Hence, the BLH estimates from regular radiosondes will vary with longitude and season (McGrath-Spangler and Denning, 2012). Generally, the principal PBL mechanism at night is associated with an SBL, which gradually transitions into the CBL in the morning (Stull, 1988; Zhang et al., 2018). The transition from the SBL to CBL is generally quick and occurs swiftly after sunrise, but the reverse process can be slow in the late evening (Taylor et al., 2014). Despite the dominance of the CBL during the daytime, an SBL still occurs, especially in the event of overcast sky (Zhang et al., 2018, 2020b) and near strong divergences in moist convective downbursts (King et al., 2017). To illustrate the daytime variation in BLH, we only selected the soundings that are launched 2 h after sunrise and 2 h before sunset. The sunrise and sunset times are gauged in a longitude bin size of 15∘ and are based on the latitude of station and the calendar day of the release. Using this definition, a total of 190 013 profiles, including soundings launched at both synoptic times and during IOPs, spanning January 2012 to December 2019 are used to obtain the BLHs in the daytime. The spatial distribution of file number for each site is displayed in Fig. S1 in the Supplement, in which the sites with less than 10 matches are excluded.
2.2 ERA5, MERRA-2, JRA-55, and NCEP-2 reanalysis datasets
ERA5 is the successor of ERA-interim and has undergo a variety of improvements, including more recent parameterization schemes and data assimilation system, better spatial resolution, both horizontally and vertically (137 levels), and improved representation of evaporation balance, cyclones, soil moisture, and global precipitation (Hersbach et al., 2020). The BLH is composited in the ERA5 product on a 1440×721 grid with 0.25∘ latitude and 0.25∘ longitude resolution. It is computed by the bulk Richardson number method with a temporal resolution of 1 h.
MERRA-2 is the latest atmospheric reanalysis of the modern satellite era produced by NASA's Global Modeling and Assimilation Office (GMAO). It includes aerosol data assimilation, improvements on ozone, and cryospheric processes (Gelaro et al., 2017). In this product, the BLH is packaged and defined by identifying the lowest level at which the heat diffusivity drops below a threshold value (McGrath-Spangler and Denning, 2012). The formula for calculating BLH is as follows:
where BLH(MERRA2_packaged) is in units of meters, PPBLtop is the BLH (packaged parameter in MERRA-2; in units of Pa), and PSurface is the surface pressure (in units of Pa). However, to preclude the uncertainty raised by different methods adopted, the BLH by MERRA-2 is extracted by the bulk Richardson number method by utilizing the parameters of horizontal wind, temperature, geopotential height, relative humidity (RH), and surface pressure as inputs. These input data are provided on a grid of 576×361 points with 0.5∘ latitude and 0.625∘ longitude resolution, and they have 42 pressure levels (about 16 layers below 500 hPa) with a temporal resolution of 3 h.
JRA-55 is the second Japanese global atmospheric reanalysis commissioned by the Japan Meteorological Agency (JMA) (Kobayashi et al., 2015). Data contain 37 pressure levels between 1 and 1000 hPa (16 layers below 500 hPa), provided on a grid of 288×145 points with a horizontal spacing of and a temporal resolution of 6 h. The parameters, including geopotential height, temperature, horizontal wind, surface pressure, and RH, are used to assess BLH as before.
NCEP-2 has a coarser model resolution than ERA5 (Rinke et al., 2019) with a spatial resolution of 2.5∘ latitude and 2.5∘ longitude. The total level is 17 (6 layers below 500 hPa), which is substantially less than MERRA-2, JRA-55, or ERA5, and the temporal resolution is 6 h. Similar parameters to JRA-55 are preserved to compute BLH. It is noteworthy that all model times include 00:00 and 12:00 UTC and hence collocate well with the synoptic radiosonde times.
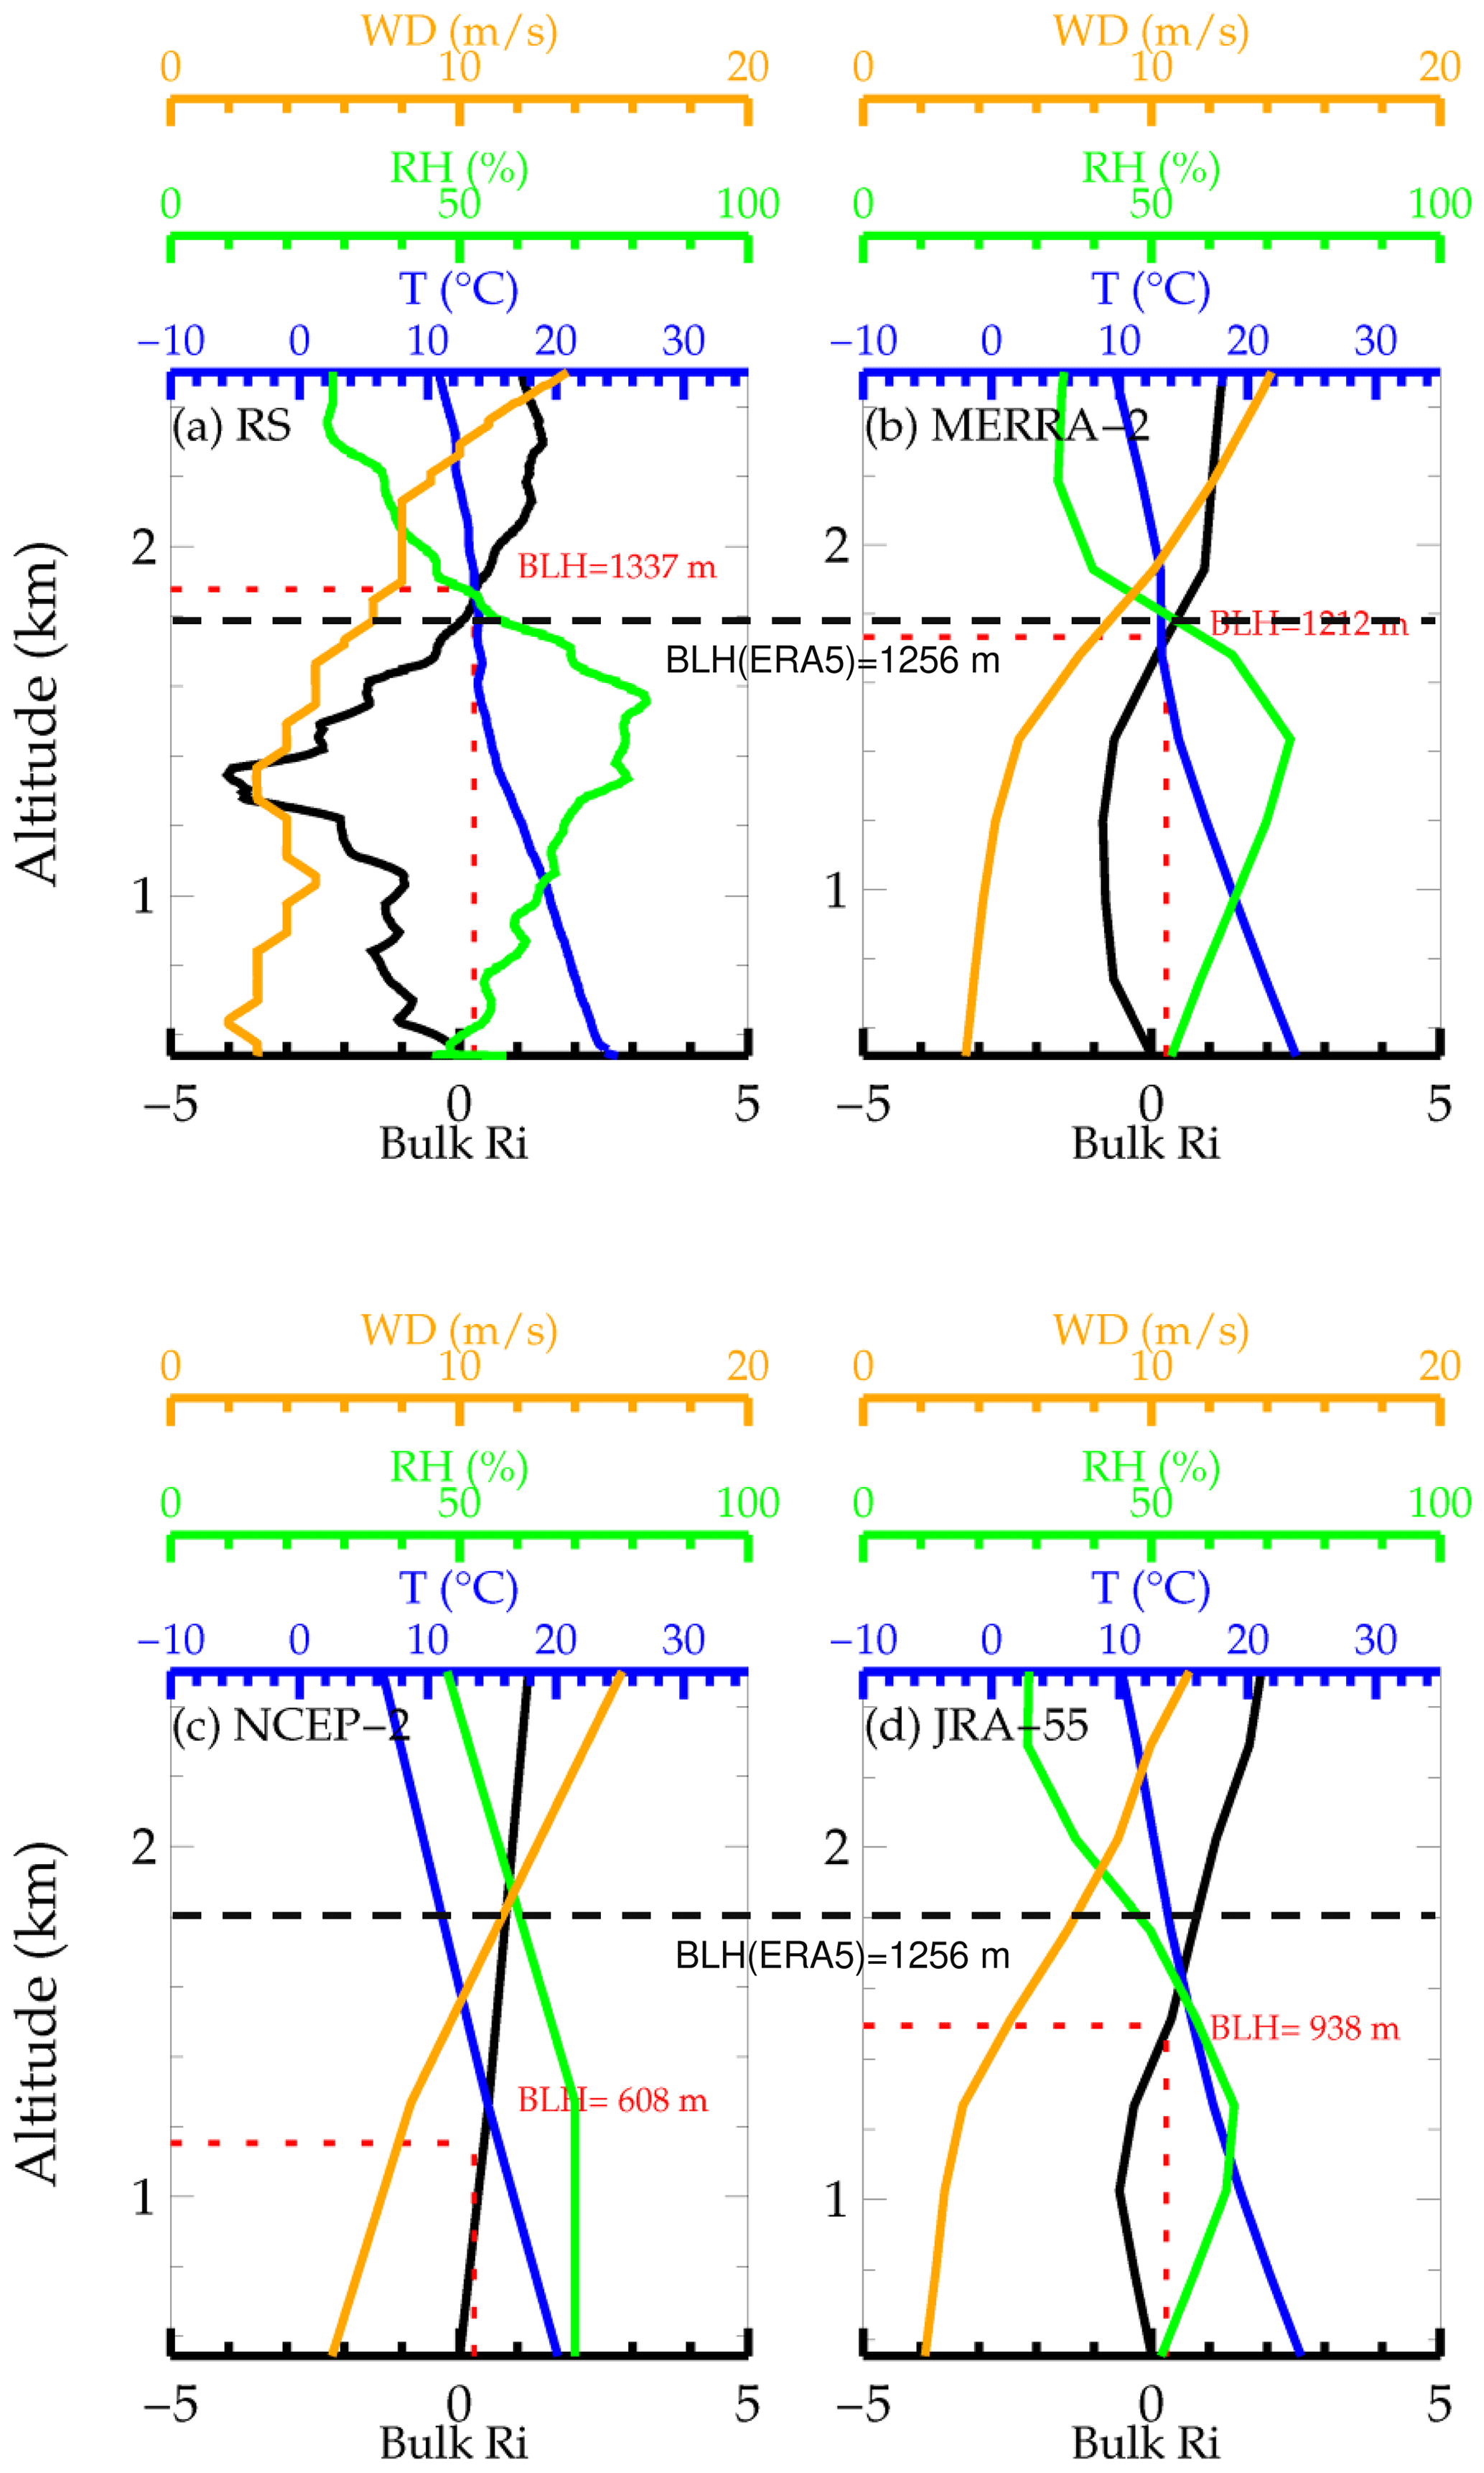
Figure 1Profiles of basic atmospheric parameters from the ground up to 2.5 km a.g.l., including wind speed (orange), bulk Ri (black), temperature (blue), and RH (green) at 06:00 UTC (14:00 LST) on 6 June 2016 at Chongqing (29.6∘ N, 106.4∘ E; 541 m) from radiosonde (a), MERRA-2 (b), NCEP-2 (c), and JRA-55 (d) reanalysis datasets. The boundary layer height (BLH) in each subplot is marked as dashed red lines and red text, and the BLH for ERA5 is 1265 m in this case (dashed black lines).

Figure 2The mean BLH estimated from ERA5 (a), NCEP-2 (b), JRA-55 (c), and MERRA-2 (d) reanalysis data at 00:00 UTC during the years 2012–2019. The dots with gray marginal lines in each map denote the mean BLH derived by sondes at 00:00 UTC, and the dotted red lines present the mean BLH derived by radiosonde on a grid with 5∘ longitude. Stations with less than 10 profiles are not included in the analysis. The 2D scatter plot in the bottom left corner of each panel illustrates the correlations between reanalysis-derived and sonde-derived BLHs at 00:00 UTC, for which the asterisk (*) superscripts indicate that the correlation coefficients are statistically significant (p<0.05), and the red lines denote the least-squares regression line.
2.3 Bulk Richardson number method
In the spirit of a like-for-like comparison, the BLHs derived from radiosonde and reanalysis data (MERRA-2, JRA-55, and NCEP-2) are calculated using the bulk Richardson number (BRN), which also serves as the built-in algorithm in ERA5 for BLH products. The BRN, an algorithm used to reflect how strongly buoyancy is coupled to the vertical momentum (Scotti, 2015), has been widely used for the climatological study of BLH from radiosonde measurements thanks to its applicability and reliability for all PBL regimes (Anderson 2009; Seidel et al., 2012; Guo et al., 2019). It determines the BLH by identifying the level at which the bulk Richardson number, represented by Ri(z), reaches its critical value (Palm et al., 2005) and is formulated as follows:
where g is the gravitational acceleration, zAG the height above ground level (a.g.l.), θv the virtual potential temperature, u* the surface friction velocity, u and v the horizontal wind components, and b a constant, which is usually set to zero due to the fact that friction velocity is much weaker compared with the horizontal wind (Seidel et al., 2012). The subscripts of z and s denote the parameters at z height above ground and ground level, respectively.
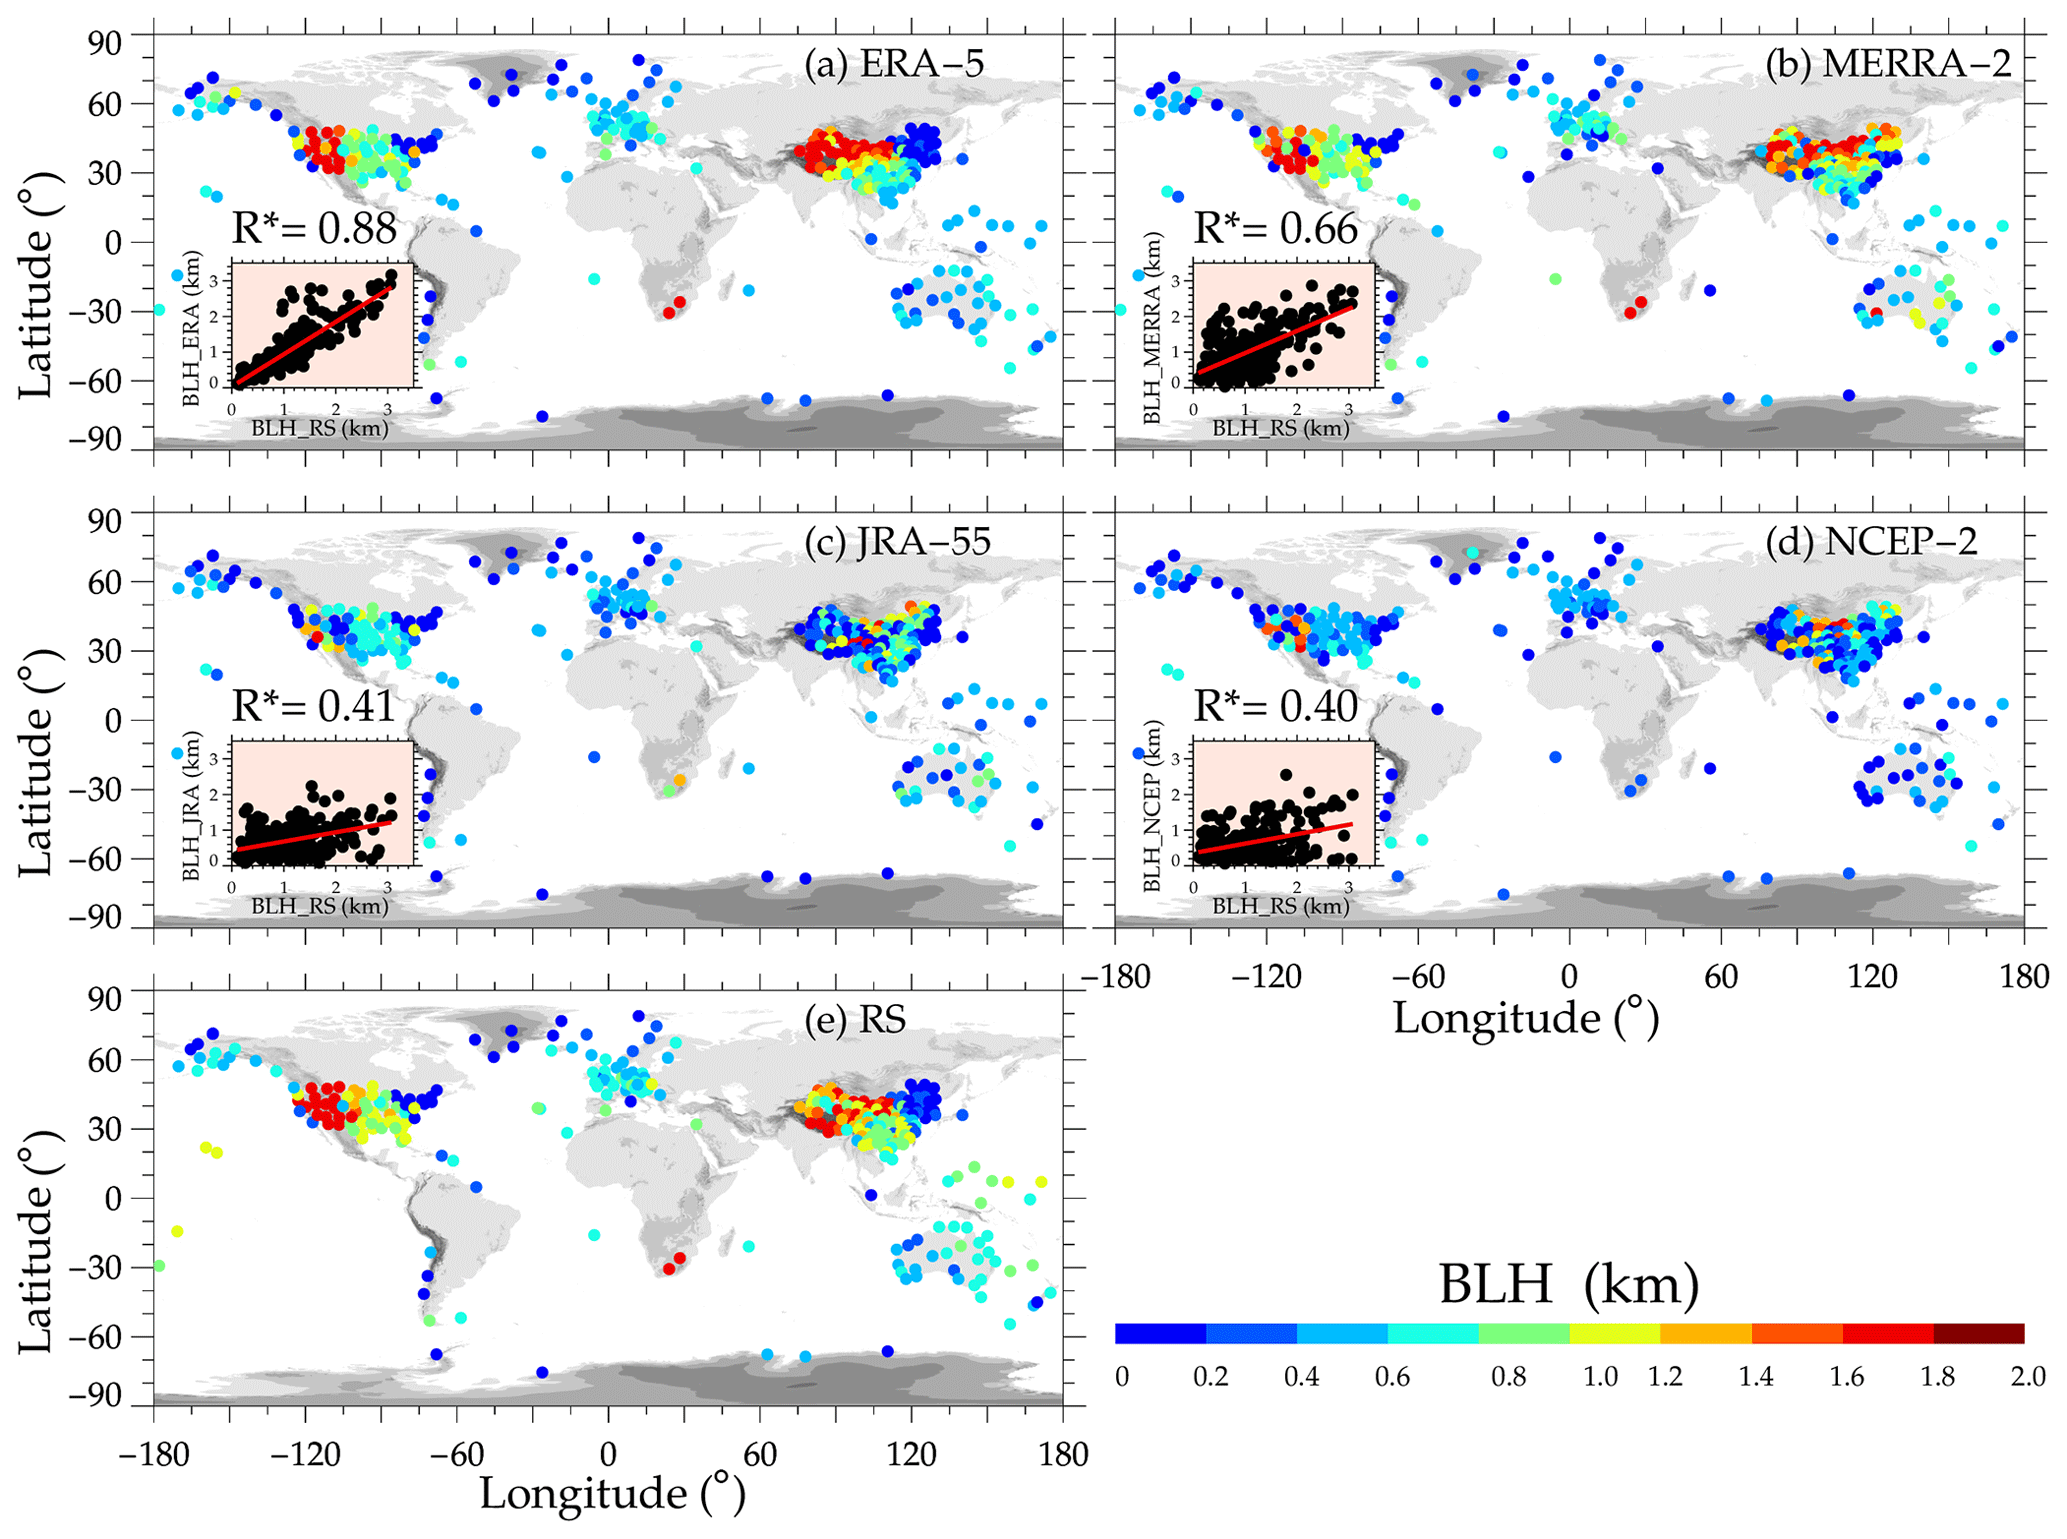
Figure 3Spatial distributions of the mean BLHs determined at the near-global high-resolution radiosonde observational network locations during the daytime for the period 2012 to 2019 which are extracted from ERA5 (a), MERRA-2 (b), JRA-55 (c), NCEP-2 (d), and radiosonde (e) measurements. Similar to Fig. 2, the scatter plot illustrates the correlations between reanalysis-derived and sonde-determined BLHs in the daytime.
It is known that Ri(z) increases with increasing free flow stability (Zilitinkevich and Baklanov, 2002). Below a critical value of 0.25, the flow is dynamically unstable and likely causes turbulent motion. Nevertheless, since turbulence can also occur away from this critical value (Haack et al., 2014), care must be taken in that the critical value might not be well defined, leading to uncertainty in estimating BLH. Meanwhile, the BLH estimates were found not to change very much by differing the input of critical values ( (Guo et al., 2016). Therefore, for a given discrete Ri profile, here we identify the BLH as the interpolated height at which the Ri(z) firstly crosses the critical value of 0.25 starting upward from the ground surface. Moreover, it is well recognized that the vertical resolution of radiosonde measurements has a large impact on the BLH estimated. For instance, BLHs are usually lower for a sparser vertical resolution (Seidel et al., 2012). Therefore, factors that cause uncertainty in estimating BLH by using the bulk Richardson method include, but are not limited to, meteorological parameters, the surface friction, vertical resolution of data, and the critical value of Ri.
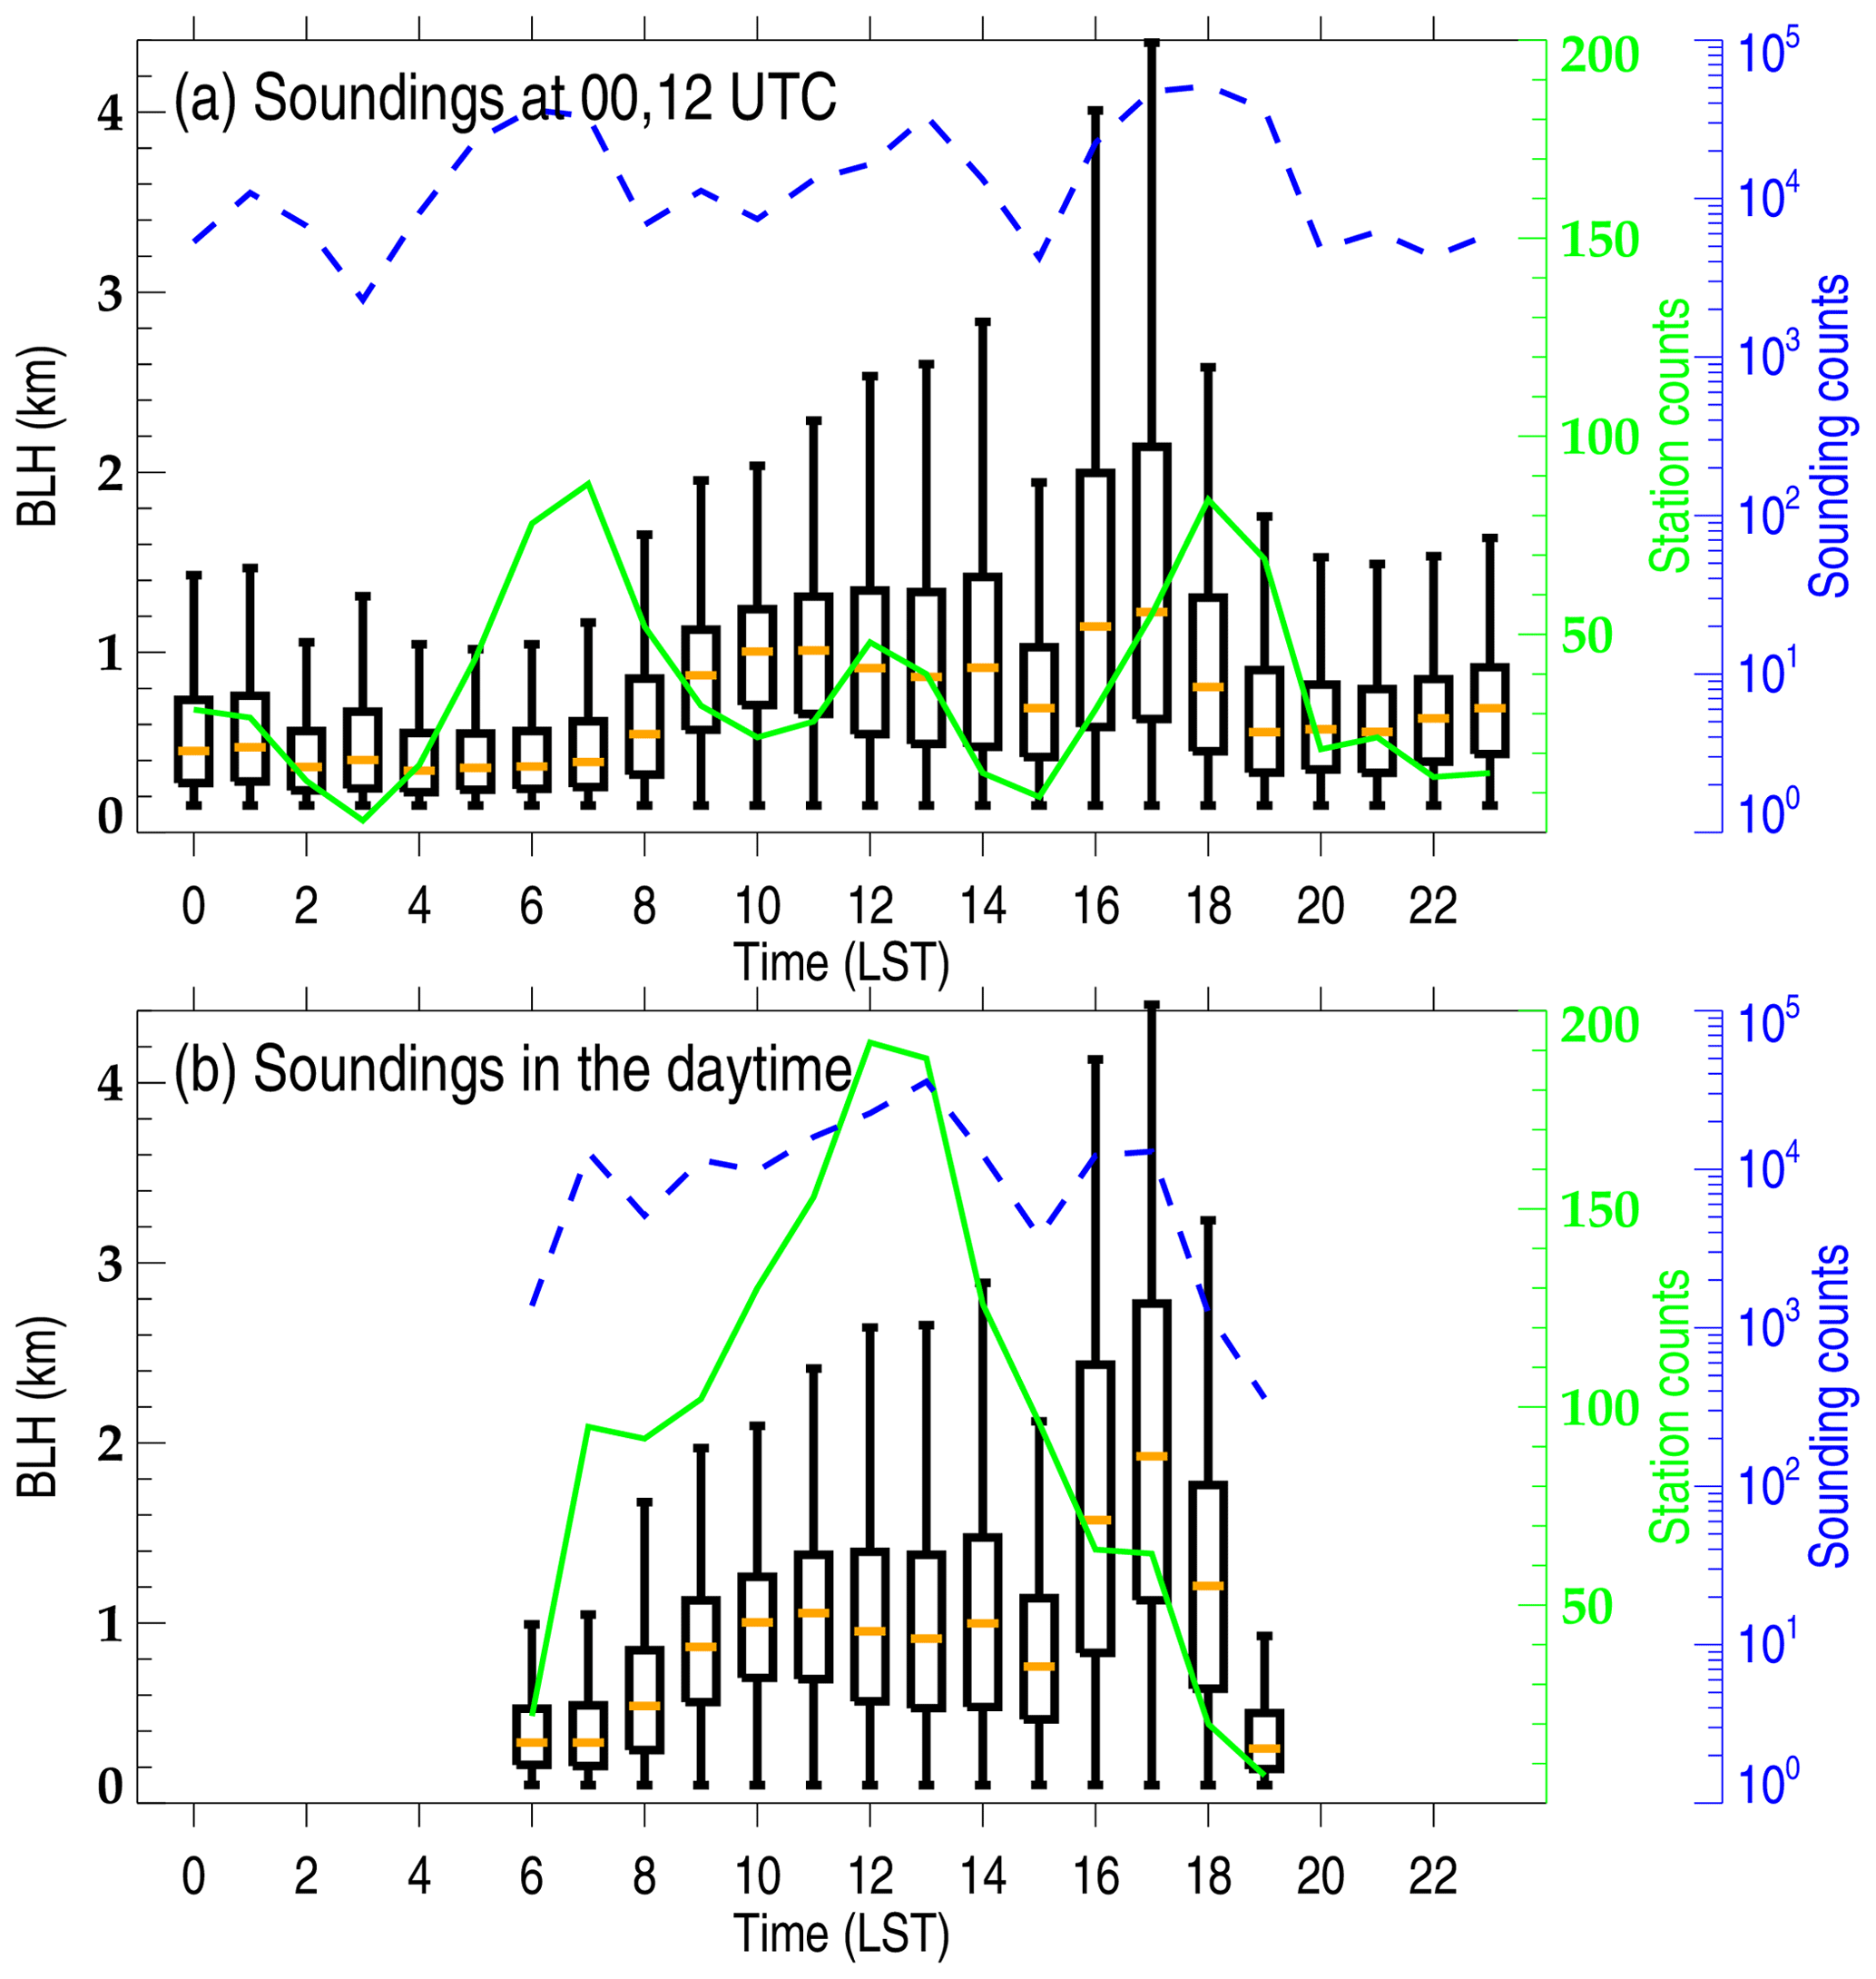
Figure 4Box and whisker plots of diurnal variation (in LST, 24 h) in BLH determined by all soundings operationally launched at 00:00 and 12:00 UTC (a) and by the soundings launched at both synoptic times and intensive observation times that are limited to the daytime alone (b). Solid green line and dotted blue line highlight the number of sonde stations and total soundings for each hour of day, respectively.
2.4 Collocation procedure and a case study
In contrast to the reanalysis data, the longitude and latitude distributions of high-resolution radiosonde are irregular. A precise comparison between reanalysis data and sounding is required for consistency in time, latitude, and longitude. The matching procedures implemented in this present study go as follows. (1) A latitudinal and longitudinal matching procedure is carried out by finding the geographical grid cell of the reanalysis product that contains the radiosonde station. (2) Time matching for ERA5 is to find the exact UTC time (hour) of the weather balloon launch. (3) For MERRA-2, NCEP-2, and JRA-55 datasets, the requirement is to limit the time difference with the weather balloon launch time to 1 h.
A case at 06:00 UTC on 6 June 2016 in Chongqing (29.6∘ N, 106.4∘ E; 541 m) is shown in Fig. 1. In this case, BLH obtained by sounding is 1337 m and is closest to that by ERA5, which underestimates the height by 72 m. Compared with the radiosonde profile, MERRA-2 can capture the main vertical structures and the magnitude of wind speed (WS), RH, and temperature but not the fine-scale vertical variations (Fig. 1b). It also slightly undervalues the BLH by 125 m. The basic parameters outlined by NCEP-2, for instance, RH (5 % larger than sounding), temperature (3∘ C less than sounding), and wind speed (4.5 m s−1 larger than sounding), all have notable differences from the sounding (Fig. 1c). Eventually, the NCEP-2-derived BLH is considerably underestimated by 729 m. By and large, the profiles from JRA-55 are not as accurate as those from MERRA-2. More specifically, the wind speed at some heights, prominently above 2 km, is underestimated (Fig. 1d); the mean RH is 4 % less than that from the sounding. As a result, JRA-55 substantially underestimates BLH by 399 m. Based on this case, we can note that the performances of ERA5 and MERRA-2 are obviously better than those from JRA-55 and NCEP-2 in terms of the BLH. The remarkable underestimation by NCEP-2 can be attributed to the underestimations in near-surface virtual potential temperature (roughly 2.46 K less than sounding) and temperature. By comparison, the smaller BLH in JRA-55 could be attributed to the underestimated RH.
2.5 Normalized sensible and latent heat flux in the daytime
The sensible heat flux represents the level of energy that induces CBL growth (Wei et al., 2017), whereas the latent heat fluxes characterize the evaporation of moisture from the soil to the CBL, which feeds back on the development of the CBL and the formation of PBL cloud (Pal and Haeffelin, 2015). For a given amount of heat flux, small latent heat fluxes usually mean more energy being available for PBL growth (Chen et al., 2016). When less energy is constrained by the moist ground, more energy is available to heat the air. Moreover, the surface heat flux is closely associated with near-surface meteorological variables. For instance, a lower RH usually indicates a larger sensible heat flux and lower latent heat flux (Guo et al., 2019; Zhang et al., 2013). Suppose that the heat supplied to the air at the radiosonde balloon launch time is the area shaded under the heat flux curve (Fig. 11.12 in Stull, 1988); the normalized sensible heat flux in the daytime is defined by
where Tsunrise and Tlaunch are the sunrise time and radiosonde balloon launch time, QH is the sensible heat flux, and ρ is the near-surface density; cp equals 1004 J C∘−1 kg−1. A similar principle is applied to the calculation of normalized latent heat flux as well.
3.1 Overview of BLHs at two synoptic times and over the day
The near-global mean BLHs at 00:00 UTC from 2012 to 2019 by four reanalysis products are shown in Fig. 2, in which the results obtained from radiosonde are overlaid by colored circles. The stations with sounding covering at least 2 continuous years are kept. The four reanalysis products yield an analogous result with respect to the spatial variation in BLHs, which are positively correlated with the sounding-derived BLH, with correlation coefficients of 0.90, 0.81, 0.47, and 0.46 for ERA5, MERRA-2, NCEP-2, and JRA-55, respectively. It is evident that the BLHs from NCEP-2 over the continents of Africa, Asia, and South America are 300 m thicker than those of the other three products (Fig. 2b). Furthermore, the BLH in Antarctic by ERA5 is notably 500 m lower than that by NCEP-2 and MERRA-2 (Fig. 2a). Most of the mean BLHs by radiosonde are consistent with the reanalysis products, except that the values from all four reanalysis products over the Pacific Ocean and the contiguous United States are underestimated by about 300 m. Moreover, it is worth noting here that the BLHs by JRA-55 are considerably underestimated by around 1 km over these regimes. For 00:00 UTC, the regions nearly from the east coast to the west coast of the Pacific Ocean (UTC + 8 to UTC + 12 and UTC − 12 to UTC − 8) are covered by sunshine and thus are filled with a deeper PBL.
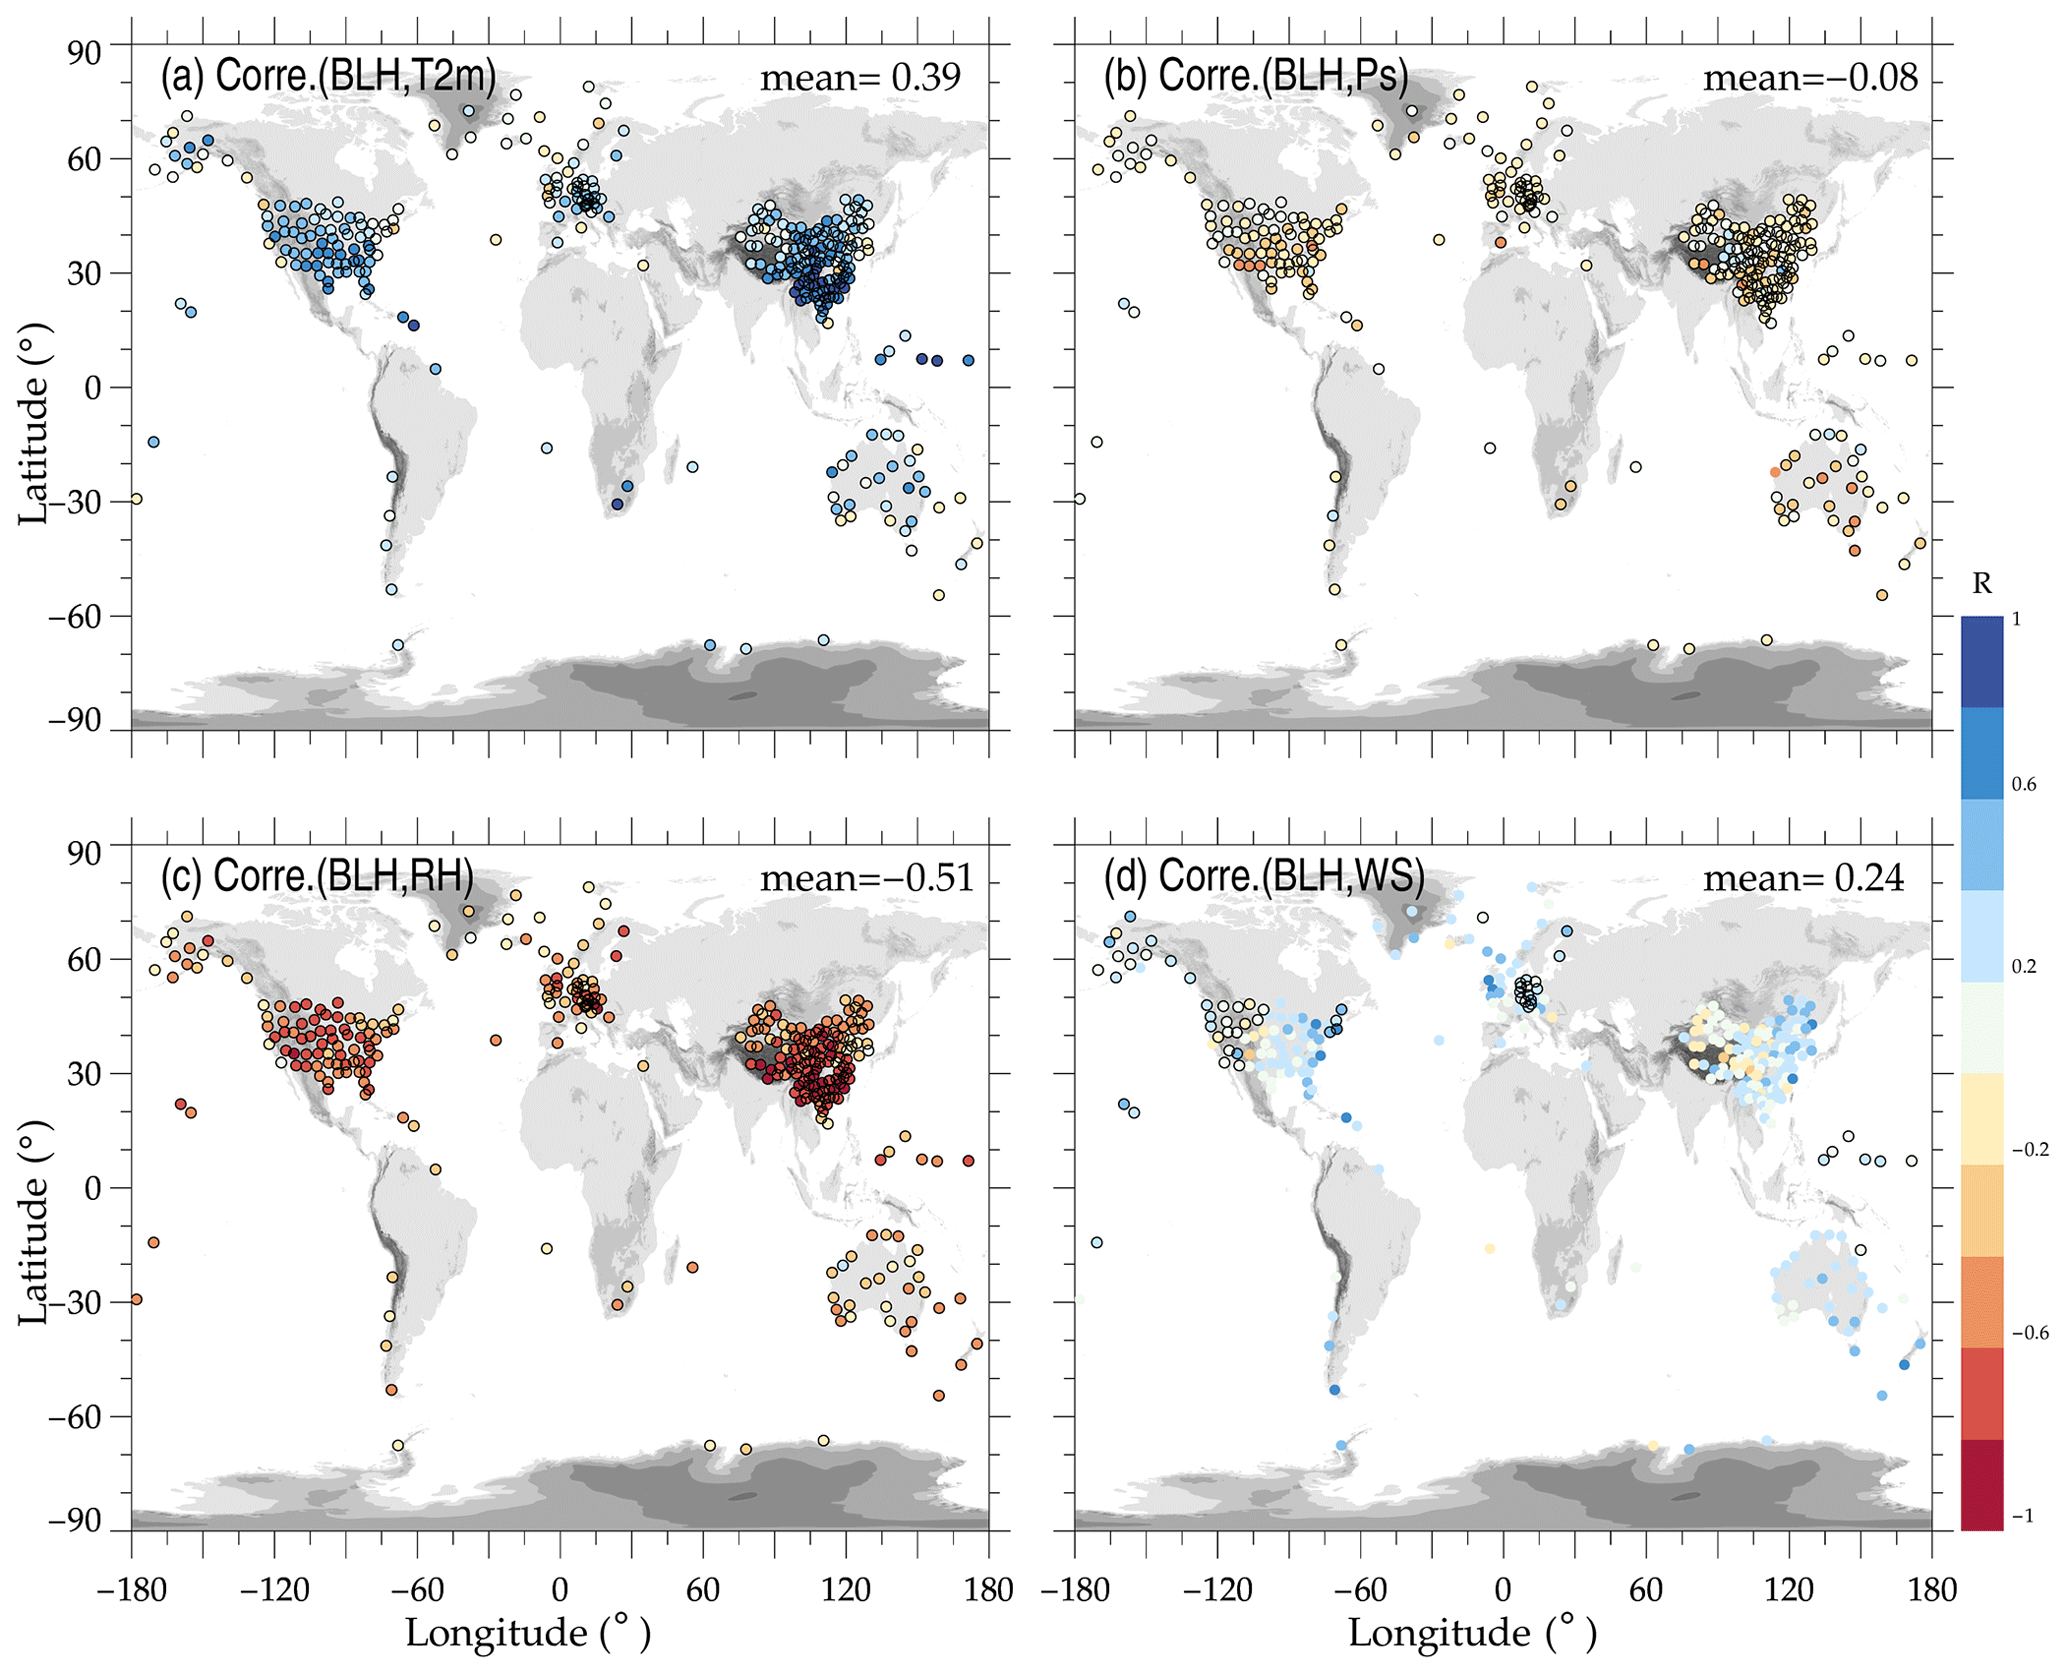
Figure 5Correlations between the radiosonde-derived BLHs and near-surface air temperature at 2 m a.g.l. (T2 m; a), near-surface pressure (Ps; b), near-surface RH (c), and near-surface wind speed (WS; d). Dots outlined in black denote that the correlation coefficient values are statistically significant (p<0.05), and the mean correlations are written in the upper right corner of each panel.
Comparable results at 12:00 UTC are presented in Fig. S2. Africa, the Middle East, and the west of India and China, corresponding to local noon and afternoon, have maximal BLHs of around 1.8 km. Moreover, it is noteworthy that the values from NCEP-2 and JRA-55 over these areas are visibly lower than those from ERA5 and MERRA-2, particularly over Africa and the Middle East, whereas these low values can barely be validated with soundings due to their sparse distribution. Over these areas, the BLHs are underestimated by reanalysis by about 200 m relative to the sounding results. Notably, BLHs from NCEP-2 over the continents of Africa are 1 km lower than those from ERA5 and MERRA-2. According to the results at 00:00 and 12:00 UTC, the comparisons between reanalysis products and soundings demonstrate that the BLHs are well resolved in the nighttime but are underestimated at daytime by reanalysis datasets.
For the near-global variation in BLH at a certain synoptic time, daytime and nighttime appear on the map simultaneously but as a function of longitude, which is displayed in Fig. 2. Thus, the variations at a fixed synoptic time on the map create a picture of the diurnal BLH variation. Given the dominance of the CBL in the daytime, investigating the BLHs in the daytime is thus favorable for unraveling the underlying causes for the discrepancies existing in the BLHs from both radiosonde and reanalysis. Therefore, the following results show the variations in daytime BLH only, unless otherwise noted.
The climatological mean variations in the daytime BLH from the soundings and four reanalysis products are drawn in Fig. 3. The period spans from January 2012 to December 2019 for most of the stations provided by China, the United States, Germany, and the United Kingdom. As implied by the results from soundings (Fig. 3e), the deepest PBL is observed over the Tibetan Plateau (TP) and the northwest of China, the south of Africa, and the west of the United States, with values as high as 1.7 km. The possible reason for this phenomenon is that the weather balloons over these regions are basically launched in the early afternoon of boreal summer (June–July–August) when the maximal BLH is usually observed (Collaud Coen et al., 2014; Guo et al., 2016). The BLHs over the Pacific Ocean are noticeably large, with values of 1.3 km. The longitudinal variation in BLH is evident likely due to LST variations in the soundings. Additionally, BLHs at middle and low latitudes are larger than at high latitudes, which is consistent with the findings in Gu et al. (2020).
By and large, the climatological results of BLH by radiosonde and four model products are comparable, indicating that both capture the spatial variations implied by the sounding LSTs sampled. Among the model products, ERA5 shows the best prediction of BLH contrasted with radiosonde, with a correlation coefficient of 0.88 (Fig. 3a). Furthermore, the results from MERRA-2 are positively correlated with those from the soundings, with a correlation coefficient of 0.66 (Fig. 3b). The performances of JRA-55 and NCEP-2 are significantly poorer than those of ERA5 and MERRA-2, with correlation coefficients of 0.4 and 0.41, respectively (Fig. 3c, d). The values of BLH over the west of the United States and the west of China are seriously underestimated by NCEP-2 and JRA-55 by around 800 m. Thus, we note that ERA5 and MERRA-2 are more robust in deriving the BLH, purely based on the climatological distribution of BLHs.
Figure 4 illustrates the diurnal variations in BLH at 00:00 and 12:00 UTC and during daytime. A notable diurnal variation can be noticed, with a minimum of 343 m at 04:00 LST and a maximum of 1224 m at 17:00 LST (Fig. 4a). The magnitude in BLH during daytime is essentially larger than that at 00:00 and 12:00 UTC and has a maximal value of 1926 m at 17:00 LST (Fig. 4b). It follows that most of the soundings (about 78 %) that are released at 00:00 and 12:00 UTC are excluded by the collocation procedure designed for collecting samples in the daytime. Note that the result during daytime will not significant change with or without IOP data.
3.2 Correlations with near-surface meteorological variables and surface heat flux
The PBL is the lowest part of the troposphere and evolves diurnally due to near-surface thermodynamic variables through turbulent exchanges of momentum, heat, and moisture (Pithan et al., 2015). Thus, the surface meteorological variables depend on the underlying land surface and its coupling with the PBL, and they could act as a good proxy for BLH under some specific circumstances (Zhang et al., 2013, 2018). An analysis of the correlation between the BLHs by radiosondes and near-surface meteorological variables is presented in Fig. 5. The variables include near-surface air temperature at 2 m a.g.l. (T2 m), pressure (Ps), RH, and WS, which are extracted from the first level in sounding. The first level is assumed to be associated with the near-surface variables (Serreze et al., 1992; Wang and Wang 2016). We note that BLH, T2 m, RH, and WS all have substantial diurnal and seasonal variability, as partly expressed in Eq. (2).
Figure 6Similar to Fig. 5 but for the correlations between BLHs versus normalized surface sensible (a) and latent (b) heat fluxes.
Moderate positive (negative) correlation coefficients can be noticed between BLH and T2 m (RH), with mean values of 0.39 (-0.51) (Fig. 5a, c), implying that both T2 m and RH could be an adequate indicator for the temporal variation in BLH. Moreover, the correlations between BLH and WS are also positive, with a mean value of 0.24 (Fig. 5d). By contrast, the correlation between Ps and BLH is negatively significant above most of the regions (Fig. 5b).
The correlation analyses between BLH and normalized heat fluxes, which are assessed by ERA5 reanalysis products, are displayed in Fig. 6. It is notable that positive and negative correlation coefficients usually exist in normalized sensible and latent heat flux, with a global mean of 0.29 and −0.31. This correlation is not high because BLH also depends on the radiative heating and cooling and the temperature profile in different stations (Yang et al., 2004).
Figure 7Statistical results of BLH differences between ERA5 and radiosonde. The spatial distribution of mean differences is highlighted in (e). Also shown are the distributions of mean BLH differences as a function of longitude (d) and latitude (f). The box and whisker plot of BLH differences over the six regions of interest (i.e., North America, Europe, East Asia, Australia, Pacific Ocean, polar regions) over four seasons are displayed in (a–c) and (g–i). The seasons are defined as follows: MAM, March–April–May; JJA, June–July–August; SON, September–October–November; DJF, December–January–February.
Figure 8Similar to Fig. 7 but for the differences between MERRA-2-derived BLHs and radiosonde-determined BLHs.
For the climatological variation in BLH, the near-surface variables, such as T2 m, RH, and WS, and the normalized sensible and latent heat flux could be a good indicator. Conversely, the development of BLH could also limit the magnitude of RH (McGrath-Spangler, 2016).
3.3 Comparisons with reanalysis products
The radiosonde stations are mainly dispersed over the United States, China, Australia, Europe, the Pacific Ocean, and the polar regions, and only a few stations contribute over the rest of the world. The polar regions contain a station with a latitude higher or lower than 67.7∘ N and S. Therefore, six regions are specifically examined in terms of the bias between radiosonde and model product.
Figure 9Similar to Fig. 7 but for the differences between JRA-55-derived BLHs and radiosonde-determined BLHs.
The BLH differences between ERA5 and radiosonde are shown in Fig. 7, in which we specify the differences over the six above-mentioned regions. As observed in Fig. 7e, the BLH over most of the stations is underestimated to a slight extent, with a near-global mean of 131.96 m. As expected, the most underestimated regions cover the west of the United States and southern China (Fig. 7e), with a difference of around 200 m. In addition, it is worth mentioning that the BLHs over the Pacific Ocean are overestimated in four seasons, with a bias of around 400 m (Fig. 7h). Among the six classified regions, BLHs in Europe, East Asia, and the polar regions are reliably determined by ERA5, with an average bias of around 50 m (Fig. 7b, c, i). The bias seems to exhibit a seasonal dependence, and it is around 62 m larger in the warm seasons compared to cool seasons in both hemispheres. Regardless of the small bias, the newest model product, ERA5, properly estimates the BLH, especially above Europe, the eastern United States, East Asia, and the polar regions.

Figure 10Similar to Fig. 7 but for the differences between NCEP-2-derived BLHs and radiosonde-determined BLHs.
Similarly, the BLHs by MERRA-2 are underestimated, with a near-global mean bias of 166.35 m (Fig. 8), which is slightly larger than that of ERA5 (131.96 m). This could indicate that the MERRA-2-derived BLH is more dispersed than ERA5. The spatial distribution of the bias value is broadly identical to that of ERA5 except that the BLHs over Europe, Australia, and the polar regions are well estimated by MERRA-2 due to much smaller mean biases at 42.78, 52.98, and 66.20 m, respectively (Fig. 8b, g, i).
In addition, the packaged BLH in MERRA-2 is also evaluated with radiosonde. BLH is as high as 3 km over the TP region at 06:00 UTC (Fig. S3), corresponding to an overestimation of 0.8 km over this region (Fig. S4). Over the rest of the regions, BLH is slightly or moderately overestimated by around 50 m. However, The BLH difference among various methods could reach up to a kilometer or even more (Seidel et al., 2010), which is probably owing to the variety of kinetic or thermodynamic theories applied in different algorithms.
By comparison, the mean bias produced by JRA-55 is larger than those from ERA5 and MERRA-2, with a mean value of 351.49 m, as shown in Fig. 9. The BLHs above most stations are underestimated by JRA-55, particularly for the sites over western China, the western United States, and the Pacific Ocean, with an underestimation of about 800 m. The most underestimated stations cluster at the latitude range of 40–45∘ N, with a mean difference of around 1 km (Fig. 9f). Although the near-global mean bias is significantly larger than ERA5 and MERRA-2, the estimations over Europe and the polar regions seem to be more in line with the observations, with mean values of 174.99 and 93.84 m, respectively (Fig. 9b, i).
The mean bias of NCEP-2 is larger than that of JRA-55, with a mean value of 420.86 m, as illustrated by Fig. 10. The distribution results are similar to JRA-55, except for Europe and Australia, where the bias is about twice that of JRA-55.
In general, the comparison analysis of the daytime BLH results between soundings and four reanalysis datasets indicates that ERA5 reanalysis produces the BLH that is closest to the high-resolution soundings. Interestingly, MERRA-2 can provide a good spatial distribution of BLH. JRA-55 and NCEP-2 can only give a good prediction over some regions, most of which tend to produce much larger BLH estimates compared to those from ERA5 and MERRA-2.
3.4 Potential sources for the bias between reanalysis products and radiosonde
The possible sources for the difference between radiosonde and reanalysis could be rather complicated. From the spatial pattern of BLH discrepancy results between radiosonde and reanalysis (Figs. 7–10), we can notice that the regions with large differences tend to be observed over regions with high elevation, such as the TP in China and Rocky Mountains in the United States. These regions generally have much more complex orography. Coincidently, the soundings over the above-mentioned two regions are all obtained from the afternoon, in which the PBL develops to the maximum (Fig. 4). As expected, the highest biases generally are accompanied by peak BLHs, which has also been confirmed in our previous studies (cf. Fig. 2c in Li et al., 2017). Therefore, the biases depend on the LST when the weather balloon is launched, which at least could not be ruled out.
In addition, the large differences primarily appear at low and middle latitudes where thermal convection frequently occurs. Therefore, it is reasonable to infer that static stability could exert an influence on the comparison results. Then, we will analyze the probable influences from terrain and static stability on BLH differences.
We evaluate the influence from the orographic complexity around the sounding station and calculate the standard derivation (SD) of elevation within a 1∘ × 1∘ grid, with the help of a 30 arcsec digital elevation model (DEM) dataset. Terrain is complex over western China and the western United States where most of the soundings are released in the afternoon, and large BLH biases are usually found. Therefore, for all soundings that are launched during the time period spanning from 13:00 LST to 18:00 LST, we analyze the relationship between BLH biases and the SD of the DEM (Fig. 11). It follows that the influence from the orography appears instrumental given the correlation coefficient varying from −0.84 to −0.95. Furthermore, the errors or uncertainties in ERA5 are less easily impacted by the orographic complexity given a much flatter fitted line (Fig. 11a).
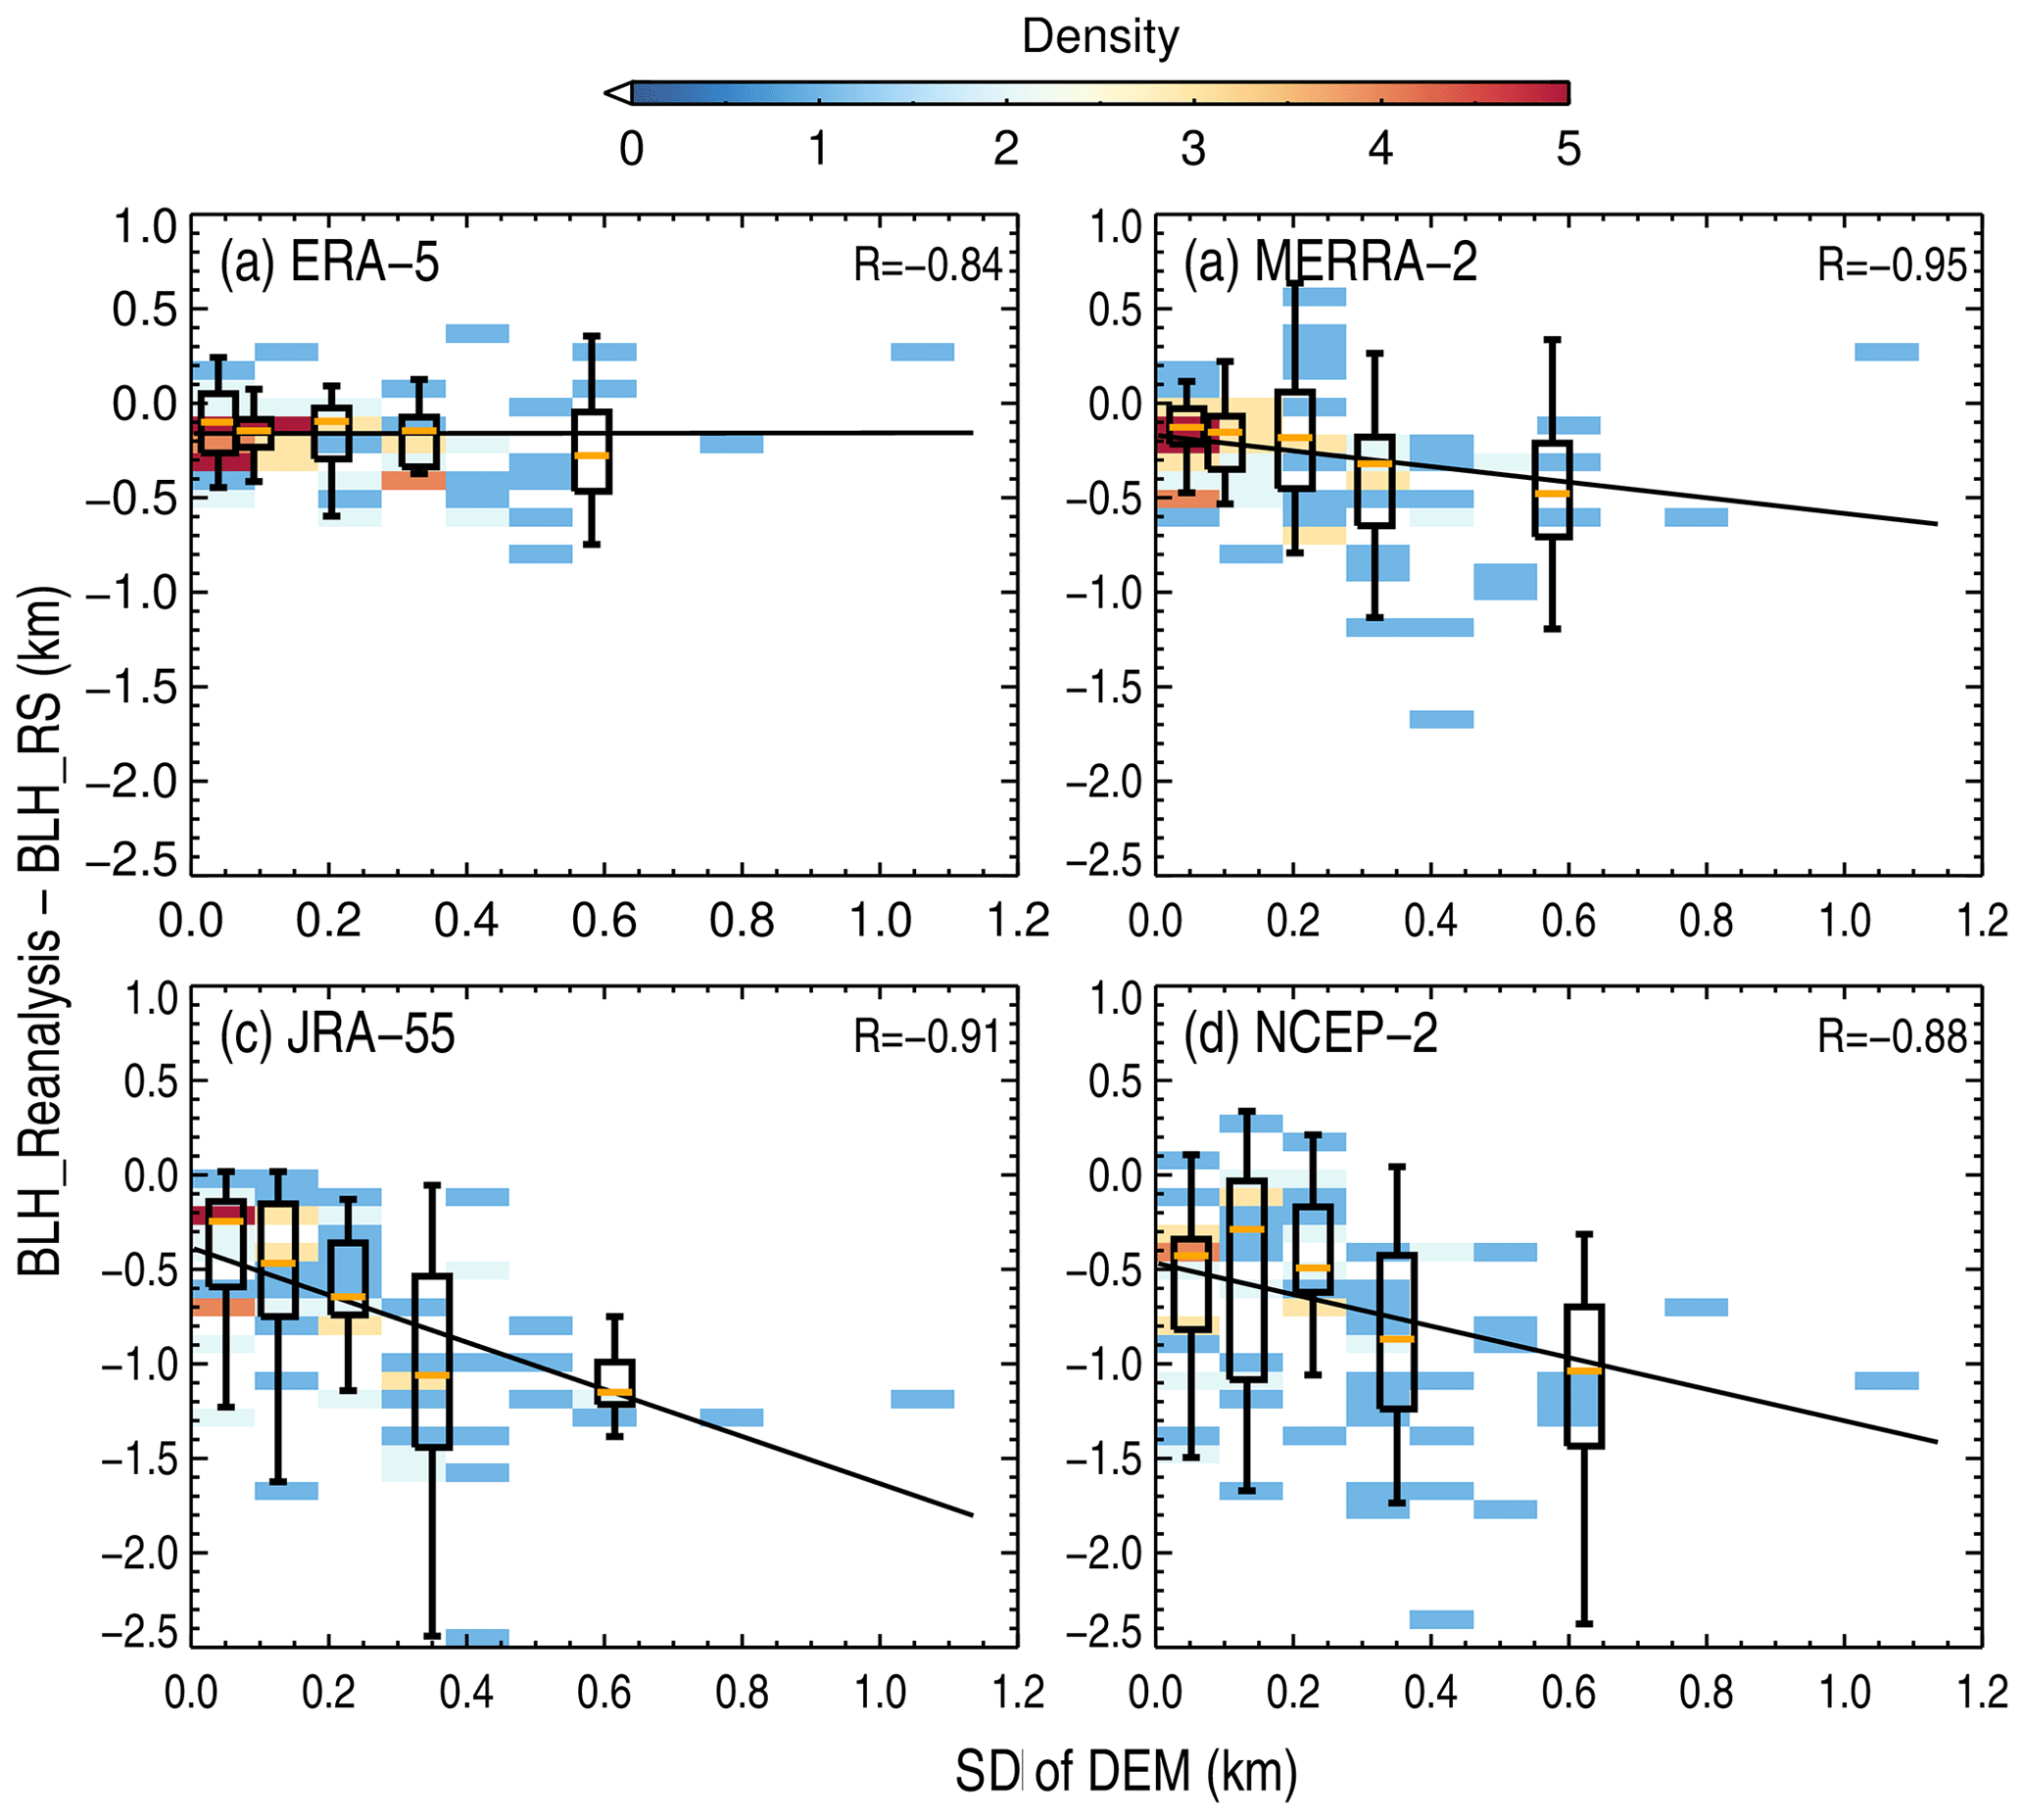
Figure 11Density plots of the differences of BLHs between radiosonde and ERA5 (a), MERRA-2 (b), JRA-55 (c), and NCEP-2 (d) as a function of the SD of the DEM, for which the black lines denote the least-squares regression line. The box-and-whisker plots of the anomalies in BLH in five evenly intervals are overlaid in each panel, and the correlation coefficients are marked in the upper right corner of each panel. Note that all samples are collected from soundings that are launched in the afternoon, spanning from 13:00 to 18:00 LST.
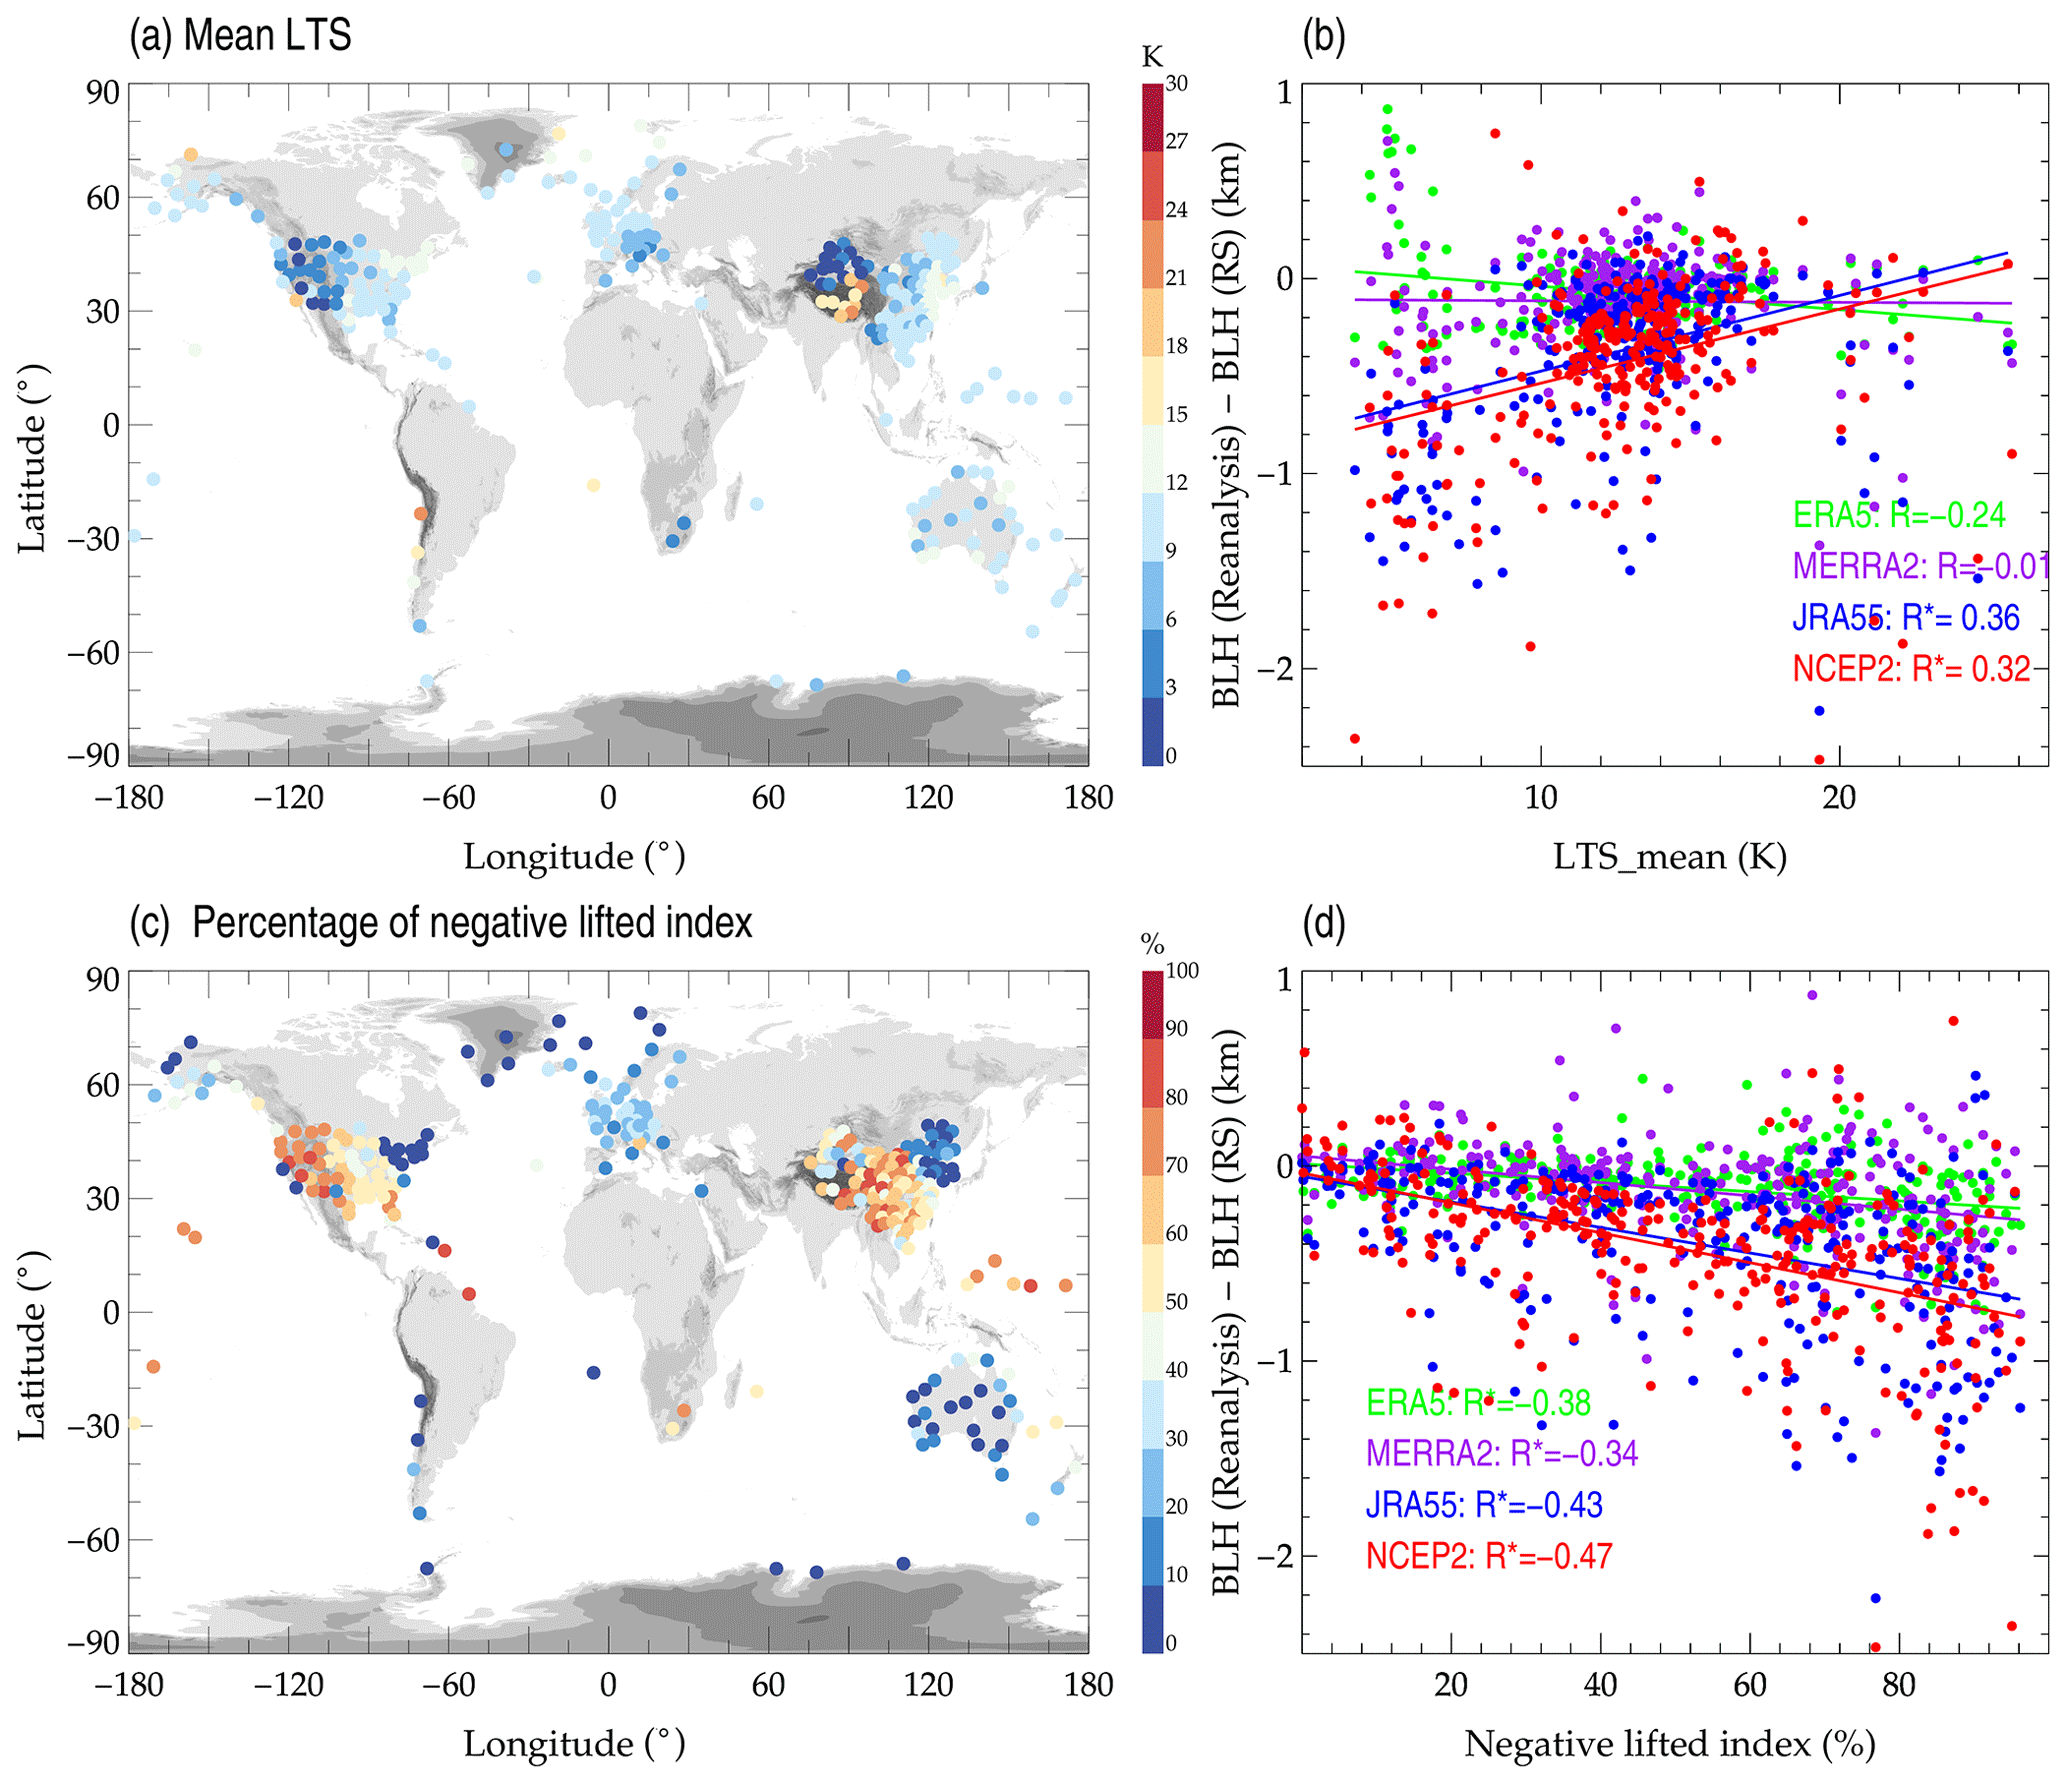
Figure 12Spatial distribution of the ensemble means of lower tropospheric stability in the daytime (a). The scatter plots showing the difference of model-derived minus sounding-derived BLHs from four reanalysis datasets versus the anomalies of LTS as derived from four reanalysis relative to those from soundings (b). The variations in the percentage of the negative lifted index (c), and the anomalies of BLH as a function of the negative lifted index (d).
Based on the correlation between orographic complexity (manifested by the SD of the DEM) and the bias of a reanalysis relative to radiosonde measurements, it is likely that the performances of MERRA-2, JRA-55, and NCEP-2 might be restricted by the complex underlying terrains. One of the reasons could be because global reanalysis with coarse resolution cannot resolve the sub-grid processes due to topography. However, ERA5 appears to be less dependent on terrain. In other words, the models used in ERA5 show sufficient capability and excellent performance in reproducing the atmospheres, particularly in the PBL over complex terrains.
Lower tropospheric stability (LTS) is an indicator to describe the thermodynamic state of the lower atmosphere and is defined by the differences in potential temperature at 700 and 1000 hPa (Guo et al., 2016). Typically, the smaller the LTS is, the more unstable the low troposphere will be. The mean LTS over each station is defined by the ensemble mean by four reanalysis datasets, and its spatial distribution is depicted in Fig. 12. The lower troposphere over the western United States and western China is more unstable compared to the rest of the world, with LTS of around 6 K (Fig. 11a), which is likely associated with the afternoon launch time of weather balloons. According to the correlation between the bias of BLH and the mean LTS, it is clear that the underestimation in BLH by JRA-55 and NCEP-2 products is negatively correlated with LTS, with correlation coefficients of 0.32 and 0.36 (Fig. 12b).
Besides the LTS, the role of lifted index could be another influential factor. The lifted index is a predictor of latent instability (Galway, 1956), and it is defined as the temperature difference between the environment temperature and an air parcel lifted adiabatically at 500 hPa. The index is computed by the air temperature, RH, and pressure profiles from radiosondes. We calculate the percentage of the negative lifted index above each station, which represents the occurrence rate of latent instability that exists in the daytime (Fig. 12c). The stations with high probability of strong instability, by the occurrence rate of negative lifted index (P(lifted index)<0), are predominantly dispersed over the western United States, the west and south of China, and the Pacific Ocean, reaching a percentage as high as around 70 %. These stations are regularly overlapped with great biases in the reanalysis products as shown in Figs. 7–10. According to the analysis, it is clear that all four reanalysis products are positively associated with P (lifted index<0), with correlation coefficients ranging from −0.34 to −0.47 (Fig. 12d). The positive (negative) correlation coefficients in lifted index suggests that the underestimation by reanalysis might be associated with the instable activity in the lower troposphere that has not been adequately represented or simulated by the models used in reanalyses. In light of the surface heating during the day and the growth of the PBL due to air ascent, it is also inferred that afternoon BLHs suffer the greatest errors if this is caused by inadequate air mixing within the free troposphere in models.
A climatology of near-global BLH from high-resolution radiosonde measurements has been described for the daytime BLH. The high-resolution radiosonde data have a much finer spatial resolution of 5 or 10 m, compared to that by IGRA, and can establish a finer and more precise structure of the PBL. In addition, direct comparisons among four well-established reanalysis model products have been conducted. The present study adopts over 300 sounding stations with a high resolution, spanning from 2012 to 2019, to investigate the climatological variation in near-global BLH in the daytime and evaluates four model products at the radiosonde sampling.
Notable spatial variation can be observed in the climatological mean of BLH at 00:00 and 12:00 UTC. In the afternoon, the regions over the western United States and western China have the largest BLHs with values as high as 1.7 km, whereas 00:00 and 12:00 UTC compare generally well to earlier times of day in the rest of the world with thus a lower BLH. In addition, BLHs at middle and low latitudes are larger than those at high latitudes. The T2 m, RH, and the normalized sensible and latent heat flux are good predictors for the spatiotemporal evolution of BLH. The most important result is that we found that all the four reanalysis products generally underestimate the daytime BLH, with a near-global mean varying from around 132 m to 420 m. The largest bias in reanalysis appears over the western United States and western China, where the boundary layers grow vigorously in the afternoon. ERA5 and MERRA-2 definitely have better performance than JRA-55 and NCEP-2 in terms of the magnitude of BLH and a higher correlation coefficient with the soundings. The newest version of reanalysis, ERA5, has the smallest bias and the highest positive correlation relative to radiosondes. The underestimation by NCEP-2 and JRA-55 is robust over some regions, for instance, western China and the western United States, with differences even exceeding 800 m. However, all products can obtain a precise estimate over some regions, for instance Europe, the eastern United States, and the polar regions, probably due to morning LST soundings and smaller daytime PBL development. The BLH over the Pacific Ocean is underestimated in all seasons and by all products. The underestimation tends to have a seasonal dependence; i.e., the warm season has a larger underestimation. However, BLH is moderately overestimated by the packaged BLH parameter in MERRA-2 possibly due to different BLH-deriving methods used.
We investigated two possible sources contributing to the biases, including topography and static stability. The analysis shows that the DEM spread does have a negative correlation with the bias, suggesting that the reanalysis data cannot provide a reliable simulation result under complex terrain conditions. In addition, reanalysis BLH errors tend to be negatively correlated with the occurrence rate of unstable air, suggesting that the reanalyses do not accurately determine BLH when the lower troposphere is unstable.
Although this study suffers from the inhomogeneous distribution of the radiosonde sites, the climatological BLHs at the near-global scale can help us understand the variation characteristics of BLH in different regions and for different LSTs. For the first time, we present near-global BLH estimates from high-resolution radiosondes and further conduct a comprehensive comparison of BLH products for four widely used reanalysis datasets using the BLHs derived from the soundings. The findings provide insights into the limitations of reanalysis data and, more importantly, are expected to greatly benefit future research works related to applications of different kinds of reanalysis data in the future.
The authors would like to acknowledge the National Meteorological Information Centre (NMIC) of CMA, NOAA, German Deutscher Wetterdienst (Climate Data Center), UK Centre for Environmental Data Analysis (CEDA), GRUAN, and the University of Wyoming (http://data.cma.cn/en, CMA, 2021; https://www.ncei.noaa.gov/data/us-radiosonde-bufr/archive/, NOAA, 2021, https://opendata.dwd.de/climate_environment/CDC/observations_germany/radiosondes/high_resolution/historical/, Deutscher Wetterdienst (Climate Data Center), 2021, https://catalogue.ceda.ac.uk/, CEDA, 2021, ftp://ftp.ncdc.noaa.gov/pub/data/gruan/processing/level2/RS92-GDP/version-002/, GRUAN, 2021, http://weather.uwyo.edu, The University of Wyoming, 2021) for providing the high-resolution sounding data. We would like to thank the ECWMF for ERA5 data (https://cds.climate.copernicus.eu/cdsapp#!/dataset/reanalysis-era5-single-levels?tab=_form; ECWMF, 2021), GMAO for MERRA-2 data (https://disc.gsfc.nasa.gov/datasets?keywords=MERRA-2&page=_1; GMAO, 2021), NCAR and Japan Meteorological Agency data for JRA-55 (https://climatedataguide.ucar.edu/climate-data/jra-55; Japan Meteorological Agency, 2021), NOAA for NCEP-2 data (https://psl.noaa.gov/data/gridded/data.ncep.reanalysis2.html; NCAR, 2021), and NASA for 30 arcsec digital evaluation height (DEM) data (https://search.earthdata.nasa.gov/; NASA, 2021).
The supplement related to this article is available online at: https://doi.org/10.5194/acp-21-17079-2021-supplement.
JG conceptualized this study. JG and JZ carried out the analysis with comments from other co-authors. JG and JZ wrote the paper. KY, AS, HL, SY, and TS provided useful suggestions for the study. JS contributed to the big data analysis. All authors contributed to the improvement of paper.
The contact author has declared that neither they nor their co-authors have any competing interests.
Publisher's note: Copernicus Publications remains neutral with regard to jurisdictional claims in published maps and institutional affiliations.
This study is jointly supported by the National Key Research and Development Program of the Ministry of Science and Technology of China under grant 2017YFC1501401, the National Natural Science Foundation of China under grants 41771399, 41531070, 41874177, and 62101203, the S&T Development Fund of CAMS (2021KJ008), and the Fundamental Research Funds for the Central Universities, China University of Geosciences (Wuhan) (no. 162301192698).
This study is jointly supported by the National Key Research and Development Program of the Ministry of Science and Technology of China under grant no. 2017YFC1501401, the National Natural Science Foundation of China under grant nos. 41771399, 41531070, 41874177, and 62101203, the S&T Development Fund of CAMS (2021KJ008), and the Fundamental Research Funds for the Central Universities, China University of Geosciences (Wuhan) (no. 162301192698).
This paper was edited by Yun Qian and reviewed by Ye Liu and two anonymous referees.
Anderson, P. S.: Measurement of Prandtl number as a function of Richardson number avoiding self-correlation, Bound.-Lay. Meteorol., 131, 345–362, https://doi.org/10.1007/s10546-009-9376-4, 2009.
Basha, G., Kishore, P., Ratnam, M. V., Ravindra Babu, S., Velicogna, I., Jiang, J. H., and Ao, C. O.: Global climatology of planetary boundary layer top obtained from multi-satellite GPS RO observations, Clim. Dynam., 52, 2385–2398, https://doi.org/10.1007/s00382-018-4269-1, 2018
Belmonte Rivas, M. and Stoffelen, A.: Characterizing ERA-Interim and ERA5 surface wind biases using ASCAT, Ocean Sci., 15, 831–852, https://doi.org/10.5194/os-15-831-2019, 2019.
CEDA: radiosonde data, available at: https://catalogue.ceda.ac.uk/, last access: 16 November 2021.
Chen, X., Škerlak, B., Rotach, M. W., Añel, J. A., Su, Z., Ma, Y., and Li, M.: Reasons for the extremely high-ranging planetary boundary layer over the western Tibetan Plateau in winter, J. Atmos. Sci., 73, 2021–2038, https://doi.org/10.1175/JAS-D15-0148.1, 2016
CMA: radiosonde data, available at: http://data.cma.cn/en, last access: 16 November 2021.
Collaud Coen, M., Praz, C., Haefele, A., Ruffieux, D., Kaufmann, P., and Calpini, B.: Determination and climatology of the planetary boundary layer height above the Swiss plateau by in situ and remote sensing measurements as well as by the COSMO-2 model, Atmos. Chem. Phys., 14, 13205–13221, https://doi.org/10.5194/acp-14-13205-2014, 2014.
Davy, R. and I. Esau: Differences in the efficacy of climate forcings explained by variations in atmospheric boundary layer depth, Nat. Commun., 7, 11690, https://doi.org/10.1038/ncomms11690, 2016.
de Arruda Moreira, G., Guerrero-Rascado, J. L., Bravo-Aranda, J. A., Benavent-Oltra, J. A., Ortiz-Amezcua, P., Román, R., Bedoya-Velásquez, A. E., Landulfo, E., and AladosArboledas, L.: Study of the planetary boundary layer by microwave radiometer, elastic lidar and Doppler lidar estimations in Southern Iberian Peninsula, Atmos. Res., 213, 185–195, https://doi.org/10.1016/j.atmosres.2018.06.007, 2018.
ECWMF: ERA5 data, available at: https://cds.climate.copernicus.eu/cdsapp#!/dataset/reanalysis-era5-single-levels?tab=form, last access: 16 November 2021.
Galway, J. G.: The lifted index as a predictor of latent instability, B. Am. Meteorol. Soc., 37, 528–529, 1956.
Gelaro, R., McCarty, W., Suárez, M. J., Todling, R., Molod, A., Takacs, L., Randles, C. A., Darmenov, A., Bosilovich, M. G., Reichle, R., Wargan, K., Coy, L., Cullather, R., Draper, C., Akella, S., Buchard, V., Conaty, A., da Silva, A. M., Gu, W., Kim, G.- K., Koster, R., Lucchesi, R., Merkova, D., Nielsen, J. E., Partyka, G., Pawson, S., Putman, W., Rienecker, M., Schubert, S. D., Sienkiewicz, M., and Zhao, B.: The Modern-Era Retrospective Analysis for Research and Applications, Version 2 (MERRA-2), J. Climate, 30, 5419–5454, https://doi.org/10.1175/JCLI-D-16-0758.1, 2017.
Deutscher Wetterdienst (Climate Data Center): radiosonde data, available at: https://opendata.dwd.de/climate_environment/CDC/observations_germany/radiosondes/high_resolution/historical/, last access: 16 November 2021.
GMAO: MERRA-2 data, available at: https://disc.gsfc.nasa.gov/datasets?keywords=MERRA-2&page=1, last access: 16 November 2021.
GRUAN: radiosonde data, available at: ftp://ftp.ncdc.noaa.gov/pub/data/gruan/processing/level2/RS92-GDP/version-002/, last access: 16 November 2021.
Gu, J., Zhang, Y. H., Yang, N., and Wang, R.: Diurnal variability of the planetary boundary layer height estimated from radiosonde data, Earth Planet. Phys., 4, 479–492, https://doi.org/10.26464/epp2020042, 2020.
Guo, J., Miao, Y., Zhang, Y., Liu, H., Li, Z., Zhang, W., He, J., Lou, M., Yan, Y., Bian, L., and Zhai, P.: The climatology of planetary boundary layer height in China derived from radiosonde and reanalysis data, Atmos. Chem. Phys., 16, 13309–13319, https://doi.org/10.5194/acp-16-13309-2016, 2016.
Guo, J., Li, Y., Cohen, J. B., Li, J., Chen, D., Xu, H., Liu, L., Yin, J., Hu, K., and Zhai, P.: Shift in the temporal trend of boundary layer height in China using long-term (1979–2016) radiosonde data, Geophys. Res. Lett., 46, 6080–6089, https://doi.org/10.1029/2019GL082666, 2019.
Haack, A., Gerding, M., and Lübken, F.-J.: Characteristics of stratospheric turbulent layers measured by LITOS and their relation to the Richardson number, J. Geophys. Res.-Atmos., 119, 10605–10618. https://doi.org/10.1002/2013JD021008, 2014.
Hersbach, H., Bell, B., Berrisford, P., Hirahara, S., Horányi, A., Muñoz-Sabater, J., Nicolas, J., Peubey, C., Radu, R., Schepers, D., Simmons, A., Soci, C., Abdalla, S., Abellan, X., Balsamo, G., Bechtold, P., Biavati, G., Bidlot, J., Bonavita, M., De Chiara, G., Dahlgren, P., Dee, D., Diamantakis, M., Dragani, R., Flemming, J., Forbes, R., Fuentes, M., Geer, A., Haimberger, L., Healy, S., Hogan, R. J., Hólm, E., Janisková, M., Keeley, S., Laloyaux, P., Lopez, P., Lupu, C., Radnoti, G., de Rosnay, P., Rozum, I., Vamborg, F., Villaume, S., and Thépaut, J.-N.: The ERA5 Global Reanalysis, Q. J. Roy. Meteor. Soc., 146, 730, 1999–2049, https://doi.org/10.1002/qj.3803, 2020
Houchi, K., Stoffelen, A., Marseille, G. J., and De Kloe, J.: Comparison of wind and wind shear climatologies derived from high-resolution radiosondes and the ECMWF model, J. Geophys. Res.-Atmos., 115, D22123, https://doi.org/10.1029/2009JD013196, 2010.
Japan Meteorological Agency: JRA-55 data, available at: https://climatedataguide.ucar.edu/climate-data/jra-55, last access: 16 November 2021.
King, G. P., Portabella, M., Lin, W., and Stoffelen, A.: Correlating extremes in wind and stress divergence with extremes in rain over the Tropical Atlantic, EUMETSAT Ocean and Sea Ice SAF Scientific Report OSI_AVS_15_02, Version 1.0, available at: https://osi-saf.eumetsat.int/community/stories/correlating-extremes-wind-and-stress-divergence-extremes-rain-over-tropical (last access: 15 November 2021), 2017.
Kobayashi, S., Ota, Y., Harada, Y., Ebita, A., Moriya, M., Onoda, H., Onogi, K., Kamahori, H., Kobayashi, C., Endo, H., Miyaoka, K., and Takahashi, K.: The JRA-55 reanalysis: general specifications and basic characteristics, J. Meteorol. Soc. Jpn., 93, 5–48, https://doi.org/10.2151/jmsj.2015-001, 2015.
Li, H., Y. Yang, X.-M. Hu, Z. Huang, G. Wang, B. Zhang, and Zhang, T.: Evaluation of retrieval methods of daytime convective boundary layer height based on lidar data, J. Geophys. Res.-Atmos., 122, 4578–4593, https://doi.org/10.1002/2016JD025620, 2017.
Liu, S. and Liang, X.-Z.: Observed diurnal cycle climatology of planetary boundary layer height, J. Climate, 23, 5790–5809. https://doi.org/10.1175/2010JCLI3552.1, 2010
Martins, J. P. A., Teixeira, J., Soares, P. M. M., Miranda, P. M. A., Kahn, B. H., Dang, V. T., Irion, F. W., Fetzer, E. J., and Fishbein, E.: Infrared sounding of the trade-wind boundary layer: AIRS and the RICO experiment, Geophys. Res. Lett., 37, L24806, https://doi.org/10.1029/2010GL045902, 2010.
McGrath-Spangler, E. L.: The impact of a boundary layer height formulation on the GEOS-5 model climate, J. Geophys. Res.-Atmos., 121, 3263–3275, https://doi.org/10.1002/2015JD024607, 2016.
McGrath-Spangler, E. L. and Denning, A. S.: Estimates of North American summertime planetary boundary layer depths derived from space-borne lidar, J. Geophys. Res.-Atmos., 117, D15101, https://doi.org/10.1029/2012JD017615, 2012.
NASA: 30 arcsec digital evaluation height (DEM) data, available at: https://search.earthdata.nasa.gov/, last access: 4 November 2021.
NCAR: NECEP-2 data, available at: https://psl.noaa.gov/data/gridded/data.ncep.reanalysis2.html, last access: 16 November 2021.
NOAA: radiosonde data, available at: https://www.ncei.noaa.gov/data/us-radiosonde-bufr/archive/, last access: 16 November 2021.
Oliveira, M. I., Acevedo, O. C., Sörgel, M., Nascimento, E. L., Manzi, A. O., Oliveira, P. E. S., Brondani, D. V., Tsokankunku, A., and Andreae, M. O.: Planetary boundary layer evolution over the Amazon rainforest in episodes of deep moist convection at the Amazon Tall Tower Observatory, Atmos. Chem. Phys., 20, 15–27, https://doi.org/10.5194/acp-20-15-2020, 2020.
Palarz, A., Celiński-Mysław, D., and Ustrnul, Z.: Temporal and spatial variability of surface-based inversions over Europe based on ERA-Interim reanalysis, Int. J. Climatol., 38, 158–168, https://doi.org/10.1002/joc.5167, 2018.
Pal, S. and Haeffelin, M.: Forcing mechanisms governing diurnal, seasonal, and interannual variability in the boundary layer depths: Five years of continuous lidar observations over a suburban site near Paris, J. Geophys. Res.-Atmos., 120, 11936–11956, https://doi.org/10.1002/2015JD023268, 2015.
Palm, S. P., A. Benedetti, and Spinhirne, J.: Validation of ECMWF global forecast model parameters using GLAS atmospheric channel measurements, Geophys. Res. Lett., 32, L22S09, https://doi.org/10.1029/2005GL023535, 2005.
Pithan, F., Angevine, W., and Mauritsen, T.: Improving a global model from the boundary layer: total turbulent energy and the neutral limit Prandtl number, J. Adv. Model. Earth. Syst., 7, 791–805, https://doi.org/10.1002/2014MS000382, 2015.
Ratnam, M. V. and Basha, G.: A robust method to determine global distribution of atmospheric boundary layer top from COSMIC GPS RO measurements, Atmos. Sci. Lett., 11, 216–222, https://doi.org/10.1002/asl.277, 2010.
Rinke, A., Segger, B., Crewell, S., Maturilli, M., Naakka, T., Nygard, T., Vihma, T., Alshawaf, F., Dick, G., Wickert, J., and Keller, J.: Trends of vertically integrated water vapor over the arctic during 1979–2016: Consistent moistening all over?, J. Climate, 32, 6097–6116, https://doi.org/10.1175/JCLI-D-19-0092.1, 2019.
Saha, S., Moorthi, S., Wu, X., Wang, J., Nadiga, S., Tripp, P., Behringer, D., Hou, Y. T., Chuang, H. Y., Iredell, M., and Ek, M.: The NCEP climate forecast system version 2, J. Climate, 27, 2185–2208, https://doi.org/10.1175/JCLI-D-12-00823.1, 2014.
Scotti, A.: Biases in Thorpe-scale estimates of turbulence dissipation. Part II: energetics arguments and turbulence simulations, J. Phy. Oceanog., 45, 2522–2543, https://doi.org/10.1175/JPO-D-14-0092.1, 2015.
Seibert, P., Beyrich, F., Gryning, S. E., Joffre, S., Rasmussen, A., and Tercier, P.: Review and inter-comparison of operational methods for the determination of the mixing height, Atmos. Environ., 34, 1001–1027, https://doi.org/10.1016/S1352-2310(99)00349-0, 2000.
Seidel, D. J., Ao, C. O., and Li, K.: Estimating climatological planetary boundary layer heights from radiosonde observations: Comparison of methods and uncertainty analysis, J. Geophys. Res.-Atmos., 115, D16113, https://doi.org/10.1029/2009JD013680, 2010.
Seidel, D. J., Zhang, Y., Beljaars, A., Golaz, J.-C., Jacobson, A. R., and Medeiros, B.: Climatology of the planetary boundary layer over the continental United States and Europe, J. Geophys. Res.-Atmos., 117, D17106, https://doi.org/10.1029/2012JD018143, 2012.
Serreze, M. C., J. A. Maslanik, M. C. Rehder, R. C. Schnell, J. D. Kahl, and E. L. Andreas, E. L.: Theoretical heights of buoyant convection above open leads in the winter Arctic pack ice cover, J. Geophys. Res.-Atmos., 97, 9411–9422, 1992.
Short, E., Vincent, C. L., and Lane, T. P: Diurnal cycle of surface winds in the Maritime Continent observed through satellite scatterometry, Mon. Weather Rev., 147, 2023–2044, https://doi.org/10.1175/MWR-D-18-0433.1, 2019.
Stull, R. B.: An Introduction to Boundary Layer Meteorology, Kluwer Academic, Dordrecht, the Netherlands, 666 pp., 1988.
Su, T., Li, Z., and Kahn, R.: Relationships between the planetary boundary layer height and surface pollutants derived from lidar observations over China: regional pattern and influencing factors, Atmos. Chem. Phys., 18, 15921–15935, https://doi.org/10.5194/acp-18-15921-2018, 2018.
Su, T., Li, Z., Zheng, Y., Luan, Q., and Guo, J.: Abnormally shallow boundary layer associated with severe air pollution during the COVID-19 lockdown in China, Geophys. Res. Lett., 47, e2020GL090041, https://doi.org/10.1029/2020GL090041, 2020.
Taylor, A. C., Beare, R. J., and Thomson, D. J.: Simulating dispersion in the evening-transition boundary layer, Bound.-Lay. Meteorol., 153, 389–407, https://doi.org/10.1007/s10546-014-9960-0, 2014.
Teixeira, J., Piepmeier, J. R., Nehrir, A. R., Ao, C. O., Chen, S. S., Clayson, C. A., Fridlind, A. M., Lebsock, M., McCarty, W., Salmun, H., Santanello, J. A., Turner, D. D., Wang, Z., and Zeng, X.: Toward a global planetary boundary layer observing system: the NASA PBL incubation study team report, NASA PBL Incubation Study Team, 134 pp., available at: https://science.nasa.gov/science-red/s3fs-public/atoms/files/NASAPBLIncubationFinalReport.pdf, last access: 15 November 2021.
The University of Wyoming: radiosonde data, available at: http://weather.uwyo.edu, last access: 16 November 2021.
von Engeln, A. and Teixeira, J.: A planetary boundary layer height climatology derived from ECMWF reanalysis data, J. Climate, 26, 6575–6590, https://doi.org/10.1175/JCLI-D-12-00385.1, 2013.
Wang, X. and Wang, K.: Homogenized variability of radiosonde-derived atmospheric boundary layer height over the global land surface from 1973 to 2014, J. Climate, 29, 6893–6908, https://doi.org/10.1175/JCLI-D-15-0766.1, 2016.
Wei, N., Zhou, L., and Dai, Y.: Evaluation of simulated climatological diurnal temperature range in CMIP5 models from the perspective of planetary boundary layer turbulent mixing, Clim. Dynam., 49, 1–22, https://doi.org/10.1007/s00382-016-3323-0, 2017.
Yang, K., T. Koike, H. Fujii, T. Tamura, X. Xu, L. Bian, and Zhou, M.: The Daytime Evolution of the Atmospheric Boundary Layer and Convection over the Tibetan Plateau: Observations and Simulations, J. Meteorol. Soc. Jpn., 82, 1777–1792, 2004.
Zhang, Y., Sun, K., Gao, Z., Pan, Z., Shook, M. A., and Li, D.: Diurnal climatology of planetary boundary layer height over the contiguous United States derived from AM- 115 DAR and reanalysis data, J. Geophys. Res.-Atmos., 125, e2020JD032803, https://doi.org/10.1029/2020JD032803, 2020a.
Zhang, Y., Guo, J., Yang, Y., Wang, Y., and Yim, S. H. L.: Vertical wind shear modulates particulate matter pollutions: A perspective from Radar wind profiler observations in Beijing, China, Remote Sens., 12, 546, https://doi.org/10.3390/rs12030546, 2020b.
Zhang, W., Guo, J., Miao, Y., Liu, H., Li, Z., and Zhai, P.: Planetary boundary layer height from CALIOP compared to radiosonde over China, Atmos. Chem. Phys., 16, 9951–9963, https://doi.org/10.5194/acp-16-9951-2016, 2016.
Zhang, W., Guo, J., Miao, Y., Liu, H., Song, Y., Fang, Z., He, J., Lou, M., Yan, Y., Li, Y., and Zhai, P.: On the summertime planetary boundary layer with different thermodynamic stability in China: A radiosonde perspective, J. Climate, 31, 1451–1465, https://doi.org/10.1175/JCLI-D-17-0231.1, 2018.
Zhang, J., Zhang, S. D., Huang, C. M., Huang, K. M., Gong, Y., Gan, Q., and Zhang, Y. H.: Latitudinal and topographical variabilities of free atmospheric turbulence from high-resolution radiosonde data sets, J. Geophys. Res.-Atmos., 124, 4283–4298, https://doi.org/10.1029/2018JD029982, 2019.
Zhang, Y., D. J. Seidel, J.-C. Golaz, C. Deser, and Tomas, R. A.: Climatological characteristics of Arctic and Antarctic surface-based inversions, J. Climate, 24, 5167–5186, https://doi.org/10.1175/2011JCLI4004.1, 2011.
Zhang, Y. H., Seidel, D. J., and Zhang, S. D.: Trends in planetary boundary layer height over Europe, J. Climate, 26, 10071–10076, https://doi.org/10.1175/JCLI-D-13-00108.1, 2013.
Zilitinkevich, S. and Baklanov, A.: Calculation of the height of the stable boundary layer in practical applications, Bound.-Lay. Meteorol., 105, 389–409, https://doi.org/10.1023/A:1020376832738, 2002.