the Creative Commons Attribution 4.0 License.
the Creative Commons Attribution 4.0 License.
 | 24 Nov 2021
Origin of water-soluble organic aerosols at the Maïdo high-altitude observatory, Réunion Island, in the tropical Indian Ocean
Sharmine Akter Simu
Eri Tachibana
Henning Finkenzeller
Jérôme Brioude
Aurélie Colomb
Olivier Magand
Bert Verreyken
Stephanie Evan
Rainer Volkamer
Trissevgeni Stavrakou
The tropical and subtropical Indian Ocean (IO) is expected to be a significant source of water-soluble organic aerosols (WSOAs), which are important factors relevant to cloud formation of aerosol particles. Current atmospheric numerical models significantly underestimate the budget of organic aerosols and their precursors, especially over tropical oceans. This is primarily due to poor knowledge of sources and the paucity of observations of these parameters considering spatial and temporal variation over the tropical open ocean. To evaluate the contribution of sources to WSOA as well as their formation processes, submicrometer aerosol sampling was conducted at the high-altitude Maïdo observatory (21.1∘ S, 55.4∘ E; 2160 m a.s.l.), located on the remote island of La Réunion in the southwest IO. The aerosol samples were continuously collected during local daytime and nighttime, which corresponded to the ambient conditions of the marine boundary layer (MBL) and free troposphere (FT), respectively, from 15 March to 24 May 2018. Chemical analysis showed that organic matter was the dominant component of submicrometer water-soluble aerosol (∼ 45 ± 17 %) during the wet season (15 March–23 April). On the other hand, sulfate dominated (∼ 77 ± 17 %) during the dry season (24 April–24 May), most of which was attributable to the effect of volcanic eruption. Measurements of the stable carbon isotope ratio of water-soluble organic carbon (WSOC) suggested that marine sources contributed significantly to the observed WSOC mass in both the MBL and the FT in the wet season, whereas a mixture of marine and terrestrial sources contributed to WSOC in the dry season. The distinct seasonal changes in the dominant source of WSOC were also supported by Lagrangian trajectory analysis. Positive matrix factorization analysis suggested that marine secondary organic aerosol (OA) dominantly contributed to the observed WSOC mass (∼ 70 %) during the wet season, whereas mixtures of marine and terrestrial sources contributed during the dry season in both MBL and FT. Overall, this study demonstrates that the effect of marine secondary sources is likely important up to the FT in the wet season, which may affect cloud formation as well as direct radiative forcing over oceanic regions.
- Article
(3803 KB) - Full-text XML
-
Supplement
(203 KB) - BibTeX
- EndNote


The ocean is a major source of submicrometer aerosols, which play an important role in the atmospheric radiative budget because they determine the number of cloud condensation nuclei (CCN) and ice nuclei (IN). Marine-derived submicrometer organic aerosols (OAs) can affect the marine aerosol optical depth (AOD) as well as CCN and IN concentrations. These are particularly important over remote oceans, as these areas experience minimal influence from anthropogenic emissions originating from terrestrial sources. In general, organic matter (OM) is concentrated in the sea surface microlayers relative to bulk seawater. OM is further concentrated in aerosols during the bubble-bursting process, which produces primary submicrometer sea spray aerosols (SSAs) that are enriched in OM (O'Dowd and De Leeuw, 2007). Moreover, sea-to-air emissions of volatile organic compounds (VOCs) produced by marine microbial activity have the potential to form secondary OAs. Nevertheless, there is still a large uncertainty in the potential sources and formation processes of OA in the marine atmosphere, leading to uncertainty in determining their climate impact.
The tropical Indian Ocean (IO) is an oceanic region with high primary productivity (Jayaraman et al., 1998; Langley DeWitt et al., 2013; Höpner et al., 2016) (Fig. 1), where significant emissions of VOCs, including oxygenated VOCs (OVOCs), and OAs are expected. A number of previous studies have focused on aerosols over the northern IO, particularly around India (Chylek et al., 2006; Madhavan et al., 2008; Srinivas and Sarin, 2013). These studies have addressed the impact of anthropogenic and land influences from Asia on the marine background. Conversely, the southwest IO is one of the few pristine regions in the global ocean. It is generally not affected by anthropogenic emissions originating from continental sources. Moreover, the western IO has been recognized as a region in which phytoplankton blooms occur frequently (Kyewalyanga, 2016; Roxy et al., 2016). Consequently, it is suitable to investigate remote marine aerosol composition and its relationship to oceanic emissions (Mallet et al., 2018). The source apportionment of organic aerosols has not yet been investigated, particularly for both marine and high-altitude sites that cover both the marine boundary layer (MBL) and lower free tropospheric (FT) conditions over tropical oceans in the Southern Hemisphere.
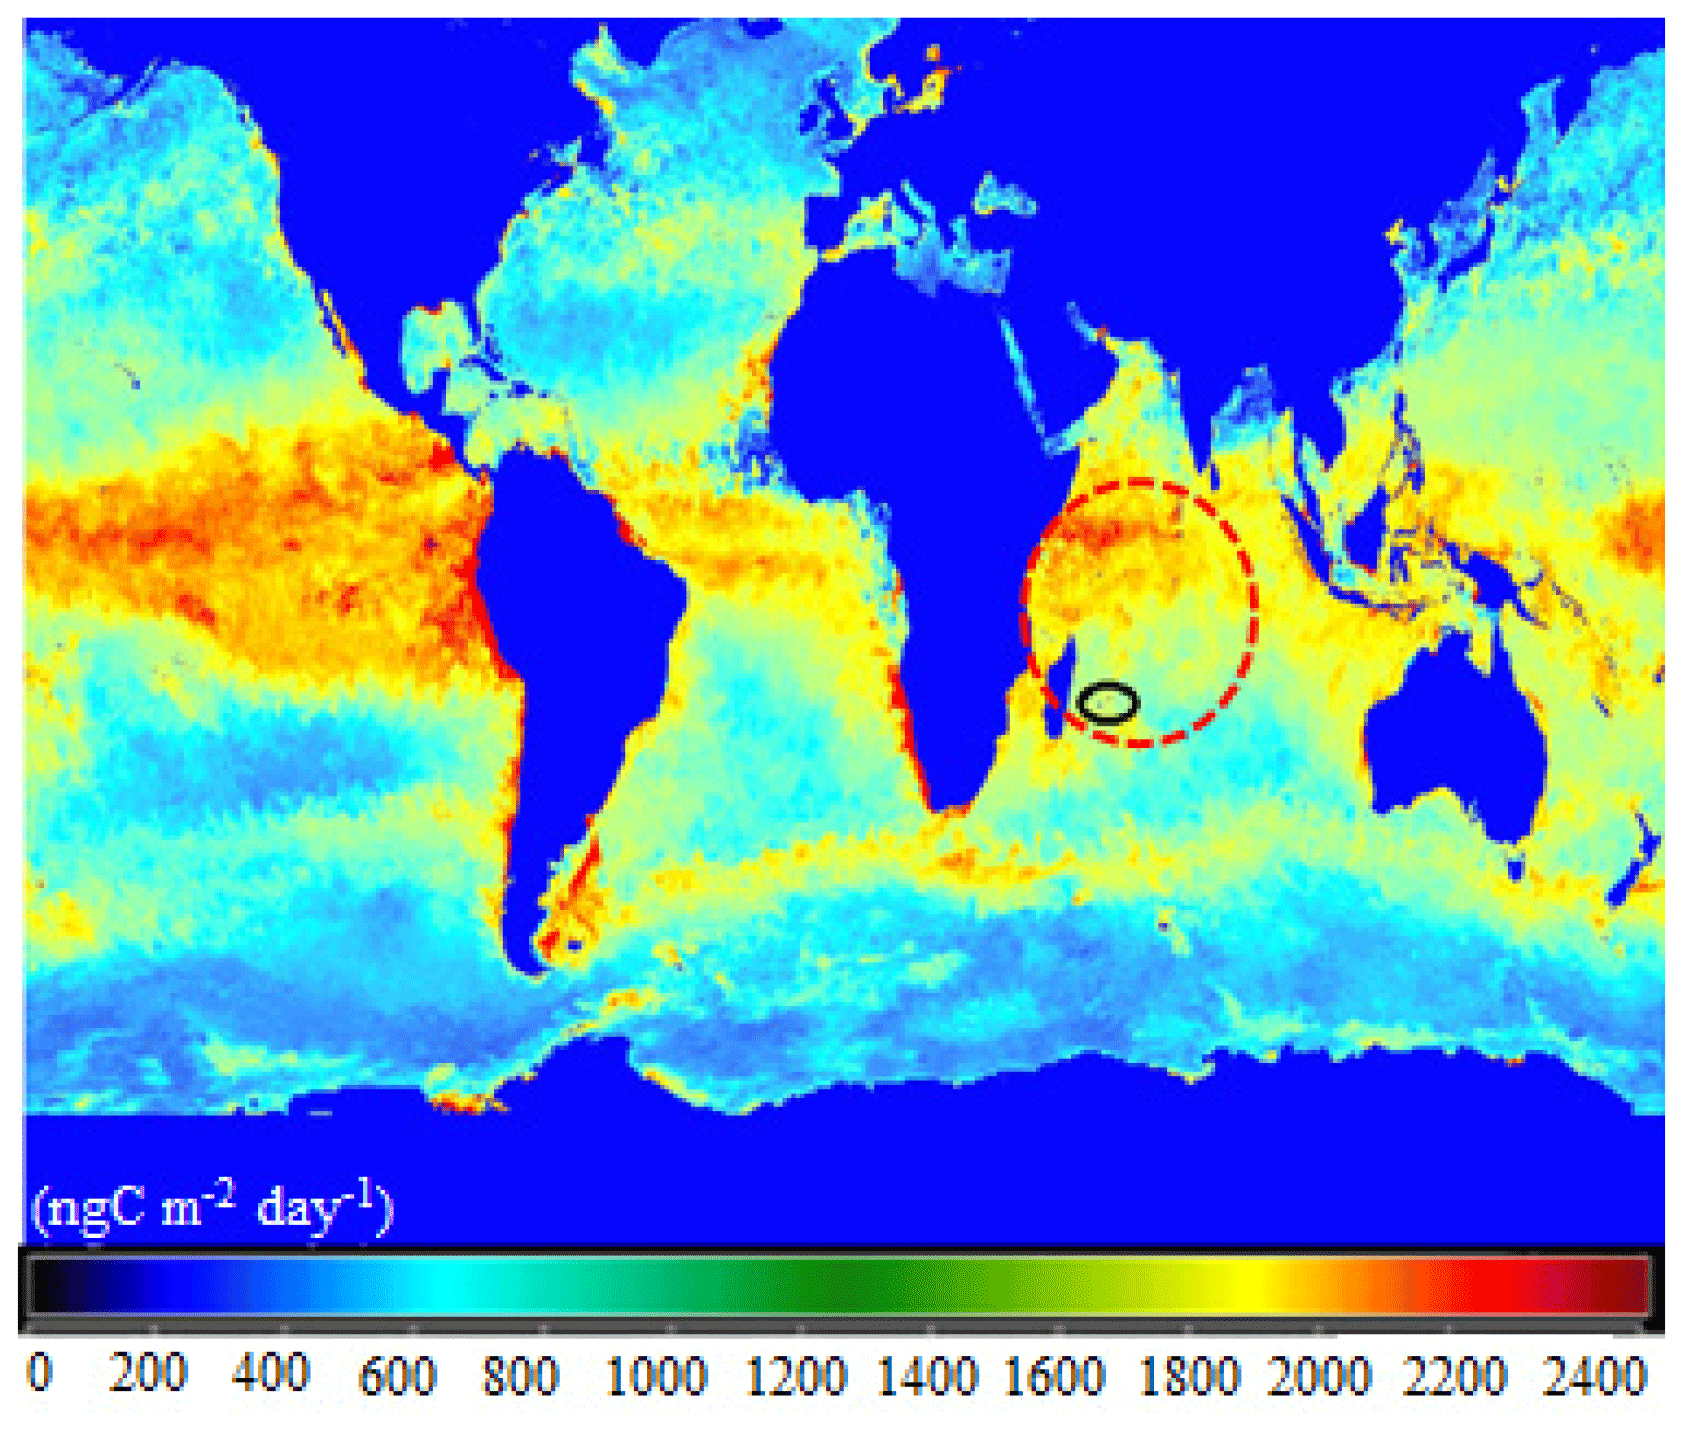
Figure 1Annual average of marine primary productivity for the year 2018. The colors in the map explain the productivity condition of the ocean. Blue (0–1200 ngC m−2 d−1), green (1200–1800 ngC m−2 d−1), and from yellow to red (1800–2400 ngC m−2 d−1) colors indicate oligotrophic, mesotrophic, and eutrophic states of the oceanic regions, respectively (Carr et al., 2006; Istvánovics, 2009). The dashed red circle indicates a region of Indian Ocean with high primary productivity and black circle indicates the location of the Maïdo high-altitude observatory. The figure was produced and adapted from the NASA's OceanColor Web (http://oceancolor.gsfc.nasa.gov/cgi/l3, last access: 7 July 2021).
This paper presents a 2-month study of chemical composition and stable carbon isotope ratios in marine aerosols obtained at a high-altitude observatory in La Réunion in the southwest IO over two seasons. The purpose of this study was to evaluate the contribution of marine/terrestrial sources to water-soluble organic aerosols and their formation processes in MBL and FT over the tropical Indian Ocean.
2.1 The Maïdo high-altitude observatory
The high-altitude Maïdo observatory (21.1∘ S, 55.4∘ E; 2160 m a.s.l.) is located on the remote island of La Réunion in the southwest IO (Baray et al., 2013). The observatory is affected by prevailing southeasterly trade winds in the MBL. The meteorological field in that region is characterized by wet (typically from November to April) and dry seasons (from May to October). Cyclones can occur typically between November and May (Baray et al., 2013). Previous studies reported that the observatory is located in the MBL during daytime, and in the FT during nighttime (Baray et al., 2013; Guilpart et al., 2017). Although Collaud Coen et al. (2018) pointed to influence of residual aerosols in daytime on nighttime conditions at high-altitude stations, Guilpart et al. (2017) showed a 1-year long record of the isotopic composition of water vapor at the same observatory to demonstrate the validity of the assumption of FT conditions at night. Thus, we aimed to obtain aerosol samples in daytime and nighttime conditions by using two identical aerosol samplers, as described in the following subsection.
2.2 Aerosol sampling
Submicrometer aerosol samples were collected at the Maïdo observatory during the period of 15 March–24 May 2018, in the framework of the OCTAVE (Oxygenated Compounds in the Tropical Atmosphere: Variability and Exchanges) project (e.g., Verreyken et al., 2020). The aerosol samplings were conducted continuously using two high-volume air samplers (HVASs; Model 120SL, Kimoto Electric, Osaka, Japan) in parallel, with cascade impactors (Model-TE 234, Tisch Environmental, Inc., Cleves, OH, USA) attached to each. The samples were collected onto quartz-fiber filters at a flow rate of 1130 L min−1 with one sampler during daytime (07:00–18:00 in local time; LT) and the other sampler during nighttime (22:00–05:00 LT) by auto power supply. To avoid the influence of residual layer on the separation between MBL and FT conditions, 18:00–22:00 and 05:00–07:00 LT were set to be transition time. After the sample collection, the filter samples were stored in the glass vial with a Teflon-lined screw cap at −20 ∘C in a freezer prior to the analysis.
In this study, we used analytical results obtained from the bottom stage of the impactor, which collected particles with aerodynamic diameter (Dp) lower than 0.95 µm. Here, ambient aerosol particles collected at the bottom are referred to as submicrometer aerosol particles. The sample filters were typically exchanged every 2–3 d. The average volumes of the sampled air were 2098 and 1454 m3 during daytime and nighttime, respectively.
2.3 Measurements of chemical parameters of water-soluble aerosols
Water-soluble aerosols are defined as particles sampled on the filter and extracted with ultrapure water followed by filtration through a syringe filter (Miyazaki et al., 2018). To determine the water-soluble organic carbon (WSOC) concentration of the submicrometer filter samples, a filter cut of 39.25 cm2 was extracted with 15 mL ultrapure water using an ultrasonic bath for 15 min. The extracts were filtered through a 0.22 µm pore syringe filter and then injected into a total organic carbon (TOC) analyzer (Model TOC-LCHP, Shimadzu) (Miyazaki et al., 2018, 2020).
To measure the stable carbon isotope ratio of WSOC (δ13CWSOC), another filter cut (27.24 cm2) for each sample was acidified to pH 2 with hydrochloric acid (HCl) to remove inorganic carbon prior to extraction (Miyazaki et al., 2018, 2020). The decarbonated filter samples were then dried under a nitrogen stream for approximately 2 h. WSOC was extracted from the filters in 20 mL of ultrapure water using the method described above to measure the WSOC concentration. The extracted samples were concentrated by rotary evaporation, and 40 µL of each sample were transferred to be absorbed onto 10 mg of pre-combusted Chromosorb in a pre-cleaned tin cup. The δ13CWSOC was then measured using a Flash EA 1112/continuous flow carrier gas system (ConFlo) – isotope ratio mass spectrometer (Delta V, Thermo Finnigan).
To determine the concentrations of inorganic ions, another filter cut was extracted with ultrapure water. The total extract was filtered through a membrane disk filter, and major inorganic ions (SO, NO, NO, Cl−, Br−, NH, Na+, K+, Ca2+, and Mg2+), including methanesulfonic acid (MSA), were determined using an ion chromatograph (model 761 compact IC; Metrohm, Herisau, Switzerland) (Miyazaki et al., 2016).
2.4 Measurements of molecular tracer compounds
Another portion of the filter (58.9 cm2) was extracted with dichloromethane and methanol to measure biogenic molecular tracers. The molecular compounds include 2-methyltetrol, pinic acid, pinonic acid, and 3-methyl-1,2,3-butanetricarboxylic acid (3-MBTCA), as oxidation products of biogenic VOCs (Yu et al., 1999; Claeys et al., 2004, 2007; Szmigielski et al., 2007). In addition, tracers of primary biogenic emissions, such as glucose (Simoneit et al., 2004) and n-nonacosan-10-ol (Miyazaki et al., 2019), were also measured. The –COOH and –OH functional groups in the extracts were reacted with N,O-bis-(trimethylsilyl) trifluoroacetamide to form trimethylsilyl (TMS) esters and TMS ethers, respectively (Fu et al., 2011). The TMS derivatives were then analyzed for the compounds listed above using a capillary gas chromatograph (GC8890, Agilent) coupled to a mass spectrometer (MSD5977B, Agilent).
2.5 Meteorological parameters and FLEXPART backward trajectory
Water vapor mixing ratio values at the sampling site were derived from the automatic measurements of ambient temperature and relative humidity monitored by meteorological sensors (Vaisala, Helsinki, Finland) at the Maïdo observatory. To investigate air-mass histories from the sampling site, 10 d backward trajectories were computed using the Lagrangian FLEXible PARTicle dispersion model, FLEXPART (Stohl et al., 1998; Pisso et al., 2019). These FLEXPART simulations were driven with hourly European Centre for Medium-Range Weather Forecasts (ECMWF) operational data at 0.5∘ horizontal resolution and 137 vertical levels. The calculation was initialized at 00:00, 06:00, 12:00, and 18:00 UTC every day during the sampling period.
2.6 Positive matrix factorization
Positive matrix factorization (PMF) (Paatero and Tapper, 1994) was used to identify and characterize possible sources of the observed WSOC during the study period. In this study, EPA PMF 5.0 (Norris et al., 2014) was used for the calculation with inputs of mass concentrations of 16 chemical components (WSOC, glucose, n-nonacosan-10-ol, 2-methyltetrol, pinic acid, pinonic acid, 3-MBTCA, SO, NO, NH, Na+, MSA, Br−, K+, Ca2+, and Mg2+). The analytical measurement uncertainties of each component were derived in each individual analysis and were used as uncertainties in the PMF model. The calculation was performed with 20 runs. We explored PMF outputs by varying number of factors systematically to check Q values (i.e., values reached by the objective function which is minimized by the PMF model), distribution of residuals, physical sense of source profiles, and contributions (Table S1). As a result, six factors were the most appropriate number of factors corresponding to meaningful sources. The PMF reproduced more than 86 % of the measured mass concentrations of WSOC.
3.1 Water vapor mixing ratios as an indicator of diurnal and seasonal changes in ambient atmospheric conditions
Figure 2 compares the average profiles of the water vapor mixing ratios observed during daytime and nighttime at the observatory during the first half (15 March–23 April 2018) and the second half (24 April–24 May 2018) of the sampling period. In this study, the wet season was defined as the first half of the sampling period, whereas the latter half was defined as the dry season reflecting the significant difference in the water vapor mixing ratios between wet (8.7 ± 2.6 g kg−1) and dry seasons (6.4 ± 1.4 g kg−1), where the confidence interval of 95 % for the difference is higher than zero. Indeed, it is apparent that the level of the water vapor mixing ratios substantially decreased just after 24 April (Fig. S1). Moreover, water vapor mixing ratios during daytime (9.3 ± 2.7 and 8.1 ± 2.5 g kg−1 for the wet and dry seasons, respectively) were significantly higher than those observed during nighttime (7.4 ± 0.9 and 5.4 ± 1.4 g kg−1 for the wet and dry seasons, respectively.
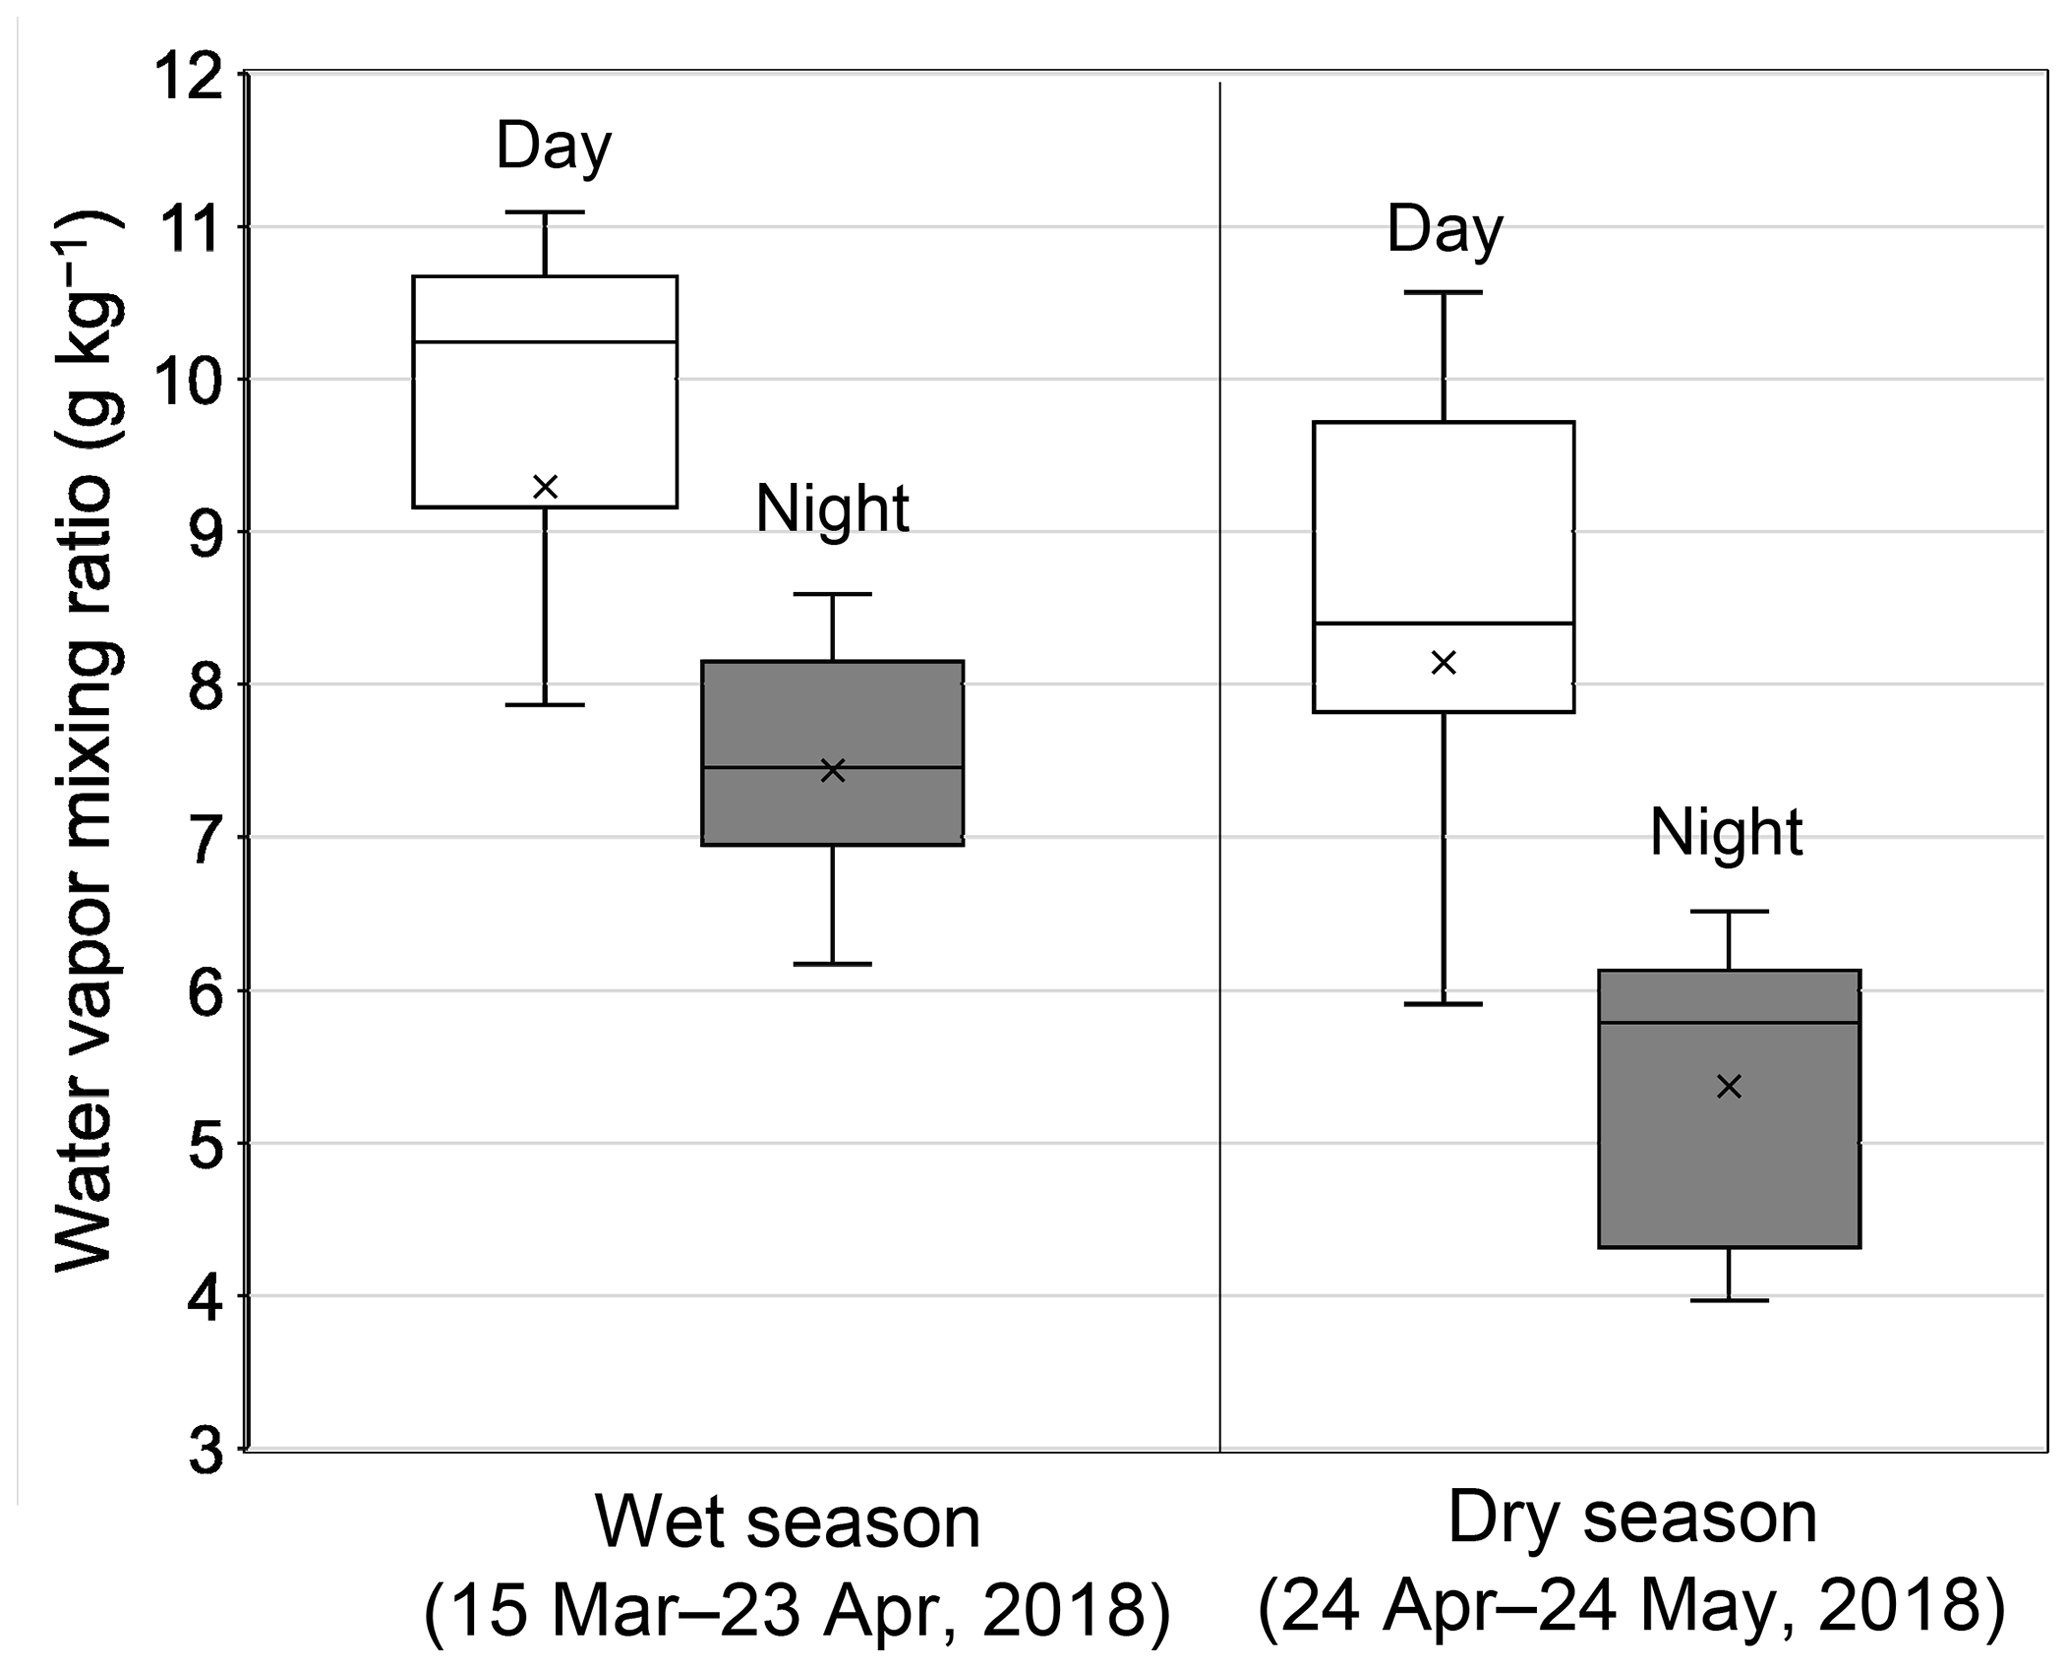
Figure 2Box–whisker plots of the water vapor mixing ratio during the first half (15 March–23 April 2018) and second half (24 April–24 May 2018) of the sampling period. White and gray box plots indicate the data for daytime (07:00–18:00 LT) and nighttime (22:00–05:00 LT), respectively; medians and the upper/lower 25th percentiles of data are shown. Cross marks indicate the average values of each category.
Guilpart et al. (2017) presented a 1-year record of the mixing ratio of water vapor at the Maïdo observatory, demonstrating a clear seasonal decrease in the mixing ratio from March to May. Moreover, they reported distinct diurnal variations in the water vapor mixing ratio with averages of 9.7 ± 2.4 g kg−1 during the day (07:00–18:00 LT) and 6.4 ± 2.9 g kg−1 at night (22:00–05:00 LT) during the 1-year period, showing that the Maïdo observatory indeed located both in the MBL and FT during the day and at night, respectively. The observed levels of the water vapor mixing ratio and their seasonal changes in this study are in good agreement to those reported by Guilpart et al. (2017). Therefore, the results presented in this study confirm that the observatory was located in the MBL during daytime, whereas it was in the FT at night.
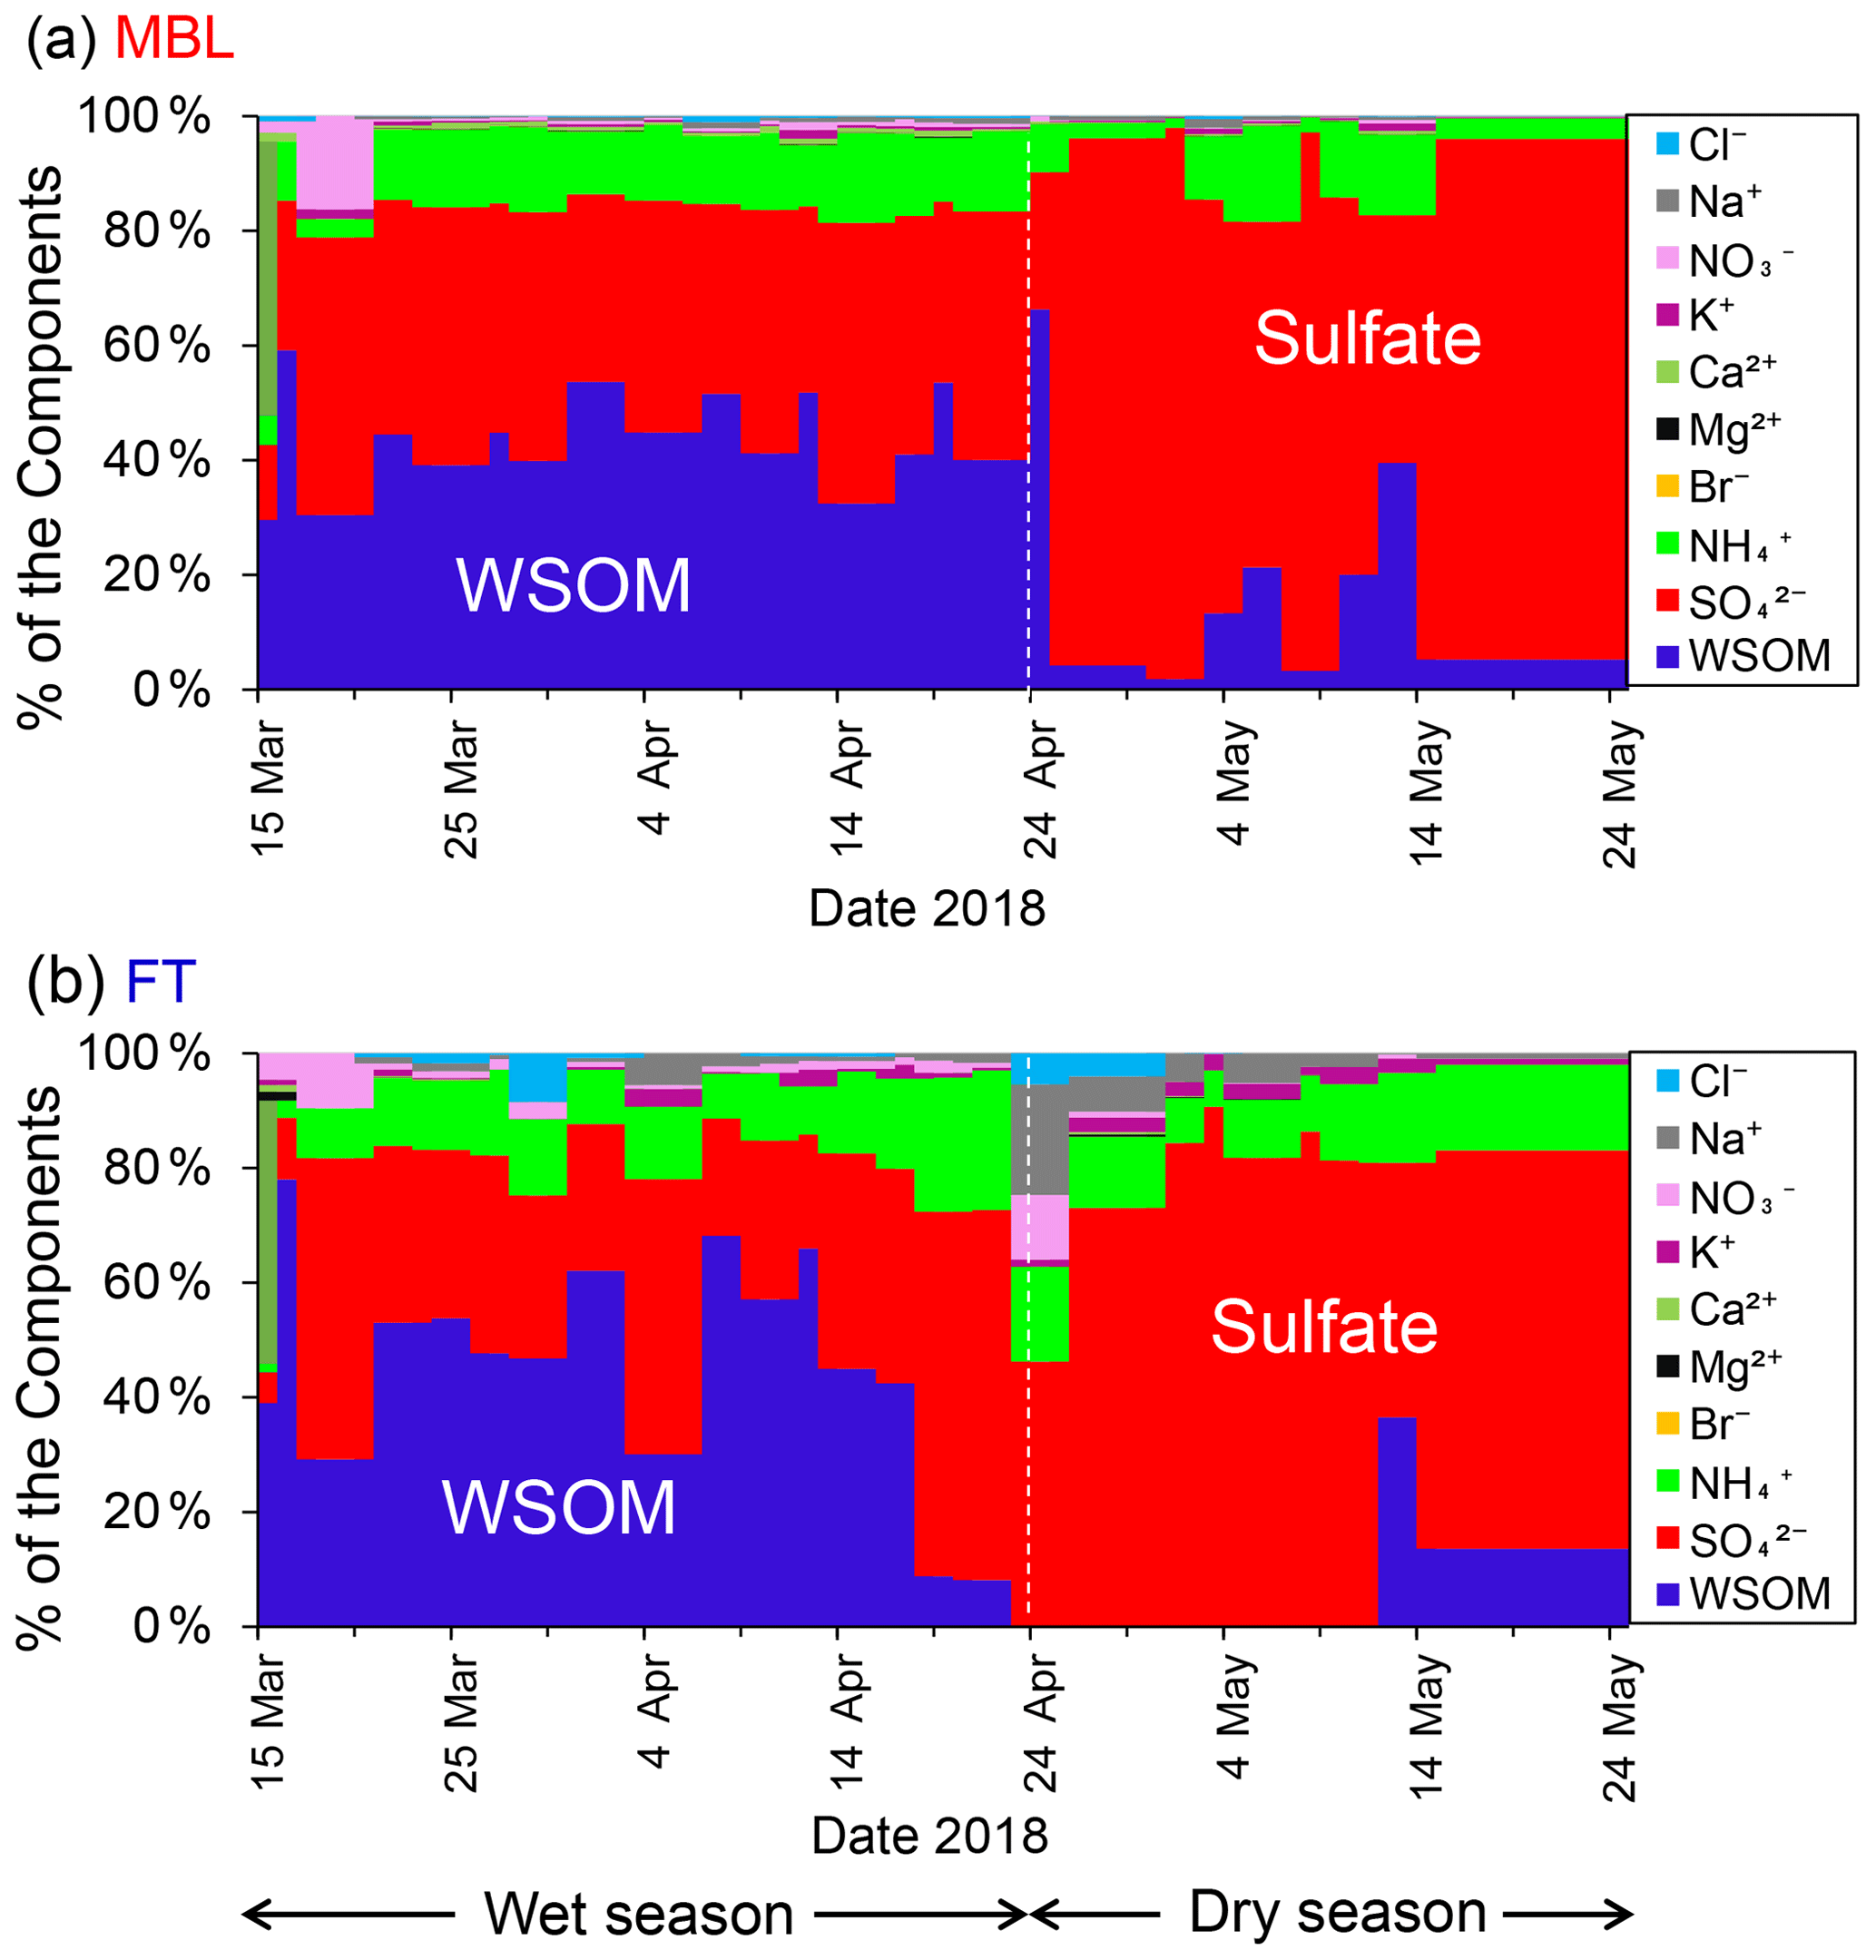
Figure 3Time series of the chemical mass fraction of the submicrometer water-soluble aerosols under (a) MBL (in daytime) and (b) FT (in nighttime) conditions throughout the sampling period.
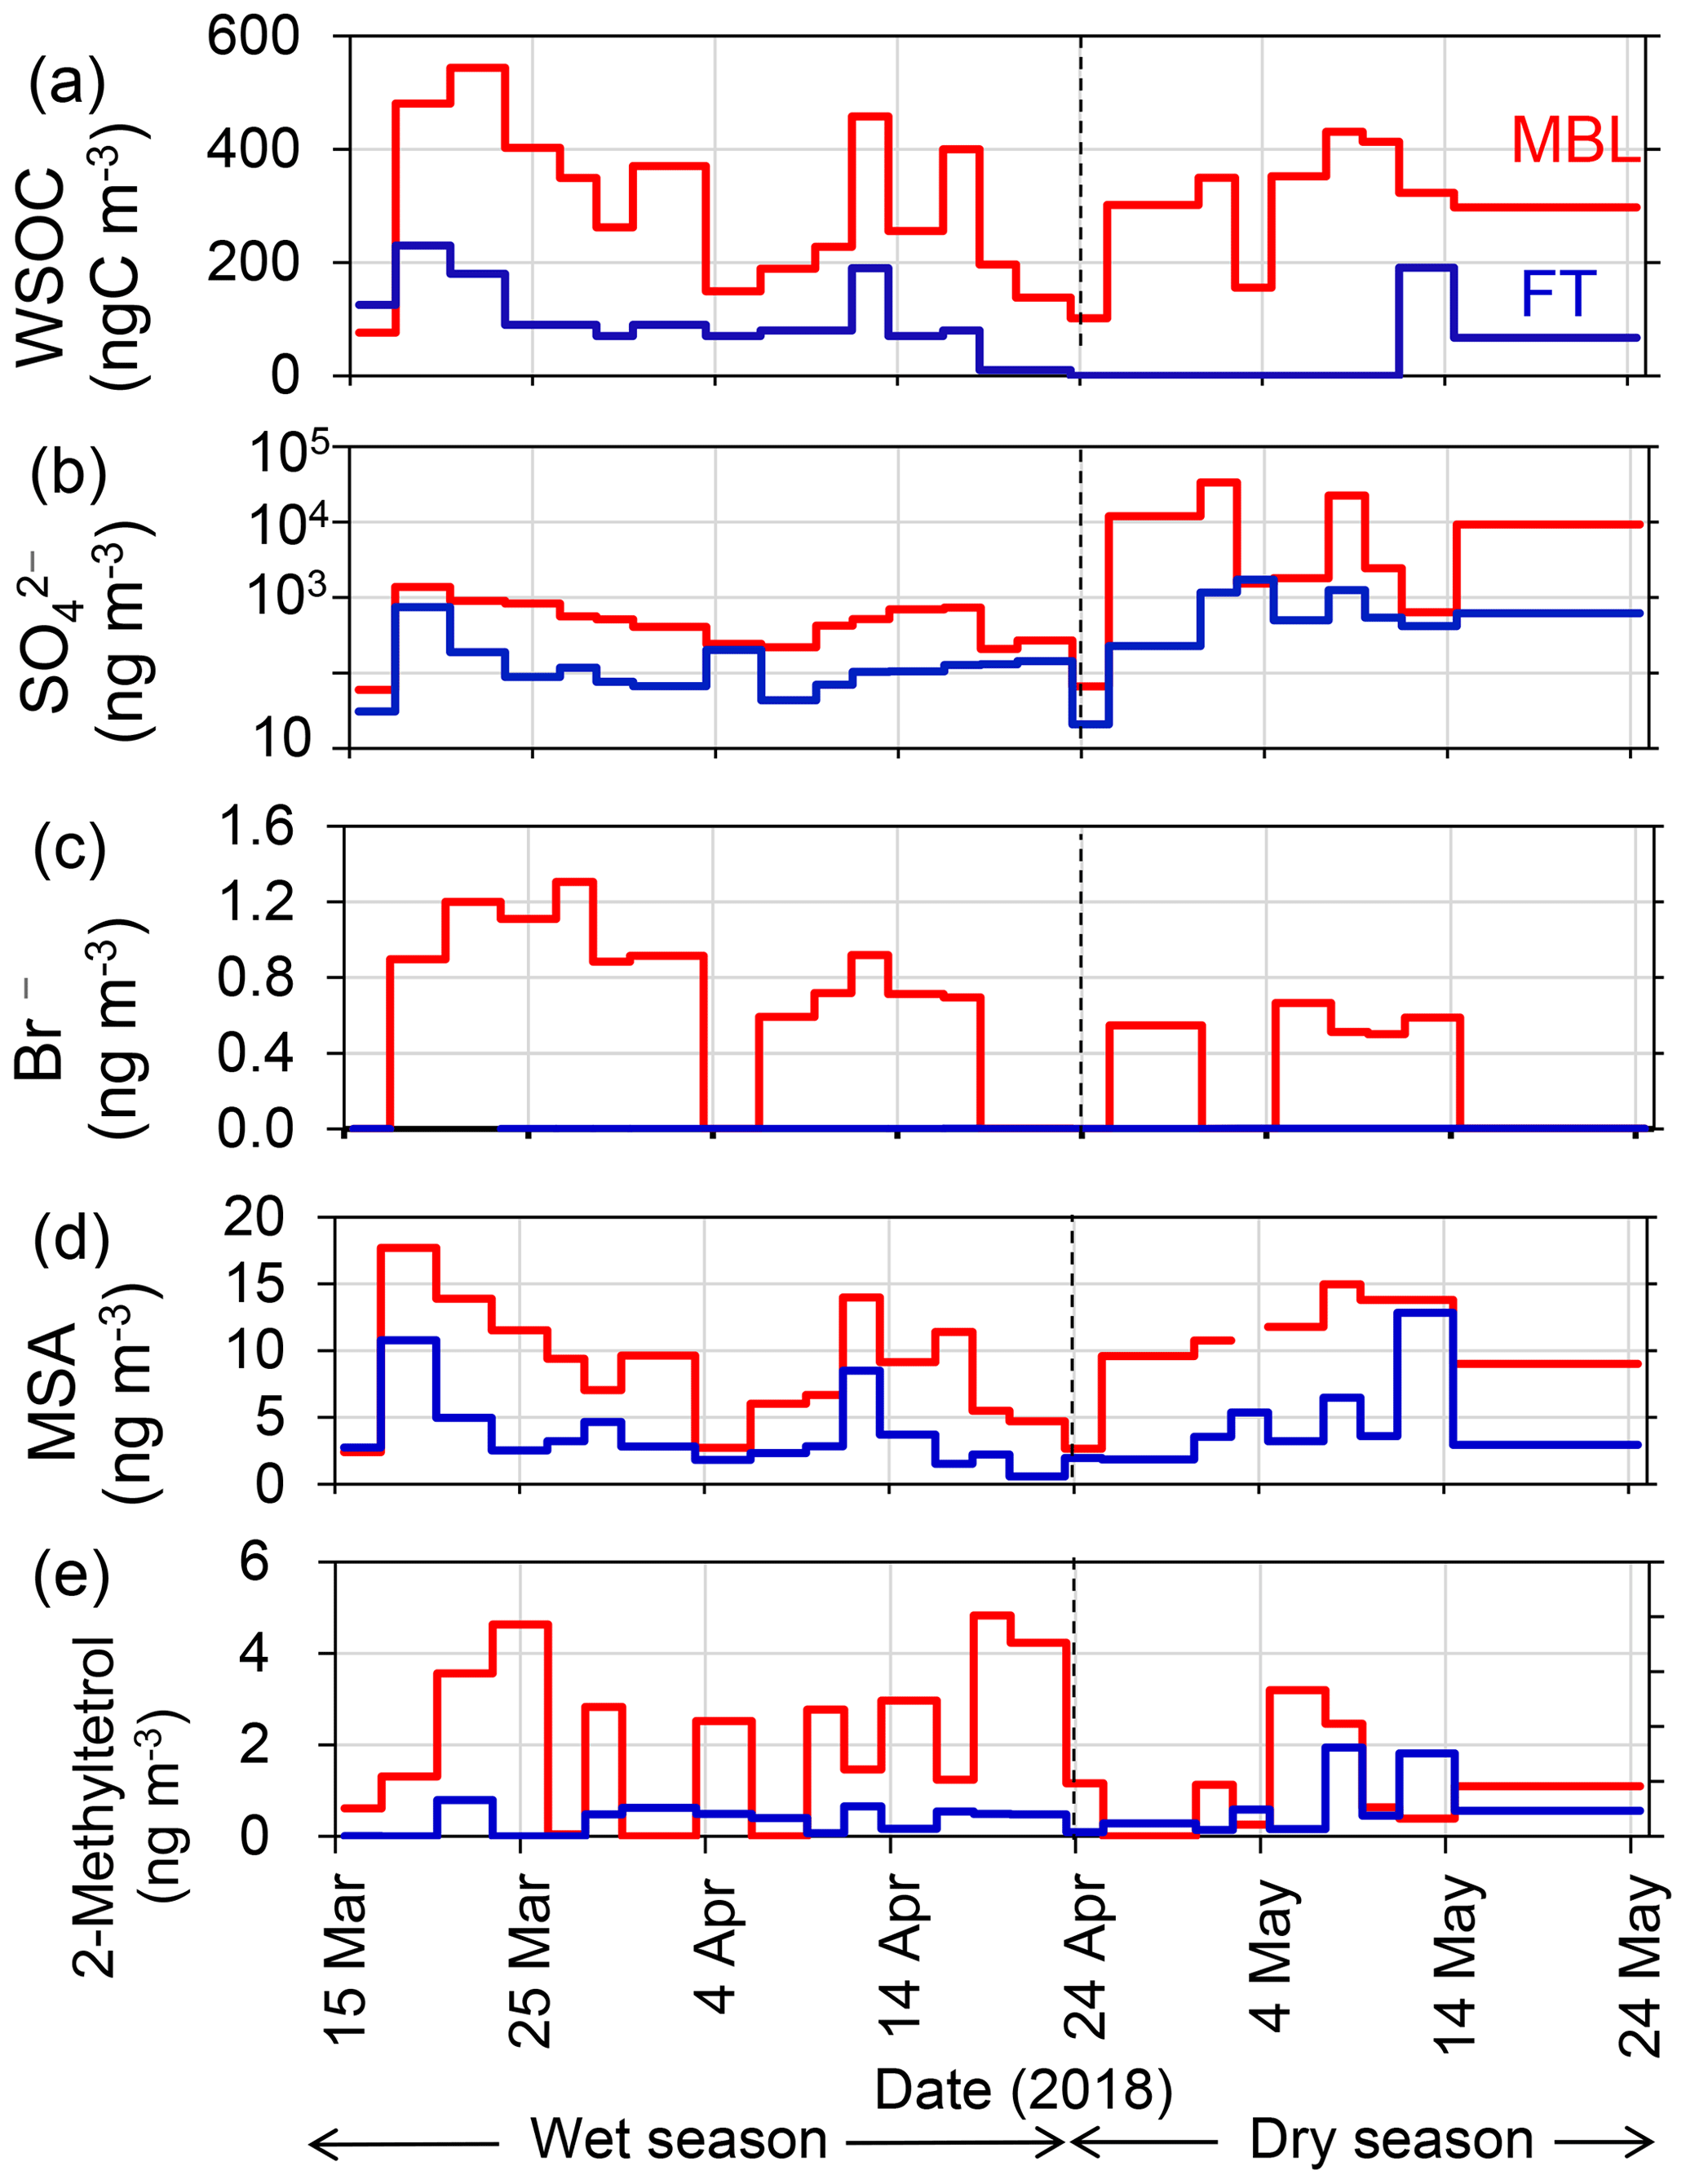
Figure 4Time series of the mass concentrations of (a) WSOC, (b) sulfate, (c) bromide, (d) MSA, and (e) 2-methyltetrol under the MBL (red) and FT (blue) conditions.
3.2 Seasonal variations of mass fractions and concentrations of submicrometer water-soluble aerosol
Figure 3 shows seasonal changes in chemical mass fraction of the submicrometer water-soluble aerosols under the MBL and FT conditions during the entire sampling period. Water-soluble organic matter (WSOM) dominated the aerosol mass in the MBL (46 ± 10 %) and in the FT (43 ± 23 %) during the wet season. In contrast, during the dry season, sulfate was the dominant component of the submicrometer water-soluble aerosol mass in both the MBL (77 ± 19 %) and the FT (76 ± 15 %). The pattern of the temporal variation of the mass fractions was similar in MBL and FT in both seasons.
Figure 4 shows temporal variations in the mass concentrations of WSOC in comparison with those of sulfate, bromide, MSA, and 2-methyltetrol under the MBL and FT conditions during the entire period. Clearly, the average concentrations of WSOC (306 ± 140 and 303 ± 109 ngC m−3 in the wet and dry seasons, respectively) in the MBL were substantially larger than those in the FT (91 ± 64 and 32 ± 68 ngC m−3 in the wet and dry seasons, respectively) (Table 1). These average concentrations of WSOC in the MBL are substantially larger than those previously observed (∼ 60 ngC m−3) at Amsterdam Island located in the southern IO sector of the Austral Ocean (Sciare et al., 2009). Sciare et al. (2009) suggested that atmospheric dilution induced by the long-range transport of marine aerosols resulted in the lower concentrations of WSOC in their study, which may partly explain the difference in the concentrations of WSOC between the current study and their study.
Table 1Average concentrations and ratios of the major parameters under the marine boundary layer (MBL; daytime) and free tropospheric (FT; nighttime) conditions at the Maïdo observatory during wet and dry seasons. The numbers in the parentheses show the lower detection limit of mass concentration and the number of samples that showed values below the lower limit of detection (LOD) in each category. If the measured concentrations were below LOD, the concentrations were treated as zero when the averages and standard deviations were calculated.

The extremely high sulfate concentrations observed both in the MBL (up to ∼ 33 µg m−3) and in the FT (up to ∼ 1.7 µg m−3) in the dry season (Fig. 4b) are attributable to the eruption of the Piton de la Fournaise volcano in the southeast of La Réunion, which started on 27 April and continued until the beginning of June 2018. The air masses affected by the volcanic eruption in the southeast of the island were frequently transported to the observatory, where this transport pathway was explained by the strong trade wind which is commonly observed in the dry season. In contrast, no significant corresponding increase in the WSOC concentrations during this period (Fig. 4a) was observed, suggesting that the contribution of the volcanic eruption to the WSOC mass was insignificant.
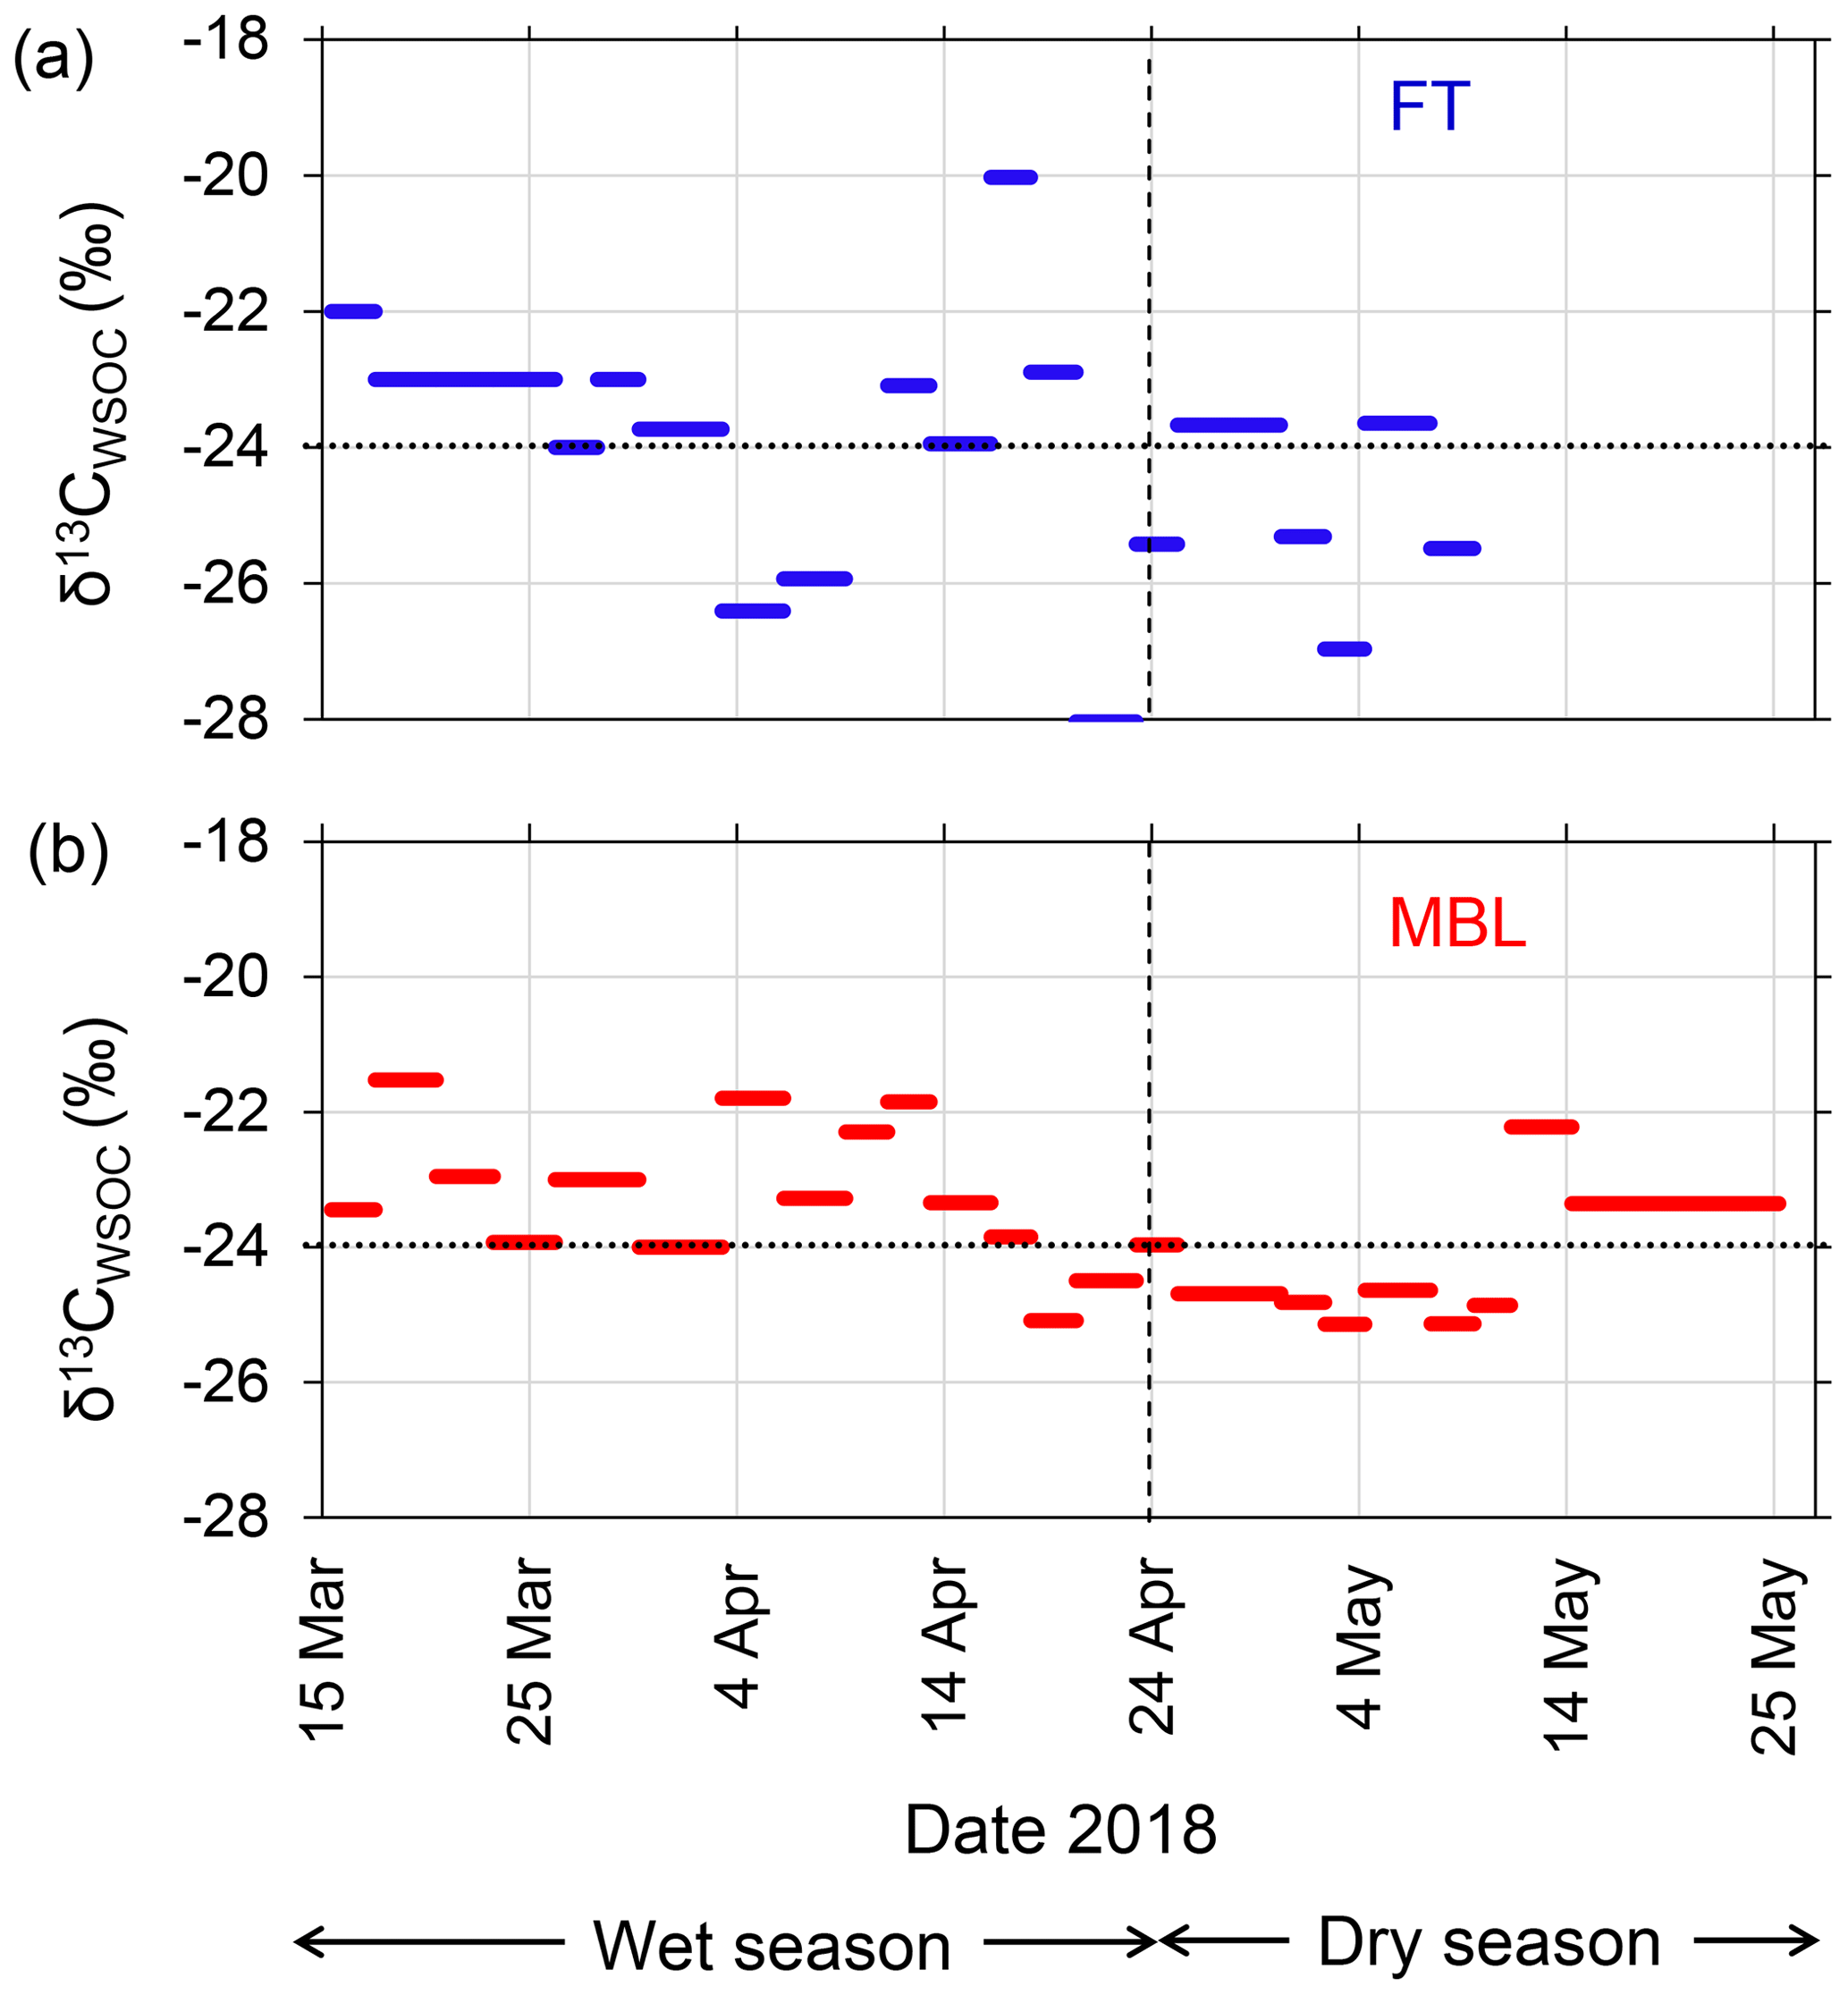
Figure 5Time series of stable carbon isotope ratio of WSOC (δ13CWSOC) under (a) FT and (b) MBL conditions during the entire sampling period. Dashed lines indicate the transition from wet to dry seasons. Dotted lines indicate the boundary of δ13CWSOC ranges distinguishing assumed marine (>−24 ‰) and terrestrial sources (<−24 ‰).
Bromide is used here as a tracer of marine primary emissions, whereas MSA is formed by the oxidation of dimethyl sulfide (DMS) emitted from the marine surface and is used as a tracer of marine secondary production. Substantially larger concentrations of bromide and MSA in the MBL than in the FT were also observed (Fig. 4c and d). The average bromide concentration in the wet season was twice as large as that in the dry season (Table 1), reflecting higher biological productivity (Zhu et al., 2019) in the wet season. The temporal variation of the concentration of MSA is similar to that of WSOC (R2=0.71, p<0.01), suggesting that the dominant source of WSOC is similar to MSA. The concentrations of 2-methyltetrol, an oxidation product of isoprene, were typically larger in the MBL than in the FT in the wet season (Fig. 4e), although their temporal variations are generally different from those of WSOC (R2<0.01) with the exception of a few samples. The contributions of terrestrial sources are further discussed in the following sections.
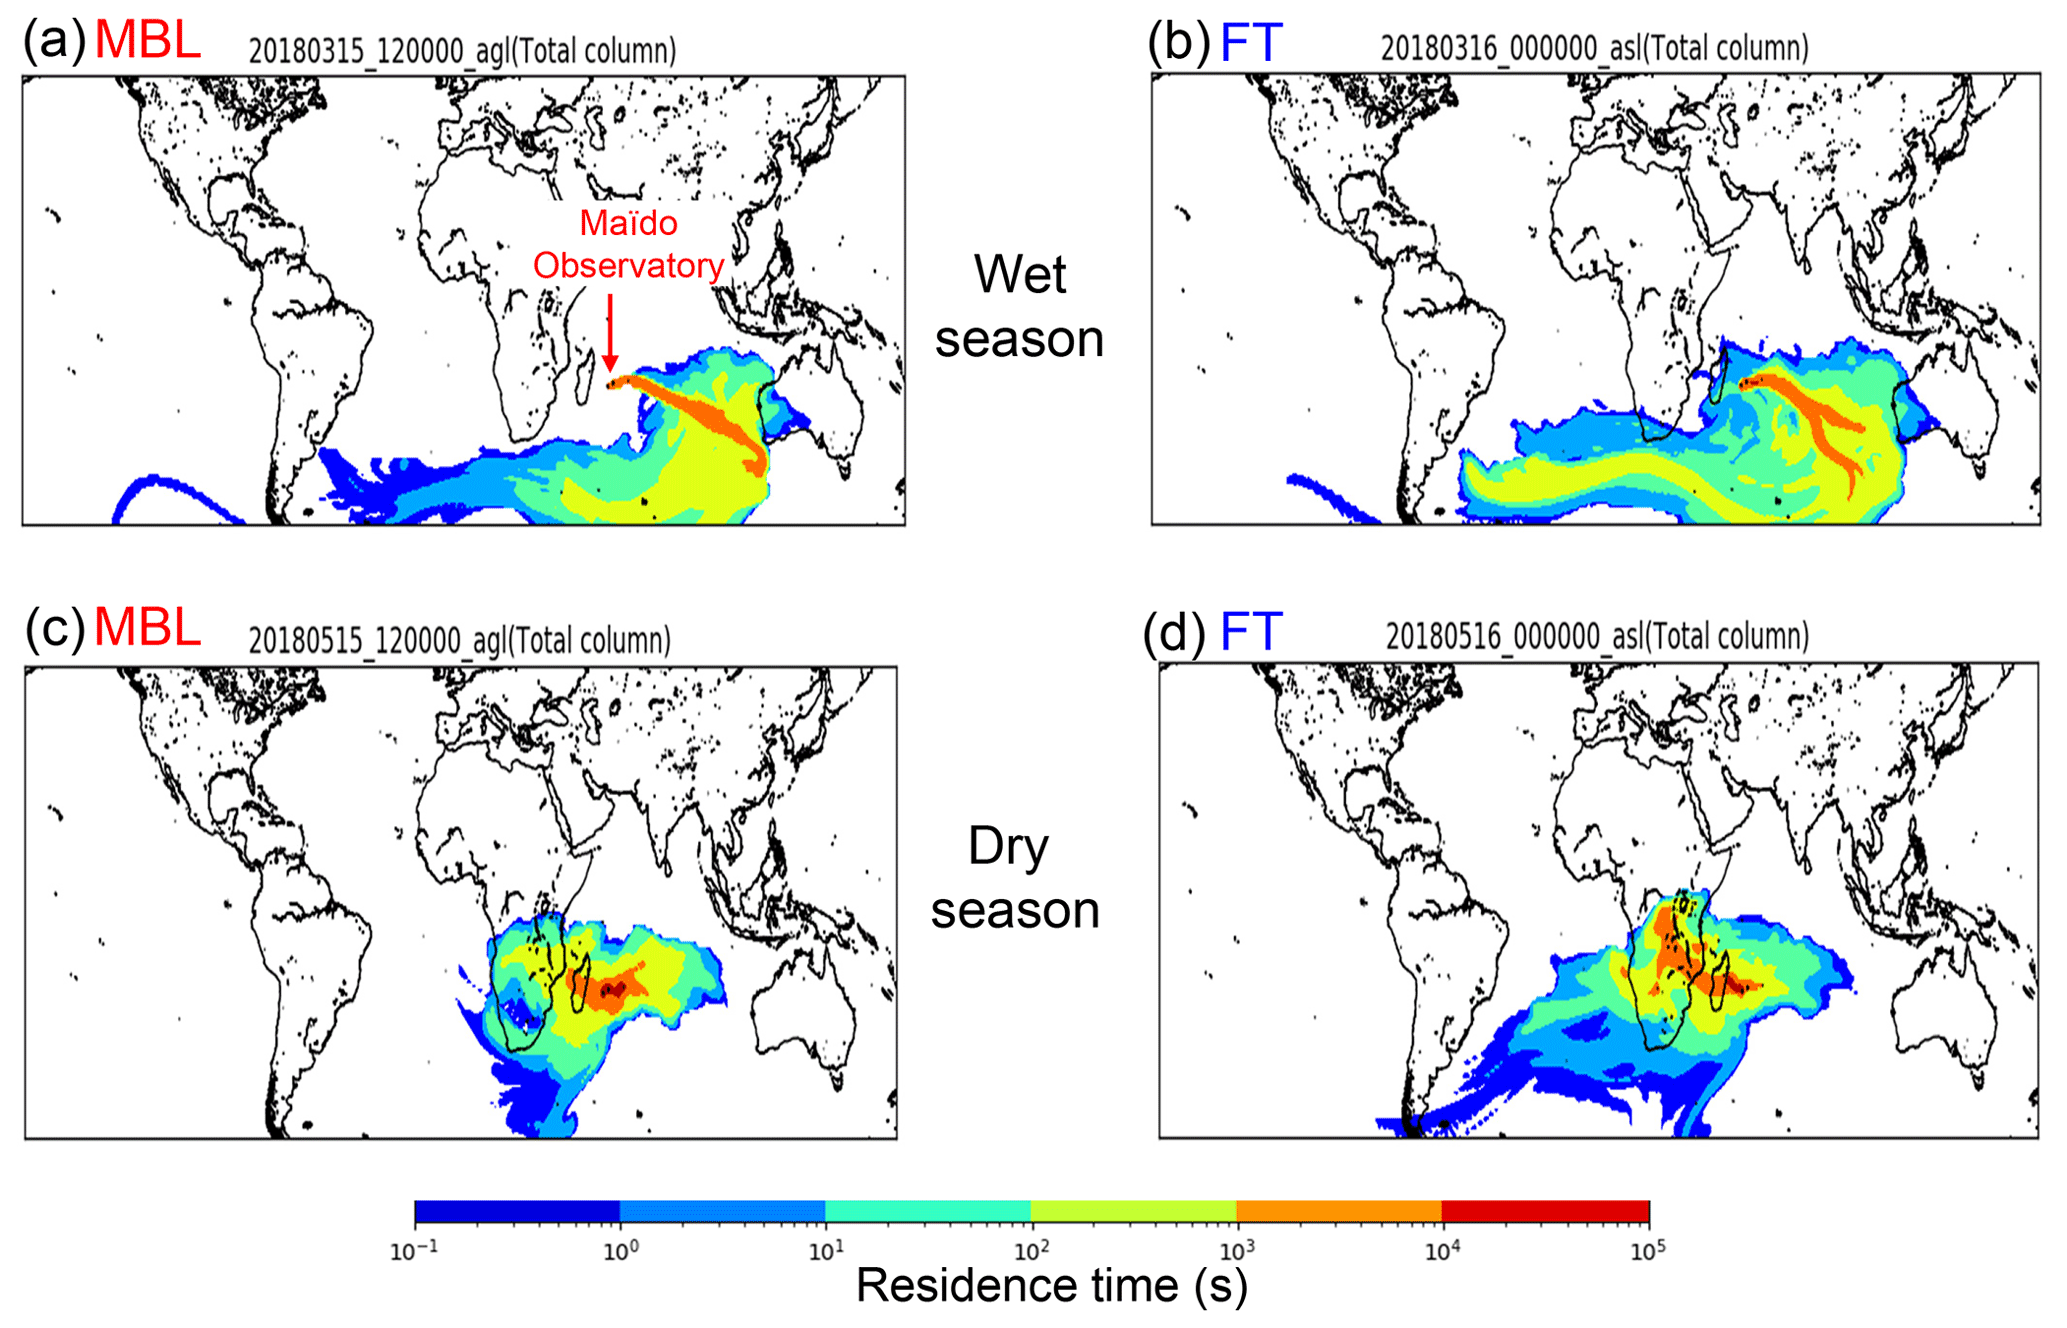
Figure 6Representative source–receptor relationships for aerosols observed at the Maïdo observatory for a 10 d period starting at time under the (a) MBL and (b) FT conditions during the wet season and (c) MBL and (d) FT during the dry season, which were calculated by FLEXPART. The color code represents the surface contribution to the measured air mass at the Maïdo observatory. Each color represents the degree of the surface contribution that varies by a factor of 10. For example, the orange color shows the surface contribution 10 times larger than that shown in yellow.
3.3 Isotopic characterization of WSOC and FLEXPART backward trajectories
The isotopic composition of aerosol carbon has been used successfully to determine the contributions of marine and terrestrial sources to aerosol carbon mass found in the remote marine atmosphere (e.g., Cachier et al., 1986). In particular, the WSOC-specific stable carbon isotope (δ13CWSOC) provides robust tools for the source apportionment of aerosol WSOC in the marine atmosphere (e.g., Miyazaki et al., 2016). Figure 5 shows the temporal variations of δ13CWSOC in the submicrometer aerosols during the entire period. Based on previous studies (e.g., Cachier et al., 1986; Turekian et al., 2003), here we assume that δ13CWSOC>−24 ‰ indicates WSOC was mostly originated from seawater, whereas δ13CWSOC<−24 ‰ indicates WSOC mainly affected by terrestrial sources, with uncertainty of ± 1.0 ‰. In the wet season, 87 % and 83 % of the data in the MBL and the FT, respectively, showed the δ13CWSOC larger than −24 ‰, with averages of −23.2 ± 1.0 ‰ (MBL) and −23.5 ± 2.5 ‰ (FT). While these average values with the uncertainty were close to −24 ‰, the larger concentrations of WSOC (e.g., >300 ngC m−3 in MBL; Fig. 4a) corresponded to a higher δ13CWSOC (>−24 ‰). In particular, the larger concentrations of WSOC (e.g., >300 ngC m−3 in MBL; Fig. 4a) corresponded to a higher δ13CWSOC (>−24 ‰). The results suggest that marine sources contributed significantly to the WSOC mass under both the MBL and FT conditions during the wet season. In contrast, the average δ13CWSOC values in the dry season were −24.4 ± 1.0 ‰ and −25.0 ± 1.4 ‰ in the MBL and FT, respectively, where 33 % (MBL) and 33 % (FT) of the data showed δ13CWSOC>−24 ‰.
To estimate the relative contributions of marine and terrestrial organic carbon (OC) sources to the observed WSOC, a mass balance equation (e.g., Turekian et al., 2003) was applied using the following equation:
where Fmarine and Fterrestrial are the fractions of marine and terrestrial carbon respectively, and δ13Cmarine and δ13Cterrestrial are the reported isotopic values for marine and terrestrial carbon, respectively. A δ13C value is assumed to be −21.5 ‰ for marine OC (Turekian et al., 2003; Miyazaki et al., 2010), and −28 ‰ for terrestrial OC (e.g., Cachier et al., 1986). Our calculations indicate that marine sources contributed ∼ 74 % and ∼ 69 % in MBL and FT, respectively, during the wet season. The estimated contributions of marine sources are reduced to ∼ 55 % and ∼ 46 % in the MBL and in the FT, respectively, during the dry season, suggesting that the WSOC mass was attributed to both marine and terrestrial sources with similar fractional contributions in the MBL and FT during the dry season.
Figure 6 presents representative 10 d back trajectory calculated by FLEXPART, which shows the surface contribution to the measured air mass at the Maïdo observatory. The calculated air parcels were initialized at the Maïdo observatory under the MBL and FT conditions in each seasonal category throughout the sampling periods. Overall, the air-mass flow pattern shown in the figure is controlled by the Mascarene High located over the southern IO, whose location shifts westward during the dry season (e.g., Mallet et al., 2018). The Lagrangian trajectory analysis showed that the majority of air parcels in the wet season were transported over the southern Indian Ocean. This is consistent with the results of the isotopic analysis and suggested that the majority of submicrometer WSOC originated from the sea surface during the wet season. During the dry season, some portion of the trajectories passed over southern Africa in addition to the southern Indian Ocean, indicating some influence from the land surface in addition to the marine source. This is also consistent with the results from the isotopic analysis of WSOC, which suggests the influence of both land and ocean surface.
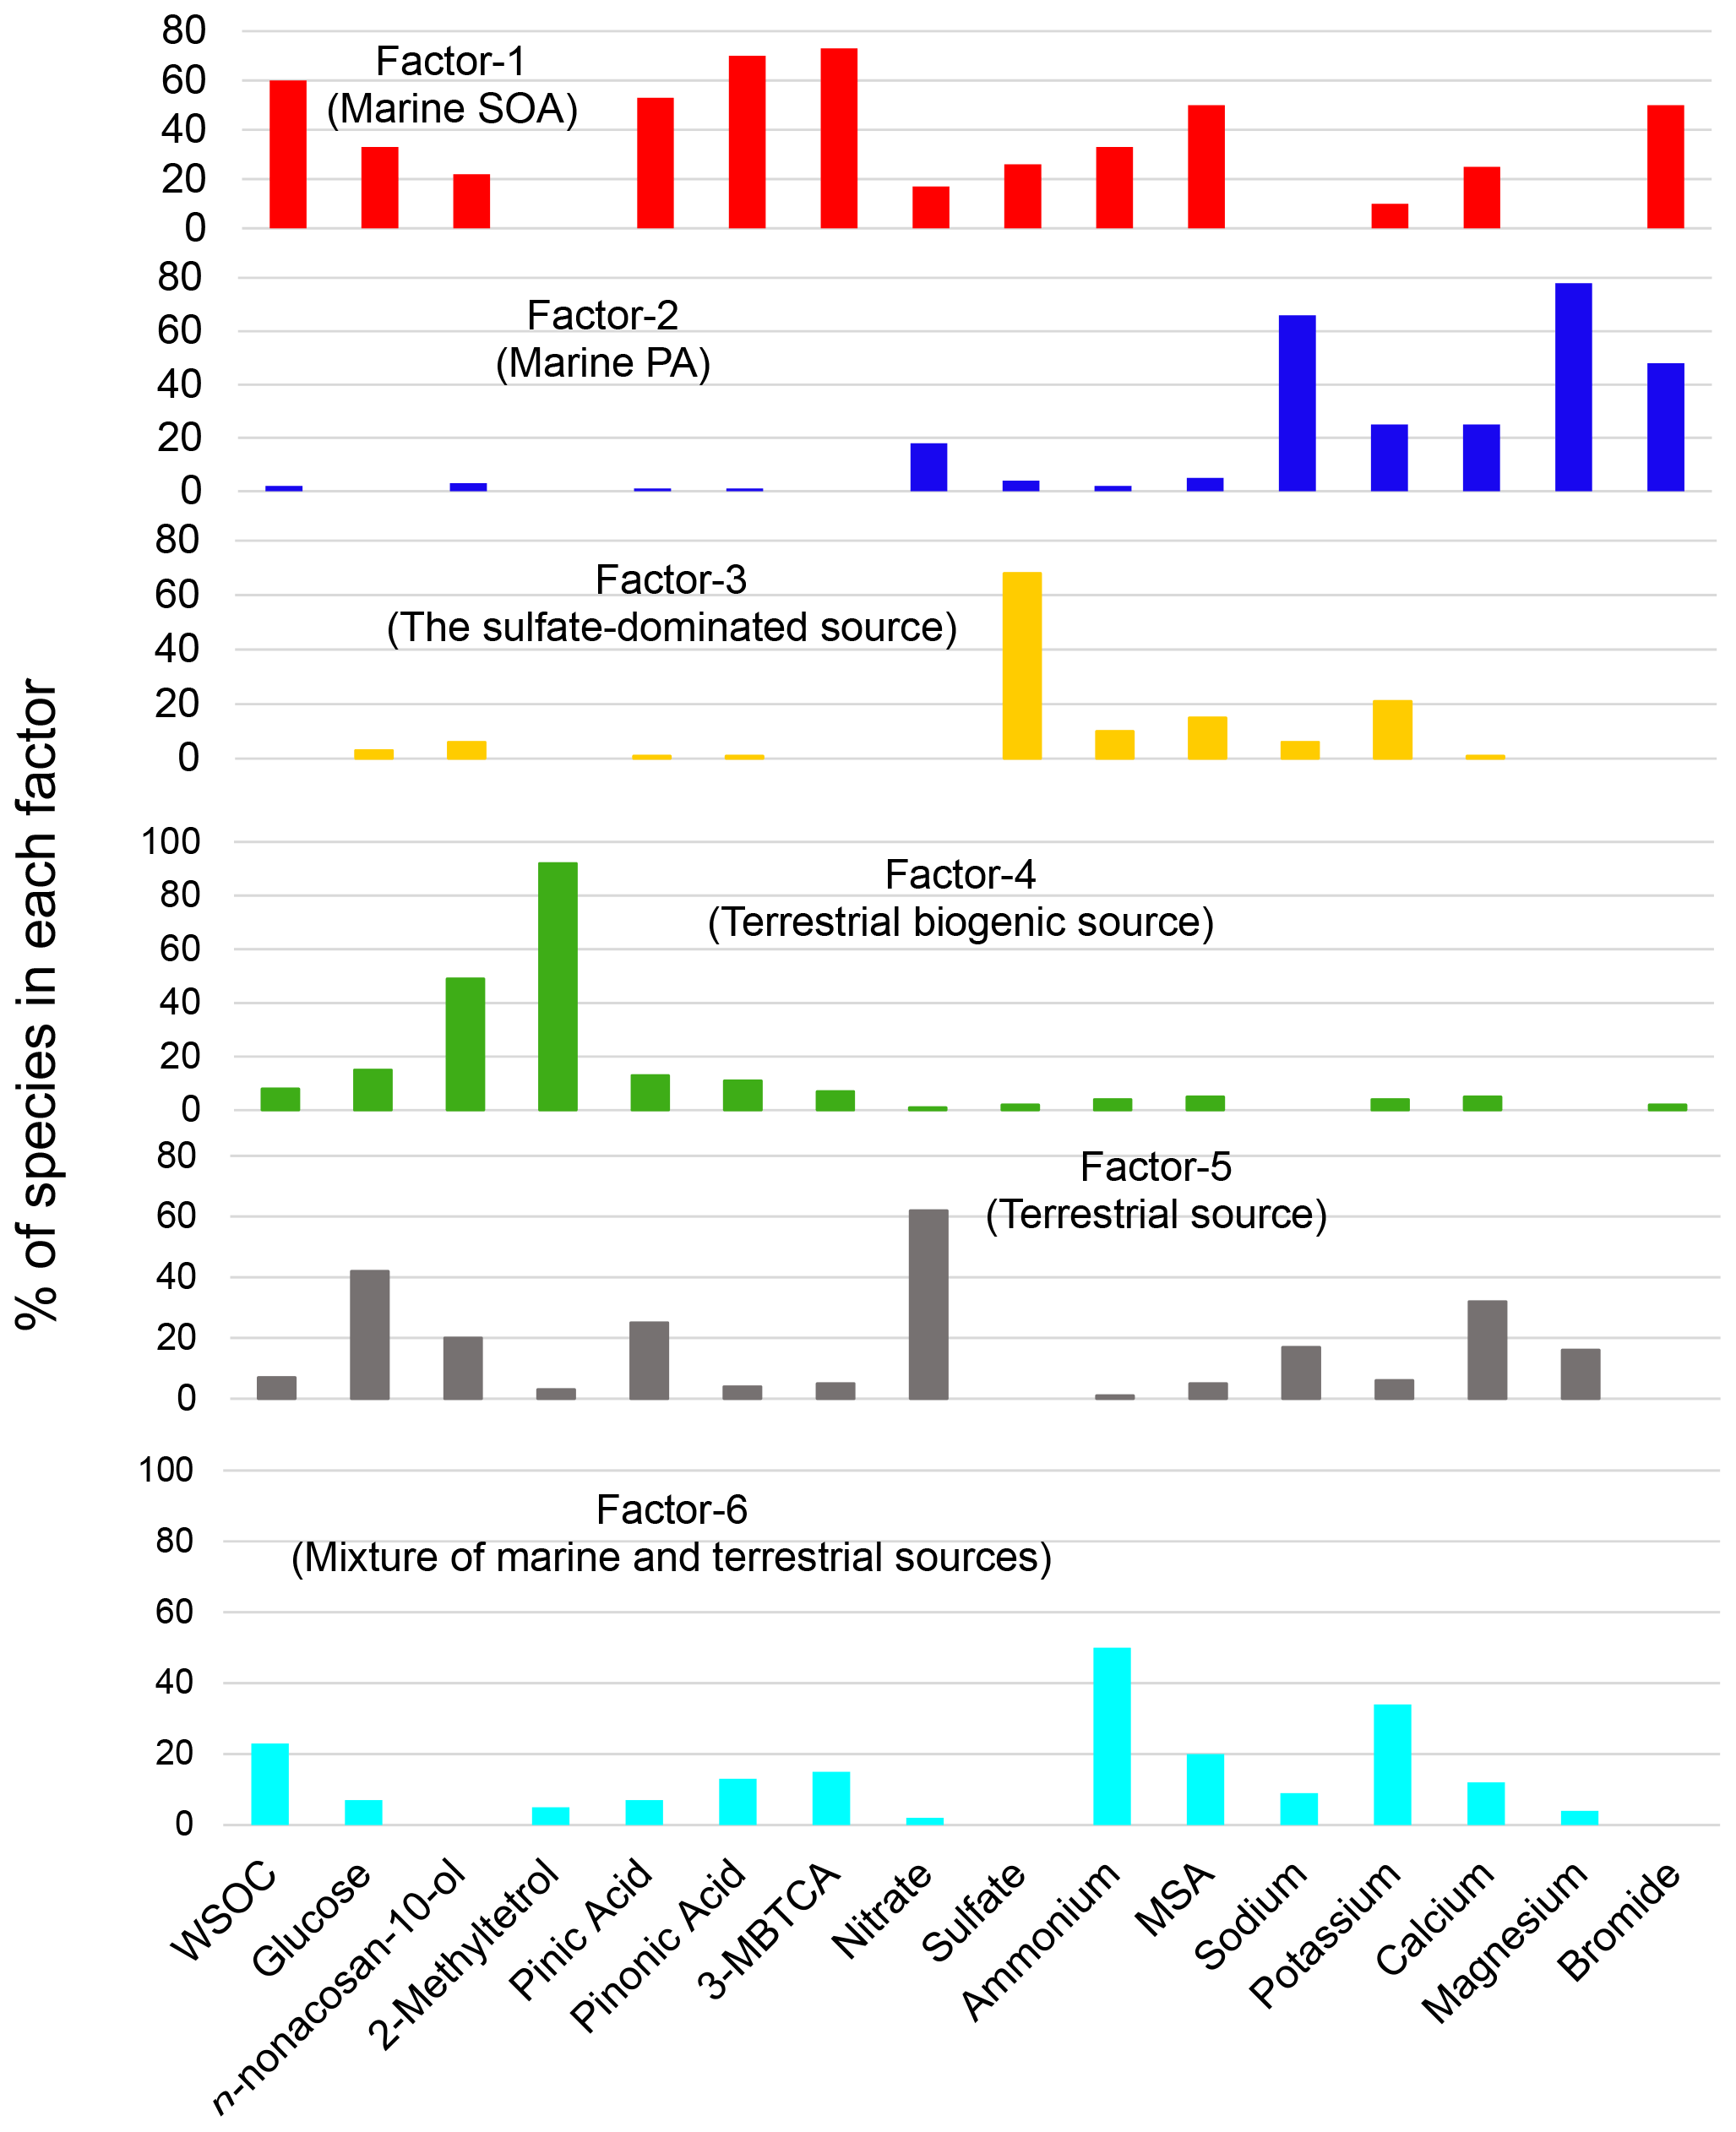
Figure 7Six factor profiles for the entire campaign derived from PMF analysis. The percentage of chemical species in each factor is shown.
3.4 Source apportionment of WSOC by PMF
To further investigate the possible sources of the submicrometer WSOC under different conditions, a PMF analysis was performed as described in Sect. 2.6. Figure 7 illustrates each factor profile calculated by the PMF. The PMF resolved six interpretable factors, which were characterized by the enrichment of each tracer compound in a factor compared to the other factors. Factor 1 (F1) was characterized by the large contribution of MSA (∼ 50 %). Consequently, it is referred to here as “marine SOA”. In fact, previous cruise measurements showed that in the southern IO, the sea-to-air emission of DMS is more active than that of other oceanic regions (Sciare et al., 1999) and that DMS was the most abundant VOC measured in the atmosphere (Colomb et al., 2009). The oceanic regions mentioned in these previous studies overlap with the possible oceanic source region shown in Fig. 6a and b.
Factor 2 (F2) is characterized by sea salt components, such as sodium (66 %) and magnesium (78 %). Moreover, bromide also contributed significantly to F2, which is thus referred to here as “marine primary aerosol”. It is interesting to note that bromide also had a large contribution to F1 (marine SOA). Bromide is expected to be recycled rather quickly via the gas phase and redistributed among all types of aerosols on timescales of minutes to a few hours after emission (e.g., Zhu et al., 2019). Therefore, primary bromide, which is emitted with sodium as a part of sea spray aerosols, is expected to appear in F1 (marine SOA). Because Factor 3 (F3) is dominated by sulfate (68 %), it is defined as “the sulfate-dominated” source. Factor 4 (F4) is characterized by the dominant contributions of 2-methyltetrol and n-nonacosan-10-ol. Miyazaki et al. (2019) identified n-nonacosan-10-ol in forest aerosols, suggesting that they originated mostly from plant waxes and could be a tracer of primary biological aerosol particles. Consequently, F4 is referred to here as “terrestrial biogenic sources”. Although Factor 5 (F5) was difficult to attribute to a specific source, given the possibility that nitrate is associated with terrestrial sources with smaller contributions of marine tracers, F5 was labeled here as “terrestrial sources”. Similarly, Factor 6 (F6) is dominated by ammonium (50 %) with a mixture of tracers of marine and terrestrial sources. F6 is referred to here as a “mixture of marine and terrestrial sources” as a possible source category of WSOC.
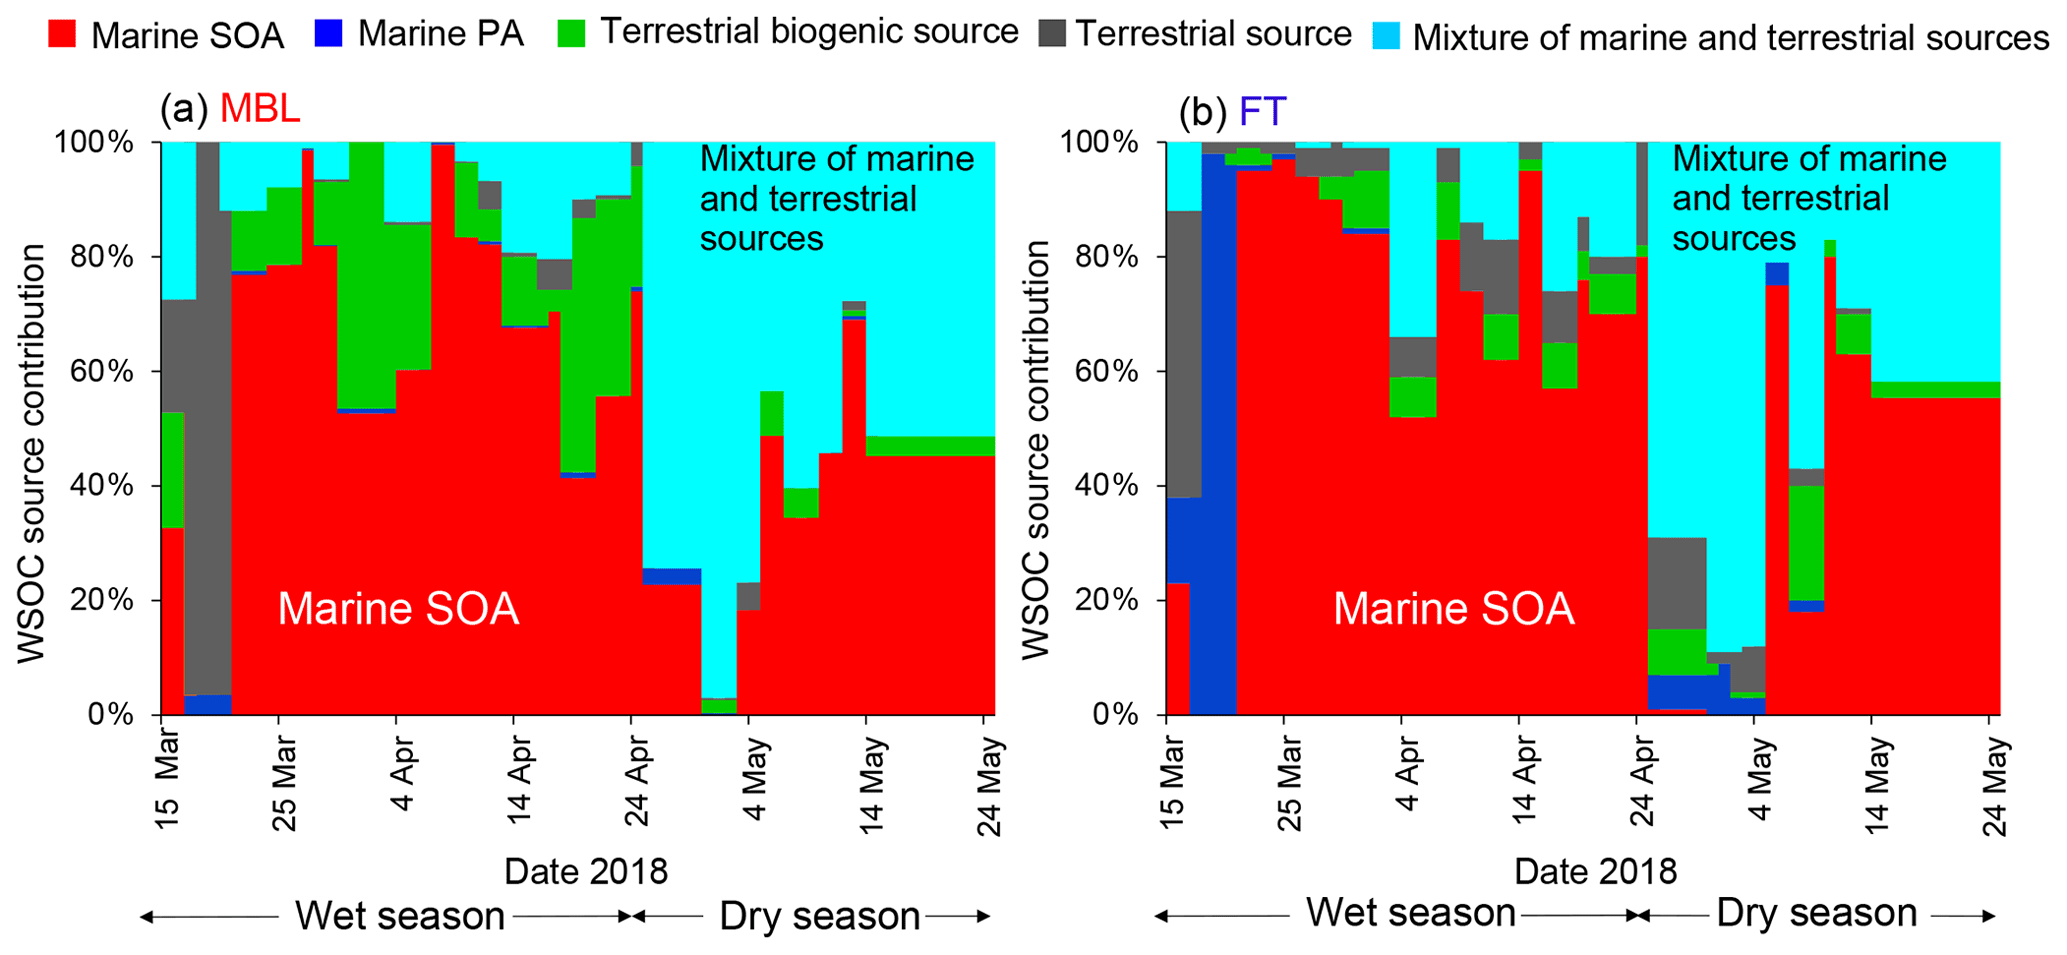
Figure 8Time series of contribution of each PMF-derived factor to the WSOC mass concentration under the (a) MBL and (b) FT conditions.

Figure 9Average contribution of each PMF-derived factor to the WSOC mass concentration during the wet season (a, b) and dry season (c, d). The pie charts are further classified under (a, c) FT and (b, d) MBL conditions.
Figure 8 shows the time series of the mass contributions of the individual identified factors to the WSOC mass concentrations in the MBL and FT. The average contributions of each PMF-derived factor to the WSOC mass are also summarized in Fig. 9. A distinct temporal shift of the dominant source of WSOC was apparent from the wet season to the dry season in both the MBL (Fig. 8a) and FT (Fig. 8b). On average, marine SOA dominantly contributed to the WSOC mass (∼ 66 %–70 %) in both the MBL and FT during the wet season (Fig. 9a and b). On average, terrestrial biogenic sources, which are mainly based on the contribution of 2-methyltetrol, accounted for 16 % of the WSOC mass in the MBL during the wet season. Specifically, the contribution of terrestrial biogenic sources was more than 40 % of the WSOC mass around 1 and 19 April in the MBL. Previous cruise measurements of VOCs suggested oceanic emissions of isoprene in the southern IO during austral summer (December) (e.g., Colomb et al., 2009). However, the data exhibiting large contributions of terrestrial biogenic sources mentioned above showed a lower δ13CWSOC<−24 ‰ (Fig. 5b), supporting the validity of the definition of the PMF factor as terrestrial biogenic sources rather than marine biogenic origin. These biogenic sources are attributable to local terrestrial biogenic emissions of VOCs in La Réunion, followed by the upward transport along the slope of the island particularly in daytime (Verreyken et al., 2020). It is noted that F1 had also large contributions of oxidation products of α-pinene (i.e., pinic acid, pinonic acid, and 3-MBTCA; Fig. 7). The regression analysis showed that R2 values of WSOC with pinic acid, pinonic acid, and 3-MBTCA were 0.53 (p<0.01), 0.27 (p<0.01), and 0.26 (p<0.01), respectively. This result is also attributable to local terrestrial biogenic emissions of VOCs during the transport from the ocean to the observatory. However, the dominance of marine SOA as a source of WSOC in the wet season (Fig. 8) is consistent with the δ13CWSOC measurements, supporting the validity of the definition of F1 and that the contribution of α-pinene SOA from local biogenic sources to the WSOC mass was small in this case.
Mixtures of marine and terrestrial sources significantly contributed to the WSOC mass during the dry season, where they accounted for 61 % and 47 % of the WSOC mass in the MBL and FT, respectively (Fig. 9c and d). These results point to the importance of marine SOA up the FT during the wet season, which is attributed to the high oceanic productivity in this region (Zhou et al., 2019), as well as to significant vertical transport of air during this season. It is noted that a few samples showed some contributions of terrestrial source mainly explained by nitrate (Fig. 7), which was attributable to the effect of local anthropogenic sources. In fact, two tropical cyclone events (13–21 March and 18–26 April) can explain the increased concentrations of nitrate in those limited samples (Fig. 3), when air masses on a local scale were vertically transported rapidly to the sampling site. However, our measurement of δ13CWSOC suggests that the majority of the observed WSOC originated from marine sources particularly during wet seasons. Therefore, possible contributions of local contamination to the WSOC concentrations are likely minor in our study.
It is also noted that the average contribution of marine primary aerosol to the WSOC mass was higher in FT than in MBL (Fig. 9). This was attributable to the two samples which showed dominant or higher contributions of marine primary aerosol to the WSOC mass in FT at the beginning of both wet and dry seasons. These can be explained by the two cyclone events as mentioned above, when marine primary aerosols were rapidly transported to FT. Although the source apportionment of WSOC only by PMF has a limitation with a limited number of samples in the current study, the overall result is supported by the measurements of δ13CWSOC as well as the result of FLEXPART, which are consistent with the output of PMF.
3.5 Secondary formation of marine-derived WSOC and implications
It is possible that the aging of marine primary OA (POA) and subsequent formation of more oxidized OA significantly contributed to the observed WSOC mass. Mallet et al. (2018) presented an 8-year satellite dataset of the distribution and variability of marine aerosols over the southern IO, which included the current aerosol sampling site. They suggested that aerosols are mainly confined below 2 km above sea level and are dominated by sea salt over the southern IO. However, the mass fraction of sea salt in the submicrometer particles observed at the Maïdo observatory (2160 m a.s.l.) was insignificant, which resulted in a significantly lower contribution from marine primary aerosol (PA) (Figs. 8 and 9). Therefore, the current results indicate that the aging of marine POA is insignificant, and the contribution of oxidation of VOCs from the sea surface to the WSOC mass up to the lower FT is likely more important.
Model results by Brüggemann et al. (2018) indicated that, especially in tropical regions with low POA concentrations, SOA from oxidation of photochemically produced VOCs contributes up to 60 % of additional OA mass, such as over the IO. In summary, the results of the current study highlight the importance of marine biogenic SOA up to the lower FT, a process lacking in climate models. Current models typically consider only marine POA (i.e., SSA) from the sea surface to represent the OA burden in tropical “pristine” oceanic regions (e.g., Gantt et al., 2015). The impacts of marine SOA up to FT aerosols lead to changes in the microphysical and optical properties of aerosol particles. Model calculations (Zhu et al., 2017) suggested that the contribution of SOA to radiative forcing will increase substantially in the future even if the increase of SOA burden is slight and without considering the combined effects of changes in marine SOA. The current results may have important implications for understanding the climate effects of aerosols in these oceanic regions.
In this study, the origins of WSOC in submicrometer aerosols were investigated based on continuous ambient aerosol sampling at the Maïdo observatory in La Réunion in the southwest Indian Ocean. OM was the dominant component of the submicrometer water-soluble aerosol (∼ 46 ± 10 %) in the MBL during the wet season, whereas sulfate dominated (∼ 77 ± 19 %) during the dry season. Our estimate using the stable carbon isotope ratio of WSOC showed that, on average, for the wet season, marine sources accounted for ∼ 74 % and ∼ 69 % of the WSOC mass in MBL and FT, respectively. Conversely, marine sources contributed ∼ 55 % and ∼ 46 % in MBL and FT, respectively, of the WSOC mass during the dry season, suggesting that the WSOC mass was attributed to both marine and terrestrial sources in the MBL and FT during that season. The significant seasonal difference in the dominant source of WSOC between the two seasons was also supported by Lagrangian trajectory analysis.
The PMF analysis suggested that marine secondary OA was a dominant contributor to the observed WSOC mass (∼ 70 %) during the wet season, whereas mixtures of marine and terrestrial sources accounted for 61 % and 47 % of the WSOC mass in the MBL and FT, respectively. Overall, this study demonstrates that emissions of biogenic VOCs from the ocean surface followed by the formation of secondary OA are likely important up into the FT during the wet season, when marine biological activity and vertical transport are more significant. These characteristics may affect subsequent cloud formation as well as the direct radiative forcing over this oceanic region.
The measurement data of the aerosol samples are provided in the supplement. The other data are available upon request.
The supplement related to this article is available online at: https://doi.org/10.5194/acp-21-17017-2021-supplement.
YM designed the research. The overall measurements and analysis of the aerosol samples were performed by SAS, ET, and YM. SAS and YM wrote the manuscript. JB, RV, and TS coordinated the project and the aerosol samplings at the research sites. HF, JB, AC, OM, and YM made aerosol samplings. FLEXPART simulations were performed by BV, SE, and JB.
The authors declare that they have no conflict of interest.
Publisher’s note: Copernicus Publications remains neutral with regard to jurisdictional claims in published maps and institutional affiliations.
We would like to thank Jean-Marc Metzger for his support in the deployment of the aerosol samplers. We also thank Nur Hussain for his help in making the global map of marine primary productivity. The authors acknowledge OPAR (Observatoire de Physique de l'Atmosphère à La Réunion), funded by CNRS-INSU and Université de La Réunion and managed by OSU-R (Observatoire des Sciences de l'Univers à La Réunion, UMS 3365). Henning Finkenzeller and Rainer Volkamer acknowledge NSF awards AGS-1620530 and AGS-2027252.
This research has been supported by JSPS KAKENHI (grant nos. JP16H02931 and JP19H04233) of the Ministry of Education, Culture, Sports, Science, and Technology (MEXT) of Japan, and by the Belgian Federal Science Policy Office (grant no. BR/175/A2/OCTAVE).
This paper was edited by Paul Zieger and reviewed by two anonymous referees.
Baray, J. L., Courcoux, Y., Keckhut, P., Portafaix, T., Tulet, P., Cammas, J. P., Hauchecorne, A., Godin Beekmann, S., De Mazière, M., Hermans, C., Desmet, F., Sellegri, K., Colomb, A., Ramonet, M., Sciare, J., Vuillemin, C., Hoareau, C., Dionisi, D., Duflot, V., Vérèmes, H., Porteneuve, J., Gabarrot, F., Gaudo, T., Metzger, J. M., Payen, G., Leclair De Bellevue, J., Barthe, C., Posny, F., Ricaud, P., Abchiche, A., and Delmas, R.: Maïdo observatory: A new high-altitude station facility at Reunion Island (21 S, 55 E) for long-term atmospheric remote sensing and in situ measurements, Atmos. Meas. Tech., 6, 2865–2877, https://doi.org/10.5194/amt-6-2865-2013, 2013.
Brüggemann, M., Hayeck, N., and George, C.: Interfacial photochemistry at the ocean surface is a global source of organic vapors and aerosols, Nat. Commun., 9, 1–8, https://doi.org/10.1038/s41467-018-04528-7, 2018.
Cachier, H., Buat-Menard, P., Fontugne, M., and Chesselet, R.: Long-range transport of continentally-derived particulate carbon in the marine atmosphere: Evidence from stable carbon isotope studies, Tellus B, 38, 161–177, https://doi.org/10.3402/tellusb.v38i3-4.15125, 1986.
Carr, M. E., Friedrichs, M. A. M., Schmeltz, M., Noguchi Aita, M., Antoine, D., Arrigo, K. R., Asanuma, I., Aumont, O., Barber, R., Behrenfeld, M., Bidigare, R., Buitenhuis, E. T., Campbell, J., Ciotti, A., Dierssen, H., Dowell, M., Dunne, J., Esaias, W., Gentili, B., Gregg, W., Groom, S., Hoepffner, N., Ishizaka, J., Kameda, T., Le Quéré, C., Lohrenz, S., Marra, J., Mélin, F., Moore, K., Morel, A., Reddy, T. E., Ryan, J., Scardi, M., Smyth, T., Turpie, K., Tilstone, G., Waters, K., and Yamanaka, Y.: A comparison of global estimates of marine primary production from ocean color, Deep-Sea Res. Pt. II, 53, 741–770, https://doi.org/10.1016/j.dsr2.2006.01.028, 2006.
Chylek, P., Dubey, M. K., Lohmann, U., Ramanathan, V., Kaufman, Y. J., Lesins, G., Hudson, J., Altmann, G., and Olsen, S.: Aerosol indirect effect over the Indian Ocean, Geophys. Res. Lett., 33, 2–5, https://doi.org/10.1029/2005GL025397, 2006.
Claeys, M., Graham, B., Vas, G., Wang, W., Vermeylen, R., Pashynska, V., Cafmeyer, J., Guyon, P., Andreae, M. O., Artaxo, P., and Maenhaut, W.: Formation of Secondary Organic Aerosols Through Photooxidation of Isoprene, Science, 303, 1173–1176, https://doi.org/10.1126/science.1092805, 2004.
Claeys, M., Szmigielski, R., Kourtchev, I., Van Der Veken, P., Vermeylen, R., Maenhaut, W., Jaoui, M., Kleindienst, T. E., Lewandowski, M., Offenberg, J. H., and Edney, E. O.: Hydroxydicarboxylic acids: Markers for secondary organic aerosol from the photooxidation of α-pinene, Environ. Sci. Technol., 41, 1628–1634, https://doi.org/10.1021/es0620181, 2007.
Collaud Coen, M., Andrews, E., Aliaga, D., Andrade, M., Angelov, H., Bukowiecki, N., Ealo, M., Fialho, P., Flentje, H., Hallar, A. G., Hooda, R., Kalapov, I., Krejci, R., Lin, N.-H., Marinoni, A., Ming, J., Nguyen, N. A., Pandolfi, M., Pont, V., Ries, L., Rodríguez, S., Schauer, G., Sellegri, K., Sharma, S., Sun, J., Tunved, P., Velasquez, P., and Ruffieux, D.: Identification of topographic features influencing aerosol observations at high altitude stations, Atmos. Chem. Phys., 18, 12289–12313, https://doi.org/10.5194/acp-18-12289-2018, 2018.
Colomb, A., Gros, V., Alvain, Ś., Sarda-Esteve, R., Bonsang, B., Moulin, C., Klpfel, T., and Williams, J.: Variation of atmospheric volatile organic compounds over the Southern Indian Ocean (3049∘ S), Environ. Chem., 6, 70–82, https://doi.org/10.1071/EN08072, 2009.
Fu, P., Kawamura, K., and Miura, K.: Molecular characterization of marine organic aerosols collected during a round-the-world cruise, J. Geophys. Res.-Atmos., 116, D13302, https://doi.org/10.1029/2011JD015604, 2011.
Gantt, B., Glotfelty, T., Meskhidze, N., and Zhang, Y.: Simulating the impacts of marine organic emissions on global atmospheric chemistry and aerosols using an online-coupled meteorology and chemistry model, Atmos. Clim. Sci., 5, 266–274, https://doi.org/10.4236/acs.2015.53020, 2015.
Guilpart, E., Vimeux, F., Evan, S., Brioude, J., Metzger, J. M., Barthe, C., Risi, C., and Cattani, O.: The isotopic composition of near-surface water vapor at the Maïdo observatory (Reunion Island, southwestern Indian Ocean) documents the controls of the humidity of the subtropical troposphere, J. Geophys. Res.-Atmos., 122, 9628–9650, https://doi.org/10.1002/2017JD026791, 2017.
Höpner, F., A.-M. Bender, F., Ekman, A. M. L., Praveen, P. S., Bosch, C., Ogren, J. A., Andersson, A., Ogren, J. A., and Ramanathan, V.: Vertical profiles of optical and microphysical particle properties above the northern Indian Ocean during CARDEX 2012, Atmos. Chem. Phys., 16, 1045–1064, https://doi.org/10.5194/acp-16-1045-2016, 2016.
Istvánovics, V.: Eutrophication of Lakes and Reservoirs, Encycl. Inl. Waters, 157–165, https://doi.org/10.1016/B978-012370626-3.00141-1, 2009.
Jayaraman, A., Lubin, D., Ramachandran, S., Ramanathan, V., Woodbridge, E., Collins, W. D., and Zalpuri, K. S.: Direct observations of aerosol radiative forcing over the tropical Indian Ocean during the January–February 1996 pre-INDOEX cruise, J. Geophys. Res., 103, 827–836, 1998.
Kyewalyanga, M.: Phytoplankton primary production: Western Indian Ocean, Reg. State Coast Rep., 212–230, https://doi.org/10.18356/7e303d60-en, 2016.
Langley DeWitt, H., Coffman, D. J., Schulz, K. J., Alan Brewer, W., Bates, T. S., and Quinn, P. K.: Atmospheric aerosol properties over the equatorial Indian Ocean and the impact of the Madden-Julian Oscillation, J. Geophys. Res.-Atmos., 118, 5736–5749, https://doi.org/10.1002/jgrd.50419, 2013.
Madhavan, B. L., Niranjan, K., Sreekanth, V., Sarin, M. M.m and Sudheer, A. K.: Aerosol characterization during the summer monsoon period over a tropical coastal Indian station, Visakhapatnam, J. Geophys. Res.-Atmos., 113, 1–16, https://doi.org/10.1029/2008JD010272, 2008.
Mallet, P. É., Pujol, O., Brioude, J., Evan, S., and Jensen, A.: Marine aerosol distribution and variability over the pristine Southern Indian Ocean, Atmos. Environ., 182, 17–30, https://doi.org/10.1016/j.atmosenv.2018.03.016, 2018.
Miyazaki, Y., Kawamura, K., and Sawano, M.: Size distributions of organic nitrogen and carbon in remote marine aerosols: Evidence of marine biological origin based on their sotopic ratios, Geophys. Res. Lett., 37, L06803, https://doi.org/10.1029/2010GL042483, 2010.
Miyazaki, Y., Coburn, S., Ono, K., Ho, D. T., Pierce, R. B., Kawamura, K., and Volkamer, R.: Contribution of dissolved organic matter to submicron water-soluble organic aerosols in the marine boundary layer over the eastern equatorial Pacific, Atmos. Chem. Phys., 16, 7695–7707, https://doi.org/10.5194/acp-16-7695-2016, 2016.
Miyazaki, Y., Yamashita, Y., Kawana, K., Tachibana, E., Kagami, S., Mochida, M., Suzuki, K., and Nishioka, J.: Chemical transfer of dissolved organic matter from surface seawater to sea spray water-soluble organic aerosol in the marine atmosphere, Sci. Rep., 8, 1–10, https://doi.org/10.1038/s41598-018-32864-7, 2018.
Miyazaki, Y., Gowda, D., Tachibana, E., Takahashi, Y., and Hiura, T.: Identification of secondary fatty alcohols in atmospheric aerosols in temperate forests, Biogeosciences, 16, 2181–2188, https://doi.org/10.5194/bg-16-2181-2019, 2019.
Miyazaki, Y., Suzuki, K., Tachibana, E., Yamashita, Y., Müller, A., Kawana, K., and Nishioka, J.: New index of organic mass enrichment in sea spray aerosols linked with senescent status in marine phytoplankton, Sci. Rep., 10, 1–10, https://doi.org/10.1038/s41598-020-73718-5, 2020.
Norris, G., Duvall, R., Brown, S., and Bai, S.: EPA Positive Matrix Factorization (PMF) 5.0 Fundamentals and User Guide. Washington, DC: Environmental Protection Agency, Office of Research and Development, available at: https://www.epa.gov (last access: 13 July 2021), 2014.
O'Dowd, C. D. and De Leeuw, G.: Marine aerosol production: A review of the current knowledge, Philos. Trans. R. Soc. A, 365, 1753–1774, https://doi.org/10.1098/rsta.2007.2043, 2007.
Paatero, P. and Tapper, U.: Positive matrix factorization: a nonnegative factor model with optimal utilization of error estimates of data values, Environmetrics, 5, 111–126, 1994.
Pisso, I., Sollum, E., Grythe, H., Kristiansen, N. I., Cassiani, M., Eckhardt, S., Arnold, D., Morton, D., Thompson, R. L., Groot Zwaaftink, C. D., Evangeliou, N., Sodemann, H., Haimberger, L., Henne, S., Brunner, D., Burkhart, J. F., Fouilloux, A., Brioude, J., Philipp, A., Seibert, P., and Stohl, A.: The Lagrangian particle dispersion model FLEXPART version 10.4, Geosci. Model Dev., 12, 4955–4997, https://doi.org/10.5194/gmd-12-4955-2019, 2019.
Roxy, M. K., Modi, A., Murtugudde, R., Valsala, V., Panickal, S., Prasanna Kumar, S., Ravichandran, M., Vichi, M., and Lévy, M.: A reduction in marine primary productivity driven by rapid warming over the tropical Indian Ocean, Geophys. Res. Lett., 43, 826–833, https://doi.org/10.1002/2015GL066979, 2016.
Sciare, J., Mihalopoulos, N., and Nguyen, B. C.: Summertime seawater concentrations of dimethylsulfide in the western Indian Ocean: Reconciliation of fluxes and spatial variability with long-term atmospheric observations, J. Atmos. Chem., 32, 357–373, https://doi.org/10.1023/A:1006132001945, 1999.
Sciare, J., Favez, O., Sarda-Estève, R., Oikonomou, K., Cachier, H., and Kazan, V.: Long-term observations of carbonaceous aerosols in the Austral Ocean atmosphere: Evidence of a biogenic marine organic source, J. Geophys. Res., 114, D15302, https://doi.org/10.1029/2009JD011998, 2009.
Simoneit, B. R. T., Elias, V. O., Kobayashi, M., Kawamura, K., Rushdi, A. I., Medeiros, P. M., Rogge, W. F., and Didyk, B. M.: Sugars – Dominant water-soluble organic compounds in soils and characterization as tracers in atmospheric participate matter, Environ. Sci. Technol., 38, 5939–5949, https://doi.org/10.1021/es0403099, 2004.
Srinivas, B. and Sarin, M. M.: Light absorbing organic aerosols (brown carbon) over the tropical Indian Ocean: Impact of biomass burning emissions, Environ. Res. Lett., 8, 044042, https://doi.org/10.1088/1748-9326/8/4/044042, 2013.
Stohl, A., Hittenberger, M., and Wotawa, G.: Validation of the Lagrangian particle dispersion model FLEXPART against large-scale tracer experiment data, Atmos. Environ., 32, 4245–4264, https://doi.org/10.1016/S1352-2310(98)00184-8, 1998.
Szmigielski, R., Surratt, J. D., Gómez-González, Y., van der Veken, P., Kourtchev, I., Vermeylen, R., Blockhuys, F., Jaoui, M., Kleindienst, T. E., Lewandowski, M., Offenberg, J. H., Edney, E. O., Seinfeld, J. H., Maenhaut, W., and Claeys, M.: 3-methyl-1,2,3-butanetricarboxylic acid: An atmospheric tracer for terpene secondary organic aerosol, Geophys. Res. Lett., 34, L24811, https://doi.org/10.1029/2007GL031338, 2007.
Turekian, V. C., Macko, S. A., and Keene, W. C.: Concentrations, isotopic compositions, and sources of size-resolved, particulate organic carbon and oxalate in near-surface marine air at Bermuda during spring, J. Geophys. Res.-Atmos., 108, 4157, https://doi.org/10.1029/2002jd002053, 2003.
Verreyken, B., Amelynck, C., Brioude, J., Muller, J. F., Schoon, N., Kumps, N., Colomb, A., Metzger, J. M., Lee, C. F., Koenig, T. K., Volkamer, R., and Stavrakou, T.: Characterisation of African biomass burning plumes and impacts on the atmospheric composition over the south-west Indian Ocean, Atmos. Chem. Phys., 20, 14821–14845, https://doi.org/10.5194/acp-20-14821-2020, 2020.
Yu, J., Cocker III, D. R., Griffin, R. J., Flagan, R. C., and Seinfeld, J. H.: Journal of Atmospheric Chemistry, Volume 34, Number 2 – SpringerLink, J. Atmos. Chem., 34, 207–258, 1999.
Zhou, S., Collier, S., Jaffe, D. A., and Zhang, Q.: Free tropospheric aerosols at the Mt. Bachelor Observatory: more oxidized and higher sulfate content compared to boundary layer aerosols, Atmos. Chem. Phys., 19, 1571–1585, https://doi.org/10.5194/acp-19-1571-2019, 2019.
Zhu, J., Penner, J. E., Lin, G., Zhou, C., Xu, L., and Zhuang, B.: Mechanism of SOA formation determines magnitude of radiative effects, P. Natl. Acad. Sci. USA, 114, 12685–12690, https://doi.org/10.1073/pnas.1712273114, 2017.
Zhu, L., Jacob, D. J., Eastham, S. D., Sulprizio, M. P., Wang, X., Sherwen, T., Evans, M. J., Chen, Q., Alexander, B., Koenig, T. K., Volkamer, R., Huey, L. G., Le Breton, M., Bannan, T. J., and Percival, C. J.: Effect of sea salt aerosol on tropospheric bromine chemistry, Atmos. Chem. Phys., 19, 6497–6507, https://doi.org/10.5194/acp-19-6497-2019, 2019.