the Creative Commons Attribution 4.0 License.
the Creative Commons Attribution 4.0 License.
 | 19 Nov 2021
Air quality deterioration episode associated with a typhoon over the complex topographic environment in central Taiwan
Yang-Fan Sheng
Wan-Chin Chen
Charles C. K. Chou
Yi-Yun Chien
Wen-Mei Chen
Air pollution is typically at its lowest in Taiwan during summer. The mean concentrations of PM10, PM2.5, and daytime ozone (08:00–17:00 LST) during summer (June–August) over central Taiwan were 35–40 µg m−3, 18–22 µg m−3, and 30–42 ppb, respectively, between 2004 and 2019. Sampling analysis revealed that the contribution of organic carbon (OC) to PM2.5 could have exceeded 30 % in urban and inland mountain sites during July in 2017 and 2018. Frequent episodes of air quality deterioration occur over the western plains of Taiwan when an easterly typhoon circulation interacts with the complex topographic structure of the island. We explored an episode of air quality deterioration that was associated with a typhoon between 15 and 17 July 2018 using the Weather Research Forecasting with Chemistry (WRF-Chem) model. The results indicated that the continual formation of low-pressure systems or typhoons in the area between Taiwan and Luzon island in the Philippines provided a strong easterly ambient flow, which lasted for an extended period between 15 and 17 July. The interaction between the easterly flow and Taiwan's Central Mountain Range (CMR) resulted in stable weather conditions and weak wind speed in western Taiwan during the study period. Numerical modeling also indicated that a lee side vortex easily formed, and the wind direction could have changed from southwesterly to northwesterly over central Taiwan because of the interaction between the typhoon circulation and the CMR. The northwesterly wind coupled with a sea breeze was conducive to the transport of air pollutants from the coastal upstream industrial and urban areas to the inland area. The dynamic process for the wind direction changed given a reasonable explanation for why the observed SO became the major contributor to PM2.5 during the episode. SO contribution proportions (%) to PM2.5 at the coastal, urban, and mountain sites were 9.4 µg m−3 (30.5 %), 12.1 µg m−3 (29.9 %), and 11.6 µg m−3 (29.7 %), respectively. Moreover, the variation of the boundary layer height had a strong effect on the concentration level of both PM2.5 and ozone. The lee vortex and land–sea breeze, as well as the boundary layer development, were the key mechanisms in air pollutant accumulation and transport. As typhoons frequently occur around Taiwan during summer and fall, their effect on the island's air quality merits further research attention.
- Article
(6051 KB) - Full-text XML
- BibTeX
- EndNote


Tropical cyclones (also known as typhoons) are a frequent occurrence in East Asia during summer and fall. Typhoons significantly affect not only meteorological parameters but also air quality. That is because air pollution is strongly related to atmospheric conditions, and typhoon circulation typically alters atmospheric stability and air pollutant diffusion in specific locations. For example, researchers revealed that ozone episodes in Hong Kong and southeastern China are strongly related to the passage of typhoons as they approach the area (Lee et al., 2002; Ding et al., 2004; Huang et al., 2005, 2006; Yang et al., 2012; Zhang et al., 2013, 2014; Wei et al., 2016; Yan et al., 2016; Luo et al., 2018; Deng et al., 2019; Huang et al., 2021). The stagnant meteorological conditions associated with strong subsidence and stable stratification in the boundary layer result in pollutant accumulation before typhoons make landfall. Huang et al. (2005) reported that approximately 30 % of total ozone in Hong Kong was due to local chemical production in the lower atmospheric boundary layer, and approximately 70 % was contributed by long-range transport from southern China (i.e., the Pearl River Delta). According to the dynamic process perspective, Chow et al. (2018) reported frequent high-O3 days when typhoons were located between Hong Kong and Taiwan (Fig. 1a) due to the influence of the typhoon position and associated atmospheric circulations on air quality.
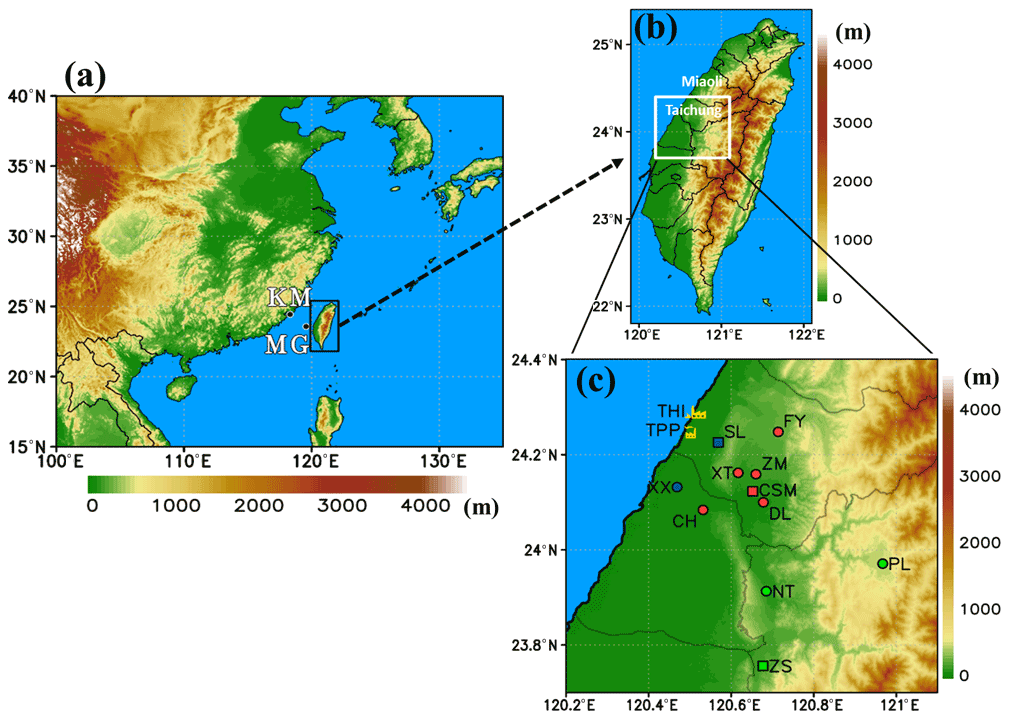
Figure 1(a) Location of Taiwan and surrounding countries in East Asia. KM and MG are the island stations of the Taiwan Environmental Protection Administration (TEPA). (b) Topography over Taiwan and the locations of Taichung city and Miaoli county. (c) Location of TEPA air quality monitoring stations in central Taiwan in coastal (SL and XX), urban (FY, XT, ZM, CH, and DL), and mountain (PL, NT, and ZS) areas. TPP, Taichung Power Plant; THI, Taichung Harbor industrial area.
Taiwan also experiences air quality deterioration as typhoons approach (Fang et al., 2009; Chang et al., 2011, Cheng et al., 2014; Hsu and Cheng, 2019). However, not all typhoons are associated with poor air quality in Taiwan. The effect of typhoons on air quality is highly related to the location of the typhoon and its circulation's interaction with Taiwan's Central Mountain Range (CMR; Fig. 1b). Thus, the mechanism of the formation of poor air quality may differ between Taiwan and Hong Kong. Air quality deterioration frequently occurs over the western plains of Taiwan when typhoons pass between Taiwan and Luzon island in the Philippines; the distance of the typhoons from Taiwan is typically several hundred kilometers but may even be greater than 1000 km. Under such conditions, the weather is typically stable, with clear skies, strong solar intensity, and weak wind speeds over Taiwan's western plains because of the interactions of the typhoon's easterly circulations with the CMR. Furthermore, such typhoons are usually associated with a Pacific high-pressure system during summer; thus, the air temperature may be high. For example, researchers have noted that typhoon's secondary circulation may enhance subsidence and result in a heat wave, clear skies, and weak wind speed over Taiwan or southern China (e.g., Ding et al., 2004; Huang et al., 2005; Jiang et al., 2015; Shu et al., 2016; Lam, et al., 2018), thus adversely affecting air quality as well. In Taiwan, this phenomenon is particularly attributed to the blocking effect of the CMR. The CMR occupies approximately two-thirds of Taiwan's landmass (300 km × 100 km) and lies NNE–SSW (Fig. 1b), with an average terrain height of approximately 2000 m (Lin and Chen, 2002; Lin et al., 2011) and some peaks of nearly 4000 m. The CMR has a major effect on local circulation and frequently interferes with the easterly or northeasterly prevailing winds such as long-range transport dust storms and air pollution events (Lin et al., 2004, 2005, 2012a, b) during the winter monsoon. When a typhoon is located between Taiwan and Luzon, the low-level easterly airflow easily splits northern and southern Taiwan and moves around the island, forming a vortex at the lee side of the mountain (Hunt and Synder, 1980; Smolarkiewicz and Rotunno, 1989; Y. L. Lin, 1993; Lin et al., 2007). On the lee side of the CMR, wind speeds are weak (Lin et al., 2007) and the atmospheric conditions are more stable than on the windward side of eastern Taiwan. Under these favorable conditions, air pollutants readily accumulate and result in high ozone and aerosol concentrations over western Taiwan. Actually, the interactions between ambient flow and topography result in stable weather conditions, and air pollutant accumulation in the low boundary is common all over the world. According to the obstacle's scale, it could occur on plateaus (Ning et al., 2019), mountains (Lai and Lin et al., 2020), and even among buildings (W. Theurer, 1999) as the airflow interacts with them. For example, Wallace et al. (2010) investigated the spatial and topographic effects of temperature inversions on air quality in the industrial city of Hamilton, located at the western tip of Lake Ontario, Canada. Topographically constrained wind flows and frequent temperature inversions occurred in Los Angeles, California (Lu and Turco, 1995), the Highveld Plateau industrial region in South Africa (Jury and Tosen, 2004), and Perth, Australia (Pitts and Lyons, 1988). Valverde et al. (2016) studied air pollution in Europe and found that the dispersion and transfer of air pollutants are affected by topographic features and weather patterns. Ning et al. (2019) presented synergistic effects of synoptic weather patterns of a low trough, low vortex, and topography on air quality over the Sichuan Basin of China.
Summer and fall are regarded as the “typhoon season” over Taiwan and throughout East Asia. Statistically, more than 20 typhoons form in the western Pacific Ocean per year, and approximately 3–4 typhoons directly strike Taiwan (Lin et al., 2011; Tu and Chen 2019). Records from Taiwan's Central Weather Bureau (CWB) indicate that 18 % of typhoons (Type 5; https://www.cwb.gov.tw/V8/C/K/Encyclopedia/typhoon/typhoon.pdf, last access: 18 March 2021) between 1911 and 2019 did not make landfall but passed between Taiwan and Luzon. The wind circulations of this type of typhoon were easterly or southeasterly depending on the location of the typhoons. Thus, it is not uncommon for more than 10 typhoons per year to pass near Taiwan and affect the island's air quality. The impact of the interaction between the typhoon's circulation and the CMR on the air quality on the lee side of the mountain is more serious than in other areas.
To date, air pollution episodes with a formation mechanism associated with the interactions between typhoon circulation and the CMR have not been thoroughly documented in Taiwan. In this study, we investigated a major air quality event that occurred on 17 July 2018, with a maximum O3 concentration of 134 ppb and a daily maximum aerosol concentration for PM10 (PM2.5) reaching 152 µg m−3 (70 µg m−3) in inland rural areas of central Taiwan. We used the Weather Research Forecasting with Chemistry model (WRF-Chem version 3.9; Grell et al., 2005) to study the processes and mechanisms of formation of the air pollution episode. The remainder of this paper is organized as follows: Sect. 2 describes the data sources and sampling measurement during the study period; Sect. 3 presents the model and settings used in this study; Sect. 4 presents the air quality characteristics and measurements recorded over the western plains of Taiwan; Sect. 5 describes and discusses the simulation results of air quality associated with the typhoon event using WRF-Chem; and, finally, Sect. 6 provides the conclusions.
We collected measurements of hourly PM10, PM2.5, and other pollutants (O3, NOx, CO, and SO2) as well as meteorological parameters (air temperature, wind field, and rainfall) from Taiwan Environmental Protection Administration (TEPA) air quality monitoring stations. To elucidate the spatial distribution of air pollutants, we classified the observed stations over central Taiwan into “coast,” “urban,” and “mountain.” Each of these categories represents the mean concentration of the numbers derived from stations of the same type. The coast category included two stations: Shalu (SL) and Xianxi (XX; Fig. 1c). The urban category included five stations: Fengyuan (FY), Xitun (XT), Zhongming (ZM), Changhua (CH), and Dali (DL; Fig. 1c). The mountain category included three stations: Nantou (NT), Zhushan (ZS), and Puli (PL), which were located nearby or in basins surrounded by high mountains (Fig. 1c). Two stations on small islands were also considered in the analysis. One was in Kinmen (KM), which is located close to Xiamen city in southeastern China, and the other was Magong (MG) station located in the Taiwan Strait (Fig. 1a).
To explore the air pollution episodes during summer, we recorded data in central Taiwan in July 2017 and 2018. For the summer campaigns, we employed three sampling sites (the squares in Fig. 1c): Shalu (SL, 24.23∘ N, 120.57∘ E; the same location as the TEPA station), Zhushan (ZS, 23.76∘ N, 120.68∘ E; the same location as the TEPA station), and Chung Shan Medical University (CSM) (24.12∘ N, 120.65∘ E; Fig. 1c). ZS is a suburban site located in a complex valley surrounded by hills (300–500 m) and high mountains (CMR; elevation >2000 m) to the east and south, respectively. The remaining two sampling sites, SL and CSM, are located in a coastal suburban and urban area (Fig. 1c), respectively. The sampling period of each sample was 11 h; daytime samples were collected from 08:00 to 19:00 LST, whereas nighttime sampling was conducted from 20:00 to 07:00 LST. We determined mass concentrations of the aerosols using a gravimetric measurement of the samples collected on polytetrafluoroethylene membrane filters (Chou et al., 2008; Lee et al., 2019). The filter samples were analyzed for water-soluble ions (Ca2+, Mg2+, Na+, NH, K+, SO, NO, and Cl−) via ion chromatography (Dionex ICS 1000, Thermo Scientific). Organic carbon (OC) and elemental carbon (EC) were measured by a thermal–optical carbon analyzer (DRI, 2001A, Atmoslytic Inc.), following the IMPROVE thermo-optical reflectance (TOR) protocol (Chow et al., 2001). The instruments for the hourly measurement of PM10 and PM2.5 from TEPA are METONE_BAM1020 (https://airtw.epa.gov.tw/CHT/EnvMonitoring/Central/Tools.aspx, last access: 18 March 2021). Two reactive gases, ozone (O3) and sulfur dioxide (SO2), were measured in parallel with the aerosol measurements. A non-dispersive ultraviolet photometer (ML9810, Ecotech, Australia) and an ultraviolet fluorescence spectrometer (ML9850, Ecotech, Australia) were used to measure O3 and SO2 concentrations, respectively. Sounding data were obtained from the CWB; the site on Penghu island (the World Meteorological Organization – WMO – station number code is 46734) was close to the MG TEPA station (Fig. 1a).
During summer, the land–sea breeze easily combines with the mountain upslope and downslope wind during daytime and nighttime. As the sea breeze develops, airflows are typically transported from coastal areas and pass over the Taichung metropolitan region (Fig. 1c) coupled with mountain slope flow to the inland area. The Taichung metropolis is a large urban environment comprising residential, industrial, and agricultural lands (Cheng et al., 2009). In particular, Taichung Power Plant (TPP, Fig. 1c), which is coal-fired, and the Taichung Harbor industrial area (THI, Fig. 1c) are both located on the coast and are responsible for substantial emissions in central Taiwan. Thus, severe emission sources contribute to and affect the air quality in the Taichung metropolitan area under favorable weather conditions. Meteorological parameters, including wind speed and wind direction, temperature, and relative humidity, were acquired from a meteorological station in the same location where data were collected for this study.
In this study, we used the Weather Research and Forecasting (WRF) model coupled with the WRF-Chem version 3.9 to study air pollutant transport during the episode. We obtained the meteorological initial and boundary conditions for WRF-Chem from the National Center for Environmental Prediction (NCEP) Operational Global Forecast System (GFS) data sets at 6 h intervals. We selected the Yonsei University (YSU) planetary boundary layer (PBL) scheme for this study. The coarse and fine domains had 259×370 and 301×301 grid nets with resolutions of 9 and 3 km, respectively. The vertical had 41 levels, with the lowest level approximately 40 m above the surface. To ensure that the meteorological fields were well simulated, we employed the four-dimensional data assimilation scheme according to the NCEP GFS data. Transport processes included advection by winds, convection by clouds, and diffusion by turbulent mixing. Removal processes included gravitational settling, surface deposition, and wet deposition (scavenging in convective updrafts and rainout or washout in large-scale precipitation). The kinetic preprocessor (KPP) interface was used in both the chemistry scheme of the Regional Atmospheric Chemistry Mechanism (Stockwell et al., 1990). The secondary organic aerosol formation module, the Modal Aerosol Dynamics Model for Europe (MADE) (Ackermann et al., 1998) volatility basis set (VBS) (Ahmadov et al., 2012), was employed in the WRF-Chem model. The anthropogenic emissions in Taiwan were obtained from the air pollutant monitoring database of the TEPA. Its emission inventory system is called the Taiwan Emission Data System (TEDS). The TEDS version in this study is V9.0 (2013) and contains data on eight primary atmospheric pollutants: CO, NO, NO2, NOx, O3, PM10, PM2.5, and SO2.
4.1 Characteristics of air quality over central Taiwan
Figure 2a–c indicate the monthly mean concentration for PM10, PM2.5, and daytime (08:00–17:00 LST) ozone between 2004 and 2019. Clear seasonal variations were noted for aerosol and ozone over central Taiwan. The lowest PM10, PM2.5, and daytime ozone concentrations were observed during summer (June–August) at 32–40 µg m−3, 16–23 µg m−3, and 35–42 ppb, respectively. The concentration of daytime ozone peaked in October, whereas PM10 and PM2.5 peaked in March. In general, the highest concentrations were observed in spring (March–May) and fall (September–November). The daytime ozone peaked at 56 and 48 ppb in October and April, respectively (Fig. 2c). For PM10 and PM2.5, the peak concentrations were 70–75 and 40–45 µg m−3 over the western plains in March (Fig. 2a, b). Regarding the characteristics of ozone distribution, the concentration at the mountain site was typically higher than that in urban areas and the coast. For PM10 and PM2.5, the mountain site also typically had higher concentrations than the urban and coastal areas, except during summer (Fig. 2a, b). The monsoon dominates the prevailing wind over East Asia. During summer, a southwesterly wind prevails, whereas a northeasterly wind prevails during fall, winter, and spring. The characteristics of the seasonal variations might be due to the summer having a cleaner background and higher boundary layer height than in other seasons. As mentioned earlier, the major emission sources such as industry and traffic are located in coastal and urban areas. The mean highest concentration of ozone typically occurs over rural mountain areas during summer; thus, the dominant land–sea breeze might play a critical role in the air quality in western Taiwan.
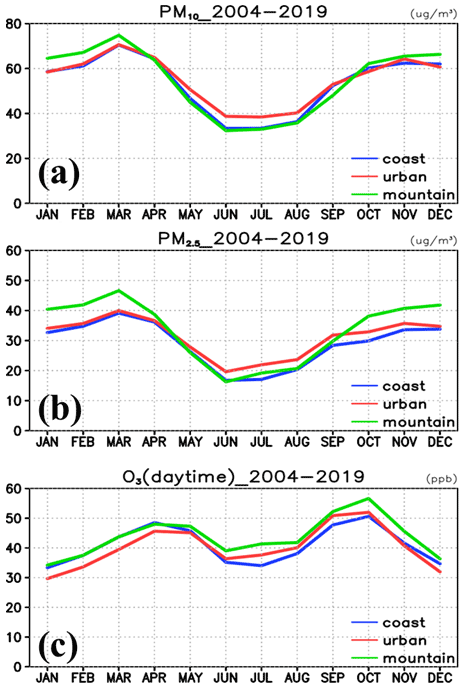
Figure 2Average monthly concentrations of (a) PM10, (b) PM2.5, and (c) daytime (08:00–17:00 LST) ozone for coastal, urban, and mountain areas between 2004 and 2019.
During summer (July only in this study) in 2017 and 2018, we conducted sampling campaigns in central Taiwan. Table 1 presents the mean concentration of the elements in PM2.5 at sampling stations SL, CSM, and ZS during July in 2017 and 2018. The mean concentrations of PM2.5 for stations SL, CSM, and ZS were 15.7, 16.9, and 21.4 µg m−3. The inland rural mountain site, ZS, clearly had the highest total PM2.5 concentration. Organic carbon (OC) and SO had the highest concentrations of the species in PM2.5, and both increased from the coast to the inland mountain area (Table 1). Because the major emissions were from coastal industry or urban areas, sea breeze transport played a role in PM2.5 concentration in the western plains. The major contributing species in PM2.5 were OC, SO, NO, NH, and elemental carbon (EC; Table 1). At the coastal station SL, the concentrations of OC and SOwere comparable at 4.3 and 4.5 µg m−3, accounting for 27.5 % and 28.6 % of PM2.5, respectively. At the city site CSM and the inland rural mountain station ZS, OC had concentrations of 5.6 (33.1 % of PM2.5) and 6.6 µg m−3 (30.9 % of PM2.5), respectively. The results indicated that the contribution of OC to PM2.5 could exceed 30 % at the urban and inland mountain sites. The concentration of OC increased from the coast (4.3 µg m−3; 27.5 % of PM2.5) to the mountain station (6.6 µg m−3; 30.9 % of PM2.5), and the urban site had the highest proportion (5.6 µg m−3; 33.1 % of PM2.5) in PM2.5 among these stations (Table 1). SO also exhibited an increased concentration from coastal areas to the inland mountain area, but the changes were minor (4.5–4.8 µg m−3). Notably, the proportion of SOin PM2.5 decreased from the coast to the mountain area because the major sources, TPP and THI (Fig. 1c), are located on the coast. The other species, namely NO, NH, and EC, at SL, CSM, and ZS had comparable concentrations between stations (1.0–1.4, 1.7–2.0, and 1.1–1.4 µg m−3, respectively; Table 1). The inland rural station ZS is located in a foothill valley of the CMR and surrounded by mountains. Thus, the high concentration at ZS might be due to sea breeze transport.
Table 1Concentrations of PM2.5 and its major components (SO, OC, NO, NH, and EC) as well as daytime ozone and meteorological parameters at the SL (coast), CSM (urban), and ZS (mountain) sampling sites in July 2017 and 2018.
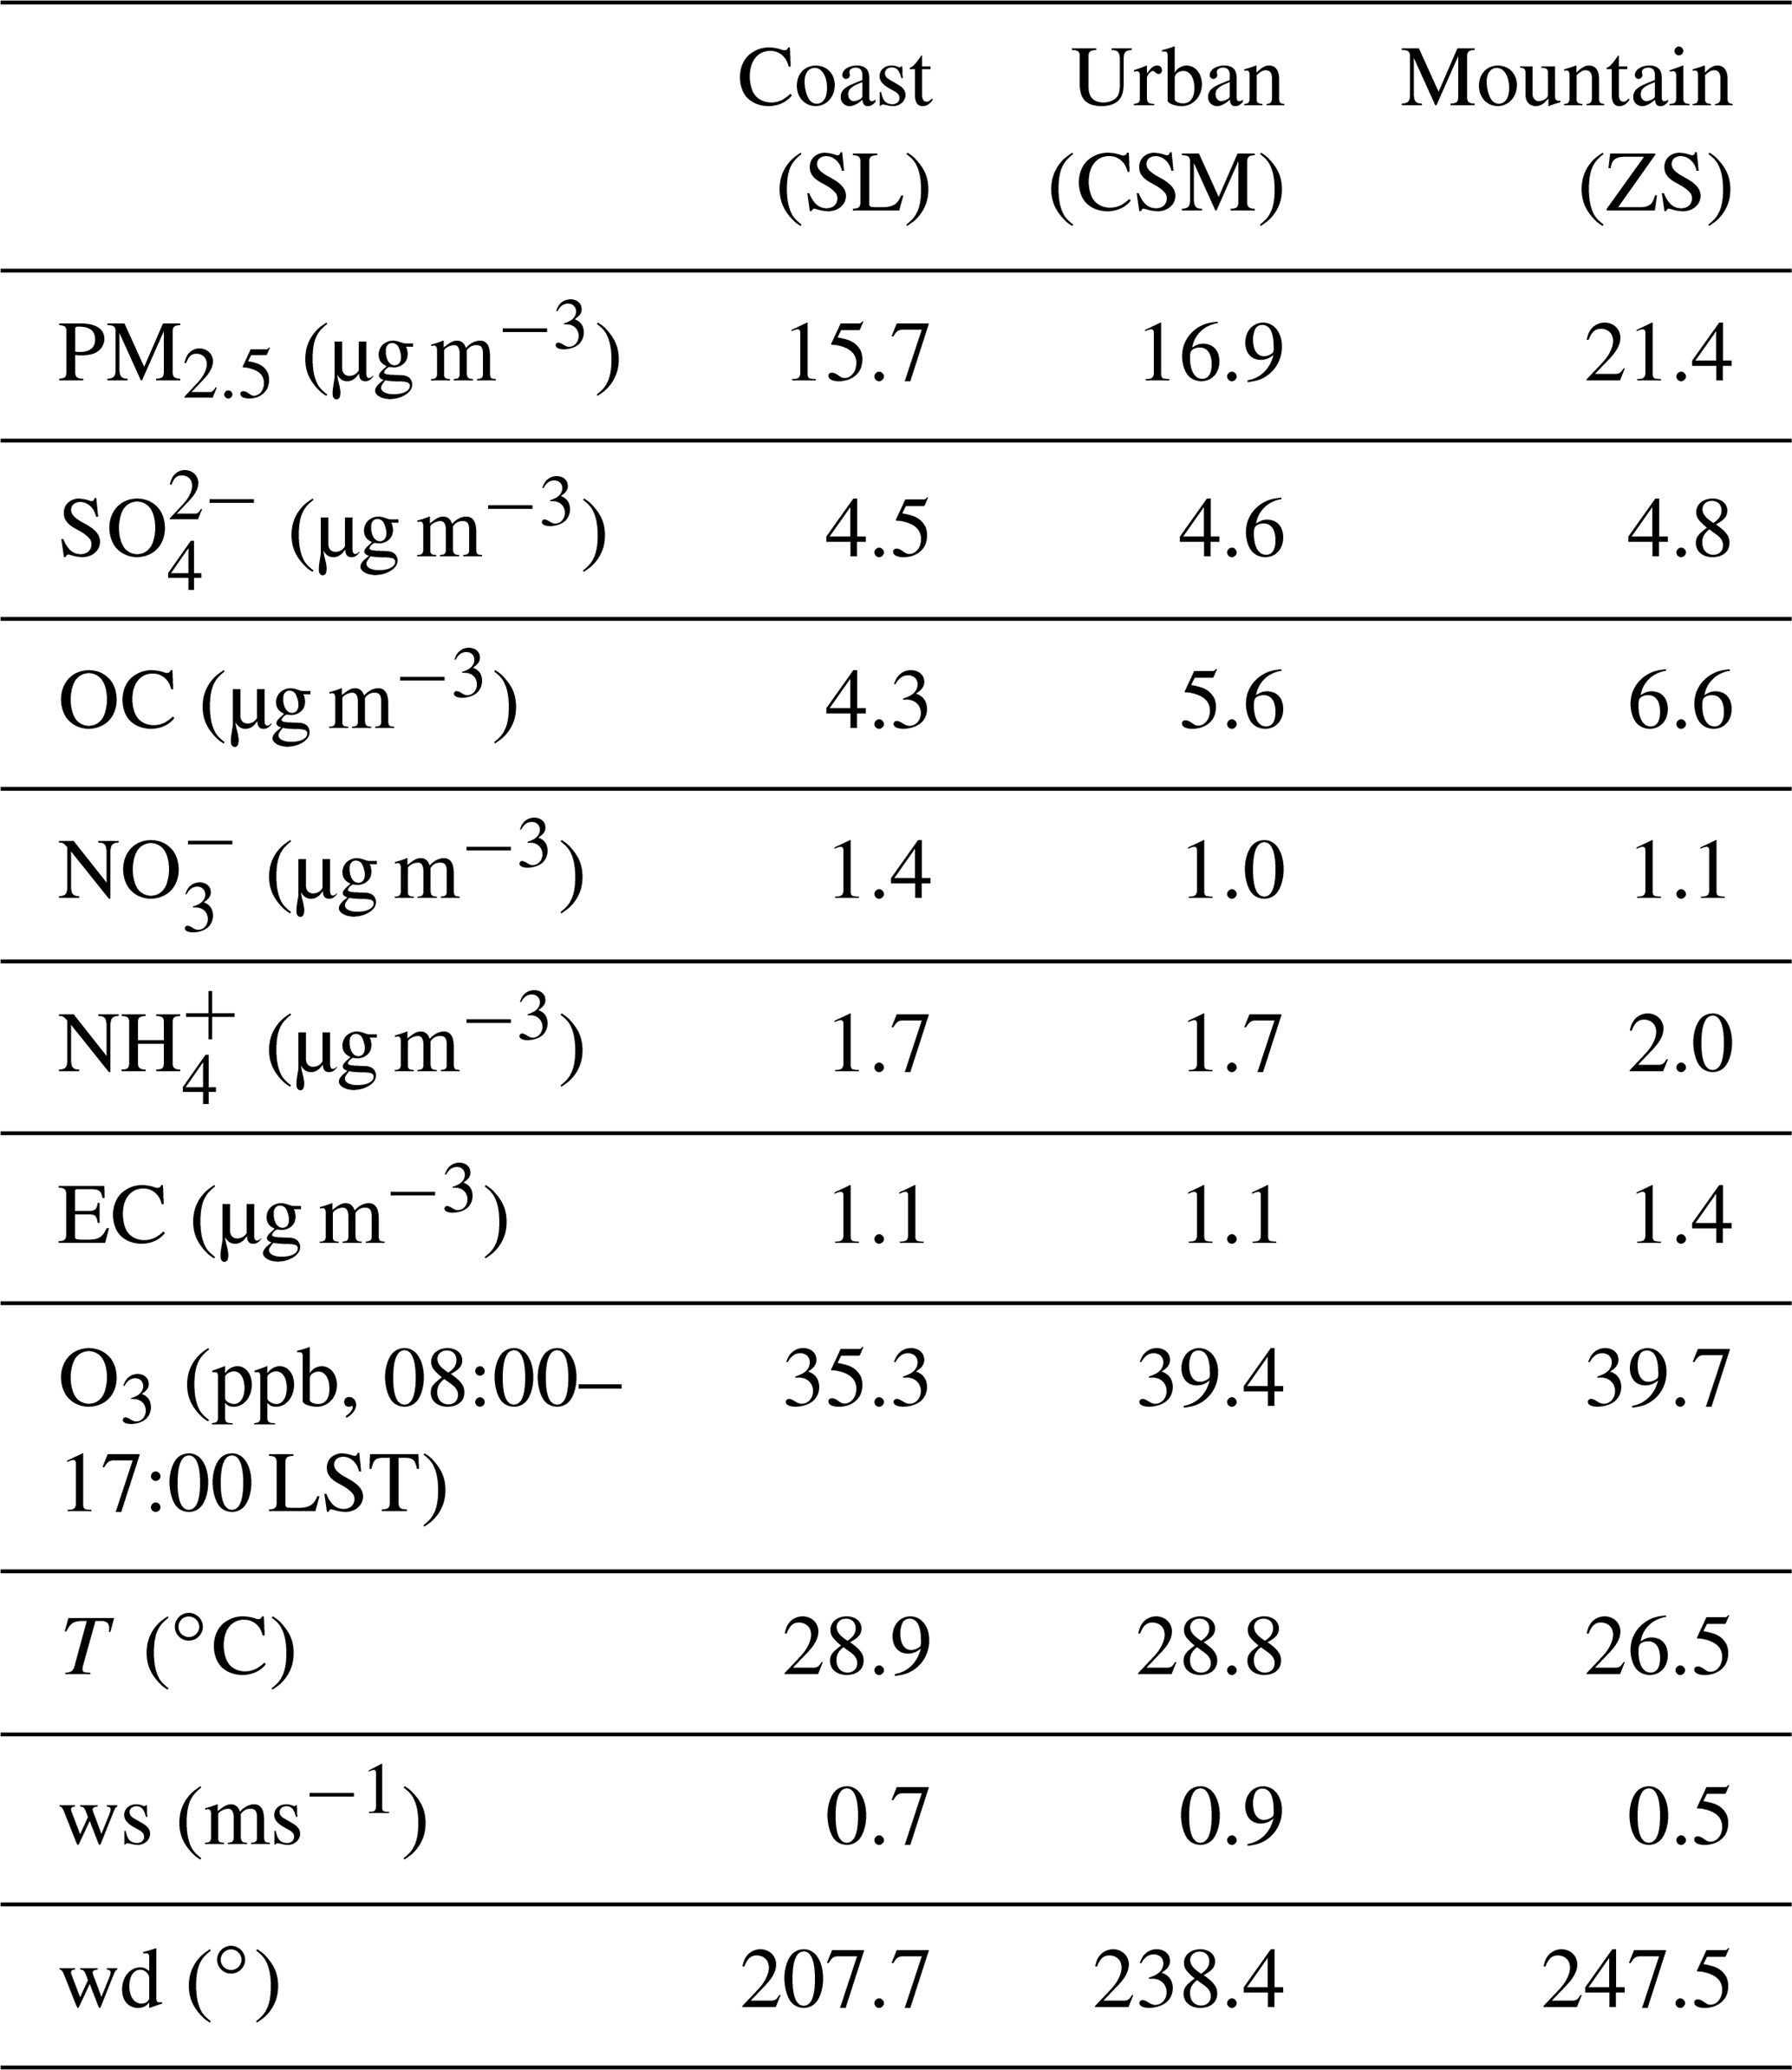
In general, OC and SO were the major species over western Taiwan, especially in inland areas. These results suggest that local contributions, such as traffic, industry, and even agricultural emissions, might play critical roles in the composition of PM2.5. Furthermore, the spatial distributions of the highest PM2.5 and daytime ozone concentration were not always in urban areas; instead, concentrations accumulated in inland rural areas (Fig. 2 and Table 1). The roles that the land–sea breeze, boundary layer development, and interaction of typhoon circulation with complex geographic structures play in air quality require clarification. The mechanisms of these complex processes and local circulation variations are demonstrated through a case study using numerical model simulation in Sect. 4.2.2.
4.2 Air quality deterioration case from 15–17 July 2018
4.2.1 Weather condition and observation
To explore air quality deterioration processes and formation mechanisms, we employed a severe air pollution episode between 15 and 17 July 2018. Weather maps obtained from the NCEP Global Forecast System (GFS) revealed that a tropical depression formed to the east of the Philippines and moved northwestward on 15 July 2018 (Fig. 3a). Another low-pressure system followed, located to the south of this tropical depression on 16 July (Fig. 3b). On 17 July, this tropical depression strengthened and formed a weak typhoon named Son-Tinh, located between Taiwan and Luzon island in the Philippines (Fig. 3c); the original low-pressure system also strengthened into a tropical depression on 17 July. The continual formation of low-pressure systems or typhoons to the east of Luzon shifted the ambient wind flow of Taiwan to an easterly direction for an extended period between 15 and 17 July (Fig. 3a–c). The easterly ambient flow was easily blocked by Taiwan's CMR, resulting in a lee vortex formation associated with stable atmospheric conditions and weak wind speed in western Taiwan. The mechanism of lee vortex formation on the lee side of a high mountain has been described through a laboratory experiment (Hunt and Synder, 1980) and numerical modeling (e.g., Smolarkiewicz and Rotunno, 1989). Li and Chen (1998) employed wind flow with a low Froude number (<0.5) (, where U is the far upstream flow speed; N is the Brunt–Vaisala frequency, a measure of stratification; and H is the height of an obstacle), and the low-level airflow easily split off the northern coast and moved around the island of Taiwan. The current study is an example of a low-Fr case (<0.5; assumed average wind speed, U=10 ms−1; Brunt–Vaisala frequency, s−1; and average mountain height, H=2.5 km). Thus, we expected wind speeds to be weak and atmospheric conditions to be more stable on the lee side of the CMR compared with the windward side of eastern Taiwan.

Figure 3Near-surface weather charts obtained from NCEP GFS data. The gray area represents clouds according to a Himawari satellite infrared image. (a): 00:00 UTC on 15 July; (b) 00:00 UTC on 16 July, and (c) 00:00 UTC on 17 July.
Sounding data (Fig. 4) recorded at the CWB station on Penghu island (WMO station number code is 46734, close to MG in Fig. 1a) indicated a relatively weak wind speed (<5 m s−1) in the low boundary (below 850 hPa) during the study period from 15 to 17 July 2018 (Fig. 4a–c). Above 700 hPa (3000 m), a strong easterly wind (>10 m s−1) prevailed due to the typhoon circulations. Furthermore, clear subsidence and multiple inversion layers were revealed in the sounding between 16 and 17 July (Fig. 4b, c). On 17 July, the inversion layer was even lower than 950 hPa (Fig. 4c); that is, only a few hundred meters over Penghu island in the Taiwan Strait. The sounding data revealed stable atmospheric conditions, high relative humidity, and weak wind speed on the lee side of the mountains over western Taiwan.
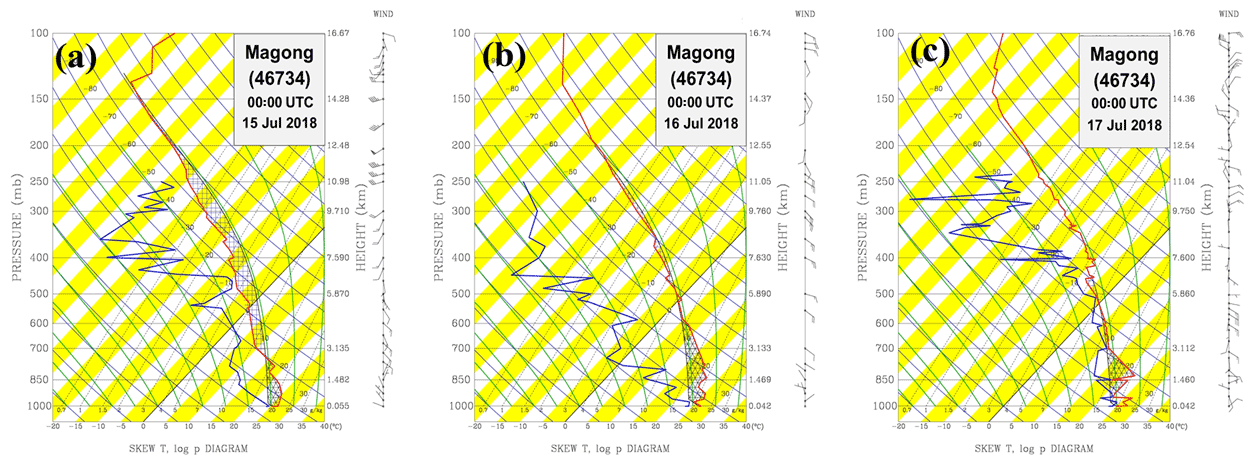
Figure 4Morning sounding launched at 00:00 UTC at station 46734 (located at MG in Fig. 1a): (a) 15 July, (b) 16 July, and (c) 17 July. The red line represents the vertical profile of air temperature, and blue is dew-point temperature.
Table 2Concentrations of PM2.5 and its major components (SO, OC, NO, NH, and EC) as well as daytime ozone and meteorological parameters at the SL (coast), CSM (urban), and ZS (mountain) sampling sites between 15 and 17 July 2018.
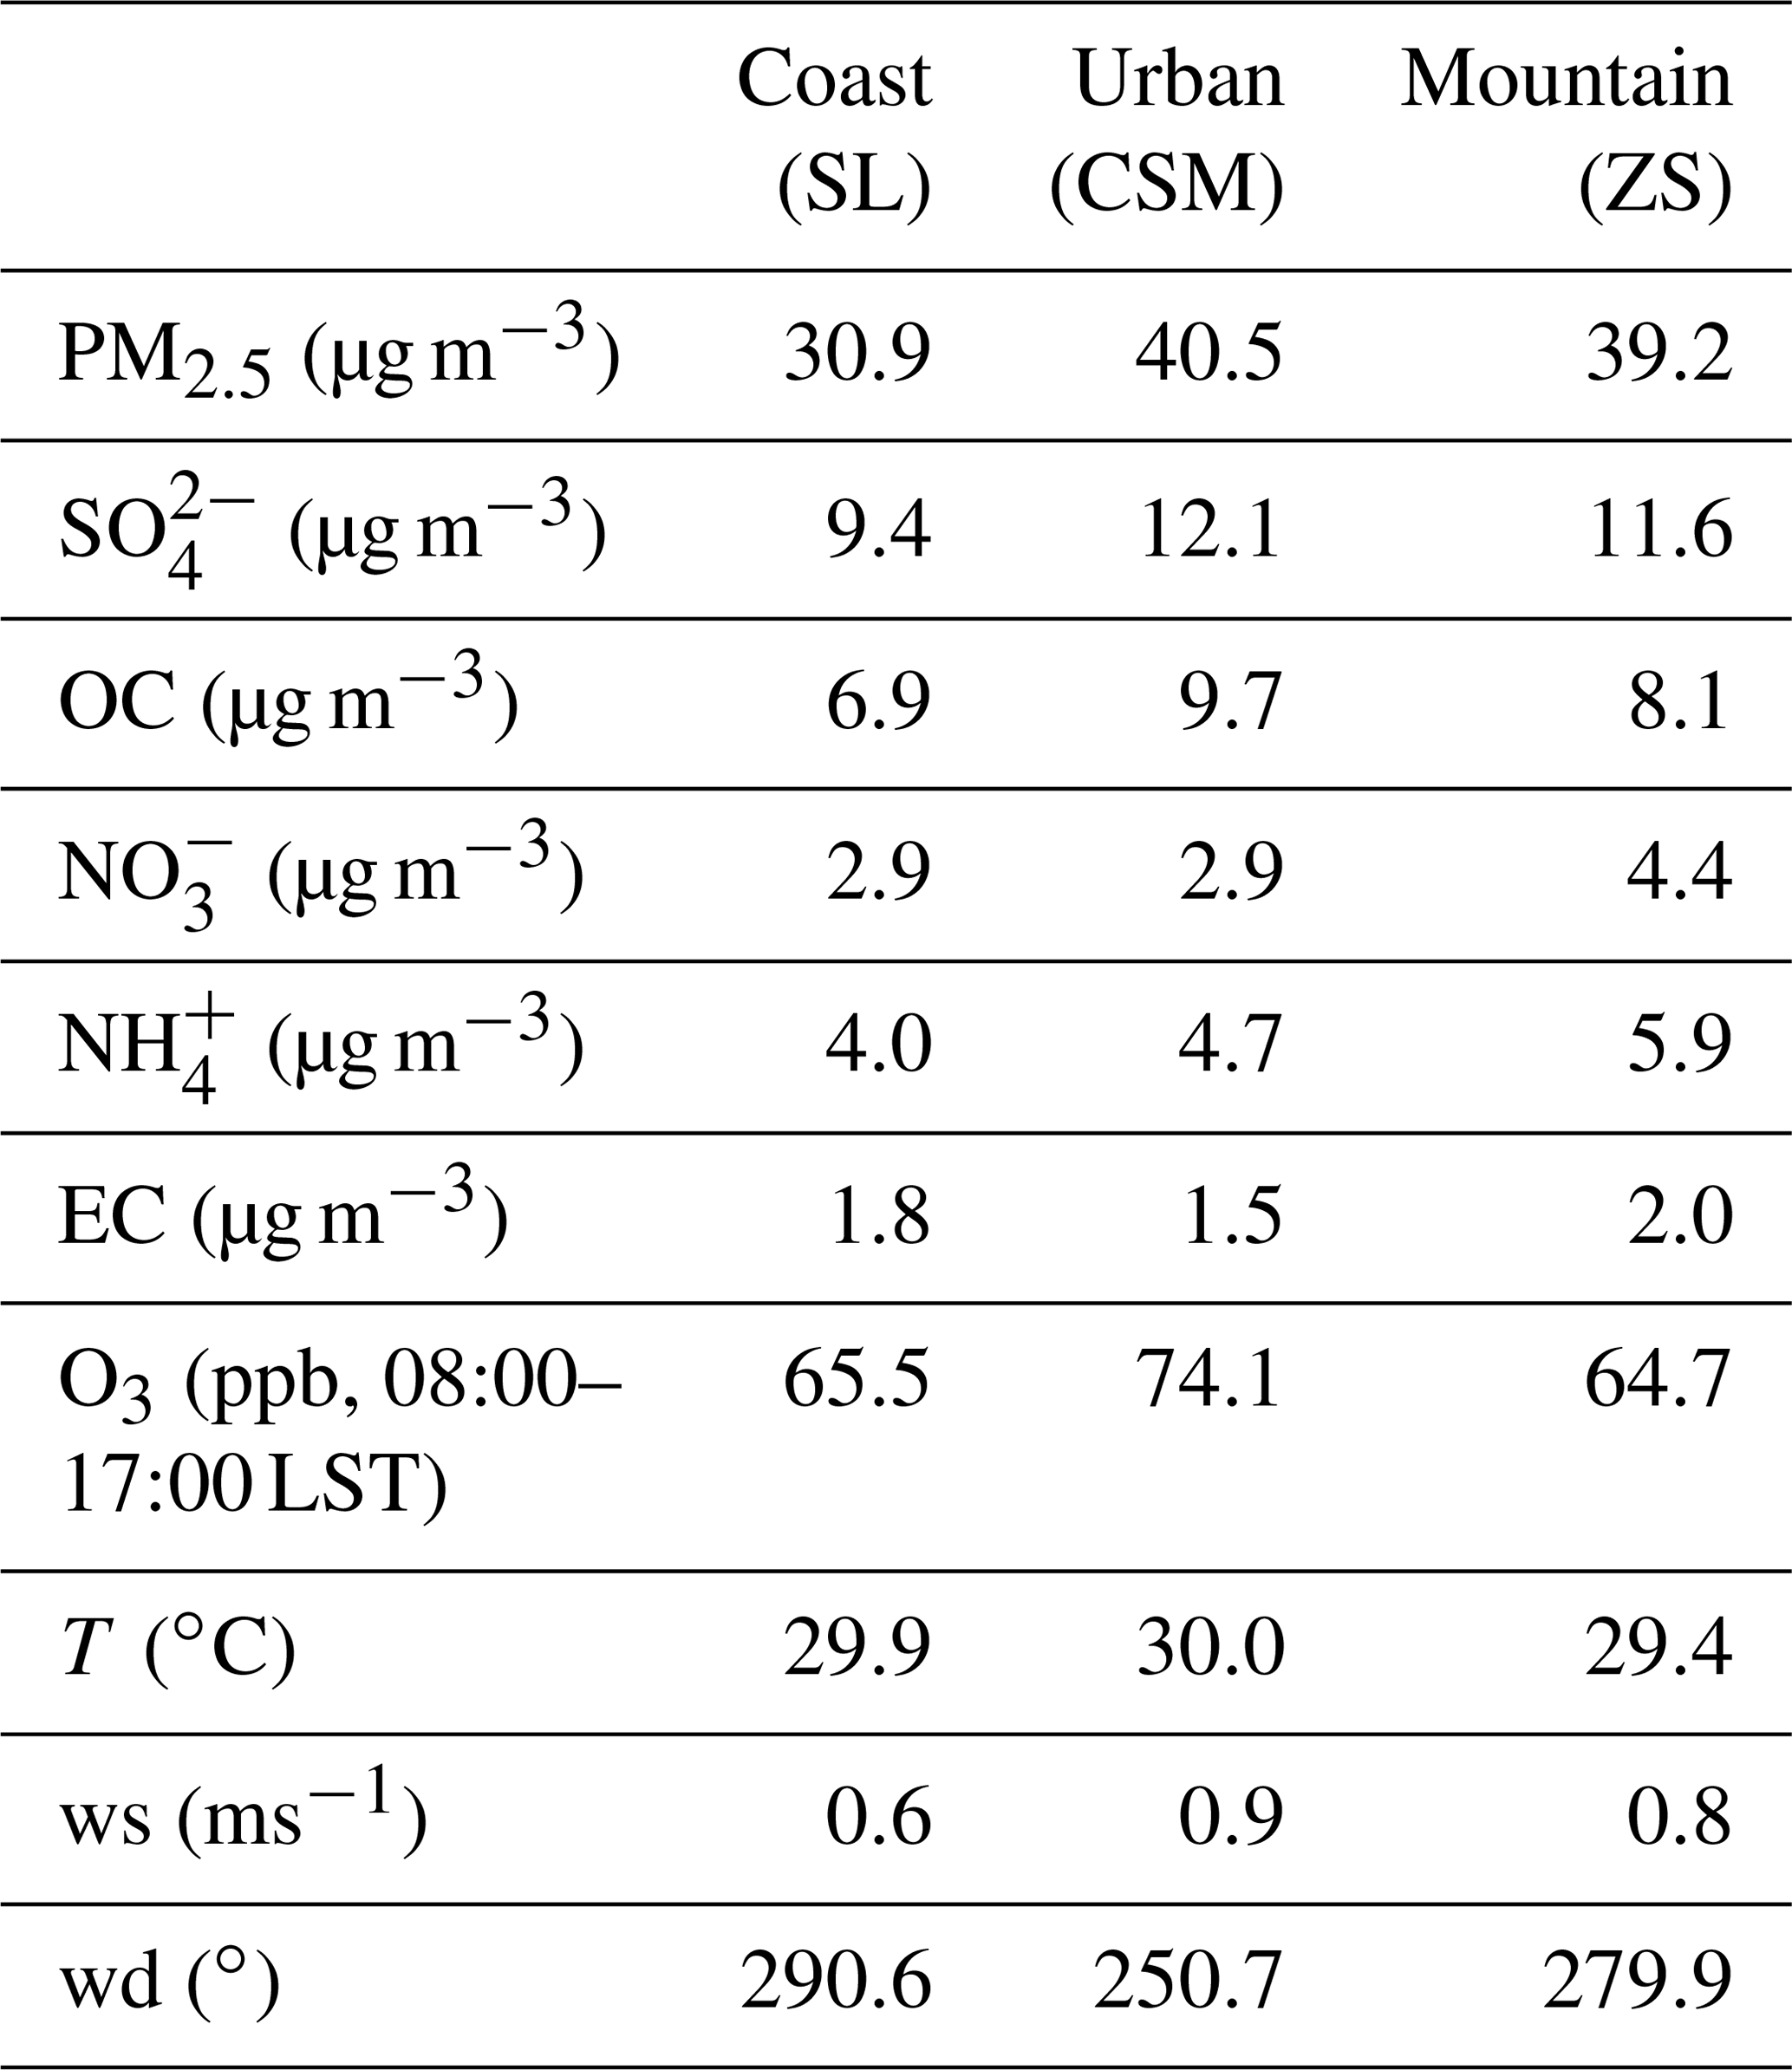
Figure 5 displays the variations in wind field and air pollutants (both PM2.5 and ozone) at the TEPA stations on two small islands, KM and MG (locations marked in Fig. 1a), and results over the western plains from 12 to 18 July 2018. The wind direction and wind speed were quite different between these two stations and over the western plains (Fig. 5a). The wind speed was relatively strong at KM, especially between 16 and 17 July because the typhoon circulation had already reached the coastal area of China and the Taiwan Strait. The wind direction was originally southerly on 12 July, becoming northeasterly after 12:00 LST on 14 July 2018. During periods of strong wind speed at KM, the concentrations of PM2.5 and O3 revealed no diurnal variation and a steady low, with PM2.5 < 15 µg m−3 and daytime O3 <40 ppb after 12:00 LST on 14 July. The wind speed at MG was weaker than that at KM because MG is close to Taiwan and was likely affected by the mountain blocking effect mentioned earlier. Because the wind speed did not change considerably, the PM2.5 and O3 concentration levels did not fluctuate obviously at MG during the study period.
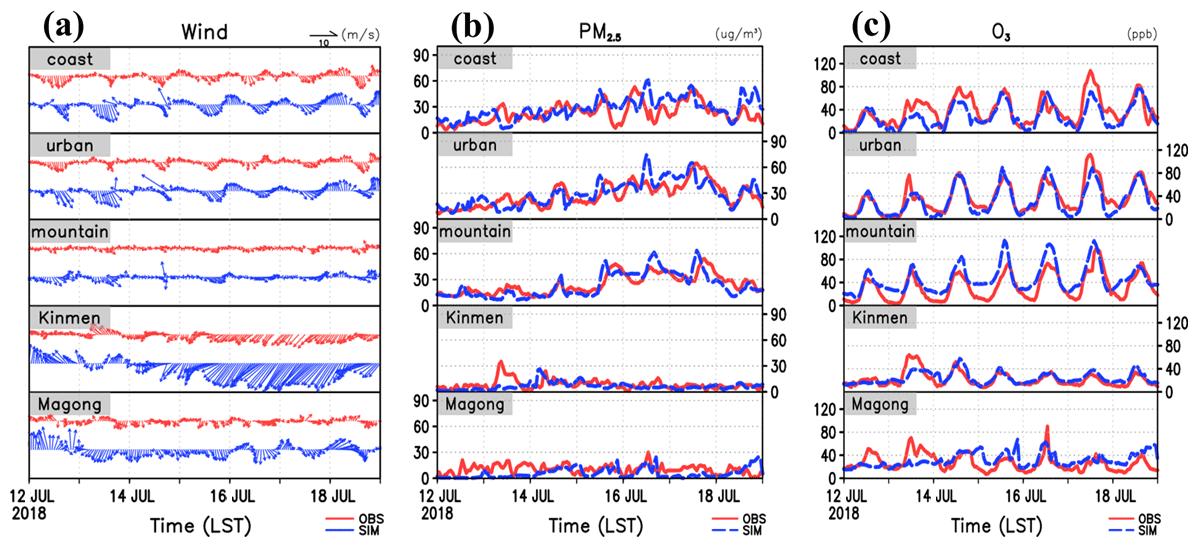
Figure 5Hourly variation of observed (red) and simulated (blue) values for (a) wind, (b) PM 2.5, and (c) daytime (08:00–17:00 LST) ozone between 12 and 18 July 2018 for the coastal, urban, and mountain stations as well as for the two island stations, Kinmen (KM) and Magong (MG).
By contrast, the wind field time series indicated clear land–sea breeze variations over western Taiwan. At the inland mountain site, wind speed was relatively weak compared with the coastal and urban sites (Fig. 5a). The PM2.5 and ozone time series for the coastal, urban, mountain sites are presented in Fig. 5b and c. The PM2.5 concentrations at the urban and mountain sites ranged from 30 to 60 µg m−3 between 16 and 17 July 2018. Notably, the timing of the peak PM2.5 concentration differed between the coastal, urban, and mountain sites. Peak PM2.5 at the coastal and urban sites was observed around noon, whereas peak PM2.5 at the inland mountain site occurred at 18:00 LST on 17 July 2018 (Fig. 5b). The differences in the timing of the peak PM2.5 concentrations between the coastal and urban sites and the inland mountain site could be attributed to the transport of the sea breeze. No clear diurnal variation in PM2.5 concentration was observed between the urban and mountain sites between 16 and 17 July. That is, even at night and in the early morning, the concentration remained as high as 40 µg m−3 (Fig. 5b) because atmospheric conditions were favorable for air pollutant accumulation. The peak ozone concentration occurred around noon at the coast and urban sites, whereas the peak at the mountain site occurred later at 16:00 LST (Fig. 5c). We estimated that the concentrations of PM2.5 and ozone on the episode day on 17 July (Fig. 5b, c) were 3 times higher than the mean concentration during summer (Fig. 2) in central Taiwan. As mentioned earlier, the major emissions were generated by coastal industry and the Taichung city metropolitan area, but the peak ozone concentration occurred at the inland mountain station (120 ppb at PL) because of sea breeze transport from upstream to downstream sites.
The spatial distribution of the wind field and PM2.5 concentration (Fig. 6) from TEPA stations in Taiwan revealed a strong easterly wind in northern and southern Taiwan as well as weak wind speed and clear sea breeze development during daytime in central Taiwan. PM2.5 concentrations remained low (<15 µg m−3) at the northern, eastern, and southern tips of Taiwan on 17 July 2018 (Fig. 6a–f). Over western Taiwan, a sea breeze developed after 10:00 LST, and a strong onshore flow blew air pollutants to the inland area (Fig. 6b–d). A high PM2.5 concentration (>50 µg m−3) extended from the coast to the urban area at noon (Fig. 6b, c), which was subsequently transported to the inland mountain area in the afternoon and nighttime (Fig. 6d–f). The high PM2.5 concentration accumulated in Miaoli county (located north of Taichung city) at midnight owing to the convergence of southerly and land breezes (Fig. 6f). Actually, the spatial variation of PM2.5 could also be observed on the previous day (16 July; Fig. 5b), which contributed approximately 30 µg m−3 in the early morning on 17 July in central Taiwan.
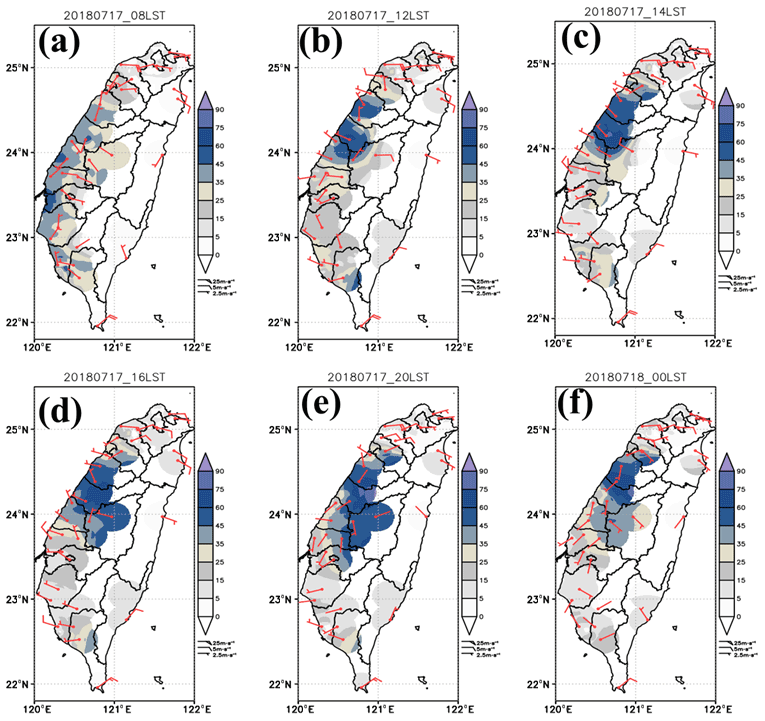
Figure 6Observed PM2.5 concentration (µg m−3) and wind recorded in Taiwan (a) at 08:00 LST, (b) 12:00 LST, (c) 14:00 LST, (d) 16:00 LST, and (e) 20:00 LST on 17 July as well as (f) 00:00 LST on 18 July 2018.
The location of the high-pollution ozone was also strongly associated with the land–sea breeze during the daytime (Fig. 7b–e). A high concentration of ozone was observed at the urban station at noontime (Fig. 7c); the ozone was transported to the inland mountain station, resulting in peak concentrations higher than 120 ppb between 16:00 and 18:00 LST (Fig. 7d–f). By 22:00 LST, the ozone concentration had declined more rapidly in the city than in the mountain area because of the dilution effect (Fig. 7g, h). The detailed pollution process and mechanism are demonstrated and discussed in the model simulation in Sect. 4.2.2.

Figure 7Observed ozone concentration (ppb) and wind recorded in Taiwan at (a) 08:00 LST, (b) 10:00 LST, (c) 12:00 LST, (d) 14:00 LST, (e) 16:00 LST, (f) 18:00 LST, (g) 20:00 LST, and (h) 22:00 LST on 17 July 2018.
4.2.2 Simulation results
The hourly comparison between observed (red solid) and simulated (blue dashed) PM2.5 and ozone between 12 and 18 July 2018 is presented in Fig. 5b and c. In general, our simulation reasonably captured the variation of PM2.5 and ozone in western Taiwan and the small island sites MG and KM (Table 2). For PM2.5, the root mean square error (RMSE) at all sites was less than 1.0 µg m−3, and the correlation between observed and simulated values was 0.72 and 0.81 at the urban and mountain sites, respectively. Regarding the mean bias of PM2.5, it was slightly overestimated at coastal and urban sites and underestimated at the mountain site and sites on the two islands. In the ozone simulation, the correlation between observed and simulated values was as high as 0.73–0.9, except for MG. The RMSE of ozone for all areas was less than 1.45 ppb. For the mean bias of ozone, the maximum underestimation (−10 ppb) occurred at the coastal site, and the maximum overestimation (13.8 ppb) occurred over the mountain area because of the simulation of the spatial distribution difference.
Figure 8 indicates the simulated wind field (streamline) and spatial distribution of PM2.5 on 17 July 2018. The ambient wind flow was easterly and blocked by the CMR; the wind flow went around the CMR during the study period. The strongest wind speeds were recorded at the northern and southern tips of Taiwan and the coastal area of southeastern China (Fig. 8). By contrast, the wind speed was relatively weak on the lee side of the CMR from the middle of the Taiwan Strait to western Taiwan. This finding is consistent with the observed wind speed being stronger at KM (Fig. 5a) than in the area over western Taiwan. Figure 8a–f reveal that the highest PM2.5 concentration (>60 µg m−3) occurred on the lee side of the CMR in central Taiwan during the daytime (08:00–16:00 LST) on 17 July 2018. After 08:00 LST, the sea breeze gradually developed and the onshore wind speed increased (Fig. 8a–c); thus, the high-concentration PM2.5 plume was transported from the coast to the inland mountain area. Even though the area has high emissions, the PM2.5 concentration along the coastal area of China was low because of the strong wind speed (Fig. 8a–c). As a sea breeze developed after 08:00 LST, the vortex circulation was coupled with the onshore flow (Fig. 8a–d). The lee vortex circulation was not clear because it combined with the sea breeze and enhanced the air pollutant transport to the inland area during the daytime. However, the lee vortex circulation was clearly formed in the area from 23.5 to 24.5∘ N in the afternoon until early morning the next day because the land breeze interacted with the mountain lee side flows (Fig. 8e–f). After the lee vortex circulation formed, the southerly flow in the western plains was enhanced (Fig. 8e, f). These processes resulted in trapped air pollutants over the plains area because of the interaction between the lee vortex southerly component wind and the offshore flow in the nighttime and early morning. This also explains the absence of diurnal PM2.5 variation, and high concentrations (>35 µg m−3) accumulated during nighttime and early morning on 16 and 17 July over central Taiwan (Figs. 5a, b, and 6f). Thus, the lee vortex formation was adverse to the development of the offshore flow (land breeze) and prolonged the air pollutant accumulation in western central Taiwan (Figs. 6 and 8). These critical processes explain why air pollutants tended to accumulate in central Taiwan during the episode days. Notably, the wind speed was strong and the concentration of PM2.5 was low in the Taiwan Strait close to coastal areas of China in the simulation (Fig. 8a–f) and according to observations at KM (Fig. 5a). According to the spatial distribution, a strong wind speed can limit the number of air pollutants transported southward from mainland China to Taiwan (Fig. 8b–f). That is, the pollution type was locally dominated during the event days.
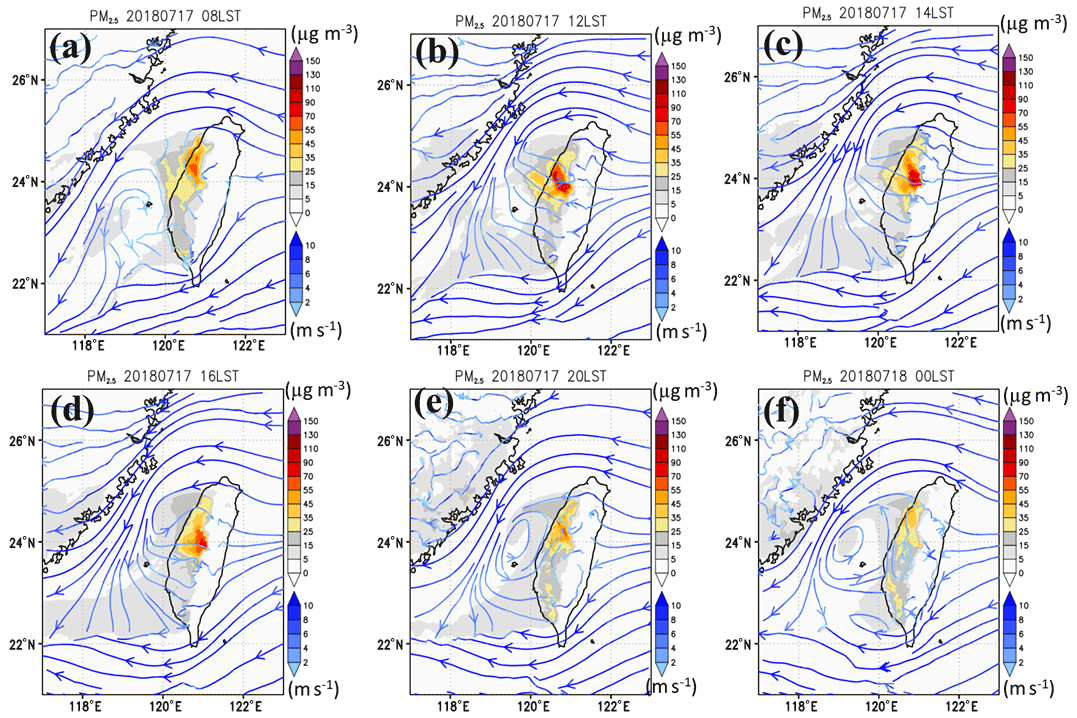
Figure 8Simulated near-surface (30 m) streamline and PM2.5 concentration (µg m−3) in Taiwan (a) at 08:00 LST, (b) 12:00 LST, (c) 14:00 LST, (d) 16:00 LST, and (e) 20:00 LST on 17 July as well as (f) 00:00 LST on 18 July 2018.
Similar to the observed ozone (Fig. 7), the simulated ozone (Fig. 9) was also dominated by circulations associated with the land–sea breeze and the interaction of the easterly flow with the CMR. Most of the area had steady low concentrations in the early morning on 17 July (Fig. 9a) because of the dilution effect of the ozone formation in the nighttime and early morning (Fig. 9a and h–i). A high concentration already existed over the mountain area in Miaoli county (Fig. 1b) in the early morning at 04:00 LST (Fig. 9a), with a steady low concentration over the coastal and urban areas. During the daytime, the background ozone concentration was 25–35 ppb over the ocean. The ozone concentration promptly increased around noon and extended over almost the entire western plains in the afternoon (Fig. 9c–f) on 17 July. The area of high ozone concentration extended over the western plains when the sea breeze developed after 10:00 LST on 17 July (Fig. 9c). Following increases in wind speed, the high ozone concentration extended to the inland area and was transported further south of Taichung city (Fig. 9d, e). The peak ozone concentration at the inland rural site occurred at 16:00 LST, whereas it occurred in the city center at the urban site at 12:00–14:00 LST (Figs. 5c, 7c, d, 9d, e). Because the major emission sources were coastal industry and the urban area, the high ozone concentration at the inland site was the result of ozone being transported by the sea breeze. The simulated peak ozone concentration occurred between 14:00 and 16:00 LST at the inland site because of the sea breeze coupled with the mountain upslope wind (Fig. 9 c–f). Moreover, the high-ozone plume was associated with the lee vortex circulation over the Taiwan Strait and existed during the nighttime and early morning. It provided a southerly flow component during the nighttime and early morning (Figs. 9a and g–i).

Figure 9Simulated near-surface (30 m) streamline and ozone concentration (ppb) in Taiwan at (a) 04:00 LST, (b) 08:00 LST, (c) 10:00 LST, (d) 12:00 LST, (e) 14:00 LST, (f) 16:00 LST, (g) 18:00 LST (h) 20:00 LST, and (i) 22:00 LST on 17 July 2018.
As mentioned earlier, sounding data indicated multiple inversion layers on the event days. To further investigate the boundary layer development and air pollutant distribution in the vertical, a northwest–southeast cross section AA' (Fig. 10a) was superimposed over the high-concentration area, as illustrated in Fig. 10. In the early morning at 05:00 LST (Fig. 10b), a separate high-concentration plume was observed at ground level, and another remained at an elevation of 1000 m on 17 July. It is a typical boundary layer structure due to ground surface radiation cooling under stable atmospheric conditions during nighttime and early morning. These two layers' plumes coupled together due to a boundary layer gradually developing in the morning after 07:00 LST (Fig. 10b–d). Because the emissions increased during rush hour, the concentration promptly increased as the PM2.5 plumes of these two layers coupled well in the vertical below 1000 m at 10:00 LST (Fig. 10d). The wind speed was weak at elevations below 1500 m but strong and offshore in a southeast–northwest direction above 2000 m due to easterly tropical cyclone circulation. The high-PM2.5 plume (concentration >50 µg m−3) was pushed by the sea breeze coupled with the upslope wind and accumulated in the inland rural area during daytime (12:00–16:00 LST) (Fig. 10e–g). The highest concentration was not at ground level but heights between 500 and 1000 m at noontime (Fig. 10e) and 1000–1500 m in the afternoon (Fig. 10f, g). The boundary layer structure as well as the coupling between the sea breeze and mountain upslope wind played important roles for the PM2.5 concentration distribution in the vertical along the cross section (Fig. 10d–g). As offshore wind developed, which pushed the air pollutants from the mountain area to the plains and coastal area (Fig. 10g–i), the elevation of the plume was predominantly between 500 and 1500 m after 20:00 LST. The discussion above indicates that the PM2.5 concentration was not only strongly related to the interaction of ambient flow with the CMR but also the diurnal variations in boundary layer development.
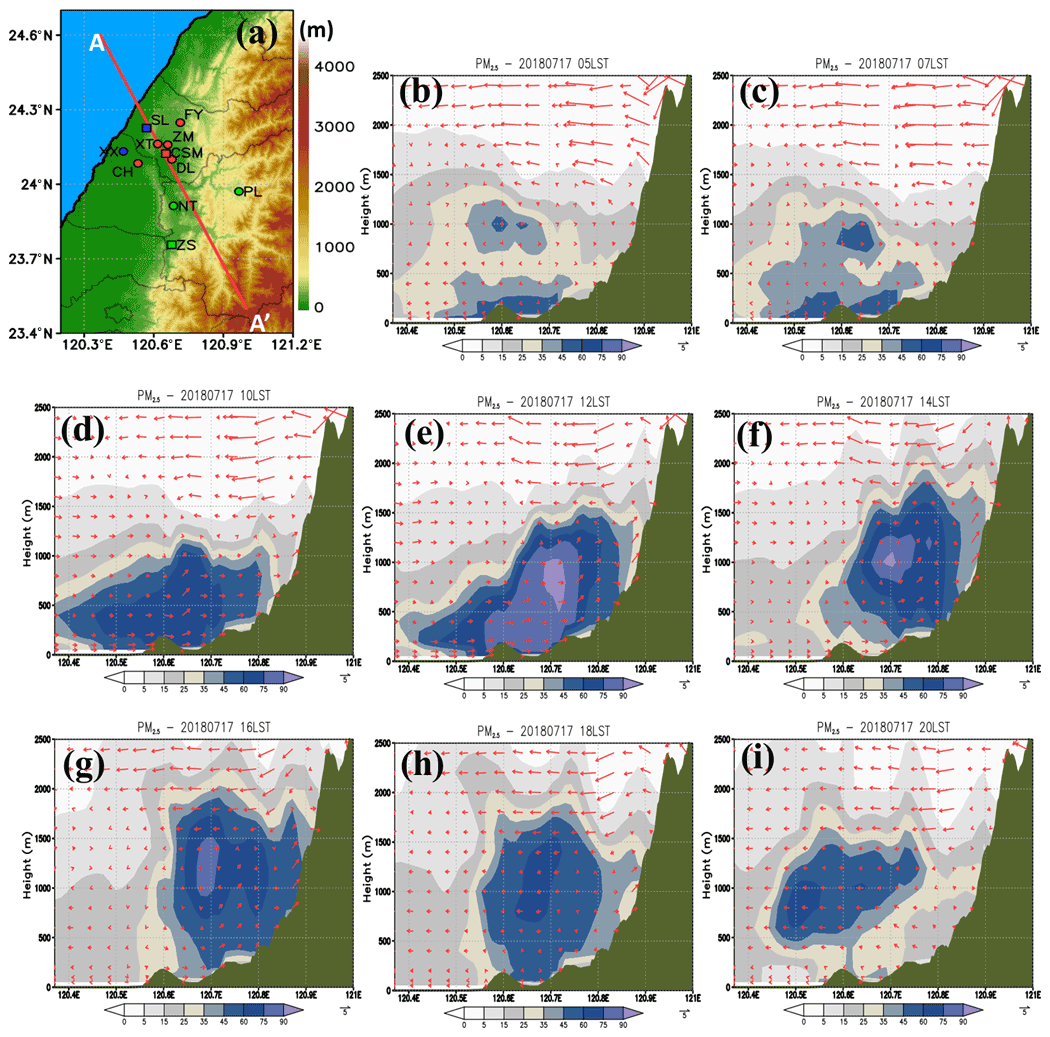
Figure 10(a) The geographic location of the study area in central Taiwan and the location of NW–SE cross section AA'. Wind field distribution and PM2.5 concentration (unit: µg m−3) along the northwest–southeast cross section at (b) 05:00 LST, (c) 07:00 LST, (d) 10:00 LST, (e) 12:00 LST, (f) 14:00 LST, (g) 16:00 LST, (h) 18:00 LST, and (i) 20:00 LST on 17 July 2018.
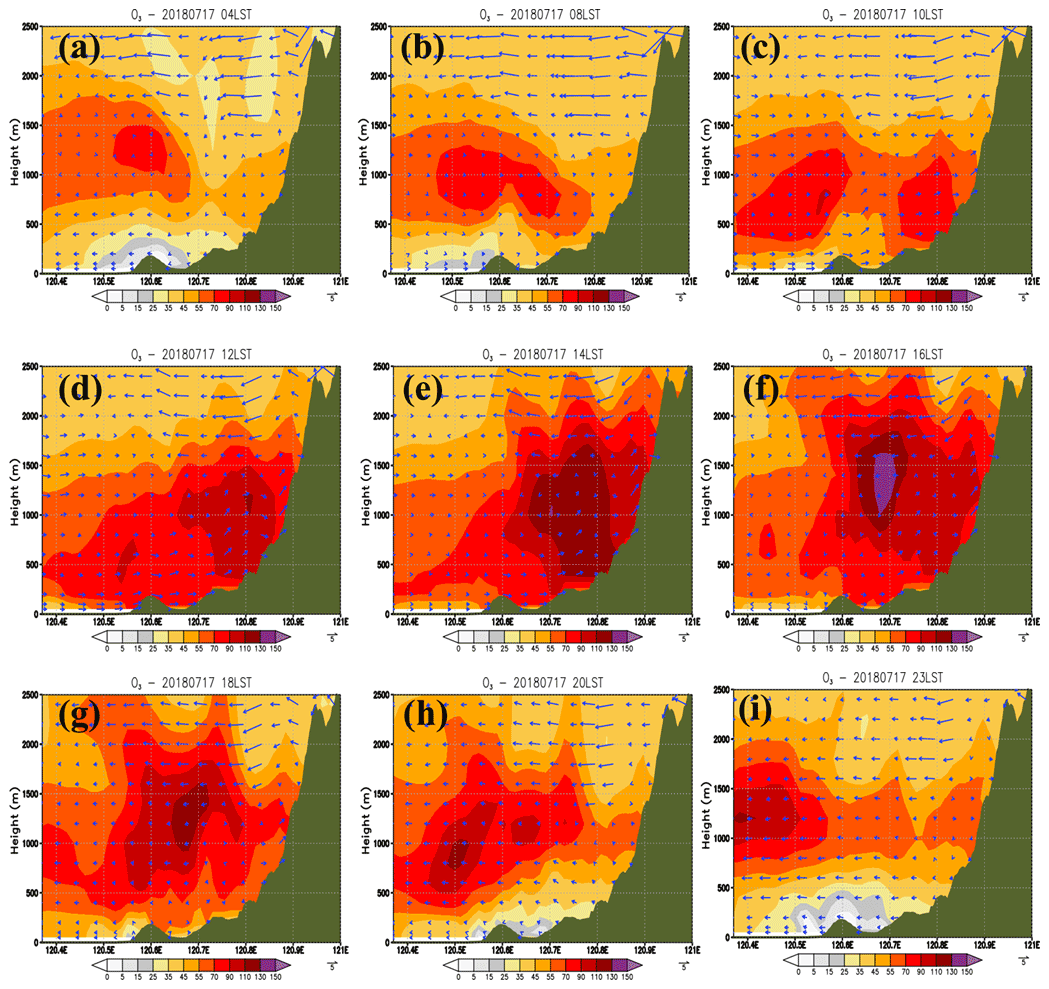
Figure 11Wind field distribution and ozone concentration (unit: ppb) along the northwest–southeast cross section AA' in Fig. 10a at (a) 04:00 LST, (b) 08:00 LST, (c) 10:00 LST, (d) 12:00 LST, (e) 14:00 LST, (f) 16:00 LST, (g) 18:00 LST, (h) 20:00 LST, and (i) 23:00 LST.
Figure 11 indicates the ozone cross section in a northwest–southeast direction in Fig. 10a. A low ozone concentration (<25 ppb) was observed near ground level because of the dilution effect in the early morning at 04:00 LST (Fig. 11a) on 17 July. However, a high-ozone layer was observed between 500 and 1500 m because of the previous day's contribution. After 08:00 LST, the mixing layer developed, and emissions from traffic and industry also increased. Concurrently, both the onshore sea breeze over the plains and the upslope wind over the mountain developed; thus, wind speed was also enhanced in the low boundary (Fig. 11b–e). The sea breeze and weak wind speed also exacerbated the high-concentration ozone in the inland area during the daytime (Fig. 11c–f). At nighttime, the ozone concentration gradually decreased because of the dilution effect below 500 m (Fig. 11h, i). However, TEPA measurements revealed that a layer with a high ozone concentration remained between 1000 and 1500 m (Fig. 7g, h) because low NOx was emitted over the mountain area in Taichung and Miaoli county. This also explains why the high ozone concentration first occurred over the mountain slope area as a result of the concurrent sea breeze and upslope wind in the morning (Figs. 9a and 11a). That is, the area of high concentration occurred earlier in the low-emission mountain area than on the plains, a major emission area. The simulated ozone concentration indicated that the high concentration did not occur near ground level but at 800–1000 m. This phenomenon was closely related to the development of the boundary layer structure and its interaction with the upper residual layer formation on the previous day.
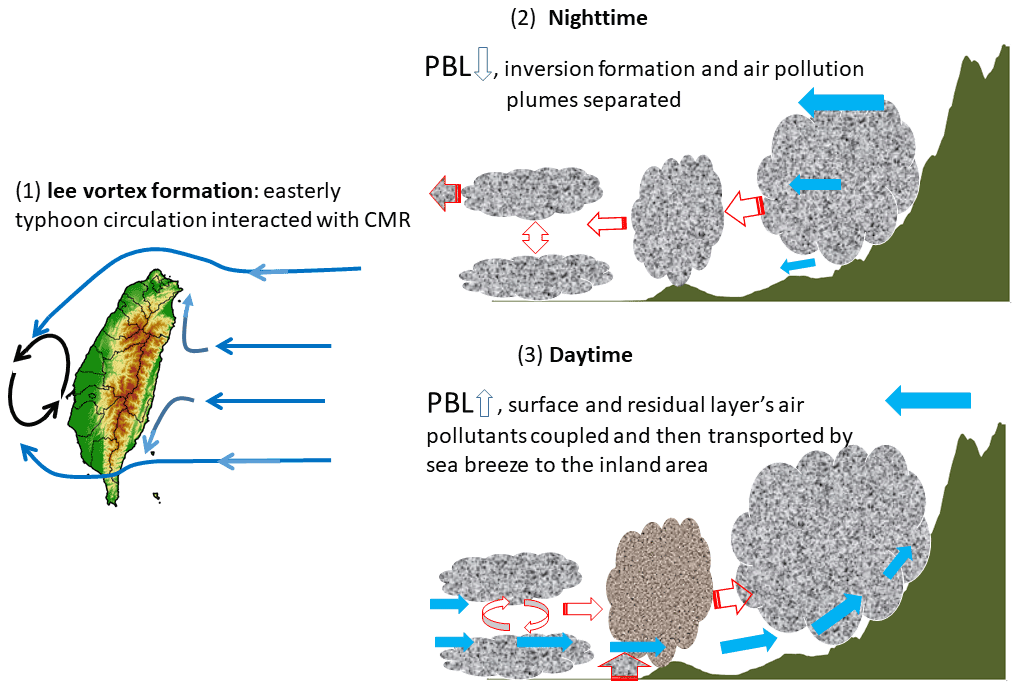
Figure 12Schematic of the processes of air quality deterioration during an episode associated with a typhoon over Taiwan's western plains.
The wind direction over Taiwan during summer is mostly southerly to southwesterly (Table 1). However, the wind direction during the episode was westerly to northwesterly (Table 2). The wind direction changed because of the critical interaction between typhoon circulations and the CMR. Moreover, the concentration of PM2.5 and its composition during the episode also differed significantly from the monthly mean, as revealed in Table 2. A substantial increase in daily mean PM2.5 was observed at all sites, especially at the CSM site (urban), where the concentration increased from 16.9 to 40.5 µg m−3 (Table 2). Furthermore, SO became the dominant species in PM2.5. Its concentration increased from the coast (9.4 µg m−3; 30.5 % of PM2.5) to the mountain station (11.6 µg m−3; 29.7 % of PM2.5), and the urban site had the highest concentration (12.1 µgm−3; 29.9 % of PM2.5) in PM2.5 among these stations. The SO concentration during the episode (Table 2) was more than twice that of the monthly mean (Table 1) in the Taichung area. This variation was due to the wind direction changing from southwesterly to northwesterly, resulting in a contribution increase from the upstream TPP and THI (Fig. 1c), which are the major sources in central Taiwan.
On 17 July 2018, Taichung city not only experienced high air pollutant concentrations but also a maximum air temperature as high as 35.4 ∘C. That is, a heat wave (Lin et al., 2017; Kueh et al., 2017) occurred on 17 July because of the subsidence of the typhoon circulation on the lee side of the mountain. The daily mean temperatures for the sampling sites between 15 and 17 July for SL, CSM, and ZS were 29.9, 30, and 29.4 ∘C, respectively. However, the monthly mean temperatures (July in 2017 and 2018) during the sampling period for SL, CSM, and ZS were 28.9, 28.8, and 26.5 ∘C, respectively. Thus, the daily mean temperature during the episode was 1–2 ∘C higher than is typical for days in July. In general, the mean wind speed on the episode days at these three sites was weaker (<1 m s−1) than the monthly mean (Tables 1 and 2). Such stable weather conditions, weak wind speed, and high air temperature were conducive to the generation and formation of a secondary aerosol. This is exemplified by the concentrations of other species, such as OC, NO, and NH, being considerably higher during the episode days (Table 2) compared with the monthly mean in Table 1. Notably, EC increased to a lesser extent than the other species. These results suggest that secondary aerosol plays a critical role under such stable weather conditions and wind direction. Because ambient wind changes during typhoon formation between Taiwan and Luzon island in the Philippines are not uncommon, the air quality impacts in such weather conditions merit further research. A detailed discussion of variations in aerosol chemical composition transformation will be presented in a separate paper.
Summer was the season with the lowest air pollution levels in Taiwan during 2004–2019. The monthly mean concentrations of PM10, PM2.5, and daytime ozone (08:00–17:00 LST) in summer (June–August) over central Taiwan are 35–40 µg m−3, 18–22 µg m−3, and 30–42 ppb, respectively. The contribution of OC to PM2.5 can exceed 30 % in urban and inland mountain sites. However, episodes of poor air quality frequently occur over the western plains when an easterly typhoon circulation interacts with the complex topographic structure in Taiwan. Under such a weather condition, concentrations of PM2.5 and ozone could be 2 times higher than the monthly mean. During the episode in this study, SO became the major contributor to PM2.5, and its concentrations and contribution proportions (%) in PM2.5 at coastal, urban, and mountain sites were 9.4 µg m−3 (30.5 %), 12.1 µg m−3 (29.9 %), and 11.6 µgm−3 (29.7 %), respectively.
To explore the mechanism of air pollution formation, we conducted a detailed data analysis and WRF-Chem model simulation of an episode of poor air quality associated with a typhoon event between 15 and 17 July 2018. Numerical modeling indicated that not only wind direction changes due to lee vortex but also land–sea breeze and boundary layer development were the key mechanisms in the transport of air pollutants. We summarize the key mechanisms and processes of the interaction between typhoon circulation, lee vortex, land–sea breeze, boundary layer development, and topography as well as their effects on air quality in Fig. 12.
-
First, typhoon circulations provided a strong easterly ambient flow. This easterly flow interacted with the CMR, resulting in a lee vortex formation over western Taiwan (Fig. 12, left panel).
-
During the nighttime, the offshore wind (land breeze) pushed the air pollutants from the mountain area to the plains and coastal areas. Concurrently, a clear lee vortex formation could be observed near Taiwan's coastal area in the Taiwan Strait, and thus a southerly flow in the western plains was enhanced. These processes resulted in trapped air pollutants over the Taichung area in western Taiwan. The boundary layer height was low because of ground surface radiation cooling and inversion layer formation. Therefore, the air pollution plumes remained separate at ground level coupled with the boundary residual layer being at a higher elevation (Fig. 12, top right panel).
-
In the morning, this residual layer with polluted air mass combined and contributed to the ground surface air concentration level because the boundary layer height increased. This also explains why the ozone and PM2.5 concentrations dramatically increased after the boundary layer development during the daytime. During the daytime, the lee vortex flow coupled with a sea breeze and combined with a mountain upslope wind resulted in the accumulation of air pollutants in the inland mountain area. The peak concentration at the inland mountain site occurred approximately 4–6 h later than at the upstream coastal site because of the sea breeze (Fig. 12, bottom right panel).
Software for maps and plots produced using the HYPERLINK http://cola.gmu.edu/grads/grads.php (Tsai and Doty, 1998) Graphic Analysis and Display System (GrADS) was developed at and supported by HYPERLINK http://cola.gmu.edu/ as well as COLA and George Mason U. (further information can be found at http://cola.gmu.edu/, last access: 18 March 2021).
The hourly historical Taiwan EPA air quality monitoring data can be found at https://data.epa.gov.tw/dataset/aqx_p_15 (The Environmental Protection Administration's environmental open data platform, 2020). The sampling data used in this study can be obtained upon request from the corresponding author. The sounding observations can be found in the Data Bank for Atmospheric and Hydrologic Research at https://dbar.pccu.edu.tw/ (Ministry of Science and Technology and Chinese Culture University, 2018).
CYL conceived the idea, performed critical revision of the paper for important intellectual content, and supervised the study. YFS and WCC performed the model simulations. Data analysis and results discussion were contributed by CYL, YFS, WCC, CCKC, YYC, and WMC. CYL prepared the paper with the contributions from all co-authors.
The authors declare that they have no conflict of interest.
Publisher's note: Copernicus Publications remains neutral with regard to jurisdictional claims in published maps and institutional affiliations.
The authors sincerely thank the National Center for High-Performance Computing (NCHC) for providing computational and storage resources.
This research has been supported by the Ministry of Science and Technology, Taiwan (grant nos. 109-2111-M-001-004 and 108-2111-M-001-002).
This paper was edited by Stefano Galmarini and reviewed by two anonymous referees.
Ackermann, I. J., Hass, H., Memmsheimer, M., Ebel, A., Binkowski, F. S., and Shankar, U.: Modal aerosol dynamics model for Europe: development and first applications, Atmos. Environ., 32, 2981–2999, https://doi.org/10.1016/S1352-2310(98)00006-5, 1998.
Ahmadov, R., McKeen, S. A., Robinson, A. L., Bahreini, R., Middlebrook, A. M., de Gouw, J. A., Meagher, J., Hsie, E.- Y. Edgerton, E., Shaw, S., and Trainer, M.: A volatility basis set model for summertime secondary organic aerosols over the eastern United States in 2006, J. Geophys. Res., 117, D06301, https://doi.org/10.1029/2011JD016831, 2012.
Chang, L. T.-C., Tsai, J.-H., Lin, J.-M., Huang, Y.-S., and Chiang, H.-L.: Particulate matter and gaseous pollutants during a tropical storm and air pollution episode in Southern Taiwan, Atmos. Res., 99, 67–79, https://doi.org/10.1016/j.atmosres.2010.09.002, 2011.
Cheng, M. T., Horng, C. L., Su, Y. R., Lin, L. K., Lin, Y. C., and Chou, C. C.-K.: Particulate matter characteristics during agricultural waste burning in Taichung City, Taiwan, J. Hazard. Mater., 165, 187–192, https://doi.org/10.1016/j.jhazmat.2008.09.101, 2009.
Cheng, W. L., Lai, L. W., Den, W., Wu, M. T., Hsueh, C. A., Lin, P. L., Pai, C. L., and Yan, Y. L.: The relationship between typhoons' peripheral circulation and ground-level ozone concentrations in central Taiwan, Environ. Monit. Assess., 186, 791– 804, https://doi.org/10.1007/s10661-013-3417-7, 2014.
Chou, C. C.-K., Lee, C. T., Yuan, C. S., Hsu, W. C., Lin, C. Y., Hsu, S. C., and Liu, S. C.: Implications of the chemical transformation of Asian outflow aerosols for the long-range transport of inorganic nitrogen species. Atmos. Environ., 42, 7508–7519, https://doi.org/10.1016/j.atmosenv.2008.05.049, 2008.
Chow, E. C. H., Li, R. C. Y., and Zhou, W.: Influence of tropical cyclones on Hong Kong air quality, Adv. Atmos. Sci., 35, 1177–1188, https://doi.org/10.1007/s00376-018-7225-4, 2018.
Deng, T., Wang, T., Wang, S., Zou, Y., Yin, C., Li, F., Liu, L., Wang, N., Song, L., Wu, C., and Wu, D.: Impact of typhoon periphery on high ozone and high aerosol pollution in the Pearl River Delta region, Sci. Total Environ., 668, 617–630, https://doi.org/10.1016/j.scitotenv.2019.02.450, 2019.
Ding, A. J., Wang, T., Zhao, M., Wang, T. J., and Li, Z. K.: Simulation of sea-land breezes and a discussion of their implications on the transport of air pollution during a multiday ozone episode in the Pearl River Delta of China, Atmos. Environ., 38, 6737–6750, https://doi.org/10.1016/j.atmosenv.2004.09.017, 2004.
Fang, G. C., Lin, S. J., Chang, S. Y., and Chou, C. C.-K.: Effect of typhoon on atmospheric particulates in autumn in central Taiwan, Atmos. Environ., 43, 6039–6048, https://doi.org/10.1016/j.atmosenv.2009.08.033, 2009.
Grell, G. A., Peckham, S. E., Schmitz, R., McKeen, S. A., Frost, G., Skamarock, W. C., and Eder, B.: Fully coupled “online” chemistry within the WRF model, Atmos. Environ., 39, 6957–6975, https://doi.org/10.1016/j.atmosenv.2005.04.027, 2005.
Hsu, C. H. and Cheng, F. Y.: Synoptic Weather Patterns and Associated Air Pollution in Taiwan, Aerosol Air Qual. Res., 19, 1139–1151, https://doi.org/10.4209/aaqr.2018.09.0348, 2019.
Huang, J. P., Fung, J. C. H., Lau, A. K. H., and Qin, Y.: Numerical simulation and process analysis of typhoon-related ozone episodes in Hong Kong, J. Geophys. Res., 101, D05301, https://doi.org/10.1029/2004JD004914, 2005.
Huang, J. P., Fung, J. C. H., and Lau, A. K. H.: Integrated processes analysis and systematic meteorological classification of ozone episodes in Hong Kong, J. Geophys. Res., 111, D20309, https://doi.org/10.1029/2005JD007012, 2006.
Huang, T., Yang, Y., O'Connor, E. J., Lolli, S., Haywood, J., Osborne, M., Cheng, J. C.-H., Guo, J., and Yim, S. H.-L.: Influence of a weak typhoon on the vertical distribution of air pollution in Hong Kong: A perspective from a Doppler LiDAR network, Environ. Pollut., 276, 116534, https://doi.org/10.1016/j.envpol.2021.116534, 2021.
Hunt, C. R. and Snyder, W. H.: Experiments on stably and neutrally stratified flow over a model three-dimensional hill, J. Fluid Mech., 96, 671–704, https://https://doi.org/10.1017/S0022112080002303, 1980.
Jiang, Y. C., Zhao, T. L., Liu, J., Xu, X. D., Tan, C. H., Cheng, X. H., Bi, X. Y., Gan, J. B., You, J. F., and Zhao, S. Z.: Why does surface ozone peak before a typhoon landing in southeast China?, Atmos. Chem. Phys., 15, 13331–13338, https://doi.org/10.5194/acp-15-13331-2015, 2015.
Jury M. R. and Tosen G. R. Characteristics of the winter boundary layer over the African Plateau: 26∘ S, Bound.-Layer Meteorol., 49, 53–76, https://doi.org/10.1007/BF00116405, 2004.
Kueh, M. T., Lin, C. Y., Chuang, Y. J., Sheng, Y. F., and Chien, Y. Y.: Climate variability of heat waves and their associated diurnal temperature range variations in Taiwan, Environ. Res. Lett., 12, 074017, https://doi.org/10.1088/1748-9326/aa70d9, 2017.
Lai, H. C. and Lin, M. C.: Characteristics of the upstream flow patterns during PM2.5 pollution events over a complex island topography, Atmos. Environ, 227, 117418, https://doi.org/10.1016/j.atmosenv.2020.117418, 2020.
Lam, Y. F., Cheung, H. M., and Ying, C. C.: Impact of tropical cyclone track change on regional air quality, Sci. Total Environ., 610–611, 1347–1355, https://doi.org/10.1016/j.scitotenv.2017.08.100, 2018.
Lee, C. S. L., Chou, C. C.-K., Cheung, H. C., Tsai, C.-Y., Huang, W.-R., Huang, S.-H., Chen, M.-J., Liao, H.-T., Wu, C.-F., Tsao, T.-M., Tsai, M.-J., and Su, T.-C.: Seasonal variation of chemical characteristics of fine particulate matter at a high-elevation subtropical forest in East Asia, Environ. Pollut., 246, 668–677, https://doi.org/10.1016/j.envpol.2018.11.033, 2019.
Lee, Y. C., Calori, G., Hills, P., and Carmichael, G. R.: Ozone episodes in urban Hong Kong 1994–1999, Atmos. Environ., 36, 1957–1968, https://doi.org/10.1016/S1352-2310(02)00150-4, 2002.
Li, J. and Chen, Y.-L.: Barrier jets during TAMEX, Mon. Weather Rev., 126, 959–971, https://doi.org/10.1175/1520-0493(1998)126<0959:BJDT>2.0.CO;2, 1998.
Lin, C. Y. and Chen, C. S.: A study of orographic effects on mountain-generated precipitation systems under weak synoptic forcing, Meteorol. Atmos. Phys., 81, 1–25, https://doi.org/10.1007/s007030200028, 2002.
Lin, C.-Y., Liu, S. C., Chou, C. C.-K., Liu, T. H., Lee, C.-T., Yuan, C.-S., Shiu, C.-J., and Young, C.-Y.: Long-Range Transport of Asian Dust and Air Pollutants to Taiwan, Terr. Atmos. Ocean. Sci., 15, 759–784, https://doi.org/10.3319/TAO.2004.15.5.759(ADSE), 2004.
Lin, C.-Y., Liu, S. C., Chou, C. C.-K., Huang, S.-J., Liu, C.-M., Kuo, C.-H., and Young C.-Y.: Long-range transport of aerosols and their impact on the air quality of Taiwan, Atmos. Environ., 39, 6066–6076, https://doi.org/10.1016/j.atmosenv.2005.06.046, 2005.
Lin, C. Y., Wang, Z., Chou, C. C.-K., Chang, C.-C., and Liu, S. C.: A numerical study of an autumn high ozone episode over southwestern Taiwan, Atmos. Environ., 41, 3684–3701, https://doi.org/10.1016/j.atmosenv.2006.12.050, 2007.
Lin, C.-Y., Hsu, H.-m., Sheng, Y.-F., Kuo, C.-H., and Liou, Y.-A.: Mesoscale processes for super heavy rainfall of Typhoon Morakot (2009) over Southern Taiwan, Atmos. Chem. Phys., 11, 345–361, https://doi.org/10.5194/acp-11-345-2011, 2011.
Lin, C.-Y., Sheng, Y.-F., Chen, W.-N., Wang, Z., Kuo, C.-H., Chen, W.-C., and Yang, T.: The impact of channel effect on Asian dust transport dynamics: a case in southeastern Asia, Atmos. Chem. Phys., 12, 271–285, https://doi.org/10.5194/acp-12-271-2012, 2012a.
Lin, C. Y., Chou, C. C. K, Wang, Z., Lung, S. C., Lee, C. T., Yuan, C. S., Chen, W. N., Chang, S. Y., Hsu, S. C., Chen, W. C., and Liu, S. C.: Impact of different transport mechanisms of Asian dust and anthropogenic pollutants to Taiwan, Atmos. Environ., 60, 403–418, https://doi.org/10.1016/j.atmosenv.2012.06.049, 2012b.
Lin, C. Y., Chien, Y. Y., Su, C. J., Kueh, M. T., and Lung, S. C.: Climate variability of heat wave and projection of warming scenario in Taiwan, Clim. Chang., 145, 305–320, https://doi.org/10.1007/s10584-017-2091-0, 2017.
Lin, Y.-L.: Orographic effects on airflow and Mesoscale weather system over Taiwan, Terr. Atmos. Ocean. Sci., 4, 381–420, 1993.
Lu, R. and Turco, R. P.: Air pollutant transport in a coastal environment. II: Three-dimensional simulations over Los Angeles Basin, Atmos. Environ., 29, 1499–1518, https://doi.org/10.1016/1352-2310(95)00015-Q, 1995.
Luo, M., Hou, X., Gu, Y., Lau, N.-C., and Yim, S. H.-L.: Trans-boundary air pollution in a city under various atmospheric conditions, Sci. Total Environ., 618, 132–141, https://doi.org/10.1016/j.scitotenv.2017.11.001, 2018.
Ministry of Science and Technology and Chinese Culture University: Sounding observations, available at: https://dbar.pccu.edu.tw/, 2018.
Ning, G., Yim, S. H. L, Wang, S., Duan, B., Nie, C., Yang, X., Wang, J., and Shang, K.: Synergistic effects of synoptic weather patterns and topography on air quality: a case of the Sichuan Basin of China, Clim. Dyn., 53, 6729–6744, https://doi.org/10.1007/s00382-019-04954-3, 2019.
Pitts, O. and Lyons, T. J.: The influence of topography on Perth radiosonde observations, Aust. Meteorol. Mag., 36, 17–23, 1988.
Shu, L., Xie, M., Wang, T., Gao, D., Chen, P., Han, Y., Li, S., Zhuang, B., and Li, M.: Integrated studies of a regional ozone pollution synthetically affected by subtropical high and typhoon system in the Yangtze River Delta region, China, Atmos. Chem. Phys., 16, 15801–15819, https://doi.org/10.5194/acp-16-15801-2016, 2016.
Smolarkiewicz, K. S. and Rotunno, R.: Low Froude number flow past three-diemsnsional obstacles. Part I: baroclinically generated lee vortices, J. Atmos. Sci., 46, 1154–1164, https://doi.org/10.1175/1520-0469(1989)046%3C1154:LFNFPT%3E2.0.CO;2, 1989.
Stockwell, W. R., Middleton, P., Chang, J. S., and Tang, X.: The second generation regional acid deposition model chemical mechanism for regional air quality modeling, J. Geophys. Res., 95, 16343–16367, https://doi.org/10.1029/JD095iD10p16343, 1990.
The Environmental Protection Administration's environmental open data platform: Hourly historical Taiwan EPA air quality monitoring data, available at: https://data.epa.gov.tw/dataset/aqx_p_15 (last access: 18 March 2021), 2020.
Theurer W.: Typical building arrangements for urban pollution modelling. Atmos. Environ., 33, 4057–4066, https://doi.org/10.1016/S1352-2310(99)00147-8, 1999.
Tsai, P. and Doty, B. E.: A Prototype Java Interface for the Grid Analysis and Display System (GrADS), Fourteenth International Conference on Interactive Information and Processing Systems, Phoenix, AZ, 11–16 January 1998.
Tu, J. Y. and Chen, J. M.: Large-scale indices for assessing typhoon activity around Taiwan, Int. J. Climatol., 39, 921–933, https://doi.org/10.1002/joc.5852, 2019.
Valverde, V., Pay, M. T., and Baldasano, J. M.: A model-based analysis of SO2 and NO2 dynamics from coal-fired power plants under representative synoptic circulation types over the Iberian Peninsula, Sci. Total Environ., 541, 701–713, https://doi.org/10.1016/j.scitotenv.2015.09.111, 2016.
Wallace, J., Corr, D., and Kanaroglou, P.: Topographic and spatial impacts of temperature inversions on air quality using mobile air pollution surveys, Sci. Total Environ., 408, 5086–5096, https://doi.org/10.1016/j.scitotenv.2010.06.020, 2010.
Wei, X., Lam, K.-S., Cao, C., Li, H., and He, J.: Dynamics of the Typhoon Haitang related high ozone episode over Hong Kong, Adv. Meteorol., 2016, 6089154, https://doi.org/10.1155/2016/6089154, 2016.
Yan, J., Chen, L., Lin, Q., Zhao, S., and Zhang, M.: Effect of typhoon on atmospheric aerosol particle pollutants accumulation over Xiamen, China, Chemosphere, 159, 244–255, https://doi.org/10.1016/j.chemosphere.2016.06.006, 2016.
Yang, J. X., Lau, A. K. H., Fung, J. C. H., Zhou, W., and Wenig, M.: An air pollution episode and its formation mechanism during the tropical cyclone Nuri's landfall in a coastal city of south China, Atmos. Environ., 54, 746–753, https://doi.org/10.1016/j.atmosenv.2011.12.023, 2012.
Zhang, X., Liu, Y., Deng, X., Chen, P., Feng, Y., and Fan, Q.: Analysis of Summertime Typical Pollution in Pearl River Delta Region-Numerical Simulation of Meteorological Field, Meteorol. Environ. Res., 59, 9–18, 2014.
Zhang, Y., Mao, H. T., Ding, A. J., Zhou, D. R., and Fu, C. B.: Impact of synoptic weather patterns on spatio-temporal variation in surface O3 levels in Hong Kong during 1999–2011, Atmos. Environ., 73, 41–50, https://doi.org/10.1016/j.atmosenv.2013.02.047, 2013.