the Creative Commons Attribution 4.0 License.
the Creative Commons Attribution 4.0 License.
 | 18 Nov 2021
Measurement report: Comparison of airborne, in situ measured, lidar-based, and modeled aerosol optical properties in the central European background – identifying sources of deviations
Sebastian Düsing
Albert Ansmann
Holger Baars
Joel C. Corbin
Cyrielle Denjean
Martin Gysel-Beer
Thomas Müller
Laurent Poulain
Holger Siebert
Gerald Spindler
Thomas Tuch
Birgit Wehner
Alfred Wiedensohler
A unique data set derived from remote sensing, airborne, and ground-based in situ measurements is presented. This measurement report highlights the known complexity of comparing multiple aerosol optical parameters examined with different approaches considering different states of humidification and atmospheric aerosol concentrations. Mie-theory-based modeled aerosol optical properties are compared with the respective results of airborne and ground-based in situ measurements and remote sensing (lidar and photometer) performed at the rural central European observatory at Melpitz, Germany. Calculated extinction-to-backscatter ratios (lidar ratios) were in the range of previously reported values. However, the lidar ratio is a function of the aerosol type and the relative humidity. The particle lidar ratio (LR) dependence on relative humidity was quantified and followed the trend found in previous studies. We present a fit function for the lidar wavelengths of 355, 532, and 1064 nm with an underlying equation of fLR(RH, , with the derived estimates of γ(355 nm) = 0.29 (±0.01), γ(532 nm) = 0.48 (±0.01), and γ(1064 nm) = 0.31 (±0.01) for central European aerosol. This parameterization might be used in the data analysis of elastic-backscatter lidar observations or lidar-ratio-based aerosol typing efforts. Our study shows that the used aerosol model could reproduce the in situ measurements of the aerosol particle light extinction coefficients (measured at dry conditions) within 13 %. Although the model reproduced the in situ measured aerosol particle light absorption coefficients within a reasonable range, we identified many sources for significant uncertainties in the simulations, such as the unknown aerosol mixing state, brown carbon (organic material) fraction, and the unknown aerosol mixing state wavelength-dependent refractive index. The modeled ambient-state aerosol particle light extinction and backscatter coefficients were smaller than the measured ones. However, depending on the prevailing aerosol conditions, an overlap of the uncertainty ranges of both approaches was achieved.
- Article
(3914 KB) - Full-text XML
-
Supplement
(1814 KB) - BibTeX
- EndNote


Aerosol particles can sensitively influence the Earth's radiation budget by scattering and absorption of solar radiation. The aerosol impact is described as utilizing the wavelength-dependent aerosol particle scattering coefficient (σsca(λ)) and particle absorption coefficient (σabs(λ)), as well as the sum of both, denoted as particle extinction coefficient (σext(λ)). In situ aerosol measurements with unmanned aerial vehicles (UAV; Altstädter et al., 2018), helicopter-borne payloads, e.g., with the Airborne Cloud Turbulence Observations System (ACTOS; e.g., Siebert et al., 2006; Ditas et al., 2012; Wehner et al., 2015; Düsing et al., 2018), tethered-balloon payloads (e.g., Ferrero et al., 2019; Brunamonti et al., 2021), and zeppelins (e.g., Rosati et al., 2016b) are important experimental approaches to provide vertically resolved insight into the relationship between aerosol microphysical properties, chemical composition, optical properties, and related radiative effects. Remote sensing techniques such as light detection and ranging (lidar) allow the profiling of aerosol optical properties with a high vertical and temporal resolution in a complementary way (Weitkamp, 2005). All these different experimental approaches are needed to improve our knowledge about the role of aerosols in the climate system and, at the same time, to reduce the uncertainties in the applied aerosol observations. Direct in situ aerosol measurements are helpful to validate remote sensing techniques and vice versa. Lidar-based aerosol particle light backscatter coefficient (σbsc(λ)) profiles have been compared with balloon-borne in situ measurements (Brunamonti et al., 2021) and Mie modeling results (Ferrero et al., 2019). However, the airborne in situ aerosol measurements provide the vertically resolved aerosol information (Rosati et al., 2016b; Düsing et al., 2018; Tian et al., 2020), usually in a dried state. Lidar, on the other hand, monitors the aerosol under ambient conditions. Therefore, the effect of the relative humidity (RH) must be considered when comparing in situ measurements and modeling approaches with remote sensing retrievals. Lidar systems have been previously utilized to investigate hygroscopic processes (e.g., Zhao et al., 2017; Navas-Guzmán et al., 2019; Dawson et al., 2020). Modeling aerosol optical properties can also account for the ambient state of the aerosol by simulating the hygroscopic growth of the aerosol particles utilizing, e.g., the semi-empirical parameterization of Petters and Kreidenweis (2007). Also, they can be used for the validation of lidar-based retrievals of, e.g., the absorption.
However, modeling, remote sensing, and in situ measurements are subject to individual uncertainties that must be considered to compare these approaches. Raman lidar systems, for instance, such as the PollyXT lidar (Engelmann et al., 2016), can measure the aerosol particle light extinction and backscattering coefficients at several wavelengths λ throughout the entire troposphere but only during nighttime hours. The standard backscatter lidar technique is applied to derive aerosol backscatter and extinction height profiles in the daytime. The required estimates for the unknown extinction-to-backscatter ratio, also lidar ratio (including its wavelength dependence; LR(λ)), can introduce large uncertainties in the obtained spectral particle backscatter and extinction profiles. Note that LR(λ) is a function of the wavelength of incoming light, the shape of the aerosol particles, the aerosol particle number size distribution (PNSD), and aerosol chemical composition. LR(λ) estimates during daytime have been derived via a combination of direct lidar σbsc(λ) and columnar sun photometer measurements (Guerrero-Rascado et al., 2011). A sun photometer measures the columnar integral of σext(λ), which is the aerosol optical depth (AOD). An effective columnar LR(λ) can then be estimated by minimizing the difference between measured AOD and the integrated lidar-based σext(λ) derived with an assumed, best matching LR(λ). When the Klett–Fernald method (Klett, 1981; Fernald et al., 1972) is used to derive σext(λ) and σbsc(λ) with lidar, the LR(λ) is kept height constant, and this assumption introduces significant uncertainties because the lidar ratio varies with height, i.e., with changing aerosol layering and aerosol type conditions (Guerrero-Rascado et al., 2011).
Previous studies have focused on the dependence of σext(λ) on ambient RH (Skupin et al., 2016; Zieger et al., 2011). Navas-Guzmán et al. (2019) utilized these effects to investigate the aerosol hygroscopicity with lidar. LR(λ) is based on the RH-dependent σbsc(λ) and σext(λ), and calculations by Sugimoto et al. (2015) indicated that LR(λ) is RH dependent as well. Ackermann (1998) provided a numerical study based on pre-defined aerosol types with distinct size distribution shapes to establish a power series to describe the LR(λ) as a function of RH. Salemink et al. (1984) found a linear relationship between the LR(λ) and the RH. Also, Ruangrungrote and Limsuwan (2012) observed a dependence of the LR to RH. Intensively discussed is the lidar ratio (LR) enhancement due to hygroscopic growth in Zhao et al. (2017). They reported a positive relationship between LR and RH, but their study lacks information on vertically resolved aerosol particle number size distributions and other wavelengths. However, their simulations have shown that utilizing RH-dependent LR to retrieve aerosol particle light extinction from elastic backscatter lidar signals results in significantly different values than the constant LR approach. The studies above have shown an inconclusive dependence of the LR(λ) on the RH and corroborate that further research is needed, e.g., a quantification based on vertically resolved in situ measurements. On the other hand, modeling is based on many aerosol input parameters regarding particle size distribution and chemical composition as a function of height, which is usually not available in the required density, e.g., because of airborne platform and payload limitations. Details are illuminated in the article.
We present two field experiments conducted in June 2015 and winter 2017 at the regional central European background measurement facility at Melpitz, about 50 km northeast of Leipzig in eastern Germany. In both field studies, ground-based and airborne in situ aerosol measurements, and accompanying remote sensing, were performed as measurements were performed during various atmospheric and aerosol conditions.
This study has three goals. Of central importance is the comparison of σbsc(λ) and σext(λ) profiles obtained with lidar with individual modeling results based on airborne in situ aerosol measurements. In this context, we want to highlight the challenges that have to be faced when instrumental limitations regarding airborne payloads do not determine the complete set of physicochemical aerosol properties. The second goal deals with the dependence of the lidar ratio on relative humidity. The humidity-related LR enhancement at the three lidar wavelengths of 355, 532, and 1064 nm is modeled with input from the in situ aerosol measurements. Finally, the study evaluates the ability of the Mie model to reproduce measured σabs(λ) values at different wavelengths. The goal is to provide a tool for the validation of lidar–photometer-retrieved σabs(λ) estimates, as Tsekeri et al. (2018) show. The presented study, which includes modeling of σbsc(λ), σext(λ), and σabs(λ) in the ambient and dried state, based on ground-based and vertically resolved in situ measurements of aerosol properties as well as remote sensing with state-of-the-art photometers and multiwavelength aerosol lidar, is unique in its complexity.
The study is structured as follows. First, a general overview of the methodology is presented. Subsequently, the measurement site and the deployed instrumentation are described. Afterward, the comparison of Mie modeled with the measured aerosol optical properties is presented and discussed separately for the summer and winter field observations. Meteorological and aerosol conditions and Mie model validation efforts are presented in the Supplement. The quantification of the RH-induced lidar ratio enhancement is discussed for the summer case. Finally, a summary and concluding remarks are given.
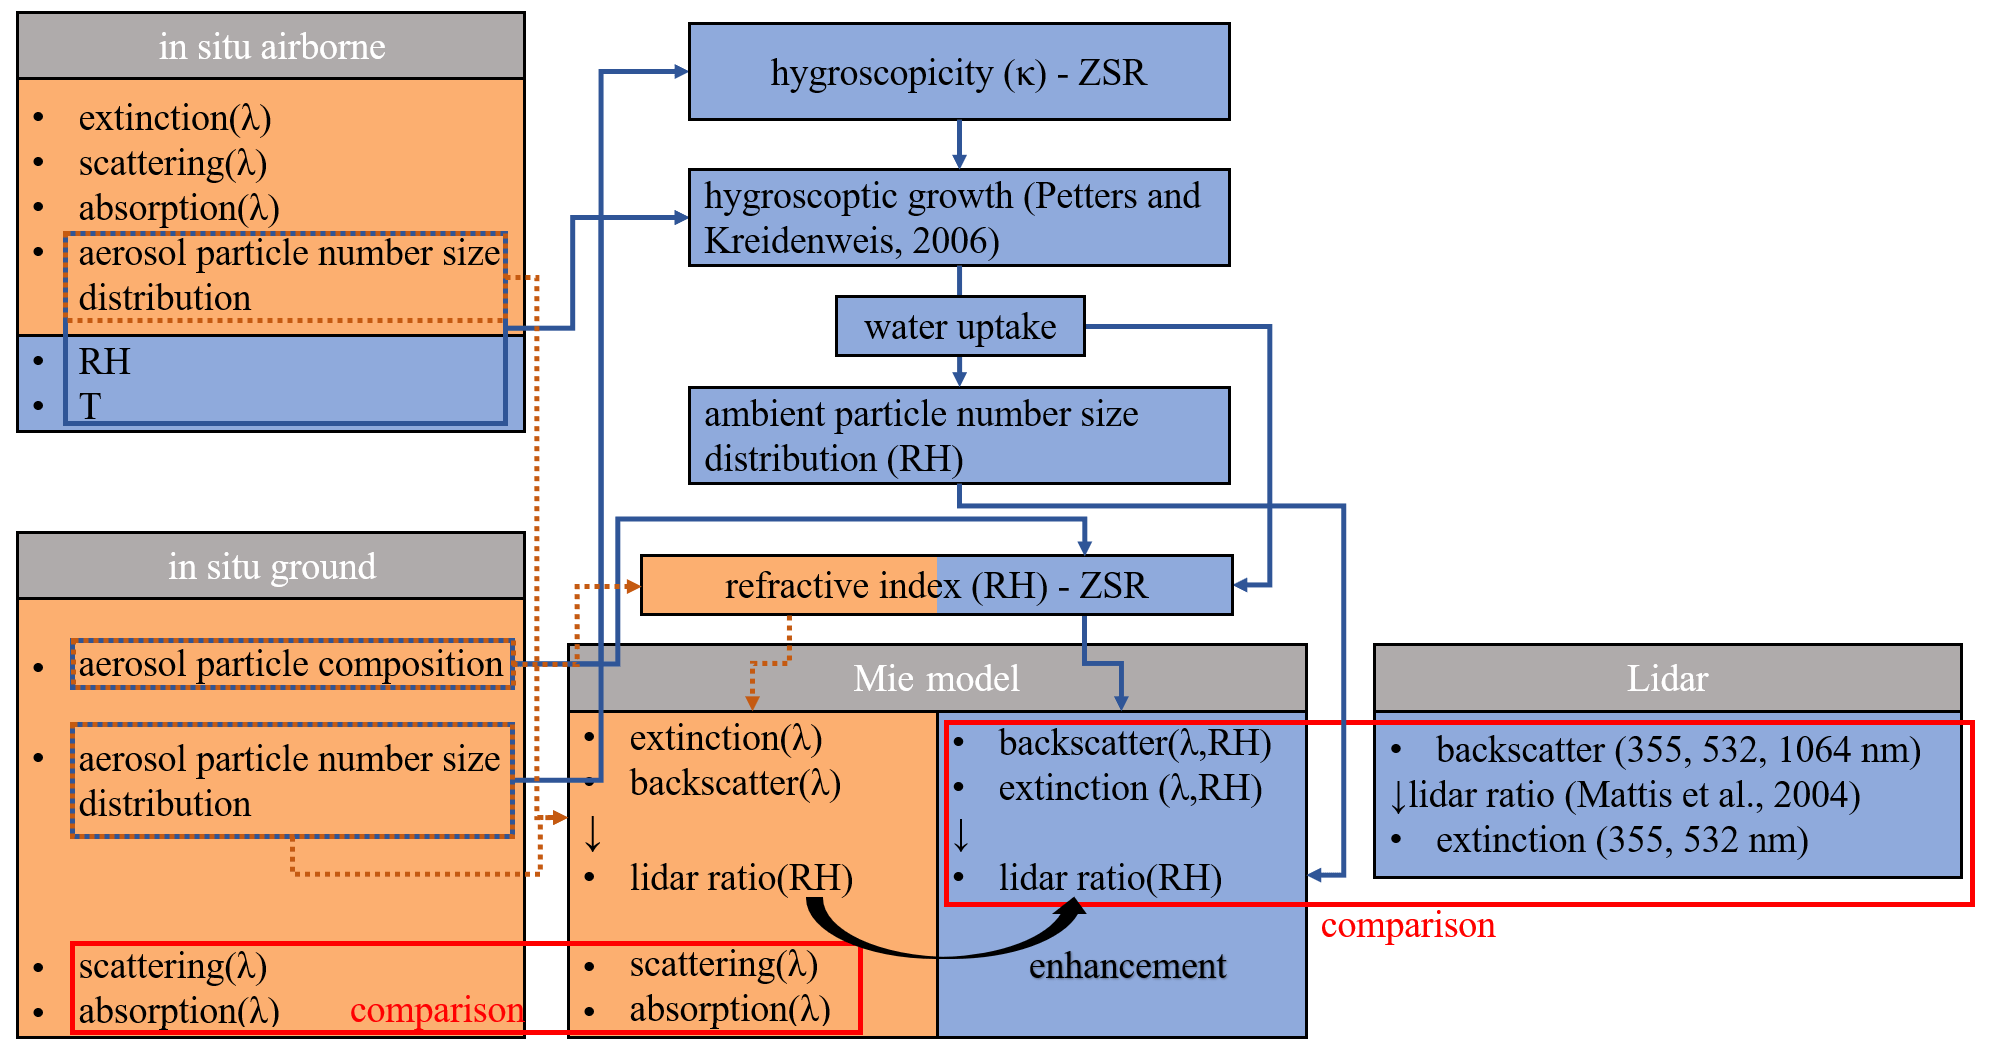
Figure 1Flowchart of the methodology. Orange shaded areas represent the comparison in the dried aerosol state; blue shaded areas represent the pathway for the ambient state.
The aerosol optical properties are calculated following the flowchart displayed in Fig. 1. A model utilizing Mie's theory (Mie, 1908) allows the calculation of the optical properties of aerosol particles under the assumption that these particles are spherical. The Mie model applied here fulfilled three main tasks. First, it is tested to what extent it can reproduce measured σabs(λ) with the given constraints. Second, it is compared to lidar-based σbsc(λ) and σext(λ) based on airborne in situ measurements accounting the ambient RH. Third, it derives LR(λ) at ambient aerosol conditions to examine the LR–RH dependence.
For both campaigns, an adapted Mie model, written in Python (package PyMieSca v1.7.5; Sumlin et al., 2018), simulates the aerosol optical properties, including, in particular, σbsc(λ), σext(λ), σsca(λ), and σabs(λ) for eight different wavelengths. From σbsc(λ) and σext(λ), the Mie-based LR(λ) (LRMie(λ)) is derived. For slightly non-spherical particles, Mie theory is still applicable to particles with a size parameter of less than 5; for particles with a larger x, Mie theory results in a smaller LR(λ) than the slightly non-spherical particles would have (Pinnick et al., 1976). At 355 nm, for instance, Mie theory would underestimate the LR(λ) already for a non-spherical particle with a diameter larger than 570 nm; the corresponding thresholds for 532 and 1064 nm are 850 and 1700 nm. Also, giant particles, usually non-spherical, result in a larger LR(λ) than that calculated with Mie theory.
The Mie model requires the following three major input parameters: (a) the aerosol particle number size distribution, which was measured on board of the airborne payloads or at ground level in Melpitz, (b) the mixing state of the aerosol particles, and (c) the aerosol particle complex refractive index, which is estimated by the chemical composition measurements on the ground. The model contains a module to derive aerosol optical properties in the dried and ambient state. For ambient state calculations, the model solves the semi-empirical parameterization of Petters and Kreidenweis (2007) to simulate the hygroscopic growth of the aerosol particles and, therefore, needs additional information about the ambient RH and T, as well as the aerosol hygroscopicity derived with the chemical composition measurements introduced in Sect. 3.1.1. This results in the ambient state PNSD and the humidified complex aerosol refractive index.
Regarding the mixing state of the aerosol, the following three different approaches are considered in the scientific community: (1) external mixture, in which each compound is presented by its PNSD, (2) internally homogeneous mixture, with homogeneously mixed aerosol compounds within the aerosol particles, and (3) the internal core shell mixture, in which a core of a specific compound, like sea salt or light-absorbing carbon, is surrounded by a shell of, e.g., organics or inorganic salts. For internally mixed aerosols, Ma et al. (2012) have shown that the core shell mixing model for the aged aerosol conditions at Melpitz usually better represents the internally mixed approaches to estimate the aerosol optical properties. Rose et al. (2006) have shown that the number fraction of externally mixed soot aerosol particles at 80 nm diameter is relatively low in Melpitz, indicating most internally mixed aerosol particles at this size range. The study of Yuan et al. (2021), conducted at Melpitz observatory, has shown coating the thicknesses of several tens of nanometers of BC cores, with a diameter of about 200 nm estimated for February 2017. Based on these findings, the core shell internal mixture model was utilized in this study to calculate the aerosol optical properties for both campaigns. We assume that the aerosol particles consist of a water-insoluble core of light-absorbing carbon and a shell of water-soluble, non-absorbing material. However, it must be mentioned that, in general, the mixing of aerosol particles is somewhat complex, and a more sophisticated approach would be to consider mixtures of aerosol particle populations. For instance, a mixture could be a combination of homogeneously mixed aerosol particles containing no BC and aerosol particles containing a light-absorbing BC core surrounded by a shell of inorganic salts, organic material, or something else. However, the number fraction of both populations would remain unclear.
This mixing approach requires the determination of the aerosol particle core and shell size and their corresponding complex refractive index. The aerosol particle core diameter Dc is calculated with the following:
where fv,eBC is the volume fraction of equivalent black carbon (eBC) and is assumed to be constant over the entire size range. The volume fraction of the eBC particles is estimated as described in the Sect. 3.1.1.
Regarding the complex refractive index of the aerosol particles, following Ma et al. (2014) and references therein, the complex refractive index of water-soluble compounds is set to , with a 0.5 % uncertainty of the real part and 0 % of the imaginary part, respectively. The water-insoluble light-absorbing (eBC) compounds are estimated to have a wavelength-independent complex refractive index of 1.75+0.55i, with a 4 % and 6.6 % uncertainty, respectively. This approach leads to inaccuracies, especially for calculating σabs(λ), since the complex aerosol refractive index depends on the wavelength. Bond and Bergstrom (2006), e.g., recommended a complex refractive index of black carbon (BC) at 550 nm of 1.95+0.79i at 550 nm, whereas Moteki et al. (2010) reported values of 2.26+1.26i at 1064 nm.
Also, only BC is considered, whereas brown carbon (BrC), usually organic material, and, hence, part of the particle shell, was not. However, BrC is especially effective in light absorption at smaller wavelengths, whereas the contribution of BC to σabs(λ) decreases towards smaller wavelengths. A brief discussion of the spectrally resolved Mie-based σabs(λ) follows in Sect. 4.2.1.
Hale and Querry (1973) provided the complex refractive index of water (liquid; 25 ∘C). Following this publication, the mean (± standard deviation) of the real part of the complex refractive index of water is 1.33 (±0.0043) in the range from 0.3 to 1.0 µm wavelength. The imaginary part is negligibly small () in this wavelength range. Hence, the complex refractive index of water is set to 1.33+0i, with an assumed real part uncertainty of 0.5 %. At an ambient state, the complex refractive index of the aerosol particle shell is derived based on the volume-weighted Zdanovskii, Stokes, and Robinson (ZSR; Zdanovskii, 1948; Stokes and Robinson, 1966) mixing rule of the complex refractive index of the water-soluble components and the additionally added water. Although the sampled aerosol was dried, it always contained a small amount of residual water, which is negligible for the hygroscopic growth calculations. In the Mie model, each estimate of the aerosol optical properties is derived with a Monte Carlo approach with n=50 runs. Before each run, the input parameters are varied according to their uncertainty with a Gaussian normal distribution. A uniform distribution is used when the Gaussian normal distribution creates physically unreasonable input parameters, e.g., a negative volume fraction of eBC or negative ambient RH. Table A2 summarizes the input parameters of the Mie model with the uncertainties and the underlying distribution for the variation within the Monte Carlo approach.
The quality of the underlying assumptions is checked by means of correlation of the in situ measured and modeled aerosol optical coefficients in the dry state, and details are provided in the Supplement (Figs. S4 and S5). Mie modeling and in situ measurements agree within 18 %, implying that the model constraints provide a good representation of the real aerosol properties, at least in the dried state.
The data assembled during two campaigns near Melpitz, Saxony, Germany, are examined in this study. The first campaign, named the Melpitz column or MelCol summer, is, unless otherwise stated, ongoing and referred to as the summer campaign, was conducted in May and June 2015 with an intensive measurement period including ground-based and air-borne in situ measurements between 13 and 28 June. The second campaign, MelCol winter, took place in February and March 2017 and, thus, is referred to as the winter campaign in the remainder of this paper. The upcoming sections overview the conducted experiments, introduce the Melpitz observatory with its characteristic features, and provide an overview of the applied instrumentation on the ground and the air.
3.1 Melpitz observatory
Both campaigns took place at the central European background station at Melpitz, Saxony, Germany. Melpitz observatory (51∘31′ N, 12∘55′ E; 84 m a.s.l.) is located in eastern Germany in a rural, agriculturally used area 44 km northeast of Leipzig. About 400 km to the north is the Baltic Sea, and about 1000 km to the west is the Atlantic Ocean. Detailed information about Melpitz observatory is given in Spindler et al. (2010, 2013). As part of various measurement networks, such as GUAN (German Ultrafine Aerosol Network; Birmili et al., 2016), ACTRIS (Aerosols, Clouds, and Trace gases Research Infrastructure), and GAW (Global Atmosphere Watch), and the measurement facility LACROS (Leipzig Aerosol and Cloud Remote Observations System; Bühl et al., 2013), Melpitz observatory comprises comprehensive instrumentation in quasi-continuous operation, for high-quality, long-term observations, and can be adapted to various needs as required. An overview of the continuously operating instrumentation is presented in the following. Details about specific instrumentation additionally added during the campaigns will be given within respective subsections.
3.1.1 Ground in situ instrumentation
In both campaigns, the PNSD was measured by a combination of a dual mobility particle size spectrometer (D-MPSS; TROPOS type; Birmili et al., 1999) with 10 % accuracy and an aerodynamic particle size spectrometer (APSS; model no. 3321; TSI Incorporated, Shoreview, MN, USA) with 10 % to 30 % uncertainty, depending on the size range (Pfeifer et al., 2016).
A D-MPSS consists of a bipolar diffusion charger, two differential mobility analyzers (DMA; Knutson and Whitby, 1975), and two condensation particle counters (CPCs; i.e., model no. 3010 and model no. 3776, for an ultrafine condensation particle counter (UCPC); TSI Incorporated, Shoreview, MN, USA). The bipolar charger transforms the aerosol into a well-defined charge equilibrium, according to Fuchs (1963) and Wiedensohler et al. (1988). The TROPOS-type DMAs select the charged aerosol particles concerning their electrical mobility, and the CPC then counts their number concentration. Overall, this setup covers an aerosol particle size range of 3–800 nm in mobility diameter (Dm). The PNSD is available every 20 min, and the scan duration is 10 min. The final D-MPSS PNSD used in this study is derived utilizing an inversion routine (Pfeifer et al., 2014) accounting for multiple charged aerosol particles, including a diffusion loss correction based on the method of “equivalent pipe length” (Wiedensohler et al., 2012).
For the calculation of the optical properties with the Mie theory, spherical particles must be assumed. Therefore, we assume that all aerosol particles measured by the D-MPSS system used here are spherical, and the Dm is equal to the volume-equivalent diameter (Dv). The quality of the PNSD measurements is assured by frequent calibrations, as Wiedensohler et al. (2018) described. To cover the entire size range from 10 nm to 10 µm, the APSS PNSD extended the D-MPSS PNSD. For this purpose, the aerodynamic diameter (Daer) of the APSS is converted into Dv by applying the following:
with
following DeCarlo et al. (2004). Thereby, ρ0 corresponds to the standard density of 1 g cm−3, ρaer to the aerosol density, ρeff to the effective aerosol density of 1.5 g cm−3 for fine mode aerosol, and it already accounts for the shape of the larger aerosol particles expressed with the shape factor χ. The effective density of 1.5 g cm−3 is chosen because the best overlap of the APSS and T-MPSS PNSD is achieved for most merged PNSDs. Also, this effective density fits reasonably well to the findings of Tuch et al. (2000) and Poulain et al. (2014), with reported aerosol particle densities of 1.53±0.31 and 1.4 to 1.6 g cm−3, respectively. Although shape factor and aerosol particle density are usually size dependent, we assume a constant density and shape of the aerosol particles for all the measurements of the APSS. At visible wavelengths, the coarse mode of the PNSD is less efficient than the fine mode in terms of aerosol particle light scattering and extinction. Hence, for aerosols dominated by accumulation mode particles, the underlying assumption is appropriate to calculate the extinction and scattering properties of the aerosol.
In addition to these continuously running instruments at Melpitz observatory, a quadrupole aerosol chemical speciation monitor (Q-ACSM; Aerodyne Research Inc, Billerica, MA, USA; Ng et al., 2011) measured the mass concentration of non-refractory particulate matter (PM). Ammonium (NH4), sulfate (SO4), nitrate (NO3), and chlorine (Cl), as well as the organic aerosol mass, have been derived in the fine-mode regime (NR-PM1). Further details on the Q-ACSM measurements at Melpitz can be found in Poulain et al. (2020). An ion-pairing scheme (ISORROPIA II; Fountoukis and Nenes, 2007) is utilized to derive the chemical compounds of the aerosol particles at 293 K and 0 % RH. Furthermore, a DIGITEL DHA-80 (RIEMER Messtechnik e.K., Hausen/Rhön, Germany) high-volume aerosol sampler collected daily the PM10 (10 denotes an aerodynamic diameter of the aerosol particles of 10 µm) aerosol particles on a quartz fiber filter (type MK 360; Munktell, Grycksbo, Sweden) with a total flow of 30 m3 h−1. Among others, Müller (1999), Gnauk et al. (2005), and Herrmann et al. (2006) provide detailed information about the aerosol sampler. The sampled quartz fiber filters were analyzed offline to determine the total aerosol particle mass concentration (here, we focus on PM10), water-soluble ions, and elemental carbon (EC) mass. The EC mass concentration (mEC) was measured following the EUSAAR2 protocol (Cavalli et al., 2010).
A continuously operating Multi-Angle Absorption Photometer (MAAP; model no. 5012; Thermo Fisher Scientific, Waltham, MA, USA; Petzold and Schönlinner, 2004) recorded the σabs(λ) at Melpitz observatory at a wavelength of 637 nm, with an uncertainty of 10 % (Müller et al., 2011) to 12 % (Lack et al. 2014). Several corrections are applied to the aerosol particle light absorption measurements of the MAAP. Following Müller et al. (2011), a wavelength correction factor of 1.05 is applied to all MAAP data in this study. Previously, observations conducted in Melpitz by Spindler et al. (2013) and Poulain et al. (2014) have shown that the submicron aerosol regime contains 90 % of the total PM10 eBC (Petzold et al., 2013) mass concentration (meBC). Hence, on the meBC data, a correction factor of 0.9 is applied to match the corresponding PM1 measurements of the Q-ACSM. With mEC and these absorption measurements, meBC is derived using a time-dependent (t) mass absorption cross section related to the MAAP wavelength of 637 nm (MAC(t, λ=637 nm)) with the following:
The daily average MAC(t,637 nm) is derived by dividing the daily mEC by the daily (midnight to midnight) mean of the measured σabs(637 nm) as follows:
Following this approach, a mean daily MAC(637 nm) of 10.4 m2 g−1 (median is 10.9 m2 g−1; interquartile range (IQR) is 7.1 to 12.3 m2 g−1) is derived between 1 February and 15 March 2017. Recently, Yuan et al. (2021) provided MAC(870 nm) estimates for the winter campaign period of this study of 7.4 m2 g−1 (geometric mean value; range from 7.2 to 7.9 m2 g−1), which relates to a MAC(637 nm) of around 10.8 m2 g−1 (10.5 to 11.5 m2 g−1), assuming an absorption Ångström exponent (AAE) of 1.2 (taken from Yuan et al., 2021). Zanatta et al. (2016) also reported a geometric mean MAC(637 nm) of 8.2 m2 g−1 (geometric standard deviation of 1.5 m2 g−1). For the period between 1 and 30 June 2015, a mean daily MAC(637 nm) of 7.3 m2 g−1 (median is 7.2 m2 g−1; IQR is 6.0 to 8.4 m2 g−1) is estimated at Melpitz observatory, which agrees with the 7.4 m2 g−1 previously reported by Nordmann et al. (2013) and is slightly smaller than the geometric mean MAC(637 nm) of 9.5 m2 g−1 (geometric standard deviation of 1.38 m2 g−1) reported by Zanatta et al. (2016) for the aerosol at Melpitz during summer. However, Nordmann et al. (2013) reported estimates based on Raman spectroscopy. Hence, the estimated MAC(637 nm) values for summer and winter seem reasonable but are evaluated in depth later. The specific volume fractions of each aerosol compound, fv,i, are derived based on the Q-ACSM and MAAP measurements, dividing each aerosol compound's mass with its respective density. Table A1 lists the density of each derived aerosol compound. Moteki et al. (2010) reported that it is accurate, within 5 %, to assume the density of non-graphitic carbon at 1.8 g cm−3. Therefore, in this study, a BC density of 1.8 g cm−1 is used.
Due to a lack of airborne chemical composition measurements, we assume that the chemical composition derived on the ground represents the airborne aerosol measurements in both campaigns.
These measurements were completed by a nephelometer (model no. 3563; TSI Incorporated, Shoreview, MN, USA), which measures the σsca(λ) at 450, 550, and 700 nm, with a relative uncertainty by calibration and truncation of about 10 % (Müller et al., 2009). The error of the nephelometer measurements due to truncation and illumination is corrected following Anderson and Ogren (1998).
The aerosol particle hygroscopicity parameter κ, introduced by Petters and Kreidenweis (2007), represents a quantitative measure of the aerosol's water uptake characteristics and depends on the aerosol particles' chemical composition and size. A volatility hygroscopicity–tandem differential mobility analyzer (VH-TDMA), first introduced by Liu et al. (1978), measures the hygroscopic growth of aerosol particles at a specific RH and particles sizes, and, with that, the water uptake is estimated. A VH-TDMA was deployed at Melpitz observatory during the summer campaign and operated at six different size bins (30, 50, 75, 110, 165, and 265 nm) from which the size-resolved aerosol hygroscopicity κ(Dp) was inferred. For particles smaller than 30 nm, we assume κ=κ(30 nm) and, for particles larger than 265 nm, κ=κ(265 nm), respectively. For particles between two sizes, linear interpolation is applied. The scientific community uses various VH-TDMAs, but detailed insights on the system deployed here are provided in Augustin-Bauditz et al. (2016).
During the winter campaign, no size-resolved direct hygroscopicity measurements were available. Therefore, the hygroscopicity of the aerosol particles encountered in the winter campaign is derived based on the parallel conducted measurements of the aerosol chemical composition utilizing the volume-weighted ZSR mixing rule, considering the hygroscopicity parameter of every single aerosol compound κi listed in Table A1. A comparison of the size-segregated κ(Dp) estimates of the VH-TDMA with bulk Q-ACSM measurements during the summer campaign shows a 1:1 agreement with a high correlation (R2=0.98; fit through the origin) at 165 nm (see Fig. S6). Hence, bulk Q-ACSM measurements represent the aerosol at a size of around 165 nm. However, the bulk Q-ACSM approach might over- or underestimate the hygroscopicity of aerosol particles smaller or larger than 165 nm in diameter.
Furthermore, Düsing et al. (2018) have conducted an optical closure experiment comparing Mie-based aerosol particle light extinction and backscatter coefficients with lidar measurements, using both κ estimates based on chemical composition and cloud condensation nuclei counter measurements at 0.2 % supersaturation. In the case of the chemical composition, the aerosol particle light extinction coefficient did agree with the lidar within 10 %. Hence, using κ from the bulk Q-ACSM measurements is a feasible approach.
3.1.2 Ground-based remote sensing
In addition to the in situ measurements on the ground, in both campaigns, a lidar system was used to determine σbsc(λ) and σext(λ). This system was PollyXT, a wavelength Raman polarization lidar system, with the first version introduced by Althausen et al. (2009). The PollyXT version in this study, introduced by Engelmann et al. (2016), operated with three channels for aerosol particle light backscattering and two for aerosol particle light extinction. During the summer campaign, a near-field channel at 532 nm was available. After the summer campaign, PollyXT was updated and equipped with an additional near-field channel at 355 nm and therefore available during the winter campaign. Vertical profiles of these aerosol properties are available and are each 30 s with a vertical resolution of 7.5 m. The geometry of emitted laser and far field of view (FOV) leads to a partial overlap below an altitude of 800 m, known as the overlap height, and can be determined experimentally (see Wandinger and Ansmann, 2002). Below 800 m, an overlap correction is applied to the lidar data (see Engelmann, 2016; Wandinger and Ansmann, 2002). The standard far FOV is 1 mrad, and the near FOV is 2.2 mrad (Engelmann et al., 2016). The automated data evaluation routines and quality check control are presented in detail in Baars et al. (2016). An intercomparison campaign presented by Wandinger et al. (2016), including different EARLINET (European Aerosol Research LIdar NETwork) instruments, including the system within this study (see the lidar system named le02 therein), has shown a maximum deviation of less than 10 %. Hence, we assume a 10 % measurement uncertainty of the σbsc(λ) measurements.
During the daytime, the signal-to-noise ratio in the Raman channels is too weak, due to solar radiation, to provide robust Raman σext(λ). Therefore, in this and other studies, e.g., Omar et al. (2009), Kim et al. (2018), Rosati et al. (2016b), and Höpner et al. (2016), the σbsc(λ) is converted to σext(λ), utilizing the extinction-to-backscatter ratio, also known as lidar ratio (LR; in steradian; hereafter sr), with the following:
LR is an intensive aerosol property. The estimates of σext(λ), hence, are subject to uncertainties arising from the LR uncertainty and σbsc(λ).
In the past, several studies investigated the LR of different aerosol types with ground-based lidar systems (Haarig et al., 2016; Mattis et al., 2004; Wang et al., 2016; Ansmann et al., 2010; with an airborne lidar system by Groß et al., 2013). Cattrall et al. (2005) estimated LRs at 550 and 1020 nm wavelength based on the direct sky radiance and solar transmittance measurements retrievals. Tao et al. (2008) and Lu et al. (2011) determined the LR with a synergistic approach combining space-borne and ground-based lidar. Düsing et al. (2018) provide LR based on airborne in situ measurements estimated with Mie theory. All these investigations clearly show that the LR is highly dependent on the predominant aerosol types. Müller et al. (2007) and Mattis et al. (2004) provided an overview of the LR for different aerosol types. Mattis et al. (2004) provided long-term (2000–2003) estimates of the LR for central European haze (anthropogenic aerosol particles) of 58 (±12) sr for 355 nm, 53 (±11) sr for 532 nm, and 45 (±15) sr for 1064 nm wavelength, respectively. In this study, the measured σbsc(λ) is transformed into σext(λ) with these estimates (see Fig. 1; lidar box). The uncertainties of the estimates of Mattis et al. (2004) and the measurement uncertainties of the lidar system are accounted for in the derived σext(λ). Later, the LR derived with the Mie model in the ambient state is compared with the LR provided by Mattis et al. (2004). With the uncertainty range of the LR by Mattis et al. (2004) and applying Gaussian error propagation, the uncertainty of the lidar-based σext(λ) is at best 23 % at 355 and 532 nm and 35 % at 1064 nm, respectively.
Additionally, a sky spectral radiometer (model no. CE318; Cimel Electronique, Paris, France) was deployed during both intensive periods of both campaigns as part of the AERONET (AErosol RObotic NETwork) observations. This pointed sun radiometer derived the AOD at several wavelengths, and Holben et al. (1998) provide detailed insights on the working principle of this instrument. It was used to cross-check the lidar retrievals to validate the integrated σext(λ) profiles with the AERONET AOD.
Directly deriving the LR from nighttime observations with the Raman lidar would also have been a feasible approach. However, as the atmospheric conditions between night and daytime were not homogenous and quite variable, we could not apply the nighttime finding to our daytime observations. However, we used AERONET AOD data to validate our extinction profiles and found good agreement whenever atmospheric conditions allowed. For example, for 28 June 2015, the integral of the mean aerosol particle light coefficient between 0 and 2500 m and 08:00 to 10:00 UTC (below the overlap height; the values are linearly extrapolated to the ground) is 0.13 at 355 nm and 0.072 at 532 nm. The corresponding AOD (355 nm), extrapolated with the Ångström exponent between 340 and 380 nm, is 0.14 and 0.097 at 532 nm (extrapolated between 500 and 675 nm). Thus, we believe the used lidar ratio values are well justified.
With a lidar and sun photometer combination, profiles of σabs(λ) can be estimated using the Generalized Aerosol Retrieval from Radiometer and Lidar Combined data (GARRLiC) algorithm (Lopatin et al., 2013). However, AOD at 404 nm of 0.4 and more is needed for this purpose; thus, we could not apply it for our study.
3.1.3 Airborne in situ measurements
Measurement platforms
During the intensive period of the summer campaign, a set of state-of-the-art instruments, installed on the airborne platform ACTOS (Siebert et al., 2006), determined microphysical and aerosol optical properties. ACTOS was designed as an external cargo under a helicopter, with a 150 m long aerial rope, and was operated at maximum ascend and descend speeds of 6 m s−1. Ambient RH and temperature (T) were recorded and averaged to a temporal resolution of 1 Hz. A data link was established between ACTOS and a receiver station installed on the helicopter. The scientist on board the helicopter adjusted flight height and track based on the real-time data observation. The measurement strategy is shown in the Supplement, with a typical flight pattern displayed in Fig. S1.
On ACTOS, a custom-made silica-bead-based diffusion dryer dried the air sample to ensure an aerosol humidity below 40 %, following the recommendations of Wiedensohler et al. (2012). The RH has been measured downstream of the dryer with an RH sensor (model no. HYT939, B+B Thermo-Technik GmbH, Donaueschingen, Germany). The upper cut-off of the inlet system is estimated at around 2 µm, following Kulkarni et al. (2011).
During the MelCol winter, the tethered balloon system BELUGA (Balloon-bornE modular Utility for profilinG the lower Atmosphere; Egerer et al., 2019) carried a set of payloads which determined meteorological conditions, including ambient T and RH, as well as microphysical and aerosol optical properties. The aerosol was sampled with instrumentation with a temperature-insulated box. The 90 m3 helium-filled balloon was attached to a 2 km long tether (3 m Dyneema®), and an electric winch allowed profiling with a climb and sink rate of 1 to 3 m s−1.
Varying wind speeds during the campaign changed the inclination of the aerosol inlet accordingly. Therefore, we do not account for the varying upper cut-off of the inlet. However, calculations, following Kulkarni et al. (2011), with an inclination angle of 90∘ show that 50 % of 10 µm aerosol particles with a density of 2 g cm−3 are aspirated by the inlet at a wind speed of around 0.8 m s−1.
The aerosol was passively dried with a silica-bead-based dryer, similar to the one on ACTOS, to dampen sudden changes in the RH of the aerosol stream. Such speedy fluctuations in the relative humidity affect filter-based absorption measurements and have been shown by Düsing et al. (2019), among others, for the instrument used in this study.
Aerosol optical properties
In summer and winter, the aerosol optical properties were measured on board ACTOS. The Single Channel Tricolor Absorption Photometer (STAP; Brechtel Manufacturing Inc., Hayward, CA, USA) derived σabs(λ) at 450, 525, and 624 nm wavelength, respectively. Briefly, the STAP evaluates σabs(λ) based on light attenuation measurements behind two filters with a spot size of around m−2. This study used quartz fiber filters (Pallflex membrane filters, type E70-2075W; Pall Corporation, Port Washington, NY, USA). On one filter, the aerosol matter deposits, and one filter spot stays clean downstream of the first filter. A photodetector detects the intensity of light of the given wavelength behind these filter spots. All raw data have been recorded on a 1 s time resolution. The STAP estimates σabs(λ) based on 60 s running averages of the measured intensities at default. At this averaging period, the measurement uncertainty is estimated to be 0.2 Mm. Based on differential light attenuation measurements between two time steps, the STAP calculates the σabs(λ). Filter loading and the enhancement of absorption due to multiple scattering within the filter material are corrected, following Ogren (2010) and Bond et al. (1999). These corrections include the real-time estimated filter-transmission-dependent loading correction factor, as follows:
where the transmission τ is defined as the ratio of the intensity I(t) measured at time t and the blank filter intensity I0=I(t0). Due to the limited computational power of the internal chip on board, the STAP σabs(λ) are recalculated based on a 30 s time resolution during the post-processing with more considerable precision. Also, STAP data have been corrected in terms of scattering artifacts, following Bond et al. (1999). At the time of the measurement campaign, the STAP was still in an early stage of development and reacted very sensitively to changes in temperature. Therefore, measurements of the STAP from the summer campaign are not shown here but are mentioned for the sake of completeness.
In addition to the STAP measurements in summer, a Cavity Attenuated Phase Shift monitor (CAPS PMssa; Aerodyne Research Inc., Billerica, MA, USA) was measuring σext(λ) and σsca(λ) at 630 nm wavelength each second. The measured aerosol particle light scattering coefficient is not used within this study, and therefore, the truncation error of σsca(630 nm) is not corrected. Moreover, we focus on σext(630 nm) estimated with a 5 % accuracy. However, a detailed characterization of the CAPS PMssa monitor is provided by Modini et al. (2021). Truncation and scattering cross-calibration correction factors are reported with uncertainties of 2 % and 4 % to 9 % for fine- and coarse-mode-dominated aerosol.
Aerosol particle number size distribution
In summer, a TROPOS-built MPSS determined the PNSD with a temporal resolution of 2 min, covering a size range of 8 to 230 nm. This temporal resolution translates into a vertical spatial resolution of several 100 m, depending on the ascent/descent speed of the helicopter. Like the D-MPSS on the ground, this MPSS included a bipolar charger (here model no. 3077A; TSI Incorporated, Shoreview, MN, USA) containing radioactive Kr-85, a TROPOS-type DMA (Hauke type; short), and a condensation particle counter (CPC; model no. 3762A; TSI Incorporated, Shoreview, MN, USA) with a lower cut-off diameter (Dp,50 %; the CPC detects 50 % of the aerosol particles with this diameter) of around 8 nm and counting accuracy of 10 %. In both campaigns, an optical particle size spectrometer was used to determine the PNSD within a specific size range. In the summer campaign, an optical particle size spectrometer (OPSS; here model no. SkyOPC 1.129, GRIMM Aerosol Technik Ainring GmbH & Co. KG, Ainring, Germany) recorded the optical equivalent PNSD covering an aerosol particle size range of 350 nm to 2.8 µm (optical diameter) with a temporal resolution of 1 s. The manual of the SkyOPC (v. 2.3) states that each offspring OPSS unit is calibrated to a mother instrument with a so-called in-house standard using polydisperse mineral dust (dolomite). The polarization of the used laser with a wavelength of 655 nm is unknown but is needed to calculate precise response curves. Because of these reasons, a correction regarding the complex aerosol refractive index () could not be applied to the data set. The OPSS in situ measurements are quality checked by comparing the average PNSD of the lowermost 200 m with the ground in situ measurements (see Fig. 2).
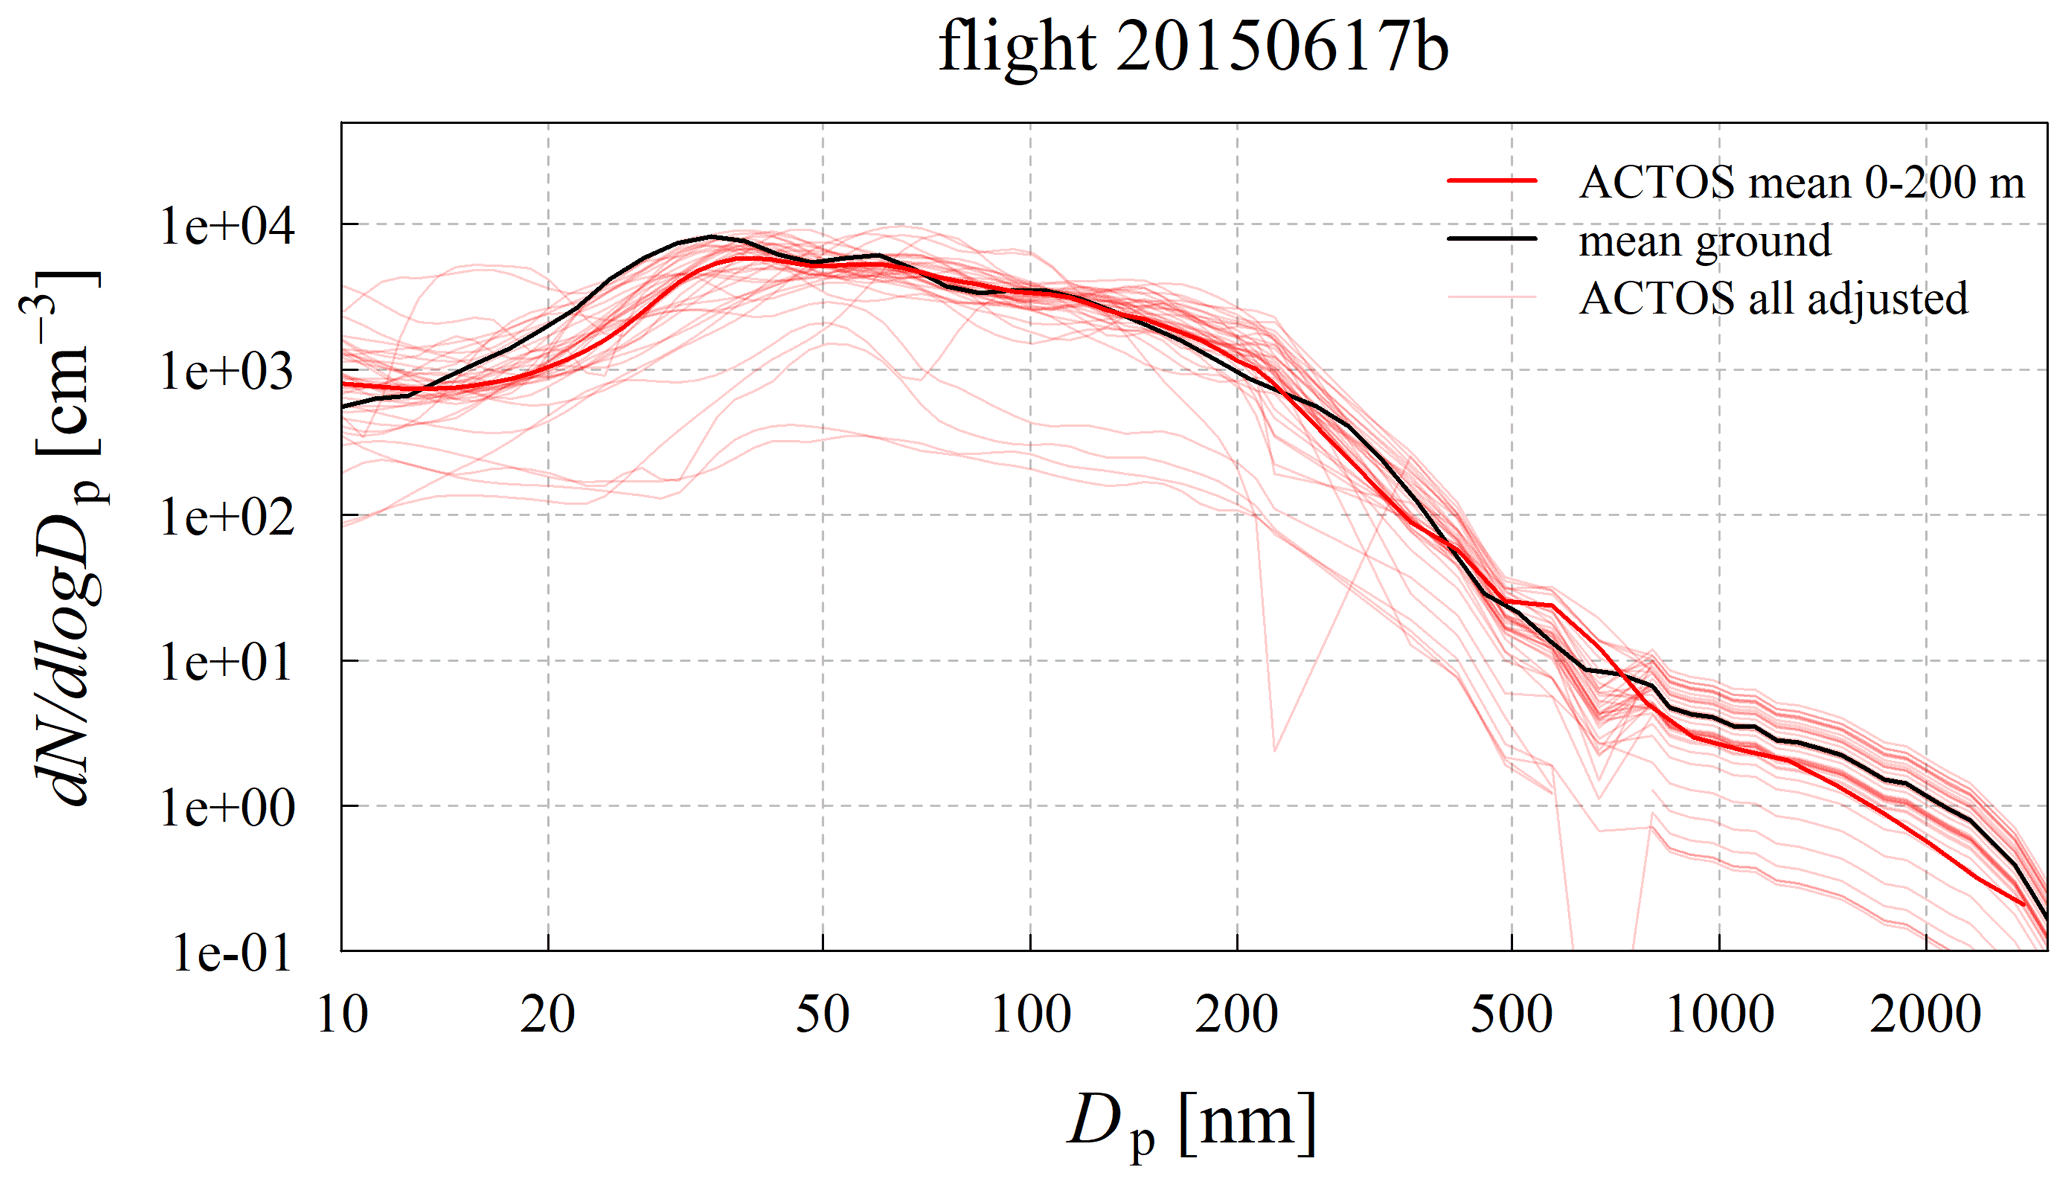
Figure 2PNSD at the dried state derived during flight 20150617b. The red line indicates the mean PNSD in the atmospheric layer between 0–200 m sampled with the ACTOS MPSS and OPSS. The black line represents the mean PNSD derived on the ground during the ACTOS flight time. Red transparent thin lines display the PNSDs derived with ACTOS adjusted with the height-corrected PNSD measured at Melpitz observatory.
The comparisons reveal a distinct underestimation of the aerosol particle number concentration above 800 nm in optical diameter (see Fig. 2). The underestimation is caused presumably due to a mixture of losses within the system which cannot be addressed appropriately. The refractive index correction of the OPSS missing here would shift the OPSS PNSD more to larger particle diameters (see Alas et al., 2019). A corresponding 2 min mean of the OPSS measurements extended the MPSS PNSD, and the resulting PNSD has been corrected concerning aspirational and diffusional losses, following Kulkarni et al. (2011) and Wiedensohler et al. (2012) and using the method of the equivalent pipe length.
In the winter campaign, an OPSS (model no. 3330, TSI Incorporated, Shoreview, MN, USA) sampled the PNSD in a range of 0.3 to 10 µm in 16 size bins every 10 s. Diffusional losses at the OPSS size range are negligible and are not considered. Contrary to the PNSD derived with the SkyOPC, this OPSS PNSD is corrected with in-house software for the complex aerosol refractive index. Briefly, the used software utilizes Mie theory to calculate the intensity of sideward scattered light with a given wavelength of aerosol particles with a complex refractive index and a given diameter D within an angular range. The next step shifts the diameter up to the intensity that matches the intensity of the calibration aerosol (here polystyrene latex particles) of a specific diameter and refractive index. As a result, the size bins are remapped to a new diameter array. For the calculations, the specific characteristics of the device have to be known. In this case, the sideward angular range is ±60∘, the wavelength is 660 nm, assuming unpolarized light and a refractive index of the calibration aerosol at this wavelength of 1.581+i0. A complex aerosol refractive index of 1.54+i0 is used since this results in OPSS PNSD with a decent overlap to the MPSS PNSD measured on the ground. The imaginary part of the complex aerosol refractive index is forced to 0 because it leads to a significant overestimation of the coarse mode in the PNSD when the imaginary part of the complex aerosol refractive index is above 0 (see Alas et al., 2019). Note that this complex aerosol refractive index is not the refractive index used in the Mie model because the imaginary components are also used there. For the investigated days of the winter campaign, a median complex refractive index of the aerosol of 1.56+i0.11 is found for 9 February and 1.56+i0.06 for 9 March, respectively. However, these refractive indices are based on the ZSR mixing of homogeneously mixed particles, but (a) we assumed a core shell mixing of the aerosol particles, and (b) the shape of the aerosol particles is essential as well for the refractive index correction. Therefore, the used complex refractive index for correction is a more effective refractive index for matching the OPSS PNSD to the PNSD derived at ground level with the MPSS and APSS.
In both cases, the instrumentation on board the payloads did not cover the entire aerosol particle size range from 10 nm to 10 µm. Since the in situ instrumentation at the ground is quality assured, the ground-based measurements are the reference and are utilized to correct the airborne measurements. The missing size range is addressed as follows: the size range of the corresponding PNSD from the ground fills the missing size range; from 10 nm up to 326 nm, in the winter case, in the summer case, all sizes larger than 800 nm in optical diameter. Advantageously, this addresses the unaccounted for underestimation of larger particles by the SkyOPC in the summer case, provides volume-equivalent diameters for the Mie calculations in that size range, and accounts for uncertainties introduced due to differences in the complex refractive index of the calibration aerosol and the prevalent aerosol. To account for vertical variability within the atmosphere, the ground-based PNSD is corrected for altitude, establishing a non-fixed altitude-correction factor fh. This factor normalizes the ground-based PNSD (each bin equally) with the number concentration ratio of the aerosol particles detected by the OPSS at altitude h(NOPSS(h)) and the mean in a layer near the ground below an altitude x (NOPSS(<x m)). The altitude correction factor fh(h) is calculated according to Eq. (8), as follows:
For the summer campaign, x is set to 200 m, and in the winter campaign it is 50 m. NOPSS(h) is the mean aerosol particle number concentration detected by the OPSS at a given height h. In the summer campaign, h is the corresponding mean height of the 2 min MPSS scan period; in the winter campaign, it is the mean altitude of the 10 s measurement period of the OPSS.
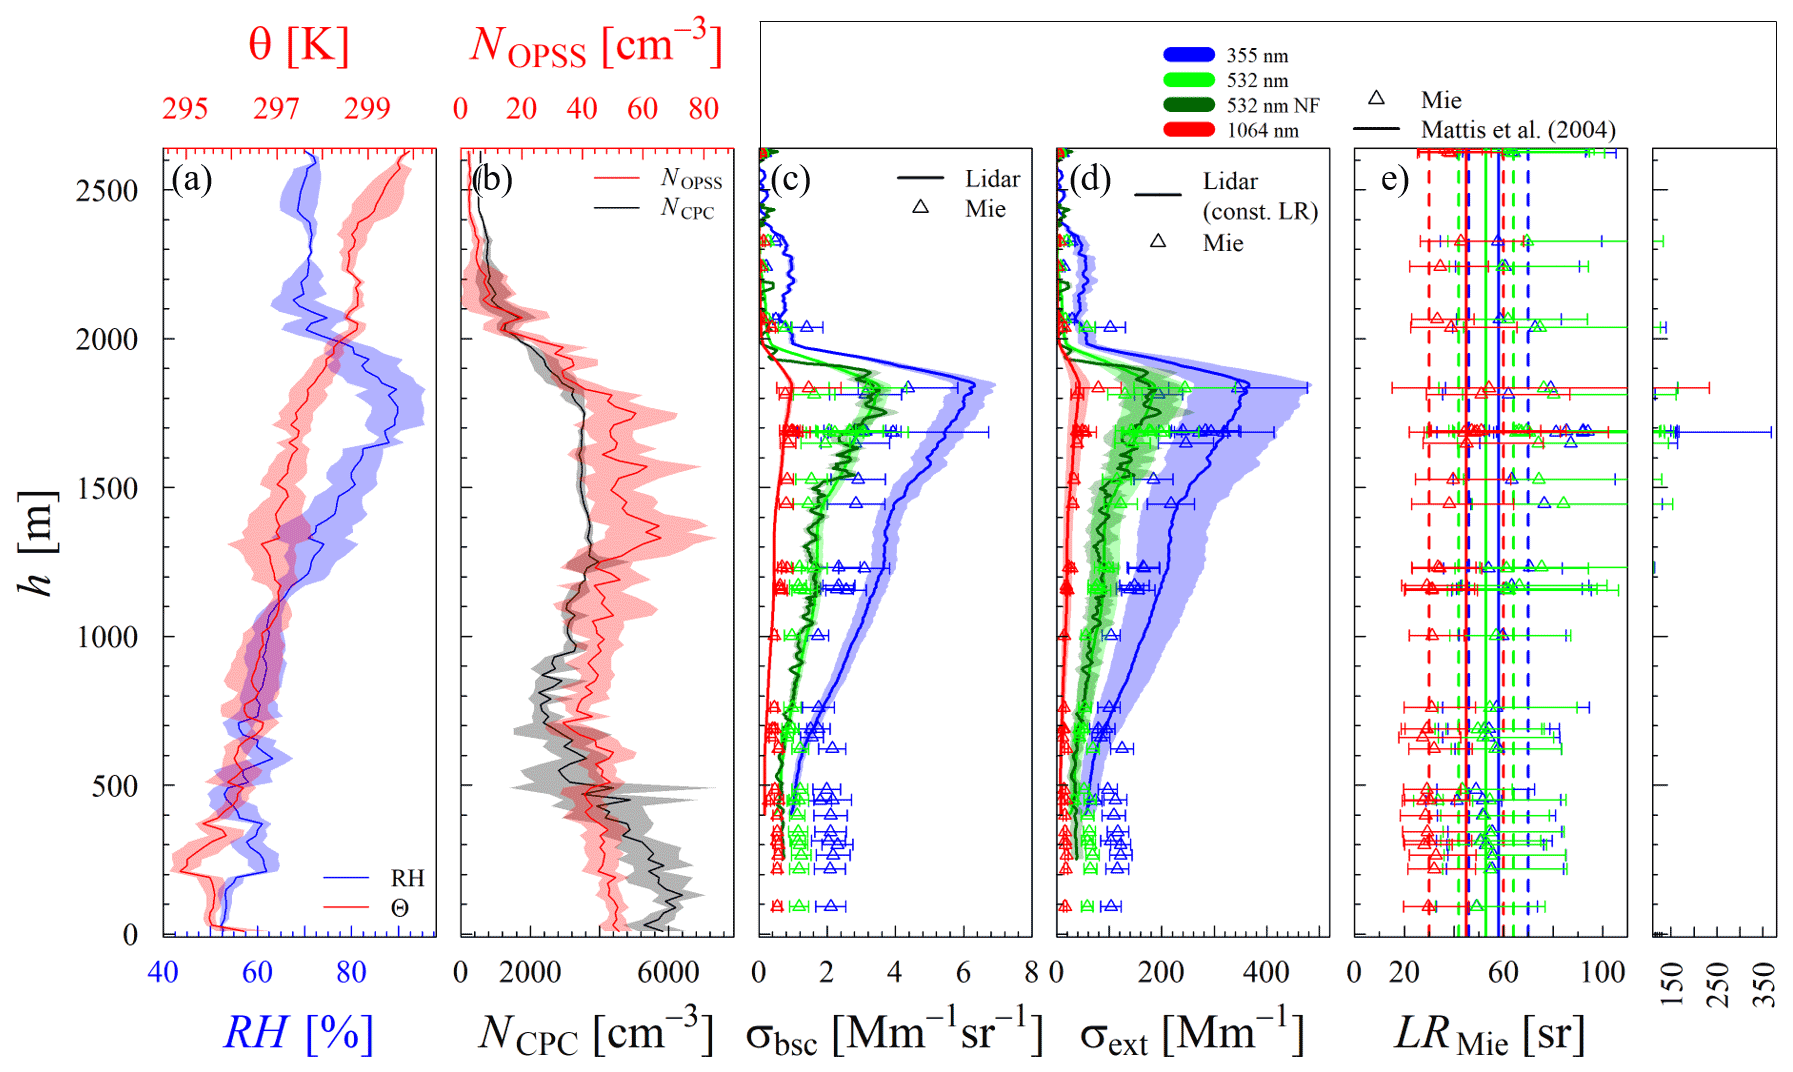
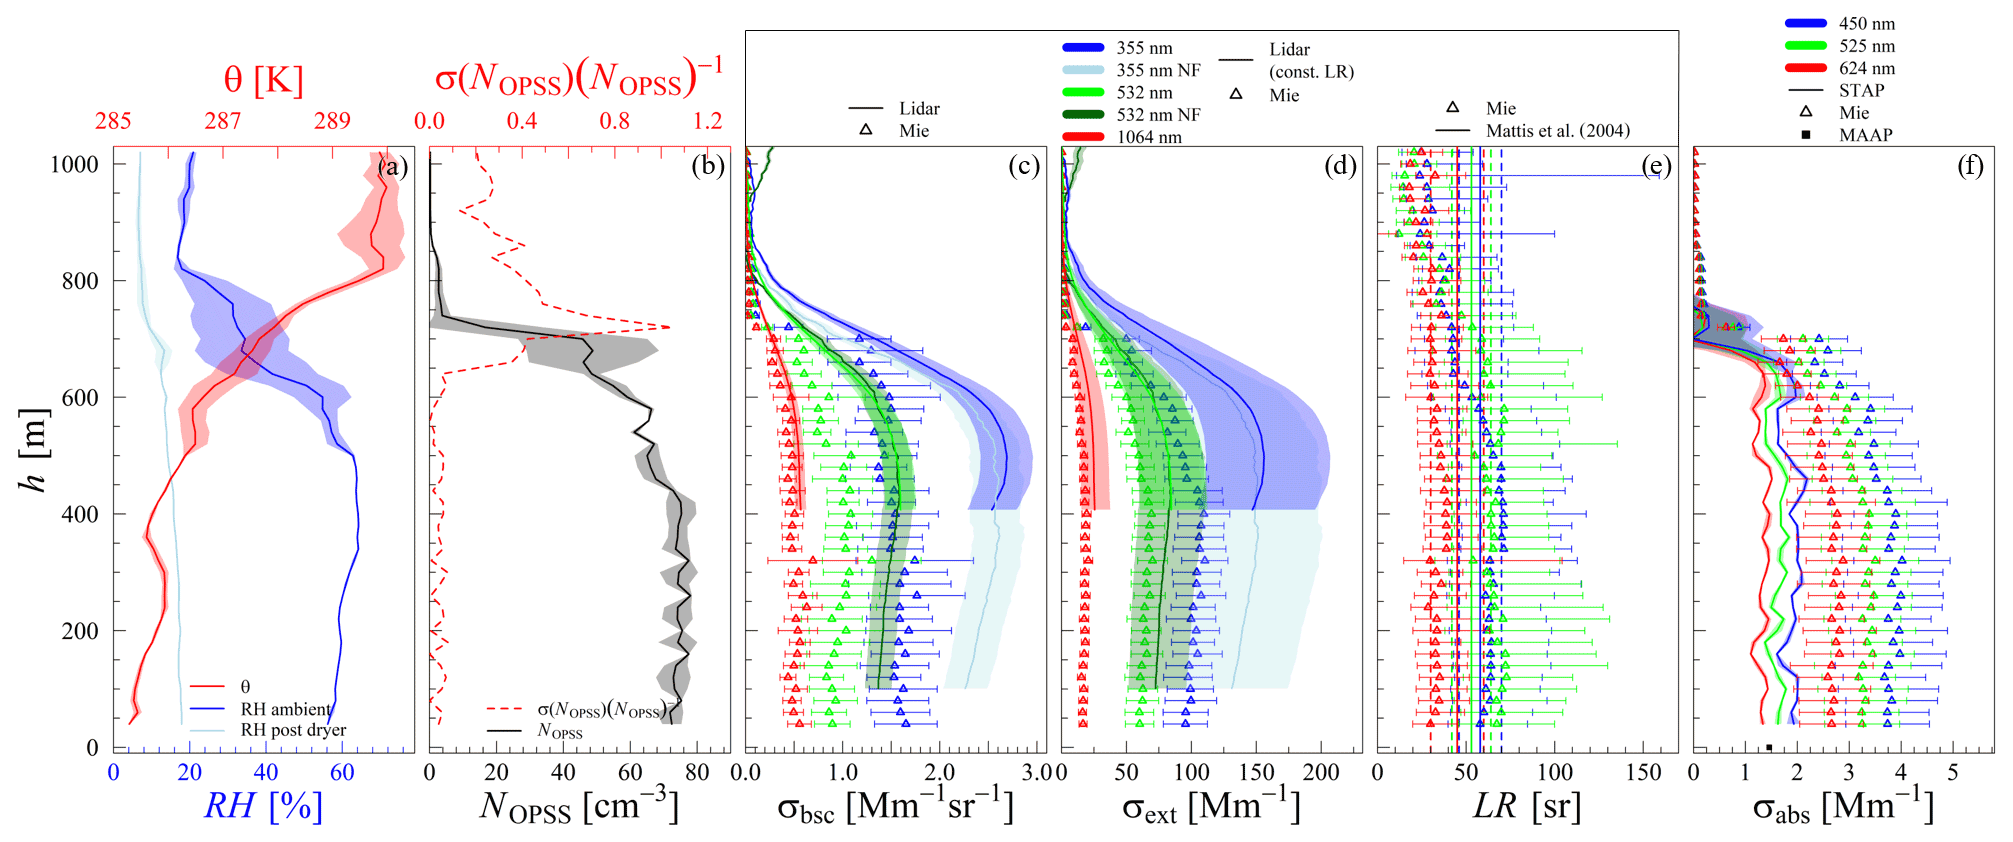
Figure 3(a) Vertical profiles of the 20 m layer averages of the ambient RH (blue) and potential temperature θ (red). (b) The aerosol particle number concentration of all particles (NCPC; black) and the particles detected by the OPSS (NOPSS; red). Shaded areas around T, RH, and NOPSS represent the standard deviation of the mean in the layer. (c) Aerosol particle light backscattering coefficient (σbsc(λ)) averaged from 08:35 to 09:00 UTC. Lines represent lidar estimates and modeled estimates displayed by triangles (for each PNSD scan on ACTOS) for the given wavelengths of 355 nm (blue), 532 nm (green), and 1064 nm (red). (d) Aerosol particle light extinction coefficient (σext(λ)) shown correspondingly. Shaded areas around the lidar-based coefficients indicate the assumed 10 % uncertainty of σbsc(λ) and the range of possible σext(λ), following the given range of Mattis et al. (2004). (e) The extinction-to-backscatter ratio for the different wavelengths (indicated by colors), based on Mie calculations (dots with error bars) and from Mattis et al. (2004; solid vertical lines, vertical dashed lines represent uncertainty). Uncertainty bars around the Mie-based σbsc(λ) and σext(λ) denote the 3σ range; around LRMie(λ) they denote the range of possible LRMie(λ) resulting from the uncertainties of the modeled σbsc(λ) and σext(λ). The given profiles were derived during flight b between 08:08 and 09:58 UTC on 26 June 2015.
4.1 MelCol summer
4.1.1 Model vs. lidar
Figure 3 shows the vertically resolved atmospheric conditions during the measurement flight between 08:08 and 09:58 UTC on 26 June 2015. The 20 m layer averages of microphysical aerosol particle properties, the ambient RH and T, and the measured (average between 08:35 and 09:00 UTC) and modeled aerosol optical properties of each PNSD scan are shown. The top of the planetary boundary layer (PBL) is about at an altitude of around 2 km. From 2000 to 0 m altitude, the total aerosol particle number concentration, measured by the CPC (NCPC), and the number concentration for aerosol particles larger than 350 nm (NOPSS) indicates the presence of two different aerosol layers (Fig. 3b). Between 1200 and 1800 m altitude, a layer is indicated by a constant NCPC of around 4000 cm−3 and a NOPSS of around 55 cm−3. In the layer from 700 to 0 m altitude, NCPC steadily increases towards the ground up to 5000 cm−3, while NOPSS scatters around 45 cm−3. For this layer, the model calculates larger optical coefficients than observed with the lidar. Above an altitude of 700 m, the model calculates smaller σbsc(λ) at 355 and 532 nm and slightly smaller σext (355 nm; Fig. 3c and d). That indicates different aerosol populations in these layers. The flight was conducted in the early morning from 08:00 to 10:00 UTC. During this daytime, the PBL is usually still developing due to thermal convection. Hence, most of the data were collected within the residual layer. The residual layer is an aged layer of aerosol, and the aerosol sampled on the ground should not represent the layer aloft the PBL. However, the model calculates aerosol particle light backscatter and extinction within 35 % compared to the lidar, with the best agreement at 532 nm, reproducing the extinction within 12 %, which is much smaller than the approximated lidar uncertainty. Within the PBL, presumingly up to an altitude of 600 m, the model significantly calculates larger σext(λ) and σbsc(λ). Surprisingly, the assumptions within the model capture the conditions within the residual layer better than the aerosol conditions within the PBL. It could be that the more aged aerosol within the residual layer better fits the core shell mixing assumption with the model.
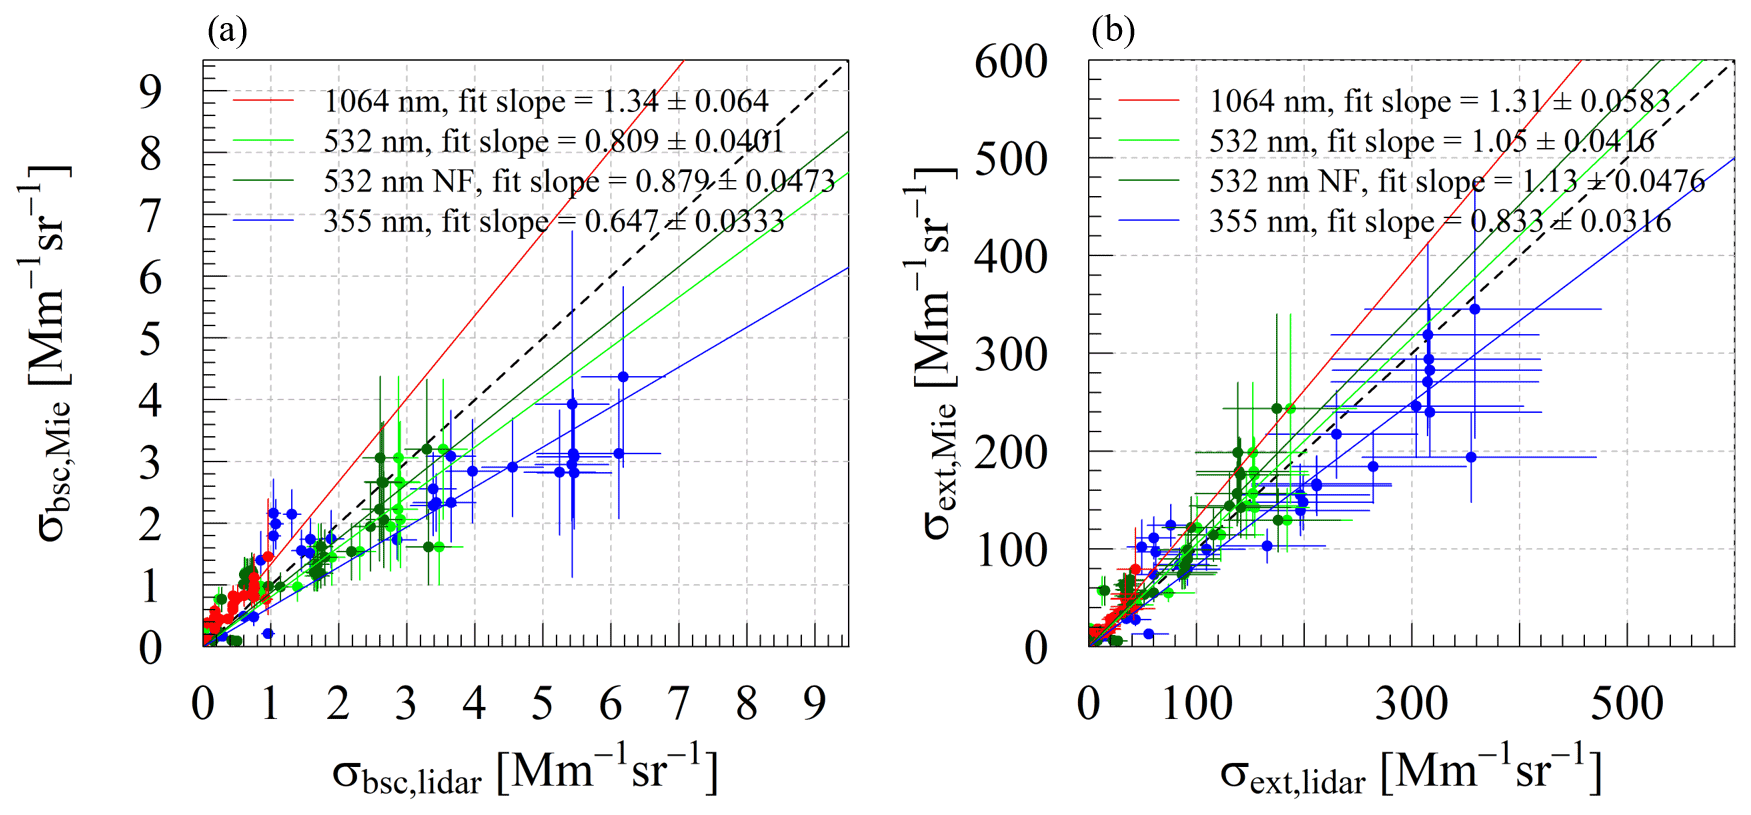
Figure 4Scatterplots of the measured (lidar) and modeled (Mie) ambient state aerosol particle light backscattering (σbsc(λ); panel a) and extinction (σext(λ); panel b) coefficient derived during flight 20150626a. Vertical uncertainty bars indicate the range within ± 3 times the standard deviation of the mean. Horizontal uncertainty bars denote the uncertainty of the lidar estimates. Colored lines represent linear fit at the corresponding color for 1064 nm (red), 532 nm (green; NF – dark green), and 355 nm (blue). The black dashed line represents the 1:1 line.
Figure 4a and b summarize the results shown in Fig. 3c and d. Regarding σbsc(λ), the Mie model calculates around 34 % (±6.4) larger values than measured with the lidar at 1064 nm wavelength, 19.1 % (±4) smaller values at 532 nm, and 35.3 % (±3.3) smaller values at 355 nm. Considering σext(λ), the estimates of the Mie model are 31 % (±5.8) larger than the lidar-based estimates at 1064 nm wavelength and by 5 % (±4) larger at 532 nm. At 355 nm, the Mie model calculates around 16.7 % (±3) smaller aerosol particle light extinction coefficients than derived with the lidar.
Figure 3e displays the spectrally resolved modeled LRMie(λ) and the LR(λ), with the given uncertainty range reported by Mattis et al. (2004). Within the lowermost 1200 m, LRMie(λ) is relatively constant, and the RH increases from ground to 1200 m from around 50 % to 70 %. The impact of the RH on the LR(λ) is small due to the small hygroscopic growth of the aerosol particles in this RH range. Under these conditions, the mean LRMie(λ) is 54 sr at 355 and 532 nm, respectively. This average LRMie(λ) is in the range of reported LR(λ) for urban haze aerosol, as reported by Müller et al. (2007) and Mattis et al. (2004), and is reasonable when considering also the LR(532 nm) of polluted dust aerosol of 60 sr reported by Omar et al. (2009). The anthropogenic influence (urban and polluted) is indicated by a larger meBC than observed on 17 and 28 June (see Fig. S2). The mean LRMie(1064 nm) below 1200 m altitude is 30 sr and agrees with the findings of Omar et al. (2009). They reported an LR(1064 nm) of 30 sr based on satellite-borne lidar observations for clean continental, polluted continental, and polluted dust aerosol. Above 1200 m altitude, the LRMie(λ) followed the trend of the RH up to the PBL top, indicating an LR–RH dependence.
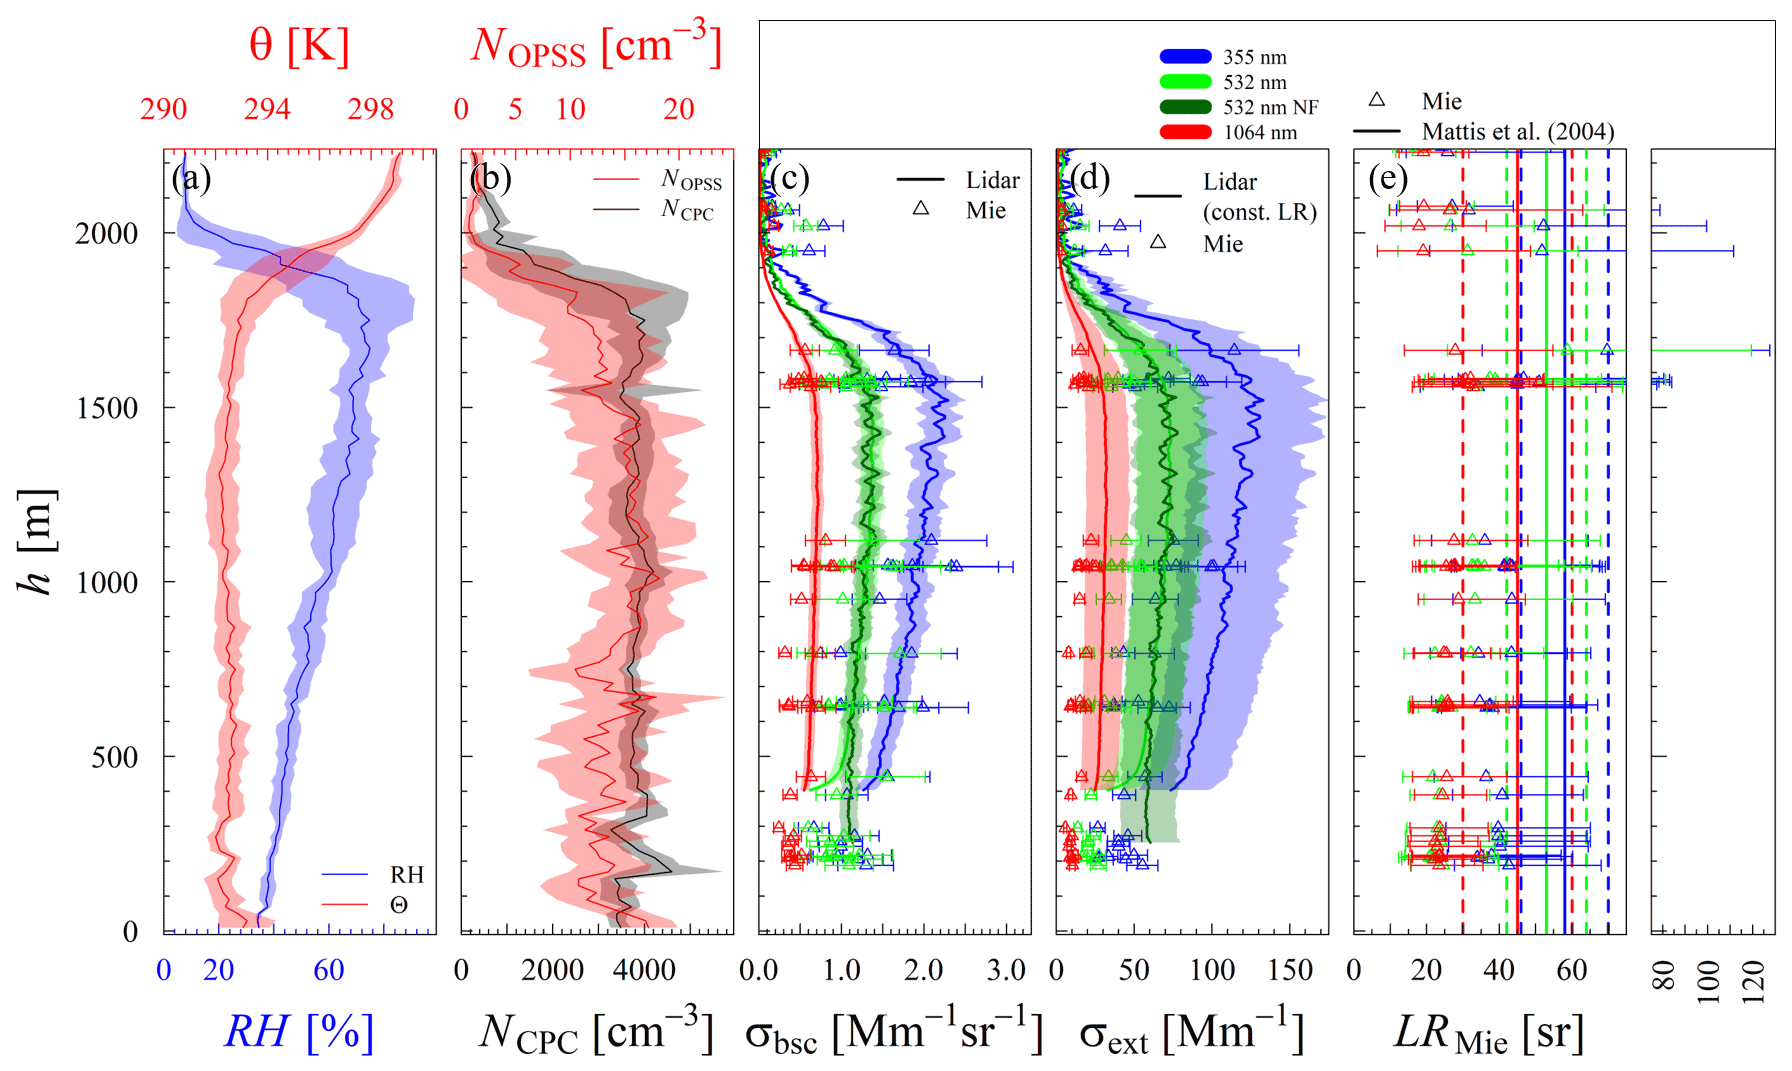
Figure 5 displays vertical profiles of the same observed parameters as shown in Fig. 3 obtained during the second flight (12:43 to 14:19 UTC) on 17 June 2015. Unlike 26 June, a larger decrease in RH was observed above the top of the PBL at around 1800 to 2000 m altitude (Fig. 5a). Below 2000 m altitude, the RH is steadily decreasing from 75 % to 35 % towards the ground. The stable NOPSS and NCPC of ∼15 and 3800 cm−3, respectively, indicates a well-mixed planetary boundary layer up to an altitude of around 1800 m (Fig. 5b). Compared to the case of 26 June 2015, on average, the model values of the σbsc(λ) are 1.4 % to 12.3 % smaller than the lidar-based ones (see Table 1). The model calculates significantly smaller (42.9 % to 35.9 %) σext(λ) in the ambient state than derived from the lidar aerosol particle light backscatter using the LR(λ) of Mattis et al. (2004).
We assume that the LRs for urban haze aerosol reported by Mattis et al. (2004) might not apply to that day. The spectral behavior of LRMie(λ) was different from the case of 26 June. In particular, during flight b on 17 June, the LRMie(532 nm) is in the range of LRMie(1064 nm), whereas on 26 June LRMie(532 nm) it is in the range of LRMie(355 nm). Within the lowermost 400 m, under dry conditions at around 40 % RH, the LRMie(355 nm) is around 38 sr at LRMie(532 nm), and LRMie(1064 nm) is around 23 sr. These LRs agree with Catrall et al. (2005), who have reported an LR(550 nm) of 28 (±5) sr, with a ratio of LR(550 nm)/LR(1020 nm) of 1.0 (±0.2) for marine aerosol. Hence, the prevalent aerosol on this day could be classified as a marine-type aerosol, applying the classification of Catrall et al. (2005). The origin of the corresponding trajectory cluster (see the Supplement; WS-A2 (clean); Sun et al., 2020) located over the North Atlantic supports this aerosol classification. Applying the LRMie(λ) displayed in Fig. 5e to σbsc,lid(λ), the slope of the linear fit of modeled and the lidar-based σext(λ) is much closer to 1, and the agreement is within 12.9 % (underestimation of 7 % at 1064 nm, 7.9 % at 532 nm, 5.2 % at 532 nm near-field channel, and 12.9 % at 355 nm). Above the PBL, within the free troposphere, the model is significantly larger than the lidar estimates. However, ACTOS was not flying directly above the lidar; hence, small-scale differences in the PBL height could explain the difference. These variations in the PBL height are also visible in Fig. S1, with distinct variations in the aerosol load within a short period.
Averaged over all four investigated flights, the Mie model calculates smaller optical coefficients than those derived by the lidar. Table 1 summarizes the slopes of the correlation between measured and modeled optical coefficients of the four investigated flights.
Table 1Overview of the slopes and their standard error of a linear regression between the modeled extinction and backscattering coefficient with the measured ones from the lidar for the four investigated flights and summarized for all data points displayed, with the accuracy to three significant figures.
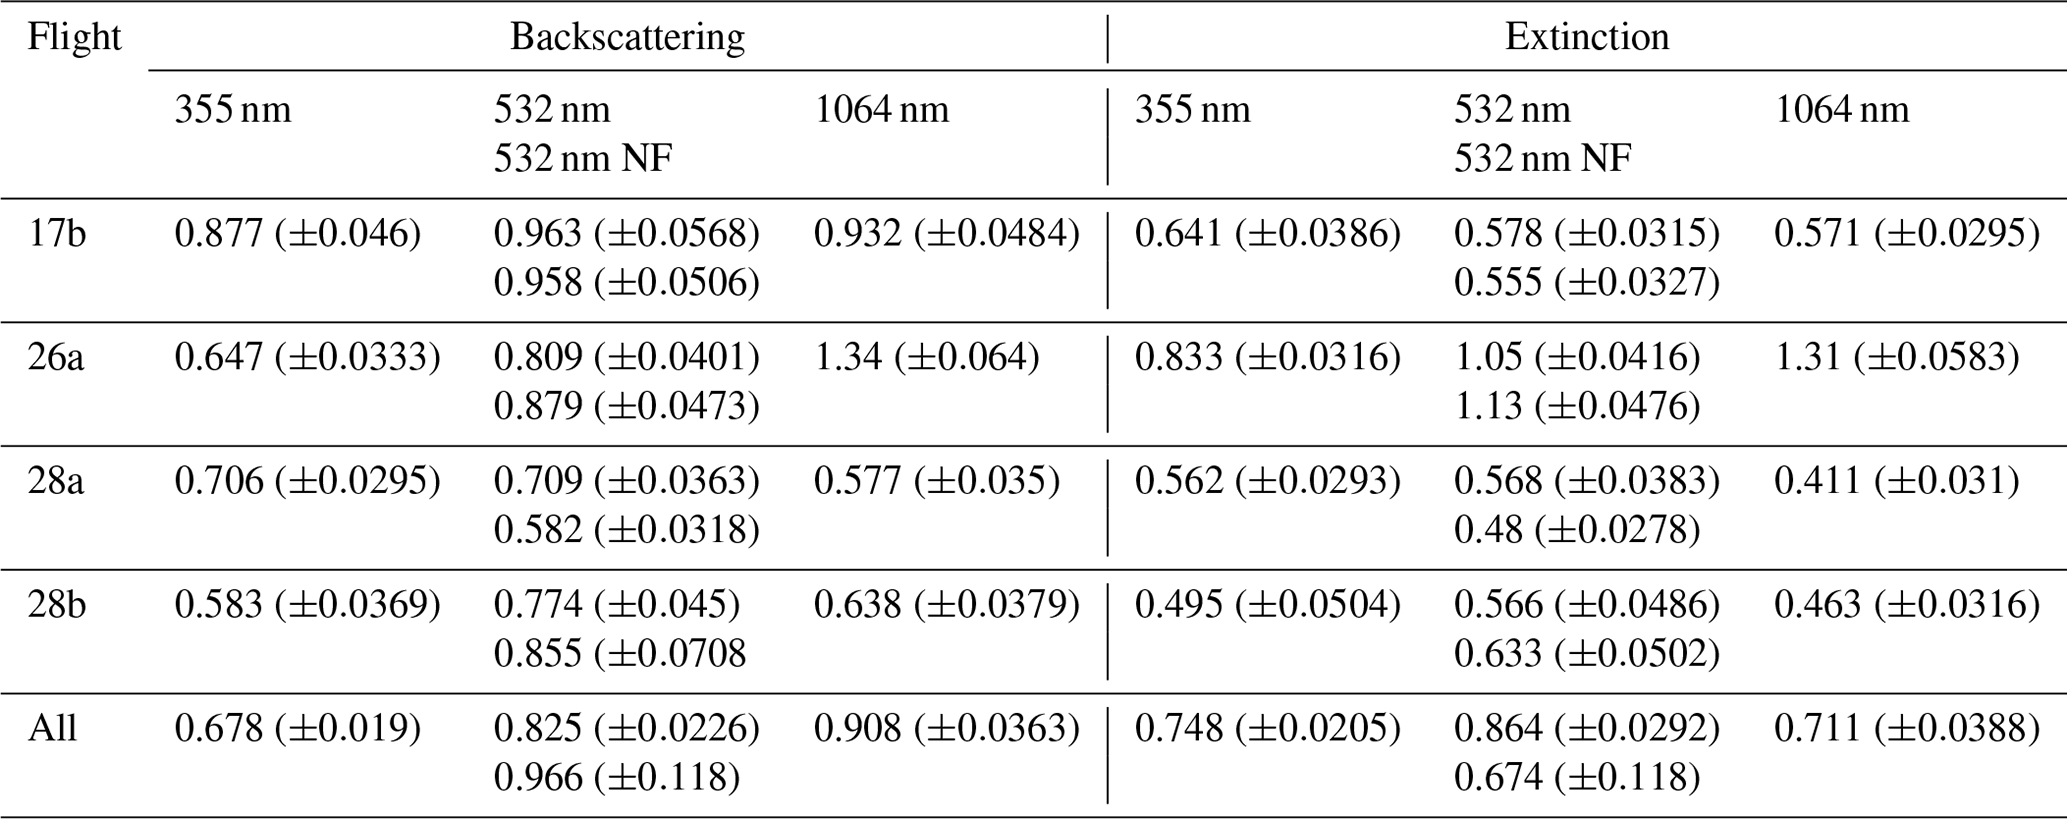
On average, the modeled σbsc(λ) is 32.2 % (±1.9) smaller at 355 nm, 17.5 % (±2.3) at 532 nm, 3.3 % (±11.8) at 532 nm near-field channel, and 9.2 % (±3.6) smaller at 1064 nm; the modeled σext(λ) is 25.2 % (±2.1) smaller at 355 nm, 13.6 % (±2.9) at 532 nm, 22.6 % (±11.8) at 532 nm near-field channel, and 28.9 % (±3.9) smaller at 1064 nm. For all cases, the largest fraction of cases with an overlap of the uncertainty ranges of modeled and lidar-based values are observed at 532 nm for the near-field channel extinction. Most cases of overlap at backscatter; in particular, 61 %, are observed at 532 nm and the far-field configuration of the lidar. Ferrero et al. (2019) have shown that unaccounted dust significantly impacts the modeling of σbsc(λ). Their Mie calculations have been 72 % to 39 % smaller than the corresponding lidar measurements without considering dust. After considering the 45 % of unaccounted PM10 mass as dust, their modeled results agreed with the lidar measurements (37 % overestimation at 355 nm and within 7 % at 532 and 1064 nm) and increased the intensity of the scattered light at 180∘ significantly. In our study, we do not consider dust or any other crustal material within the chemical composition. Hence, the missing dust and crustal material could explain the underestimation of the Mie model. Moreover, as the refractive index correction of OPSS tends to shift the particle towards a larger diameter, that could, at least partially, explain some of the underestimations, although the used size range of the SkyOPC is limited between 356 and 800 nm.
Another reason could be underestimating the aerosol hygroscopicity and, hence, underestimating the aerosol particle growth, resulting in a smaller simulated extinction and backscatter cross section of the aerosol particles in the ambient state. As stated by Wu et al. (2013), evaporation of NH4NO3 within the VH-TDMA system can occur, and therefore, the hygroscopicity is underestimated compared to size-segregated hygroscopicity estimates based on chemical composition measurements. Also, as Rosati et al. (2016a) have shown, the variation in temperature and RH can influence the apportionment of ammonium nitrate, which has a κ of 0.68 (see Table 1). A lower temperature at higher altitudes results in less evaporation and a larger volume fraction of ammonium nitrate, and a larger hygroscopicity in that altitude.
Furthermore, De Leeuw and Lamberts (1987) have shown that σbsc(λ) is sensitive to (a) the refractive index and (b) the covered size range. At a size-constant imaginary part of 0.05, the variation in σbsc(λ) for a real part of 1.4 to 1.6 is almost 1 order of magnitude. At a real part of 1.56, they have shown that increasing the imaginary part from 10−3 to 10−1 decreases σbsc(λ) by 1 to 2 orders of magnitude. Since the BC content mainly drives the imaginary part within the aerosol, an overestimation of the BC mass would result in a larger imaginary part of the refractive index and, hence, to a σbsc(λ) that would be too small. Also, they stated that extending the covered aerosol particle diameters to more than 32 µm significantly increases extinction and backscatter. They also showed that σext(λ) is, in general, less sensitive to the imaginary part of the complex refractive index compared to σbsc(λ). However, the real part is essential, and the aerosol particle light extinction increases by increasing the real part. Thereby, the smaller the wavelength, the larger the increase. Hence, (a) non-captured aerosol particles larger than the observed size range could lead to larger σbsc(λ) and σext(λ), and (b) the constant complex aerosol refractive index over all wavelengths and for all particle sizes could also influence the results. However, the bulk chemical composition approach shows good agreement with the in situ scattering measurements on the ground – at least at 450 nm wavelength. A wavelength-dependent complex refractive index of the aerosol components could improve the agreement.
Furthermore, correcting the airborne PNSD with the OPSS-based altitude correction factor fh might underestimate in higher altitudes, resulting in smaller modeled optical coefficients than observed with the lidar.
Ma et al. (2012) have already shown that a mixture of a fully externally and internally core shell mixed aerosol containing light-absorbing carbon is a better representation for deriving the hemispheric backscatter fractions (HBF). Also, they reported a mass fraction of fully externally mixed light-absorbing carbon of 0.51 (±0.21) in the North China Plain for 12 July to 14 August 2009. With fixed refractive indices of the aerosol components (1.8+0.54i for light-absorbing carbon and the less absorbent components ) and constant volume fractions for the whole observed particle size range, they have shown that the core shell approach overestimates the measured HBF at 450 nm by around 10 % and underestimates the measured HBF by about 5 % at 700 nm wavelength. Although HBF is not σbsc(λ), these results show that the constant mixing approach in this study might lead to biases in the modeled aerosol optical coefficients.
In addition, the integration approach, in combination with the non-observed size range from 230 nm, the last channel of the MPSS on ACTOS, to 356 nm optical diameter, the first channel of the SkyOPC, could cause an underestimation of the optical parameters when the peak of the optical parameter size distribution, d, is in between the mentioned diameters. Based on the ground-based observations, we simulated a similar case. We removed some bins in the size range from 226 to 356 nm and did Mie model calculations for the winter. There is no significant difference between both approaches for aerosol particle light extinction coefficient at all three wavelengths and the aerosol particle light backscatter coefficient at 1064 nm (within 2.5 %). However, with the gap at 355 and 532 nm, the aerosol particle light backscatter coefficient is calculated around 8 % larger and might indicate that the airborne-based calculated aerosol particle light backscatter coefficients at these wavelengths are too large.
To summarize, biased hygroscopicity, the refractive index, the assumed mixing approach, the eBC volume, and the limited observed size range can lead to the differences in both approaches. However, considering the maximum uncertainty of the lidar of 23 % at 355 and 532 nm and 35 % at 1064 nm, on average, the modeled extinction is within the uncertainty of the lidar for 532 and 1064 nm, and for 355 nm, the model is slightly smaller. Also, the modeled values are subject to uncertainty as well. On average, at 355 nm, the 3 times standard deviation of mean is 20.1 % of the mean modeled extinction coefficient at 532 nm (21.4 %) and at 1064 nm (21 %). In the aerosol particle light backscatter coefficient at 355 nm, we have a 26.8 % uncertainty, at 532 nm there is a 29.1 % uncertainty, and for 1064 nm, we have 24.9 % uncertainty, respectively.
4.1.2 RH dependence of the LR(λ)
The LR(λ) dependence on the RH is examined based on the four measurement flights during the summer campaign. The winter cases are excluded in this analysis because the underlying measurements are based on airborne in situ measurements, which are different in (a) the underlying hygroscopicity estimates and (b) the measured aerosol particle number size distribution.
Figures 3e and 5e display the Mie-based ambient state LR(λ) at the given wavelengths (dots with error bars) and the reference LR(λ) of Mattis et al. (2004), represented by the color-coded vertical lines with the given uncertainty range marked as dashed lines around these. The mean LR(λ) of flight 26a, calculated with the Mie model in the ambient state, was 64.1 sr (±14.1) at 355 nm, 61.7 sr (±10.9), and 36.2 sr (±8.0) at 1064 nm, which is 10.5 % larger, 16.4 % larger, and 19.6 % smaller than the corresponding LR(λ) reported by Mattis et al. (2004) but in the given range. The vertical structure of LRMie(λ) follows the trend of the RH. Aerosol changes with height probably cause some changes in the LR too. However, a comparison of the LR profile in the dry state with the LR profile in the ambient state shows that the LR increases more with increasing RH than it does with a change in the aerosol itself (see Fig. S7).
Previous studies reported a significant influence of the RH on the aerosol optical properties often expressed with an enhancement factor. Zieger et al. (2013), e.g., presented the aerosol particle light scattering enhancement for different European sites, Skupin et al. (2016) published a 4-year-long study on the impact of the RH on the aerosol particle light extinction for Central European aerosol, and Haarig et al. (2017) showed the backscatter and extinction enhancement for marine aerosol. Ackermann (1998) investigated the dependence of the LR(λ) on RH for different aerosol types with a numerical simulation but has not presented an LR(λ) enhancement factor, and the underlying PNSD were solely based on climatology data and not based on actual measurements such as those within this study. Following the approach of Hänel (1980), the RH- and wavelength-dependent enhancement factor of the LR(λ), fLR(RH, λ), is expressed as follows:
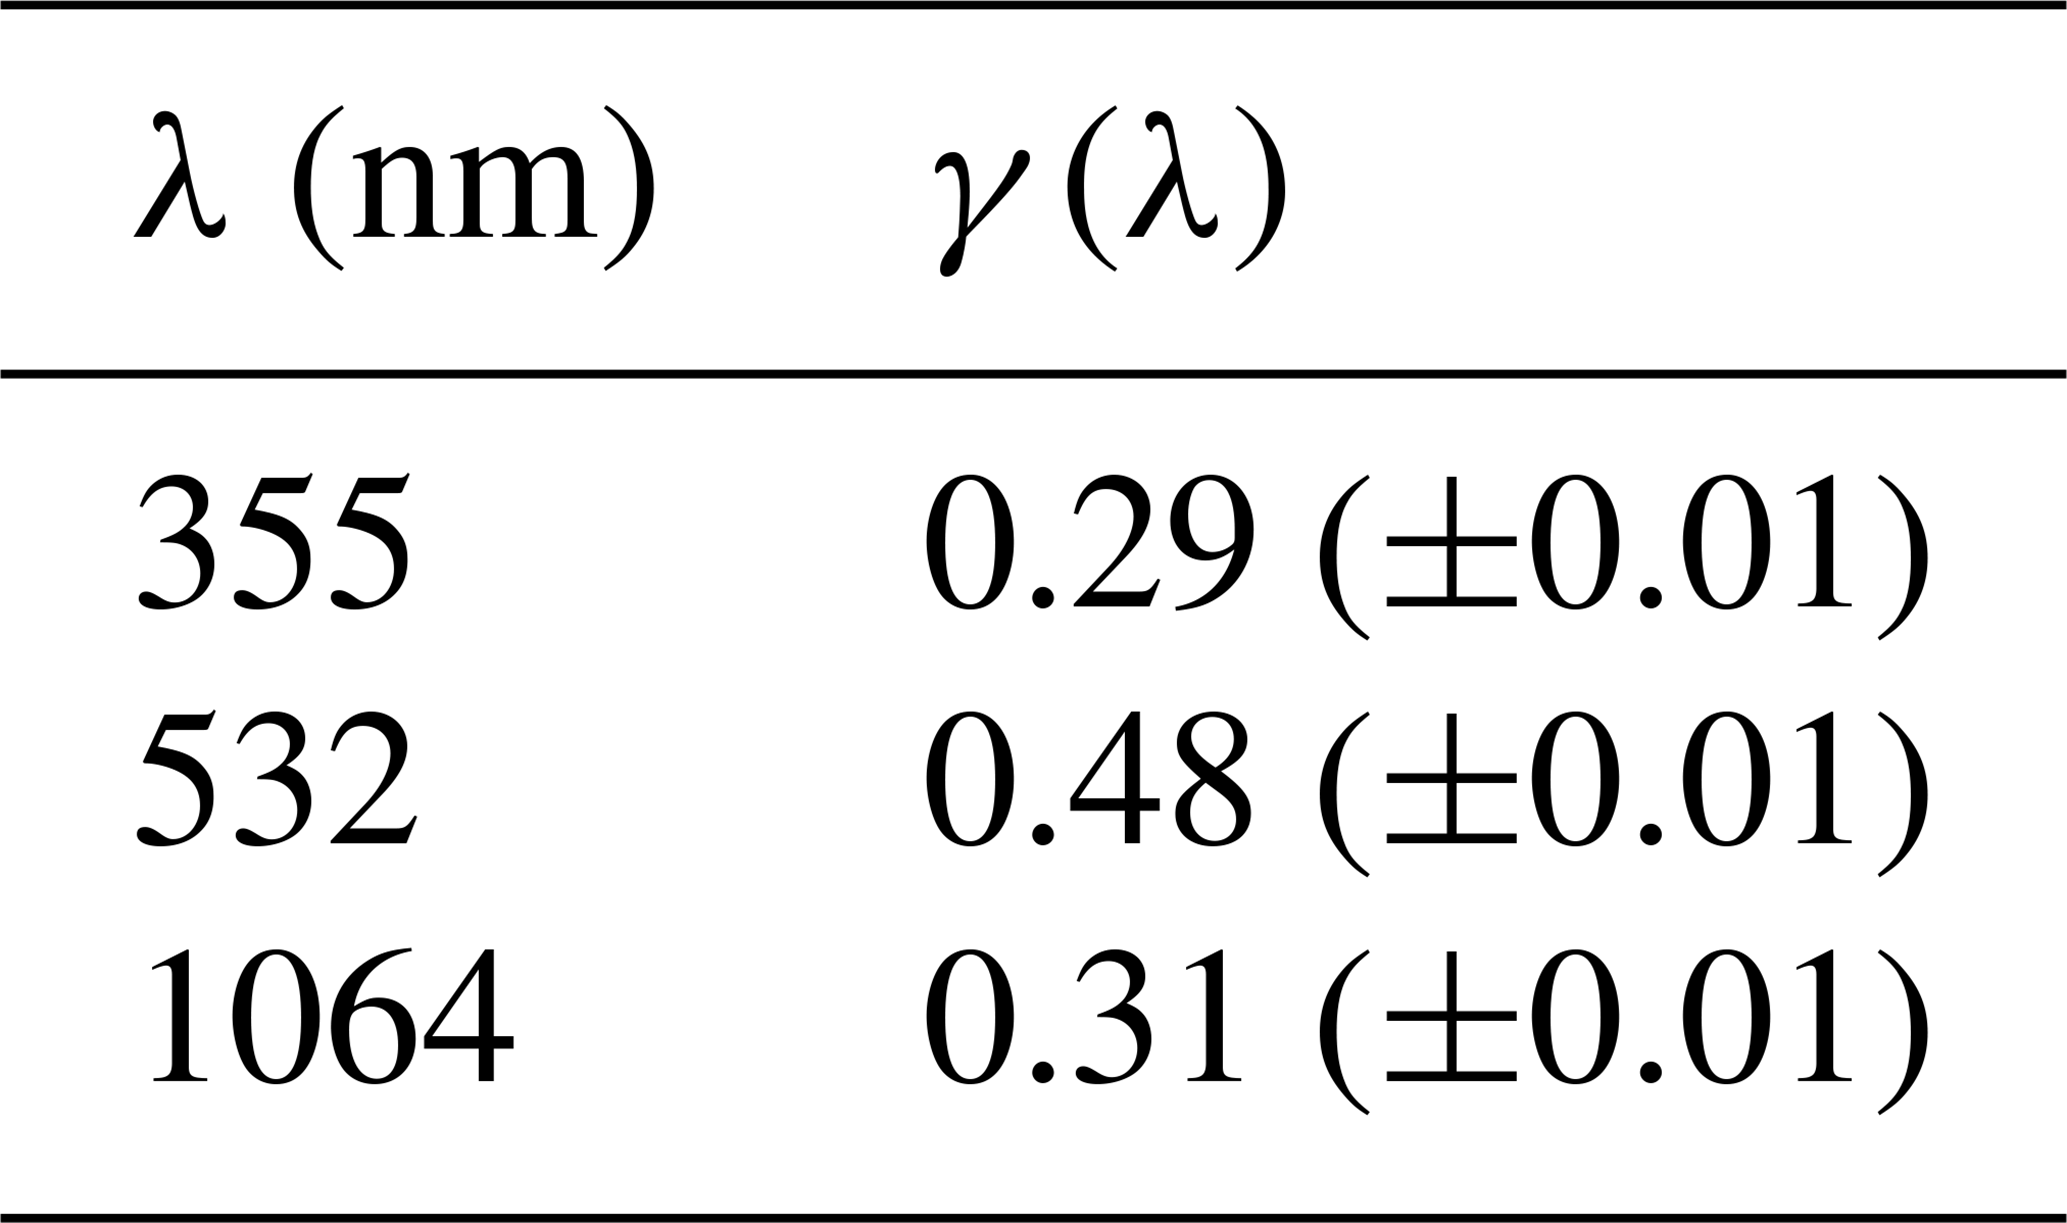
where fLR,dryis equal to fLR(RH = 0, λ), and the LR(λ) enhancement factor is at 0 % RH and is forced through 1. γ(λ) denotes the wavelength-dependent fitting exponent.
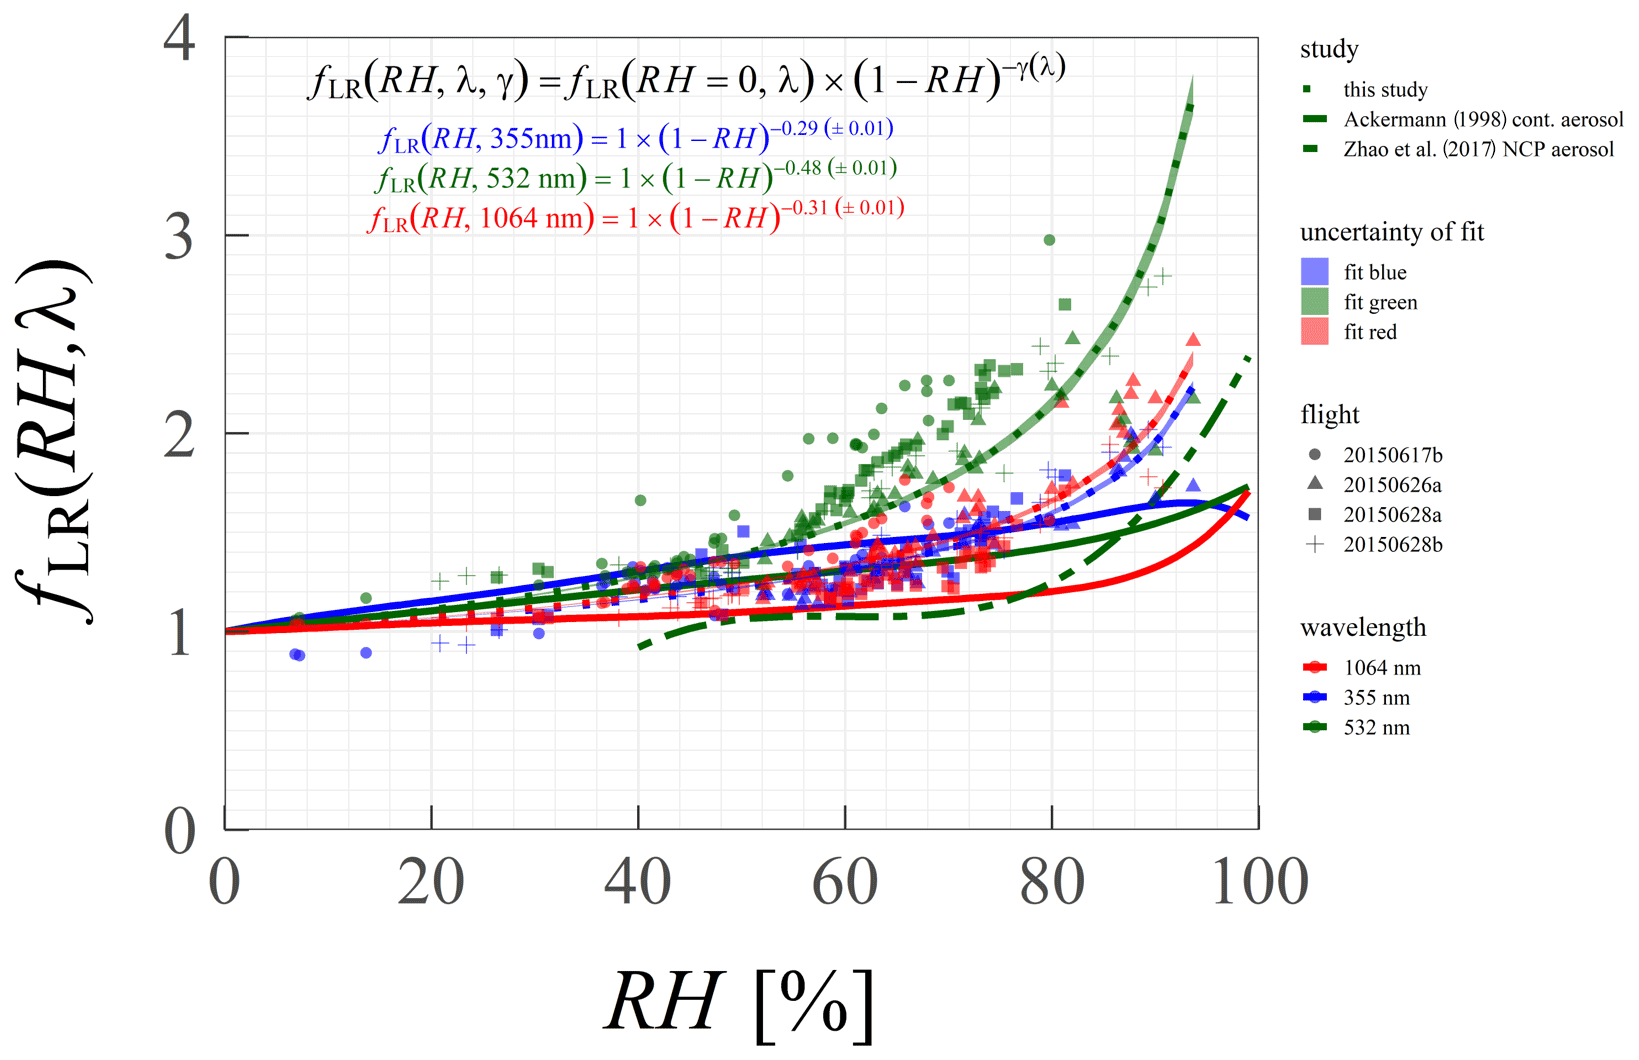
Figure 6Mie-based RH-dependent LR(λ) enhancement factor fLR(RH, λ) calculated with the airborne in situ PNSD derived with ACTOS plotted for the three lidar wavelengths (dashed line). Symbols represent the investigated flights, colors are the considered wavelength, and the shaded area is around the standard error of the fit. In comparison, the estimates for the continental aerosol of Ackermann (1998) and Zhao et al. (2017) for the North China Plain (NCP) aerosol translated into the lidar ratio enhancement factor are displayed as solid and dotted-dashed lines.
The estimated fLR(RH, λ) for the four investigated measurement flights (17b, 26a, 28a, and 28b) is displayed in Fig. 6, and Table 2 shows the corresponding fitting parameters with the standard errors of the fit. Note that the dried state LR(λ) is calculated for aerosol with some residue water because the sampled aerosol was never completely dry. The RH measured after the dryer was, at most, 48.3 % on flight 20150617b and reached a maximum of 35.8 % on the other days. In the Mie model, the aerosol particles in the dried state are treated as being completely dry. However, the growth in the size of the aerosol particles at this RH level is small (around 10 %), and the bias on the LR(λ) enhancement estimates should be negligibly small. In the 48 % RH case, the difference in RH results in a deviation of 3.2 % in the dry state diameter. The optical coefficients from the Mie calculation are proportional to the cross section of the aerosol particle. Hence, the dry diameter deviation translates into a deviation of 6.5 % in this regard. Zieger et al. (2013) have shown the scattering enhancement due to hygroscopic growth for different European sites. In all but marine air-mass-influenced cases, no hysteresis effect has been observed at Melpitz, and they stated that these might occur due to high fractions of low hygroscopic organic material. Hence, the effects of the aerosol efflorescence can be neglected since the volume fraction of the organic material within the aerosol population was relatively large during the summer campaign period. A mean volume fraction of 0.58 (median = 0.59; IQR from 0.47 to 0.69) was estimated based on the chemical composition and assumed material densities between 1 and 30 June 2015.
The LR(λ) enhancement factor shows a clear dependence on the ambient RH, with an expected enhancement factor of around 1 at low RH. The observed trend follows the results reported by Ackermann (1998; solid lines in Fig. 6) for continental aerosol but with larger quantities, especially at larger RH. The aerosol sampled in this study results in an LR(λ) enhancement factor of up to 3.7 (2.4 and 2.2) at 532 nm (1064 and 355 nm) at 93.7 % RH. The power series representation of Ackermann (1998), however, resulted in an fLR(355 nm) of 1.6, fLR(532 nm) of 1.73, and fLR(1064 nm) of 1.71 at 99 % RH. Following Zhao et al. (2017), we obtain an fLR(532 nm) of 2.4 at 99 % RH.
fLR(RH, 355 nm) and fLR(RH, 1064 nm) behave similarly. The calculated LR enhancements follow the overall trend, but the data points of flight 20150617b, indicated filled circles, show a positive offset to the fit function. A predominant aerosol type on that day, which might be different from the other shown days, is assumed to be the reason for a different LR(λ) enhancement factor behavior.
γ(532 nm) is significantly larger than γ(355 nm) and γ(1064 nm), respectively. The data points sampled under ambient conditions of 60 % to 80 % RH are overrepresented in the fit. Furthermore, Mie calculations (settings of , κ=0.3, T=20 ∘C, and a core shell mixture), conducted based on the PNSD measured at Melpitz observatory during 26 June 2015, show that, in this RH range, the LR(532 nm) becomes more enhanced than the LR(1064 nm) or LR(355 nm) and might be a typical feature of the predominant aerosol or results from the model constraints. Similarly, in the results of Ackermann (1998), the LR-to-RH dependence for continental aerosol was not following the exponential curve perfectly. Also, LR(λ) for marine aerosol is more enhanced at this RH range than Ackermann (1998) reported. Therefore, the fit for 532 nm at this RH range might be overweighted, leading to an overestimation of γ(532 nm). Also, at 355 nm, Ackermann (1998) has shown a decreasing LR(355 nm) above 90 % RH, which we could not observe in this study solely based on the small number of cases and the observed RH range. The observations follow a trend similar to the reported parameterization of Zhao et al. (2017) but with a different magnitude. Although the LR enhancement was derived similarly, differences can occur because they normalized their observations to RH0=40 %. Also, they used data based on PNSD recorded in the North China Plain (NCP) and a different approach of the aerosol mixing state utilizing a mixture of internally and externally mixed aerosol with a fraction of 51 % externally mixed BC.
The results are opposed to the findings of Takamura and Sasano (1987), showing a negative correlation of LR(λ) and RH at 355 nm and a slight dependence of the LR(λ) on the RH at larger wavelengths. The opposing finding might be caused by their different analysis approach since Takamura and Sasano (1987) used PNSDs inferred from angular light scattering measurements of a polar nephelometer, including more uncertainty-increasing processing steps. Also, their Mie calculations are based on PNSD estimates at different RH levels with assumed homogeneously mixed aerosol particles, with an effective complex refractive index at the ambient state. Contrarily, our investigations are based on hygroscopic growth simulations and a core shell mixing approach. Furthermore, the limited covered size range of the aerosol particle hygroscopicity might introduce some bias in our results since the κ(Dp) estimates above 265 nm are maybe too large or too small, which would have an impact on the Mie model results, especially on σbsc, which is more sensitive to the complex aerosol refractive index than σext(λ).
Nevertheless, the presented results provide reasonable first estimates of the RH-induced LR(λ) enhancement factor based on in situ measured PNSD for the observed RH range for the aerosol conditions at Melpitz. Although Ackermann (1998) has already shown the LR-to-RH dependence for three different aerosol types (marine, continental, and desert dust), future research should collect more data to provide fLR(RH, λ) with the corresponding γ(λ) estimates, including separation into different aerosol types.
Future research should investigate the impact of the mixing state and hygroscopic growth factor representation within the Mie model on the lidar ratio enhancement factor. Also, one should investigate the impact of RH-dependent LR within the Klett–Fernald retrieval.
Table 2Overview of the fitting parameter of the LR(λ) enhancement factor. The standard error of fit is marked with parentheses.
4.2 MelCol winter
Data representing another season with different atmospheric conditions were collected and are evaluated for the winter of 2017. Exemplarily, the data of 2 measurement days within winter 2017 are discussed in the following.
4.2.1 Optical closure of Mie model and lidar during MelCol winter
Aerosol particle light absorption
During winter, two balloon launches at different levels of pollution were conducted. This part of the paper focuses on the evaluation of the model with airborne in situ measurements in a dried state. The corresponding atmospheric conditions are shown. The findings provide insights to, e.g., evaluate σabs(λ) derived from lidar with similar setups.

Figure 7(a) The 20 m layer averages of the ambient and post-dryer RH and T. (b) The aerosol particle number concentration measured by the OPSS (NOPSS) and the ratio of the standard deviation of the mean and the mean itself (solid black and red dashed line) are shown. Shaded areas around T, RH, and NOPSS represent the standard deviation of the mean in the layer. Panels (c), (d), and (f) display the aerosol particle light backscattering (σbsc(λ)), extinction (σext(λ)), and absorption coefficients (σabs(λ)). Mean values are calculated for the period 11:20–11:58 UTC on 9 February 2017. Shaded areas in panel (f) represent the standard deviation of the mean. Shaded areas around the lidar-based coefficients indicate the assumed 10 % uncertainty of σbsc(λ) and the range of possible σext(λ), following the given range of Mattis et al. (2004). Panel (e) displays the LR(λ) derived with the Mie model (dots with a range bar from min to max), and the reference of Mattis et al. (2004) with its respective uncertainty range is displayed with dashed lines. Uncertainty bars around the Mie-based coefficients cover the range from −3 to +3 times standard deviation. Uncertainty around the LR(λ) is minimum and maximum LR(λ) resulting from calculations with the 3 times standard deviation from the σbsc(λ) and σext(λ).
Figure 7a displays the vertical distribution of 20 m averages of the ambient RH (blue line), post-dryer RH (light blue line), and T (red line) measured on 9 February 2017, between 11:20 and 11:58 UTC (Fig. 7a), which is the same time window of the averaged lidar profiles. A very sharp inversion characterizes this measurement day that the balloon could not ascend through. Below, the atmosphere was well mixed, indicated by a relatively constant potential temperature of around 270 K and a stable NOPSS (Fig. 7b). NOPSS varies between 180 to 220 cm−3 within the lowermost 300 m above ground, followed by a steady decrease to around 160 cm towards 450 m. Figure 7c and d display the modeled and lidar-based σbsc(λ) and σext(λ).
Figure 8 displays the vertically resolved atmospheric parameters shown in Fig. 7 but for 9 March 2020 between 13:30 and 14:09 UTC. Compared to 9 February, 9 March is characterized by a much lower atmospheric aerosol load within the PBL, indicated by an almost 3 times smaller NOPSS. The measurement flight during this day could profile the atmosphere up to an altitude of around 1080 m, and the entire planetary boundary layer was covered. The top of the PBL reached an altitude of around 750 m, indicated by the temperature inversion at this height (see Fig. 8a).
The profiles of the Mie modeled and measured σabs(λ) in the dried state conducted on 9 February and 9 March 2017 are shown in Figs. 7f and 8f. The linear fit and the corresponding fittings are displayed in Figs. 9c and 10c, and the fitting parameters are given in Table 3.
On 9 February, between 11:00 and 12:00 UTC, and 9 March, between 13:00 and 15:00 UTC, the MAAP on the ground measured a mean σabs(637 nm) of 21.2 and 1.46 Mm−1, respectively (Figs. 7f and 8f; black dot), which was 6.1 % and 12.9 % larger than the average σabs(624 nm) measured by the STAP within the lowermost 200 m above ground (20.0, 1.3 Mm−1).
The spectral behavior of the σabs(λ) can be described with the absorption Ångström exponent (AAE) as follows:
The AAESTAP(624, 450 nm) was 1.64±0.02, on average, within the lowermost 700 m on 9 February and is slightly larger than the daily mean AAEAE33(660, 450 nm) of 1.49 (±0.08 standard deviation of the mean) derived from parallel conducted, spectrally resolved, σabs(λ) measurements of an Aethalometer at Melpitz (model AE33; Magee Scientific, Berkeley, CA, USA). For 9 March 2017, we could not compare the AAE since the AE33 stopped its measurements on 22 February 2017. The comparison of the AAESTAP(624, 450 nm) with AAEAE33(660, 450 nm) and of σabs,STAP(624 nm) with the MAAP indicates a decent representation of the σabs(λ) derived by the STAP. Comparing the measurements of the MAAP and AE33, in the period between 4 and 22 February 2017, reveals a dependence of σabs,AE33(635 nm) = 1.27σabs,MAAP(637 nm).
As shown in Fig. S4b, in the winter period, the Mie model simulates, on average, around 8 % larger σabs(637 nm) than that measured by the MAAP. For the airborne measurements, the assumptions within the Mie model to derive σabs(λ) in the dried state lead to a 12.1 % (±1.1) and 4.2 % (±1.7) underestimation at 450 and 525 nm and to an 11 % (±1.4) overestimation at 624 nm, respectively, on 9 February (see Figs. 9c and 7f) and indicates a spectral dependence. On 9 March 2017, an 88 % to 92 % overestimation of the airborne measured σabs(λ) was observed (see Figs. 10c and 8f).
At the ground, the Mie simulation based on the aerosol microphysical measurements calculates a σabs,Mie(630 nm) on 9 February (9 March), which is 12.8 % (103 %) larger than that measured by the MAAP at 637 nm. The assumptions within the model, which lead to the overestimation of the ground-based σabs(λ) estimates, also propagate into the airborne modeling. An overestimation of 103 % indicates aerosol conditions during 9 March, which the model cannot capture. For instance, the estimated MAC(637 nm), which indirectly leads to the eBC volume fraction used within the model, is likely too small probably due to too small mEC measurements. However, we consider EC as being eBC, which introduces some bias in the MAC(637 nm) estimate. In particular, on 9 February, a MAC(637 nm) of 10.9 m2 g−1 is derived; on 9 March, there is a small MAC(637 nm) of 6.6 m2 g−1. On 10 March, the MAC(637 nm) estimate is almost as double that of 9 March and indicates a transition to another aerosol mass during that day (see Fig. A1).
Zanatta et al. (2018) and Yuan et al. (2021), e.g., have shown that the mixing of BC is an important parameter influencing the value of the MAC(λ) directly. They reported MAC(λ) for pure externally mixed BC aerosol particles. For Melpitz, during the winter period of this study and applying an AAE of 1, the MAC(870 nm) of 5.8 m2 g−1 reported by Yuan et al. (2021) translates to 7.9 m2 g−1 at 637 nm. With an AAE of 1, modeled MAC(550 nm) for pure BC particles reported by Zanatta et al. (2018) translates into very small (3.5 to 5.7 m2 g−1) particles at 637 nm, depending on the particle size. Nevertheless, the MAC(637 nm) on 9 February coincides with the estimates of Yuan et al. (2021). Therefore, on 9 February 2017, σabs,Mie(624 nm) and σabs,STAP(624 nm) agree reasonably well within 11 %, since a MAC estimated at 637 nm represents 624 nm reasonably well.
The core shell mixing representation within the model does not apply to the aerosol on 9 March because a MAC(637 nm) is in the range of the estimates of Yuan et al. (2021), and Zanatta et al. (2018) indicate an external mixture rather than an internal core shell mixture. The larger MAC(637 nm) on 9 February, on the other hand, suggests a good representation of the mixing state of the prevalent aerosol.
The AAE can explain the spectral dependence for both days. Within the lowermost 700 m above ground, a median AAEMie(624 and 450 nm) of 0.94 is found on 9 February and of 1.05 on 9 March, respectively. The corresponding median AAESTAP(624 and 450 nm) of 1.64 on 9 February and of 1.08 on 9 March indicated a significant amount of BrC aerosol particles, according to Zhang et al. (2020). The AAE of BC is near unity at visible and near-infrared wavelengths (e.g., Kirchstetter and Thatcher, 2012) and can go as high as 1.6 when BC is coated with a transparent material (Lack and Cappa, 2010). The values of AAEMie(624 and 450 nm) of around 1 agree with these findings. AAESTAP on both days and AAEAE33 on 9 February indicate the presence of BrC. BrC contributes less to the absorption at near-infrared wavelengths and shows an increasing contribution to the aerosol particle light absorption towards UV wavelengths (e.g., Kim et al., 2020; Sun et al., 2007). The daily mean volume fraction of organic material detected by the Q-ACSM on 9 February is 45.1 %, peaking at around 50 % during the flight time. On 9 March, during flight time, a volume fraction of 34.4 % is found with values as small as 17 % in the morning hours. The small volume fraction (9 March) has less impact on the Mie model and leads to the small spectral dependence of the overestimation. The larger volume fraction on 9 February, on the other hand, indicates a large content of BrC and, hence, a larger spectral dependence of the deviation.
To summarize, for 9 March, it is more likely that a combination of the aerosol mixing representation within the model and the possibly too small MAC(637 nm) led to the overestimation by the model rather than the missing BrC. An overlap over measurement and model uncertainties is achieved in a maximum of 10 % of the cases. For 9 February, the agreement within 11 % at 624 nm indicates that the MAC(637 nm) represents the prevalent aerosol within a satisfying range; the missing BrC content within the model resulted in a larger spread in the agreement from a underestimation of 12.1 % to 11 % overestimation. The mixing approach within the model seemed to have better represented the aerosol present on 9 February. The fraction of overlapping uncertainties is 1 for 624 nm, 0.95 for 525 nm, and 1 for 450 nm.
In conclusion, when used for, e.g., the validation of lidar-based aerosol particle light absorption estimates, one should (a) consider the mixing state of the aerosol, or include this in the uncertainty analysis, and (b) include BrC with a spectrally resolved MAC(λ).
Aerosol particle light backscattering and extinction coefficient
The comparison of the lidar estimates of σbsc(λ) and σext(λ) with the modeled values is conducted and is shown below.
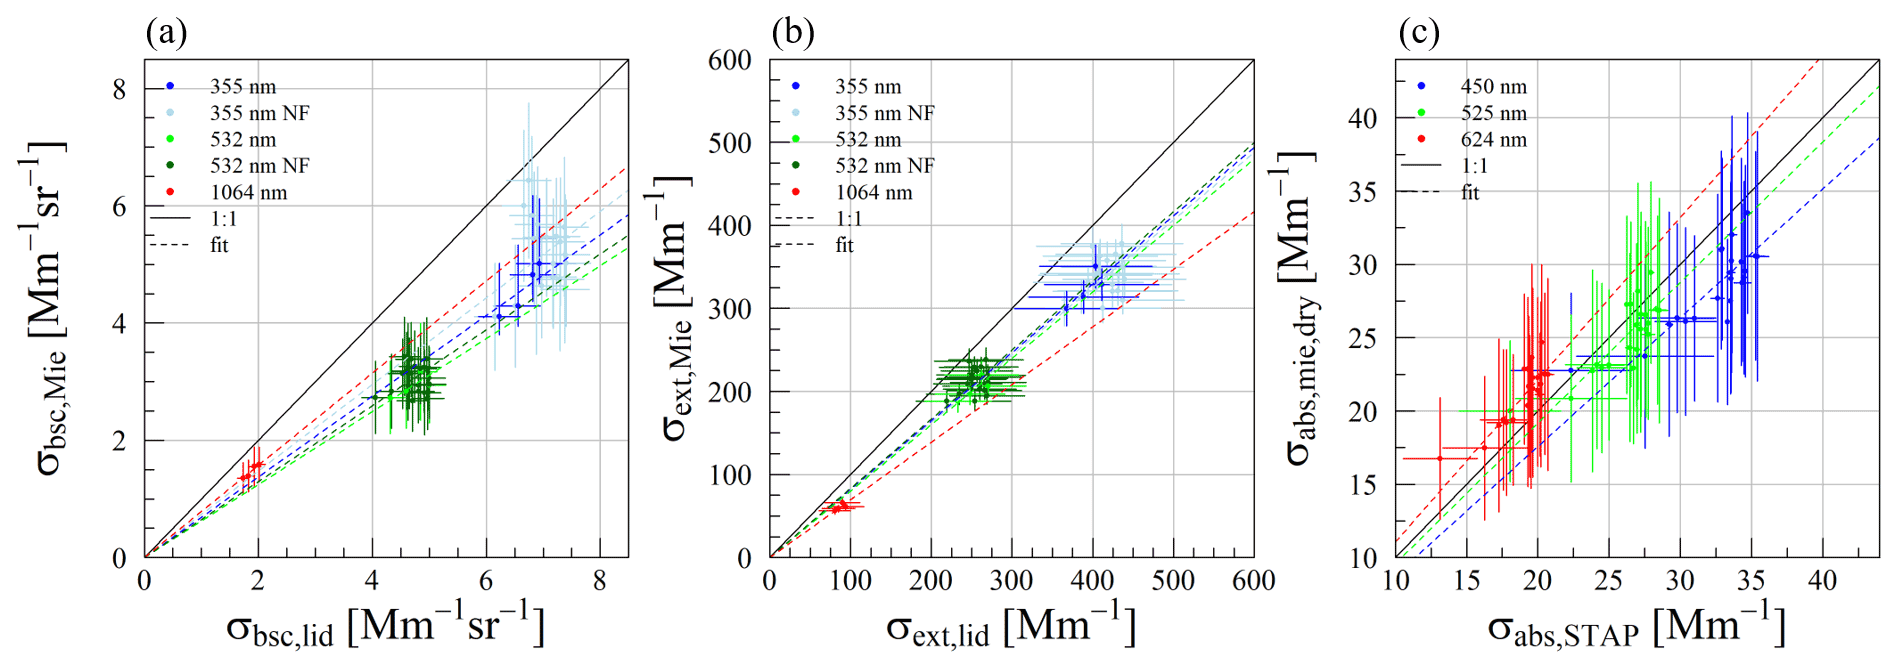
Figure 9Optical coefficients derived with the Mie model (ambient for extinction a and backscattering b; dry for absorption c) based on the data from 9 February plotted against the coefficients derived with lidar and STAP, respectively. The black line indicates the 1:1 line, and colors represent the respective wavelengths. Horizontal error bars indicate the uncertainty range of the lidar estimates for backscattering and extinction; for measured absorption, they represent the standard deviation of the mean. Vertical error bars indicate 3 times the standard deviation of the mean in the case of the Mie model.
The σbsc(λ) and σext(λ) are displayed in panels (c) and (d) of Figs. 7 and 8 for 9 February and 9 March 2017. Dots represent the Mie modeled coefficients; error bars are the 3 times standard deviation of the mean. Lines in corresponding colors represent the lidar estimates.
Figures 9a and b and 10a and b display the correlation of the modeled and measured σbsc(λ) and σext(λ) shown in Figs. 7c and d and 8c and d, correspondingly. The linear fit estimates, the corresponding standard error of fit, and correlation coefficients are given in Table 3. Note that the shown fit of Fig. 9 (Fig. 10) is forced through the coordinate origin, which artificially enhances the coefficient of determination R2. The fits are forced through zero since (a) the range of the values of the observed optical coefficients was small and (b) because both model and measurements rely on the present aerosol, and if no aerosol is prevalent, both the model and observation should be zero. Therefore, results of R2 should be considered with care.
For 9 February, considering all wavelengths and field-of-view configurations, the model results agree with the measured σbsc(λ) within 21.2 % at 1064 nm to 37.8 % at 532 nm. At 1064 nm, the modeled aerosol particle light extinction coefficients are up to 30.5 % (±1.8) smaller than those derived based on the lidar measurements with a mean underestimation of 18.3 % (±0.8). An overlap of the uncertainties is achieved at 355 nm in 25 % of the cases and in 37 % when considering the near-field channel. At 532 nm, no overlap is achieved. Due to the small number of cases, the 100 % overlap at 1064 has to be considered with care. However, the modeled extinction agrees with the lidar-based estimates in 100 % of the cases considering overlapping uncertainty ranges but is, on average, 18 % to 30 % smaller.
We can only speculate about the underlying reasons. First, correcting the smaller aerosol particles with the altitude correction factor might underestimate the number concentration of the aerosol particles up to 300 nm in diameter. Particles with about the same size as the incoming radiation wavelength are most efficient in scattering. In the study of Virkkula et al. (2011), aerosol particles in the range of 100 to 1000 nm contribute most to the aerosol particle light scattering at 550 nm. Therefore, at 355 nm, an artificial undersampling of the aerosol particles up to 300 nm in diameter induced by the altitude correction factor could lead to underestimating the modeled aerosol particle light scattering and, thus, extinction. Also, the Mie model and the refractive index correction of the OPSS did not consider non-spherical particles, leading to a bias induced by the underlying PNSD. Moreover, some deviations can be explained by the wavelength-independent complex refractive index of the aerosol and by the presence of non-captured, huge particles, as discussed in the summer part. However, all modeled σext(λ) match the range of aerosol particle light extinction coefficients calculated with the minimum and maximum LR(λ) provided by Mattis et al. (2004).
Figure 7e shows the LR(λ), with the range bars indicating the minimum and maximum value of the ambient state Mie modeling result. A clear positive connection between the LR(λ) and RH is significant in the summer cases. Overall, the average LR(λ) in the shown profile is 63.8 sr at 355 nm, 69.0 sr at 532 nm, and 37.6 sr at 1064 nm, which is in the range of the LR(λ) reported by Mattis et al. (2004), except for the LR(532 nm) at 532 nm which was 7.8 % larger than the maximum reported LR(532 nm). However, these LR(λ) seem reasonable since Catrall et al. (2005) reported an LR(550 nm) of around 70 sr for aerosol classified as urban/industrial aerosol, and Omar et al. (2009) estimated an LR(532 nm) of 70 sr for aerosol classified as polluted continental aerosol and smoke. Considering the origin of the aerosol (an industrial area in south Poland), these results appear conclusive.
Considering 9 March 2017, comparing the Mie model results with the lidar-based estimates results in an underestimation at 1064 nm in backscattering by about 14 % (0.86±0.02). Thereby, an overlap of the uncertainties ranges is achieved in 69 % of the cases. In extinction, the underestimation is as large as 36 % (0.64±0.02), respectively, with an overlap in 69 % of 50 cases. In the case of backscattering, the underestimation increases with a decrease in wavelength (overlap of the uncertainty ranges in 12.5 % of the cases at 355 nm) and indicates that a wavelength-dependent complex refractive index is needed to precisely model σbsc(λ). Overall, the conditions have been relatively clean and were similar to the shown cases of the summer campaign, with roughly the same amount of aerosol particle light absorption. The summer results show an underestimation of the lidar estimates by the Mie model with similar slopes of the linear fit. The assumption within the Mie model in the dried state results in good agreement with in situ measurements of σext(λ) and σsca(λ), overestimating the in situ measured σabs(λ). However, the hygroscopic growth, the refractive index of the aerosol particles estimated by their chemical composition, or the refractive index for the correction of the OPSS, might be inaccurate. However, using the ZSR-based real part of the complex refractive index of 1.56 during both days cannot explain the lidar and Mie model differences. Applying this real part to the data of 9 February, the slope of the correlation changes within absolute values of −0.055 to 0.045 compared to a real part of 1.54.
Nevertheless, most of the modeled σext(λ) match with the lidar estimates within the range of the LR(λ) estimates of Mattis et al. (2004). Except above 450 m altitude and 355 nm wavelength, the modeled σext(λ) is significantly smaller than the lidar estimates, indicating an underestimation of the aerosol particle number concentration at this altitude and size range caused probably by an inaccurate altitude correction factor of the PNSD.
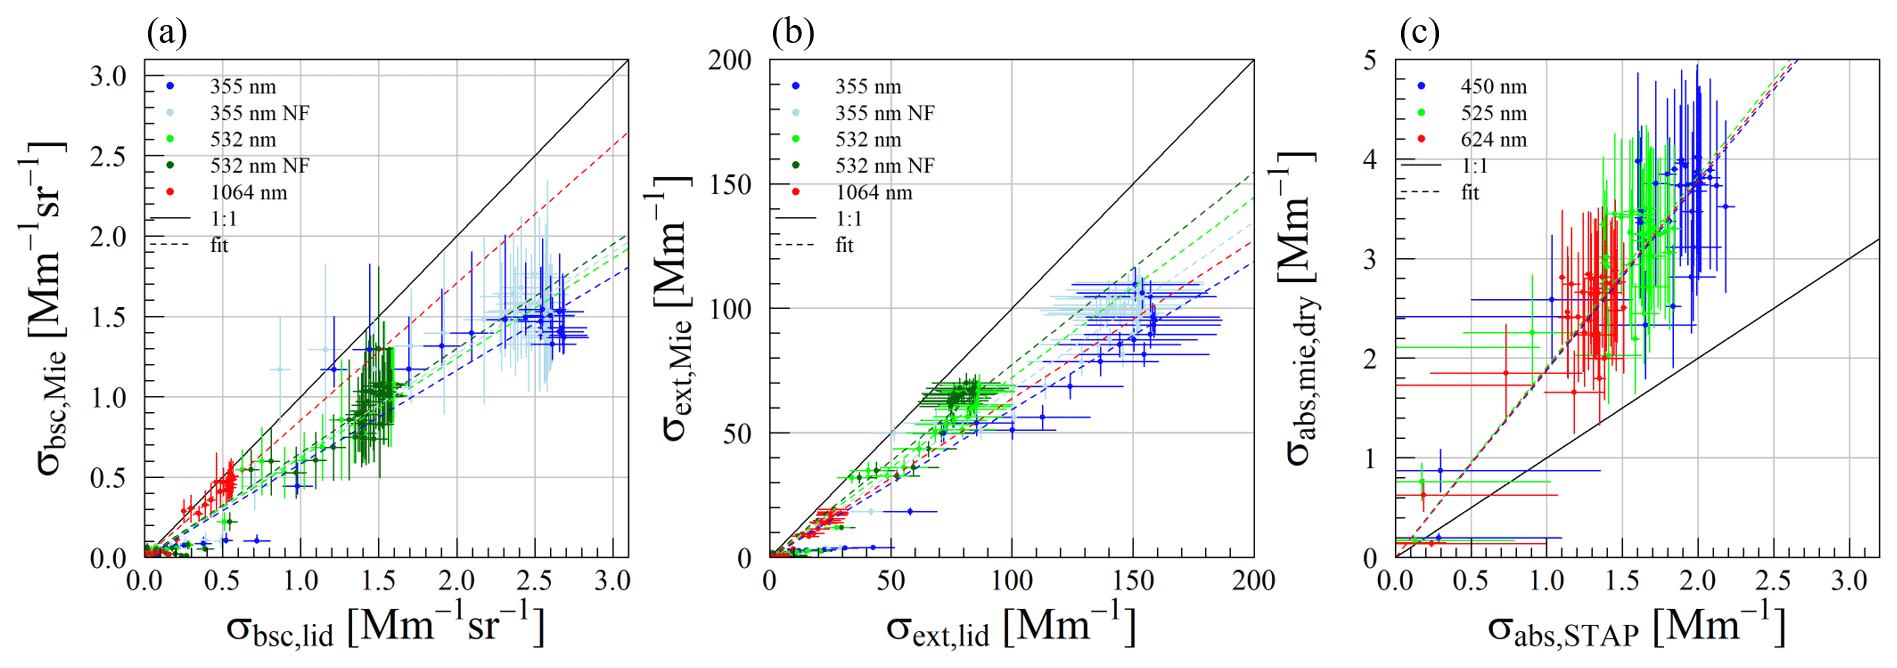
LRMie(λ) estimates are shown in Fig. 8e. Within the planetary boundary layer, below an altitude of 600 m, where the ambient RH is stable, the LRMie(λ) agrees with the Mattis et al. (2004) estimates. At 355 nm, a mean LRMie(355 nm) of 64.2 sr, at 532 nm an LRMie(532 nm) of 65.7 sr, and at 1064 nm an LRMie(1064 nm) of 34.3 sr was calculated, indicating that the aerosol observed here was of the type of urban haze. Like in the profile of 9 February 2017, the vertical distribution of the LRMie(λ) follows the trend of the ambient RH. The uncertainty of the LRMie(λ) estimates increases with an increasing standard deviation of the ambient RH.
Table 3Fitting estimates with the standard error and coefficients of determination (R2) of the linear fits shown in Figs. 9 and 10. The abbreviation NF indicates the near-field channel of the lidar.

To summarize, the Mie model reproduces σext(λ) at an ambient state closer to the lidar estimates at the more polluted case, whereas, in the clean case, the underestimation is larger. In the case of σext(λ), no spectral trend is observed in terms of agreement, indicating a bias induced by the PNSD rather than by the complex aerosol refractive index. At 1064 nm, also, the Mie model results are closest to the measured σbsc(λ). That might hint that utilizing an altitude correction factor for the ground in situ PNSD measurements cannot reproduce the PNSD aloft of Melpitz, at least in the lower size ranges. Equivalent to the summer cases, the findings of De Leeuw and Lamberts (1987) and Ferrero et al. (2019) may explain the observed results. However, modeling and lidar estimates underlie uncertainties, meaning that the modeled results could be too small but also that the lidar estimates could be too large, especially in the extinction where the LR(λ) is subject to an extensive uncertainty range.
The underlying reasons are speculative, and many parameters within the model can be varied. However, for σbsc(λ) and σext(λ), we do not suspect that the missing BrC within the model would result in significantly different results. Nevertheless, considering the limitations of the measurements setup, e.g., the limited covered size range and no vertically resolved chemical composition measurements, the results are promising.
This study presents the comparison of lidar estimates of σbsc(λ) and σext(λ) with airborne in situ measurement-based modeled ones and examines the effect of the RH to the aerosol particle light extinction-to-backscatter ratio. Also, it evaluates modeled σabs(λ) with measured airborne ones in a dried state to determine whether the presented model can be utilized to evaluate lidar-based aerosol particle light absorption estimates. For this purpose, the results of two field campaigns near Melpitz conducted in the summer of 2015 and February–March 2017, covering different states of aerosol load and atmospheric conditions, are utilized. There were two different airborne systems deployed in the two campaigns to carry out in situ aerosol measurements, complemented by a set of state-of-the-art ground-based in situ instrumentation. A polarization Raman lidar system was directly measuring the aerosol particle light backscattering coefficient at three wavelengths. In this study, a height-constant LR(λ) is utilized to derive aerosol particle light extinction profiles from aerosol particle light backscattering profiles derived by the lidar system.
The in situ measurements are used to calculate aerosol optical properties using Mie theory. A core shell mixture of the aerosol particles is assumed. The chemical composition of the aerosol particles measured on the ground is set to constant for all considered particle sizes and is assumed to represent all altitudes above ground. The model validation under dry conditions confirms the underlying assumptions with modeled values by matching the in situ measurements within 18 %. An additional module of the Mie model calculates the aerosol optical properties in the ambient state utilizing a hygroscopic growth simulation based on the κ–Köhler theory. In both campaigns, the airborne-based PNSD is extended with height-extrapolated ground-based in situ PNSD measurements.
Ambient-state Mie model results and lidar measurements are compared with each other. On average, over the considered cases, the Mie model calculates aerosol optical coefficients up to 32 % smaller than the lidar for the summer. The best agreement was found for 532 nm within 3.4 % to 32.6 %. The model results were up to 42 % smaller for the winter. For 1064 nm, the best agreement within 14 % is found for a relatively polluted case, which falls within the reported uncertainty range.
In both campaigns, a spectral dependence in the slope of the linear fit of the modeled and measured σbsc(λ) is observed, whereas in σext(λ) it is not. The results agree with findings of previous studies which have shown that σext(λ) is less sensitive to the complex aerosol refractive index than σbsc(λ) and is more driven by the PNSD. The results are promising since the σbsc(λ) especially requires an exact determination of the aerosol state in terms of PNSD and chemical composition (refractive index and mixing state) and considering that many aerosol optical parameters are compared at once.
The Mie model result is compared to the filter-based airborne in situ σabs(λ) measurements in the winter campaign. In the more polluted case, the Mie model derives σabs(λ), which agrees within 12 % with the in situ observations. The agreement shows a distinct spectral dependence. The Mie model calculates up to factor of 2 larger σabs(λ), with a small spectral dependence in the cleaner case. The results indicate that the mixing state of the aerosol, the wavelength-dependent complex refractive index of the aerosol compounds, and the BrC content must be accurately represented by the model to match the measured σbsc(λ) within a narrow uncertainty range.
Utilizing a height-constant LR(λ) is widely applied to determine σext(λ) from σbsc(λ) and within the Klett–Fernald retrieval. The modeled LR(λ) shown here is in the range of LR(λ) estimates presented by previous studies for different aerosol types. In both campaigns, the Mie model ambient state calculations, however, revealed a dependence of the LR(λ) on the ambient RH and resulted in an RH and wavelength-dependent LR(λ) enhancement factor expressed with the following term: , with forced through one. Estimates of γ(λ) are derived based on the summer campaign data set.
Various reasons that can lead to a disagreement between lidar and modeling are identified, and the overview provides a valuable set of suggestions for future campaign planning, with a focus on comparing in situ and remote sensing results.
We conclude the following:
-
Conducting comparison studies of aerosol optical properties, e.g., to validate lidar-based σabs(λ), requires a precise determination of the aerosol mixing state, its composition, the inclusion of BrC, and the application of a wavelength-dependent complex refractive index. Information on size- and height-resolved aerosol composition is needed.
-
Observing aerosol particles above a size of 10 µm would ensure that these non-observed particles would not cause a significant bias, based on De Leeuw and Lamberts (1987).
-
By knowing the connection between RH and the LR(λ), the LR(λ) enhancement can be a valuable tool to estimate the LR(λ) at ambient state when the dry-state LR(λ) is known. Also, it allows one to calculate the LR(λ) back in the dry state when the LR(λ) is directly measured in the ambient state and an RH profile is known, e.g., via radio soundings.
-
Conducting long-term measurements to verify the LR(λ) enhancement estimates for various aerosol types and different seasons must, however, be done.
Table A1Density ρ and hygroscopicity parameter κ of the aerosol compounds to derive the volume fraction of each compound. The densities follow a Lin et al. (2013) and references therein (Tang, 1996; Chazette and Louisse, 2001; Sloane, 1986; Haynes, 2011; Seinfeld and Pandis, 2006; Eichler et al., 2008), b Moteki et al. (2010), c Kreidenweis et al. (2008) and references therein (Tang and Munkelwitz, 1994; Marcolli et al., 2004), d Petters and Kreidenweis (2007), e Wu et al. (2013), f Zaveri et al. (2010), and g Liu et al. (2014).
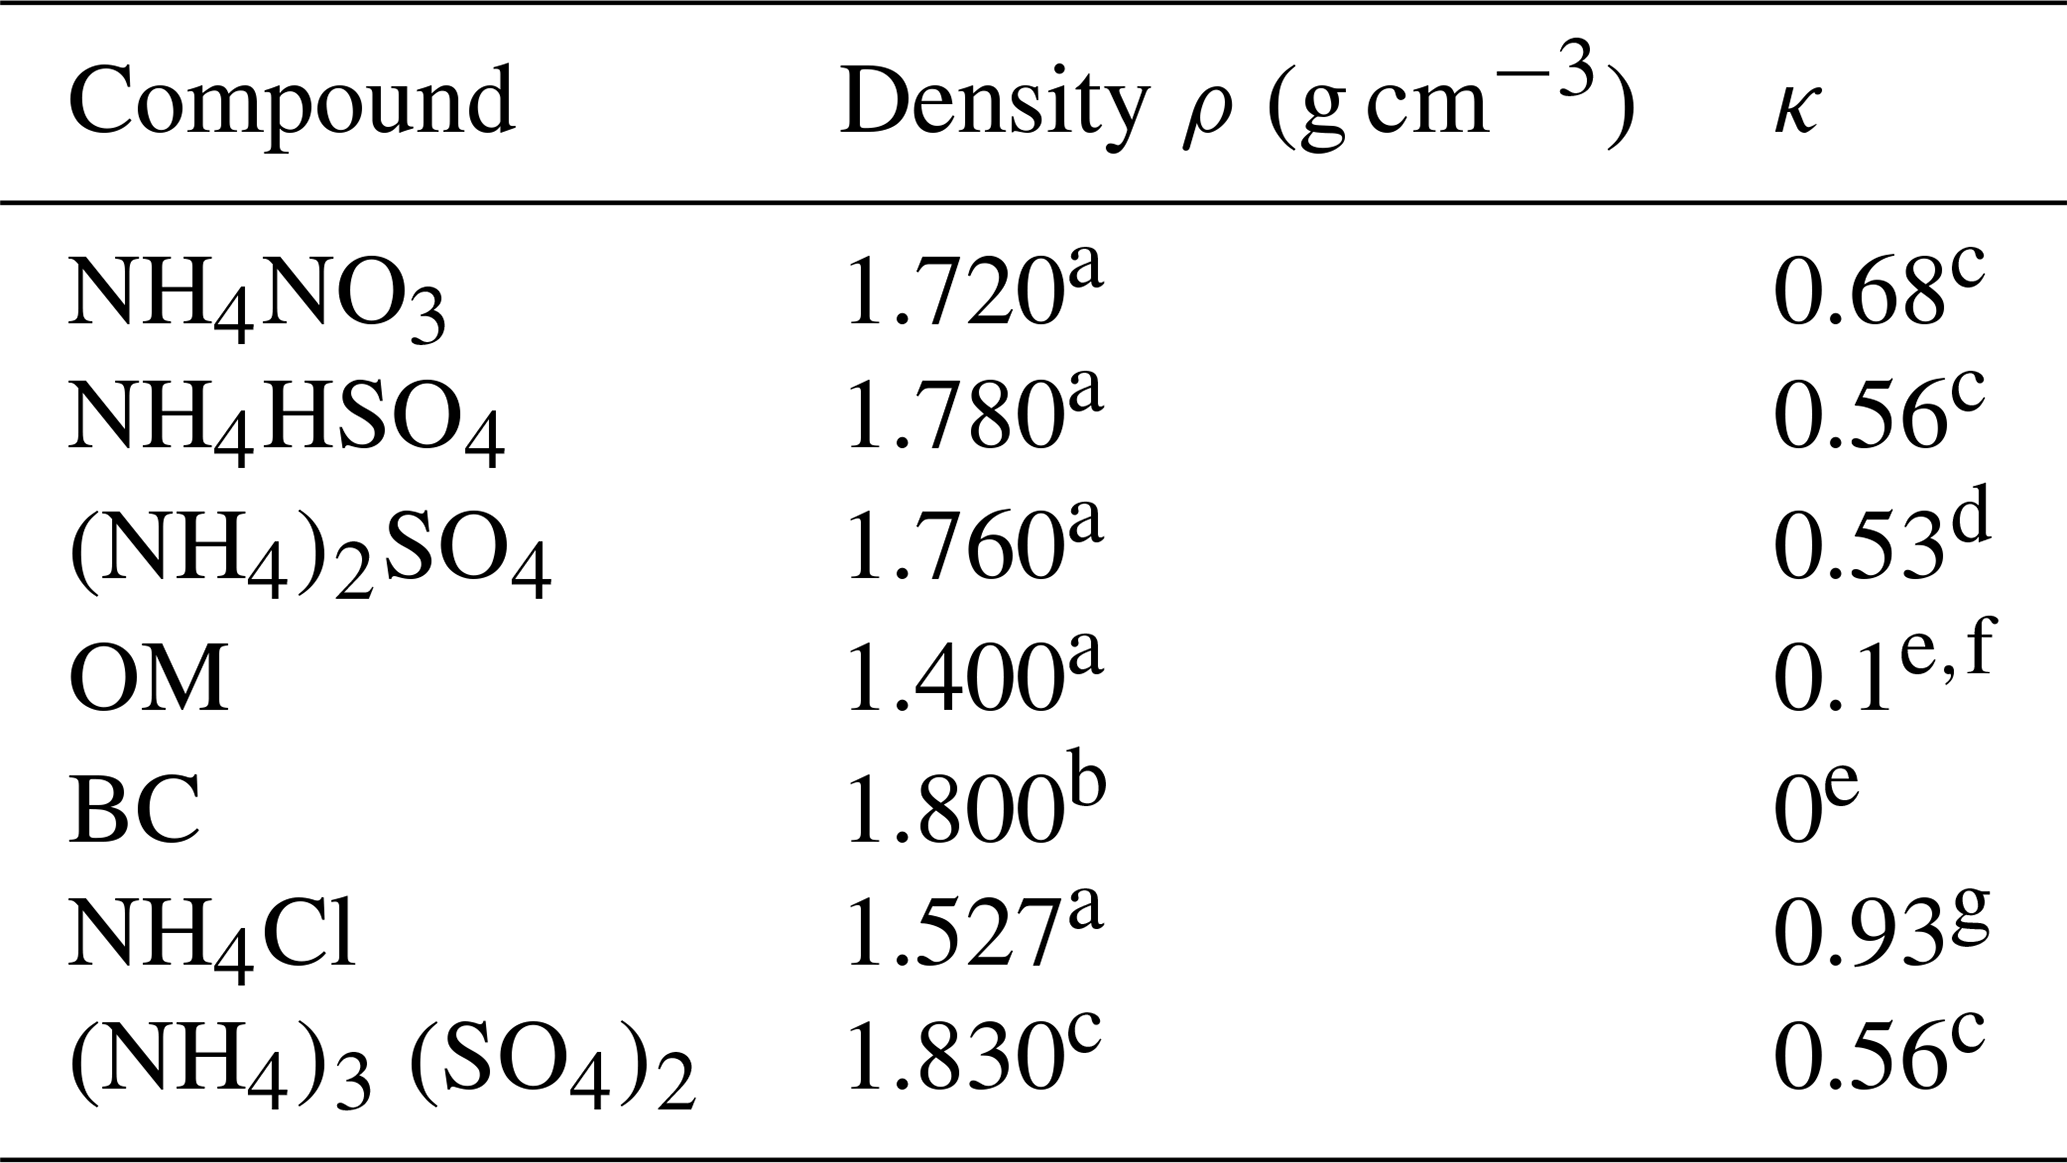

Figure A1MAC (637 nm) derived from measurements of the aerosol particle light absorption at 637 nm and mass concentration of elemental carbon at Melpitz observatory. The horizontal dashed line indicates the median of the shown period. Panel (a) displays the period from 1 to 30 June 2015. Panel (b) displays 1 February to 15 March 2017.
Table A2Overview of the input parameters of the Mie model, the corresponding assumed uncertainties, and the underlying type of distribution for the variation of the input parameter.
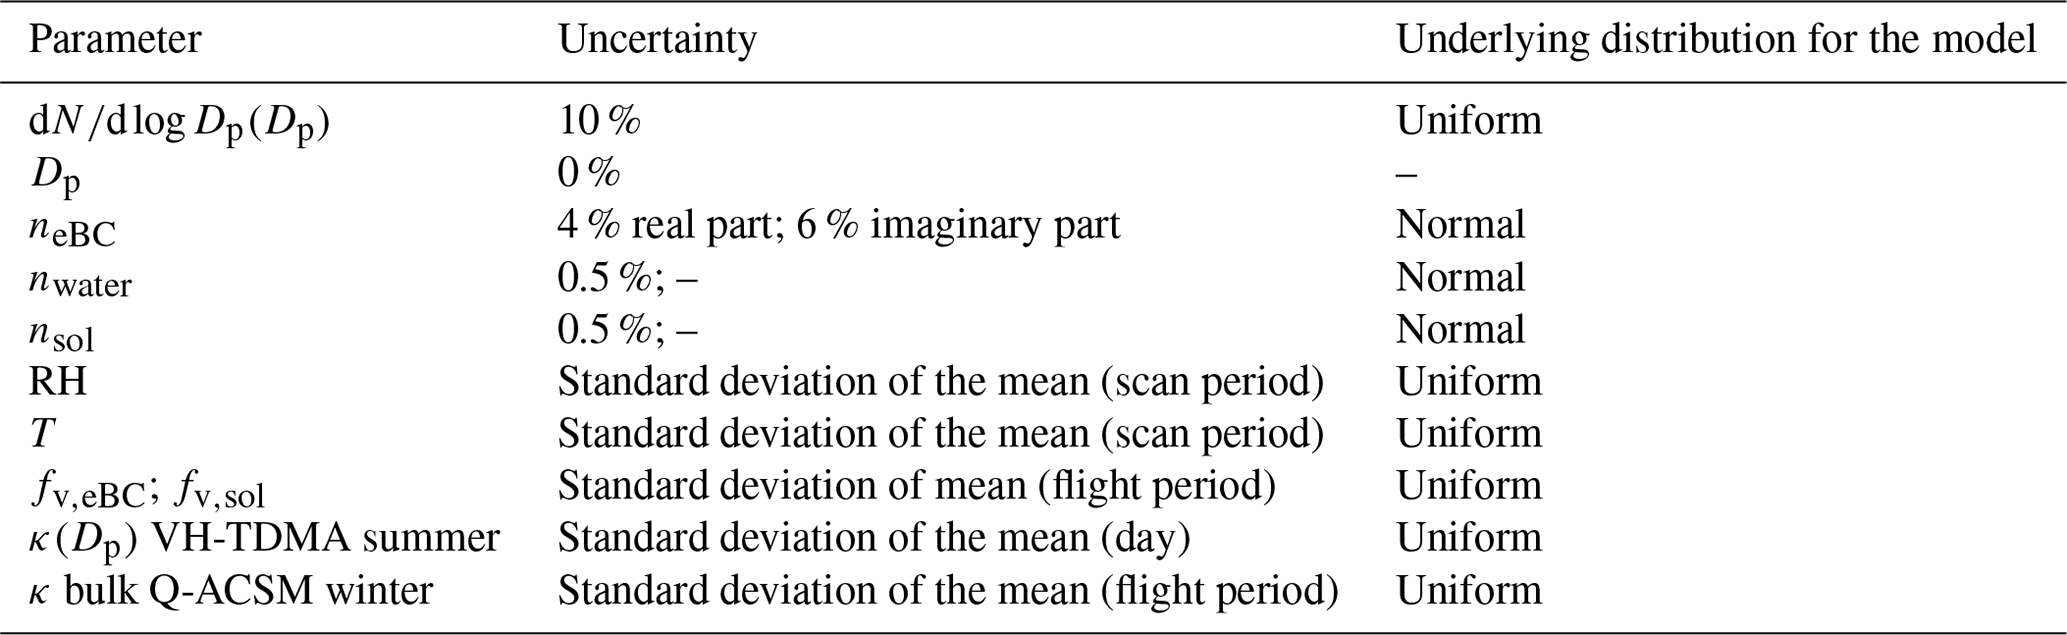
Q-ACSM, MAAP, the nephelometer, EC, and T-SMPS data are available at the NILU EBAS database under http://ebas-data.nilu.no/default.aspx (last access: 10 November 2021). All other data have been uploaded and are available at https://doi.org/10.5281/zenodo.5608560 (Düsing et al., 2021).
The supplement related to this article is available online at: https://doi.org/10.5194/acp-21-16745-2021-supplement.
The authors SD, BW, AA, and HB were responsible for the conceptualization of the study. SD did the data curation, investigation, and development of the methodology. Furthermore, for the study, data were provided by CD (VH-TDMA), GS (filter sampling data), LP (Q-ACSM), JCC (airborne CAPS data), TT (MPSS and APSS at Melpitz), TM (MAAP at Melpitz), and HB (lidar). Any software not included for processing was written by SD. BW, TM, HB, BW, and AW supervised the study. SD produced all figures and wrote the original draft of the paper. The reviewing and editing of the paper were done by SD, AA, HB, JCC, CD, MGB, TM, LP, GS, TT, BW, and AW.
The authors declare that they have no conflict of interest.
Publisher's note: Copernicus Publications remains neutral with regard to jurisdictional claims in published maps and institutional affiliations.
We gratefully thank the competent help of the technicians Thomas Conrath, Astrid Hofmann, and Ralf Käthner. We thank Holger Siebert, for setting up and building ACTOS. We express our deepest gratitude to all other TROPOS employees, who supported us with energy and passion before, during, and after the campaigns, and we thank all participants for helping to tame the balloon during the winter campaign. Moreover, we are very thankful to the helicopter pilots Alwin Vollmer and Jürgen Schütz, for the secure helicopter flights during the summer campaign. The authors, furthermore, thank Dieter Schell of enviscope GmbH, for his expertise. We also thank Anke Rödger of TROPOS, for providing and conducting the filter measurement samples of Melpitz. Joel C. Corbin and Martin Gysel-Beer received financial support from the ERC (grant no. 615922-BLACARAT), the ACTRIS2 project funded by the EU (H2020; grant no. 654109), and the Swiss State Secretariat for Education, Research, and Innovation (SERI; contract no. 15.0159-1).
This research has been supported by the European Commission, FP7 Ideas: European Research Council (BLACARAT; grant no. 615922), the European Commission, European Research Council (ACTRIS-2; grant no. 654109), and the Staatssekretariat für Bildung, Forschung und Innovation (grant no. 15.0159-1).
This paper was edited by Zhanqing Li and reviewed by three anonymous referees.
Ackermann, J.: The Extinction-to-Backscatter Ratio of Tropospheric Aerosol: A Numerical Study, J. Atmos. Ocean. Tech., 15, 1043–1050, https://doi.org/10.1175/1520-0426(1998)015<1043:TETBRO>2.0.CO;2, 1998.
Alas, H. D. C., Weinhold, K., Costabile, F., Di Ianni, A., Müller, T., Pfeifer, S., Di Liberto, L., Turner, J. R., and Wiedensohler, A.: Methodology for high-quality mobile measurement with focus on black carbon and particle mass concentrations, Atmos. Meas. Tech., 12, 4697–4712, https://doi.org/10.5194/amt-12-4697-2019, 2019.
Althausen, D., Engelmann, R., Baars, H., Heese, B., Ansmann, A., Müller, D., and Komppula, M.: Portable Raman Lidar PollyXT for Automated Profiling of Aerosol Backscatter, Extinction, and Depolarization, J. Atmos. Ocean. Tech., 26, 2366–2378, https://doi.org/10.1175/2009JTECHA1304.1, 2009.
Altstädter, B., Platis, A., Jähn, M., Baars, H., Lückerath, J., Held, A., Lampert, A., Bange, J., Hermann, M., and Wehner, B.: Airborne observations of newly formed boundary layer aerosol particles under cloudy conditions, Atmos. Chem. Phys., 18, 8249–8264, https://doi.org/10.5194/acp-18-8249-2018, 2018.
Anderson, T. L. and Ogren, J. A.: Determining Aerosol Radiative Properties Using the TSI 3563 Integrating Nephelometer. Aerosol. Sci. Technol., 29, 57–69, https://doi.org/10.1080/02786829808965551,1998.
Ansmann, A., Tesche, M., Groß, S., Freudenthaler, V., Seifert, P., Hiebsch, A., Schmidt, J., Wandinger, U., Mattis, I., Müller, D., and Wiegner, M.: The 16 April 2010 major volcanic ash plume over central Europe: EARLINET lidar and AERONET photometer observations at Leipzig and Munich, Germany, Geophys. Res. Lett., 37, L13810, https://doi.org/10.1029/2010GL043809, 2010.
Augustin-Bauditz, S., Wex, H., Denjean, C., Hartmann, S., Schneider, J., Schmidt, S., Ebert, M., and Stratmann, F.: Laboratory-generated mixtures of mineral dust particles with biological substances: characterization of the particle mixing state and immersion freezing behavior, Atmos. Chem. Phys., 16, 5531–5543, https://doi.org/10.5194/acp-16-5531-2016, 2016.
Baars, H., Kanitz, T., Engelmann, R., Althausen, D., Heese, B., Komppula, M., Preißler, J., Tesche, M., Ansmann, A., Wandinger, U., Lim, J.-H., Ahn, J. Y., Stachlewska, I. S., Amiridis, V., Marinou, E., Seifert, P., Hofer, J., Skupin, A., Schneider, F., Bohlmann, S., Foth, A., Bley, S., Pfüller, A., Giannakaki, E., Lihavainen, H., Viisanen, Y., Hooda, R. K., Pereira, S. N., Bortoli, D., Wagner, F., Mattis, I., Janicka, L., Markowicz, K. M., Achtert, P., Artaxo, P., Pauliquevis, T., Souza, R. A. F., Sharma, V. P., van Zyl, P. G., Beukes, J. P., Sun, J., Rohwer, E. G., Deng, R., Mamouri, R.-E., and Zamorano, F.: An overview of the first decade of PollyNET: an emerging network of automated Raman-polarization lidars for continuous aerosol profiling, Atmos. Chem. Phys., 16, 5111–5137, https://doi.org/10.5194/acp-16-5111-2016, 2016.
Birmili, W., Stratmann, F., and Wiedensohler, A.: Design of a DMA-based size spectrometer for a large particle size range and stable operation, J. Aerosol Sci., 30, 549–553, https://doi.org/10.1016/S0021-8502(98)00047-0, 1999.
Birmili, W., Weinhold, K., Rasch, F., Sonntag, A., Sun, J., Merkel, M., Wiedensohler, A., Bastian, S., Schladitz, A., Löschau, G., Cyrys, J., Pitz, M., Gu, J., Kusch, T., Flentje, H., Quass, U., Kaminski, H., Kuhlbusch, T. A. J., Meinhardt, F., Schwerin, A., Bath, O., Ries, L., Gerwig, H., Wirtz, K., and Fiebig, M.: Long-term observations of tropospheric particle number size distributions and equivalent black carbon mass concentrations in the German Ultrafine Aerosol Network (GUAN), Earth Syst. Sci. Data, 8, 355–382, https://doi.org/10.5194/essd-8-355-2016, 2016.
Bond, T. C. and Bergstrom, R. W.: Light Absorption by Carbonaceous Particles: An Investigative Review, Aerosol Sci. Technol., 40, 27–67, https://doi.org/10.1080/02786820500421521, 2006.
Bond, T. C., Anderson, T. L., and Campbell, D.: Calibration and Intercomparison of Filter-Based Measurements of Visible Light Absorption by Aerosols, Aerosol Sci. Technol., 30, 582–600, https://doi.org/10.1080/027868299304435, 1999.
Brunamonti, S., Martucci, G., Romanens, G., Poltera, Y., Wienhold, F. G., Hervo, M., Haefele, A., and Navas-Guzmán, F.: Validation of aerosol backscatter profiles from Raman lidar and ceilometer using balloon-borne measurements, Atmos. Chem. Phys., 21, 2267–2285, https://doi.org/10.5194/acp-21-2267-2021, 2021.
Bühl, J., Seifert, P., Wandinger, U., Baars, H., Kanitz, T., Schmidt, J., Myagkov, A., Engelmann, R., Skupin, A., Heese, B., Klepel, A., Althausen, D., and Ansmann, A.: LACROS: the Leipzig Aerosol and Cloud Remote Observations System, Proc. SPIE 8890, Remote Sensing of Clouds and the Atmosphere XVIII; and Optics in Atmospheric Propagation and Adaptive Systems XVI, 889002, https://doi.org/10.1117/12.2030911, 2013.
Cattrall, C., Reagan, J., Thome, K., and Dubovik, O.: Variability of aerosol and spectral lidar and backscatter and extinction ratios of key aerosol types derived from selected Aerosol Robotic Network locations, J. Geophys. Res., 110, D10S11, https://doi.org/10.1029/2004JD005124, 2005.
Cavalli, F., Viana, M., Yttri, K. E., Genberg, J., and Putaud, J.-P.: Toward a standardised thermal-optical protocol for measuring atmospheric organic and elemental carbon: the EUSAAR protocol, Atmos. Meas. Tech., 3, 79–89, https://doi.org/10.5194/amt-3-79-2010, 2010.
Chazette, P. and Louisse, C.: A case study of optical and chemical ground apportionment for urban aerosols in Thessaloniki, Atmos. Environ., 35, 2497–2506, https://doi.org/10.1016/S1352-2310(00)00425-8, 2001.
Dawson, K. W., Ferrare, R. A., Moore, R. H., Clayton, M. B., Thorsen, T. J., and Eloranta, E. W.: Ambient aerosol hygroscopic growth from combined Raman lidar and HSRL, J. Geophys. Res.-Atmos., 125, e2019JD031708, https://doi.org/10.1029/2019JD031708, 2020.
DeCarlo, P. F., Slowik, J. G., Worsnop, D. R., Davidovits, P., and Jimenez, J. L.: Particle morphology and density characterization by combined mobility and aerodynamic diameter measurements. Part 1: Theory, Aerosol Sci. Tech., 38, 1185–1205, https://doi.org/10.1080/027868290903907, 2004.
De Leeuw, G., and Lamberts, C. W.: Influence of refractive index and particle size interval on Mie calculated backscatter and extinction, J. Aerosol Sci., 18, 131–138, https://doi.org/10.1016/0021-8502(87)90050-4, 1987.
Ditas, F., Shaw, R. A., Siebert, H., Simmel, M., Wehner, B., and Wiedensohler, A.: Aerosols-cloud microphysics-thermodynamics-turbulence: evaluating supersaturation in a marine stratocumulus cloud, Atmos. Chem. Phys., 12, 2459–2468, https://doi.org/10.5194/acp-12-2459-2012, 2012.
Düsing, S., Wehner, B., Seifert, P., Ansmann, A., Baars, H., Ditas, F., Henning, S., Ma, N., Poulain, L., Siebert, H., Wiedensohler, A., and Macke, A.: Helicopter-borne observations of the continental background aerosol in combination with remote sensing and ground-based measurements, Atmos. Chem. Phys., 18, 1263–1290, https://doi.org/10.5194/acp-18-1263-2018, 2018.
Düsing, S., Wehner, B., Müller, T., Stöcker, A., and Wiedensohler, A.: The effect of rapid relative humidity changes on fast filter-based aerosol-particle light-absorption measurements: uncertainties and correction schemes, Atmos. Meas. Tech., 12, 5879–5895, https://doi.org/10.5194/amt-12-5879-2019, 2019.
Düsing, S., Ansmann, A., Baars, H., Corbin, J. C., Denjean, C., Gysel-Beer, M., Müller, T., Poulain, L., Siebert, H., Spindler, G., Tuch, T., Wehner, B., and Wiedensohler, A.: Data for “Measurement report: Comparison of airborne in-situ measured, lidar-based, and modeled aerosol optical properties in the Central European background – identifying sources of deviations”, Zenodo [data set], https://doi.org/10.5281/zenodo.5608560, 2021.
Egerer, U., Gottschalk, M., Siebert, H., Ehrlich, A., and Wendisch, M.: The new BELUGA setup for collocated turbulence and radiation measurements using a tethered balloon: first applications in the cloudy Arctic boundary layer, Atmos. Meas. Tech., 12, 4019–4038, https://doi.org/10.5194/amt-12-4019-2019, 2019.
Eichler, H., Cheng, Y. F., Birmili, W., Nowak, A., Wiedensohler,A., Brüggemann, E., Guauk, T., Herrmann, H., Althausen, D., Ansmann, A., Engelmann, R., Tesche, M., Wendisch, M., Zhang,Y. H., Hu, M., Liu, S., and Zeng, L. M.: Hygroscopic properties and extinction of aerosol particles at ambient relative humidity in South-Eastern China, Atmos. Environ., 42, 6321–6334, https://doi.org/10.1016/j.atmosenv.2008.05.007, 2008.
Engelmann, R., Kanitz, T., Baars, H., Heese, B., Althausen, D., Skupin, A., Wandinger, U., Komppula, M., Stachlewska, I. S., Amiridis, V., Marinou, E., Mattis, I., Linné, H., and Ansmann, A.: The automated multiwavelength Raman polarization and water-vapor lidar PollyXT: the neXT generation, Atmos. Meas. Tech., 9, 1767–1784, https://doi.org/10.5194/amt-9-1767-2016, 2016.
Fernald, F., Herman, B., and Reagan, J.: Determination of aerosol height distribution by lidar, J. Appl. Meteorol., 11, 482–489, https://doi.org/10.1175/1520-0450(1972)011<0482:DOAHDB>2.0.CO;2, 1972.
Ferrero, L., Ritter, C., Cappelletti, D., Moroni, B., Močnik, G., Mazzola, M., Lupi, A., Becagli, S., Traversi, R., Cataldi, M., Neuber, R., Vitale, V., and Bolzacchini, E.: Aerosol optical properties in the Arctic: The role of aerosol chemistry and dust composition in a closure experiment between Lidar and tethered balloon vertical profiles, Sci. Total Environ., 686, 452–467, https://doi.org/10.1016/j.scitotenv.2019.05.399, 2019.
Fountoukis, C. and Nenes, A.: ISORROPIA II: a computationally efficient thermodynamic equilibrium model for K+–Ca2+–Mg2+–NH–Na+–SO–NO–Cl−–H2O aerosols, Atmos. Chem. Phys., 7, 4639–4659, https://doi.org/10.5194/acp-7-4639-2007, 2007.
Fuchs, N.: On the stationary charge distribution on aerosol particles in a bipolar ionic atmosphere, Geofisica pura e applicata, 56, 185–193, https://doi.org/10.1007/BF01993343, 1963.
Gnauk, T., Brüggemann, E., Müller, K., Chemnitzer, R., Rüd, C., Galgon, D., Nowak, A., Wiedensohler, A., Acker, K., Auel, R., Wieprecht, W., Jaeschke, W., and Herrmann, H.: Aerosol characterisation at the FEBUKO upwind station Goldlauter (I): particle mass, main ionic components, OC/EC, and mass closure. Atmos. Environ., 39, 4209–4218, https://doi.org/10.1016/j.atmosenv.2005.02.007, 2005.
Groß, S., Esselborn, M., Weinzierl, B., Wirth, M., Fix, A., and Petzold, A.: Aerosol classification by airborne high spectral resolution lidar observations, Atmos. Chem. Phys., 13, 2487–2505, https://doi.org/10.5194/acp-13-2487-2013, 2013.
Guerrero-Rascado, J. L., Andrey, J., Sicard, M., Molero, F., Comerón, A., Pujadas, M., Rocadenbosch, F., Pedrós, R., Serrano-Vargas, O., Gil, M., Olmo, F. J., Lyamani, H., Navas-Guzmán, F., and Alados-Arboledas, L.: Aerosol closure study by lidar, Sun photometry, and airborne optical counters during DAMOCLES field campaign at El Arenosillo sounding station, Spain, J. Geophys. Res., 116, D02209, https://doi.org/10.1029/2010JD014510, 2011.
Haarig, M., Engelmann, R., Ansmann, A., Veselovskii, I., Whiteman, D. N., and Althausen, D.: 1064 nm rotational Raman lidar for particle extinction and lidar-ratio profiling: cirrus case study, Atmos. Meas. Tech., 9, 4269–4278, https://doi.org/10.5194/amt-9-4269-2016, 2016.
Haarig, M., Ansmann, A., Gasteiger, J., Kandler, K., Althausen, D., Baars, H., Radenz, M., and Farrell, D. A.: Dry versus wet marine particle optical properties: RH dependence of depolarization ratio, backscatter, and extinction from multiwavelength lidar measurements during SALTRACE, Atmos. Chem. Phys., 17, 14199–14217, https://doi.org/10.5194/acp-17-14199-2017, 2017.
Hale, G. M. and Querry, M. R.: Optical constants of water in the 200-nm to 200-µm wavelength region, Appl. Optics, 12, 555–563, https://doi.org/10.1364/AO.12.000555, 1973.
Hänel, G.: Technical Note: an attempt to interpret the humidity dependencies of the aerosol extinction and scattering coefficients, Atmos. Environ., 15, 403–406, https://doi.org/10.1016/0004-6981(81)90045-7, 1980.
Haynes, W. M. (Ed.): CRC Handbook of Chemistry and Physics 92nd Edition, CRC Press, ISBN 978-1-4398-5511-9, 2011.
Herrmann, H., Brüggemann, E., Franck, U., Gnauk, T., Löschau, G., Müller, K., Plewka, A., and Spindler, G.: A source study of PM in Saxony by size-segregated characterisation. J. Atmos. Chem., 55, 103–130, https://doi.org/10.1007/s10874-006-9029-7, 2006.
Holben, B. N., Eck, T. F., Slutsker, I., Tanré, Buis, J. P., Setzer, A., Vermote, E., Reagan, J. A., Kaufman, Y. J., Nakajima, T., Lavenu, F., Jankowiak, I., and Smirnov, A.: AERONET – A federated instrument network and data archive for aerosol characterization, Remote Sens. Environ., 66, 1–16, https://doi.org/10.1016/S0034-4257(98)00031-5, 1998.
Höpner, F., Bender, F. A.-M., Ekman, A. M. L., Praveen, P. S., Bosch, C., Ogren, J. A., Andersson, A., Gustafsson, Ö., and Ramanathan, V.: Vertical profiles of optical and microphysical particle properties above the northern Indian Ocean during CARDEX 2012, Atmos. Chem. Phys., 16, 1045–1064, https://doi.org/10.5194/acp-16-1045-2016, 2016.
Kim, M.-H., Omar, A. H., Tackett, J. L., Vaughan, M. A., Winker, D. M., Trepte, C. R., Hu, Y., Liu, Z., Poole, L. R., Pitts, M. C., Kar, J., and Magill, B. E.: The CALIPSO version 4 automated aerosol classification and lidar ratio selection algorithm, Atmos. Meas. Tech., 11, 6107–6135, https://doi.org/10.5194/amt-11-6107-2018, 2018.
Kim, S., Cho, C., and Rupakheti, M.: Estimating contributions of black and brown carbon to solar absorption from aethalometer and AERONET measurements in the highly polluted Kathmandu Valley, Nepal, Atmos. Res., 247, 105164, https://doi.org/10.1016/j.atmosres.2020.105164, 2020.
Kirchstetter, T. W. and Thatcher, T. L.: Contribution of organic carbon to wood smoke particulate matter absorption of solar radiation, Atmos. Chem. Phys., 12, 6067–6072, https://doi.org/10.5194/acp-12-6067-2012, 2012.
Klett, J. D.: Stable analytical inversion solution for processing lidar returns, Appl. Optics, 20, 211–220, https://doi.org/10.1364/AO.20.000211, 1981.
Knutson, E. and Whitby, K.: Aerosol classification by electric mobility: apparatus, theory, and applications, J. Aerosol Sci., 6, 443–451, https://doi.org/10.1016/0021-8502(75)90060-9, 1975.
Kreidenweis, S. M., Petters, M. D., and DeMott, P. J.: Single-parameter estimates of aerosol water content, Environ. Res. Lett., 3, 035002, https://doi.org/10.1088/1748-9326/3/3/035002, 2008.
Kulkarni, P., Baron, P. A., and Willeke, K.: Aerosol Measurement: Principles, Techniques, and Applications, Third Edition, John Wiley and Sons, Hoboken, N. J., https://doi.org/10.1002/9781118001684, 2011.
Lack, D. A. and Cappa, C. D.: Impact of brown and clear carbon on light absorption enhancement, single scatter albedo and absorption wavelength dependence of black carbon, Atmos. Chem. Phys., 10, 4207–4220, https://doi.org/10.5194/acp-10-4207-2010, 2010.
Lack, D. A., Moosmüller, H., McMeeking, G. R., Chakrabarty, R. K., and Baumgardner, D.: Characterizing elemental, equivalent black, and refractory black carbon aerosol particles: a review of techniques, their limitations and uncertainties, Anal. Bioanal. Chem., 406, 99–122, https://doi.org/10.1007/s00216-013-7402-3, 2014.
Lin, Z. J., Tao, J., Chai, F. H., Fan, S. J., Yue, J. H., Zhu, L. H., Ho, K. F., and Zhang, R. J.: Impact of relative humidity and particles number size distribution on aerosol light extinction in the urban area of Guangzhou, Atmos. Chem. Phys., 13, 1115–1128, https://doi.org/10.5194/acp-13-1115-2013, 2013.
Lopatin, A., Dubovik, O., Chaikovsky, A., Goloub, P., Lapyonok, T., Tanré, D., and Litvinov, P.: Enhancement of aerosol characterization using synergy of lidar and sun-photometer coincident observations: the GARRLiC algorithm, Atmos. Meas. Tech., 6, 2065–2088, https://doi.org/10.5194/amt-6-2065-2013, 2013.
Liu, B. Y. H., Pui, D. Y. H., Whitby, K. T., Kittelson, D. B., Kousaka, Y., and McKenzie, R. L.: The aerosol mobility Chromatograph: A new detector for sulfuric acid aerosols, Atmos. Environ., 12, 99–104, https://doi.org/10.1016/B978-0-08-022932-4.50014-8, 1978.
Liu, H. J., Zhao, C. S., Nekat, B., Ma, N., Wiedensohler, A., van Pinxteren, D., Spindler, G., Müller, K., and Herrmann, H.: Aerosol hygroscopicity derived from size-segregated chemical composition and its parameterization in the North China Plain, Atmos. Chem. Phys., 14, 2525–2539, https://doi.org/10.5194/acp-14-2525-2014, 2014.
Lu, X., Jiang, Y., Zhang, X., Wang, X., Nasti, L., and Spinelli, N.: Retrieval of aerosol extinction-to-backscatter ratios by combining ground-based and space-borne lidar elastic scattering measurements, Opt. Express., 19, A72–A79, https://doi.org/10.1364/OE.19.000A72, 2011.
Ma, N., Zhao, C. S., Müller, T., Cheng, Y. F., Liu, P. F., Deng, Z. Z., Xu, W. Y., Ran, L., Nekat, B., van Pinxteren, D., Gnauk, T., Müller, K., Herrmann, H., Yan, P., Zhou, X. J., and Wiedensohler, A.: A new method to determine the mixing state of light absorbing carbonaceous using the measured aerosol optical properties and number size distributions, Atmos. Chem. Phys., 12, 2381–2397, https://doi.org/10.5194/acp-12-2381-2012, 2012.
Ma, N., Birmili, W., Müller, T., Tuch, T., Cheng, Y. F., Xu, W. Y., Zhao, C. S., and Wiedensohler, A.: Tropospheric aerosol scattering and absorption over central Europe: a closure study for the dry particle state, Atmos. Chem. Phys., 14, 6241–6259, https://doi.org/10.5194/acp-14-6241-2014, 2014.
Marcolli, C., Luo, B., and Peter, T.: Mixing of the Organic Aerosol Fractions: Liquids as the Thermodynamically Stable Phases, J. Phys. Chem. A, 108, 2216–2224, https://doi.org/10.1021/jp036080l, 2004.
Mattis, I., Ansmann, A., Müller, D., Wandinger, U., and Althausen, D.: Multilayer aerosol observations with dual-wavelength Raman lidar in the framework of EARLINET, J. Geophys. Res.-Atmos., 109, 1–15, https://doi.org/10.1029/2004JD004600, 2004.
Mie, G.: Beiträge zur Optik trüber Medien, speziell kolloidaler Metalllösungen, Ann. Phys., 330, 377–445, https://doi.org/10.1002/andp.19083300302, 1908.
Modini, R. L., Corbin, J. C., Brem, B. T., Irwin, M., Bertò, M., Pileci, R. E., Fetfatzis, P., Eleftheriadis, K., Henzing, B., Moerman, M. M., Liu, F., Müller, T., and Gysel-Beer, M.: Detailed characterization of the CAPS single-scattering albedo monitor (CAPS PMssa) as a field-deployable instrument for measuring aerosol light absorption with the extinction-minus-scattering method, Atmos. Meas. Tech., 14, 819–851, https://doi.org/10.5194/amt-14-819-2021, 2021.
Moteki, N., Kondo, Y., and Nakamura, S.: Method to measure refractive indices of small nonspherical particles: Application to black carbon particles, J. Aerosol Sci., 41, 513–521, https://doi.org/10.1016/j.jaerosci.2010.02.013, 2010.
Müller, K.: A 3-year study of the aerosol in northwest Saxonia (Germany), Atmos. Environ., 33, 1679–1685, https://doi.org/10.1016/S1352-2310(98)00333-1, 1999.
Müller, D., Ansmann, A., Mattis, I., Tesche, M., Wandinger, U., Althausen, D., and Pisani, G.: Aerosol-type-dependent lidar ratios observed with Raman lidar, J. Geophys. Res., 112, D16202, https://doi.org/10.1029/2006JD008292, 2007.
Müller, T., Wiedensohler, A., Nowak, A., Laborde, M., Covert, D. S., Sheridan, P. J., Marinoni, A., Imre, K., Henzing, B., Roger, J. C., Martins dos Santos, S., Wilhelm, R., Wang, Y. Q., and de Leeuw, G.: Angular illumination and truncation of three different integrating nephelometers: implications for empirical, size-based corrections, Aerosol Sci. Tech., 43, 581–586, https://doi.org/10.1080/02786820902798484, 2009.
Müller, T., Henzing, J. S., de Leeuw, G., Wiedensohler, A., Alastuey, A., Angelov, H., Bizjak, M., Collaud Coen, M., Engström, J. E., Gruening, C., Hillamo, R., Hoffer, A., Imre, K., Ivanow, P., Jennings, G., Sun, J. Y., Kalivitis, N., Karlsson, H., Komppula, M., Laj, P., Li, S.-M., Lunder, C., Marinoni, A., Martins dos Santos, S., Moerman, M., Nowak, A., Ogren, J. A., Petzold, A., Pichon, J. M., Rodriquez, S., Sharma, S., Sheridan, P. J., Teinilä, K., Tuch, T., Viana, M., Virkkula, A., Weingartner, E., Wilhelm, R., and Wang, Y. Q.: Characterization and intercomparison of aerosol absorption photometers: result of two intercomparison workshops, Atmos. Meas. Tech., 4, 245–268, https://doi.org/10.5194/amt-4-245-2011, 2011.
Navas-Guzmán, F., Martucci, G., Collaud Coen, M., Granados-Muñoz, M. J., Hervo, M., Sicard, M., and Haefele, A.: Characterization of aerosol hygroscopicity using Raman lidar measurements at the EARLINET station of Payerne, Atmos. Chem. Phys., 19, 11651–11668, https://doi.org/10.5194/acp-19-11651-2019, 2019.
Ng, N. L., Herndon, S. C., Trimborn, A., Canagaratna, M. R., Croteau, P., Onasch, T. B., Sueper, D., Worsnop, D. R., Zhang, Q., Sun, Y., and Jayne, J. T.: An Aerosol Chemical Speciation Monitor (ACSM) for routine monitoring of the composition and mass concentrations of ambient aerosol, Aerosol Sci. Technol., 45, 780–794, https://doi.org/10.1080/02786826.2011.560211, 2011.
Nordmann, S., Birmili, W., Weinhold, K., Müller, K., Spindler, G., and Wiedensohler, A.: Measurements of the mass absorption cross section of atmospheric soot particles using Raman spectroscopy, J. Geophys. Res.-Atmos., 118, 12075–12085, https://doi.org/10.1002/2013JD020021, 2013.
Ogren, J. A.: Comment on Calibration and Intercomparison of Filter-Based Measurements of Visible Light Absorption by Aerosols, Aerosol Sci. Technol., 44, 589–591, https://doi.org/10.1080/02786826.2010.482111, 2010.
Omar, A. H., Winker, D. M., Vaughan, M. A., Hu, Y., Trepte, C. R., Ferrare, R. A., Lee, K.-P., Hostetler, C. A., Kittaka, C., Rogers, R. R., Ferrare, R. A., Lee, K.-P., Kuehn, R. E., and Hostetler, C. A.: The CALIPSO automated aerosol classification and lidar ratio selection algorithm, J. Atmos. Ocean. Tech., 26, 1994–2014, https://doi.org/10.1175/2009JTECHA1231.1, 2009.
Petters, M. D. and Kreidenweis, S. M.: A single parameter representation of hygroscopic growth and cloud condensation nucleus activity, Atmos. Chem. Phys., 7, 1961–1971, https://doi.org/10.5194/acp-7-1961-2007, 2007.
Petzold, A. and Schönlinner, M.: Multi-angle absorption photometry – a new method for the measurement of aerosol light absorption and atmospheric black carbon, J. Aerosol Sci., 35, 421–441, https://doi.org/10.1016/j.jaerosci.2003.09.005, 2004.
Petzold, A., Ogren, J. A., Fiebig, M., Laj, P., Li, S.-M., Baltensperger, U., Holzer-Popp, T., Kinne, S., Pappalardo, G., Sugimoto, N., Wehrli, C., Wiedensohler, A., and Zhang, X.-Y.: Recommendations for reporting “black carbon” measurements, Atmos. Chem. Phys., 13, 8365–8379, https://doi.org/10.5194/acp-13-8365-2013, 2013.
Pfeifer, S., Birmili, W., Schladitz, A., Müller, T., Nowak, A., and Wiedensohler, A.: A fast and easy-to-implement inversion algorithm for mobility particle size spectrometers considering particle number size distribution information outside of the detection range, Atmos. Meas. Tech., 7, 95–105, https://doi.org/10.5194/amt-7-95-2014, 2014.
Pfeifer, S., Müller, T., Weinhold, K., Zikova, N., Martins dos Santos, S., Marinoni, A., Bischof, O. F., Kykal, C., Ries, L., Meinhardt, F., Aalto, P., Mihalopoulos, N., and Wiedensohler, A.: Intercomparison of 15 aerodynamic particle size spectrometers (APS 3321): uncertainties in particle sizing and number size distribution, Atmos. Meas. Tech., 9, 1545–1551, https://doi.org/10.5194/amt-9-1545-2016, 2016.
Pinnick, R. G., Carroll, D. E., and Hofmann, D. J.: Polarized light scattered from monodisperse randomly oriented nonspherical aerosol particles: measurements, Appl. Optics, 15, 384–393, https://doi.org/10.1364/AO.15.000384, 1976.
Poulain, L., Birmili, W., Canonaco, F., Crippa, M., Wu, Z. J., Nordmann, S., Spindler, G., Prévôt, A. S. H., Wiedensohler, A., and Herrmann, H.: Chemical mass balance of 300 ∘C non-volatile particles at the tropospheric research site Melpitz, Germany, Atmos. Chem. Phys., 14, 10145–10162, https://doi.org/10.5194/acp-14-10145-2014, 2014.
Poulain, L., Spindler, G., Grüner, A., Tuch, T., Stieger, B., van Pinxteren, D., Petit, J.-E., Favez, O., Herrmann, H., and Wiedensohler, A.: Multi-year ACSM measurements at the central European research station Melpitz (Germany) – Part 1: Instrument robustness, quality assurance, and impact of upper size cutoff diameter, Atmos. Meas. Tech., 13, 4973–4994, https://doi.org/10.5194/amt-13-4973-2020, 2020.
Rosati, B., Gysel, M., Rubach, F., Mentel, T. F., Goger, B., Poulain, L., Schlag, P., Miettinen, P., Pajunoja, A., Virtanen, A., Klein Baltink, H., Henzing, J. S. B., Größ, J., Gobbi, G. P., Wiedensohler, A., Kiendler-Scharr, A., Decesari, S., Facchini, M. C., Weingartner, E., and Baltensperger, U.: Vertical profiling of aerosol hygroscopic properties in the planetary boundary layer during the PEGASOS campaigns, Atmos. Chem. Phys., 16, 7295–7315, https://doi.org/10.5194/acp-16-7295-2016, 2016a.
Rosati, B., Herrmann, E., Bucci, S., Fierli, F., Cairo, F., Gysel, M., Tillmann, R., Größ, J., Gobbi, G. P., Di Liberto, L., Di Donfrancesco, G., Wiedensohler, A., Weingartner, E., Virtanen, A., Mentel, T. F., and Baltensperger, U.: Studying the vertical aerosol extinction coefficient by comparing in situ airborne data and elastic backscatter lidar, Atmos. Chem. Phys., 16, 4539–4554, https://doi.org/10.5194/acp-16-4539-2016, 2016b.
Rose, D., Wehner, B., Ketzel, M., Engler, C., Voigtländer, J., Tuch, T., and Wiedensohler, A.: Atmospheric number size distributions of soot particles and estimation of emission factors, Atmos. Chem. Phys., 6, 1021–1031, https://doi.org/10.5194/acp-6-1021-2006, 2006.
Ruangrungrote, S., and Limsuwan, P.: Aerosol Lidar Ratio Determination and Its Effect on Troposphere in Thailand, Proced. Eng., 32, 793–799, https://doi.org/10.1016/j.proeng.2012.02.014, 2012.
Salemink, H., Schotanus, P., and Bergwerff, J. B.: Quantitative lidar at 532 nm for vertical extinction profiles in the lidar solution, Appl. Phys., 34B, 187–189, https://doi.org/10.1007/BF00697633, 1984.
Seinfeld, J. H. and Pandis, S. N.: Atmospheric Chemistry and Physics: from air pollution to climate change (Second Edition), John Wiley & Sons Inc., New York, ISBN 0471720186, 2006.
Siebert, H., Lehmann, K., Wendisch, M., Franke, H., Maser, R., Schell, D., Wei Saw, E., and Shaw, R.: Probing Finescale Dynamics and Microphysics of Clouds with Helicopter-Borne Measurements, B. Am. Meteorol. Soc., 87, 1727–1738, https://doi.org/10.1175/bams-87-12-1727, 2006.
Skupin, A., Ansmann, A., Engelmann, R., Seifert, P., and Müller, T.: Four-year long-path monitoring of ambient aerosol extinction at a central European urban site: dependence on relative humidity, Atmos. Chem. Phys., 16, 1863–1876, https://doi.org/10.5194/acp-16-1863-2016, 2016.
Sloane, C. S.: Effect of composition on aerosol light scattering efficiencies, Atmos. Environ., 20, 1025–1037, https://doi.org/10.1016/0004-6981(86)90288-X, 1986.
Spindler, G., Brüggemann, E., Gnauk, T., Grüner, A., Müller, K., and Herrmann, H.: A four-year size-segregated characterization study of particles PM, PM and PM depending on airmass origin at Melpitz, J. Atmos. Environ., 44, 164–173, https://doi.org/10.1016/j.atmosenv.2009.10.015, 2010.
Spindler, G., Grüner, A., Müller, K., Schlimper, S., and Herrmann, H.: Long-term size-segregated particle (PM10, PM2.5, PM1) characterization study at Melpitz – influence of air mass inflow, weather conditions and season, J. Atmos. Chem., 70, 165–195, https://doi.org/10.1007/s10874-013-9263-8, 2013.
Stokes, R. H. and Robinson, R. A.: Interactions in aqueous nonelectrolyte solutions. I. Solute-solvent equilibria, J. Phys. Chem., 70, 2126–2130, https://doi.org/10.1021/j100879a010, 1966.
Sugimoto, N., Shimizu, A., Nishizawa, T., Matsui, I., Jin, Y., Khatri, P., Irie, H., Takamura, T., Aoki, K., and Thana, B.: Aerosol characteristics in Phimai, Thailand determined by continuous observation with a polarization sensitive Mie–Raman lidar and a sky radiometer, Environ. Res. Lett., 10, 065003, https://doi.org/10.1088/1748-9326/10/6/065003, 2015.
Sumlin, B. J., Heinson, W. R., and Chakrabarty, R. K.: Retrieving the Aerosol Complex Refractive Index using PyMieScatt: A Mie Computational Package with Visualization Capabilities, J. Quant. Spectros. Ra., 205, 127–134, https://doi.org/10.1016/j.jqsrt.2017.10.012, 2018.
Sun, H., Biedermann, L., and Bond, T. C.: Color of Brown Carbon: A Model for Ultraviolet and Visible Light Absorption by Organic Carbon Aerosol, Geophys. Res. Lett., 34, L17813, https://doi.org/10.1029/2007gl029797, 2007.
Sun, J., Birmili, W., Hermann, M., Tuch, T., Weinhold, K., Merkel, M., Rasch, F., Müller, T., Schladitz, A., Bastian, S., Löschau, G., Cyrys, J., Gu, J., Flentje, H., Briel, B., Asbach, C., Kaminski, H., Ries, L., Sohmer, R., Gerwig, H., Wirtz, K., Meinhardt, F., Schwerin, A., Bath, O., Ma, N., and Wiedensohler, A.: Decreasing trends of particle number and black carbon mass concentrations at 16 observational sites in Germany from 2009 to 2018, Atmos. Chem. Phys., 20, 7049–7068, https://doi.org/10.5194/acp-20-7049-2020, 2020.
Takamura, T. and Sasano, Y.: Ratio of aerosol backscatter to extinction coefficients as determined from angular scattering measurements for use in atmospheric lidar applications, Opt. Quant. El., 19, 293–302, https://doi.org/10.1007/BF02032687, 1987.
Tang, I. N.: Chemical and size effects of hygroscopic aerosols on light scattering coefficients, J. Geophys. Res., 101, 19245–19250, https://doi.org/10.1029/96JD03003, 1996.
Tang, I. N. and Munkelwitz, H. R.: Water activities, densities, and refractive indices of aqueous sulfates and sodium nitrate droplets of atmospheric importance, J. Geophys. Res., 99, 18801–18808, https://doi.org/10.1029/94JD01345, 1994.
Tao, Z., Liu, Z., Wu, D., McCormick, M. P., and Su, J.: Determination of aerosol extinction-to-backscatter ratios from simultaneous ground-based and spaceborne lidar measurements, Opt. Lett., 33, 2986–2988, https://doi.org/10.1364/OL.33.002986, 2008.
Tian, P., Liu, D., Zhao, D., Yu, C., Liu, Q., Huang, M., Deng, Z., Ran, L., Wu, Y., Ding, S., Hu, K., Zhao, G., Zhao, C., and Ding, D.: In situ vertical characteristics of optical properties and heating rates of aerosol over Beijing, Atmos. Chem. Phys., 20, 2603–2622, https://doi.org/10.5194/acp-20-2603-2020, 2020.
Tsekeri, A., Amiridis, V., Lopatin, A., Marinou, E., Giannakaki, E., Pikridas, M., Sciare, J., Liakakou, E., Gerasopoulos, E., Duesing, S., Corbin, J. C., Gysel, M., Bukowiecki, N., Baars, H., Engelmann, R., Wehner, B., Kottas, M., Mamali, D., Kokkalis, P., Raptis, P. I., Stavroulas, I., Keleshis, C., Müller, D., Solomos, S., Binietoglou, I., Mihalopoulos, N., Papayannis, A., Stachlewska, I. S., Igloffstein, J., Wandinger, U., Ansmann, A., Dubovik, O., and Goloub, P.: Aerosol absorption profiling from the synergy of lidar and sun-photometry: the ACTRIS-2 campaigns in Germany, Greece and Cyprus, EPJ Web Conf., 176, 08005, https://doi.org/10.1051/epjconf/201817608005, 2018.
Tuch, T., Mirme, A., Tamm, E., Heinrich, J., Heyder, J., Brand, P., Roth, Ch., Wichmann, H. E., Pekkanen, J., and Kreyling, W. G.: Comparison of two particle-size spectrometers for ambient aerosol measurements, Atmos. Environ., 34, 139–149, https://doi.org/10.1016/S1352-2310(99)00248-4, 2000.
Virkkula, A., Backman, J., Aalto, P. P., Hulkkonen, M., Riuttanen, L., Nieminen, T., dal Maso, M., Sogacheva, L., de Leeuw, G., and Kulmala, M.: Seasonal cycle, size dependencies, and source analyses of aerosol optical properties at the SMEAR II measurement station in Hyytiälä, Finland, Atmos. Chem. Phys., 11, 4445–4468, https://doi.org/10.5194/acp-11-4445-2011, 2011.
Wandinger, U. and Ansmann, A.: Experimental determination of the lidar overlap profile with Raman lidar, Appl. Optics, 41, 511–514, https://doi.org/10.1364/AO.41.000511, 2002.
Wandinger, U., Freudenthaler, V., Baars, H., Amodeo, A., Engelmann, R., Mattis, I., Groß, S., Pappalardo, G., Giunta, A., D'Amico, G., Chaikovsky, A., Osipenko, F., Slesar, A., Nicolae, D., Belegante, L., Talianu, C., Serikov, I., Linné, H., Jansen, F., Apituley, A., Wilson, K. M., de Graaf, M., Trickl, T., Giehl, H., Adam, M., Comerón, A., Muñoz-Porcar, C., Rocadenbosch, F., Sicard, M., Tomás, S., Lange, D., Kumar, D., Pujadas, M., Molero, F., Fernández, A. J., Alados-Arboledas, L., Bravo-Aranda, J. A., Navas-Guzmán, F., Guerrero-Rascado, J. L., Granados-Muñoz, M. J., Preißler, J., Wagner, F., Gausa, M., Grigorov, I., Stoyanov, D., Iarlori, M., Rizi, V., Spinelli, N., Boselli, A., Wang, X., Lo Feudo, T., Perrone, M. R., De Tomasi, F., and Burlizzi, P.: EARLINET instrument intercomparison campaigns: overview on strategy and results, Atmos. Meas. Tech., 9, 1001–1023, https://doi.org/10.5194/amt-9-1001-2016, 2016.
Wang, W., Gong, W., Mao, F., Pan, Z., and Liu, B.: Measurement and Study of Lidar Ratio by Using a Raman Lidar in Central China, Int. J. Env. Res. Pub. He., 13, 508, https://doi.org/10.3390/ijerph13050508, 2016.
Wehner, B., Werner, F., Ditas, F., Shaw, R. A., Kulmala, M., and Siebert, H.: Observations of new particle formation in enhanced UV irradiance zones near cumulus clouds, Atmos. Chem. Phys., 15, 11701–11711, https://doi.org/10.5194/acp-15-11701-2015, 2015.
Weitkamp, C.: LIDAR: Range-Resolved Optical Remote Sensing of the Atmosphere, Springer Science+Business Media Inc., New York., ISBN 978-0-387-25101-1, 2005.
Wiedensohler, A.: An approximation of the bipolar charge distribution for particles in the submicron size range, J. Aerosol Sci., 19, 387–389, https://doi.org/10.1016/0021-8502(88)90278-9, 1988.
Wiedensohler, A., Birmili, W., Nowak, A., Sonntag, A., Weinhold, K., Merkel, M., Wehner, B., Tuch, T., Pfeifer, S., Fiebig, M., Fjäraa, A. M., Asmi, E., Sellegri, K., Depuy, R., Venzac, H., Villani, P., Laj, P., Aalto, P., Ogren, J. A., Swietlicki, E., Williams, P., Roldin, P., Quincey, P., Hüglin, C., Fierz-Schmidhauser, R., Gysel, M., Weingartner, E., Riccobono, F., Santos, S., Grüning, C., Faloon, K., Beddows, D., Harrison, R., Monahan, C., Jennings, S. G., O'Dowd, C. D., Marinoni, A., Horn, H.-G., Keck, L., Jiang, J., Scheckman, J., McMurry, P. H., Deng, Z., Zhao, C. S., Moerman, M., Henzing, B., de Leeuw, G., Löschau, G., and Bastian, S.: Mobility particle size spectrometers: harmonization of technical standards and data structure to facilitate high quality long-term observations of atmospheric particle number size distributions, Atmos. Meas. Tech., 5, 657–685, https://doi.org/10.5194/amt-5-657-2012, 2012.
Wiedensohler, A., Wiesner, A., Weinhold, K., Birmili, W., Hermann, M., Merkel, M., Müller, T., Pfeifer, S., Schmidt, A., Tuch, T., Velarde, F., Quincey, P., Seeger, S., and Nowak, A.: Mobility Particle Size Spectrometers: Calibration Procedures and Measurement Uncertainties, Aerosol Sci. Technol., 52, 146–164, https://doi.org/10.1080/02786826.2017.1387229, 2018.
Wu, Z. J., Poulain, L., Henning, S., Dieckmann, K., Birmili, W., Merkel, M., van Pinxteren, D., Spindler, G., Müller, K., Stratmann, F., Herrmann, H., and Wiedensohler, A.: Relating particle hygroscopicity and CCN activity to chemical composition during the HCCT-2010 field campaign, Atmos. Chem. Phys., 13, 7983–7996, https://doi.org/10.5194/acp-13-7983-2013, 2013.
Yuan, J., Modini, R. L., Zanatta, M., Herber, A. B., Müller, T., Wehner, B., Poulain, L., Tuch, T., Baltensperger, U., and Gysel-Beer, M.: Variability in the mass absorption cross section of black carbon (BC) aerosols is driven by BC internal mixing state at a central European background site (Melpitz, Germany) in winter, Atmos. Chem. Phys., 21, 635–655, https://doi.org/10.5194/acp-21-635-2021, 2021.
Zanatta, M., Gysel, M., Bukowiecki, N., Müller, T., Weingartner, E., Areskoug, H., Fiebig, M., Yttri, K. E., Mihalopoulos, N., Kouvarakis, G., Beddows, D., Harrison, R. M., Cavalli, F., Putaud, J. P., Spindler, G., Wiedensohler, A., Alastuey, A., Pandolfi, M., Sellegri, K., Swietlicki, E., Jaffrezo, J. L., Baltensperger, U., and Laj, P.: A European aerosol phenomenology-5: Climatology of black carbon optical properties at 9 regional background sites across Europe, Atmos. Environ., 145, 346–364, https://doi.org/10.1016/j.atmosenv.2016.09.035, 2016.
Zanatta, M., Laj, P., Gysel, M., Baltensperger, U., Vratolis, S., Eleftheriadis, K., Kondo, Y., Dubuisson, P., Winiarek, V., Kazadzis, S., Tunved, P., and Jacobi, H.-W.: Effects of mixing state on optical and radiative properties of black carbon in the European Arctic, Atmos. Chem. Phys., 18, 14037–14057, https://doi.org/10.5194/acp-18-14037-2018, 2018.
Zaveri, R. A., Barnard, J. C., Easter, R. C., Riemer, N., and West, M.: Particle-resolved simulation of aerosol size, composition, mixing state, and the associated optical and cloud condensation nuclei activation properties in an evolving urban plume, J. Geophys. Res.-Atmos., 115, D17210, https://doi.org/10.1029/2009JD013616, 2010.
Zdanovskii, A.: New methods for calculating solubilities of electrolytes in multicomponent systems, Zhur. Fiz. Khim., 22, 1475–1485, 1948.
Zhang, X., Mao, M., Yin, Y., and Tang, S.: The absorption Ångstrom exponent of black carbon with brown coatings: effects of aerosol microphysics and parameterization, Atmos. Chem. Phys., 20, 9701–9711, https://doi.org/10.5194/acp-20-9701-2020, 2020.
Zhao, G., Zhao, C., Kuang, Y., Tao, J., Tan, W., Bian, Y., Li, J., and Li, C.: Impact of aerosol hygroscopic growth on retrieving aerosol extinction coefficient profiles from elastic-backscatter lidar signals, Atmos. Chem. Phys., 17, 12133–12143, https://doi.org/10.5194/acp-17-12133-2017, 2017.
Zieger, P., Weingartner, E., Henzing, J., Moerman, M., de Leeuw, G., Mikkilä, J., Ehn, M., Petäjä, T., Clémer, K., van Roozendael, M., Yilmaz, S., Frieß, U., Irie, H., Wagner, T., Shaiganfar, R., Beirle, S., Apituley, A., Wilson, K., and Baltensperger, U.: Comparison of ambient aerosol extinction coefficients obtained from in-situ, MAX-DOAS and LIDAR measurements at Cabauw, Atmos. Chem. Phys., 11, 2603–2624, https://doi.org/10.5194/acp-11-2603-2011, 2011.
Zieger, P., Fierz-Schmidhauser, R., Weingartner, E., and Baltensperger, U.: Effects of relative humidity on aerosol light scattering: results from different European sites, Atmos. Chem. Phys., 13, 10609–10631, https://doi.org/10.5194/acp-13-10609-2013, 2013.