the Creative Commons Attribution 4.0 License.
the Creative Commons Attribution 4.0 License.
 | 16 Nov 2021
Tracking the influence of cloud condensation nuclei on summer diurnal precipitating systems over complex topography in Taiwan
Yu-Hung Chang
Chien-Ming Wu
Christopher Moseley
Chia-Chun Wu
This study focuses on how aerosols, serving as cloud condensation nuclei (CCN), affect the properties of diurnal precipitation under the weak synoptic weather regime over complex topography, which is a common summertime environmental regime in Taiwan. Semi-realistic large-eddy simulations (LESs) were carried out using TaiwanVVM and driven by idealized observational soundings. We perform object-based tracking analyses, which diagnose both the spatial and temporal connectivity of convective systems, aiming to reduce the variability in convection and align the aerosol effects on the mature stage of the convective life cycle. In the hotspot areas of strong orographic locking processes, the precipitation initiation is postponed significantly when the CCN concentration is increased from the clean scenario to the normal scenario, which prolongs the development of local circulation and convection. For this organized regime, the occurrence of the tracked extreme diurnal precipitating systems is notably enhanced. Also, the 99th percentile of the maximum rain rate, cloud depth, and in-cloud vertical velocity during the lifetime of the diurnal precipitating systems increases by 9.4 %, 4.4 %, and 1.3 %. This study demonstrates that the design of semi-realistic LESs, as well as the object-based tracking analyses, is useful to investigate the responses of orographically driven diurnal convective systems to ambient conditions.
- Article
(5592 KB) - Full-text XML
- BibTeX
- EndNote


Aerosol–cloud–precipitation interactions (ACPIs) have been studied extensively in the past few decades to understand how aerosols influence clouds and precipitation through modifying the microphysical processes. Excessive aerosols, released to the atmosphere by continuing human activities, could reshape clouds and precipitation characteristics after being activated as cloud condensation nuclei (CCN). Clouds developed under the environment with more CCN could have more cloud droplets with smaller sizes, leading to a narrower drop size distribution (DSD). Small cloud droplet sizes and a narrow DSD could result in a lower collision–coalescence efficiency and then suppress the warm rain processes, known as the Albrecht effect or the second aerosol indirect effect (Albrecht, 1989). However, the Albrecht effect is more relevant to describe the responses of warm clouds to aerosols, and the ACPIs can be cloud-regime dependent (Mülmenstädt and Feingold, 2018). For deep convective clouds, mixed-phase microphysics processes come into play, thus involving more complicated mechanisms that affect precipitation (Tao et al., 2012) How aerosols influence deep convection, which has a higher ability to produce heavy precipitation and a greater probability of causing hazards, has been notably the main research target in recent years.
Numerous studies have been conducted to explore the impacts of increasing aerosols on convective precipitation. Various types of deep convection have been investigated, including squall lines (e.g., Khain et al., 2004, 2005; Wang, 2005; Tao et al., 2007; Lynn et al., 2005; Su et al., 2020; Lebo, 2014; Li et al., 2009; Lebo and Morrison, 2014), mesoscale convective systems (e.g., Kawecki et al., 2016; Clavner et al., 2018; Zhang et al., 2020), fronts (e.g., Iguchi et al., 2008; Cheng et al., 2010; Liu et al., 2020), and winter cyclones (e.g., Thompson and Eidhammer, 2014; Mccoy et al., 2018). Different types of convective systems exhibit inconsistent responses to increasing aerosols, mainly owing to various convective structures and organization mechanisms that can significantly feedback to the initial microphysical perturbations (Khain, 2009; Fan et al., 2016), while the synoptic-scale meteorological conditions modulate which types of convective systems can occur. Since both meteorology and aerosols could influence the development of clouds and precipitation, Stevens and Feingold (2009) stated that the aerosol effects on clouds and precipitation are almost certainly dependent on the weather regimes. Here we generalize the regimes concerning the factors controlling the convective structure to include not only meteorological factors but also topography, land use types, and the other aspects of the environment.
The deep convective clouds or systems mentioned above are generally enormous in size with longevity. However, locally and diurnally developed deep convection, that is, afternoon thunderstorms, can still produce extreme precipitation and cause costly hazards. Even if significant synoptic-scale weather forcing is absent, the development of afternoon thunderstorms can still be fueled by the surface heat flux and be affected by the local topography. Since solar heating and corresponding surface heat flux are directly imposed on the mountain ridges, topography could influence the development of the afternoon thunderstorms. Clear examples can be found in the afternoon thunderstorms and their accompanied diurnal precipitation in Taiwan. Chen et al. (2010) discovered through a case study that the formation and maintenance mechanism of an afternoon thunderstorm system over the Snow Mountain Range was related to the lifting of airflow with high equivalent potential temperature over the southwestern slope. Kuo and Wu (2019) used idealized cloud-resolving model simulations to show that the confluent flow of sea breezes from two river valleys could determine the location of initiation and the development of afternoon thunderstorms inside the Taipei Basin, while the case simulation by Miao and Yang (2020) revealed that the intensified sea breeze and increased moisture transport by the channel effect of the river valley provide favorable dynamic and thermodynamic conditions for more intense convection to develop inside the Taipei Basin. Thus, with the tight relationship between afternoon thunderstorms and the local environment, especially topography, we postulate that the influence of microphysical perturbation on diurnal precipitation through increasing aerosols can be highlighted more evidently in these “orographic locking” afternoon thunderstorms given similar large-scale weather conditions.
Several studies have introduced the aerosol effects on convective precipitation under different orographic regimes. Seo et al. (2020) showed that the upslope geometry could control the precipitation of shallow convective clouds over a bell-shaped mountain by conducting two-dimensional idealized simulations. Several simulations concluded that the aerosol effects suppressed the precipitation of shallow convective clouds in the mountain ranges of the North American Cordillera (Lynn et al., 2007; Jirak and Cotton, 2006; Givati and Rosenfeld, 2004). Observations from the Dominica Experiment field campaign also revealed that aerosols could have impacts on thermally driven orographic clouds and precipitation (Nugent et al., 2016). In the studies mentioned above, shallow convection and its resulting precipitation over the topography are the main focus. However, the aerosol effects on diurnal precipitation induced by deep convection over complex topography remain insufficiently discerned.
Grabowski and Morrison (2016) showed that the precipitation is strengthened with high CCN concentration based on the simulation of a diurnal precipitation case during the Large-Scale Biosphere-Atmosphere field campaign over the great plain of the Amazon. However, Grabowski (2018) suggested that the impact of atmospheric environmental perturbations is comparable to the aerosol effects shown in Grabowski and Morrison (2016). Thus, the extent to which the response of deep convection and the resulting precipitation can be attributed to the aerosol effects is ambiguous. As mentioned previously, the development of diurnal precipitation in Taiwan is profoundly affected by its complex topography. In this study, we apply the object-based tracking analyses, which diagnose both the spatial and the temporal connectivity of convective systems, to highlight the convective clouds locked by topography and reduce the stochastic features of convection.
Rosenfeld et al. (2008) proposed that deep convection can be invigorated under the environment with more aerosols, namely the aerosol invigoration effect. Since the warm rain processes are suppressed, more cloud droplets are frozen, and more latent heat is released above the freezing level. Thus, deep convection would become more intensive and cause more rainfall in a more polluted environment (Altaratz et al., 2014). The aerosol invigoration effect shows that increasing aerosols would have a specific influence during various stages of the life cycle of the convective clouds. Therefore, it is necessary to record the evolution of convection. The adjustment in convective structure and organization is also a crucial issue of the aerosol effects on deep convection from the dynamical perspective (Su et al., 2020; Lebo and Morrison, 2014; Fan et al., 2013). The probability distribution of convective features can be altered due to the modulation of the convective structure by increasing aerosol loading (Su et al., 2020). Therefore, in this study, we specifically focus on the extreme precipitation and cloud properties of the convective life cycle. Instead of including convection of all stages as an average, the statistical analyses on extreme convection with the object-based consideration highlight the structural characteristics of convection modified by increasing aerosols.
The objective of the present study is to investigate how increasing CCN affect the properties of the diurnal precipitation induced by deep convection under the weak synoptic weather regime over complex topography. We specifically focus on the precipitating systems produced by orographic locking processes. Due to the complicated interactions between convective clouds and their environment, it is challenging to separate the impacts of CCN from the influence of meteorology on convection merely using observational data (Grabowski, 2018). Thus, we conducted semi-realistic large-eddy simulations (LESs) with fine temporal and spatial resolutions, highlighting the role of topography on the evolution of diurnal precipitation. The object-based tracking analyses provide novel and useful insights into the understanding of the responses of convective systems resulting from increasing CCN. Section 2 presents the model description and the experiment setup. The properties of diurnal precipitation in Taiwan and the influence of CCN on them over complex topography are analyzed in Sect. 3, mainly based on the perspective of the precipitating systems. The discussion of the results and the possible extensions that can be accomplished under the semi-realistic LES framework are presented in Sect. 4, with the summary and conclusion in Sect. 5.
2.1 Model description
In this study, we use the vector vorticity equation cloud-resolving model (VVM) to simulate the development of diurnal precipitation over complex topography. VVM was initially developed by Jung and Arakawa (2008), based on the three-dimensional anelastic vorticity equations. In VVM, the horizontal vorticity is predicted, and the vertical velocity is diagnosed using a three-dimensional elliptic equation. The pressure gradient force is eliminated in the equations, and the horizontal buoyancy gradient that drives the vorticity field responds to the surface fluxes directly. Thus, compared with the other models using the traditional terrain-following coordinate approach, VVM can better represent local circulation induced by heating differences. The steeper the topography is, the more significant this advantage becomes (Wu et al., 2019). The immersed boundary method is implemented (Chien and Wu, 2016; Wu and Arakawa, 2011) to represent the steep topography in Taiwan. With this representation, mountain waves, orographic precipitation, upslope wind, and other atmospheric phenomena related to topography can be reasonably simulated without having computational problems. The Noah land surface model (Noah LSM; Chen and Dudhia, 2001; Chen et al., 1996) version 3.4.1 is also coupled to VVM (Wu et al., 2019) and has been applied to evaluate the influence of land–atmosphere interactions on the afternoon thunderstorms on idealized tropical islands (Wu and Chen, 2021).
To investigate the atmospheric processes specifically over the island of Taiwan, Wu et al. (2019) developed a framework of VVM with high-resolution Taiwan topography and land use types, named TaiwanVVM. They carried out idealized simulations of summertime afternoon thunderstorms with realistic Taiwan topography. Hsieh (2019) utilized TaiwanVVM to discuss the effect of local circulation associated with fog formation at Xitou, Nantou County, Taiwan. In contrast to previous studies using TaiwanVVM, this study uses the Predicted Particle Properties (P3; Morrison and Milbrandt, 2015) microphysics scheme, implemented by Huang and Wu (2020) in VVM, to enable capturing the influences of aerosols on cloud microphysics while the aerosols are not scavenged by precipitation. The other physical parameterizations used in TaiwanVVM are the Rapid Radiative Transfer Model for GCMs (RRTMG; Iacono et al., 2008), the flux–profile relationship of Deardorff (1972) to estimate the surface fluxes, and the eddy viscosity and diffusivity coefficients depending on deformation and stability (Shutts and Gray, 1994) as the first-order turbulence closure.
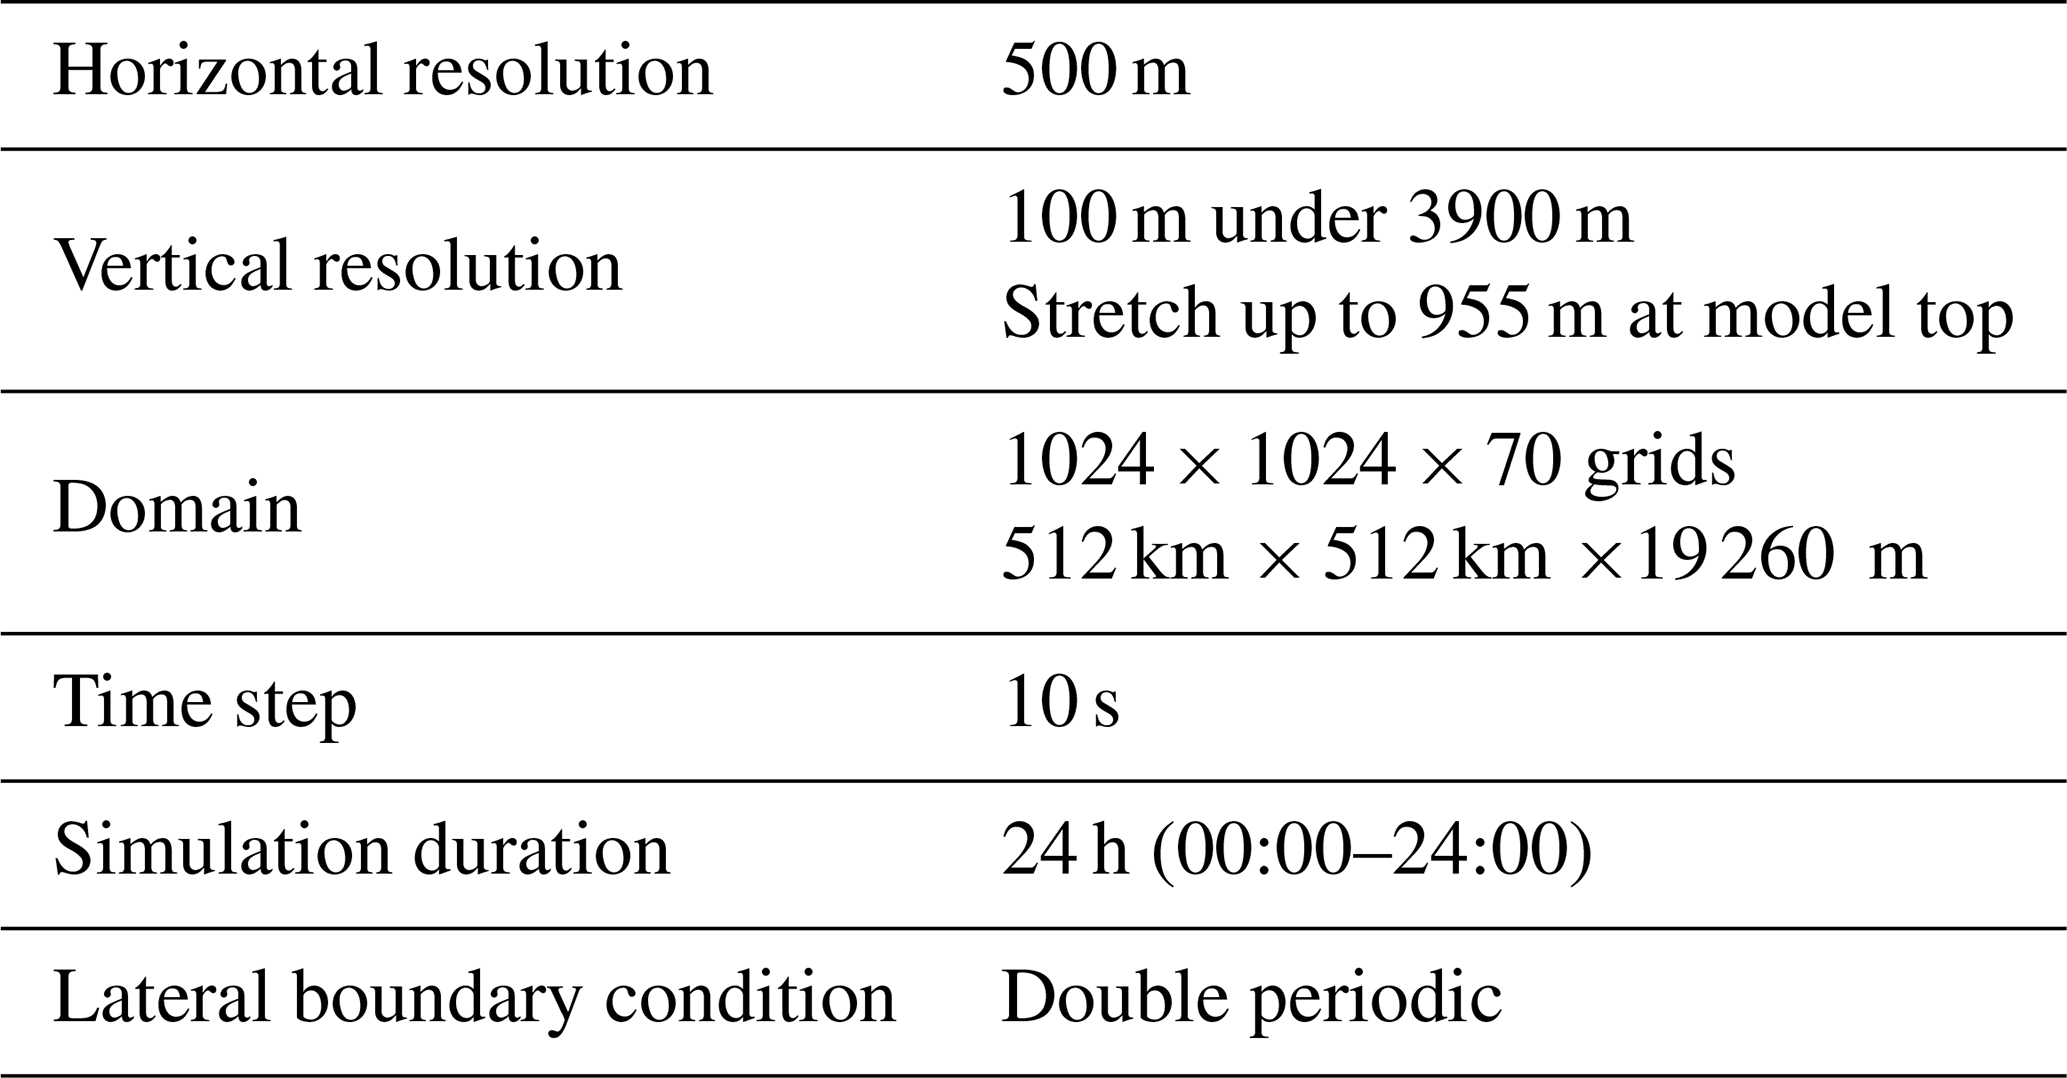
For TaiwanVVM, the horizontal resolution is 500 m. The total number of vertical layers is 70, and the vertical resolution is 100 m from the sea level up to 3900 m and a stretched grid above 3900 m up to about 19 260 m (Krueger, 1988). The domain is 512×512 km in size (Fig. 1). To avoid the domain boundary being cut at the edge of complex topography, which might potentially induce problems from the inflow outside the domain, the island of Taiwan is placed in the center of the domain with a sufficient area of surrounding seas. To focus on the phenomena solely related to the island of Taiwan, the topography of adjacent land around the island of Taiwan, including several islands, islets, and a part of southeast China, is not implemented in the model. Although the lateral boundary of TaiwanVVM is doubly periodic, the diurnal convection stays in the domain under a weak synoptic environment. Other detailed settings of the simulations are provided in Table 1.
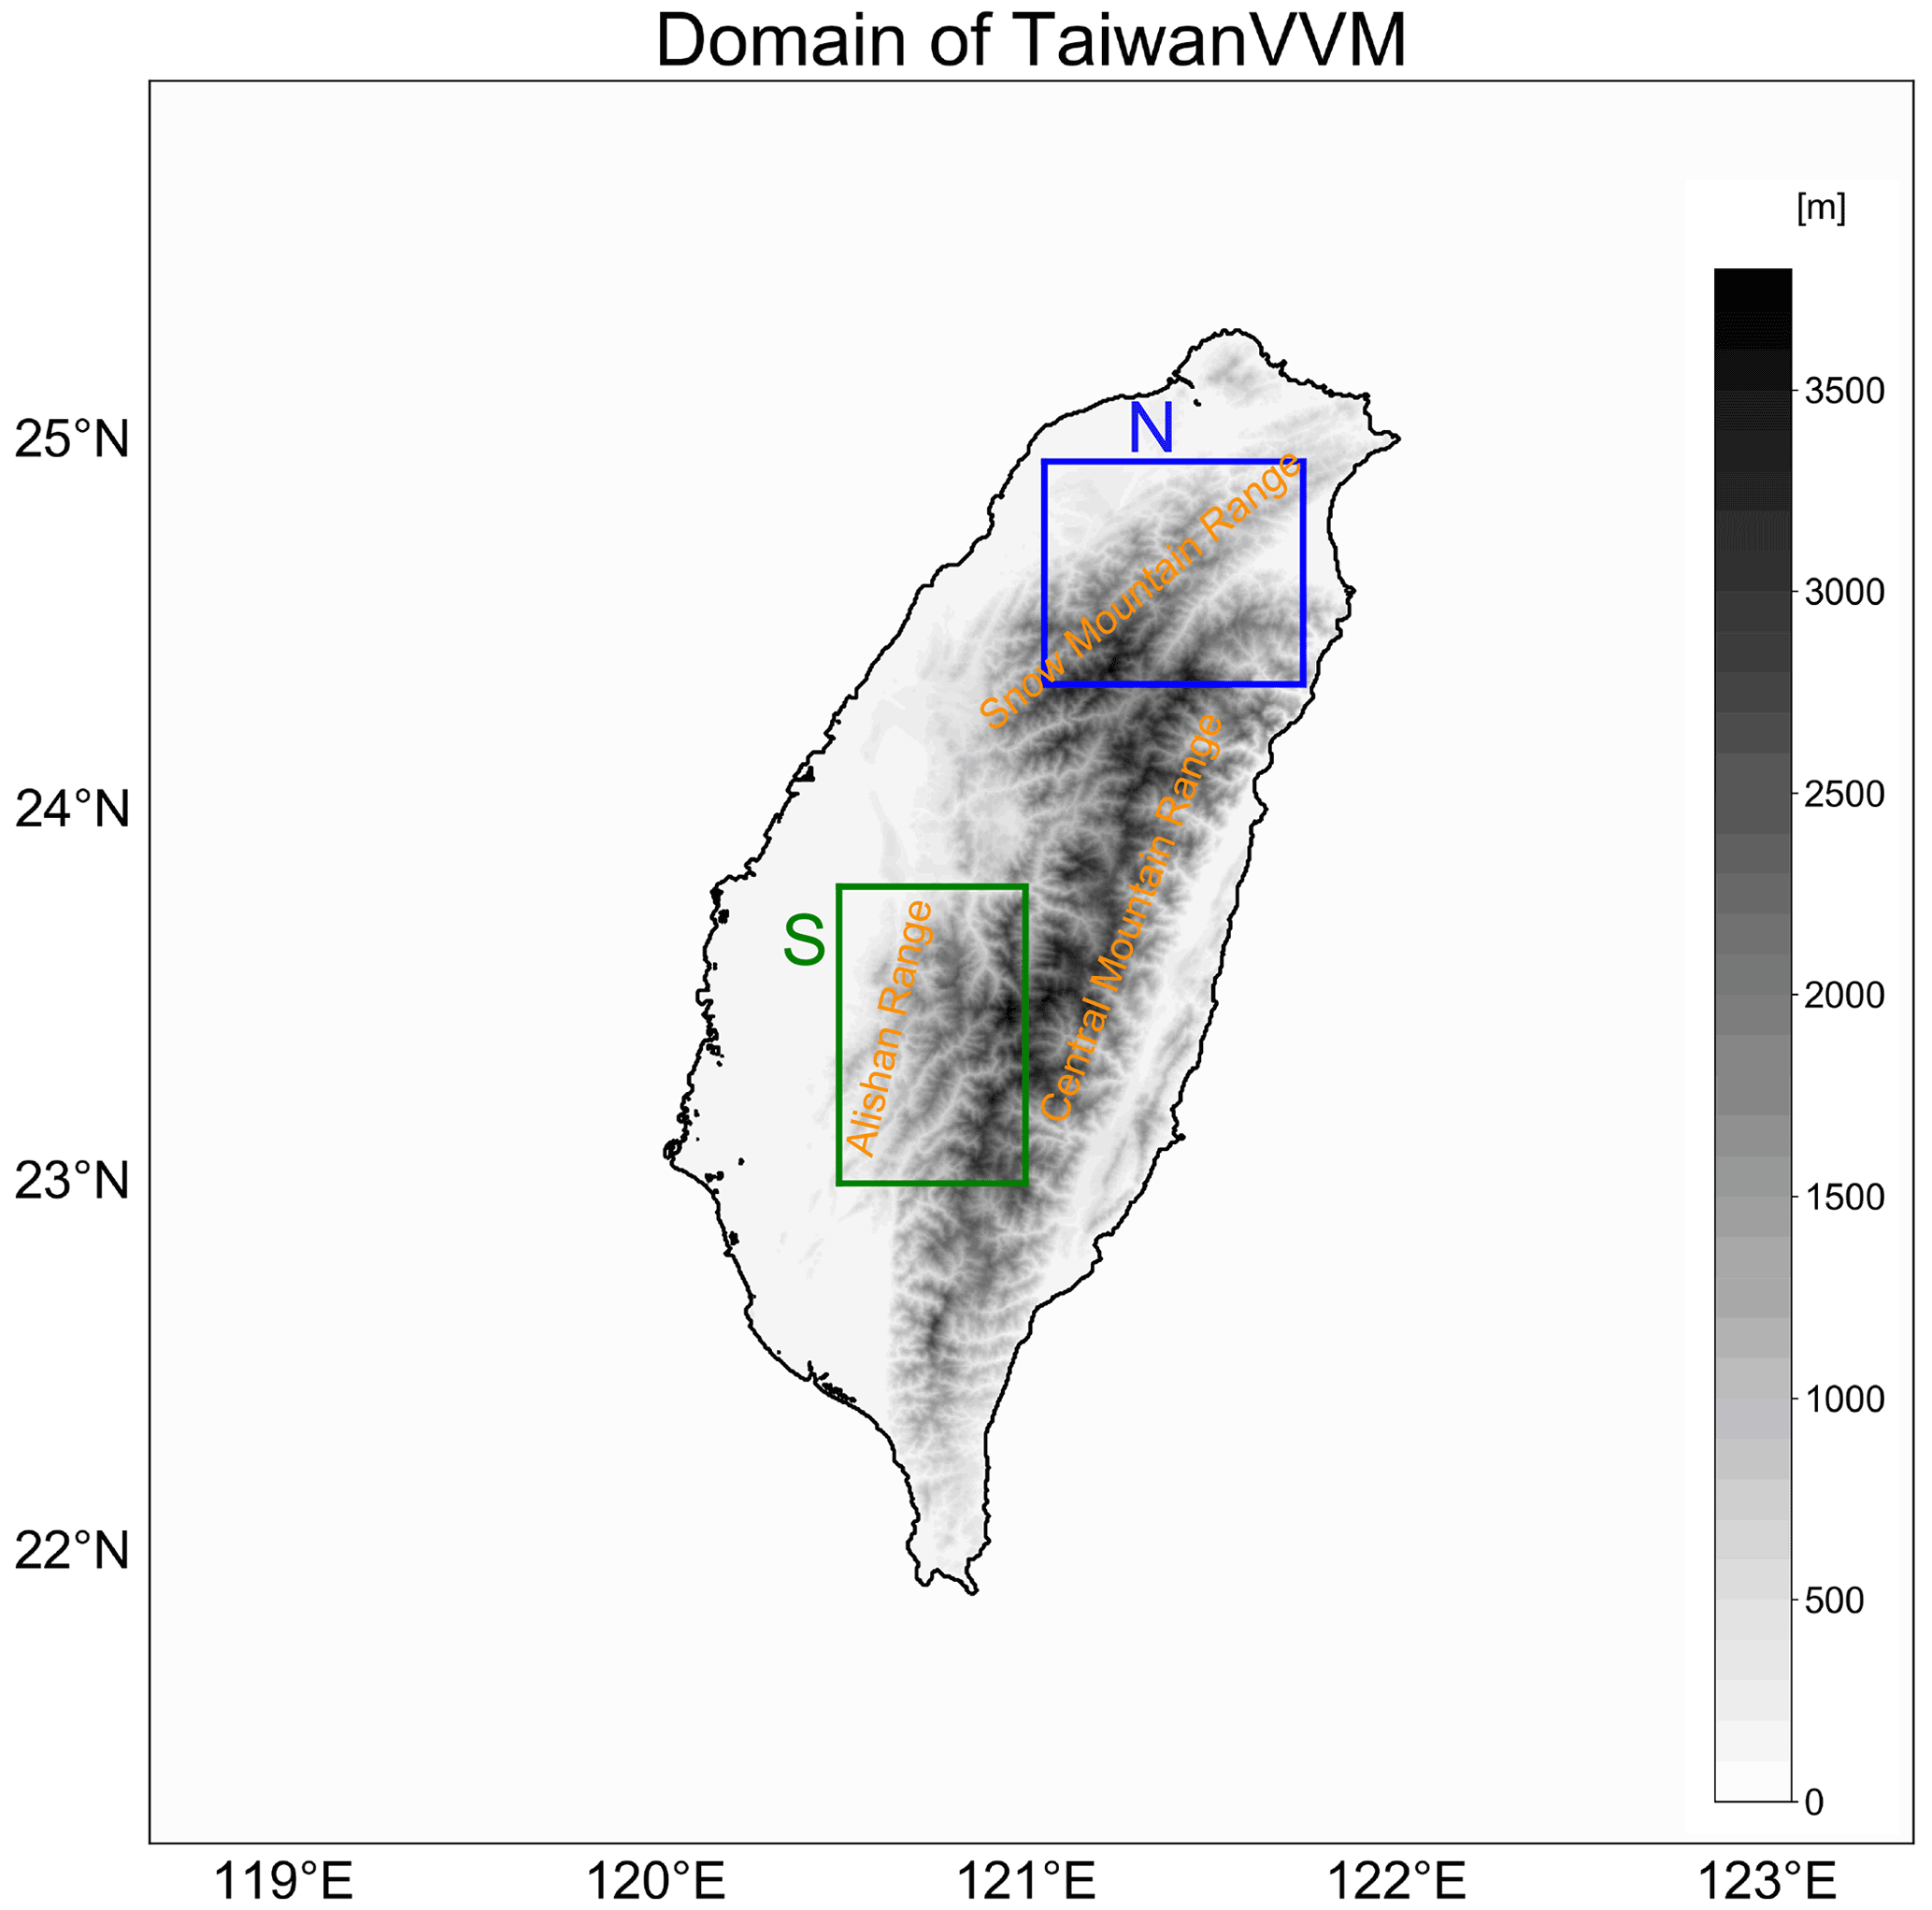
Figure 1The domain of TaiwanVVM with the 500 m resolution topography of the island of Taiwan (grey shading). The boxes are the mountain areas for subsequent statistical analyses: the blue box is the northern mountain area (area N), and the green box is the southern mountain area (area S).
Table 1The configuration of TaiwanVVM for the semi-realistic simulations.
2.2 Experiment design
A semi-realistic approach is adopted in designing TaiwanVVM simulations. That is, an observed sounding is idealized as the uniform initial condition over the entire domain, similarly to in Wu et al. (2019). Such an approach is commonly used in LESs (e.g., Grabowski et al., 2006). The direct comparison to the observations of specific cases or events is not the goal of this study. Instead, the idealization emphasizes the decisive environmental factors that modulate the development of particular convection types. By this semi-realistic approach, interactions among physical processes dominate the evolution of local circulation and convection, which can also interact with the simplified background states in the initial condition. The variability in the background environment is represented by the ensemble approach (mentioned later in Sect. 2.3), and the statistics of the semi-realistic ensemble can be compared with the observed climatological statistics from cases with similar environments.
To investigate the influence of CCN on diurnal precipitation over complex topography, we perform experiments with two scenarios of aerosol concentration. In the clean scenario, the aerosol number mixing ratio is fixed at in the entire domain, which is within the range of the clean conditions in the marine environment (Andreae, 2009). Under the normal scenario, on the other hand, the aerosol number mixing ratio increases to , which lies in the range of the urban environment of Taipei City, Taiwan (Lin, 2012). In P3, the number of activated CCN (Nc) is determined by
where s is supersaturation, s0 is mean geometric supersaturation, β is the soluble fraction of an aerosol particle, and σd is the dispersion of the dry spectrum. s0 depends on the chemical properties of the soluble part of the dry aerosol, including density, surface tension, the van 't Hoff factor, osmotic potential, and molecular weight. When s=s0, only half of the total aerosols would be activated as CCN (Khvorostyanov and Curry, 2006; Morrison and Grabowski, 2007, 2008). Thus, the initial atmospheric conditions are identical, but the aerosol concentration scenarios are different. We can expect that the difference in convection development and convective properties results from the impact of aerosol concentration.
2.3 Initial condition
To find appropriate representations for the environment of diurnal precipitation under weak synoptic-scale weather forcing in summer, the selection procedure was carefully designed (Fig. 2). First, using the Taiwan Atmospheric Events Database (TAD; Su et al., 2018), we selected the days with the weak southwesterly flow or weak synoptic weather conditions during the summers (May to September) between 2005 and 2014. Then, using the Central Weather Bureau surface rain gauge observations, we calculated the average diurnal precipitation cycle of 115 well-functioning weather stations for each day. To find the days with a prominent diurnal precipitation cycle, only the days with precipitation in the afternoon greater than that in the morning, as well as with the diurnal precipitation cycle within 2 standard deviations, were selected. Next, using 3-hourly Tropical Rainfall Measuring Mission Multi-Satellite Precipitation Analysis (3B42) version 7, we chose the days when precipitation occurred on the island of Taiwan but the coverage of precipitation in the surrounding areas (20.625–26.375∘ N and 118.125–123.875∘ E) was less than 20 %, making sure that the precipitation occurred locally on the island of Taiwan. There are 218 dates from the summers between 2005 and 2014 that pass the criteria mentioned above. The observed composite precipitation of these 218 dates is displayed in Fig. 4a. The precipitation over the mountains is much more intense than that on the plains. The most significant precipitation hotspot is located around the Alishan Range, which is the green box in Fig. 1 (area S). Another precipitation hotspot is situated in the Snow Mountain Range and the northern tip of Central Mountain Range, the blue box in Fig. 1 (area N), although the observation sites are relatively scarce there. For these two precipitation hotspots, the mountain ridges next to the plains have notably more rainfall than the mountain ridges behind them. Finally, we selected 30 dates for which to perform semi-realistic simulations. The selection of these 30 cases generally covers the rainfall variability in the 218 dates and serves as the ensemble members representing favorable environments for orographic locking diurnal precipitation in summer.
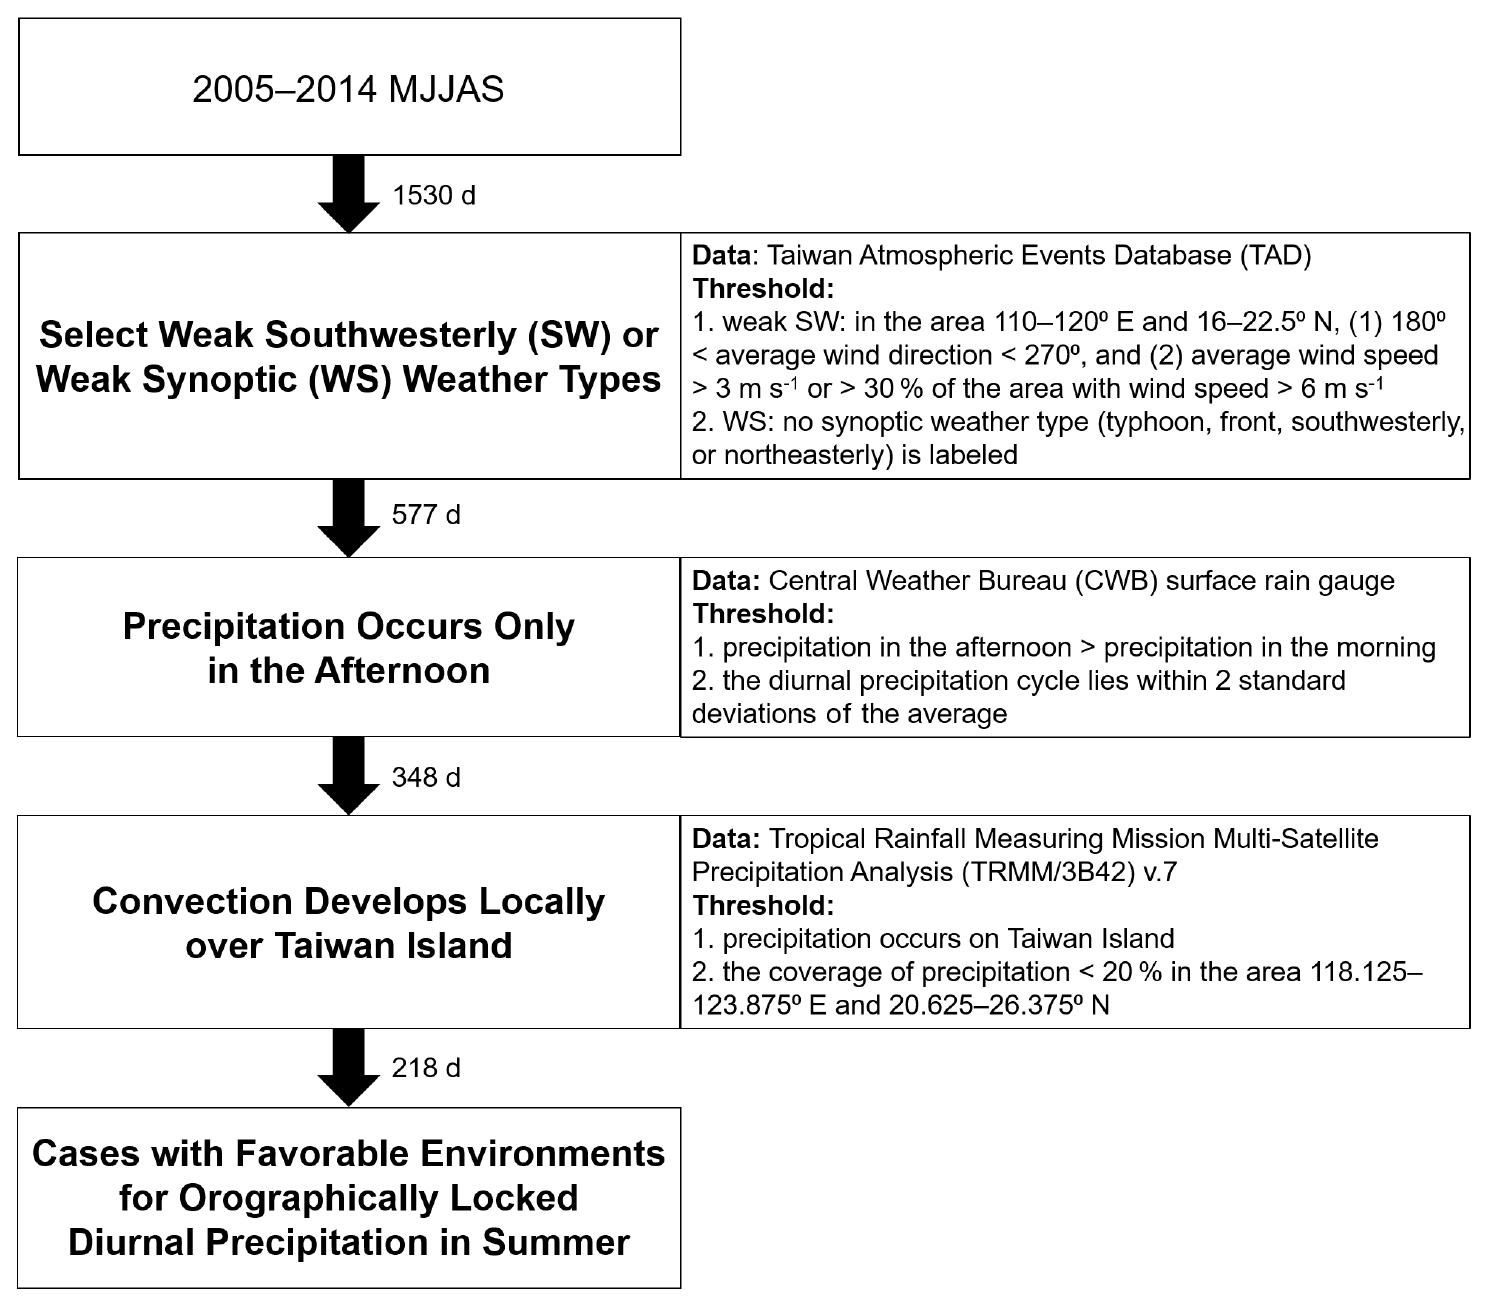
Figure 2The procedure and data of case selection for semi-realistic simulations, aiming to find favorable environments for orographic locking diurnal precipitation under weak synoptic-scale weather forcing in summer.
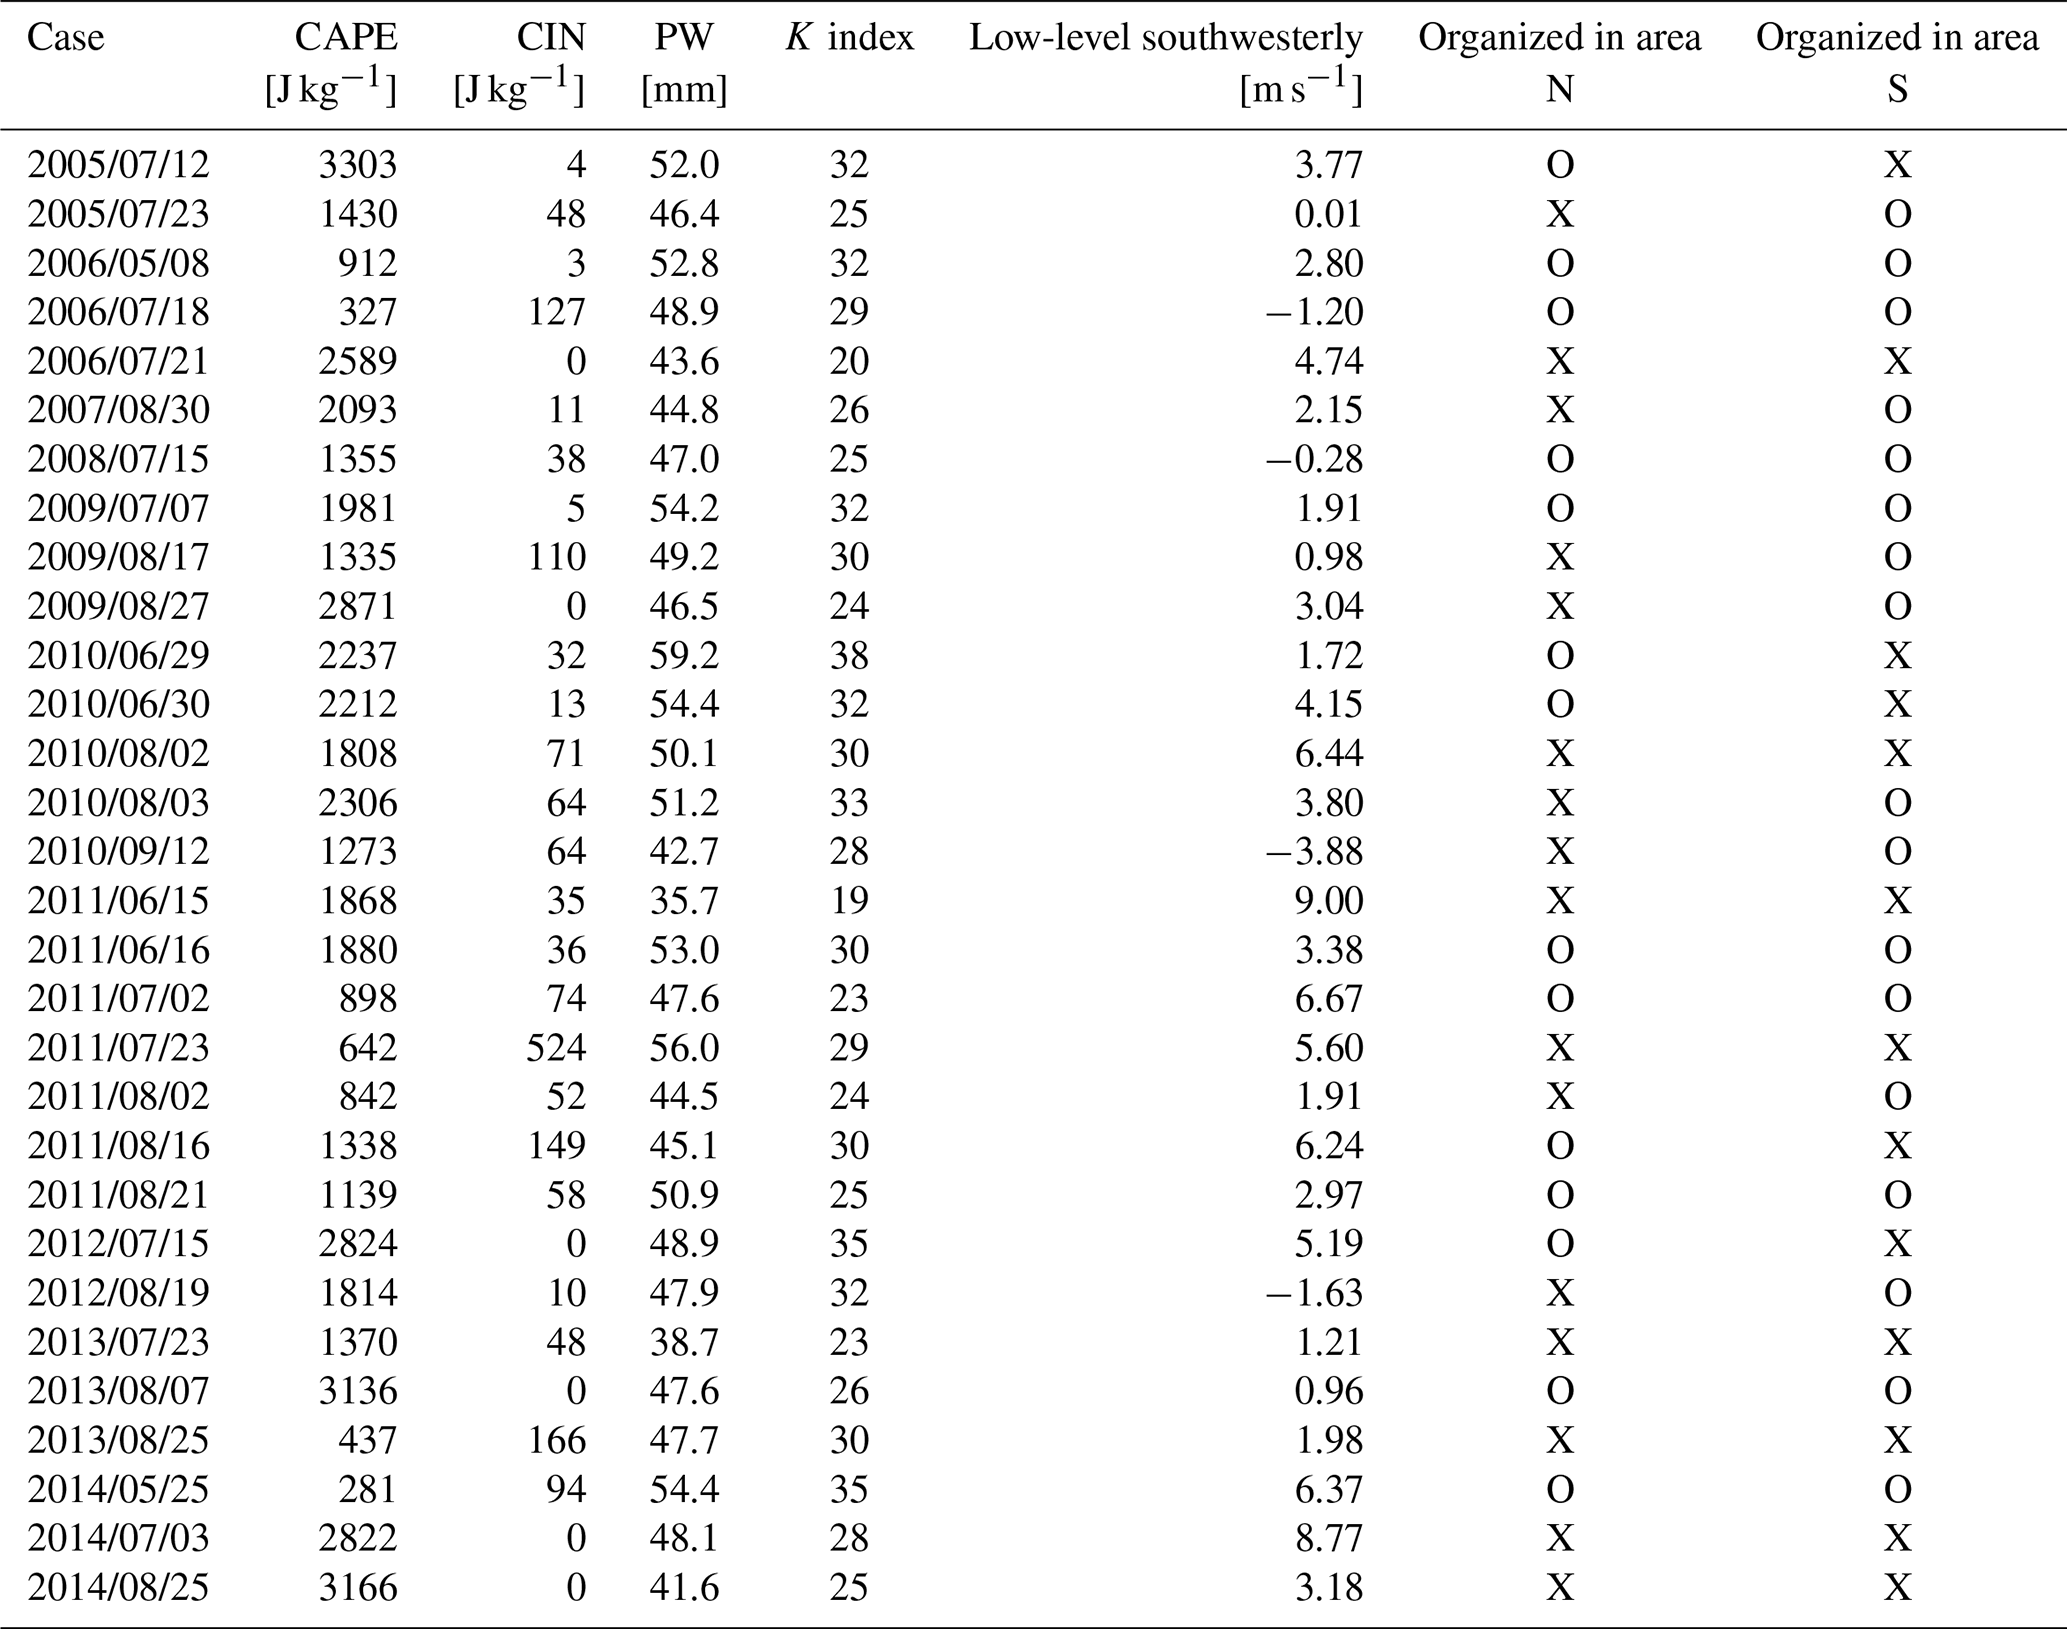
The simulations were driven by the simplified Banqiao Station soundings at 08:00 Taiwan standard time of these 30 cases. The thermodynamic and dynamic parameters of the initial soundings are shown in Table A1. Although variability appears in the initial convective available potential energy (CAPE), convective inhibition (CIN), precipitable water (PW), K index, and mean low-level southwesterly of the 30 simulated cases, high CAPE (mostly higher than 1100 J kg−1 with the maximum value surpassing 3300 J kg−1), low CIN (mostly less than 70 J kg−1), and high PW (generally greater than 45 mm with the maximum value almost reaching 60 mm) indicate that these soundings are conditionally unstable and moist, which is considered favorable for convection to develop. Low-level southwesterlies exist in 27 soundings, and 26 of them are southwesterly below 1500 m on average.
Aside from atmospheric conditions, the initial settings of physical parameterizations are listed below. The chemical properties of aerosols are set as ammonium sulfate, and the size distribution of aerosols follows a lognormal size distribution, with a mean size of 0.05 µm (Morrison and Milbrandt, 2015). The initial condition of the ocean and the land is relatively simple. The surface temperature of the sea and land is prescribed as the temperature of the lowest level of the initial sounding. To drive Noah LSM, land properties are necessary for model inputs. The daily averaged soil moisture over the island of Taiwan from the Global Land Data Assimilation System (GLDAS; Rodell et al., 2004) version 2.0 is assigned to the topsoil layers for all land grids in the model. The initial settings of the terrain elevation, slope type, land use, green vegetation fraction, and soil texture are the same as in Wu et al. (2019).
2.4 Object-based tracking algorithm
Object-based tracking analyses, which combine cloud object connecting and rain cell tracking algorithms, are developed to obtain the statistics related to convective structures and the intensity of precipitating systems. Figure 3 is a conceptual example of the algorithm. The x–z cross-section of two three-dimensional cloud objects is shown at the top of Fig. 3, with their projection to the surface presented beneath. The cloud object connecting is performed by the six-connected segmentation method (Tsai and Wu, 2017). It connects horizontally and vertically adjacent cloudy (cloud liquid water plus cloud ice mixing ratio greater than 10−4) grid boxes as the same cloud object. In this study, only the convective cloud objects, defined by a cloud base lower than 0.5 km, a cloud depth thicker than 1.0 km, and the center of cloud mass higher than 0.5 km, are analyzed. These criteria are chosen to include the shallow cumulus clouds during the developing stage of convection. For the vertically overlapped cloud objects, the cloud projection on the surface is determined by the lowest cloud object detected bottom-up from the surface.
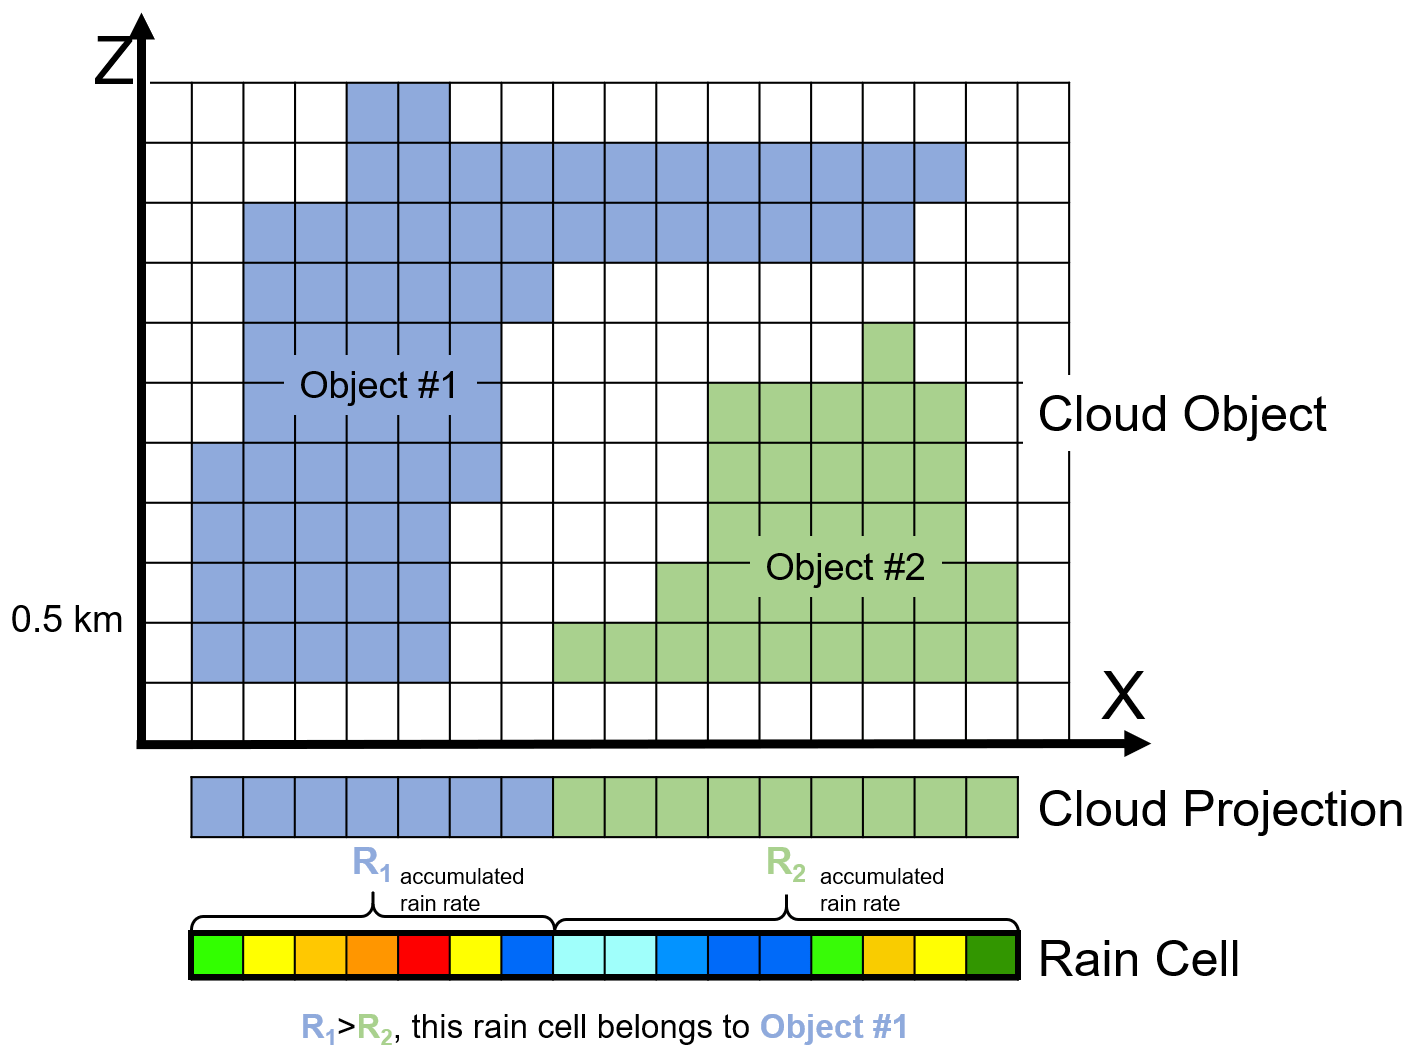
Figure 3The schematic diagram of connecting cloud objects and rain cells, as well as co-locating the cloud objects with the rain cells along the x–z cross-section. Anvil of cloud object no. 1 (blue cloud) is overlapped with cloud object no. 2 (green cloud). The cloud projection to the surface is based on the lowest cloud bottom. For a connected rain cell covered by multiple cloud objects, the co-location is simplified by identifying the cloud object that contributes to the highest fractional rainfall. For example, the accumulated rain rate to the rain cell from cloud object no. 1 is more than that from cloud object no. 2, so the rain cell in this diagram would be co-located entirely with cloud object no. 1.
The bottom of Fig. 3 shows the x dimension of a two-dimensional rain cell, which is formed by a four-way connection of rainy grids with a rain rate greater than 5 mm h−1. By co-locating the rain cell with the cloud object above, we could establish the relationship between the precipitation and the convective structure. We simplify the condition of cloud object overlapping by assuming that the precipitation on the surface is completely contributed by the lowest cloud object. Still, a rain cell could be covered by multiple cloud objects. For instance, both cloud objects in Fig. 3 partially cover the rain cell. For this rain cell, the accumulated rain rate covered by cloud object no. 1 is greater than that of cloud object no. 2, and we would co-locate the rain cell fully with cloud object no. 1. In other words, the rain cell would be co-located with the cloud object that contributes most precipitation to it.
To further evaluate the evolution of precipitating systems, we perform iterative rain cell tracking (IRT; Moseley et al., 2013, 2019). This links the rain cells at each time step and forms the rain tracks, providing a Lagrangian framework that focuses on the life cycle of the diurnal precipitating systems. By the time connection of the rain cells and the co-location between rain cells and cloud objects, the life cycle of precipitating systems is established. We can assess the progression of convective organization and the CCN effect on it.
In this section, we first present the simulated composite precipitation pattern in Taiwan under the weak synoptic environment. The composite result of the onset timing of precipitation is also examined, which plays a critical role in the subsequent convection development and hence the response of diurnal precipitation to increasing CCN. Lastly, object-based tracking analyses were carried out to quantify the changes in convective structures of the diurnal precipitating systems organized by orographic locking processes.
3.1 Composite precipitation patterns
Figure 4b demonstrates the composite simulated precipitation in Taiwan of our 30 cases. The simulated precipitation pattern captures the key features in the observed climatology of diurnal precipitation under weak synoptic weather in summertime (Fig. 4a and Lin et al., 2011), particularly the characteristics of more precipitation over the mountains than on the plains and the location of the two major precipitation hotspots (i.e., areas S and N in Fig. 1).
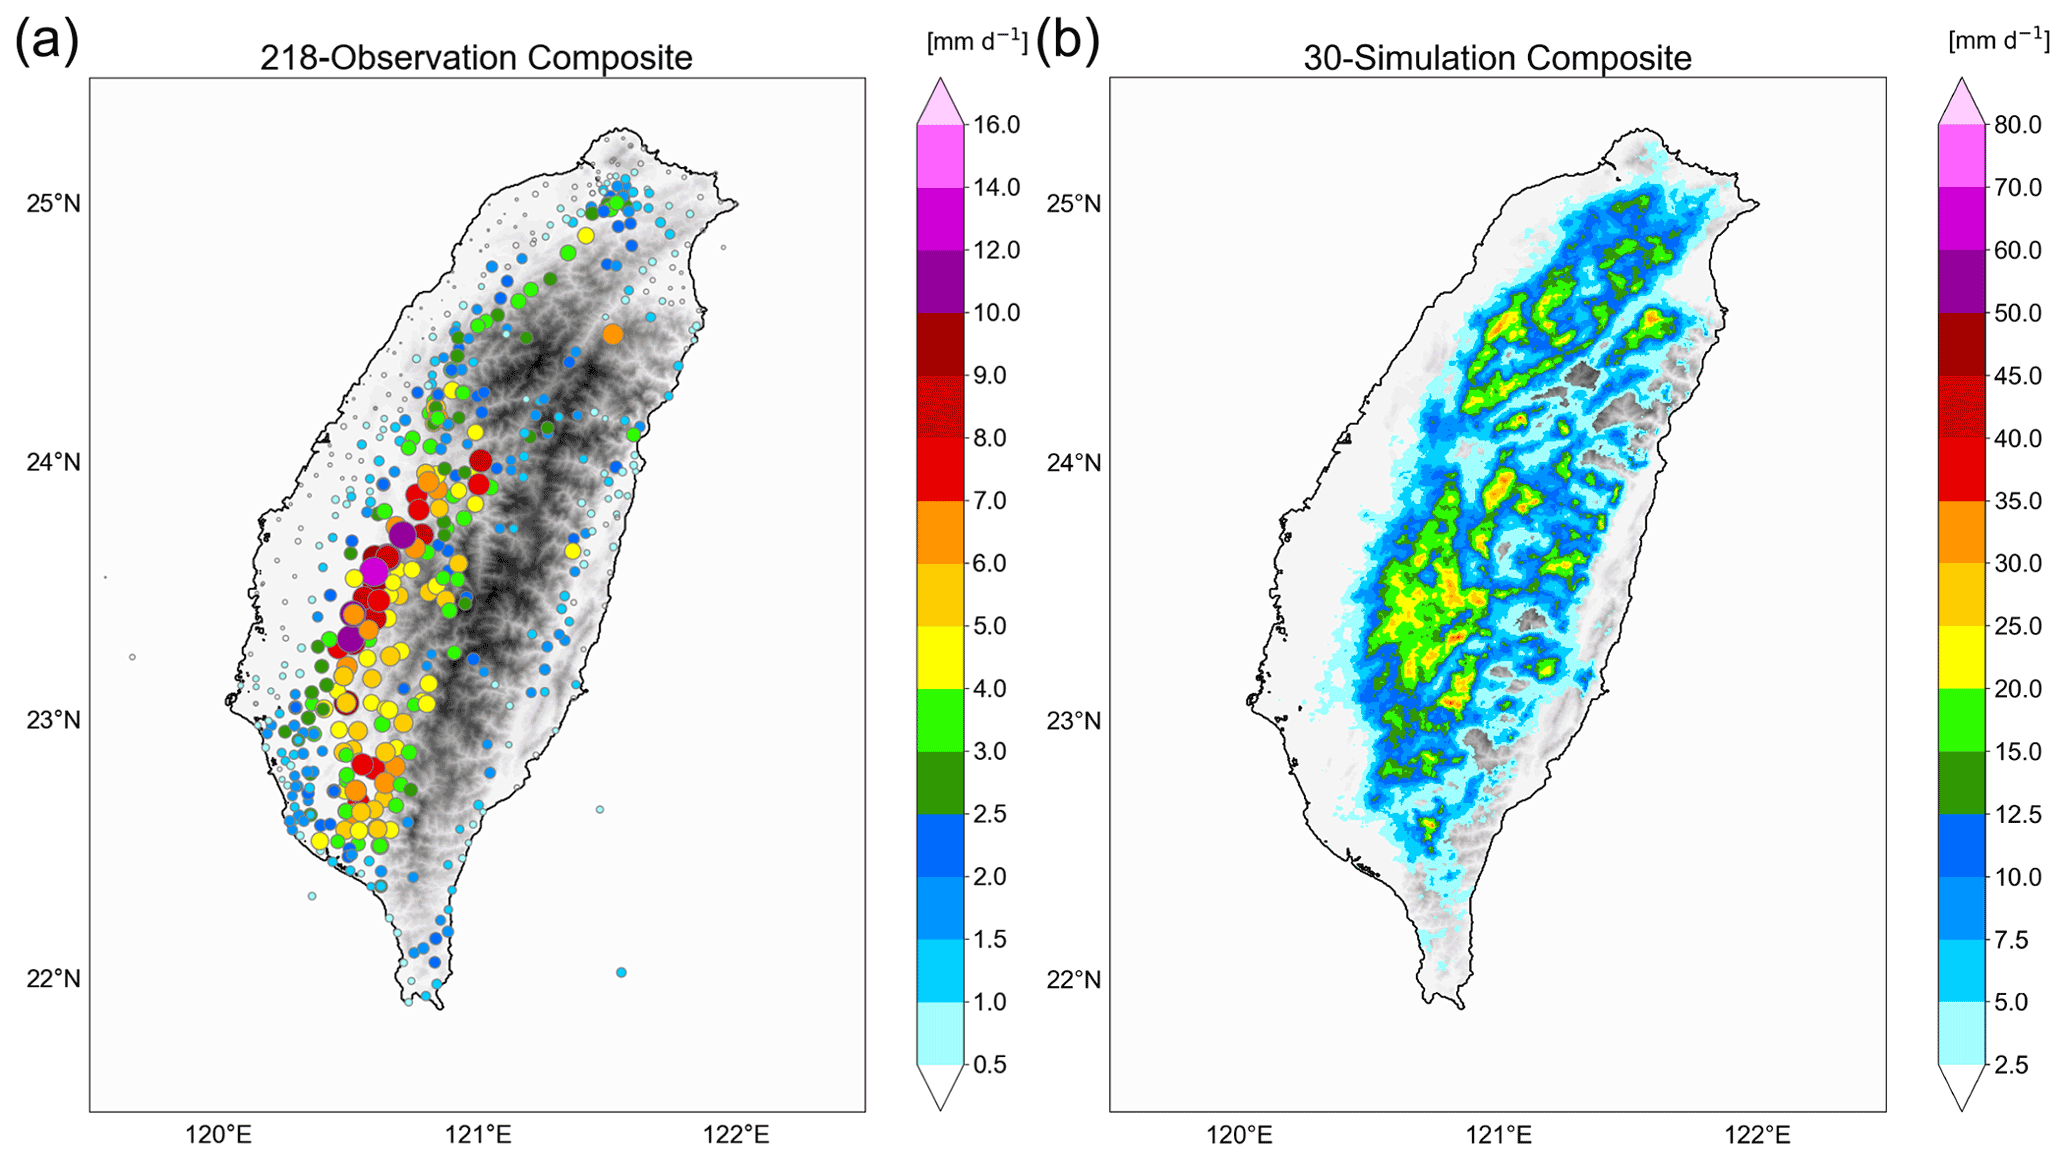
Figure 4The composite daily mean precipitation of (a) all 218 weak synoptic days from Central Weather Bureau rain gauge observations (the sizes of colored dots are scaled with the mean precipitation) and (b) all 30 semi-realistic simulations under the clean scenario on the island of Taiwan. Grey shading shows the orographic heights (same as in Fig. 1).
3.2 Initiation time of precipitation
The timing of sufficient solar heating and surface fluxes and the establishment of local circulation determine the initiation time of diurnal precipitation, which is highly influenced by the topography (Kuo and Wu, 2019). As increasing CCN suppress the warm rain processes and delay the rain initiation, the changes in the initiation time of precipitation reflect one of the crucial effects of increasing CCN on diurnal precipitation over complex topography.
To visualize the precipitation timing associated with the topography, a three-dimensional perspective is adopted using VAPOR (Clyne et al., 2007). It is clear to see that, under the clean scenario (Fig. 5a), the development of the initiation time of precipitation is earlier over the mountain ridges and later in the river valleys. The strong buoyancy gradient induced by the heating difference between the mountain ridges and their ambient atmosphere produces convergent valley breezes that cause early precipitation over the mountain ridges. As a result, diurnal precipitation can be initiated at noon or even earlier over the mountain ridges. In the river valleys, on the other hand, diurnal precipitation can be postponed until 15:30 or even later (not shown in Fig. 5a).
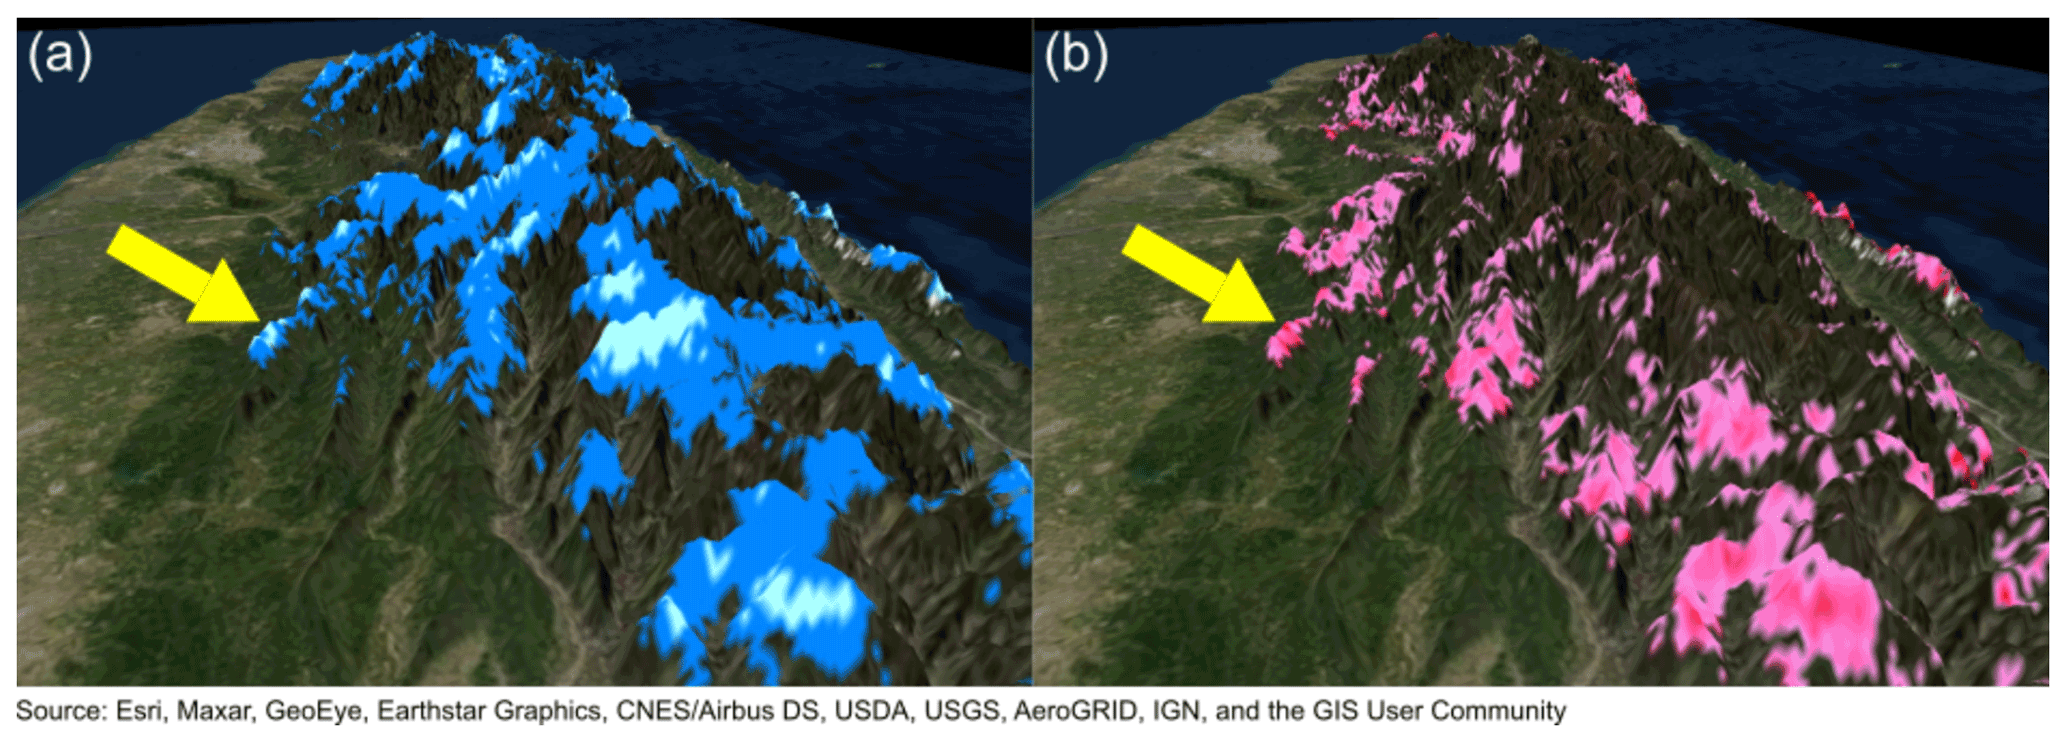
Figure 5(a) The composite initiation time of precipitation under the clean scenario in area S. The light blue and dark blue areas represent the initiation time from 10:00 to 12:00 and from 12:00 to 13:00. (b) The area of precipitation initiation is delayed for more than 1.5 h due to increasing CCN in area S. Only areas above 600 m are shown.
Figure 5b illustrates the delayed timing of precipitation initiation when CCN concentration increases (i.e., the normal scenario minus the clean scenario). For the highlighted areas with the significant postponement, the precipitation is usually initiated before 13:00 under the clean scenario. This phenomenon is especially evident in area S, where the western slopes and ridges (pointed out by the yellow arrow in Fig. 5) have a precipitation initiation at around noon and a significant rain postponement for about 1.5 h. Thus, we conclude that increasing CCN delay the initiation time of precipitation. This significant delay in precipitation initiation could prevent local circulation from being disrupted by rainfall, which provides the convective clouds with a longer time to develop. If this hypothesis stands, the convection supported by the persisting local circulation could lead to a stronger intensity and higher degree of organization. Therefore, we next compare the statistics associated with the convective structures diagnosed by object-based tracking analyses on diurnal precipitating systems to examine the relationship between the delay in precipitation initiation and the convective intensity.
3.3 Object-based tracking statistics
In this section, we apply the object-based tracking analyses, which diagnose both the spatial and the temporal connectivity of convective systems. The CCN effect could be different between organized and non-organized types of convection and among various stages of the convective life cycle (Rosenfeld et al., 2008). For the convective clouds that are locked by topography, the stochastic features of convection can be reduced. Thus, the following statistics concern the two major precipitation hotspot areas (areas S and N in Fig. 1), where orographic locking processes enhance the appearance of organized convective systems. We identify the organized regime by the size of the convective systems. For a simulated case under the clean scenario in a precipitation hotspot area, once the 75th percentile of the maximum cloud size during the lifetime of the diurnal precipitating systems is greater than 3×10⁴ km3, the area of the case was considered the organized regime. The classifications of the organized regime in areas S and N among the 30 simulations are listed in Table A1 in Appendix A. We then analyzed the result of the object-based tracking algorithm to identify the structural characteristics of convection modified by increasing aerosols in the mature stage of the convective life cycle (i.e., maximum intensity within the lifetime) for the organized and non-organized regimes.
Figure 6 presents the counts of the occurrence of precipitating systems with the maximum rain rate larger than 100 mm h−1. For the precipitation hotspot in area S (the green box in Fig. 1), the counts of the extreme precipitating systems increase significantly from 32 to 52 when CCN concentration rises. As for the precipitation hotspot in area N (the blue box in Fig. 1), the increment of the counts of the extreme precipitating systems due to rising CCN is only 1 (from 36 to 37), which is less than that in area S. Furthermore, the major hotspot in area S remains in about the same location, while the major hotspot shifts toward the ridges in the northeast in area N.
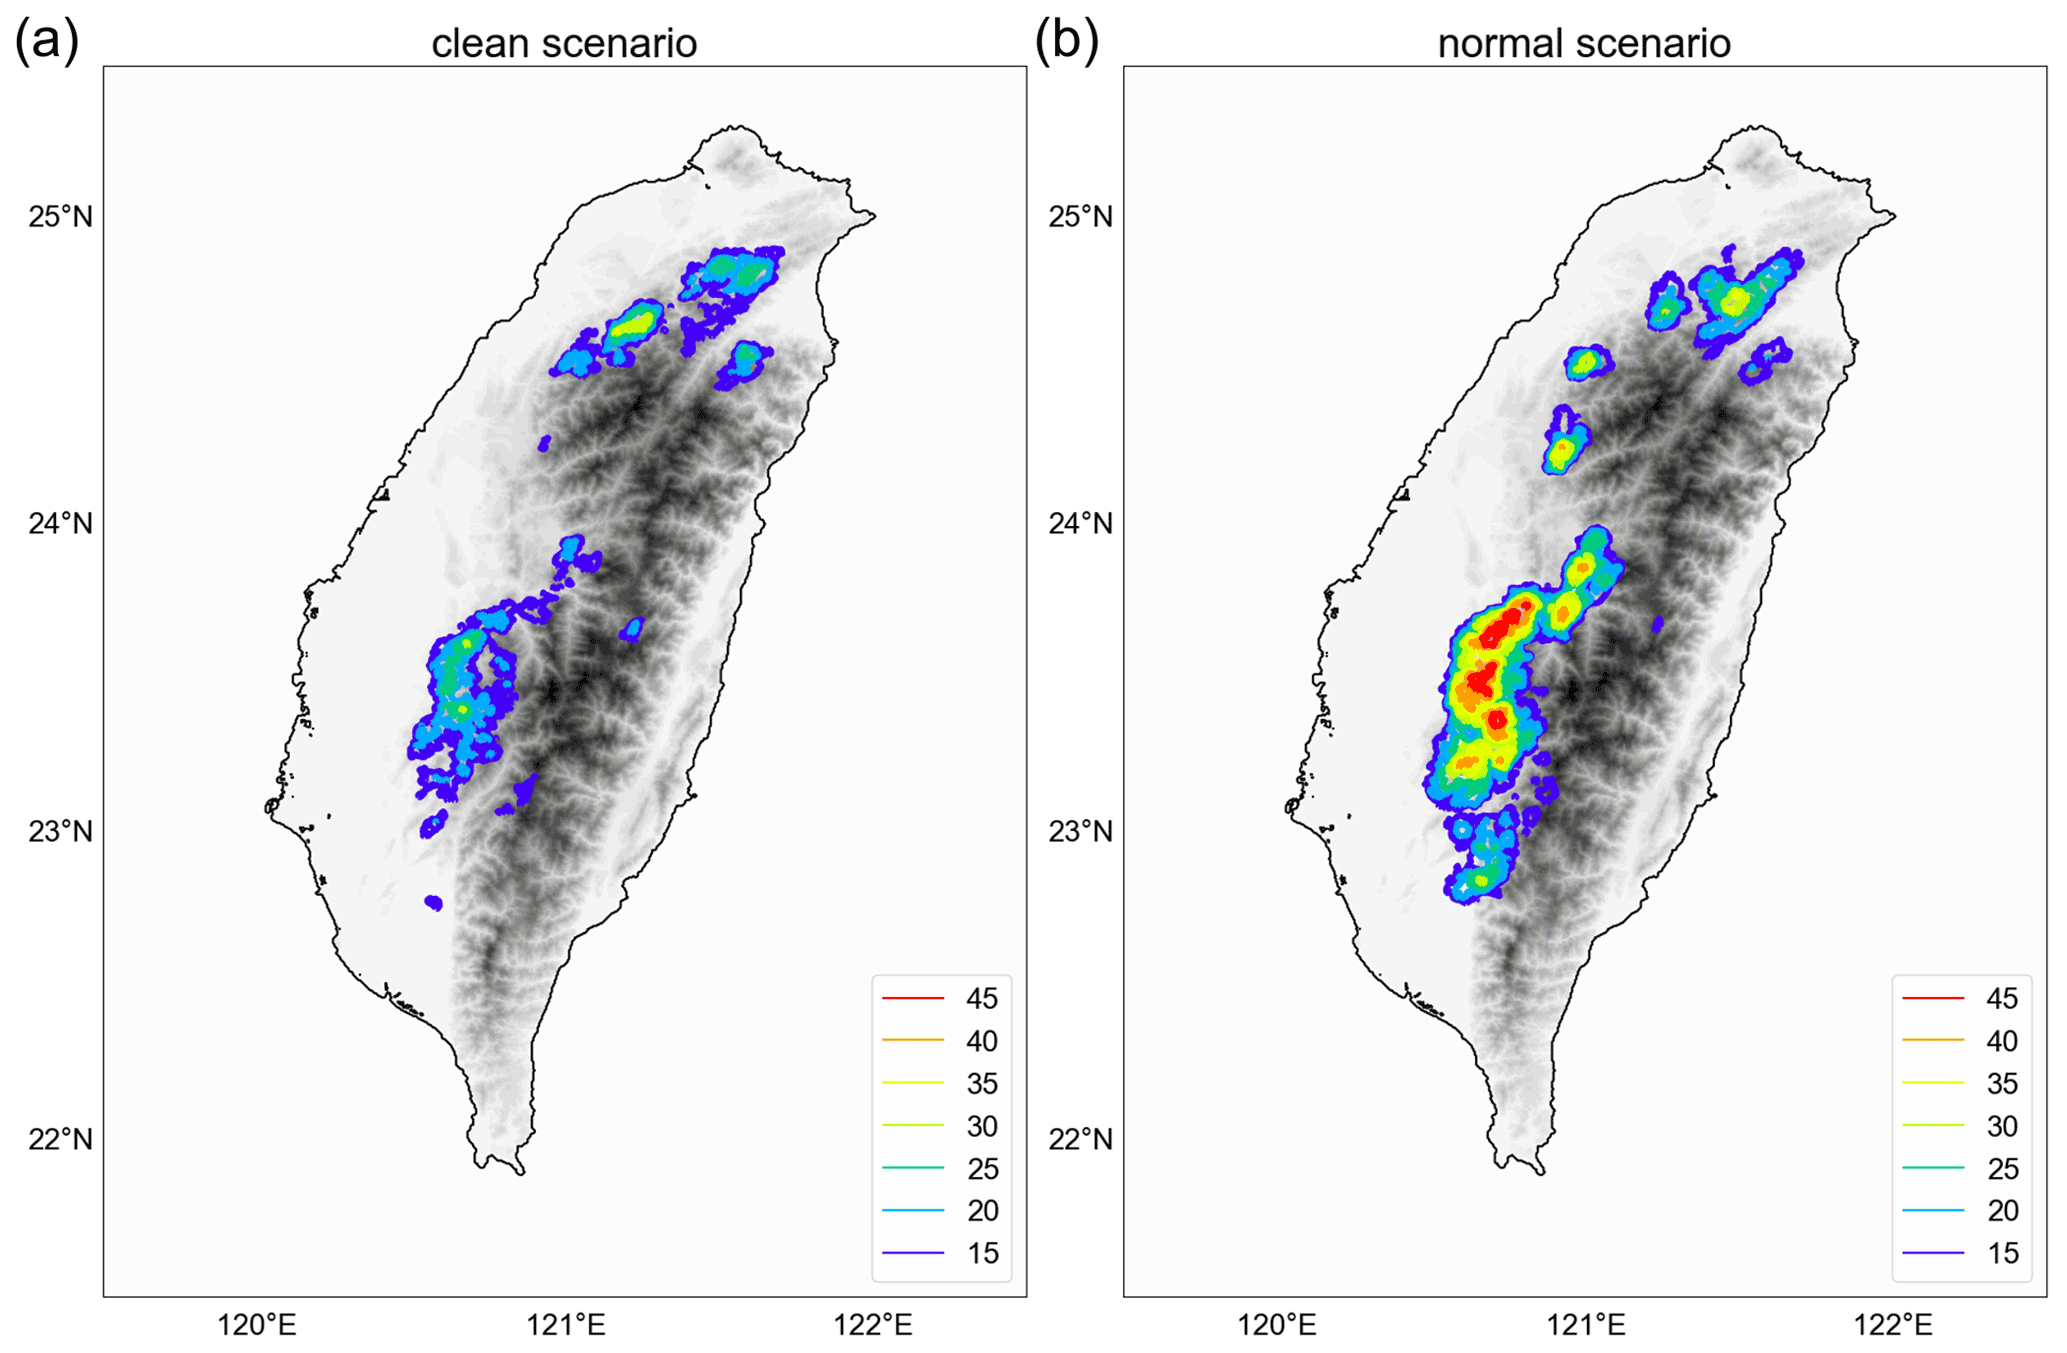
Figure 6The occurrence counts of convective systems with a maximum rain rate greater than 100 mm h−1 under (a) the clean scenario and (b) the normal scenario.
In addition to the spatial distribution of the extreme precipitating systems, the effect of increasing CCN can also be identified in the frequency of extreme precipitation, as shown by the probability density function (PDF) of the maximum rain rate of cloud objects (Fig. 7). For the organized regime, the probability of extreme precipitation is higher than that for the non-organized regime. Under the clean scenario, the probability of a 100 mm h−1 rain rate is for the organized regime (blue dots in Fig. 7a), higher than that () for the non-organized regime (blue dots in Fig. 7b). Furthermore, increasing CCN result in different responses in the PDF of the two regimes. Rising CCN lead to a notable enhancement in the probability of heavy precipitation for the organized regime, which is less significant for the non-organized regime. The probability of a 100 mm h−1 rain rate for the organized regime increases by , and that for the non-organized regime decreases by . On the other hand, the reduction in the probability of light precipitation for the organized regime is lower than that for the non-organized regime when CCN concentration rises. The probability of a 1 mm h−1 rain rate for the organized regime decreases by 11.7 %, and that for the non-organized regime reduces by 12.4 %.
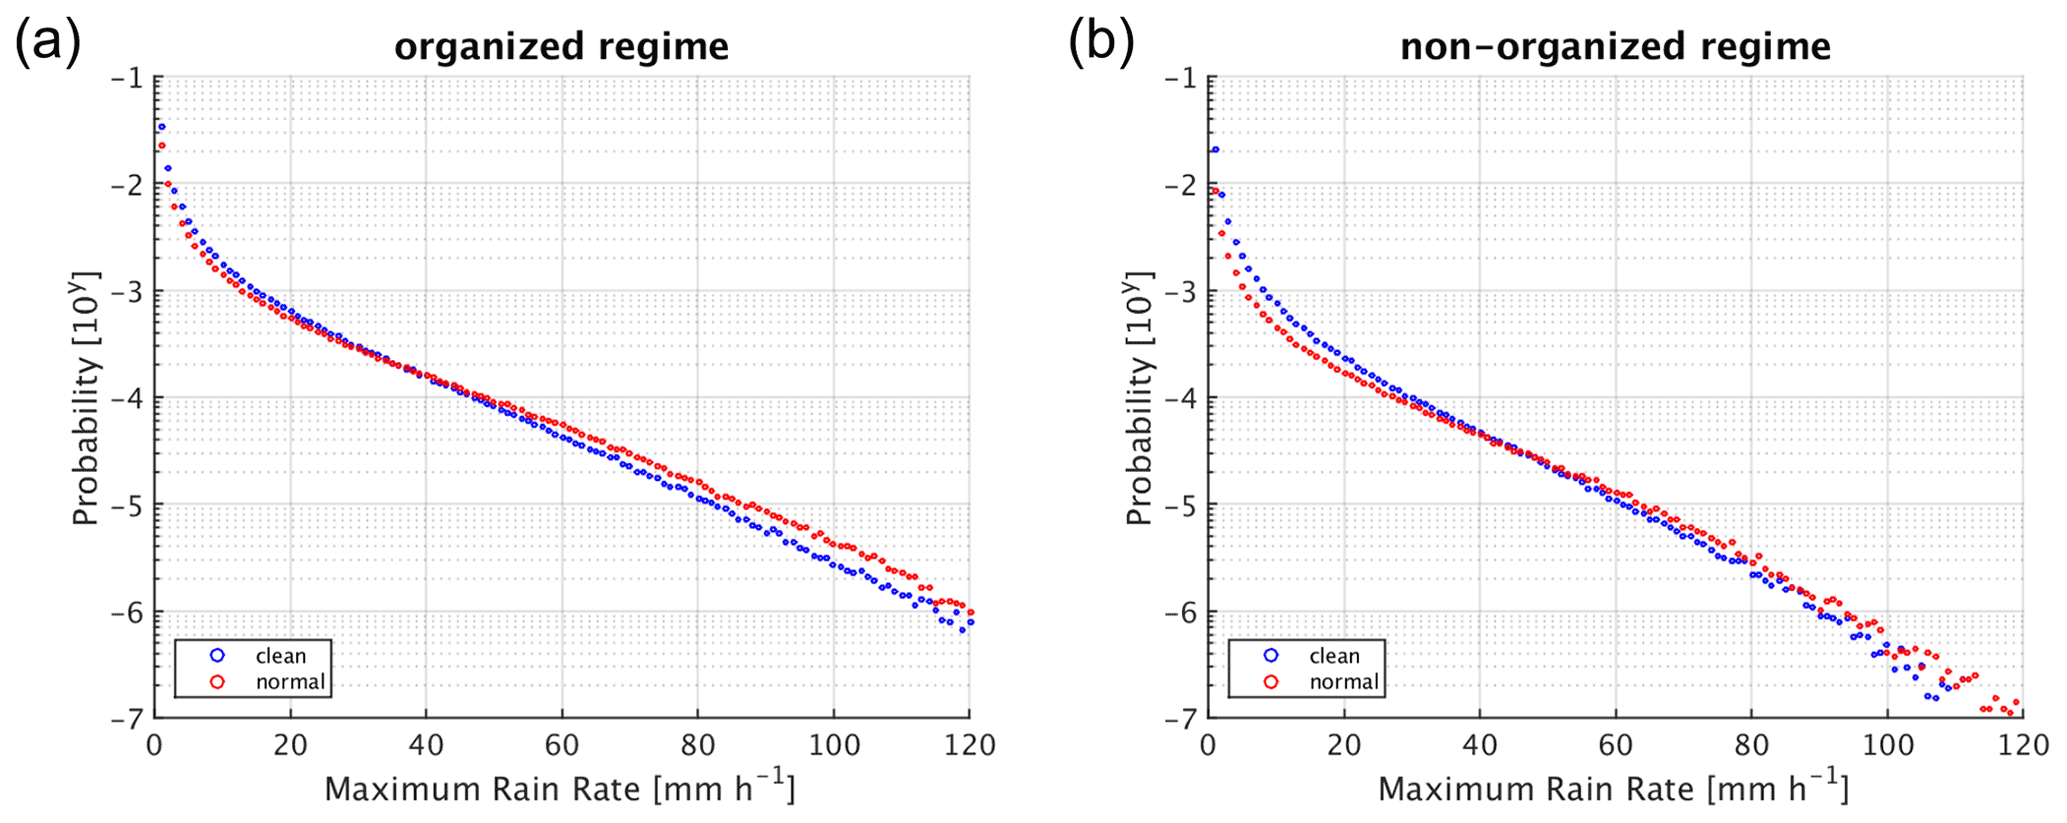
Figure 7The probability density functions of the maximum rain rates of the convective cloud objects for the (a) organized regime and (b) the non-organized regime. The blue and the red circles represent the results of the clean and the normal scenarios, respectively.
We further focus on the convective structure and intensity of the mature stage of the diurnal precipitating systems. Figure 8a demonstrates the box-and-whisker plot of the maximum rain rate during the lifetime of each precipitating system, representing the strength of the precipitation in the mature stage. CCN concentration is more influential on the extreme precipitation of the diurnal precipitating systems for the organized regime. The 99th percentile (P99) of the maximum rain rate increases by 10.84 mm h−1 for the organized regime when CCN concentration rises but only by 5.66 mm h−1 for the non-organized regime. The box-and-whisker plots of the maximum cloud depth and the maximum cloud size during the lifetime of each precipitating system are displayed in Fig. 8b and c, respectively, representing the characteristics of the cloud structures in the mature stage. The P99 of the maximum cloud depth increases by 0.86 km for the organized regime when CCN concentration rises, while it decreases by 0.30 km for the non-organized regime. The maximum cloud size increases by 1.43×10⁴ km3 for the organized regime when CCN concentration rises and by 1.90×10⁴ km3 for the non-organized regime. Figure 8d and e illustrate the box-and-whisker plots of the maximum in-cloud vertical velocity and the maximum core ratio during the lifetime of each precipitating system, representing the cloud dynamical features in the mature stage. The core ratio is defined as the fraction of the cloud with the vertical velocity larger than 0.5 m s−1, characterizing the updraft region. Generally, increasing CCN leads to a more intense in-cloud upward motion and a more concentrated core area for the organized regime. The P99 of the maximum in-cloud vertical velocity increases by 0.54 m s−1 for the organized regime when CCN concentration rises but decreases by 2.12 m s−1 for the non-organized regime. The P99 of the maximum core ratio decreases by 5.32 % and 4.59 % for the organized regime and the non-organized regime, respectively.
In summary, the CCN effect is more significant on the diurnal precipitating systems for the organized regime. The occurrence of the tracked extreme diurnal precipitating systems is notably enhanced. Also, the P99 of the maximum rain rate, cloud depth, and in-cloud vertical velocity during the lifetime of the diurnal precipitating systems increases by 9.4 %, 4.4 %, and 1.3 %.
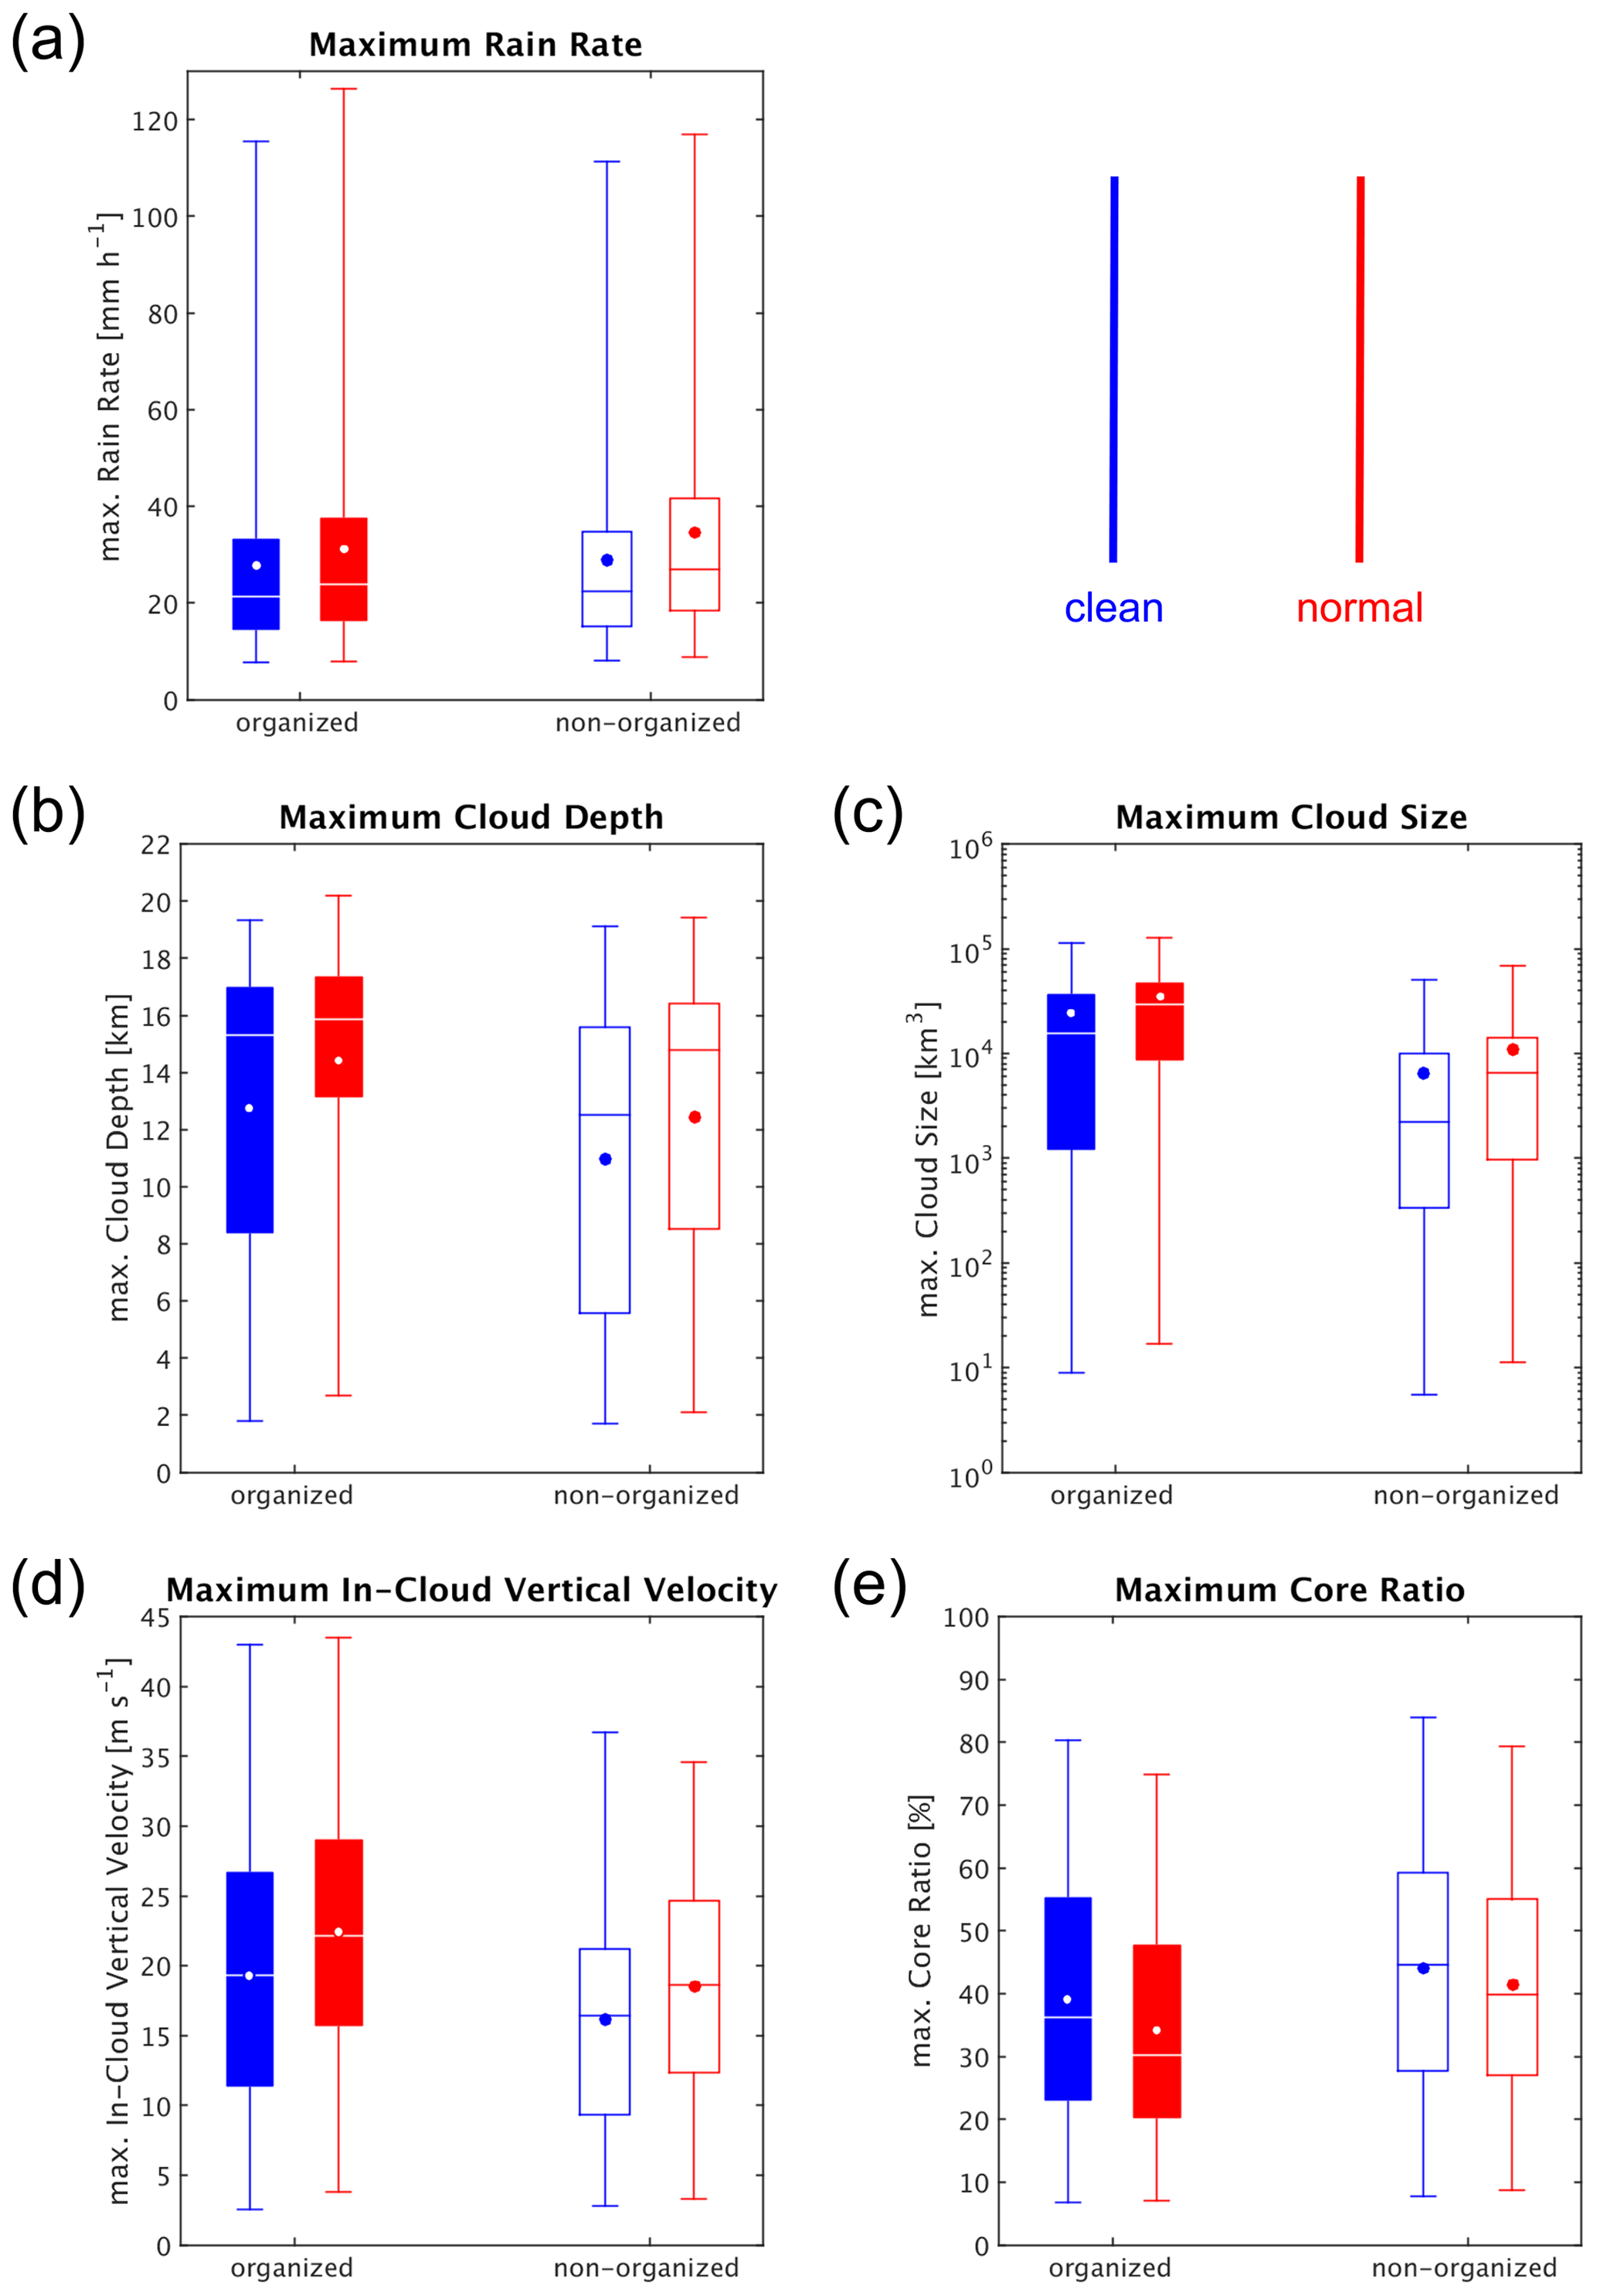
Figure 8The box-and-whisker plots of the maximum (a) rain rate, (b) cloud depth, (c) cloud size, (d) in-cloud vertical velocity, and (e) core ratio during the lifetime of the diurnal precipitating systems. The core ratio is defined as the proportion of the clouds with a vertical velocity greater than 0.5 m s−1, indicating the ratio of the updraft region. The blue and the red boxes represent the results of the clean and the normal scenarios, respectively. The filled boxes represent the organized regime, while the unfilled boxes represent the non-organized regime. The dots on the box-and-whisker plots are the mean values.
Stevens and Feingold (2009) pointed out that it is difficult to separate the effect of CCN changes and meteorological perturbations on convective clouds. Also, the variability in convective clouds is so large that it is challenging to make a statistically significant argument of the influence of increasing CCN on them even through numerical modeling experiments (Grabowski, 2018). We show that it is possible to untangle such ambiguity in a more specific condition in terms of weather, topography, and convective life cycle. This study focuses on the environmental regime of summertime weak synoptic weather over the complex topography of a subtropical island. Under this environment regime, the development of convection can be orographically locked. Thus, the convection would become more organized with extreme precipitation. By conducting object-based tracking analysis, we further reduce the variability between different stages of the convective life cycle (Rosenfeld et al., 2008) and focus on the mature stage of the diurnal precipitating systems.
The effects of increasing CCN can have statistically significant impacts on the organized diurnal precipitating systems through delay in precipitation initiation and sustenance of local circulation. The interaction between the convection and the topography-related local circulation is crucial in the mountains. Generally, increasing CCN delay the initiation time of precipitation. Especially for the organized regime, the significant postponement in the initiation time of precipitation due to increasing CCN prolongs the development of the local circulation and enables further development of convection. An evident example is shown in area S, where the development of convection over western slopes and ridges could be linked with local circulation (Fig. 5).
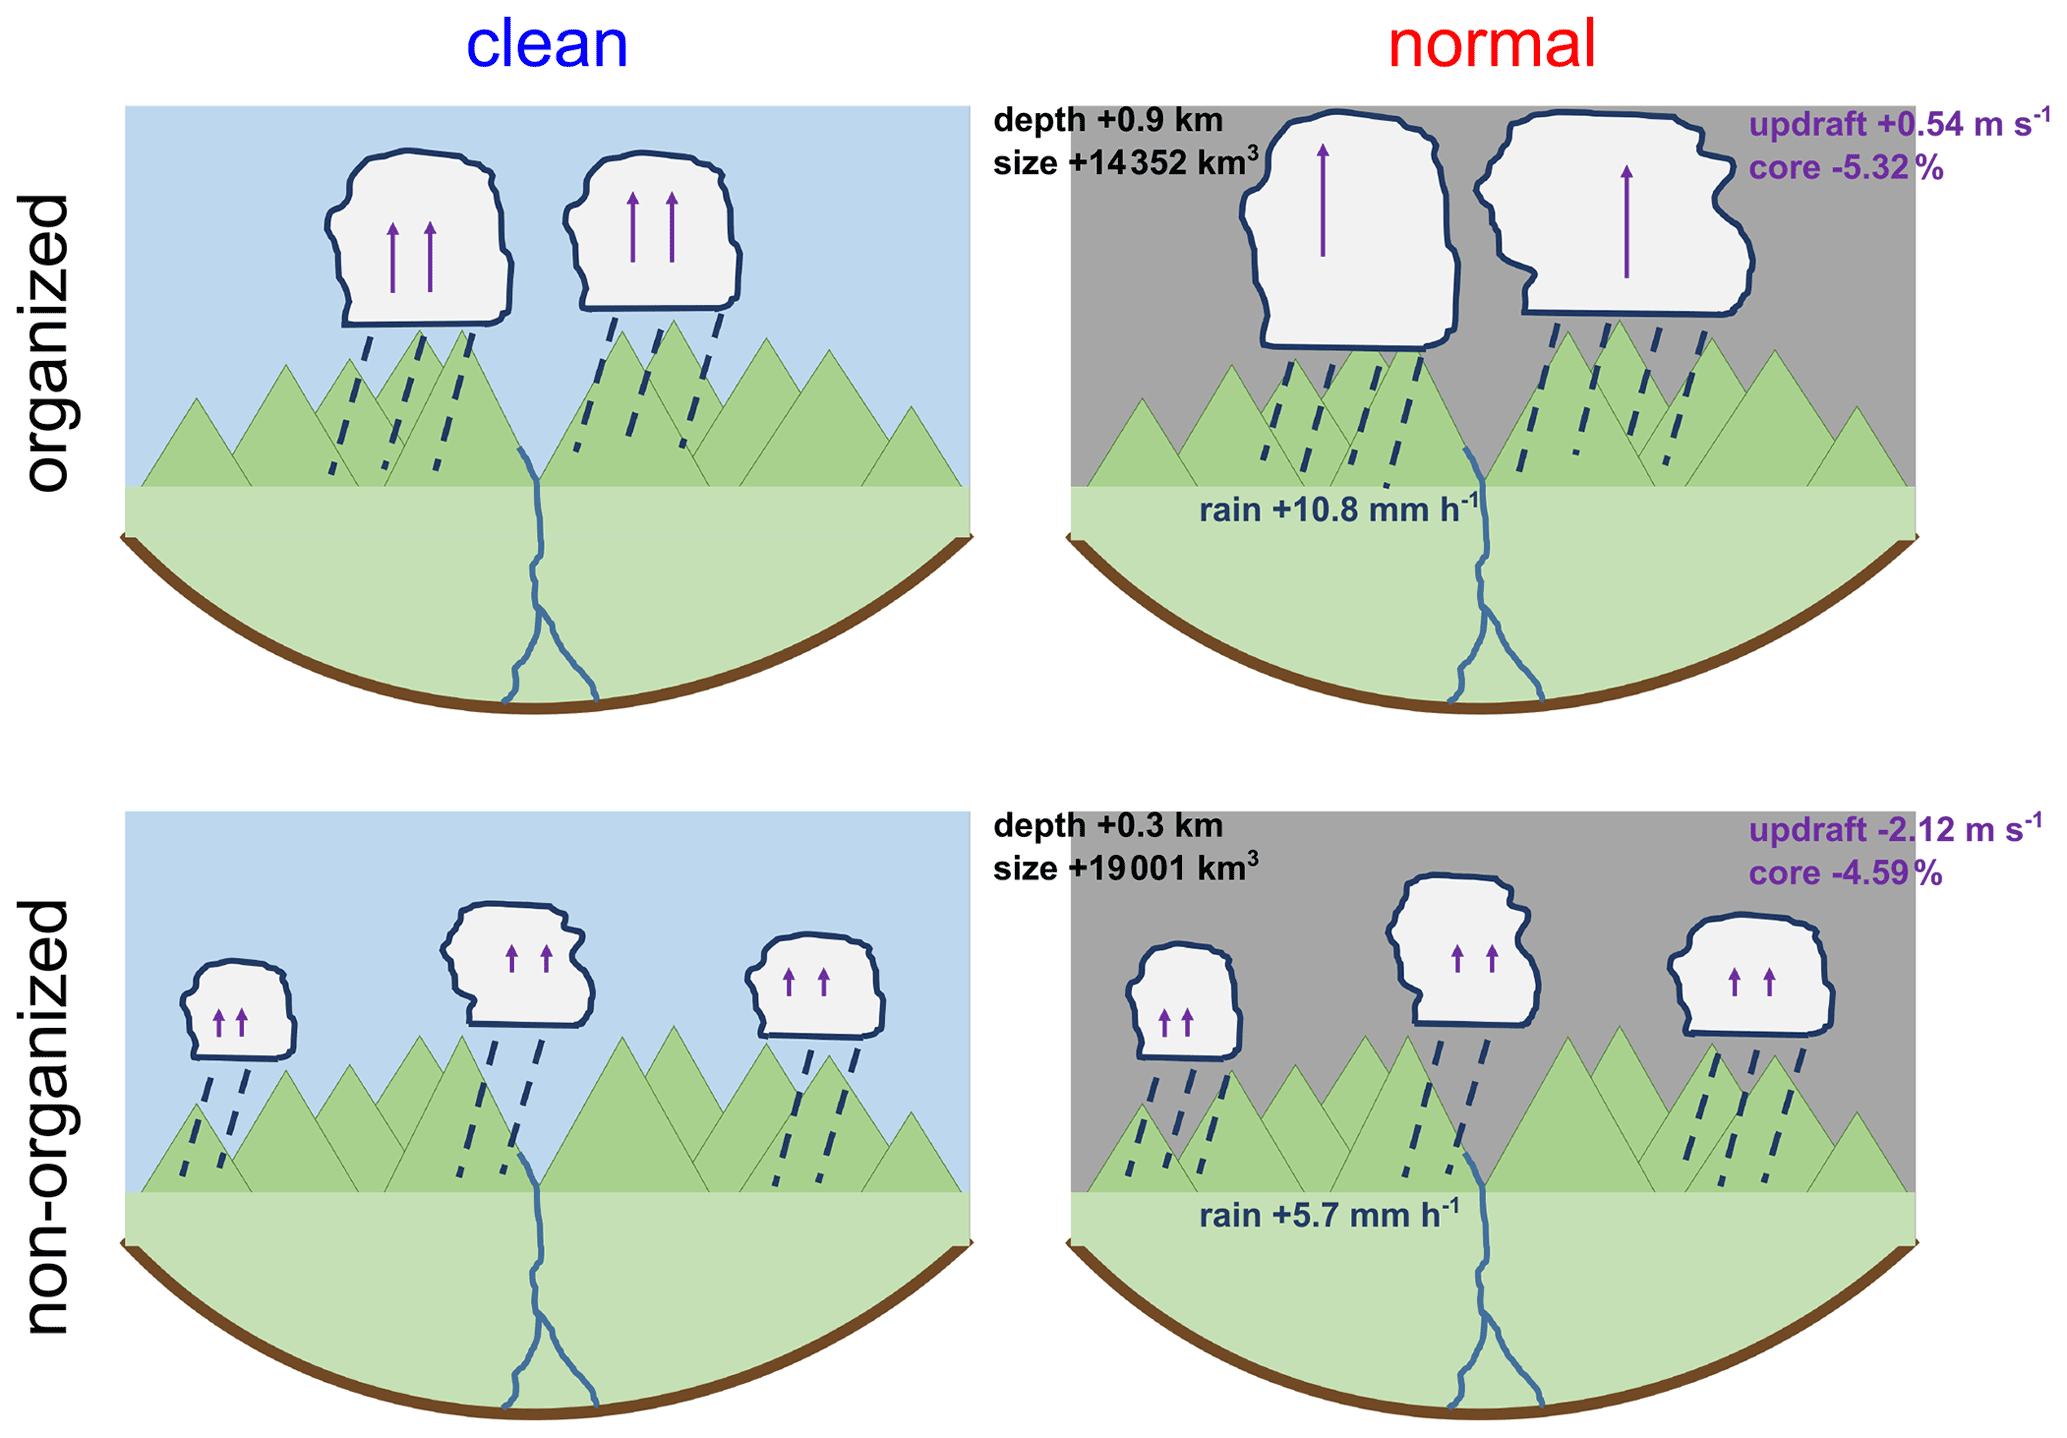
Figure 9The schematic diagram summarizes the influence of CCN on the mature stage of the diurnal precipitating systems over complex topography. The values in the normal scenario are the increment due to increasing CCN of the P99 of the maximum rain rate, cloud depth, cloud size, in-cloud vertical velocity, and core ratio.
Thus, for the organized regime, the CCN effect on convection becomes significant and is manifested in the convective structure and variability, as revealed by the changes in the extreme convective properties. The object-based tracking analyses introduced in this study and the statistics focusing on the mature stage enable us to identify that for the organized regime (the top panel of Fig. 9), rising CCN make the P99 of the maximum rain rate and the maximum cloud depth during the lifetime of the diurnal precipitating systems much more intense. Meanwhile, the convective clouds of the diurnal precipitating systems generally have a stronger vertical velocity with a more concentrated core area when CCN concentration increases. For the non-organized regime (the bottom panel of Fig. 9), although increasing CCN also lead to a more intense extreme rain rate and convective cloud, the increment of the P99 of the maximum rain rate and the maximum cloud depth during the lifetime of the diurnal precipitating systems is less significant. Fan et al. (2013) reported that aerosols could lead to changes in the macrophysics properties of convection, including the cloud top height, cloud depth, and cloud fraction. Our object-based statistics reveal the responses of the detailed morphology and structure of convective systems to aerosols, and the changes in the probability distribution of the convective properties are evident, showcasing that the object-based tracking analyses of extreme precipitating systems are useful to investigate the responses of orographically driven diurnal precipitating systems to CCN.
Although our results emphasize the importance of local circulation in the CCN influence on convection over complex topography, it is also critical to explore the uncertainty related to microphysics even when the dynamical environment is fairly well constrained (White et al., 2017). An earlier study using VVM identified that different microphysics schemes can lead to differences in convective structures mainly related to the melting processes at the freezing level (Huang and Wu, 2020). Therefore, we will explore the uncertainty related to microphysics in future studies by conducting mechanism denial experiments using a similar framework to separate the roles of warm-rain and cold-rain processes in the aerosol invigoration hypothesis (Rosenfeld et al., 2008).
The organized regime could be discovered in both diurnal precipitation hotspots but with different CCN responses to the occurrence of extreme diurnal precipitating systems (Fig. 6). Area S is the area directly windward of the southwesterly, and its terrain height increases gradually toward the inland. Area N, on the other hand, is situated in a rather leeward area with relatively equivalent terrain height. Under summertime weak synoptic weather with southwesterlies, the location and the terrain geometry of these areas could influence the CCN effect on extreme diurnal precipitating systems. Nevertheless, why diurnal precipitation in Taiwan shows the pattern of two distinct hotspots is a question that remains to be answered. Since diurnal precipitation is one of the primary water sources for Taiwan in summer, it is critical to understand its relationship with the atmospheric environment and the topography. In addition to the model simulations, high-temporal-resolution and high-spatial-resolution sounding observation, whose targets are the hotspots of diurnal precipitation and its upstream surroundings, can produce essential understandings of the fundamentals of diurnal precipitation over complex topography.
Through this research, we are confident that TaiwanVVM provides a profound framework to understand diurnal precipitation over complex topography in Taiwan. Aside from anthropogenic aerosol emissions, global warming and land use land cover change are also notable human-induced impacts on the environment. TaiwanVVM can serve as the tool to carry out scenario-based, high-resolution, semi-realistic simulations to assess how these factors could alter the characteristics of diurnal precipitation under summertime weak synoptic weather.
This study focuses on how CCN concentration affects the properties of diurnal precipitation under the weak synoptic weather regime over complex topography, which is a routine summertime environmental regime in Taiwan. Semi-realistic LESs are carried out using TaiwanVVM and driven by idealized observational soundings. Given the same atmospheric environment, clean and normal CCN concentration scenarios are simulated. We introduce object-based tracking analyses, aiming to reduce the variability in convection and target the aerosol effects on different stages of the convective life cycle. Our results show that for the organized regime, the effect of CCN on the diurnal precipitating systems is more notable. The precipitation is delayed more significantly due to increasing CCN, which prolong the development of local circulation and convection. Thus, the convective organization of the diurnal precipitating systems alters. When CCN concentration rises, the diurnal precipitating systems with extreme maximum rain rates occur more frequently. Also, for the normal scenario, the maximum precipitation and cloud depth during the lifetime of the diurnal precipitating systems become significantly more intense, and the diurnal precipitating systems have a stronger vertical velocity with a more concentrated core area.
In conclusion, we argue that CCN could significantly affect the extreme precipitation and cloud features of the diurnal precipitating systems under the summertime weak synoptic weather for the orographic locking organized regime. The background weather conditions, the topography, and the precipitation type work together to determine the development of the convective clouds and the effect of CCN on the properties of the convective clouds and the resulting precipitation.
Table A1The thermodynamic and dynamic parameters of the 30 initial soundings. Dates are in the format year/month/day. The organization status is also listed in the table, presented by O (organized regime) and X (non-organized regime).
Here, we selected four cases (30 August 2007, 27 August 2009, 30 June 2010, and 15 July 2012) to carry out the sensitivity tests, which applied only a 10-times increase in aerosol number concentration (). The counts of the occurrence of precipitating systems with a maximum rain rate larger than 100 mm h−1 in the clean sensitivity test (10-fold CCN) and normal (100-fold CCN) scenarios are presented in Fig. B1. The response in 10-fold CCN experiments is much closer to the 100-fold CCN experiments, indicating that the effects of 100-fold CCN are nearly saturated. The results of clean versus normal scenarios in these four cases are consistent with the analysis of the 30 cases in the main text. To emphasize the overall signal, in the main text we present the analysis comparing a CCN concentration of (clean scenario) and (normal scenario).
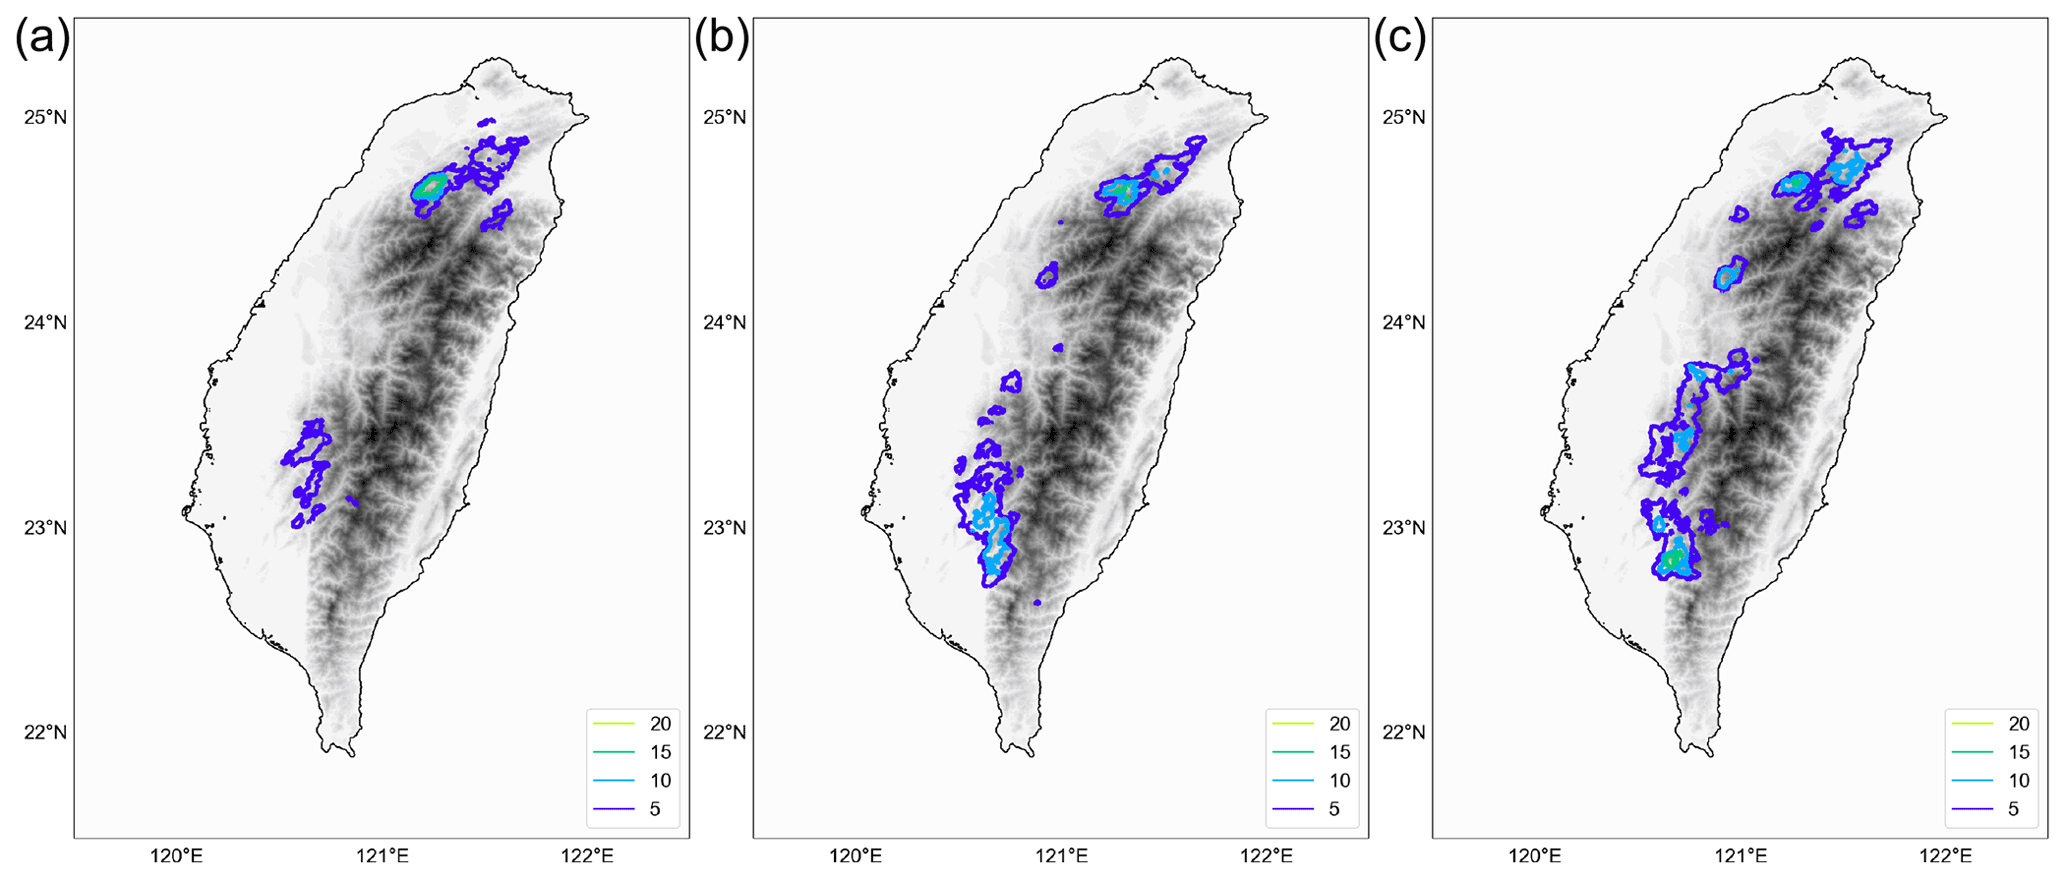
Figure B1The occurrence counts of convective systems with a maximum rain rate greater than 100 mm h−1 when CCN concentration is (a) , (b) , and (c) .
The observation and data sets were downloaded from the following sources: TRMM 3B42 from Tropical Rainfall Measuring Mission (TRMM) (2011), https://doi.org/10.5067/TRMM/TMPA/3H/7; CWB rain gauge and sounding observations from the Ministry of Science and Technology and Chinese Culture University, Data Bank for Atmospheric and Hydrologic Research, https://dbar.pccu.edu.tw/ (Ministry of Science and Technology and Chinese Culture University, 2018); and GLDAS version 2.0 soil moisture from Beaudoing and Rodell (2019), https://doi.org/10.5067/342OHQM9AK6Q.
YHC and WTC designed the experiments, and CMW performed the simulations. CM developed the tracking algorithm. YHC developed the code for analysing observation and model results. CCW carried out the 3D visualization of model outputs. YHC and WTC prepared the manuscript with contributions from all co-authors.
The authors declare that they have no conflict of interest.
Publisher’s note: Copernicus Publications remains neutral with regard to jurisdictional claims in published maps and institutional affiliations.
The authors sincerely thank the National Center for High-performance Computing (NCHC) and Central Weather Bureau (CWB) for providing the high-performance computation platform to conduct the simulations.
This research has been supported by the Ministry of Science and Technology, Taiwan (grant nos. MOST 109-2628-M-002-003-MY3 and MOST 107-2111-M-002-010-MY4), and the Alexander von Humboldt-Stiftung (grant no. MOST-AvH 109-2927-I-002-514-).
This paper was edited by Yun Qian and reviewed by two anonymous referees.
Albrecht, B. A.: Aerosols, Cloud Microphysics, and Fractional Cloudiness, Science, 245, 1227–1230, https://doi.org/10.1126/science.245.4923.1227, 1989.
Altaratz, O., Koren, I., Remer, L. A., and Hirsch, E.: Review: Cloud invigoration by aerosols – Coupling between microphysics and dynamics, Atmos. Res., 140–141, 38–60, https://doi.org/10.1016/j.atmosres.2014.01.009, 2014.
Andreae, M. O.: Correlation between cloud condensation nuclei concentration and aerosol optical thickness in remote and polluted regions, Atmos. Chem. Phys., 9, 543–556, https://doi.org/10.5194/acp-9-543-2009, 2009.
Beaudoing, H. and Rodell, M. (NASA/GSFC/HSL): GLDAS Noah Land Surface Model L4 3 hourly 0.25 × 0.25 degree V2.0, Greenbelt, Maryland, USA, Goddard Earth Sciences Data and Information Services Center (GES DISC) [data set], https://doi.org/10.5067/342OHQM9AK6Q, 2019.
Chen, F. and Dudhia, J.: Coupling an Advanced Land Surface–Hydrology Model with the Penn State–NCAR MM5 Modeling System. Part I: Model Implementation and Sensitivity, Mon. Weather Rev., 129, 569–585, https://doi.org/10.1175/1520-0493(2001)129<0569:Caalsh>2.0.Co;2, 2001.
Chen, F., Mitchell, K., Schaake, J., Xue, Y., Pan, H.-L., Koren, V., Duan, Q. Y., Ek, M., and Betts, A.: Modeling of land surface evaporation by four schemes and comparison with FIFE observations, J. Geophys. Res.-Atmos., 101, 7251–7268, https://doi.org/10.1029/95jd02165, 1996.
Chen, C.-S., Liu, C.-L., Yen, M.-C., Chen, C.-Y., Lin, P.-L., Huang, C.-Y., and Teng, J.-H.: Terrain Effects on an Afternoon Heavy Rainfall Event, Observed over Northern Taiwan on 20 June 2000 during Monsoon Break, J. Meteorol. Soc. JPN, 88, 649–671, https://doi.org/10.2151/jmsj.2010-403, 2010.
Cheng, C.-T., Wang, W.-C., and Chen, J.-P.: Simulation of the effects of increasing cloud condensation nuclei on mixed-phase clouds and precipitation of a front system, Atmos. Res., 96, 461–476, https://doi.org/10.1016/j.atmosres.2010.02.005, 2010.
Chien, M.-H. and Wu, C.-M.: Representation of topography by partial steps using the immersed boundary method in a vector vorticity equation model (VVM), J. Adv. Model. Earth Sy., 8, 212–223, https://doi.org/10.1002/2015ms000514, 2016.
Clavner, M., Cotton, W. R., van den Heever, S. C., Saleeby, S. M., and Pierce, J. R.: The response of a simulated mesoscale convective system to increased aerosol pollution: Part I: Precipitation intensity, distribution, and efficiency, Atmos. Res., 199, 193–208, https://doi.org/10.1016/j.atmosres.2017.08.010, 2018.
Clyne, J., Mininni, P., Norton, A., and Rast, M.: Interactive desktop analysis of high resolution simulations: application to turbulent plume dynamics and current sheet formation, New J. Phys., 9, 301–301, https://doi.org/10.1088/1367-2630/9/8/301, 2007.
Deardorff, J. W.: Parameterization of the Planetary Boundary layer for Use in General Circulation Models, Mon. Weather Rev., 100, 93–106, https://doi.org/10.1175/1520-0493(1972)100<0093:Potpbl>2.3.Co;2, 1972.
Fan, J., Leung, L. R., Rosenfeld, D., Chen, Q., Li, Z., Zhang, J., and Yan, H.: Microphysical effects determine macrophysical response for aerosol impacts on deep convective clouds, P. Natl. Acad. Sci. USA, 110, E4581–E4590, https://doi.org/10.1073/pnas.1316830110, 2013.
Fan, J., Wang, Y., Rosenfeld, D., and Liu, X.: Review of Aerosol–Cloud Interactions: Mechanisms, Significance, and Challenges, J. Atmos. Sci., 73, 4221–4252, https://doi.org/10.1175/jas-d-16-0037.1, 2016.
Givati, A. and Rosenfeld, D.: Quantifying Precipitation Suppression Due to Air Pollution, J. Appl. Meteorol., 43, 1038–1056, https://doi.org/10.1175/1520-0450(2004)043<1038:Qpsdta>2.0.Co;2, 2004.
Grabowski, W. W.: Can the Impact of Aerosols on Deep Convection be Isolated from Meteorological Effects in Atmospheric Observations?, J. Atmos. Sci., 75, 3347–3363, https://doi.org/10.1175/jas-d-18-0105.1, 2018.
Grabowski, W. W., Bechtold, P., Cheng, A., Forbes, R., Halliwell, C., Khairoutdinov, M., Lang, S., Nasuno, T., Petch, J., Tao, W.-K., Wong, R., Wu, X., and Xu, K.-M.: Daytime convective development over land: A model intercomparison based on LBA observations, Q. J. Roy. Meteor. Soc., 132, 317–344, https://doi.org/10.1256/qj.04.147, 2006.
Grabowski, W. W. and Morrison, H.: Untangling Microphysical Impacts on Deep Convection Applying a Novel Modeling Methodology. Part II: Double-Moment Microphysics, J. Atmos. Sci., 73, 3749–3770, https://doi.org/10.1175/jas-d-15-0367.1, 2016.
Hsieh, M.-K.: Effects of orographically induced low-level moisture convergence and inversion strength on upslope fog: a case study at Xitou, Master's thesis, Department of Atmospheric Sciences, National Taiwan University, Taiwan, 43 pp., https://doi.org/10.6342/ntu201900872, 2019.
Huang, J.-D. and Wu, C.-M.: Effects of Microphysical Processes on the Precipitation Spectrum in a Strongly Forced Environment, Earth and Space Science, 7, e2020EA001190, https://doi.org/10.1029/2020ea001190, 2020.
Iacono, M. J., Delamere, J. S., Mlawer, E. J., Shephard, M. W., Clough, S. A., and Collins, W. D.: Radiative forcing by long-lived greenhouse gases: Calculations with the AER radiative transfer models, J. Geophys. Res.-Atmos., 113, D13103, https://doi.org/10.1029/2008jd009944, 2008.
Iguchi, T., Nakajima, T., Khain, A. P., Saito, K., Takemura, T., and Suzuki, K.: Modeling the influence of aerosols on cloud microphysical properties in the east Asia region using a mesoscale model coupled with a bin-based cloud microphysics scheme, J. Geophys. Res.-Atmos., 113, D14215, https://doi.org/10.1029/2007jd009774, 2008.
Jirak, I. L. and Cotton, W. R.: Effect of Air Pollution on Precipitation along the Front Range of the Rocky Mountains, J. Appl. Meteorol. Clim., 45, 236–245, https://doi.org/10.1175/jam2328.1, 2006.
Jung, J.-H. and Arakawa, A.: A Three-Dimensional Anelastic Model Based on the Vorticity Equation, Mon. Weather Rev., 136, 276–294, https://doi.org/10.1175/2007mwr2095.1, 2008.
Kawecki, S., Henebry, G. M., and Steiner, A. L.: Effects of Urban Plume Aerosols on a Mesoscale Convective System, J. Atmos. Sci., 73, 4641–4660, https://doi.org/10.1175/jas-d-16-0084.1, 2016.
Khain, A., Pokrovsky, A., Pinsky, M., Seifert, A., and Phillips, V.: Simulation of Effects of Atmospheric Aerosols on Deep Turbulent Convective Clouds Using a Spectral Microphysics Mixed-Phase Cumulus Cloud Model. Part I: Model Description and Possible Applications, J. Atmos. Sci., 61, 2963–2982, https://doi.org/10.1175/jas-3350.1, 2004.
Khain, A., Rosenfeld, D., and Pokrovsky, A.: Aerosol impact on the dynamics and microphysics of deep convective clouds, Q. J. Roy. Meteor. Soc., 131, 2639–2663, https://doi.org/10.1256/qj.04.62, 2005.
Khain, A. P.: Notes on state-of-the-art investigations of aerosol effects on precipitation: a critical review, Environ. Res. Lett., 4, 015004, https://doi.org/10.1088/1748-9326/4/1/015004, 2009.
Khvorostyanov, V. I. and Curry, J. A.: Aerosol size spectra and CCN activity spectra: Reconciling the lognormal, algebraic, and power laws, J. Geophys. Res.-Atmos., 111, D12202, https://doi.org/10.1029/2005jd006532, 2006.
Krueger, S. K.: Numerical Simulation of Tropical Cumulus Clouds and Their Interaction with the Subcloud Layer, J. Atmos. Sci., 45, 2221–2250, https://doi.org/10.1175/1520-0469(1988)045<2221:Nsotcc>2.0.Co;2, 1988.
Kuo, K.-T. and Wu, C.-M.: The Precipitation Hotspots of Afternoon Thunderstorms over the Taipei Basin: Idealized Numerical Simulations, J. Meteorol. Soc. JPN Ser. II, 97, 501–517, https://doi.org/10.2151/jmsj.2019-031, 2019.
Lebo, Z. J.: The Sensitivity of a Numerically Simulated Idealized Squall Line to the Vertical Distribution of Aerosols, J. Atmos. Sci., 71, 4581–4596, https://doi.org/10.1175/jas-d-14-0068.1, 2014.
Lebo, Z. J. and Morrison, H.: Dynamical Effects of Aerosol Perturbations on Simulated Idealized Squall Lines, Mon. Weather Rev., 142, 991–1009, https://doi.org/10.1175/mwr-d-13-00156.1, 2014.
Li, G., Wang, Y., Lee, K.-H., Diao, Y., and Zhang, R.: Impacts of aerosols on the development and precipitation of a mesoscale squall line, J. Geophys. Res.-Atmos., 114, D17205, https://doi.org/10.1029/2008jd011581, 2009.
Lin, P.-F., Chang, P.-L., Jou, B. J.-D., Wilson, J. W., and Roberts, R. D.: Warm Season Afternoon Thunderstorm Characteristics under Weak Synoptic-Scale Forcing over Taiwan Island, Weather Forecast., 26, 44–60, https://doi.org/10.1175/2010waf2222386.1, 2011.
Lin, W.-T.: A study of the cloud condensation nuclei (CCN) activity for urban ambient aerosols, Master's thesis, Department of Atmospheric Sciences, National Taiwan University, Taiwan, 57 pp., https://doi.org/10.6342/ntu.2012.01002, 2012.
Liu, L., Cui, C., Deng, Y., Zhou, Z., Hu, Y., Wang, B., Ren, J., Cai, Z., Bai, Y., Yang, J., and Dong, X.: Localization and Invigoration of Mei-yu Front Rainfall due to Aerosol-Cloud Interactions: A Preliminary Assessment Based on WRF Simulations and IMFRE 2018 Field Observations, J. Geophys. Res.-Atmos., 125, e2019JD031952, https://doi.org/10.1029/2019jd031952, 2020.
Lynn, B. H., Khain, A. P., Dudhia, J., Rosenfeld, D., Pokrovsky, A., and Seifert, A.: Spectral (Bin) Microphysics Coupled with a Mesoscale Model (MM5). Part II: Simulation of a CaPE Rain Event with a Squall Line, Mon. Weather Rev., 133, 59–71, https://doi.org/10.1175/mwr-2841.1, 2005.
Lynn, B., Khain, A., Rosenfeld, D., and Woodley, W. L.: Effects of aerosols on precipitation from orographic clouds, J. Geophys. Res.-Atmos., 112, D10225, https://doi.org/10.1029/2006jd007537, 2007.
McCoy, D. T., Field, P. R., Schmidt, A., Grosvenor, D. P., Bender, F. A.-M., Shipway, B. J., Hill, A. A., Wilkinson, J. M., and Elsaesser, G. S.: Aerosol midlatitude cyclone indirect effects in observations and high-resolution simulations, Atmos. Chem. Phys., 18, 5821–5846, https://doi.org/10.5194/acp-18-5821-2018, 2018.
Miao, J.-E. and Yang, M.-J.: A Modeling Study of the Severe Afternoon Thunderstorm Event at Taipei on 14 June 2015: The Roles of Sea Breeze, Microphysics, and Terrain, J. Meteorol. Soc. JPN Ser. II, 98, 129–152, https://doi.org/10.2151/jmsj.2020-008, 2020.
Ministry of Science and Technology and Chinese Culture University: Central Weather Bureau Weather Station Observation Data, Data Bank for Atmospheric and Hydrologic Research (DBAR) [data set], available at: https://dbar.pccu.edu.tw/ (last access: 28 January 2021), 2018.
Morrison, H. and Grabowski, W. W.: Comparison of Bulk and Bin Warm-Rain Microphysics Models Using a Kinematic Framework, J. Atmos. Sci., 64, 2839–2861, https://doi.org/10.1175/jas3980, 2007.
Morrison, H. and Grabowski, W. W.: Modeling Supersaturation and Subgrid-Scale Mixing with Two-Moment Bulk Warm Microphysics, J. Atmos. Sci., 65, 792–812, https://doi.org/10.1175/2007jas2374.1, 2008.
Morrison, H. and Milbrandt, J. A.: Parameterization of Cloud Microphysics Based on the Prediction of Bulk Ice Particle Properties. Part I: Scheme Description and Idealized Tests, J. Atmos. Sci., 72, 287–311, https://doi.org/10.1175/jas-d-14-0065.1, 2015.
Moseley, C., Berg, P., and Haerter, J. O.: Probing the precipitation life cycle by iterative rain cell tracking, J. Geophys. Res.-Atmos., 118, 13361–13370, https://doi.org/10.1002/2013jd020868, 2013.
Moseley, C., Henneberg, O., and Haerter, J. O.: A Statistical Model for Isolated Convective Precipitation Events, J. Adv. Model. Earth Sy., 11, 360–375, https://doi.org/10.1029/2018ms001383, 2019.
Mülmenstädt, J. and Feingold, G.: The Radiative Forcing of Aerosol–Cloud Interactions in Liquid Clouds: Wrestling and Embracing Uncertainty, Curr. Clim. Change Rep., 4, 23–40, https://doi.org/10.1007/s40641-018-0089-y, 2018.
Nugent, A. D., Watson, C. D., Thompson, G., and Smith, R. B.: Aerosol Impacts on Thermally Driven Orographic Convection, J. Atmos. Sci., 73, 3115–3132, https://doi.org/10.1175/jas-d-15-0320.1, 2016.
Rodell, M., Houser, P. R., Jambor, U., Gottschalck, J., Mitchell, K., Meng, C.-J., Arsenault, K., Cosgrove, B., Radakovich, J., Bosilovich, M., Entin, J. K., Walker, J. P., Lohmann, D., and Toll, D.: The Global Land Data Assimilation System, B. Am. Meteorol. Soc., 85, 381–394, https://doi.org/10.1175/bams-85-3-381, 2004.
Rosenfeld, D., Lohmann, U., Raga, G. B., Dowd, C. D., Kulmala, M., Fuzzi, S., Reissell, A., and Andreae, M. O.: Flood or Drought: How Do Aerosols Affect Precipitation?, Science, 321, 1309–1313, https://doi.org/10.1126/science.1160606, 2008.
Seo, J. M., Lee, H., Moon, S., and Baik, J.-J.: How Mountain Geometry Affects Aerosol-Cloud-Precipitation Interactions: Part I. Shallow Convective Clouds, J. Meteorol. Soc. JPN Ser. II, 98, 43–60, https://doi.org/10.2151/jmsj.2020-003, 2020.
Shutts, G. J. and Gray, M. E. B.: A numerical modelling study of the geostrophic adjustment process following deep convection, Q. J. Roy. Meteor. Soc., 120, 1145–1178, https://doi.org/10.1002/qj.49712051903, 1994.
Stevens, B. and Feingold, G.: Untangling aerosol effects on clouds and precipitation in a buffered system, Nature, 461, 607–613, https://doi.org/10.1038/nature08281, 2009.
Su, C.-Y., Chen, W.-T., Chen, J.-P., Chang, W.-Y., and Jou, B. J.-D.: The Impacts of cloud condensation nuclei on the extreme precipitation of a monsoon coastal mesoscale convection system, Terr. Atmos. Ocean. Sci., 31, 131–139, https://doi.org/10.3319/tao.2019.11.29.01, 2020.
Su, S.-H., Chu, J.-L., Yo, T.-S., and Lin, L.-Y.: Identification of synoptic weather types over Taiwan area with multiple classifiers, Atmos. Sci. Lett., 19, e861, https://doi.org/10.1002/asl.861, 2018.
Tao, W.-K., Li, X., Khain, A., Matsui, T., Lang, S., and Simpson, J.: Role of atmospheric aerosol concentration on deep convective precipitation: Cloud-resolving model simulations, J. Geophys. Res.-Atmos., 112, D24S18, https://doi.org/10.1029/2007jd008728, 2007.
Tao, W.-K., Chen, J.-P., Li, Z., Wang, C., and Zhang, C.: Impact of aerosols on convective clouds and precipitation, Rev. Geophys., 50, RG2001, https://doi.org/10.1029/2011RG000369, 2012.
Thompson, G. and Eidhammer, T.: A Study of Aerosol Impacts on Clouds and Precipitation Development in a Large Winter Cyclone, J. Atmos. Sci., 71, 3636–3658, https://doi.org/10.1175/jas-d-13-0305.1, 2014.
Tropical Rainfall Measuring Mission (TRMM): TRMM (TMPA) Rainfall Estimate L3 3 hour 0.25 degree × 0.25 degree V7, Greenbelt, MD, Goddard Earth Sciences Data and Information Services Center (GES DISC) [data set], https://doi.org/10.5067/TRMM/TMPA/3H/7, 2011.
Tsai, W.-M. and Wu, C.-M.: The environment of aggregated deep convection, J. Adv. Model. Earth Sys., 9, 2061–2078, https://doi.org/10.1002/2017ms000967, 2017.
Wang, C.: A modeling study of the response of tropical deep convection to the increase of cloud condensation nuclei concentration: 1. Dynamics and microphysics, J. Geophys. Res.-Atmos., 110, D21211, https://doi.org/10.1029/2004jd005720, 2005.
White, B., Gryspeerdt, E., Stier, P., Morrison, H., Thompson, G., and Kipling, Z.: Uncertainty from the choice of microphysics scheme in convection-permitting models significantly exceeds aerosol effects, Atmos. Chem. Phys., 17, 12145–12175, https://doi.org/10.5194/acp-17-12145-2017, 2017.
Wu, C.-M. and Arakawa, A.: Inclusion of Surface Topography into the Vector Vorticity Equation Model (VVM), J. Adv. Model. Earth Sy., 3, M04002, https://doi.org/10.1029/2011ms000061, 2011.
Wu, C.-M., Lin, H.-C., Cheng, F.-Y., and Chien, M.-H.: Implementation of the Land Surface Processes into a Vector Vorticity Equation Model (VVM) to Study its Impact on Afternoon Thunderstorms over Complex Topography in Taiwan, Asia-Pac, J. Atmos. Sci., 55, 701–717, https://doi.org/10.1007/s13143-019-00116-x, 2019.
Wu, C.-M. and Chen, P.-Y.: Idealized cloud-resolving simulations of land–atmosphere coupling over tropical islands, Terr. Atmos. Ocean. Sci., 32, 191–202, https://doi.org/10.3319/TAO.2020.12.16.01, 2021.
Zhang, L., Fu, T.-M., Tian, H., Ma, Y., Chen, J.-P., Tsai, T.-C., Tsai, I.-C., Meng, Z., and Yang, X.: Anthropogenic Aerosols Significantly Reduce Mesoscale Convective System Occurrences and Precipitation Over Southern China in April, Geophys. Res. Lett., 47, e2019GL086204, https://doi.org/10.1029/2019gl086204, 2020.