the Creative Commons Attribution 4.0 License.
the Creative Commons Attribution 4.0 License.
 | 16 Nov 2021
A meteorological overview of the ORACLES (ObseRvations of Aerosols above CLouds and their intEractionS) campaign over the southeastern Atlantic during 2016–2018: Part 1 – Climatology
Ju-Mee Ryoo
Leonhard Pfister
Rei Ueyama
Paquita Zuidema
Robert Wood
Ian Chang
Jens Redemann
In 2016–2018, the ObseRvations of Aerosols above CLouds and their intEractionS (ORACLES) project undertook 3-month-long deployments to the southeastern (SE) Atlantic Ocean using research aircraft to better understand the impact of biomass burning (BB) aerosol transport to the SE Atlantic Ocean on climate. In this (part 1 of the meteorological overview) paper, the climatological features at monthly timescales are investigated. The southern African easterly jet (AEJ-S), defined as the zonal easterlies over 600–700 hPa exceeding 6 m s−1 around 5–15∘ S, is a characteristic feature of the mid-level circulation over southern Africa that was also during the deployment months of August 2017, September 2016, and October 2018. Climatologically, the AEJ-S develops at lower altitudes (∼ 3 km; 700 hPa) between 5–10∘ S in August, while it develops at around 4 km (∼ 600 hPa) and further south (5–15∘ S) in September and October, largely driven by the strong sensible heating over the African plateau.
Notable meteorological anomalous characteristics during the 3 deployment months, compared to climatology (2000–2018), include the following: (1) during August 2017, the AEJ-S was weaker than the climatological mean, with an additional anomalous upper-level jet aloft (∼ 6 km) around 10∘ S. August 2017 was also drier over the SE Atlantic at 600–700 hPa than climatology, with a stronger Benguela low-level jet (LLJ) at 925–950 hPa along the Namibian coast of the SE Atlantic. Consistent with this, the southern Atlantic anticyclone was also stronger and closer to the coast than the August climatological mean. (2) During September 2016, the AEJ-S intensity was similar to the climatological mean, although the heat low and vertical motion over the land was slightly stronger compared to the September climatology. The LLJ and the large-scale southern Atlantic anticyclone were stronger than the climatological mean. (3) During October 2018, the AEJ-S was slightly weaker compared to the climatological mean, as was the LLJ and the southern Atlantic anticyclone. October 2018 was wetter over the Benguela coastal region at 600 hPa than the climatological mean. During all the deployment months, the sea surface temperatures (SST) over the SE Atlantic were warmer than the climatological means, but the monthly mean low cloud fraction was only noticeably reduced in August 2017.
A weak August 2017 AEJ-S can explain low offshore black carbon (BC) mixing ratios within the European Centre for Medium-Range Weather Forecasts (ECMWF) Copernicus Atmosphere Monitoring Service (CAMS) reanalysis, although the BC peak altitude, at 2–3 km, is below that of the AEJ-S. The upper-level wave disturbance and the associated anomalous circulation also explain the weakening of AEJ-S through the reduction of the strength of the heat low over the land during August 2017.
- Article
(15895 KB) - Full-text XML
- Companion paper
-
Supplement
(2639 KB) - BibTeX
- EndNote


The southeastern (SE) Atlantic and the west coast of southern Africa is one of the key regions of the globe for understanding the interactions between the Earth's climate, weather, and pollution. It is characterized by a stratocumulus cloud deck associated with strong large-scale subsidence and the anticyclonic circulation of the semi-permanent southern Atlantic sea level pressure high (Klein and Hartman, 1993; Wood, 2015). The low-level stratocumulus clouds increase the net amount of outgoing radiation at the top of the atmosphere (TOA), inducing a negative radiative effect (a cooling).
The southern African Easterly Jet (AEJ-S) in the Southern Hemisphere (SH), one of two jets dominating the mid-tropospheric circulation over Africa, is an effective carrier of aerosols (Adebiyi and Zuidema, 2016). Adebiyi and Zuidema (2016) showed that about 55 % of the biomass burning (BB) aerosols from southern Africa during September–October is transported westward by the AEJ-S to the southern tropical Atlantic and beyond, and the remaining BB aerosols are either carried northwestward into the intertropical convergence zone or returned toward southern Africa. Additionally, a strong low-level wind, known as the Benguela low-level jet (hereafter LLJ; Nicholson, 2010), is also one of the characteristic features of the SE Atlantic circulation, which is related to the strength and location of the subtropical high (Nicholson, 2010).
Figure 1 illustrates maps of the SE Atlantic region and the elevation of the adjacent African continent showing the characteristic features over that region. The distinct difference in elevation between the Congo basin (north of 10∘ S) and the Namibia–Kalahari dryland (south of 10∘ S, 15–21∘ S) is evident (Fig. 1a). At mid-levels (∼ 600 hPa) during August-October, the strong easterly winds, AEJ-S, transport high relative humidity (RH) plumes (compared to the air it is replacing) from the African continent over the ocean, aided, in part, by the topography itself (i.e., by deflecting the mid-latitude westerlies and increasing low-level tropospheric stability (LTS), leading to an increase in the stratocumulus; Richter and Mechoso, 2006). The mid-level anticyclone (centered at 5–15∘ S, 0–10∘ E around 600–700 hPa) associated with the AEJ-S is caused by differential latitudinal heating over the land and is tied to the topography of southwestern Africa. Air recirculated by the anticyclone, to the south of the AEJ-S, returns to the African continent south of 18∘ S and merges with mid-latitude westerly winds (Fig. 1b).
The LLJ is characterized by peak winds (∼ 10 m s−1) around 925–950 hPa over the Benguela current along the Namibian coast of the SE Atlantic (∼ 10∘ E, 20–25∘ S; Fig. 1c). The LLJ is also related to the strength and location of the subtropical high (Nicholson, 2010) but also generates a secondary circulation that can affect local subsidence. The SE Atlantic LLJ differs in important respects from the SE Pacific LLJ along the Chilean coast. Zuidema et al. (2016) showed that the exit region of the SE Atlantic LLJ tends to be an offshore flow with a surface divergence that depresses the boundary layer height (BLH), while the SE Pacific LLJ is more onshore, hitting southern Peru north of the Arica Bight, with surface convergence aiding the elevation of the coastal cloud-topped boundary layer. The meridional gradient in 600–850 hPa geopotential thickness (i.e., layer mean temperature) over the continent is large at ∼ 10∘ S (Fig. 1c). This meridional temperature gradient over the land, sustained by a heat low over the Namibia–Kalahari dryland, is the dominant driver of the AEJ-S. After the onset of the rainy season around the end of October, precipitation reduces the local temperature gradient and, consequently, weakens the AEJ-S (not shown).
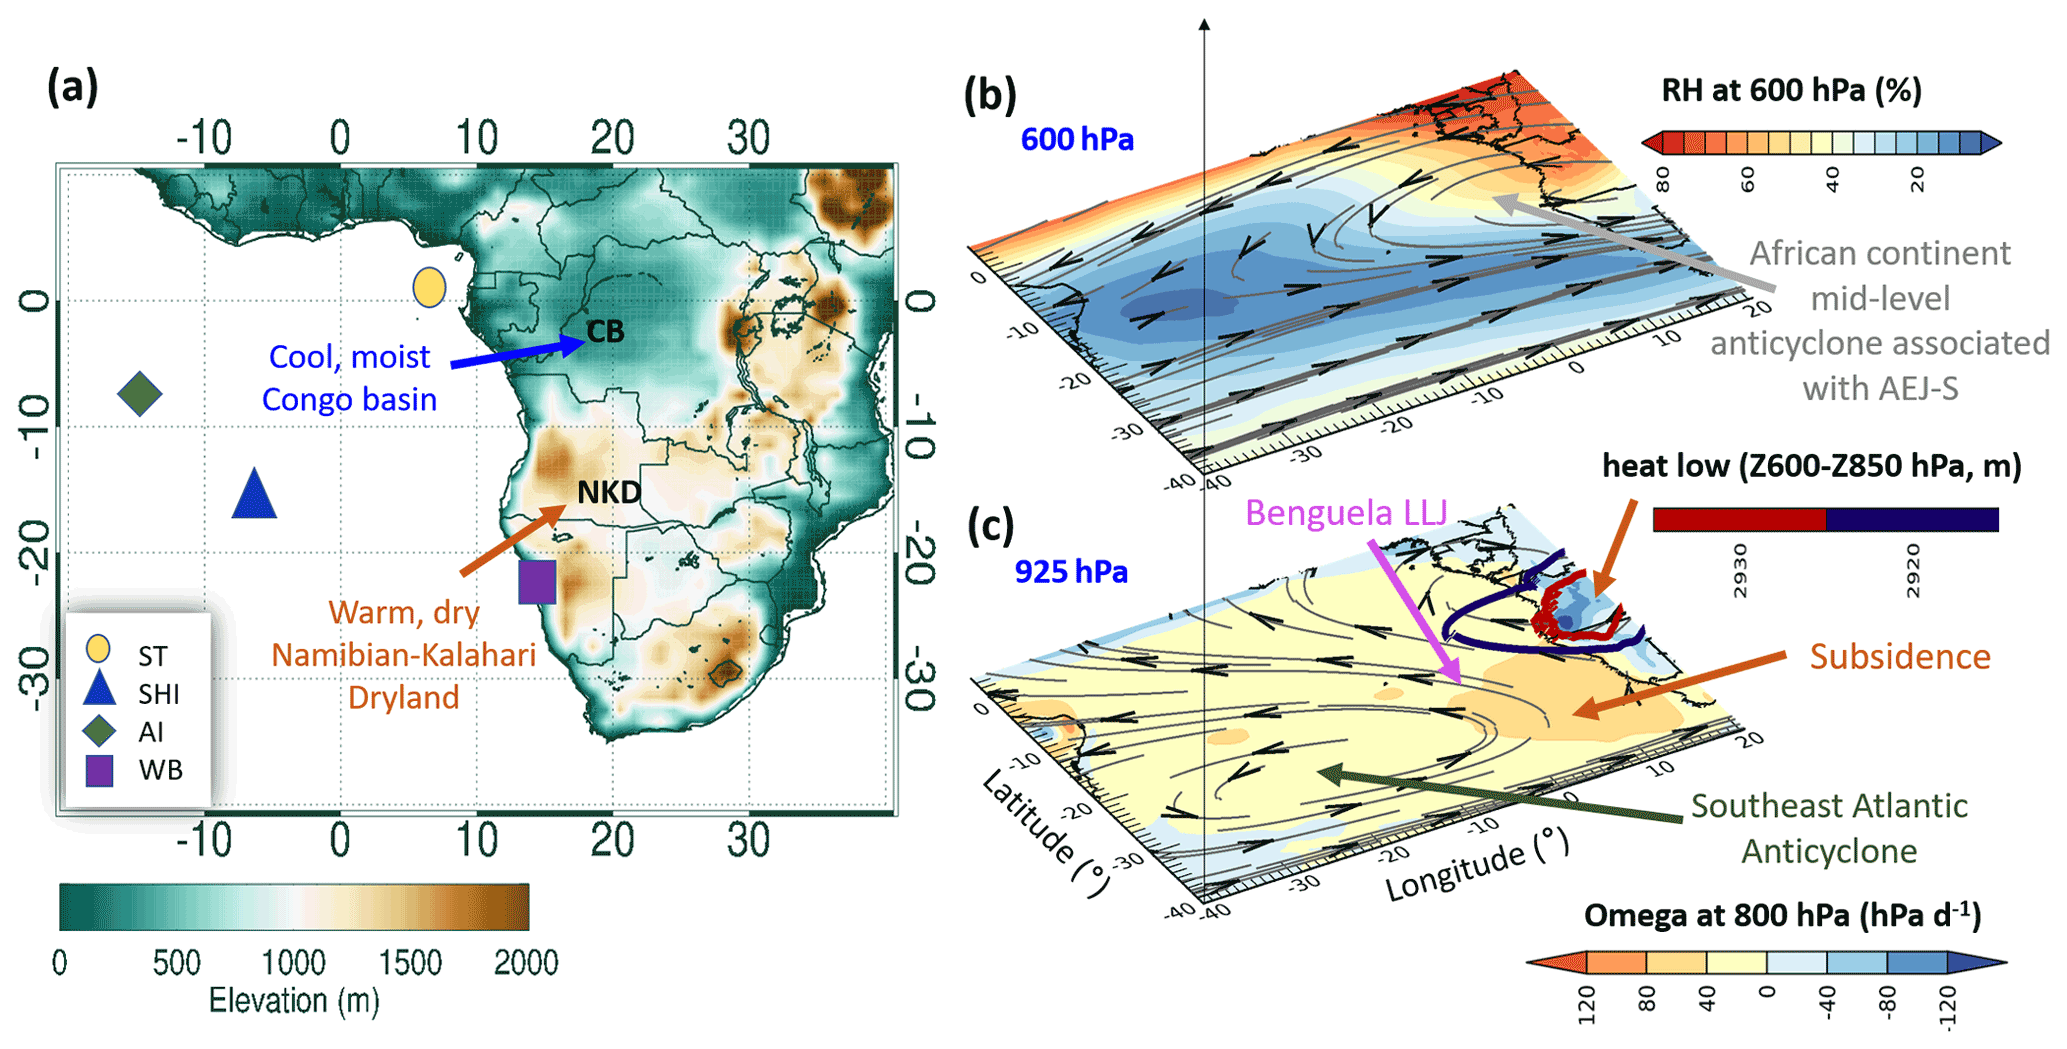
Figure 1(a) Map of the ORACLES deployment region in the SE Atlantic and elevation of southwestern Africa. The markers represent São Tomé (ST), St. Helena island (SHI), Ascension Island (AI), and Walvis Bay (WB). (b)The 600 hPa climatological September monthly mean (2000–2018) RH (color shading; percent), overlain by horizontal wind streamlines (meters per second; hereafter m s−1). (c) The 800 hPa climatological September mean (2000–2018) vertical velocity (omega at 800 hPa; positive values represent subsidence in hectopascals per day; hereafter hPa d−1) overlain by 925 hPa horizontal wind streamlines with the thickness between 600 and 850 hPa (heat low and contours in dark red and navy; meters).
To characterize the interaction between aerosols and clouds, the ORACLES (ObseRvation of Aerosols above Clouds and their IntEractionS) field deployments took place during 2016–2018 over the southeastern Atlantic Ocean immediately to the west of the southern African continent. The goal was to develop an understanding of the impacts of southern African BB aerosol transport over the Atlantic Ocean on climate (Redemann et al., 2021). Collaborative international deployment activities over the SE Atlantic, such as the UK's CLARIFY (CLoud–Aerosol–Radiation Interactions and Forcing) campaign (September 2016, 16 August–7 September 2017; Haywood et al., 2021), the USA's Department of Energy (DOE) LASIC (Layered Atlantic Smoke Interactions with Clouds) campaign (1 June 2016–31 October 2017; Zuidema et al., 2018), and the French AEROCLO-sA (AErosol RadiatiOn and CLOuds in Southern Africa) campaign (22 August–12 September 2017; Formenti et al., 2019) have also advanced the understanding of aerosols and their interaction with clouds. A few results from ORACLES have elucidated the observed details of aerosol–cloud interactions (Kacarab et al., 2020; Gupta et al., 2021), the combined direct aerosol radiative effect (Cochrane et al., 2021), and the impact of moisture outflow on mid-level clouds (Adebiyi et al., 2020; Pistone et al., 2021). However, while those studies highlight the detailed features of aerosol–cloud interaction during the deployment period, they cannot tell us whether the observations were typical. Hence, understanding the meteorological characteristics during the ORACLES deployment and how different they are compared to the climatological mean in various temporal and spatial scales is critical. This paper focuses on the climatological overview of the meteorology reflecting the coupled land–ocean–atmosphere system and the representativeness of the deployment months.
Aerosol–cloud interactions are modulated by meteorology. For example, cloud cover changes with LTS, which is modified not only by surface temperature but also by the absorption of solar radiation by aerosols residing above the cloud over the ocean in the African region (Gordon et al., 2018; Mallet et al., 2019, 2020). Other recent studies also detail how the large-scale flow interacts with the entrainment of smoke into the boundary layer (Diamond et al., 2018; Zhang and Zuidema, 2019; Abel et al., 2020). Thus, it is important to identify the direct impact of the prevailing circulation on BB aerosol transport and stratocumulus decks and to separate the meteorological impact on the stratocumulus deck from the aerosol impact on stratocumulus during the ORACLES deployment period.
The goal of this study is to describe the meteorological characteristics that directly impact aerosols and low clouds, particularly stratocumulus decks, during the ORACLES campaign. In this (part 1 of the meteorological overview) paper, we focus on the climatological characteristics of meteorological variables during the deployment compared to the climatological mean at monthly timescales. To aid in the interpretation of airborne measurement during flight days in a more detailed manner, the key meteorological characteristics during the flight days at daily to weekly timescales will be separately presented in Part 2 of the meteorological overview paper (Ryoo et al., 2021).
Section 2 of this paper describes the reanalyses and satellite data sets used in this study. In Sect. 3.1, the key meteorological anomalous features associated with the AEJ-S during the ORACLES deployment months, as compared to their climatological means, are highlighted. Meteorological characteristics associated with low-level cloud are also shown in Sect. 3.2. In Sect. 3.3, how the aerosol from European Centre for Medium-Range Weather Forecasts (ECMWF) Copernicus Atmosphere Monitoring Service (CAMS) reanalysis behaves, along with the meteorological variables during the deployment months, is discussed. The possible reasons for the different AEJ-S characteristics during the deployment month, particularly in August 2017 are given in Sect. 3.4. Finally, the summary and the conclusions are provided in Sect. 4.
The geographic domain of our study region is the SE Atlantic and southern Africa (30∘ S–5∘ N, 20∘ W–20∘ E), as shown in Fig. 1a. The data and methods used to complete the relevant fields used in this study are described below.
-
Meteorological fields, such as 3-D wind (u, v, and ω), temperature, geopotential height (Z), specific humidity (q), divergence, and potential vorticity (PV) come from the European Centre from Medium-Range Weather Forecasts (ERA-5; Hersbach et al., 2020). The analysis is primarily based on monthly mean data, available on a 0.25∘ longitude × 0.25∘ latitude grid, with 37 vertical levels ranging from 1000 to 1 hPa. It is noted when hourly data are used in the analysis. The anomaly fields are computed by subtracting the climatological monthly mean values (2000–2018) from each monthly mean value. Note that the monthly mean ERA5 BLH data are calculated based on the bulk Richardson number (ERA5 data description document).
-
ERA5's depiction of the AEJ-S and its magnitude are also compared to those of the Modern-Era Retrospective analysis for Research and Applications version 2 (MERRA-2; Gelaro et al., 2017), the Japanese 55-year Reanalysis (JRA55; Japan Meteorological Agency/Japan, 2013), and the National Centers for Environmental Prediction(NCEP)/National Center for Atmospheric Research (NCAR) reanalysis (Kalnay et al., 1996) over the same time period using monthly mean data. MERRA-2 data are based on 0.6∘ longitude × 0.5∘ latitude, with 42 pressure levels, and JRA55 data are based on 2.5∘ longitude × 2.5∘ latitude, with pressure levels ranging from 27 to 37. NCEP/NCAR data are based on 2.5∘ longitude × 2.5∘ latitude, with 17 pressure levels. These comparison plots are provided in the Supplement.
-
The Kalahari heat low is defined by the geopotential height thickness between 850 and 600 hPa over a southern African plateau. We chose these levels rather than lower levels (e.g., the 700–925 hPa difference as used by Knippertz et al., 2017) since the 925 hPa level is below the ground for much of our study region of interest. The sensitivity of the strength of the heat low during the deployment to the precise choice of levels is minimal.
-
The low-level tropospheric stability (LTS) is defined as the potential temperature (θ) difference between 800 and 1000 hPa, below the aerosol layer at 700 hPa, following Adebiyi and Zuidema (2016).
-
AEJ-S is defined as the zonal winds (zonal winds <−6 m s−1; implying easterly winds) around 0–20∘ E, 5–15∘ S at 600 hPa, for September and October, and at 700 hPa, for August.
-
LLJ is defined by a 925 hPa horizontal wind speed in excess of 5 m s−1 off the coast of Namibia (0–10∘ E, 15–25∘ S).
-
Microwave and infrared (MW_IR) daily Optimum Interpolation Sea Surface Temperature (OISST) from remote sensing systems (REMSS; Gentemann et al., 2004, 2010) with approximately 0.088∘ (∼ 9 km) spatial resolution is used to characterize the interannual variability in sea surface temperatures (SSTs) over the southeastern Atlantic.
-
The monthly mean Tropical Rainfall Measuring Mission (TRMM) product 3B43 with 0.25∘ grid spacing (Huffman et al., 2007) is used to characterize precipitation. This data set is a combination of space-borne radar and microwave and infrared channels with monthly calibration with surface rain gauges, when available. Similar results were obtained using monthly Global Precipitation Mission data (not shown).
-
The level 3 monthly cloud fraction product from the Moderate Resolution Imaging Spectroradiometer (MODIS) on board both Terra and Aqua (1∘ grid resolution; Platnick et al., 2015a, b) is used to calculate monthly mean low cloud fractions. The low cloud is defined when cloud-top height is below 2.5 km. Like Cermak et al. (2009), an extensive analysis to separate the low clouds into the detailed cloud types such as stratocumulus, stratus, and fog will be desirable. However, considering that the fraction of annual low cloud cover due to stratocumulus over the SE Atlantic Ocean is larger than 70 %, with a peak of 90 % (Wood, 2012), we assume that the low clouds represent stratocumulus clouds in this study.
-
Upper-level disturbances are determined by the ERA5 Ertel's potential vorticity (PV) field at 250 hPa anomaly from the climatological mean (2000–2018) at a given month (August, September, and October).
-
ECMWF CAMS global reanalysis (EAC4) monthly mean data (Inness et al., 2019) on a 0.75∘ longitude × 0.75∘ latitude grid, with 25 vertical levels, are analyzed to investigate aerosol transport features. Data during 2003–2020 are used to compute the climatological mean.
We first examine the climatological mean and variability in the key meteorological factors directly affecting clouds and aerosols during the ORACLES deployment.

Figure 2(a–c) Distributions of the climatological mean (2006–2017) aerosol layer top height (red), cloud top height (blue), and the separation distance between clouds and overlying aerosols (yellow) as a function of longitude (latitudinally averaged from 10–22.5∘ S) from Cloud–Aerosol Lidar with Orthogonal Polarization (CALIOP). Source: figure reproduced from Redemann et al., 2021. (d–f) The longitudinal cross sections at 10∘ S and (g–i) latitudinal cross sections at 10∘ E of the RH (shading; percent) overlain by zonal wind (contours are solid gray lines; easterly lines are magenta dashed; westerly lines are in m s−1) during (top) climatological mean (2000–2018) and (bottom) the 3 years of deployment months (August 2017, September 2016, and October 2018). White arrows represent the horizontal wind vectors.
The top panels of Fig. 2 show the climatological mean longitudinal cross sections of aerosol-layer-top height, cloud-top height, and their separation. The lower panels of Fig. 2 show longitudinal and latitudinal cross sections of relative humidity (RH) overlain by the zonal wind, with the AEJ-S highlighted, for both the climatological mean and the individual deployment months for each of the 3 years. It is evident that there is month-to-month variability in the aerosol- and cloud-top height and their separation. The vertical extent of the aerosol layer and the depth of the separation layer between cloud and aerosols (Fig. 2a–c) appear to be tied to the vertical extent of AEJ-S (Fig. 2d–f). That is, as the height of the AEJ-S increases from August to October, the aerosol layer top heights, and separation between the aerosol layer and the underlying cloud, increase as well. The aerosol top height occurs around 4.5 km, averaged over SE Atlantic in September, and is similar to the heights of the highest RH (> 70 %) and maximum AEJ-S wind speed, indicating that the large-scale circulation can directly affect local aerosol fields.
The AEJ-S core is located at near 3 km altitude in August and 4 km altitude in September and October at around 8-10∘ S (Fig. 2g–i). The enhanced RH extends up to ∼ 6 km just offshore at 10∘ E (Fig. 2d–f). The southerly LLJ off the Namibian coast is also seen (∼ 1–2 km; white wind vectors). The individual deployment months mimic the climatological mean values of RH and the zonal winds to some extent, but there are some differences. For example, an additional anomalously strong upper-level jet was observed at 6.5 km (5∘ S–15∘ N) during August 2017 (Fig. 2d). This jet is enhanced over a relatively dry region (RH < 30 %). The mid-latitude dry tongue at 1–2 km penetrates northward to around 20–10∘ S (Fig. 2g–i), with a high RH plume aloft at 3–5 km due to the AEJ-S. The reduced moisture at 1–2 km is tied to the anomalous northward advection of dry air originating from the southern oceans, while the dry air above 5 km reflects the Hadley circulation-driven large-scale subsidence (Wood, 2012; Myers and Norris, 2013; Adebiyi et al., 2015). The mid-level dryness above 4 km is stronger in August 2017 compared to the climatological mean (Fig. 2g). The dry intrusion along with southwesterly wind and moist plume above and south of 10∘ S during the deployment are both similar to their climatological mean in September 2016, while the free tropospheric drying is reduced in October 2018 compared to the October climatology (Fig. 2g–i). The anomaly fields in RH and horizontal wind speed show the features described above, which are provided in Fig. 1S in the Supplement.
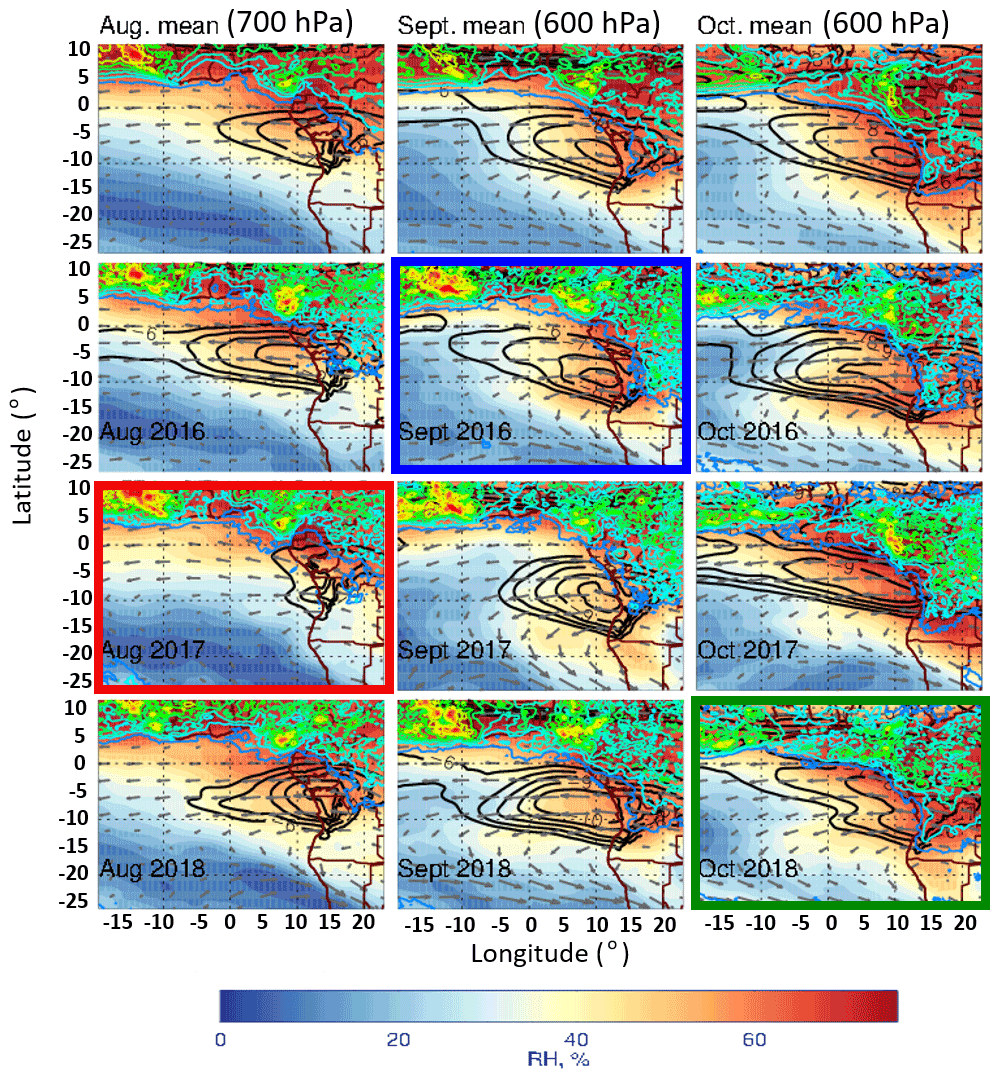
Figure 3Maps of zonal wind (black contours; m s−1; values are given as m s−1, with a 1 m s−1 interval), RH (shading; percent), and horizontal wind vector at 700 hPa for August and at 600 hPa for September and October. Precipitation (color contours, from light blue (0.05) to red (1.05), with 0.1 intervals in millimeters per hour; hereafter mm h−1) is overplotted for the climatological mean (2000–2018) and the ORACLES deployment months (August 2017, September 2016, and October 2018). The colored boxes (red, blue, and green) indicate the month of the ORACLES deployment.
3.1 Meteorological characteristics associated with the AEJ-S
Spatial features of the AEJ-S and RH are shown for the individual deployment months (August, September, and October) in Fig. 3. Since the core of AEJ-S in August is lower than in September and October (Fig. 2), the wind and RH are shown at 700 hPa (∼ 3 km) for August. The southward progression of the regions of significant RH and continental rainfall is clearly apparent, as well as the strengthening of the easterly jet from August to September and October. The AEJ-S maximum wind speed is largest in September, confined over the coastal region over 5–15∘ S. The maximum wind speed is weaker in October than that in September, but the jet extends further westward over the tropical Atlantic Ocean. Note that the recirculation pattern (shown by reversing wind vectors around 15∘ W–10∘ E, 10–25∘ S) is present for all 3 months but is only about half as strong in August as in the other 2 months. The zonal extent of the recirculation pattern appears to be associated with the strength of AEJ-S; the stronger the AEJ-S, the larger the radius of recirculation. The AEJ-S also exhibits substantial year-to-year variability. The distribution of RH, which is tied to the southward extent of precipitation, also varies from year to year.
The AEJ-S in August 2017 is significantly weaker than the climatological mean. The AEJ-S in September 2016 is similar to the climatological mean. Inland precipitation is also pronounced around 5∘ N, penetrating further south, with the region being wetter in September 2016 compared to the climatological mean. In October 2018, AEJ-S is slightly weaker than the climatological mean at around 0–10∘ E, 5–10∘ S.
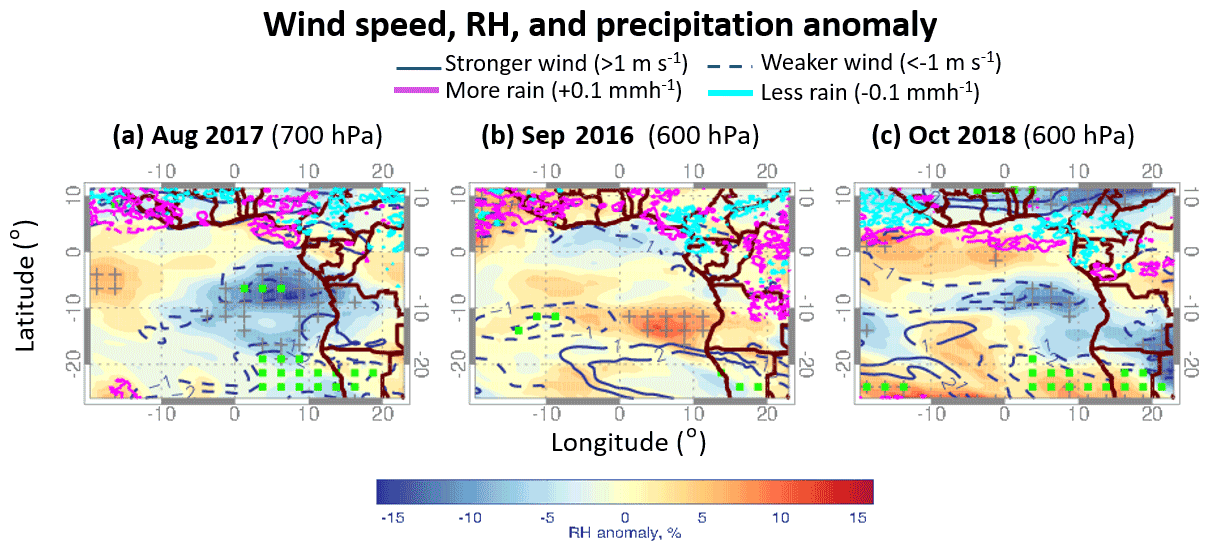
Figure 4Maps of horizontal wind speed anomaly (navy contour; dashed lines represent the negative values; m s−1) and RH anomaly (shading; blue colors represent the negative values; percent) at 700 hPa for (a) August 2017 and at 600 hPa for (b) September 2016 and (c) October 2018, respectively. The magenta (cyan) lines show more (less) than the climatological mean precipitation. The green square (gray cross) indicates that the wind speed anomaly (RH anomaly) data are significant at the 85 % confidence level.
The weaker AEJ-S in August 2017 is also evident in the anomaly fields in Fig. 4. The horizontal wind speed is significantly weaker than the climatological mean in August 2017, and similar features were found when using zonal wind speed, reflecting the weakening of AEJ-S (not shown). The region around 0–15∘ E, 5–10∘ S is drier in August 2017 than the August climatology (Fig. 4a). The horizontal wind speed in September 2016 is similar to the climatological mean, with more rain penetrating further south (Fig. 4b). In October 2018, the horizontal wind speed is slightly weaker than the climatological mean around 15∘ W–10∘ E, 5–10∘ S, and the region is also drier than the October climatology, but the wind speed difference is not statistically significant at the 85 % confidence level. October 2018 is wetter over the Benguela coasts around 0–20∘ E, 20–25∘ S (Fig. 4c).
These meteorological features, including the location and intensity of the AEJ-S in ERA-5 during the deployment months, are also well observed in the other reanalyses. For instance, the weakening of AEJ-S in August 2017 is observed in other reanalysis data, such as ERA-interim (not shown), MERRA2, and JRA55, although the difference is small in JRA55 (see Figs. 2S and 3S in the Supplement). However, the NCEP/NCAR reanalysis shows the greatest differences compared to the other three reanalyses during August–October. This may be related to the differences in the location and intensity of the large-scale subsidence and the lack of enhancement in the local upper-level wind over the 5–10∘ S region during August 2017 in NCEP/NCAR.

Figure 5(a) Maps of thickness (geopotential height (Z) difference between 600 and 850 hPa; meters) overlain by zonal wind (contour; black; m s−1) and wind vector at 700 hPa in August 2017. (b, c) The same fields as panel (a), except for 600 hPa in September 2016 and October 2018. (d) The 2-D joint-probability density function (PDF) of zonal wind at 700 hPa and RH at 700 hPa in August 2017 averaged over the jet exit region (white box region; 0–10∘ E, 5–10∘ S). (e, f) The same as panel (d) except for 600 hPa in September 2016 and October 2018. (g–i) The blue squares represent the scatterplots of 700 hPa zonal wind (white box region; 0–10∘ E, 5–10∘ S; m s−1) and heat low (blue box region; 12–18∘ E, 15–21∘ S; meters) for August 2017. The red triangles denote the scatterplots of the 700 hPa zonal wind (white box region; 0–10∘ E, 5–10∘ S; m s−1) and 850 hPa specific humidity (q; red box region; 12–18∘ E, 5–10∘ S; grams per kilogram; hereafter g kg−1) for August 2017. (h, i) The same as panel (g) except for 600 hPa zonal wind in September and October. The hourly data at 18:00 UTC on each day of the month are used for panels (a)–(c) and (g)–(i). Each point in panels (g)–(i) refers to data at 18:00 UTC on each day of the month. The 6 h data are used for generating panels (d–f). The boxed regions are shown in panels (a–c).
To better understand how the AEJ-S is associated with RH, the heat low over the continent is examined in more detail in Fig. 5. The heat low is strongest in September and October, centered over 12–20∘ E between 10–20∘ S, encompassing the north of Namibian–Kalahari dryland (12–18∘ E, 15–21∘ S), while the AEJ-S is observed near the border between Namibian–Kalahari dryland and Congo basin (5–10∘ S). Both the AEJ-S and the heat low are strongest in September 2016, while the AEJ-S is weaker but more extensive, expanding to the ocean in October 2018. The heat low is weaker in August compared to other deployment months, consistent with the thermal wind relationship, in which a stronger horizontal temperature gradient leads to stronger vertical wind shear, leading, in turn, to a stronger AEJ-S.
Joint PDFs between the zonal wind at 600–700 hPa and RH (0–10∘ E, 5–10∘ S) indicate that RH and AEJ-S relationships in September and October are very similar, with a stronger jet advecting more moisture than a weaker jet. During August 2017, the AEJ-S is generally weak under dry conditions (RH < 20 %; Fig. 5d). In contrast, the AEJ-S is strong when RH was high (> 60 %–70 %) in September and October (Fig. 5e, f). This can be also explained by the moist convection over the continent migrating southward from September to October. The scatterplots show that the AEJ-S–heat low correlation is strongest in September (Fig. 5g–i). The correlation between AEJ-S and the heat low in October and August is slightly lower than in September, suggesting that other factors may affect the strength of the jet besides the thermal wind relation at daily timescales. The use of different times or daily mean data produces a similar result. The sensitivity of the correlation to the choice of the heat low region between 10–20∘ S over the land is small. The correlation between AEJ-S and inland q is low. The AEJ-S may enhance convection through enhancing the vertical ascent at the jet entrance region (Jackson et al., 2009), but the additional advected moisture north of 10∘ S does not reduce the thermal contrast much (at most 10 %; based on Adebiyi and Zuidema, 2016). Nonetheless, the question still remains whether the AEJ-S is also sustained by a meridional circulation driven by equatorial convection, similar to the AEJ-N (where N is north; Thorncroft and Blackburn, 1999).

Figure 6(a) Maps of 800 hPa vertical velocity (omega; shading; hPa d−1; positive values refer to subsidence) overlain by thickness between 600 and 850 hPa (color contour with 10 m interval from 2900; meters), 700 hPa zonal wind (black contour; m s−1), and 700 hPa horizontal wind (wind vector; m s−1) in (a) August for (top) the climatological mean and (bottom) the deployment month. (b, c) The same as August except for 600 hPa in September and October. (d–f) Latitudinal cross sections of vertical velocity (omega (ω); shading; hPa d−1) averaged over 12–18∘ E overlain by wind vector (vector, meridional wind, and −1 ⋅ omega (v; ω); m s−1; for positive value to represent the ascent) and zonal wind (black contour; m s−1) for (top) the climatological mean and (bottom) the deployment month. The gray-filled area represents the inland topography. The red asterisk in panels (d)–(f) represents the AEJ-S core.
While Fig. 5 indicates that the latitudinal temperature gradient is associated with AEJ-S, how it maintains the AEJ-S is not clear. We further look at the vertical motion along with the heat low and other meteorological variables during the deployment months in Fig. 6.
The AEJ-S core is located further north (0–5∘ S; Fig. 6a, d) and lower in altitude (∼ 3 km, 700 hPa; Fig. 6d) in August compared to September and October (5–10∘ S; ∼ 4 km, 600 hPa; Figs. 2, 6b–c, e–f), and the jet cores are tied to the strength of the inland heat low (Fig. 6a–c), as shown in Fig. 5. Since the inland heat low is weaker in August, this explains why the jet core in August is located lower than that in September and October. This also accounts for why the jet strength at around 4 km (∼ 600 hPa) is weaker in August than in September and October (Fig. 6). Furthermore, the strong ascent inland, which is supported by a low-level convergence of surface winds, appears to be associated with a stronger AEJ-S over the SE Atlantic coast as well (Fig. 6d–f). This may also contribute to the aerosol transport efficiency, supported by the finding of Adebiyi and Zuidema (2016), that the AEJ-S also helps loft aerosol through ascent at the AEJ-S entrance region (10–15∘ S, 12–18∘ E).
Large-scale subsidence over the SE Atlantic is also associated with the strength of AEJ-S, especially over the subtropical region (15–25∘ S; Fig. 6a–c). The weaker AEJ-S is associated with stronger subsidence, while the stronger mean AEJ-S is associated with suppressed subsidence, and this is most clearly shown in August (Fig. 6d). This result is consistent with the finding by Adebiyi and Zuidema (2016) that the AEJ-S induces an ascending motion below the AEJ-S over the continent, including aerosol source regions, while reducing the mean subsidence over the ocean north of 20∘ S. The vertical motion associated with the AEJ-S during August, September, and October in 2016–2018 is provided in Fig. 3S in the Supplement.
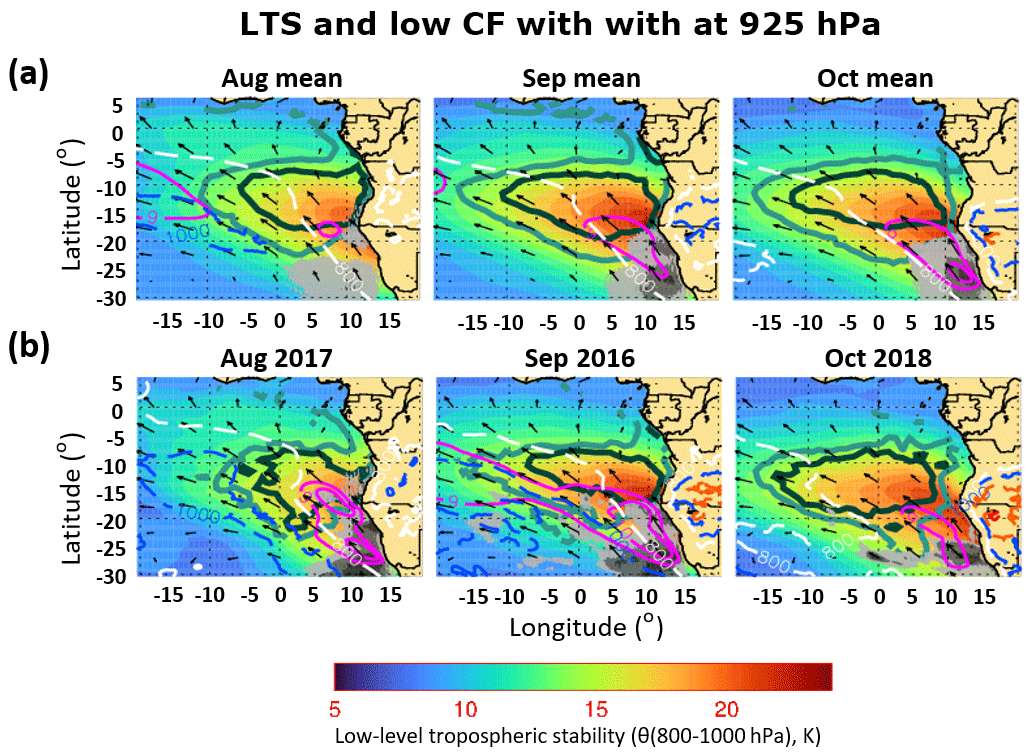
Figure 7Maps of LTS (shading; color; Kelvin) and low-level cloud fraction (low CF; cloud-top height below 2.5 km; 0.8 (light green) and 0.9 (dark green); percent) overlain by subsidence (omega at 800 hPa; 50, 65, and 80 hPa d−1; increasing from light gray to dark gray), BLH (dashed contours in white, blue, orange, and red from 800 to 1400 in 200 m increments; meters), and 925 hPa horizontal wind speed (magenta contour; m s−1). The 925 hPa wind vector (arrow) for panel (a), the climatological mean (2003–2018 for low CF and 2000–2018 for other variables), and (b) the deployment months.
3.2 Meteorological characteristics associated with low-level cloud
The stratocumulus deck, which accounts for most of the low cloud over the SE Atlantic, is affected by the BLH, LTS, and large-scale subsidence (Wood and Bretherton, 2006; Wood et al., 2015; van der Dussen et al., 2016; Fuchs et al., 2017; Adebiyi and Zuidema, 2018). For all months, LTS is positively associated with low CF (Fig. 7a, b). The lower troposphere is more stable in August 2017 and October 2018 near the south of offshore Namibia compared to climatology, and the low CF is increased there too. Climatologically, the strength of the LLJ increases from August to October, off the coast of Namibia around 15–25∘ S, 0–10∘ E, but LLJ is stronger in August 2017 and September 2016, while it is weaker in October 2018 compared to the climatological mean. For all months, the subsidence off the Namibian coast is stronger than the climatological mean, especially in August. In particular, the LLJ is strong when the subsidence off the Namibian coast is strong (Fig. 7) in August 2017 and September 2016.
Overall, from August to October, BLH decreases over the ocean, but it increases over the land. The BLH also changes from high over the ocean to low near the coast (Fig. 7a, b). BLH is also higher than the climatological mean during the deployment months for both ocean and land. The low CF tends to be reduced when the BLH becomes higher, as shown in August 2017, but the exact relationship between low CF and BLH at the monthly mean timescale needs further investigation.
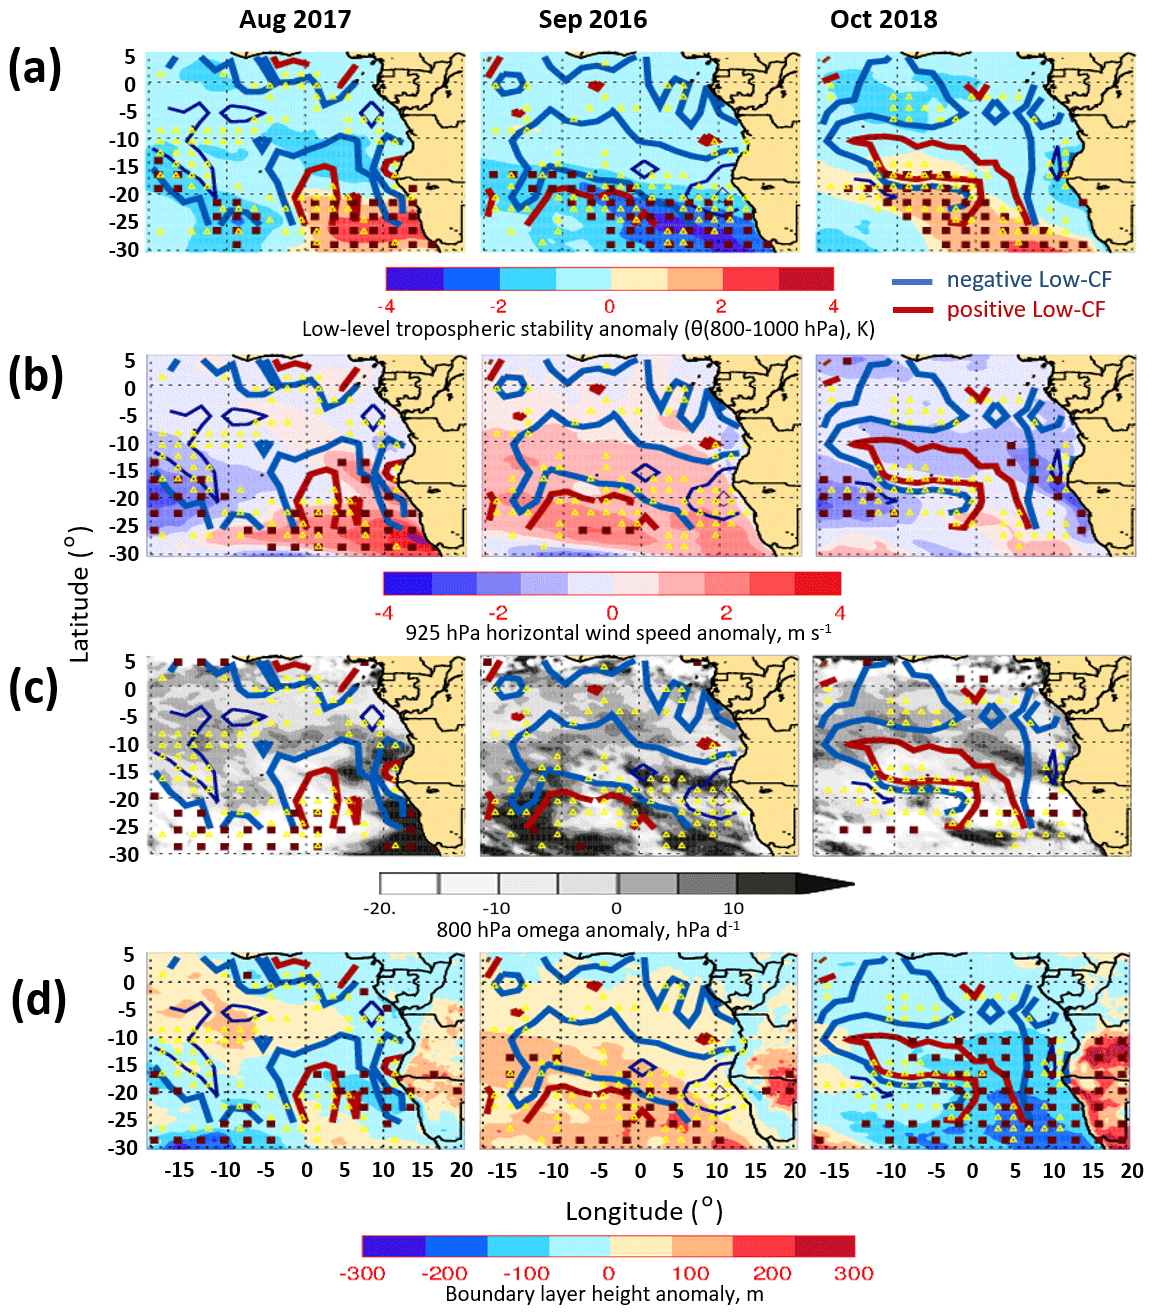
Figure 8Maps of (a) LTS anomaly (shading; Kelvin). (b) The 925 hPa horizontal wind speed anomaly (shading; m s−1), (c) 800 hPa vertical velocity anomaly (omega; gray shading; subsidence is a positive value; hPa d−1), and (d) BLH anomaly (shading; meters) for the deployment months (August 2017, September 2016, and October 2018). All maps are overlain by a low-CF anomaly (contours, from thick to thin, in blue (−0.02, −0.07, and −0.12) and dark red (+0.02, +0.07, and +0.12); percent), which is smoothed by averaging at 2∘ (longitude) by 5∘ (latitude) to reduce the noise. The purple square (yellow triangle) indicates that the shaded field (low-CF anomaly) data are significant at the 85 % confidence level.
To examine the impact of large-scale circulation on a low cloud during the ORACLES deployment months and how they differ compared to the climatological mean more clearly, we computed the anomaly of each variable discussed in Fig. 7. In general, the higher low CF is strongly tied to higher LTS (Fig. 8a). The LLJ strength is also negatively related to low CF, which is clearly shown in September 2016 (Fig. 8b). The strong subsidence tends to be positively associated with low CF at a monthly mean timescale, especially off the coast of southwestern African in August 2017 (5–12∘ E, 0–25∘ S; Fig 8c), but this association also appears to vary with regions and months (not shown). Furthermore, LLJ is positively associated with the subsidence off the Namibian coast, clearly shown in August 2017. The relationship among AEJ-S, LLJ, subsidence, and low CF, however, shows high variability due to factors such as (1) subsidence indirectly enhancing clouds by enhancing inversion strength or reducing clouds at the given inversion strength at a monthly timescale (Myers and Norris, 2013) and (2) the different response of low clouds to subsidence as a function of timescale (De Szoeke et al., 2016; Adebiyi and Zuidema, 2018).
The relationship between low CF and BLH is not clear here, partially because the BLH used in this study is not designed to include the decoupled cloud-top layer. Although low CF tends to be negatively associated with the BLH, especially over the ocean in August 2017 and September 2016, there is significant spatial variability (Fig. 8d). This demonstrates the need for the use of BLH, including the decoupled cloud-top layer, to better understand its coupling with the low CF. We will further investigate the relationship between cloud-topped BLH and low CF in Part 2 of the meteorological overview paper. Similar features shown in Figs. 7 and 8 are also found in August, September, and October in 2016–2018 (see Figs. 4S–7S).
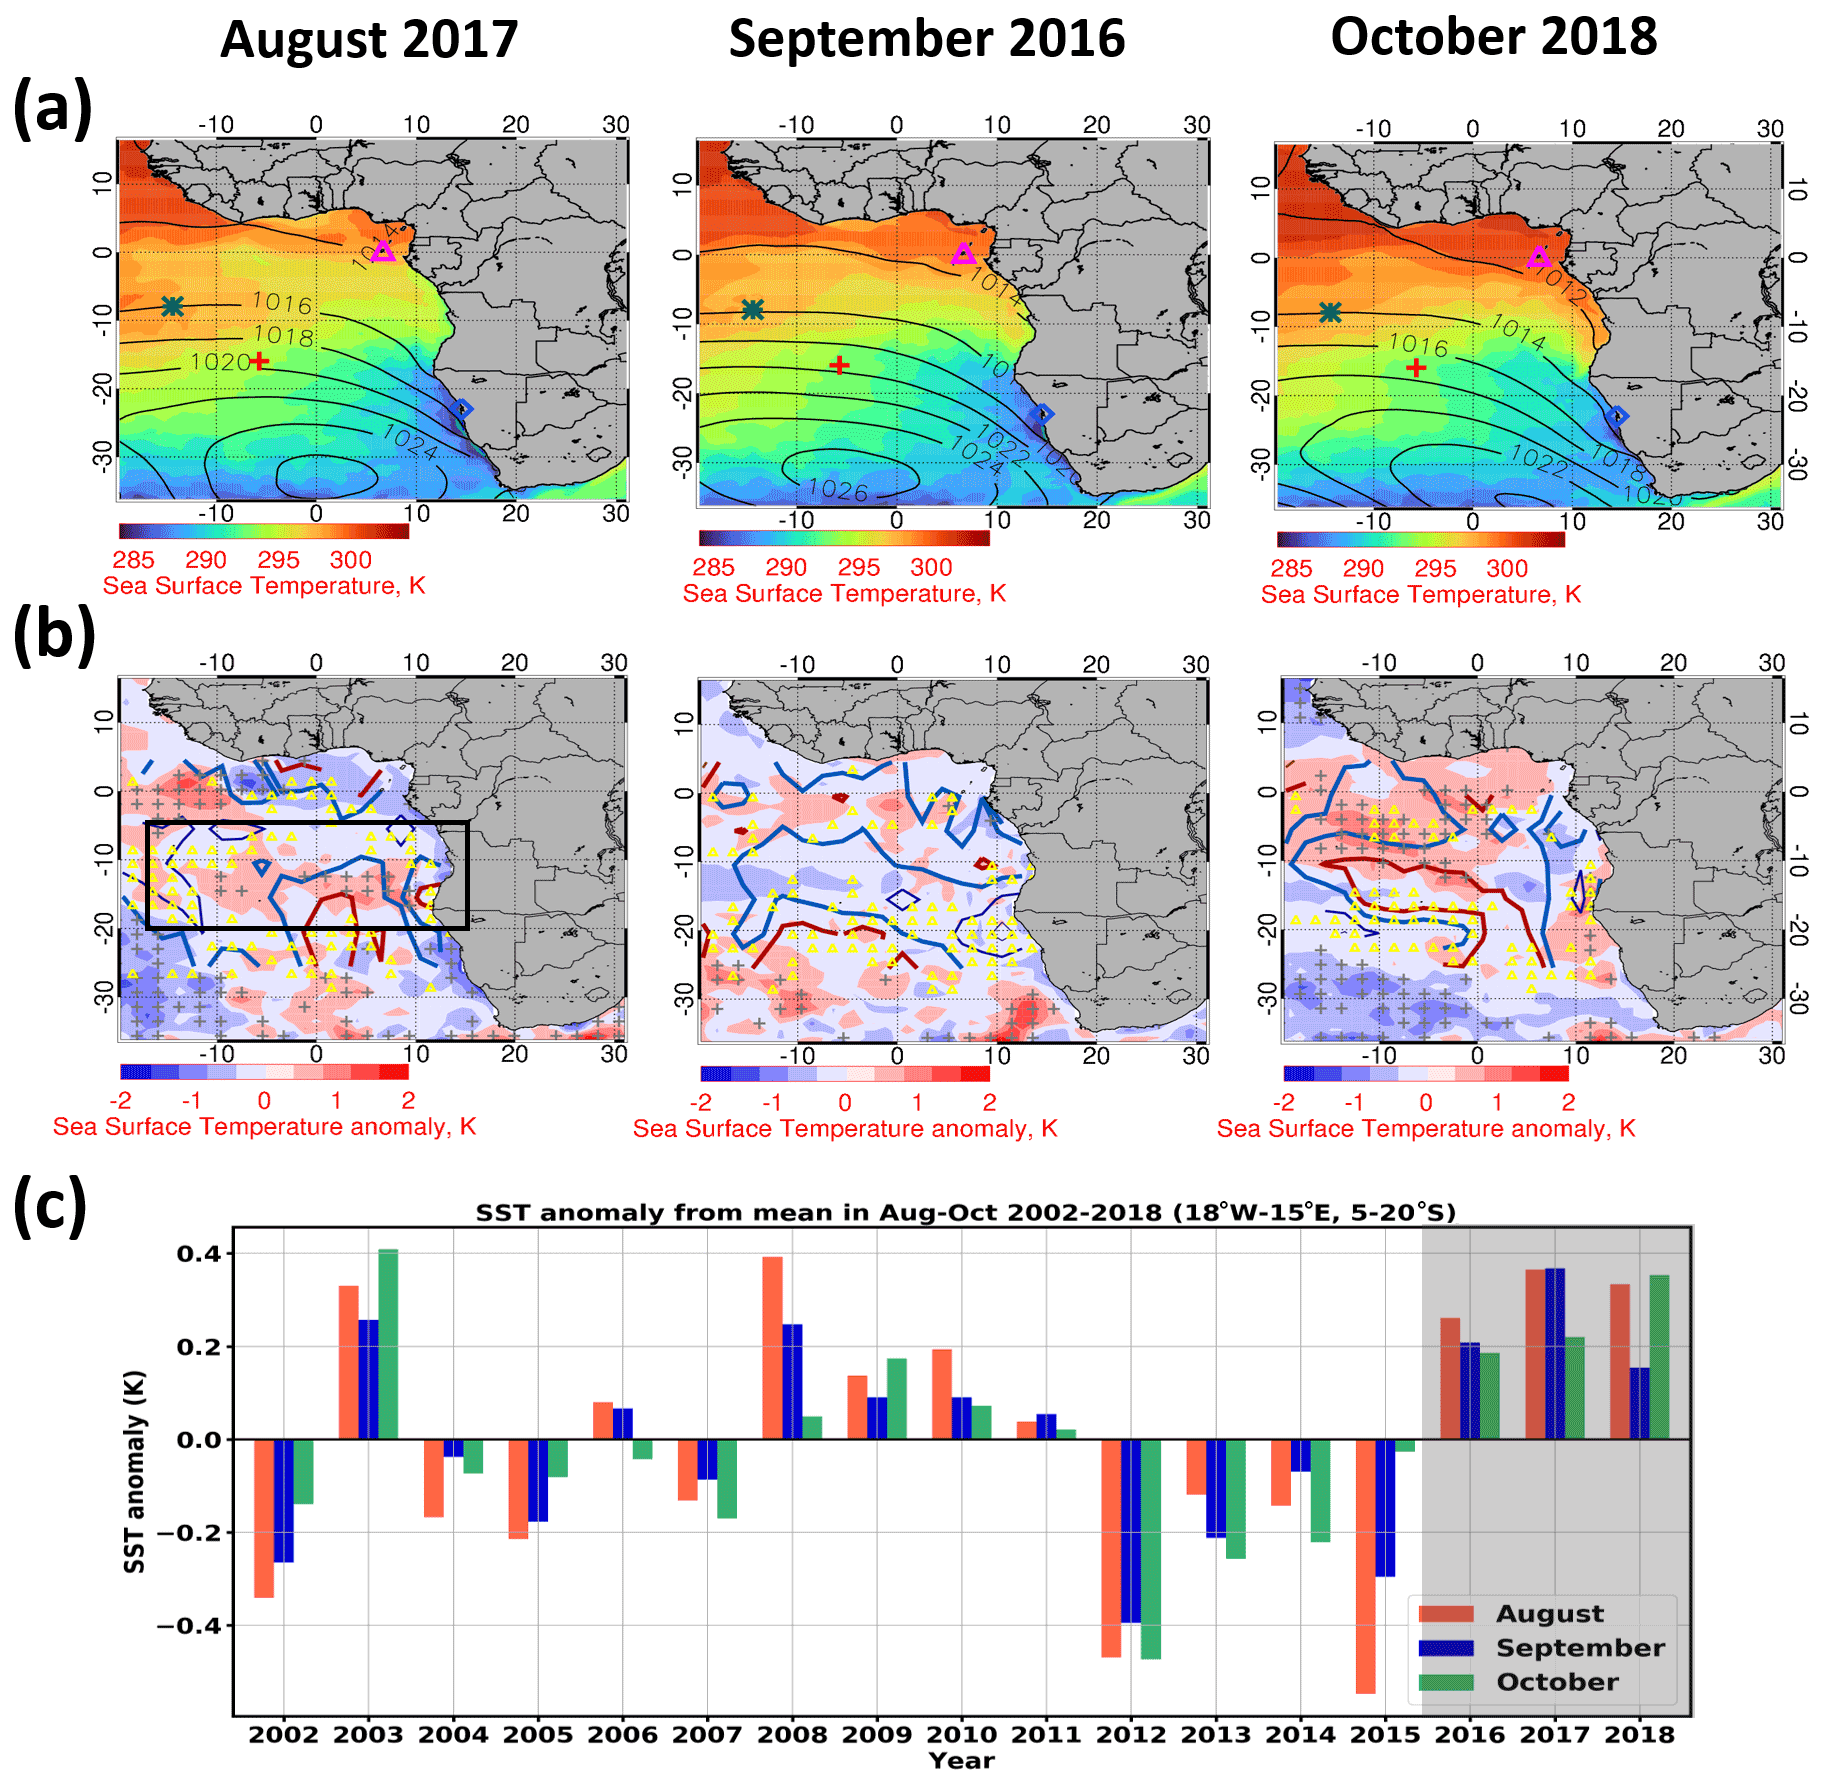
Figure 9Maps of (a) SST monthly mean (shading; Kelvin) overlain by sea level pressure (SLP; black contour; hectopascals), and (b) SST anomaly from the climatological mean (2002–2018) overlain by a low-CF anomaly (contours, from thick to thin, in blue (−0.02, −0.07, and −0.12) and dark red (+0.02, +0.07, and +0.12); percent). (c) Time series of SST anomaly averaged over the box region (18∘ W–15∘ E, 5–20∘ S, black) for the ORACLES deployment months (August 2017, September 2016, and October 2018). The markers in panel (a) represent São Tomé (magenta triangle), St. Helena island (red cross), Ascension Island (green asterisk), and Walvis Bay (light blue diamond). The SST anomaly is averaged at ∼ 2.11∘ resolution, and the low-CF anomaly is smoothed by averaging at 2∘ (longitude) by 5∘ (latitude) to reduce the noise. The gray cross (yellow triangle) indicates that the SST anomaly (low-CF anomaly) data are significant at the 85 % confidence level. The SST monthly mean data are obtained by averaging SST hourly data.
How the low CF varies in association with the SST during the deployment years is examined in Fig. 9. The SST over the SE Atlantic is warmer during the deployment months compared to the climatological mean (Fig. 9c). Warmer SST tends to reduce the stratocumulus cloud fraction by reducing the static stability (Wood et al., 2015). August 2017 has the warmest SST anomaly in the 10–20∘ S region, and the smallest CF fraction is found over that region. However, in September 2016, the reduction in low CF is found over the region of a cool SST anomaly in the 10–20∘ S region (Fig. 9b). There is also no robust relationship between SST and low CF in October 2018, especially over the coastal region, although we notice that the warmer SST is linked to the decreased low-CF anomaly, especially over the tropical Atlantic (5∘ N–10∘ S, 20∘ W–0). Warming is more intense over the tropical Atlantic, although the warming trend is still reflected over the ORACLES flight region (5–20∘ S; a boxed region in Fig. 9b).
The southern Atlantic anticyclone associated with high SLP is the weakest in October 2018 compared to the other 2 deployment months (Fig. 9a). The southern Atlantic anticyclone is stronger and closer to the coast in August 2017 and September 2016 than the climatological mean but slightly weaker over the SE Atlantic and more southward in October 2018 compared to the climatological mean (shown in Fig. 8S). The monthly mean SST and SE Atlantic anticyclone associated with SLP patterns for all of August, September, and October during 2016–2018 are also provided in Fig. 8S.
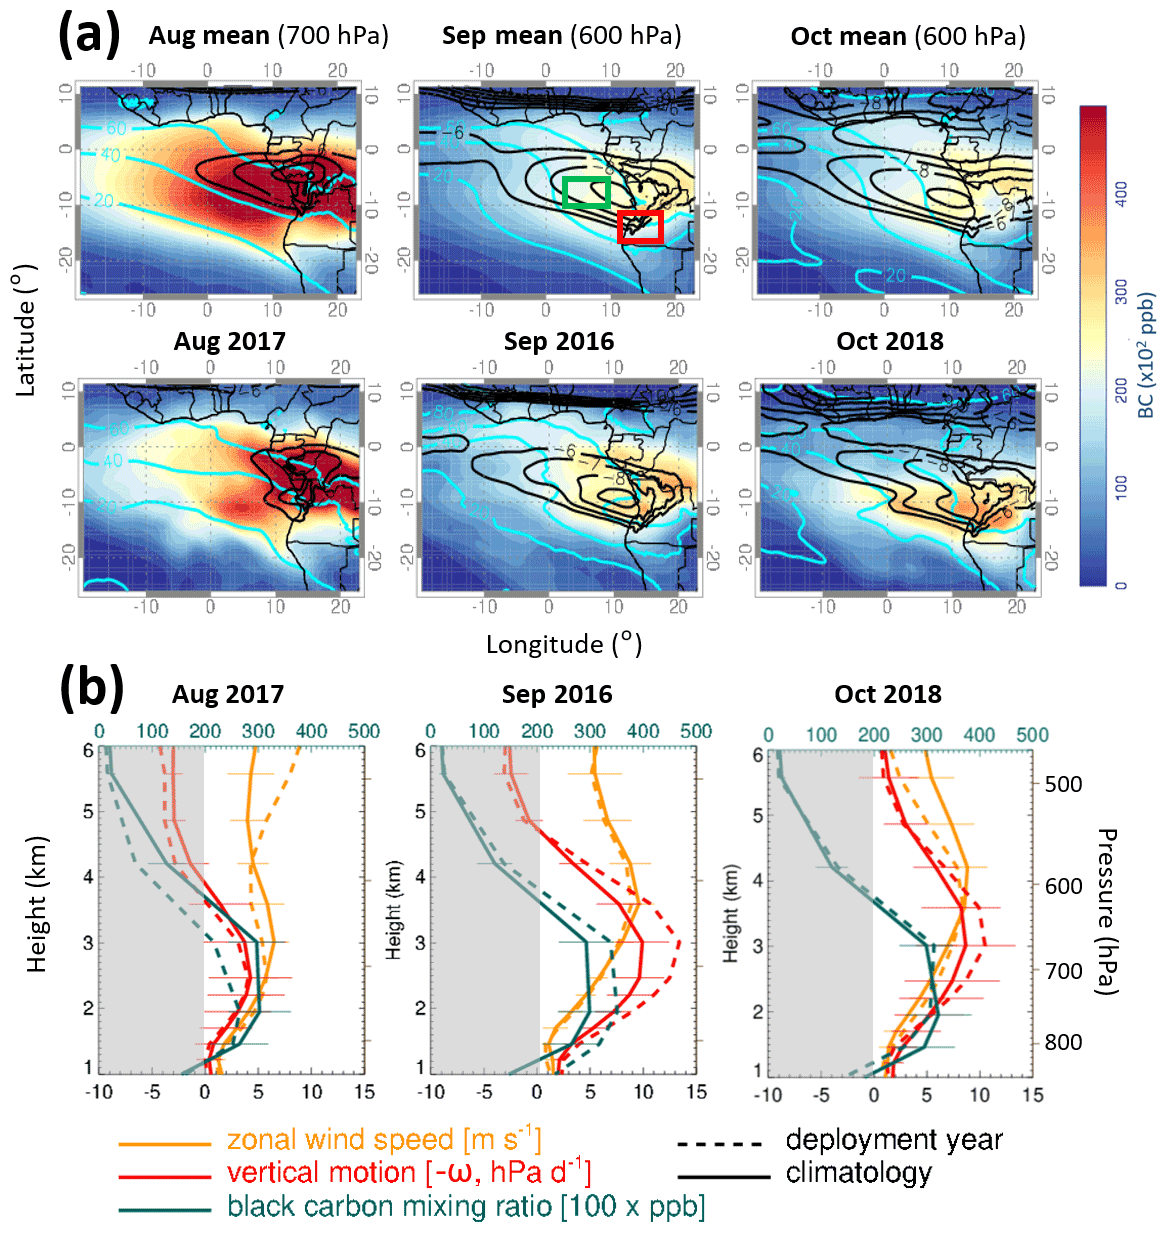
Figure 10(a) Maps of 700 hPa black carbon mixing ratios (BC; 100× ppb – parts per billion) overlain by ERA5 700 hPa zonal wind (black contour; m s−1) and 700 hPa RH (cyan contour; percent) for (top row) the climatological mean and (bottom row) August 2017. The same variables, except at 600 hPa, are used for September 2016 and October 2018. (b) The vertical profiles of BC (green; averaged over the region (4–10∘ E, 5–10∘ S); 100× ppb), vertical velocity (red; omega multiplied by −1 to represent the positive (negative) value as the ascent (descent); averaged over 12–18∘ E, 12–17∘ S; hPa d−1), and zonal wind speed (orange; averaged over the region (4–10∘ E, 5–10∘ S); m s−1) for August 2017, September 2016, and October 2018. The climatology for AEJ-S and RH is based on 2000–2018 from ERA5, and the climatology for BC is based on 2003–2020 from ECMWF CAMS. The thin horizontal line at each height level in panel (b) represents the 1.5 ± standard deviation of the climatological mean. The gray shading refers to the descent regions. The green (red) box in the middle of panel (a) refers to the region for the averaged zonal wind speed and the BC (vertical velocity) values used in panel (b), respectively.
3.3 Relationship of meteorological conditions to the aerosol transport
Considering the effect of the meteorological conditions on low-CF, we also examine how meteorology influences aerosol transport at regional and monthly time scales. Figure 10 shows the black carbon mixing ratios (BC) from CAMS and meteorological parameters from ERA5. The monthly mean BC is lower in August 2017 than the climatological mean, especially off the coast and over the ocean (Fig. 10a). This is consistent with a weaker AEJ-S during advection of these burning constituents out over the SE Atlantic (Adebiyi and Zuidema, 2016; Pistone et al., 2021), which may help explain the anomalously low aerosol optical depth in August 2017 (Redemann et al., 2021). The BC in both September 2016 and October 2018 is slightly higher than the climatological mean. The high values of BC are also found in the relatively high RH condition, which is mostly ranging from 20 % at lower altitudes up to around 70 % of RH. Similar features were found in other trace gas such as CO as well (not shown).
Another notable feature in the CAMS black carbon (and CO) analyses is that the peak mixing ratio occurs around 2–3 km in all deployment months (Fig. 10b). While the vertical motion clearly differs among three months, the vertical structures of BC do not covary with ascent strength. Shinozuka et al. (2020) and Doherty et al. (2021) both document that the aerosols in models tend to have more of their mass located at a lower altitude than is evident in the ORACLES observations, although their comparisons did not include CAMS reanalysis data. While more quantitative analysis needs to be done, this suggests the reanalysis assimilation schemes still have room for improvement in how they distribute aerosols vertically. The difference between BC in August 2017 and its climatological mean is smaller over the land than the coast (e.g., when we average BC and zonal wind speed over 5–10∘ S, 12–18∘ E region), but the overall features are similar.
3.4 The influence of the upper-level disturbance on the AEJ-S
The primary focus of this paper is to provide a meteorological overview during the ORACLES deployment year. However, we seek, in addition, to understand why August 2017 was characterized by a lower and weaker AEJ-S compared to climatology. Previous studies have shown that upper-level mid-latitude disturbance can modulate the temperature gradient over SE Atlantic (Adebiyi and Zuidema, 2018; Kuete et al., 2020), and the different phases of upper-level waves play an important role in modulating the strength of the AEJ-S over the SE Atlantic as well (Kuete et al., 2020). Motivated by these studies, we examine whether the upper-level disturbances can contribute to the weakening of AEJ-S in August 2017 and how they modulated the AEJ-S.
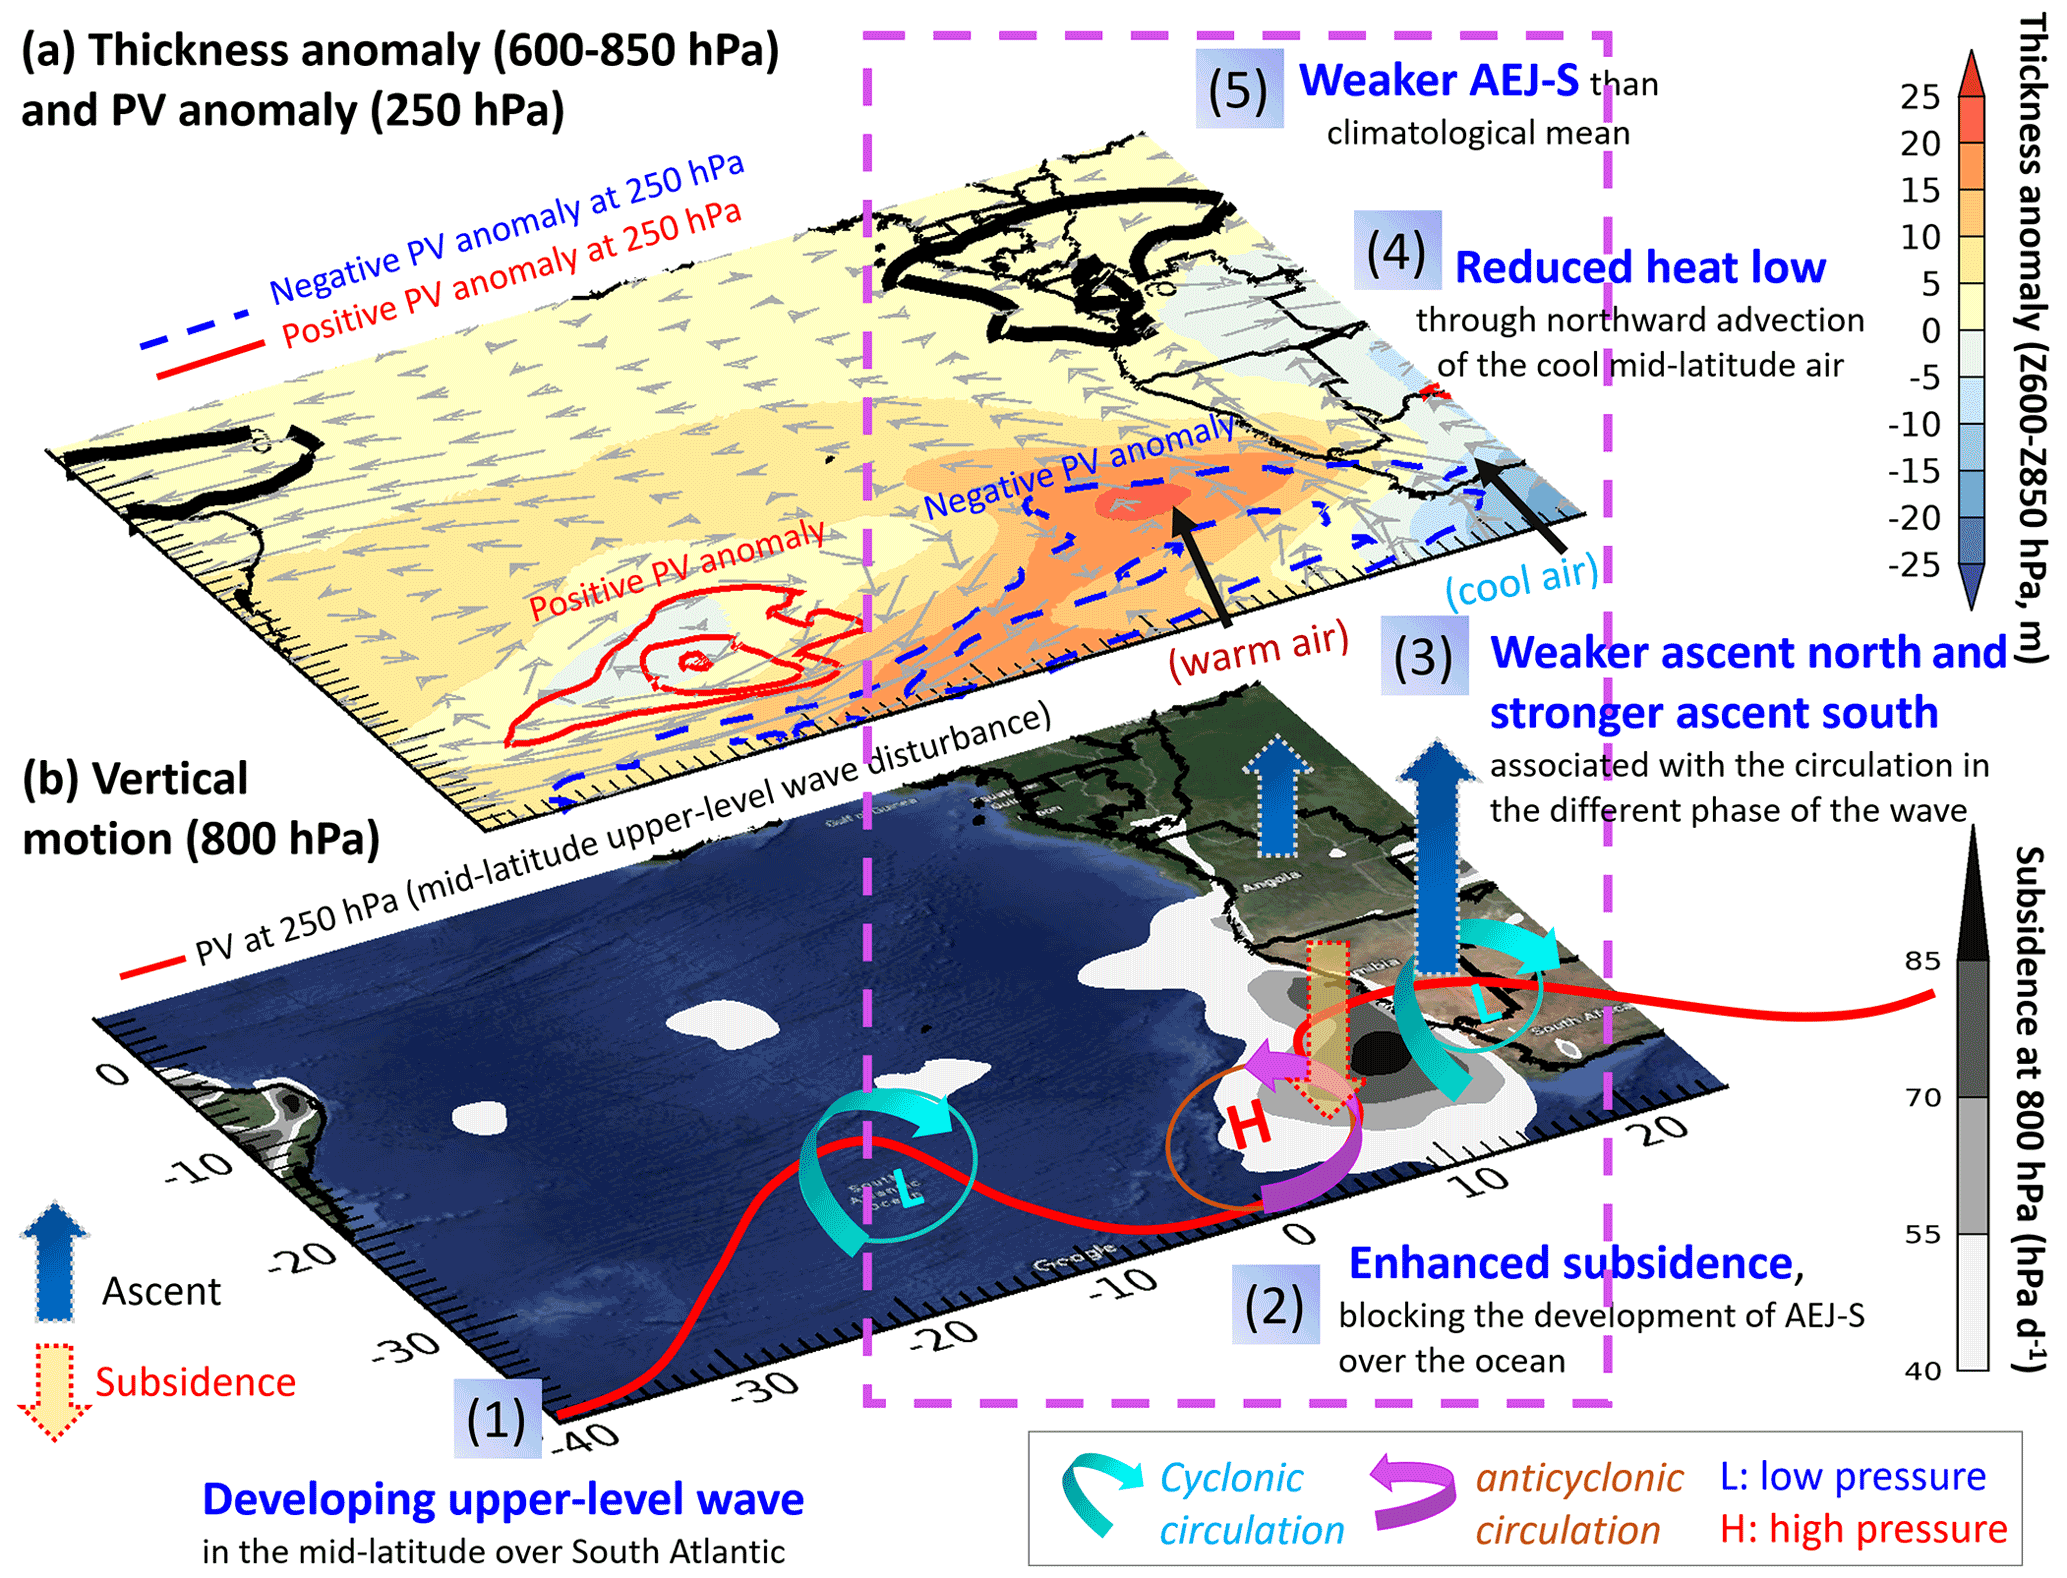
Figure 11Schematics of the upper-level disturbance and associated circulations, leading to the change in a vertical motion, reduction in the heat low through northward advection of the cool mid-latitude air, resulting in the weaker AEJ-S in August 2017 over the land north of 10∘ S. The enhanced subsidence also contributes to preventing the development of AEJ-S over the ocean. (a) Map of 250 hPa PV anomaly (dashed contour; potential vorticity unit – PVU; the blue dashed (red solid) line represents the negative (positive) PV anomaly), thickness anomaly (Z600 hPa–Z850 hPa; shading; meters), and 250 hPa horizontal wind anomaly (gray arrow; m s−1) overlain by AEJ-S (zonal wind isotach at 700 hPa; m s−1). (b) Subsidence (positive values from omega at 800 hPa; hPa d−1) is plotted on © Google Earth.
The negative (positive) PV anomaly corresponds to high (low) thickness anomaly and warm air (cool air). The cyclonic (anticyclonic) circulation represents the winds turning clockwise (counterclockwise) in the SH associated with the phase of the upper-level wave. The dashed magenta box represents the features that occurred in the August 2017 deployment.
To examine how the circulation associated with the upper-level disturbance can influence the AEJ-S further, we computed the thickness (heat low over the continent) anomaly with the upper-level PV anomaly at 250 hPa. Indeed, the upper-level disturbance is closely linked to the change in thickness, which is proportional to the layer mean temperature, shown in Fig. 11a. For example, in August 2017, the negative PV anomaly is linked to positive thickness anomaly (warm air), and the anticyclones associated with this advect the cool air from the mid-latitude ocean, reducing the heat low over the land (Fig. 11a).
Figure 11 shows the schematics of the anomalous 250 hPa circulation associated with the developing mid-latitude upper-level wave (or disturbance). An anomalous ascent is found downstream of the troughs, and anomalous subsidence is found upstream of the trough. This subsidence and ascent drive an anomalous anticyclone and cyclone in the 900–600 hPa depth region up to the upper-tropospheric region (∼ 250 hPa), leading to a northward motion over Namibia. This advects air from higher mid-latitude latitudes (i.e., cooler air) to the Angolan highlands, reducing the meridional temperature contrast between the Angolan highlands and the Congo basin, leading to weaker AEJ-S over the land at the north of 10∘ S. Together with this, the subsidence over the ocean is much stronger in August 2017, especially off the Benguela coast up to around 3∘ S, preventing the AEJ-S from transporting to the ocean (Adebiyi and Zuidema, 2016), which is also closely tied to the phase of the upper-level disturbances (Kuete et al., 2020). These upper-level waves and associated circulations also explain the variability in, and strength of, the heat low and AEJ-S during the other deployment months as well (Fig. 9S).
As a remote driver, the Madden–Julian oscillation convection (MJO; Madden and Julian, 1994; Wheeler and Hendon, 2004), an intraseasonal convective variability in the equatorial troposphere with a periodicity of about 30–90 d, may contribute to the weakening of AEJ-S in August 2017 because this is weakened over Africa during this period (shown in Fig. 10S). The MJO can affect the timing and intensity of convectively coupled Kelvin waves and convective activity over Africa (Guo et al., 2014), which can affect AEJ-S activity (Ventrice and Thorncroft, 2013; Zaitchik, 2017). However, this remote driver has been investigated for the AEJ-N, and the MJO's influence on the AEJ-S is less understood and remains unclear.
This paper describes the meteorological factors controlling aerosol transport and low cloud fraction during the August, September, and October 2016–2018 deployments of ObsErvation of Aerosols above CLouds and their intEractionS (ORACLES) project, particularly focusing on the climatological aspect of the meteorological overview at monthly timescales.
(a) Key climatological characteristics during the deployment month
-
August 2017: the monthly mean AEJ-S was slightly weaker in August 2017 compared to the climatological (2000–2018) mean. The AEJ-S was the weakest among deployment months, with the core being around 700 hPa (∼ 3 km). The heat low was the lowest among deployment months as well. The region around 5–10∘ S, 0–15∘ E was drier than the climatology, with the moisture mostly confined to the area near the Equator (< 5∘ N) than the climatological mean. The LLJ was stronger in August 2017 (∼ 2 m s−1) compared to the climatological mean. The well-mixed BLH in August 2017 was lower near the coast and higher over the SE Atlantic Ocean than the climatological mean. The subsidence near the Namibian coast was considerably stronger in August 2017 than the climatological mean. The low-CF was slightly smaller than the August climatology. The negative PV anomalies and anomalous circulation associated with the mid-latitude upper-level disturbance over the SE Atlantic Ocean brought the cool mid-latitude air mass, resulting in the reduced heat low and the weaker AEJ-S.
-
September 2016: the AEJ-S in September 2016 was similar to the climatological mean. Interestingly, the heat low (up to 5–10 m) over the north of Namibian dryland, and the ascending motion over the Namibian dryland, was slightly stronger (up to 2 hPa d−1) in September 2016 than the climatological mean. The LLJ was stronger in September 2016 (∼ 1 m s−1) compared to the climatological mean. In general, the BLH over the southern Atlantic Ocean in September 2016 was higher (∼ 100 m) than the climatological mean. The subsidence near the Namibian coast and southern Atlantic in September 2016 was also slightly stronger than the climatological mean. The low CF was slightly smaller than the September climatology.
-
October 2018: the updraft over the continent was slightly weak, but the horizontal temperature gradient still maintained the AEJ-S and vertical motion associated with the jet. The AEJ-S was slightly weaker than the climatological mean, but the difference was small (less than ±1 m s−1), with the heat low weaker than the climatological mean. The LLJ was weaker in October 2018 (−2–−3 m s−1) compared to the climatological mean. The BLH over the southern Atlantic Ocean in October 2018 was also lower (100–200 m) than the climatological mean. Furthermore, the BLH was lowest in October 2018 compared to other deployment months. The subsidence near the Namibian coast was also reduced in October 2018 by about 10–30 hPa d−1 off the Namibian coast (∼ 13∘ E, ∼ 22∘ S) compared to the climatological mean. The low CF in October 2018 was the largest among deployment months and larger than the October climatology.
(b) Key climatological characteristics that affect aerosol transport and low-level cloud:
-
A weaker AEJ-S, weaker vertical motion over the land, a stronger LLJ, and stronger subsidence near the Benguela coast in August 2017 than the climatological mean was closely linked to a lower black carbon (BC) mixing ratio in August 2017 compared to climatology in the CAMS reanalysis. Peak BC values were found in the high RH conditions, which mostly resided between about 20 % and 70 % of RH at the AEJ-S exit and entrance regions at 600–700 hPa. This indicates the possible association with the moist plume advected by AEJ-S from the continents. The peak of maximum BC occurred between 2 and 3 km for all 3 months, without co-varying with either the vertical motion or the AEJ-S.
-
The high low-level tropospheric stability (LTS) was closely associated with high low CF. The LLJ strength is also negatively related to low CF, most clearly shown over the subtropical Atlantic Ocean in September 2016. LLJ is positively associated with the subsidence off the Namibian coast, as clearly shown in August 2017. Large-scale subsidence off the coast of Namibia and the SE Atlantic Ocean and SST was also associated with the low CF at monthly timescales, but the sign of relationship varied with time and space. The relationship between low CF and BLH is not clear at monthly timescales, although low CF tends to be negatively associated with the BLH, especially over the ocean in August 2017 and September 2016,
This paper provides a meteorological context for interpreting the airborne aerosol measurements, particularly focusing on the climatological perspective. The goal of this paper (part 1) is primarily to describe how the large-scale meteorological factors are reflected in the aerosol transport and low cloud fractions during the deployment months, towards facilitating the interpretation of the field observation data. We will provide the detailed meteorological characteristics for the 3 deployment months at daily to weekly timescales in Part 2 of the meteorological overview paper.
The data in this analysis are based on open-source data. ERA 5 data are available from the Copernicus Climate Change Service (C3S) at https://cds.climate.copernicus.eu/ (Hersbach et al., 2020). The MODIS Aqua (Terra) Level 3 product is from https://doi.org/10.5067/MODIS/MYD08_M3.006 (Platnick et al., 2015a; https://doi.org/10.5067/MODIS/MYD08_M3.006, Platnick et al., 2015b). OISST data are available from http://www.remss.com/measurements/sea-surface-temperature/oisst-description/ (Gentemann et al., 2010). TRMM (TRMM_3B43) monthly rainfall estimate data are also available from https://disc.sci.gsfc.nasa.gov/datasets/TRMM_3B43_7/summary?keywords=TRMM (Huffman et al., 2007). ECMWF CAMS global reanalysis monthly mean data are available from https://ads.atmosphere.copernicus.eu/cdsapp#!/dataset/cams-global-reanalysis-eac4-monthly?tab=overview (Inness et al., 2019). MERRA2 monthly mean data are available from https://goldsmr4.gesdisc.eosdis.nasa.gov/data/MERRA2_MONTHLY/ (Gelaro et al., 2017). JRA55 monthly mean data are available from https://doi.org/10.5065/D60G3H5B (Japan Meteorological Agency/Japan, 2013). NCEP/NCAR monthly mean reanalysis data are available from https://psl.noaa.gov/data/gridded/data.ncep.reanalysis.pressure.html (Kalnay et al., 1996). The ORACLES P-3 flight track data can be obtained from NASA Earth Science Project Office (ESPO) archive at https://doi.org/10.5067/Suborbital/ORACLES/P3/2016_V2 (ORACLES Science Team, 2020a), for the 2016 data, https://doi.org/10.5067/Suborbital/ORACLES/P3/2017_V2 (ORACLES Science Team, 2020b), for the 2017 data, and https://doi.org/10.5067/Suborbital/ORACLES/P3/2018_V2 (ORACLES Science Team, 2020c), for the 2018 data, respectively.
The supplement related to this article is available online at: https://doi.org/10.5194/acp-21-16689-2021-supplement.
RW and PZ envisioned the original ORACLES meteorological overview concept, and RU, JMR, and LP designed the structure of the paper. IC provided the climatological mean and monthly mean MODIS low-cloud data and assisted JMR in obtaining the VIIRS daily mean cloud data product. LP, RU, PZ, and RW supported research activity planning, execution, and presentation. LP and PZ assisted with the interpretation of the results, and JMR performed the data analysis, including the visualization of the results, and did the writing. LP, RU, PZ, RW, IC, and JR edited the paper. LP and RU led the meteorological forecast briefing during the three ORACLES field deployments.
Paquita Zuidema is a guest editor for the ACP Special Issue: “ACP special issue: New observations and related modelling studies of the aerosol–cloud–climate system in the Southeast Atlantic and southern Africa regions”. The rest of the authors declare that they have no conflict of interest.
Publisher’s note: Copernicus Publications remains neutral with regard to jurisdictional claims in published maps and institutional affiliations.
This article is part of the special issue “New observations and related modelling studies of the aerosol–cloud–climate system in the Southeast Atlantic and southern Africa regions (ACP/AMT inter-journal SI)”. It is not associated with a conference.
The authors give their sincere gratitude to all the ORACLES participants who made the project successful. The first author thanks Sara Purdue, for her assistance in obtaining the OISST data, and Yohei Shinozuka, Kristina Pistone and Samuel E. LeBlanc, for the helpful discussion and resources for ORACLES flight data. We also thank the editor and two anonymous reviewers for their thoughtful and insightful comments that helped us improve the paper.
This research has been supported by the NASA Earth Venture Suborbital-2 (grant no. NNH13ZDA001N-EVS2).
This paper was edited by Frank Eckardt and reviewed by two anonymous referees.
Abel, S. J., Barrett, P. A., Zuidema, P., Zhang, J., Christensen, M., Peers, F., Taylor, J. W., Crawford, I., Bower, K. N., and Flynn, M.: Open cells exhibit weaker entrainment of free-tropospheric biomass burning aerosol into the south-east Atlantic boundary layer, Atmos. Chem. Phys., 20, 4059–4084, https://doi.org/10.5194/acp-20-4059-2020, 2020.
Adebiyi, A., Zuidema, P., and Abel, S.: The convolution of dynamics and moisture with the presence of shortwave absorbing aerosols over the southeast Atlantic, J. Climate, 28, 1997–2024, https://doi.org/10.1175/JCLI-D-14-00352.1, 2015.
Adebiyi, A. A., and Zuidema, P.: The role of the southern African easterly jet in modifying the southeast Atlantic aerosol and cloud environments, Q. J. Roy. Meteorol. Soc., 142, 1574–1589, https://doi.org/10.1002/qj.2765, 2016.
Adebiyi, A. A. and Zuidema, P.: Low Cloud Cover Sensitivity to Biomass-Burning Aerosols and Meteorology over the Southeast Atlantic, J. Climate, 31, 4329–4346, https://doi.org/10.1175/JCLI-D-17-0406.1, 2018.
Adebiyi, A. A., Zuidema, P., Chang, I., Burton, S. P., and Cairns, B.: Mid-level clouds are frequent above the southeast Atlantic stratocumulus clouds, Atmos. Chem. Phys., 20, 11025–11043, https://doi.org/10.5194/acp-20-11025-2020, 2020.
Cermak, J., Eastman, R. M., Bendix, J., Warren, S. G.: European climatology of fog and low stratus based on geostationary satellite observations, Q. J. Roy. Meteor. Soc., 135, 2125–2130, https://doi.org/10.1002/qj.503, 2009.
Cochrane, S. P., Schmidt, K. S., Chen, H., Pilewskie, P., Kittelman, S., Redemann, J., LeBlanc, S., Pistone, K., Kacenelenbogen, M., Segal Rozenhaimer, M., Shinozuka, Y., Flynn, C., Dobracki, A., Zuidema, P., Howell, S., Freitag, S., and Doherty, S.: Empirically derived parameterizations of the direct aerosol radiative effect based on ORACLES aircraft observations, Atmos. Meas. Tech., 14, 567–593, https://doi.org/10.5194/amt-14-567-2021, 2021.
De Szoeke, S. P., Verlinden, K. L., Yuter, S. E., and Mechem, D. B.: The Time Scales of Variability of Marine Low Clouds, J. Climate, 29, 6463–6481, https://doi.org/10.1175/JCLI-D-15-0460.1, 2016.
Diamond, M. S., Dobracki, A., Freitag, S., Small Griswold, J. D., Heikkila, A., Howell, S. G., Kacarab, M. E., Podolske, J. R., Saide, P. E., and Wood, R.: Time-dependent entrainment of smoke presents an observational challenge for assessing aerosol–cloud interactions over the southeast Atlantic Ocean, Atmos. Chem. Phys., 18, 14623–14636, https://doi.org/10.5194/acp-18-14623-2018, 2018.
Doherty, S. J., Saide, P. E., Zuidema, P., Shinozuka, Y., Ferrada, G. A., Gordon, H., Mallet, M., Meyer, K., Painemal, D., Howell, S. G., Freitag, S., Dobracki, A., Podolske, J. R., Burton, S. P., Ferrare, R. A., Howes, C., Nabat, P., Carmichael, G. R., da Silva, A., Pistone, K., Chang, I., Gao, L., Wood, R., and Redemann, J.: Modeled and observed properties related to the direct aerosol radiative effect of biomass burning aerosol over the Southeast Atlantic, Atmos. Chem. Phys. Discuss. [preprint], https://doi.org/10.5194/acp-2021-333, in review, 2021.
Formenti, P., D'Anna, B., Flamant, C., Mallet, M., Piketh, S.-J., Schepanski, K., Waquet, F., Auriol, F., Brogniez, G., Burnet, F., Chaboureau, J.-P., Chauvigné, A, Chazette, P, Denjean, C., Desboeufs, K, Doussin, J.-F., Elguindi, N., Feuerstein, S., Gaetani, M, Giorio, C., Klopper, D., Mallet, M. D., Nabat, P., Monod, A., Solmon, F., Namwoonde, A., Chikwililwa, C., Mushi, R., Welton, E. J., and Holben, B.: The Aerosols, Radiation and Clouds in Southern Africa field campaign in Namibia, overview, illustrative observations, and way forward., B. Am. Meteorol. Soc., 100, 1277–1298, 2019.
Fuchs, J., Cermak, J., Andersen, H., Hollmann, R., and Schwarz, K.: On the influence of air mass irigin on low-cloud properties in the Southeast Atlantic, J. Geophys. Res.-Atmos., 122, 11076–11091, https://doi.org/10.1002/2017JD027184, 2017.
Gelaro, R., McCarty, W., Suárez, M., J., Todling, R. Molod, A., Takacs, L., Randles, C. A., Darmenov, A., Bosilovich, M. G., Reichle, R., Wargan, K., Coy, L., Cullather, R., Draper, C., Akella, S., Buchard, V., Conaty, A., da Silva, A. M., Gu, W., Kim, G.-K., Koster, R., Lucchesi, R., Merkova, D., Nielsen, J. E., Partyka, G., Pawson, S., Putman, W., Rienecker, M., Schubert, S. D., Sienkiewicz, M., and Zhao, B.: The Modern-Era Retrospective Analysis for Research and Applications, Version 2 (MERRA-2), J. Climate, 30, 5419–5454, https://doi.org/10.1175/JCLI-D-16-0758.1, 2017 (data available at: https://goldsmr4.gesdisc.eosdis.nasa.gov/data/MERRA2_MONTHLY/, last access: 11 November 2021).
Gentemann, C. L., Wentz, F. J., Mears, C. A., and Smith, D. K.: In situ validation of Tropical Rainfall Measuring Mission microwave sea surface temperatures, J. Geophys. Res., 109, C04021, https://doi.org/10.1029/2003JC002092, 2004.
Gentemann, C. L., Meissner, T., and Wentz, F. J.: Accuracy of satellite sea surface temperatures at 7 and 11 GHz, IEEE T. Geosci. Remote, 48, 1009–1018, 2010 (data available at: http://www.remss.com/measurements/sea-surface-temperature/oisst-description/, last access: 11 November 2021).
Gordon, H., Field, P. R., Abel, S. J., Dalvi, M., Grosvenor, D. P., Hill, A. A., Johnson, B. T., Miltenberger, A. K., Yoshioka, M., and Carslaw, K. S.: Large simulated radiative effects of smoke in the south-east Atlantic, Atmos. Chem. Phys., 18, 15261–15289, https://doi.org/10.5194/acp-18-15261-2018, 2018.
Guo, Y., Jiang, X., and Waliser, D. E.: Modulation of the Convectively Coupled Kelvin Waves over South America and the Tropical Atlantic Ocean in Association with the Madden–Julian Oscillation, J. Atmos. Sci., 71, 1371–1388, 2014.
Gupta, S., McFarquhar, G. M., O'Brien, J. R., Delene, D. J., Poellot, M. R., Dobracki, A., Podolske, J. R., Redemann, J., LeBlanc, S. E., Segal-Rozenhaimer, M., and Pistone, K.: Impact of the variability in vertical separation between biomass burning aerosols and marine stratocumulus on cloud microphysical properties over the Southeast Atlantic, Atmos. Chem. Phys., 21, 4615–4635, https://doi.org/10.5194/acp-21-4615-2021, 2021.
Haywood, J. M., Abel, S. J., Barrett, P. A., Bellouin, N., Blyth, A., Bower, K. N., Brooks, M., Carslaw, K., Che, H., Coe, H., Cotterell, M. I., Crawford, I., Cui, Z., Davies, N., Dingley, B., Field, P., Formenti, P., Gordon, H., de Graaf, M., Herbert, R., Johnson, B., Jones, A. C., Langridge, J. M., Malavelle, F., Partridge, D. G., Peers, F., Redemann, J., Stier, P., Szpek, K., Taylor, J. W., Watson-Parris, D., Wood, R., Wu, H., and Zuidema, P.: The CLoud–Aerosol–Radiation Interaction and Forcing: Year 2017 (CLARIFY-2017) measurement campaign, Atmos. Chem. Phys., 21, 1049–1084, https://doi.org/10.5194/acp-21-1049-2021, 2021.
Hersbach, H., Bell, B., Berrisford, P., Hirahara, S., Horányi, A., Muñoz-Sabater, J., Nicolas, J., Peubey, C., Radu, R., Schepers, D., Simmons, A., Soci, C., Abdalla, S., Abellan, X., Balsamo, G., Bechtold, P., Biavati, G., Bidlot, J., Bonavita, M., De Chiara, G., Dahlgren, P., Dee, D., Diamantakis, M., Dragani, R., Flemming, J., Forbes, R., Manuel, F., Geer, A., Haimberger, L., Healy, S., Hogan, R. J., Hólm, E., Janisková, M., Keeley, S., Laloyaux, P., Lopez, P., Lupu, C., Radnoti, G., De Rosnay, P., Rozum, I., Vamborg, F., Villaume, S., Thépaut, J.-N.: The ERA5 global reanalysis, Q. J. Roy. Meteor. Soc., 146, 1999–2049, https://doi.org/10.1002/qj.3803, 2020 (data available at: https://cds.climate.copernicus.eu/, last access: 11 November 2021).
Huffman, G. J., Adler, R. F., Bolvin,, D. T., Gu, G., Nelkin, E. J., Bowman, K. P., Hong, Y., Stocker, E. F., and Wolff, D. B.: The TRMM Multi-satellite Precipitation Analysis: Quasi- Global, Multi-Year, Combined-Sensor Precipitation Estimates at Fine Scale, J. Hydrometeorol., 8, 38–55, 2007 (data available at: https://disc.sci.gsfc.nasa.gov/datasets/TRMM_3B43_7/summary?keywords=TRMM, last access: 11 November 2021).
Inness, A., Ades, M., Agustí-Panareda, A., Barré, J., Benedictow, A., Blechschmidt, A.-M., Dominguez, J. J., Engelen, R., Eskes, H., Flemming, J., Huijnen, V., Jones, L., Kipling, Z., Massart, S., Parrington, M., Peuch, V.-H., Razinger, M., Remy, S., Schulz, M., and Suttie, M.: The CAMS reanalysis of atmospheric composition, Atmos. Chem. Phys., 19, 3515–3556, https://doi.org/10.5194/acp-19-3515-2019, 2019 (data available at: https://ads.atmosphere.copernicus.eu/cdsapp#!/dataset/cams-global-reanalysis-eac4-monthly?tab=overview, last access: 11 November 2021).
Jackson, B., Nicholson, S. E., and Klotter, D.: Mesoscale Convective Systems over Western Equatorial Africa and Their Relationship to Large-Scale Circulation, Mon. Weather Rev., 137, 1272–1294, https://doi.org/10.1175/2008MWR2525.1, 2009.
Japan Meteorological Agency/Japan: JRA-55: Japanese 55-year Reanalysis, Monthly Means and Variances, Research Data Archive at the National Center for Atmospheric Research, Computational and Information Systems Laboratory, https://doi.org/10.5065/D60G3H5B, 2013.
Kacarab, M., Thornhill, K. L., Dobracki, A., Howell, S. G., O'Brien, J. R., Freitag, S., Poellot, M. R., Wood, R., Zuidema, P., Redemann, J., and Nenes, A.: Biomass burning aerosol as a modulator of the droplet number in the southeast Atlantic region, Atmos. Chem. Phys., 20, 3029–3040, https://doi.org/10.5194/acp-20-3029-2020, 2020.
Kalnay, E., Kanamitsu, M., Kistler, R., Collins, W., Deaven, D., Gandin, L., Iredell, M., Saha, S., White, G., Woollen, J., Zhu, Y., Chelliah, M., Ebisuzaki, W., Higgins, W., Janowiak, J., Mo, K. C., Ropelewski, C., Wang, J., Leetmaa, A., Reynolds, R., Jenne, R., and Joseph, D.: The NCEP/NCAR 40-year reanalysis project, B. Am. Meteorol. Soc., 77, 437–471, 1996 (data available at: https://psl.noaa.gov/data/gridded/data.ncep.reanalysis.pressure.html, last access: 11 November 2021).
Klein, S. A. and Hartmann, D. L.: The seasonal cycle of low stratiform clouds, J. Climate, 6, 1588–1606, 1993.
Knippertz, P., Fink, A. H., Deroubaix, A., Morris, E., Tocquer, F., Evans, M. J., Flamant, C., Gaetani, M., Lavaysse, C., Mari, C., Marsham, J. H., Meynadier, R., Affo-Dogo, A., Bahaga, T., Brosse, F., Deetz, K., Guebsi, R., Latifou, I., Maranan, M., Rosenberg, P. D., and Schlueter, A.: A meteorological and chemical overview of the DACCIWA field campaign in West Africa in June–July 2016, Atmos. Chem. Phys., 17, 10893–10918, https://doi.org/10.5194/acp-17-10893-2017, 2017.
Kuete, G., Mba, W. P., and Washington, R.: African Easterly Jet South: Control, maintenance mechanisms and link with Southern subtropical waves, Clim. Dynam., 54, 1539–1552, https://doi.org/10.1007/s00382-019-05072-w, 2020.
Madden, R. A. and Julian, P. R.: Observations of the 40–50-Day Tropical Oscillation – A Review, Mon. Weather Rev., 122, 814–837, 1994.
Mallet, M., Nabat, P., Zuidema, P., Redemann, J., Sayer, A. M., Stengel, M., Schmidt, S., Cochrane, S., Burton, S., Ferrare, R., Meyer, K., Saide, P., Jethva, H., Torres, O., Wood, R., Saint Martin, D., Roehrig, R., Hsu, C., and Formenti, P.: Simulation of the transport, vertical distribution, optical properties and radiative impact of smoke aerosols with the ALADIN regional climate model during the ORACLES-2016 and LASIC experiments, Atmos. Chem. Phys., 19, 4963–4990, https://doi.org/10.5194/acp-19-4963-2019, 2019.
Mallet, M., Solmon, F., Nabat, P., Elguindi, N., Waquet, F., Bouniol, D., Sayer, A. M., Meyer, K., Roehrig, R., Michou, M., Zuidema, P., Flamant, C., Redemann, J., and Formenti, P.: Direct and semi-direct radiative forcing of biomass-burning aerosols over the southeast Atlantic (SEA) and its sensitivity to absorbing properties: a regional climate modeling study, Atmos. Chem. Phys., 20, 13191–13216, https://doi.org/10.5194/acp-20-13191-2020, 2020.
Myers, T. A. and Norris, J. R.: Observational evidence that enhanced subsidence reduces subtropical marine boundary layer cloudiness, J. Climate, 26, 7507–7524, https://doi.org/10.1175/JCLI-D-12-00736.1, 2013.
Nicholson, S.: A low-level jet along the Benguela coast, an integral part of the Benguela current ecosystem, Climatic Change, 99, 613, https://doi.org/10.1007/s10584-009-9678-z, 2010.
ORACLES Science Team: Moffett Field, CA, NASA Ames Earth Science Project Office (ESPO) [data set], https://doi.org/10.5067/Suborbital/ORACLES/P3/2016_V2, 2020a.
ORACLES Science Team: Moffett Field, CA, NASA Ames Earth Science Project Office (ESPO) [data set], https://doi.org/10.5067/Suborbital/ORACLES/P3/2017_V2, 2020b.
ORACLES Science Team: Moffett Field, CA, NASA Ames Earth Science Project Office (ESPO) [data set], https://doi.org/10.5067/Suborbital/ORACLES/P3/2018_V2, 2020c.
Pistone, K., Zuidema, P., Wood, R., Diamond, M., da Silva, A. M., Ferrada, G., Saide, P. E., Ueyama, R., Ryoo, J.-M., Pfister, L., Podolske, J., Noone, D., Bennett, R., Stith, E., Carmichael, G., Redemann, J., Flynn, C., LeBlanc, S., Segal-Rozenhaimer, M., and Shinozuka, Y.: Exploring the elevated water vapor signal associated with the free tropospheric biomass burning plume over the southeast Atlantic Ocean, Atmos. Chem. Phys., 21, 9643–9668, https://doi.org/10.5194/acp-21-9643-2021, 2021.
Platnick, S., Hubanks, P., Meyer, K., and King, M. D.: MODIS Atmosphere L3 Monthly Product (08_L3). NASA MODIS Adaptive Processing System, (Terra), Goddard Space Flight Center [data set], https://doi.org/10.5067/MODIS/MYD08_M3.006, 2015a.
Platnick, S., Hubanks, P., Meyer, K., and King, M. D.: MODIS Atmosphere L3 Monthly Product (08_L3). NASA MODIS Adaptive Processing System, (Aqua), Goddard Space Flight Center [data set], https://doi.org/10.5067/MODIS/MYD08_M3.006, 2015b.
Redemann, J., Wood, R., Zuidema, P., Doherty, S. J., Luna, B., LeBlanc, S. E., Diamond, M. S., Shinozuka, Y., Chang, I. Y., Ueyama, R., Pfister, L., Ryoo, J.-M., Dobracki, A. N., da Silva, A. M., Longo, K. M., Kacenelenbogen, M. S., Flynn, C. J., Pistone, K., Knox, N. M., Piketh, S. J., Haywood, J. M., Formenti, P., Mallet, M., Stier, P., Ackerman, A. S., Bauer, S. E., Fridlind, A. M., Carmichael, G. R., Saide, P. E., Ferrada, G. A., Howell, S. G., Freitag, S., Cairns, B., Holben, B. N., Knobelspiesse, K. D., Tanelli, S., L'Ecuyer, T. S., Dzambo, A. M., Sy, O. O., McFarquhar, G. M., Poellot, M. R., Gupta, S., O'Brien, J. R., Nenes, A., Kacarab, M., Wong, J. P. S., Small-Griswold, J. D., Thornhill, K. L., Noone, D., Podolske, J. R., Schmidt, K. S., Pilewskie, P., Chen, H., Cochrane, S. P., Sedlacek, A. J., Lang, T. J., Stith, E., Segal-Rozenhaimer, M., Ferrare, R. A., Burton, S. P., Hostetler, C. A., Diner, D. J., Seidel, F. C., Platnick, S. E., Myers, J. S., Meyer, K. G., Spangenberg, D. A., Maring, H., and Gao, L.: An overview of the ORACLES (ObseRvations of Aerosols above CLouds and their intEractionS) project: aerosol–cloud–radiation interactions in the southeast Atlantic basin, Atmos. Chem. Phys., 21, 1507–1563, https://doi.org/10.5194/acp-21-1507-2021, 2021.
Richter, I. and Mechoso, C. R.: Orographic Influences on Subtropical Stratocumulus, J. Atmos. Sci., 63, 2585–2601, 2006.
Ryoo, J.-M., Pfister, L., Ueyama, R., Zuidema, P., Wood, R., Chang, I., and Redemann, J.: A meteorological overview of the ORACLES (ObseRvations of Aerosols above Clouds and their intEractionS) campaign over the southeastern Atlantic during 2016–2018: Part 2 – Synoptic-scale characteristics during the deployments, Atmos. Chem. Phys., in preparation, 2021.
Shinozuka, Y., Saide, P. E., Ferrada, G. A., Burton, S. P., Ferrare, R., Doherty, S. J., Gordon, H., Longo, K., Mallet, M., Feng, Y., Wang, Q., Cheng, Y., Dobracki, A., Freitag, S., Howell, S. G., LeBlanc, S., Flynn, C., Segal-Rosenhaimer, M., Pistone, K., Podolske, J. R., Stith, E. J., Bennett, J. R., Carmichael, G. R., da Silva, A., Govindaraju, R., Leung, R., Zhang, Y., Pfister, L., Ryoo, J.-M., Redemann, J., Wood, R., and Zuidema, P.: Modeling the smoky troposphere of the southeast Atlantic: a comparison to ORACLES airborne observations from September of 2016, Atmos. Chem. Phys., 20, 11491–11526, https://doi.org/10.5194/acp-20-11491-2020, 2020.
Thorncroft, C. D. and Blackburn, M.: Maintenance of the African easterly jet, Q. J. Roy. Meteor. Soc., 125, 763–786, 1999.
van der Dussen, J. J., de Roode, S. R., and Siebesma, A. P.: How large-scale subsidence affects stratocumulus transitions, Atmos. Chem. Phys., 16, 691–701, https://doi.org/10.5194/acp-16-691-2016, 2016.
Ventrice, M. J. and Thorncroft, C. D.: The Role of Convectively Coupled Atmospheric Kelvin Waves on African Easterly Wave Activity, Mon. Weather Rev., 141, 1910–1924, https://doi.org/10.1175/MWR-D-12-00147.1, 2013.
Wheeler, M. C. and Hendon, H. H.: An all-season real-time multivariate MJO index: development of an index for monitoring and prediction, Mon. Weather Rev., 132, 1917–1932, 2004.
Wood, R. and Bretherton, C. S.: On the Relationship between Stratiform Low Cloud Cover and Lower-Tropospheric Stability, J. Climate, 19, 6425–6432, 2006.
Wood, R: REVIEW Stratocumulus Clouds, Month. Weather Rev., 140, 2373–2423, 2012.
Wood, R.: Clouds and Fog, Stratus and Stratocumulus, Encyclopedia of Atmospheric Sciences, Second Edition, 2015.
Zaitchik, B., F.: Madden-Julian Oscillation impacts on tropical African precipitation, Atmos. Res., 184, 88–102, https://doi.org/10.1016/j.atmosres.2016.10.002, 2017.
Zhang, J. and Zuidema, P.: The diurnal cycle of the smoky marine boundary layer observed during August in the remote southeast Atlantic, Atmos. Chem. Phys., 19, 14493–14516, https://doi.org/10.5194/acp-19-14493-2019, 2019.
Zuidema, P., Chang, P., Medeiros, B., Kirtman, B. P., Mechoso, R., Schneider E. D., Tonizzo, T., Richter, I., Small, R. J., Bellomo, K., Brandt, P., De Szoeke, S., Farrar, T., Jung, E., Kato, S., Li, M., Patricola, C., Wang, Z., Wood, R., and Zu, Z.: Challenges and prospects for reducing coupled climate model SST biases in the eastern tropical Atlantic and Pacific Oceans: The U.S. CLIVAR Eastern Tropical Oceans Synthesis Working Group, B. Am. Meteorol. Soc., 97, 2305–2327, https://doi.org/10.1175/BAMS-D-15-00274.1, 2016.
Zuidema, P., Sedlacek III, A. J., Flynn, C., Springston, S., Delgadillo, R., Zhang, J., Aiken, A. C., Koontz, A., and Muradyan, P.: The Ascension Island boundary layer in the remote southeast Atlantic is often smoky, Geophys. Res. Lett., 45, 4456–4465, https://doi.org/10.1002/2017GL076926, 2018.