the Creative Commons Attribution 4.0 License.
the Creative Commons Attribution 4.0 License.
 | 12 Nov 2021
Distinct impacts on precipitation by aerosol radiative effect over three different megacity regions of eastern China
Yue Sun
Many studies have investigated the impacts of aerosol on the intensity and amount of precipitation, but few have been done so regarding the impacts of aerosol on the start and peak times of precipitation. Using the high-resolution precipitation, aerosol, and meteorological data in the warm season of June–August from 2015 to 2020, this study investigates the influence of aerosol on the start and peak times of precipitation over three different regions, the North China Plain (NCP), the Yangtze River Delta (YRD), and the Pearl River Delta (PRD). It shows that the period with the highest frequency of precipitation start time, defined as the frequent period (FP) of precipitation start time, is delayed and prolonged by aerosols in NCP, contributing to the similar durations of precipitation in NCP, YRD, and PRD. This study also shows that different types of aerosol (absorbing versus scattering) have caused different influences on the start and peak times of precipitation over the three study regions. The precipitation start time is 3 h advanced in NCP but 2 h delayed in PRD by aerosols during precipitation FP and shows no response to aerosol in YRD. Compared to stratiform precipitation, the convective precipitation is more sensitive to aerosol. The start and peak times of convective precipitation show similar responses to aerosols. This study further shows that the aerosol impacts on precipitation can vary with meteorological conditions. Humidity is beneficial to precipitation, which can advance the precipitation start and peak times and prolong the precipitation duration time. Correspondingly, the impacts of aerosol on start time of precipitation are significant under low humidity or weak low tropospheric stability conditions. The impacts of vertical wind shear (WS) on the start and peak times of precipitation are contrary to that of aerosols, resulting in the fact that WS inhibits the aerosol effects on precipitation.
- Article
(7653 KB) - Full-text XML
-
Supplement
(495 KB) - BibTeX
- EndNote


Aerosols can modify radiative energy balance, cloud physics, and precipitation and then affect both weather and climate, bringing large uncertainties to weather forecast and climate assessment (Edenhofer and Seyboth, 2013; Tao et al., 2012). Associated with the rapid economic development in China, heavy aerosol pollution has also resulted in serious impacts on atmospheric environment, weather, climate, and even public health (An et al., 2019; Song et al., 2017; Wang et al., 2017). Although the PM2.5 mass concentrations have decreased significantly since 2013 due to the major air pollution control measures made by the Chinese government (Ding et al., 2019; Fan et al., 2021a; Wang et al., 2020; Zhang et al., 2020; Zheng et al., 2018), China is still among the regions with high aerosol amounts. Thus, it is still necessary to further investigate aerosol's impacts in China.
The aerosol can affect the cloud and precipitation by changing the radiation directly and by serving as cloud condensation nuclei (CCN) or ice nuclei (IN), which are referred to as radiative effect and microphysical effect (Garrett and Zhao, 2006; Wang et al., 2010; Fan et al., 2015; Chen et al., 2017; Liu et al., 2020; Zhao et al., 2020). On one hand, the aerosols can scatter and absorb solar radiation, which can heat the atmosphere and cool the surface, stabilise the atmosphere, and then suppress precipitation. In particular, aerosols by absorbing solar radiation, can strengthen the evaporation of cloud and then suppress the formation of cloud and precipitation (Ackerman et al., 2000). On the other hand, aerosols, by serving as CCN or IN, can increase cloud droplet number concentration, resulting in larger cloud albedo (Twomey, 1977), enhanced cloud thermal emissivity (Garrett and Zhao, 2006; Zhao and Garrett, 2015), reduced precipitation and longer cloud lifetime (Albrecht, 1989; Pincus and Baker, 1994), and invigorated convective precipitation (Fan et al., 2015; Li et al., 2011; Rosenfeld et al., 2008).
The aerosols show distinct influences on precipitation under different climatic regions, which make humid areas wetter and arid areas drier (Huang et al., 2006a, b, 2010; Koren et al., 2005; Rosenfeld, 2000; Teller and Levin, 2006; Wang, 2005). Using long-term ground site observations, Li et al. (2011) have found that the increasing aerosols make the cloud higher and deeper under humid conditions, which can increase the frequency and intensity of precipitation significantly and then increase the probability of floods, while under dry conditions, aerosols can inhibit the development of cloud and precipitation and then increase the probability of drought. Based on the global satellite data, Niu and Li (2012) have further found that the above phenomenon is shown not only at a single ground site, but even more pronounced in tropical regions. Considering the complexity of precipitation processes and their variations with locations, studying the aerosol–precipitation interactions is important to improve the accuracy of regional weather forecasts (Fan et al., 2015).
The significant influences of aerosol on cloud and precipitation in China have been reported in many studies (e.g. Chen et al., 2017; Liu et al., 2019; Zhao et al., 2020). In southeast China, with the increase in aerosol, light and moderate precipitation are inhibited, while heavy precipitation is enhanced (Shi et al., 2015; Wu et al., 2016; Yang et al., 2018). Aerosols over urban regions can increase the total precipitation amount when there is sufficient moisture supply and decrease the total precipitation amount when there is insufficient moisture supply (Chen et al., 2015; Qiu et al., 2017). Yang et al. (2017) found that aerosols can reduce the precipitation areas and intensity over Beijing–Tianjin–Hebei region using WRF-Chem model simulations. Zhao et al. (2018) indicated that the aerosols can reduce the precipitation intensity while enlarging the precipitation area of tropical cyclones over the western pacific area using long-term observations.
Most existing studies about the impacts of aerosol on precipitation have focused on the precipitation amount, frequency, and intensity, but few studies have investigated how the aerosols affect precipitation time, including both start and peak times of precipitation. Several studies have pointed out that aerosols can make cloud higher and deeper under polluted conditions, which will delay the precipitation and cause strong thunderstorm precipitation in downwind areas (Andreae et al., 2004; Lin et al., 2006; Rosenfeld et al., 2008). However, this effect, called the invigoration effect, has not gained wide recognition. Several model simulation studies have shown that the invigoration effect is weak, and the aerosols even suppress convection in the case with strong wind shear or with cold cloud base (Fan et al., 2009, 2012, 2013; Khain et al., 2005; Lebo and Morrison, 2014). Moreover, the delay caused by the invigoration effect has not yet been quantified.
The limited studies regarding the influence of aerosol on precipitation time showed controversial findings in China. Yang et al. (2017) found that aerosols show no influence on precipitation time in the Beijing–Tianjin–Hebei region using WRF-Chem model simulations, while Zhou et al. (2020) reported that aerosols advance the heavy precipitation start and peak times significantly and prolong the duration of the precipitation in the Beijing–Tianjin–Hebei region. Similar research has been carried out by Guo et al. (2016) and Lee et al. (2016) in the Pearl River Delta (PRD) region. Guo et al. (2016) found that the aerosol can delay heavy precipitation, which was further confirmed by model simulations (Lee et al., 2016). Guo et al. (2016) and Lee et al. (2016) found that the aerosol radiative effect is dominant at the initial stage of convection, and the microphysical effect is dominant at the development stage, and the interaction of radiative and microphysical effects eventually delays precipitation.
The controversial findings from limited previous studies raise a serious question: why do the aerosols show different impacts on the start and peak times of precipitation over different regions? To answer this question, this study investigates the impacts of aerosols on the start and peak times of precipitation over three different regions of the North China Plain (NCP), Yangtze River Delta (YRD), and PRD by using data from the same source with the same analysis method. With the support of high-precision data, this study tries to quantify the impacts of aerosols on precipitation time. The responses of convective and stratiform precipitation to aerosols are also investigated based on the precipitation types. Moreover, the changes of aerosol impacts on precipitation time with meteorological conditions that can affect precipitation have also been investigated, including the relative humidity, low troposphere stability (LTS), and vertical wind shear (WS), which are essential to aerosol–cloud–precipitation interactions (Boucher and Quaas, 2012; Fan et al., 2009; Klein, 1997; Slingo, 1987; Zhou et al., 2020).
The paper is organised as follows. Section 2 describes the data and methods used in this study. Section 3 shows the analysis and results. The summary and discussion are provided in Sect. 4.
2.1 Region of interest
Three study regions of the NCP, YRD, and PRD have been selected in this study, where the concentration and types of aerosols are different. The PM2.5 mass concentration decreases gradually from north to south in China. The mixed-absorbing aerosols are dominant in the NCP, which can absorb solar radiation strongly and then heat the atmosphere, followed by urban and industrial aerosols (He et al., 2020). The dominant aerosols in the YRD are urban, industrial, and mixed absorbing aerosols (Che et al., 2018; Li et al., 2018; He et al., 2020). The main aerosol types in the PRD are urban and industrial aerosols (He et al., 2020). It is worth noting that the absorbing aerosols increase in the North China Plain and Yangtze River Delta in June and August due to biomass burning (Che et al., 2018).
Figure 1 shows the study regions with surface altitude (m) information from a digital elevation model (DEM), along with the location of PM2.5 ground site stations. Due to the topographic rain effect (Jiao and Bi, 2005), this study only selects the area with a DEM less than 100 m as the study region. There are 131, 100, and 70 ground sites in the NCP, YRD, and PRD, respectively. In order to obtain enough precipitation samples and then reduce the statistical error, the selected study period is the summer (June to August) of multiple years from 2015 to 2020.
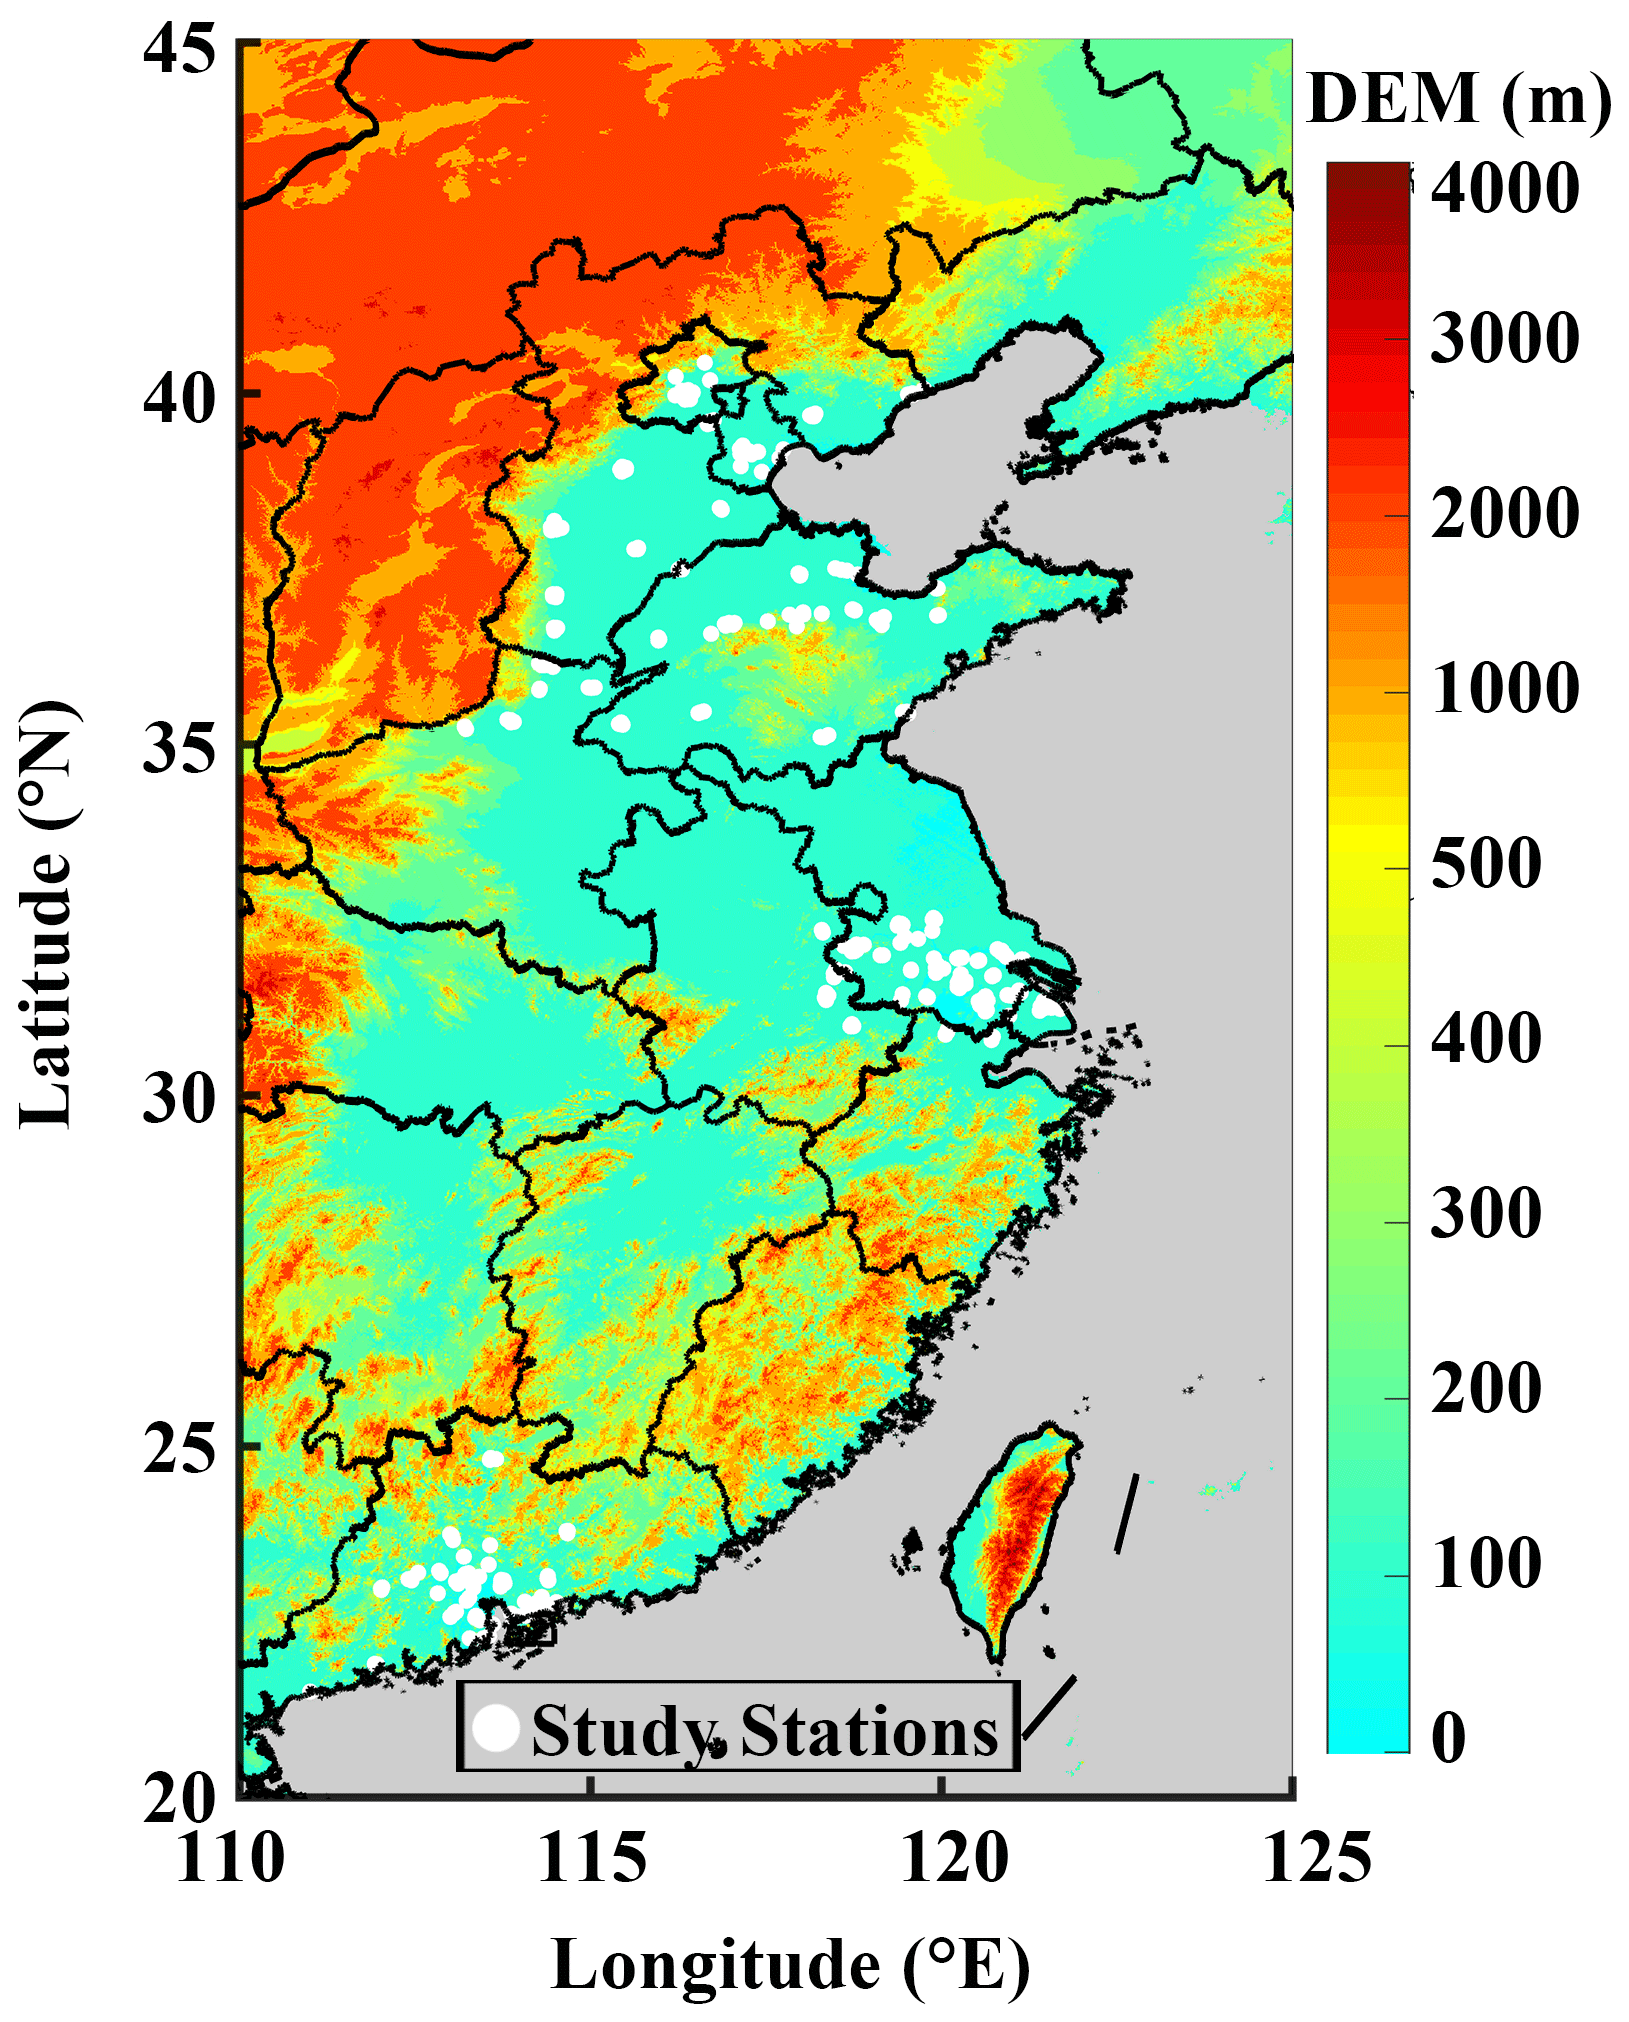
Figure 1The study region with surface altitude (m) information from digital elevation model (DEM). The white dots are the PM2.5 site stations used in this study, and the colour map represents the DEM information.
2.2 Data
The datasets including precipitation, aerosol, and meteorological fields are used in this study, which are described as follows.
2.2.1 Precipitation data from GPM
The Global Precipitation Measurement (GPM) mission can provide global observations of rain and snow. Compared to the Tropical Rainfall Measuring Mission (TRMM), the GPM extends capability to measure light rain (<0.5 mm h−1), solid precipitation, and the microphysical properties of precipitating particles, in addition to the ability to observe heavy to moderate precipitation. The observation devices are the first space-borne Ku-/Ka-band Dual-frequency Precipitation Radar (DPR) and a multi-channel GPM Microwave Imager (GMI). The DPR instrument can provide three-dimensional measurements of precipitation structure over 78 and 152 mi (125 and 245 km) swaths. The combination of detection information from the Ka-band precipitation radar (KaPR) and Ku-band precipitation radar (KuPR) can retrieve precipitation particle size distribution and snowfall events effectively, which is beneficial to facilitate the understanding of precipitation nature and structure deeply. The DPR Level-2A product is used in this study.
The DPR Level-2A product with a temporal resolution of 90 min provides precipitation profile data from the ground to 21 875 m at a vertical interval of 125 m vertical intervals, including precipitation position, type, and intensity; the height of freezing level; the height of storm top; and so on. A major role of the DPR Level-2A product in this study is to classify the three types of precipitation, which are convective, stratiform, and other. The method of precipitation type classification for DPR is based on different vertical motion distributions and microphysical mechanisms of different precipitation types. The difference between two frequency (Ku- and Ka-band) observations or so-called measured dual-frequency ratio (DFRm) provides rich information to investigate the microphysical properties of precipitation. The DFRm vertical profile is controlled by the non-Rayleigh scattering effect and the path-integrated attenuation difference (δPIA) between two frequency channels (Le et al., 2010). The DFRm is mainly controlled by non-Rayleigh scattering effect in the ice region. Both non-Rayleigh scattering effects and δPIA play a role in the melting region. The DFRm is dominated by δPIA in the liquid precipitation region. Different precipitation types have different characteristics. As in the case for convective precipitation, mixing of hydrometeors can be present in the melting layer, and in general, density of the mixture is higher than the case of stratiform precipitation (Le and Chandrasekar, 2013). Therefore, the vertical profile of DFRm has different characteristics for stratiform and convective rain according to significant on-Rayleigh scattering part and δPIA part. More details about the precipitation type classification method for DPR can be found in Le et al. (2010) and Le and Chandrasekar (2013). GPM generally performs better for summer, liquid precipitation, and plain area than for winter, solid precipitation, and complex terrain area (Chen et al., 2019; Speirs et al., 2017). This study focuses on the warm season in eastern China, and the precipitation is mostly liquid during the study period, so the DPR Level-2A product is suitable to be used.
2.2.2 Hourly precipitation from China Merged Precipitation Analysis Version 1.0 product
The other precipitation dataset used in this study is the hourly China Merged Precipitation Analysis Version 1.0 product. This product has a spatial resolution of 0.1∘ and a temporal resolution of 1 h in China. The hourly precipitation product can be found at http://nwpc.nmc.cn. The product is developed based on the observation data at 30 000 automatic stations in China and Climate Prediction Morphing Technique (CMORPH) data. This product overcomes the shortcoming of ground stations, which is that it is difficult to provide the change of the spatial distribution of the overall climate due to discontinuous distribution. Simultaneously, this product overcomes the issue of poor accuracy of satellite products. With these merits, this dataset has been successfully applied to many precipitation-related studies (Guo et al., 2016; Sun et al., 2019), which provides us the possibility for examining aerosol impacts on precipitation time in this study.
2.2.3 Aerosol data
This study makes use of the hourly PM2.5 mass concentration provided by the China Environmental Monitoring Station of the national air quality real time release platform with data quality assurance (http://beijingair.sinaapp.com, last access: 2 November 2021) to represent aerosol. Previous studies have used aerosol optical depth (AOD) or PM10 to study the influence of aerosol on precipitation (Guo et al., 2016; Zhao et al., 2018; Zhou et al., 2020). However, AOD could be not suitable for many cases since it represents the column-integrated aerosol amount while precipitation mostly occurs in the troposphere and is more affected by aerosols below cloud bases. In addition, the AOD is not a good proxy for CCN (Chen et al., 2021; Stier, 2016) and is strongly correlated to humidity (Boucher and Quaas, 2012). PM10 might also not be suitable for the study of aerosol impacts on precipitation, particularly in the case of large aerosol particles such as dust exist since PM10 is more representative of large aerosol particle mass while cloud condensation nuclei are more related to the aerosol particle number with sizes larger than 100 nm. Pan et al. (2021) have reported that fine aerosols can serve as the best proxy for CCN compared to AOD and coarse aerosols. Instead, PM2.5 mass concentration is more representative of aerosol particle amount with sizes larger than 100 nm, so that we choose PM2.5 to represent the aerosol amount in this study. Of course, there are few large-particle aerosols in the three selected research areas (Fan et al., 2021b), especially in summer. Also noted is that while the ground-based aerosol observations are not the aerosols at cloud bases, most convective clouds investigated here with precipitation are with cloud bases near the tops of the mixed boundary layer (MBL). Considering that aerosols are generally well mixed within the MBL layer, the ground-based PM2.5 is suitable to represent the aerosol amount below cloud bases in this study.
The diurnal variation in PM2.5 mass concentration is significant in the study regions, especially over the NCP as shown later. This diurnal variation raises a question for the study of aerosol impacts on precipitation: what time should we choose for the aerosol observations that have more clear impacts on precipitation? Figure 2 shows the relationship of PM2.5 mass concentration between the daily mean and the 07:00–12:00 LT mean, the 13:00–18:00 LT mean, the value at 1 h before precipitation, the mean value in 2 h before precipitation, the mean value in 3 h before precipitation, the mean value in 4 h before precipitation, and the mean value in 5 h before precipitation. As shown, the correlation between daily mean PM2.5 mass concentration and 07:00–12:00 LT (13:00–18:00 LT) mean PM2.5 mass concentration is relatively poor (r=0.57–0.73) in the three study regions. The correlation coefficients between the daily mean PM2.5 mass concentration and PM2.5 mass concentration averaged 1, 2, 3, 4, and 5 h before precipitation are worse than that between daily mean PM2.5 mass concentration and 07:00–12:00 LT (13:00–18:00 LT) mean PM2.5 mass concentration, suggesting that it is not suitable to use PM2.5 mass concentration at a given moment to examine the influence of aerosol on precipitation. Taking into account that the aerosol effect needs time to accumulate, this study selects the 4 h mean PM2.5 mass concentration before precipitation to investigate the impact of aerosols on precipitation.
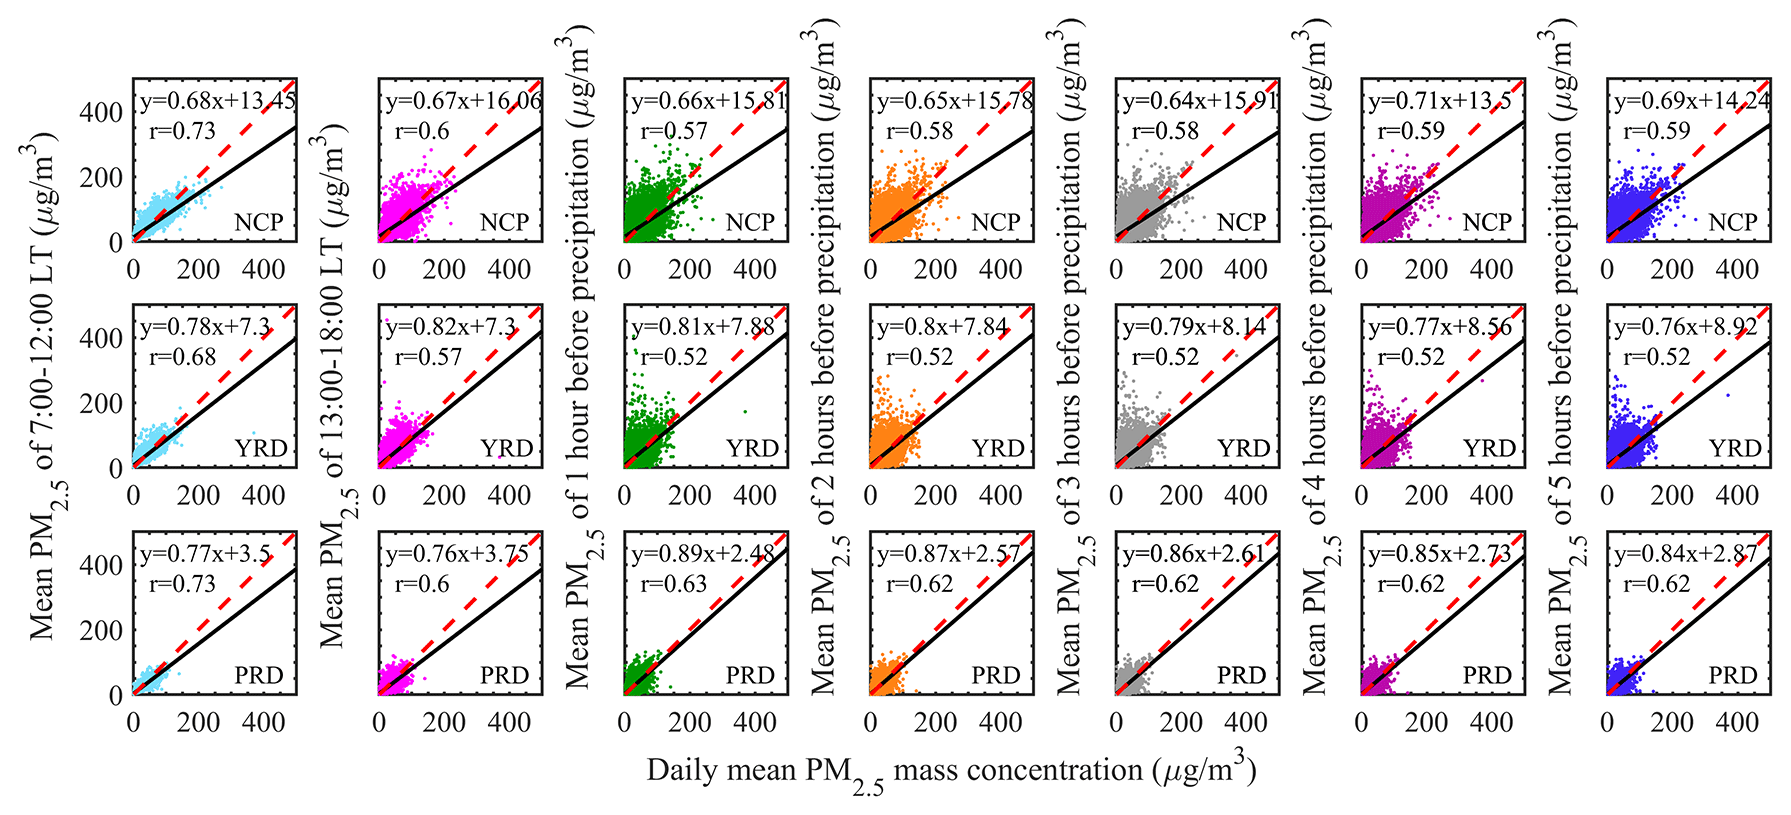
Figure 2The relationships between the daily mean PM2.5 mass concentration (µg m−3) and the mean PM2.5 mass concentration of 07:00–12:00 LT (azure, the first column), 13:00–18:00 LT (roseo, the second column), 1 h before precipitation (green, the third column), 2 h before precipitation (orange, the fourth column), 3 h before precipitation (grey, the fifth column), 4 h before precipitation (purple, the sixth column), and 5 h before precipitation (blue, the seventh column) in June–August from 2015 to 2020 over the North China Plain (NCP, the first row), Yangtze River Delta (YRD, the second row), and Pearl River Delta (PRD, the third row).
2.2.4 ERA5
As indicated earlier, three essential meteorological variables will be investigated in this study, which are the relative humidity, low troposphere stability, and vertical wind shear. Relative humidity can affect both precipitation process and AOD. And the cloud occurrence is closely related to water vapour; for example clear skies were more likely than cloudy skies for relative humidities below 65 % (Boucher and Quaas, 2012; Klein, 1997; Slingo, 1980, 1987; Zhou et al., 2020). The low troposphere stability (LTS) can signify the strength of the inversion that caps the planetary boundary layer, which is correlated with cloud amount (Klein, 1997; Wood and Bretherton, 2006). High LTS generally means a relatively stable atmospheric stratification, and low LTS means unstable atmospheric column, which is more favourable for the development of convection (Guo et al., 2016; Klein, 1997; Slingo, 1987). Wind shear implies mechanical turbulence, which can influence detrainment and evaporation of cloud hydrometeors and then affects the aerosol effect on precipitation (Fan et al., 2009; Slingo, 1987; Tao et al., 2007). Fan et al. (2009) found that the vertical wind shear plays a dominant role in regulating aerosol effects on isolated deep convective clouds, which determines whether aerosols suppress or enhance convection.
The meteorological datasets including the three key variables shown above are from ERA5 in this study, which is the fifth-generation ECMWF (European Centre for Medium-Range Weather Forecasts, ECMWF) reanalysis data (https://cds.climate.copernicus.eu/, last access: 2 November 2021). ERA5 is better than ERA-Interim in temporal–spatial resolutions of 1 h and , respectively, and have been used by thousands of studies (e.g. Fan et al., 2021a; Hoffmann et al., 2019; Urraca et al., 2018; Yang et al., 2021). The ERA5 hourly data at pressure levels are used in this study, including temperature (at 1000, 975, 950, 925, 900, 875, and 850 hPa), relative humidity (at 850 hPa), vertical velocity (at 1000, 975, 950, 925, 900, 875, and 850 hPa), and wind (at 850 and 500 hPa) on different pressure levels.
2.3 Methods
The hourly precipitation product is shown in grid pattern, but the PM2.5 mass concentration dataset is from site observation. Therefore, the matching between precipitation information and PM2.5 mass concentration is not point to point. However, the representative area of PM2.5 site observation is between 0.25 and 16.25 km2 (Shi et al., 2018), and the representative area is even larger in clean and plain areas, so the vague matching described as follows should be reasonable. Assuming the location of the PM2.5 site is a given point called A, and point A is in a certain grid of hourly precipitation product that is called B, the PM2.5 mass concentration at A can then be used to represent the pollution condition at B. In order to know the precipitation type at B, we find the nearest location according to the latitude and longitude provided by GPM. The ERA5 dataset is also shown in grid pattern, and we use the same method described above to match the hourly precipitation product and the ERA5 dataset.
The main method used in this study is cluster analysis. We divide all study samples into three groups based on the PM2.5 mass concentration and defined two of them as polluted and clean conditions to further investigate the aerosol impacts on precipitation. The detailed method is as follows. First, we sort all observations of PM2.5 by removing the abnormal values that are over 2 times the standard deviation to get the good-quality data group C. Second, we rank the PM2.5 mass concentration observations from high to low and define the top one-third of group C as polluted conditions and the bottom one-third of group C as clean conditions. A similar classification method has been applied to other variables when defining their high and low value conditions, such as meteorological conditions including the low troposphere stability (LTS), vertical wind shear between 1500 and 5500 m (WS), and relative humidity (RH). The LTS (unit of kelvin) used here is the difference of potential temperature at 700 and 1000 hPa (Slingo, 1987; Wood and Bretherton, 2006). The relative humidity (unit: %) at 850 hPa is used to represent the moisture below the cloud base in this study (Klein, 1997; Zhou et al., 2020). The wind shear (s−1) can be calculated as (Guo et al., 2016)
where u5.5 and u1.5 are horizontal wind speed at 5500 m and 1500 m, respectively, and v5.5 and v1.5 are vertical wind speed at 5500 m and 1500 m, respectively. The wind speed at 1500 (5500) m can be converted to wind speed at 500 (850) hPa by the barometric height formula.
3.1 Characteristics of PM2.5 and precipitation
Figure 3 shows the diurnal variation in PM2.5 mass concentration. As shown, the diurnal variation in PM2.5 mass concentration is strong in NCP and weak in YRD and PRD, which further confirms that the too long time average of PM2.5 mass concentration cannot reliably represent the aerosol amount that influences the precipitation during a relatively short term. The diurnal variation patterns of PM2.5 are similar in the NCP, YRD, and PRD, with low values in the afternoon and high values at night, along with high PM2.5 mass concentration values in rush hours. The diurnal variation in PM2.5 is most likely related to the diurnal variation in boundary layer height (BLH). The high BLH is conducive to the diffusion of pollutants in the afternoon, while the low BLH is not conducive to the diffusion at night. Moreover, the PM2.5 mass concentration is also high around 12:00 LT in the PRD, which is most likely caused by the secondary formation by strong solar radiation.
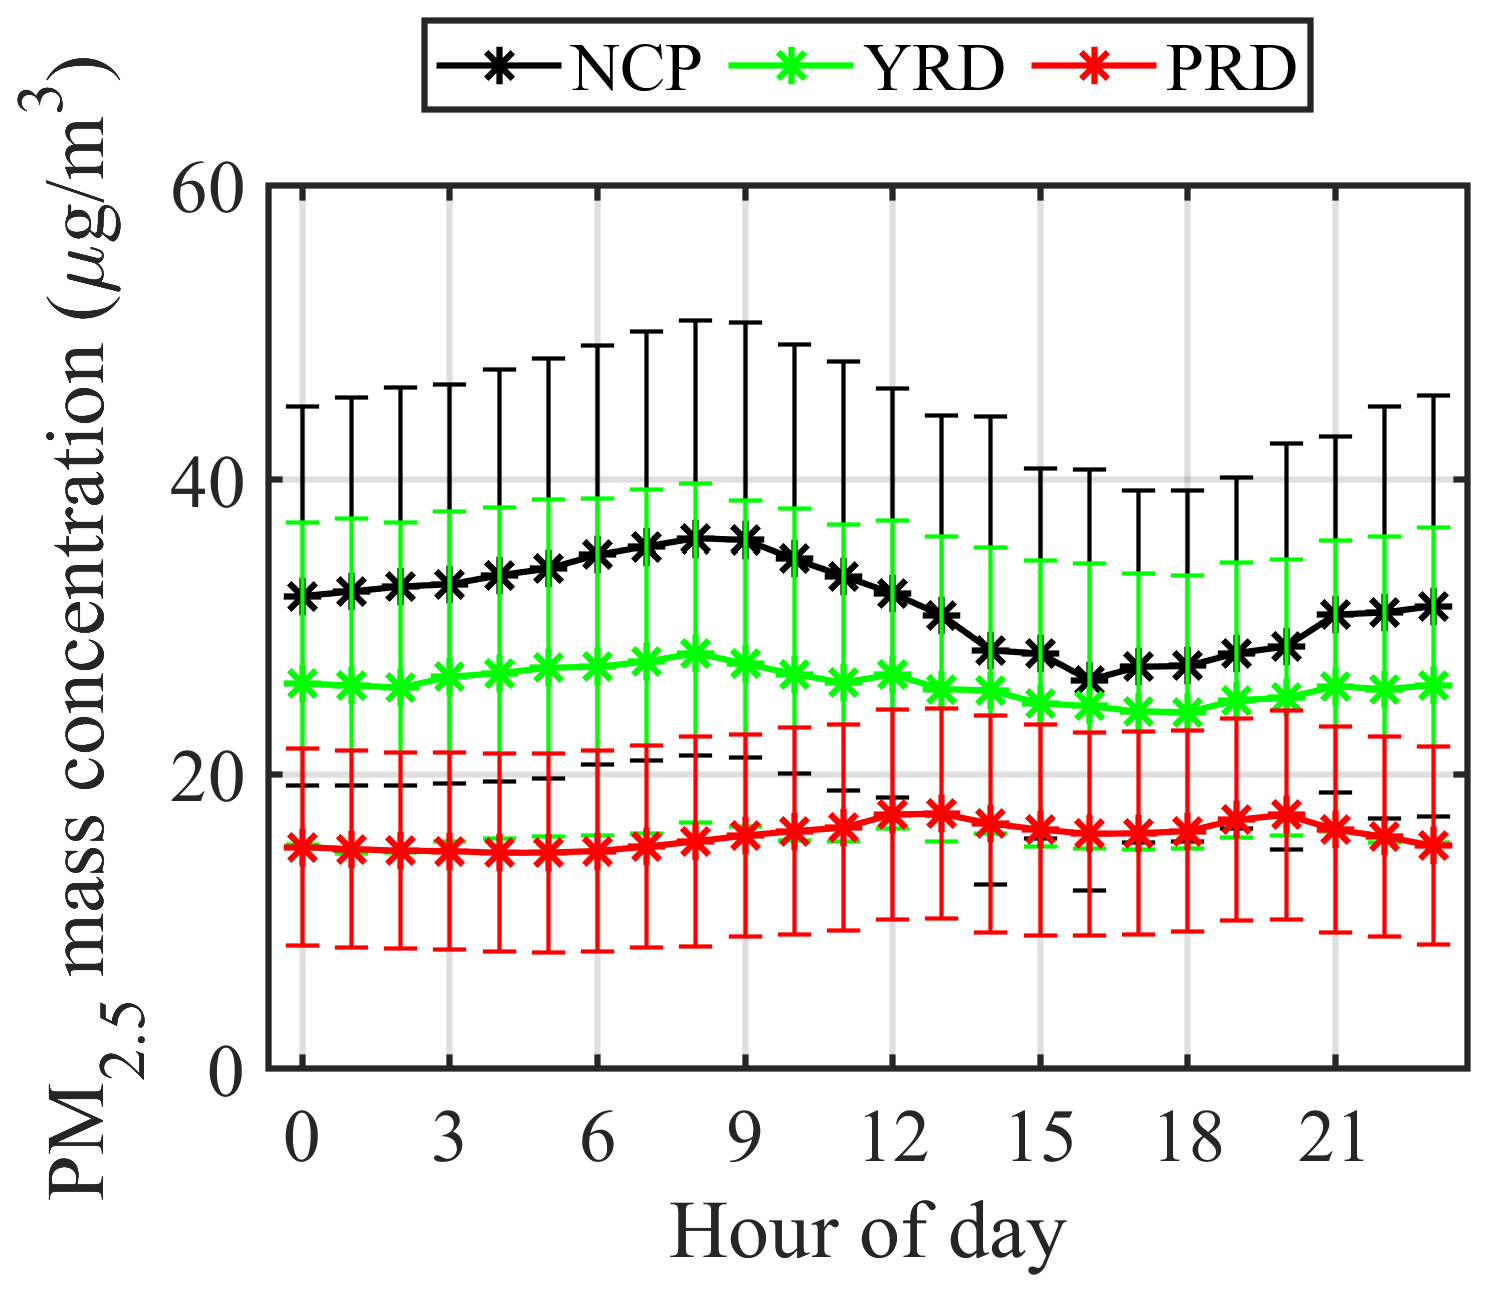
Figure 3The diurnal variation in PM2.5 mass concentration (µg m−3) during the period of June–August from 2015 to 2020 in the North China Plain (NCP; black), Yangtze River Delta (YRD; green), and Pearl River Delta (PRD, red). The dotted lines are for average values, and the vertical bars are for standard deviations of PM2.5 mass concentration at each hour.
This study focuses on the start and peak times of the precipitation event. We define the precipitation event as a continuous precipitation, that is, no precipitation before and after this precipitation for at least 1 h. During a precipitation event, the time that precipitation appears is called the start time, and the time that precipitation intensity is the highest is called the peak time. Figure 4 shows the statistical probability density function (PDF) of precipitation start and peak times. There are more than 800 samples at any given hour in the study regions, making the results statistically convincing. As shown in Fig. 4, the precipitation events are more frequent at 14:00–16:00 LT but less frequent at 06:00–8:00 LT, which correspond to the time of strong and weak solar radiation, respectively. In general, the cloud droplets occur when the atmosphere gets saturated and the droplets can further become precipitation particles through the processes of condensational growth, collision–coalescence, and so on. Strong solar radiation can increase the atmospheric instability by heating the ground surface, further enhancing the convection and promoting the formation of precipitation. In the following analysis, we set the continuous periods that are over the red dotted line as the periods with the most frequent occurrence of precipitation (simply called the frequent period), and we set the periods that are below the red dotted line as the infrequent period. There are subtle differences in the frequent periods of the start time (Fig. 4a, b, c) and peak time (Fig. 4d, e, f) of precipitation over the same region. Note that we use Frequent (Infrequent) Period (S) and Frequent (Infrequent) period (P) to denote the Frequent (Infrequent) Periods of start time and peak time, respectively.
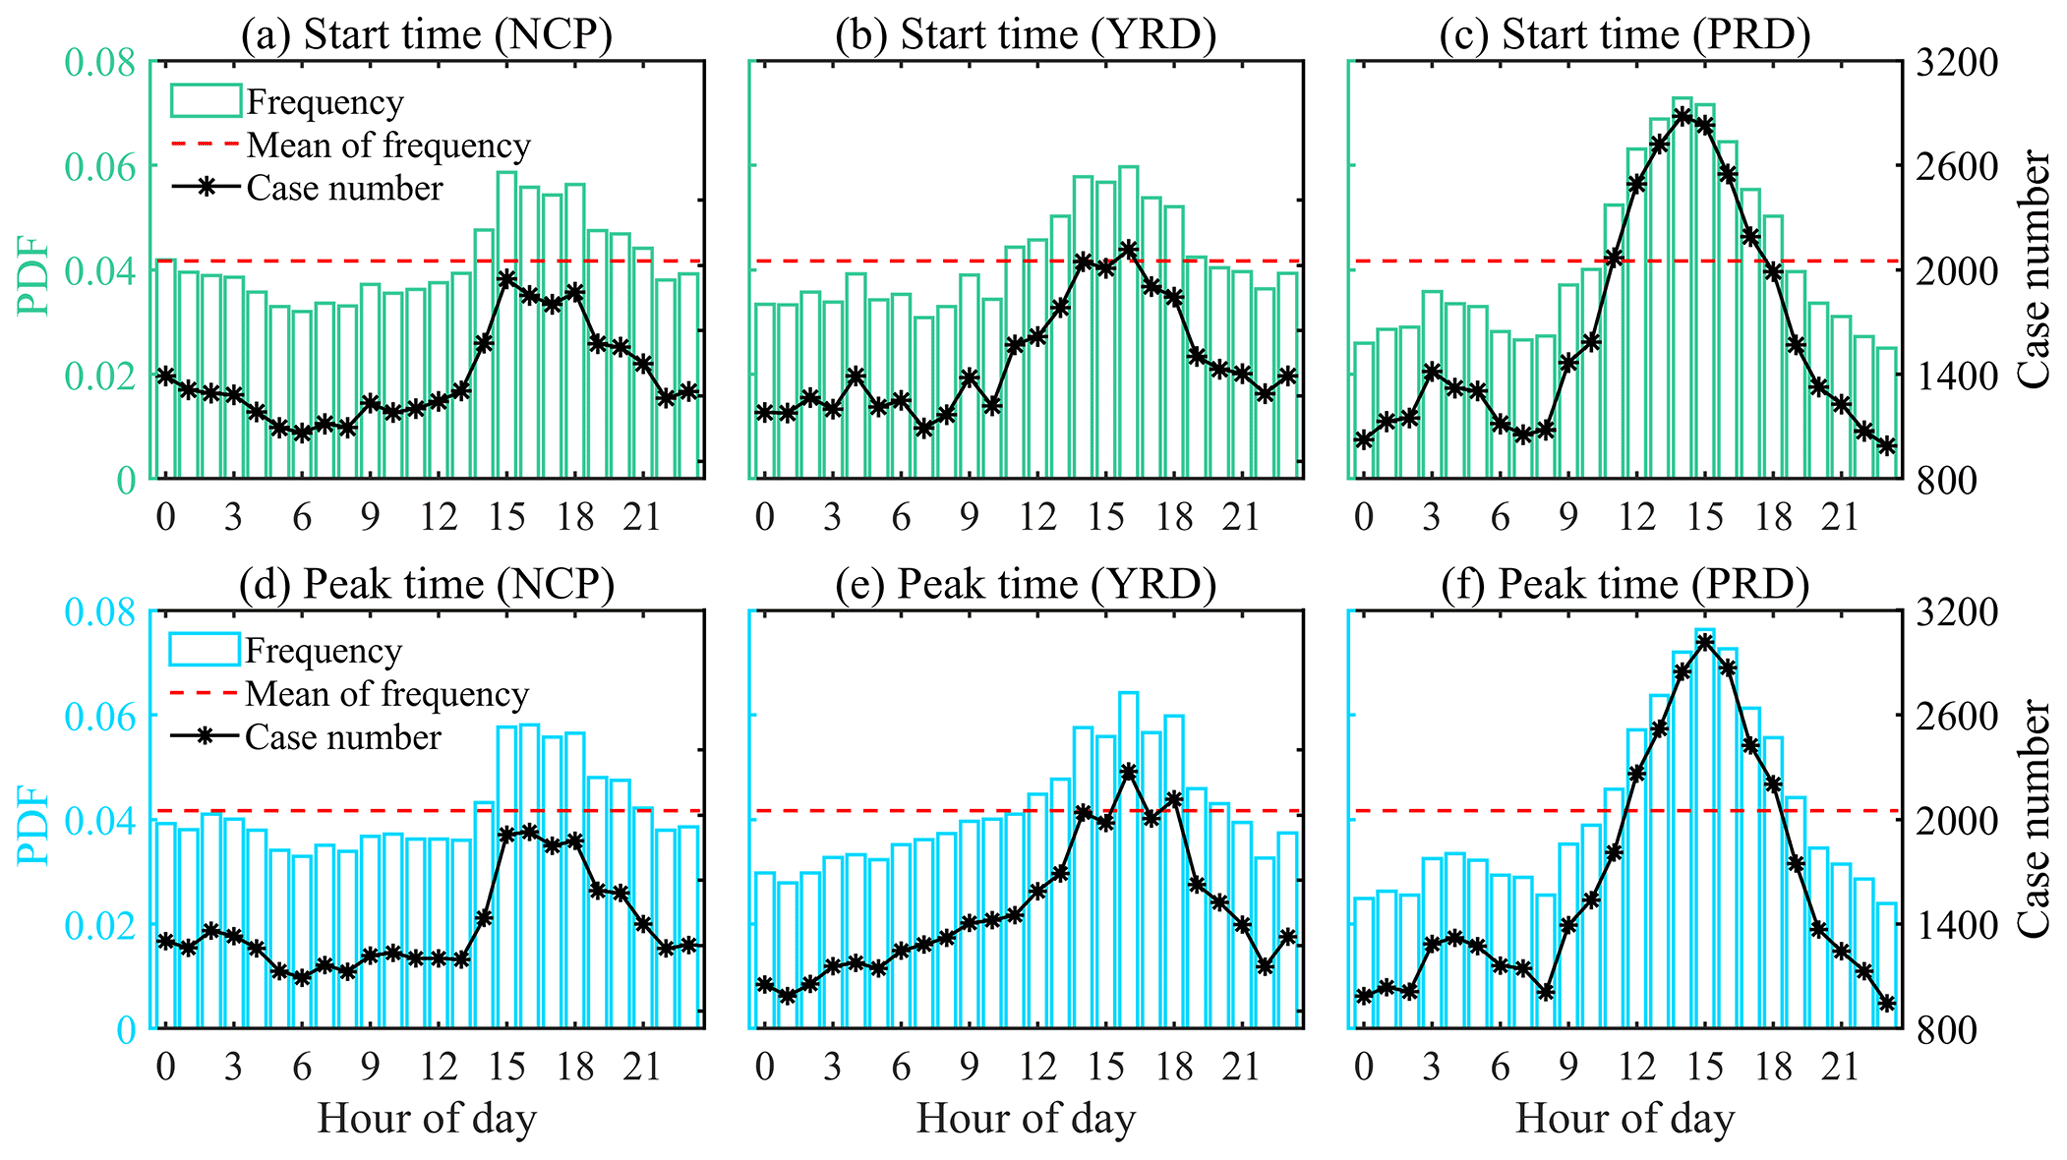
Figure 4The probability density functions (PDFs) of the start time (a–c, green) of precipitation and the peak time (d–f, blue) of precipitation in June–August from 2015 to 2020 over the three study regions. The NCP, YRD, and PRD represent the North China Plain, Yangtze River Delta, and Pearl River Delta, respectively. The black line represents the sample number of precipitation events at the corresponding time, and the red dotted line is the average daily precipitation frequency.
As shown in Fig. 4a–c the frequent periods and infrequent periods are significantly different in the three study regions. The frequent period (S) is 14:00–21:00 LT in the NCP, 11:00–19:00 LT in the YRD, and 11:00–18:00 in the PRD. The durations of the frequent period (S) are 8, 9, and 8 h in the NCP, YRD, and PRD, respectively. The initial time of the frequent period (S) in the NCP is 3 h later than that in the YRD and PRD, likely suggesting that the solar radiation takes longer to strengthen convection in the NCP than in the YRD and PRD. In contrast, the frequent periods (S) turn into infrequent periods (S) soon after sunset in the YRD and PRD, while the frequent period (S) remains 3 h after sunset in the NCP. This makes the initial time of the frequent period (S) different but the durations similar in the three study regions. It is curious why the frequent period (S) can remain 3 h after sunset in the NCP and what powers the precipitation or convection during the 3 h. Figure 3 already shows that the PM2.5 mass concentration is the highest in the NCP and the lowest in the PRD. In addition, there is a relatively large proportion of aerosols as absorbing type in the NCP compared to that in the YRD and PRD (Yang et al., 2016). As is known, aerosol can heat the atmosphere and cool the ground by scattering and absorbing solar radiation. Thus, it is most likely that the large quantities of aerosol particles in the NCP weaken the downward surface shortwave radiation in the morning and make the frequent period (S) delayed. Simultaneously, the large quantities of aerosol particles could release the heat that they absorbed in the low atmosphere to extend the frequent period (S) of precipitation after sunset.
The diurnal variation in peak time of precipitation is similar to that of the start time, also with more frequent occurrence in the afternoon and less frequent occurrence in the early morning. As shown in Fig. 4d–f, the frequent periods (P) are 14:00–21:00, 12:00–20:00, and 11:00–19:00 LT in the NCP, YRD, and PRD, respectively, which indicates that the peak time is often 1–2 h later than the start time. In the NCP, although the frequent period (S) and the frequent period (P) are the same, the frequency of precipitation peak time at 14:00 LT is lower than that for the precipitation start time, while the frequency at 15:00–16:00 LT is higher than that for the precipitation start time, which further confirms that the peak time is often 1–2 h later than the start time.
Figure 5 shows the PDFs of the precipitation duration time and the time difference between precipitation peak and start time. As shown, precipitation events within 2 h account for more than 50 % of all precipitation events, and the precipitation events within 4 h account for more than 80 % of all precipitation events. In fact, long-time precipitation events are mostly related to large-scale weather systems, and the impact of aerosol on them is difficult to identify from the complex meteorological factors. Therefore, the precipitation events selected in this study are those with a duration time within 4 h. As shown in Fig. 5d–f, because of the high proportion of short-term precipitation events, the peak time tends to occur shortly after the precipitation start time. More than 90 % of the precipitation peak times occur within 4 h of the precipitation events.
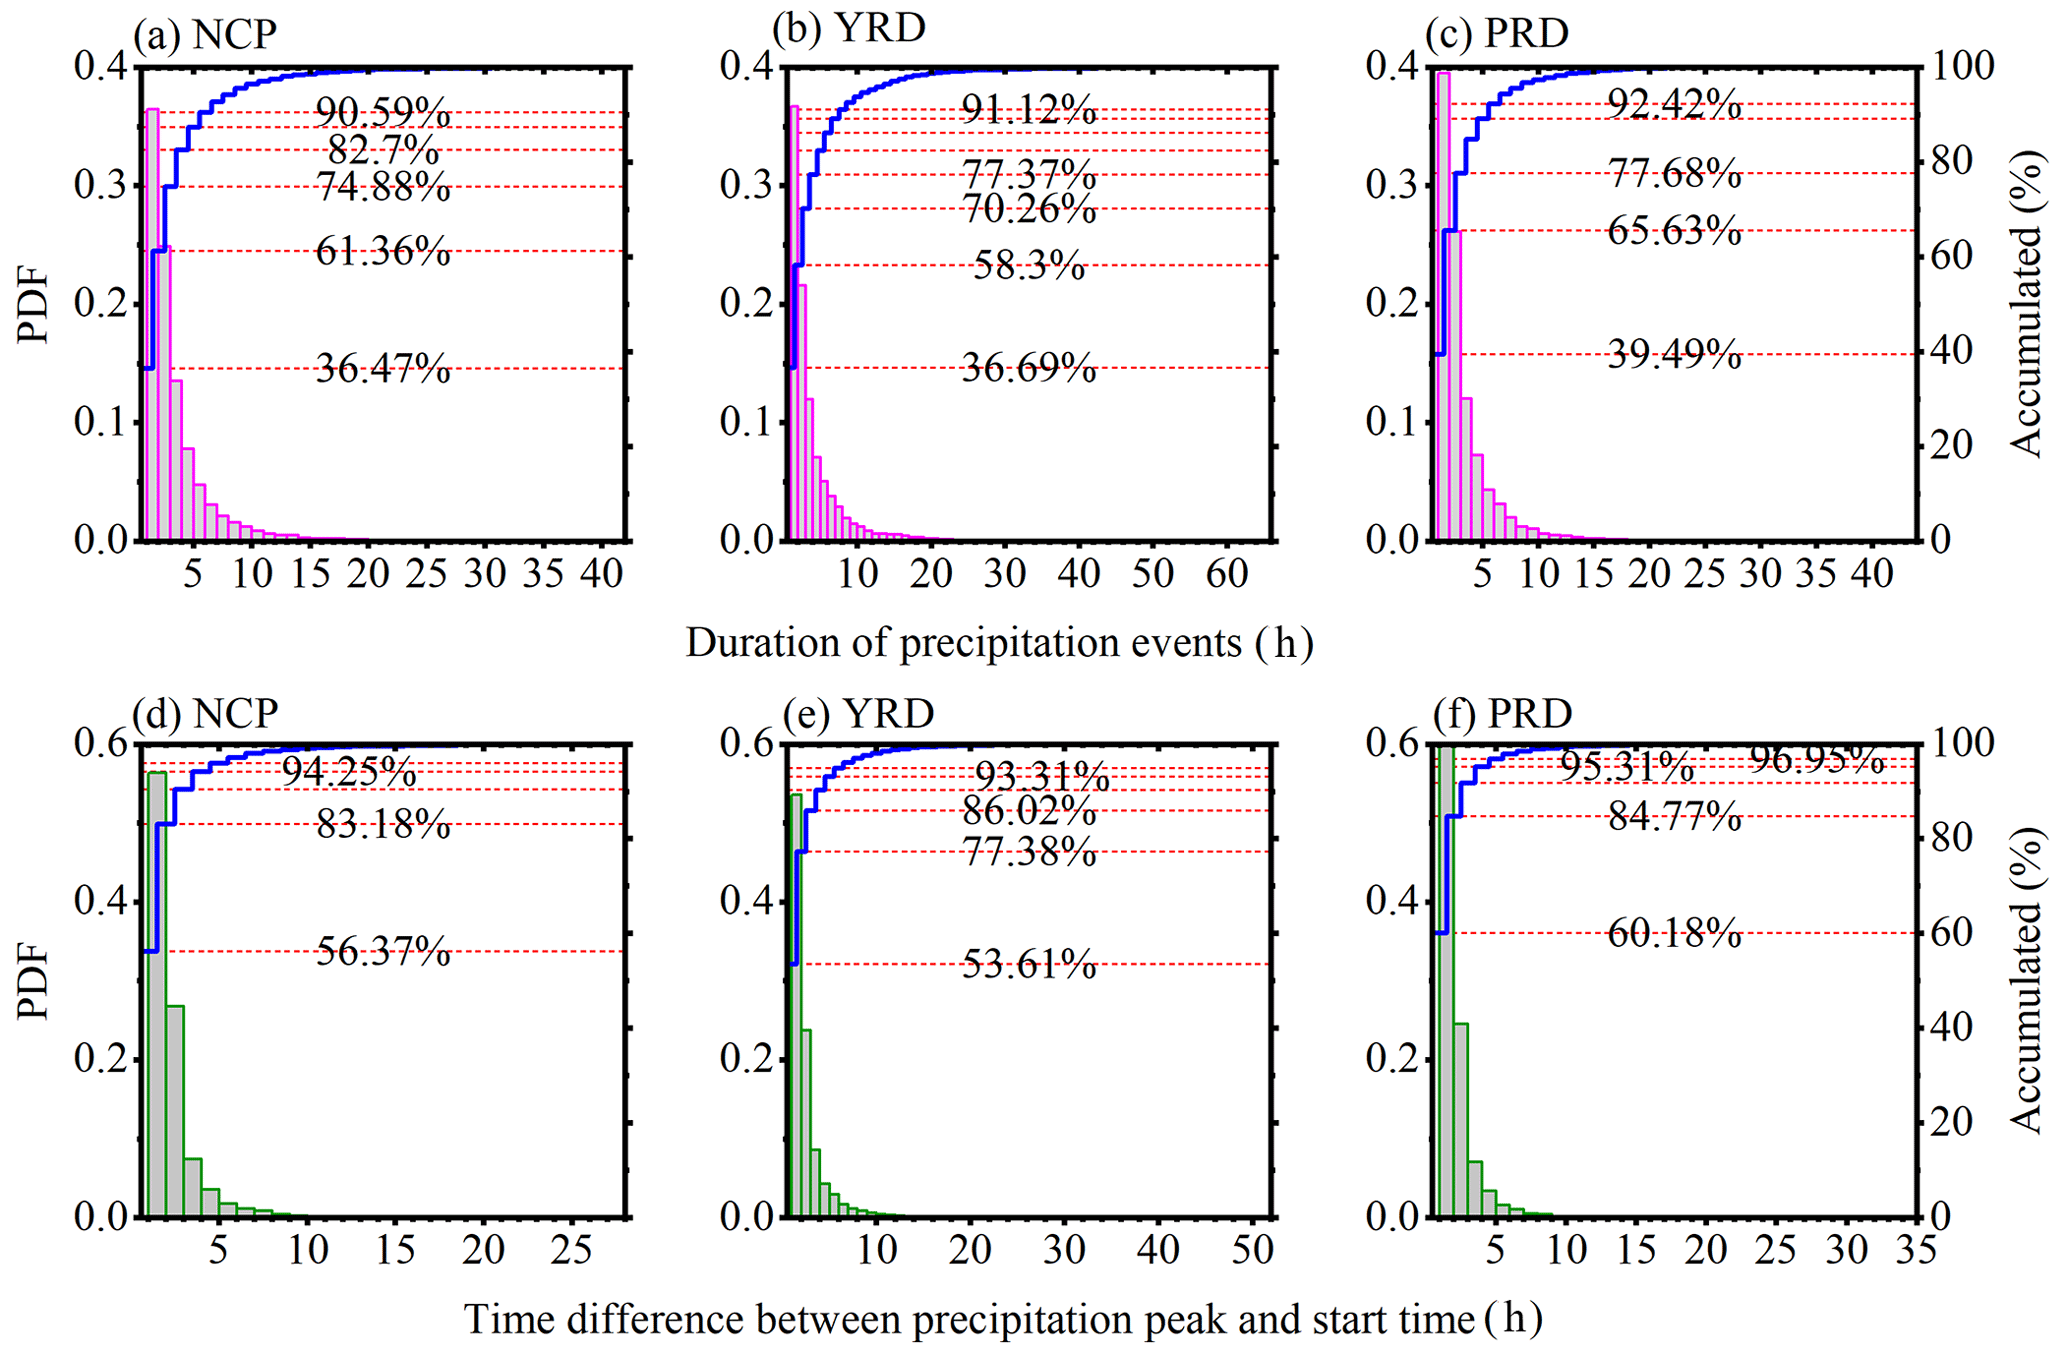
Figure 5The PDFs of duration of precipitation events (a–c) and PDFs of time difference (in hours) between precipitation peak and start time for all precipitation events (d–f) during the study period of June–August from 2015 to 2020 over the three study regions. The NCP, YRD, and PRD represent the North China Plain, Yangtze River Delta, and Pearl River Delta, respectively. Blue solid lines denote accumulated occurrence frequencies of precipitation (ordinate on the right-hand side of each panel). Red dotted lines and numbers show the accumulated occurrence frequencies of precipitation.
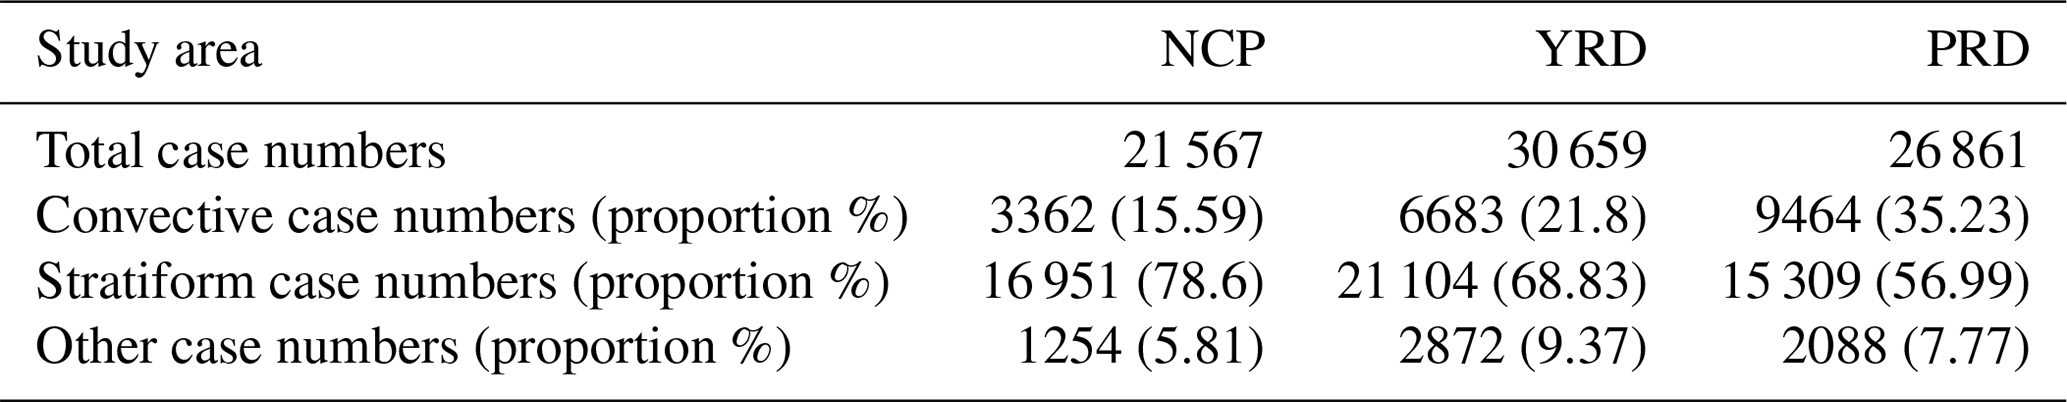
Table 1 shows the sample volume of precipitation events along with the precipitation types obtained from GPM product. There are in total 21 567 matched precipitation events in the NCP, with 78.60 % (16 951 cases) as stratiform precipitation and 15.59 % (3362 cases) as convective precipitation. The number of other precipitation events is small, so this study does not investigate the other precipitation further. The numbers of precipitation events are 30 659 and 26 861 in the YRD and PRD, respectively. The proportions of stratiform precipitation events are higher than 56 % in both the YRD and PRD, and the proportion of convective precipitation is secondary to the stratiform precipitation with values of more than 21 %. As shown in Table 1, the proportions of convective precipitation gradually increase, and the proportions of stratiform precipitation gradually decrease from the NCP to YRD to PRD.
Table 1The number and proportion of different types of precipitation in the three study regions of the North China Plain (NCP), Yangtze River Delta (YRD), and Pearl River Delta (PRD).
3.2 Influence of aerosol on precipitation start (peak) time
We investigate the influence of aerosol on precipitation start and peak times by analysing their frequent period and infrequent period, respectively. Figure 6 shows the PDFs of the start and peak times of precipitation events under polluted and clean conditions. During the frequent period of precipitation in the NCP, the crest of the start time is 15:00 LT under polluted conditions and 18:00 LT under clean conditions, which implies that the start time of precipitation is 3 h advanced by aerosols. In the infrequent period of precipitation start time in the NCP, the influences of aerosol on the start time of precipitation are different between before and after sunrise: the start time is 1–2 h delayed by aerosol after sunrise, while there is no significant delay or advance in start time of precipitation by aerosol before sunrise. The diurnal variations in precipitation start time are similar in pattern between polluted and clean conditions in the YRD, suggesting that aerosols have no significant impact on the precipitation start time over the YRD. In addition, the crest of precipitation start time during the frequent period is about 16:00 LT under both clean and polluted conditions in the YRD. Figure 4 already shows that the crest of precipitation start time is at 14:00 LT in the PRD. Figure 6c further shows that the crest of precipitation start time is at 13:00 LT under clean conditions and at 15:00 LT under polluted conditions in the PRD during the frequent period of precipitation, while there are no obvious differences in the PDFs of precipitation start time between polluted and clean conditions during the infrequent period.
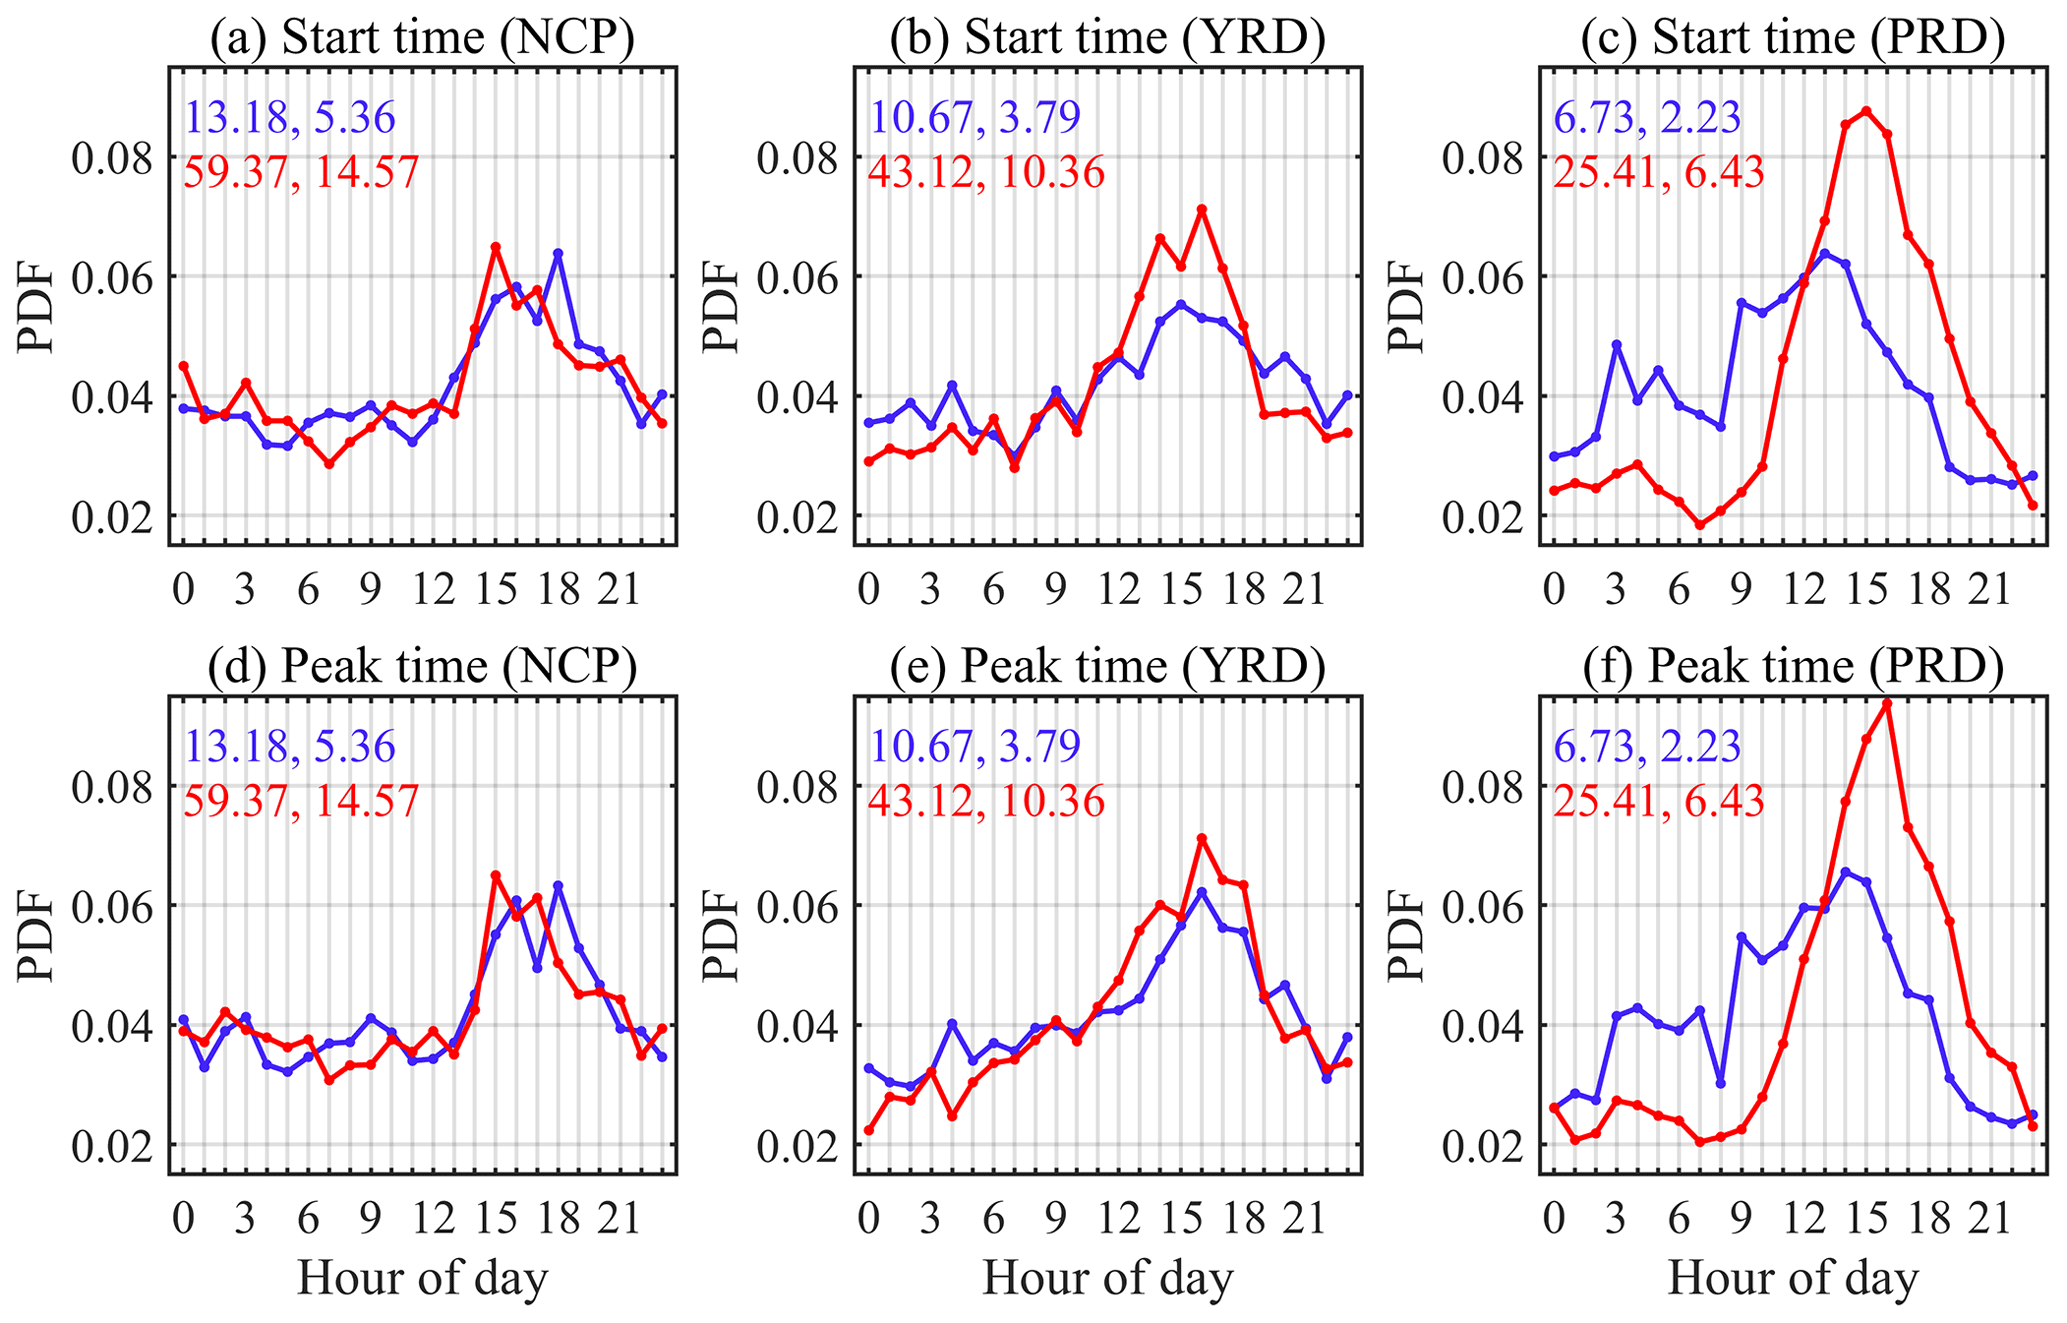
Figure 6Normalised PDFs of precipitation (a–c) start time and (d–f) peak time (LT), represented as ratios of their corresponding precipitation frequency at a given hour to those accumulated over 24 h under clean (blue lines) and polluted (red lines) conditions in June–August from 2015 to 2020 over the NCP, YRD, and PRD, respectively. The blue (red) numbers are the average (the first column) and standard deviation (the second column) of the PM2.5 mass concentration (µg m−3) under clean (polluted) conditions.
The results shown in Fig. 6 clearly suggest that the influences of aerosol on the start time of precipitation are distinct over the three study regions, especially during their frequent period. The aerosol can advance, delay, or show almost no effect on the crest of the start time over the NCP, PRD, and YRD, respectively. Moreover, the aerosols make precipitation more focused in the afternoon and suppress the precipitation at night over all three study regions, which is most obvious over the PRD. The diurnal variations in the precipitation start time are much more different between the polluted and clean conditions in the PRD. During the period 12:00–22:00 LT, the frequency of precipitation under polluted conditions is higher than that under clean conditions, while during the other period a contrary phenomenon is found in the PRD.
We also investigate the influence of aerosol on the precipitation peak time during their frequent period. The diurnal variations and the responses of precipitation peak time to aerosol are similar to that of the precipitation start time. By comparing the diurnal variations in precipitation peak time under polluted and clean conditions, we find that although the aerosols can advance or delay the precipitation time, the diurnal variation pattern has not been changed. Based on the almost fixed patterns, we can quantify the impacts of aerosol on the precipitation start and peak times. As shown earlier, we can investigate the crest of the precipitation start and peak times to quantify the influence of aerosol on the precipitation, but this method is not always suitable. As shown in Fig. 6d, the crests of the peak time are at 15:00 and 18:00 LT under polluted and clean conditions during the frequent period respectively, which suggests that the aerosol has caused the precipitation peak time to advance by 3 h in the NCP. However, by comparing the diurnal variations in precipitation peak time between polluted and clean conditions, the right correspondence should be 15:00–16:00–17:00 LT and 16:00–17:00–18:00 LT under polluted and clean conditions, which suggests that the aerosol has caused the precipitation peak time to be advanced by 1 h not 3 h. Anyway, what we can confirm from Fig. 6d is that the high frequency of the precipitation peak time is at 15:00–17:00 LT under polluted conditions while it is at 16:00–18:00 LT under clean conditions. During the infrequent period over the NCP, there is relatively more precipitation under polluted conditions than under clean conditions before sunrise, while there is relatively less precipitation under polluted conditions after sunrise. Also, the precipitation peak time is delayed (advanced) 1 h over the NCP under polluted conditions after (before) sunrise during the infrequent period of precipitation.
The crests of the precipitation peak time are at 16:00 LT under both polluted and clean conditions over the YRD during the frequent period, which suggests that the aerosols show negligible impact on the precipitation peak time. In contrast, it shows that the precipitation peak time is advanced by 1 h under polluted conditions during the infrequent period over the YRD. The diurnal variations in the precipitation peak time are similar to that of the precipitation start time under both polluted and clean conditions over the PRD. The precipitation peak time over the PRD was delayed 2 h during the frequent period and advanced 1 h during the infrequent period (before sunrise) by aerosols. The responses of precipitation start and peak times to aerosol are similar. Consistent with the fact that the precipitation peak time appears 1–2 h after the precipitation start time as shown in Fig. 5, the crest of the precipitation peak time is also later than that of the precipitation start time as shown in Fig. 6.
The findings above show that the aerosols have distinct impacts on the precipitation start time in the NCP (advanced), YRD (no influence), and PRD (delayed), which may be related to their different aerosol amount and types, precipitation types, or meteorological conditions. Among the three study regions, the most polluted area is the NCP, and the cleanest area is the PRD. Meanwhile, the proportion of the absorbing aerosol is the highest in the NCP and is the lowest in the PRD. Both aerosol concentration and the proportion of the absorbing aerosol in the YRD are between the NCP and PRD. Correspondingly, if the aerosols do have significant impacts on precipitation, the aerosol impacts on precipitation over the YRD should also be between that over the NCP and PRD. The initial time of the frequent period in the NCP (14:00 LT) is later than that in the PRD (11:00 LT), which is most likely due to the high aerosol concentration in the NCP. The high aerosol concentration reduces the solar radiation reaching the ground, making the convection suppressed in the morning in the NCP. However, the high proportion of absorbing aerosol can advance the precipitation start time by strengthening the convection in the afternoon. In contrast, the scattering-dominant aerosol can cool the ground surface and then low atmosphere by scattering solar radiation, which weakens the convection and generally delays the precipitation start time during the frequent period in the PRD. We also find that the aerosol makes the precipitation more frequent at night in the NCP, which is most likely associated with the fact that the aerosol can heat the atmosphere and strengthen convection even after sunset due to the relatively high proportion of absorbing aerosol in the NCP. In addition to aerosols, we also find that the variation in meteorology can play a role in the change of precipitation. For example, the decreasing temperature and increasing humidity both contribute to the growth of cloud droplets and then precipitation at night. After sunrise, the precipitation seems more influenced by solar radiation and aerosols in the NCP. The atmosphere is heated more quickly under clean conditions than under polluted conditions in the morning in the NCP, making the probability of precipitation higher under clean conditions in the morning.
The precipitation is also affected by solar radiation and aerosols after sunrise in the YRD, but the aerosols show no significant influence on the precipitation start time, likely due to weak radiative effect by the relatively low aerosol amount over this study region. Even with weak radiative effect due to relatively low aerosol amount, the aerosol still makes the precipitation more frequent in the afternoon and more infrequent in the morning and at night over the YRD, which likely suggests the significant aerosol microphysical effect on the precipitation. Aerosols, by serving as cloud condensation nuclei, increase the cloud droplet number concentration and decrease cloud droplet sizes, decreasing the stratiform precipitation that occurs more in the morning and invigorating the convective precipitation that occurs more in the afternoon.
To further understand whether the different precipitation types cause distinct responses of precipitation to aerosols, we next investigate the impacts of aerosol on convective and stratiform precipitation using the same method. Note that we ignore some hours in a day at which the sample size is too small (fewer than 10) to be analysed reliably, and we only investigate the impacts of aerosol on convective and stratiform precipitation during the continuous period of precipitation.
Figure 7 shows the PDFs of convective (stratiform) precipitation start time under polluted (red line) and clean (blue line) conditions. Figure 7a–c show that the convective precipitation occurs frequently around 08:00, 12:00–14:00, and 18:00–20:00 LT and infrequently at 15:00–16:00 LT and at night in the NCP. The aerosols advance convective precipitation start time by 1–2 h around 10:00–15:00 LT, while no obvious influence is shown during the periods 00:00–09:00 and 16:00–20:00 LT in the NCP. Consistent with the results presented above, aerosol makes the precipitation more accumulated in the afternoon, particularly on days when the aerosol radiative effect works strongly. The convective precipitation is found frequently at 09:00–15:00 LT in the YRD. The crest of convective precipitation start time is at 12:00 LT under both polluted and clean conditions during the period 08:00–16:00 LT in the YRD, while it is delayed by 1 h by aerosols during the period 13:00–16:00 LT. The continuous period with enough precipitation samples is 07:00–22:00 LT in the PRD. The convective precipitation start time over the PRD shows negligible response to aerosols during the period 07:00–11:00 LT, while it is 1 h delayed during the period 12:00–22:00 LT. As shown in Fig. 7c, the crest and secondary crest of the convective precipitation start time are at 12:00 and 17:00 LT under clean conditions and at 14:00 and 18:00 LT under polluted conditions, which implies that the delaying effect of aerosols on convective precipitation start time becomes weaker with the decreasing solar radiation or convective strength.
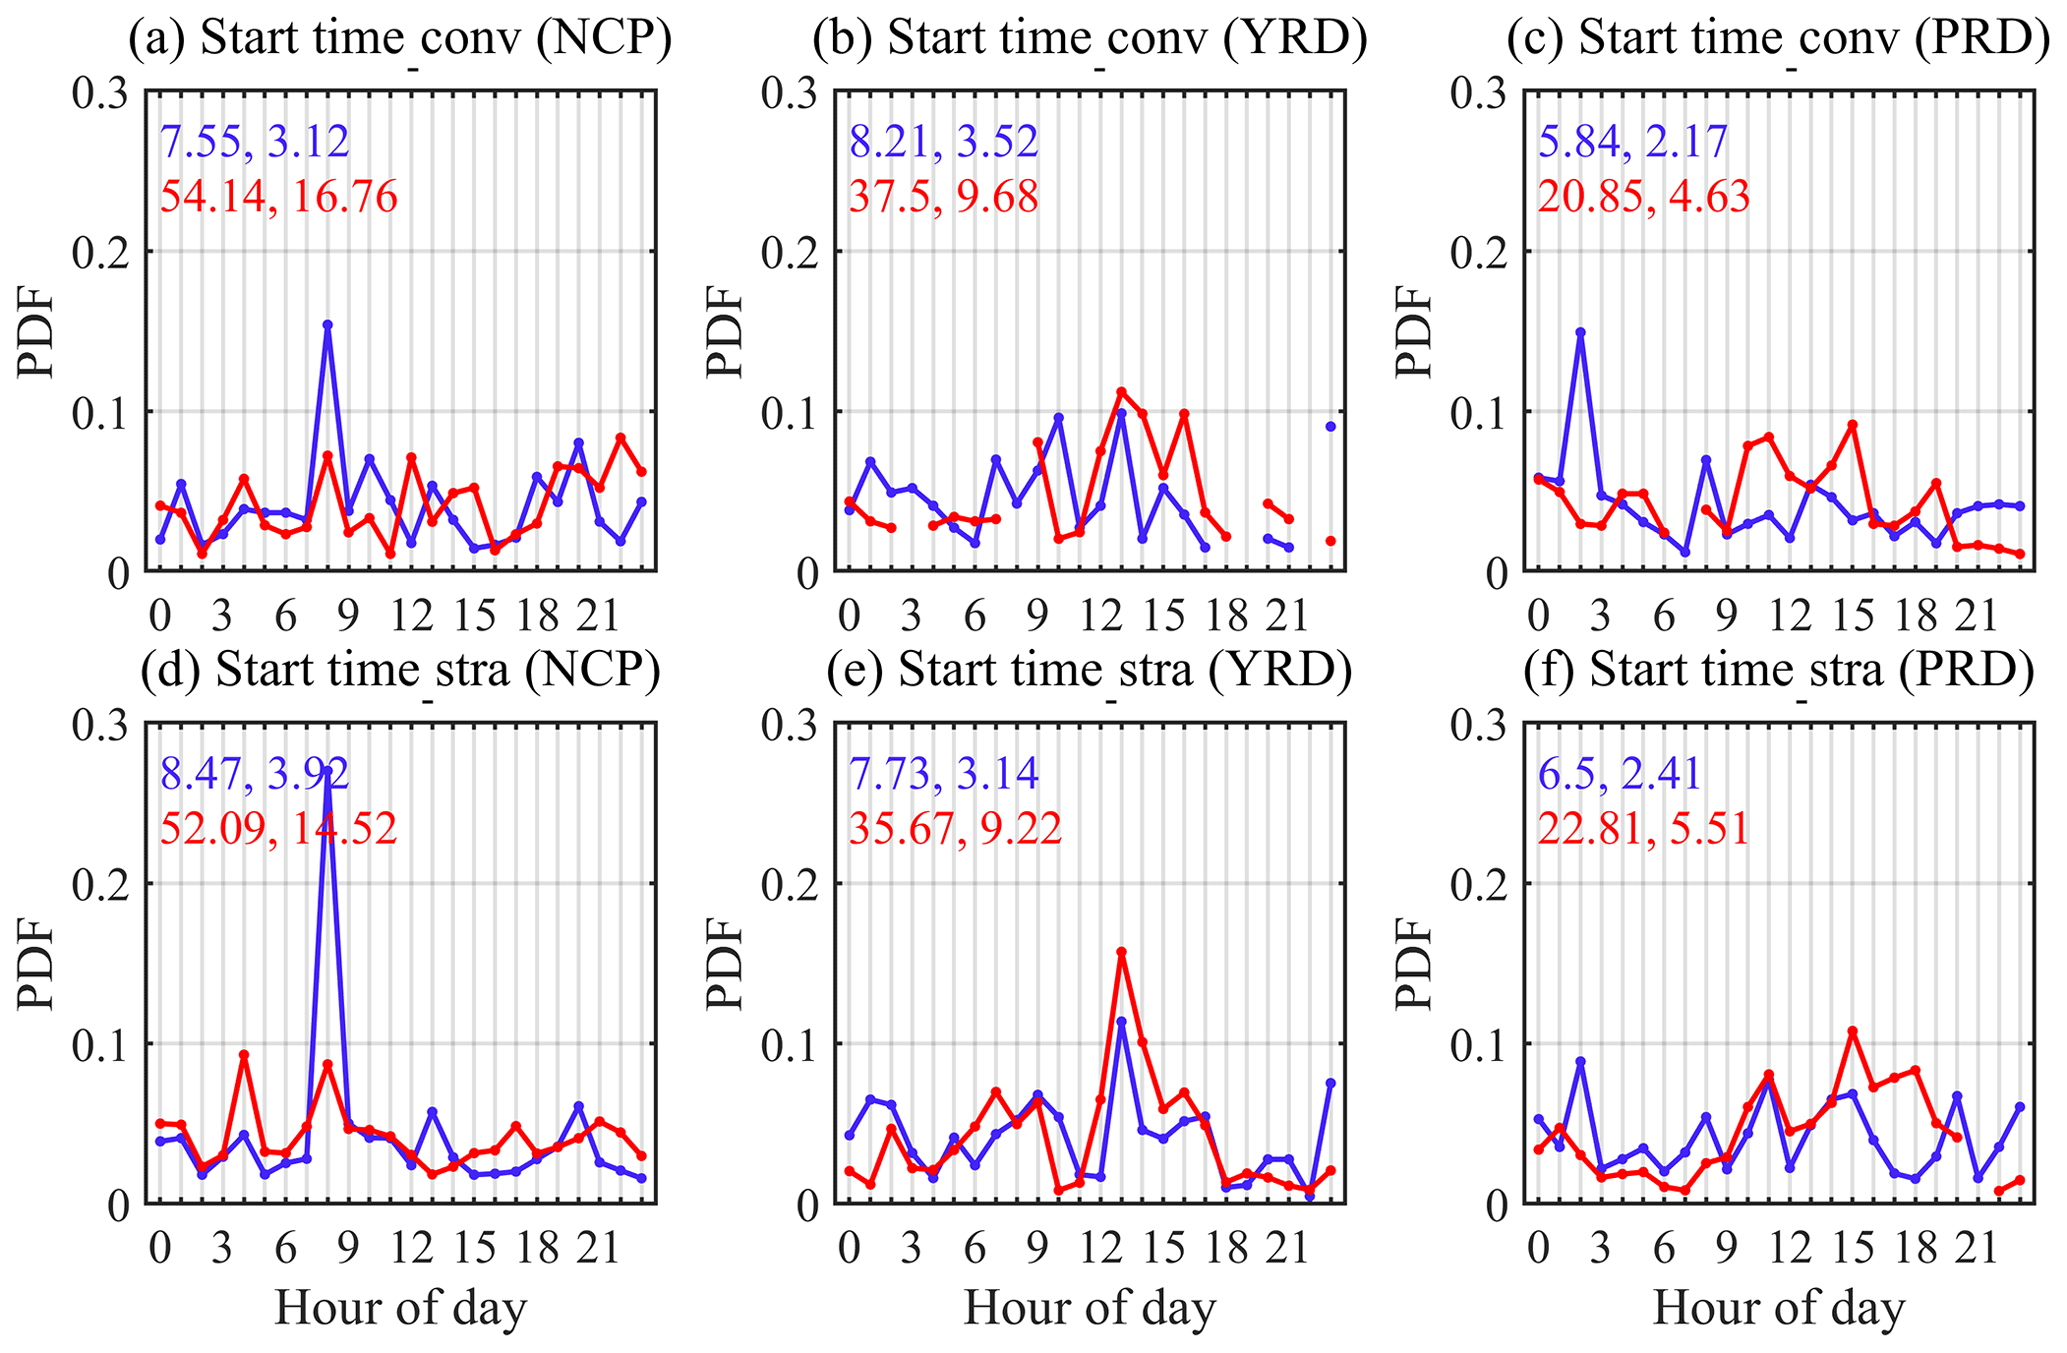
Figure 7Normalised PDFs of (a)–(c) convective precipitation start time and (d)–(f) stratiform precipitation start time (LT), represented as ratios of their corresponding precipitation frequency at a given hour to those accumulated over 24 h under clean (blue lines) and polluted (red lines) conditions in June–August from 2015–2020 over the NCP, YRD, and PRD, respectively. The blue (red) numbers are the average (the first column) and standard deviation (the second column) of the PM2.5 mass concentration (µg m−3) under clean (polluted) conditions.
Figure 7d–f show that the stratiform precipitation occurs frequently at night and around sunrise, with a peak occurrence frequency at about 07:00 LT in the NCP. The aerosol shows no significant influence on the start time of the stratiform precipitation in the NCP. In the YRD, the diurnal variations in the stratiform precipitation start time are similar under polluted and clean conditions, while the occurrence frequencies at a given hour are slightly different, which indicates that the aerosol can only weakly affect the stratiform precipitation start time. In the PRD, more stratiform precipitation occurs in the afternoon under polluted conditions. Moreover, the crests of the stratiform precipitation start time are at 20:00 and 18:00 LT under clean and polluted conditions in the afternoon, respectively, which suggests that the aerosol could advance the stratiform precipitation start time by 2 h in the PRD.
Figure 8 shows the PDFs of the convective and stratiform precipitation peak time under polluted and clean conditions. Note that only the continuous periods with fewer than 10 precipitation events at each given hour are investigated. The continuous periods with convective precipitation are 00:00–16:00 LT and 18:00–22:00 LT in the NCP. As shown in Fig. 8a, the crests of the convective precipitation peak time are at 14:00 LT (polluted condition) and 16:00 LT (clean condition) in the NCP, which suggests that the aerosol could advance the convective precipitation peak time by 2 h during the period 00:00–16:00 LT. However, it is challenging to identify whether the convective precipitation peak time has been changed by aerosols during the period 17:00–22:00 LT because of the discontinuous distribution of convective precipitation in the NCP. The convective precipitation is frequent during the period 10:00–17:00 LT, and aerosols show no significant influence on the convective precipitation peak time in the YRD. For example, the crests of convective precipitation peak time are both at 14:00 LT under clean and polluted conditions during the period 10:00–17:00 LT, one of the continuous periods with sufficient samples of convective precipitation events in the YRD. Figure 8c shows that there is a continuous period of convective precipitation at 00:00–17:00 LT in the PRD, during which the aerosol enhances the convective precipitation gradually. The radiative effect of aerosol generally works significantly during the period 11:00–15:00 LT, which helps advance the convective precipitation peak time by 1 h in the PRD.
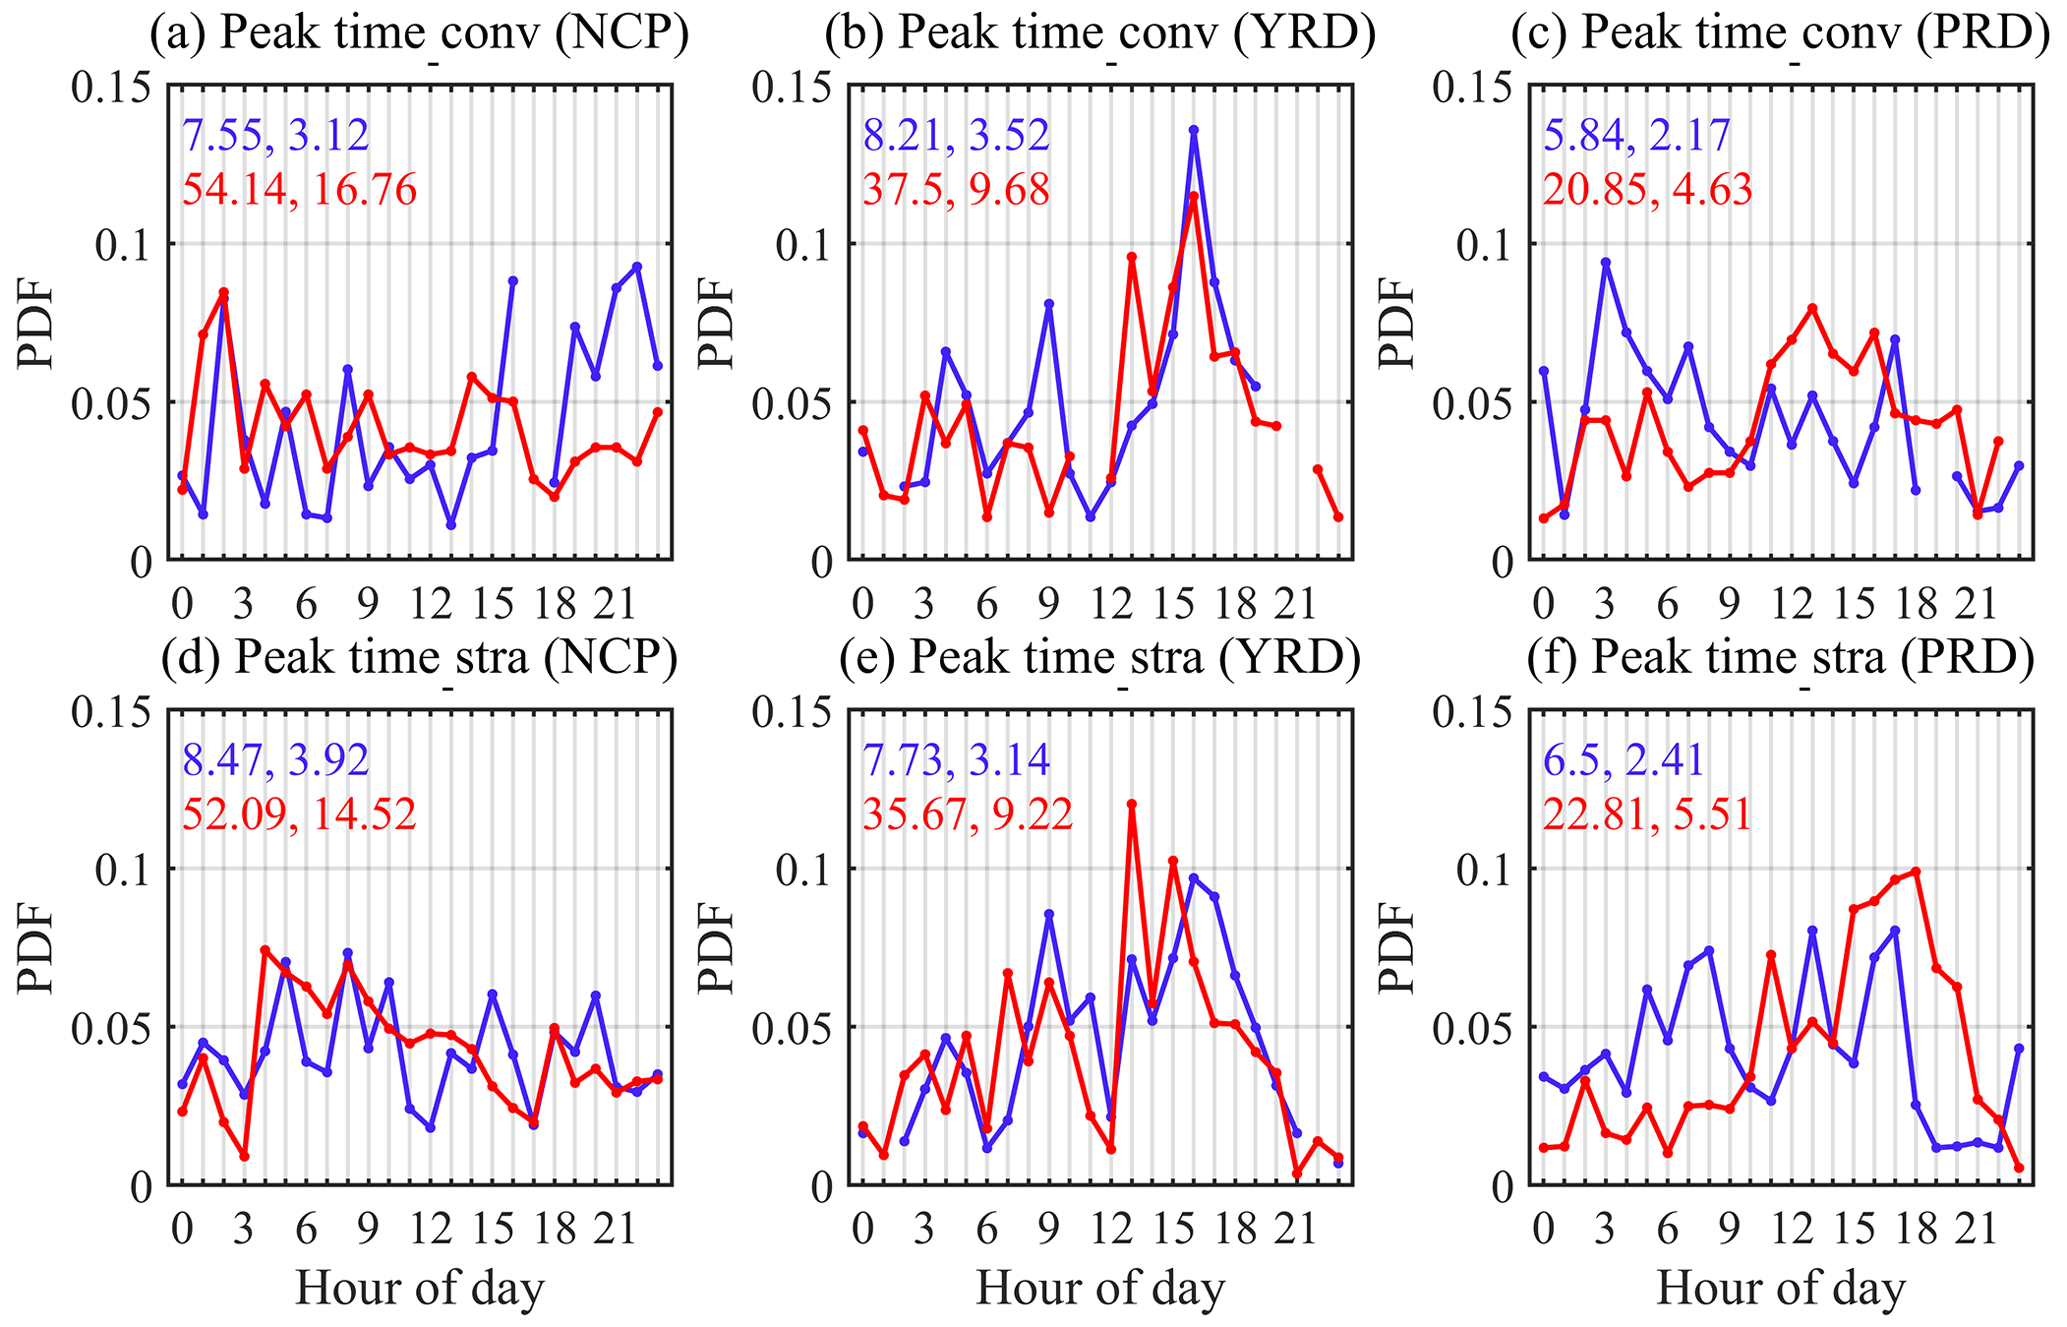
Figure 8Same as Fig. 7, but for (a)–(c) convective precipitation peak time and (d)–(f) stratiform precipitation peak time (LT).
The frequency of the stratiform precipitation of the day fluctuates greatly in the NCP and shows larger values in the early morning and early afternoon over the YRD. The stratiform precipitations are not affected by aerosols clearly over both the NCP and YRD. Over the PRD, the stratiform precipitation is also strengthened gradually by aerosol, while the stratiform precipitation peak time is likely 1 h delayed by aerosols during the period 13:00–21:00 LT. It is clear that the aerosol affects the convective precipitation much more strongly than the stratiform precipitation over the NCP and YRD, while the aerosol shows different impacts on convective and stratiform precipitation over the PRD. Due to the high proportion of the stratiform precipitation over the PRD, the start and peak times of total precipitation events are delayed, as shown in Fig. 6.
The above findings have suggested that the aerosol can affect convection, and we next try to confirm this hypothesis. If the aerosol could affect precipitation and convection, the temperature and vertical velocity would show strong responses to the changes of aerosol over the plain regions. We here investigate how the temperature and vertical velocity change with aerosol concentration and types at different pressure levels. The differences of temperature between polluted and clean conditions are shown in Fig. 9a–c. As shown, the aerosol causes significant changes of atmospheric temperature by radiative effect in the low troposphere (1000–900 hPa). As the altitude increases, the aerosol radiative effect decreases gradually, which results in smaller temperature differences. The strongest influence of aerosol on temperature is shown in the NCP, and the weakest is in the PRD, which is likely related to their difference in aerosol amount. It is also clear that the aerosol heats the atmosphere all day in the NCP.
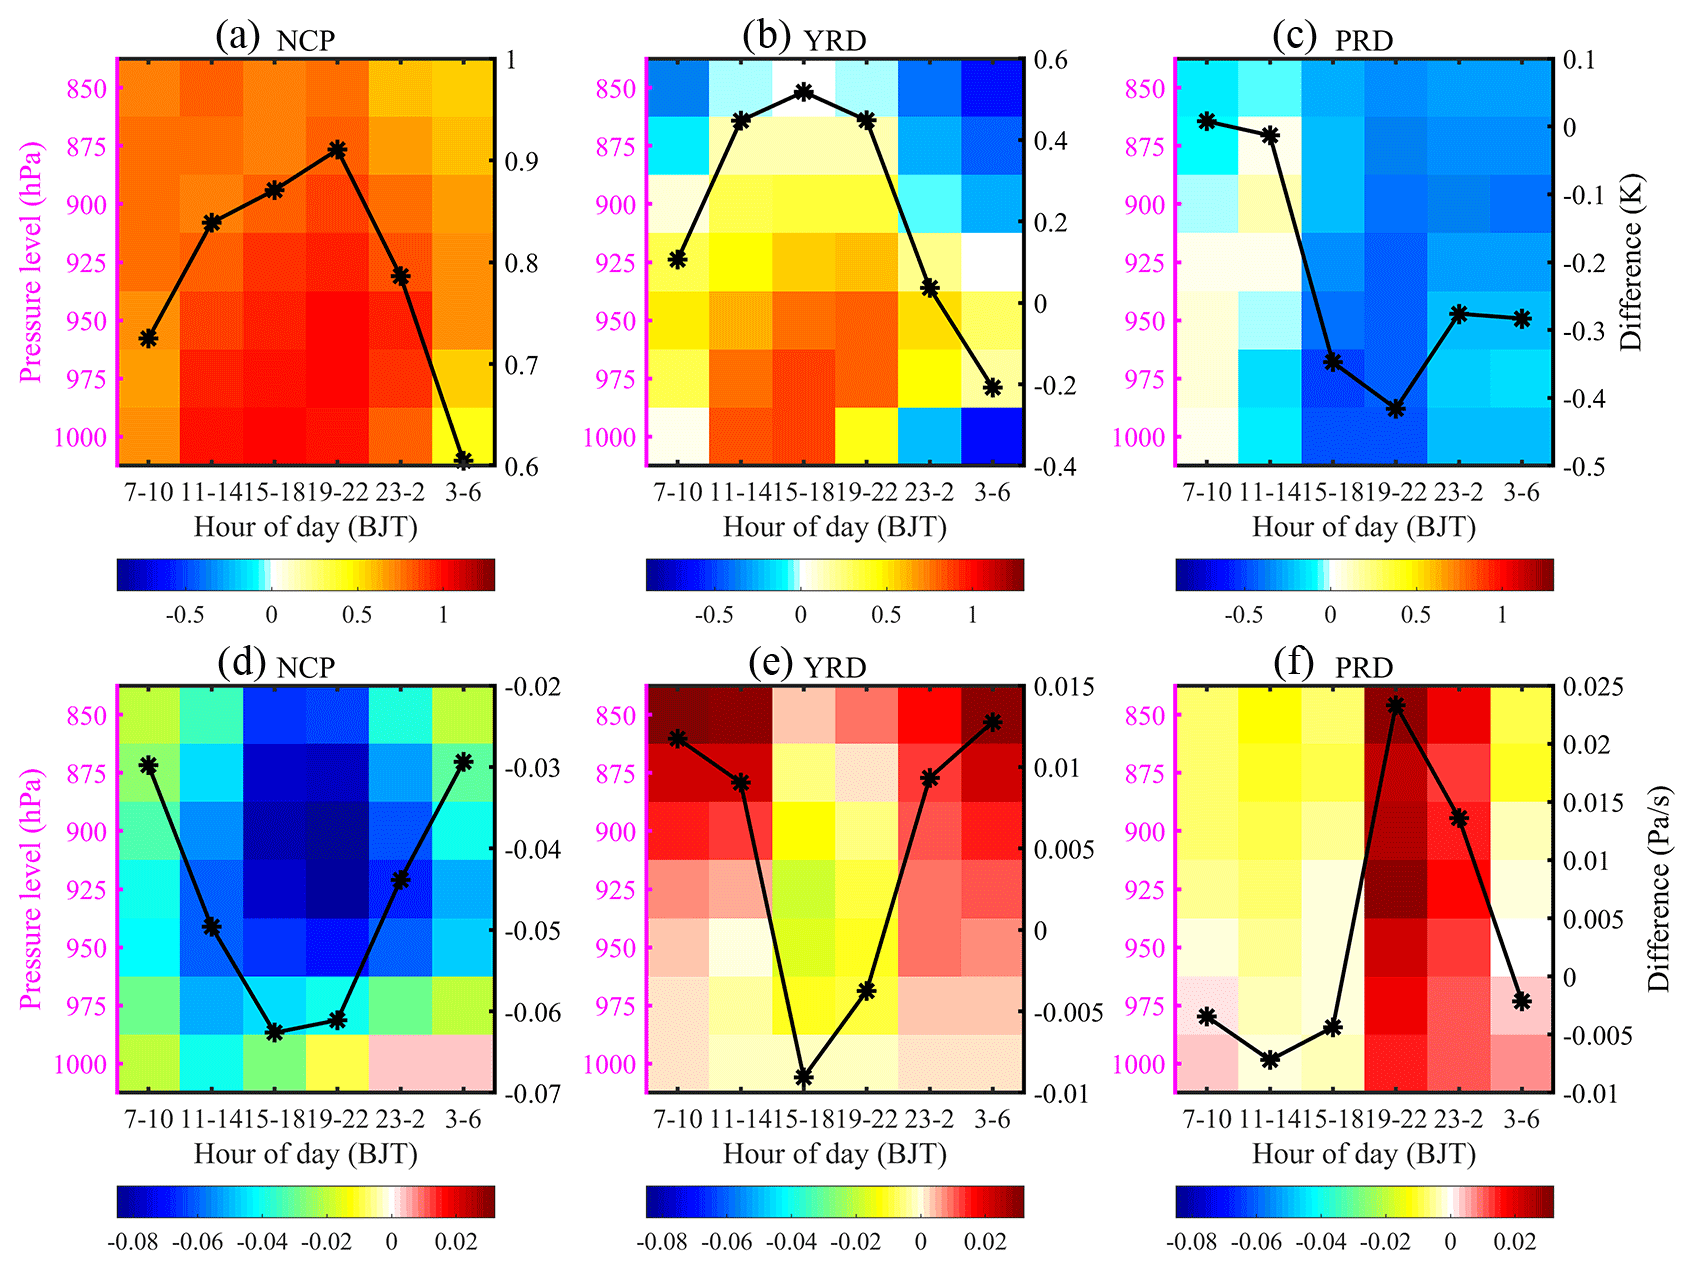
Figure 9The differences in (a)–(c) temperature (K) and (d)–(f) vertical velocity (Pa s−1) between polluted and clean conditions in the NCP, YRD, and PRD at different pressure levels. The positive (negative) values represent heating (cooling) of the atmosphere in (a)–(c). The positive (negative) values represent downward (upward) airflow in (d)–(f). The black lines represent the means of the differences in temperature (vertical velocity) from 1000 to 850 hPa for several given hour periods, including 07:00–10:00, 11:00–14:00, 15:00–18:00, 19:00–22:00, 23:00–02:00 (the next day), and 03:00–06:00 LT.
As shown in Fig. 9a, the radiative effect of aerosol is strengthened gradually after sunrise, with the largest impact on atmospheric temperature at 19:00–22:00 LT, and is weakened from midnight to before sunrise the next day in the NCP, which implies that the precipitation is also affected by the aerosol radiative effect at night. The atmosphere is heated by aerosols over the YRD for almost all times except the period 03:00–06:00 LT. The radiative effect of aerosol increases after sunrise and decreases after sunset, with the largest impact on atmospheric temperature at 15:00–18:00 LT in the YRD. The obvious cooling effect of aerosol is shown in the PRD for almost all times except for a weak heating effect in the morning. After sunrise, the cooling effect increases gradually in the PRD. The above phenomena could help explain why the aerosol shows a different influence on the precipitation start and peak time over the three study regions. Over the NCP, the impacts of aerosol radiative effect on atmospheric temperature at 1000–950 hPa is weaker than that at 925–875 hPa, implying that the potential convective energy needs time to accumulate. Correspondingly, the convection is strengthened weakly in the morning even though the aerosol can heat the atmosphere due to the high aerosol concentration. Accompanied by the accumulation of aerosol heating effect with time, the aerosols favour the convection strongly and then advance the precipitation start time over the NCP. Differently, the aerosols paly a cooling effect over the PRD, and accompanied by the accumulated aerosol cooling effect with time, the precipitation start time is delayed.
Figure 9d–f show the differences in vertical velocity between polluted and clean conditions, which further confirms the above results. The positive vertical velocity (downward movement) suppresses the convection, and negative vertical velocity (upward movement) strengthens the convection. In general, when the aerosol heats (cools) the atmosphere, the airflow is upward (downward). However, we should note when the radiative effect of aerosol is weak (at night and in the early morning), the increasing temperature does not mean that the airflow must be upward.
3.3 Sensitivities of aerosol impacts on precipitation to meteorological factors
In addition to aerosols, meteorological variables can also affect the precipitation. We here investigate the potential impacts from the meteorological variables, and we further investigate the aerosol impacts on precipitation by limiting the influence from those meteorological variables. This study selects three crucial factors for the precipitation formation and development, including moisture, wind shear, and low troposphere stability (Fan et al., 2009; Guo et al., 2016; Klein, 1997; Slingo, 1987; Zhou et al., 2020).
Figures S1–S3 in the Supplement show the influence of moisture, WS, and LTS on precipitation. Sufficient moisture is beneficial to precipitation generation and advances precipitation. The differences in precipitation frequency between crest and valley under high-humidity conditions are less than that under low-humidity conditions, which means that high moisture increases the precipitation frequency for all corresponding time instead of making precipitation gathered at a particular time range. As a result, the high humidity weakens the diurnal variations in precipitation frequency. The LTS changes the diurnal characteristics of the precipitation start time. The precipitation is more frequent in the daytime, with peak occurrence frequency in the afternoon under low-LTS conditions, while the precipitation is more frequent in the nighttime with valley occurrence frequency in the afternoon under high-LTS conditions. The high WS delays the precipitation start time by 3 h in the NCP, delays the precipitation start time by 1 h in the YRD, and advances the precipitation start time by 2 h in the PRD, which is opposite to the influence of aerosol on precipitation start time. Therefore, the high WS inhibits the aerosol effects on precipitation, which is in good agreement with the findings by Fan et al. (2009) that increasing aerosol concentrations can enhance convection under weak wind shear conditions.
Using a similar method to classify meteorological conditions as aerosols, this study next investigates the differences of crest or valley of precipitation frequency between polluted and clean conditions to verify the aerosol effects by limiting the meteorological conditions. Under high-humidity conditions, the diurnal variations in precipitation frequency are more complicated under polluted conditions over the NCP and YRD, making it challenging to judge the corresponding crest and valley time. Moreover, the aerosol radiative effect is weak under high-humidity conditions, which could also make the impacts of aerosols on precipitation hard to identify. Under low-humidity conditions, the aerosols advance the precipitation start time by 3 h in the NCP (Fig. 10a) and by 1 h in the YRD (Fig. 10e). The aerosols delay the precipitation start time by 2 h both under low- and high-humidity conditions in the PRD (Fig. 10i–j). However, the differences of PDFs between polluted and clean conditions under low-humidity conditions are more distinct than under high-humidity conditions over the PRD, which indicates that the aerosol effects on precipitation are more significant under low-humidity conditions. All above results suggest that the humidity can affect the strength of aerosol impacts on precipitation. The aerosol impacts on precipitation are more obvious under low-humidity conditions and are somehow weakened under high-humidity conditions. The response of aerosol impacts on precipitation peak time to humidity is basically consistent with that of the aerosol impacts on precipitation start time but shows weakened aerosol impacts under high-humidity conditions more clearly, especially in PRD. Under low-humidity conditions, the crest of precipitation peak time is at 14:00 LT under clean conditions and at 16:00 LT under polluted conditions, suggesting that the precipitation peak time is delayed 2 h by aerosols in the PRD (Fig. 10k). Differently, under high-humidity conditions, the crests of precipitation peak time are both at 15:00 LT under both polluted and clean conditions (Fig. 10l), which suggests that the aerosols have no obvious influence on precipitation peak time under high-humidity conditions in the PRD.

Figure 10Normalised PDFs of precipitation start time under (a, e, i) low-humidity conditions and (b, f, j) high-humidity conditions and the precipitation peak time under (c, g, k) low-humidity conditions and (d, h, l) high-humidity conditions in June–August from 2015 to 2020 over the NCP, YRD, and PRD, respectively. The blue (red) numbers are the average (the first column) and standard deviation (the second column) of the PM2.5 mass concentration (µg m−3) under clean (polluted) conditions. RH represents the relative humidity.
Figure 11 shows that the aerosol effects on precipitation are distinct under low-LTS conditions but are almost negligible under high-LTS conditions. The aerosols advance the precipitation start time in the NCP (Fig. 11a) and YRD (Fig. 11e) by 1 h under low-LTS conditions. During the frequent period of precipitation, the frequency of precipitation under polluted conditions is higher than that under clean conditions, which means that the aerosol microphysical effect is prominent in addition to the aerosol radiative effect. The precipitation start time is delayed 2 h (polluted: 16:00 LT, clean: 14:00 LT) by aerosol in the PRD (Fig. 11i) under low-LTS conditions. The responses of precipitation peak time to the aerosols are generally consistent with that of precipitation start time under different LTS conditions. The aerosol impacts on precipitation are distinct under high- and low-WS conditions while they are more obvious under low-WS conditions. In the NCP, the aerosols advance the precipitation start time under both low- and high-WS conditions (Fig. 12a–b), which suggests that the aerosol radiative effect plays a significant role. However, under low-WS conditions, the crest frequency of precipitation under polluted conditions is higher than that under clean conditions in the NCP, while a contrary phenomenon is found under high-WS conditions, which suggests that the high WS suppresses the aerosol microphysical effects. The aerosols make the precipitation start time 1 h earlier under low-WS conditions in the YRD (Fig. 12e) while the aerosol effects on precipitation start time are not obvious under high-WS conditions (Fig. 12f). The aerosols delay the precipitation start time under both low- and high-WS conditions in the PRD. The responses of precipitation peak time to aerosols are also found to be generally consistent with that of precipitation start time under different WS conditions.
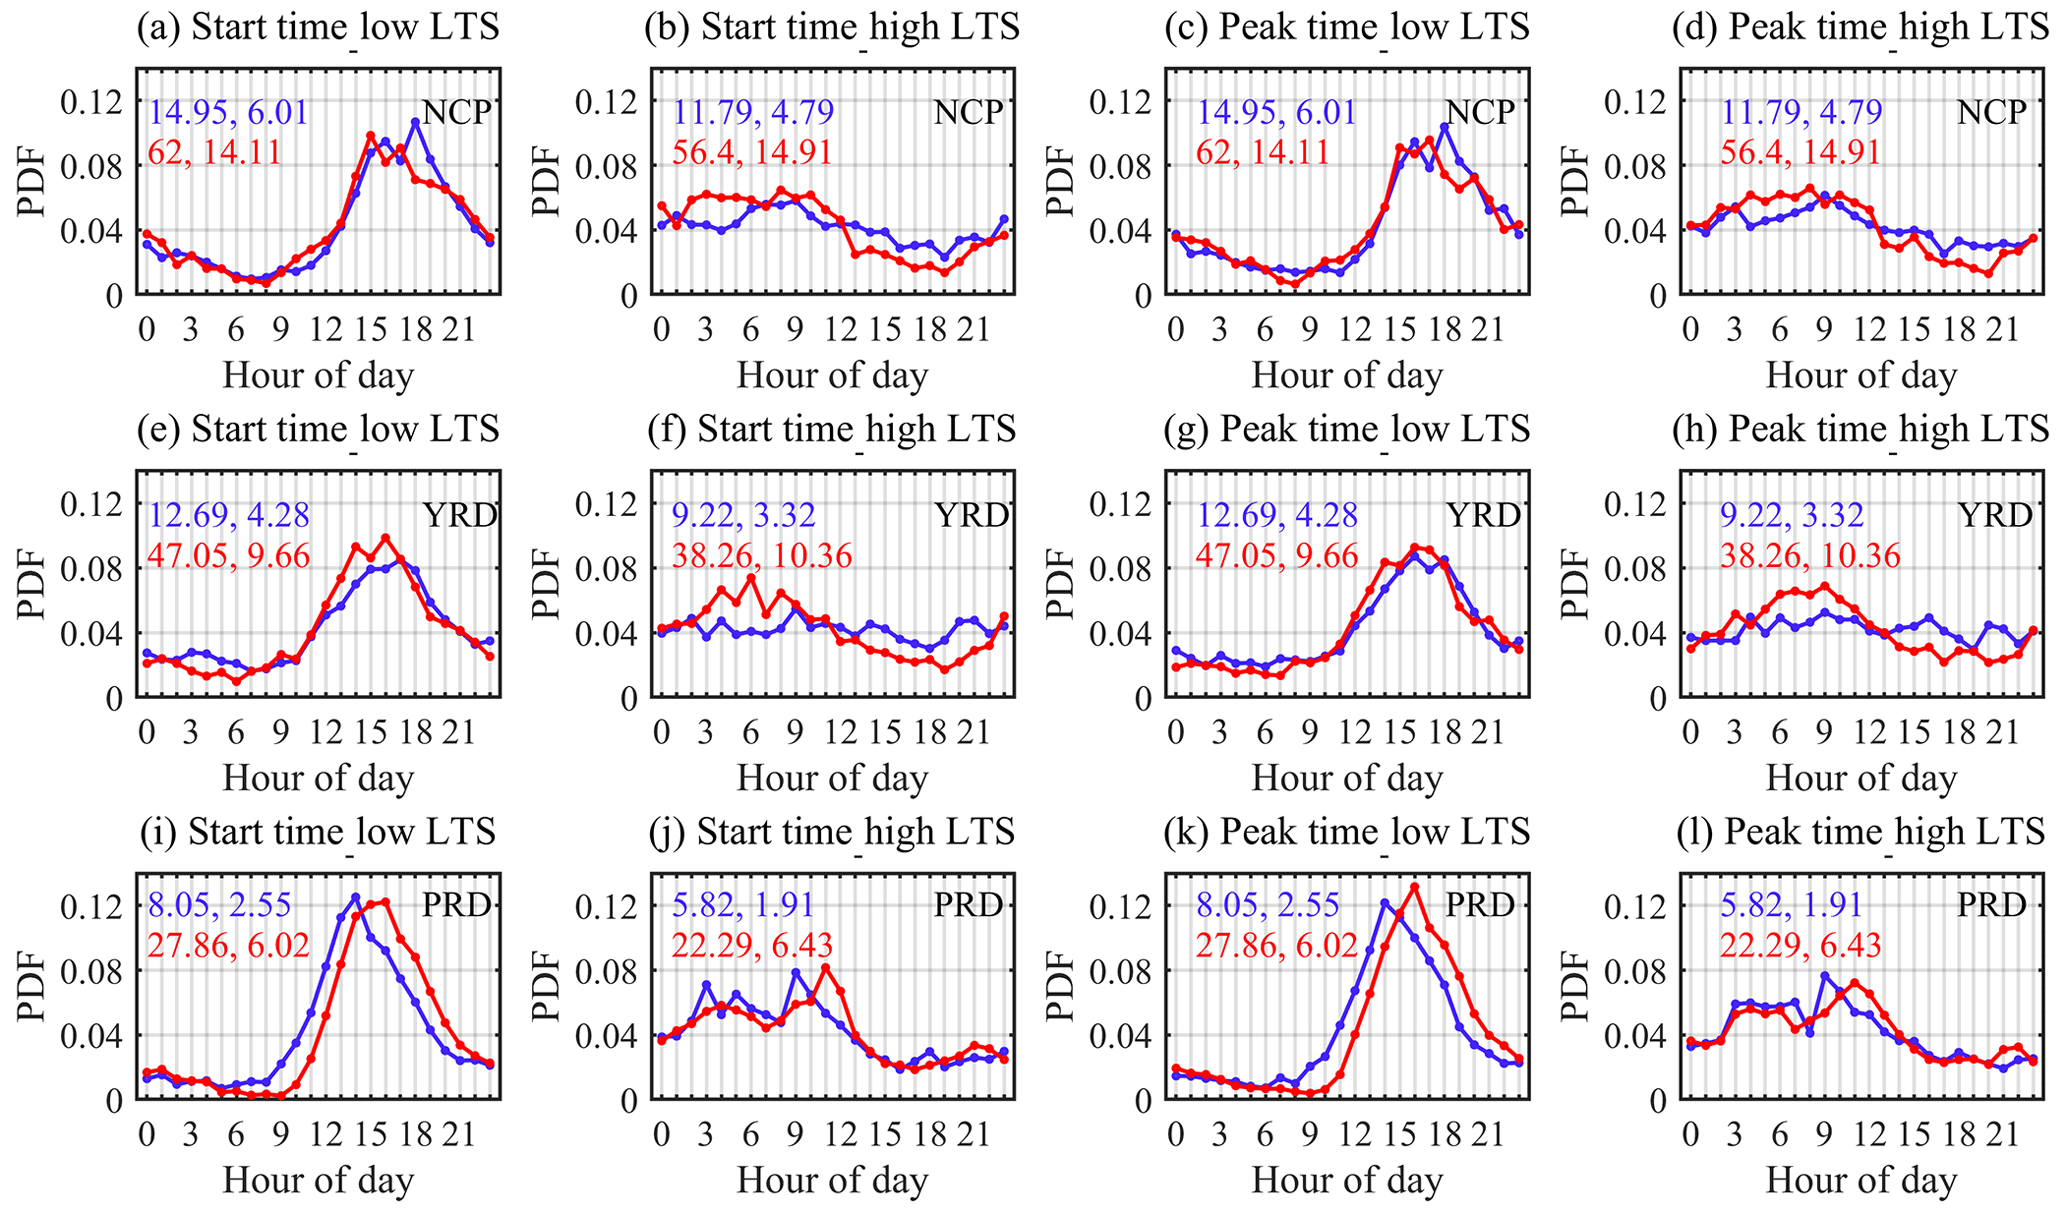
Figure 11Same as Fig. 10, but under low-LTS conditions and high-LTS conditions. LTS represents low troposphere stability.
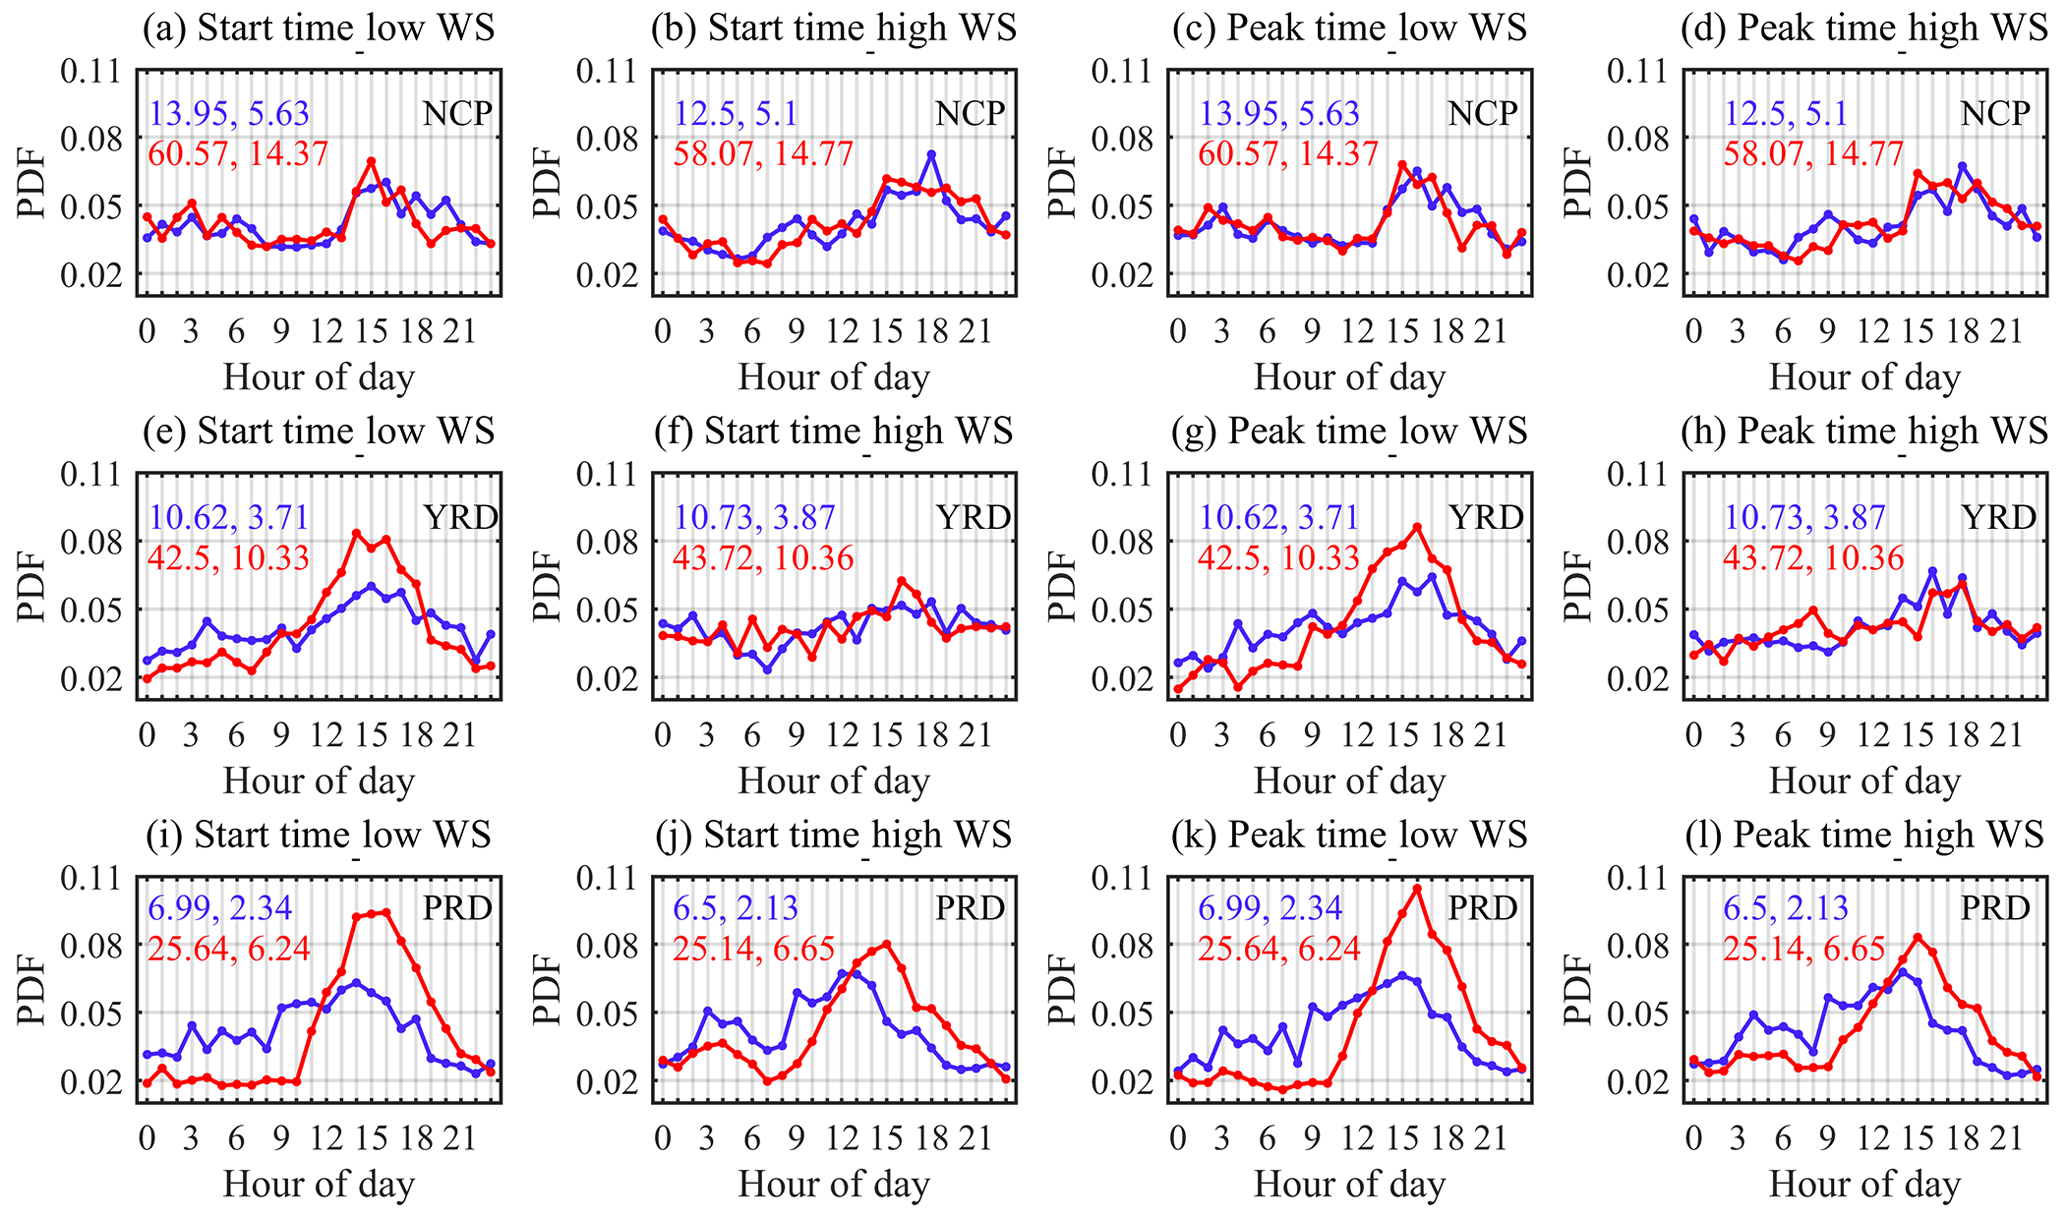
Figure 12Same as Fig. 10, but under low-WS conditions and high-WS conditions. WS represents vertical wind shear between heights of 5500 and 1500 m.
4.1 Summary
This study investigates the influence of aerosol on the precipitation start and peak times over three different megacity regions using the high-resolution precipitation, aerosol, and meteorological data in summer (June–August) during the period from 2015 to 2020. We first examine the changes of precipitation start and peak times with aerosols over the North China Plain (NCP), Yangtze River Delta (YRD), and Pearl River Delta (PRD) regions. Then we classify the precipitation types into convective and stratiform precipitation, and we examine their different responses in start and peak times to aerosols. Finally, considering that meteorological variables, particularly three key meteorological variables of humidity, low tropospheric stability, and wind shear, also play important roles in precipitation development, we further classify the meteorological conditions using the same method as aerosols and examine the aerosol impacts on precipitation start and peak times under different meteorological conditions. New findings have been provided with the following several key points.
-
The frequent period of precipitation start time is delayed and prolonged by high aerosol concentrations and a relatively high proportion of absorbing aerosol in the NCP, so the initial time of the frequent period in the NCP (14:00 LT) is later than that in the YRD (11:00 LT) and PRD (11:00 LT), while the durations of frequent periods are similar among the three study regions. The different aerosol concentrations and aerosol types (absorbing versus scattering) contribute to the different aerosol impacts on the precipitation start (peak) time over the NCP, YRD, and PRD. The precipitation start time is advanced 3 h in the NCP but delayed 2 h in the PRD by aerosols during the frequent period, and the precipitation start time in YRD shows negligible response to aerosol. The most likely reason is that the aerosols heat the atmosphere strongly in the NCP, associated with the high aerosol concentration and the relatively larger proportion of absorbing aerosol over the NCP. The aerosol concentration and aerosol type in the PRD is opposite to that in the NCP. The aerosol concentration and aerosol type in the YRD are both between that in the NCP and PRD, and the aerosol impacts on the precipitation start (peak) time in the YRD are also between that in the NCP and PRD, which is relatively weakly affected by aerosol. The influences of aerosol radiative effect on precipitation start (peak) time are also found to be different during the different periods of the day.
-
The frequency of stratiform precipitation is higher than that of convective precipitation, but the convective precipitation is more sensitive to aerosol than stratiform precipitation. The responses of the convective precipitation start and peak times to aerosol are similar to each other, with the results as shown above in point (1), except that the start time is delayed 1 h in the YRD, but the peak time is advanced 1 h in the PRD.
-
Humidity is beneficial to precipitation, which can advance the precipitation start (peak) time, but the influence of aerosol on precipitation is weakened when the humidity is high. The low tropospheric stability (LTS) can modify the diurnal variation characteristics of precipitation start (peak) time. The influences of aerosol on precipitation start time are more significant under low LTS. Vertical wind shear (WS) inhibits the aerosol effects on precipitation, since the influences of WS on the precipitation start (peak) time are opposite to that of aerosols. WS delays the precipitation start (peak) time by 3 h in the NCP and by 1 h in the YRD, while it advances the precipitation start (peak) time by 2 h in the PRD.
4.2 Discussion
Aerosol–precipitation interaction is a hot topic in atmospheric science and has many challenges due to its complexity. Previous studies have focused on the influence of aerosols on the precipitation intensity at inter-decadal or daily timescales, but few studies have examined the impacts of aerosols on the precipitation time for a large number of precipitation events. This study investigates the impacts of aerosols on the precipitation start and peak times for both stratiform and convective precipitation by limiting the impacts of meteorological variables, which are essential to improve our understanding of aerosol–precipitation interaction. However, there are still some problems in the current study, with at least the following several points.
First, the temporal resolution of observations is still too coarse for the current study. For example, the temporal resolution of the precipitation product is 1 h in this study, which makes it difficult for us to more accurately quantify the impacts of aerosols on precipitation time: precipitation time changes with values less than 1 h are not able to be identified. Second, the complicated mechanisms and processes of aerosol effect on precipitation could introduce extra uncertainties to our findings. Currently, we only examine the sensitives of aerosol effects on precipitation under different humidity, LTS, and WS conditions, which might not be sufficient. Also, this study focuses on summer precipitation, but the influence of summer monsoon has not been considered and definitely needs to be further investigated in the future. Finally, we would like to mention that we focus on the aerosol radiative effects on precipitation time, while the aerosol microphysical effect is less discussed. It is hard to distinguish radiative effect and microphysical effect using observation study alone, so numerical model simulations should be further applied in the future. Moreover, the influence of aerosol on precipitation intensity and duration also needs to be investigated further over different regions.
Surface elevation data from the Shuttle Radar Topography Mission (SRTM) were downloaded from https://srtm.csi.cgiar.org (last access: 1 November 2021) (Jarvis et al., 2008). ERA-5 Reanalysis data were provided by the European Centre for Medium Weather Forecasts, (https://doi.org/10.24381/cds.bd0915c6, Hersbach et al., 2018). The details of the hourly precipitation data from the China Merged Precipitation Analysis Version 1.0 product can be looked up from http://data.cma.cn/ (last access: 4 November 2021, Shen et al., 2014). The hourly PM2.5 mass concentration is provided by the China Environmental Monitoring Station of the national air quality real-time release platform with data quality assurance (http://beijingair.sinaapp.com, last access: 4 November 2021, Sun et al., 2019). The DPR Level-2A product from the Global Precipitation Measurement (GPM) mission can be downloaded from https://doi.org/10.5067/GPM/DPR/GPM/2A/06 (Iguchi and Meneghini, 2017).
The supplement related to this article is available online at: https://doi.org/10.5194/acp-21-16555-2021-supplement.
CZ and YS developed the ideas and designed the study. YS contributed to collection and analyses of data. YS performed the analysis and prepared the manuscript. CZ supervised and modified the manuscript. All authors made substantial contributions to this work.
The contact author has declared that neither they nor their co-authors have any competing interests.
Publisher’s note: Copernicus Publications remains neutral with regard to jurisdictional claims in published maps and institutional affiliations.
This work was supported by the Ministry of Science and Technology of China National Key Research and Development Program (grant no. 2017YFC1501403), the National Natural Science Foundation of China (grant nos. 41925022, 41575143), the State Key Laboratory of Earth Surface Processes and Resources Ecology, and the Fundamental Research Funds for the Central Universities.
This research has been supported by the National Key Research and Development Program of China (grant no. 2017YFC1501403) and the National Natural Science Foundation of China (grant nos. 41925022 and 41575143).
This paper was edited by Jianping Huang and reviewed by two anonymous referees.
Ackerman, A. S., Toon, O. B., Stevens, D. E., Heymsfield, A. J., Ramanathan, V., and Welton, E. J.: Reduction of Tropical Cloudiness by Soot, Science, 288, 1042, https://doi.org/10.1126/science.288.5468.1042, 2000.
Albrecht, B. A.: Aerosols, cloud microphysics, and fractional cloudiness, Science, 245, 1227–1230, https://doi.org/10.1126/science.245.4923.1227, 1989.
An, Z., Huang, R. J., Zhang, R., Tie, X., Li, G., Cao, J., Zhou, W., Shi, Z., Han, Y., and Gu, Z.: Severe haze in northern China: A synergy of anthropogenic emissions and atmospheric processes, P. Natl. Acad. Sci. USA, 116, 8657–8666, https://doi.org/10.1073/pnas.1900125116, 2019.
Andreae, M. O., Rosenfeld, D., Artaxo, P., Costa, A. A., Frank, G. P., Longo, K. M., and Silva-Dias, M. A. F.: Smoking Rain Clouds over the Amazon, Science, 303, 1337–1342, https://doi.org/10.1126/science.1092779, 2004.
Boucher, O. and Quaas, J.: Water vapour affects both rain and aerosol optical depth, Nat. Geosci., 6, 4–5, https://doi.org/10.1038/ngeo1692, 2012.
Che, H., Qi, B., Zhao, H., Xia, X., Eck, T. F., Goloub, P., Dubovik, O., Estelles, V., Cuevas-Agulló, E., Blarel, L., Wu, Y., Zhu, J., Du, R., Wang, Y., Wang, H., Gui, K., Yu, J., Zheng, Y., Sun, T., Chen, Q., Shi, G., and Zhang, X.: Aerosol optical properties and direct radiative forcing based on measurements from the China Aerosol Remote Sensing Network (CARSNET) in eastern China, Atmos. Chem. Phys., 18, 405–425, https://doi.org/10.5194/acp-18-405-2018, 2018.
Chen, H. Q., Lu, D. K., Zhou, Z. H., Zhu, Z. W., Ren, Y. J., and Yong, B.: An overview of assessments on global precipitation measurement (GPM) precipitation products, Water Resour. Protect., 35, 27–34, https://doi.org/10.3880/j.issn.1004-6933.2019.01.006, 2019 (in Chinese).
Chen, S., Huang, J., Kang, L., Wang, H., Ma, X., He, Y., Yuan, T., Yang, B., Huang, Z., and Zhang, G.: Emission, transport, and radiative effects of mineral dust from the Taklimakan and Gobi deserts: comparison of measurements and model results, Atmos. Chem. Phys., 17, 2401–2421, https://doi.org/10.5194/acp-17-2401-2017, 2017.
Chen, T., Li, Z., Kahn, R. A., Zhao, C., Rosenfeld, D., Guo, J., Han, W., and Chen, D.: Potential impact of aerosols on convective clouds revealed by Himawari-8 observations over different terrain types in eastern China, Atmos. Chem. Phys., 21, 6199–6220, https://doi.org/10.5194/acp-21-6199-2021, 2021.
Chen, W. D., Fu, D. H., Miao, S. G., and Zhang, Y. Z.: Impacts of aerosols from Beijing and the surrounding areas on urban precipitation, Chin. Sci. Bull., 60, 2124–2135, https://doi.org/10.1360/N972015-00217, 2015 (in Chinese).
Ding, A., Huang, X., Nie, W., Chi, X., Xu, Z., Zheng, L., Xu, Z., Xie, Y., Qi, X., Shen, Y., Sun, P., Wang, J., Wang, L., Sun, J., Yang, X.-Q., Qin, W., Zhang, X., Cheng, W., Liu, W., Pan, L., and Fu, C.: Significant reduction of PM2.5 in eastern China due to regional-scale emission control: evidence from SORPES in 2011–2018, Atmos. Chem. Phys., 19, 11791–11801, https://doi.org/10.5194/acp-19-11791-2019, 2019.
Edenhofer, O. and Seyboth, K.: Intergovernmental Panel on Climate Change (IPCC), Encyclopedia of Energy, Natural Resource, and Environ. Econ., 1, 48–56, https://doi.org/10.1016/B978-0-12-375067-9.00128-5, 2013.
Fan, H., Wang, Y., Zhao, C., Yang, Y., Yang, X., Sun, Y., and Jiang, S.: The role of primary emission and transboundary transport in the air quality changes during and after the COVID-19 lockdown in China, Geophys. Res. Lett., 48, e2020GL091065, https://doi.org/10.1029/2020GL091065, 2021a.
Fan, H., Zhao, C., Yang, Y., and Yang, X.: Spatio-Temporal Variations of the PM2.5/PM10 Ratios and Its Application to Air Pollution Type Classification in China, Front. Environ. Sci., 9, 692440, https://doi.org/10.3389/fenvs.2021.692440, 2021b.
Fan, J., Yuan, T., Comstock, J. M., Ghan, S., Khain, A., Leung, L. R., Li, Z., Martins, V. J. and Ovchinnikov, M.: Dominant role by vertical wind shear in regulating aerosol effects on deep convective clouds, J. Geophys. Res.-Atmos., 114, D22206, https://doi.org/10.1029/2009JD012352, 2009.
Fan, J., Rosenfeld, D., Ding, Y., Leung, L. R., and Li, Z.: Potential aerosol indirect effects on atmospheric circulation and radiative forcing through deep convection, Geophys. Res. Lett., 39, L09806, https://doi.org/10.1029/2012GL051851, 2012.
Fan, J., Leung, L. R., Rosenfeld, D., Chen, Q., Li, Z., Zhang, J., and Yan, H.: Microphysical effects determine macrophysical response for aerosol impacts on deep convective clouds, P. Natl. Acad. Sci. USA, 110, E4581, https://doi.org/10.1073/pnas.1316830110, 2013.
Fan, J., Rosenfeld, D., Yang, Y., Zhao, C., Leung, L. R., and Li, Z.: Substantial contribution of anthropogenic air pollution to catastrophic floods in Southwest China, Geophys. Res. Lett., 42, 6066–6075, https://doi.org/10.1002/2015GL064479, 2015.
Garrett, T. J. and Zhao. C.: Increased Arctic cloud longwave emissivity associated with pollution from mid-latitudes, Nature, 440, 787–789, https://doi.org/10.1038/nature04636, 2006.
Guo, J., Deng, M., Lee, S. S., Wang, F., Li, Z., Zhai, P., Liu, H., Lv, W., Yao, W., and Li, X.: Delaying precipitation and lightning by air pollution over the Pearl River Delta. Part I: Observational analyses, J. Geophys. Res.-Atmos., 121, 6472–6488, https://doi.org/10.1002/2015JD023257, 2016.
He, X., Lu, C. S., and Zhu, J.: A study of the spatiotemporal variation in aerosol types and their radiation effect in China, Acta Scientiae Circumstantiae, 40, 4070–4080 https://doi.org/10.13671/j.hjkxxb.2020.0100, 2020 (in Chinese).
Hersbach, H., Bell, B., Berrisford, P., Biavati, G., Horányi, A., Muñoz Sabater, J., Nicolas, J., Peubey, C., Radu, R., Rozum, I., Schepers, D., Simmons, A., Soci, C., Dee, D., and Thépaut, J.-N.: ERA5 hourly data on pressure levels from 1979 to present, Copernicus Climate Change Service (C3S) Climate Data Store (CDS) [data set], https://doi.org/10.24381/cds.bd0915c6, 2018.
Hoffmann, L., Günther, G., Li, D., Stein, O., Wu, X., Griessbach, S., Heng, Y., Konopka, P., Müller, R., Vogel, B., and Wright, J. S.: From ERA-Interim to ERA5: the considerable impact of ECMWF's next-generation reanalysis on Lagrangian transport simulations, Atmos. Chem. Phys., 19, 3097–3124, https://doi.org/10.5194/acp-19-3097-2019, 2019.
Huang, J., Lin, B., Minnis, P., Wang, T., Wang, X., Hu, Y., Yi, Y., and Ayers, J. K.: Satellite-based assessment of possible dust aerosols semi-direct effect on cloud water path over East Asia, Geophys. Res. Lett., 33, L19802, https://doi.org/10.1029/2006GL026561, 2006a.
Huang, J., Minnis, P., Lin, B., Wang, T., Yi, Y., Hu, Y., Sun-Mack, S., and Ayers, K.: Possible influences of Asian dust aerosols on cloud properties and radiative forcing observed from MODIS and CERES, Geophys. Res. Lett., 33, L06824 https://doi.org/10.1029/2005GL024724, 2006b.
Huang, J., Minnis, P., Yan, H., Yi, Y., Chen, B., Zhang, L., and Ayers, J. K.: Dust aerosol effect on semi-arid climate over Northwest China detected from A-Train satellite measurements, Atmos. Chem. Phys., 10, 6863–6872, https://doi.org/10.5194/acp-10-6863-2010, 2010.
Iguchi, T. and Meneghini, R.: GPM DPR Precipitation Profile L2A 1.5 hours 5 km V06, Greenbelt, MD, Goddard Earth Sciences Data and Information Services Center (GES DISC) [data set], https://doi.org/10.5067/GPM/DPR/GPM/2A/06, 2017.
Jarvis, A., Reuter, H. I., Nelson, A., and Guevara, E.: Hole-filled seamless SRTM data V4, International Centre for Tropical Agriculture (CIAT) [data set], available at: https://srtm.csi.cgiar.org (last access: 1 November 2021), 2008.
Jiao, M. Y. and Bi, B. G.: Mesoscale structure analysis of topography-induced heavy rainfall in Beijing in summer, Meteorology, 31, 9–14, https://doi.org/10.3969/j.issn.1000-0526.2005.06.002, 2005 (in Chinese).
Khain, A., Rosenfeld, D., and Pokrovsky, A.: Aerosol impact on the dynamics and microphysics of deep convective clouds, Q. J. R. Meteorol. Soc., 131, 2639–2663, https://doi.org/10.1256/qj.04.62, 2005.
Klein, S. A.: Synoptic variability of low-cloud properties and meteorological parameters in the subtropical trade wind boundary layer, J. Climate, 10, 2018–2039, https://doi.org/10.1175/1520-0442(1997)010<2018:svolcp>2.0.co;2, 1997.
Koren, I., Kaufman, Y. J., Rosenfeld, D., Remer, L. A., and Rudich, Y.: Aerosol invigoration and restructuring of Atlantic convective clouds, Geophys. Res. Lett., 32, L14828, https://doi.org/10.1029/2005GL023187, 2005.
Le, M. and Chandrasekar, V.: Precipitation Type Classification Method for Dual-Frequency Precipitation Radar (DPR) Onboard the GPM, IEEE Trans. Geosci. Remote Sens., 51, 1784–1790, https://doi.org/10.1109/TGRS.2012.2205698, 2013.
Le, M., Chandrasekar, V., and Lim, S.: Microphysical retrieval from dual frequency precipitation radar board GPM, Proc. IEEE IGARSS, 11686330, 3482–3485, https://doi.org/10.1109/IGARSS.2010.5652487, 2010.
Lebo, Z. and Morrison, H.: Dynamical Effects of Aerosol Perturbations on Simulated Idealized Squall Lines, Mon. Weather Rev., 142, 991–1009, https://doi.org/10.1175/MWR-D-13-00156.1, 2014.
Lee, S. S., Guo, J., and Li, Z.: Delaying precipitation by air pollution over the Pearl River Delta: 2. Model simulations, J. Geophys. Res.-Atmos., 121, 11739–11760, https://doi.org/10.1002/2015JD024362, 2016.
Li, Z., Niu, F., Fan, J., Liu, Y., Rosenfeld, D., and Ding, Y.: Long-term impacts of aerosols on the vertical development of clouds and precipitation, Nat. Geosci., 4, 888–894, https://doi.org/10.1038/ngeo1313, 2011.
Li, Z. Q., Xu, H., Li, K. T., Li, D. H., Xie, Y. S., Li, L., Zhang, Y., Gu, X. F., Zhao, W., Tian, Q. J., Deng, R. R., Su, X. L., Huang, B., Qiao,Y. L., Cui, W. Y., Hu, Y., Gong, C. L., Wang, Y. Q., Wang, X. F., Wang, J. P., Du, W. B., Pan, Z. Q., Li, Z. Z., and Bu, D.: Comprehensive study of optical, physical, chemical, and radiative properties of total columnar atmospheric aerosols over China: an overview of sun-sky radiometer observation network (SONET) measurements, B. Am. Meteorol. Soc., 99, 739–755, https://doi.org/10.1175/BAMS-D-17-0133.1, 2018.
Lin, J. C., Matsui, T., Pielke Sr., R. A., and Kummerow, C.: Effects of biomass-burning-derived aerosols on precipitation and clouds in the Amazon Basin: a satellite-based empirical study, J. Geophys. Res.-Atmos., 111, D19204, https://doi.org/10.1029/2005JD006884, 2006.
Liu, Y., Li, Y., Huang, J., Zhu, Q., and Wang, S.: Attribution of the Tibetan Plateau to northern drought, Natl. Sci. Rev., 7, 489–492, https://doi.org/10.1093/nsr/nwz191, 2020.
Liu, Y. Z., Hua, S., Jia, R., and Huang, J. P.: Effect of aerosols on the ice cloud properties over the Tibetan Plateau, J. Geophys. Res.-Atmos., 124, 9594–9608, https://doi.org/10.1029/2019JD030463, 2019.
Niu, F. and Li, Z.: Systematic variations of cloud top temperature and precipitation rate with aerosols over the global tropics, Atmos. Chem. Phys., 12, 8491–8498, https://doi.org/10.5194/acp-12-8491-2012, 2012.
Pan, Z., Rosenfeld, D., Zhu, Y., Mao, F., Gong, W., Zang, L., and Lu, X.: Observational quantification of aerosol invigoration for deep convective cloud lifecycle properties based on geostationary satellite, J. Geophys. Res.-Atmos., 126, e2020JD034275, https://doi.org/10.1029/2020JD034275, 2021.
Pincus, R. and Baker, M. B.: Effect of precipitation on the albedo susceptibility of clouds in the marine boundary layer, Nature, 372, 250–252, https://doi.org/10.1038/372250a0, 1994.
Qiu, Y., Zhao, C., Guo, J., and Li, J.: 8 Year ground-based observational analysis about the seasonal variation of the aerosol-cloud droplet effective radius relationship at SGP site, Atmos. Environ., 164, 139–146, https://doi.org/10.1016/j.atmosenv.2017.06.002, 2017.
Rosenfeld, D.: Suppression of Rain and Snow by Urban and Industrial Air Pollution, Science, 287, 1793, https://doi.org/10.1126/science.287.5459.1793, 2000.
Rosenfeld, D., Lohmann, U., Raga, G. B., Dowd, C. D., Kulmala, M., Fuzzi, S., Reissell, A., and Andreae, M. O.: Flood or Drought: How Do Aerosols Affect Precipitation?, Science, 321, 1309, https://doi.org/10.1126/science.1160606, 2008.
Shen, Y., Zhao, P., Pan, Y., and Yu, J.: A high spatiotemporal gauge-satellite merged precipitation analysis over China, J. Geophys. Res.-Atmos., 119, 3063–3075, https://doi.org/10.1002/2013JD020686, 2014 (data available at: http://data.cma.cn/, last access: 4 November 2021).
Shi, R., Wang, T. J., Li, S., Zhuang, B. L., Jiang, Z. Q., Liao, J. B., and Yin, C. Q.: The Spatial and Temporal Characteristics of Aerosol-Cloud-Precipitation Interactions during Summer in East Asia, Chinese J. Atmos. Sci., 39, 12–22, https://doi.org/10.3878/j.issn.1006-9895.1404.13276, 2015 (in Chinese).
Shi, X., Zhao, C., Jiang, J. H., Wang, C., Yang, X., and Yung, Y. L.: Spatial Representativeness of PM2.5 Concentrations Obtained Using Reduced Number of Network Stations, J. Geophys. Res.-Atmos., 123, 3145–3158, https://doi.org/10.1002/2017JD027913, 2018.
Slingo, J. M.: A cloud parametrization scheme derived from gate data for use with a numerical model, Q. J. R. Meteorol. Soc., 106, 747–770 https://doi.org/10.1002/qj.49710645008, 1980.
Slingo, J. M.: The Development and Verification of A Cloud Prediction Scheme For the Ecmwf Model, Q. J. R. Meteorol. Soc., 113, 899–927, https://doi.org/10.1002/qj.49711347710, 1987.
Song, C., He, J., Wu, L., Jin, T., Chen, X., Li, R., Ren, P., Zhang, L., and Mao, H.: Health burden attributable to ambient PM2.5 in China, Environ. Pollut., 223, 575–586, https://doi.org/10.1016/j.envpol.2017.01.060, 2017.
Speirs, P., Gabella, M., and Berne, A.: A comparison between the GPM dual-frequency precipitation radar and ground-based radar precipitation rate estimates in the Swiss Alps and Plateau, J. Hydrol., 18, 1247–1269, https://doi.org/10.1175/JHM-D-16-0085.1, 2017.
Stier, P.: Limitations of passive remote sensing to constrain global cloud condensation nuclei, Atmos. Chem. Phys., 16, 6595–6607, https://doi.org/10.5194/acp-16-6595-2016, 2016.
Sun, Y., Zhao, C., Su, Y., Ma, Z. S., Li, J. M., Letu, H., Yang, Y. K., and Fan, H.: Distinct impacts of light and heavy precipitation on PM2.5 mass concentration in Beijing, Earth Space Sci., 6, 1915–1925 https://doi.org/10.1029/2019EA000717, 2019 (data available at: http://beijingair.sinaapp.com, last access: 4 November 2021).
Tao, W.-K., Li, X., Khain, A., Matsui, T., Lang, S., and Simpson, J.: Role of atmospheric aerosol concentration on deep convective precipitation: Cloud-resolving model simulations, J. Geophys. Res., 112, D24S18, https://doi.org/10.1029/2007JD008728, 2007.
Tao, W. K., Chen, J. P., Li, Z., Wang, C. E., and Zhang, C. D.: Impact of aerosols on convective clouds and precipitation, Rev. Geophys., 50, RG2001, https://doi.org/10.1029/2011RG000369, 2012.
Teller, A. and Levin, Z.: The effects of aerosols on precipitation and dimensions of subtropical clouds: a sensitivity study using a numerical cloud model, Atmos. Chem. Phys., 6, 67–80, https://doi.org/10.5194/acp-6-67-2006, 2006.
Twomey, S.: The Influence of Pollution on the Shortwave Albedo of Clouds, J. Atmos. Sci., 34, 1149–1152, https://doi.org/10.1175/1520-0469(1977)034<1149:TIOPOT>2.0.CO;2, 1977.
Urraca, R., Huld, T., Gracia-Amillo, A., Martinez-de-Pison, F. J., Kaspar, F., and Sanz-Garcia, A.: Evaluation of global horizontal irradiance estimates from ERA5 and COSMO-REA6 reanalyses using ground and satellite-based data, Sol. Energy, 164, 339–354, https://doi.org/10.1016/j.solener.2018.02.059, 2018.
Wang, C.: A modeling study of the response of tropical deep convection to the increase of cloud condensation nuclei concentration: 1. Dynamics and microphysics, J. Geophys. Res.-Atmos., 110, D21211, https://doi.org/10.1029/2004JD005720, 2005.
Wang, J., Xing, J., Mathur, R., Pleim, J. E., Wang, S., Hogrefe, C., Gan, C. M., Wong, D. C., and Hao, J. M.: Historical Trends in PM2.5-Related Premature Mortality during 1990–2010 across the Northern Hemisphere, Environ. Health Perspect., 125, 400–408, https://doi.org/10.1289/EHP298, 2017.
Wang, W., Huang, J., Minnis, P., Hu, Y., Li, J., Huang, Z., Ayers, J., and Wang, T.: Dusty cloud properties and radiative forcing over dust source and downwind regions derived from A-Train data during the Pacific Dust Experiment, J. Geophys. Res.-Atmos., 115, D00H35, https://doi.org/10.1029/2010JD014109, 2010.
Wang, Y. H., Gao, W. K., Wang, S. A., Song, T., Gong, Z. Y., Ji, D. S., Wang, L. L., Liu, Z. R., Tang, G. Q., Huo, Y. F., Tian, S. L., Li, J. Y., Li, M. G., Yang, Y., Chu, B. W., Petäjä, T., Kerminen, V.-M., He, H., Hao, J. M., Kulmala, M., Wang, Y. S., and Zhang, Y. H.: Contrasting trends of PM2.5 and surface-ozone concentrations in China from 2013 to 2017, Natl. Sci. Rev., 7, 1331–1339, https://doi.org/10.1093/nsr/nwaa032, 2020.
Wood, R. and Bretherton C. S.: On the relationship between stratiform low cloud cover and lower-tropospheric stability, J. Clim., 19, 6425–6432, https://doi.org/10.1175/jcli3988.1, 2006.
Wu, G. X., Li, Z. Q., Fu, C. B., Zhang, X. Y., Zhang, R. Y., Zhang, R. H., Zhou, T. J., Li, J. P., Li, J. D., Zhou, D. G., Wu, L., Zhou, L. T., He, B., and Huang, R. H.: Advances in studying interactions between aerosols and monsoon in China, Sci. China Earth Sci., 59, 1–16, https://doi.org/10.1007/s11430-015-5198-z, 2016.
Yang, T. J., Liu, Y. D., and Sui, M.: Impacts of different concentrations of anthropogenic pollutants on a rainstorm, Chinese J. Atmos. Sci., 41, 882–896, https://doi.org/10.3878/j.issn.1006-9895.1702.16235, 2017 (in Chinese).
Yang, X., Zhao, C., Zhou, L., Wang, Y., and Liu, X.: Distinct impact of different types of aerosols on surface solar radiation in China, J. Geophys. Res.-Atmos., 121, 6459–6471, https://doi.org/10.1002/2016JD024938, 2016.
Yang, X., Zhou, L., Zhao, C., and Yang, J.: Impact of aerosols on tropical cyclone induced precipitation over the mainland of China, Clim. Change, 148, 173–185, https://doi.org/10.1007/s10584-018-2175-5, 2018.
Yang, X., Zhao, C., Yang, Y., and Fan, H.: Long-term multi-source data analysis about the characteristics of aerosol optical properties and types over Australia, Atmos. Chem. Phys., 21, 3803–3825, https://doi.org/10.5194/acp-21-3803-2021, 2021.
Zhang, A. Q. and Fu, Y. F.: The structural characteristics of precipitation cases detected by dual-frequency radar of GPM satellite, Chinese J. Atmos. Sci., 42, 33–51, https://doi.org/10.3878/j.issn.1006-9895.1705.16220, 2018 (in Chinese).
Zhang, F., Wang, Y., Peng, J., Chen, L., Sun, Y., Duan, L., Ge, X., Li, Y., Zhao, J., Liu, C., Zhang, X., Zhang, G., Pan, Y., Wang, Y., Zhang, A. L., Ji, Y., Wang, G., Hu, M., Molina, M. J., and Zhang, R.: An unexpected catalyst dominates formation and radiative forcing of regional haze, Proc. Natl. Acad. Sci. U.S.A., 117, 3960–3966, https://doi.org/10.1073/pnas.1919343117, 2020.
Zhao, C. and Garrett, T.: Effects of Arctic haze on surface cloud radiative forcing, Geophys. Res. Lett., 42, 557–564, https://doi.org/10.1002/2014GL062015, 2015.
Zhao, C., Lin, L., Wu, F., Wang, Y., Li, Z., Rosenfeld, D., and Wang, Y.: Enlarging rainfall area of tropical cyclones by atmospheric aerosols, Geophys. Res. Lett., 45, 8604–8611, https://doi.org/10.1029/2018GL079427, 2018.
Zhao, C., Yang, Y., Fan, H., Huang, J., Fu, Y., Zhang, X., Kang, S., Cong, Z., Letu, H., and Menenti, M.: Aerosol characteristics and impacts on weather and climate over Tibetan Plateau, Natl. Sci. Rev., 7, 492–495, https://doi.org/10.1093/nsr/nwz184, 2020.
Zheng, B., Tong, D., Li, M., Liu, F., Hong, C., Geng, G., Li, H., Li, X., Peng, L., Qi, J., Yan, L., Zhang, Y., Zhao, H., Zheng, Y., He, K., and Zhang, Q.: Trends in China's anthropogenic emissions since 2010 as the consequence of clean air actions, Atmos. Chem. Phys., 18, 14095–14111, https://doi.org/10.5194/acp-18-14095-2018, 2018.
Zhou, S., Yang, J., Wang, W.-C., Zhao, C., Gong, D., and Shi, P.: An observational study of the effects of aerosols on diurnal variation of heavy rainfall and associated clouds over Beijing–Tianjin–Hebei, Atmos. Chem. Phys., 20, 5211–5229, https://doi.org/10.5194/acp-20-5211-2020, 2020.