the Creative Commons Attribution 4.0 License.
the Creative Commons Attribution 4.0 License.
 | 11 Nov 2021
Examining the competing effects of contemporary land management vs. land cover changes on global air quality
Anthony Y. H. Wong
Our work explores the impact of two important dimensions of land system changes, land use and land cover change (LULCC) as well as direct agricultural reactive nitrogen (Nr) emissions from soils, on ozone (O3) and fine particulate matter (PM2.5) in terms of air quality over contemporary (1992 to 2014) timescales. We account for LULCC and agricultural Nr emissions changes with consistent remote sensing products and new global emission inventories respectively estimating their impacts on global surface O3 and PM2.5 concentrations as well as Nr deposition using the GEOS-Chem global chemical transport model. Over this time period, our model results show that agricultural Nr emission changes cause a reduction of annual mean PM2.5 levels over Europe and northern Asia (up to −2.1 µg m−3) while increasing PM2.5 levels in India, China and the eastern US (up to +3.5 µg m−3). Land cover changes induce small reductions in PM2.5 (up to −0.7 µg m−3) over Amazonia, China and India due to reduced biogenic volatile organic compound (BVOC) emissions and enhanced deposition of aerosol precursor gases (e.g., NO2, SO2). Agricultural Nr emission changes only lead to minor changes (up to ±0.6 ppbv) in annual mean surface O3 levels, mainly over China, India and Myanmar. Meanwhile, our model result suggests a stronger impact of LULCC on surface O3 over the time period across South America; the combination of changes in dry deposition and isoprene emissions results in −0.8 to +1.2 ppbv surface ozone changes. The enhancement of dry deposition reduces the surface ozone level (up to −1 ppbv) over southern China, the eastern US and central Africa. The enhancement of soil NO emission due to crop expansion also contributes to surface ozone changes (up to +0.6 ppbv) over sub-Saharan Africa. In certain regions, the combined effects of LULCC and agricultural Nr emission changes on O3 and PM2.5 air quality can be comparable (>20 %) to anthropogenic emission changes over the same time period. Finally, we calculate that the increase in global agricultural Nr emissions leads to a net increase in global land area () that potentially faces exceedance of the critical Nr load (>5 kg N ha−1 yr−1). Our result demonstrates the impacts of contemporary LULCC and agricultural Nr emission changes on PM2.5 and O3 in terms of air quality, as well as the importance of land system changes for air quality over multidecadal timescales.
- Article
(7223 KB) - Full-text XML
-
Supplement
(1644 KB) - BibTeX
- EndNote


The broad term “land use and land cover change (LULCC)” encapsulates both the anthropogenic (e.g., agricultural expansion) and natural (e.g., ecological succession) dimensions of terrestrial biome changes (Reick et al., 2013), which alter the physical and ecophysiological properties of the land surface. These perturbations alter the transfer and uptake of air pollutants by ecosystems and can also have large impacts on the emission of biogenic volatile organic compounds (BVOCs), which play vital roles in tropospheric ozone (O3) and secondary organic aerosol (SOA) formation (Fu and Tai, 2015; Ganzeveld et al., 2010; Heald and Geddes, 2016; Heald and Spracklen, 2015; Squire et al., 2014; Wu et al., 2012a).
Agricultural activities, in addition to being a large driver of LULCC (e.g., Ellis, 2015; Ellis et al., 2013; Goldewijk et al., 2017; Kaplan et al., 2011), also introduce an enormous amount of reactive nitrogen into the soil (Galloway et al., 2008), which can be emitted into the atmosphere either as oxidized or reduced nitrogen. The reactive nitrogen oxides emitted from soil, NOx (≡ NO + NO2), enhance O3 production when volatile organic compounds (VOCs) are relatively abundant (i.e., NOx-limited regimes) but suppresses O3 production when the concentration of VOCs is relatively low (i.e., VOC-limited regimes) (Sillman et al., 1990). Reactive nitrogen also contributes to aerosol formation. Ammonia (NH3) can combine with nitrate and sulfate ions to form secondary inorganic aerosol, while the emissions of NOx can oxidize further and contribute to particulate nitrate formation (Ansari and Pandis, 1998). Indeed, agricultural emissions are the dominant global anthropogenic source of NH3 (Hoesly et al., 2018) and have been identified as a major contributor to global premature mortality due to particulate matter (PM) pollution (Lelieveld et al., 2015). Trends in atmospheric reactive nitrogen also affect nitrogen deposition (e.g., Geddes and Martin, 2017), with potentially negative impacts on biodiversity (e.g., Bobbink et al., 2010; Payne et al., 2017; WallisDeVries and Bobbink, 2017) and eutrophication of aquatic ecosystems (e.g., Fenn et al., 2003). These ecosystem impacts may contribute to economic loss comparable to the benefits of extra crop output from LULCC and agricultural emissions (Paulot and Jacob, 2014; Sobota et al., 2015).
Even while land cover at a particular location may not change, modifications in human management of the land (e.g., intensification of agriculture, irrigation practices, fertilizer application, selective harvesting) may still be associated with changes in pollutant emission and uptake. An obvious example would be a region where direct agricultural emissions may have changed without any concomitant changes in land cover. Reducing NH3 emission, particularly from the agricultural sector, has been explored as a potent strategy of controlling PM pollution (Giannadaki et al., 2018; Pinder et al., 2007; Pozzer et al., 2017). Bauer et al. (2016) suggest that agricultural emissions are the main source of present-day PM2.5 (fine particulate with an aerodynamic diameter less than 2.5 µm) over the eastern US, Europe and northern China. However, as anthropogenic NOx and SO2 emissions are expected to be lower in the future, some aerosol formation chemistry is expected to become less sensitive to NH3 emissions.
The potential impacts of LULCC and agricultural emission changes on air quality have been explored previously. To date, this work has focused on future projections in land use (Bauer et al., 2016; Ganzeveld et al., 2010; Hardacre et al., 2013; Heald et al., 2008; Squire et al., 2014; Tai et al., 2013; Wu et al., 2012b), contrasted preindustrial estimates of land cover and agricultural emissions with present-day conditions (Heald and Geddes, 2016; Hollaway et al., 2017), or has been regional in focus (Fu and Tai, 2015; Geddes et al., 2015; Silva et al., 2016). For example, Wu et al. (2012) propose that LULCC induced by climate, CO2 abundance and agriculture could significantly affect surface O3 in the future, mainly through modulating dry deposition and isoprene emissions. Over more contemporary timescales (e.g., across the last 20–30 years), Fu et al. (2016), Fu and Tai (2015), and Silva et al. (2016) find that LULCC could have impacts on O3 and PM in terms of air quality over China and Southeast Asia.
Given the large spatial scale of LULCC (e.g., Hansen et al., 2013; Li et al., 2018) and agricultural emission changes (e.g., Crippa et al., 2018; Hoesly et al., 2018; Xu et al., 2019) over recent decades, these two land system changes could be substantially contributing to global trends in O3 and PM pollution. While changes in land cover and agricultural emissions actually occur simultaneously across the globe, they are rarely considered together in simulations of air quality from chemical transport models. The importance of studying these combined processes at the same time was highlighted by Ganzeveld et al. (2010) in their analysis of air quality impacts from future land use and land cover changes. In this study, for example, opposing effects on O3 were simulated, with decreases in tropical forest soil NOx emissions being compensated for by increases in soil NOx emissions associated with agriculture. Still, this work did not explore the concomitant changes in ammonia emissions that would be expected with the changes in agricultural activity. It remains unclear to what extent LULCC may either amplify or offset the impacts of some of the associated agricultural emission changes, how this may vary regionally, and to what extent these land system impacts may compare to concomitant changes resulting from other direct anthropogenic emissions (e.g., emissions from industrial and transport sectors).
Consistent long-term land records of land cover derived from satellite remote sensing observations and global anthropogenic emission inventories have become readily available. This opens an opportunity for a more holistic and observationally constrained assessment of the impacts on global O3 and PM in terms of air quality from contemporary changes in LULCC and agricultural emissions simultaneously, which has been advocated by Ganzeveld et al. (2010), and a comparison of these to the effects of direct anthropogenic emissions. In this study, we model the effects of contemporary LULCC and agriculture emissions changes on global surface O3 and PM2.5 levels and gauge their importance relative to changes in other direct anthropogenic emissions over the same period of time. We also highlight the effect of agricultural emissions changes on nitrogen deposition on land ecosystems. Through our chemical transport model predictions, we aim to identify potential global hotspots of contemporary land changes that may be substantially altering trends in air quality and nitrogen deposition.
To simulate global changes in surface O3 and PM2.5 concentrations due to LULCC, agricultural emissions, and direct anthropogenic emissions over 1992 to 2014, we use the GEOS-Chem chemical transport model (version 12.7.0, available at https://doi.org/10.5281/zenodo.3634864). We choose our timeframe due to the availability of consistent high-resolution remote sensing products (PFT and LAI maps) and concurrent global emission inventories. We define “direct anthropogenic” and “agricultural” emissions separately in more detail below.
We perform five sets of simulations summarized in Table 1: (1) a “baseline” scenario in which land cover, agricultural emissions and direct anthropogenic emissions are all set to 1992 levels; (2) an “anthropogenic emission” scenario in which direct anthropogenic emissions are updated to 2014 levels; (3) an “anthropogenic emissions and land cover change” scenario in which anthropogenic emissions remain updated to 2014, with land cover inputs now prescribed based on updated 2014 data (Xiao et al., 2016); and (4) an “anthropogenic emissions, land cover and agricultural emission change” scenario in which direct anthropogenic emissions and land cover inputs remain updated to 2014, with agricultural emissions also updated to 2014 levels. To test the chemical sensitivity of our results, (5) is performed with anthropogenic emissions held at 1992 levels, but land cover change and agricultural emissions are updated to 2014 levels.
Table 1Model configurations. The numbers in the top row are referred to in the main text.

The role of direct anthropogenic emission changes can be evaluated by comparing simulations (1) and (2); the additional role played by land cover changes over this time period is evaluated by comparing simulations (2) and (3); and finally the additional impact of agricultural emission changes is evaluated by comparing simulations (3) and (4). The latter two effects will be the focus of this paper, but we compare these to the role of direct anthropogenic emission changes for context. Since changes in surface ozone and PM2.5 should be sensitive to the NOx-to-VOC ratio and availability of NO and SO ions, the sensitivity of the effects from land cover change and agricultural emission changes to anthropogenic emission changes can be quantified by evaluating simulation (5).
We use assimilated meteorological fields from Modern-Era Retrospective analysis for Research and Applications Version 2 (MERRA-2) (Gelaro et al., 2017) to drive GEOS-Chem. All simulations are carried out at 2∘ latitude by 2.5∘ longitude resolution over the globe, using identical meteorological fields from 2011 to 2014 in order to exclude meteorological variability from the analysis. The output from 2011 is discarded as spin-up. The GEOS-Chem model simulates O3 chemistry with a comprehensive HOx−NOx−VOC−O3−BrOx chemical mechanism (Bey et al., 2001; Mao et al., 2013). Gaseous dry deposition follows Wang et al. (1998) and Wesely (1989), while particle deposition follows Zhang et al. (2001). In GEOS-Chem, the surface exchange modules are unidirectional (which implies that the effects of bidirectional exchanges of trace gases are not explicitly modeled). In certain regions for which the Community Emission Data System (CEDS) inventory scales the calculated emissions to a regional inventory, the extent of accounting for bidirectional exchange may depend on the underlying assumptions in the regional inventory modeling. For example, agricultural ammonia emissions from NEI for the United States include considering bidirectional ammonia exchange modeling from the Community Multiscale Air Quality Modeling System (CMAQ) (U.S. EPA, 2018). However, we cannot comment with certainty on how this is treated elsewhere across the globe, so we assume that neglecting bidirectional exchange of ammonia (and other species for which an atmospheric compensation point may exist) introduces some uncertainty in our simulation (which we discuss in a subsequent section). Wet deposition is described by Liu et al. (2001) with updates from Amos et al. (2012) and Wang et al. (2011, 2014). The recent update from Luo et al. (2019) on wet deposition parameterization is also included to improve model–observation agreement for sulfate–nitrate–ammonium (SNA) aerosol. The thermodynamics and gas–aerosol partitioning of the NH3−H2SO4−HNO3 system are simulated by ISORROPIA II module (Fountoukis and Nenes, 2007). A simple yield-based secondary organic aerosol (SOA) estimate is also included (Kim et al., 2015). Other types of aerosol represented in the model include sea salt, dust, primary black carbon (BC) and organic carbon (OC). The total PM2.5 mass is then calculated at 35 % relative humidity for consistency with the measurement standard in the US.
We use anthropogenic and agricultural emissions based on the Community Emission Data System (CEDS) inventory (Hoesly et al., 2018), which contains the estimates of anthropogenic NOx, non-methane volatile organic compounds (NMVOCs), CO, BC, OC, SO2 and NH3 emissions harmonized from a wide range of global and regional inventories. In this inventory, emissions are from six major sectors: energy production, industry, transportation, RCO (residential, commercial, other), agriculture and waste. For this study, “agricultural emissions” specifically refer to NOx and NH3 emitted from fertilizer application and manure management, which correspond directly to agricultural nitrogen input. We do not consider the changes in agriculture for other trace species (e.g., CH4, SO2, CO). For simplicity, we assume that agricultural emissions from fertilizer application in CEDS represent “above-canopy” emissions to the atmosphere (instead of making assumptions about the implicit treatment of canopy reduction over each region). We note that the fertilizer emissions represent only a fraction of the total agricultural NH3 emissions we are considering here (e.g., which also include livestock operation) so that uncertainty in canopy reduction will only affect a fraction of the total. Likewise, fertilizer NOx emissions are small compared to the total soil NOx emissions (for which canopy reduction is accounted for online in the Hudman et al., 2012, parameterization).
Biogenic volatile organic compound emissions are calculated by the Model of Emissions of Gases and Aerosols from Nature (MEGAN) v2.1 (Guenther et al., 2012). Soil NOx emission follows Hudman et al. (2012), with fertilizer emissions zeroed out to avoid double counting with the agricultural NOx emission in the CEDS inventory. Fire (Global Fire Emissions Database v4.1; Van Der Werf et al., 2017) and lightning (Murray et al., 2012) emissions are held constant at the 2014 level.
We use the European Space Agency Climate Change Initiative (ESA CCI) land cover map (Li et al., 2018) to characterize LULCC and drive the biosphere–atmosphere emission fluxes in our simulations. The ESA CCI land cover map is a consistent global annual land cover time series derived from satellite observations from the AVHRR, MERIS, SOPTVGT and PROBA-V instruments. It has a native spatial resolution of 300 m following the United Nations Land Cover Classification System. Time-consistent land surface characterization also requires leaf area index (LAI) data. We use the Global Land Surface Satellite (GLASS) product (Xiao et al., 2016) (retrieved from http://globalchange.bnu.edu.cn/, last access: 15 May 2020), which is a global LAI time series combining AVHRR and MODIS observations. The 3-year average (1991–1993 average LAI for 1992 land cover, 2013–2015 average LAI for 2014 land cover) is used as input for LAI to GEOS-Chem to reduce the possible effect of interannual variability.
This satellite-derived land surface characterization on its own is not directly compatible with the input to the vegetation-related modules in GEOS-Chem; it thus requires further harmonization (dry deposition, BVOC emissions, soil NOx emissions), which is a common problem for simulations involving land change (e.g., Geddes et al., 2016). We first aggregate and process the ESACCI land cover map with the tool and crosswalk table provided with the land cover product to derive the percentage coverage of plant functional type (PFT) at 0.05∘ resolution, which is the native resolution of GLASS LAI. The dominant surface type can be readily mapped to the 11 deposition surface types in the Wesely (1989) dry deposition model. We adopt the approach of Geddes et al. (2016) to replace roughness length (z0) from assimilated meteorology with that prescribed for each deposition surface type. We ignore changes in displacement height as they are expected to be much less important than the changes in zo (Text S1 in the Supplement). To derive the MODIS–Köppen type land map (Steinkamp and Lawrence, 2011) required for the soil NOx module, we first translate the PFT map according to the International Geosphere–Biosphere Programme (IGBP) land cover classification system (available at: http://www.eomf.ou.edu/static/IGBP.pdf, last access: 15 May 2020). We use global monthly temperature climatology (Matsuura and Willmott, 2012) to further differentiate the land types by climate with criteria outlined by Kottek et al. (2006). Finally, the ESA CCI PFT map is converted to a Community Land Model (CLM) PFT map, which is required for the MEGAN BVOC emissions module, by the temperature criteria specified by Bonan et al. (2002). As the method of deriving the C3-to-C4 grass ratio was subsequently updated (Lawrence and Chase, 2007), this ratio is directly taken from the CLM land surface dataset.
In the Supplement, we provide an evaluation of the annual mean simulated SNA aerosol mass concentration and surface O3 mixing ratios from simulation (4) (representative of 2014 conditions) with globally available observations from the same time period. In general, the model captures the spatial distributions of individual SNA species reasonably well (Fig. S1 in the Supplement). The model is able to capture regional annual means of individual SNA species (Table S1 in the Supplement) over Europe. Over the US and China, where annual means of all SNA species are underestimated by 21 %–55 %, and in regions covered by the Acid Deposition Monitoring Network in East Asia (Japan, Korea and southeast Asia) where SO is underestimated by 36 %, we expect the model may underestimate the sensitivity of SNA concentration to NH3 emission perturbations. This may imply that results from our study should be interpreted as conservative. Figure S2 shows the reasonable agreement on annual mean surface O3 between our model output and the gridded observation dataset from Sofen et al. (2016) (mean bias ppbv and mean absolute error =3.97 ppbv). Our model therefore captures the present-day annual means of surface SNA and O3 concentrations, providing a basis for our subsequent analyses. We also provide definitions for geographical regions, which largely follow Integrated Modeling of Global Environmental Change (IMAGE) 2.4 classifications, in Table S2.
Table 2 shows the changes in the global coverage of the major land cover types from 1992 to 2014 derived by the ESA CCI land cover product. The coverage of managed grass (including cropland and pasture) and built-up area, both of which are unmistakably related to human activities, has increased mainly at the expense of forest coverage. This is consistent with a global trend in deforestation over this period. Figure 1 shows the spatial distribution of changes in fractional coverage of the major land cover types. Expansion of agricultural land at the expense of broadleaf forest coverage is most notable in South America and Southeast Asia, which is well-documented in other studies based on remote sensing (Hansen et al., 2013) and national surveys (Keenan et al., 2015). The expansion of agricultural land over this time period is also observed in central Asia, southern China and Africa, but usually at the expense of land types other than broadleaf forests (mainly primary grassland and needleleaf forests). Meanwhile, transitions from agricultural land to forests and built-up areas are observed in northern China and eastern Europe, consistent with the findings of Potapov et al. (2015) and Lai et al. (2016).
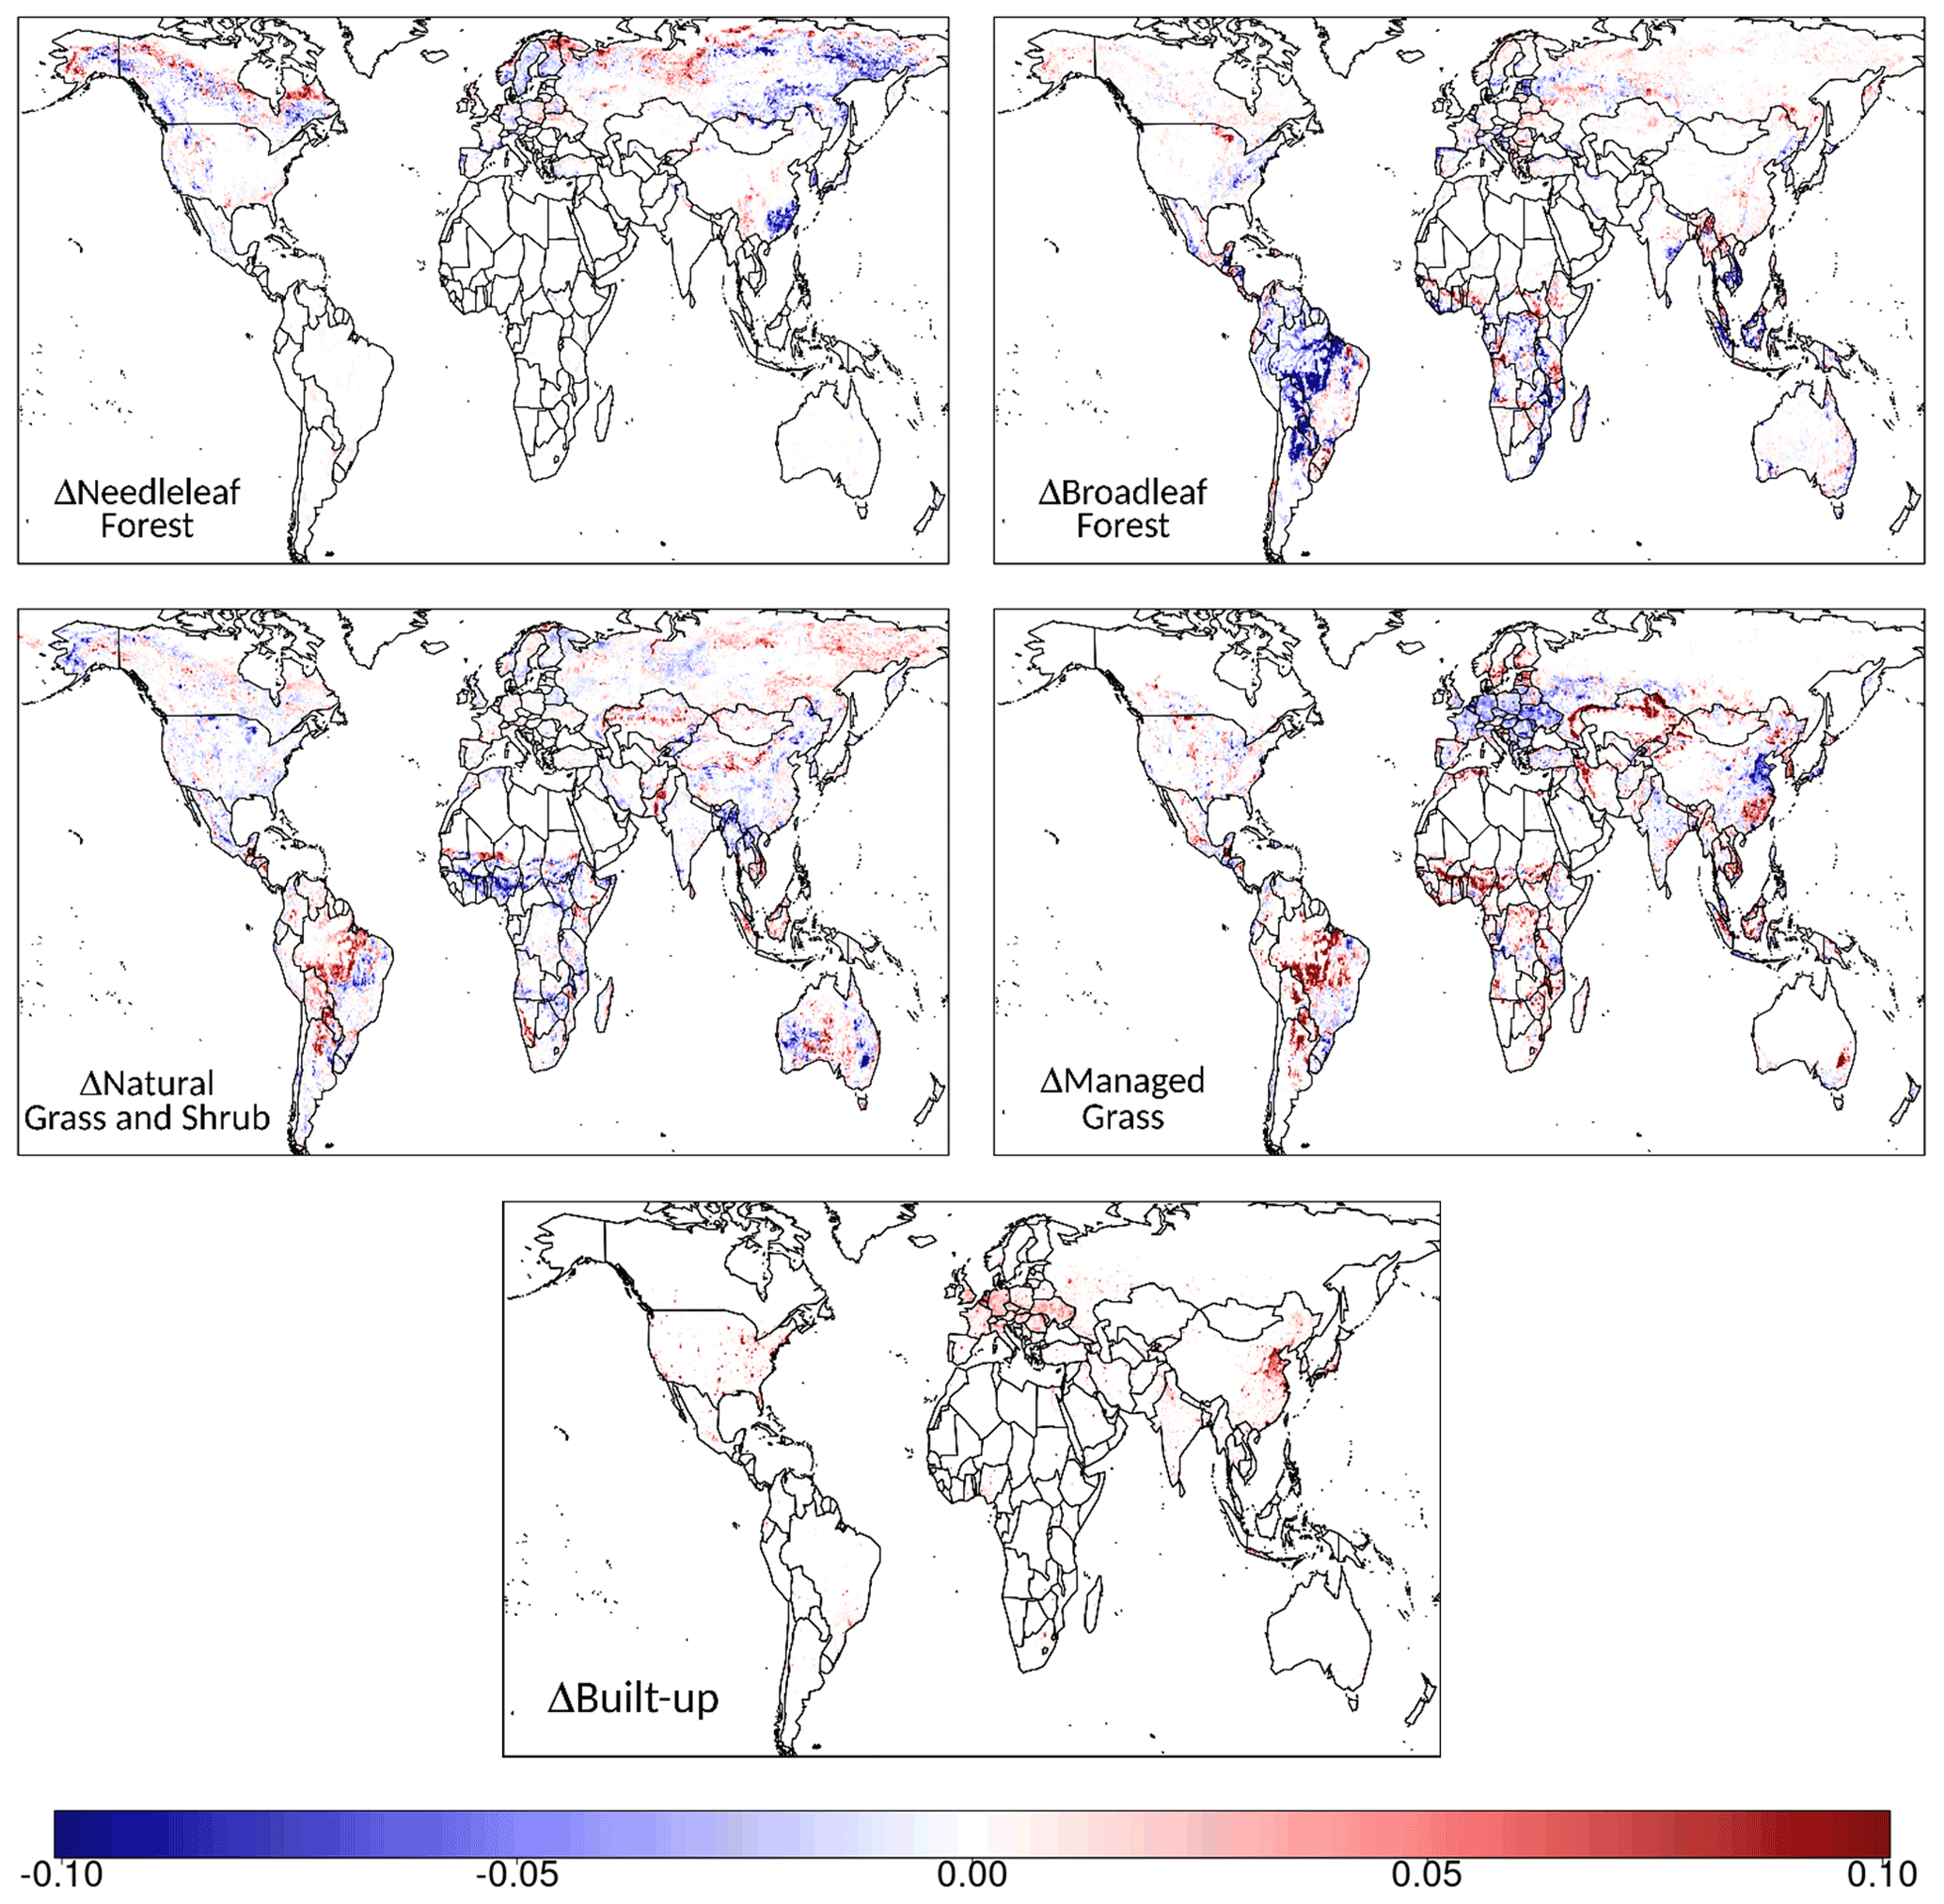
Figure 1Global spatial patterns of 2014–1992 LULCC characterized by the changes in fractional coverage within a grid box (unitless) of major land cover types derived from the ESA CCI land cover product.
Table 2Global LULCC summarized by the changes in coverage of different land types (2014–1992) from the ESACCI land cover product.
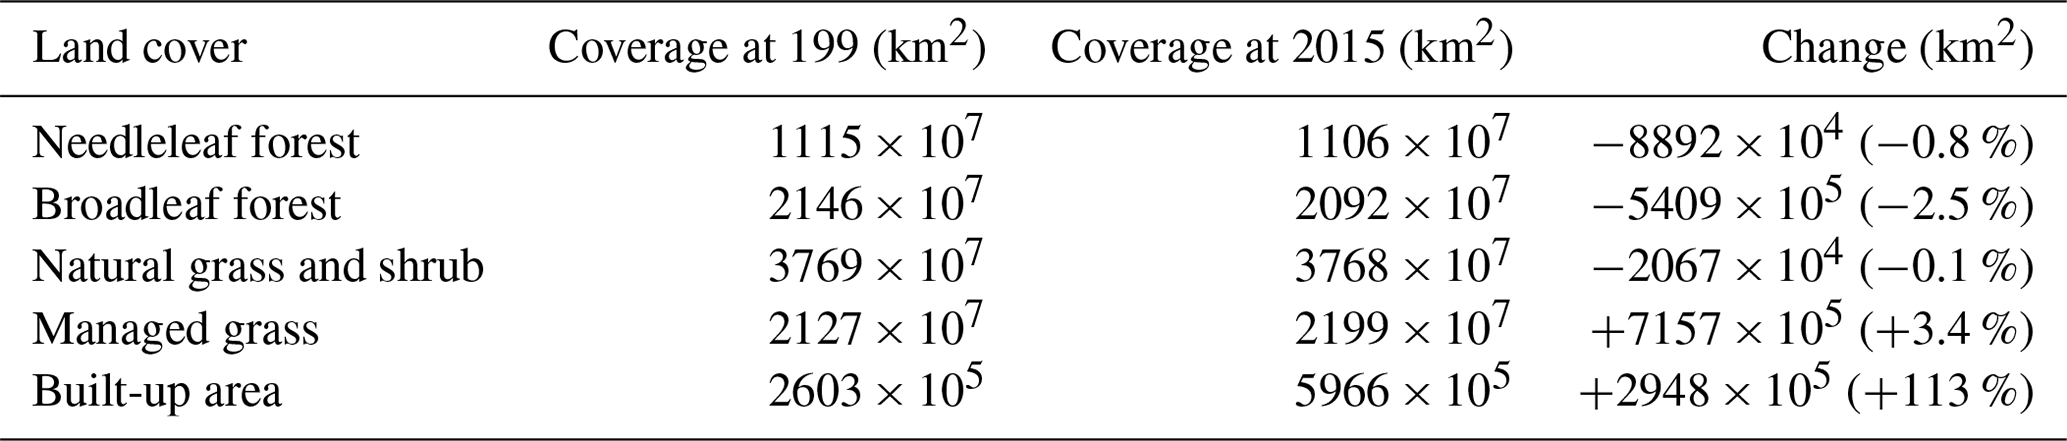
Figure 2 shows the global changes in the 3-year (2012–2014 minus 1991–1993) annual mean LAI calculated from the GLASS LAI dataset. Over southern China and South America, the area with regionally consistent deforestation experience general increases in LAI, while the opposite effect is observed in the Sahel and the former Soviet Union. In Europe, LAI increases in most parts despite a fairly consistent retraction of agricultural land being observed. The agricultural expansion and deforestation over Southeast Asia are mostly concurrent with the LAI decreases. LAI increases notably in northern China where agricultural land decreases. The fact that LAI change can be driven by factors other than changes in land cover type (e.g., temperature, precipitation, atmospheric CO2 level) (e.g., Zhu et al., 2016) may explain the regionally divergent trend response of LAI to agricultural land use change. For example, the general increase in LAI in China is not only driven by changes in biome types, but also the greening within cropland (mainly attributable to agricultural intensification) and forests (mainly attributable to ambitious tree planting programs) (Chen et al., 2019). Similarly, some deforested land in South America might have been cultivated intensively, resulting in an increase rather decrease in LAI. We also note that since the relationship between satellite-derived surface reflectance and retrieved LAI depends on land cover, the use of a static land cover map in long-term LAI retrievals (Claverie et al., 2016; Xiao et al., 2016; Zhu et al., 2013) may not fully capture the effect of LULCC on LAI (Fang et al., 2013). In particular, Fang et al. (2013) show that LAI could be substantially overestimated when grasses and crops are misclassified as forest. We may therefore overestimate dry deposition velocity over regions with significant deforestation. Such an impact on biogenic emissions is secondary as biogenic emissions are expected to be much more sensitive to land cover type than LAI (e.g., Guenther et al., 2012).
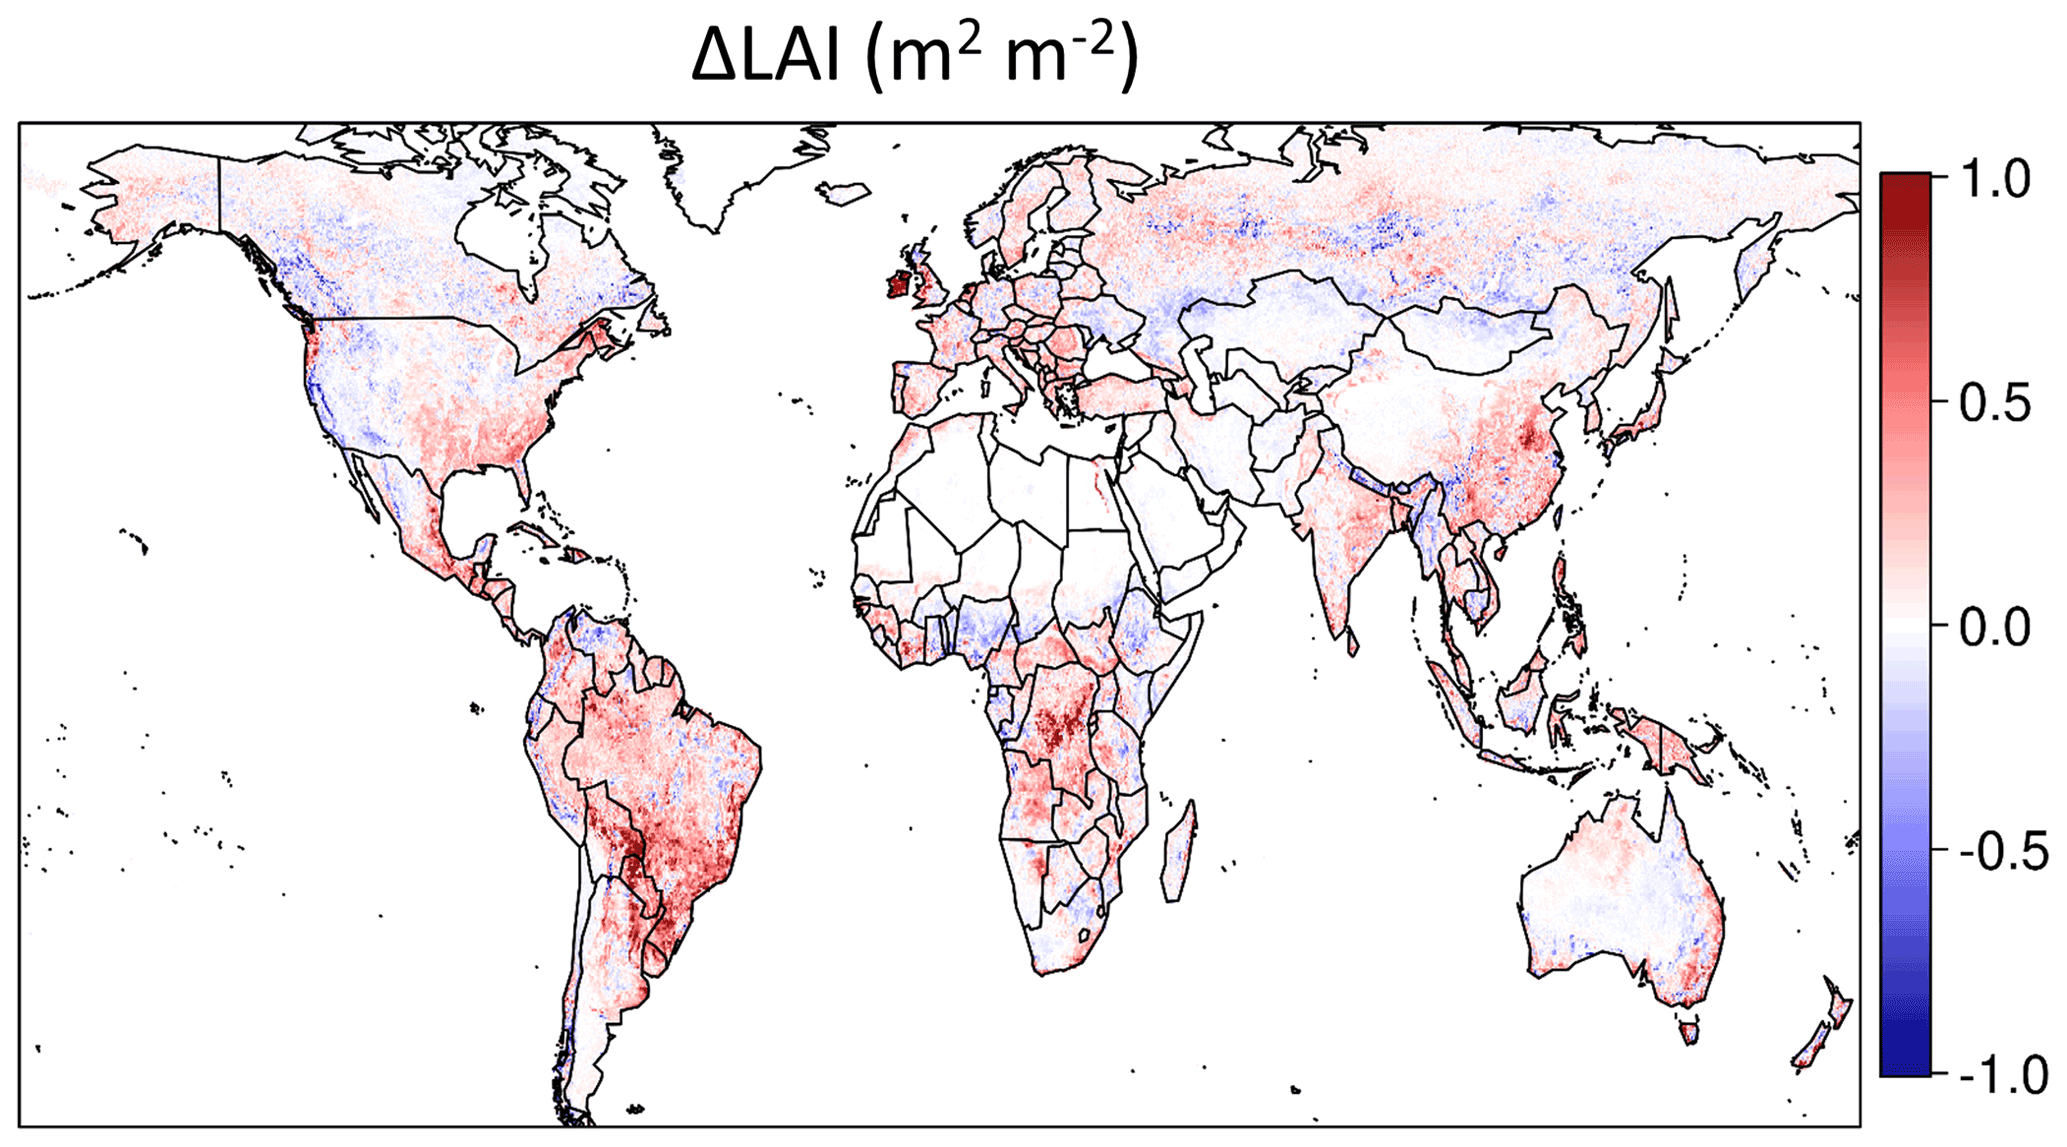
Figure 2Changes in 3-year mean annual leaf area index (LAI) derived from the Global Land Surface Satellite (GLASS) (2012 to 2014 average minus 1991 to 1993 average).
These changes in land cover produce changes in the biogenic fluxes of reactive trace gases between the Earth's surface and atmosphere derived by GEOS-Chem. Figure 3a shows the calculated changes in annual mean isoprene emission due to land cover change over 1992 to 2014 and suggests that global isoprene emission could have decreased by 5.12 Tg yr−1 (−1.5 %). The largest local reductions in isoprene emissions (up to 30 %) are observed in parts of South America, where deforestation from highly isoprene-emitting broadleaf forests is most strongly observed. We note that the decrease in isoprene emission simulated in Southeast Asia does not agree with the result from Silva et al. (2016), since our remote sensing data do not have a separate land cover class for oil palm plantations, which have expanded dramatically in the region. Our model therefore may not capture the full effects of LULCC on isoprene emission and its effect on PM2.5 and O3 over the region. Elsewhere in the world, the signals of land cover change in isoprene emissions are mostly small and follow the local patterns of changes in LAI. Changes in monoterpene (<5 ng m−2 s−1) and sesquiterpene (<1 ng m−2 s−1) emissions are relatively small.
Figure 3Changes in annual mean (a) isoprene emissions (ΔIsop), (b) soil NO emissions (ΔSoil NO) and (c) O3 dry deposition velocity (Δvd) due to LULCC over 1992 to 2014.
Figure 3b shows the changes in annual mean soil NO emission due to LULCC, which represent the change in soil emission driven purely by LAI (which affects canopy uptake) and land cover changes (which affects both the biome-based emission factor and canopy uptake) (i.e., without considering the changes in nitrogen input). LULCC leads to a small signal of +0.04 Tg yr−1 (+0.6 %) in global soil NO emissions. The magnitude of changes in soil NO emissions induced by LULCC is comparable to that in agricultural NO emission inventories (see below) over certain regions (e.g., South America, Australia, Africa). Relatively large increases in soil NO are simulated over western Africa due to both cropland expansion and LAI reduction, which leads to a smaller canopy reduction factor and larger emission factor.
Figure 3c shows the changes in annual mean O3 dry deposition velocity (vd), which also closely follow the pattern of LAI changes. Slight increases in vd are observed in China, India, the southeastern US, Central America, South America, Europe and southern Africa. In Southeast Asia vd decreases concurrently with deforestation and reduction in LAI. In central Brazil, the increase in LAI is offset by the deforestation of tropical evergreen broadleaf forests that have higher vd than other land types (Song-Miao Fan et al., 1990; Wang et al., 1998), leading to small overall change in vd. Likewise, despite deforestation observed further south, these losses are offset by strong increases in LAI so that vd increases by up to 0.1 cm s−1. Significant changes in the vd of O3 due to LAI also imply that vd of other relevant trace gases (e.g., NO2, SO2) would also be perturbed by land cover change in our model, which will be discussed briefly in the subsequent section.
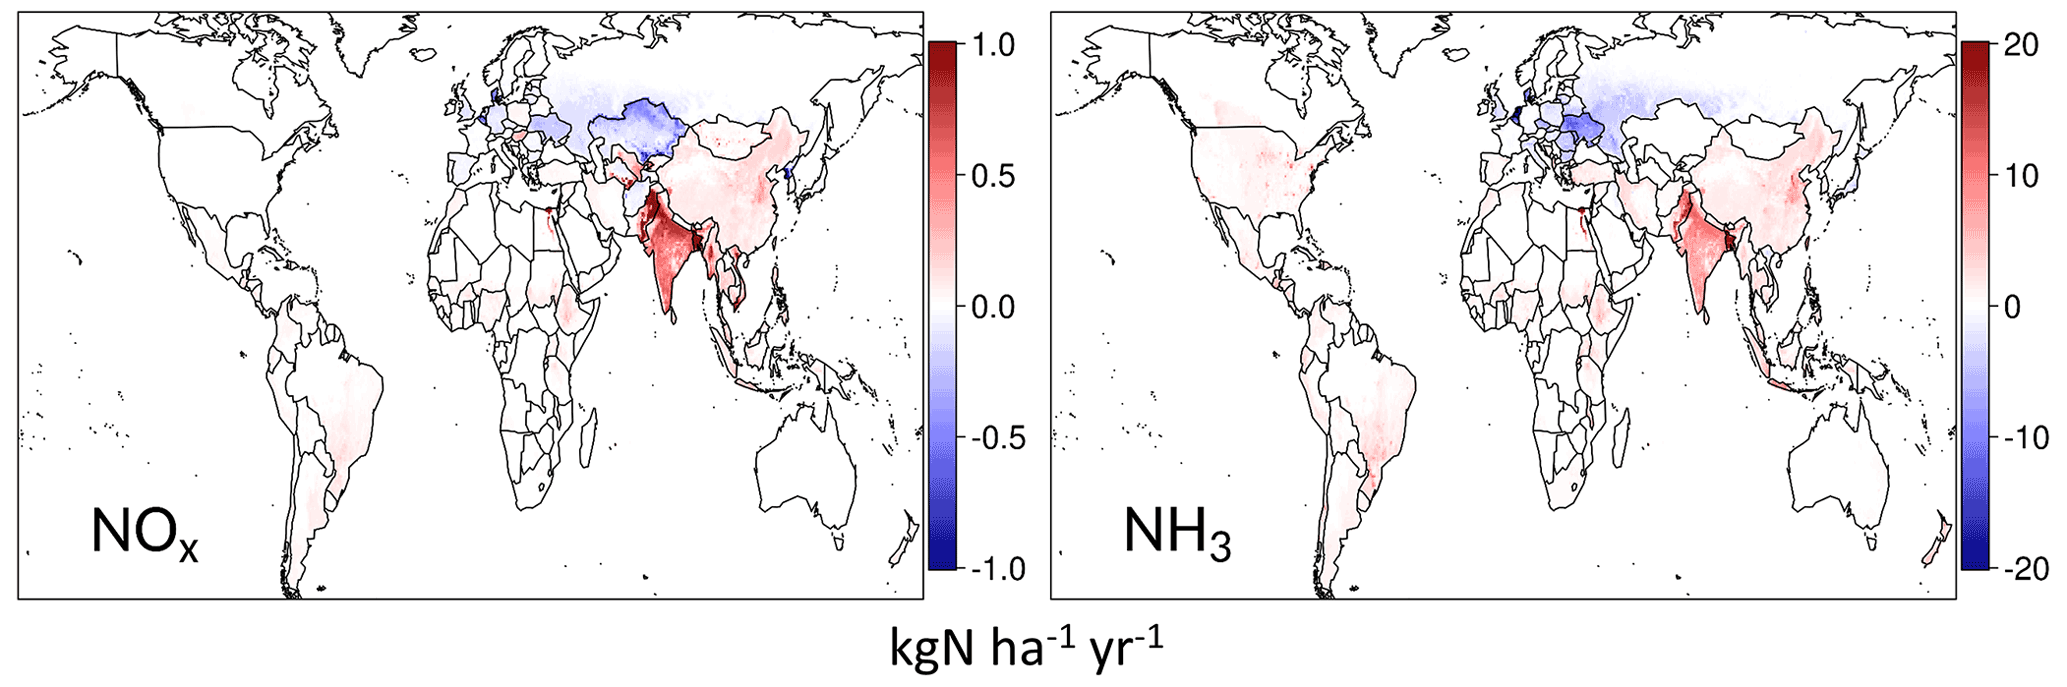
Figure 4Changes in agricultural NH3 and NOx emissions (2014–1992) as implemented by the Community Emissions Data System (CEDS).
Figure 4 shows the changes in agricultural NH3 and NOx emissions between 1992 and 2014, which consists mostly of emissions from fertilizer application and manure management (Hoesly et al., 2018). According to the CEDS inventory, global direct agricultural NH3 emissions have increased by 7.6 Tg N yr−1 since 1992, equivalent to a 19 % increase in total anthropogenic NH3 emissions. Direct agricultural soil NOx emissions have increased by 0.37 Tg N yr−1 since 1992, and while this is a substantial increase in agricultural soil NOx emissions (26 %), it represents only a 1 % increase in total anthropogenic NOx emissions.
The increases in agricultural emissions are most substantial over South Asia, followed by China, parts of the Middle East, Southeast Asia and South America, and to a lesser degree Central America, North America and the Sahel. The sharpest decline of agricultural emissions is observed in Europe and the former Soviet Union, followed by milder declines over Japan and Korea. The particularly sharp decline of agricultural emissions in Europe is mainly attributable to the implementation of emission control protocols (National Emissions Ceilings, or NECs, and Integrated Pollution Prevention and Control, or IPPC, directives) within the European Union (Skjøth and Hertel, 2013). According to the CEDS inventory, changes in agricultural emissions dominate the trend of total NH3 emissions in all major regions except Africa, where a large part of the NH3 emissions trend is attributable to the waste management and RCO (residential, commercial, other) sectors (Hoesly et al., 2018) (Fig. S3). In contrast, the increase in agricultural emissions of NOx does not contribute significantly to the global increase in total NOx emissions over our period of concern.
We note that the hotspots of change in managed land cover and of change in agricultural emissions do not always overlap. For example, agricultural emissions increase significantly over northern China and northern India, while the cropland coverage over those regions does not increase correspondingly over this same period. Such agricultural intensification in turn significantly contributes to the positive LAI trend over the above regions (Chen et al., 2019). Similarly, agricultural emissions have declined over Kazakhstan, while the area of managed land has not decreased significantly. This highlights a degree of independence between land management and LULCC, with both being components of land change but having potentially distinct spatial patterns and impacts on air quality. This also highlights the importance of treating both in our chemical transport model simulations as they occur contemporaneously around the globe and may have different impacts on air quality.
Figure 5 shows the modeled impacts of LULCC, changes in agricultural emissions and the combined effects of both on annual mean surface PM2.5 (under 2014 anthropogenic emissions). We have calculated the impacts of LULCC on PM2.5 (ΔPM2.5,LULCC) as the difference in PM2.5 predicted by simulation (3) and simulation (2), the impacts of agricultural emission changes on PM2.5 (ΔPM2.5,agr_emis) as the difference in PM2.5 predicted by simulation (4) and simulation (3), and the impacts of these combined (ΔPM) as the difference in PM2.5 predicted in simulation (4) and simulation (2) (see Table 1).
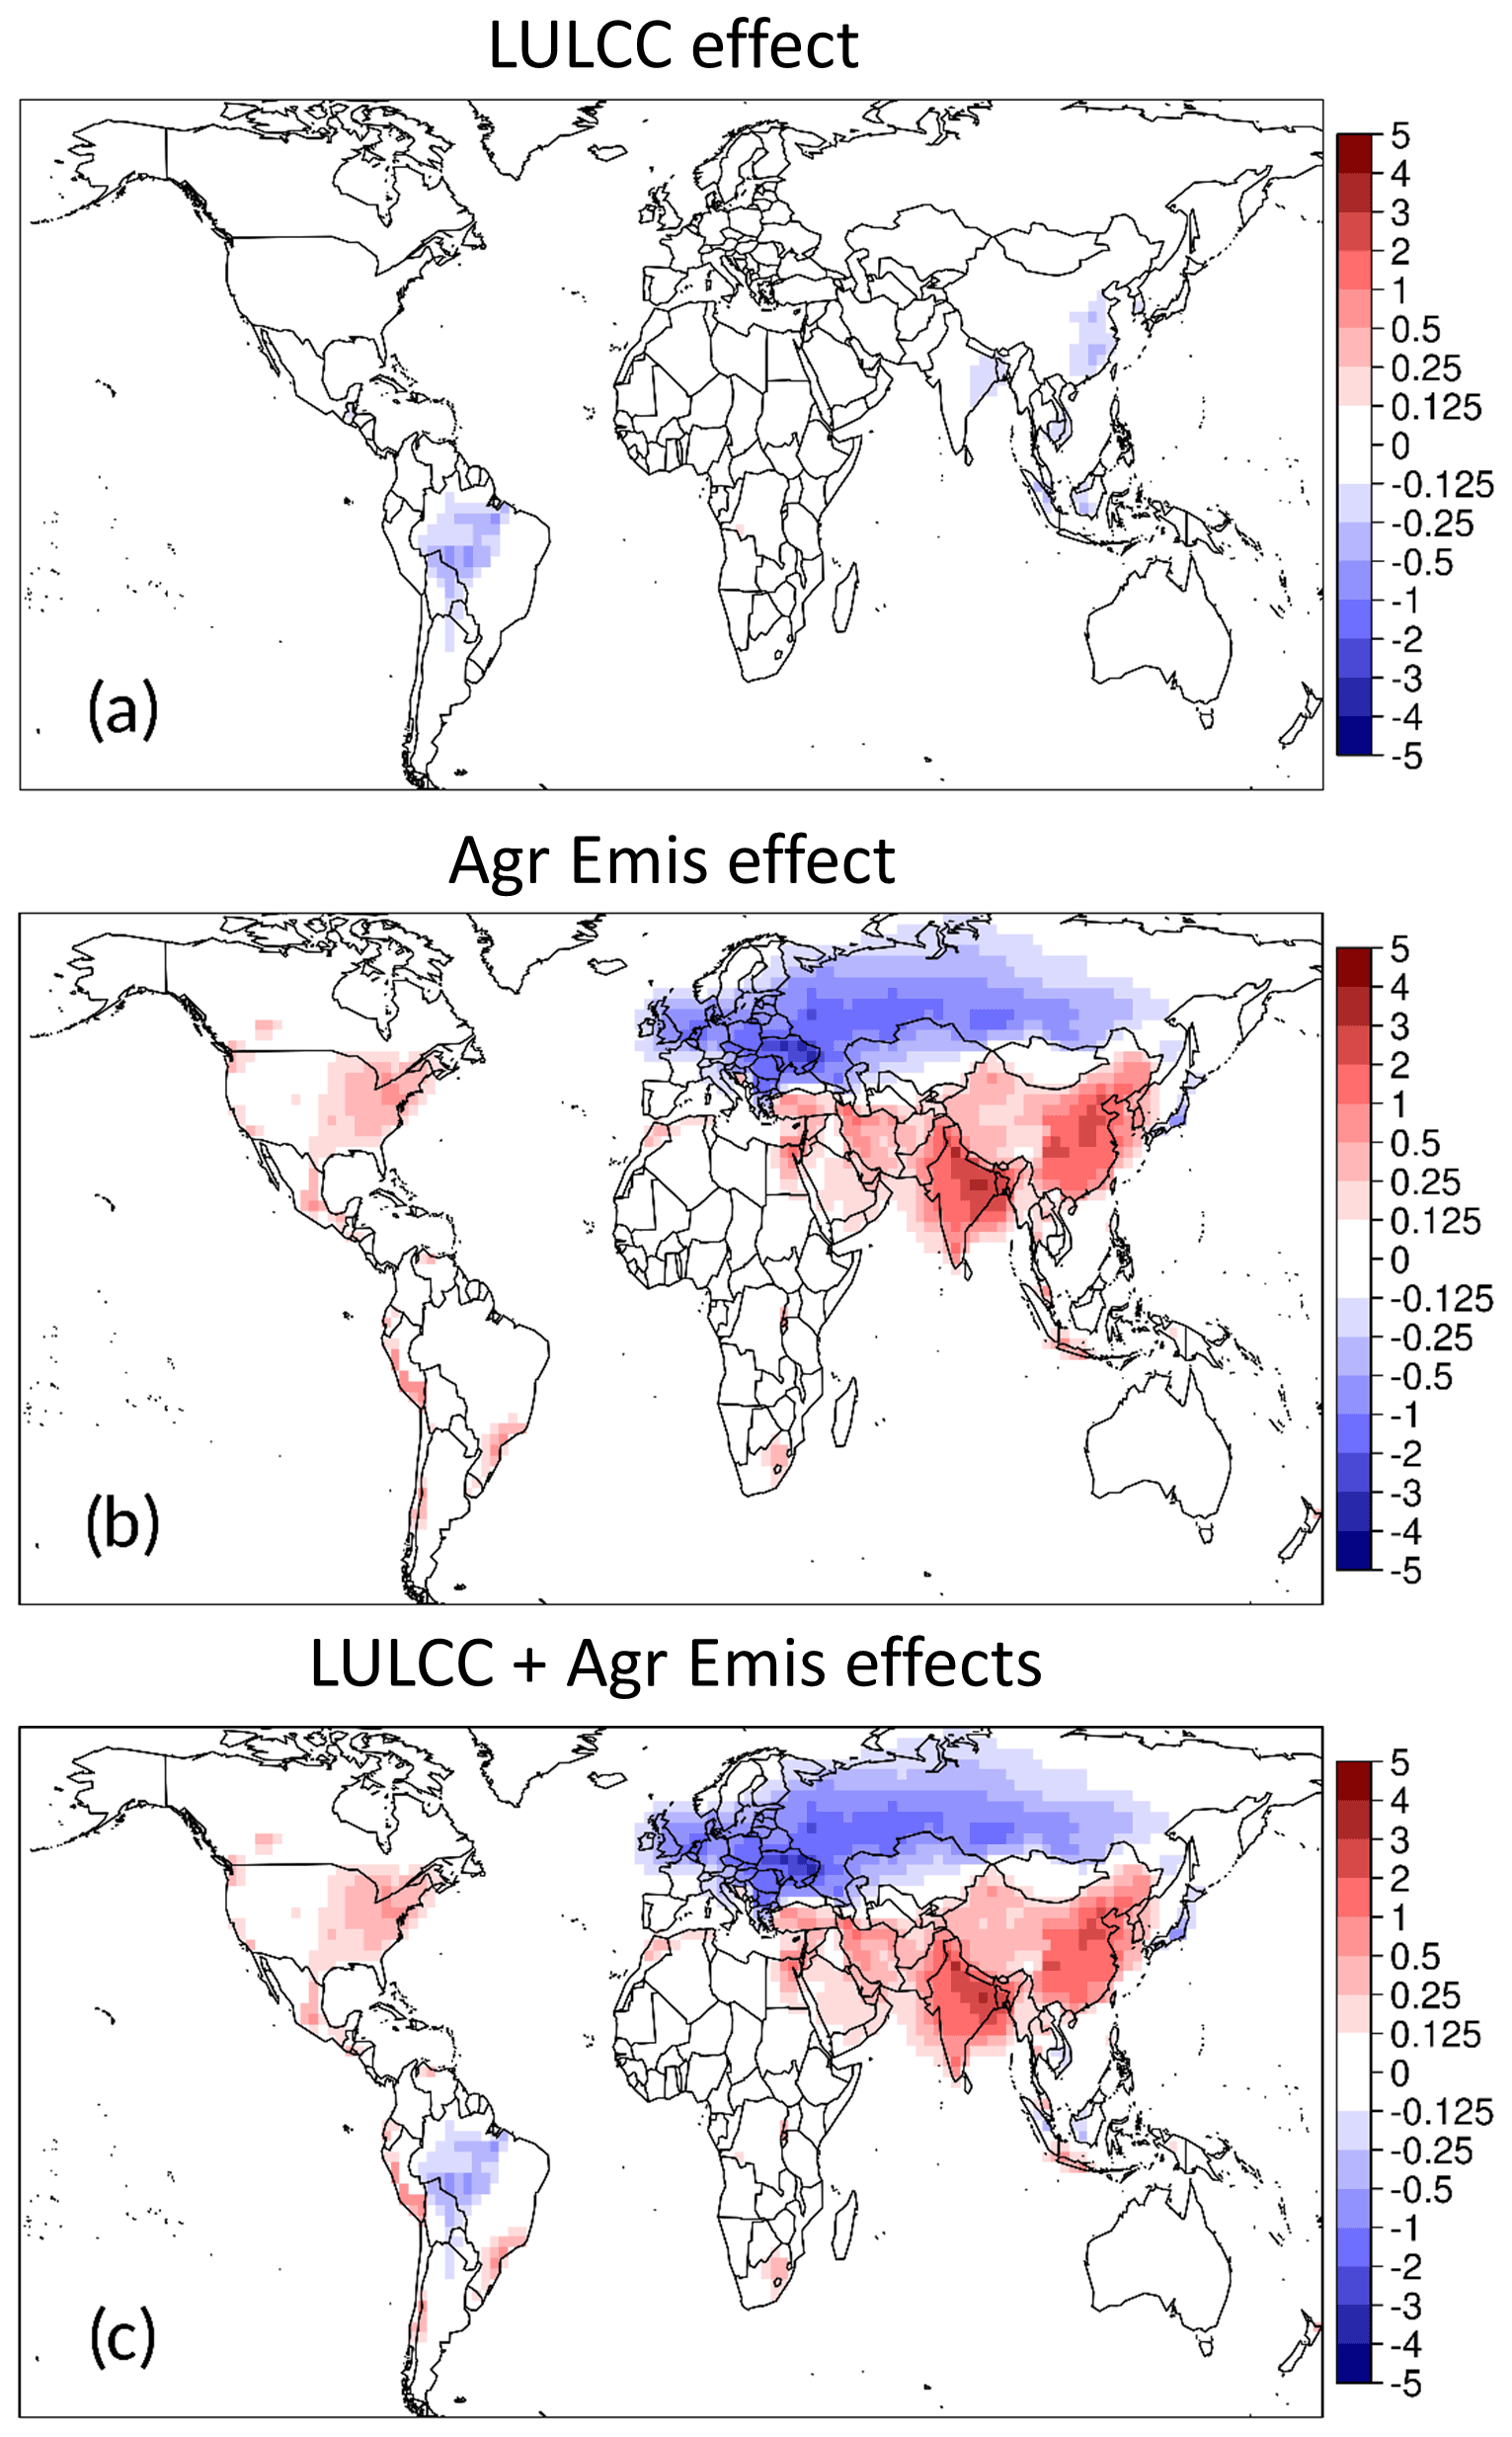
Figure 5Simulated changes in annual mean surface PM2.5 due to (a) LULCC, (b) agricultural emission (“Agr Emis”) changes, and (c) the combined effects of agricultural emissions and LULCC.
The effect of LULCC on PM2.5 (Fig. 5a) is mainly through perturbing BVOC emissions as they are a precursor to SOA. Over parts of South America and Southeast Asia, where isoprene emissions drop significantly due to deforestation, PM2.5 is reduced by up to 0.7 µg m−3. Land cover changes also lead to changes in the dry deposition velocity of some SNA precursor gases for which stomatal uptake is an important deposition pathway (e.g., NO2 and SO2, Fig. S4). Indeed, over India and China, where our model suggests high levels of SNA aerosol precursors, contemporary LULCC enhances dry deposition of these constituents, which reduces PM2.5 overall by up to 0.3 µg m−3, similar to the finding of Fu et al. (2016).
We find that agricultural emissions generally have a larger impact on annual mean surface PM2.5 level (Fig. 5b) than LULCC. The largest increases in annual mean surface PM2.5 due to changes in agricultural emissions over 1992 to 2014 occur across China (+0.7 µg m−3) and India (+1.6 µg m−3). Over some hotspots in the two countries (e.g., northwestern India and the North China Plain), the local changes in PM2.5 exceed 3.5 µg m−3, supporting the previously emphasized importance of controlling NH3 emissions for PM in terms of air quality in China (Fu et al., 2017), but potentially India as well. Some moderate increases (<2 µg m−3 in most locations) in annual mean PM2.5 concentrations are also observed in the Middle East, North America, Central America and South America.
The largest decreases (up to 2.1 µg m−3) in annual mean PM2.5 due to changes in agricultural emissions are simulated in central and eastern Europe and the former Soviet Union. Despite comparable reductions in agricultural NH3 emissions, decreases in PM2.5 over western Europe are smaller because of weaker sensitivity of SNA aerosol to NH3 emissions, which is consistent with the finding of Lee et al. (2015) and Pozzer et al. (2017). In general, reductions in annual mean PM2.5 due to agricultural emission changes simulated over western Europe are weaker than over central and eastern Europe and the former Soviet Union.
Figure 5c shows the combined effect of agricultural emissions and LULCC on annual mean surface PM2.5, which we have already shown is mostly dominated by the effect of agricultural emissions. Nevertheless, we find that the effects of LULCC are able to partially offset the increase in PM2.5 due to agricultural emissions changes over China and India. These offsets are occurring in densely populated areas so that the effects on population-weighted average (method described in Text S2 in the Supplement) PM2.5 concentrations (see below), and therefore potentially exposure, may be noteworthy. This is discussed in further detail below.
We note that the difference between Fig. S5a and 5c illustrates how ΔPM is sensitive to the anthropogenic emissions background. We find that surface PM2.5 over the US, Europe and the former Soviet Union is less sensitive to NH3 emissions under the 2014 anthropogenic emissions background, since both SO2 and NOx emissions in these regions have decreased significantly (>42 % for NOx and >58 % for SO2) over 1992 to 2014. The opposite is simulated over China and India, where SO2 and NOx emissions have increased by >50 %.
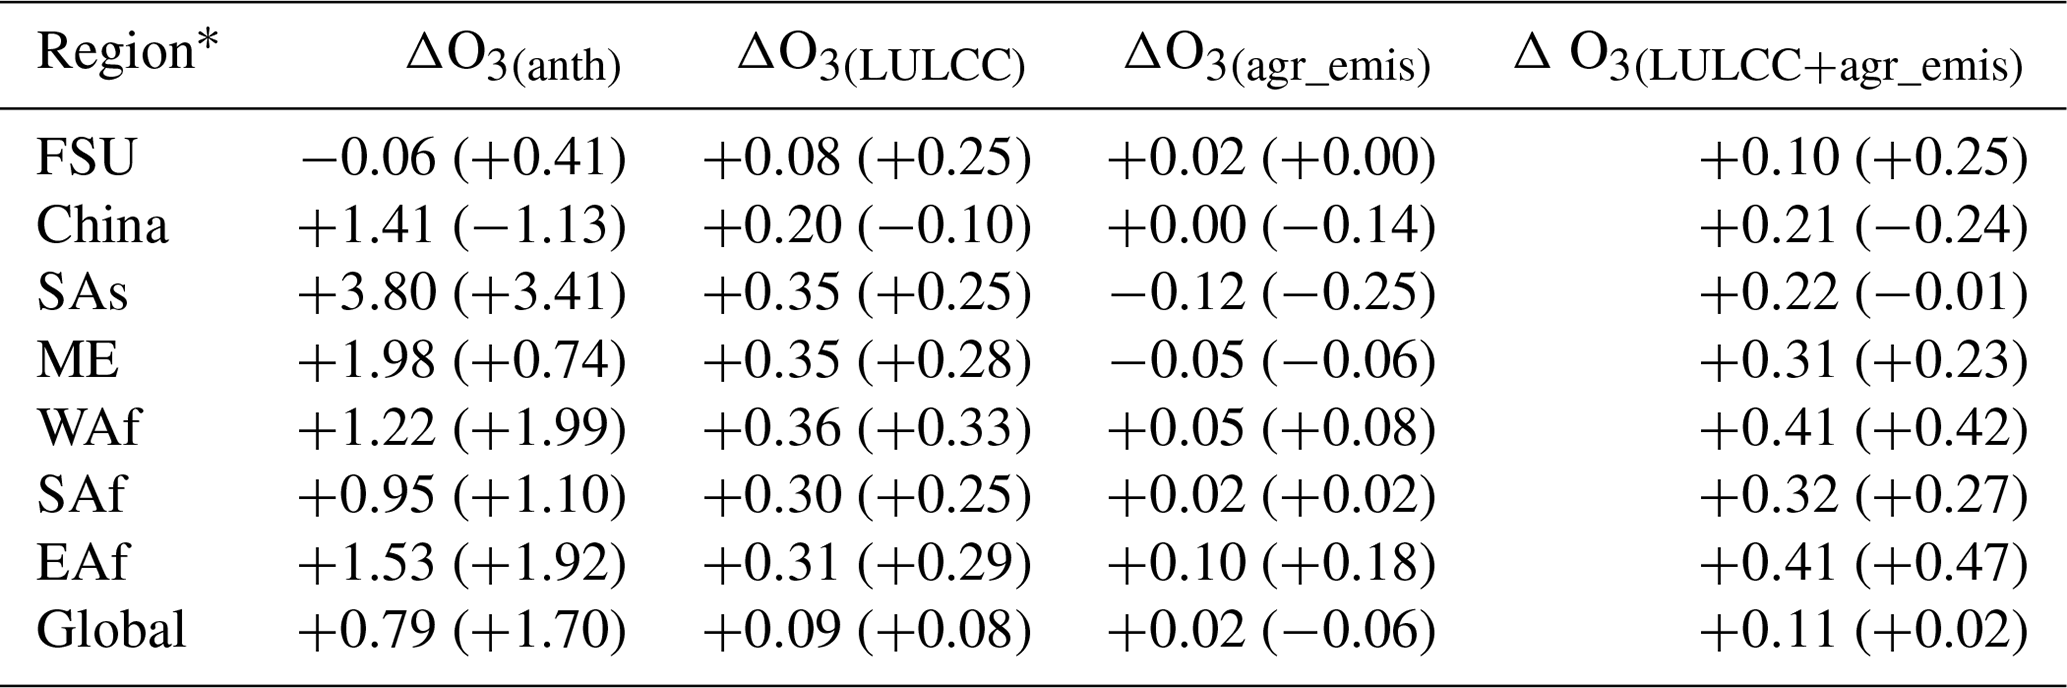
Table 3 summarizes the simulated effects of LULCC and agricultural emission changes on PM2.5 in terms of air quality and compares their magnitudes with the concomitant effects from direct anthropogenic emission changes (ΔPM2.5,anth) over the same time period. We additionally compare area-averaged and population-weighted global and regional metrics. While the resolution of our simulations does not capture urban-scale gradients and nonlinearities in urban chemistry, the use of population weighting allows us to explore whether signals of change in land cover or land management are concentrated over areas of high population or whether they are primarily observed over less populated areas.
Table 3Changes in area-averaged and population-weighted (in parentheses) annual mean surface PM2.5 concentrations (in µg m−3) due to anthropogenic emissions alone (ΔPM2.5(anth)), LULCC (ΔPM2.5(LULCC)), agricultural emissions (ΔPM2.5(agr_emis)), and the combined effects of LULCC and agricultural emissions (ΔPM2.5(LULCC+agr_emis)) together. Results only from regions with ΔPM2.5(LULCC), ΔPM2.5(agr_emis) or ΔPM2.5(LULCC+agr_emis) >0.2 µg m−3 are shown.
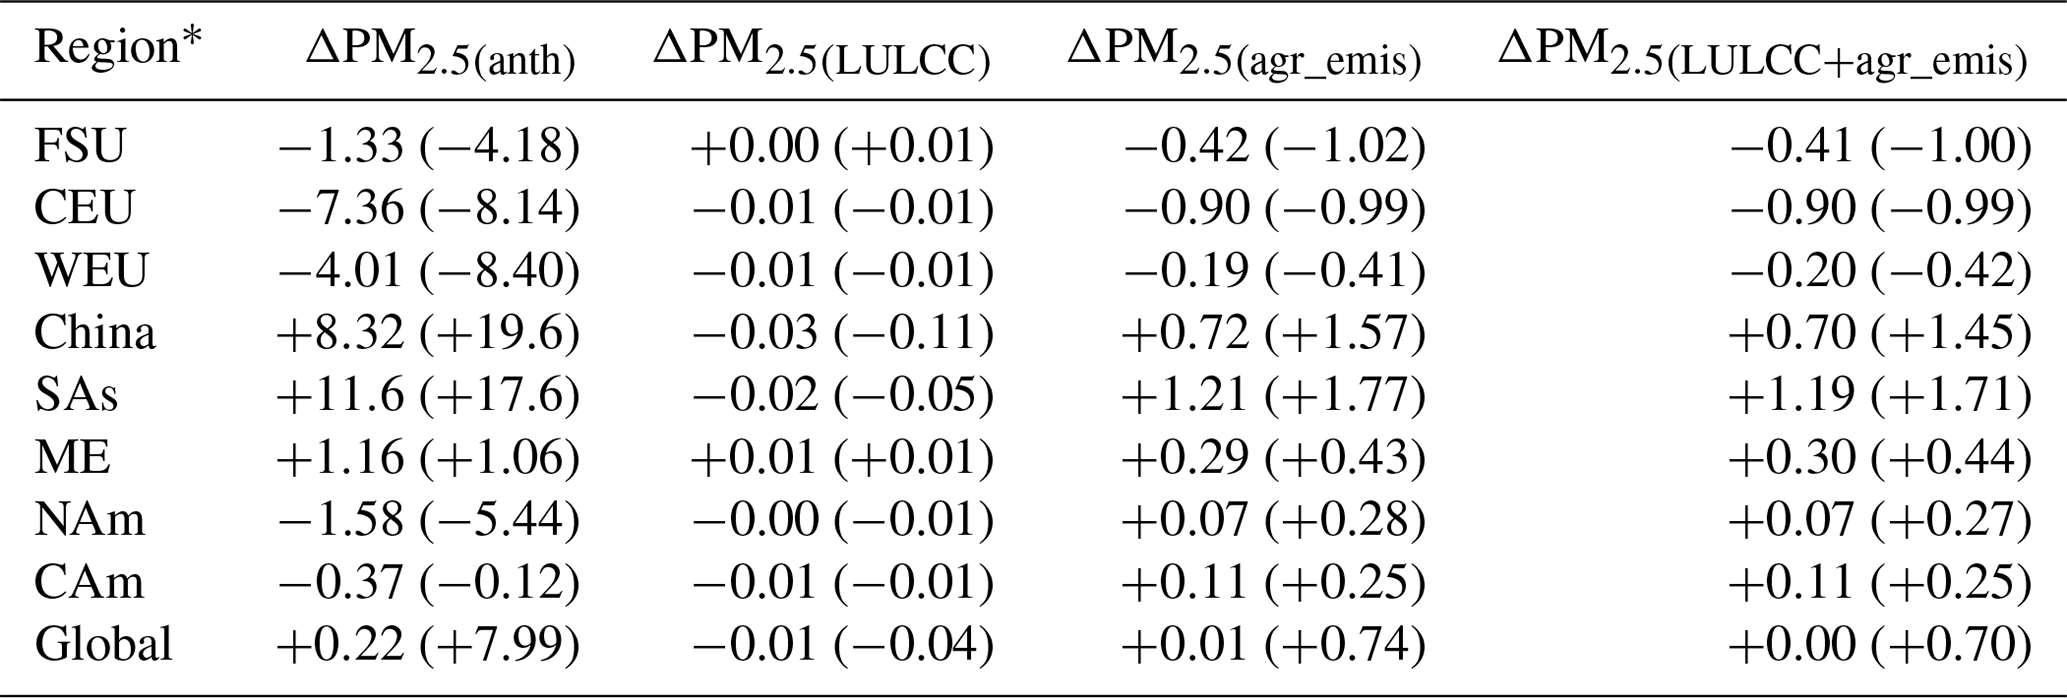
∗ The definitions and abbreviations of all regions can be found in Table S2.
Globally, our model results estimate that the global population-weighted change in PM2.5 resulting from LULCC and agricultural emission changes (+0.70 µg m−3) is on the order of ∼10 % of the change in PM2.5 resulting from direct anthropogenic emissions (+7.99 µg m−3) over 1992 to 2014. Regionally, the largest impact of land change (ΔPM on population-weighted annual mean surface PM2.5 is simulated over central and eastern Europe (−1.01 µg m−3), the former Soviet Union (−1.00 µg m−3), South Asia (+1.71 µg m−3), and China (+1.45 µg m−3). In most regions, the difference between population-weighted ΔPM2.5,agr_emis and ΔPM is very small (<∼0.05 µg m−3) except in China (0.12 µg m−3). Generally, the impacts of land change on population-weighted ΔPM2.5 have the same sign as the impacts of direct anthropogenic emissions. The only exception to this occurs over North America where anthropogenic NOx and SO2 emissions have declined, but agricultural emissions have increased. This suggests that the increase in agricultural emissions over North America has partially canceled out the effects of other emission controls on PM2.5, though this effect is small so far (∼5 %). In other regions, population-weighted ΔPM is generally on the order of 5 % to 12 % of changes due to direct anthropogenic emissions (e.g., in central, eastern and western Europe Europe). Notably, over the former Soviet Union, the Middle East and Central America, ΔPM is much more comparable to the effect of anthropogenic emission changes (24 %, 42 % and 208 %, respectively).
Our result shows that the impact of LULCC and land management changes on PM2.5 is mainly from agricultural emission changes, while LULCC can result in additional impacts in regions with high SNA precursor emissions (e.g., India, China) through modulating dry deposition. The magnitude of population-weighted ΔPM suggests that land change may contribute significantly to regional and global changes in human PM2.5 exposure and that the effects of these changes are not isolated to low-population regions. Particularly, over the regions experiencing rapid change in land use intensity (e.g., the former Soviet Union) or slow change in anthropogenic emissions (e.g., Central America, the Middle East), the effects of land changes on particulate air pollution could be comparable (24 % to 208 %) to the effects of direct anthropogenic emission changes.
Figure 6 shows the modeled impacts of LULCC, changes in agricultural emissions and the combined effects of both on annual mean surface O3 (under 2014 anthropogenic emissions). These changes are calculated identically as for PM2.5 above: the impact of LULCC on O3 (ΔO3,LULCC) is the difference in O3 predicted by simulation (3) and simulation (2), the impact of agricultural emission changes on O3 (ΔO3,agr_emis) is the difference in PM2.5 predicted by simulation (4) and simulation (3), and the impact of these combined (ΔO) is the difference in PM2.5 predicted in simulation (4) and simulation (2) (see Table 1). We also use predictions of surface HNOH2O2 ratios (Fig. S6) as a proxy for VOC- vs. NOx-sensitive chemical O3 production (Peng et al., 2006; Sillman, 1995) in our discussion of the results.

Figure 6Simulated changes in annual mean surface O3 due to (a) LULCC, (b) agricultural emission (“Agr Emis”) changes, and (c) the combined effects of agricultural emissions and LULCC.
The modeled response of surface O3 to LULCC (ΔO3,LULCC) (Fig. 6a) involves several distinct processes (dry deposition, soil NOx and BVOC emissions). Over parts of North America and Central America, the increase in dry deposition velocity (vd) reduces annual mean surface ozone by up to 0.5 ppbv overall. In central Brazil, deforestation of tropical rainforests leads to a significant reduction in isoprene emissions, reducing surface ozone by up to 0.8 ppbv in this NOx-limited environment (Fig. S6). In contrast, modeled surface ozone decreases by up to 1.2 ppbv further south, where strong increases in LAI lead to increases in vd (up to 0.06 cm s−1). The modeled reduction of surface ozone (up to 1 ppbv) over central African rainforests is also likely attributable to increased vd as neither soil NOx nor isoprene emissions change much in the region. However, in other parts of Africa, up to 0.6 ppbv of surface ozone increases are simulated, mainly because of the relatively large increase in soil NO emission. In southern China, up to 0.5 ppbv reduction in surface ozone is simulated, which is likely attributable to the increase in vd and slightly offset by the small increase in isoprene emission under this NOx-saturated environment (Fig. S6). Small surface O3 changes, mainly due to transport, are also simulated over the Atlantic Ocean.
Overall, the role of agricultural emission changes in fertilizer-associated NOx plays a minor role in surface O3 changes (Fig. 6b). An exception to this is observed in the large increase in agricultural NOx emissions, which reduces surface O3 by up to 0.6 ppbv over NOx-saturated India and China but increases surface O3 in NOx-limited parts of Southeast Asia by a similar magnitude. Slight increases in surface O3 levels due to increased agricultural NOx emissions are also simulated over parts of eastern Africa and South America. Whether the effect of agricultural emissions strengthens (e.g., China and the Sahel) or offsets (e.g., over southern Brazil and India) the effect of LULCC is largely region-dependent. As shown in Fig. 6c, LULCC tends to dominate the impacts on surface O3 over most regions in the world (unlike PM2.5 for which the effects of agricultural emission changes dominate).
Similar to PM2.5, we find that the changes in the anthropogenic emission background over 1992 to 2014 are strong enough to alter the sensitivity of O3 to land change. As indicated by Fig. S6, Asia was less NOx-saturated, while western Europe and the coastal United States were more NOx-saturated in 1992 than in 2014. For example, the increase in soil NO emission over India is more likely to increase rather than decrease the surface ozone concentration (Fig. S7a), leading to different modeled effects on surface ozone.
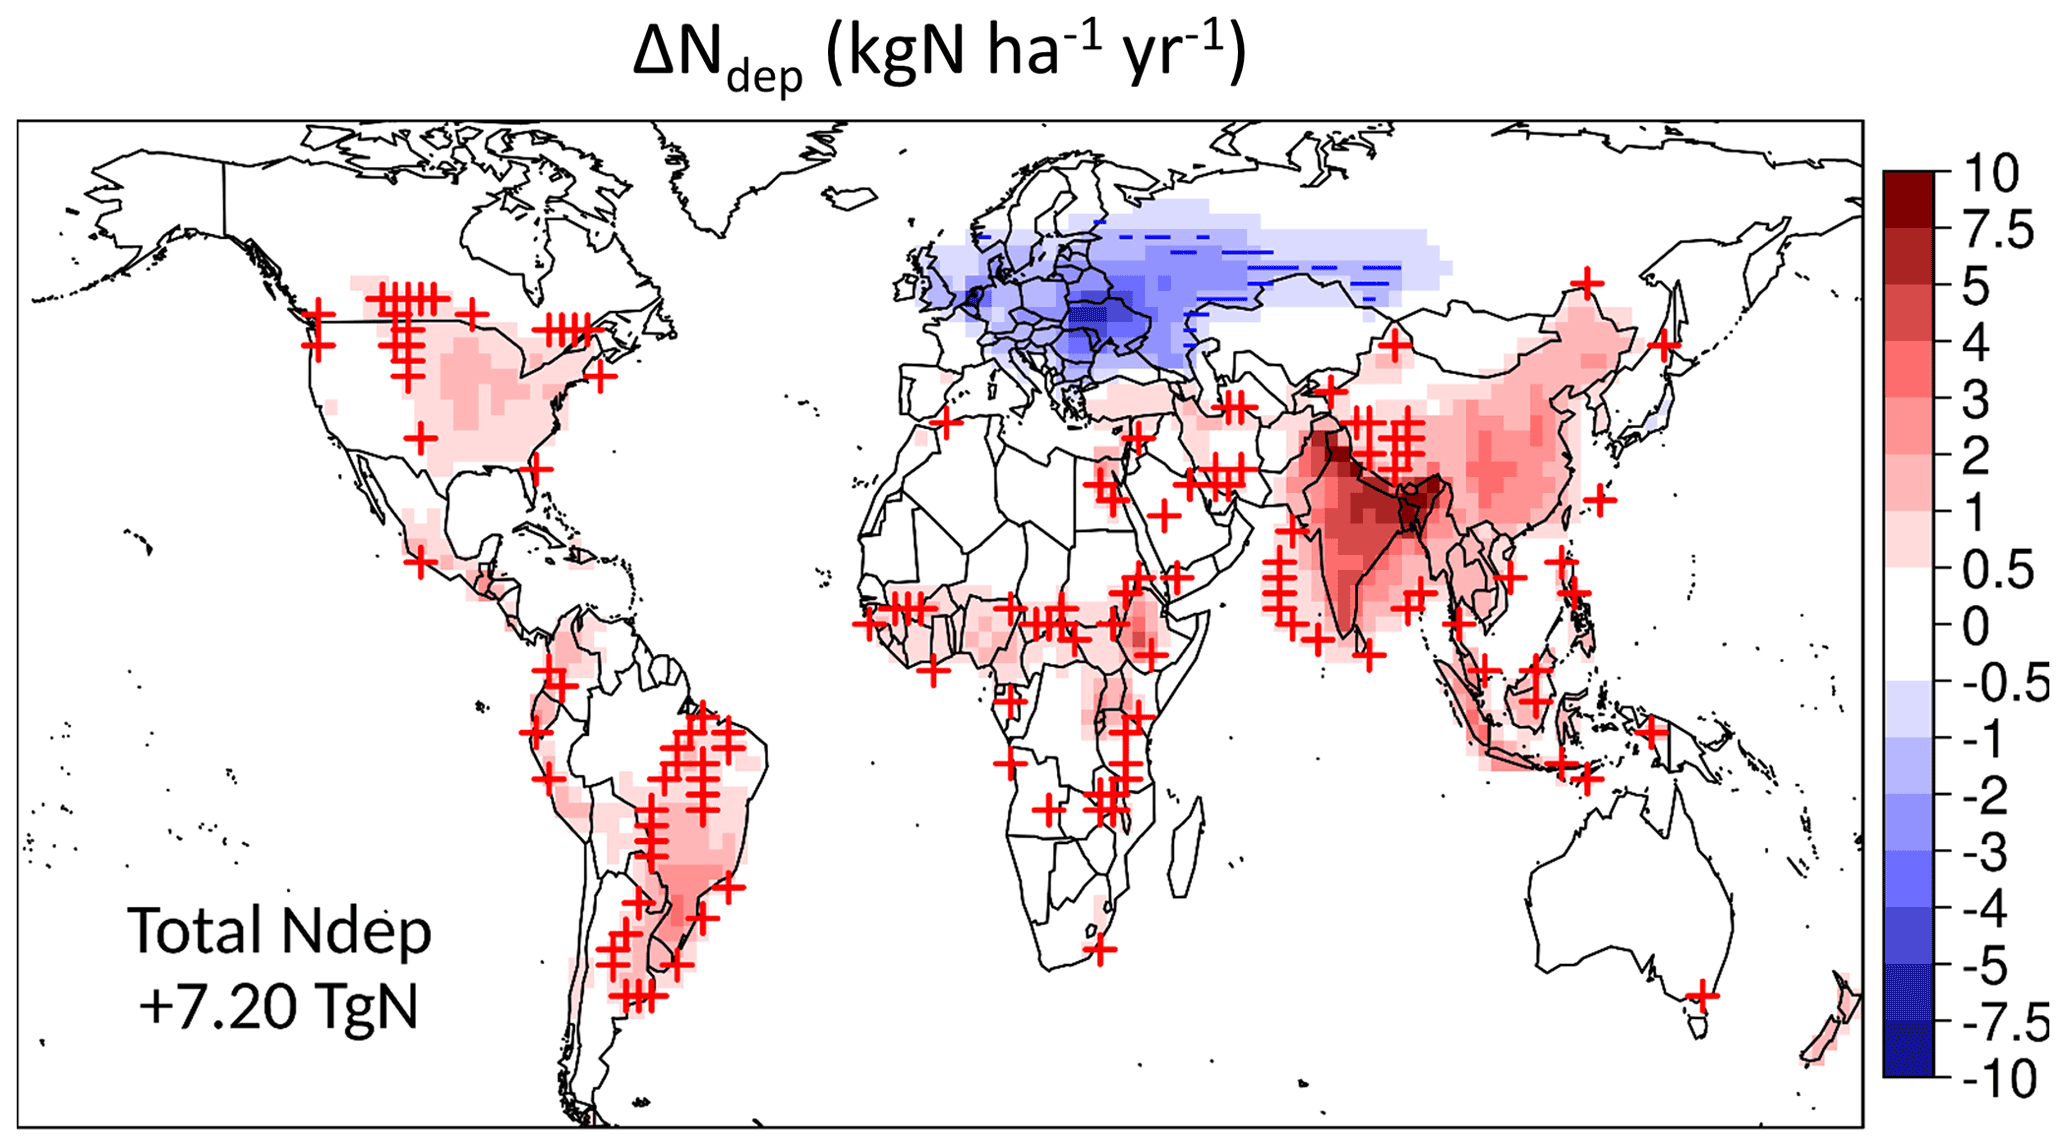
Figure 7Changes in total nitrogen deposition (ΔNdep) due to changes (1992–2014) in agricultural emissions and land cover. Red plus signs (+) mark new grid cells wherein total nitrogen deposition exceeds 5 kg N ha−1 yr−1, while blue minus signs (−) denote the grid cells wherein total nitrogen deposition decreases to below 5 kg N ha−1 yr−1.
Table 4 shows the change in area- and population-weighted annual mean afternoon surface O3 due to the effects of anthropogenic emissions (ΔO3,anth, Fig. S7b), ΔO3,LULCC, ΔO3,agr_emis and ΔO. In most regions, ΔO is positive. However, this is offset by the negative population-weighted average ΔO over the most populous regions (South Asia and China), resulting in very small globally averaged population-weighted ΔO.
Table 4Changes in area-averaged and population-weighted (in parentheses) annual mean surface O3 concentrations (in ppbv) due to anthropogenic emissions alone (ΔPM2.5(anth)), LULCC (ΔPM2.5(LULCC)), agricultural emissions (ΔPM2.5(agr_emis)), and the combined effects of LULCC and agricultural emissions (ΔPM2.5(LULCC+agr_emis)) together. Results only from regions with population-weighted average ΔO3(LULCC), ΔO3(agr_emis) or ΔO3(LULCC+agr_emis) >0.2 ppb are shown.
∗ The definitions and abbreviations of all regions can be found in Table S2.
The magnitudes of population-weighted ΔO3 (within ±0.5 ppbv) display less regional variability than that of ΔPM2.5. Over eastern Africa, western Africa and southern Africa, area-averaged ΔO generally has magnitudes similar to population-weighted ΔO. In other regions, the differences between area- and population-weighted ΔO are more substantial. The largest discrepancies between area- and population-weighted ΔO are found over China, where increases in surface O3 are predicted over less populated western China, while reductions in surface O3 are simulated over more densely populated eastern China. In South America, there are large sub-regional signals of ΔO, but these positive and negative signals largely offset each other, resulting in both small area-weighted and population-weighted ΔO.
Over China, western Africa, eastern Africa, southern Africa, the former Soviet Union and the Middle East, the magnitudes of population-weighted ΔO are more than 20 % of that of ΔO3,anth, implying that contemporary land system changes could be a regionally important component in contemporary trends of surface O3. The effects of agricultural emission changes and LULCC can either noticeably enhance (e.g., over the Middle East, Japan and Korea, China) or offset (e.g., over South Asia) each other because of the dependence of ΔO on regional NOx–VOC chemistry and details of LULCC, indicating the complexity of diagnosing the effect of land change on surface O3 at regional and global scale.
Our result suggests that contemporary agricultural emission changes and LULCC each have distinct effects on surface O3, with LULCC generally stronger in magnitude. Both of the effects are dependent on local NOx–VOC chemistry, as agricultural emission changes perturb NOx emissions, while LULCC tends to affect BVOC emissions. In addition, LULCC is also able to affect surface O3 (and other precursors) directly through dry deposition and LAI changes over our period of concern. These effects are found to affect O3 pollution over densely populated regions (e.g., China) and could be comparable to the magnitudes of O3 changes due to anthropogenic emissions over specific regions (e.g., the former Soviet Union, eastern Africa, western Africa), indicating the importance of land change in studying long-term changes in surface O3.
Finally, we estimate the effect of these land changes on nitrogen deposition estimates. Figure 7 shows the global impact of LULCC and agricultural emission changes on total nitrogen deposition (Δ Ndep), and Table 5 summarizes the regional and global results. The largest increase and decrease in nitrogen deposition (Ndep) are simulated over South Asia (+1.91 Tg N yr−1) and the former Soviet Union (−1.28 Tg N yr−1), respectively. Notable increases in Ndep are also simulated over China (+1.55 Tg N yr−1), South America (+1.24 Tg N yr−1), North America (+0.66 Tg N yr−1), western Africa (+0.39 Tg N yr−1) and eastern Africa (+0.41 Tg N yr−1). Figure 7 also illustrates the simulated changes over 1992 to 2014 in areas with nitrogen deposition (Ndep) exceeding 5 kg N ha−1 yr−1, which is a proxy for possible exceedance of critical Ndep loads for terrestrial and fresh water (Moriarty, 1988).
Table 5Changes in total nitrogen deposition (ΔNdep) and land area that has nitrogen deposition >5 kg N ha−1 yr−1 (ΔAreacrit), which is a proxy for potential risk of critical nitrogen deposition load exceedance. Only regions with significant ΔNdep (> 0.25 Tg N yr−1) or ΔAreacrit(> 105 km2) are shown.
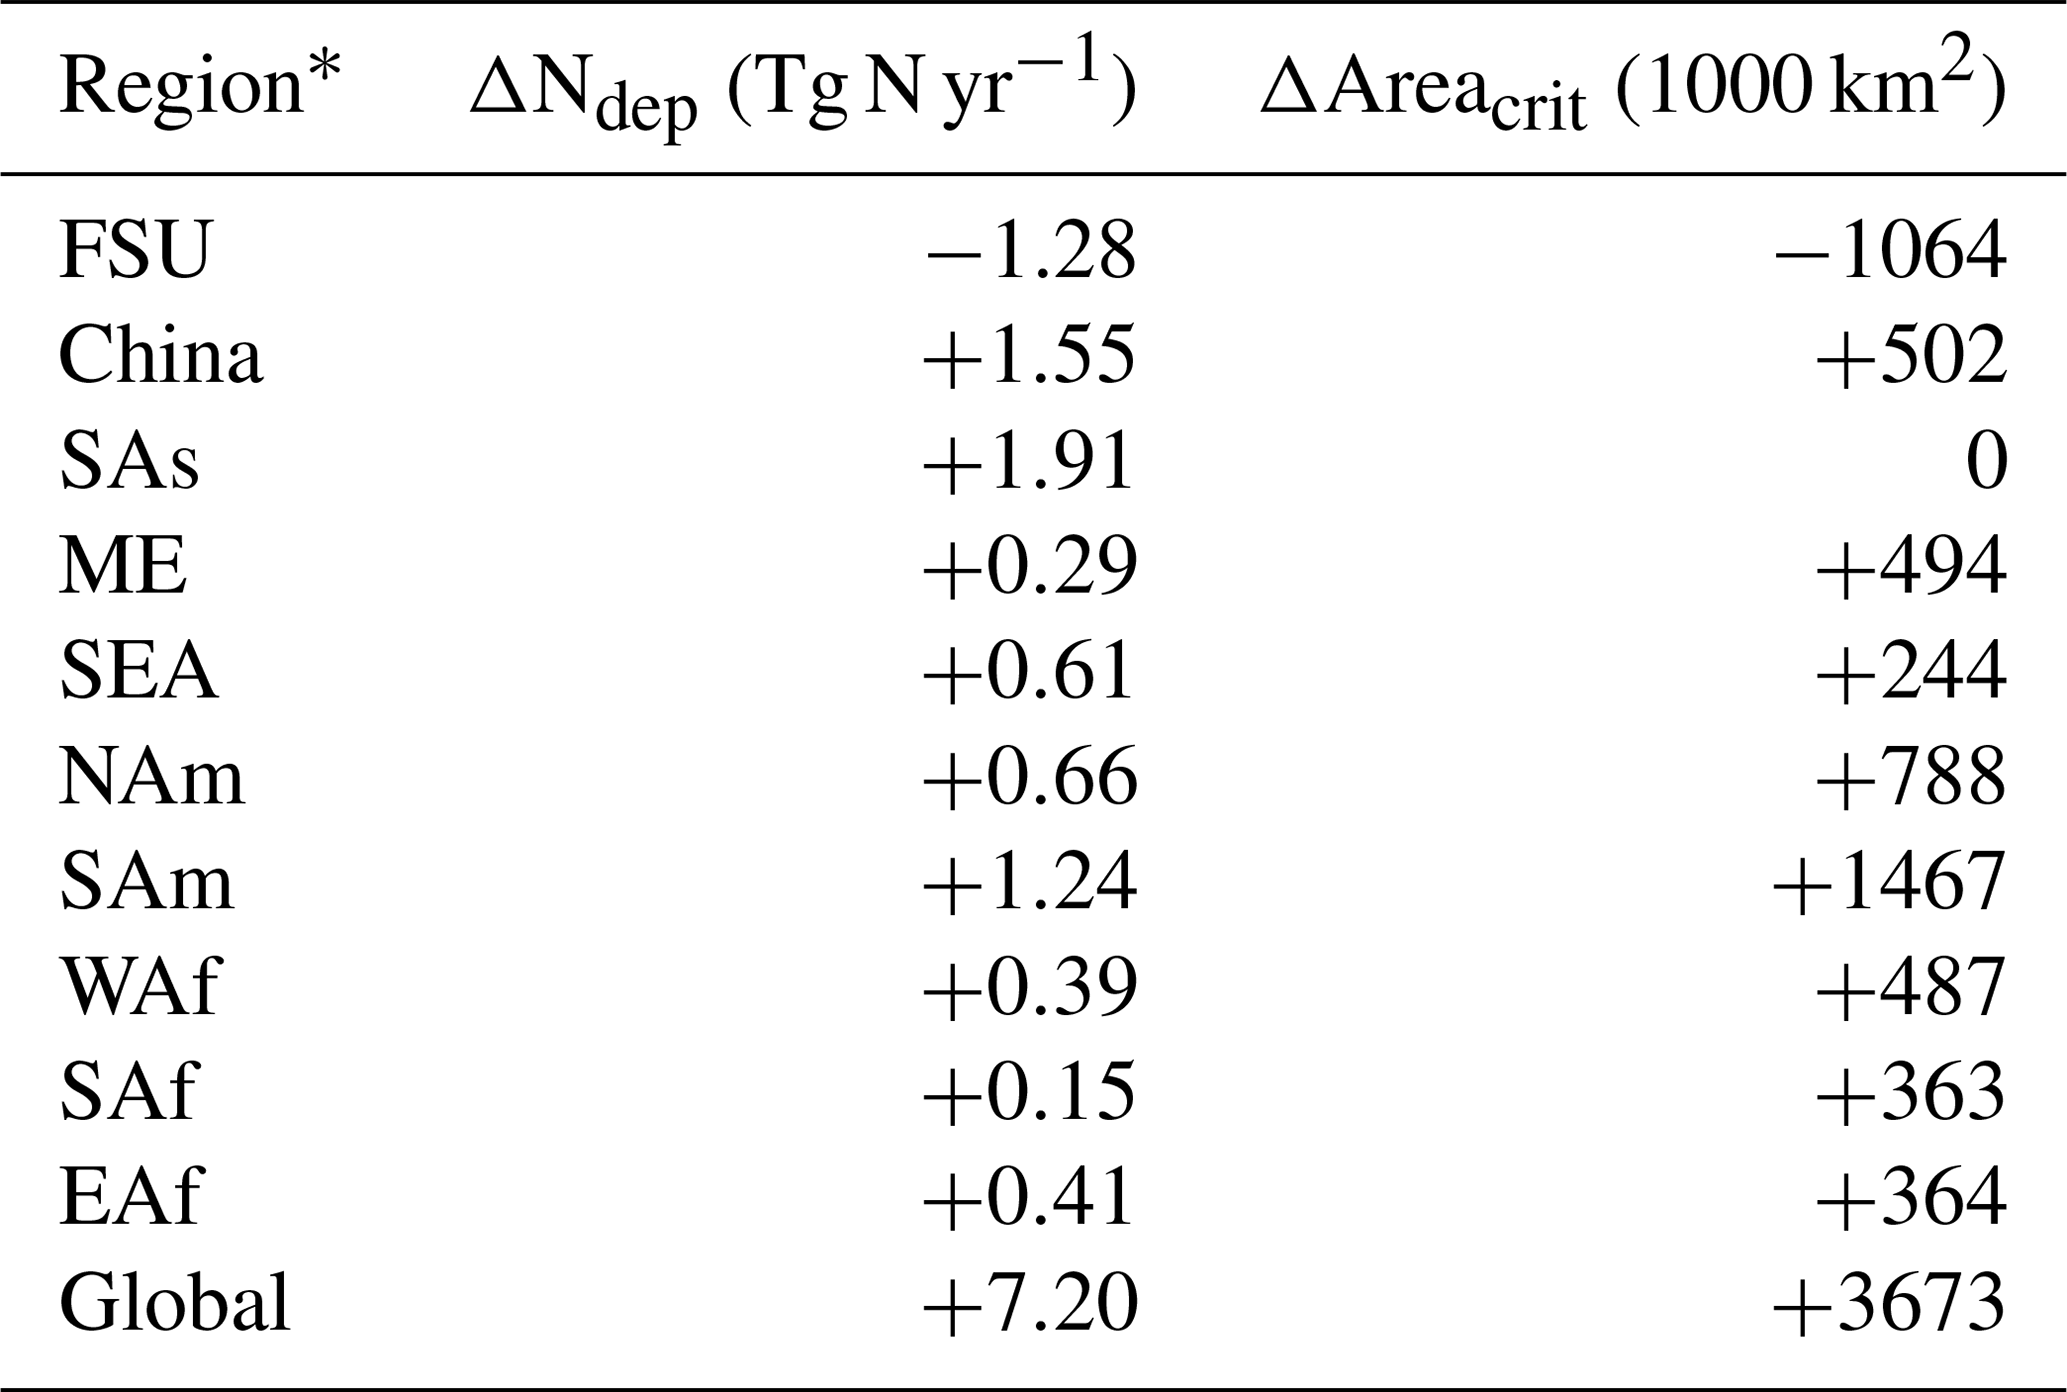
∗ The definitions and abbreviations of all regions can be found in Table S2.
Globally, there is a net increase in land area with Ndep >5 kg N ha−1 yr−1 of 3.67×10⁶ km2. The increase is mostly simulated over the Americas, Africa, the Middle East and China, which is partially offset by the large decrease over the former Soviet Union. Meanwhile, despite agricultural changes that lead to notable ΔNdep, over most of Europe, the eastern US, China, South Asia and Southeast Asia, nitrogen input from other sources is large enough that this signal alone does not lead to substantial changes in Ndep exceedances of 5 kg N ha−1 yr−1. However, over parts of North America, South America, Africa and China, agricultural changes are simulated to increase Ndep from below to above 5 kg N ha−1 yr−1. This implies that these natural ecosystems at the edge of these areas are at risk of nitrogen exceedances due to agricultural changes. In contrast, the substantial reduction of Ndep in parts of the former Soviet Union may have significantly reduced the risk of nitrogen exceedance in natural ecosystems from agricultural sources.
In this work, we have explored how changes in the global land system, through LULCC and agricultural emission changes, may have impacted contemporary global air quality over 1992 to 2014. We model the effects of contemporary LULCC and agricultural emission changes, individually then in combination, on surface O3 and PM2.5 using the GEOS-Chem chemical transport model (CTM). With a uniquely consistent framework, we are able to integrate direct information from global emission inventories (CEDS) with updated land surface remote sensing products (ESA CCI land cover and GLASS LAI). This allows us to avoid invoking extra assumptions on land management practices (e.g., constant Nr input, emissions or emission factors over time) and biophysical properties of PFTs (e.g., constant PFT-specific LAI over time).
We find that changes in agricultural emissions are simulated to increase the annual mean surface PM2.5 concentrations in China and India by up to 3.5 µg m−3 and to decrease in Europe by up to 3.5 µg m−3. Our simulation suggests that though ΔPM2.5 is mainly attributable to changes in agricultural emissions at the global scale, LULCC over India and China can lead to enhanced dry deposition of certain PM2.5 precursor gases (SO2 and NO2), thus partially offsetting (∼10 %) the increase in PM2.5 from agricultural regions. This implies a potentially important role of LULCC in determining the SNA aerosol level over certain heavily polluted regions. Also, LULCC reduces BVOC emissions over Amazonia, which leads to reductions in PM2.5 by up to 0.7 µg m−3. In a future with decreasing anthropogenic NOx and SO2 emissions, which could diminish the importance of agricultural emissions for PM2.5 formation (Bauer et al., 2016), LULCC may become increasingly important in the overall effect of land change on PM2.5. Noticeable changes (>1 µg m−3) in population-weighted ΔPM are simulated over China (+1.45 µg m−3), South Asia (+1.71 µg m−3), central and eastern Europe (−1.00 µg m−3), and the former Soviet Union (−1.01 µg m−3), indicating the potential impact of land change on long-term public health through modulating the PM2.5 level at regional scale. Our results suggest that contemporary (1996–2014) LULCC and agricultural emission changes contribute to changes in PM2.5 at regional and global scales that range from the order of 5 % to 10 % of changes in PM2.5 resulting from direct anthropogenic emissions over the same time period and up to ∼25 % or more in the former Soviet Union and the Middle East specifically.
In contrast, the effect of LULCC is generally stronger than that of agricultural emission change in simulations of surface O3. We find that the role of LULCC over 1992 to 2014 is regionally significant enough to induce changes in BVOC emissions and dry deposition, which affect surface O3, but that the overall effects largely offset each other on the global scale, leading to very small population-weighted ΔO. This finding is consistent with that of Ganzeveld et al. (2010), even though the timeframe of study (2000–2050) is different. The effects of both agricultural emission changes and LULCC, through NOx and BVOC emissions, are sensitive to the regional ozone production regime. The increase in agricultural emissions reduces O3 over NOx-saturated parts of China and South Asia by up to 0.6 ppbv, while the reduction in BVOC emissions increases surface O3 over VOC-limited Amazonia by up to 1.2 ppbv; enhancements of dry deposition reduce O3 over parts of China, North America and South America by up to 1.2 ppbv. Overall, the largest population-weighted ΔO is simulated over western Africa (+0.42 ppbv) and eastern Africa (+0.47 ppbv). We find that the ratio between ΔO and ΔO3,anth varies widely depending on region, with some having ΔO comparable (>20 %) to ΔO3,anth. These results show the complexity and importance of land change in mediating long-term changes in surface O3.
We also find that both the modeled ΔO and ΔPM are sensitive to the changes in anthropogenic emissions suggested by the CEDS inventory over 1992 to 2014, as the changes in NOx, SO2 and VOC emissions are large enough to considerably perturb atmospheric HNO3 and H2SO4 production, as well as the ozone production regime in many regions (e.g., Asia and western Europe). This highlights the necessity of accurate and relevant emission inventories when evaluating the impacts of land change on air quality (e.g., Bauer et al., 2016).
The increased atmospheric reactive nitrogen (+7.20 Tg yr−1) due to agricultural emissions is mostly found to be deposited near source regions as the atmospheric lifetime of NH3 is generally short, which implies the potential risk of excessive nitrogen input over natural ecosystems near regions with increases in agricultural emissions.
Our work suggests that, at contemporary timescales (on the order of ∼20 years), the effect of land change on air quality can sometimes be important relative to the air quality changes induced by trends in direct anthropogenic emissions. We also find that agricultural emission changes have stronger effects on PM2.5, while LULCC has stronger effects on O3. This finding is comparable to that from Heald and Geddes (2016), which suggests much more comparable changes in biogenic SOA (mostly induced by LULCC) and particulate nitrate (mostly induced by agricultural emission changes), as well as stronger surface ozone changes induced by land change over 1850–2000. This shows that both the magnitudes and relative contributions from different components of land change effects on air quality vary significantly with the timescale of study, as well as the potential importance at longer timescales (e.g., multidecadal, centennial), despite the relatively small signal that we obtain here.
We find the effects of agricultural emissions and LULCC to be largely linearly additive over contemporary timescales, which may be attributable to two factors: (1) LULCC mainly impacts O3 precursors, while agricultural emissions mainly impact SNA precursors, and these are often spatially segregated; (2) LULCC and agriculture-related changes in surface fluxes of O3 and SNA precursors are not large enough to change their respective chemical production regime. At longer timescales when land change signals are stronger, the effects of LULCC and agricultural emissions may be nonlinear.
We note several important limitations and opportunities for development. We were only able to evaluate our simulation extensively over Europe, North American and East Asia. In most other regions where such evaluation of SNA speciation is not feasible, the sensitivity of SNA formation to NH3 emissions can be a major source of uncertainty. Given that the changes in agricultural emissions have occurred at a global scale, effort to monitor SNA speciation outside North America and Europe (e.g., Weagle et al., 2018) is necessary for understanding the sensitivity of PM2.5 to agricultural emissions to a global extent. A better understanding of both the sources and sinks of HNO3 (e.g., Heald et al., 2012; Holmes et al., 2019; Luo et al., 2019; Petetin et al., 2016) as well as nitrate partitioning (e.g., Vasilakos et al., 2018) is important for modeling SNA aerosol and its sensitivity to NH3 emissions. Agricultural NOx and NH3 emissions estimates also carry large uncertainty due their biological nature and resulting dependence on environmental conditions, which are not explicitly considered in the construction of bottom-up anthropogenic emission inventories (Crippa et al., 2018; Hoesly et al., 2018). Bidirectional exchanges of NO2 (Breuninger et al., 2013; Chaparro-Suarez et al., 2011; Lerdau et al., 2000) and NH3 (Bash et al., 2013; Massad et al., 2010; Wichink Kruit et al., 2012; Zhang et al., 2010) are not explicitly modeled (although in some regions they may be implicitly accounted for in the regional scaling performed by CEDS), which introduces some uncertainty in the accuracy of surface flux modeling. Zhu et al. (2015) implemented a bidirectional NH3 exchange model in GEOS-Chem and found no substantial improvement with observations in the modeled NH3 concentration, NH wet deposition and nitrate aerosol concentration compared to the default GEOS-Chem unidirectional exchange framework. This indicates that the unidirectional framework may still be sufficiently accurate in simulating global air quality compared to the bidirectional framework, which requires more observations to properly parameterize at global scale. In the case of NO2, we make the assumption that in most regions we are interested in (Fig. S9), the ambient concentrations of NO2 exceed an ecosystem compensation point (0.05–0.6 ppb) (e.g., Breuninger et al., 2013) so that we can assume deposition would dominate. The simplistic representation of dry deposition in general, particularly the lack of dependence of stomatal conductance on atmospheric and soil water content, may not adequately capture the effects of LULCC, as biomes can have differential responses to meteorological and hydrological conditions. The inherent inconsistency of long-term LAI time series derived from reflectance measured by different instruments (Jiang et al., 2017) and the use of static land cover maps also introduce uncertainty in the LAI retrieval (Fang et al., 2013) and the subsequently computed LAI changes and trends, and these have been shown to be important to changes in simulated O3 in this study and elsewhere (Wong et al., 2019). Though the use of PFT-based emission factors in regional and global modeling is generally justifiable (Guenther et al., 2012), we cannot rule out the possibility of intra-PFT variabilities of BVOC emission factors affecting the accuracies our results, which is exemplified by the inability of our model to capture the palm-driven isoprene emission increase over Southeast Asia (Silva et al., 2016) as discussed in Sect. 3. Finally, the meteorological feedbacks (e.g., changes in sensible heat, latent heat, air temperature, boundary layer height) and the subsequent effects on atmospheric chemistry and transport from LULCC and agricultural emissions are not considered in our study, which could potentially be important (e.g., Wang et al., 2020).
Our study helps demonstrate the possible magnitudes and regional patterns of the impacts of contemporary LULCC and agricultural emission changes on PM2.5 and O3, and it suggests that the combination of these factors should not be neglected in the study of regional and global air quality changes over multidecadal timescales. Our results confirm the potential importance of controlling agricultural emissions for improving air quality in terms of PM2.5, which could be practical as there are numerous feasible options for reducing agricultural emissions through optimizing livestock and crop production systems (e.g., Ti et al., 2019). Incentivizing these and other practices that improve agricultural nitrogen use efficiency (e.g., including livestock production with cropping, synchronizing nitrogen supply with crop demand) (e.g., Fageria and Baligar, 2005; Langholtz et al., 2021) can be one of the keys to mitigate the air quality impacts of reactive nitrogen input without compromising agricultural productivity (e.g., Guo et al., 2020). Furthermore, as increasing reactive nitrogen input and land use change are the two of the main strategies to meet the global demand for biomass-based products in the future (Foley et al., 2011), the distinct yet significant impacts of agricultural emissions and land use change on O3, PM2.5 and nitrogen deposition should be investigated as part of the overall environmental impacts of land system changes, especially when there is a trade-off between increasing land input and cropland expansion (e.g., Lotze-Campen et al., 2010; Mauser et al., 2015). This could benefit agricultural policy activities by appropriately considering the externalities and socioeconomic costs of different options and scenarios for agricultural expansion.
The GLASS LAI product is publicly available through http://globalchange.bnu.edu.cn/research/laiv6#download (Xiao et al., 2016). The ESA CCI land cover product is publicly available through ftp://geo10.elie.ucl.ac.be/CCI/LandCover/ESACCI-LC-L4-LCCS-Map-300m-P1Y-1992_2015-v2.0.7b.nc.zip (Li et al., 2018). The CEDS emission inventory is publicly available through https://esgf-node.llnl.gov/search/input4mips (Hoesly et al., 2018). The GEOS-Chem model configuration and land cover input files used in this study are available through https://open.bu.edu/handle/2144/43267 (Wong, 2021).
The source code of the GEOS-Chem model is publicly available (https://doi.org/10.5281/zenodo.3634864, the International GEOS-Chem User Community, 2020). The GEOS-Chem model output and other source code used in the project can be obtained by contacting the corresponding author (jgeddes@bu.edu).
The supplement related to this article is available online at: https://doi.org/10.5194/acp-21-16479-2021-supplement.
AYHW and JAG developed the ideas for this study, formulated the methods and designed the model experiments together. AYHW performed the chemical transport model simulations and data analysis, with input and feedback from JAG. Paper preparation was performed by AYHW, and the paper was reviewed, edited and approved by JAG.
The authors declare that they have no conflict of interest.
Publisher's note: Copernicus Publications remains neutral with regard to jurisdictional claims in published maps and institutional affiliations.
This work was funded by an NSF CAREER grant (ATM-1750328) to project PI Jeffrey A. Geddes. We also thank the Global Modeling and Assimilation Office (GMAO) at NASA Goddard Flight Center for providing the MERRA-2 data, the European Space Agency Climate Change Initiative (ESA CCI) for the land cover time series, and the Center for Global Change Data Processing and Analysis at Beijing Normal University (BNU) for the GLASS LAI product.
This research has been supported by the National Science Foundation (grant no. ATM-1750328).
This paper was edited by Laurens Ganzeveld and reviewed by two anonymous referees.
Amos, H. M., Jacob, D. J., Holmes, C. D., Fisher, J. A., Wang, Q., Yantosca, R. M., Corbitt, E. S., Galarneau, E., Rutter, A. P., Gustin, M. S., Steffen, A., Schauer, J. J., Graydon, J. A., Louis, V. L. St., Talbot, R. W., Edgerton, E. S., Zhang, Y., and Sunderland, E. M.: Gas-particle partitioning of atmospheric Hg(II) and its effect on global mercury deposition, Atmos. Chem. Phys., 12, 591–603, https://doi.org/10.5194/acp-12-591-2012, 2012.
Ansari, A. S. and Pandis, S. N.: Response of inorganic PM to precursor concentrations, Environ. Sci. Technol., 32, 2706–2714, https://doi.org/10.1021/es971130j, 1998.
Bash, J. O., Cooter, E. J., Dennis, R. L., Walker, J. T., and Pleim, J. E.: Evaluation of a regional air-quality model with bidirectional NH3 exchange coupled to an agroecosystem model, Biogeosciences, 10, 1635–1645, https://doi.org/10.5194/bg-10-1635-2013, 2013.
Bauer, S. E., Tsigaridis, K., and Miller, R.: Significant atmospheric aerosol pollution caused by world food cultivation, Geophys. Res. Lett., 43, 5394–5400, https://doi.org/10.1002/2016GL068354, 2016.
Bey, I., Jacob, D. J., Yantosca, R. M., Logan, J. A., Field, B. D., Fiore, A. M., Li, Q., Liu, H. Y., Mickley, L. J., and Schultz, M. G.: Global modeling of tropospheric chemistry with assimilated meteorology: Model description and evaluation, J. Geophys. Res. Atmos., 106, 23073–23095, https://doi.org/10.1029/2001JD000807, 2001.
Bobbink, R., Hicks, K., Galloway, J., Spranger, T., Alkemade, R., Ashmore, M., Bustamante, M., Cinderby, S., Davidson, E., Dentener, F., Emmett, B., Erisman, J. W., Fenn, M., Gilliam, F., Nordin, A., Pardo, L., and De Vries, W.: Global assessment of nitrogen deposition effects on terrestrial plant diversity: A synthesis, Ecol. Appl., 20, 30–59, https://doi.org/10.1890/08-1140.1, 2010.
Bonan, G. B., Levis, S., Kergoat, L., and Oleson, K. W.: Landscapes as patches of plant functional types: An integrating concept for climate and ecosystem models, Global Biogeochem. Cycles, 16, 5-1-5–23, https://doi.org/10.1029/2000gb001360, 2002.
Breuninger, C., Meixner, F. X., and Kesselmeier, J.: Field investigations of nitrogen dioxide (NO2) exchange between plants and the atmosphere, Atmos. Chem. Phys., 13, 773–790, https://doi.org/10.5194/acp-13-773-2013, 2013.
Chaparro-Suarez, I. G., Meixner, F. X., and Kesselmeier, J.: Nitrogen dioxide (NO2) uptake by vegetation controlled by atmospheric concentrations and plant stomatal aperture, Atmos. Environ., 45, 5742–5750, https://doi.org/10.1016/j.atmosenv.2011.07.021, 2011.
Chen, C., Park, T., Wang, X., Piao, S., Xu, B., Chaturvedi, R. K., Fuchs, R., Brovkin, V., Ciais, P., Fensholt, R., Tømmervik, H., Bala, G., Zhu, Z., Nemani, R. R., and Myneni, R. B.: China and India lead in greening of the world through land-use management, Nat. Sustain., 2, 122–129, https://doi.org/10.1038/s41893-019-0220-7, 2019.
Claverie, M., Matthews, J. L., Vermote, E. F., and Justice, C. O.: A 30+ year AVHRR LAI and FAPAR climate data record: Algorithm description and validation, Remote Sens., 8, 263, https://doi.org/10.3390/rs8030263, 2016.
Crippa, M., Guizzardi, D., Muntean, M., Schaaf, E., Dentener, F., van Aardenne, J. A., Monni, S., Doering, U., Olivier, J. G. J., Pagliari, V., and Janssens-Maenhout, G.: Gridded emissions of air pollutants for the period 1970–2012 within EDGAR v4.3.2, Earth Syst. Sci. Data, 10, 1987–2013, https://doi.org/10.5194/essd-10-1987-2018, 2018.
Ellis, E. C.: Ecology in an anthropogenic biosphere, Ecol. Monogr., 85, 287–331, https://doi.org/10.1890/14-2274.1, 2015.
Ellis, E. C., Kaplan, J. O., Fuller, D. Q., Vavrus, S., Goldewijk, K. K., and Verburg, P. H.: Used planet: A global history, Proc. Natl. Acad. Sci. USA, 110, 7978–7985, https://doi.org/10.1073/pnas.1217241110, 2013.
Fageria, N. K. and Baligar, V. C.: Enhancing Nitrogen Use Efficiency in Crop Plants, Adv. Agron., 88, 97–185, https://doi.org/10.1016/S0065-2113(05)88004-6, 2005.
Fang, H., Li, W., and Myneni, R. B.: The Impact of Potential Land Cover Misclassification on MODIS Leaf Area Index (LAI) Estimation: A Statistical Perspective, Remote Sens., 5, 830–844, https://doi.org/10.3390/rs5020830, 2013.
Fenn, M. E., Baron, J. S., Allen, E. B., Rueth, H. M., Nydick, K. R., Geiser, L., Bowman, W. D., Sickman, J. O., Meixner, T., Johnson, D. W., and Neitlich, P.: Ecological effects of nitrogen deposition in the western United States, Bioscience, https://doi.org/10.1641/0006-3568(2003)053[0404:EEONDI]2.0.CO;2, 2003.
Foley, J. A., Ramankutty, N., Brauman, K. A., Cassidy, E. S., Gerber, J. S., Johnston, M., Mueller, N. D., O'Connell, C., Ray, D. K., West, P. C., Balzer, C., Bennett, E. M., Carpenter, S. R., Hill, J., Monfreda, C., Polasky, S., Rockström, J., Sheehan, J., Siebert, S., Tilman, D., and Zaks, D. P. M.: Solutions for a cultivated planet, Nature, 478, 337–342, https://doi.org/10.1038/nature10452, 2011.
Fountoukis, C. and Nenes, A.: ISORROPIA II: a computationally efficient thermodynamic equilibrium model for KCaMgNHNaSONOCl−−H2O aerosols, Atmos. Chem. Phys., 7, 4639–4659, https://doi.org/10.5194/acp-7-4639-2007, 2007.
Fu, Y. and Tai, A. P. K.: Impact of climate and land cover changes on tropospheric ozone air quality and public health in East Asia between 1980 and 2010, Atmos. Chem. Phys., 15, 10093–10106, https://doi.org/10.5194/acp-15-10093-2015, 2015.
Fu, X., Wang, S., Xing, J., Zhang, X., Wang, T., and Hao, J.: Increasing Ammonia Concentrations Reduce the Effectiveness of Particle Pollution Control Achieved via SO2 and NOX Emissions Reduction in East China, Environ. Sci. Technol. Lett., 4, 221–227, https://doi.org/10.1021/acs.estlett.7b00143, 2017.
Fu, Y., Tai, A. P. K., and Liao, H.: Impacts of historical climate and land cover changes on fine particulate matter (PM2.5) air quality in East Asia between 1980 and 2010, Atmos. Chem. Phys., 16, 10369–10383, https://doi.org/10.5194/acp-16-10369-2016, 2016.
Galloway, J. N., Townsend, A. R., Erisman, J. W., Bekunda, M., Cai, Z., Freney, J. R., Martinelli, L. A., Seitzinger, S. P., and Sutton, M. A.: Transformation of the nitrogen cycle: Recent trends, questions, and potential solutions, Science, 320, 889–892, https://doi.org/10.1126/science.1136674, 2008.
Ganzeveld, L., Bouwman, L., Stehfest, E., van Vuuren, D. P., Eickhout, B., and Lelieveld, J.: Impact of future land use and land cover changes on atmospheric chemistry-climate interactions, J. Geophys. Res., 115, D23301, https://doi.org/10.1029/2010JD014041, 2010.
Geddes, J. A. and Martin, R. V.: Global deposition of total reactive nitrogen oxides from 1996 to 2014 constrained with satellite observations of NO2 columns, Atmos. Chem. Phys., 17, 10071–10091, https://doi.org/10.5194/acp-17-10071-2017, 2017.
Geddes, J. A., Heald, C. L., Silva, S. J., and Martin, R. V.: Land cover change impacts on atmospheric chemistry: Simulating projected large-scale tree mortality in the United States, Atmos. Chem. Phys. Discuss., 15, 29303–29345, https://doi.org/10.5194/acpd-15-29303-2015, 2015.
Geddes, J. A., Heald, C. L., Silva, S. J., and Martin, R. V.: Land cover change impacts on atmospheric chemistry: simulating projected large-scale tree mortality in the United States, Atmos. Chem. Phys., 16, 2323–2340, https://doi.org/10.5194/acp-16-2323-2016, 2016.
Gelaro, R., McCarty, W., Suárez, M. J., Todling, R., Molod, A., Takacs, L., Randles, C. A., Darmenov, A., Bosilovich, M. G., Reichle, R., Wargan, K., Coy, L., Cullather, R., Draper, C., Akella, S., Buchard, V., Conaty, A., da Silva, A. M., Gu, W., Kim, G. K., Koster, R., Lucchesi, R., Merkova, D., Nielsen, J. E., Partyka, G., Pawson, S., Putman, W., Rienecker, M., Schubert, S. D., Sienkiewicz, M., and Zhao, B.: The modern-era retrospective analysis for research and applications, version 2 (MERRA-2), J. Climate, 30, 5419–5454, https://doi.org/10.1175/JCLI-D-16-0758.1, 2017.
Giannadaki, D., Giannakis, E., Pozzer, A., and Lelieveld, J.: Estimating health and economic benefits of reductions in air pollution from agriculture, Sci. Total Environ., 622–623, 1304–1316, https://doi.org/10.1016/j.scitotenv.2017.12.064, 2018.
Guenther, A. B., Jiang, X., Heald, C. L., Sakulyanontvittaya, T., Duhl, T., Emmons, L. K., and Wang, X.: The Model of Emissions of Gases and Aerosols from Nature version 2.1 (MEGAN2.1): an extended and updated framework for modeling biogenic emissions, Geosci. Model Dev., 5, 1471–1492, https://doi.org/10.5194/gmd-5-1471-2012, 2012.
Guo, Y., Chen, Y., Searchinger, T. D., Zhou, M., Pan, D., Yang, J., Wu, L., Cui, Z., Zhang, W., Zhang, F., Ma, L., Sun, Y., Zondlo, M. A., Zhang, L., and Mauzerall, D. L.: Air quality, nitrogen use efficiency and food security in China are improved by cost-effective agricultural nitrogen management, Nat. Food, 1, 648–658, https://doi.org/10.1038/s43016-020-00162-z, 2020.
Hansen, M. C., Potapov, P. V., Moore, R., Hancher, M., Turubanova, S. A., Tyukavina, A., Thau, D., Stehman, S. V., Goetz, S. J., Loveland, T. R., Kommareddy, A., Egorov, A., Chini, L., Justice, C. O., and Townshend, J. R. G.: High-resolution global maps of 21st-century forest cover change, Science, 342, 850–853, https://doi.org/10.1126/science.1244693, 2013.
Hardacre, C. J., Palmer, P. I., Baumanns, K., Rounsevell, M., and Murray-Rust, D.: Probabilistic estimation of future emissions of isoprene and surface oxidant chemistry associated with land-use change in response to growing food needs, Atmos. Chem. Phys., 13, 5451–5472, https://doi.org/10.5194/acp-13-5451-2013, 2013.
Heald, C. L. and Geddes, J. A.: The impact of historical land use change from 1850 to 2000 on secondary particulate matter and ozone, Atmos. Chem. Phys., 16, 14997–15010, https://doi.org/10.5194/acp-16-14997-2016, 2016.
Heald, C. L. and Spracklen, D. V.: Land Use Change Impacts on Air Quality and Climate, Chem. Rev., 115, 4476–4496, https://doi.org/10.1021/cr500446g, 2015.
Heald, C. L., Henze, D. K., Horowitz, L. W., Feddema, J., Lamarque, J. F., Guenther, A., Hess, P. G., Vitt, F., Seinfeld, J. H., Godstein, A. H., and Fung, I.: Predicted change in global secondary organic aerosol concentrations in response to future climate, emissions, and land use change, J. Geophys. Res. Atmos., 113, D05211, https://doi.org/10.1029/2007JD009092, 2008.
Heald, C. L., Collett Jr., J. L., Lee, T., Benedict, K. B., Schwandner, F. M., Li, Y., Clarisse, L., Hurtmans, D. R., Van Damme, M., Clerbaux, C., Coheur, P.-F., Philip, S., Martin, R. V., and Pye, H. O. T.: Atmospheric ammonia and particulate inorganic nitrogen over the United States, Atmos. Chem. Phys., 12, 10295–10312, https://doi.org/10.5194/acp-12-10295-2012, 2012.
Hoesly, R. M., Smith, S. J., Feng, L., Klimont, Z., Janssens-Maenhout, G., Pitkanen, T., Seibert, J. J., Vu, L., Andres, R. J., Bolt, R. M., Bond, T. C., Dawidowski, L., Kholod, N., Kurokawa, J.-I., Li, M., Liu, L., Lu, Z., Moura, M. C. P., O'Rourke, P. R., and Zhang, Q.: Historical (1750–2014) anthropogenic emissions of reactive gases and aerosols from the Community Emissions Data System (CEDS), Geosci. Model Dev., 11, 369–408, https://doi.org/10.5194/gmd-11-369-2018, 2018 (data available at: https://esgf-node.llnl.gov/search/input4mips, last access: 26 March 2021).
Hollaway, M. J., Arnold, S. R., Collins, W. J., Folberth, G., and Rap, A.: Sensitivity of midnineteenth century tropospheric ozone to atmospheric chemistry-vegetation interactions, J. Geophys. Res. Atmos., 122, 2452–2473, https://doi.org/10.1002/2016JD025462, 2017.
Holmes, C. D., Bertram, T. H., Confer, K. L., Graham, K. A., Ronan, A. C., Wirks, C. K., and Shah, V.: The Role of Clouds in the Tropospheric NOx Cycle: A New Modeling Approach for Cloud Chemistry and Its Global Implications, Geophys. Res. Lett., 46, 4980–4990, https://doi.org/10.1029/2019GL081990, 2019.
Hudman, R. C., Moore, N. E., Mebust, A. K., Martin, R. V., Russell, A. R., Valin, L. C., and Cohen, R. C.: Steps towards a mechanistic model of global soil nitric oxide emissions: implementation and space based-constraints, Atmos. Chem. Phys., 12, 7779–7795, https://doi.org/10.5194/acp-12-7779-2012, 2012.
Jiang, C., Ryu, Y., Fang, H., Myneni, R., Claverie, M., and Zhu, Z.: Inconsistencies of interannual variability and trends in long-term satellite leaf area index products, Glob. Chang. Biol., 23, 4133–4146, https://doi.org/10.1111/gcb.13787, 2017.
Kaplan, J. O., Krumhardt, K. M., Ellis, E. C., Ruddiman, W. F., Lemmen, C., and Goldewijk, K. K.: Holocene carbon emissions as a result of anthropogenic land cover change, Holocene, 21, 775–791, https://doi.org/10.1177/0959683610386983, 2011.
Keenan, R. J., Reams, G. A., Achard, F., de Freitas, J. V., Grainger, A., and Lindquist, E.: Dynamics of global forest area: Results from the FAO Global Forest Resources Assessment 2015, For. Ecol. Manage., 352, 9–20, https://doi.org/10.1016/j.foreco.2015.06.014, 2015.
Kim, P. S., Jacob, D. J., Fisher, J. A., Travis, K., Yu, K., Zhu, L., Yantosca, R. M., Sulprizio, M. P., Jimenez, J. L., Campuzano-Jost, P., Froyd, K. D., Liao, J., Hair, J. W., Fenn, M. A., Butler, C. F., Wagner, N. L., Gordon, T. D., Welti, A., Wennberg, P. O., Crounse, J. D., St. Clair, J. M., Teng, A. P., Millet, D. B., Schwarz, J. P., Markovic, M. Z., and Perring, A. E.: Sources, seasonality, and trends of southeast US aerosol: an integrated analysis of surface, aircraft, and satellite observations with the GEOS-Chem chemical transport model, Atmos. Chem. Phys., 15, 10411–10433, https://doi.org/10.5194/acp-15-10411-2015, 2015.
Klein Goldewijk, K., Beusen, A., Doelman, J., and Stehfest, E.: Anthropogenic land use estimates for the Holocene – HYDE 3.2, Earth Syst. Sci. Data, 9, 927–953, https://doi.org/10.5194/essd-9-927-2017, 2017.
Kottek, M., Grieser, J., Beck, C., Rudolf, B., and Rubel, F.: World map of the Köppen-Geiger climate classification updated, Meteorol. Zeitschrift, 15, 259–263, https://doi.org/10.1127/0941-2948/2006/0130, 2006.
Lai, L., Huang, X., Yang, H., Chuai, X., Zhang, M., Zhong, T., Chen, Z., Chen, Y., Wang, X., and Thompson, J. R.: Carbon emissions from land-use change and management in China between 1990 and 2010, Sci. Adv., 2, e1601063, https://doi.org/10.1126/sciadv.1601063, 2016.
Langholtz, M., Davison, B. H., Jager, H. I., Eaton, L., Baskaran, L. M., Davis, M., and Brandt, C. C.: Increased nitrogen use efficiency in crop production can provide economic and environmental benefits, Sci. Total Environ., 758, 143602, https://doi.org/10.1016/j.scitotenv.2020.143602, 2021.
Lawrence, P. J. and Chase, T. N.: Representing a new MODIS consistent land surface in the Community Land Model (CLM 3.0), J. Geophys. Res. Biogeosciences, 112, G01023, https://doi.org/10.1029/2006JG000168, 2007.
Lee, C. J., Martin, R. V., Henze, D. K., Brauer, M., Cohen, A., and Van Donkelaar, A.: Response of global particulate-matter-related mortality to changes in local precursor emissions, Environ. Sci. Technol., 49, 4335–4344, https://doi.org/10.1021/acs.est.5b00873, 2015.
Lelieveld, J., Evans, J. S., Fnais, M., Giannadaki, D., and Pozzer, A.: The contribution of outdoor air pollution sources to premature mortality on a global scale, Nature, 525, 367–371, https://doi.org/10.1038/nature15371, 2015.
Lerdau, M. T., Munger, J. W., and Jacob, D. J.: The NO2 flux conundrum, Science, 289, 2291–2293, https://doi.org/10.1126/science.289.5488.2291, 2000.
Li, W., MacBean, N., Ciais, P., Defourny, P., Lamarche, C., Bontemps, S., Houghton, R. A., and Peng, S.: Gross and net land cover changes in the main plant functional types derived from the annual ESA CCI land cover maps (1992–2015), Earth Syst. Sci. Data, 10, 219–234, https://doi.org/10.5194/essd-10-219-2018, 2018, data available at: ftp://geo10.elie.ucl.ac.be/CCI/LandCover/ESACCI-LC-L4-LCCS-Map-300m-P1Y-1992_2015-v2.0.7b.nc.zip, last access: 15 May 2020.
Liu, H., Jacob, D. J., Bey, I., and Yantosca, R. M.: Constraints from 210Pb and 7Be on wet deposition and transport in a global three-dimensional chemical tracer model driven by assimilated meteorological fields, J. Geophys. Res. Atmos., 106, 12109–12128, https://doi.org/10.1029/2000JD900839, 2001.
Lotze-Campen, H., Popp, A., Beringer, T., Müller, C., Bondeau, A., Rost, S., and Lucht, W.: Scenarios of global bioenergy production: The trade-offs between agricultural expansion, intensification and trade, Ecol. Modell., 221, 2188–2196, https://doi.org/10.1016/j.ecolmodel.2009.10.002, 2010.
Luo, G., Yu, F., and Schwab, J.: Revised treatment of wet scavenging processes dramatically improves GEOS-Chem 12.0.0 simulations of surface nitric acid, nitrate, and ammonium over the United States, Geosci. Model Dev., 12, 3439–3447, https://doi.org/10.5194/gmd-12-3439-2019, 2019.
Mao, J., Paulot, F., Jacob, D. J., Cohen, R. C., Crounse, J. D., Wennberg, P. O., Keller, C. A., Hudman, R. C., Barkley, M. P., and Horowitz, L. W.: Ozone and organic nitrates over the eastern United States: Sensitivity to isoprene chemistry, J. Geophys. Res. Atmos., 118, 11256–11268, https://doi.org/10.1002/jgrd.50817, 2013.
Massad, R.-S., Nemitz, E., and Sutton, M. A.: Review and parameterisation of bi-directional ammonia exchange between vegetation and the atmosphere, Atmos. Chem. Phys., 10, 10359–10386, https://doi.org/10.5194/acp-10-10359-2010, 2010.
Matsuura, K. and Willmott, C. J.: Terrestrial Air Temperature: 1900–2010 Gridded Monthly Time Series, available at: http://climate.geog.udel.edu/~climate/html_pages/Global2011/GlobalTsT2011.html (last access: 26 August 2020), 2012.
Mauser, W., Klepper, G., Zabel, F., Delzeit, R., Hank, T., Putzenlechner, B., and Calzadilla, A.: Global biomass production potentials exceed expected future demand without the need for cropland expansion, Nat. Commun., 6, 1–11, https://doi.org/10.1038/ncomms9946, 2015.
Moriarty, F.: Air quality guidelines for Europe, Environ. Pollut., 55, 77, https://doi.org/10.1016/0269-7491(88)90163-7, 1988.
Murray, L. T., Jacob, D. J., Logan, J. A., Hudman, R. C., and Koshak, W. J.: Optimized regional and interannual variability of lightning in a global chemical transport model constrained by LIS/OTD satellite data, J. Geophys. Res. Atmos., 117, https://doi.org/10.1029/2012JD017934, 2012.
Paulot, F. and Jacob, D. J.: Hidden cost of U.S. agricultural exports: Particulate matter from ammonia emissions, Environ. Sci. Technol., 48, 903–908, https://doi.org/10.1021/es4034793, 2014.
Payne, R. J., Dise, N. B., Field, C. D., Dore, A. J., Caporn, S. J. M., and Stevens, C. J.: Nitrogen deposition and plant biodiversity: past, present, and future, Front. Ecol. Environ., 15, 431–436, https://doi.org/10.1002/fee.1528, 2017.
Peng, Y. P., Chen, K. S., Lai, C. H., Lu, P. J., and Kao, J. H.: Concentrations of H2O2 and HNO3 and O3-VOC-NOx sensitivity in ambient air in southern Taiwan, Atmos. Environ., 40, 6741–6751, https://doi.org/10.1016/j.atmosenv.2006.05.079, 2006.
Petetin, H., Sciare, J., Bressi, M., Gros, V., Rosso, A., Sanchez, O., Sarda-Estève, R., Petit, J.-E., and Beekmann, M.: Assessing the ammonium nitrate formation regime in the Paris megacity and its representation in the CHIMERE model, Atmos. Chem. Phys., 16, 10419–10440, https://doi.org/10.5194/acp-16-10419-2016, 2016.
Pinder, R. W., Adams, P. J., and Pandis, S. N.: Ammonia emission controls as a cost-effective strategy for reducing atmospheric particulate matter in the Eastern United States, Environ. Sci. Technol., 41, 380–386, https://doi.org/10.1021/es060379a, 2007.
Potapov, P. V., Turubanova, S. A., Tyukavina, A., Krylov, A. M., McCarty, J. L., Radeloff, V. C., and Hansen, M. C.: Eastern Europe's forest cover dynamics from 1985 to 2012 quantified from the full Landsat archive, Remote Sens. Environ., 159, 28–43, https://doi.org/10.1016/j.rse.2014.11.027, 2015.
Pozzer, A., Tsimpidi, A. P., Karydis, V. A., de Meij, A., and Lelieveld, J.: Impact of agricultural emission reductions on fine-particulate matter and public health, Atmos. Chem. Phys., 17, 12813–12826, https://doi.org/10.5194/acp-17-12813-2017, 2017.
Reick, C. H., Raddatz, T., Brovkin, V., and Gayler, V.: Representation of natural and anthropogenic land cover change in MPI-ESM, J. Adv. Model. Earth Syst., 5, 459–482, https://doi.org/10.1002/jame.20022, 2013.
Sillman, S.: The use of NOy, H2O2, and HNO3 as indicators for ozone-NOx-hydrocarbon sensitivity in urban locations, J. Geophys. Res., 100, 14 175–14 188, https://doi.org/10.1029/94JD02953, 1995.
Sillman, S., Logan, J. A., and Wofsy, S. C.: The sensitivity of ozone to nitrogen oxides and hydrocarbons in regional ozone episodes, J. Geophys. Res., 95, 1837–1851, https://doi.org/10.1029/JD095iD02p01837, 1990.
Silva, S. J., Heald, C. L., Geddes, J. A., Austin, K. G., Kasibhatla, P. S., and Marlier, M. E.: Impacts of current and projected oil palm plantation expansion on air quality over Southeast Asia, Atmos. Chem. Phys., 16, 10621–10635, https://doi.org/10.5194/acp-16-10621-2016, 2016.
Skjøth, C. A. and Hertel, O.: Ammonia Emissions in Europe, in Urban Air Quality in Europe, 141–163, Springer, https://doi.org/10.1007/698_2012_206, 2013.
Sobota, D. J., Compton, J. E., McCrackin, M. L., and Singh, S.: Cost of reactive nitrogen release from human activities to the environment in the United States, Environ. Res. Lett., 10, 025006, https://doi.org/10.1088/1748-9326/10/2/025006, 2015.
Sofen, E. D., Bowdalo, D., Evans, M. J., Apadula, F., Bonasoni, P., Cupeiro, M., Ellul, R., Galbally, I. E., Girgzdiene, R., Luppo, S., Mimouni, M., Nahas, A. C., Saliba, M., and Tørseth, K.: Gridded global surface ozone metrics for atmospheric chemistry model evaluation, Earth Syst. Sci. Data, 8, 41–59, https://doi.org/10.5194/essd-8-41-2016, 2016.
Song-Miao Fan, Wofsy, S. C., Bakwin, P. S., Jacob, D. J., and Fitzjarrald, D. R.: Atmosphere-biosphere exchange of CO2 and O3 in the central Amazon forest, J. Geophys. Res., 95, 16 851–16 864, https://doi.org/10.1029/jd095id10p16851, 1990.
Squire, O. J., Archibald, A. T., Abraham, N. L., Beerling, D. J., Hewitt, C. N., Lathière, J., Pike, R. C., Telford, P. J., and Pyle, J. A.: Influence of future climate and cropland expansion on isoprene emissions and tropospheric ozone, Atmos. Chem. Phys., 14, 1011–1024, https://doi.org/10.5194/acp-14-1011-2014, 2014.
Steinkamp, J. and Lawrence, M. G.: Improvement and evaluation of simulated global biogenic soil NO emissions in an AC-GCM, Atmos. Chem. Phys., 11, 6063–6082, https://doi.org/10.5194/acp-11-6063-2011, 2011.
Tai, A. P. K., Mickley, L. J., Heald, C. L., and Wu, S.: Effect of CO2 inhibition on biogenic isoprene emission: Implications for air quality under 2000 to 2050 changes in climate, vegetation, and land use, Geophys. Res. Lett., 40, 3479–3483, https://doi.org/10.1002/grl.50650, 2013.
The International GEOS-Chem User Community: geoschem/geos-chem: GEOS-Chem 12.7.0, Zenodo [code], https://doi.org/10.5281/zenodo.3634864, 2020.
Ti, C., Xia, L., Chang, S. X., and Yan, X.: Potential for mitigating global agricultural ammonia emission: A meta-analysis, Environ. Pollut., 245, 141–148, https://doi.org/10.1016/j.envpol.2018.10.124, 2019.
U.S. EPA: 2014 National Emissions Inventory, version 2 Technical Support Document, U.S. Environmental Protection Agency, (July) [online], available at: https://www.epa.gov/sites/production/files/2018-06/documents/nei2014v2_tsd_09may2018.pdf (last access: 18 September 2021), 2018.
van der Werf, G. R., Randerson, J. T., Giglio, L., van Leeuwen, T. T., Chen, Y., Rogers, B. M., Mu, M., van Marle, M. J. E., Morton, D. C., Collatz, G. J., Yokelson, R. J., and Kasibhatla, P. S.: Global fire emissions estimates during 1997–2016, Earth Syst. Sci. Data, 9, 697–720, https://doi.org/10.5194/essd-9-697-2017, 2017.
Vasilakos, P., Russell, A., Weber, R., and Nenes, A.: Understanding nitrate formation in a world with less sulfate, Atmos. Chem. Phys., 18, 12765–12775, https://doi.org/10.5194/acp-18-12765-2018, 2018.
WallisDeVries, M. F. and Bobbink, R.: Nitrogen deposition impacts on biodiversity in terrestrial ecosystems: Mechanisms and perspectives for restoration, Biol. Conserv., 212, 387–389, https://doi.org/10.1016/j.biocon.2017.01.017, 2017.
Wang, L., Tai, A. P. K., Tam, C.-Y., Sadiq, M., Wang, P., and Cheung, K. K. W.: Impacts of future land use and land cover change on mid-21st-century surface ozone air quality: distinguishing between the biogeophysical and biogeochemical effects, Atmos. Chem. Phys., 20, 11349–11369, https://doi.org/10.5194/acp-20-11349-2020, 2020.
Wang, Q., Jacob, D. J., Fisher, J. A., Mao, J., Leibensperger, E. M., Carouge, C. C., Le Sager, P., Kondo, Y., Jimenez, J. L., Cubison, M. J., and Doherty, S. J.: Sources of carbonaceous aerosols and deposited black carbon in the Arctic in winter-spring: implications for radiative forcing, Atmos. Chem. Phys., 11, 12453–12473, https://doi.org/10.5194/acp-11-12453-2011, 2011.
Wang, Q., Jacob, D. J., Spackman, J. R., Perring, A. E., Schwarz, J. P., Moteki, N., Marais, E. A., Ge, C., Wang, J., and Barrett, S. R. H.: Global budget and radiative forcing of black carbon aerosol: Constraints from pole-to-pole (HIPPO) observations across the Pacific, J. Geophys. Res., 119, 195–206, https://doi.org/10.1002/2013JD020824, 2014.
Wang, Y., Jacob, D. J., and Logan, J. A.: Global simulation of tropospheric O3-NOx-hydrocarbon chemistry – 1. Model formulation, J. Geophys. Res. D. Atmos., 103, 10713–10725, https://doi.org/10.1029/98jd00158, 1998.
Weagle, C. L., Snider, G., Li, C., Van Donkelaar, A., Philip, S., Bissonnette, P., Burke, J., Jackson, J., Latimer, R., Stone, E., Abboud, I., Akoshile, C., Anh, N. X., Brook, J. R., Cohen, A., Dong, J., Gibson, M. D., Griffith, D., He, K. B., Holben, B. N., Kahn, R., Keller, C. A., Kim, J. S., Lagrosas, N., Lestari, P., Khian, Y. L., Liu, Y., Marais, E. A., Martins, J. V., Misra, A., Muliane, U., Pratiwi, R., Quel, E. J., Salam, A., Segev, L., Tripathi, S. N., Wang, C., Zhang, Q., Brauer, M., Rudich, Y., and Martin, R. V.: Global Sources of Fine Particulate Matter: Interpretation of PM2.5 Chemical Composition Observed by SPARTAN using a Global Chemical Transport Model, Environ. Sci. Technol., 52, 11670–11681, https://doi.org/10.1021/acs.est.8b01658, 2018.
Wesely, M. L.: Parameterization of surface resistances to gaseous dry deposition in regional-scale numerical models, Atmos. Environ., 41(SUPPL.), 52–63, https://doi.org/10.1016/j.atmosenv.2007.10.058, 1989.
Wichink Kruit, R. J., Schaap, M., Sauter, F. J., van Zanten, M. C., and van Pul, W. A. J.: Modeling the distribution of ammonia across Europe including bi-directional surface–atmosphere exchange, Biogeosciences, 9, 5261–5277, https://doi.org/10.5194/bg-9-5261-2012, 2012.
Wong, A. Y. H.: GEOS-Chem model configuration and land cover input files, available at: https://open.bu.edu/handle/2144/43267, last access: 4 November 2021.
Wong, A. Y. H., Geddes, J. A., Tai, A. P. K., and Silva, S. J.: Importance of dry deposition parameterization choice in global simulations of surface ozone, Atmos. Chem. Phys., 19, 14365–14385, https://doi.org/10.5194/acp-19-14365-2019, 2019.
Wu, S., Mickley, L. J., Kaplan, J. O., and Jacob, D. J.: Impacts of changes in land use and land cover on atmospheric chemistry and air quality over the 21st century, Atmos. Chem. Phys., 12, 1597–1609, https://doi.org/10.5194/acp-12-1597-2012, 2012a.
Wu, S., Mickley, L. J., Kaplan, J. O., and Jacob, D. J.: Impacts of changes in land use and land cover on atmospheric chemistry and air quality over the 21st century, Atmos. Chem. Phys., 12, 1597–1609, https://doi.org/10.5194/acp-12-1597-2012, 2012b.
Xiao, Z., Liang, S., Wang, J., Xiang, Y., Zhao, X., and Song, J.: Long-Time-Series Global Land Surface Satellite Leaf Area Index Product Derived from MODIS and AVHRR Surface Reflectance, IEEE Trans. Geosci. Remote Sens., 54, 5301–5318, https://doi.org/10.1109/TGRS.2016.2560522 2016, data available at http://globalchange.bnu.edu.cn/research/laiv6#download, last access: 15 May 2020.
Xu, R., Tian, H., Pan, S., Prior, S. A., Feng, Y., Batchelor, W. D., Chen, J., and Yang, J.: Global ammonia emissions from synthetic nitrogen fertilizer applications in agricultural systems: Empirical and process-based estimates and uncertainty, Glob. Chang. Biol., 25, 314–326, https://doi.org/10.1111/gcb.14499, 2019.
Zhang, L., Gong, S., Padro, J., and Barrie, L.: A size-segregated particle dry deposition scheme for an atmospheric aerosol module, Atmos. Environ., 35, 549–560, https://doi.org/10.1016/S1352-2310(00)00326-5, 2001.
Zhang, L., Wright, L. P., and Asman, W. A. H.: Bi-directional air-surface exchange of atmospheric ammonia: A review of measurements and a development of a big-leaf model for applications in regional-scale air-quality models, J. Geophys. Res. Atmos., 115, D20310, https://doi.org/10.1029/2009JD013589, 2010.
Zhu, Z., Bi, J., Pan, Y., Ganguly, S., Anav, A., Xu, L., Samanta, A., Piao, S., Nemani, R. R., and Myneni, R. B.: Global data sets of vegetation leaf area index (LAI)3 g and fraction of photosynthetically active radiation (FPAR)3 g derived from global inventory modeling and mapping studies (GIMMS) normalized difference vegetation index (NDVI3G) for the period 1981 to 2, Remote Sens., 5, 927–948, https://doi.org/10.3390/rs5020927, 2013.
Zhu, Z., Piao, S., Myneni, R. B., Huang, M., Zeng, Z., Canadell, J. G., Ciais, P., Sitch, S., Friedlingstein, P., Arneth, A., Cao, C., Cheng, L., Kato, E., Koven, C., Li, Y., Lian, X., Liu, Y., Liu, R., Mao, J., Pan, Y., Peng, S., Peuelas, J., Poulter, B., Pugh, T. A. M., Stocker, B. D., Viovy, N., Wang, X., Wang, Y., Xiao, Z., Yang, H., Zaehle, S., and Zeng, N.: Greening of the Earth and its drivers, Nat. Clim. Chang., 6, 791–795, https://doi.org/10.1038/nclimate3004, 2016.
- Abstract
- Introduction
- Methods
- Changes in land cover, biospheric fluxes and agricultural emissions
- Impact of LULCC and agricultural emission changes on surface PM2.5
- Impact on surface O3
- Impact on nitrogen deposition
- Discussion and conclusions
- Data availability
- Code availability
- Author contributions
- Competing interests
- Disclaimer
- Acknowledgements
- Financial support
- Review statement
- References
- Supplement